

Page 1
XProtect
®
Analytics 2.2
User’s Manual
Milestone
Page 2

Milestone XProtect Analytics 2.2; User’s Manual
Target Audience for this Document
This document is aimed at end users of the Milestone XProtect Analytics solutions for license plate
recognition, perimeter protection, motion detection and countless other purposes.
This document describes how to configure an existing Smart Client for use with video content
analytics, and subsequently how to view analytics data together with live and recorded video in the
Smart Client
For information about installing a Smart Client, and using the Smart Client for other purposes than
analytics, see the separate XProtect Smart Client User’s Manual available from your surveillance
system administrator or from www.milestonesys.com.
For information about configuring the XProtect Analytics solution on the surveillance system, refer
to the separate XProtect Analytics Administrator’s Manuals, available on the XProtect Analytics
software DVD as well as from www.milestonesys.com.
XPA22-um-1-110811
www.milestonesys.com Target Audience for this Document
Page 3

Milestone XProtect Analytics 2.2; User’s Manual
Copyright, Trademarks and Important Information
Copyright
© 2011 Milestone Systems A/S.
Trademarks
XProtect is a registered trademark of Milestone Systems A/S.
Microsoft® and Windows® are registered trademarks of Microsoft Corporation.
All other trademarks mentioned in this document are trademarks of their respective owners.
Disclaimer
This document is intended for general information purposes only, and due care has been taken in
its preparation.
Any risk arising from the use of this information rests with the recipient, and nothing herein should
be construed as constituting any kind of warranty.
Milestone Systems A/S reserve the right to make adjustments without prior notification.
All names of people and organizations used in this document’s examples are fictitious. Any
resemblance to any actual organization or person, living or dead, is purely coincidental and
unintended.
www.milestonesys.com Copyright, Trademarks and Important Information
Page 4

Milestone XProtect Analytics 2.2; User’s Manual
Contents
PRODUCT OVERVIEW ................................................. 5
CONFIGURATION ........................................................ 7
Plugin Required .................................................................................... 7
Creating Views for Analytics ................................................................. 8
Create Many or Few Views? .................................................................. 9
Troubleshooting .................................................................................... 9
VIEWING LIVE VIDEO & ANALYTICS DATA ............... 11
Selecting an Analytics View ................................................................ 11
View’s Structure ................................................................................. 11
BROWSING RECORDED VIDEO & ANALYTICS DATA .. 13
Selecting an Analytics View ................................................................ 13
View’s Structure ................................................................................. 13
Selecting Incidents in the Table .......................................................... 14
Table Displays 100 Incidents at a Time .................................................. 14
You Control the Table’s Content ............................................................ 14
Sorting Table Columns ........................................................................ 14
Filtering Table Columns ....................................................................... 14
Browsing Video from Around Detected Incidents ............................... 15
INTERPRETING THE COLORED OVERLAYS ................ 16
USING THE TIME SYNCHRONIZATION SLIDER ......... 17
REMOVAL.................................................................. 18
www.milestonesys.com Page 4 Contents
Page 5

Milestone XProtect Analytics 2.2; User’s Manual
Product Overview
Milestone XProtect Analytics provides an intelligent yet highly intuitive solution for video content
analysis tasks such as license plate recognition (LPR), perimeter protection, left objects detection,
etc. XProtect Analytics works in tight integration with Microsoft® Windows® components as well as
a range of different Milestone products.
XProtect Smart Client is the client application used for viewing video combined with analytics
data wherever you require.
Depending on which video content analysis plugins are used with your organization’s XProtect
Analytics solution, you can work with:
License plate recognition (LPR)
Perimeter protection
Detection of persons, vehicles, etc. moving in unauthorized patterns or directions
Unattended objects detection
Loitering detection
Tailgating detection
Crowd formation detection
People counting
Detection of illegally parked vehicles
Detection of removed items
Advanced video motion detection (VMD)
Countless other purposes (thanks to the XProtect Analytics Generic VA plugin, which allows
third-party video content analysis applications to supply data for XProtect Analytics)
XProtect Analytics lets you easily combine video content analysis alerts with Milestone surveillance
system features, such as recording, activation of outputs, etc. XProtect Analytics is therefore highly
interesting in areas such as retail, transportation, education, industry, government, etc.
Basic Data Flow
In an XProtect Analytics solution, video and analytics data basically flows between the products in
the following way:
Cameras send raw video streams to the surveillance system.
The video streams are passed on to an analytics component on the surveillance system, which
processes the video streams in one or more steps: 1) Image analysis, for example for license plate
www.milestonesys.com Page 5 Product Overview
Page 6
Milestone XProtect Analytics 2.2; User’s Manual
recognition or left object detection, and 2) Match against associated positive and/or negative lists,
if required.
Whenever a license plate, left object, etc. is
recognized, the surveillance system stores the
analytics information together with timestamp
information.
In the Smart Client, users are able to the analytics
data together with video from the surveillance system.
The time-linking of the analytics data and video makes
sure that Smart Client users are able to view and
browse the analytics data and video simultaneously.
www.milestonesys.com Page 6 Product Overview
Page 7
Milestone XProtect Analytics 2.2; User’s Manual
Configuration
Plugin Required
In order to use the Smart Clients with your analytics solution, a plugin must be installed for each
Smart Client you intend to use.
The Smart Client should be installed first, then the plugin. If in doubt about how to install a Smart
Client, refer to the Smart Client User’s Manual, available from www.milestonesys.com.
When ready to install the plugin, do the following on each computer on which you require the
Smart Client to work with your analytics solution:
1. Open an Internet Explorer browser (version 6.0 or later), and connect to the URL or IP
address specified by your system administrator in order to connect to the surveillance
system server. When you connect to the surveillance system server, you will see a
welcome page.
2. Different versions of the welcome page exist. On some versions, you will immediately see a
list of available plugins. On other versions you must click a Download and install plugins
link before you can see a list of available plugins.
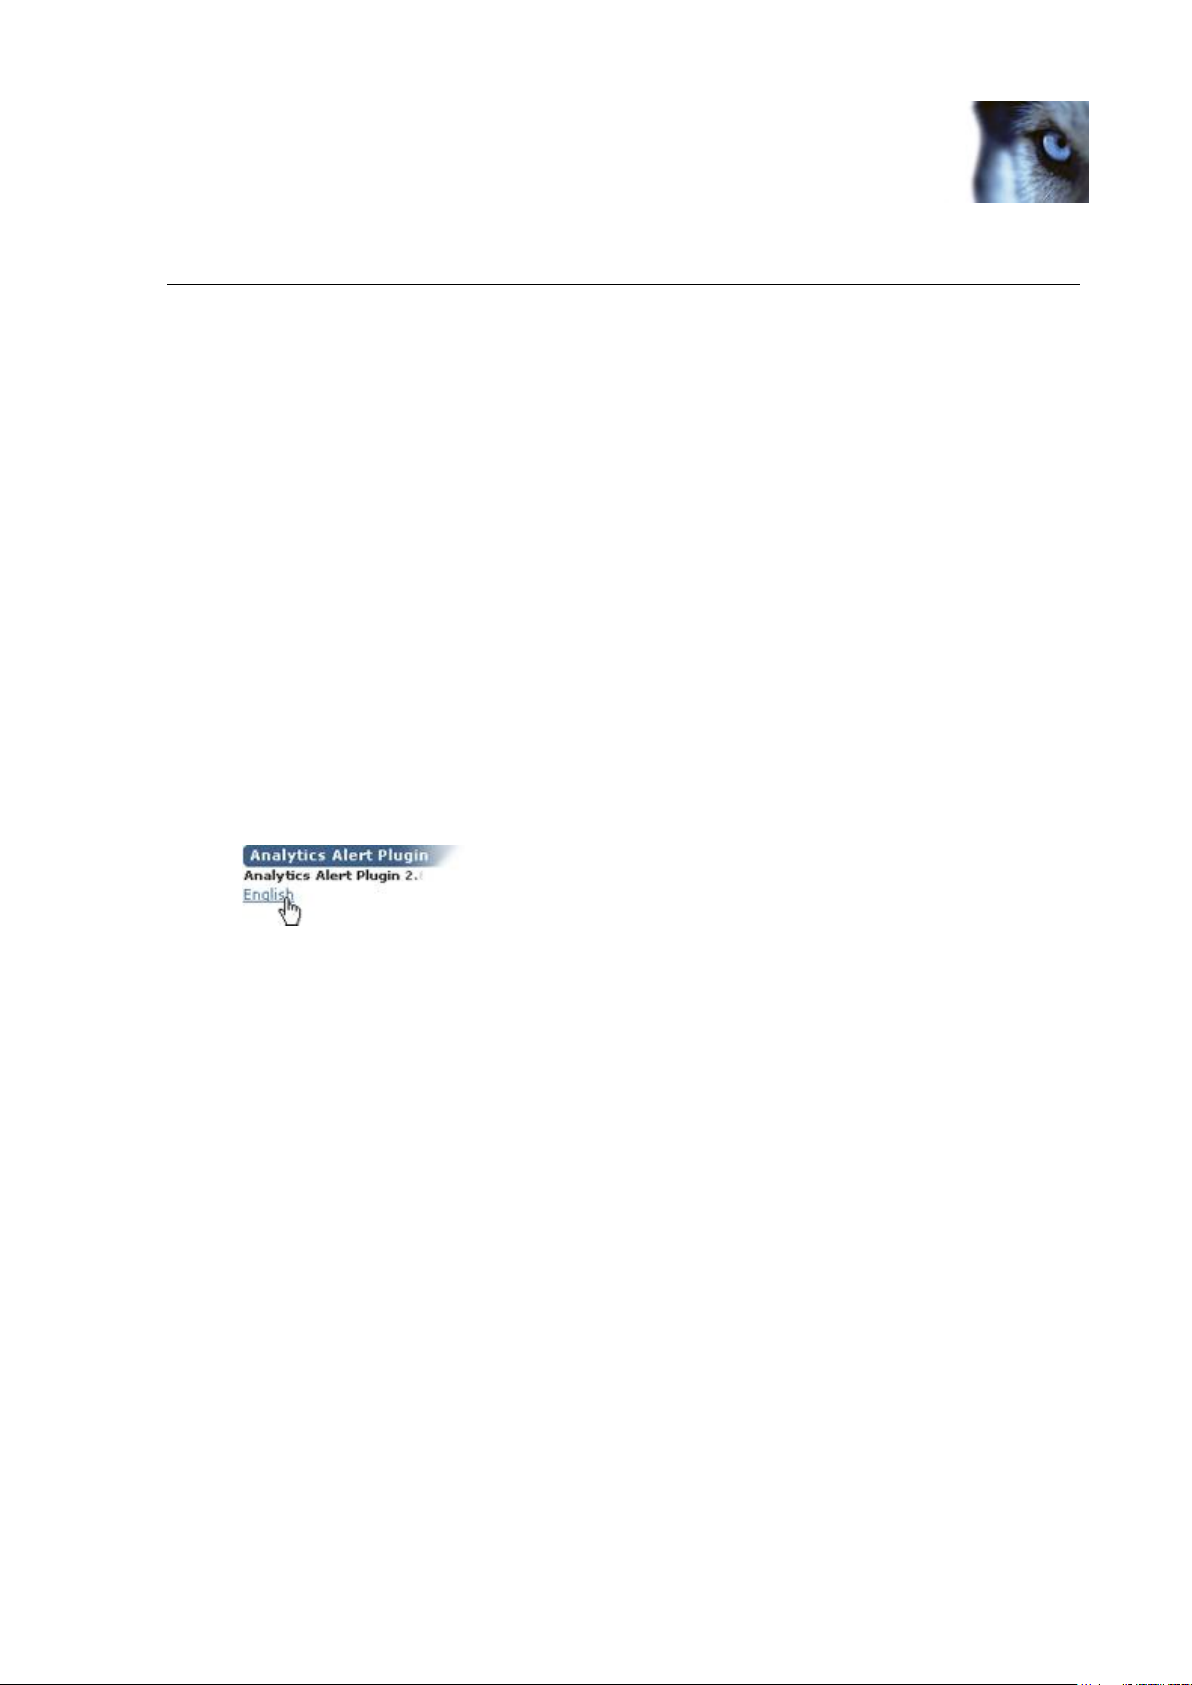
3. Download the required version of the Analytics Alert Plugin.
Example only; note that different
versions of the welcome page exist
4. Depending on your security settings, you may receive one or more security warnings (Do
you want to run or save this file?, Do you want to run this software? or similar; exact
wording depends on your browser version). When this is the case, accept the security
warnings (by clicking Run or similar; exact button names also depend on your browser
version).
5. After a short while the Milestone XProtect Smart Client Plug-in for Analytics Setup Wizard
opens. Click Next.
6. Select required installation folder (a default installation folder is automatically suggested).
Also select whether just yourself or anyone using the computer should be able to access
the plugin (if in doubt, select Everyone). Then click Next twice.
7. Read and accept the license agreement, then click Next to begin the actual installation.
8. When installation is complete, click the Close button. You are now able to view analytics
data together with video recordings in your Smart Client
www.milestonesys.com Page 7 Configuration
Page 8

Milestone XProtect Analytics 2.2; User’s Manual
Creating Views for Analytics
Once your Smart Client has the necessary plugin, you are able to create Smart Client views for use
with analytics.
In some organizations, your surveillance system administrator will have set up the required views
for you, in which case you can go straight to page 11 (for information about viewing live video and
analytics data) or 13 (for information about browsing recorded video and analytics data).
1. On the Smart Client’s Setup tab, create a new group. If in doubt about how to create
groups and views in the Smart Client, see the Smart Client User’s Manual, available from
www.milestonesys.com.
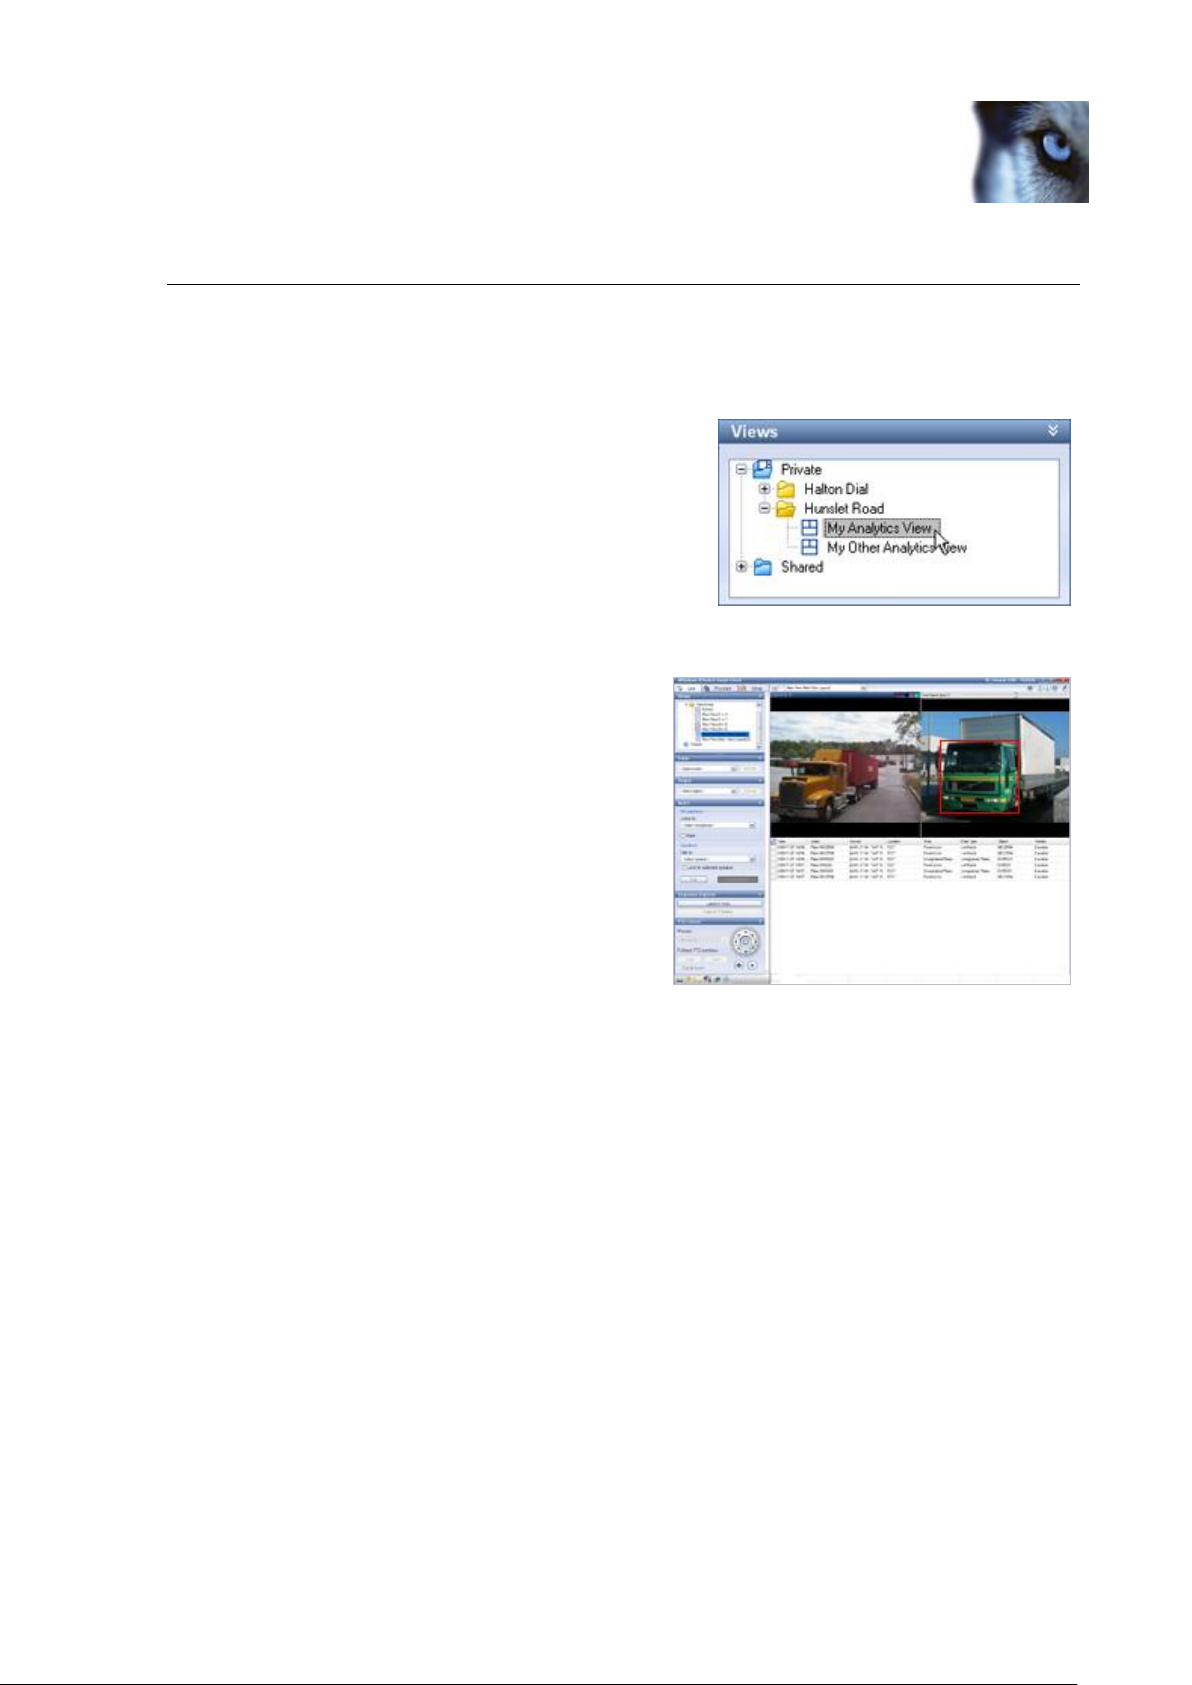
2. In the new group, create a new view of the
type Alert View Layout. This will give you a
special type of view which consists of three
elements: a camera position, a special
analytics image capture position, and an area
for display of analytics data.
3. In the Setup tab’s System Overview section,
select the relevant camera, and drag it onto
the view’s top left position.
4. Click inside the large gray area at the bottom of the view. Then, in the Properties section
(1 in the example), expand the source list and select the relevant analytics source(s).
When you select analytics source(s), a
spreadsheet-like matrix will appear in the
previously gray analytics data area (2 in the
example). If the selected sources already
contain analytics data, the data will also be
displayed.
What is a source? By selecting a source,
you basically tell your Smart Client where
you want to get the view’s analytics data
from. If you are a Smart Client end-user
creating your own views for use with
analytics, ask your surveillance system
administrator about the name of the source
if in doubt.
5. You are now able to test your view on the Smart Client’s Live and Playback tabs.
www.milestonesys.com Page 8 Configuration
Page 9

Milestone XProtect Analytics 2.2; User’s Manual
Live: Data about relevant incidents will be
displayed in the view’s bottom area, live video
will be displayed in the view’s top left position,
and an image from the latest incident will be
displayed in the view’s top right position.
Playback: By switching to the Smart Client’s
Playback tab, you can try out the features
for browsing past analytics data combined
with time-linked video recordings.
Tip: If your view does not display analytics data or video as expected, see Troubleshooting in the
following.
Create Many or Few Views?
Even though it is not a requirement, it is often a good idea to create a separate view for each
analytics source. This way you are able to keep targeted settings (such as data filtering and time
synchronization) for each source when you switch between them during day-to-day use. Note that
you are able to group your views in as many groups and sub-groups as you require. This way, you
can easily organize your views—even when you have many of them.
Using the Time Synchronization Slider
Analytics views feature a time synchronization slider for synchronizing images in the analytics
image capture position in the view’s top right position with the video displayed in the view’s top left
position. For more information about using the slider, see page 17.
Troubleshooting
If an analytics view in your Smart Client does not display analytics data or video as expected,
verify the following:
That you have logged in to the Smart Client with an account which has rights to view the
required camera(s).
That the camera you have specified in your view is indeed the one used for analytics.
That you have selected source(s) for the view on the Setup tab.
If you think that time-based filtering of incidents on the Smart Client's Playback tab takes
very long, you can cancel the filtering, and try specifying a different time filter. The reason:
The list may in some organizations contain several millions of incidents, and if such very
large amounts of incidents have to be filtered, the filtering process may take time.
The fact that your Smart Client does not display analytics data or video as expected may also be
due to problems on the surveillance system itself. Your surveillance system administrator can help
you verify the following (information relevant for surveillance system administrators only is shown
in gray text):
Surveillance System Server Services
Verify that the required XProtect Analytics service is running on the surveillance system
server. This service makes sure your XProtect Analytics configuration is applied. To verify
this on the surveillance system server, click Windows’ Start button, select Control Panel >
www.milestonesys.com Page 9 Configuration
Page 10

Milestone XProtect Analytics 2.2; User’s Manual
Administrative Tools > Services, and make sure the status of the required service is
Started. If not, right-click the name or the service, and select Start.
Verify that the Recording Server service is running on the surveillance system server(s).
This service handles the display and recording of video. To verify this on the surveillance
system server, click Windows’ Start button, select Control Panel > Administrative Tools >
Services, and make sure the status of the Milestone Recording Server service is Started. If
not, right-click the name or the service, and select Start.
For XProtect Enterprise and XProtect Professional surveillance systems: Verify that the
Image Server service is running on the surveillance system server. This service handles the
display of video in clients as well as authentication of Smart Client users. To verify this on
the surveillance system server, click Windows’ Start button, select Control Panel >
Administrative Tools > Services, and make sure the status of the Milestone Image Server
service is Started. If not, right-click the name or the service, and select Start.
Verify that the Transact service is running on the surveillance system server. This service
handles the sending of analytics data to the Smart Client. To verify this on the surveillance
system server, click Windows’ Start button, select Control Panel > Administrative Tools >
Services, and make sure the status of the Milestone Transact service is Started. If not,
right-click the name or the service, and select Start.
Surveillance System Server Setup
Verify that the required camera is transmitting video to the surveillance system. To verify
on XProtect Enterprise and XProtect Professional from version 7.0, open the Management
Application, expand Advanced Configuration, expand Scheduling & Archiving, and verify
that the camera in question is online at the required times. To verify on XProtect Enterprise
and XProtect Professional system versions earlier than 7.0, click the Scheduler button in
the surveillance system server's Administrator application, and verify that the camera in
question is online at the required times. On XProtect Corporate systems, verify that your
rules configuration allows feeds from the required camera at the required times.
Verify that the user account specified for use with XProtect Analytics is a valid account, and
that the account in question is allowed to view live and recorded video from the camera. To
verify on XProtect Enterprise and XProtect Professional systems from version 7.0, open the
Management Application, expand Advanced Configuration, expand Users, and verify that
the user account in question exists, and that it has rights to view live and recorded video
from the required cameras. To verify on XProtect Enterprise and XProtect Professional
system versions earlier than 7.0, open the surveillance system server's Image Server
Administrator, and click the User Setup… button to verify that the user account in question
exists; then click the User Access… button to verify that user account in question has rights
to view live and recorded video from the required cameras. On XProtect Corporate
systems, verify that the user has a role with the required rights.
XProtect Analytics configuration
Verify that there are no errors in the configuration specified in the XProtect Analytics
administration interface. If verifying XProtect Analytics for LPR, make sure you look for
possible errors in the specific configuration parameters for each connection. Select the
required connection, then click the Configuration button below the reference images; the
configuration parameters contain important information relating to license plate character
size, license plates' country of origin, etc. Also make sure the minimum confidence level of
the required LPR connection is not very high (e.g. 950), as this can lead to very little or no
license plate recognition data to work with. Begin with a minimum confidence level value of
approximately 600; once you have worked with the LPR connection for a while you can
adjust the threshold.
Verify that your surveillance system administrator has saved the configuration in the
XProtect Analytics administration interface, and—if required—restarted the service.
Physical Cameras
Verify that the required cameras are correctly mounted, cabled, connected, etc.
www.milestonesys.com Page 10 Configuration
Page 11
Milestone XProtect Analytics 2.2; User’s Manual
Viewing Live Video & Analytics Data
The Smart Client lets you view real-time analytics data combined with matching live video.
Selecting an Analytics View
1. Go to the Smart Client’s Live tab.
2. In the Views section, select the required view.
View’s Structure
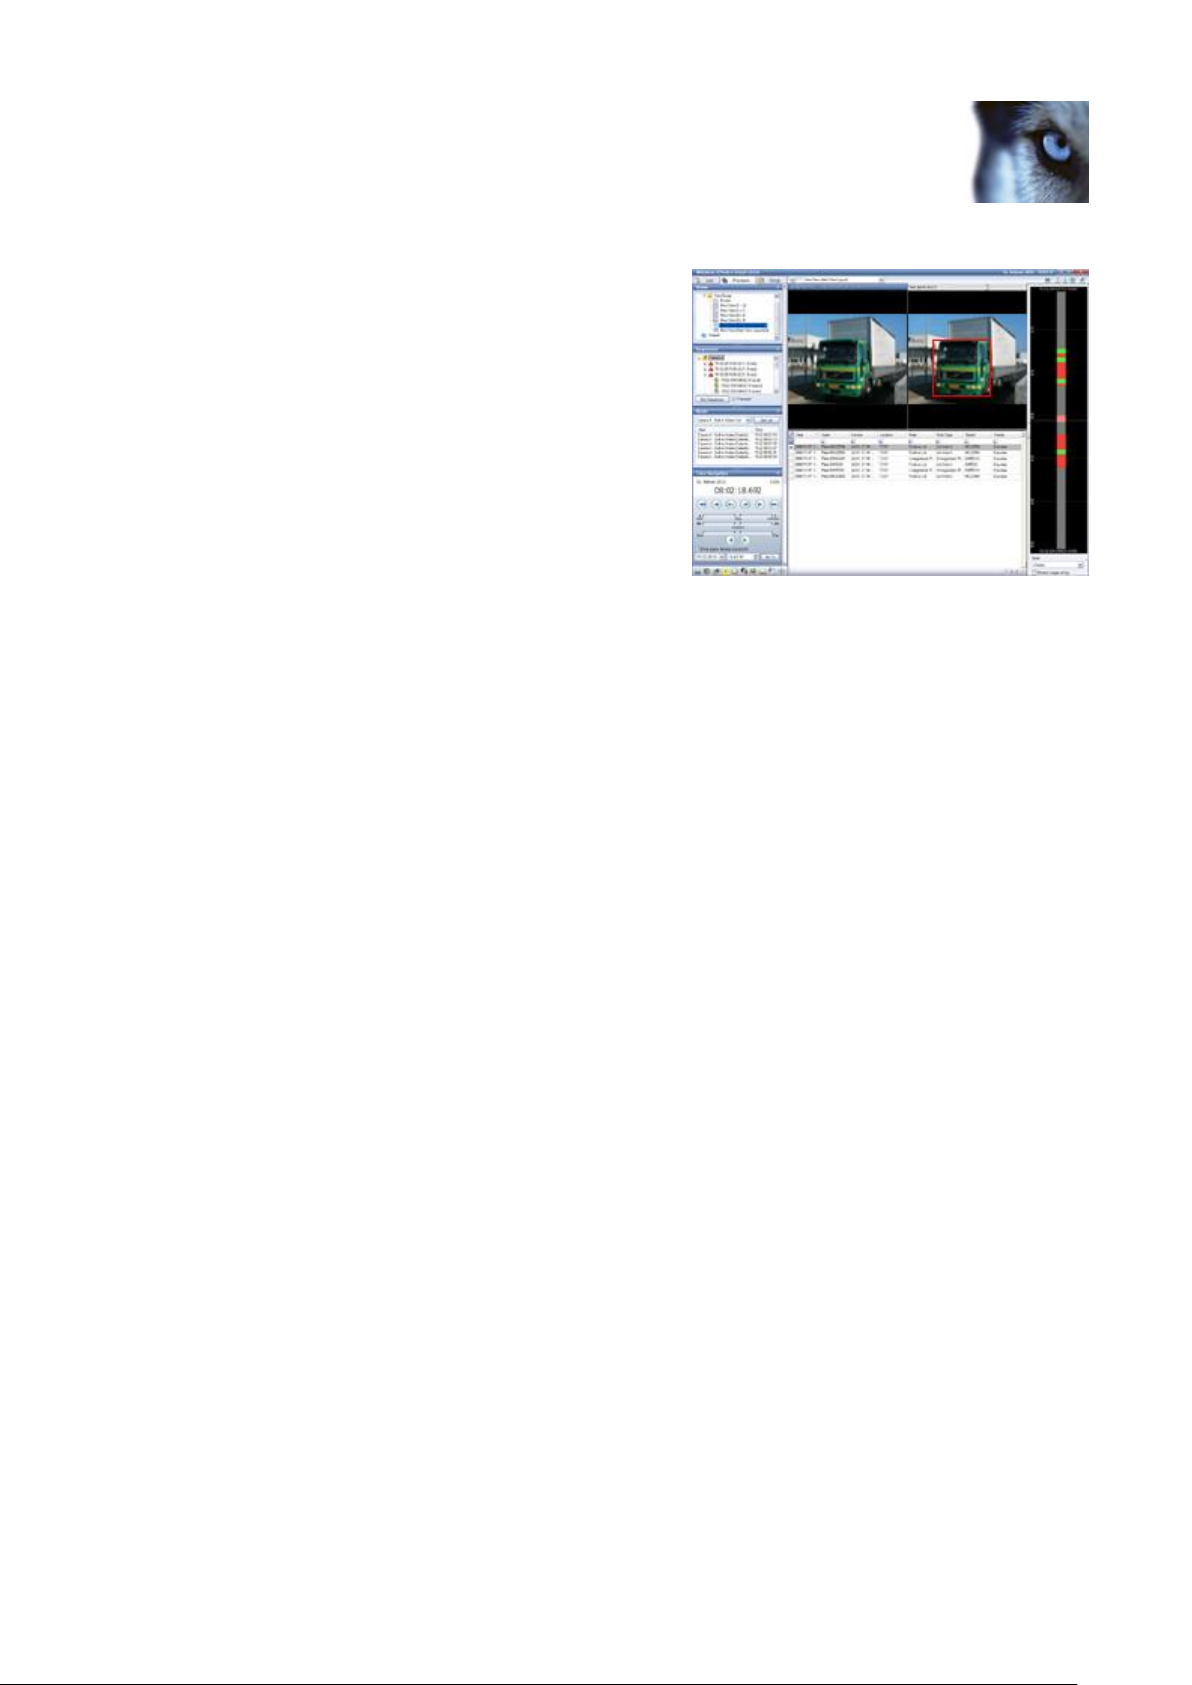
Data about relevant incidents will be displayed in the
view’s bottom area, live video will be displayed in
the view’s top left position, and an image from the
latest detected incident will be displayed in the
view’s top right position.
Each incident can be displayed with information in
the following columns:
Alarm: Lists the type of incident detected,
for example motion or a license plate.
Alert Type: Lists the category of incident.
Confidence: Lists a value between 1 and
1000 describing the confidence level for the detection. Example: A value of 950 means that
the XProtect Analytics solution is at least 950/1000 certain that it has made a correct
detection. You will typically not see very low confidence values since it is possible to set a
minimum acceptable confidence level on the server.
Description: Lists a summary of the detection.
Device: Lists the camera by which the incident was detected.
Location: Lists the location of the camera by which the incident was detected.
Object: Lists the object detected.
Object Type: Lists the category of object detected.
Rule: Lists the XProtect Analytics rule triggered by the detection of the incident.
Rule Type: Lists the category of XProtect Analytics rule triggered by the detection of the
incident.
Source: Lists the surveillance system server hosting the camera by which the incident was
detected.
www.milestonesys.com Page 11 Viewing Live …
Page 12

Milestone XProtect Analytics 2.2; User’s Manual
Time: Lists the time at which the incident was detected.
Vendor: Lists the video content analysis software on which the incident detection was
based.
Tip: You decide which columns to display in the table, and in which order they appear. To select
which columns to display, click the button to the left of the column headings (see example below).
To arrange the order of columns, simply drag them to the required positions.
For more information about the Smart Client’s live viewing features, refer to the XProtect Smart
Client User’s Manual, available from your surveillance system administrator or from
www.milestonesys.com.
Colored Overlays
In analytics views an image from the latest detected incident will be displayed in the view’s top
right position. This image contains an overlay in one or more colors. For more information about
interpreting the different overlay colors, see page 16.
Time Synchronization Slider
Analytics views feature a time synchronization slider for synchronizing images in the analytics
image capture position in the view’s top right position with the video displayed in the view’s top left
position. For more information about using the slider, see page 17.
www.milestonesys.com Page 12 Day-to-Day Use
Page 13

Milestone XProtect Analytics 2.2; User’s Manual
Browsing Recorded Video & Analytics Data
The Smart Client lets you view analytics data combined with matching, time-linked, recorded video.
Selecting an Analytics View
1. Go to the Smart Client’s Playback tab.
2. In the Views section, select the required view.
View’s Structure
Data about relevant incidents will be displayed in the
view’s bottom area, matching recorded video will be
displayed in the view’s top left position, and an
image from the selected incident will be displayed in
the view’s top right position.
Each incident can be displayed with information in
the following columns:
Alarm: Lists the type of incident detected,
for example motion or a license plate.
Alert Type: Lists the category of incident.
Confidence: Lists a value between 1 and
1000 describing the confidence level for the detection. Example: A value of 950 means that
the XProtect Analytics solution is at least 950/1000 certain that it has made a correct
detection. You will typically not see very low confidence values since it is possible to set a
minimum acceptable confidence level on the server.
Description: Lists a summary of the detection.
Device: Lists the camera by which the incident was detected.
Location: Lists the location of the camera by which the incident was detected.
Object: Lists the object detected.
Object Type: Lists the category of object detected.
Rule: Lists the XProtect Analytics rule triggered by the detection of the incident.
Rule Type: Lists the category of XProtect Analytics rule triggered by the detection of the
incident.
www.milestonesys.com Page 13 Browsing Recorded …
Page 14

Milestone XProtect Analytics 2.2; User’s Manual
Source: Lists the surveillance system server hosting the camera by which the incident was
detected.
Time: Lists the time at which the incident was detected.
Vendor: Lists the video content analysis software on which the incident detection was
based.
Selecting Incidents in the Table
To view video from a detected incident, you select the required incident in the table in the bottom
part of the view. The table may contain large amounts of incidents, so it is important that you
know how to navigate the table itself.
Table Displays 100 Incidents at a Time
To allow for optimum performance, the table displays a maximum of 100 incidents at a time. To
browse to the previous/next 100 incidents, simply use the buttons in the bottom
right part of the table.
You Control the Table’s Content
You decide which columns to display in the table, and in which
order they appear. To select which columns to display, click the
button to the left of the column headings. To arrange the order
of columns, simply drag them to the required positions.
Sorting Table Columns
To sort columns alphabetically, by time, etc., simply click the required column heading.
Filtering Table Columns
You can filter content in the table’s columns in three ways:
To filter on a specific date/time period, click in the row below the Time column heading (1
in the example), select Custom, click the required date drop-down menu (2), select
required date (3), then required time (4):
www.milestonesys.com Page 14 Day-to-Day Use
Page 15
Milestone XProtect Analytics 2.2; User’s Manual
You can also filter on Today (that is the current day, from 00:00:00 until the current
moment), Week (that is the current week, from Monday 00:00:00 until the current
moment), or on All (the same as not using a time filter).
When ready, click OK.
Tip: The list may in some organizations contain several millions of incidents. If such very
large amounts of incidents have to be filtered, the filtering process may take some time. If
a time filter takes very long to apply, click the Cancel button and then try specifying a
different filter.
To quickly filter content in columns, simply click the drop-down menu in the row below the
column heading:
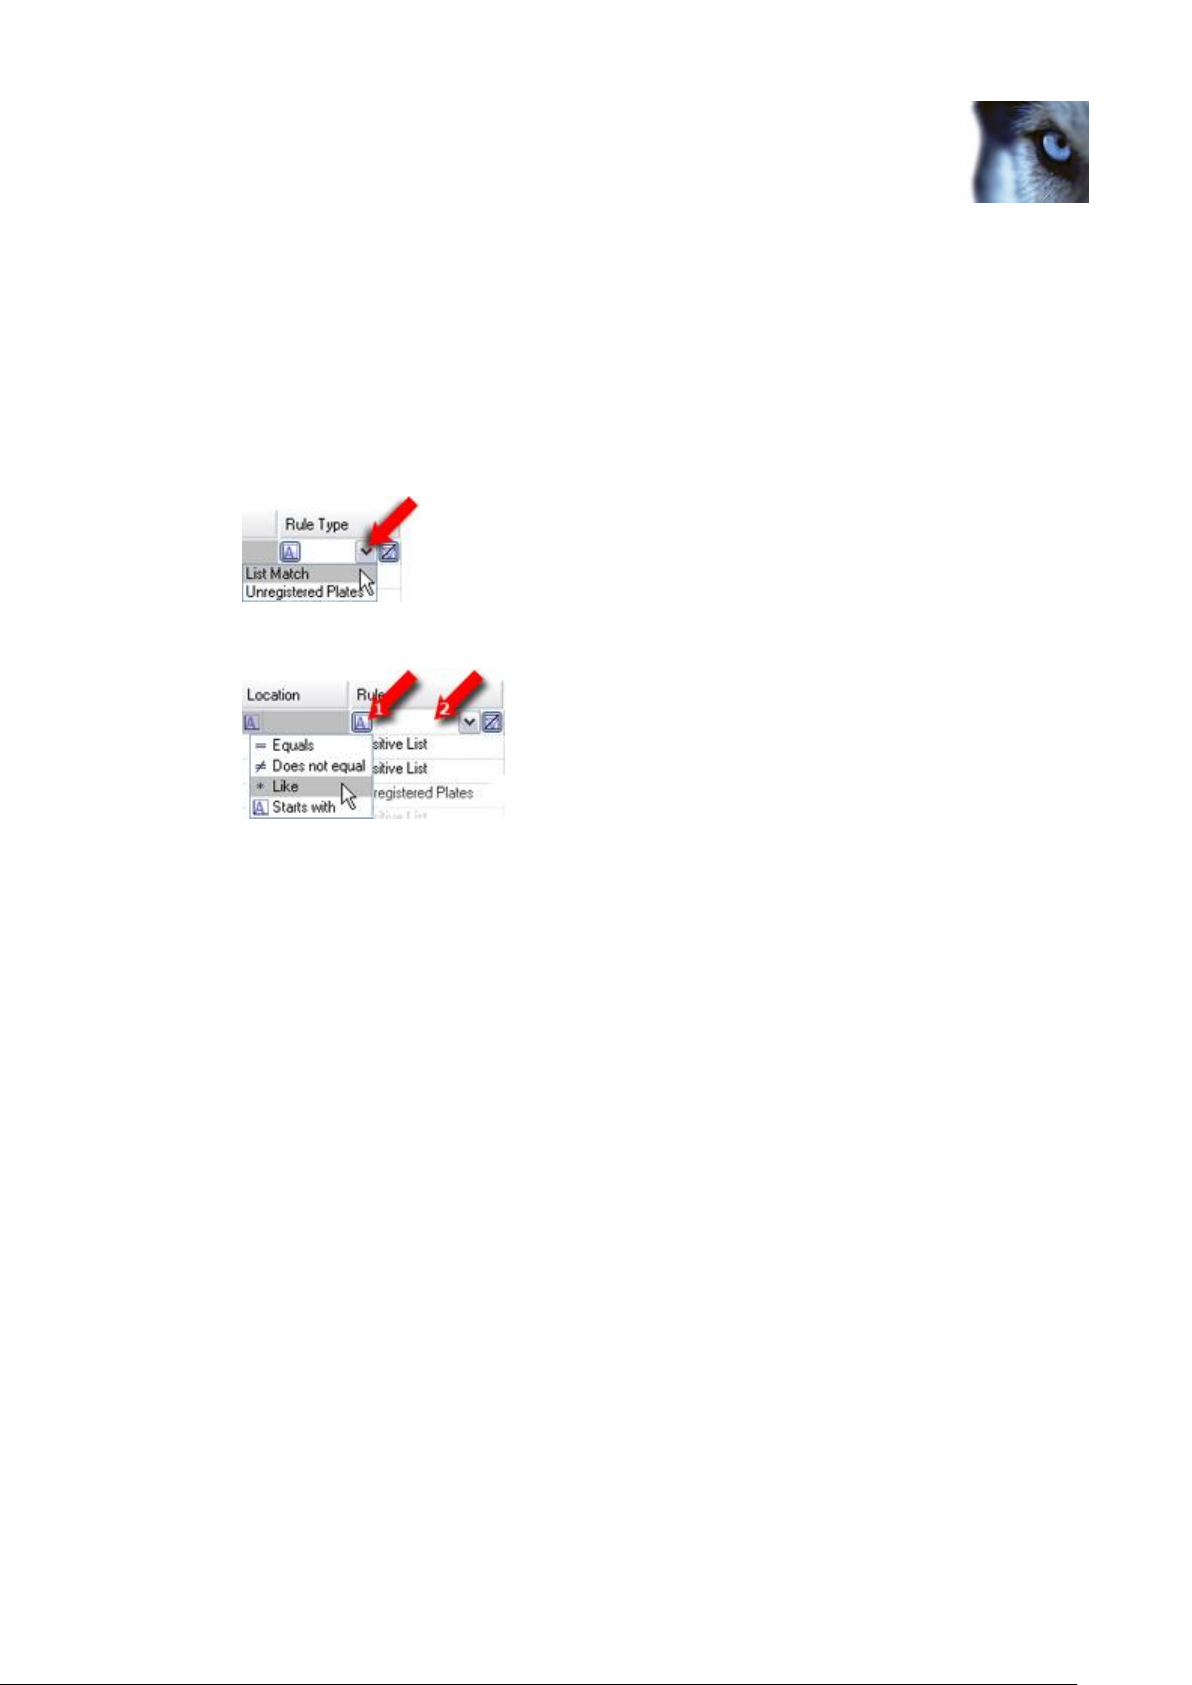
To use more advanced filtering, first select the required filtering method (1), then type
your filtering criteria in the row below the column heading (2):
Browsing Video from Around Detected Incidents
1. Select the required incident in the table in the bottom part of the view.
2. Use the Smart Client’s time browsing features (e.g. the time line browser in the right side
of the view) to browse video from around the time of the selected incident. For more
information about the Smart Client’s browsing features, refer to the XProtect Smart Client
User’s Manual, available from your surveillance system administrator or from
www.milestonesys.com.
Colored Overlays
In analytics views an image from the latest detected incident will be displayed in the view’s top
right position. This image contains an overlay in one or more colors. For more information about
interpreting the different overlay colors, see page 16.
Time Synchronization Slider
Analytics views feature a time synchronization slider for synchronizing images in the analytics
image capture position in the view’s top right position with the video displayed in the view’s top left
position. For more information about using the slider, see page 17.
www.milestonesys.com Page 15 Day-to-Day Use
Page 16

Milestone XProtect Analytics 2.2; User’s Manual
Interpreting the Colored Overlays
In analytics views an image from the latest detected incident will be displayed in the view’s top
right position. This image contains an overlay in one or more colors.
A red (●) box signifies the area of interest, i.e. the detected object, license plate, person or
whatever else your analytics solution has been set up to detect.
A blue (●) line signifies an analytics rule, for example a line which objects must not cross.
Only used in connection with certain types of analytics.
A green (●) line signifies an object path. Only used in connection with certain types of
analytics.
A yellow (●) box signifies an object which has been detected, but which does not match a
rule in the analytics solution. Example: An object which is moving, but not in a direction
that conflicts with any analytics rules. Only used in connection with certain types of
analytics.
www.milestonesys.com Page 16 Interpreting the Colored Overlays …
Page 17
Milestone XProtect Analytics 2.2; User’s Manual
Using the Time Synchronization Slider
The Time Synchronization slider is used for time-synchronizing images in the analytics image
capture position in the view’s top right position with the video displayed in the view’s top left
position.
Often there will be no need for synchronizing time between the two positions, but synchronization
may be required if you experience network latency. Network latency may cause the time stamps
for two positions' images to vary by a number of milliseconds; by moving the slider you are able to
compensate for this.
Move the slider—located in the view’s top right position—to the left to compensate by up to -2000
milliseconds; move the slider to the right to compensate by up to 2000 milliseconds.
Time synchronization slider; in this case used for compensating
by 20 milliseconds
To use your keyboard’s arrow keys to move the slider in convenient increments, first click the
slider, then press UP ARROW to reduce compensation by five milliseconds or DOWN ARROW to
increase compensation by five milliseconds.
Double-click the slider to reset compensation to 0 milliseconds.
www.milestonesys.com Page 17 Using the Time Synchronization …
Page 18

Milestone XProtect Analytics 2.2; User’s Manual
Removal
To remove the alert plugin from a computer running a Smart Client, do the following on the
computer running the Smart Client:
After you remove the alert plugin, it will no longer be possible to view analytics data in the Smart
Client.
1. In Windows’ Start menu, select Control Panel, and select Add or Remove Programs. This
will open the Add or Remove Programs window.
2. In the Add or Remove Programs window’s list of currently installed programs, select the
Milestone XProtect Smart Client Plug-in for Analytics [version #] entry, and click the
Remove button
3. You will be asked to confirm that you want to remove the software. Click Yes, and follow
the removal instructions.
If you require information about the removing the Smart Client software itself, refer to the XProtect
Smart Client User’s Manual, available from your surveillance system administrator or from
www.milestonesys.com.
www.milestonesys.com Page 18 Removal
Page 19

Milestone Systems offices are
located across the world. For
details about office addresses,
phone and fax numbers, visit
www.milestonesys.com.
 Loading...