


Ver.1.09 / Nov. / 2016
MICRONIX CORPORATION
3.3GHz/8.5GHz Handheld Signal Analyzer
MSA538(E/TG)/MSA558(E)
Operating manual
OM-12014

–I–
Before Using the Product
· Please use following the below notes described on the back panel.
· For safe use
1) When abnormal sound, abnormal smell or smoke is found, stop using and remove the battery and AC
adapter.
2) Never use this product by wet hands, or the electric shock, a fire or the damage is caused.
3) Never use this product when thundering, or the damage by lightning may be caused.
4) Never use any AC adapter other than specified, or the damage is caused. And connect the power cable to
three-terminal outlet for protecting from static electricity, or this product or a device under test may be
damaged.
5) Never use any battery other than specified, or this product is damaged. When removing or installing the
battery, do it after turning off the power and disconnecting AC adapter.
6) Be sure to charge the battery by the specified way.
Moreover, an explosion, a fire or smoking may happen if the handling of the battery is improper.
Please read the notes of the handling of battery.
· Set clock function
The time information is set at Japan standard time. Set the year, month, day and time when MSA500 series is
used for the first time. (Refer to “24.4 Setting of clock” for the details.)

–II–
· Quality assurance
Warranty
If the defect by our responsibility occurs within one year after delivered, it shall be repaired free of
charge. However, this warranty does not cover such defect that :
1) is caused by a fire or natural disasters.
2) is caused by inappropriate handling such as dropping while moving the unit delivered.
3) is caused by handling in contradiction to usage or precautions described in the operating manual.
4) is caused by modification or misuse.
We will not be responsible for direct or indirect damage caused by use or defect of this product.
Warm-up time
Warm up the product for ten minutes at least after turning on the power in order to stabilize the internal
circuit.
Precautions for storage
1) Store this unit avoiding direct sunlight or dust.
2) Store this unit in a place where temperature is -20°C to 60°C, humidity is less than 60°C/70%RH and
also variation of temperature and humidity is small.
After service
Please contact us without hesitation if you have any questions about this product:
MICRONIX CORPORATION
2987-2, KOBIKI-CHO, HACHIOJI-SHI, TOKYO 193-0934 JAPAN
TEL. +81-42-637-3667 FAX. +81-42-637-0227
URL: http://www.micronix-jp.com/ E-mail: micronix_e@micronix-jp.com

1. Outline
----------------------------------------------------------------- 1
1.1 Product outlines --------------------------------------------------- 1
1.2 Standard accessories ----------------------------------------------- 2
1.3 Lineup of five models ---------------------------------------------- 2
2. Specifications
--------------------------------------------------------- 3
2.1 Performances ---------------------------------------------------- 3
2.2 External view --------------------------------------------------- 8
3. Explanation of Panel
-------------------------------------------------- 9
4. Explanation of Screen
------------------------------------------------ 12
4.1 SWEEP MODE ------------------------------------------------- 12
4.2 REAL TIME MODE (Single view) --------------------------------- 13
4.3 REAL TIME MODE (Dual view) ----------------------------------- 14
5. Function Menu
------------------------------------------------------- 15
6. Preparing for Operation
---------------------------------------------- 24
6.1 Stand --------------------------------------------------------- 24
6.2 Connection to power supply --------------------------------------- 24
6.3 Battery charge -------------------------------------------------- 25
6.4 Installation of battery -------------------------------------------- 25
7. Measurement Mode <OPERATIONMODE>
-------------------------- 26
7.1 MAIN-MEASUREMENT mode ------------------------------------ 27
7.2 Time Domain MESUREMENT mode ------------------------------- 28
7.3 SUB-MESUREMENT mode -------------------------------------- 28
8. Center Frequency <FREQ>
------------------------------------------- 29
8.1 Setting with step keys ( [F1], [F2] ) --------------------------------- 29
8.2 Setting with encoder --------------------------------------------- 29
8.3 Setting with numeric key ----------------------------------------- 29
8.4 Set to marker position -------------------------------------------- 31
8.5 AUTO Tuning -------------------------------------------------- 31
9. Frequency Span <SPAN>
--------------------------------------------- 31
10. Reference Level <REFER>
------------------------------------------ 33
10.1 Setting of reference level ---------------------------------------- 33
10.2 Change of unit of amplitude axis ---------------------------------- 33
10.3 Setting of step size of reference level ------------------------------- 33
10.4 On-off setting of offset ------------------------------------------ 33
10.5 Setting of offset level ------------------------------------------- 33
10.6 Setting of input impedance --------------------------------------- 34
10.7 Reference level setting range for each unit --------------------------- 34
10.8 Relation between reference level and ATT/AMP (at dBm) --------------- 35
10.9 Reference level function menu in TIME DOMAIN measurement --------- 36
Contents

10.10 Setting of reference level in TIME DOMAIN measurement ------------ 37
10.11 Setting of offset level in TIME DOMAIN measurement --------------- 37
10.12 On-off setting of offset in TIME DOMAIN measurement -------------- 37
11. Display Scale <SCALE>
--------------------------------------------- 37
11.1 Setting with function key ---------------------------------------- 37
11.2 Display Scale function menu in TIME DOMAIN measurement ---------- 37
12. Resolution/Video Bandwidth <BW>
---------------------------------- 39
12.1 RBW MANUAL mode ------------------------------------------ 39
12.2 RBW AUTO mode --------------------------------------------- 39
12.3 VBW MANUAL mode ------------------------------------------ 39
12.4 VBW AUTO mode --------------------------------------------- 39
12.5 ALL AUTO mode ---------------------------------------------- 40
13. Sweep Axis / Detection Mode <SWEEP>
----------------------------- 40
13.1 MANUAL mode ----------------------------------------------- 40
13.2 AUTO mode -------------------------------------------------- 40
13.3 ALL AUTO mode ---------------------------------------------- 40
13.4 Setting of Detection mode ---------------------------------------- 41
14. Trigger Function <TRIG>
------------------------------------------- 41
14.1 Setting of Trigger source (SWEEP MODE) -------------------------- 41
14.2 Setting of Trigger source (REAL TIME MODE) ---------------------- 41
14.3 Trigger source select menu --------------------------------------- 42
14.4 Channel power trigger select menu --------------------------------- 43
15. Hold / Run <HOLD/RUN>
------------------------------------------ 44
16. Calculation Function <CALC>
-------------------------------------- 44
16.1 NORMAL mode ----------------------------------------------- 44
16.2 MAX HOLD mode --------------------------------------------- 44
16.3 MIN HOLD mode ---------------------------------------------- 45
16.4 AVERAGE mode ---------------------------------------------- 45
16.5 OVER WRITE mode ------------------------------------------- 45
16.6 SPURIOUS FREE mode (MSA558/558E) --------------------------- 45
17. Marker & peak search <MKR>
-------------------------------------- 47
17.1 Setting of marker ----------------------------------------------- 47
17.2 Setting of marker for I/Q vs. Time measurement of REAL TIME MODE --- 48
17.3 Normal peak search --------------------------------------------- 48
17.4 Zone peak search ----------------------------------------------- 49
17.5 Change for unit at maker level ------------------------------------ 49
18. Save / Load <SAVE/LOAD>
----------------------------------------- 50
18.1 Selection of storage device --------------------------------------- 50
18.2 Save function -------------------------------------------------- 51
18.3 About file name ------------------------------------------------ 52
18.4 Load function ------------------------------------------------- 52

18.5 Delete function ------------------------------------------------ 54
18.6 Presetting (Initialization) ----------------------------------------- 54
19. Measuring Function <MEAS>
--------------------------------------- 55
19.1 Channel power measurement <CH POWER> ------------------------ 56
19.2 Adjacent channel leakage power measurement <ACP> ----------------- 57
19.3 Occupied bandwidth measurement <OBW> ------------------------- 58
19.4 Electric field strength measurement <EFS ANT> ---------------------- 59
19.5 Magnetic field strength measurement <MFS PROBE> ----------------- 64
19.6 Noise measurement <NOISE> ------------------------------------ 65
20. EMI Test (MSA538E/558E)
------------------------------------------ 66
20.1 Additional function for EMI test ----------------------------------- 66
20.2 EMI test ------------------------------------------------------ 67
21. Screen Control <DSPL>
--------------------------------------------- 70
21.1 Setting of color of screen display ---------------------------------- 70
21.2 ON/OFF switching of LCD backlight ------------------------------- 70
21.3 Adjustment of brightness of LCD backlight -------------------------- 70
22. Tracking Generator Mode (MSA538TG)
----------------------------- 71
22.1 Specification of T.G. function ------------------------------------- 71
22.2 Description of I/O connector -------------------------------------- 71
22.3 ON/OFF Switching of TG function --------------------------------- 72
22.4 Normalizing function -------------------------------------------- 72
23. Storage and print of screen image <COPY>
-------------------------- 73
23.1 Selection of image area ------------------------------------------ 73
23.2 Print on printer -------------------------------------------------- 73
23.3 Storage into USB memory ----------------------------------------- 73
23.4 Transferring internal data to USB memory in a lump sum ---------------- 73
23.5 USB printer (option) --------------------------------------------- 74
23.6 USB memory --------------------------------------------------- 74
24. Utility Function <UTIL>
-------------------------------------------- 75
24.1 Label function ------------------------------------------------- 75
24.2 Menu off ----------------------------------------------------- 76
24.3 Buzzer setting ------------------------------------------------- 76
24.4 Setting of clock ------------------------------------------------ 77
25. USB device Function
------------------------------------------------ 78
25.1 Outline ------------------------------------------------------- 78
25.2 How to connect ------------------------------------------------ 78
25.3 Installation of driver -------------------------------------------- 78
25.4 Explanation of Command ---------------------------------------- 79
25.5 Input of frequency ---------------------------------------------- 87
25.6 Transfer of spectrum data ----------------------------------------- 88
25.7 Writing of original compensation data -------------------------------- 88

26. Option
-------------------------------------------------------------- 91
27. Basis Performance Test (MSA538/538E/538TG/558/558E)
------------- 94
27.1 Frequency characteristics ---------------------------------------- 94
27.2 Accuracy of reference level --------------------------------------- 95
27.3 Display accuracy of center frequency ------------------------------- 95
27.4 Display accuracy of frequency span -------------------------------- 96
27.5 Linearity of amplitude axis --------------------------------------- 96

-1-
1. Outline
1.1 Product outlines
MSA500 series signal analyzer offers both the real time system based on Fast Fourier Transform (FFT) and
the conventional sweep system. Each strong point of both systems is effectively usable.
The features are as follows.
1) Real time plus Sweep system
In real time system, the spectrum which occurs in an instant won’t be missed. It is optimum for analyzing a
noise and a transitional phenomenon. On the other hand, the sweep system is suitable for observing at wide
frequency range. Various applications can be covered by making good use of advantage of each system.
2) Sufficient analysis functions
In real time system, Spectrogram analysis and OverWrite analysis can be performed besides Spectrum
analysis. Furthermore, time domain analysis is also available.
3) Time domain analysis expanding analyzer capability
In real time system, time domain analyses such as power vs. time, frequency vs. time, phase vs. time, IQ vs.
time and Q vs. I are possible.
4) Fast OverWrite analysis of 720 frames/sec
Since OverWrite analysis in real time system is processed at high speed as 720 frames/sec, even unnecessary
spectrum which appears rarely isn’t missed.
5) Powerful trigger functions
In real time system, powerful trigger functions such as channel power trigger, power trigger, IF level trigger
and external trigger can be used.
6) Real time operation by 20MHz maximum span
Since a signal can be observed with maximum span of 20MHz in real time system, the modulation signals of
almost all of wireless communications can be captured.
7) Large memory of 16K frames and high speed USB communication
In real time system, data can be captured for a long time because the IQ memory is as large as 16K frames
(64M bytes). Moreover, IQ data can be transmitted to PC at speed of 19ms/frame.
8) Average noise level -162dBm/Hz
The average noise level of -162dBm/Hz at [MSA538/538TG/538E] and -157dBm/Hz at [MSA558/558E] is
achieved. At span 20kHz in real time mode, it is -140dBm and –135dBm respectively.
9) Compact and lightweight 1.8kg
The dimensions are as small as 162(W)x71(H)x265(D)mm, and the weight is only 1.8kg including the
battery. It is very convenient for outdoor use and on business trip.

-2-
10) Four-hour battery operation
Lithium-ion battery MB400 (option) fully charged enables about four-hour battery operation at backlight off.
11) Data storage into USB memory
USB memory can be used as an external memory. The screen image is stored by BMP format. And the
spectrum waveform, IQ data and setting parameters are stored by CSV format. Moreover, the screen image
is copied on the optional USB printer as it is.
12) Functions comparable to a bench type
・
Measuring functions : Channel power, Adjacent channel power, Occupied bandwidth, Electric field strength,
Magnetic field strength and Noise measurement
・ Calculation functions : MaxHold, MinHold, Averaging, OverWrite
・ Marker measurement and peak search function
1.2 Standard accessories
1. AC adaptor MA400
2. Carrying case
3. Accessory pouch
4. Operating manual
1.3 Lineup of five models
Model Contents
MSA538
20kHz to 3.3GHz
The most popular model
MSA558
20kHz to 8.5GHz
Covering almost all wireless systems
MSA538TG
20kHz to 3.3GHz
With TG from 5MHz to 3.3GHz
MSA538E
20kHz to 3.3GHz
With 3.3GHz EMI measurement
MSA558E
20kHz to 8.5GHz
With 8.5GHz EMI measurement

-3-
2. Specifications
2.1 Performances
■ Frequency section
MSA538/538E/538TG MSA558/558E
Frequency range 20kHz to 3.3GHz 20kHz to 8.5GHz
Center frequency
Setting
resolution
100Hz
Allows rotary encoder, numeric key and function key.
Accuracy
Sweep mode :
±(30+20T)kHz ±1dot@span≦10MHz, ※1
±(60+300T)kHz ±1dot@span≧20MHz, ※1
T: sweep time (s)
Real time mode :
±0.5ppm ±1dot
Frequency span
Setting range Sweep mode:
0Hz (zero span), 100kHz to 2GHz (1-2-5
step) and 3.3GHz (full span)
Real time mode:
20kHz to 20MHz (1-2-5 step)
Sweep mode:
0Hz (zero span), 100kHz to 5GHz (1-2-5
step) and 8.5GHz (full span)
Real time mode:
20kHz to 20MHz (1-2-5 step)
Accuracy Sweep mode : ±3% ±1dot @ one step slower sweep time than AUTO, ※1
Real time mode
: ±0.1% ±1dot
Display dots 501dots
Resolution bandwidth
※Valid only in sweep mode, 3dB bandwidth
Setting range 300Hz to 3MHz (1-3 step) and AUTO <MSA538/538TG/558>
300Hz to 3MHz (1-3 step) and AUTO, in addition 9kHz(6dB), 120kHz(6dB) and
1MHz(6dB) <MSA538E/558E>
Accuracy ±5%
Selectivity 1:4.5 (typical)@3dB:60dB
Video bandwidth ※Valid only in sweep mode, 3dB bandwidth
Setting range 100Hz to 3MHz (1-3 step) and AUTO
SSB phase noise -95dBc/Hz (typical)@100kHz offset
Spurious response less than -60dBc@sweep mode, applied to
5dB
lower signal
from REF level,
spurious free mode at MSA558/558E
less than -60dBc@real time mode, applied to
5dB
lower signal
from REF level,
to be no signal of (
REF-35dB) or more outside center frequency
±200MHz at MSA558/558E
Residual responses -80dBm (typical)@REF level ≦ -15dBm
Harmonics -40dBc (typical)@≧10MHz
Reference frequency
Temperature
stability
±0.2ppm@0 to 50℃
Aging rate ±0.5ppm@ 1 year
※1 : 23±5°C, less than 28°C/70%RH

-4-
■ Amplitude section
MSA538/538E/538TG MSA558/558E
Reference level
Setting range +10 to -60dBm, 1dB step
Accuracy ±0.8dB ±1dot@CF 100MHz, REF -15dBm ※1
Unit dBm, dBV, dBmV, dBμV, dBμV/m, dBμA/m
Average noise level -162dBm/Hz (typical) @ 1GHz
<Ref.>At real time mode, 1GHz and
span 20kHz : -140dBm(typical)
-157dBm/Hz (typical) @ 1GHz
<Ref.> At real time mode, 1GHz and
span 20kHz : -135dBm(typical)
Frequency response ±2.6dB ±1dot @<10MHz
±1.0dB ±1dot @≧10MHz
Input impedance 50Ω
Input VSWR 2.0 (typical)
Input attenuator
Attenuation
range
0 to 25dB (1dB step), coupled with reference level
Switching error ±0.6dB @100MHz
Display scale
Display dots 381 dots/10div
Scale Spectrum and OverWrire: 2, 5, 10dB/div
Power vs. time: 1, 2, 5, 10dB/div
Frequency vs. time: 1, 2, 5, 10%/div of span (actually, displayed by “Hz/div” coupled
with span)
Phase vs. time: 5, 10, 20, 40°/div
IQ vs. time: 0.02, 0.05, 0.1, 0.2V/div
Accuracy ±(0.1dB+1dot)/2dB, ±(0.2dB+1dot)/5dB, ±(0.4dB+1dot)/10dB, ±(0.9dB+1dot)/83dB
Offset
Spectrum: ±200dB, resolution 0.1dB
Power vs. time: ±100dB, resolution 1dB
Frequency vs. time: ±(span/2), resolution (span/100)
Phase vs. time: ±200°, resolution 1°
IQ vs. time: ±1V, resolution 10mV
Input damage level +27dBm(CW average power), 25VDC
RF input connector N(J) connector
※1 : 23±5°C, less than 28°C/70%RH

-5-
■ Sweep section
MSA538/538E/538TG MSA558/558E
Sweep time ※Valid only in sweep mode
Setting range
10ms to 30s (1-3 step, span 0 to
2GHz) and AUTO
30ms to 30s (1-3 step, full span) and
AUTO
10ms to 30s (1-3 step, span 0 to 2GHz)
and AUTO
30ms to 30s (1-3 step, span 5GHz, full
span) and AUTO
Accuracy ±0.1%±1dot @excluding full span
±1.5%±1dot @full span
±0.1%±1dot @excluding full span
±2.5%±1dot @full span
Trigger ※Valid
only in real time mode and zero span of sweep mode
Trigger mode Free run, Trigger
Scan mode Single, Continuous@ valid only in real time mode
Trigger source Sweep mode: Internal and External
Real time mode: Channel power, Power, IF level and External
Level setting range Internal@ sweep mode: fixed
Channel power: 0dB(ref. level) to -40dB, 1dB step
Power: 0dB(ref. level) to -40dB, 1dB step
IF level: 1 to 100% (full scale of A/D converter), 1% step
Slope Rising, Falling@ valid only in real time mode
Pre-trigger ※Valid only in real time mode
Setting range 0 to 100%, 25% step
External trigger
Voltage range
Frequency range
Input RC
Input coupling
Trigger level
Input damage level
Input connector
1 to 10Vp-p
DC to 5MHz
approx. 10kΩ// less than 15pF
DC coupling
approx. 0.56V(fixed)
±50V(DC+AC peak)
SMA(J) connector
Time resolution 5 samples @channel power
1 sample @power
14.7ns @IF level
Detection mode Positive peak, Negative peak and Sample @valid only in sweep mode.
※As for MSA538E/558E, QP and AV are added further.

-6-
■ Real time mode
MSA538/538E/538TG/558/558E common
IQ memory size
64Mbytes
Number of frames
16,383 frames max
Frame time 30.1
μs (span 20MHz) to 30.1ms (span 20kHz)
Analysis function
Spectrum analysis
Windows function
Equivalent noise band width
Data of one frame is calculated and displayed as spectrum.
4-term Blackman-Harris window
Span/301
Spectrogram analysis Three dimensional display of X axis: time (frame), Y axis: frequency and
Z axis: power (magnitude is expressed by colors)
OverWrite analysis
Overwriting frequency
Accumulation rate
Accumulation frame number
Spectrum waveform of each frame is accumulated.
Expressed in color
720 frames/s
200, 500, 1000, 2000, 5000, ∞ frames
Time domain analysis
Power vs. time
Frequency vs. time
Phase vs. time
IQ vs. time
Q vs. I
Following five types of analyses based on IQ data are displayed.
Displayed as time on X axis and power on Y axis.
Displayed as time on X axis and frequency on Y axis.
Displayed as time on X axis and phase on Y axis.
Displayed with two traces as time on X axis and IQ data on Y axis.
Displayed with polar coordinates as I data on X axis and Q data on Y axis.
■ Common function
MSA538/538E/538TG/558/558E common
Measuring function Channel power (total power and average power), Adjacent channel power, Occupied
bandwidth, Electric field strength (in addition, power density and magnetic field
strength measurements, needs optional dipole antenna), Magnetic field strength (needs
optional magnetic field probe) and Noise measurements
Calculation function Norm, MaxHold, MinHold, Averaging, OverWrite
Sweep mode: number of sweeps is 2 to 1024 (power of 2) and infinite
Real time mode: number of scans is 2 to 1024 (power of 2) and infinite
※Valid only in spectrum waveform
Marker measurement
Single:
displays frequency (8 digits max) and level (4 digits max) at one marker point.
Dual: displays each frequency and level at two marker points.
Delta: displays frequency difference and level difference between two markers.
※Invalid in OverWrite analysis
Peak search function
Searches for peak level within all of 10 div (WHOLE) or within specified zone (ZONE) and
displays frequency and level at peak level, and moreover NEXT peak search is possible at
WHOLE mode. Available for unit conversion from dB to linear system.
※Invalid in OverWrite analysis
Auto tuning
When pressing AUTO TUNE of function key, the spectrum of maximum level within
full span is adjusted to the center, and is set to optimum reference level. Moreover,
RBW, VBW and sweep time are also set to optimum parameters.
※Valid only in sweep mode

-7-
Save Saves 200 spectrum waveforms and 200 setting parameters
※ Spectrogram waveform, OverWrite waveform, five kinds of time domain
waveforms and IQ data cannot be stored in real time mode.
Save/
Load
Load Loads one spectrum waveform and one setting parameter.
■ General
MSA538/538E/538TG/558/558E common
Input connector N(J) connector
Communication
Interface Corresponding to USB 2.0
Connector B plug (device)
Transfer rate Full speed (12Mbps)
Transfer data number
501points (spectrum) / 64Mbytes max (IQ data) @ real time mode
1001points @sweep mode
Hard copy
USB printer (option) connected to A plug (host) enables hard copy of screen image.
USB memory Uses A plug (host), and stores spectrum waveform, IQ data, setting
parameters and [(spectrum waveform or IQ data)+(setting parameters)].
※Only [IQ data + setting parameters] is re-analyzable after loading.
Display
Display 5.7 inches and color LCD
Backlight LED backlight
Number of dots 640(H) x 480(V) dots
Power supply
Source of power supply External DC source (dedicated AC adaptor MA400) and Lithium-ion
battery (MB400/option)
Dedicated
AC adaptor
Input : 100 to 240VAC
Output : 9VDC/2.6A
Lithium-ion battery 7.4V/5000mAh
Charge function
Capable of charging only during power-off.
Indicates 4 conditions with two colors LED (red and green).
Remainder indication
5 levels indication
■ Other
MSA538/538E/538TG/558/558E common
Operating temperature
0 to 50°C (guaranteed at 23±10°C but at 23±5°C as to items with ※1, without carrying case)
Operating humidity less than 40°C/80%RH (guaranteed at less than 33°C/70%RH but at less than
28°C/70%RH as to items with ※1, without carrying case)
Storage temperature -20 to 60°C, less than 60°C/70%RH
Dimensions 162(W) x 71(H) x 265(D)mm (excluding projections, protection bumper and stand)
Weight approx. 1.8kg (including battery)
※1 : 23±5°C, less than 28°C/70%RH
* Refer to 『22. Tracking Generator Mode』 for the specifications of MSA538TG.

-8-
2.2 External view
[Unit : mm]
* MICRONIX Corporation reserves the right to make changes in design, specification and other information without prior notice.

-9-
3. Explanation of Panel
1) TFT display
This is a large liquid crystal display with 480 (V) × 640 (H) dots. It simultaneously displays spectrum
(10div × 10div), various setting parameters, measured values and etc.
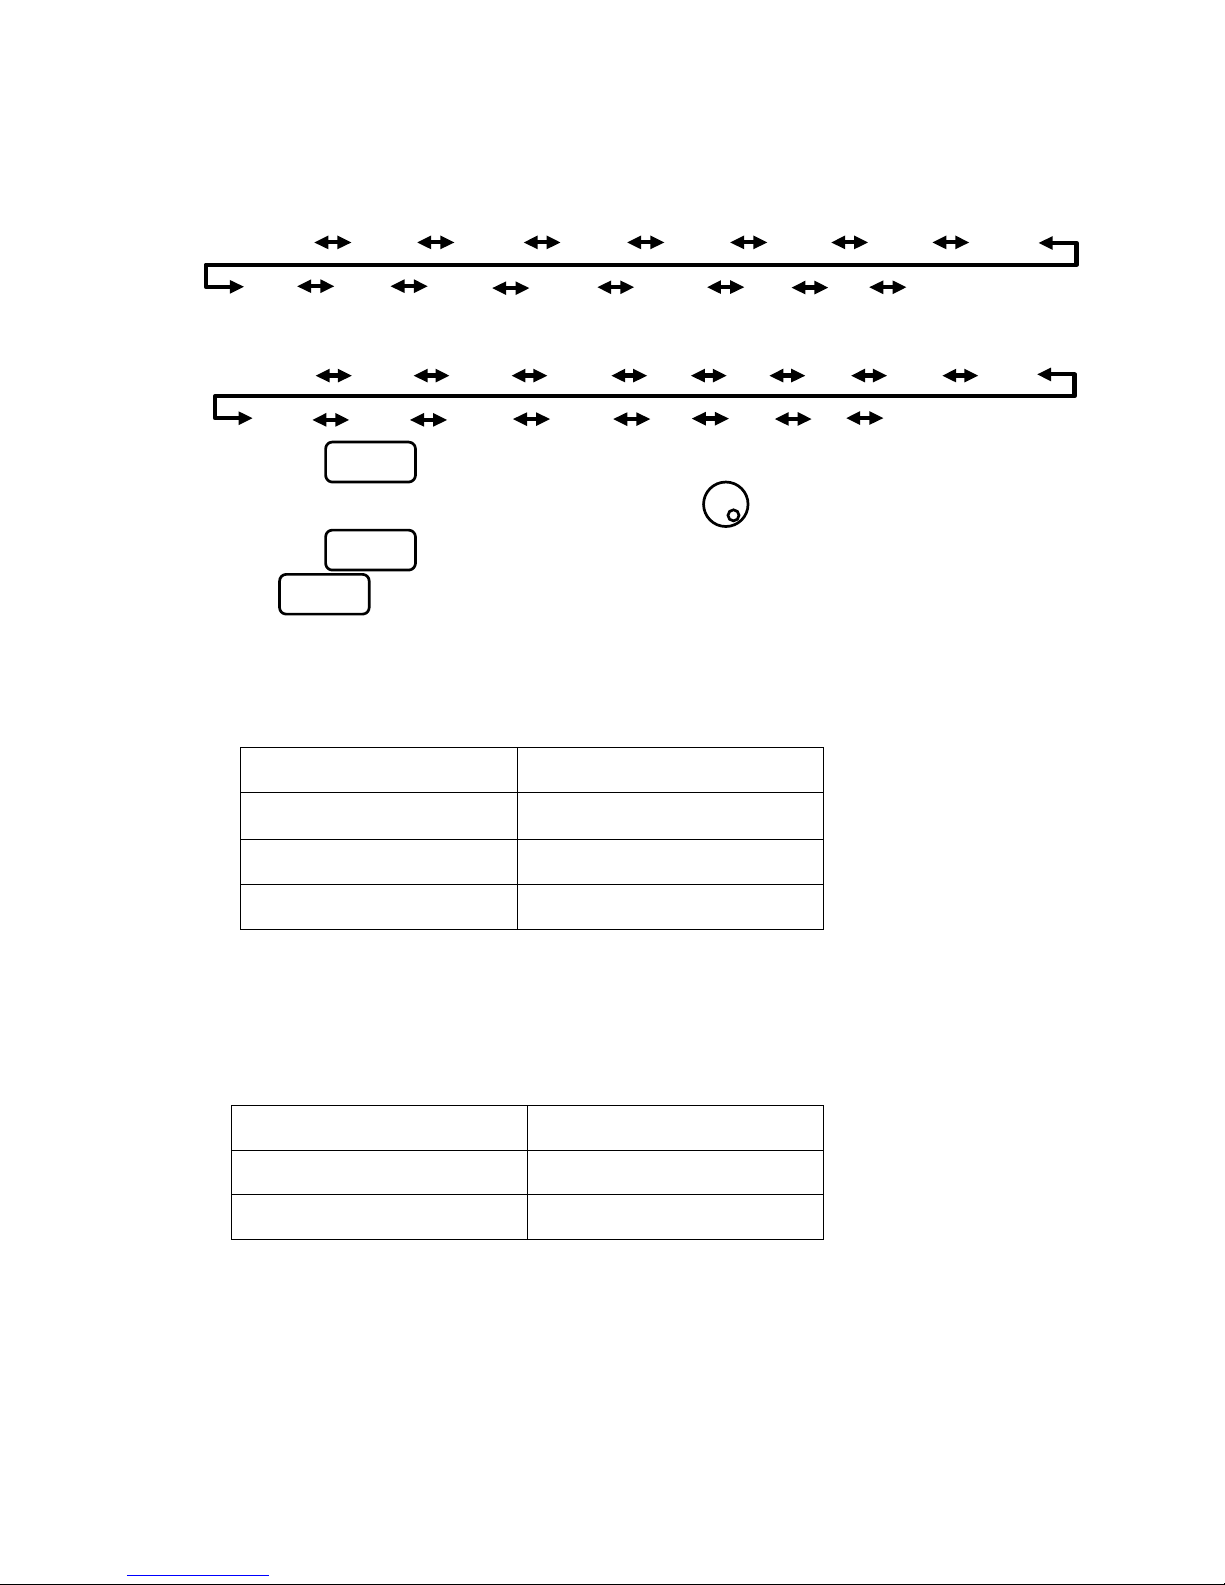
2) Function key (F1 to F6)
The function is changed according to the key operation.
1
2
5
9
10
14
15
19131820
7
6
8
3
4
11
12
16
17
22
23
24
25
26
21
1
2
5
9
10
14
15
19131820
7
6
8
3
4
11
12
16
17
22
23
24
25
26
21

-10-
3) Center frequency key
The center frequency is set with this key. The setting range is 0 to 3.3GHz(for MSA538, MSA538TG
and MSA538E), and 0 to 8.5GHz(for MSA558 and MSA558E). The setting resolution is 100Hz.
4) Frequency span key
The frequency span is set with this key.
In sweep mode, for MSA538, MSA538TG and MSA538E, it is set in/to the range from 100kHz to
2GHz, ZERO SPAN and FULL SPAN (3.3GHz). For MSA558 and MSA558E, it is set in/to the range
from 100kHz to 5GHz, ZERO SPAN and FULL SPAN (8.5GHz).
In real time mode, it is set in the range from 20kHz to 20MHz.
5) Reference level key
The reference level is set with this key. It can be set in the range from +10dBm to –60dBm by 1dB step.
6) Bandwidth key
The resolution or video bandwidth is set with this key. The resolution bandwidth can be set in the range from
300Hz to 3MHz and to AUTO. The bandwidth can be set in the range from 100Hz to 3MHz and to AUTO.
7) Trigger key
The trigger function in real time mode is set with this key.
8) Operation mode key
The sweep mode or the real time mode is set.
9) Measuring function key
Available for Channel power, Adjacent channel power, Occupied bandwidth, Electric field strength,
Magnetic field strength and Noise measurements.
10) Calculation function key
Available for Norm, Max hold, Min hold, Averaging and OverWrite.
11) Display scale key
The display scale of an amplitude axis is selectable with this key.
12) Sweep key
The sweep time is set in the range from 10ms to 30s and to AUTO. And also the detection mode is selected.
13) Hold/Run key
The measurement is stopped or restarted.

-11-
14) Marker & peak search key
The setting and the operation of marker or peak search are performed.
15) Save/Load key
The spectrum or the setting parameters is saved or loaded.
16) Copy key
The screen image is printed on USB printer (option) or stored in USB memory.
17) UTIL key
The setting of subsidiary functions such as label entry, clock, buzzer and others are performed.
18) Display control key
Color, backlight ON/OFF or brightness of backlight is set.
19) Rotary encoder
This is used for the various setting. Please rotate slowly in operation.
20) Power switch
This is for power ON or OFF.
21) Input connector
N(J) connector
22) Indicator for charging condition
Two colors LED indicates the charging conditions of battery.
23) Input connector for DC power source
AC adaptor MA400 is connected.
24) USB A plug
USB printer (option) or USB memory is connected.
25) USB B plug
The PC through USB cable MI400(option) is connected.
26) External Trigger input
SMA(J) connector

-12-
4. Explanation of Screen
4.1 Sweep mode
※1 : It is displayed when it is not possible to normal measurement for sweep time is too fast.
Please choose a slower sweep time.
Spectrum display
10div×10div
Function menu
Frequency axis setting values display
Center frequency, Frequency span,
Resolution bandwidth, Video bandwidth
Amplitude axis setting values display
Reference level, Input attenuator,
Display scale
Sweep time,
Detection mode
Calculation function display
Measuring function display
Operating information display
Loaded spectrum information display
* This is also used as a setting values display
when the measuring function is used.
Measured values display
UNCAL
UNCAL Display
※
1
Remaining battery
level display
Upper : Label display
Lower : Clock display
Active area display
Sweep axis setting
values display

-13-
4.2 REAL TIME MODE (Single view)
Spectrum display
10div×10div
Function menu
Frequency axis setting values display
Center frequency, Frequency span
Amplitude axis setting values display
Reference level, Input attenuator,
Display scale
Calculation function display
Measuring function display
Operating information display
Loaded spectrum information display
* This is also used as a setting values display
when the measuring function is used.
Remaining battery
level display
Upper : Label display
Lower : Clock display
Active area display
USB:LOAD
BA S E 3 5 2 acp8 _ S P 0 9 0 . csv
Trigger function display
Measured values display
BASE35 2 a c p8
CF:100 0 . 0 0M
SP: 20 M 5 dBm

-14-
4.3 REAL TIME MODE (Dual view)
MAIN screen
Spectrum display
10div×10div
SUB screen

-15-
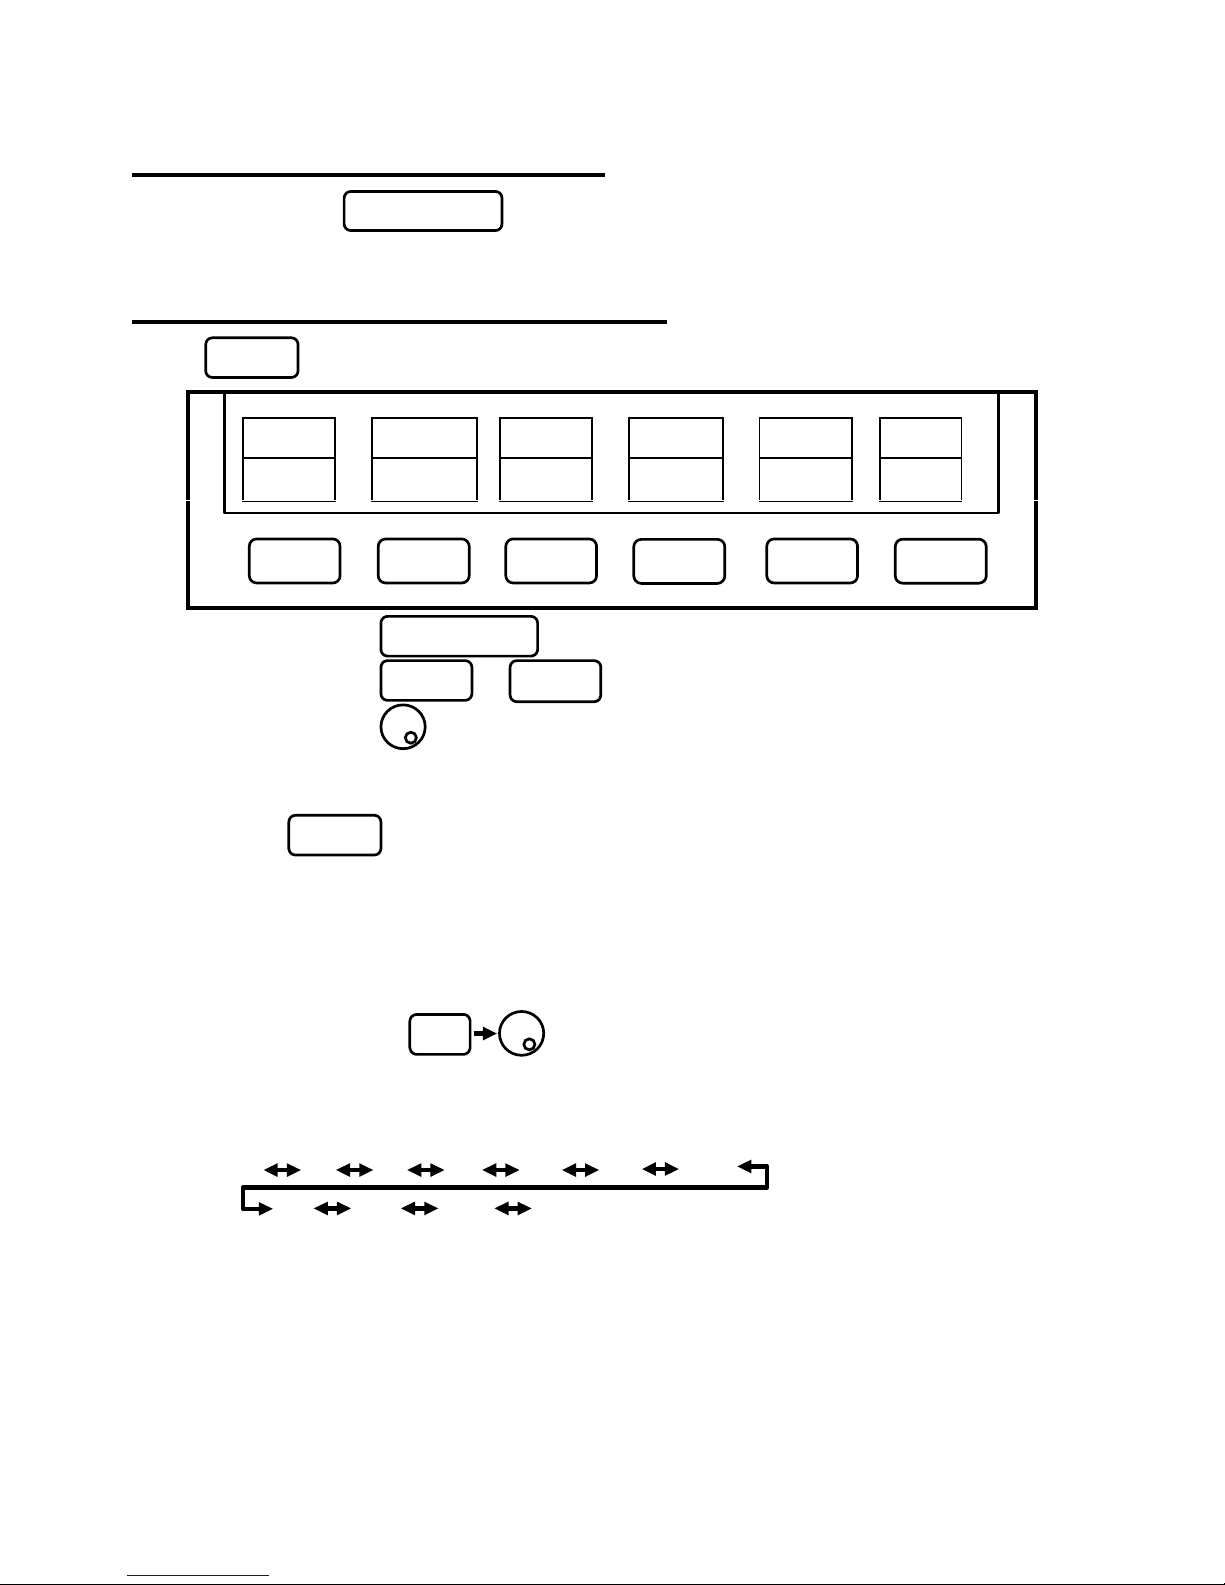
5. Function Menu
The following is the sequence of selection for the function menu.
The function menu corresponds to the function key of F1 to F6.
“Function menu”
* Refer to “7. Measurement Mode” for details.
CH POWER
ACP
OBW
ANT
EFS
MFS
PROBE
NOISE
F1
F2
F3
F4
F5
F6
OPERATIN
MODE
ANALYSIS
MAIN
SUB
T DOMAIN
SELECT
FREQ - T
POWER - T
PHASE - T
SPECTRUM
SPECTROGM
STR FRAME
2000
SPECTROGM
OVERWRITE
POWER - T
IQ - T Q - I
OFF
※Real time mode
RETURN
RETURN
RETURN
ACQ FRAME
1
STT FRAME
1
ANL FRAME
1
ENC STEP
10
ANALYSIS
MAIN
SUB
※Display in OverWrite Measurement

-16-
* Refer to “8. Center Frequency” for details.
* Refer to “9. Frequency Span” for details.
FREQ
100MHz
100MHz
EncStep SET
CENTER
Ten Key
Mode
CENTER FREQ
KeyStep
:
Set the center frequency
MKR
CENTER
AUTO
TUNE
SPAN
:
Set the frequency span
SPAN
NORMAL
SPAN
FULL
SPAN
ZERO
".”
CLEAR
BACK
SPACE RETURN
GHz MHz
RETURN

-17-
* Refer to “10. Reference Level” for details.
REFER
dBm
OFS STEP
1dB
IMP
50Ω
UNIT
1dB
REF STEP
OFF
OFFSET
1.0dB
OFS dB
OFS STEP
1dB
OFF
OFFSET
0dB
OFS dB
OFS STEP
10°
OFF
OFFSET
0°
OFS deg
OFS STEP
10mV
OFF
OFFSET
0mV
OFS V
dBm
REF
dBm
REF
dBm
REF
OFS STEP
100KHz
OFF
OFFSET
0KHz
OFS Hz
dBm
REF
※Sweep mode and Spectrum / OverWrite measurement
※Power vs Time
※Frequency vs Time
※Phase vs Time
※IQ vs Time
:Set the reference level

-18-
* Refer to “11. Display scale” for details.
* Refer to “12. Resolution/Video Bandwidth” for details.
SCALE
:
Set the display scale
SCALE
10dB/
5dB/ 2dB/
BW
:
Set the BW
SCALE
10dB/
5dB/ 2dB/ 1dB/
SCALE
2MHz/
1MHz/ 400kHz/
200kHz/
SCALE
0.2V/
0.1V/ 0.05V/
SCALE
40°/
5dB/ 2dB/ 1dB/
※Power vs Time
※Frequency vs Time
※Phase vs Time
RBW
MANUAL
AUTO
VBW
MANUAL AUTO
ALL AUTO
0.02V/
※Sweep mode and Spectrum / OverWrite measurement

-19-
* Refer to “13. Sweep axis / Detection mode” for details.
* T.G. MODE is only for MSA538TG.
* Refer to “14. Trigger Function” for details.
SWEEP
:
Set the sweep time
SWEEP TIME
MANUAL
AUTO ALL AUTO
SMPL
DET
MODE
T.G.
ON
T.G.
ON
NORM
TRIG
TRIG SRC
INT
EXT
CH1
CHANNEL
-40dB
LEVEL
RETURN
SELECT
TRIG SRC
100%
PRE TRIG
RISE
SLOPE
SINGLE
SCAN
FREE RUN
-35dB
POWER
SELECT
CH POWER
80%
IF LEVEL
EXT
RETURN
※Sweep mode
※Real time mode

-20-
* Refer to “16. Calculation Function” for details.
* “SPR. FR” is only for MSA558/558E.
* Refer to “17. Marker & peak search Function” for details.
CALC
:
Set the number
OVRWR
256 256
MAX HLD
256
MIN HLD
256
AVG
SPR. FR
OFF
NORMAL
MKR
:Set the marker position (NORMAL mode)
:Set the marker position (I/Q vs. Time measurement of REAL TIME MODE)
dBm→W
UNIT CONV
PEAK SEARCH
WHOLE
ZONE
SINGLE
MARKER
IQ TRACE
MARKER
MARKER SELECT
I Q

-21-
* Refer to “18. Save / Load” for details.
SAVE/LOAD
PRE
SET
RETURN
RETURN
RETURN
Main menu
DEVICE
MEM USB
MODE SELECT
SAVE
LOAD DELETE
Save menu
SAVE
EXECUTE
File Search Step
1
10 100
Load menu
Delete menu
:
Set the address to eliminate the file.
:
Set the address to call the file.
LOAD
EXECUTE
DELETE
EXECUTE
DISP
CLEAR
File Search Step
1
10 100
:
Set the address to store the file.
Preset menu for MSA538E/558E
PRESET
NORMAL
EMI-C
EMI-R
In case of MSA538E/558E
OBJECT
SPECTRUM
ALL DEL
DELETE

-22-
* Refer to “19. Measuring Function” for details
MEAS
:
Set the parameter
CH POWER
MFS
PROBE
NOISE
ACP
OBW
ANT
EFS
MEAS
OFF
BAND
MODE BAND
CENTER
WIDTH
:
Set the parameter
MEAS
OFF
BAND
MODE
ACP
OFFSET
WIDTH
REFERENCE
CENTER
WIDTH
N%
MEAS
OFF 99.5% 1.0%
MODE
RATIO
Enc Step
:
Set the parameter
M401
MEAS
OFF
ANT
CP-2S
MEAS
OFF
PROBE
SUM
POWER
dBμV/m
UNIT
dBm/BW
MEAS
OFF
UNIT
1Hz
BW

-23-
* Refer to “21. Screen Control” for details
* Refer to “23. Storage and print of screen image” for details
* Refer to “24. Utility Function” for details
DSPL
COLOR1
COLOR
ON
BACK LT
80
BRIGHT
COPY
WHOLE
AREA
EXECUTE
PRINT
COPY
Bmp->USB
EXECUTE
MEM→USB
UTIL
LABEL
OFF
MENU
ALWAYS
BUZZR
CONFIG
CLOCK
BACK SP
←
ENTER
→
012
abc
ABC
@%*
08
MIN
50
ENTER
YEAR
4
MONTH
30
DATE
23
HOUR
:
Select the character
:
Select the numeric value
EXECUTE
USB→MEM
SYSTEM
INFO

-24-
Please make sure to connect to ground.
6. Preparing for Operation
6.1 Stand
Utilize the stand on the back to use the screen in an easier-to-see angle on the desk.
6.2 Connection to power supply
The MA400 AC adapter is both for the use with AC power supply and for charging the MB400 built-in
battery (optional). (Charge is started automatically if AC adapter is connected and power-off.)
Connect the adapter as in the figure below and connect the AC plug to the power line (100-240 VAC,
50/60 Hz). For static electricity protection, ground the unit by connecting the three cores if possible. Not
grounding the unit can damage it and the object measured. Do not use an AC adapter other than the
MA400 supplied with the unit. Using an AC adapter other than the MA400 may cause damage to the unit.
The battery remainder is divided into five levels and displayed on the screen.
When the mark of the battery remainder is displayed like , the buzzer is sounded even if the setting of
buzzer is OFF, and the power is turned off within a few minutes.
Do the necessary work such as a protection of data promptly so that any problem should not be causes even
if the power is turned off.
Connec
t to 100
to 240 VAC, 50/60Hz
Battery full charge time: approx. 4 hours
Battery operating time: 4 hours maximum
(backlight OFF)
*In case of non-operating, at normal tem-
perature, and setting parameters are an
initialization.

-25-
6.3 Battery charge
Under the conditions of power-off and connecting the AC adaptor MA400 of a standard accessory, the battery is
charged. The charging conditions are indicated by two colors LED on the right side as shown in the table below.
※LED is turned off at power-on.
The abnormal condition means that the charging time is more than the time decided beforehand, or that the battery voltage
becomes too high.
6.4 Installation of battery
When the battery is installed, remove the battery cover on the back as shown in Fig.1 after turning off
power and removing the AC adaptor.
Next, put the battery as shown in Fig.2, move it in the direction of the arrow show in Fig.3, and install it surely.
Use the specified battery MB400. Otherwise, the breakdown and the accident might be caused.
Charging condition Color of LED
On charge red
Completion of charge green
No battery green
Abnormal blinking in red
Caution
Misuse of the battery may cause leaks, abnormal heats, firing or explosion.
For safe use, please observe the following precautions fully.
* Be not short-circuited of the terminal of the removed battery.
* Do not have an impact shock due to throwing, dropping or striking.
* Do not disassemble or remodel the battery.
* Do not throw into a fire or heat the battery.
* Do not leave the battery in the place of the high temperature.
* Do not wet the terminal of the battery.
* Do not cool the battery, and do not charge it in cold outdoor. It causes the performance and battery life
to be decreased.
* Do not charge the battery by the methods other than the specification.
* When you keep the battery, please keep it as much as possible in the cool dark place where humidity is low.
Moreover, please keep it in the place where child cannot get.
The battery not used for a long time might not be charged enough.
* Please exchange the battery for new one (MB400) when operating time shortens extremely.
Good usage of battery
Remove the battery when this unit is used with the AC adaptor.
Otherwise, the number of charging increases and the battery life
might be shortened.
Fig.1
Fig.2
Fig.3
※
Please charge it at the operating temperature of 0
℃
to 40
℃
.

-26-
7. Measurement Mode <OPERATION MODE>
By pushing , SWEEP MODE and REAL TIME MODE can be changed.
*In SWEEP MODE, screen menu does not change.
*In REAL TIME MODE, the following real time mode menu is displayed.
*In REAL TIME MODE, by pushing , it can be changed to SWEEP MODE.
Even if the power is turned OFF, the setup of measurements made at the end on each of SWEEP MODE
and REAL TIME MODE is remembered. However, when the power is turned ON, starting mode is
always SWEEP MODE.
Real Time Mode Menu
1. By pushing , main-measurement mode select menu is displayed.
(Refer to 7.1 MAIN-MEASUREMENT mode)
2. By pushing , sub-measurement mode select menu is displayed.
(Refer to 7.3 SUB-MESUREMENT mode)
1 frame consists of 1024 sample on time domain.
Sample/Frame time and maximum acquisition time depends on the span setting as follows.
Span Sample Time Frame Time Maximum Acquisition Time
20 MHz 29.4 ns 30.1 us 0.4935 s
10 MHz 58.8 ns 60.2 us 0.9869 s
5 MHz 118 ns 121us 1.973 s
2 MHz 294 ns 301 us 4.935 s
1 MHz 588 ns 602 us 9.869 s
500 kHz 1.18 us 1.21 ms 19.73 s
200 kHz 2.94 us 3.01 ms 49.35 s
100 kHz 5.88 us 6.02 ms 98.69 s
50 kHz 11.8 us 12.1 ms 197.3 s
20 kHz 29.4 us 30.1 ms 493.5 s
ANALYSIS
ACQ FRAME
STT FRAME
ANL FRAME
ENC STEP
MAIN
SUB
1 1 1
10
OPERATION MODE
OPERATION MODE
F1 F2 F3 F4 F5 F6
F2
F1

-27-
3. By operating , the number of analysis frames can be set.
4. By operating , the analysis start frame can be set.
5. By operating , the analyzed frame number can be set.
6. By pushing , the encoder step value can be changed as follows.
1 10 100 1000
Real Time Mode Menu (in OVERWRITE measurement)
7. By pushing , the stored frame number can be changed as follows.
200 500 1000 2000 5000 **(infinite)
7.1 MAIN-MEASUREMENT mode
1. By pushing , SPECTRUM measurement is displayed.
2. By pushing , SPECTROGRAM measurement is displayed.
3. By pushing , OverWrite measurement is displayed.
Then, it is not possible to set the sub-measurement mode.
4. By pushing , Time Domain measurement select menu is displayed.
(Refer to 7.2 Time Domain MESUREMENT Mode)
ANALYSIS
STR FRAME
MAIN
SUB 200
SPECTRUM
SPECTROGM
OVERWRITE
T DOMAIN
SELECT
RETURN
F3
F4
F5
F6
F1
F2
F3
F4
F5
F6
F2
F1
F3
F4
F1
F2
F3
F4
F5
F6
F3

-28-
7.2 Time Domain MESUREMENT mode
1. By pushing , Power vs. Time measurement is displayed.
2. By pushing , Frequency vs. Time measurement is displayed.
3. By pushing , Phase vs. Time measurement is displayed.
4. By pushing , IQ vs. Time measurement is displayed.
5. By pushing , Q vs. I measurement is displayed.
7.3 SUB-MESUREMENT mode
1. By pushing , Power vs. Time measurement is displayed.
2. By pushing , Spectrogram measurement is displayed.
3. By pushing , measurement is not performed on a sub screen.
Note: In a sub screen, the setting of offset level is invalid, and the display scale is fixed at 10dB/dev.
POWER - T
FREQ - T
PHASE - T
IQ - T
Q - I
RETURN
POWER - T
SPECTROGM
OFF IQ - T
Q - I
RETURN
F1
F2
F3
F4
F5
F6
F2
F1
F3
F4
F5
F1
F2
F3
F4
F5
F6
F2
F1
F3

-29-
8. Center Frequency <FREQ>
When
is pushed, the following function menu is displayed.
8.1 Setting with step keys
( [F1], [F2] )
1. When is pushed, the center frequency decreases in the set step size.
2. When is pushed, the center frequency increases in the set step size.
3. Setting step size:
When is pushed, the step size is changed according to the following.
AUTO 100MHz 10MHz 1MHz 100kHz 10kHz 1kHz 100Hz
AUTO :
The step size is 1/10 of the frequency span.
AUTO is recommended in normal use.
8.2 Setting with encoder
1. By rotating , the center frequency is changed in the set step size.
2. Setting step size:
When is pushed, the step size is changed according to the following.
AUTO 100MHz 10MHz 1MHz 100kHz 10kHz 1kHz 100Hz
AUTO :
The step size is 1/500 of the frequency span.
However, if the frequency span is less than 50kHz, the step size is set to 100Hz.
AUTO is recommended in normal use.
8.3 Setting with numeric key
1. When is pushed, the following function menu is displayed.
CENTER FREQ
Key Step
Enc Step
SET
Ten Key
←
→
100M
100M
MKR
Mode
F1
F2
F3
F4
FREQ
F1 F2 F3 F4 F5 F6
* Center frequency setting range: 0 to 3.3GHz@MSA538(E/TG), 0 to 8.5GHz@MSA558(E)
*
The center frequency may shift for a while (up to 10 sec.), after setting is changed.
F6

-30-
TRIG
2 3
SWEEP
7
2. , and correspond to <GHz>, <MHz> and <. >
and correspond to <CLEAR> and <BACK SPACE>.
Changing of center frequency by encoder is available in Ten Key Mode.
3. The center frequency can be input directly according to “Numeric Key Mapping Diagram” as follows.
4. The center frequency is determined by inputting of the unit of frequency.
For inputting of the unit, and are available.
( and are also available.)
* Any figures below the setting resolution (100Hz) will be truncated.
5. Change of setting
The setting values can be changed before pushing the unit key.
:
The setting values are cleared.
:
The last input digit is deleted.
6. Cancel of Ten Key Mode
By pushing or , the function menu is returned.
BACK
GHz
MHz
“.”
CLEAR
SPACE
RETURN
F4
F5
FREQ
F1 F2 F3 F4 F5 F6
F6
F1
F2
F3
F4
F5
F1 F2
MEAS
DSPL
MKR
CALC
OPERATION
MODE
SAVE
LOAD
RUN
HOLD
4 5
0 9 8
UTIL
SCALE
BW
COPY
1
6
.
MHz
GHz
UTIL
DSPL

-31-
8.4 Set to marker position
By pushing , the center frequency is set according to the frequency of
current marker position.
* Any figures below the setting resolution (100Hz) will be truncated.
* When the marker is not displayed, this operation is invalid. (The function menu disappears.)
8.5 AUTO Tuning
By pushing , the spectrum with the maximum level is searched within full
span, and then it is adjusted to the center of the screen, and the optimum setting parameters are set.
* Set the frequency span before setting AUTO tuning.
* AUTO tuning starts with the push of AUTO TUNE key. (The function menu is not displayed.)
* The auto tuning does not operate normally in the following conditions.
1) Zero span
2) Full span
3) The signal level is –40dBm or lower.
4) The signal frequency is 50MHz or lower.
9. Frequency Span <SPAN>
When
is pushed, the following function menu is displayed.
By operating , the frequency span is set.
1. By rotating , the frequency span is changed in the specified step size as follows.
Real time mode
20k 50k 100k 200k 500k 1M 2M 5M 10M 20M [Hz]
SPAN
SPAN
F1 F2 F3 F4 F5 F6
NORMAL
FULL ZERO
SPAN
SPAN
SPAN SPAN
1GHz 50MHz 1MHz
F5
F5
F2
F1
-32-
Sweep mode
MSA538 / MSA538E / MSA538TG
ZERO 100k 200k 500k 1M 2M 5M 10M
20M 50M 100M 200M 500M 1G 2G FULL(3.3G)[Hz]
MSA558/MSA558E
ZERO 100k 200k 500k 1M 2M 5M 10M 20M
50M 100M 200M 500M 1G 2G 5G FULL(8.5G)[Hz]
2. By pushing , the frequency span is set to FULL SPAN.
Under such a condition, it returns to former span when is turned by rotation.
3. By pushing , the frequency span is set to ZERO SPAN.
4. When is pushed and then the setting is FULL or ZERO span, the frequency span is returned
to the last setting.
■
Switching frequency band
MSA558 and MSA558E have three frequency bands.
The frequency band is automatically set to the appropriate band based on the center frequency and span.
(At the span less than 200MHz, only one band is used.)
When the setting frequency range belongs to two bands, the lower band has a priority.
The frequency connection point of two bands is fixed as follows.
Two bands
Frequency connection point
Base band and Band 1- 3.30GHz
Band 1- and Band 1+ 6.19GHz
Note: The amplitude of spectrum may not display correctly at the frequency connection point.
For the accurate measurement, center frequency and span should be set as the measured frequency
range is in one band.
Frequency band Measured frequency range
Base band
20kHz to 3.50GHz
Band 1-
3.30GHz to 6.19GHz
Band 1+
5.99GHz to 8.50GHz
F2
F1
F3

-33-
10. Reference Level <REFER>
In SWEEP MODE and Spectrum/OverWrite measurement of REAL TIME MODE, when is
pushed, the following function menu is displayed.
10.1 Setting of reference level
By rotating , the reference level is changed.
(Refer to “10.7 Reference level setting range for each unit” for details.)
10.2 Change of unit of amplitude axis
When is pushed, the unit is set as follows.
dBm dBμV dBmV dBV
10.3 Setting of step size of reference level
By pushing , the step size is changed to 10dB or 1dB.
10.4 On-off setting of offset
By pushing , the on-off setting is changed.
ON/OFF : The setting of offset is valid / invalid.
10.5 Setting of offset level
1.By operating , the offset of reference level is set.
When external amplifier or attenuator is used, the display level can be matched by the offset.
The setting range is -50.0 to 50.0dB.
The reference level is displayed including the offset.
* If the offset is set, “OFS” is displayed in Amplitude axis setting values display area.
Furthermore, the level at the marker point is displayed including the offset.
* If the unit is changed to dBμV, dBmV, dBV or W, the offset is automatically changed.
2.By pushing , the step size of offset is changed. (10dB, 1dB, 0.1dB)
UNIT
REF STEP
OFS dB
OFFSET
OFS STEP
IMP
dBm 1dB
1.0dB
OFF 1 dB 50Ω
F1
F1
F2
F3
F4
F5
F6
REFER
F2
F4
F3
F5

-34-
10.6 Setting of input impedance
By pushing , the input impedance (50Ω /75Ω) is selected.
The conversion of reference level is automatically executed.
When the input impedance is set to 75Ω with adapter MA308 (50Ω/75Ω impedance converter),
the reference level is displayed including offset and conversion of 75Ω.
*
When “75Ω” is selected, “75Ω” is displayed in Amplitude axis setting values display area, and
the offset is set to 5.7dB (insertion loss of MA308). Moreover, the offset can be changed.
When the unit at marker point is set to W, V, V/m or other, it is converted correctly from dBm.
*
Be sure to attach adapter MA308(50Ω /75Ω impedance converter), when “75Ω” is selected.
10.7 Reference level setting range for each unit
Unit dBm dBμV dBmV dBV
Maximum 10 117 57 -3
Minimum -40 67 7 -53
Minimum
(shifted spectrum data)
-60 47 -13 -73
“Available unit in measuring function”
Unit dBμV/m (Electric field strength measurement)
dBμA/m
(Magnetic field
strength measurement)
Setting M401 M402 M403 M404 M405 M406 M407 CP-2S
Maximum 143 146 149 151 138 159 141 160~203
Minimum 93 96 99 101 88 109 91 110~153
Minimum
(shifted spectrum
data)
73 76 79 81 68 89 71 90~133
* When the reference level is set between “Minimum” and “Minimum (shifted spectrum data)”, the
spectrum of “Minimum” is shifted and displayed on the screen.
* When the reference level is set below “Minimum”, “S/W AMP” is displayed in Amplitude axis
setting values display area on the screen.
Calculating formula (conversion from dBm)
● A[dBμV]=107+X[dBm] ● B[dBmV]=47+X[dBm] ● C[dBV]=-13+X[dBm]
● D[dBμV/m]=68.8/λ×√(X/Gar)[dBm] λ:Wavelength[m] Gar:Antenna absolute gain[times]
● E[dBμA/m]=107+X+F[dBm] F:Probe calibration coefficient[dB] ※ changes depending on the frequency.
F6

-35-
10.8 Relation between reference level and ATT/AMP
(at dBm )
Internal input attenuator (ATT) and IF amplifier (AMP) are automatically set to the optimum values
based on the reference level (REFER). (The input attenuator cannot be set independently.)
* When the input signal level is higher than the proper level for 1st mixer’s terminal, harmonics
distortion and spurious are generated.
This product is designed so that the input signal level of 1st mixer is determined to proper level based
on the reference level.
REFER
(dBm)
ATT
(dB)
AMP
(dB)
REFER
(dBm)
ATT
(dB)
AMP
(dB)
REFER
(dBm)
ATT
(dB)
AMP
(dB)
REFER
(dBm)
ATT
(dB)
AMP
(dB)
10
25 0
-3 12 0
-16
0 1
-29
7 21 9 24 0
-4 11 0
-17
0 2
-30
6 21 8 23 0
-5 10 0
-18
0 3
-31
5 21
7
22 0
-6 9 0
-19
0 4
-32
4 21
6
21 0
-7 8 0
-20
0 5
-33
3 21 5 20 0
-8
7
0
-21
15 21
-34
2 21
4
19 0
-9 6 0
-22
14 21
-35
1
21
3
18
0
-10
5 0
-23
13 21
-36
0 21 2 17 0
-11
4 0
-24
12 21
-37
0 22
1
16
0
-12
3 0
-25
11 21
-38
0 23
0
15 0
-13
2 0
-26
10 21
-39
0
24
-1
14 0
-14
1 0
-27
9 21
-40
0 25 -2 13
0
-15
0 0
-28
8 21

-36-
10.9 Reference level function menu in TIME DOMAIN measurement
In TIME DOMAIN measurement (Power vs. Time, Frequency vs. Time, Phase vs. Time, IQ vs. Time) of
REAL TIME MODE, when
is pushed, the following function menu is displayed.
REF
OFS dB
OFFSET
OFS STEP
OFS STEP
IMP
dBm
0dB
OFF
1dB
1 dB
50Ω
REF
OFS Hz
OFFSET
OFS STEP
OFS STEP
IMP
dBm
0kHz
OFF
100kHz
1 dB
50Ω
REF
OFS deg
OFFSET
OFS STEP
OFS STEP
IMP
dBm
0゜
OFF
10゜
1 dB
50Ω
REF
OFS V
OFFSET
OFS STEP
OFS STEP
IMP
dBm
0mV
OFF
10mV
1 dB
50Ω
F1 F2 F3 F4 F5 F6
REFER
Power vs. Time measurement
F1 F2 F3 F4 F5 F6
Frequency vs. Time measurement
F1 F2 F3 F4 F5 F6
Phase vs. Time measurement
F1 F2 F3 F4 F5 F6
IQ vs. Time measurement

-37-
10.10 Setting of reference level in TIME DOMAIN measurement
By operating , the reference level is changed.
10.11 Setting of offset level in TIME DOMAIN measurement
1.By operating , the offset of reference level is set.
2.By pushing , the step size of offset is changed.
10.12 On-off setting of offset in TIME DOMAIN measurement
By pushing , the on-off setting is changed.
ON/OFF : The setting of offset is valid/invalid.
11. Display Scale <SCALE>
11.1 Setting with function key
When
is pushed, the following function menu is displayed.
1. By pushing , 10dB/div display scale is set.
2. By pushing , 5dB/div display scale is set.
3. By pushing , 2dB/div display scale is set.
11.2 Display Scale function menu in TIME DOMAIN measurement
In TIME DOMAIN measurement (Power vs. Time, Frequency vs. Time, Phase vs. Time, IQ vs. Time) of
REAL TIME MODE, when
is pushed, the following function menu is displayed.
SCALE
10dB/ 5dB/ 2dB/
F2
SCALE
F1
F1 F2 F3 F4 F5 F6
F3
F2
F4
F1
F3
SCALE

-38-
By pushing ~ or , specified display scale is set.
SCALE
10dB/ 5dB/ 2dB/ 1dB/
SCALE
2MHz/ 1MHz/ 400kHz/ 200kHz/
SCALE
40゜/ 20゜/ 10゜/ 5゜/
SCALE
0.2V/ 0.1V/ 0.05V/
0.02V/
F1 F2 F3 F4 F5 F6
Power vs. Time measurement
F1 F2 F3 F4 F5 F6
Frequency vs. Time measurement
F1 F2 F3 F4 F5 F6
Phase vs. Time measurement
F1 F2 F3 F4 F5 F6
IQ vs. Time measurement
F1
F3
F4
10, 5, 2, 1%/div of span. Actually, displayed by “Hz/dev” coupled with span.

-39-
12. Resolution/Video Bandwidth <BW>
When
is pushed, the following function menu is displayed.
12.1 RBW MANUAL mode
By pushing , MANUAL mode is set.
By rotating , RBW is set as follows.
MSA538/538TG/558 : 300Hz 1kHz 3kHz 10kHz 30kHz 100kHz 300kHz
1MHz 3MHz
MSA538E/558E : 300Hz 1kHz 3kHz 10kHz 30kHz 100kHz 300kHz 1MHz 3MHz
9kHz(6dB) 120kHz(6dB) 1MHz(6dB) (※A value becomes orange color in case of 6dB.)
12.2 RBW AUTO mode
By pushing , the optimum RBW is set based on the frequency span and sweep time.
* When AUTO mode is set, “*” is displayed on the right end of RBW setting value display.
12.3 VBW MANUAL mode
By pushing , MANUAL mode is set.
By rotating , VBW is set as follows.
100Hz 300Hz 1kHz 3kHz 10kHz 30kHz
100kHz 300kHz 1MHz 3MHz
12.4 VBW AUTO mode
By pushing , the optimum VBW is set based on the frequency span and sweep time.
* When AUTO mode is set, “*” is displayed on the right end of VBW setting value display.
RBW VBW
MANUAL AUTO
MANUAL AUTO
ALL AUTO
F2
BW
F1
F5
F6
F1 F2 F3
F4
F3
F4

-40-
12.5 ALL AUTO mode
By pushing , the optimum RBW, VBW and sweep time are set based on the frequency span.
* When ALL AUTO mode is set, “*” is displayed on the right end of each setting value display.
* When RBW is set to 100kHz or less, the selectivity at 60dB becomes larger than an actual value due
to SSB phase noise.
13. Sweep Axis / Detection Mode <SWEEP>
When is pushed, the following function menu is displayed.
13.1 MANUAL mode
By pushing or rotating , MANUAL mode is set.
By rotating , sweep time is set as follows.
10ms 30ms 0.1s 0.3s 1s 3s 10s 30s
* For MSA538, MSA538E and MSA538TG, when setting to FULLSPAN, it cannot be set to 10ms.
* For MSA558 and MSA538E, when setting to 5GHz SPAN or FULLSPAN, it cannot be set to 10ms.
* When RBW is setting to 300Hz or 1kHz, it cannot be set to 10ms or 30ms.
13.2 AUTO mode
By pushing , the optimum sweep time is set based on the frequency span and RBW.
* When AUTO mode is set, “*” is displayed on the right end of SWEEP setting value display.
13.3 ALL AUTO mode
By pushing , the optimum RBW, VBW and sweep time are set based on the frequency span.
* When ALL AUTO mode is set, “*” is displayed on the right end of each setting value display.
SWEEP TIME
DET TRIG
T.G.
MANU
AUTO
ALL AUTO
SMPL INT
MODE
F5
F2
F3
SWEEP
F1
F1
F2
F3
F4
F5
F6
* T.G. MODE [F6] is only for MSA538TG. This menu is not displayed on MSA538, MSA538E, MSA558 and
MSA558E. For the details, refer to “22. Tracking Generator Mode”.

-41-
13.4 Setting of Detection mode
(For MSA538E and MSA558E, refer to “20. EMI test”)
By pushing , the detection mode is set.
POS SMPL NEG
POS (Positive Peak) : The maximum value of the sample points is detected.
SMPL (Sample) : The momentary value of the sample points is detected.
NEG (Negative Peak) : The minimum value of the sample points is detected.
14. Trigger Function <TRIG>
In SWEEP MODE, when
is pushed, the following function menu is displayed.
14.1 Setting of Trigger source (SWEEP MODE)
1. By pushing , the sweep is automatically repeated. This setting is normally used.
2. By pushing , when the signal over the trigger level (0.56V) is input to external trigger
input, the sweep starts.
14.2 Setting of Trigger source (REAL TIME MODE)
In REAL TIME MODE, when
is pushed, the following function menu is displayed.
1. By pushing , trigger source select menu is displayed.
(Refer to 14.3 Trigger source select menu)
TRIG SRC DET
TRIG T.G.
INT EXT SMPL
INT
MODE
TRIG SRC
PRE TRIG
SLOPE
SCAN
SELECT
100%
RISE
SINGLE
F4
TRIG
F1 F2 F3
F4
F5
F6
F2
F1
TRIG
F1 F2 F3
F4
F5
F6
F1

-42-
2. By pushing , trigger position can be set. It can be only set when the number of analysis
frames is 4 or more.
100% : The portion before the trigger point and the trigger point is displayed.
0% : The portion after the trigger point and the trigger point is displayed.
It can be set in step of 25% between 0 to 100% .
Spectrogram measurement screen
3. By pushing , trigger slope is set.
RISE FALL
4. By pushing , trigger motion is set.
SINGLE CONTINUE
SINGLE: When a trigger event occurs, the scan is performed one time.
CONTINUE: The scan is performed, whenever a trigger event occurs.
14.3 Trigger source select menu
1. By pushing , FREE RUN is selected. The measurement is performed continuously.
2. By pushing , power of an input is selected as for a trigger. By rotating , the power
value is set. Trigger condition is defined as the total power within the span. Trigger level is described
as the relative value against the reference level . When the trigger slope is set to “RISE”, if the signal
power exceeds the trigger level, the waveform is updated. When the trigger slope is set to “FALL”, if
the signal power is lower than the trigger level, the waveform is updated. The trigger level is set to -40
to 0 dB (1dB Step).
FREE RUN
POWER
CH POWER
IF LEVEL
EXT
-35dB
SELECT
80%
RETURN
F2
Trigger point
100%
50%
0%
Before
trigger point
Before
trigger
point
After
trigger
point
After
trigger
point
F4
F3
F1 F2 F3 F4 F5 F6
F2
F1
Trigger point
Trigger point

-43-
3. By pushing , channel power is selected as for a trigger, and channel power select menu is
displayed. (Refer to 14.4 Channel power trigger select menu)
4. By pushing , internal IF level is selected as for a trigger. Trigger condition is defined as
the ratio between the instantaneous signal level and the full scale of IF signal path. If the signal level
exceeds the trigger level, the waveform is updated. The trigger level is set to 1 to 100 % (1% Step).
5. By pushing , external trigger is set. Trigger condition is defined as the external trigger
input voltage. When the trigger slope is set to “RISE”, if the input level exceeds the fixed threshold
(0.56V), the waveform is updated. When the trigger slope is set to “FALL”, if the input level is lower
than the fixed threshold(0.56V), the waveform is updated.
14.4 Channel power trigger select menu
Trigger condition is defined as the total power within the channel. The span is divided into 5 then each piece is
defined as the channel. 1 is the lowest frequency, 3 is the center and 5 is the highest frequency. Choice of the one
of 5 channels is to be used as the trigger source. Trigger level is described as the relative value against the
reference level. The trigger slope setting works as same as Power trigger.
By pushing , channel as for a trigger source is set.
CH1 CH2 CH3 CH4 CH5
By rotating , the value is set.
The comparison table is shown in below. Please refer to the table at page 26 for the sample time.
Trigger Source Time Resolution Slope Level Range
IF Level 14.7 ns RISE only 1 to 100 % (1% Step)
Power 1 sample RISE/FALL -40 to 0 dB (1dB Step)
Channel Power 5 sample RISE/FALL -40 to 0 dB (1dB Step)
External Analog bandwidth DC-5MHz RISE/FALL 0.56V Fixed
CHANNEL
LEVEL
CH1
-40dB RETURN
CH1 CH2 CH3 CH4 CH5
F3
F5
F4
F1 F2 F3 F4 F5 F6
F1
-44-
15. Hold / Run <HOLD/RUN>
By pushing , the sweep is switched to halt and continuance.
16. Calculation Function <CALC>
When
is pushed, the following function menu is displayed.
16.1 NORMAL mode
1. When is pushed, the normal mode is set. The calculation is not performed in this mode.
The number of times of the sweep is infinite. This mode is normally used.
* When this mode is set, “NORMAL” is displayed in the CALC area on the screen.
(Refer to “4. Explanation of Screen” for the details.)
16.2 MAX HOLD mode
1. By the operation of , the number of times of the sweep in MAX HOLD mode is set.
2. The update spectrum data is compared with the data left last time at each point, and the larger one is
retained and displayed.
2 4 8 16 32 64 128
256 512 1024 **(infinite)
* When this mode is set, “MAX --- (number of times)” is displayed in the CALC area on the screen.
(Refer to “4. Explanation of Screen” for the details.)
NORMAL MAX HLD
MIN HLD AVG OVRWR SPRI FR
**
** 256 ** OFF
HOLD/RUN
F1
F2
C
ALC
* By pushing , the sweep is restarted.
* By pushing
~
, the calculation functions is selected.
By rotating
, the sweep count can be set.
HOLD/RUN
F1 F2 F3
F4
F5
F6
F1
F5

-45-
16.3 MIN HOLD mode
1. By the operation of , the number of times of the sweep in MIN HOLD mode is set.
2. The update spectrum data is compared with the data left last time at each point, and the smaller one is
retained and displayed.
2 4 8 16 32 64 128
256 512 1024 **(infinite)
* When this mode is set, “MIN --- (number of times)” is displayed in the CALC area on the screen.
(Refer to “4. Explanation of Screen” for the details.)
16.4 AVERAGE mode
1. By the operation of , the number of times of the sweep in AVERAGE mode is set.
2. The simple averaging processing is executed at each sweep.
2 4 8 16 32 64 128
256 512 1024
* When this mode is set, “AVG --- (number of times)” is displayed in the CALC area on the screen.
(Refer to “4. Explanation of Screen” for the details.)
16.5 OVER WRITE mode
1. By the operation of , the number of times of the sweep in OVER WRITE mode is set.
2. The image on the screen is not cleared at each sweep, and the overwriting display is executed.
2 4 8 16 32 64 128
256 512 1024 **(infinite)
* When this mode is set, “OVER WR” is displayed in the CALC area on the screen.
(Refer to “4. Explanation of Screen” for the details.)
* Only the last spectrum is saved.
16.6 SPURIOUS FREE mode (MSA558/558E)
1. By pushing , the SPURIOUS FREE mode, by which the spurious response peculiarly
caused at band 1- and band 1+ is simply deleted, is selected.
* “SPR” is displayed in CALC area on the screen.
(Refer to “4. Explanation of Screen” for the details.)
* Differing from base band at which the up-conversion of input frequency is done with a frequency
mixer, the spurious response peculiar to band 1- and band 1+ is generated because the
down-conversion is done at those two bands.
F4
F3
F5
F6

-46-
* About SPURIOUS FREE mode
1. SPURIOUS FREE mode is a mode by which the spurious response peculiarly caused at
band 1- and band 1+ is simply deleted.
2. SPURIOUS FREE mode is especially effective in the measurement of a stationary wave.
3. If SPURIOUS FREE mode is used in measurement of a signal with level change or
frequency change, the phenomenon that the level goes down is caused.
4. The noise level goes down a little in case of a noise changing at random. In short, the same
phenomenon as MIN HOLD function happens.
* How to judge SPURIOUS response at band 1- and band 1+
The procedure for judging SPURIOUS response at band 1- and band 1+ is as follows.
1. Set the center frequency to < (current setting value) + f >.
2. The spectrum shifting left by f is a correct spectrum, but another spectrum shifting such as
left by 2f, left by 3f, right by f, right by 2f or right by 3f is a spurious response.
* “f ” should be changed according to SPAN for easy judgment. For reference;
f = SPAN/(10 to 50) (corresponding to 0.2 to 1 div)
Example: judging a spectrum displayed at 6.92GHz
(setting : center frequency 6.92GHz and SPAN 500MHz)
1. Set the center frequency to < 6.92GHz + 500MHz/25 > = 6.94GHz.
2. A spectrum at 6.92GHz (shifting left by f from 6.94GHz) is correct. A spectrum at
6.98GHz (shifting right by 2f from 6.94GHz) is spurious.
Additionally, a spurious response mentioned above shifting right by 2f at band 1+ is
largest, and other spurious response are about 25 to 50dB smaller than that.

-47-
17. Marker & peak search <MKR>
When is pushed, the following function menu is displayed.
● Main menu of marker function
17.1 Setting of marker
1. By pushing , the marker mode is selected.
SINGLE DUAL DELTA OFF
SINGLE: One marker is displayed.
DUAL: Two markers are displayed.
DELTA: Delta marker is displayed.
OFF: Marker is not displayed.
2. By pushing and , an active marker is selected.
The displayed content is different according to setting by .
SINGLE MODE Marker select key is not displayed because of one marker.
DUAL MODE:
M1: 1st marker is active.
M2: 2nd maker is active.
DELTA MODE:
REF: reference maker is active.
DELTA: another maker is active.
OFF: Marker select key is not displayed.
MARKER MARKER SELECT PEAK SEARCH
UNIT CONV
DUAL M1
M2
WHOLE ZONE dBm→W
MKR
F5
F6
F1 F2 F3
F4
F1
F2
F3 F1

-48-
17.2 Setting of marker for I/Q vs. Time measurement of REAL TIME MODE
● Main menu of marker function for I/Q vs. Time measurement of REAL TIME MODE
1. By pushing , the marker mode is selected.
IQ TRACE OFF
IQ TRACE: Two markers (I & Q) are displayed.
OFF: Marker is not displayed.
2. By pushing and , an active marker is selected.
I: A marker on the trace data of I is active.
Q: A marker on the trace data of Q is active.
17.3 Normal peak search
● Menu of normal peak search
When is pushed, the following function menu is displayed.
1. When is pushed, the marker moves to the maximum peak position of spectrum.
2. When is pushed, the marker moves to the next higher peak of the peak on which
the marker is attached. Fifty or less peaks are available.
3. When is pushed, the function menu is returned to the main menu of maker function.
MARKER MARKER SELECT
IQ TRACE I
Q
PEAK NEXT
SEARCH
PEAK
RETURN
F1
F5
F6
F1 F2 F3
F4
F4
F2 F6
F5
F6
F1 F2 F3
F4
F1
F2 F3

-49-
17.4 Zone peak search
● Menu of Zone mode
When is pushed, the following function menu is displayed.
At the Zone mode, the marker automatically moves to the maximum peak point within the range
beforehand set.
When entering this mode, the zone is displayed with light blue shadow in the spectrum display area.
The marker moves to maximum level within this zone at each sweep.
By the operation of , the center of the zone is decided.
By the operation of , the width of the zone is decided.
※The marker doesn't move in HOLD.
17.5 Change for unit at maker level
When is pushed, the unit at marker level is changed.
If the unit of the reference level is dBm, it is changed like [dBm] [W].
If the unit of the reference level is dBμV, dBmV or dBV, it is changed like
[dBμV, dBmV, dBV] [V].
If the unit of the reference level is dBμV/m, it is changed like [dBμV/m] [V/m].
If the unit of the reference level is dBμA/m, it is changed like [dBμA/m] [A/m].
Moreover, the sub-unit is attached as follows according to the level.
[W] [W, mW, μW, nW, pW, fW]
[V] [V, mV, μV, nV]
[V/m] [V/m, mV/m, μV/m, nV/m]
[A/m] [A/m, mA/m, μA/m, nA/m]
"V/m" is displayed only when the electric field strength measurement is selected.
(Refer to "19.4 Electric field strength measurement".)
"A/m" is displayed only when the magnetic field strength measurement is selected.
(Refer to "19.5 Magnetic field strength measurement".)
ZONE
CENTER WIDTH RETURN
F5
F6
F1 F2 F3
F4
F5
F1
F2
F6

-50-
18. Save / Load <SAVE/LOAD>
When is pushed, SAVE/LOAD menu is displayed as follows.
18.1 Selection of storage device
1. When is pushed, the built-in flash memory is selected as a storage device.
※ IQ data cannot be saved in the built-in flash memory.
2. When is pushed, the external USB memory is selected as a storage device.
※ Install the USB memory in USB A plug on the right side firmly. Refer to the figure below.
※ The “FAT” or “FAT32” format USB memory is only available.
※ If the USB memory is installed again after it is installed once and then removed, the
MSA500 series cannot normally recognize it. In that case refer to the following operation.
Method of recognition:
By the operation of , the USB memory is recognized.
MODE SELECT DEVICE PRE
SAVE LOAD DELETE MEM USB
SET
SAVE/LOAD
F1 F2 F3
F4
F5
F6
F4
F5
SAVE/LOAD
F5

-51-
18.2 Save function
When is pushed, SAVE menu is displayed as follows.
1. In this function, the data is stored in the built-in memory or USB memory by CSV format.
The data stored in USB memory can be used with a personal computer as a CSV file.
“SVLD” which is a folder for storage is automatically generated and the data is stored in it as a file.
2. By pushing , the object to be stored is selected.
SPECTRUM PARAMETER IQ DATA SPEC + PARA IQ + PARA IQ FULL
SPECTRUM : The current spectrum on the screen is stored.
PARAMETER : The setting parameters are stored.
IQ DATA : IQ data in current analysis area is stored.
SPEC + PARA : The spectrum and the setting parameters are stored as one file.
IQ + PARA : IQ data in current analysis area and the setting parameters are stored as one file.
IQ FULL : IQ data in current acquisition area and the setting parameters are stored as one file.
IQ data can be saved when following conditions are satisfied.
(1) On real-time mode, the acquisition is completed.
(2) Time domain is selected on Analysis Main menu.
(3) Start Frame and Analysis Frame are specified.
※IQ data can be saved only in USB memory. IQ data cannot be saved in the built-in flash memory.
IQ data is a big volume.
It takes 50 or more minutes when 16K frames are saved.
3. When is pushed, SAVE is executed.
The data is stored by the file name displayed in the active area (refer to “4. Explanation of screen”).
As for the file name, refer to “18.3 File name”.
200 or less files can be stored in the built-in memory. 1000 or less files can be stored in USB memory.
4. When is pushed, the former menu is displayed.
OBJECT SAVE
SPECTRUM
EXECUTE
RETEURN
F1
F1
F4
F6
F1 F2
F3
F4
F5
F6

-52-
18.3 About file name
1. The file name is attached to the file stored using this function as follows.
LABEL_SP001.csv
① ② ③ ④
① The named label is pasted. Refer to “24.1 Label function”.
② S :The object stored is the spectrum (SPECTRUM).
P :The object stored is the setting parameters (PARAMETER).
I :The object stored is the IQ data in current analysis area(IQ DATA).
SP :The object stored is both of spectrum and setting parameters (SPEC + PARA).
IP :The object stored is both of IQ data in current analysis area and setting parameters (IQ + PARA).
IF :The object stored is both of IQ data in current acquisition area and setting parameters (IQ +
PARA).
③ The consecutive three digit number from “000” is automatically attached if ① and ② are same.
④ This is the extension showing CSV format and is automatically attached.
2. If the label is not named, “MSA” instead of it is attached and the file name becomes below.
MSA_SP001.csv
3. About file name at the time of storage
When SAVE is selected, a candidate of file name is displayed in the active area following
above-mentioned regulations.
When SAVE is executed as it is, the data is stored with that file name. If the file exists in the storage
device and is rotated left before SAVE is executed, those file names are displayed one by one.
If SAVE is executed with an existing file name displayed, the data is overwritten on it.
18.4 Load function
When is pushed, LOAD menu is displayed as follows.
1. When is rotated right and left, the stored file name is displayed one by one from the specified
storage device in the active area as follows.
File Search Step LOAD DISP
1 10 100
EXECUTE
CLEAR
RETURN
F2
F1
F2
F3
F4 F5
F6
① USB : LOAD
② MSA_SP012.csv
③ 12

-53-
①
The storage device in which the file is stored is displayed.
(USB: USB memory, MEM: built-in memory)
②
The file name selected.
③
Number attached to file
The files in the specified folder of the storage device are sorted in alphabetical order. And this shows
that number.
2. Selection of number of skips of files to be searched
By
, the file is displayed in order of the number attached to it in the active area.
The number skips each 10 by and each 100 by as well.
Select it according to the number of stored files.
3. When is pushed, LOAD is executed.
※
When setting parameters are loaded, they are displayed in the loaded spectrum information display
area. [Refer to “4. Explanation of screen” for details.]
※
When the spectrum is loaded, the MSA500 series enters HOLD state and a current spectrum
disappears. And then the loaded spectrum is displayed.
When is pushed after then, a loading spectrum and a current spectrum are
displayed together.
※ When the IQ data or IQ data with setting parameters is loaded, MSA500 enters HOLD state and a
current waveform data disappears. Then the loaded data is shown with the analysis type specified
in the IQ file. The setting parameters shall be set as follows.
Operation Mode: Real Time
Center Frequency: The value recorded in IQ file.
Span: The value recorded in IQ file.
Ref. Level: The value recorded in IQ file.
Acquisition Frame: The value recorded in IQ file.
Start Frame: 1
Analysis Frame: Same as the acquisition frame
Main Measurement: The type recorded in IQ file.
Sub Measurement: Off
Display Scale: 10 dB/div
4. When is pushed, the loaded spectrum can be non-displayed.
F4 F1 F2
F3
F5
HOLD/RUN

-54-
18.5 Delete function
When is pushed, DELETE menu is displayed as follows.
1. The file name to be deleted is selected from the specified device with , and then display it in the
active area. As for the number of skips, it is the same as “18.4 Load function”.
2. When is pushed, DELETE is executed. The file displayed in the active area is deleted at this
time.
3. Repeat 1. and 2. operation, and more than one file can be deleted one by one.
4. When is pushed, all files are deleted at once.
18.6 Presetting (Initialization)
( For MSA538E/558E, refer to “20. EMI test”.)
When is pushed, the setting parameters are reset to the initialization shown below.
“Initialization”
File Search Step
DELETE ALL DEL
1 10 100
EXECUTE EXECUTE RETURN
Items Parameters
Center frequency 1GHz
Frequency span 20MHz
Reference level 10dBm
Offset 0.0dB
Impedance 50Ω
Sweep time 30ms
Detection mode Sample mode (SMPL)
RBW 100kHz
VBW 30kHz
Display scale 10dB/div
F6 F3
F4
F1 F2 F3
F4
F5
F6
F5

-55-
19. Measuring Function <MEAS>
When is pushed, the following function menu is displayed.
The measuring function can be selected as follows.
CH POWER ----------- Channel power measurement
ACP ----------------------- Adjacent channel leakage power measurement
OBW ---------------------- Occupied bandwidth measurement
EFS ANT ---------------- Electric field strength measurement
MFS PROBE ----------- Magnetic field strength measurement
NOISE ------------------- Noise measurement
* Once the measuring function is set, when is pushed, the function menu is directly returned to the
last setting of the measuring function. In order to stop the measuring function or to select the other measuring
function, push [F6] key (MEAS OFF), then the function menu is returned to the main menu of the
measuring function.
* Each of the four functions (Channel power, Adjacent channel leakage power, Occupied bandwidth and
Noise) and the marker function cannot be used at the same time. When is pushed while each of
the four functions is selected, the measuring function is stopped.
Similarly, when the measuring function is selected while using the marker function, the marker function is
stopped.
* Although 501 points are displayed on its screen, the number of points calculated in the instrument is all of
1001 points.
EFS MFS
CH POWER
ACP
OBW ANT PROBE
NOISE
F1
F2
F3
F4 F5
MEAS
MEAS
MKR
F6
F1
F2
F3
F4
F5
F6

-56-
19.1 Channel power measurement <CH POWER>
The total power in the specified frequency band is measured.
Two modes, TOTAL and BAND, are available.
●TOTAL mode [ By pushing (MODE), TOTAL mode is selected.]
The sum of power or the average of power in the displayed spectrum specified by center frequency and
frequency span are measured.
[Measuring mode] [Measured value]
●BAND mode [ By pushing (MODE), BAND mode is selected.]
The sum of power or the average of power in the band specified by band center and bandwidth are
measured.
[Measuring mode] [Measured value]
[Setting parameter]
* “CP TOTAL” is displayed in MEAS area on the screen.
* The measured value is displayed at the lower right corner on the screen.
By
pushing (POWER), the sum of power and the average of
power are switched.
* “CP BAND” is displayed in MEAS area on the screen.
* The measured value and the setting parameter are displayed at the
lower on the screen.
1. By (BAND CENTER)
, the band center is
set.
2. By (BAND WIDTH) , the band width is set.
3. By
pushing (POWER), the sum of power and the average
of power are switched.
F1 F1
F2
F3
F1
F4
F4

-57-
19.2 Adjacent channel leakage power measurement <ACP>
The adjacent channel leakage power is measured as the ratio of power in the range specified by offset
frequency and bandwidth to carrier power. Both of leakage power at the upper and lower side are measured.
Furthermore, the method for measurement is selected out of three methods based on the classification of
definition of carrier power; total power method, reference level method and in-band method.
●Mode selection and measurement
[ By pushing (MODE), TOTAL, BAND or PEAK mode is selected.]
* “ACP TOTAL”, “ACP BAND” or “ACP PK” is displayed in MEAS area on the screen.
* The measured value and the setting parameter are displayed at the lower on the screen.
●Definition of reference carrier for each mode
TOTAL (total power method)
This is based on the sum of power in
the
displayed spectrum. The center
frequency of
the reference carrier is set by [F4].
F1
1. By (ACP OFFSET)
, the offset frequency
of adjacent channel is set.
* The offset is from the center frequency of the reference carrier.
2. By (ACP WIDTH)
, the band width of
adjacent channel is set.
3. By (REFERENCE CENTER) , the center
frequency of the reference carrier is set.
* [F4] is only for TOTAL and BAND mode.
4. By (REFERENCE WIDTH)
, the band
width of reference carrier is set.
* [F5] is only for BAND mode.
F2
F3
F4 F5
BAND (in-band method)
This is based on the sum of power in the
specified bandwidth. The center frequency
of the reference carrier is set by [F4].
PEAK (reference level method)
This is based on the power of peak on the
screen. The center frequency of the
reference carrier is automatically set to the
peak on the screen.
[Measured value]
[Setting parameter]
[Measuring mode]
F2

-58-
19.3 Occupied bandwidth measurement <OBW>
It is possible to measure the occupied frequency bandwidth defined as the width of points at N(%) of the total
power (N% POWER), or as the width of points that are X(dB) lower than the peak level (XdB DOWN).
●N% POWER mode [ By pushing (MODE), N% POWER mode (N%) is selected.]
The bandwidth of points at N(%) of the total power is measured.
●XdB DOWN mode [ By pushing (MODE), XdB DOWN mode (X dB) is selected.]
The bandwidth of points that are X(dB) lower than the peak level is measured.
* “OBW N%” is displayed in MEAS area on the screen.
* The measured value is displayed at the lower
right corner on the
screen.
1. By (RATIO %)
, the percentage of the
total power is set.
* Setting range : 80.0 to 99.9%
2. By
, the step size of RATIO % can be set to 1% or
0.1%.
* “OBW XdB” is displayed in MEAS area on the screen.
* The measured value is displayed at the lower right corner on the
screen.
1. By (XdB)
, the down level from the peak
level is set.
* Setting range : 0.1 to 80.0dB
2. By , the step size of XdB can be set to 1dB or 0.1dB.
F1
F1
F2
F2
F3
F3 F3
[Measuring mode]
[Setting parameter]
[Measured value]
[Measuring mode]
[Setting parameter]
[Measured value]

-59-
19.4 Electric field strength measurement <EFS ANT>
Connecting a dipole antenna (option) to the RF input enables the measurement of the electric field strength.
Other than the optional antenna is also available by creating the original compensation data.
(Refer to “25.7 Writing of original compensation data” for the details.)
[Antenna connection] [Measurement environment]
[Specifications of dipole antenna (The antenna gain and VSWR are specified at the center of frequency range.)]
* When M405 ,M407 is used, the measurement errors will occur due to how to hold of instrument and influence of human body,
because M405 ,M407 is 1/4λ whip antenna. The error value will be several dB or more. In order to reduce the error, separate
MSA500 series from human body as much as possible.
Items M401 M402 M403 M404 M405 M406 M407
Type Sleeve Sleeve Sleeve Sleeve 1/4λ whip Sleeve
1/4λ whip
Frequency
range
0.8 to 1GHz 1.25 to 1.65GHz 1.7 to 2.2GHz 2.25 to 2.65GHz 300 to 500MHz 4.7 to 6.2GHz 470 to 770MHz
Antenna gain
>1dBi >1dBi
>1dBi
>1dBi
>1dBi
>1dBi
>1dBi
VSWR <1.5 <1.5
<1.8
<1.8
<1.5
<1.8
<1.5
Dimensions 7.5φ×280mm 7.5φ×280mm 7.5φ×210mm 7.5φ×210mm 8.0φ×212mm 7.5φ×152mm 8.0φ×138mm
Weight Approx. 65g Approx. 65g
Approx. 65g
Approx. 65g
Approx. 62g
Approx. 65g
Approx. 56g
Reference level
setting range
(except for the
minimum value
in screen shift)
93 to 143
dBμV/m
96 to 146
dBμV/m
98 to 148
dBμV/m
100 to 150
dBμV/m
87 to 137
dBμV/m
109 to 159
dBμV/m
91 to 141
dBμV/m
F4
Antenna
M401
M402
M403
M404
M405
M406
M407
* Turn the back to the signal source.
MSA500 series
Connect to
RF INPUT.

-60-
●Mode selection and measurement
By pushing (ANT), the antenna (M401/M402/M403/M404/M405/M406/M407/USER) can be
selected. The measurement starts as soon as the antenna is selected.
* “EFS M40X” or “EFS USER” is displayed in MEAS area on the screen.
* “USER” is the original compensation data which is created by the user.
(Refer to “25.8 Writing of original compensation data” for the details.)
* The spectrum may exceed the area on the screen depending on the antenna gain compensation.
* The optimum center frequency and frequency span are automatically set according to the antenna.
In addition, a spectrum other than the frequency range of the antenna is not displayed.
By pushing (UNIT), the unit of measurement can be set.
dBμV/m dBμW/m2 dBμA/m
●Directivity of antenna (reference data)
* The following are the data when the antenna is connected to RF input directly with no obstacles around.
Actually, the directivity changes due to the human body when handling the unit.
* The data of M405 and M407 are the reference data which is included the influence of the human body.
F1
0°
90°
270°
180°
E plane:X-Y axis (X direction=0°)
F2

-61-
M401 (900MHz, E plane) Antenna gain vs. Frequency
-4
-3
-2
-1
0
1
2
3
4
0.8 0.85 0.9 0.95 1
Frequency (GHz)
ANT Gain (dBi)
M402 (1.5GHz, E plane) Antenna gain vs. Frequency
-1.5
-0.5
0.5
1.5
2.5
3.5
4.5
1.25 1.35 1.45 1.55 1.65
Frequency (GHz)
ANT Gain (dBi)

-62-
M403 (2GHz, E plane) Antenna gain vs. Frequency
M404 (2.4GHz, E plane) Antenna gain vs. Frequency
0.5
1
1.5
2
2.5
3
3.5
4
4.5
5
5.5
1.7 1.8 1.9 2 2.1 2.2
Frequency (GHz)
ANT Gain (dBi)
1
1.5
2
2.5
3
3.5
4
4.5
5
5.5
2.25 2.35 2.45 2.55 2.65
Frequency (GHz)
ANT Gain (dBi)

-63-
M405 (horizontal plane) Antenna gain vs. Frequency
0.0
1.0
2.0
3.0
4.0
5.0
0º
30º
60º
90º
120º
150º
180º
210º
240º
270º
300º
330º
300MHz
400MHz
500MHz
-0.2
0
0.2
0.4
0.6
0.8
1
1.2
1.4
1.6
300 325 350 375 400 425 450 475 500
Frequency (MHz)
ANT Gain (dBi)
M406 (5.4GHz, E plane) Antenna gain vs. Frequency
M407 (horizontal plane) Antenna gain vs. Frequency
4.70
Frequency(GHz)
3.5
3
2.5
1.5 1
ANT Gai
n
(dBi)
4.95 5.2
5.45 5.70 5.95
6.20
1.6
1.7
1.8
1.9
2
470 52 0 57 0 6 2 0 6 70 7 2 0 7 70
Frequ e nc y ( M H z )
A N T G a i n ( dB i)

-64-
19.5 Magnetic field strength measurement <MFS PROBE>
The magnetic field distribution can be measured by using the magnetic field probe CP-2S (option).
“Specifications of magnetic field probe CP-2S” (Refer to the operating manual for CP-2S for the details.)
●Mode selection and measurement
By pushing (PROBE), CP-2S or USER mode is selected.
The measurement starts as soon as the probe is selected.
* “MFS CP2S” or “MFS USER” is displayed in MEAS area on the screen.
* “USER” is the original compensation data which is created by the user.
(Refer to “25.8 Writing of original compensation data” for the details.)
The unit of amplitude axis is automatically changes into [dBμA/m].
* A spectrum other than the frequency range of the probe is not displayed.
Item Specifications
Frequency range 10MHz to 3GHz
Space resolution (-6dB)
approx. 0.25mm
(depending on objects)
Reference level setting range: maximum 160 to 203dBμA/m
Reference level setting range: minimum
(except for the minimum value in screen shift)
110 to 153dBμA/m
Measurement error approx.±1dB (probe simple substance)
F1
[Magnetic field probe connection]
Magnetic field probe
CP-2S
The tip of the magnetic field probe CP-2S is made of glass-
ceramic board. Take care
when handling the probe even though the strength of the glass-cera
mic board is
sufficiently ensured under normal operation.
F5

-65-
19.6 Noise measurement <NOISE>
By pushing (NOISE), the noise measurement can be performed.
●Unit of measurement and band width selection
By pushing (UNIT), the unit of measurement can be set.
dBm/BW dBμV/
√BW
dBmV/
√BW
dBV/
√BW
By pushing
(BW), the band width can be set.
By rotating , the band width is changed in the set step size.
1Hz 3Hz 10Hz 30Hz 100Hz 300Hz 1kHz
3kHz 10kHz 30kHz 100kHz 300kHz 1MHz 3MHz
F6
F6
F1 F2

-66-
20. EMI Test (MSA538E/558E)
20.1 Additional function for EMI test
● Detection mode (Refer to “13. Setting the Detection mode”)
By pushing , the detection mode can be set.
POS SMPL NEG QP AV
In MSA538E/558E, QP detection and AV detection are added for EMI measurement.
POS (Positive Peak) : The spectrum of the maximum value between the sample points
SMPL (Sample) : The spectrum of the momentary value between the sample points
NEG (Negative Peak) : The spectrum of the minimum value between the sample points
QP (Quasi Peak) : The spectrum of the quasi peak value between the sample points
AV (Average) : The spectrum of the average value between the sample points
As for QP detection, the following characteristics are chosen according to the setting of RBW.
(based on CISPR16)
RBW charging
time constant
dis-charging
time constant
meter
time constant
9kHz 1ms 160ms 160ms
120kHz 1ms 550ms 100ms
● Preset (Initialization) (Refer to “18. Save/Load”)
In MSA538E/558E, the radiated emission measurement and the conducted emission measurement are
added to the preset as a default setting.
By pushing , the menu is displayed
NORMAL : The initial parameters of normal mode are set.
EMI-C : The initial parameters of conducted emission measurement are set.
EMI-R : The initial parameters of radiated emission measurement are set
In the radiated mission measurement, “USER” is selected as an antenna.
It is necessary to input the compensation data of antenna beforehand.
SWEEP
F4
SAVE/LOAD
F6 F1
F2
F3

-67-
20.2 EMI test
The limits of conducted disturbance and radiated disturbance are standardized by QP detection and AV
detection. However, it takes long time for QP detection and AV detection. Therefore, the measurement time
can be shortened by using them in the final measurement to the spectrums narrowed by the PK detection.
● Conducted emission measurement
The conducted emission discharged through the power supply line is measured.
In this measurement, LISN* (Line Impedance Stabilization Network) device is needed.
The connection is shown in the figure below. Please refer to the manual of LISN for details of the
connection and notes.
*MICRONIX provides the LISN product (MPW201B).
1. Turn on the power of MSA538E/558E after the connection.
2. Set the initial parameters of conducted emission measurement by pushing
. The setting parameters are as follows.
Center Frequency : 25.5MHz
Frequency span : 50MHz
RBW : 9kHz
VBW : 1MHz
Sweep time : 3sec
Detection mode : Positive peak mode
3. Confirm whether the connection and the operation are correct by supplying the power to the EUT and
measuring.
4. Set the number of times of the sweep in the MAX HOLD mode by operating
. For example, it is set to 256 times.
5. Search the frequency of disturbance noise that exceeds the AV or QP limits by using the marker function.
6. Set the center frequency to the point that exceeds the limits, the SPAN to 2MHz and the SWEEP to 0.1sec.
And measure the frequency accurately.
7. Moreover, measure the frequency detected in the above with QP or AV detection, then the SPAN is
200kHz and the SWEEP is 10sec.
Power Supply
EUT
MSA538E/558E
SAVE/LOAD
F6
F2
CALC
F2
LISN *

-68-
● Radiated emission measurement
The electric field strength of disturbance noise that EUT radiates in the air is measured.
1. Set the compensation data of the antenna beforehand.
Refer to " 25.7 Writing original compensation data" for the details.
2. Turn on the power of MSA538E/558E after connection.
3. Set the initial parameters of radiated emission measurement by pushing
. The setting parameters are as follows.
Center Frequency : 515MHz
Frequency span : 1GHz
RBW : 120kHz
VBW : 1MHz
Sweep time : 0.3sec
Detection mode : Positive peak mode
4. Confirm whether the connection and the operation are correct by supplying the power to the EUT and
measuring.
5. Set the number of times of the sweep in the MAX HOLD mode by operating
. For example, it is set to 256 times.
6. Search the frequency of disturbance noise that exceeds the QP limits by using the marker function.
7. Set the center frequency to the point that exceeds the limits, the SPAN to 50MHz and the SWEEP to
30msec. And measure the frequency accurately.
8. Moreover, measure the frequency detected in the above with QP detection, then the SPAN is 1MHz and
the SWEEP is 30sec.
MSA538E/558E
EUT
Antenna
SAVE / LOAD
F6
F3 CALC
F2

-69-
EMI standards (selected)
(As of June 2008)
Frequency Quasi Peak Average
CISPR22 class A
Limits of conducted disturbance at
mains ports
0.15MHz to 0.50MHz
0.50MHz to 30MHz
79dBuV
73dBuV
---
---
CISPR22 class B
Limits of conducted disturbance at
mains ports
0.15MHz to 0.50MHz
0.50MHz to 5MHz
5MHz to 30MHz
66 to 56dBuV
56dBuV
60dBuV
56 to 46dBuV
46dBuV
50dBuV
Decreasing linearly with the logarithm of the
frequency
30MHz to 230MHz
230MHz to 1000MHz
40dBuV/m
47dBuV/m
---
---
Measurement distance 10 m
CISPR22 class A
Limits of radiated disturbance
1000MHz to 3000MHz
3000MHz to 6000MHz
76dBuV/m
80dBuV/m
56dBuV/m
60dBuV/m
Measurement distance 3 m
30MHz to 230MHz
230MHz to 1000MHz
30dBuV/m
37dBuV/m
---
---
Measurement distance 10 m CISPR22 class B
Limits of radiated disturbance
1000MHz to 3000MHz
3000MHz to 6000MHz
70dBuV/m
74dBuV/m
50dBuV/m
54dBuV/m
Measurement distance 3 m
VCCI class A
Limits of conducted disturbance at
mains ports
0.15MHz to 0.50MHz
0.50MHz to 30MHz
79dBuV
73dBuV
66dBuV
60dBuV
VCCI class B
Limits of conducted disturbance at
mains ports
0.15MHz to 0.50MHz
0.50MHz to 5MHz
5MHz to 30MHz
66 to 56dBuV
56dBuV
60dBuV
56 to 46dBuV
46dBuV
50dBuV
Decreasing linearly with the logarithm of the
frequency.
30MHz to 230MHz
230MHz to 1000MHz
40dBuV/m
47dBuV/m
---
---
Measurement distance 10 m
VCCI class A
Limits of radiated disturbance
1000MHz to 3000MHz
3000MHz to 6000MHz
76dBuV/m
80dBuV/m
56dBuV/m
60dBuV/m
Measurement distance 3 m
30MHz ~ 230MHz
230MHz ~ 1000MHz
30dBuV/m
37dBuV/m
---
---
Measurement distance 10 m VCCI class B
Limits of radiated disturbance
1000MHz to 3000MHz
3000MHz to 6000MHz
70dBuV/m
74dBuV/m
50dBuV/m
54dBuV/m
Measurement distance 3 m
FCC part15 subpartB class A
Limits of conducted disturbance at
mains ports
0.15MHz to 0.50MHz
0.50MHz to 30MHz
79dBuV
73dBuV
66dBuV
60dBuV
FCC part15 subpartB class B
Limits of conducted disturbance at
mains ports
0.15MHz to 0.50MHz
0.50MHz to 5MHz
5MHz to 30MHz
66 to 56dBuV
56dBuV
60dBuV
56 to 46dBuV
46dBuV
50dBuV
Decreasing linearly with the logarithm of the
frequency.
FCC part15 subpartB class A
Limits of radiated disturbance
30MHz to 88MHz
88MHz to 216MHz
216MHz to 960MHz
over 960MHz
39.1dBuV/m
43.5dBuV/m
46.4dBuV/m
49.5dBuV/m
---
---
---
---
Measurement distance 10 m
FCC part15 subpartB class B
Limits of radiated disturbance
30MHz to 88MHz
88MHz to 216MHz
216MHz to 960MHz
over 960MHz
40dBuV/m
43.5dBuV/m
46dBuV/m
54dBuV/m
---
---
---
---
Measurement distance 3 m
(Attention) This table is a background information. Micronix is not liable to you for any damages due to the mistake of the content of the description.

-70-
21. Screen Control <DSPL>
When is pushed, the following function menu is displayed.
21.1 Setting of color of screen display
When is pushed, the color of screen display can be selected.
COLOR1 COLOR2 MONO
・COLOR1 : F
or normal use
・COLOR2 : F
or print of screen
・MONO :
Monochrome
21.2 ON/OFF switching of LCD backlight
When is pushed , the LCD backlight is alternately switched to ON or OFF.
21.3 Adjustment of brightness of LCD backlight
Use to set the brightness. It can be set in 100 steps.
COLOR BACK LT
BRIGHT
COLOR1
ON
80
F2
F1 F2
F3
F4
F5
F6
DSPL
F3
F1

-71-
22. Tracking Generator Mode (MSA538TG)
22.1 Specification of T.G. function
Item
Specification
Frequency range 5MHz to 3.3GHz
Output Level
-10dBm±1dB @1GHz(Fixed value)
Output flatness
±1.5dB
Output impedance
50Ω
Output VSWR 2.0 or less
Output connector N(J) connector
22.2 Description of I/O connector
1) Input connector
N (J) connector
Input for an external signal
Make sure that the total power of input signals does not exceed +27dBm.
2) Output connector
N (J) connector
It is an output terminal of Tracking Generator.
※
Please set to "TG:OFF" to prevent the influence of the leak from the Tracking Generator in case of disuse of the
T.G. function.

-72-
22.3 ON/OFF Switching of TG function
When is pushed, the following function menu is displayed.
1. When is pushed, TG. MODE is set.
2. Each time is pushed, TG. output is alternately switched to ON or OFF.
22.4 Normalizing function
NORM ON : The input level is made flat to the red line on the screen.
1. When is pushed, the same function menu as the previous item is displayed.
2. When is pushed, TG. MODE is set.
3. Each time is pushed, the normalizing function is alternately switched to ON or OFF.
If the normalizing function is switched to ON, “NORM ON” is displayed on the screen.
* If the setting is changed as follows, the normalizing function is automatically turned off.
・The span is expanded. ・The center frequency is changed beyond the range normalized.
( When SPAN is changed from FULL SPAN according to center frequency, it is turned off.)
・The magnetic field strength measurement or the frequency counter (factory option) is selected.
・The AUTO tuning is executed. ・The power supply is turned off. ・The presetting is executed.
* When the scale is 2dB or 5dB, the normalizing function does not operate correctly if the spectrum level is not displayed at a
proper position on the screen.
* When this function is used, the marker moves to the position of the minimum value in the peak search. (Firmware version
1.013 or later)
SWEEP
DET T.G.
MANU
AUTO
ALLAUTO
SMPL
MODE
T.G.
NORM
ON ON
SWEEP
F6
F1
F6
F2
SWEEP
F1
F2
F3
F4
F5
F6
F1
F2
F3
F4
F5
F6

-73-
23. Storage and print of screen image <COPY>
The following function menu is displayed when is pushed.
23.1 Selection of image area
When is pushed, the image area to be stored or printed can be selected.
WHOLE : the whole screen image is stored or printed.
SPECT : only the spectrum display area is stored or printed.
23.2 Print on printer
When pushing after connecting the printer (option), the area selected in 23.1 is printed.
23.3 Storage into USB memory
When pushing after connecting USB memory (user’s) to this unit, the area selected in 23.1 is
stored in USB memory by BMP (bit map) format. As for the file name, the number is automatically put
such as “MSA001.bmp”. In case that some characters is written in the label area, the file name cosists of
it and the number put automatically such as “LABEL001.bmp”. The folder “MSAIMG” is automatically
generated and these files are recorded there.
As for setting such as color or monochrome display, refer to “21.Screen control”.
23.4 Transferring internal data to USB memory in a lump sum
When pushing after connecting USB memory (user’s) to this unit, the data stored in the
internal memory with SAVE/LOAD function are transferred to USB memory in a lump sum. The folder
“MSASVLDI” is automatically generated and these files are recorded there.
AREA
PRINT
Bmp→USB
MEM→USB
WHOLE
EXECT
COPY
EXECT
COPY
F1 F2 F3
F4
F5 F6
F1
F3
F2
F5

-74-
23.5 USB printer (option)
The MSA500 series enables a hard copy of the screen by connecting USB printer (option) to USB A plug
with USB cable MI400 (option).
* Turn on the power of the MSA500 series unit first. After that, turn on the power of USB printer.
Otherwise, it doesn’t work normally.
23.6 USB memory
USB memory can be used as a removable storage.
※ If the USB memory is installed again after it is installed once and then removed, the
MSA500 series cannot normally recognize it. In that case refer to the following operation.
Method of recognition:
By the operation of , the USB memory is recognized.
Printer
USB A plug
USB B plug
MI400
SAVE/LOAD
F5

-75-
24. Utility Function <UTIL>
When is pushed, the following function menu is displayed.
● The subsidiary function is selected.
Label function : The specified characters are written in the label display area
(MAX 16 characters).
Menu off : The display of function menu and active area is erased.
Buzzer setting : The condition on which a buzzer is sounded is set.
Clock function setting : The built-in clock is set.
System information : Firmware version, DSP version, serial number and internal
temperature are displayed.
24.1 Label function
When is pushed, the following function menu is displayed.
1. The kind of character to be written is selected with to .
012 : 0 to 9 (numeral)
abc : a to z (small letter alphabet)
ABC : A to Z (capital letter alphabet)
@%* : ! ” # % &’( ) + - . / : ; <=>? @ [ ¥ ] ^_ (mark)
LABEL
MENU
BUZZER
CLOCK
SYSTEM
OFF
ALWAYS
CONFIG
INFO
012 abc ABC
@%*
BACK SP
ENTER
<- ->
UTIL
F1
F2
F3
F4
F5
F6
F1
F1
F2
F3
F4
UTIL
F1
F2
F3
F4
F5
F6
F1
F1
F4
F2
F3
F4
F5

-76-
2. One character in the label display area becomes reverse display.
By rotating , one reversed character is replaced with a numeral, a small letter alphabet, a capital
letter alphabet or a mark.
3. When is pushed, the reversed part moves right by one character. And the previous character is decided.
4. When is pushed, the reversed part moves left by one character. The previous part becomes a
space.
And the character can be deleted one after another by consecutively pushing this key.
5. The position where the character is input can be decided by moving the reversed part right and left with
and .
And after then, if either of keys from to is pushed, the character can be input in
the reversed part.
24.2 Menu off
By pushing , the display of the function menu and the active area can be erased temporarily.
After then, they are displayed as usual the moment any other keys excepting to
are pushed.
24.3 Buzzer setting
By pushing , the condition of the buzzer sound at the operation of the key and the rotary
encoder can be set.
whenever this key is pushed, the following three conditions are displayed one by one, and one of those
can be selected.
OFF : The buzzer is not sounded.
ALARM : The buzzer is sounded in an incorrect setting for a warning and is not sounded in a
correct setting.
ALWAYS : The buzzer is sounded whenever a key or the rotary encoder is operated.
※ When the battery voltage becomes low at the battery operation, the buzzer is sounded.
(Even if OFF is selected, it is sounded.)
F2
F3
F6
F5
F5
F6
F1 F4
F1
F6

-77-
24.4 Setting of clock
When is pushed, the following function menu is displayed.
The year, month, day and time are displayed below the screen. (Refer to “4. Explanation of screen”)
Set the year, month, day and time when MSA500 series is used for the first time.
The time information is updated even if the power is turned off after then.
1. By rotating , the value of the menu which is selected by the key from to
changes and is displayed by the numeral or / in the lower of each menu.
2. The year is input. Two last digits at the Christian era are displayed. It is possible to set them
within the range from 00 to 99.
The month is input.
The day is input.
The hour is input. It is displayed by twenty-four hour notation.
The minute is input.
3. By pushing , the values which are input in item 2. are decided. The values are not updated if
this key is not pushed.
※
The clock function of MSA500 series is driven with a dedicated LSI, and the power is supplied by
a built-in lithium battery.
YEAR
MONTH
DATE
HOUR
MIN
ENTER
08
1
30
23
50
UTIL
F1 F2 F3
F4
F5
F6
F4
F4
F1
F6
F1
F2
F3 F4
F5

-78-
25. USB device Function
25.1 Outline
The MSA500 series is equipped with two kinds of USB connecters of A and B plugs. The A plug is for USB
host and is connected to USB devices such as USB memory and printer. On the other hand, the B plug is for
USB device and is connected to USB host such as a personal computer. The device function is explained in this
chapter.
As for the host function using USB A plug, refer to “23. Storage and printer of screen image”.
25.2 How to connect
When you use USB interface, connect with USB cable MI400 (option) as follows.
25.3 Installation of driver
The specified driver is necessary in order to control the MSA500 series with a PC through USB interface, and
should be installed in the PC to be used in advance.
As for the installation of the driver, first of all, the USB driver is downloaded. Download it from
“DOWNLOAD” site in our website.
Download the file for USB driver on the following download site.
http://www.micronix-jp.com/Products/download/download.html
Next, unzip the Zip file.
After the downloaded file is unzipped, the MSA500 series is connected to a PC with the USB cable and then the
power is turned on. The detection wizard for the USB driver starts on the PC screen the moment the power of
the MSA500 series is turned on, and install it following this wizard.
MI400
USB A plug
USB B plug

-79-
25.4 Explanation of Command
* “CR(0D[HEX])+LF(0A[HEX])” is added to the end of every command. When the command is sent from
PC, MSA538 (E/TG) and MSA558(E) return some responses, which include “OK” + CR + LF, “ERR” +
CR + LF and “(response to command)” + CR + LF.
* By inputting “?” instead of “**” for each command, the current setting parameters are responded.
(Except for “ ---- Request” command and the command for inputting corrected data.)
1) Setting of center frequency
Command : FREQ*******
(*******: Refer to “25.5 Input of frequency”)
2) Request of set marker
Command : FREQSETMKR
* The center frequency is set according to the frequency of current marker position.
3) Setting of frequency span
Command : SPAN****
Real time mode :(****=
20K, 50K, 100K, 200K, 500K, 1M, 2M, 5M, 10M, 20M [unit : Hz])
Sweep mode
MSA538(E/TG) :
(****=
ZERO, 100K, 200K, 500K, 1M, 2M, 5M, 10M, 20M, 50M, 100M, 200M, 500M, 1G, 2G, FULL [unit : Hz])
MSA558(E) :
(****=Z ERO, 100K, 200K, 500K, 1M, 2M, 5 M, 10 M, 20 M, 50M, 100M , 200M, 500M, 1 G, 2G, 5 G, FULL[ u nit : Hz] )
4) Setting of reference level
Command : REF***
(***=-60 to 10[1 step, unit : dBm])
5) Setting of unit of reference level
Command : UNIT***
(***=DBM, DBUV, DBMV, DBV)
6) Setting of RBW
Command : RBW****
MSA538/538TG/558 :
(****=300, 1K, 3K, 10K, 30K, 100K, 300K, 1M, 3M, AUTO, ALL [unit : Hz])
MSA538E/558E :
(****=300, 1K, 3K, 10K, 30K, 100K, 300K, 1M, 3M, 9KE, 120KE, 1ME, AUTO, ALL[unit : Hz])
* ALL : The optimum RBW, VBW and sweep time are set based on the frequency span.
* AUTO : The optimum RBW is set based on the frequency span.
7) Setting of VBW
Command : VBW****
(****=100, 300, 1K, 3K, 10K, 30K, 100K, 300K, 1M, 3M, AUTO, ALL [unit : Hz])
* ALL : The optimum RBW, VBW and sweep time are set based on the frequency span.
* AUTO : The optimum VBW is set based on the frequency span.
Command
Unit
DBM dBm
DBUV dBμV
DBMV dBmV
DBV dBV
* When the unit is other than dBm, convert into
dBm by using calculating formula in “
10.7
Reference level setting range for each unit”.

-80-
8) Start and Stop of measuring function
Command : MEAS***
(****=CP, ACP, OBW, EF, MF, OFF)
9) Request of measuring result
Command : MEASRES
* Example of measuring result
Channel power measurement ----- POW:- 25.5dBm
Adjacent channel power measurement ----- L:- 47.7dBc U:- 48.3dBc
Occupied bandwidth measurement ----- C:1.45G W:20.00k
Frequency counter ----- FC:2400.0000M
* If the frequency counter is not installed, “MEAS OFF” is responded.
* If the level of spectrum is low and unmeasurable, “Non Signal” is responded.
10) Setting of mode for channel power measurement
Command : CPMODE*****
(*****=TOTAL, BAND)
11) Setting of zone center frequency for channel power measurement
Command : CPCNTR*******
(***=0~500:Screen position, center=250)
12) Setting of zone width for channel power measurement
Command : CPWIDTH*******
(***=0~500:Screen position, center=250)
13) Setting of target for channel power measurement
Command : CPPOWER***
(***=SUM, AVG)
14) Setting of mode for adjacent channel power measurement
Command : ACPMODE*****
(*****=TOTAL, BAND, PEAK)
15) Setting of band offset for adjacent channel power measurement
Command : ACPOFS*******
(***=0~500:Screen position, center=250)
16) Setting of bandwidth for adjacent channel power measurement
Command : ACPCHBW*******
(***=0~500:Screen position, center=250)
17) Setting of reference band center frequency for adjacent channel power measurement
Command : ACPREF*******
(***=0~500:Screen position, center=250)
Command
Measuring function
CP Channel power measurement
ACP Adjacent channel power measurement
OBW Occupied bandwidth measurement
EF Electric field strength measurement
MF Magnetic field strength measurement
OFF OFF
Command
Mode
TOTAL The sum of power on the screen is measured.
BAND
The sum of power in the band specified
is measured.
Command
Mode
TOTAL TOTAL (total power method)
BAND BAND (in-band method)
PEAK PEAK (reference level method)

-81-
18) Setting of reference bandwidth for adjacent channel power measurement
Command : ACPREFBW*******
(***=0~500:Screen position, center=250)
19) Setting of mode for occupied bandwidth measurement
Command : OBWMODE**
(**: N%/DB)
20) Setting of N% RATIO for occupied bandwidth measurement
Command : OBWRATIO***
(***: 80.0 to 99.9 [ 0.1 step , unit : %] )
21) Setting of XdB DOWN for occupied bandwidth measurement
Command : OBWDB***
(***: 0.1 to 80.0 [ 0.1 step , unit : dB] )
22) Setting of antenna for electric field strength measurement
Command : EFANT****
(****: M401 / M402 / M403 / M404
/ M405 / M406 /M407 / USER)
23) Transfer of user-compensation data for electric field strength measurement
Command : EFUSER*****
(Refer to “25.7 Writing of original compensation data” for the details.)
24) Setting of probe for magnetic field strength measurement
Command : MFPROBE****
(****: CP2S / USER)
25) Transfer of user-compensation data for magnetic field strength measurement
Command : MFUSER*****
(Refer to “25.7 Writing of original compensation data” for the details.)
26) Start and Stop of calculation function
Command : CALC***
(***: OFF / MAX / MIN / AVE / OVR)
Command
Mode
N% N% POWER mode
DB XdB DOWN mode
Command
Probe
CP2S Setting data for CP‐2S
USER Setting data for user’s original probe
Command
Calculation
OFF OFF
MAX MAX HOLD
MIN MIN HOLD
AVR AVERAGE
OVR OVER WRITE
Command
Antenna
M401 Setting data for M401
M402 Setting data for M402
M403 Setting data for M403
M404 Setting data for M404
M405 Setting data for M405
M406 Setting data for M406
M407 Setting data for M407
USER Setting data for user’s original antenna

-82-
27) Setting of number of times of sweep for MAX HOLD
Command : MAXNO****
(****: 2 / 4 / 8 / 16 / 32 / 64 / 128 / 256 / 512 / 1024 / 0) * 0 = unlimited
28) Setting of number of times of sweep for MIN HOLD
Command : MINNO****
(****: 2 / 4 / 8 / 16 / 32 / 64 / 128 / 256 / 512 / 1024 / 0) * 0 = unlimited
29) Setting of number of times of sweep for AVERAGE
Command : AVENO****
(****: 2 / 4 / 8 / 16 / 32 / 64 / 128 / 256 / 512 / 1024)
30) Setting of number of times of sweep for OVERWRITE
Command : OVWNO****
(****: 2 / 4 / 8 / 16 / 32 / 64 / 128 / 256 / 512 / 1024 / 0) * 0 = unlimited
31) Setting of display scale
Command : SCALE**
(**: 2 / 5 / 10 )
32) Setting of sweep time
Command : SWEEP****
(****: 10M / 30M / 0.1S / 0.3S / 1S / 3S / 10S / 30S / AUTO / ALL)
33) Setting of detection mode
Command : DET***
(***: POS / NEG / SMP )
34) Setting of trigger source
Command : TRG**
(**: INT / EXT)
35) Request of AUTOTUNE
Command : AUTO * The response is returned after tuning.
36) Request of action
Command : HOLD / RUN
Command
Sweep time
10M
10ms
30M
30ms
0.1S
0.1s
0.3S
0.3s
1S
1s
Command
Sweep time
3S
3s
10S
10s
30S
30s
AUTO
AUTO
ALL
ALL AUTO
Command
Detection mode
POS
Positive peak mode
NEG
Negative peak mode
SMP
Sample mode
QP
QP mode (only for MSA538E/558E)
AVG
AVG mode (only for MSA538E/558E)
Command
Trigger source
INT
Internal
EXT
External
Command
Display scale
2
2dB/div
5
5dB/div
10
10dB/div

-83-
37) Request of active marker position
Command : MKRRES
38) Setting of marker mode
Command : MKR*****
(*****: NORM / DELTA/DUAL/OFF)
39) Setting of active marker frequency (spectrum)
The position of active marker is set by frequency.
Command : NORMMKR*******
(*******: Refer to “25.5 Input of frequency”)
40) Setting of marker position by number of points on horizontal axis
The position of active marker is set by number of points on horizontal axis.
Command : MKRPOSI***
(***: 0 to 500 (Q vs. I : 0 to 102400) 0 = far left, 500/102400 = far right)
41) Setting of active marker
Command : MKRSEL*****
(*****: REF / DELTA / M1 / M2 / I / Q)
42) Setting
of peak search mode
Command : PEAK****
(*****: NORM / ZONE)
43) Request of peak search
Command : PKSEARCH**
(**: 01 / 02 / 03 / 04 / 05 / 06 / 07 / 08 / 09 / 10 / 11)
44) Setting of zone center frequency for peak search
Command : PKCNTR*******
(*******: Refer to “25.5 Input of frequency”)
45) Setting of zone width for peak search
Command : PKWIDTH*******
(*******: Refer to “25.5 Input of frequency”)
46) Setting of unit of marker
Command : CONV***
(***: DBM / W / DBV / V / DBUVM / VM)
47) Request of print on printer
Command : PRT*
(*=S/W)
USB printer connected to USB A plug prints.
Command Marker mode
NORM Normal marker
DELTA Delta marker
DUAL Dual marker
OFF OFF
Command Peak search mode
NORM Normal peak search
ZONE Zone peak search
Command Unit of marker
DBM dBm
W W
DBV dBV
V V
DBUVM dBμV/m
VM V/m
Command Destination of marker
01 The maximum peak on the screen
02 The 2nd peak on the screen
・・・ ・・・
11 The 11th peak on the screen

-84-
48) Request for transfer of spectrum
Command : SRS****
(****: CURR / 000 to 199)
* The number of the command is given to the saved file.
* Refer to “25.6 Transfer of spectrum data” for the returned data.
49) Request for transfer of spectrum in USB memory
Command : SRSU****
(****: 000 to 199)
* The number of the command is given to the saved file.
* Refer to “25.6 Transfer of spectrum data” for the returned data.
50) Request for transfer of spectrum data of 1001 points
Command : SRSF * Refer to “25.6 Transfer of spectrum data” for the returned data.
51) Request of preset
Command : PRESET
52) Setting of remote control
Command : REMOTE***
(***: ON / OFF)
* When the remote control is ON, “REMOTE” is displayed in the operating information area on the screen.
( Refer to “4. Explanation of screen” for the details.)
53) Single sweep
Command : CAPT * It sweeps only once and will be in a HOLD state.
54) Setting of offset level
Command : OFFSET*****
(*****: -50.0 to 50.0 [0.1 step, unit: dB] )
55) Setting input impedance
Command : IMP**
(**: 50 / 75)
* When the input impedance is selected, the offset level is set as described above.
* When “75” is selected, attach the adapter MA308 (option) to the input connector.
56) Clearing of spectrum data and parameter
Command : MCLR***
(***:ALL / 000 to 199 )
Only an internal memory is effective.
Command Remote control
ON
Operation by function key and encoder cannot be done.
Control the unit with USB commands.
OFF
Operation by function key and encoder can be done.
USB commands are available
Command
Offset level
50 Offset level is set to 0dB.
75 Offset level is set to 5.7dB.
Command
Cleared data
ALL All of data
000 Data of 000
・・・ ・・・
199 Data of 199
Command
Transferred spectrum
CURR Current spectrum
000 Spectrum data of 000
・・・ ・・・
199 Spectrum data of 199
Command
Transferred spectrum
000 Spectrum data of 000 in USB memory
・・・ ・・・
999 Spectrum data of 999 in USB memory

-85-
57) Setting of character for label
Command : LBL***
(***: The number of characters is 16 or less)
58) Setting of clock
Command : CLC***
(***: aabbccdd ; aa: two last digits of year, bb: month (01 to 12), cc: hour (00 to 23), dd: minute (00 to 59)
59) Setting of tracking generator
Command : TG**
(***: ON / OFF)
60) Setting of normalizing function
Command : NORM***
(***: ON / OFF)
61) Toggle HOLD/RUN
Command : HOLDRUN
62) Setting of SAVE/LOAD device
Command : DEV***
(***:MEM/USB)
63) Setting of SPRIOUS FREE mode
Command : SPR***
(***: ON / OFF)
64) Setting of unit in noise measurement
Command : NHUNIT****
(****: DBM / DBUV / DBMV / DBV)
65) Setting of bandwidth in noise measurement
Command : NHBW****
(****: 1 / 3 / 10 / 30 / 100 / 300 / 1K / 3K / 10K / 30K /100K /300K /1M /3M)
66) Request of ATT value
Command : ATT
67) Request of temperature
Command : TEMP
68) Request of firmware version number
Command : VER
69) Request of signal analyzer type
Command : TYPE
70) Setting of SWEEP MODE or REAL TIME MODE
Command : SPA_MODE_***
(***: SWP / RT)

-86-
71) Setting of trigger source in REAL TIME MODE
Command : RT_TRG_SRC_***
(***: FREERUN / IF / POW / EXT)
72) Setting of trigger slope in REAL TIME MODE
Command : RT_TRG_SLOPE_*
(*: P / M) * P : plus, M : minus
73) Setting of trigger position in REAL TIME MODE
Command : RT_TRG_POSIT_***
(***: 0 / 25 / 50 / 75 / 100 [25 step, unit: %] )
74) Setting of IF trigger level in REAL TIME MODE
Command : RT_TRG_IF_***
(***: 1 to 100 [1 step, unit: %] )
75) Setting of power trigger level in REAL TIME MODE
Command : RT_TRG_POW_***
(***: -40 to 0 [1 step, unit: dB] )
76) Setting of trigger channel in REAL TIME MODE
Command : RT_TRG_CH_***
(***: ALL / 1 / 2 / 3 / 4 / 5)
77) Setting of Single scan or Continuous scan by trigger in REAL TIME MODE
Command : RT_TRG_SCAN_*****
(*****: SINGLE / CONT)
78) Request of analyzed frame IQ data sending in REAL TIME MODE
Command : RIQ_ANL
79) Request of acquisition frame IQ data sending in REAL TIME MODE
Command : RIQ_ACQ
80) Setting of MAIN-MEASUREMENT mode in REAL TIME MODE
Command : ANL_MAIN_***
(***: SPEC / SPGM / OVR / PWT / FQT / PHT / IQT / QVI)
Command
Mode
SPEC
SPECTRUM measurement
SPGM
SPECTROGRAM measurement
OVR
OverWrite measurement
PWT
Power vs. Time in Time Domain MESUREMENT
FQT
Frequency vs. Time in Time Domain MESUREMENT
PHT
Phase vs. Time in Time Domain MESUREMENT
IQT
IQ vs. Time in Time Domain MESUREMENT
QVI
Q vs. I in Time Domain MESUREMENT

-87-
81) Setting of SUB-MEASUREMENT mode in REAL TIME MODE
Command : ANL_SUB_***
(***: SPGM / PWT)
Command
Mode
SPGM
SPECTROGRAM measurement
PWT
Power vs. Time in Time Domain MESUREMENT
82) Setting of number of analysis frames in REAL TIME MODE
Command : ACQ_FRM_***
(***: 1 to 16383 [1 step, unit: frame] )
83) Setting of analysis start frame in REAL TIME MODE
Command : STT_FRM_***
(***: 1 to 16383 [1 step, unit: frame] )
84) Setting of analyzed frame number in REAL TIME MODE
Command : ANL_FRM_***
Q vs. I mode (***: 1 to 100 [1 step, unit: frame] )
Except for Q vs. I mode (***: 1 to 500 [1 step, unit: frame] )
85) Setting of OVERWRITE stored frame number in REAL TIME MODE
Command : OVR_FRM_****
(****: 200 / 500 / 1000 / 2000 / 5000 / 0) * 0 : infinite
86) IQ data SAVE of analyzed frame into USB memory
Command : SAVEIQ_AN
87) IQ data SAVE of acquisition frame into USB memory
Command : SAVEIQ_AQ
88) IQ data LOAD from USB memory to analyzed frame
Command : LOADIQ_AN
89) Status request of whether the save complete of the IQ data
Command : RT_STORE
* “0 : Completion”, “1 : During Save” for the returned data.
25.5 Input of frequency
The frequency is input as follows.
*******: 0.0k to 999.9k (0.1 step, unit: Hz)
: 0.0000M to 999.9999M (0.0001 step, unit: Hz)
: 0.0000000G to 3.3G (0.0000001 step, unit: Hz) ---- MSA538 (E/TG)
: 0.0000000G to 8.5G (0.0000001 step, unit: Hz) ---- MSA558(E)
* The offset frequency and the zone width can be input only in the range decided by the center frequency and frequency
span. If the value out of the range is input, an error occurs.
* The offset frequency and the zone width change when the frequency span is changed.

-88-
25.6 Transfer of spectrum data
The spectrum data is output as a numeric string divided by “, (comma)”. [
**.**, **.**, ……, **.**]
The unit is dBm, and it is available to two places of decimals.
●Description
String Explanation Example
SPECT
The data which follows the string "SPECT" is the spectrum data.
SPECT
**,**,・・・
It is the spectrum data. This string consists of all data points separated
by a comma “,” after each data value, and the string can have a total
of ten data points per line. For example, transferring spectrum data of
1001 points require a total of 101 lines
-102.01,-102.03,・・・,
・・・,
-110.12,
25.7 Writing of original compensation data
When antennas or probes other than the option is used in electric field strength measurement or magnetic
field strength measurement, it is necessary to write each original compensation data into the unit.
Please write the data into the unit according to the following description.
There are two methods for writing, the method of using PC software MAS500 (option) and the method of
using original program which is prepared by user.
1) Preparation items
* USB cable MI400
* Windows PC (with USB interface) [The writing cannot be done with MSA500 series unit only.]
* PC software MAS500 (in case of “3) Method of using PC software MAS500 for writing”)
2) Example of writing data
As an example, the compensation data (antenna gain) of antenna M405 and the compensation data
(compensation coefficient) of magnetic field probe CP-2S are shown below.
* Compensation data (antenna gain) of antenna M405
Frequency 300MHz 350MHz 400MHz 450MHz 500MHz
Antenna gain 0.0dBi 1.0dBi 1.4dBi 1.4dBi 0.0dBi
* Compensation data (compensation coefficient) of magnetic field probe CP-2S
Frequency 10MHz 100MHz 1GHz 2GHz 3GHz
Compensation coefficient
86.7dB 69.2dB 50.7dB 44.9dB 40.1dB
* The data of ten points or less can be written. The data cannot be written in 0Hz.

-89-
3) Method of using PC software MAS500 for writing
1. Create the text file of compensation data.
Create a new text file by new creation of a personal computer, and open by the text editor.
Write the frequency and compensation data in the following format.
* Format
“frequency”: ”compensation data”, “frequency”: “compensation data”, ・・・
Example of M405
300M:0.0DBI,350M:1.0DBI,400M:1.4DBI,450M:1.4DBI,500M:0.0DBI
* Write the unit with a capital letter. G(GHz) is also available.
2. Write the text file into the unit with PC software MAS500.
Connect the PC to MSA500 series with USB cable MI400, and turn on the power of MSA500 series.
From the upper menu of PC software MAS500,
select [File] → [Write E/F User Data] in case of electric field strength measurement, or
select [File] → [Write M/F User Data] in case of magnetic field strength measurement.
When the text file created beforehand is selected, the data is written.
* Install the specified USB driver in the personal computer to be used in advance.
(Refer to “25.3 Installation of driver”)
4) Method of using original program for writing
1. Prepare the USB communication software.
Connect the PC to MSA500 series with USB cable MI400, and turn on the power of MSA500 series.
2. Write the data into the unit.
Transfer the data in the following format with the USB communication software.
* Format
In case of electric field strength measurement;
EFUSER “frequency”: ”compensation data”, “frequency”: “compensation data”, ・・・
In case of magnetic field strength measurement;
MFUSER “frequency”: ”compensation data”, “frequency”: “compensation data”, ・・・
Example of CP-2S
MFUSER10M:86.7DB,100M:69.2DB,1G:50.7DB,2G:44.9DB,3G:40.1DB
* Write the unit with a capital letter.
3. When the writing ends correctly, “OK” is returned.

-90-
5) How to use
Set the measuring function of MSA500 series to electric field strength measurement mode or magnetic field strength
measurement mode.
By pushing [MEAS] → [EFS ANT], electric field strength measurement mode is set.
By pushing [MEAS] → [MFS PROBE], magnetic field strength measurement mode is set.
Select “USER” from antennas or probes on the display by pushing [F1].
Then, the measurement by the written data is started.
* The written data remains even if it turns off power.
* The measuring mode returns to a usual measurement when turning off power.
6) About antenna gain
In this contents, the antenna gain means an absolute gain.
When the antenna gain is a relative gain, it can change into an absolute gain by adding +2.15dB.
Absolute gain [dBi] = Relative gain [dBd] + 2.15dB
As reference, the conversion formula to electric field strength is using the following.
E=√(480π2 × Pa ÷ (Ga × λ2))
E: Electric field strength [V/m] Pa: Received electric power [W]
Ga: Antenna gain [times] = 10
(antenna gain [dBi] ÷ 10)
λ: Wavelength [m] = (3 × 10⁸) ÷ frequency [Hz]

-91-
26. Option
■ PC software MAS500
MAS500 is software that controls the signal analyzers of five models by the PC and displays the spectrum
waveform on PC screen.
The screen image is stored by BMP format and the spectrum waveform is stored by CSV format.
Furthermore, the IQ data in real time mode can be transferred to PC at a rate of 19ms/frame.
■ Logging software MAS510
MAS510 is a logging software that collects the measurement data by uninhabited. It is optimum for watching
an abnormal signal at night and recording the data by uninhabited for a long time.
・Logging at specified frequency band, sampling interval and measurement time.
・Makes it possible to fast-forward and fast-rewind the images in the file like a video recorder, and moreover,
to jump to the image with spectrum exceeding the limit line.
・ERROR is automatically displayed when the signal exceeding the limit line is input.
■ VSWR bridge MVS300B
■ Dipole antenna M401 to M407
Connector : N(P)
Refer to “19.4 Electric field strength measurement” for the details.
■ Magnetic field probe CP-2S
Refer to “19.5 Magnetic field strength measurement” for the details.
Frequency range : 5 to 3000MHz
Directivity : more than 40dB @ 50 to 3000MHz
more than 25dB @ 5 to 50MHz
Insertion loss : Less than 7dB @ SOURCE to DUT
Less than 8dB @ DUT to REFLECTED
Dimensions : 50(W)×32(H)×113(D)mm
Weight : Approx. 240g
Connectors : SMA(J) (for three ports)
Frequency range
:
10MHz to 3GHz
Space resolution
:
approx.0.25mm (depending on objects)
Dimensions
:
outside 12φ×135mm
probe tip 2mm(W)×1mm(T)
Connectors
:
SMA(P)
Specification
Specification

-92-
■ USB printer
With AC adaptor and one roll paper
Refer to “23. Storage and print of screen image” for the details.
■ Roll printer (10 rolls)
For USB printer
■ Lithium-ion battery MB400
7.4V/5000mAh Refer to “6.4 Installation of battery” for the details.
■ USB cable MI400
Connector : A plug/ B plug Length : 1m
■ Coaxial attenuator MG-XXdB
Attenuation error
Model
DC to 12.4GHz 12.4GHz to 18GHz
VSWR
Rated power
MG-1dB, 2dB, 3dB, 4dB <±0.5dB <±1dB
MG-5dB, 6dB, 7dB, 8dB <±0.7dB <±1.2dB
MG-9dB, 10dB, 12dB, 13dB <±1.0dB <±1.25dB
MG-14dB, 15dB, 20dB <±1.2dB <±1.3dB
<1.15@DC to 4GHz
<1.2@4 to 12.4GHz
<1.3@12.4 to 18GHz
MG-30dB <±1.2dB@DC to 8GHz <1.2@DC to 8GHz
1W
※ Connector, impedance : SMA(P)/SMA(J), 50Ω
■ Terminator
VSWR
Model Freq. range
DC to 4GHz 4 to 8GHz 8 to 12.4GHz 12.4 to 18GHz
Rated
power
Connector
MG-50S DC to 18GHz
<1.08 <1.10 <1.15 <1.20 0.25W SMA(P)
MG-50N DC to 8GHz <1.2@DC to 8GHz 2W N(P)
※ Impedance : 50Ω
Printing method : Thermal line dot method
Paper : 80mm width thermal paper
Power source : internal : AA-sized alkaline battery (4 pcs)
external : 7.5VDC/3A (dedicated AC adapter)
Dimensions : 134(W)×60(H)×180(D)mm
Weight : approx.450g (mainframe only)
Interface : USB 2.0
Specification

-93-
■ Coaxial cable
Model Connector Length Freq. range
MC102 SMA(P)/BNC(P) 1.5m DC to 2GHz
MC201 SMA(P)/SMA(P) 0.5m DC to 18.5GHz
MC202 SMA(P)/SMA(P) 3m DC to 18.5GHz
MC203 SMA(P)/SMA(P) 4m DC to 18.5GHz
MC204 SMA(P)/SMA(P) 1.5m DC to 12.4GHz
MC301 SMA(P)/SMA(P) 0.5m DC to 10GHz
MC302 SMA(P)/SMA(P) 1m DC to 10GHz
MC303 SMA(P)/SMA(P) 1.5m DC to 10GHz
MC304
SMA(P)/N(J) 0.2m DC to 4GHz
MC305
SMA(P)/N(P) 0.2m DC to 4GHz
MC306 SMA(P)/BNC(J) 0.2m DC to 2GHz
MC307 SMA(P)/BNC(P) 0.2m DC to 2GHz
MC308
N(P)/N(P) 0.5m DC to 10GHz
MC309
N(P)/N(P) 1m DC to 10GHz
MC310
N(P)/N(P) 1.5m DC to 10GHz
MC311
N(P)/SMA(J) 0.2m DC to 10GHz
MC312
N(P)/BNC(J) 0.2m DC to 2GHz
MC313
N(P)/BNC(P) 0.2m DC to 2GHz
MC314 BNC(P)/BNC(P) 1.5m DC to 2GHz
※ Impedance : 50Ω
■ Adapter
Model Connector Impedance Freq. range
MA301 BNC(P)/BNC(J) 50Ω/75Ω DC to 2GHz
MA302
BNC(P)/N(J) 75Ω/75Ω DC to 1.8GHz
MA303
BNC(P)/N(P) 75Ω/75Ω DC to 1.8GHz
MA304
BNC(P)/F(J) 75Ω/75Ω DC to 1.8GHz
MA305
BNC(P)/F(P) 75Ω/75Ω DC to 1.8GHz
MA306
N(P)/SMA(J) 50Ω/50Ω DC to 12.4GHz
MA307
N(P)/BNC(J) 50Ω/50Ω DC to 2GHz
MA308
N(P)/BNC(J) 50Ω/75Ω DC to 2GHz
MA309
N(J)/BNC(P) 50Ω/50Ω DC to 2GHz
 Loading...