

Page 1

Installation and Configuration Manual
P/N MMI-20015439, Rev. AA
July 2009
Micro Motion® 7829
Visconic Viscosity Meter
Short and Long Stem Versions
Page 2

©2009, Micro Motion, Inc. All rights reserved. Viscomaster is a registered trademark, and Viscomaster Dynamic is a trademark of
one of the companies of Emerson Electric Co. Micro Motion is a registered trade name of Micro Motion, Inc., Boulder, Colorado.
The Micro Motion and Emerson logos are trademarks and service marks of Emerson Electric Co. All other trademarks are property
of their respective owners.
Micro Motion pursues a policy of continuous development and product improvement. The specification in this document may
therefore be changed without notice. To the best of our knowledge, the information contained in this document is accurate and
Micro Motion cannot be held responsible for any errors, omissions, or other misinformation contained herein. No part of this
document may be photocopied or reproduced without prior written consent of Micro Motion.
Page 3

Contents
Chapter 1 Introduction. . . . . . . . . . . . . . . . . . . . . . . . . . . . . . . . . . . . . . . . . 1
1.1 Safety guidelines . . . . . . . . . . . . . . . . . . . . . . . . . . . . . . . . . . . . . . . . . . . . . . . . . . . . . 1
1.2 About the meter. . . . . . . . . . . . . . . . . . . . . . . . . . . . . . . . . . . . . . . . . . . . . . . . . . . . . . 2
1.2.1 What is it? . . . . . . . . . . . . . . . . . . . . . . . . . . . . . . . . . . . . . . . . . . . . . . . . . 2
1.2.2 7829 meter measurements . . . . . . . . . . . . . . . . . . . . . . . . . . . . . . . . . . . . 3
1.2.3 What is it used for? . . . . . . . . . . . . . . . . . . . . . . . . . . . . . . . . . . . . . . . . . . 3
1.2.4 Principle of operation . . . . . . . . . . . . . . . . . . . . . . . . . . . . . . . . . . . . . . . . . 3
Chapter 2 Installation (Short Stem) . . . . . . . . . . . . . . . . . . . . . . . . . . . . . . . . 5
2.1 Introduction . . . . . . . . . . . . . . . . . . . . . . . . . . . . . . . . . . . . . . . . . . . . . . . . . . . . . . . . . 5
2.2 Boundary effects . . . . . . . . . . . . . . . . . . . . . . . . . . . . . . . . . . . . . . . . . . . . . . . . . . . . . 6
2.3 Standard installations . . . . . . . . . . . . . . . . . . . . . . . . . . . . . . . . . . . . . . . . . . . . . . . . . 8
2.3.1 Overview . . . . . . . . . . . . . . . . . . . . . . . . . . . . . . . . . . . . . . . . . . . . . . . . . . 8
2.3.2 Meter orientation . . . . . . . . . . . . . . . . . . . . . . . . . . . . . . . . . . . . . . . . . . . . 9
2.3.3 Free stream installation - flanged fitting . . . . . . . . . . . . . . . . . . . . . . . . . . 10
2.3.4 Free stream installation - weldolet . . . . . . . . . . . . . . . . . . . . . . . . . . . . . . 11
2.3.5 T-piece installation . . . . . . . . . . . . . . . . . . . . . . . . . . . . . . . . . . . . . . . . . . 12
2.3.6 Flow-through chamber installation . . . . . . . . . . . . . . . . . . . . . . . . . . . . . . 13
2.4 Installation in the pipeline or system . . . . . . . . . . . . . . . . . . . . . . . . . . . . . . . . . . . . . 14
2.5 Typical installations . . . . . . . . . . . . . . . . . . . . . . . . . . . . . . . . . . . . . . . . . . . . . . . . . . 17
2.5.1 Jacketed pipeline . . . . . . . . . . . . . . . . . . . . . . . . . . . . . . . . . . . . . . . . . . . 17
2.5.2 Flow-through chamber . . . . . . . . . . . . . . . . . . . . . . . . . . . . . . . . . . . . . . . 19
Chapter 3 Installation (Long Stem) . . . . . . . . . . . . . . . . . . . . . . . . . . . . . . . 21
3.1 Introduction . . . . . . . . . . . . . . . . . . . . . . . . . . . . . . . . . . . . . . . . . . . . . . . . . . . . . . . . 21
3.2 Installation considerations . . . . . . . . . . . . . . . . . . . . . . . . . . . . . . . . . . . . . . . . . . . . . 22
3.2.1 Fluid at the sensor . . . . . . . . . . . . . . . . . . . . . . . . . . . . . . . . . . . . . . . . . . 22
3.2.2 Flow rate . . . . . . . . . . . . . . . . . . . . . . . . . . . . . . . . . . . . . . . . . . . . . . . . . 22
3.2.3 Entrained gas. . . . . . . . . . . . . . . . . . . . . . . . . . . . . . . . . . . . . . . . . . . . . . 23
3.2.4 Solids contamination . . . . . . . . . . . . . . . . . . . . . . . . . . . . . . . . . . . . . . . . 23
3.3 Open-tank installation . . . . . . . . . . . . . . . . . . . . . . . . . . . . . . . . . . . . . . . . . . . . . . . . 23
3.4 Closed-tank installation . . . . . . . . . . . . . . . . . . . . . . . . . . . . . . . . . . . . . . . . . . . . . . . 26
3.5 Calibration . . . . . . . . . . . . . . . . . . . . . . . . . . . . . . . . . . . . . . . . . . . . . . . . . . . . . . . . . 29
3.6 If the Tank is Pressurized . . . . . . . . . . . . . . . . . . . . . . . . . . . . . . . . . . . . . . . . . . . . . 29
Chapter 4 Electrical Connections . . . . . . . . . . . . . . . . . . . . . . . . . . . . . . . . 31
4.1 Introduction . . . . . . . . . . . . . . . . . . . . . . . . . . . . . . . . . . . . . . . . . . . . . . . . . . . . . . . . 31
4.2 Installation considerations . . . . . . . . . . . . . . . . . . . . . . . . . . . . . . . . . . . . . . . . . . . . . 32
4.2.1 Power supply . . . . . . . . . . . . . . . . . . . . . . . . . . . . . . . . . . . . . . . . . . . . . . 32
4.2.2 EMC . . . . . . . . . . . . . . . . . . . . . . . . . . . . . . . . . . . . . . . . . . . . . . . . . . . . . 32
4.2.3 Ground connections. . . . . . . . . . . . . . . . . . . . . . . . . . . . . . . . . . . . . . . . . 32
4.2.4 Cabling requirements. . . . . . . . . . . . . . . . . . . . . . . . . . . . . . . . . . . . . . . . 33
4.2.5 Surge protection. . . . . . . . . . . . . . . . . . . . . . . . . . . . . . . . . . . . . . . . . . . . 33
4.2.6 Installation in explosive areas . . . . . . . . . . . . . . . . . . . . . . . . . . . . . . . . . 34
Installation and Configuration Manual 1
Page 4

Contents
4.3 Wiring the meter . . . . . . . . . . . . . . . . . . . . . . . . . . . . . . . . . . . . . . . . . . . . . . . . . . . . 35
4.4 Power supply input . . . . . . . . . . . . . . . . . . . . . . . . . . . . . . . . . . . . . . . . . . . . . . . . . . 36
4.5 Modbus (RS-485) . . . . . . . . . . . . . . . . . . . . . . . . . . . . . . . . . . . . . . . . . . . . . . . . . . . 36
4.6 4-20 mA outputs . . . . . . . . . . . . . . . . . . . . . . . . . . . . . . . . . . . . . . . . . . . . . . . . . . . . 37
4.7 Wiring procedure . . . . . . . . . . . . . . . . . . . . . . . . . . . . . . . . . . . . . . . . . . . . . . . . . . . 39
4.8 Further information on RS-485 . . . . . . . . . . . . . . . . . . . . . . . . . . . . . . . . . . . . . . . . . 41
4.8.1 RS-485 . . . . . . . . . . . . . . . . . . . . . . . . . . . . . . . . . . . . . . . . . . . . . . . . . . 41
4.8.2 RS-485 to RS-232 . . . . . . . . . . . . . . . . . . . . . . . . . . . . . . . . . . . . . . . . . . 41
4.8.3 RS-485 multi-drop . . . . . . . . . . . . . . . . . . . . . . . . . . . . . . . . . . . . . . . . . . 44
4.8.4 Transmission mode . . . . . . . . . . . . . . . . . . . . . . . . . . . . . . . . . . . . . . . . . 44
Chapter 5 Using ADView and ProLink II . . . . . . . . . . . . . . . . . . . . . . . . . . . . 45
5.1 Using ADView software. . . . . . . . . . . . . . . . . . . . . . . . . . . . . . . . . . . . . . . . . . . . . . . 45
5.1.1 What is ADView? . . . . . . . . . . . . . . . . . . . . . . . . . . . . . . . . . . . . . . . . . . . 45
5.1.2 Installing ADView . . . . . . . . . . . . . . . . . . . . . . . . . . . . . . . . . . . . . . . . . . . 45
5.1.3 Starting ADView. . . . . . . . . . . . . . . . . . . . . . . . . . . . . . . . . . . . . . . . . . . . 46
5.1.4 Understanding ADView features . . . . . . . . . . . . . . . . . . . . . . . . . . . . . . . 48
5.2 Using ProLink II software . . . . . . . . . . . . . . . . . . . . . . . . . . . . . . . . . . . . . . . . . . . . . 53
5.2.1 Overview . . . . . . . . . . . . . . . . . . . . . . . . . . . . . . . . . . . . . . . . . . . . . . . . . 53
5.2.2 Requirements . . . . . . . . . . . . . . . . . . . . . . . . . . . . . . . . . . . . . . . . . . . . . 53
5.2.3 Connecting from a PC to a meter . . . . . . . . . . . . . . . . . . . . . . . . . . . . . . 53
5.2.4 ProLink II configuration upload/download . . . . . . . . . . . . . . . . . . . . . . . . 54
5.2.5 ProLink II language . . . . . . . . . . . . . . . . . . . . . . . . . . . . . . . . . . . . . . . . . 54
Chapter 6 Calibration Check. . . . . . . . . . . . . . . . . . . . . . . . . . . . . . . . . . . . 55
6.1 Calibration. . . . . . . . . . . . . . . . . . . . . . . . . . . . . . . . . . . . . . . . . . . . . . . . . . . . . . . . . 55
6.1.1 Factory calibration . . . . . . . . . . . . . . . . . . . . . . . . . . . . . . . . . . . . . . . . . . 55
6.1.2 Calibration of Transfer Standards . . . . . . . . . . . . . . . . . . . . . . . . . . . . . . 55
6.1.3 Instrument calibration . . . . . . . . . . . . . . . . . . . . . . . . . . . . . . . . . . . . . . . 56
6.1.4 General viscosity equation. . . . . . . . . . . . . . . . . . . . . . . . . . . . . . . . . . . . 56
6.1.5 General density equation. . . . . . . . . . . . . . . . . . . . . . . . . . . . . . . . . . . . . 56
6.2 Calibration certificate example . . . . . . . . . . . . . . . . . . . . . . . . . . . . . . . . . . . . . . . . . 57
6.3 User calibration checks . . . . . . . . . . . . . . . . . . . . . . . . . . . . . . . . . . . . . . . . . . . . . . . 58
6.3.1 Ambient air calibration check . . . . . . . . . . . . . . . . . . . . . . . . . . . . . . . . . . 58
6.3.2 On-line calibration adjustment . . . . . . . . . . . . . . . . . . . . . . . . . . . . . . . . . 58
Chapter 7 General Maintenance . . . . . . . . . . . . . . . . . . . . . . . . . . . . . . . . . 61
7.1 Overview . . . . . . . . . . . . . . . . . . . . . . . . . . . . . . . . . . . . . . . . . . . . . . . . . . . . . . . . . . 61
7.2 General maintenance . . . . . . . . . . . . . . . . . . . . . . . . . . . . . . . . . . . . . . . . . . . . . . . . 61
7.2.1 Physical checks . . . . . . . . . . . . . . . . . . . . . . . . . . . . . . . . . . . . . . . . . . . . 61
7.2.2 Electrical check . . . . . . . . . . . . . . . . . . . . . . . . . . . . . . . . . . . . . . . . . . . . 62
7.2.3 Performance check . . . . . . . . . . . . . . . . . . . . . . . . . . . . . . . . . . . . . . . . . 62
7.2.4 Calibration check . . . . . . . . . . . . . . . . . . . . . . . . . . . . . . . . . . . . . . . . . . . 62
7.3 Fault analysis and remedial action . . . . . . . . . . . . . . . . . . . . . . . . . . . . . . . . . . . . . . 62
7.3.1 Troubleshooting faults . . . . . . . . . . . . . . . . . . . . . . . . . . . . . . . . . . . . . . . 62
7.3.2 Mechanical servicing . . . . . . . . . . . . . . . . . . . . . . . . . . . . . . . . . . . . . . . . 64
7.3.3 Time period trap . . . . . . . . . . . . . . . . . . . . . . . . . . . . . . . . . . . . . . . . . . . 64
Appendix A Factory Default Settings . . . . . . . . . . . . . . . . . . . . . . . . . . . . . . . 67
A.1 Default configuration for analog outputs . . . . . . . . . . . . . . . . . . . . . . . . . . . . . . . . . . 67
2 Micro Motion 7829 Visconic Viscosity Meter
Page 5

Contents
Appendix B Calculated Parameters . . . . . . . . . . . . . . . . . . . . . . . . . . . . . . . . 69
B.1 Overview . . . . . . . . . . . . . . . . . . . . . . . . . . . . . . . . . . . . . . . . . . . . . . . . . . . . . . . . . . 69
B.2 Kinematic viscosity . . . . . . . . . . . . . . . . . . . . . . . . . . . . . . . . . . . . . . . . . . . . . . . . . . 69
B.3 Base kinematic viscosity referral using ASTM D341 . . . . . . . . . . . . . . . . . . . . . . . . . 70
B.4 Base density referral . . . . . . . . . . . . . . . . . . . . . . . . . . . . . . . . . . . . . . . . . . . . . . . . . 70
B.4.1 Matrix density referral . . . . . . . . . . . . . . . . . . . . . . . . . . . . . . . . . . . . . . . 70
B.4.2 API density referral . . . . . . . . . . . . . . . . . . . . . . . . . . . . . . . . . . . . . . . . . 71
B.5 Calculated parameters . . . . . . . . . . . . . . . . . . . . . . . . . . . . . . . . . . . . . . . . . . . . . . . 73
B.5.1 Specific gravity. . . . . . . . . . . . . . . . . . . . . . . . . . . . . . . . . . . . . . . . . . . . . 73
B.5.2 Degrees Baumé . . . . . . . . . . . . . . . . . . . . . . . . . . . . . . . . . . . . . . . . . . . . 73
B.5.3 Degrees Brix . . . . . . . . . . . . . . . . . . . . . . . . . . . . . . . . . . . . . . . . . . . . . . 73
B.5.4 Quartic equation . . . . . . . . . . . . . . . . . . . . . . . . . . . . . . . . . . . . . . . . . . . 73
B.5.5 % Mass . . . . . . . . . . . . . . . . . . . . . . . . . . . . . . . . . . . . . . . . . . . . . . . . . . 73
B.5.6 % Volume . . . . . . . . . . . . . . . . . . . . . . . . . . . . . . . . . . . . . . . . . . . . . . . . . 74
B.5.7 API degrees . . . . . . . . . . . . . . . . . . . . . . . . . . . . . . . . . . . . . . . . . . . . . . . 74
Appendix C Safety Certification. . . . . . . . . . . . . . . . . . . . . . . . . . . . . . . . . . . 75
C.1 Safety certification. . . . . . . . . . . . . . . . . . . . . . . . . . . . . . . . . . . . . . . . . . . . . . . . . . . 75
Appendix D Modbus Communications . . . . . . . . . . . . . . . . . . . . . . . . . . . . . . 77
D.1 Overview . . . . . . . . . . . . . . . . . . . . . . . . . . . . . . . . . . . . . . . . . . . . . . . . . . . . . . . . . . 77
D.2 Accessing Modbus registers . . . . . . . . . . . . . . . . . . . . . . . . . . . . . . . . . . . . . . . . . . . 78
D.2.1 Establishing Modbus communications . . . . . . . . . . . . . . . . . . . . . . . . . . 78
D.3 Modbus implementation . . . . . . . . . . . . . . . . . . . . . . . . . . . . . . . . . . . . . . . . . . . . . . 78
D.3.1 Register size and content . . . . . . . . . . . . . . . . . . . . . . . . . . . . . . . . . . . . 78
D.4 Modbus register assignments . . . . . . . . . . . . . . . . . . . . . . . . . . . . . . . . . . . . . . . . . . 79
D.5 Index codes . . . . . . . . . . . . . . . . . . . . . . . . . . . . . . . . . . . . . . . . . . . . . . . . . . . . . . . . 83
D.5.1 API product type . . . . . . . . . . . . . . . . . . . . . . . . . . . . . . . . . . . . . . . . . . . 83
D.5.2 Pressure, Temperature, Density and other Units . . . . . . . . . . . . . . . . . . . 83
D.5.3 Special function . . . . . . . . . . . . . . . . . . . . . . . . . . . . . . . . . . . . . . . . . . . . 83
D.5.4 Special function quartic equation name. . . . . . . . . . . . . . . . . . . . . . . . . . 84
D.5.5 Special function quartic equation units . . . . . . . . . . . . . . . . . . . . . . . . . . 84
D.5.6 Output averaging time . . . . . . . . . . . . . . . . . . . . . . . . . . . . . . . . . . . . . . . 85
D.5.7 Analog output selection . . . . . . . . . . . . . . . . . . . . . . . . . . . . . . . . . . . . . . 85
D.5.8 Referral temperature . . . . . . . . . . . . . . . . . . . . . . . . . . . . . . . . . . . . . . . . 85
D.5.9 Software version . . . . . . . . . . . . . . . . . . . . . . . . . . . . . . . . . . . . . . . . . . . 86
D.5.10 Hardware type . . . . . . . . . . . . . . . . . . . . . . . . . . . . . . . . . . . . . . . . . . . . . 86
D.5.11 Unit type. . . . . . . . . . . . . . . . . . . . . . . . . . . . . . . . . . . . . . . . . . . . . . . . . . 86
D.5.12 Status register flags . . . . . . . . . . . . . . . . . . . . . . . . . . . . . . . . . . . . . . . . . 86
D.5.13 Line dynamic viscosity units. . . . . . . . . . . . . . . . . . . . . . . . . . . . . . . . . . . 87
D.6 Establishing Modbus communications . . . . . . . . . . . . . . . . . . . . . . . . . . . . . . . . . . . 87
D.7 Example of direct Modbus access . . . . . . . . . . . . . . . . . . . . . . . . . . . . . . . . . . . . . . 89
D.7.1 Example 1: Reading line density (16-bit register size) . . . . . . . . . . . . . . 89
D.7.2 Example 2: Reading line density (32-bit register size) . . . . . . . . . . . . . . 90
Appendix E Product Data . . . . . . . . . . . . . . . . . . . . . . . . . . . . . . . . . . . . . . . 91
E.1 Density / temperature relationship of hydrocarbon products. . . . . . . . . . . . . . . . . . . 91
E.1.1 Crude oil . . . . . . . . . . . . . . . . . . . . . . . . . . . . . . . . . . . . . . . . . . . . . . . . . 91
E.1.2 Refined products . . . . . . . . . . . . . . . . . . . . . . . . . . . . . . . . . . . . . . . . . . . 91
E.1.3 Platinum resistance law . . . . . . . . . . . . . . . . . . . . . . . . . . . . . . . . . . . . . 92
E.1.4 Density of ambient air . . . . . . . . . . . . . . . . . . . . . . . . . . . . . . . . . . . . . . . 93
Installation and Configuration Manual 3
Page 6

Contents
E.1.5 Density of water . . . . . . . . . . . . . . . . . . . . . . . . . . . . . . . . . . . . . . . . . . . 93
E.1.6 Velocity of sound in liquids. . . . . . . . . . . . . . . . . . . . . . . . . . . . . . . . . . . . 94
Appendix F Return Policy. . . . . . . . . . . . . . . . . . . . . . . . . . . . . . . . . . . . . . . 97
F.1 General guidelines . . . . . . . . . . . . . . . . . . . . . . . . . . . . . . . . . . . . . . . . . . . . . . . . . . 97
F.2 New and unused equipment . . . . . . . . . . . . . . . . . . . . . . . . . . . . . . . . . . . . . . . . . . . 97
F.3 Used equipment . . . . . . . . . . . . . . . . . . . . . . . . . . . . . . . . . . . . . . . . . . . . . . . . . . . . 97
4 Micro Motion 7829 Visconic Viscosity Meter
Page 7

Chapter 1
Introduction
1.1 Safety guidelines
Handle the 7829 Visconic viscosity meter with great care.
• Do not drop the meter.
• Do not use liquids incompatible with materials of construction.
• Do not operate the meter above its rated pressure or maximum temperature.
• Do not pressure test beyond the specified test pressure.
• Ensure all explosion-proof requirements have been applied.
• Ensure the meter and associated pipework are pressure tested to 1-1/2 times the maximum
operating pressure after installation.
• Always store and transport the meter in its original packaging, including the transit cover
secured by grub screws.
• To return a meter, refer to the Return Policy appendix for more information on the Micro
Motion return policy.
Safety messages are provided throughout this manual to protect personnel and equipment. Read each
safety message carefully before proceeding to the next step.
Installation (Short Stem) Electrical ConnectionsInstallation (Long Stem)Introduction
Installation and Configuration Manual 1
Page 8

Introduction
Electronics housing
Spigot
Tines
Stem (available in varying
lengths)
Stem is sealed at both ends
and air filled
1.2 About the meter
1.2.1 What is it?
The 7829 Visconic viscosity meter is a digital viscosity meter, based on the proven tuning fork
technology of Micro Motion. It is an all-welded sensor designed to be mounted directly into a
pipeline or in a tank. Viscosity and density are determined from the resonance of the tuning fork
immersed in the fluid, and a temperature sensor (RTD) is also fitted within the meter.
The 7829 meter is available in a variety of materials, and the immersed tines can be laminated with
PFA to inhibit the build up of residues such as asphaltenes.
The meter contains integral processing electronics to provide full ‘on node’ configuration, enabling it
to perform a variety of calculations.
Two forms of output are available:
• Two off 4-20 mA analog outputs, factory set but have individually configurable span, bias,
limits, and filter options. The standard factory settings for these outputs are Line Kinematic
Viscosity on Analog Output 1 and Line Temperature on Analog Output 2. Alternatively, the
analog outputs may be controlled by one of the following:
• Line dynamic viscosity
• Line density
• Base or referred kinematic viscosity
• Base or referred density (API or Matrix referral)
• Line temperature
• An RS-485 (Modbus) interface, giving access to other measurement results, system
information and configuration parameters.
2 Micro Motion 7829 Visconic Viscosity Meter
Page 9

Introduction
No signal converter is required, which simplifies wiring and enables the 7829 meter to be connected
directly to a plant monitoring and control systems and/or a local indicator.
The 7829 meter is factory set to perform API density referral. Re-configuration of the meter’s default
settings (see Appendix A) is achieved by linking a PC to the Modbus (RS-485) connection and
running the Micro Motion ADView or ProLink II (v2.9 or later) software. Once configured, the PC
can be removed.
1.2.2 7829 meter measurements
The 7829 meter directly measures the following fluid properties:
From these properties, the 7829 meter calculates:
• Line dynamic viscosity – measured in centiPoise - cP.
• Line Density – measured in kg/m
3
, g/cc, lb/gal, or lb/ft3.
• Temperature – measured in °C or °F.
• Line and base (referred) kinematic viscosity – measured in centiStokes - cSt.
• Line and base (referred) density – API or Matrix.
• Referral is made to 15°C, 1.013 bar; or at 60°F, 14.5 psi.
Installation (Short Stem) Electrical ConnectionsInstallation (Long Stem)Introduction
1.2.3 What is it used for?
The 7829 meter is ideally suited to applications where continuous real time measurement of viscosity
is required. The meter is particularly suited where viscosity is an indication of the behavioral
properties of the fluid, for example in applications involving spraying, coating or dipping.
Some uses are in the oil and petrochemical industry for:
•Refining
•Marine
•Power
• Heavy fuel oil (HFO) blending and bunkering
1.2.4 Principle of operation
The 7829 meter operates on the vibrating element principle, the element in this case being a slender
tuning fork structure which is immersed in the liquid being measured.
The tuning fork is excited into oscillation by a piezo-electric crystal internally secured at the root of
one tine, whilst the frequency of oscillation is detected by a second piezo-electric crystal secured at
the root of the other tine. The sensor is maintained at its first natural resonant frequency, as modified
by the surrounding fluid, by an amplifier circuit located in the electronics housing.
The electronics circuit actually excites the sensor into oscillation alternately at two positions on the
frequency response curve as shown in Figure 1-1. In doing this, the quality factor (Q) of the resonator
may be determined as well as the resonant frequency.
For details of the viscosity and density calculations, see the Calculated Parameters appendix.
Installation and Configuration Manual 3
Page 10

Introduction
0dB level
-3dB level
Frequency
τ
B
τ
A
A
B
Figure 1-1 Frequency response curve showing the quality factor (Q) calculation
Response
4 Micro Motion 7829 Visconic Viscosity Meter
Page 11

Chapter 2
Installation (Short Stem)
For information on installing a long-stem version of the 7829 Visconic viscosity meter, see Chapter 3.
2.1 Introduction
All drawings and dimensions given in this manual are given here for planning purposes only. Before
commencing fabrication, reference should always be made to the current issue of the appropriate
drawings. Contact Micro Motion for details.
For further information on handling and using the meter, see “Safety guidelines” on page 1
Installation (Short Stem) Electrical ConnectionsInstallation (Long Stem)Introduction
There are a variety of external factors that affect the ability of the 7829 Visconic viscosity meter to
operate successfully. In order to ensure that your system works correctly, the effects of these factors
must be taken into consideration when designing your installation.
There are two main aspects to consider:
• The accuracy and repeatability of the measurements
• The relevance of the measurements to the overall purpose of the system
Factors which may adversely affect accuracy and repeatability include:
• The presence of gas or bubbles within the fluid being measured
• Non-uniformity of the fluid
• The presence of solids as contaminants
• Fouling of the meter
• Temperature gradients
• Cavitations and swirls
• Operating at temperatures below the wax point of crude oils
• The correct pipe diameter that corresponds to the calibration of the meter.
In some applications, absolute accuracy is less important than repeatability. For example, in a system
where the control parameters are initially adjusted for optimum performance, and thereafter only
checked periodically.
The term achievable accuracy can be used to describe a measure of the product quality that can be
realistically obtained from a process system. It is a function of measurement accuracy, stability and
system response. High accuracy alone is no guarantee of good product quality if the response time of
the system is measured in tens of minutes, or if the measurement bears little relevance to the operation
of the system. Similarly, systems which require constant calibration and maintenance cannot achieve
good achievable accuracy.
Installation and Configuration Manual 5
Page 12

Installation (Short Stem)
long axis
short
axis
Factors which may adversely affect the relevance of the measurements could include:
• Measurement used for control purposes being made too far away from the point of control, so
that the system cannot respond properly to changes.
• Measurements made on fluid which is unrepresentative of the main flow.
2.2 Boundary effects
Any insertion device or meter can only measure the properties of the fluid within the region of fluid to
which it is sensitive.
For practical reasons, it is helpful to consider the sensitive, or effective region, for the viscometer as
an ovoid centered on the tips of the tines with its long axis aligned with the direction in which the
tines vibrate, as shown below. The 7829 meter is insensitive to the properties of the fluid outside this
region and progressively more sensitive to fluid properties the closer the fluid is to the tines. Density
can be considered a “mass centered” effect and viscosity a “surface centered” effect in this
visualization; i.e. the measurement of density is more uniformly sensitive to the density of fluid
throughout the region while viscosity measurement is much more critically sensitive to fluid on the
surface of the tines.
If part of this volume is taken up by the pipework or fittings there is said to be a boundary effect; i.e.,
the intrusion of the pipe walls will alter the calibration. The diagram below illustrates the 7829 meter
installed in a pocket on the side of a 4" (100 mm) horizontal pipe line (viewed from above). The
effective region is completely enclosed within the pipe line and thus is completely fluid.
6 Micro Motion 7829 Visconic Viscosity Meter
Page 13

Installation (Short Stem)
Top or Plan view
4” horizontal pipe
2”Schedule 40
Pocket or “T”
This next view shows other pipe outlines superimposed:
Installation (Short Stem) Electrical ConnectionsInstallation (Long Stem)Introduction
Installation and Configuration Manual 7
The smaller circle represents a 4" (100 mm) vertical pipe, which because the 7829 meter orientation is
constant irrespective of pipe orientation intersects the effective region. The 6" (150 mm) pipe is the
smallest pipe diameter to completely enclose the effective region when the pipe is vertical. Thus
smaller pipe diameters can lead to a variety of different geometries which would each require a
separate calibration.
An alternative condition is shown in the next diagram where the side pocket is extended until it passes
completely through the effective region producing a “core”:
Page 14

Installation (Short Stem)
From this, it would appear that almost every installation requires a separate in situ calibration – a very
undesirable situation. The problem is resolved by providing standard calibration geometries which
can be used in all pipe work configurations and thereby allow the factory calibration conditions to be
reproduced in the process.
2.3 Standard installations
2.3.1 Overview
To overcome the need for in situ calibration for every installation, three standard installations are
proposed. If an installation conforms to one of these standards, the factory calibration of the 7829
meter is valid, and in-situ calibration unnecessary. Table 2-1summarizes the three installations. For
tank installations, consult Micro Motion.
Table 2-1. Types of standard installations
Installation type Free stream T-piece Flow-through chamber
Description 7829 meter tines are inserted
Flow rate 0.3 to 0.5 m/s at the 7829 meter. 0.5 to 3 m/s at main pipe wall. 10 to 30 l/min.
Viscosity 0.5 to 12500 cP 0.5 to 100 cP 0.5 to 1000 cP
Temperature
(1)
directly into the main fluid flow.
-50 to 200°C
(-58 to 392°F)
7829 meter tines are contained
in a side pocket off the main
flow.
-50 to 200°C
(-58 to 392°F)
7829 meter tines are
contained in a flow-through
chamber in which fluid is
circulated from the main
flow.
-50 to 200°C
(-58 to 392°F)
8 Micro Motion 7829 Visconic Viscosity Meter
Page 15

Installation (Short Stem)
Table 2-1. Types of standard installations continued
Installation type Free stream T-piece Flow-through chamber
Main flow pipe size 100 mm (4") horizontal
150 mm (6") vertical, or larger.
Advantages • Simple installation in large bore
pipes.
• Ideal for clean fluids and
non-waxing oils.
• Suitable for line viscosity
measurement and simple
referrals.
Not recommended
for
• Dirty fluids.
• Low or unstable flow rates.
• Where step changes in
viscosity can occur.
• For small bore pipes.
100 mm (4") horizontal or
larger.
• Simple installation in large
bore pipes.
• Ideal for clean fluids and
non-waxing oils.
• Suitable for line viscosity
measurement and simple
referrals.
• Dirty fluids
• Low or unstable flow rates.
• Where step changes in
viscosity can occur.
• for small bore pipes.
• Where temperature effects
are significant.
Any.
• Adaptable installation to
any diameter main pipe
and for tank applications.
• Ideal for flow and
temperature conditioning.
• Suitable for complex
referrals and for use with
heat exchangers.
• Suitable for step changes
in viscosity.
• Fast response.
• Ideal for analyser
cubicles.
• Uncontrolled flow rates.
• Careful system design
required to ensure
representative
measurement.
• Frequently requires the
use of a pump.
Installation (Short Stem) Electrical ConnectionsInstallation (Long Stem)Introduction
(1)
Approval for use in hazardous areas is limited to –40 to +200°C (–40 to +392°F)
2.3.2 Meter orientation
The meter must always be installed horizontally, and orientated to allow flow in the gap between the
tines. This is irrespective of the pipe line orientation, and helps to prevent the trapping of bubbles or
solids on the meter.
Installation and Configuration Manual 9
Page 16

Installation (Short Stem)
Bubbles rise!
Solids sink!
the slot
must be
vertical
.
For ALL pipe and flow directions
.
the meter
must be
horizontal
Figure 2-1 Meter orientation
Note: All drawings and dimensions given in the following sections are derived from detailed
dimensional drawings. They are given here for planning purposes only. Before commencing
fabrication, reference should always be made to the current issue of the appropriate drawings contact Micro Motion for details.
2.3.3 Free stream installation - flanged fitting
Conditions:
• Flow: 0.3 to 0.5 m/s (at the meter)
• Viscosity: 0.5 to 12,500 cP
• Temperature: -50 °C to 200 °C (–58 °F to 392 °F)
[-40 °C to 200 °C (-40 °F to 392 °F) in hazardous areas]
Note: The thermal mass of the flanges may affect the response time of the meter to temperature
changes.
The view shown below is schematic to show the dimensions of the side pocket, which is fabricated by
the end user.
10 Micro Motion 7829 Visconic Viscosity Meter
Page 17

Installation (Short Stem)
circlip
4” or larger;
horizontal
6” or larger;
vertical
2.75”
(70 mm ±2 mm)
7.75”
(197 mm)
Free Stream; flanged
2” (52.3 mm)
wall thickness
at least
0.15” (3.912 mm)
2” Schedule 40
4.37”
(111 mm)
0.47” (12 mm)
PTFE
ring
circlip
PTFE
ring
circlip
PFA
ring
circlip
Installation (Short Stem) Electrical ConnectionsInstallation (Long Stem)Introduction
The pocket geometry must be consistent with 2" schedule 40 tube in both internal diameter and
minimum wall thickness, such as:
• Internal diameter: 2" (52.5 mm)
• Wall thickness: minimum 0.15" (3.912 mm)
Weld neck or slip-on flanges may be used, according to the flange rating selected. However, for
higher rated flanges, only slip-on flanges may give the necessary clearances.
2.3.4 Free stream installation - weldolet
This is the preferred option where temperature variations are a critical factor. The reduced thermal
mass of the weldolet's taper-lock fitting renders it more able to track rapid changes in temperature.
Conditions:
• Flow: 0.3 to 0.5 m/s (at the meter)
• Viscosity: 0.5 to 12,500 cP
• Temperature: -50 °C to 200 °C (–58 °F to 392 °F)
[-40 °C to 200 °C (-40 °F to 392 °F) in hazardous areas]
The weldolet has a 1.5" taper lock fitting, and is supplied to be welded on 4", 6", 8" or 10" pipelines.
Use of the weldolet ensures that the tines of the 7829 meter are orientated correctly and are fully
inserted into the fluid stream.
Before fitting the weldolet, the pipeline must be bored through at 2.1" (52.5 mm) diameter to accept
the viscometer. The weldolet must be welded to the pipeline concentrically with the pre-bored hole.
The view shown below is a schematic to show the relevant dimensions.
Installation and Configuration Manual 11
Page 18

Installation (Short Stem)
10” (254 mm)
Horizontal: 4” or larger
Vertical: 6” or larger
Weld
4.4” (111 mm)
Free stream weldolet
to suit pipe diameter
(4, 6, 8 or 10” N.B.)
2.1” (52.5 mm)
min
Figure 2-2 Free stream 1.5" Swagelock fitting
The installation will conform generally to Schedule 40 pressure ratings. The weldolet fabrication is
rated to 100 Bar at ambient temperature.
Note: Correct installation and pressure testing of the fitting is the responsibility of the user.
2.3.5 T-piece installation
Conditions:
The thermal mass of the flanges may affect the response time of the meter to temperature changes.
Flow velocity at the pipe wall and fluid viscosity must be within the limits shown to ensure that the
fluid within the pocket is refreshed in a timely manner. This installation will not respond as rapidly as
the free-stream installation to step changes in viscosity.
The view shown is a schematic to show the dimensions of the side pocket, which is fabricated by the
end user.
• Flow: 0.5 to 3.0 m/s (at the pipe wall)
• Viscosity: 0.5 to 100 cP
• Temperature: -50 °C to 200 °C (–58 °F to 392 °F)
[-40 °C to 200 °C (-40 °F to 392 °F) in hazardous areas]
12 Micro Motion 7829 Visconic Viscosity Meter
Page 19

Installation (Short Stem)
“T” piece Flanged
D
4” or larger;
horizontal
or vertical
6.9”
(175 mm ±2
mm)
7.75”
(197 mm)
2” (52.3 mm)
wall thickness
at least
0.15” (3.912 mm)
2” Schedule 40
PFA
ring
circlip
0.47” (12 mm)
4.37” (111 mm)
Installation (Short Stem) Electrical ConnectionsInstallation (Long Stem)Introduction
The pocket geometry must be consistent with 2" schedule 40 tube in both internal diameter and
minimum wall thickness, i.e.:
• Internal diameter: 2.1" (52.5 mm)
• Wall thickness : minimum 0.15" (3.912 mm)
Weld neck or slip-on flanges may be used, according to the flange rating selected. However, for
higher rated flanges, only slip-on flanges may give the necessary clearances.
2.3.6 Flow-through chamber installation
Flow-through chambers are fabricated by Micro Motion, and are available with either weld prepared
ends or with flange or compression fittings for connection into the process pipe lines. They are
available with 1" NB, 2" NB, or 3" NB inlet and outlet pipes.
Note: The length of the inlet and outlet pipes must not be altered, otherwise the temperature response
and stability of the fitting may be adversely affected.
Conditions:
• Flow: constant, between 10 and 30 l/min for 2" sch 40 calibration bore section, 5–300 l/min
for 3" sch 80 calibration bore.
• Viscosity: 0.5 to 1000 cP
• Temperature: -50 °C to 200 °C (–58 °F to 392 °F)
[-40 °C to 200 °C (-40 °F to 392 °F) in hazardous areas]
Installation and Configuration Manual 13
• Pressure: 70 bar @ 204 °C, subject to process connections.
The PT100 is a direct insertion type, without a thermowell, and uses a ¾" Swagelok connection.
The diagram below shows an example of this type of standard installation.
Page 20

Installation (Short Stem)
Dimensions shown in inches (mm)
The three compression fittings on the flow pockets (½" drain, ¾" temp probe, and 1-½" mounting nut
for the meter) are rated to above the working pressure of the flow pocket. The fittings may be
Swagelok or Parker; both are used in manufacture.
The fittings are certified to the following standards:
• Swagelok: SO9001 / 9002, ASME,TUV,CSA,DNV
• Parker: ISO 9001 / 9002, TUV, DNV, LLOYDS
2.4 Installation in the pipeline or system
Viscosity is a highly sensitive indicator of change in a fluid – a key reason why viscosity
measurement is increasingly being chosen as a process measurement.
This sensitivity means that the measurement can be very sensitive to extraneous effects and therefore
great care must be taken to consider all the factors which affect measurement when assessing the
installation requirements.
Like many other meters, the optimum performance of the viscometer depends upon certain conditions
of the fluid and configuration of the process pipe-work. By introducing appropriate flow conditioning,
the optimum performance of the 7829 meter can be achieved at any chosen location in the process
system.
14 Micro Motion 7829 Visconic Viscosity Meter
Page 21

Installation (Short Stem)
You must first select a location which serves the application objective; e.g. installed close to the point
of control. Then, consideration can be given to fluid conditioning at that point. Where the application
requirements allow a degree of tolerance in the point chosen for installation, the installation may be
able to take advantage of natural flow conditioning.
The choice of mechanical installation (free stream, “T” piece or flow-through chamber) will be
dictated partly by application needs and partly by the fluid conditions, such as:
• Condition of fluid at the sensor
• Thermal effects
• Flow rate
•Entrained gas
• Solids contamination
Fluid at the sensor
The fluid in the effective zone of the 7829 meter must be of uniform composition and at uniform
temperature. It must be representative of the fluid flow as a whole.
This is achieved either by mixing of the fluid either using a static inline mixer or taking advantage of
any natural pipe condition that tends to cause mixing, such as pump discharge, partially open valves.
The viscometer should be installed downstream where the flow is just returning to laminar flow
conditions.
Thermal effects
Avoid temperature gradients in the fluid and in the pipe work and fittings immediately upstream and
downstream of the viscometer.
Always insulate the viscometer and surrounding pipework thoroughly. Insulation must be at least
1" (25 mm) of rockwool, preferably 2" (50 mm) (or equivalent insulating heat jacket) and enclosed in
a sealed protective casing to prevent moisture ingress, air circulation, and crushing of the insulation.
Special insulation jackets are available from Micro Motion for the flow-through chambers, which,
because of the low volumetric flow rates and hence low heat flow, are more vulnerable to temperature
effects.
Avoid direct heating or cooling of the viscometer and associated pipe work upstream and downstream
that is likely to create temperature gradients. If it is necessary to provide protection against cooling
due to loss of flow, electrical trace heating may be applied, provided it is thermostatically controlled
and the thermostat is set to operate below the minimum operating temperature of the system.
Installation (Short Stem) Electrical ConnectionsInstallation (Long Stem)Introduction
Where flow-through chambers are used and where base (or referred) viscosity is required and the
behavior of the fluid is such that the temperature of the sample flow will require controlling, heat
exchangers should be fitted upstream a sufficient distance from the chamber so that the fluid
temperature is relatively stable. Insulation should be extended from the viscometer to the outlet from
the heat exchanger. Fluid heat exchangers should be controlled by modulating the flow rate of the heat
exchange fluid and not by modulating the sample flow rate.
Flow rate
Flow rates and velocities should be maintained relatively constant within the limits given. The fluid
flow provides a steady heat flow into the viscometer section, and the flow rate influences the self
cleaning of the sensor and the dissipation of bubbles and solid contaminants.
Installation and Configuration Manual 15
Page 22

Installation (Short Stem)
Where it is necessary to install the viscometer in a by-pass (either using the free stream installation in
a 4" diameter horizontal by-pass, or a flow-through chamber), flow may be maintained using pressure
drop, pitot scoop, or by a sample pump. Where a pump is used, the pump should be upstream of the
viscometer.
Entrained gas
Gas pockets can disrupt the measurement. A brief disruption in the signal caused by transient gas
pockets can be negated in the signal conditioning software, but more frequent disruptions or serious
gas entrainment must be avoided. This can be achieved by observing the following conditions:
• Keep pipe lines fully flooded at all times
• Vent any gas prior to the viscometer
• Avoid sudden pressure drops or temperature changes which may cause dissolved gases to
break out of the fluid
• Maintain a back pressure on the system sufficient to prevent gas break out (e.g. back pressure
equivalent to twice the ‘head loss’ plus twice the vapor pressure)
• Maintain flow velocity at the sensor within the specified limits.
Solids contamination
• Avoid sudden changes of velocity that may cause sedimentation.
• Install the viscometer far enough downstream from any pipework configuration which may
cause centrifuging of solids (e.g. bends).
• Maintain flow velocity at the sensor within the specified limits.
• Use filtration if necessary.
The diagram below illustrates some of the principles outlined in this section. It shows a free-stream
viscometer installation with an additional sample take off. The position of both is such that the static
mixing (which could be caused by pump discharge or partially closed valve), has negated the adverse
effects of bends and established laminar flow, and has ensured that the fluid is thoroughly mixed and
thus of uniform composition and temperature. The ideal place for a free stream or “T” piece
installation, or for the by-pass take off point is where the flow has just begun to be laminar.
Note: The insulation extends upstream and downstream far enough to prevent conduction losses in the
pipe walls from degrading the temperature conditioning of the fluid at the sensor.
16 Micro Motion 7829 Visconic Viscosity Meter
Page 23

Installation (Short Stem)
Installation (Short Stem) Electrical ConnectionsInstallation (Long Stem)Introduction
2.5 Typical installations
The following diagrams illustrate some typical solutions for line viscosity measurement, simple base
viscosity referral and base viscosity using temperature control of the sample flow.
In all examples, the fluid flow is assumed to be uniform in composition and temperature as it enters
the viscometer section.
2.5.1 Jacketed pipeline
The diagram below shows a jacketed pipeline. The heating fluid in the jacket will cause temperature
gradients, and therefore it is discontinued through the viscometer section. If protection against cooling
due to loss of flow is required through the unjacketed section then it must be provided using electrical
trace heating.
Installation and Configuration Manual 17
Page 24

Installation (Short Stem)
Figure 2-3 Jacketed pipeline installation
Alternatively, the viscometer can be installed in a by-pass. By ensuring that the sample is mixed
where the by-pass draws off the main pipeline, it is not necessary to discontinue the main pipe line
jacket. This is shown below.
Figure 2-4 4" bypass using DP to generate constant flow at the meter
18 Micro Motion 7829 Visconic Viscosity Meter
Page 25

Installation (Short Stem)
PT10 0
(optional)
Pump
10-30 l/min
Insulation
(required)
Optional drain line (½”)
either vented or
returned to process
Line or Base Viscosity: temperature not conditioned
Horizontal Pipe line
Flowmeter
(optional)
1”-2” sample lines
Always install the chamber with flow
in horizontal and flow out vertically
upwards.
Drain, to purge solids, is vertically
down and can be vented and/or
returned to line.
Side Wall Tappin g
Side Wall Tapping
with Pitot Scoop
Meter in 2”
flow-through
chamber
2.5.2 Flow-through chamber
The diagram below shows the use of a flow-through chamber. This provides a compact installation
and is particularly suited to flows of contaminated fluids, since the design of the chamber encourages
self cleaning. Because the volume flow rate is low, the heat flow is low and therefore the insulation
must be as efficient as possible. The low heat flow makes this system ideal for base (or referred)
viscosity measurement using heat exchangers.
Figure 2-5 Pumped bypass
Installation (Short Stem) Electrical ConnectionsInstallation (Long Stem)Introduction
Installation and Configuration Manual 19
Page 26

Installation (Short Stem)
20 Micro Motion 7829 Visconic Viscosity Meter
Page 27

Chapter 3
Installation (Long Stem)
For information on installing a short-stem version of the 7829 Visconic viscosity meter, see
Chapter 2.
3.1 Introduction
All drawings and dimensions given in this manual are given here for planning purposes only. Before
commencing fabrication, reference should always be made to the current issue of the appropriate
drawings. Contact Micro Motion for details.
To protect the tines from damage, a Transit Cover is fitted prior to shipment from the factory. The Transit
Cover is held in place by 2 grub screws. Be sure to remove and store the Transit Cover prior to
installation. Re-fit the Transit Cover if storing or transporting, such as for repair. If the Transit Cover has
been lost, it can be purchased from Micro Motion.
For further information on handling and using the meter, see “Safety guidelines” on page 1
There are a variety of external factors that affect the ability of the 7829 Visconic viscosity meter to
operate successfully. In order to ensure that your system works correctly, the effects of these factors
must be taken into consideration when designing your installation.
There are two main aspects to consider:
• The accuracy and repeatability of the measurements
Installation (Short Stem) Electrical ConnectionsInstallation (Long Stem)Introduction
• The relevance of the measurements to the overall purpose of the system
Factors which may adversely affect accuracy and repeatability include:
• The presence of gas or bubbles within the fluid being measured
• Non-uniformity of the fluid
• The presence of solids as contaminants
• Fouling of the meter
• Temperature gradients
• Cavitations and swirls
• Operating at temperatures below the wax point of crude oils
In some applications, absolute accuracy is less important than repeatability. For example, in a system
where the control parameters are initially adjusted for optimum performance, and thereafter only
checked periodically.
Installation and Configuration Manual 21
Page 28

Installation (Long Stem)
The term achievable accuracy can be used to describe a measure of the product quality that can be
realistically obtained from a process system. It is a function of measurement accuracy, stability and
system response. High accuracy alone is no guarantee of good product quality if the response time of
the system is measured in tens of minutes, or if the measurement bears little relevance to the operation
of the system. Similarly, systems which require constant calibration and maintenance cannot achieve
good achievable accuracy.
Factors which may adversely affect the relevance of the measurements could include:
• Measurement used for control purposes being made too far away from the point of control, so
that the system cannot respond properly to changes.
• Measurements made on fluid which is unrepresentative of the main flow.
3.2 Installation considerations
Density and viscosity is a sensitive indicator of change in a fluid - a key reason why density and
viscosity measurement is increasingly being chosen as a process measurement. However, density and
viscosity measurements can be sensitive to extraneous effects and, therefore, great care must be taken
to consider all the factors which may affect measurement when assessing the installation
requirements.
Like many other meters, the optimum performance of the viscosity meter depends upon certain
conditions of the fluid. You must first select a suitable position where the fork’s tines are always
completely immersed in the fluid. Although tolerant of solids, turbulence and bubbles, there should
be at least a 50 mm clearance from objects e.g. impellers, pipe stubs, etc.
Then consideration can be given to fluid conditioning at that point. Where the application
requirements allow a degree of tolerance in the point chosen for installation, the installation may be
able to take advantage of natural flow conditioning.
The choice of mechanical installation will be dictated partly by application needs and partly by the
fluid conditions, such as:
• Condition of fluid at the sensor.
• Flow rate.
•Entrained gas.
• Solids contamination.
3.2.1 Fluid at the sensor
The fluid in the effective zone of the long stem 7829 meter must be of uniform composition and at
uniform temperature. It must be representative of the fluid as a whole. This is achieved by taking
advantage of any natural tank condition that tends to cause mixing, such as pump discharge, partially
open valves etc.
3.2.2 Flow rate
If there is flow in the tank, the rate of flow should ideally be not more than 0.5 m
3
/s. If flow rates
exceed this, a ‘shift’ will be introduced into density and viscosity readings. The higher the flow rate
is, the larger the ‘shift’. Measurements also become ‘noisy’.
22 Micro Motion 7829 Visconic Viscosity Meter
Page 29

Installation (Long Stem)
3.2.3 Entrained gas
Gas pockets can disrupt the measurement. A brief disruption in the signal caused by transient gas
pockets can be negated in the internal signal conditioning software, but more frequent disruptions or
serious gas entrainment must be avoided. This can be achieved by observing the following
conditions:
• Vent any gas prior to the viscosity meter.
• Avoid sudden pressure drops or temperature changes which may cause dissolved gases to
break out of the fluid.
3.2.4 Solids contamination
• Avoid sudden changes of velocity that may cause sedimentation.
• Install the meter far enough away from any build-up of solids.
• Maintain flow velocity at the sensor within the specified limits.
• Specify the long-stem 7829 meter with a non-stick PFA protective layer.
3.3 Open-tank installation
Installation (Short Stem) Electrical ConnectionsInstallation (Long Stem)Introduction
Only the safe area model may be used in open-tank installation.
1. For open-tank installations, the long-stemmed 7829 meter is clamped to a structure (see
Figure 3-1). The position of the clamp determines the insertion depth.
Figure 3-1 Open-tank installation
2. Keep the tines away from the tank wall (see Figure 3-2).
Installation and Configuration Manual 23
Page 30

Installation (Long Stem)
Figure 3-2 Keeping tines away from the tank wall (Open-tank)
3. Keep the tines immersed in fluid (see Figure 3-3).
Figure 3-3 Keeping tines immersed (Open-tank)
4. Keep tines away from objects and disturbed flow (see Figure 3-4).
24 Micro Motion 7829 Visconic Viscosity Meter
Page 31

Installation (Long Stem)
Figure 3-4 Keeping tines away from objects and disturbed flow (open tank)
Installation (Short Stem) Electrical ConnectionsInstallation (Long Stem)Introduction
5. If there is flow, align the tines such that the flow is directed towards the gap between the tines
(see Figure 3-5).
Figure 3-5 Aligning the tines in flow (Open-tank)
6. Keep away from deposit build-up (see Figure 3-6).
Installation and Configuration Manual 25
Page 32

Installation (Long Stem)
Figure 3-6 Avoid deposit build-up (Open-tank)
3.4 Closed-tank installation
1. For closed-tank installations, the long-stemmed 7829 meter should have a factory fitted flange
attachment. (This is an option that is specified as a code in the part number – see a list of the
product options in the product data sheet available at www.micromotion.com.) (See
Figure 3-7).
Figure 3-7 Closed-tank installation
2. To vary the insertion depth, a standoff section with flange (not supplied) can be used (see
Figure 3-8).
26 Micro Motion 7829 Visconic Viscosity Meter
Page 33

Installation (Long Stem)
Figure 3-8 Use of standoff section (not supplied)(closed-tank)
3. Keep the tines immersed in fluid (see Figure 3-9).
Installation (Short Stem) Electrical ConnectionsInstallation (Long Stem)Introduction
Figure 3-9 Keeping tines immersed (closed tank)
4. Keep the tines away from the tank wall (see Figure 3-10).
Figure 3-10 Keeping away from tank wall (closed tank)
5. Allow for flexing of the tank lid, preventing the long-stemmed 7829 meter from being pushed
towards a tank wall or into the path of disturbed flow (see Figure 3-11).
Installation and Configuration Manual 27
Page 34

Installation (Long Stem)
Figure 3-11 Allowing for tank lid flexing (closed tank)
6. Keep tines away from objects and disturbed flow (see Figure 3-12).
Figure 3-12 Keeping tines away from objects and disturbed flow (Closed-tank)
7. If there is flow, align the tines such that the flow is directed towards the gap in the tines (see
Figure 3-13)
28 Micro Motion 7829 Visconic Viscosity Meter
Page 35

Installation (Long Stem)
Figure 3-13 Aligning the tines in flow (closed tank)
8. Keep away from deposit build-up (see Figure 3-14).
Figure 3-14 Avoid deposit build-up (closed tank)
Installation (Short Stem) Electrical ConnectionsInstallation (Long Stem)Introduction
3.5 Calibration
The log-stemmed 7829 meter is factory calibrated and no further calibration is necessary. The
calibration is traceable to UK National Standards through the Micro Motion UKAS-approved
laboratory.
For calibration range, see the 7829 Visconic viscosity meter product data sheet available at
www.micromotion.com.
3.6 If the Tank is Pressurized
1. Once the installation has been prepared, and before installing the 7829 meter, fit a blanking
flange or compression nut to the 7829 meter mounting, and pressurize and flush the system.
2. Isolate the system, depressurize and remove the blanking flange or compression nut.
3. Install the 7829 meter.
4. Slowly pressurize the system and check for leaks, particularly if the normal operating
temperature is high, or the sensor has been fitted cold; tighten as necessary.
Installation and Configuration Manual 29
Page 36

Installation (Long Stem)
5. Once the system has stabilized and is leak free, fit the insulation material, remembering also to
insulate any flanges.
30 Micro Motion 7829 Visconic Viscosity Meter
Page 37

Electrical Connections
Chapter 4
Electrical Connections
For installations in hazardous areas:
• For ATEX installations, the electrical installation must strictly adhere to the safety information
given in the ATEX safety instructions booklet shipped with this manual. See Section 1.1 for
important information.
• For installations in USA and Canada, the electrical installation must strictly adhere to the Electrical
Codes and a conduit seal is required within 2” (50 mm) of the enclosure.
4.1 Introduction
The 7829 Visconic viscosity meter has two types of output:
• Two off 4–20 mA analog outputs that give an output proportional to a user-specified range.
The parameters that can be output on each analog output are as follows:
Installation (Short Stem) Electrical ConnectionsInstallation (Long Stem)Introduction Installation (Short Stem) Electrical ConnectionsInstallation (Long Stem)Introduction Installation (Short Stem) Electrical ConnectionsInstallation (Long Stem)Introduction Installation (Short Stem) Electrical ConnectionsInstallation (Long Stem)Introduction
Analog Output 1 Analog Output 2
Line dynamic viscosity Line dynamic viscosity
(1)
Line kinematic viscosity
Line density Line density
Base or referred kinematic
viscosity
Base or referred density Base or referred density
Line temperature Line temperature
(1) Factory default selection
Line kinematic viscosity
Base or referred kinematic
viscosity
(1)
• A Modbus (RS-485) interface, giving access to other measurement results, system information
and configuration parameters. The Modbus interface is also used to configure the 7829 meter,
using a PC running the Micro Motion ADView or ProLink II software (see Chapter 5).
It is recommended that both output types are installed, requiring a minimum of eight wires (two for
each output, and two for power). Although you may not immediately require the Modbus connection,
it may be required for in-situ calibration adjustment and future system enhancements, and the cost of
the additional wires is trivial compared to the expense of installing them retrospectively.
Installation and Configuration Manual 31
Page 38

Electrical Connections
A number of factors must be taken into account when planning the electrical installation. These
include (see Section 4.2 for more information):
•Power supply
•EMC
• Ground connections
•Cables
• Surge protection
• Installation in explosive area
• Modbus connections
• Analog connections
4.2 Installation considerations
4.2.1 Power supply
The power supply to the 7829 Visconic viscosity meter must have the following requirements:
• Voltage: Nominally 24 VDC, but in the range 20 to 28 VDC.
• Current: for transmitter – 50 mA; for mA outputs – 22 mA per output.
If several 7829 meters are to be used within a local area, one power supply can be used to power them
all; where the meters are distributed over a wide area and cabling costs are high, it may be more cost
effective to use several smaller, local power supplies.
Upon leaving the factory, the two 4-20 mA analog outputs are non-isolated as they are powered
through internal links to the power supply input. However, if split-pads “LNK A” (Analog Output 1)
and “LNK B” (Analog Output 2) by the terminal block are ‘broken’, they become isolated and require
a separate 20-28 VDC power supply (see the 4–20 mA outputs section for details).
If an RS-232 to RS-485 converter is used (for example to connect to a serial port on a PC), this may
also require a power supply (see the Further information on RS-485 section for details).
Care should be taken where there is the possibility of significant common-mode voltages
between different parts of the system. For example, if the 7829 meter is locally powered from a
power supply which is at a different potential to the RS-485 ground connection (if used).
4.2.2 EMC
To meet the EC Directive for EMC (Electromagnetic Compatibility), it is recommended that the 7829
meter be connected using a suitable instrumentation cable containing an overall screen. This should
be earthed at both ends of the cable. At the 7829 meter, the screen can be earthed to the meter body
(and therefore to the pipework), using a conductive cable gland.
4.2.3 Ground connections
It is not necessary to earth the meter through a separate connection; this is usually achieved directly
through the metalwork of the installation.
The electronics and communications connections (RS-485/Modbus and 4-20 mA analog output) of
the 7829 meter are not connected to the body of the meter. This means that the negative terminal of
the power supply can be at a different potential to the earthed bodywork.
32 Micro Motion 7829 Visconic Viscosity Meter
Page 39

Electrical Connections
In the majority of applications, it is not necessary to connect the RS-485 ground connection. In areas
where there is a significant amount of electrical noise, higher communications integrity may be
obtained by connecting the negative power terminal (pin 2) of the 7829 meter to the communications
ground. If this is done, it is important to ensure that the possibility of ground loops (caused by
differences in earth potential) is eliminated.
4.2.4 Cabling requirements
Although it is possible to connect separate cables to the 7829 meter for power, RS-485 and the
4-20 mA analog output, it is recommended that all connections are made through one
instrumentation-grade cable.
Connections for the Analog and Modbus signals should be individually screened twisted-pairs with an
overall screen, foil or braid for the cable. Where permissible, the screen should be connected to earth
at both ends. (At the 7829 meter, this is best done using a conductive cable gland.)
Cables should conform to BS2538. In the USA, use Belden 9402 (two-pair) or Beldon 85220
(single-pair). Other cables that are suitable are those that meet BS5308 Multi-pair Instrumentation
Types 1 and 2, Belden Types 9500, 9873, 9874, 9773, 9774 etc.
The typical maximum recommended cable length for the above cable types is 1000 m (3200 ft), but
care must be taken to ensure that the power supply at the meter is at least 20 V. Thus, for 24 V power
supply, the overall resistance for the power supply connections (both wires in series) must be less than
100 ohms.
In order to complete the wiring, you will need the following parts:
Installation (Short Stem) Electrical ConnectionsInstallation (Long Stem)Introduction Installation (Short Stem) Electrical ConnectionsInstallation (Long Stem)Introduction Installation (Short Stem) Electrical ConnectionsInstallation (Long Stem)Introduction Installation (Short Stem) Electrical ConnectionsInstallation (Long Stem)Introduction
• ½” NPT to M20 gland adapter
• ½” NPT blanking plug
• M20 x 1 cable gland (not supplied).
The gland adapter and blanking plug are supplied with the 7829 meter – these two parts are Exd rated.
However, you will need to get a suitably rated cable gland:
• For non-hazardous area installations, use an IP68 or higher rated cable gland.
• For hazardous area installations use an Exd-rated cable gland.
In hazardous areas, all parts must be explosion-proof. Alternative parts may be required in order to
meet local electrical installation regulations.
4.2.5 Surge protection
Careful consideration should be given to the likelihood of power supply surges or lightning strikes.
The power supply connections of the 7829 meter have a surge arrestor fitted that gives protection
against power supply transients.
If there is a possibility of lightning strikes, external surge protection devices - one for each pair of
signals and the power supply - should be installed as close to the 7829 meter as possible.
Another method of surge protection is to connect an MOV (Metal Oxide Varistor) (breakdown voltage
>30 V) with an NE-2 neon bulb in parallel across each wire and ground. These can be mounted in a
junction box close to the 7829 meter.
If the RS-485/Modbus output is permanently connected to a PC, an independently powered, fully
isolated RS-485 to RS-232 converter should be used. (See the Further information on RS-485 section
for details).
Installation and Configuration Manual 33
Page 40

Electrical Connections
HAZARDOUS AREA SAFE AREA
Viscosity meter
Power +
Power -
RS-485 A
RS-485 B
4-20 mA output 1 +
4-20 mA output 1 -
Power supply
(
20...28 Vdc at 50 mA)
+ 24V
0V
RS-485/232
converter
To RS-232 port on a PC running
ADView or ProLink II (v2.9 or later)
software f or monitoring,
mai ntenance and confi guratio n.
Analog o/p +
Analog o/p -
1
2
4
3
5
6
4-20 mA output 2 +
4-20 mA output 2 -
Analog o/p -
7
8
Analog o/p +
Passive outp uts
(see the 4-20 mA
outputs section for
more information)
4.2.6 Installation in explosive areas
For installations in hazardous areas:
• For ATEX installations, the electrical installation must strictly adhere to the safety
• For installations in USA and Canada, the electrical installation must strictly adhere to the
The 7829 meter is an explosion-proof and flameproof device. However, it is essential to observe the
rules of compliance with current standards concerning flameproof equipment:
• Electronics housing caps should be tightened securely and locked in position by their locking
screws.
• The electrical cable or conduit should have an appropriate explosion-proof cable gland fitted.
• If any electrical conduit entry port is not used, it should be blanked off using the appropriate
explosion-proof blanking plug, with the plug entered to a depth of at least five threads.
• The spigot must be locked in place.
information given in the ATEX safety instructions booklet shipped with this manual. See
Section 1.1 for important information.
Electrical Codes and a conduit seal is required within 2” (50 mm) of the enclosure.
Figure 4-1 Wiring diagram
34 Micro Motion 7829 Visconic Viscosity Meter
Page 41

Electrical Connections
Notes
1. The main 24 VDC power supply must supply the following: 20 to 28 VDC at 50 mA for
transmitter; and, 22 mA per analog output used.
2. The RS-485/232 converter and PC are not normally installed permanently. However it is
strongly recommended that the wiring to the 7829 meter is made at installation.
3. Upon leaving factory, the two analog outputs are non-isolated as they are powered through
internal links to Power Supply Input.
4. If split-pads “LNK A” (Analog Output 1) and “LNK B” (Analog Output 2) by the terminal
block are broken, the two 4-20 mA analog outputs become isolated; direct connections to an
external power supply is then required. A second or third external 20 to 28 VDC power supply
can be used. (See 4-20 mA outputs section for more details).
5. Typically, four pairs of shielded 19/0.30 mm
are used for wiring.
6. The naming conventions for RS-485 signals differ between manufacturers. If RS-485
communications do not function correctly, try swapping the ‘A’ and ‘B’ signals over at one end
of the link.
2
(#16 AWG) to 19/0.15 mm2 (#22 AWG) wires
Installation (Short Stem) Electrical ConnectionsInstallation (Long Stem)Introduction Installation (Short Stem) Electrical ConnectionsInstallation (Long Stem)Introduction Installation (Short Stem) Electrical ConnectionsInstallation (Long Stem)Introduction Installation (Short Stem) Electrical ConnectionsInstallation (Long Stem)Introduction
4.3 Wiring the meter
Figure 4-2 shows the terminal board of the 7829 Visconic viscosity meter. To reveal the terminal
board, it is necessary to unscrew the housing cap; the procedure is described in the Wiring Procedure
section.
Note: If the 7829 meter is to be used in hazardous areas, the electrical installation must strictly
adhere to the safety information given in the ATEX safety instructions booklet that shipped with this
manual. See also Section 1.1 for more safety information.
The connections to the 7829 meter are:
•Power
• Modbus (RS-485) communications
• Analog outputs (4-20 mA).
It is recommended that you install all connections (eight cores) at installation, to avoid the possibility
of expensive alterations to the cabling at a later date. Typically, four pairs of shielded 19/0.30 mm
(#16 AWG) to 19/0.15 mm
Figure 4-2 View of the terminal board
2
(#22 AWG) wires are used.
2
Installation and Configuration Manual 35
Page 42
Electrical Connections
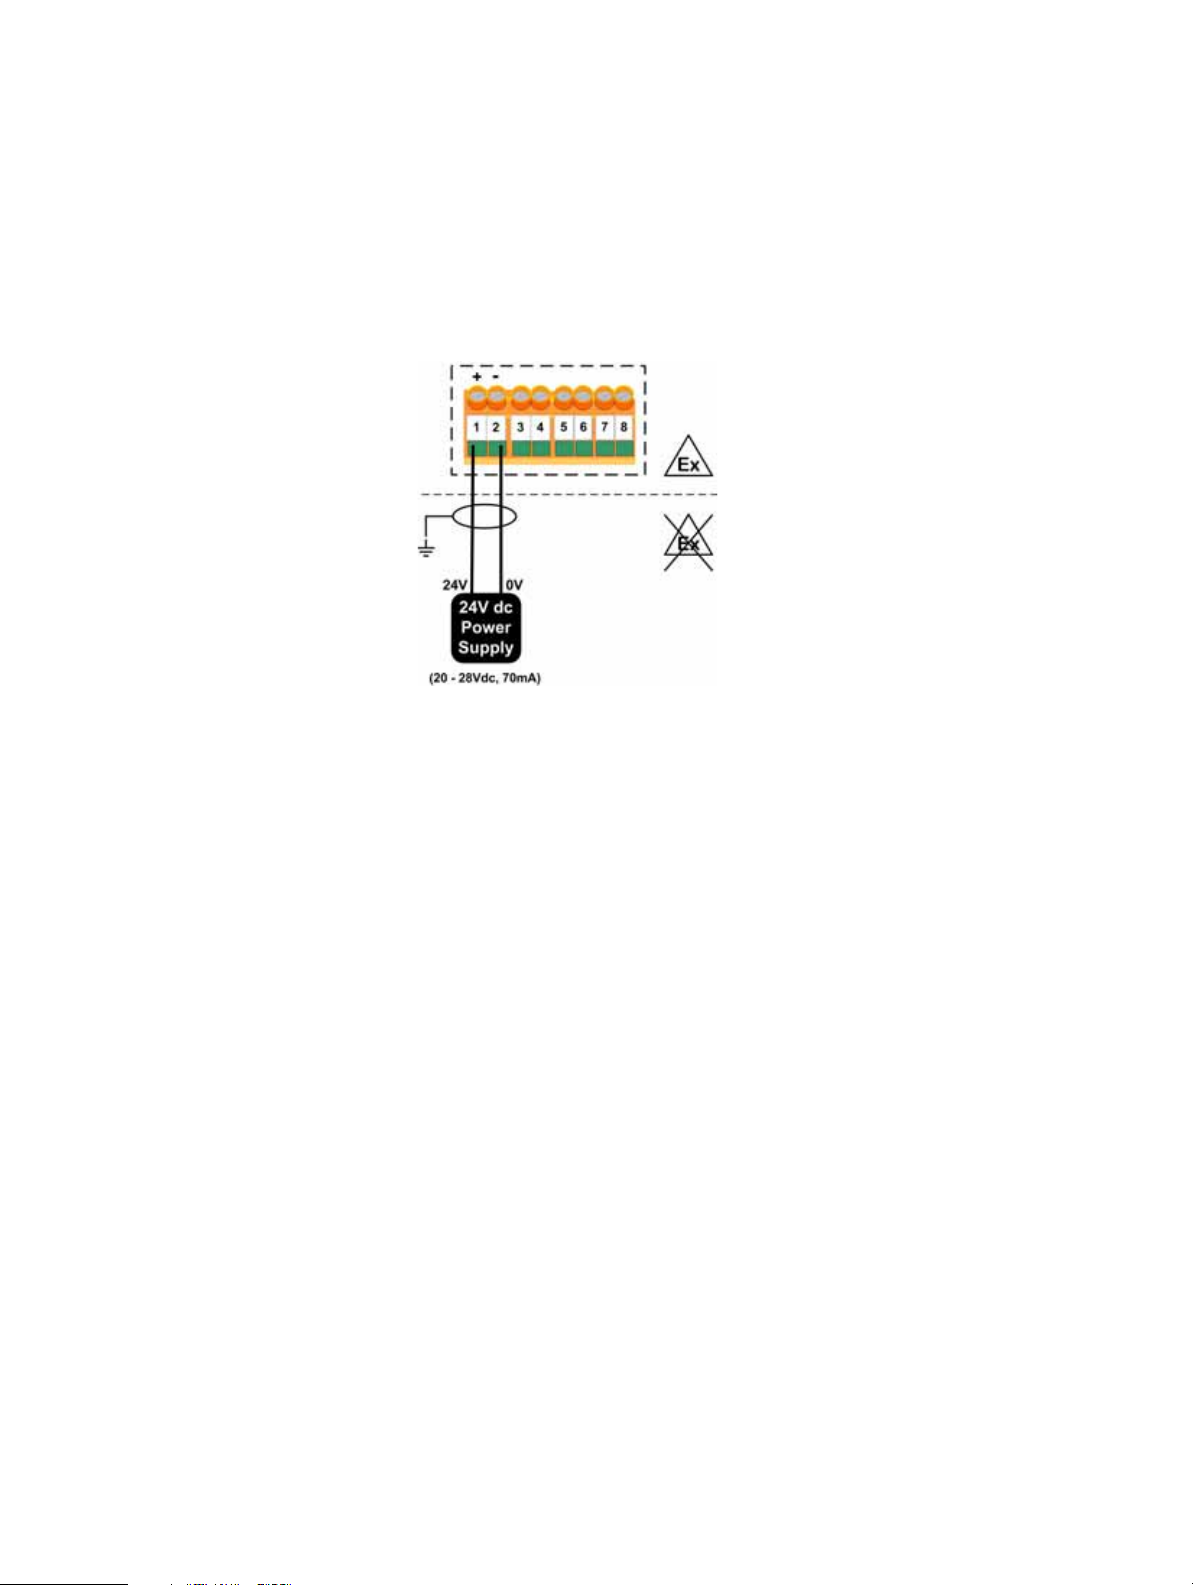
4.4 Power supply input
Terminals 1 and 2 are for connecting an external 24 VDC power supply, as guided in Figure 4-3.
Ensure that the loop resistance of the cable(s) is such that the voltage at the meter terminals is greater
than 20 volts. (The maximum voltage at the meter terminals is 28 VDC.)
Figure 4-3 Power supply connections
4.5 Modbus (RS-485)
Terminals 3 and 4 are for RS-485/Modbus connections to a PC, as shown in Figure 4-4. For cable
distances above 100 m, see the Further information on RS-485 section.
Note: The PC and converter are always located in a non-hazardous (safe) area.
The RS-485/232 converter and PC are not normally installed permanently. However it is strongly
recommended that the wiring to the 7829 meter is made at the time of installation.
For detailed information on RS-485, see the Further information on RS-485 section.
Note: If you encounter communication difficulties with RS-485, swap over the ‘A’ and ‘B’ signal
connections at one end of the network.
36 Micro Motion 7829 Visconic Viscosity Meter
Page 43

Electrical Connections
Terminal block version
9-pin DIN connector
version
OR
Figure 4-4 Modbus connections < 100 m
Installation (Short Stem) Electrical ConnectionsInstallation (Long Stem)Introduction Installation (Short Stem) Electrical ConnectionsInstallation (Long Stem)Introduction Installation (Short Stem) Electrical ConnectionsInstallation (Long Stem)Introduction Installation (Short Stem) Electrical ConnectionsInstallation (Long Stem)Introduction
4.6 4-20 mA outputs
Terminals 5, 6, 7 and 8 are for connecting the two 4-20 mA analog outputs to external devices, such
as a signal converter. Upon leaving the factory, the two 4-20 mA analog outputs are non-isolated as
they are powered through internal links to the Power Supply Input.
Installation and Configuration Manual 37
Page 44

Electrical Connections
Example split-pads
Non-isolated analog output
(default)
Connected to internal power
(split-pad with trace)
Isolated output
Disconnected from internal power
for external power connection
(split-pad with broken, or cut, trace)
Location of LNK A and LNK B split-pads
Figure 4-5 4–20 mA output using the main power supply
However, if split-pads “LNK A” (Analog Output 1) and “LNK B” (Analog Output 2) by the terminal
block are ‘broken’, they become isolated and require direct connections to another external
20–28 VDC power supply. A second or third external 20–28 VDC supply can be used.
To isolate the analog outputs from internal power, use a sharp knife to cut the fine metal strip (or
trace) for the appropriate split-pad (see Figure 4-6).
Figure 4-6 Isolating an analog output from internal power (for external power connection)
38 Micro Motion 7829 Visconic Viscosity Meter
Page 45

Electrical Connections
GRUB
Figure 4-7 4–20 mA output using a third power supply
Note: The external device must be located in a non-hazardous (safe) area unless it is explosion proof
and suitably certified.
Installation (Short Stem) Electrical ConnectionsInstallation (Long Stem)Introduction Installation (Short Stem) Electrical ConnectionsInstallation (Long Stem)Introduction Installation (Short Stem) Electrical ConnectionsInstallation (Long Stem)Introduction Installation (Short Stem) Electrical ConnectionsInstallation (Long Stem)Introduction
Fault conditions within the 7829 meter are indicated by a 2 mA output. If this is detected, the Modbus
link can be used to interrogate the meter to establish the likely cause of the problem.
4.7 Wiring procedure
1. Open the Terminal Board side of the
meter’s electronics housing by
undoing the 2.5 mm AF grub screw
and unscrewing the lid anticlockwise.
2. Fit the M20 gland adaptor into the
most convenient ½” NPT hole.
UNDO THIS CAP
SCREW
Installation and Configuration Manual 39
Page 46

Electrical Connections
a: ¾” NPT Blanking Plug.
b: ¾” NPT to M20 adaptor.
c: M20 cable gland.
VIEW FROM UNDERNEATH THE ELECTRONICS
3. Fit the M20 x 1 cable gland to the
4. Insert the cable through the cable
adapter. Fit a ½” NPT blanking plug to
the unused hole.
gland and adaptor so that the
multi-core cable is gripped leaving
200 mm of free, unscreened wire to
connect to the terminal blocks.
5. Wire up the cable cores as shown
6. When you have screwed the wires into
:
the correct terminals, carefully tuck
the wires around the electronics, and
tighten the cable gland.
TIGHTEN
CAP
7. Screw the housing cap on fully and
tighten the locking grub screw using
the 2.5 mm AF hex drive.
TIGHTEN
GRUB
40 Micro Motion 7829 Visconic Viscosity Meter
Page 47

Electrical Connections
4.8 Further information on RS-485
4.8.1 RS-485
The 7829 meter’s Modbus communications uses the RS-485 electrical standard. This uses the
difference between the two signal cores to transmit and detect logic levels, and is therefore able to
tolerate significantly higher levels of common mode noise than RS-232, which uses the voltage
between the signal core and a common earth. A brief summary of some typical characteristics of the
two standards is given below.
Signal detection Differential Single-ended
Receiver threshold 200 mV +1.5 V
Meter output swing 0 to +5 V (no load)
RS-485 RS-232
Installation (Short Stem) Electrical ConnectionsInstallation (Long Stem)Introduction Installation (Short Stem) Electrical ConnectionsInstallation (Long Stem)Introduction Installation (Short Stem) Electrical ConnectionsInstallation (Long Stem)Introduction Installation (Short Stem) Electrical ConnectionsInstallation (Long Stem)Introduction
± 8 V
+2 to +3 V (120 ohm load)
A converter is required for communication between the two standards. Further details are given in
Section 4.8.2.
Only two signal connections are required for RS-485, usually called A and B, sometimes ‘+’ and ‘–‘.
Note: Unfortunately, different manufacturers have interpreted the standard in different ways. Some
have a ‘logic 1’ represented by signal A being more positive than signal B, others have made the
opposite interpretation. If you encounter communication difficulties with RS-485, the first remedy is
to swap over the ‘A’ and ‘B’ signal connections at one end of the network.
For areas which may experience high common mode signals, a third conductor can be used as a
ground reference for the communications signals. If used, this should be connected to Terminal 2
(Power supply negative) on the 7829 meter.
4.8.2 RS-485 to RS-232
Converters are available from a number of sources, and can range from simple in-line devices that
simply plug into a PC’s RS-232 port, to programmable devices with full isolation between the two
networks.
Note: The 7829 meter uses a half-duplex implementation of RS-485, such that the A and B signals are
used for data transmission in both directions. This requires that the RTS line is toggled to indicate the
transmission direction. This can be done by the host computer, or automatically by an RS-485/232
converter which has the facility to do so. If you are using Windows NT, 2000 or XP on your PC, you
should use a converter which automatically changes RTS (as detailed below) otherwise the link may
not work correctly.
For simple installations, where the following conditions are valid, a simple in-line converter will be
satisfactory:
• The Modbus network is less than about 150 ft (50 m).
• The number of devices on the bus is low.
• No common mode problems.
Installation and Configuration Manual 41
Page 48

Electrical Connections
Micro Motion recommends the K2–ADE (Terminal Block type or DIN connector type) converter,
manufactured by KK Systems Ltd that will work with Windows 98, NT, 2000 and XP. This converter
is available through Micro Motion when you purchase the ADView software. The ADView software
package includes the latest Windows version of the software, plus a K2-ADE RS-485/RS-232
converter (Terminal Block version).
The K2-ADE converter derives its power from the PC’s RS-232 port RTS or DTR line, which must be
held permanently in the high state. This is normally adequate for short distances where there are only
a few devices on the network. However, the ability of the port to supply sufficient power is not
guaranteed, especially for laptop PCs, and it may be necessary to connect an external power supply.
This may also be necessary if using Windows NT, 2000 or XP.
To check the voltage levels, measure the voltages on the RTS input (pin 7) and the DTR input (pin 4)
while the converter is connected to the PC (or other RS-232 device). This procedure needs a
break-out box (not supplied). Whichever input is powering the converter must have at least +6 V
during communications. Where the power is found to be insufficient, a 9 VDC supply can be
connected between Pin 9 (+) and Pin 5 (GND) of the RS-232 connector. Connections are shown in
Figure 4-8. See also the manufacturer’s technical information for details.
Figure 4-8 Powering the converter with an external 9 VDC supply
For permanent installations and cables distances greater than 100 m
For permanent installations, and where the network length is more than 100 m or so, Micro Motion
can supply the following DIN-rail mounted device from KK Systems Ltd.
• KD485–ADE
The KD485–ADE is three-way isolated, providing isolation between the two ports and the power
supply. It requires a +7 to +35 V power supply and typically takes 1 to 2 W; (power consumption is
largely independent of supply voltage). It is capable of working with Windows 98, NT, 2000 and XP.
For a PC running Windows NT/2000/XP, the RTS connection can be omitted.
42 Micro Motion 7829 Visconic Viscosity Meter
Page 49

Electrical Connections
Port 1
RS232
Port 2
RS485
KD485-ADE
RS232 to RS485 Interface Converter/Isolator
Switch
Tx
Rx
Port 1 GND
RTS In
1
2
3
4
5
6
Power Input
+
-
7
8
6
5
4
3
2
1
Port 1 GND
TxB
TxA
RxB
RxA
Figure 4-9 Modbus connections > 100 m
The default configuration of the KD485-ADE has Port 2 configured for 9600 baud. This is the correct
baud rate for the 7829 meter. (See Section 4.8.4 for details).
Installation (Short Stem) Electrical ConnectionsInstallation (Long Stem)Introduction Installation (Short Stem) Electrical ConnectionsInstallation (Long Stem)Introduction Installation (Short Stem) Electrical ConnectionsInstallation (Long Stem)Introduction Installation (Short Stem) Electrical ConnectionsInstallation (Long Stem)Introduction
The switch on the KD485-ADE should be set with SW1 On (to enable half-duplex operation on Port
2), with the other three switches (SW2, SW3, SW4) set to Off.
Note: In most systems, the ground (GND) connection on pin 6 of port 2 will be unnecessary.
When two or more devices are connected on the same RS-485 network, this is known as a multi-drop
configuration (see Section 4.8.3). Each device must be configured with its unique slave address
before being installed on the network.
Installation and Configuration Manual 43
Page 50

Electrical Connections
KD485-ADE
Tx
Rx
RTS In
Port 1 GND
Power Input
1
2
3
4
5
6
7
8
-
+
6
5
4
3
2
1
Port 2
RS485
RxB
Port 2 GND
RxA
TxA
TxB
A
B
A
B
GND
GND
3
4
2
A
B
GND
3
4
2
4.8.3 RS-485 multi-drop
When several devices are connected in parallel on an RS-485 network, this is known as a multi-drop
network. Although it is theoretically possible to have up to 256 devices, in practice this is limited to
around 32 or less, depending largely on the driving power of the Master. Each device has a unique
slave address. For the 7829 meter, this address must be individually programmed using the ADView
or ProLink II (v2.9 or later) software, before being connected to the multi-drop network (see section
4.4.3 for details).
Wiring is quite straightforward: simply connect ‘B’ terminal to ‘A’ terminal, A to B. On some
devices, the RS-485 signals may be marked + and –. The + signal generally corresponds to the A
signal, and the – signal to B. If you encounter communication difficulties with RS-485, the first
remedy is to swap over the ‘A’ and ‘B’ connections at one end of the network.
4.8.4 Transmission mode
The 7829 meter’s RS-485 interface uses the following parameter settings, which are not selectable:
• Baud rate: 9600
• Bits: 8
• Parity: None
• Stop bits: 2
44 Micro Motion 7829 Visconic Viscosity Meter
Page 51

Chapter 5
Using ADView and ProLink II
5.1 Using ADView software
5.1.1 What is ADView?
ADView is a software package provided by Micro Motion to enable you to:
• Configure our density and viscosity meters.
• View and save data from them.
• Check that they are functioning correctly.
ADView is installed on a PC and interacts with the density/viscosity meter through one of the PC’s
standard serial (RS-232) ports.
ADView requires Microsoft’s Windows operating system: Windows 3.1, 95, 98, NT, 2000 or XP.
Note: To connect to an RS-485/Modbus device, such as the 7829 meter, you will need an adapter
between the PC and the meter (see Electrical Connections chapter).
ADView provides many useful facilities, such as:
• Setting up serial link to communicate with the meter
• Configuring the meter
• Displaying data in real time, or as a graph
• Logging data to a file
• Verifying correct operation of the system, and diagnosing faults
• Loading or storing Modbus register values
• Read/write to individual Modbus registers.
Calibration Check General MaintenanceUsing ADView and ProLink II
5.1.2 Installing ADView
ADView software is available for the PC on a variety of media (for example, CD-ROM) and is freely
available to download from the Micro Motion web site (at www.micromotion.com).
1. Identify the media containing the installation files for ADView.
2. Insert the media into an appropriate drive on your PC.
3. If the installation program does not begin automatically, run the set-up ‘.exe’ file that is on the
media. This does vary between different PC operating systems. In general, open the File
Manager or Windows Explorer, browse the drive containing the media and double-click on the
set-up ‘.exe’.)
Installation and Configuration Manual 45
Page 52

Using ADView and ProLink II
4. When the installation program starts, you will be asked to supply your name and company
name for registration purposes, and supply a directory path into which ADView’s files can be
loaded (a default directory path will be suggested).
5. Follow the installation instructions until installation is complete. It will normally only take a
few minutes. You can abandon the installation if you need to do so.
5.1.3 Starting ADView
Start the ADView software by navigating through the Start Menu to the program entry of ADView 6.
Left-click on it once and the window shown below will then appear.
Note: Developments in ADView may mean that the screen shots differ slightly from the ones you will see on
your PC screen.
Each of the six icons gives you access to the various facilities of ADView. You can choose to connect
a Modbus device to one of the PC’s serial ports, or you can use ADView’s built-in simulation of the
meter.
46 Micro Motion 7829 Visconic Viscosity Meter
Page 53

Using ADView and ProLink II
To run the simulation, choose Options > Simulate board response from the menu bar and choose
the appropriate densitometer option. Then, click on the
ADView screen. When simulation is chosen, ADView ignores the serial port and supplies simulated
data. However, you do still need to click on the
Connect button. Then, click on the OK buttons, as necessary, to return to the main ADView screen.
Setting up serial communications
To operate with a real Modbus device, you will need to connect it to a suitable power supply (see the
technical manual for the device) and need a connection to a serial port on the PC. Full details for
connecting to the Modbus (RS-485) link on the meter are in Chapter 4.
ADView automatically configures the selected port with the correct settings for the device. For the
meter, this is 9600 baud rate, 8 data bits, no parity, 1 stop bit, and Xon/Xoff (software) flow control.
Note for Windows NT users
An interesting feature of Windows NT is that it does not allow the RTS line to be toggled directly; any
attempt to do so will result in a crash or other problem. Unfortunately, some RS-485/232 converters
require RTS to be toggled. To overcome this difficulty, ADView reads the OS environment variable to
determine whether the operating system is Windows NT. If it is, ADView does not toggle RTS, and
you will need to use an RS-232/485 adapter which automatically switches the data direction without
using RTS.
To set the OS variable, click on the
System icon, and select the Environment tab. A list of environment variables and their values is
shown. If OS does not appear in the list, type ‘OS’ (no speech marks) in the
‘Windows_NT’ (no speech marks or spaces) in the Value box.
OK buttons, as necessary, to return to the main
Communications Setup button followed by the
Calibration Check General MaintenanceUsing ADView and ProLink II
Start button, then choose Settings > Control Panel. Click on the
Variable text box, and
To check whether the link is working, you can use ADView’s auto-detect facility. Select the correct
PC port, and then click on the
Connect button in the Communications dialog box. ADView will set
the port communications parameters, and then attempt to establish contact with any Modbus devices
connected to the serial link, within the address limits set in the dialog box.
Installation and Configuration Manual 47
Page 54

Using ADView and ProLink II
When it finds a device, the message box below appears:
If no active device is found, a warning message is given:
In this case, check that the device is powered up correctly, that the cables and adapter are pushed fully
home, and that the communications settings on the device and selected serial port are the same.
5.1.4 Understanding ADView features
ADView facilities
The main ADView window gives access to the various facilities available. A brief description of each
is listed below. Using the facilities is largely intuitive so that you can quickly learn the system.
Communications Setup
Sets up and checks RS-232/RS-485 communications.
Board Configuration
• Enables you to select the measured parameter and range for the analog output,
and to configure density referral by entering matrix values or K factors, as well
as special calculations, line pressure and averaging time.
• Displays instantaneous values of a selectable output parameter and the analog
output.
Data logging
• Provides tabular data from meters of line and base density, temperature and
special function. One parameter can be displayed as a graph.
• Data can also be logged to a file in either Excel (tab delimited) or Notepad
(space delimited) formats.
• The frequency at which results are logged can be set, and logging can be
started and stopped.
Register dump/load
With this facility you can dump the contents of all (or selected) Modbus registers
from the device, or alternatively transmit values to them. File format is selectable
(Excel/tab delimited, or Notepad/Space delimited).
48 Micro Motion 7829 Visconic Viscosity Meter
Page 55

Using ADView and ProLink II
Menu bar
Meter details
Shows a list of meter details such as type, serial number, calibration dates,
software version, etc.
Diagnostics
Enables you to view:
- live sensor readings
- the status of the meter
- values of working coefficients
You can also verify calculations.
File
Tools
Options
Window
Help
Exit Exit ADView program.
Health Check Determines whether the system is functioning correctly.
Register Read/Write A facility for reading or writing to any of the Modbus
Direct Comms. Enables you to specify exactly what will be transmitted on
Engineer Status Only used by Micro Motion service engineers.
Simulate board response/
Actual Board
Enable / disable screensaver Allows you to select between these two options. When
About ADView Displays software version number.
registers (see Appendix D).
the Serial link (see Appendix D).
Allows you to select between these two options
enabled, the screensaver operates as configured by the
Windows system settings.
Provides a means of opening or selecting ADView’s
facilities.
Configuring a slave address
The factory configuration sets the slave address to 1. However, in many applications it will be
necessary to allocate another address. In a multi-drop application, where several Modbus devices are
connected on the same network, it is essential to configure unique slave addresses for each device.
To do this, you will need to run ADView and use the Register Read/Write facility, detailed in
“Register Read / Write” on page 52. Check the value in Register 30 (Modbus Slave Address). If it is
not the required value, enter the desired value and click on the write button. The meter will now be
configured with the new slave address.
Calibration Check General MaintenanceUsing ADView and ProLink II
Board configuration
The board configuration controls the way in which the meter will process and present data, user
settings, calibration constants and other factors. This data is stored in non-volatile memory known as
registers; a full list of the registers used in the meter is given in Appendix D.
To configure the meter, it is necessary to write data into the configuration registers using the
RS-485/Modbus link. ADView provides a convenient and graphical way of doing this without you
needing to know about register addresses and data formats.
Installation and Configuration Manual 49
Page 56

Using ADView and ProLink II
Certain parameters are not available for configuration by ADView, including the Density Offset value
which may be required to fine tune the calibration of the meter. However, ADView does have tools for
reading and writing to individual Modbus registers (using the
and for direct communication on the Modbus (using
examples are given in Appendix D, but for the significant majority of applications these tools will not
be required.
There is no facility within ADView or the meter to ‘reset’ to a default configuration. Therefore,
before attempting any alterations to the configuration, you are strongly advised to use the
Register Dump/Load facility in ADView to store the existing configuration (see “Register Dump /
Load” on page 52). Then, if any mishap occurs, you will be able to restore the configuration from
the saved file.
ADView’s Board Configuration window is shown below:
Tools > Register Read/Write facility),
Tools > Direct Comms). More details and
To exit from any of the configuration windows without making any changes, press the
Esc key on
your computer keyboard.
Density referral (Configure… button)
To configure the density referral calculation, you will need to enter the relevant information.
•For matrix referral, this is a set of four values of density for each of up to five different
temperatures; Appendix B gives more details on this.
•For API referral, you can select the product type, which automatically adjusts the coefficients
of the General Density Equation (see Section 6.1.5), or enter your own values.
Special function (Configure… button)
The range of special functions (calculated parameters) that are available depends on the referral type
selected.
50 Micro Motion 7829 Visconic Viscosity Meter
Page 57

Using ADView and ProLink II
The Log Setup button – which is
activated when logging has been
stopped – enables you to configure
the frequency of logging, where the
logged data will be filed, and the
format of the data.
Display Selection dropdown
list to select the transmitter
and parameter to be displayed
on the graph
For selecting the
parameter to be
Click Show Graph
to configure and
display graph
For multi-drop
configurations, the
output of up to three
transmitters can be
displayed
simultaneously.
Tabular display of
instantaneous
output of
transmitter.
Select analog
output of another
transmitter.
Click OK to close
Data Logging window
Graphical
representation of
analog output.
Click Start to
start logging.
Click Stop to stop
logging
Special Function API referral Matrix referral
Specific Gravity ✓✓
API° ✓
% mass ✓
% volume ✓
° Baumé ✓
° Brix ✓
User defined quartic ✓
None ✓✓
When you select the Special Function you require, the configuration window will alter to allow you to
input the relevant parameters, if applicable. Note that you can only select one Special Function to be
available at any one time.
When you are satisfied with the configuration, you should save it to a file, using the
Dump/Load
facility, as a safeguard against subsequent loss or alteration.
Calibration Check General MaintenanceUsing ADView and ProLink II
Register
Data logging
ADView’s Data Logging function is a useful tool for checking setups and performing experimental
data capture. The diagram below explains some of the features.
Installation and Configuration Manual 51
Page 58

Using ADView and ProLink II
Address of unit
being accessed
Enter desired filename
for Dump, or required
filename for Load.
Choose which sets of
registers to save to file,
or simply save all of
them.
You can also specify
individual registers.
Choose data delimiter
(Dump only)
Restore a previously
saved set of register
data from file.
Store the selected
register data to a file.
Register Dump / Load
This facility is essential for saving the configuration of your meter. You should use it to save the
current configuration before you start to alter it, in order to restore it if things go wrong for any
reason. Also, if you send the meter away for servicing or re-calibration, you should save the current
configuration. Details are given below.
Register Read / Write
In a few cases, it may be useful to write directly to a single Modbus register. Two likely occasions for
using this feature are to set the Slave Address of the unit and to configure a density offset.
Appendix B has a complete list of the registers.
Before making any changes to individual registers, you should save the current configuration to
a file to safeguard your configuration if anything goes wrong. See “Data Logging” for more
information.
From ADView’s menu bar, select
Tools > Register Read/Write.
52 Micro Motion 7829 Visconic Viscosity Meter
Page 59

Using ADView and ProLink II
To see a complete list of
Modbus register numbers
and descriptors, click
here.
Choose the one you want
to access.
For non-numerical
values, click here to see
complete list of possible
entries and select one to
write into the register.
Enter numerical values
directly.
The Write button
causes the current
value to be written to
the selected register.
You can read and write to any
number of registers. When you
have done all you want to, click
OK.
The Read button
causes the current
value of the chosen
register to be
displayed.
The current
register number
appears here.
Calibration Check General MaintenanceUsing ADView and ProLink II
5.2 Using ProLink II software
5.2.1 Overview
ProLink II is a Windows-based configuration and management tool for Micro Motion meters. It
provides complete access to meter functions and data.
This chapter provides basic information for connecting ProLink II to your meter. The following topics
and procedures are discussed:
• Requirements (see Section 5.2.2)
• Configuration upload/download (see Section 5.2.4)
The instructions in this manual assume that users are already familiar with ProLink II software. For
more information on using ProLink II, see the ProLink II manual.
5.2.2 Requirements
To use ProLink II with a 7829 Visconic viscosity meter, the following are required:
• ProLink II v2.9 or later
• Signal converter(s), to convert the PC port’s signal to the signal used by the meter
- For RS-485 connections, an RS-485 to RS-232 signal converter.
- 25-pin to 9-pin adapter (if required by your PC)
Installation and Configuration Manual 53
Table 1-1 describes the options for connecting ProLink II to your meter.
Connection Physical layer Protocol
RS-485 terminals or RS-485 network RS-485 Modbus
5.2.3 Connecting from a PC to a meter
Page 60

Using ADView and ProLink II
5.2.4 ProLink II configuration upload/download
ProLink II provides a configuration upload/download function which allows you to save configuration
sets to your PC. This allows:
• Easy backup and restore of meter configuration
• Easy replication of configuration sets
Micro Motion recommends that all meter configurations be downloaded to a PC as soon as the
configuration is complete.
To access the configuration upload/download function:
1. Connect ProLink II to your meter.
2. In the ProLink II software application, open the
• To save a configuration file to a PC, use the
File menu.
Load from Xmtr to File option.
• To restore or load a configuration file to a meter, use the
5.2.5 ProLink II language
ProLink II can be configured for the following languages:
• English
•French
•German
To configure the ProLink II language, choose
Tools > Options.
In this manual, English is used as the ProLink II language.
Send to Xmtr from File option.
54 Micro Motion 7829 Visconic Viscosity Meter
Page 61

Chapter 6
Calibration Check
6.1 Calibration
6.1.1 Factory calibration
Prior to leaving the factory, the 7829 Visconic viscosity meter is calibrated within a standard physical
boundary (typically 52.5 mm diameter) against Transfer Standard instruments traceable to National
Standards.
3
Three fluids ranging in density from 1 to 1000 kg/m
constants K0, K
derived from the air-point and material properties.
The calibration procedure relies on units being immersed in fluids whose density is defined by
Transfer Standards. Great attention is paid to producing temperature equilibrium between the fluid,
the unit under test and the Transfer Standard (see Section 6.1.2). In this way, accurate calibration
coefficients covering the required density range can be produced.
Viscosity calibration is achieved using three fluids (or four for the 0 – 10 cP range) with different
calibrated viscosity values to derive the three general viscosity equation coefficients V0, V1, and V2
(see Section 6.1.4.)
All instruments are over-checked on water to verify the density calibration, and with two different
fluids to check the viscosity calibration. This check is monitored by the Micro Motion Quality
Assurance Department.
6.1.2 Calibration of Transfer Standards
The Transfer Standards for viscosity calibration are fluids which have been accurately measured
within the Micro Motion Standards Laboratory. For density calibration, Transfer Standard
instruments used in the calibration are selected instruments which are calibrated by the British
Calibration Service Calibration Laboratory and are certified.
Transfer Standard calibration uses a number of density-certified liquids, one of which is water. The
densities of these reference liquids are obtained using the Primary Measurement System whereby
glass sinkers of defined volume are weighed in samples of the liquids.
Calibration of the Transfer Standard instruments is performed under closely controlled laboratory
conditions and a calibration certificate is issued. Calibrations are repeated, typically every six
months, producing a well-documented density standard.
1, and K2 (see Section 6.1.5). The temperature coefficients (K18 and K19) are
are used to establish the general density equation
Calibration Check General MaintenanceUsing ADView and ProLink II
Installation and Configuration Manual 55
Page 62

Calibration Check
6.1.3 Instrument calibration
Each meter is issued with its own calibration which is programmed into the instrument electronics
before it leaves the factory. Under normal circumstances it should not be necessary to re-calibrate the
7829 meter provided it is used in the environment for which it was calibrated originally.
The calibration data is shown on a calibration certificate supplied with the instrument. The calibration
contains the following:
• The instrument serial number
• Four typical points in the output signal Quality Factor / Viscosity relationship, across the
• Several sample points from the output signal/density relationship. These have been calculated
• Temperature coefficient data, K18 and K19; this defines the correction which should be
• One instrument air (density) data point for check calibration purposes.
The values for all the V and K coefficients shown on the calibration certificate are programmed into
the 7829 meter’s registers, and should not be altered.
meter’s operating range. This relationship is using the general viscosity equation coefficients,
which are also listed.
using the general density equation with the calibrated coefficients listed.
applied to achieve the best density accuracy if the instrument is operating at product
temperatures other than 20 °C.
Note: If the 7829 meter is used in an application dissimilar to the one for which it was originally
calibrated, it may be necessary to re-calculate the V and K coefficients. Contact Micro Motion for
further details.
6.1.4 General viscosity equation
The General Viscosity Equation, used to calibrate the 7829 meter and shown in the Calibration
certificate is:
η = V0 + V1 / Q
2
+ V2 / Q
4
where η is the calculated viscosity, Q is the quality factor of the tuning fork, and V0, V1 and V2 are
viscosity coefficients, derived from the factory calibration data and selected to optimise the accuracy
of the viscosity measurement across the calibrated viscosity range for the known physical conditions.
6.1.5 General density equation
The General Density Equation, used to calibrate the 7829 meter and shown in the Calibration
certificate is:
ρ = K0 + K1τ + K2τ
2
where ρ is the calculated density, τ is the time period (in μs) of the tuning fork, and K0, K1 and K2
are density coefficients, derived from the factory calibration data and selected to optimise the
accuracy of the density measurement across the calibrated density range.
Temperature effects are also compensated for using a second equation:
ρ’ = ρ( 1 + K18(t - 20)) + K19(t - 20)
where ρ’ is the new (temperature compensated) density value, t is the measurement temperature, and
K18 and K19 are temperature correction coefficients.
56 Micro Motion 7829 Visconic Viscosity Meter
Page 63

Calibration Check
example
example
CALIBRATION CERTIFICATE
7829FDAAAFFCBA VISCOMETER SERIAL NO : 294711
CAL DATE : 10MAR09
PRESSURE TEST : 29 Bar
VISCOSITY CALIBRATION @ 20°C (3" Schedule 40)
VISCOSITY QUALITY VISCOSITY = V0 + V1.1/Q**2 + V2.1/Q**4
(cP) FACTOR
10.17 287.58 INSTRUMENT CHECK DATA
53.04 132.12
107.18 93.10 AIR POINT (20°C) QUALITY FACTOR =5059
539.85 40.91
1074.84 28.67
LOW RANGE MEDIUM RANGE
(10.17-107.18) (107.18-1074.84)
V0 = -1.41059E+00 1.59848E+00
V1 = 9.59694E+05 9.18568E+05
V2 = -1.60419E+08 -3.00196E+07
DENSITY CALIBRATION @ 20°C (3" Schedule 40)
DENSITY TIME PERIOD B DENSITY = K0 + K1.TB + K2.TB**2
(kg/m³) (usec)
K0 = -2.75472E+03
0 522.622 K1 = 4.60227E-01
(Air 522.518) K2 = 9.20500E-03
300 551.611
500 570.154 Dt = D( 1 + K18(t-20) ) + K19(t-20)
800 596.932
1000 614.161 K18 = -4.424E-04
1600 663.265 K19 = -1.138E+00
VISCOSITY CORRECTION DATA
Dv = Dt + (KV4 + KV5.1/Q**2 + KV6.1/Q**4)
MEDIUM RANGE
KV4 = -2.10470E+00
KV5 = 4.54024E+03
KV6 = 1.12338E+07
--------------
where D = Density (uncorrected) | FINAL TEST & |
Dt = Density (temperature corrected) | INSPECTION |
Dv = Density (temp and viscosity corrected) | |
TB = Time period B (uS ) | |
Q = Quality Factor | |
t = Temperature (°C) --------------
Ref No:- LV7827/V6.2 DATE : 11MAR09
6.2 Calibration certificate example
Note: This is an example only - it is NOT the calibration certificate for your 7829 meter.
Calibration Check General MaintenanceUsing ADView and ProLink II
Installation and Configuration Manual 57
Page 64

Calibration Check
6.3 User calibration checks
6.3.1 Ambient air calibration check
An air check is a simple and convenient method to see if any long term drift or corrosion and
deposition on the tines has occurred.
Ambient air check procedure:
1. Isolate and, if necessary, disconnect the meter from the pipeline.
2. Clean and dry the wetted parts of the meter and leave them open to the ambient air.
3. Apply power to the instrument and check that the time period of the instrument agrees with the
figure shown on the calibration certificate to within ±100 ns. If the 7829 meter is not at 20°C,
compensate for this by adding an offset of +110 ns for every °C above 20°C, or by subtracting
an offset of +110 ns/°C below 20°C.
4. Re-fit the meter to the pipeline if serviceable or remove for further servicing.
6.3.2 On-line calibration adjustment
An on-line calibration adjustment may be required if:
• The physical boundary surrounding the tines is different from the physical boundary used for
the factory calibration.
• The unit has suffered long term drift or corrosion of the tines.
The 7829 meter is a very accurate and stable instrument, and will normally provide good
measurements. If it is suspected of giving incorrect results, you should confirm this by carefully
checking the integrity of the fluid temperature measurement, and compare this with the temperature
measurement given by 7829 meter. You should also verify the integrity of the density check
measurement. It is only after you have eliminated all other possible causes of error that you should
attempt to make adjustments to the calibration of 7829 meter.
Normally the density calibration adjustment is made by configuring a simple density offset into the
instrument. If a more detailed calibration adjustment is required, such as a two- or three-fluid
calibration adjustment for offset and scale, then refer to Micro Motion.
Calibration adjustment - stable liquids:
1. Using ADView (see “Using ADView software” on page 45), reset the line density offset
(register 173) to 0, and the line density scaling factor (register 174) to 1.
2. Ensure that the system has reached its stable operating temperature.
3. With the 7829 meter operating at typical process conditions, draw off a sample of the liquid
into a suitable container, and note the 7829 meter density reading and the operating
temperature.
4. Measure the density of the sample under defined laboratory conditions using a hydrometer or
other suitable equipment. Refer this to the operating conditions at the meter.
5. Calculate the density offset required to make the 7829 meter measurement the same as the
measured density of the sample.
6. Using ADView’s Register Read/Write tool, configure the 7829 meter with the calculated line
density offset (Register 173).
58 Micro Motion 7829 Visconic Viscosity Meter
Page 65

Calibration Check
Calibration adjustment - unstable or high vapor pressure liquids:
A pressure pyknometer and its associated pipework can be coupled to the pipeline so that a sample of
the product flows through it.
1. Using ADView (see “Using ADView software” on page 45), reset the line density offset
2. Ensure that the system has reached its stable operating temperature.
3. When equilibrium conditions of product flow are reached, note the 7829 meter density reading
4. Remove the pyknometer for weighing to establish the product density.
5. Compare the pyknometer reading with the 7829 meter reading and compute the density offset
6. Using ADView’s Register Read/Write tool, configure the 7829 meter with the calculated line
For further details on these procedures, reference should be made to:
(register 173) to 0, and the line density scaling factor (register 174) to 1.
and temperature and simultaneously isolate the pyknometer from the sample flow.
required.
density offset (Register 173).
Calibration Check General MaintenanceUsing ADView and ProLink II
Energy Institute: HM7. Density, sediment and water. Section 1: General
guidance on test methods (formerly PMM Part VII, S1)
1st ed 1996 ISBN 978-0-85293-154-7
Energy Institute: HM8. Density, sediment and water. Section 2: Continuous
density measurement (formerly PMM Part VII, S2)
2nd ed Sept 1997 ISBN 978-0-85293-175-2
American Petroleum Institute: Manual of Petroleum Measurement Standards
Chapter 14 - Natural Gas Fluids - Section 6: Installing and
proving density meters used to measure hydrocarbon liquid
with densities between 0.3 and 0.7 g/cc at 15.56°C (60°F)
and saturation vapour pressure, April 1991.
Installation and Configuration Manual 59
Page 66

Calibration Check
60 Micro Motion 7829 Visconic Viscosity Meter
Page 67

Chapter 7
General Maintenance
7.1 Overview
Care is essential in handling of the meter during its removal from and fitment to the pipeline/tank and
during transportation. Wherever possible, retain and use the original packaging.
The 7829 Visconic viscosity meter is rugged and robust, and has no moving parts. When correctly
installed and operated, servicing is not normally required, even with poor quality fluid, and no
periodic maintenance procedure is specified. It is recommended that a visual inspection is carried out
at intervals to check for leaks and physical damage, and corrective maintenance carried out when
required.
ADView’s Data Logging facility can be used whenever necessary to verify that the meter is
functioning correctly.
Calibration Check General MaintenanceUsing ADView and ProLink II
Check calibrations should be carried out at specified intervals in order to identify a malfunction or
deterioration in meter performance. If a fault or a drop in performance is detected, further tests are
required to identify the cause of the fault. Remedial action is limited to cleaning the meter tines,
making good any poor connections, and replacing the internal electronics. In the extreme cases the
complete meter may need to be replaced.
Note: The electronics within the 7829 meter contain calibration information relevant to that
particular meter only. The circuit boards operate as a pair, and therefore both boards must be
changed together. Contact Micro Motion for more details if you need to change the boards.
7.2 General maintenance
No periodic maintenance procedure is specified, but the following procedure is recommended for
periodic inspection. It can also be used when fault finding.
7.2.1 Physical checks
1. Examine the meter, its electronics housing and cables for any signs of damage and corrosion.
2. Make sure that the spigot connection is tight.
3. Check the meter for sign of leakage.
4. Check that there is no ingress of water/fluid into the electronics housing.
5. Ensure that the threads on the covers are well greased (graphite grease) and that the ‘O’ rings
are in good condition.
Note: The covers MUST be completely screwed down and, in the case of an explosion-proof enclosure
application, DO NOT FAIL to tighten the locking screws.
Installation and Configuration Manual 61
Page 68

General Maintenance
7.2.2 Electrical check
1. Check the power supply and current consumption at the meter terminals, pins 1 and 2, having
disconnected all analog outputs. These should give 35 mA to 42 mA at 22.8 V to 25.2 V.
If the current consumption is outside this range, contact Micro Motion.
7.2.3 Performance check
When several systems are run in parallel and use the same fluid source, comparison of the line
viscosity, base density and temperature readings between installations can be a useful indicator of
possible system faults. Differences between readings, or changes from the normally observed
conditions should always be investigated to confirm that instrumentation is functioning correctly.
7.2.4 Calibration check
1. Carry out a check calibration as detailed in the Calibration Check chapter.
2. Compare the results obtained with the previous calibration figures to identify any substantial
deterioration in meter performance or any malfunction.
Note: A drop in meter performance is likely due to a build up of deposition on the tines which can be
removed by the application of a suitable solvent. See Mechanical Servicing below.
Note: Malfunctions generally could be the result of electrical/electronic faults in either the meter or
the readout equipment. Always check the readout equipment first before attention is directed to the
meter.
7.3 Fault analysis and remedial action
A fault may be categorized as either an erratic reading or a reading which is outside limits.
Electrical faults can also cause symptoms which appear to affect the readings and it is recommended
that the electrical system is checked first, before removing the meter for servicing.
7.3.1 Troubleshooting faults
Table 7-1 Faults and possible causes
Fault Possible causes Remedy
Readings fluctuate slightly,
i.e., are noisy
Erratic readings One or more of:
Readings outside limits Deposition and/or corrosion on
Analog output averaging time
not long enough
Gas bubbles around tines;
cavitations; severe vibration or
electrical interference; large
amount of contaminants
the tines.
Increase the averaging time using ADView’s
Board Configuration facility (see the Using
ADView and ProLink II chapter).
Remove primary cause; e.g.:
-install air release units to release gas;
-apply back pressure to discourage formation
of bubbles;
-remove cause of vibration
Alternatively, it may be necessary to adjust
the Time Period Trap.
Clean tines.
62 Micro Motion 7829 Visconic Viscosity Meter
Page 69

General Maintenance
Table 7-1 Faults and possible causes continued
Fault Possible causes Remedy
Analog output = 0 mA No power to analog output If voltage across pins 5 and 6 is not 15 to
Analog output is 2 mA Alarm condition caused by
28 V, replace power supply.
Analog output circuit failure Use ADView’s facility to set the analog output
to 4, 12 or 20 mA (in Board Configuration) to
check whether the output is functioning. If not,
replace circuit boards.
If voltage across pins 1 and 2 is not 20 to
lack of power to 7829 meter
Alarm condition caused by
other internal failure
28 V, check and replace main power supply.
Use ADView Diagnostics to check that phase
locked loop is in lock.
Temperature readings
incorrect
Viscosity reads high during
normal running
Viscosity reads high after
engine shutdown or restart
7829 meter does not
communicate with ADView
If analog output and Modbus
appear to be functioning
correctly, the temperature
sensor has probably failed.
Flow rate too low Increase flow or change to smaller
Insulation defective Repair or replace insulation
PFA laminate damaged,
leading to coating of fork tines
Calibration data is corrupted Compare calibration data to certificate or
Pump coated with aspaltenes. Check pump delivery; service pump.
Bypass not fully closed. Close bypass.
PFA laminate damaged,
leading to coating of fork tines
Calibration data is corrupted Compare calibration data to certificate or
Power failure to 7829 meter Check power supply to 7829 meter and
Power supply to RS-485/232
converter failed.
A and B Modbus connections
reversed
RS-485/232 converter failed,
wired incorrectly, or connected
the wrong way round
ADView incorrectly installed
on PC
Incorrect Slave address
chosen for 7829 meter
RS-232 port on PC failed. Connect to another free RS-232 port on the
Return the meter to Micro Motion for
servicing.
flow-through chamber
Remove 7829 meter for visual check; return to
Micro Motion for servicing.
stored configuration. Reprogram as
necessary.
Remove 7829 meter for visual check; return to
Micro Motion for servicing.
stored configuration. Reprogram as
necessary; return to Micro Motion for
servicing.
converter; replace if necessary
Check wiring
Check wiring
Try another converter
Re-install ADView
Check slave address
PC, if available.
Calibration Check General MaintenanceUsing ADView and ProLink II
Alternatively connect a known working
RS-232 device to the PC to check that the
port is working.
Installation and Configuration Manual 63
Page 70

General Maintenance
7.3.2 Mechanical servicing
This mainly comprises the cleaning of any deposition or corrosion from the tines. Deposition is
removed by the use of a suitable solvent. For corrosion, solvent and the careful use of a fine abrasive
will usually be sufficient. Take care not to damage the PFA lamination if installed. However where
extensive corrosion has been treated, it is highly recommended that a full calibration is carried out to
check the meter characteristics.
Care is essential in handling the meter during transit, installation, and removal from the pipeline/tank.
7.3.3 Time period trap
Disturbances in the fluid caused by bubbles, cavitations or contaminants can cause sudden changes in
the measured output, which may, under some circumstances, give rise to instability (i.e. hunting) in a
control system relying on the measurement. The 7829 meter can maintain the analog output during
such perturbations by ignoring the aberrant measurement, and maintaining the output at the last good
measured value. This facility is known as the Time Period Trap (TPT).
Under all normal circumstances, the factory settings for the TPT should be used. However, in extreme
cases it may be necessary to alter the settings to meet the demands of a particular system. This should
only be done after monitoring the behavior of the system for some time, to establish the normal
running conditions.
Great care must be taken not to reduce the sensitivity of the meter so that normal response to
fluctuations in the fluid is impaired.
The time period trap facility works as follows:
After each measurement of the time period (of the 7829 meter’s vibrating tines) the new value is
compared with the previous value. If the difference between them is smaller than the allowable
tolerance, the output is updated to correspond to the new measured value, and the TPT remains
inoperative; i.e., operation is normal. If the difference exceeds the allowable tolerance, the output
remains at the its previous level, and does not follow the apparent sudden change in value.
This process is repeated until either of the following:
• The latest measured value falls back to the level of the original value, indicating that the
transient has passed; or
• The TPT count is reached. At this point it is assumed that the change in value is not due to a
random disturbance, and the output adopts the value of the latest reading.
Two Modbus Registers control the operation of the Time Period Trap facility. These can be changed,
if necessary, using ADView’s Register Read/Write facility.
• Modbus Register 138: contains the maximum allowable change in the time period between
readings, specified in μs. The preset value is 10.
64 Micro Motion 7829 Visconic Viscosity Meter
Page 71

General Maintenance
• Modbus Register 137: contains the Time period count, which is the maximum number of
measurements to be rejected before resuming normal operation; the preset value is 2. If the
value is set to 0, TPT is disabled, and the output will always follow the time period
measurement. If you want to program another value, it should be determined experimentally,
and be equal to the length of the longest undesirable transients which are likely to arise. If the
value is set too high, the meter will be slow to respond to genuine changes in the fluid
properties.
Calibration Check General MaintenanceUsing ADView and ProLink II
Installation and Configuration Manual 65
Page 72

General Maintenance
66 Micro Motion 7829 Visconic Viscosity Meter
Page 73

Appendix A
Factory Default Settings
A.1 Default configuration for analog outputs
The 7829 meter is supplied in a standard configuration. Analog Output 1 is set to provide line
kinematic viscosity, in cSt. Analog Output 2 is set to provide line temperature, in °C. (Other units are
3
kg/m
for density and °C for temperature; API base density derivation is also configured.)
The complete set of default values are shown below.
Table A-1 Default configuration for analog outputs
Parameter Factory default value
Analog Output 1
Variable Line dynamic viscosity
Units CP
Factory Default Settings
Calculated Parameters Modbus Communications
Analog Output 2
Alarms
Alarm user range
Viscosity referral
4mA setting 0
20mA setting 100
Variable Line temperature
Units °C
4mA setting 0
20mA setting 100
Coverage General system
Analog output
User range
Hysteresis 2%
Variable Line dynamic viscosity
Units cP
Low setting 0
High setting 100
Base or referral temperature 50° C
ASTM D341 temperatures T1 and T20° C
Safety Certification
ASTM D341 viscosities V1 and V2 0 cSt
Density calculations
Installation and Configuration Manual 67
Temperature units ° C
Page 74

Factory Default Settings
Table A-1 Default configuration for analog outputs continued
Parameter Factory default value
Temperature offset 0
Pressure units bar
Pressure set value 1.013
Line density units kg/m
Line density scale factor 1
Line density offset 0
3
Matrix referral
API referral
Special Functions
Reference temperatures All 20
Reference densities All 0
Base temperature 20
Product type General refined
User K0 +0000E+00
User K1 +0000E+00
Base temperature 15
Base pressure 1.013
Type None
Name 0 (None)
Units None
Density of water (d) 998.2
Density of Product A 0
Density of Product B 0
Quadratic coefficients (A,B,C) 0
Output averaging time
Modbus
Slave address 1
Byte order Big Endian
Register size 16 bit
Hardware type
68 Micro Motion 7829 Visconic Viscosity Meter
1s
Advanced fork
Page 75

Appendix B
ρ
η
ν
=
Calculated Parameters
B.1 Overview
The 7829 Visconic viscosity meter is capable of calculating a number of parameters based on the
measured line dynamic viscosity, density and temperature. These calculated parameters are often
referred to as ‘special functions.’ Only one calculated parameter is available at any one time; it can be
used to control the analog (4-20 mA) output, and can also be accessed as a digital value (Modbus
Register 260).
This section describes the algorithms used in these calculations.
The availability of the calculated parameters is dependent on whether Matrix or API is chosen as the
density referral method.
Factory Default Settings
Calculated Parameters Modbus Communications
Special Function API referral Matrix referral
Specific Gravity
API°
% mass
% volume
° Baumé
° Brix
User defined quartic
None
B.2 Kinematic viscosity
Kinematic viscosity is defined as:
where
• ν = kinematic viscosity (cSt)
• η = dynamic viscosity (cP)
• ρ = density (Kg/m
99
9
9
9
9
9
9
99
3
)
Safety Certification
The 7829 meter is able to compute kinematic viscosity directly from its continuous measurements of
dynamic viscosity and density; it does not rely on a pre-configured 'typical' value of density to
calculate this parameter.
Installation and Configuration Manual 69
Page 76

Calculated Parameters
ν 0.7+()loglog A B Tlog–=
Temperature
Density
T
5
T
4
T
3
T
2
T
1
D1D2D3D
4
Line Temperature
(measured)
Line Density ρ
(measured)
Base (Referred)
Density ρ
B
(calculated)
B.3 Base kinematic viscosity referral using ASTM D341
Base kinematic viscosity is the viscosity of the fluid at a specified base (or referral) temperature
which is different to the line (i.e., the actual) temperature of the fluid. Base viscosity can be
calculated using the kinematic–viscosity–temperature charts covered by the ASTM D341 standard.
The base kinematic viscosity of a petroleum oil or liquid hydrocarbon can be determined at any
temperature within a limited range, if the kinematic viscosities at two temperatures are known.
The ASTM D341 standard charts use the following equation:
where
• ν = kinematic viscosity (cSt)
•
Τ
= temperature (deg K)
• A and B are constants for the liquid (defined by the ASTM tables)
The 7829 meter can be programmed with up to four ASTM curves that allow viscosity referral over a
wide operating range. A ratio technique is employed when operating between the ASTM curves.
B.4 Base density referral
Base density is the density of the fluid at a specified base (or referral) temperature which is different
to the line (i.e., the actual) temperature of the fluid. Base density can be calculated by either a Matrix
referral method or by the API Referral method.
B.4.1 Matrix density referral
The Matrix Density Referral method uses a process of interpolation and extrapolation between a
matrix of known density and temperature reference points to determine the liquid density at a
specified base temperature different to the line temperature. A typical referral matrix is shown below.
The lines D
different reference temperatures, T
temperature, the 7829 meter calculates the base density at the base temperature.
70 Micro Motion 7829 Visconic Viscosity Meter
to D4 plot the density of four product types for which the density is known at five
1
to T5. Using this information, and the measured line density and
1
Page 77

Calculated Parameters
2
15
1510
15
KK
ρ
ρ+
=α
The information required for the referral is:
• Five reference temperatures
• The density for each of four product types at the five reference temperatures (20 reference
points in all)
• The base temperature, which must be one of the five reference temperatures.
All 20 reference points must be specified, otherwise the 7829 meter cannot calculate the base density.
If you do not have all the relevant data, enter a sensible estimate for the missing reference points.
The easiest way of entering these values is by using the Board Configuration facility of ADView.
Section 4 tells you how to do this.
B.4.2 API density referral
This calculation uses an iterative process to determine the density at the base temperature by applying
temperature and pressure corrections using the API-ASTM-IP petroleum measurement tables.
The information required for the API density is:
• Reference pressure and reference temperature.
• Line pressure: This is not measured by 7829 meter, and must be entered as part of the
configuration.
Calculated Parameters Modbus CommunicationsSafety CertificationFactory Default Settings
• Product type: Refined product, crude product, or user defined.
Density / temperature relationship
Correction factors in the revised API-ASTM-IP petroleum measurement tables are based on the
following correlation equations:
ρt / ρ
= exp [-α15 Δt (1 + 0.8 α15 Δt)]
15
where:
• ρt = Density at line temperature t °C
• ρ
= Density at base temperature 15 °C.
15
• Δt = (t - 15) °C
• α
= Tangent thermal expansion coefficient per °C at base temperature of 15 °C.
15
The tangent coefficient differs for each of the major groups of hydrocarbons. It is obtained from the
following relationship:
where K
and K1 are known as the API factors.
0
Hydrocarbon group selection
The hydrocarbon group can be selected as:
• General refined products
• General crude products
• User defined
K
and K1 are programmed into the 7829 meter for the first two groups. For refined products the
0
values of K
Installation and Configuration Manual 71
and K1 are automatically selected according to the corrected density:
0
Page 78

Calculated Parameters
t
1
1
0
P
V
V
1
⎥
⎦
⎤
⎢
⎣
⎡
δ
=β
1
1
0
P1 β−=
ρ
ρ
Hydrocarbon Group
Gasolines 654 to 779 346.42278 0.43884
Jet Fuels 779 to 839 594.54180 0.0000
Fuel Oils 839 to 1075 186.9696 0.48618
For Crude Oil the API factors are:
Density Range
(kg/m³) K
0
K1
Product K
Crude oil 613.972226 0.0000
User defined factors can be entered as any sensible value.
0
K
1
Density / pressure relationship
Isothermal secant compressibility can be defined by the simplified equation:
• where liquid volume changes from V
(atmospheric) to P
1
•where
β = Isothermal secant compressibility at temperature t
= Change of volume from V0 to V
δV
1
P1 = Gauge pressure reading (P - 1.013) bars
• hence
to V1 as the gauge pressure changes from zero
0
1
•where
ρ
= Corrected density at zero (atmospheric) gauge.
0
ρ
= Uncorrected density (Kg/m3)
1
P
= (P - 1.013) where P is pressure in bars (P - base)
1
A correlation equation has been established for from the available compressibility data; such as,
log
C = -1.62080 + 0.00021592t + 0.87096 x 10⁶(ρ15)-2 + 4.2092t x 103(ρ15)-2 per bar
e
where
• β = C x 10
4
Bar
• t = Temperature in deg C
• ρ = ρ
72 Micro Motion 7829 Visconic Viscosity Meter
/ 1000 = oil density at 15 °C (kg/litre)
15
Page 79

Calculated Parameters
⎟
⎟
⎠
⎞
⎜
⎜
⎝
⎛
+
⎟
⎠
⎞
⎜
⎝
⎛
−
2
SG
1086.66
SG
341.384
906.318
Degrees Brix =
yAB
ρ
B
d
------
⎝⎠
⎛⎞
C
ρ
B
d
------
⎝⎠
⎛⎞
2
E
ρ
B
d
------
⎝⎠
⎛⎞
3
F
ρ
B
d
------
⎝⎠
⎛⎞
4
⋅+⋅+⋅+⋅+=
()()
()()
100*
KK
KK
21B
2B1
−ρ
−ρ
% of mass of product A =
B.5 Calculated parameters
These are also known as Special Functions.
B.5.1 Specific gravity
Specific gravity (SG) = Base density (@ T
) / Density of water (@ T
ref
B.5.2 Degrees Baumé
Degrees Baumé = 145 – (145 / Base density)
(Where Base Density is in units of g/cc.)
B.5.3 Degrees Brix
Where SG is Specific gravity.
B.5.4 Quartic equation
The following polynomial equation is implemented:
)
ref
Calculated Parameters Modbus CommunicationsSafety CertificationFactory Default Settings
Where:
A, B, C, E, F = user programmable constants.
d = density of water (also a programmable constant).
ρ
= base density.
B
B.5.5 % Mass
Where:
K
= base density of product A
1
K
= base density of product B
2
ρ
= base density of mixture
B
Installation and Configuration Manual 73
Page 80

Calculated Parameters
% of volume of product A =
100*
KK
K
21
2B
−
−ρ
5.131
SG
5.141
API −=
B.5.6 % Volume
Where:
= base density of product A
K
1
K
= base density of product B
2
ρ
= base density of mixture
B
B.5.7 API degrees
Where Base density value, used for specific gravity value (SG), is determined from API density
referral.
74 Micro Motion 7829 Visconic Viscosity Meter
Page 81

Safety Certification
Appendix C
Safety Certification
C.1 Safety certification
Please contact Micro Motion if you need to have copies of the latest safety certification for the 7829
Visconic viscosity meter.
Factory Default Settings
Calculated Parameters Modbus Communications
Safety Certification
Installation and Configuration Manual 75
Page 82

Safety Certification
76 Micro Motion 7829 Visconic Viscosity Meter
Page 83

Modbus Communications
Appendix D
Modbus Communications
D.1 Overview
The Modbus/RS-485 communications facility on the 7829 Visconic viscosity meter can be useful in a
number of ways. It is the only means of configuring the meter, and also gives access to diagnostic
information not available on the analog output. Digital representations of the measured and calculated
parameters are also available which lead to higher accuracy, and greater integration in digital
networks and systems.
The RS-485 serial interface of the 7829 Visconic viscosity meter communicates using the RTU
Modbus protocol, which is a well established system used in many industrial applications. The
protocol defines the way in which messages will be transmitted between Modbus devices, and details
how the data will be formatted and ordered.
Factory Default Settings
Calculated Parameters Modbus CommunicationsSafety CertificationFactory Default Settings Calculated Parameters Modbus CommunicationsSafety CertificationFactory Default Settings Calculated Parameters Modbus CommunicationsSafety CertificationFactory Default Settings Calculated Parameters Modbus Communications
It is beyond the scope of this manual to give a full description of the protocol, but a useful reference
on Modbus is the Modbus Protocol Reference Guide (PI-MBUS-200 Rev. D) (1992) published by
Modicon Industrial Automation Systems Inc.
A Modbus network can have only one Master at any one time, with up to 32 Slaves. The 7829
Visconic viscosity meter acts as a slave device, and only communicates on the network when it
receives a request for information from a Master device such as a computer or a PLC.
The implementation used on the 7829 Visconic viscosity meter is fully compliant with the Modicon
Specification. All information is stored in memory locations in the 7829 Visconic viscosity meter
referred to as Modbus Registers. These store all the data required to control the operation,
calculations and data output of the 7829 Visconic viscosity meter. Modbus communication with the
meter consists of reading or writing to these registers.
The 7829 Visconic viscosity meter implements only two Modbus commands:-
• Command 3: Read Modbus Register
• Command 16 (10
Any number of registers can be read with Command 3, but only one register can be written to for each
Command 16. This restriction does not limit the performance of the system, since all functions are
mapped into the register structure in one way or another.
In most cases, it is unnecessary to understand the detail of the protocol, as this is taken care of by the
application program. For example, the Micro Motion ADView or ProLink II software program
enables you to configure the meter, and even read or write to individual Modbus registers, without you
needing to know about Modbus.
However, if you are using a proprietary software package, or developing your own application
software, the information given in this section will be invaluable.
): Write Modbus Register
16
Safety Certification
Installation and Configuration Manual 77
Page 84

Modbus Communications
D.2 Accessing Modbus registers
Any device which can drive the RS-485 interface on the 7829 Visconic viscosity meter can, in theory,
access the Modbus registers. In practice, some sort of user interface is required to simplify the
process.
ADView offers several ways of accessing the registers.
Board Configuration:
Register Read/Write
Direct Communications
A graphical interface for viewing and setting the main configuration
parameters of the 7829 Visconic viscosity meter. Direct access to
registers is not offered.
This tool provides a simple window from which to read and write to
named and numbered registers. When you write to a register, you
are presented with a set of allowable values from which to choose.
Thus the tool is only useful for communicating with Micro Motion
meters. This is the simplest and most foolproof way of directly
accessing the registers. Section 4 gives full details.
This is another tool which allows you to compose a sequence of
data to be transmitted to/from the Modbus. This can be used to
communicate with any Modbus device, providing that you know the
register addresses, data format, indices, etc.
The composition of the data is entirely up to the user, although the
tool does compute and insert a checksum. Only those well versed
in the use of Modbus protocol should attempt to use this facility.
It is mainly designed for testing Modbus transmissions which are
subsequently to be used in an application specific environment.
A worked example of using this tool is given in section D.7.
D.2.1 Establishing Modbus communications
If the meter Slave address or the values of Registers 47 and 48 are not known, Modbus
communications cannot be carried out successfully, and it will be necessary to establish the current
values in these items. If you are using ADView, you can search for the addresses of all connected
slaves, and then interrogate the appropriate registers for each one.
If you are not using ADView, Section D.6 gives a procedure which will enable you to get this
information.
D.3 Modbus implementation
D.3.1 Register size and content
All registers are 32 bits (whether they are integer or floating point types), although the Modbus
specification states that registers are 16 bits and addresses and ‘number of register’ fields assume all
registers are 16 bits long. All floating point values are in IEEE single precision format.
Registers are contiguous in the Modbus register ‘address space’. There is a one-to-one mapping of
32-bit meter register numbers to 16-bit Modbus register numbers. Therefore, only the full 32 bits of
any register can be accessed. The upper and lower 16-bit segments have the same Modbus register
number and consequently cannot be individually read.
Registers 47 and 48 within the meter allow the Modbus ‘dialect’ to be changed to suit the
communicating device if it cannot easily be re-programmed. This is most easily done using
ADView’s Register Read/Write tool (see the Using ADView and ProLink II chapter).
Their usage is as follows:
78 Micro Motion 7829 Visconic Viscosity Meter
Page 85

Modbus Communications
Modbus byte ordering
Register 47 contents Modbus byte ordering
00000000
FFFFFFFF
16
16
Big Endian (i.e. MSB first)
Little Endian (i.e. LSB first)
Modbus register size
Register 48 contents Modbus register size
00000000
FFFFFFFF
16
16
16-Bit register size (Register 48 = 00000000
16 bits
32 bits
16
)
In order to read 32-bit registers when Modbus registers are dealt with in units of 16 bits, you must
specify twice the number of 32-bit register you want to read in the ‘number of registers’ field. For
example, to read one 32-bit register, use '2'. If an attempt is made to read an odd number of registers,
the command will fail.
Factory Default Settings
Calculated Parameters Modbus CommunicationsSafety CertificationFactory Default Settings Calculated Parameters Modbus CommunicationsSafety CertificationFactory Default Settings Calculated Parameters Modbus CommunicationsSafety CertificationFactory Default Settings Calculated Parameters Modbus Communications
32-Bit register size (Register 48 = FFFFFFFF
)
16
In order to read 32-bit registers when Modbus registers are dealt with in units of 32 bits, you specify
the actual number of registers you want in the ‘number of registers’ field. (for example, to read two
32-bit register in this mode, use '2'.
D.4 Modbus register assignments
Each register is identified by a unique number, and the list is organized by this number. For each
register, the contents are described, along with the data type of the contents.
The data type is always 32 bits unless stated otherwise. Variable names are given for reference
purposes only. They have no other use.
Note: All units locations (registers 3, 4, 5 and 26) must be set before entering other values.
In some cases the data in a register is used to represent a non-numerical quantity, known as an index.
For example, the units of density can be kg/m
3
, g/cc, lb/gal or lb/ft3 and these are represented by the
numbers 91 to 94. Thus if Register 3 (line density) contains the value (index) 91, this means that the
units of line density are kg/m
3
. Index values may, of course, be used for more than one register.
Tables of these indices are given in Section D.5
Table D-1 Modbus register assignments
Index Table
(where
Register Function Data Type
0 API product type Long integer D.5.1
1 API referral reference temperature 4-byte float
2 API referral reference pressure 4-byte float
3 Line density units Long integer D.5.2
applicable)
Safety Certification
Installation and Configuration Manual 79
Page 86

Modbus Communications
Table D-1 Modbus register assignments continued
Index Table
(where
Register Function Data Type
4 Base density units Long integer D.5.2
5 Temperature units Long integer D.5.2
6 Special function calculation type Long integer D.5.3
7 Special function quartic equation name Long integer D.5.4
8 Special function quartic equation units
(1)
9 Output averaging time Long integer D.5.6
10 Analog Output 1 selected variable Long integer D.5.7
11 Analog Output 2 selected variable Long integer D.5.7
14 PWM factor for 4mA on Analog Output 1 Long integer
15 PWM factor for 20mA on Analog Output 1 Long integer
16 PWM factor for 4mA on Analog Output 2 Long integer
17 PWM factor for 20mA on Analog Output 2 Long integer
20 RTD calibration factor 4-byte float
21 Crystal oscillator calibration factor 4-byte float
22 Diagnostics flags Long integer
23 Line density value when fixed by diagnostics 4-byte float
24 Base density value when fixed by diagnostics 4-byte float
25 Temperature value when fixed by diagnostics 4-byte float
26 Pressure Units D.5.2
27 Referral temperature for matrix referral Long integer D.5.8
30 Modbus Slave address Long integer
47 Modbus byte order D.3.1
48 Modbus register size D.3.1
49 Software type Long integer D.5.9
nd
53 2
referral temperature for referred density 4-byte float
57 Full unit part number String
61 Hardware type Long integer D.5.10
64 Write-protected copy of RTD factor 4-byte float
65 Write-protected copy of crystal factor 4-byte float
66 Write-protected copy of Analog O/P 1 ‘4mA PWM factor’ Long integer
67 Write-protected copy of Analog O/P 1 ‘20mA PWM factor’ Long integer
68 Write-protected copy of Analog O/P 2 ‘4mA PWM factor’ Long integer
69 Write-protected copy of Analog O/P 2 ‘20mA PWM factor’ Long integer
72 Write-protected copy of Time Period Low Limit 4-byte float
73 Write-protected copy of Time Period High Limit 4-byte float
74 Write-protected copy of Q Factor Low Limit 4-byte float
75 Write-protected copy of Q Factor High Limit 4-byte float
127 Stored checksum for the FRAM Long integer
128 K0 4-byte float
Long integer D.5.5
applicable)
80 Micro Motion 7829 Visconic Viscosity Meter
Page 87

Modbus Communications
Table D-1 Modbus register assignments continued
Index Table
(where
Register Function Data Type
129 K1 4-byte float
130 K2 4-byte float
131 K18 4-byte float
132 K19 4-byte float
137 Meter time period trap count Long integer
138 Meter time period trap (difference in
139 Time period value when fixed by diagnostics 4-byte float
140 Value represented by 4mA on analog output 4-byte float
141 Value represented by 20mA on analog output 4-byte float
146 Line pressure 4-byte float
147 – 151 Temperatures for matrix referral 4-byte float
152 – 171 Densities for matrix referral 4-byte float
172 Atmospheric pressure 4-byte float
173 Line density offset 4-byte float
174 Line density scaling factor 4-byte float
175 Special function calculation parameter A 4-byte float
176 Special function calculation parameter B 4-byte float
177 Special function calculation parameter C 4-byte float
178 Special function parameter d / density of water 4-byte float
179 Density of product A for special function calc. 4-byte float
180 Density of product B for special function calc. 4-byte float
181 Temperature offset 4-byte float
182 User K0 value for API referral 4-byte float
183 User K1 value for API referral 4-byte float
185 User range (alarm) high value 4-byte float
186 User range (alarm) low value 4-byte float
192 Write-protected copy of K0 4-byte float
193 Write-protected copy of K1 4-byte float
194 Write-protected copy of K2 4-byte float
195 Write-protected copy of K18 4-byte float
196 Write-protected copy of K19 4-byte float
201 Unit’s original calibration date Long integer
202 Unit’s most recent calibration date Long integer
203 Unit’s serial number Long integer
204 Unit type Long integer D.5.11
256 Status Register Long integer D.5.12
257 Corrected line density
258 Corrected base density
259 Line temperature
(2)
(2)
(2)
μs) 4-byte float
4-byte float
4-byte float
4-byte float
applicable)
Factory Default Settings
Calculated Parameters Modbus CommunicationsSafety CertificationFactory Default Settings Calculated Parameters Modbus CommunicationsSafety CertificationFactory Default Settings Calculated Parameters Modbus CommunicationsSafety CertificationFactory Default Settings Calculated Parameters Modbus Communications
Safety Certification
Installation and Configuration Manual 81
Page 88

Modbus Communications
Table D-1 Modbus register assignments continued
Index Table
(where
Register Function Data Type
260 Special function calculation result
261 Meter time period (in
μs)
(2)
262 FRAM calculated checksums Long integer
263 RTD resistance (in ohms)
(2)
264 Meter coil pickup level (in volts)
265 Meter resonance Q value
(3)
266 Electronics board temperature (in °C)
267/8 Software version string
286 Time period A
287 Time period B
(2)
(2)
288 Referred density at 2
289 Line dynamic viscosity
290 Line kinematic viscosity
(2)
nd
referral temperature
(2)
(2)
294 Referred density API base density (15°C)
320 Calculation selection (write-protected) Long integer
321 Phase angle fixing (write-protected) Long integer
322 Write-protected copy of V0 4-byte float
323 Write-protected copy of V1 4-byte float
324 Write-protected copy of V2 4-byte float
326 Write-protected copy of V3 4-byte float
327 Write-protected copy of V4 4-byte float
384 Value for Q when fixed 4-byte float
385 Value for time period B when fixed 4-byte float
386 Value for raw line density when fixed 4-byte float
387 Value for line dynamic viscosity when fixed 4-byte float
388 Value for line kinematic viscosity when fixed 4-byte float
400 Line dynamic viscosity scale factor 4-byte float
401 Line dynamic viscosity offset 4-byte float
402 Line kinematic viscosity scale factor 4-byte float
421 Line dynamic viscosity units Long integer D.5.13
422 V0 4-byte float
423 V1 4-byte float
424 V2 4-byte float
426 V3 4-byte float
427 V4 4-byte float
(2)
4-byte float
4-byte float
4-byte float
(2)
4-byte float
4-byte float
String
4-byte float
4-byte float
(2)
4-byte float
4-byte float
4-byte float
(2)
4-byte float
applicable)
(1) Special function units are not used in unit conversions (they are for indication only), so can be set at any time.
(2) This is a live value. Although it can be written to, it would be pointless.
(3) This value is only valid when bit 3 (hex 08) is set in the diagnostics flag register (22), after a one-second pause.
82 Micro Motion 7829 Visconic Viscosity Meter
Page 89

Modbus Communications
D.5 Index codes
This section provides an interpretation of the numerical indices used to represent non-numerical
values.
D.5.1 API product type
Used in Register 0. (The user values for K0 and K1 are stored in Registers 182 and 183.)
Index Product Type
0 Crude (general crude)
1 Refined (general product)
2 User K0 and K1
D.5.2 Pressure, Temperature, Density and other Units
Used in Registers 3, 4, 5 and 26.
Factory Default Settings
Calculated Parameters Modbus CommunicationsSafety CertificationFactory Default Settings Calculated Parameters Modbus CommunicationsSafety CertificationFactory Default Settings Calculated Parameters Modbus CommunicationsSafety CertificationFactory Default Settings Calculated Parameters Modbus Communications
Index Units
6 psi A
7 bar A
10 kg / cm²
11 Pa
12 kPa
32 °C
33 °F
57 %
90 SGU
91 g / cm³
92 kg / m³
93 lb / gal
94 lb / ft³
101 ° Brix
102 ° Baume heavy
104 ° API
D.5.3 Special function
Safety Certification
Used in Register 6.
Index Calculation
0 none
1% mass
Installation and Configuration Manual 83
Page 90

Modbus Communications
2% volume
3 Specific Gravity
4° Baume
5° Brix
6 General quartic equation
7 ° API
D.5.4 Special function quartic equation name
Used in Register 7.
Index Name
0 none
1 Density
2% Mass
3% Volume
4° Baume
5° Brix
6 Specific Gravity
7Gravity
8 API
9Plato
10 Twaddle
11 ° Alcohol
12 (reserved)
13 (reserved)
14 (reserved)
15 (reserved)
16 (reserved)
17 (reserved)
18 (reserved)
19 (reserved)
D.5.5 Special function quartic equation units
Used in Register 8.
Index Name
0 none
57 %
84 Micro Motion 7829 Visconic Viscosity Meter
Page 91

Modbus Communications
↓
D.5.6 Output averaging time
Used in Register 9.
Index Averaging Time
0 none
11 s
22 s
35 s
4 10 s
5 20 s
6 50 s
7 100 s
D.5.7 Analog output selection
Used in Register 10.
Index Output
0 Density
1 Referred Density
2 Temperature
3 Special Function
44 mA
5 12 mA
6 20 mA
7
8 Raw density
9 Line dynamic viscosity
10 Line kinematic viscosity
11 Referred kinematic viscosity
Factory Default Settings
Calculated Parameters Modbus CommunicationsSafety CertificationFactory Default Settings Calculated Parameters Modbus CommunicationsSafety CertificationFactory Default Settings Calculated Parameters Modbus CommunicationsSafety CertificationFactory Default Settings Calculated Parameters Modbus Communications
Safety Certification
D.5.8 Referral temperature
Used in Register 27
Index Referral Temperature
0 Lowest temperature value in matrix
1
2
3
4
Installation and Configuration Manual 85
Highest temperature value in matrix
Page 92

Modbus Communications
D.5.9 Software version
Used in Register 49.
Index Density Referral
0Matrix
1API
D.5.10 Hardware type
Used in Registers 61.
Index Meter Type
1 Advanced Fork
D.5.11 Unit type
Used on Register 204.
Index Meter type
5 Advanced fork
D.5.12 Status register flags
Used in Register 256.
Bit Hex Value Flag Name Definition
0 00000001 ST_IN_LOCK P.L.L. is IN LOCK
1 00000002 ST_DIAG_ON DIAGnostics ON
2 00000004 ST_FT1_ALM 4 to 20 mA output 1 in ALarM
3 00000008 ST_FT2_ALM
4 00000010 ST_FT3_ALM
5 00000020 ST_HART_BOARD
6 00000040 ST_RS232_BOARD
7 00000080 ST_SWITCH_BOARD
8 00000100 ST_EXP0_BOARD (reserved for future expansion)
9 00000200 ST_EXP1_BOARD (reserved for future expansion)
10 00000400 ST_EXP2_BOARD (reserved for future expansion)
11 00000800 ST_EXP3_BOARD (reserved for future expansion)
12 00001000 ST_FT3_HART
13 00002000 ST_BAD_STATUS STATUS
14 00004000 ST_STAT_CORR one or more STATus registers have been
15 00008000 ST_TOTAL_DEATH status registers not updating - assume the worst
16 00010000 ST_USER_ALM User defined variable in alarm
(1)
(1)
(1)
(1)
(1)
(1)
4 to 20 mA output 2 in ALarM
4 to 20 mA output 3 in ALarM
whether HART BOARD is fitted
whether RS232 BOARD is fitted
whether SWITCH BOARD is fitted
HART is in control of its 4 to 20 mA output
register corruption
CORR
ected
86 Micro Motion 7829 Visconic Viscosity Meter
Page 93

Modbus Communications
17 00020000
18 00040000
19 00080000
20 00100000
21 00200000 ST_TEMP_HI TEMP
22 00400000 ST_TEMP_LOW TEMP
23 00800000 ST_ROM_CSF ROM CheckSum Fail flag
24 01000000 ST_FRAM0_WPF FRAM0 Write Protect Fail
25 02000000 ST_FRAM1_WPF
26 04000000 ST_FRAM0_RWE FRAM0
27 08000000 ST_FRAM1_RWE
28 10000000 ST_FRAM0_CSF FRAM0 CheckSum Fail flag
29 20000000 ST_FRAM1_CSF
30 40000000 ST_FRAM0_ACK FRAM0
31 80000000 ST_FRAM1_ACK
(1) The status flags marked thus refer to hardware features not present in the 7829 meter. They can safely be ignored.
(1)
(1)
(1)
(1)
erature reading too HIgh
erature reading too LOW
FRAM1 Write Protect Fail
Read/Write Error
FRAM1 Read/Write Error
FRAM1 CheckSum Fail flag
ACK/data error
FRAM1 ACK/data error
D.5.13 Line dynamic viscosity units
Factory Default Settings
Calculated Parameters Modbus CommunicationsSafety CertificationFactory Default Settings Calculated Parameters Modbus CommunicationsSafety CertificationFactory Default Settings Calculated Parameters Modbus CommunicationsSafety CertificationFactory Default Settings Calculated Parameters Modbus Communications
Used in Register 421.
Index Variable
0cP
1P
2Pas
3mPas
D.6 Establishing Modbus communications
Using ADView, it is possible to establish which devices are available on the network, and their slave
addresses. However, if you are not using ADView, the following procedure can be adopted.
If the meter Slave address or the values of Registers 47 and 48 are not known, Modbus
communications cannot be carried out successfully, and it will be necessary to establish the current
values in these items. The following procedure will do this.
The process is:
1. Find the slave address by trying all possible values until a response is received.
2. Establish whether the register size is 16 or 32 bits by reading register 48.
3. Find the byte order by reading register 47.
Safety Certification
Step 1 Find the slave address
Make sure only the meter is connected to the Modbus Master, then send the following message (Read
Register 47):
Installation and Configuration Manual 87
Page 94

Modbus Communications
Slave
Address Command
00 03 00 47
Register
Address Checksum
10
00 02 checksum
Wait for a response. If there is none, repeat the same message, with the Slave address changed to 1,
and await a response. Repeat the process until a response is obtained. This will show the slave address
of the meter.
Step 2 Establish register size as 16-Bit versus 32-Bit
Send the following message (Read Register 48), where nn is the meter slave address:
Slave
Address Command
nn 03 00 48
Register
Address Checksum
10
00 02 checksum
The meter will respond with the following to show that the meter is set to 16-bits register size:
Slave
Address Command Data Bytes Checksum
nn 03 04 4 data bytes checksum
Or, the meter will respond with the following to show that the meter is set to 32-bits register size.
Slave
Address Command Data Bytes Checksum
nn 03 08 8 data bytes checksum
Thus, by reading the third byte of the response, you can deduce the value of Register 48.
Step 3 Find the byte order
Send the following message (Read Register 47), where nn is the meter’s slave address:
Slave
Address Command
nn 03 00 47
Register
Address Checksum
10
00 02 checksum
The meter will respond with one of the following:
Slave
Address Command Data Bytes Checksum
nn 03 04 4 data bytes checksum
88 Micro Motion 7829 Visconic Viscosity Meter
Page 95

Modbus Communications
Checksum
(Automatically
inserted if you are using
ADView.)
Slave address
(hex)
Command number: 3
(Read Register)
Number of registers
to read (Hi byte)
Number of registers
to read (Lo byte)
01 03 01 01 00 02 94 37
Register address
Hi byte
Register address
Lo byte
Slave
Address Command Data Bytes Checksum
nn 03 08 8 data bytes checksum
Examine the first four bytes of the data. If they are all 00, then the meter is in Big Endian mode; if
they are all FF, then the mode is Little Endian.
D.7 Example of direct Modbus access
In many applications, direct access to Modbus will be unnecessary. ADView provides a way of
configuring the 7829 Visconic viscosity meter, and for accessing individual registers. This example
describes how to access the 7829 meter directly, without the help of ADView.
However, before you start, you should configure the meter using ADView (described in the Using
ADView and ProLink II chapter), and also set the Modbus Byte Order and Register Size (see Modbus
Communications appendix).
Note: You can use ADView’s Direct Communications tool to test out the following sequences, or any
others you want to try. This has the added advantage that ADView calculates and inserts the checksum
value for you.
Factory Default Settings
Calculated Parameters Modbus CommunicationsSafety CertificationFactory Default Settings Calculated Parameters Modbus CommunicationsSafety CertificationFactory Default Settings Calculated Parameters Modbus CommunicationsSafety CertificationFactory Default Settings Calculated Parameters Modbus Communications
D.7.1 Example 1: Reading line density (16-bit register size)
The 7829 meter is assumed to have been configured with Register Size = 16-bit (Register 48 = 0), and
has slave address = 1.
The following string will read the line density, which is held in Register 257 (0101
).
16
The reply from the 7829 meter will be:
Safety Certification
Installation and Configuration Manual 89
Page 96

Modbus Communications
Checksum
Slave address
(hex)
Command number: 3
(Read Register)
Line density value as
a 32-bit floating point
number
01 03 04 xx xx xx xx cs cs
Reply byte count
Checksum
(Automatically
inserted if you are using
ADView.)
Slave address
(hex)
Command number: 3
(Read Register)
Number of registers
to read (Hi byte)
Number of registers
to read (Lo byte
01 03 01 01 00 01 D4 36
Register address
Hi byte
Register address
Lo byte
Checksum
Slave address
(hex)
Command number: 3
(Read Register)
Line density value as
a 32-bit floating point
number
01 03 04 xx xx xx xx cs cs
Reply byte count
D.7.2 Example 2: Reading line density (32-bit register size)
The 7829 meter is assumed to have been configured with Register Size = 32-bit (Register 48 =
FFFF
), and has slave address = 1.
16
The following string will read the line density, which is held in Register 257 (0101
).
16
The reply from the 7829 meter will be the same as for Example 1.
90 Micro Motion 7829 Visconic Viscosity Meter
Page 97

Appendix E
Product Data
E.1 Density / temperature relationship of hydrocarbon products
E.1.1 Crude oil
Table E-1 Crude oil
Temp. (°C) Density (kg/m3)
60 738.91 765.06 791.94 817.15 843.11 869.01 894.86 920.87 946.46
55 742.96 768.98 794.93 820.83 846.68 872.48 898.24 923.95 949.63
50 747.00 772.89 798.72 824.51 850.25 875.94 901.80 927.23 952.82
45 751.03 776.79 802.50 828.17 853.81 879.40 904.96 930.50 956.00
40 755.05 780.68 806.27 831.83 857.36 882.85 908.32 933.76 959.18
35 759.06 784.57 810.04 835.48 860.90 886.30 911.67 937.02 962.36
30 763.06 788.44 813.79 839.12 864.44 889.73 915.01 940.28 965.53
25 767.05 792.30 817.54 842.76 867.97 893.16 918.35 943.52 968.89
20 771.03 796.18 821.27 846.38 871.49 896.59 921.68 946.77 971.85
15.556 774.56 799.57 824.59 849.60 874.61 899.62 924.63 949.64 974.65
15 775.00 800.00 825.00 850.00 875.00 900.00 925.00 950.00 975.00
10 778.95 803.83 828.72 853.61 878.50 903.41 928.32 953.23 978.15
5 782.90 807.65 832.42 857.20 882.00 906.81 931.62 958.45 981.29
0 786.83 811.46 836.12 860.79 885.49 910.21 934.92 959.66 984.42
Return PolicyProduct Data
E.1.2 Refined products
Table E-2 Refined products
Temp. (°C) Density (kg/m3)
60 605.51 657.32 708.88 766.17 817.90 868.47 918.99 969.45 1019.87
55 610.59 662.12 713.50 769.97 821.49 872.00 922.46 972.87 1023.24
50 615.51 666.91 718.11 773.75 825.08 875.53 925.92 976.28 1026.60
45 620.49 671.68 722.71 777.53 828.67 879.04 929.38 979.69 1029.96
40 625.45 676.44 727.29 781.30 832.24 882.56 932.84 983.09 1033.32
35 630.40 681.18 731.86 785.86 835.81 886.06 938.28 986.48 1038.67
30 635.33 685.92 736.42 788.81 839.37 889.56 939.72 989.87 1040.01
25 640.24 690.63 740.96 792.55 842.92 893.04 943.16 993.26 1043.35
20 645.13 695.32 745.49 796.28 846.46 896.53 846.58 996.63 1046.68
15.556 649.46 699.48 749.50 799.59 849.61 899.61 949.62 999.63 1049.63
Installation and Configuration Manual 91
Page 98

Product Data
()
[]
t15t15
15
t
8.01exp Δα+Δα−=
ρ
ρ
t
ρ
15
ρ
t
Δ
15
α
2
15
1510
15
KK
ρ
ρ+
=α
Table E-2 Refined products continued
Temp. (°C) Density (kg/m3)
15 650.00 700.00 750.00 800.00 850.00 900.00 950.00 1000.00 1050.00
10 654.85 704.66 754.50 803.71 853.53 903.47 953.41 1003.36 1053.32
5 659.67 709.30 758.97 807.41 857.04 906.92 956.81 1006.72 1056.63
0 664.47 713.92 763.44 811.10 860.55 910.37 960.20 1010.07 1059.93
The above tables are derived from equations, which form the basis of the data in the Revised
Petroleum Measurement Tables (IP 200, ASTM D1250, API 2540 and ISO R91 Addendum 1).
The density temperature relationship used is:
3
Where: = Density at line temperature t°C (kg/m
= Density at base temperature 15°C (kg/m
)
3
)
= t°C –15°C (such as t – base temperature)
= Tangent thermal expansion coefficient per °C at base temperature 15°C
The tangent thermal expansion coefficient differs for each of the major groups of hydrocarbons. It is
obtained using the following relationship:
Where: K
Product Density Range (kg/m3)K
and K1 = API factors and are defined as follows:
0
0
K
1
Crude Oil 771 – 981 613.97226 0.00000
Gasolines 654 – 779 346.42278 0.43884
Kerosines 779 – 839 594.54180 0.00000
Fuel Oils 839 – 1075 186.96960 0.48618
E.1.3 Platinum resistance law
Table E-3 Platimum resistance law (To DIN 43 760)
°C Ohms °C Ohms °C Ohms °C Ohms °F Ohms °F Ohms
–50 80.31 5 101.91 60 123.24 115 144.17 0 93.03 100 114.68
–45 82.29 10 103.90 65 125.16 120 146.06 10 95.21 110 116.83
–40 84.27 15 105.85 70 127.07 125 147.94 20 97.39 120 118.97
–35 86.25 20 107.79 75 128.98 130 149.82 30 99.57 130 121.11
–30 88.22 25 109.73 80 130.89 135 151.70 32 100.00 140 123.24
–25 90.19 30 111.67 85 132.80 140 153.58 40 101.74 150 125.37
–20 92.16 35 113.61 90 134.70 145 155.45 50 103.90 160 127.50
–15 94.12 40 115.54 95 136.60 150 157.31 60 106.07 170 129.62
–10 96.09 45 117.47 100 138.50 155 159.18 70 108.23 180 131.74
–5 98.04 50 119.40 105 140.39 160 161.04 80 110.38 190 133.86
0 100.00 55 121.32 110 142.29 165 162.90 90 112.53 200 135.97
92 Micro Motion 7829 Visconic Viscosity Meter
Page 99

Product Data
E.1.4 Density of ambient air
Taken at a relative humidity of 50%.
3
Table E-4 Density of ambient air (in kg/m
Air
Pressure Air Temperature (°C)
(mb)6 101418222630
900 1.122 1.105 1.089 1.073 1.057 1.041 1.025
930 1.159 1.142 1.125 1.109 1.092 1.076 1.060
960 1.197 1.179 1.162 1.145 1.128 1.111 1.094
990 1.234 1.216 1.198 1.180 1.163 1.146 1.129
1020 1.271 1.253 1.234 1.216 1.199 1.181 1.163
)
E.1.5 Density of water
Use pure, bubble-free water.
3
Table E-5 Density of water (in kg/m
Temp
°C024681012141618
0 999.840 999.940 999.972 999.940 999.848 999.699 999.497 999.244 998.943 998.595
20 998.203 997.769 997.295 996.782 996.231 995.645 995.024 994.369 993.681 992.962
40 992.212 991.432 990.623 989.786 988.922 988.030 987.113 986.169 985.201 984.208
60 983.191 982.150 981.086 980.000 978.890 977.759 976.607 975.432 974.237 973.021
80 971.785 970.528 969.252 967.955 966.640 965.305 963.950 962.577 961.185 959.774
100 958.345
to ITS – 90 temperature scale)
Return PolicyProduct Data
Installation and Configuration Manual 93
Page 100

Product Data
c
t/c δδ
E.1.6 Velocity of sound in liquids
Table E-6 Velocity of sound in liquids
Liquid Temp. (t °C)
Acetic acid 20 1173 ----
Acetone 20 1190 –4.5
Amyl acetate 29 1173 ----
Aniline 20 1656 –4.0
Benzene 20 1320 –5.0
Blood (horse) 37 1571 ----
Butyl acetate 30 1172 –3.2
Carbon disulphide 25 1142 ----
Carbon tetrachloride 20 940 –3.0
Chlorine 20 850 –3.8
Chlorobenzene 20 1290 –4.3
Chloroform 20 990 –3.3
Ethanol amide 25 1724 –3.4
Ethyl acetate 30 1133 –3.9
Ethyl alcohol 20 1162 –3.6
Velocity of Sound
–1
(ms
)
Rate of Change
( ms
–1K–1
)
Formic acid 20 1360 –3.5
Heptane 20 1160 –4.5
n-Hexane 30 1060 ----
Kerosene 25 1315 –3.6
Menthol 50 1271 ----
Methyl acetate 30 1131 –3.7
Methyl alcohol 20 1121 –3.5
Methylene Chloride 25 1070 ----
Nitrogen –189 745 –10.6
Nonane 20 1248 ----
Oil (castor) 19 1500 –4.1
Oil (olive) 22 1440 –2.8
Octane 20 1197 ----
Oxygen –186 950 –6.9
94 Micro Motion 7829 Visconic Viscosity Meter
 Loading...