

Page 1

User Manual
Manual Version 1.9
Software Version 1.9
For the latest news about this version, please refer to the News section on our
website www.optogait.com
Page 2

Version 1.9 Page 2 of 170
Contents
1 Device Functions and Major Features ...................................................................................................... 6
Kit Configuration ........................................................................................................................................................ 8
1.1 Single Meter .......................................................................................................................... 9
1.1.1 Jump Test ....................................................................................................................... 9
1.1.2 Tapping/Frequency Test ................................................................................................ 9
1.1.3 Reaction Test .................................................................................................................. 9
1.2 Single Meter on Treadmill ................................................................................................... 10
1.2.1 Gait Analysis, Run Analysis ........................................................................................... 10
1.3 The Modular System ........................................................................................................... 11
1.3.1 Gait Test ....................................................................................................................... 11
1.3.2 Running Test................................................................................................................. 11
1.4 The Two-Dimensional System: OptoGait 2D ....................................................................... 12
1.5 Environmental Conditions and Disclaimers ........................................................................ 16
2 Software ............................................................................................................................................................. 18
2.1 Installation ........................................................................................................................... 18
2.2 Description .......................................................................................................................... 22
2.3 Patients ................................................................................................................................ 22
2.4 Test ...................................................................................................................................... 23
2.5 Results and Video Analysis .................................................................................................. 23
2.6 Report .................................................................................................................................. 23
3 OptoGait Driver and Hardware Installation ......................................................................................... 25
3.1 Driver Installation ................................................................................................................ 25
3.2 OptoGait Hardware Installation .......................................................................................... 25
3.3 Power Supply ....................................................................................................................... 29
3.3.1 OptoGait Battery life .................................................................................................... 33
3.4 OptoGait Electromyography Connector .............................................................................. 33
4 Description of Functions .............................................................................................................................. 34
4.1 Patients ................................................................................................................................ 34
4.1.1 Insert / Edit Patients .................................................................................................... 34
4.1.1.1 Patient Data Input Mask ....................................................................................... 37
4.1.1.2 Importing and Exporting Patients’ Personal Data Excel ....................................... 38
Page 3

Version 1.9 Page 3 of 170
4.1.2 Insert / Edit Group ....................................................................................................... 39
4.1.3 MediaGallery ................................................................................................................ 41
4.1.3.1 Acquisition from Webcam .................................................................................... 44
4.2 Test ...................................................................................................................................... 46
4.2.1 Execute ......................................................................................................................... 46
4.2.1.1 Execute Configuration .......................................................................................... 49
4.2.1.2 Video Feedback ..................................................................................................... 51
4.2.1.3 Metronome ........................................................................................................... 56
4.2.2 Define / Edit Tests ........................................................................................................ 57
4.2.2.1 Main and Secondary Parameters ......................................................................... 58
4.2.2.2 Jump Test .............................................................................................................. 62
4.2.2.3 Reaction times ...................................................................................................... 63
4.2.2.4 Sprint and Gait Test .............................................................................................. 64
4.2.2.5 Treadmill Running Test ......................................................................................... 67
4.2.2.6 Treadmill Gait Test ................................................................................................ 68
4.2.2.7 Tapping Test .......................................................................................................... 69
4.2.2.8 Vertec Like Test ..................................................................................................... 70
4.2.2.9 2D Gait Test .......................................................................................................... 71
4.2.3 Define / Edit Protocols ................................................................................................. 74
4.3 Results ................................................................................................................................. 75
4.3.1 View .............................................................................................................................. 80
4.3.1.1 Configuration Panel .............................................................................................. 82
4.3.1.2 Charts .................................................................................................................... 84
4.3.1.3 Statistics Charts..................................................................................................... 86
4.3.1.4 Table with Numerical Data ................................................................................... 87
4.3.1.5 Start Foot .............................................................................................................. 91
4.3.1.6 Video Preview Popup: First Step Preview ............................................................ 95
4.3.1.7 Viewing of the OptoGait Bars .............................................................................. 96
4.3.1.8 Print ...................................................................................................................... 99
4.3.1.9 Save Analysis ....................................................................................................... 100
4.3.1.10 Analysis Notes ..................................................................................................... 100
4.3.1.11 Signature ............................................................................................................. 100
Page 4

Version 1.9 Page 4 of 170
4.3.1.12 Parameters .......................................................................................................... 100
4.3.1.13 Using Markers ..................................................................................................... 102
4.3.2 Compare ..................................................................................................................... 103
4.3.2.1 Print, Analysis, Notes, Signature ......................................................................... 104
4.3.3 History ........................................................................................................................ 105
4.3.4 Export ......................................................................................................................... 107
4.4 Utility ................................................................................................................................. 108
4.4.1 Basic Settings ............................................................................................................. 108
4.4.1.1 General ............................................................................................................... 108
4.4.1.2 Jump Test Configuration ..................................................................................... 108
4.4.1.3 Reaction Test Configuration ............................................................................... 109
4.4.1.4 Video ................................................................................................................... 109
4.4.1.5 Sprint/Gait Test Configuration ........................................................................... 111
4.4.1.6 Screen ................................................................................................................. 112
4.4.1.7 News & Events .................................................................................................... 112
4.4.1.8 EMG Activation ................................................................................................... 113
4.4.2 OptoGait HW Test ...................................................................................................... 114
4.4.3 Database .................................................................................................................... 115
4.4.3.1 Current Database ................................................................................................ 116
4.4.3.2 New ..................................................................................................................... 116
4.4.3.3 Select ................................................................................................................... 117
4.4.3.4 Clear .................................................................................................................... 117
4.4.3.5 Export .................................................................................................................. 117
4.4.3.6 Import ................................................................................................................. 118
4.4.3.7 Save as ................................................................................................................ 121
4.4.4 Devices ....................................................................................................................... 122
4.4.4.1 Witty Timer and Photocells ................................................................................ 122
4.4.5 Heart-Rate Monitor .................................................................................................... 124
4.4.5.1 Installation and Setup ......................................................................................... 124
4.4.5.2 SportZone Setup ................................................................................................. 127
4.4.6 Check Update ............................................................................................................. 130
4.4.7 About .......................................................................................................................... 130
Page 5

Version 1.9 Page 5 of 170
5 Operating Principles ................................................................................................................................... 131
5.1 Definition of Result Columns ............................................................................................. 131
5.1.1 General information ................................................................................................... 131
5.1.2 Jump and Reaction Test ............................................................................................. 132
5.1.3 Sprint/Gait Test .......................................................................................................... 133
5.1.4 Reference Indexes ...................................................................................................... 135
5.1.5 Imbalance Index ......................................................................................................... 136
5.1.6 GaitR IN And OUT Filter ............................................................................................. 138
5.2 Gait Analysis Definition ..................................................................................................... 139
5.3 Invalid Times Management ............................................................................................... 142
5.4 Video Analysis .................................................................................................................... 145
5.5 Managing Images .............................................................................................................. 147
6 Default Tests and Protocols ..................................................................................................................... 148
6.1 Drift Protocol ..................................................................................................................... 149
6.1.1 2D Drift Protocol ........................................................................................................ 151
6.2 Five Dot Drill Protocol ....................................................................................................... 152
6.3 'GG' Protocol...................................................................................................................... 156
6.4 Single Leg 3 Hops Protocol ................................................................................................ 159
6.4.1 2D Single Leg 3 Hops Protocol ................................................................................... 161
6.4.2 2D 4H3C and 4H3C Protocol ...................................................................................... 161
6.5 MIP (March in Place) Protocol ........................................................................................... 162
6.6 VERTEC LIKE Test ............................................................................................................... 164
6.7 Ski Test ............................................................................................................................... 165
7 Technical Data .............................................................................................................................................. 166
7.1 Technical Data TX/RX Bars ................................................................................................ 166
7.2 PC Minimum Requirements .............................................................................................. 167
8 Table of Used Symbols ............................................................................................................................... 168
Page 6

Version 1.9 Page 6 of 170
1 DEVICE FUNCTIONS AND MAJOR FEATURES
OPTOGAIT is an innovative system for movement analysis and functional assessment of patients
with normal or pathological conditions. The system is equipped with optical sensors working at a
frequency of 1000 Hz and having an accuracy of 1 cm, detecting the relevant space and time
parameters for gait, running or other test types. The objective measurement of such data, combined
with an integrated video acquisition, allows to monitor a patient's condition on a constant basis,
detecting problem areas, assessing mechanical inefficiencies and rapidly verifying the existence of
asymmetries between the two legs. The software platform allows to easily store all tests carried
out and recall them instantly, if necessary. This allows to develop a customized patient recovery. It
is furthermore possible to compare very quickly and easily data of tests carried out at different
times, in order to assess the validity and the efficiency of the methodology applied.
OPTOGAIT allows to:
Assess objectively the patient's general physical conditions
Identify deficiencies, postural problems and asymmetries on the basis of data and videos
Develop and apply therapeutic-rehabilitation applications, rehab approaches and
orthopedic solutions on the basis of precise data
Prevention - thanks to immediate assessment of numerical values - of relapses,
complications and involutions of the pathological or post-accident condition due to wrong
evaluations or diagnosis
Periodically verify the results and the efficacy of treatment
Motivate patients giving them tangible proves of improvement
Compare post- and pre-accident values if available
Verify, in a dynamical situation, the efficacy of arch supports, insoles or functional tapes
Compare various shoes and their effect on the patient's gait
Optogait is a system for optical detection made of a transmitting and a receiving bar (henceforth
called TX and RX)." Each one contains 96 LEDs communicating on an infrared (890 nm) frequency
with the same number of LEDs on the opposite bar. Once positioned on the floor or on the treadmill,
the system detects the interruptions of the communication between the bars - caused by the
patient's movement - and calculates the duration and position. During the execution of a running,
gait or series of jumps test, the contact and flight times can be measured with an accuracy of 1
thousandth of a second and the position of the interrupted LEDs with a space resolution of 1.041
cm. Starting from these base data, the dedicated software measures in real-time a series of crucial
data for the movement analysis. Optogait acquires numerical parameters in real-time for gait,
running and jump tests, allowing to view them immediately.
Page 7
Version 1.9 Page 7 of 170
Thanks to the possibility to create an easy-to-read report in a few seconds, containing all main data,
asymmetries between the two legs are highlighted instantly.
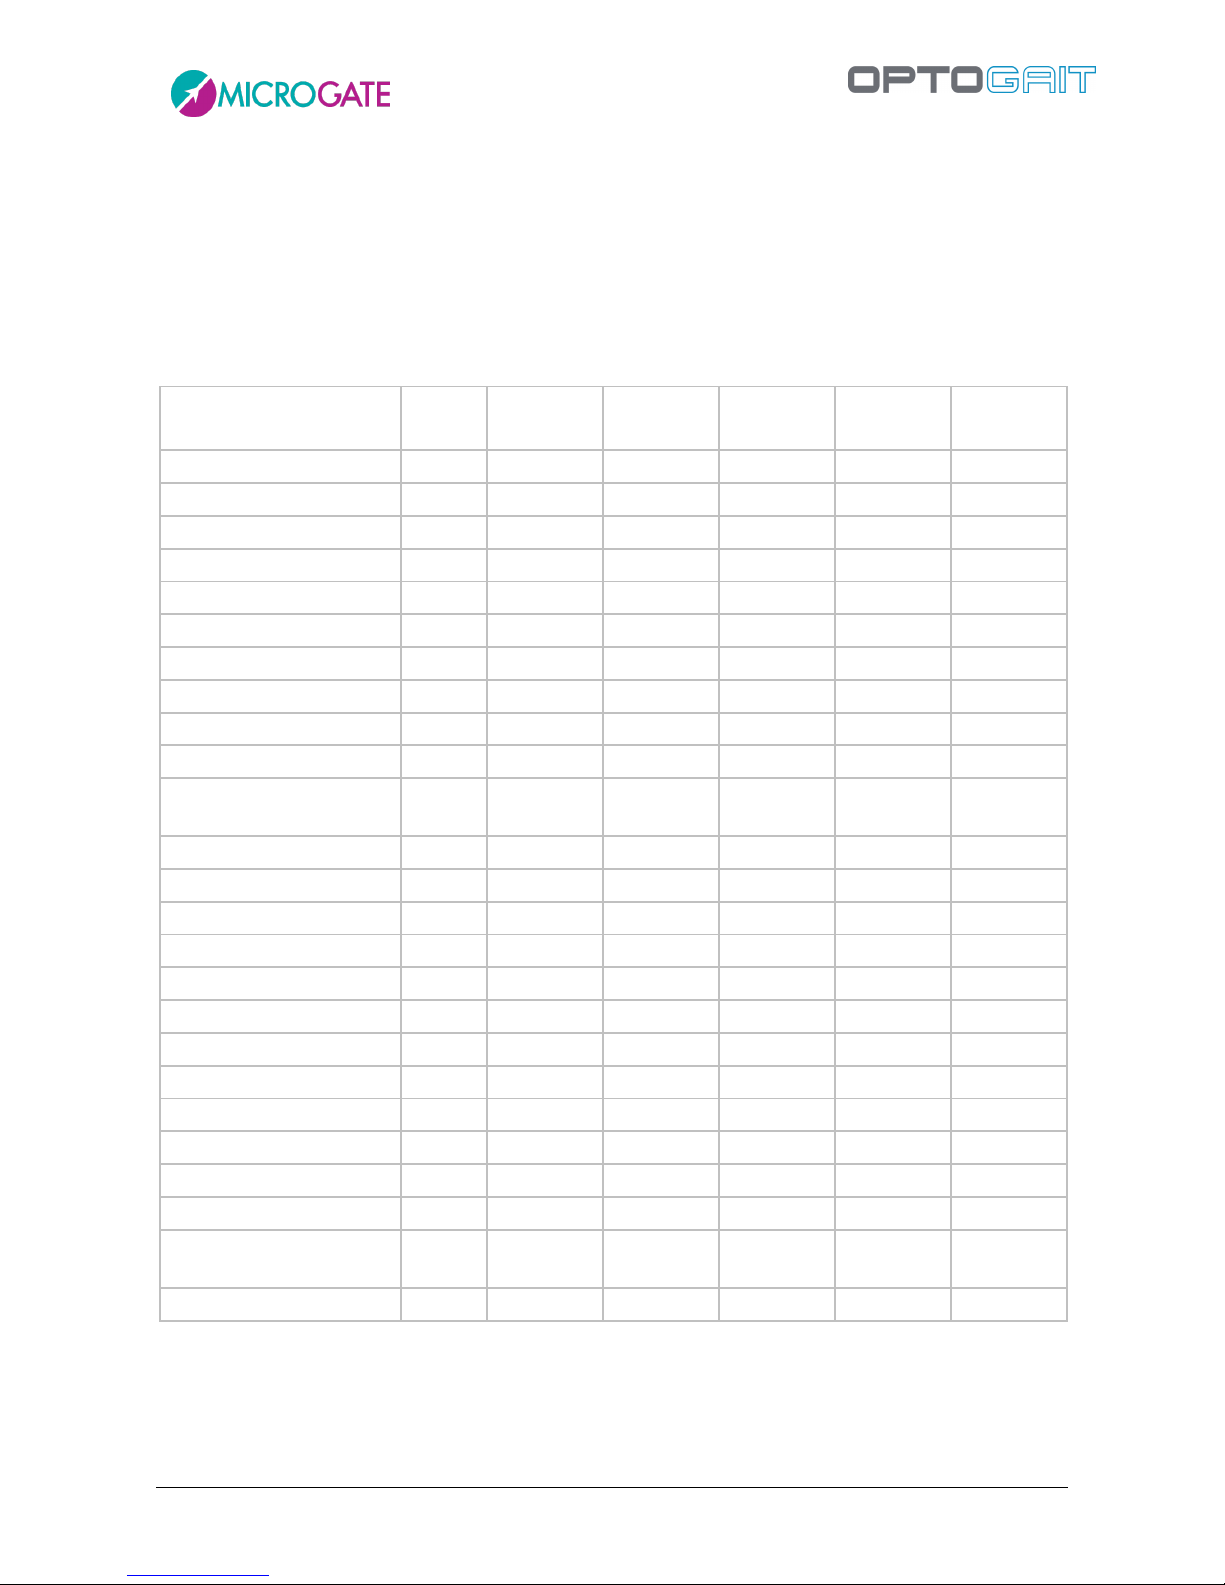
Besides the below listed data, in each test average value, standard deviation, and variability
coefficient are stated for each leg, where available. In this case, a difference between the two legs
is shown in percentage
Gait/Run
Test
Gait Test on
Treadmill
Run Test on
Treadmill
Jump Test
Tapping Test
Reaction
Test
Stance Time
X X
Swing Time
X X
Step Time X X X
Gait Cycle X X
Single Support
X X
Double Support
X X X
Loading Response
X X
Pre-swing X X
Step Length
X X X
Stride Length
X X X
3 foot phase (contact, flat,
propulsive)
X X X
Cadence/Rhythm/Pace
X X X X X
Speed X
Acceleration
X
Flight Time
X X X X
X
Contact Time
X X X X
Height X X X X
Stride Angle
X X
Imbalance X X
Specific power
X
Jumping Point
X
Jumping Point Gap
X
Used Area X X
Cycle Time (Flight +
Contact)
X
Reaction Time
X
Page 8
Version 1.9 Page 8 of 170
KIT CONFIGURATION
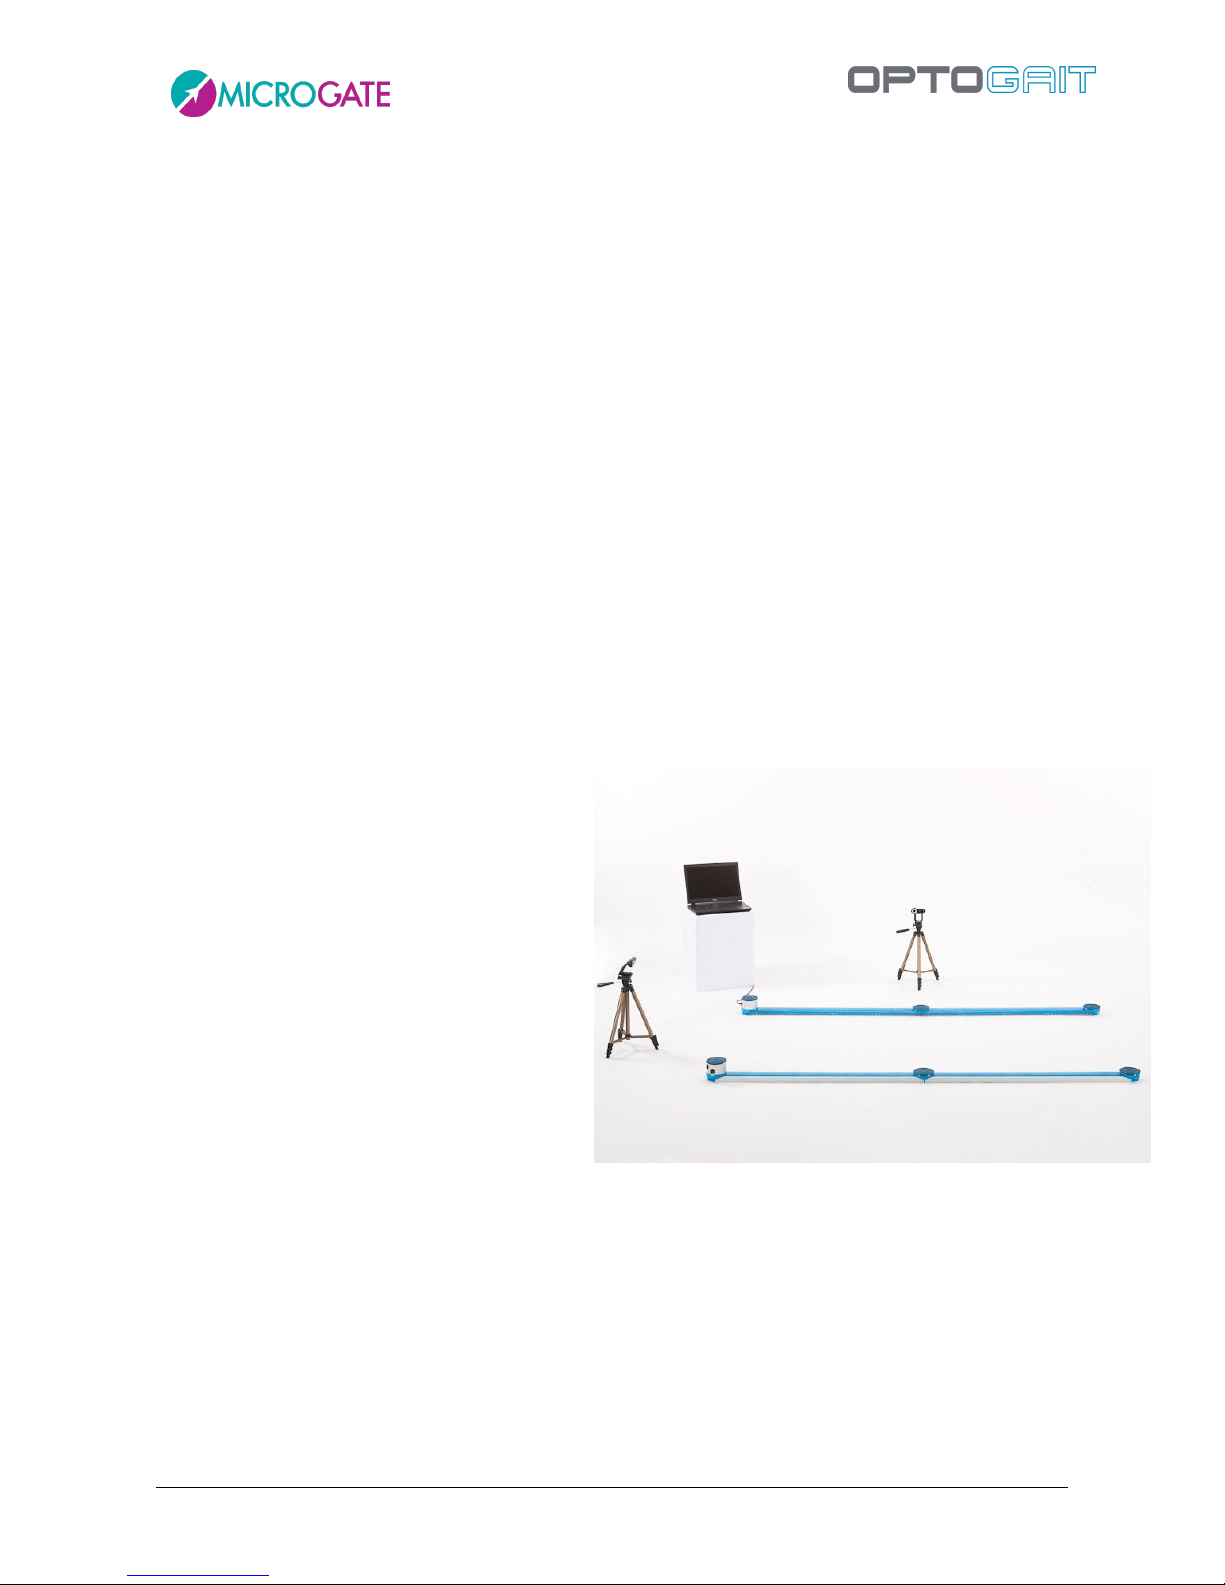
OPTOGAIT is always sold in a KIT configuration comprising at least:
1 bar with interface RX
1 bar with interface TX
(Optional for linear multiple-meter systems): n additional RX bars
(Optional for linear multiple-meter systems): n additional TX bars
USB cable for PC connection, 5 m
Single Meter: 1 power supply certified for medical use + connection cable for second bar
Linear Systems: 2 power supplies certified for medical use for recharging and current supply
2 professional webcams
2 USB cable extension cords, 5 m
2 webcam tripods
Single-meter bag or trolley for 2-to-5-meter systems
Quick installation guide (hard copy)
USB stick containing software and user guide
Kits usually sold are:
Single-Meter Kit
Single-Meter Kit predisposed for the
addition of more meters
Additional Meter Kit
5-Meter Kit
10-Meter Kit
List of Accessories
Logitech Pro 9000 webcam
Digipod TR-257 tripod
220V FRIWO DT-50 (FW 7405M/24) power supply certified for medical use
Page 9
Version 1.9 Page 9 of 170
1.1 SINGLE METER
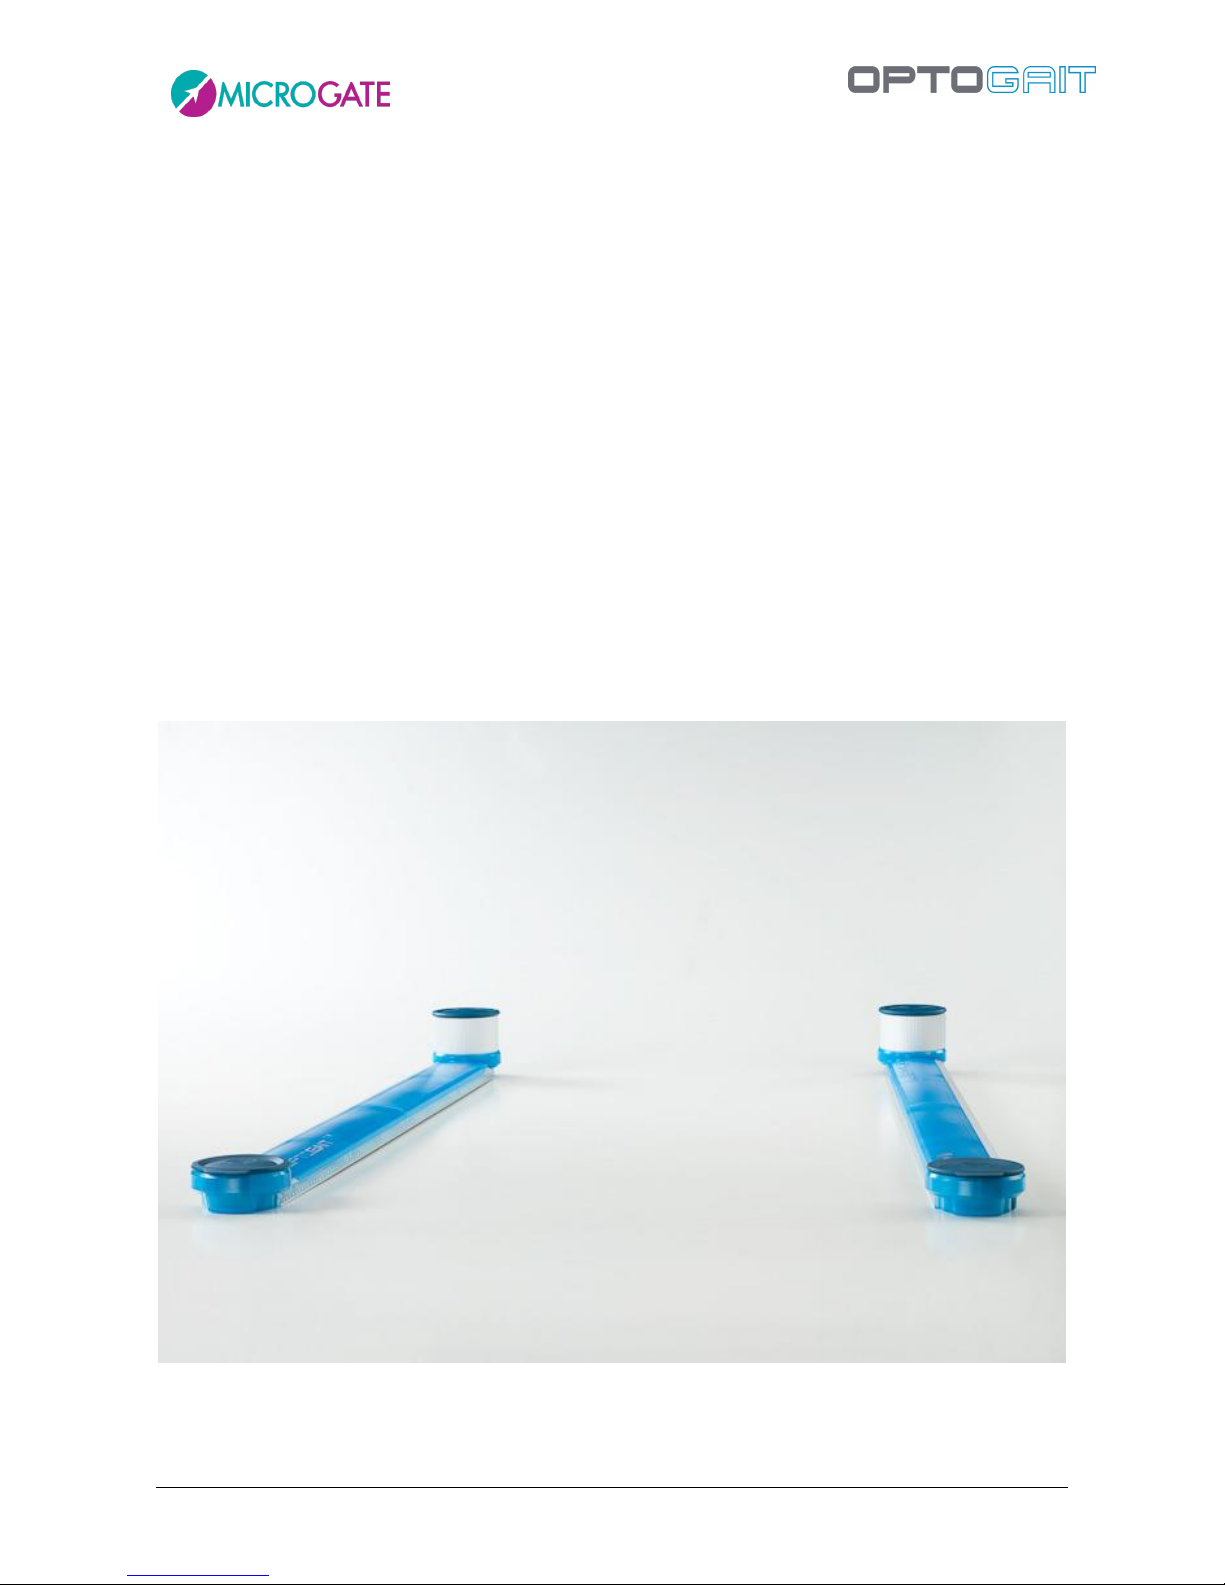
In this configuration Optogait allows already to carry out various test types:
1.1.1 JUMP TEST
A series of exercises (squat jump, counter movement jump, drop jump, continuous jumps, jumps on
one leg, etc.) and protocols ('Drift' for dynamic stability, '5 Dot Drill' for reactivity and endurance,
'Single Leg Three Hops' to verify the bending capacity and stability of the knee) are pre-configured.
At the same time, the user can easily create customized tests or protocols.
1.1.2 TAPPING/FREQUENCY TEST
This type of test is ideal for exercises where separate results are required for the left and right foot
(e.g. tapping/frequency test, side movement, walking on the spot, etc.)
1.1.3 REACTION TEST
This test detects the time between one optical/acoustic impulse and the patient's movement. It can
be used to measure simple reactions or more complex movements.
Page 10
Version 1.9 Page 10 of 170
1.2 SINGLE METER ON TREADMILL
1.2.1 GAIT ANALYSIS, RUN ANALYSIS
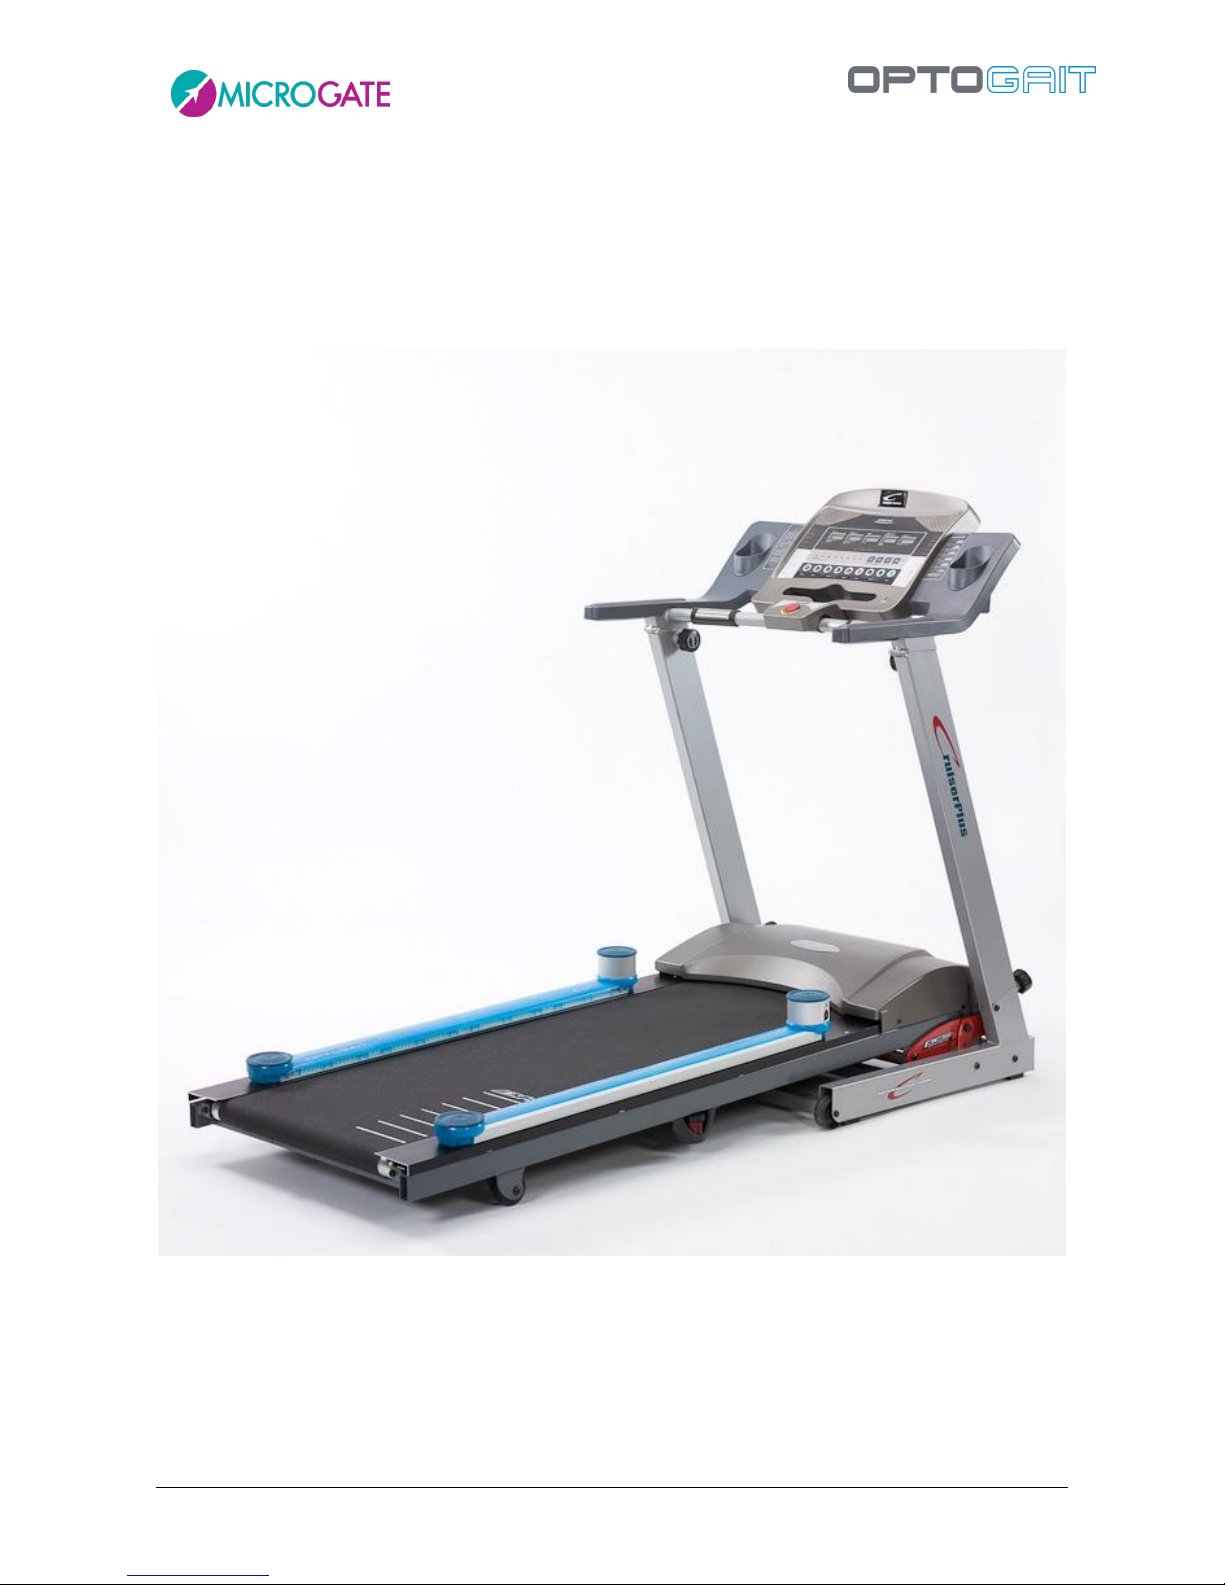
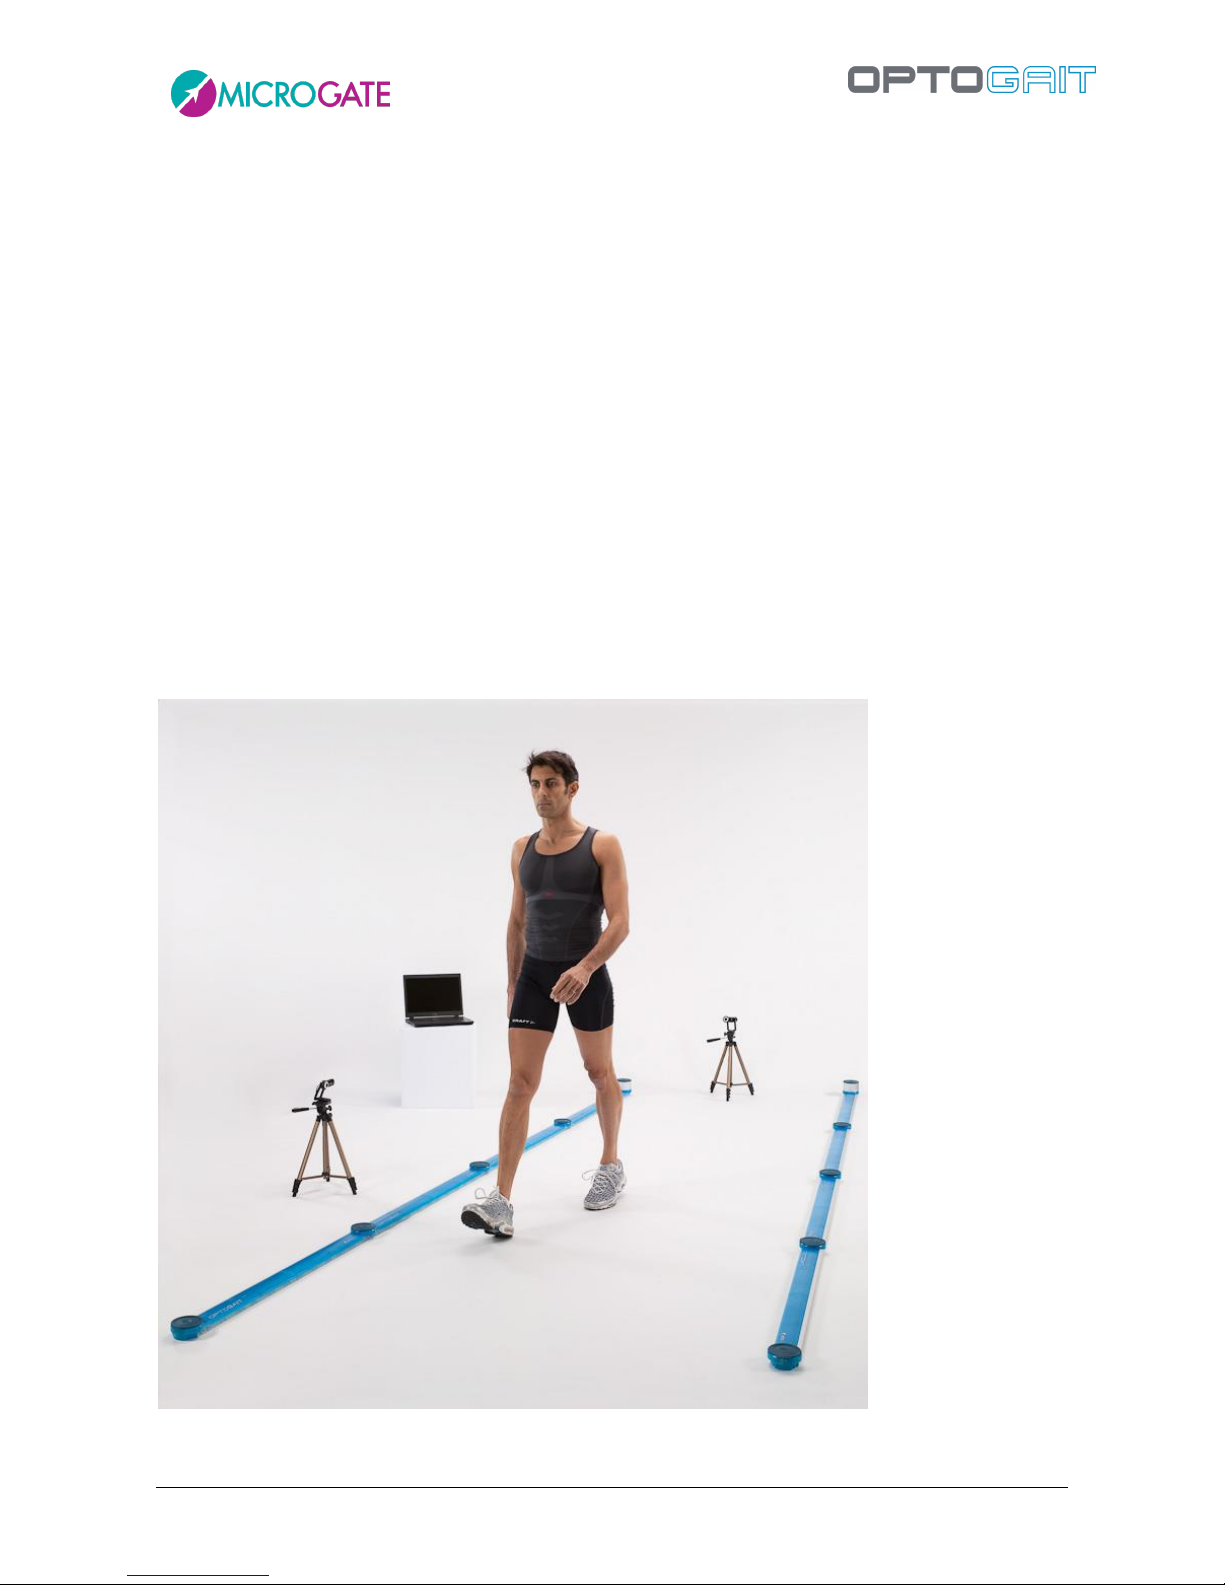
Positioned on the side bars of a treadmill, OptoGait becomes a real portable lab for small spaces
and with reduced costs. The system is compatible with the wide majority of treadmills and no
synchronization is necessary to start and carry out a test.
Page 11
Version 1.9 Page 11 of 170
1.3 THE MODULAR SYSTEM
In this configuration, OptoGait allows to carry out:
1.3.1 GAIT TEST
Gait tests can consist of simple exercises (moving from A to B), but also of more complex ones, such
as 'roundtrip' or walking backwards. They can be more complex, if needed, adding obstacles (e.g.
plastic cones) or actions to be carried out between the various gait phases (sitting down and getting
up before coming back, for example) or simultaneously.
1.3.2 RUNNING TEST
Running tests, just like gait tests, can be carried out either starting from a stand or running, to
analyse the various phases, how the incremental weariness acts on the patient at each round
installing the system on a track, measuring the time of a change of direction and the following
acceleration, and so on…
Thanks to the practical and innovative assembling system using caps, the modular system is
assembled in a few minutes and does not require cables to connect the bars or further net adapters.
The length goes from a minimum of 2 meters to a maximum of more than 10 meters.
Page 12
Version 1.9 Page 12 of 170
1.4 THE TWO-DIMENSIONAL SYSTEM: OPTOGAIT 2D
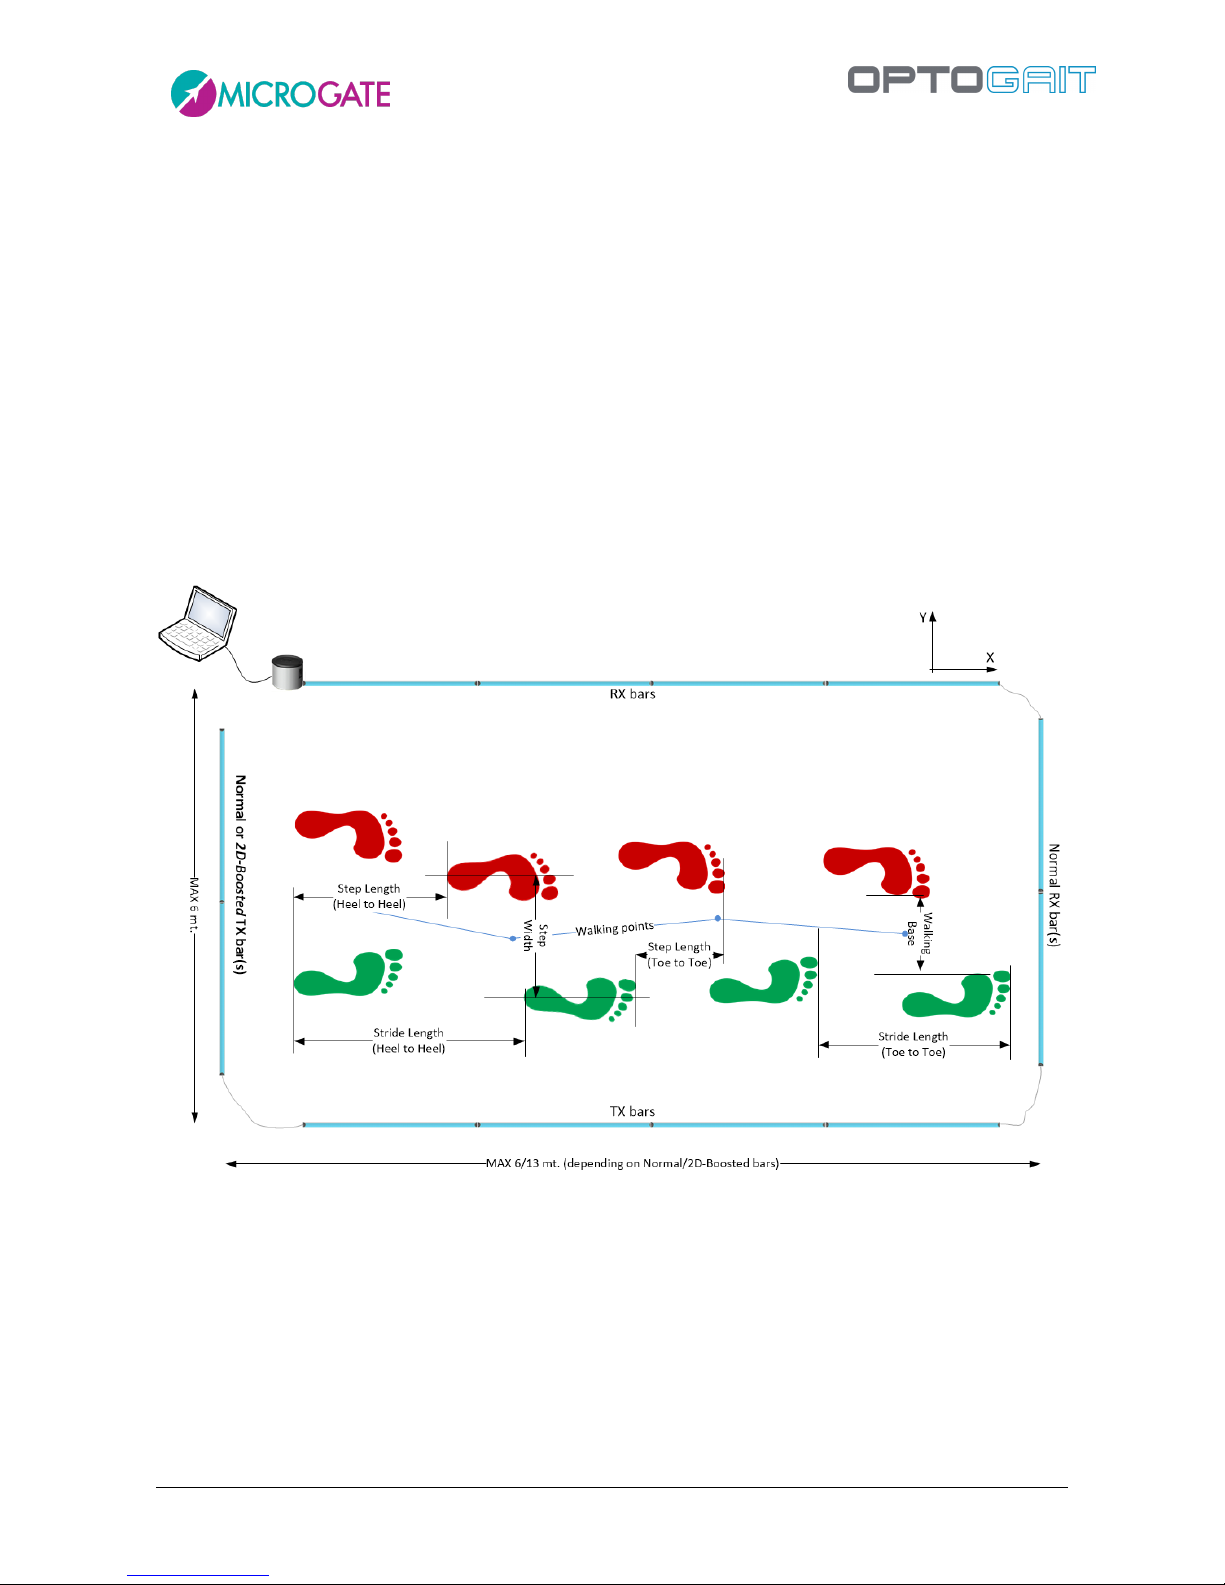
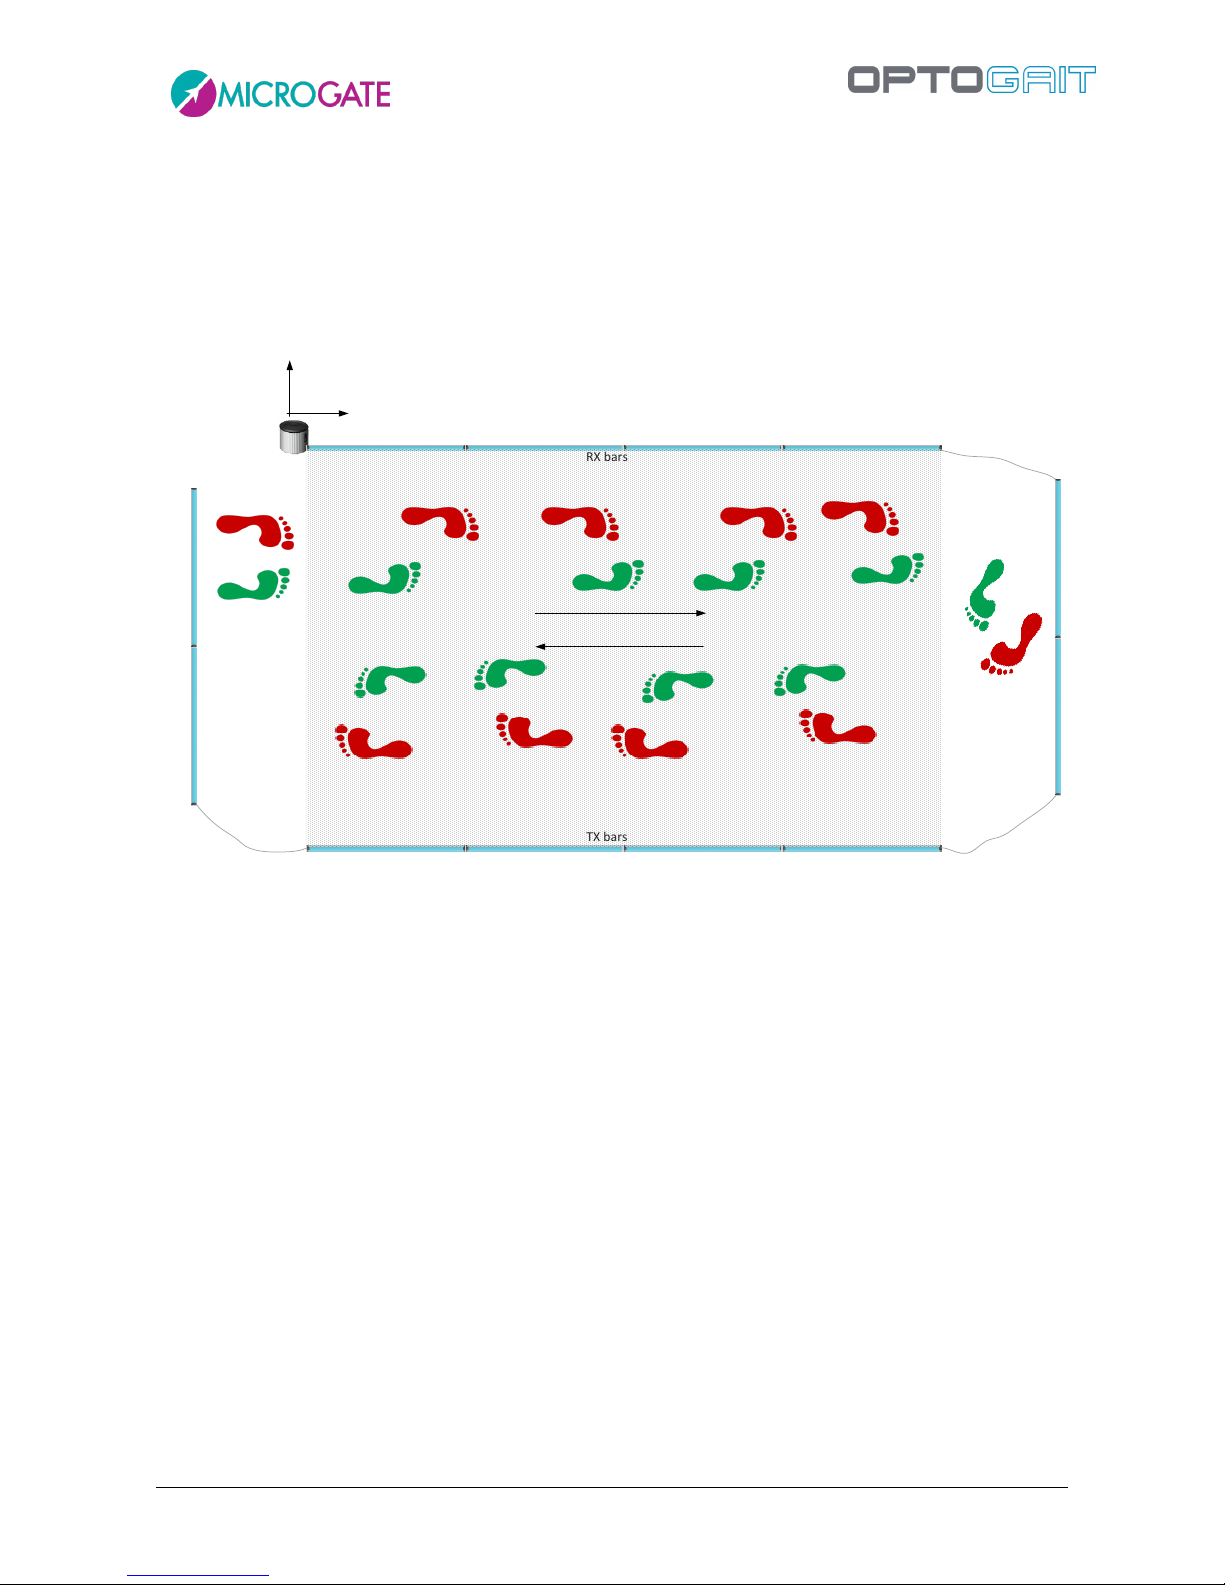
Starting from version 1.7 of the OptoGait software it is possible to use a particular bar configuration
for obtaining a two-dimensional measurement area. To the classic bars (which we will call X) more
bars (Y) can be added to form a rectangle, where new information can be gathered for the gait tests:
Step width: distance between the middle support point of each foot
Walking Base: distance between the innermost foot support points (for superposed steps
this value can be negative)
Walking Points: middle points between the two support feet; their connection defines the
gait progress (Line of Progression); conventionally it is expressed in positive values if there
is a deviation towards left and negative with a rightward deviation
Walking Point Gap: progressive variation of the current walking point with respect to the
previous one
Page 13
Version 1.9 Page 13 of 170
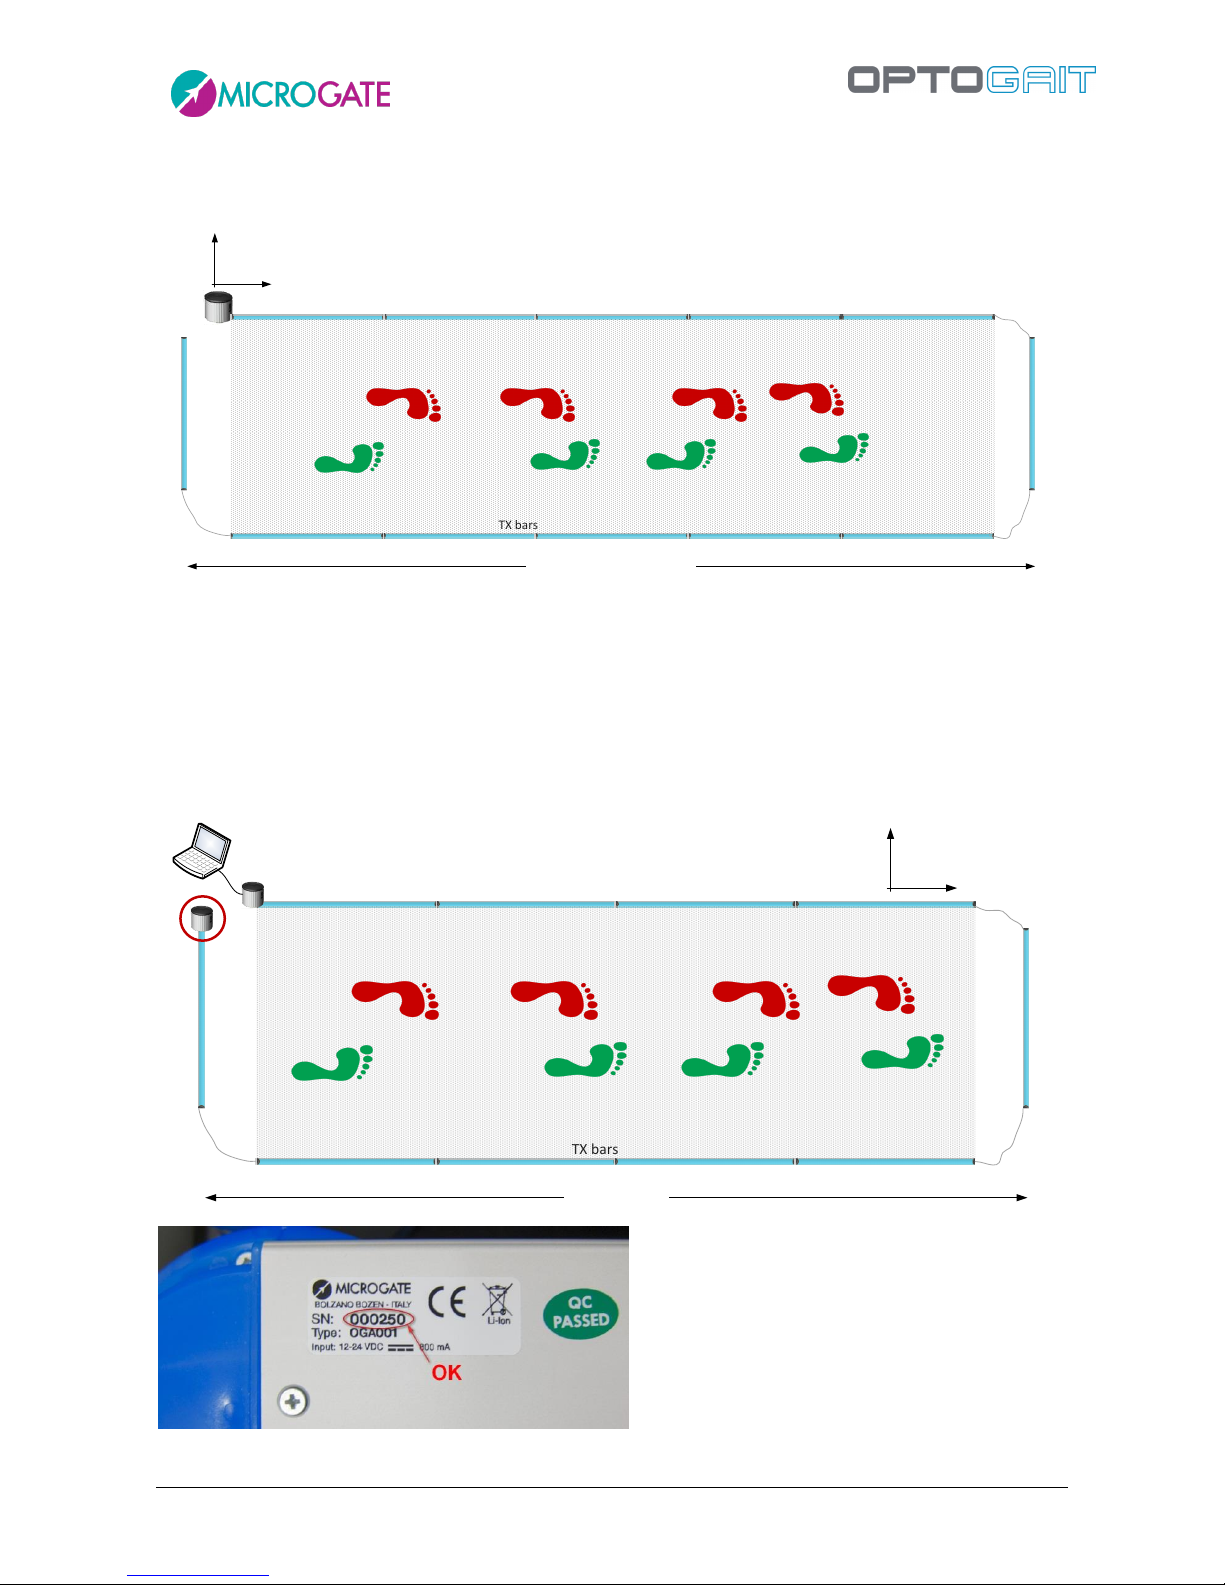
The regular OptoGait bars have a maximum transmission/reception distance of 6 meters; with this
hardware you can use at the most 5 meters of 'X' bars and approx. 50 cm of room with the 'Y' bars.
Normal TX bars
RX bars
TX bars
X
Y
RX bars
MAX 6 mt. (eg. 5mt bars + 0,5mt x 2)
The regular closing Y TX bar is usually a bar WITHOUT interface drum. Updating the firmware of the
TX bar with drum (already included with all articles having a serial number higher than 00250) this
last hardware type can also be used. Therefore with a 5-meter modular system (Kit £OGA051) it is
for example possible to use the complete hardware building a 4-meter-long linear gait system. For
serial numbers lower than 00250 it is possible to ship the bar to Microgate or a distributor and
receive a free update (shipping costs for sending and receiving are excluded). It is also possible to
buy one or more additional single TX bars.
Normal TX bars with Interface
ONLY with S/N >= 00250
RX bars
TX bars
X
Y
RX bars
4 mt bars (Kit 5 mt)
Page 14
Version 1.9 Page 14 of 170
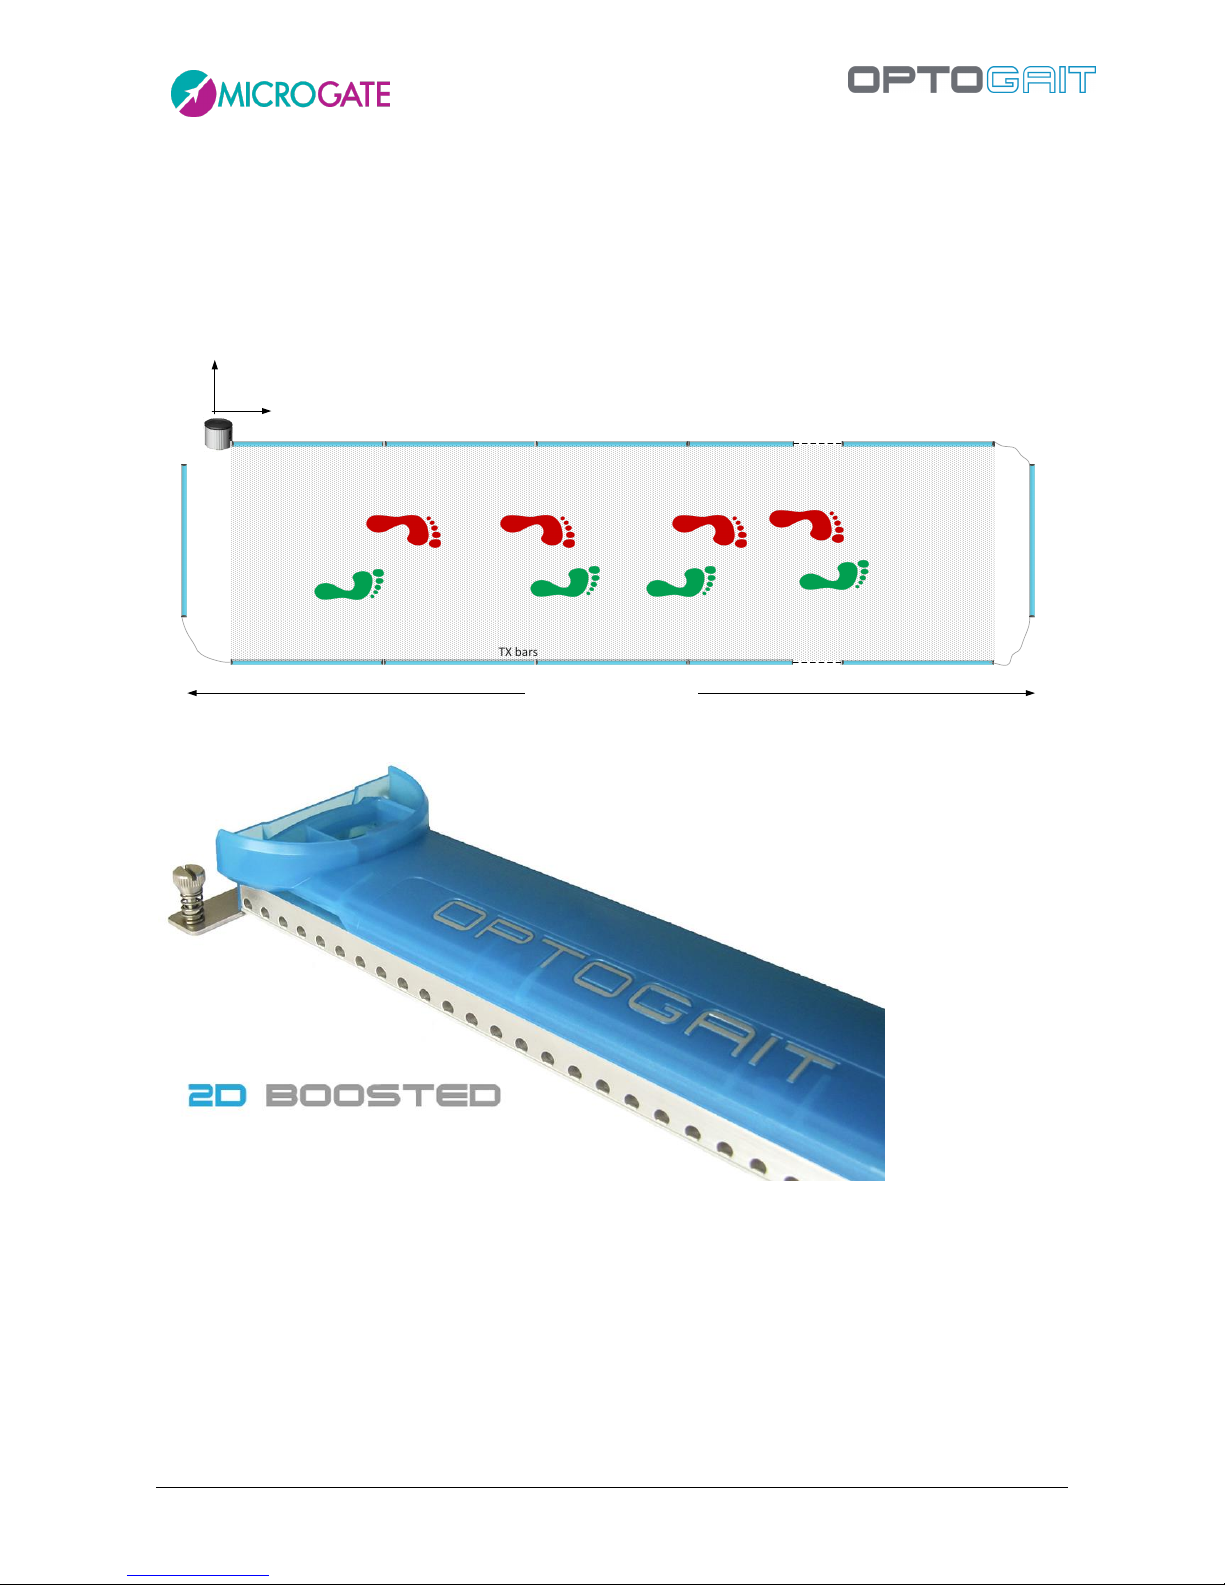
The maximum length of the 2D course can be increased up to 13 meters purchasing one or more
special Y TX bars called '2D-Boosted'. This kind of bar is equipped with stronger transmission LEDs
compared to the others and has a front aluminium cover instead of the transparent lenses, in order
to direct the narrow infrared LED beam. To help the Y bar alignment at great distances (especially
with not perfectly smooth ground), the 2D-Boosted bar is equipped with mechanical trimming
devices for applying micrometric elevation and inclination changes.
2D-Boosted TX bars
RX bars
TX bars
X
Y
RX bars
MAX 13 mt. (eg. 11mt bars + 1mt x 2)
Page 15
Version 1.9 Page 15 of 170
The bars situated on the perpendicular sides are connected using a variable-length cable (usually
1.5/2 m); this allows to distance the actual measurement area (the rectangle formed by the regular
bars and highlighted in grey in the following picture) of the Y bars; this area allows the patient to
leave the test area without having to jump over the bars or - more frequently - turn around by 180°
and go back. In fact, the software allows to carry out an undefined number of back/forth courses
recording a sufficient number of steps also in case of linear systems of only a few meters.
[Boosted] TX bars
RX bars
TX bars
X
Y
For those requiring fixed installations (which are also aesthetically appealing), a corner cover is
available (without LEDs, only for protection) to cover cables running on the ground (see first
picture).
Page 16
Version 1.9 Page 16 of 170
1.5 ENVIRONMENTAL CONDITIONS AND DISCLAIMERS
The system is intended only for indoor use and at a height of max. 2000 m a.s.l. Operating
temperature 0°C ~ +35°C
As of the manufacturer's specifications only the intended use is allowed.
The estimated product life cycle is of 20 years.
Positioning of the bars on the ground
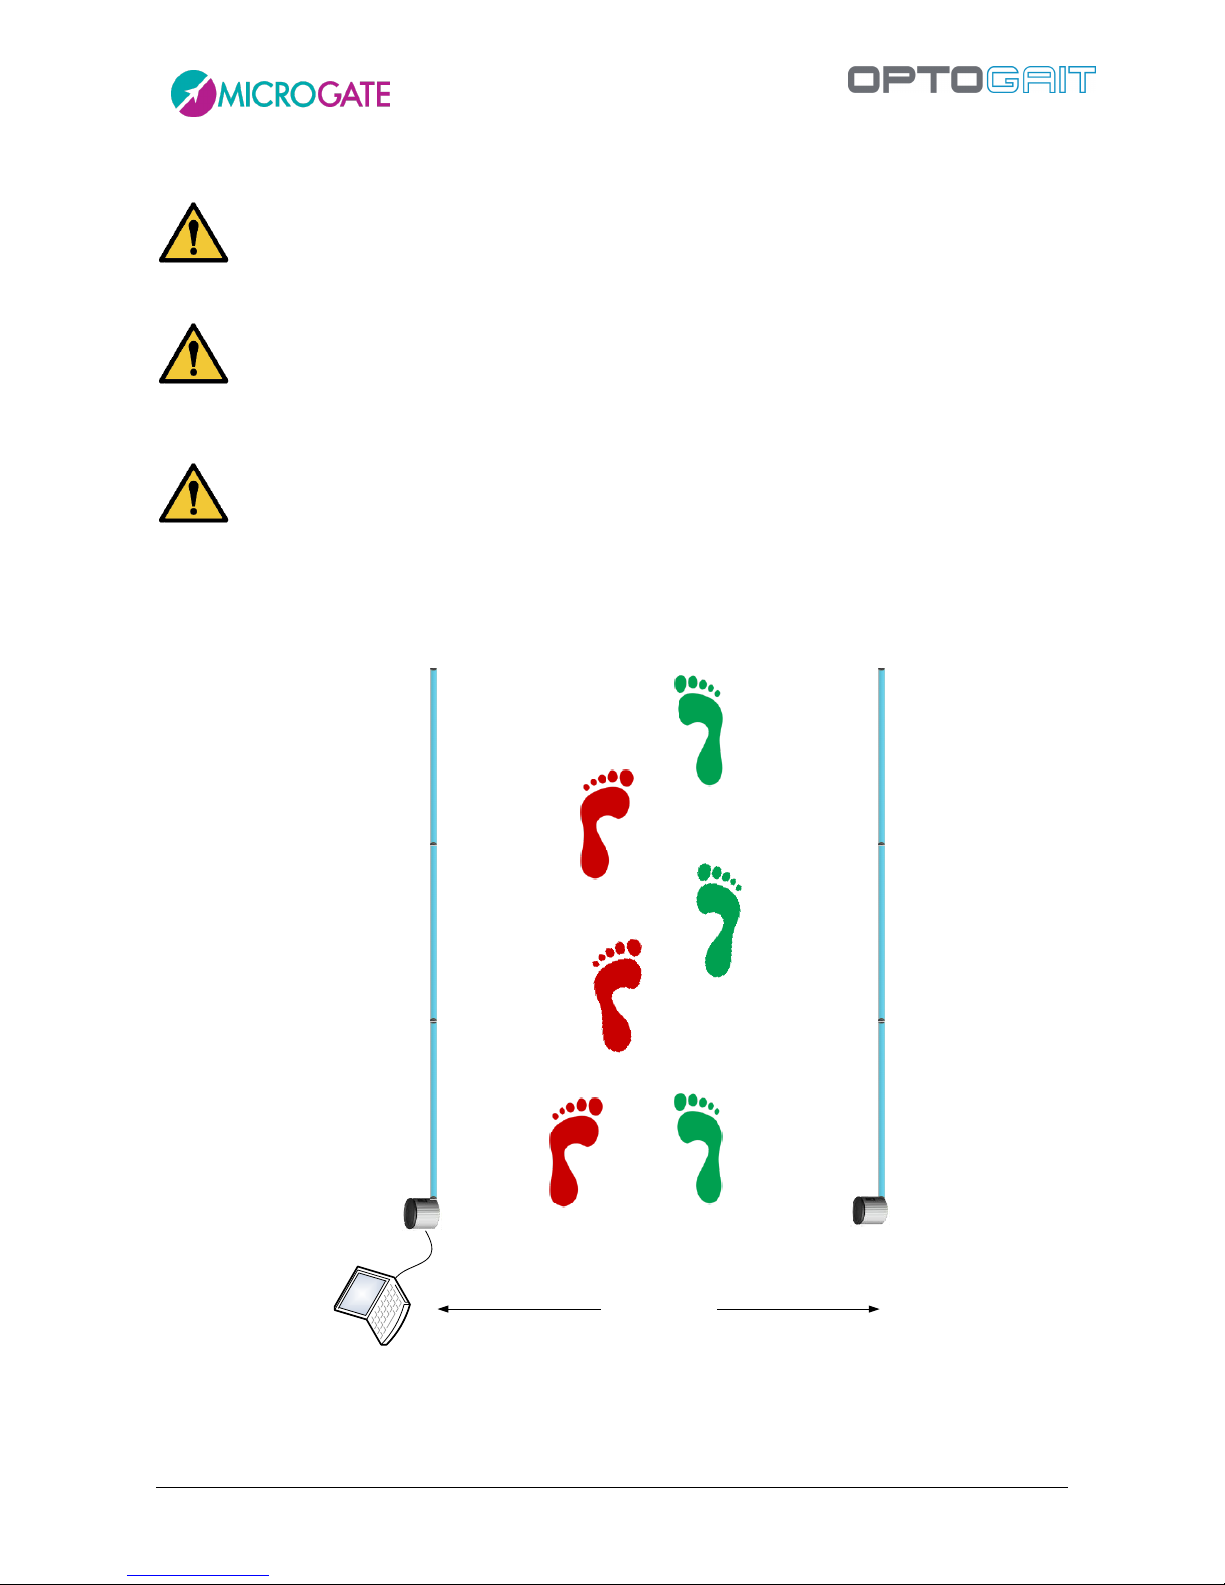
To avoid interferences between the patient and the bars, we advise a distance of at least one meter
between the bars and we advise to pay attention that bars don’t hinder the gait. Maximum distance
must not exceed 6 meters.
MIN 1 mt (suggested)
MAX 6 mt.
RX bars
TX bars
Page 17
Version 1.9 Page 17 of 170
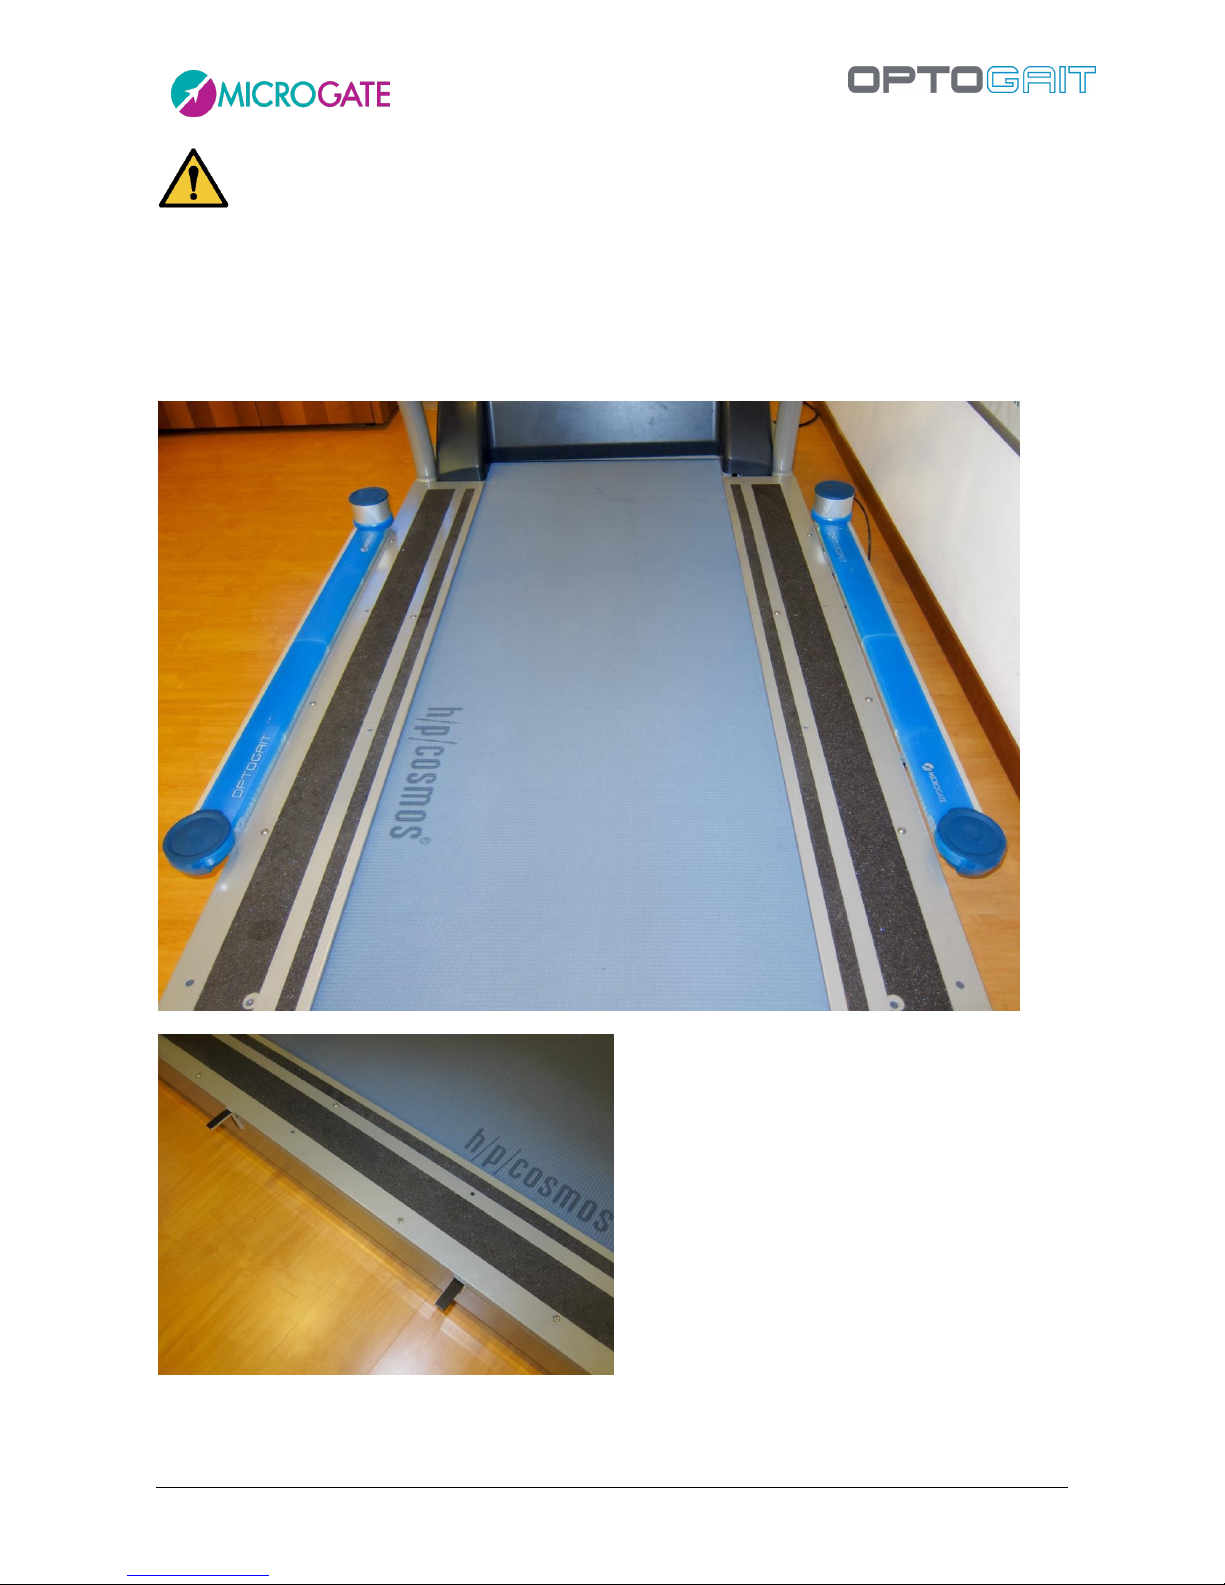
Positioning of the bars on the treadmill
The bars must be positioned at the sides of the treadmill so that the minimal safety distance planned
by the producer is obeyed. We recommend fixing "L" stirrups outside the chassis.
When mounting the bars on the treadmill ensure that vibrations caused by walking/running do not
move or make the bars fall down or onto the mobile area.
Page 18
Version 1.9 Page 18 of 170
2 SOFTWARE
The interface with which the OptoGait system is managed is divided into three main sections:
Patients’ Personal Data, Tests and Results.
2.1 INSTALLATION
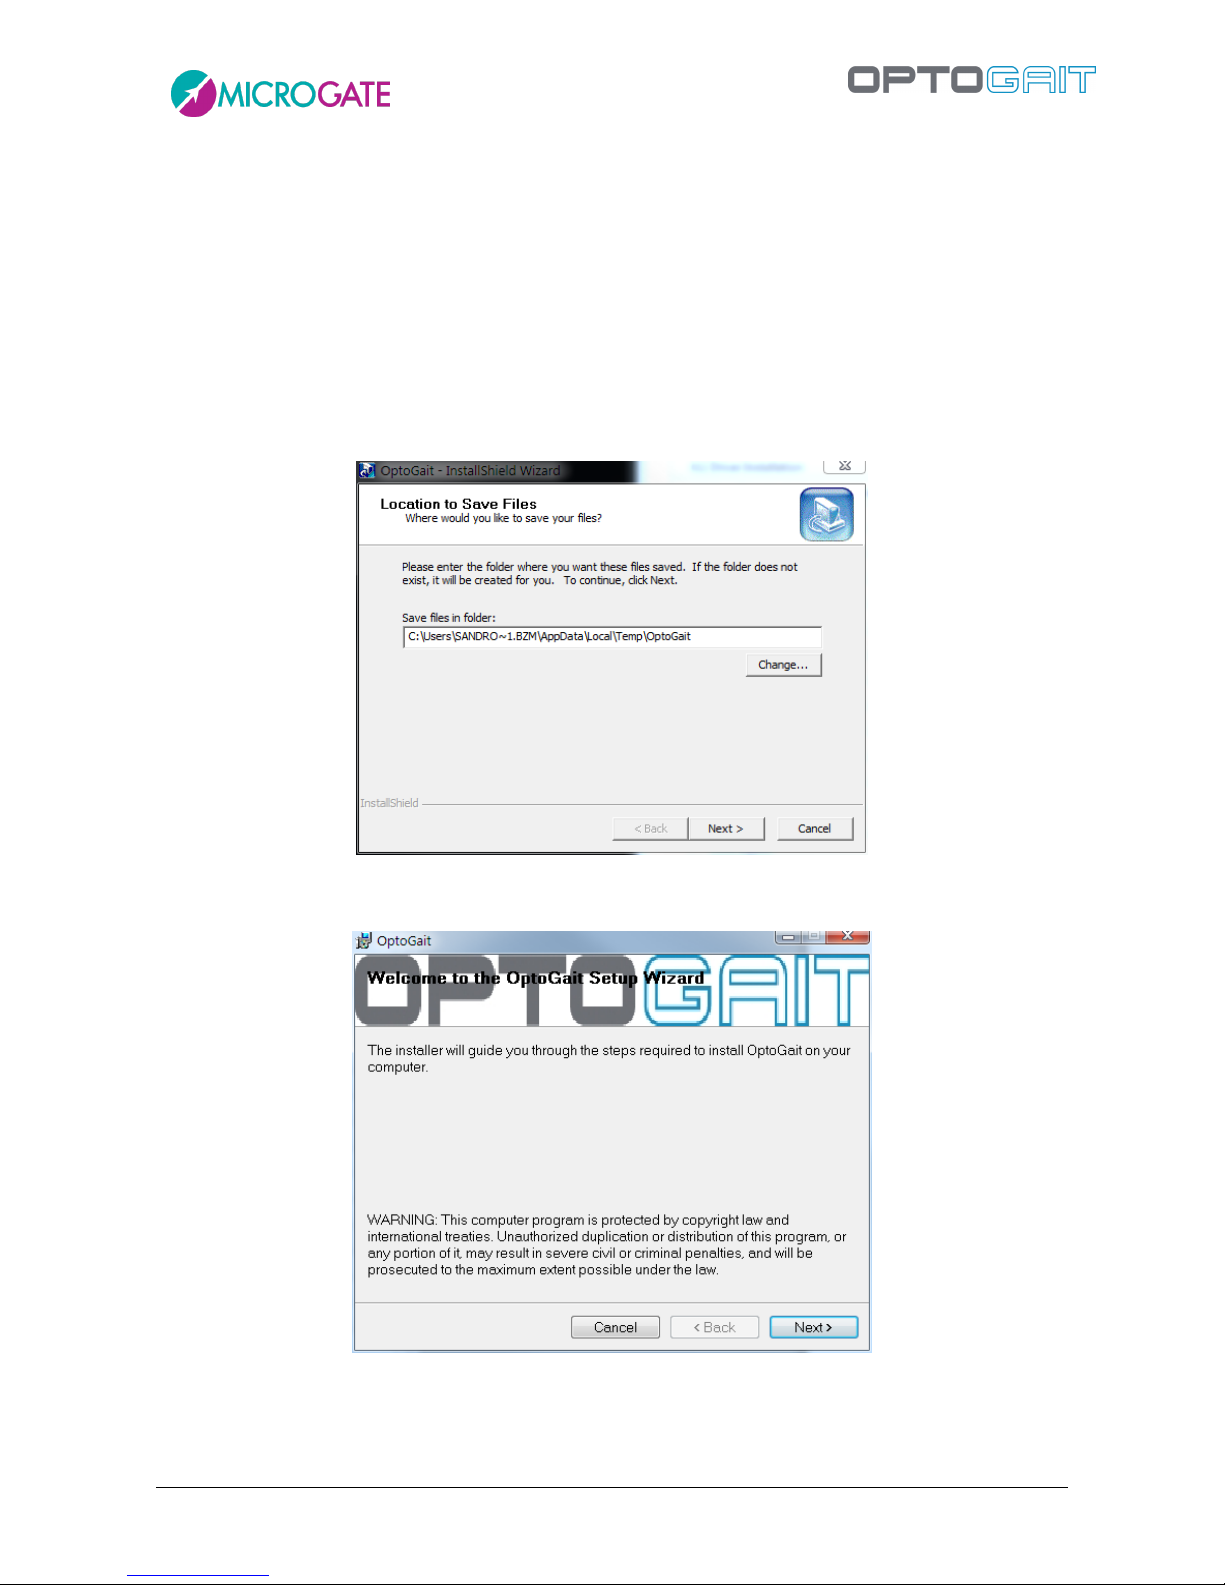
Start the OptoGait.exe. setup program in the usual way for Windows.
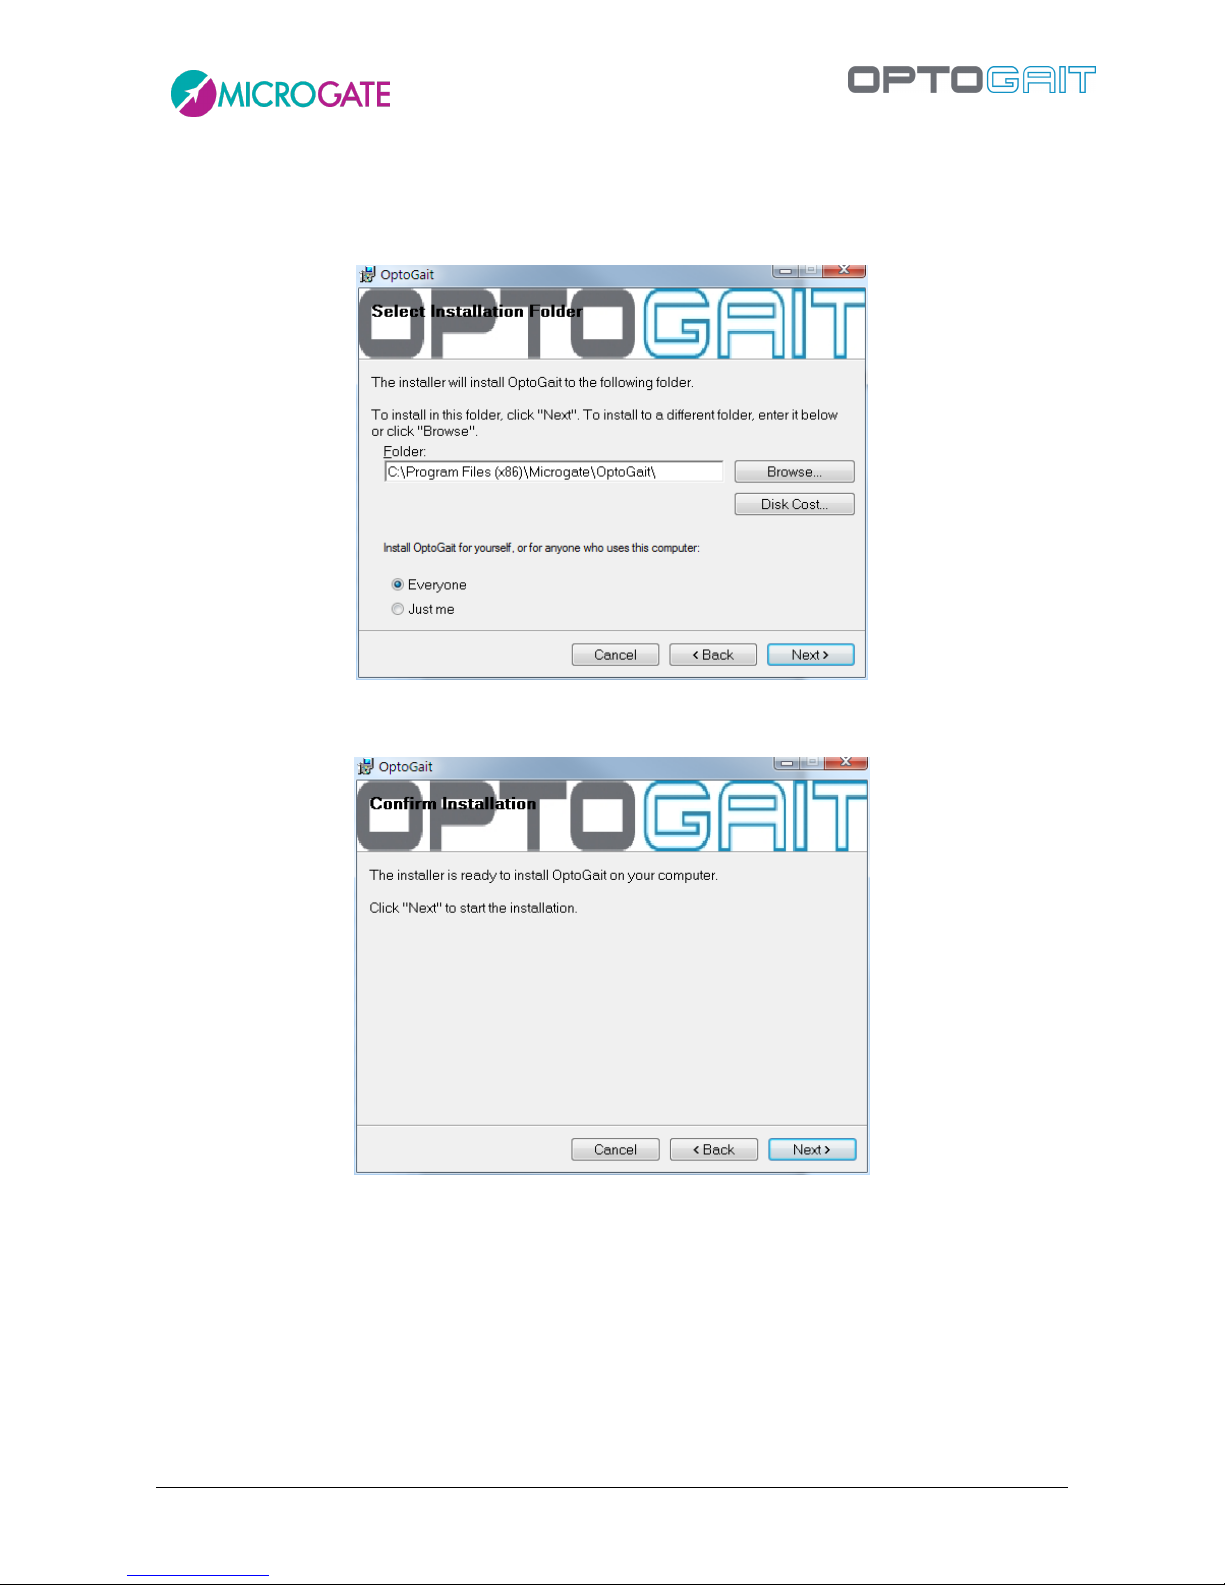
In the first installation window the user is asked where to save the files for the installation of
OptoGait. We advise you to leave the directory unchanged and to click on <Next> to continue.
Figure 1 – Installation wizard
In the first installation program window click on <Next>.
Figure 2 – Installation - welcome.
In the next window you can insert a folder where the software will be installed.
Page 19
Version 1.9 Page 19 of 170
If you want everyone with access to the computer to be able to use the product, select “Everyone”,
otherwise select “Just me”.
We advise you to leave the folder unchanged and select “Everyone”. Click on <Next> to continue.
Figure 3 – Installation – data insertion.
The next window offers to launch software installation. If all the data is correct, click on <Next>.
Figure 4 – Installation – confirm installation
The setup program will install the product on the PC, showing state of progress.
Page 20
Version 1.9 Page 20 of 170
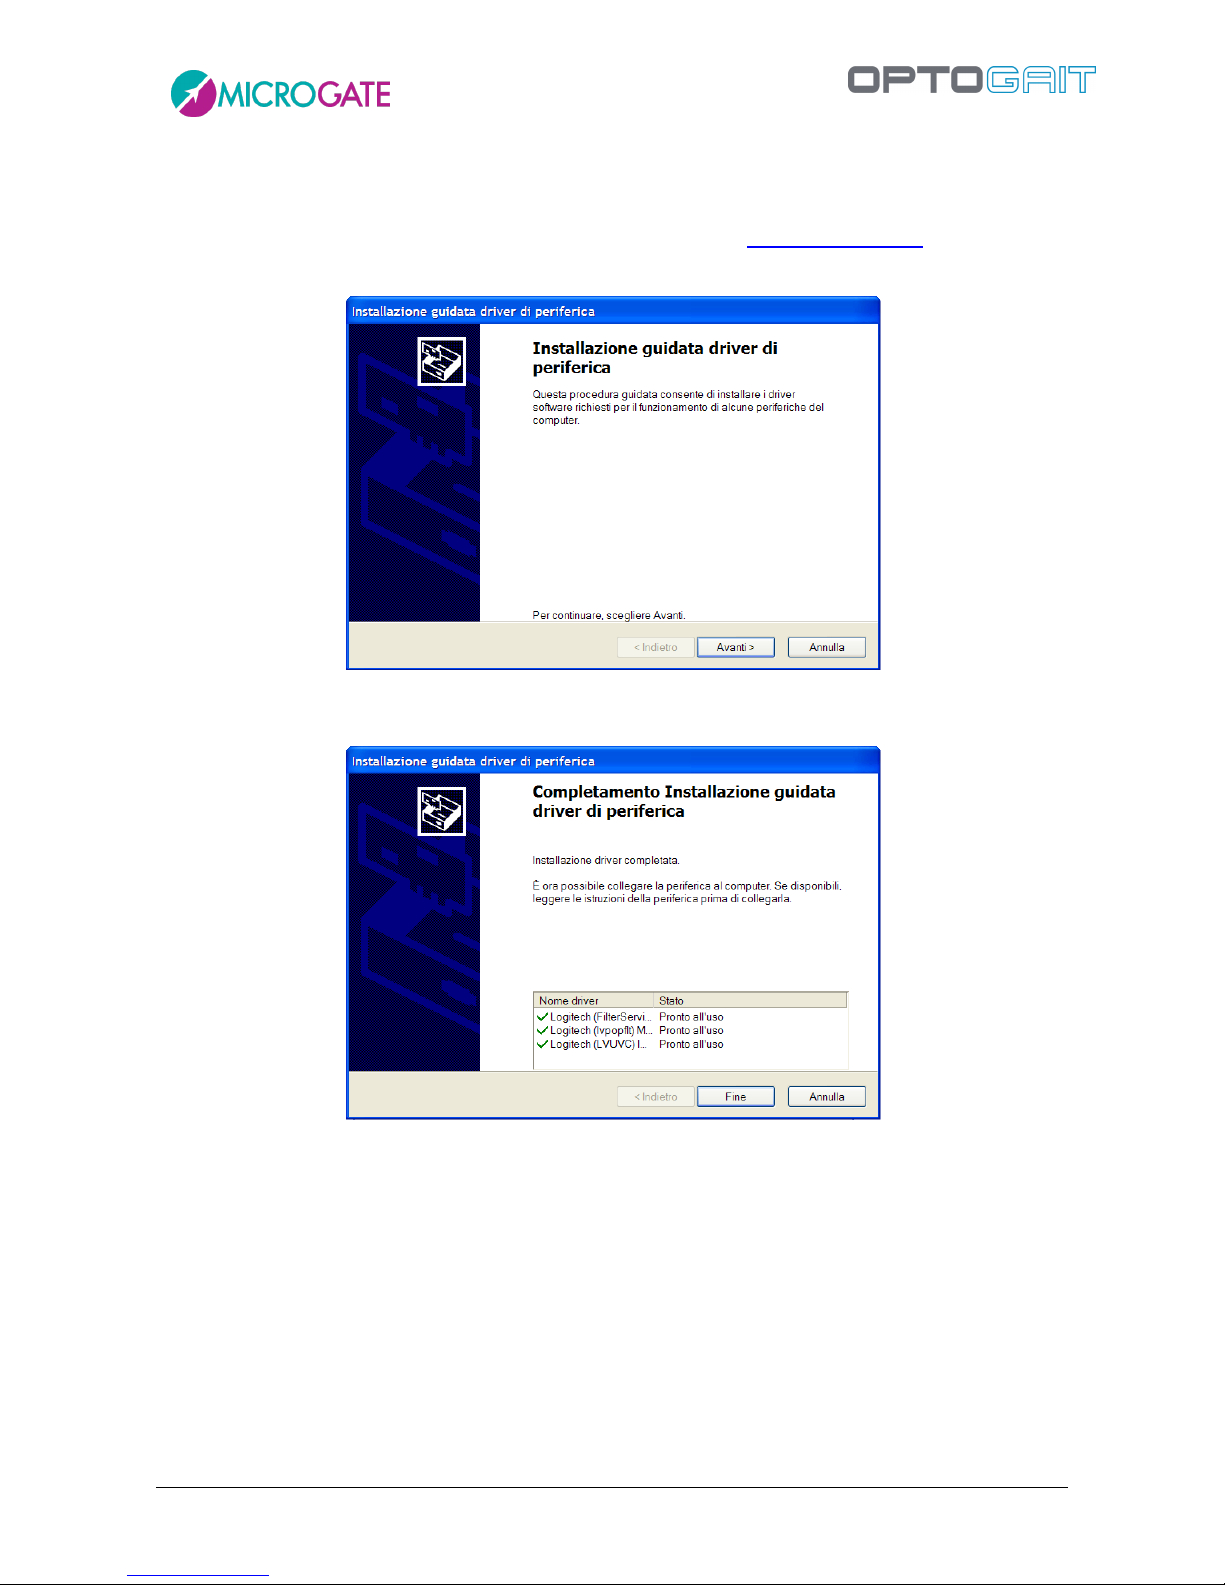
During installation the OptoGait and Logitech webcam drivers will also be installed.
If for any reason this does not happen, please install the drivers separately. These are available on
the Microgate USB key supplied with the hardware or on the www.optogait.com website in the
support section.
Figure 5 – Driver Installation
Press <Next> to install the drivers and then <Finish> to complete installation.
Figure 6 – End of driver installation
Page 21
Version 1.9 Page 21 of 170
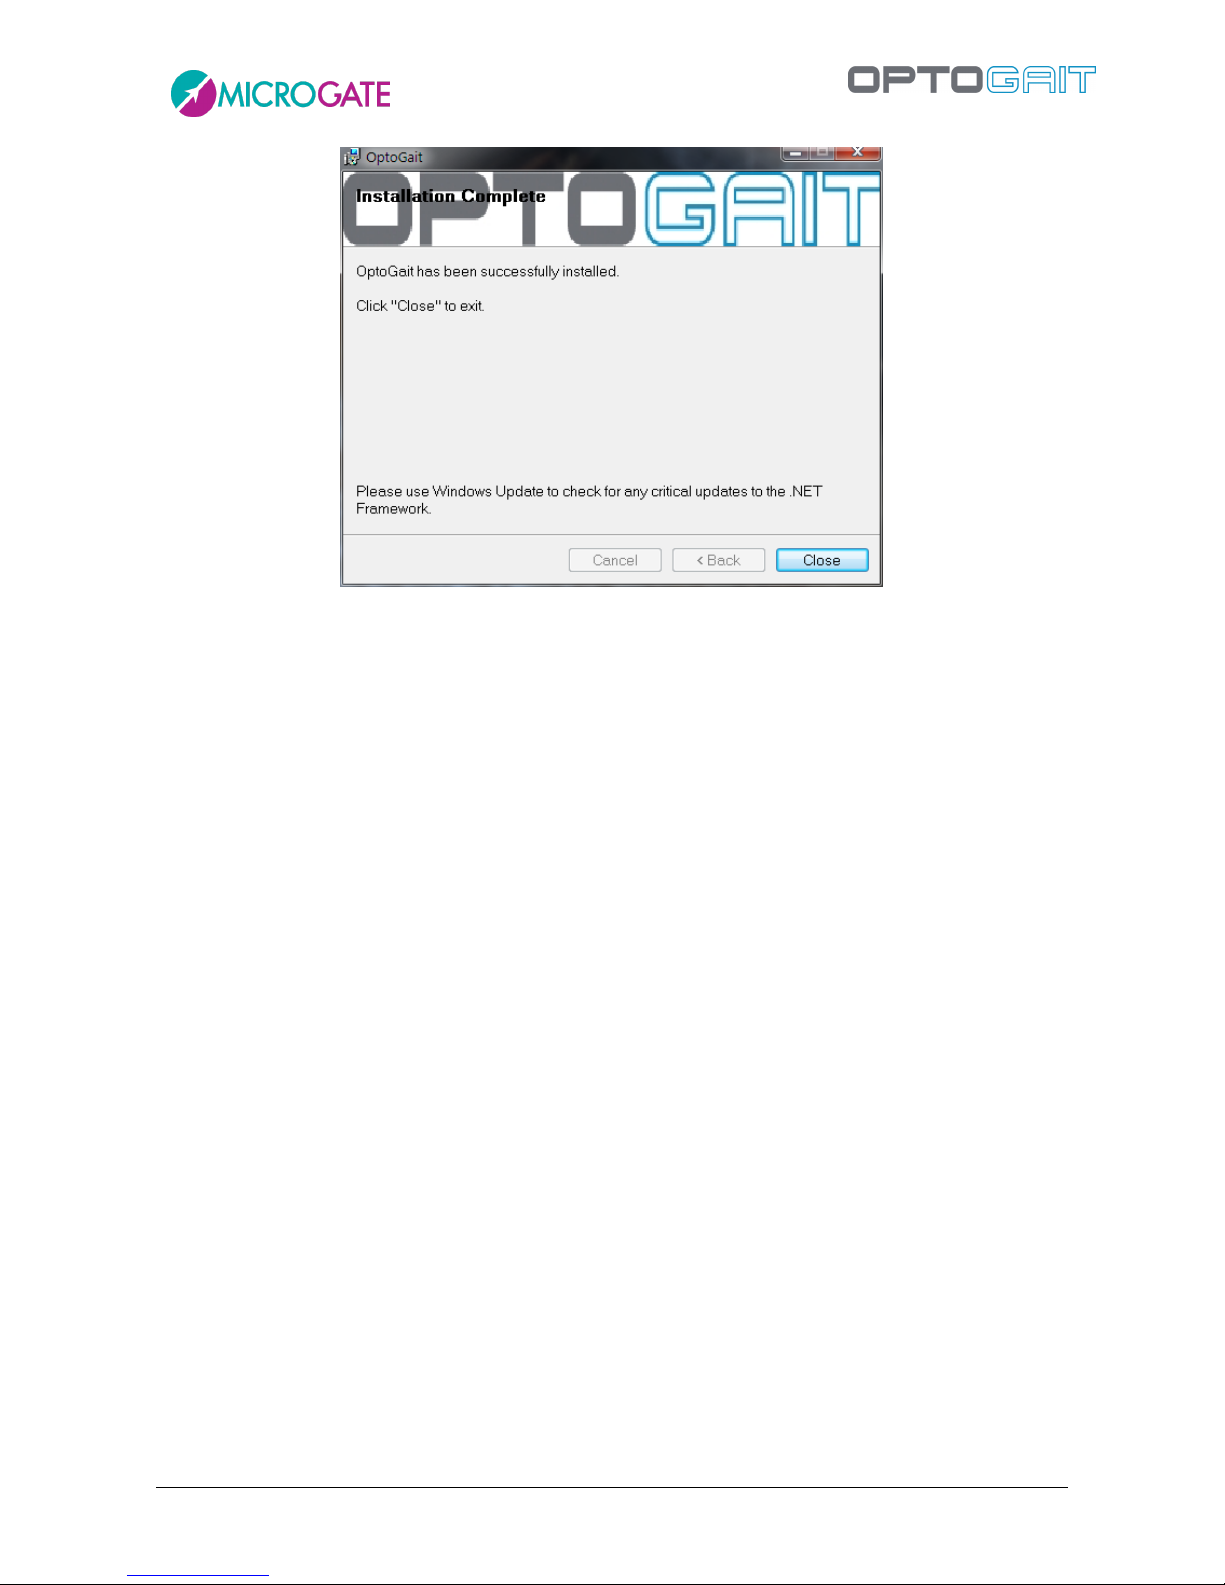
Figure 7 – Installation – completed.
By clicking on <Close> you exit the installation procedure.
During the entire installation procedure, it is possible to return to the previous window by clicking
on <Back>.
Page 22
Version 1.9 Page 22 of 170
2.2 DESCRIPTION
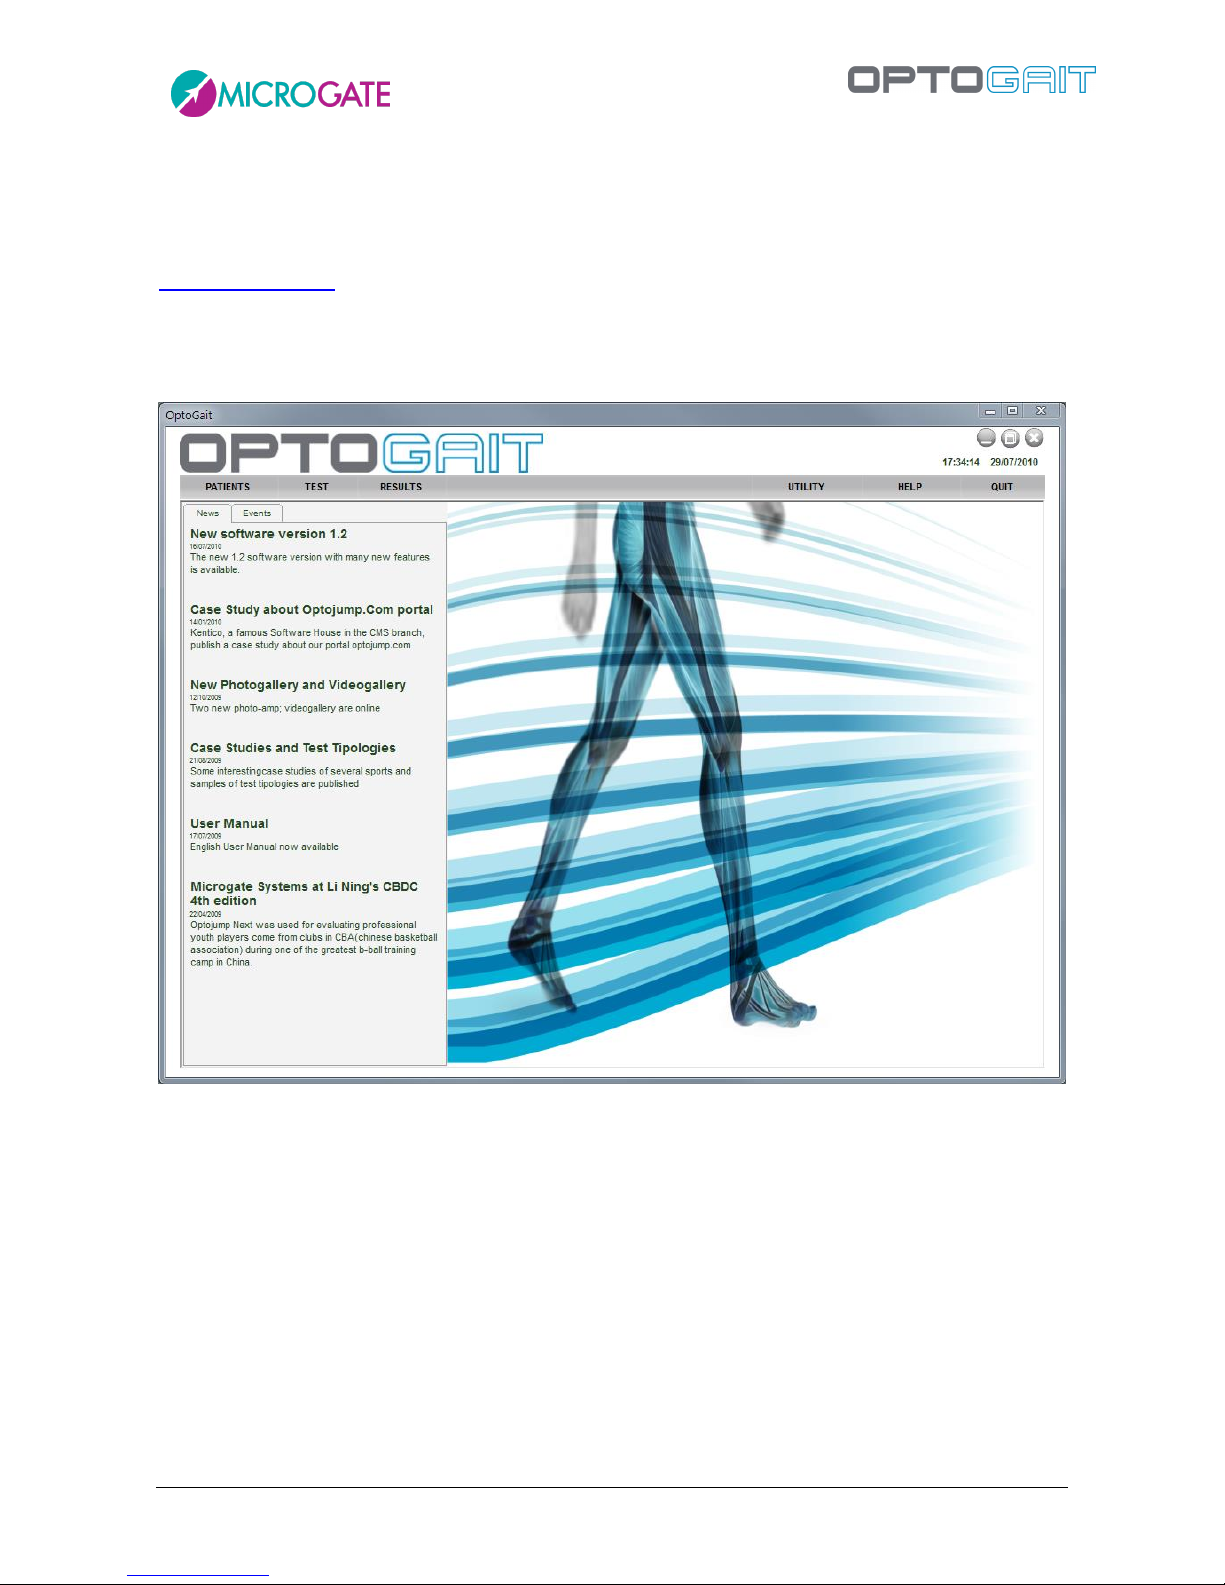
The welcome screen of the OptoGait software shows a horizontal bar with the most important menu
items and an area with News and Events, which are automatically updated from the web site
www.optogait.com in the appropriate language. In case of missing Internet connection, the
information will not be downloaded; it is also possible to deactivate the Internet connection with a
configuration parameter (see chap. 4.4.1.7). Click on a news title or an event to open the complete
description in a browser window.
Figure 8 – First page
The interface with which the OptoGait system is managed is divided into three main sections:
Patients, Tests and Results.
2.3 PATIENTS
This is the section where the patients' profiles are created and stored. A profile can contain all sorts
of information: personal data, notes, patient photo, etc. Each patient can be added to one or more
groups or subgroups. Therefore the Athletes' Personal Data can be fully customized and adapted to
the user's requirements, and imported and/or exported from/to other programs or formats (xml,
Excel, etc.).
Page 23

Version 1.9 Page 23 of 170
2.4 TEST
This section is the software’s nerve centre. It is accessed to devise and configure new tests (jump,
reaction, running, etc.) and to perform tests by choosing from the pre-defined tests or those created
by the user. It is furthermore possible to group several tests (protocols), if this is useful for
measuring particular capacities or conditions (some protocols are already pre-configured, e.g. for
measuring reactivity and dynamic stability).
During the test, the user receives three kinds of feedback in real-time: numerical, graphical and
video (from one or two webcams). If the starting foot has been previously selected, the results are
calculated assigning the values to the left or right leg. Once confirmed the test, all three types of
data are stored and are available for immediate editing or further use in future. The user can also
temporarily hide certain unnecessary information (e.g., if the video is of importance for the user,
the images can be viewed full-screen).
2.5 RESULTS AND VIDEO ANALYSIS
The tests carried out previously can be recalled at any moment accessing the Results area. Selecting
a test and clicking on 'View', (numerical or graphical) data can be compared with the images. The
video is of great help to the user to detect immediately postural or motor problems, and, more in
general, to carry out a qualitative analysis. In fact, thanks to the 'video memory', possible anomalies
of the numerical data can be easily identified and motivated.
The video images are synchronized with the data. This allows to verify with accuracy what has
happened at the time of acquisition of a certain value (e.g. if a contact time is extremely long, it is
possible to look for the cause viewing the images of the instant, when the value has been recorded).
Synchronization is carried out automatically by the software; no user action is necessary. The video
reproduction speed can be reduced down to a still image, to view the video frame-by-frame. A video
analysis utility is also provided, with traditional tools such as lines, arches, circles, text, ruler,
goniometer to measure angles and other.
In the Results section two or more tests can be compared ('Compare' option) using the video as well
as the data, having all necessary information at disposition. This allows to quickly and intuitively
carry out an analysis of quantitative and qualitative differences between tests carried out at a
different time (pre-/post- rehab, for example) or between different patients (healthy and rehab).
If more than two tests are to be compared, the 'History' function must be used, which allows to
select an infinite number of tests to verify the parameters (indicated when a patient's progress must
be measured constantly carrying out numerous tests).
All data, numerical and graphical, can be printed or exported to the most common formats).
2.6 REPORT
After having carried out and saved a test, two reports are immediately available:
Gait/Run Report – specific report for gait or running tests, with average values, standard deviation
and variability coefficient of all typical parameters (*) for the left and right leg. Furthermore, any
possible asymmetries and imbalances between the legs can be spotted instantly.
Page 24

Version 1.9 Page 24 of 170
The same report type is available when selecting two tests, allowing for a quick comparison thanks
to a graphically intuitive and clear interface.
Gait/Run reports show also if the patient's parameters are within the normal range of values.
Extended Report – contains all numerical and graphical data, stored step by step during the test.
In both report types it is possible to add screenshots taken with the video utility available in the
'View' option, as well as in the 'Compare' option.
The Software is currently available in 7 languages (Italian, English, German, French, Spanish,
Japanese and Chinese), with translation in progress for others.
Page 25

Version 1.9 Page 25 of 170
3 OPTOGAIT DRIVER AND HARDWARE INSTALLATION
3.1 DRIVER INSTALLATION
For correct functioning of the program, the respective drivers for the OptoGait hardware and the
webcam must be installed.
The OptoGait software installation file already contains the required drivers.
With regard to the Vista operating system it has been found that if the installation program is not
run as ‘Administrator’, the drivers are not installed. In this case, install the two drivers separately.
These are available on the Microgate USB key supplied with the hardware or on the site
www.optogait.com in the 'Support' section.
To verify that the drivers have been installed, connect the two devices (OptoGait hardware and
webcam). If installation has not taken place, the operating system will signal an error. If this occurs,
disconnect the hardware, reinstall the drivers and reconnect the hardware.
3.2 OPTOGAIT HARDWARE INSTALLATION
Attention must be paid when installing the OptoGait bars, particularly when inserting the caps for
connecting the bars.
A distinction must be made between the Tx and Rx bars and additionally between bars with interface
(silver drum at start of bar) and without interface. Only the interfaces have an OFF switch.
Figure 9 - Interface "drum"
ON/OFF switch
Power Supply
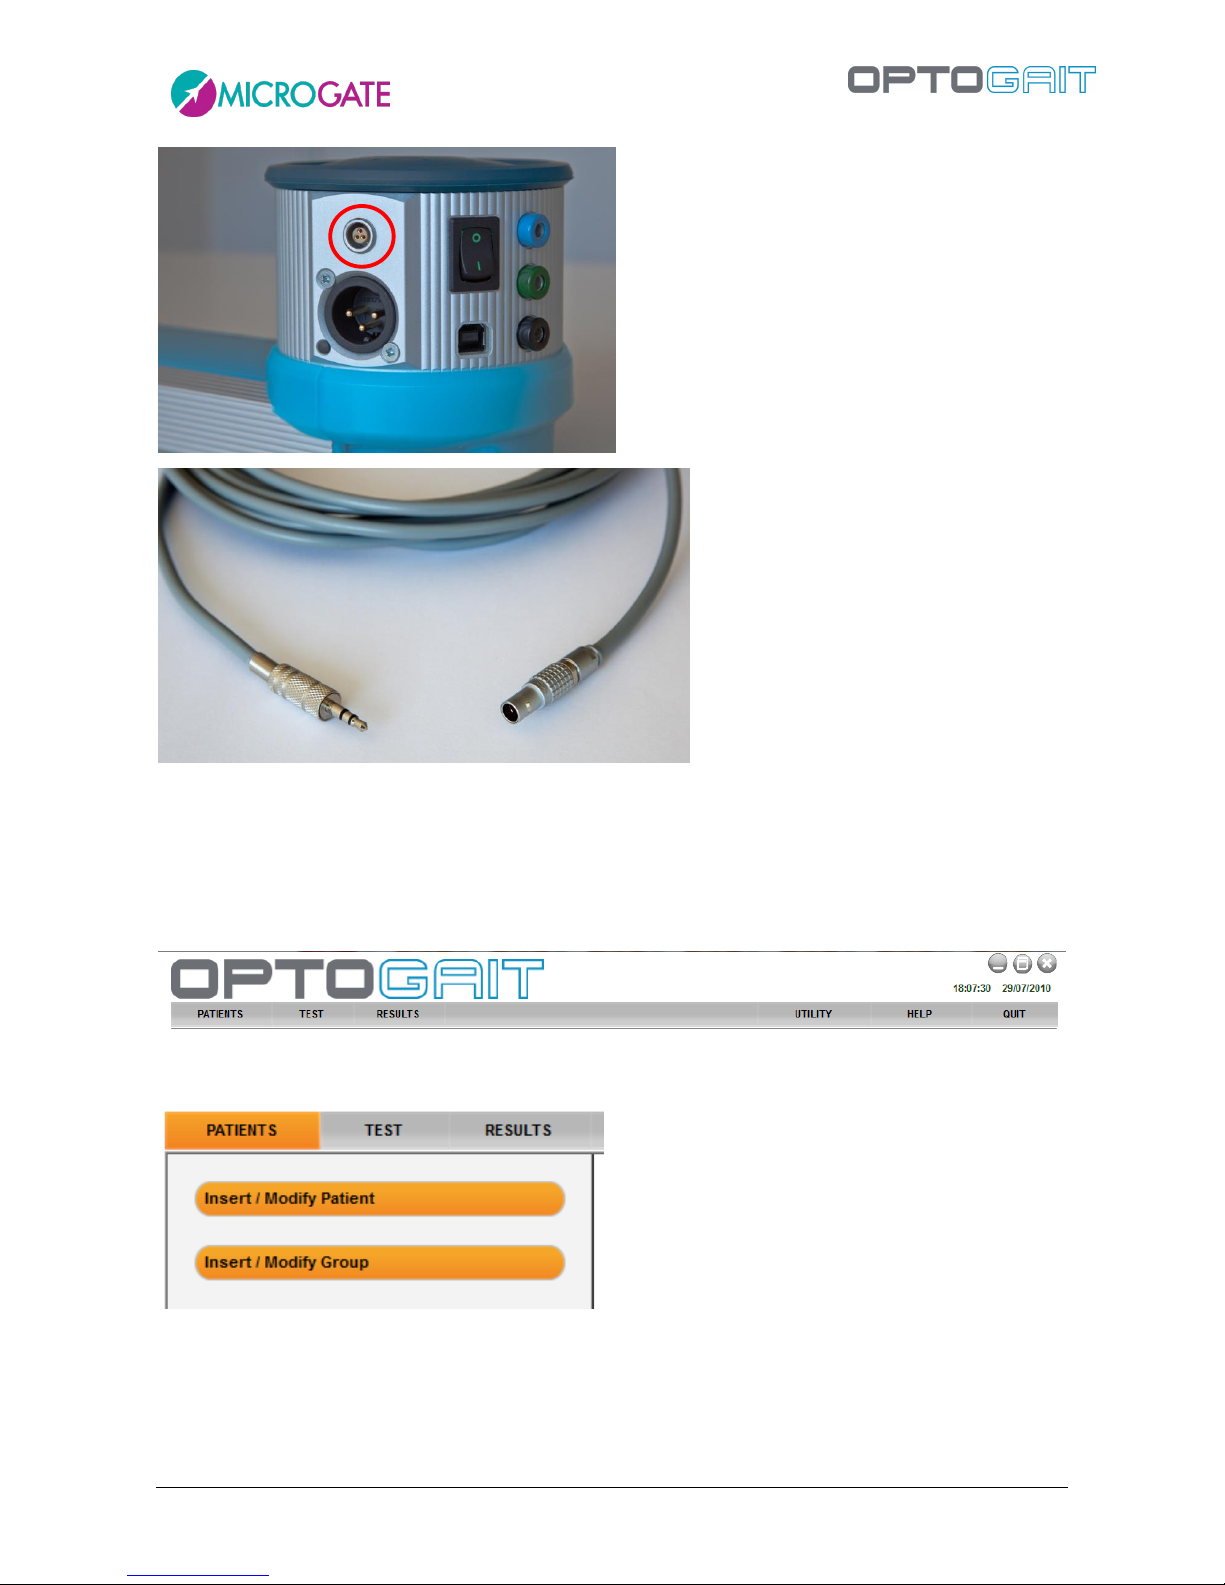
Lemo connector EMG
USB socket
Jack sockets for external events
Normally closed (blue)
Normally open (green)
Grounding (black)
Page 26
Version 1.9 Page 26 of 170
Below is the step-by-step procedure for bar installation:
Switch off the OptoGait device
Place the two OptoGait Rx and Tx bars facing each other at a minimum distance of one
meter (maximum 6 meters)
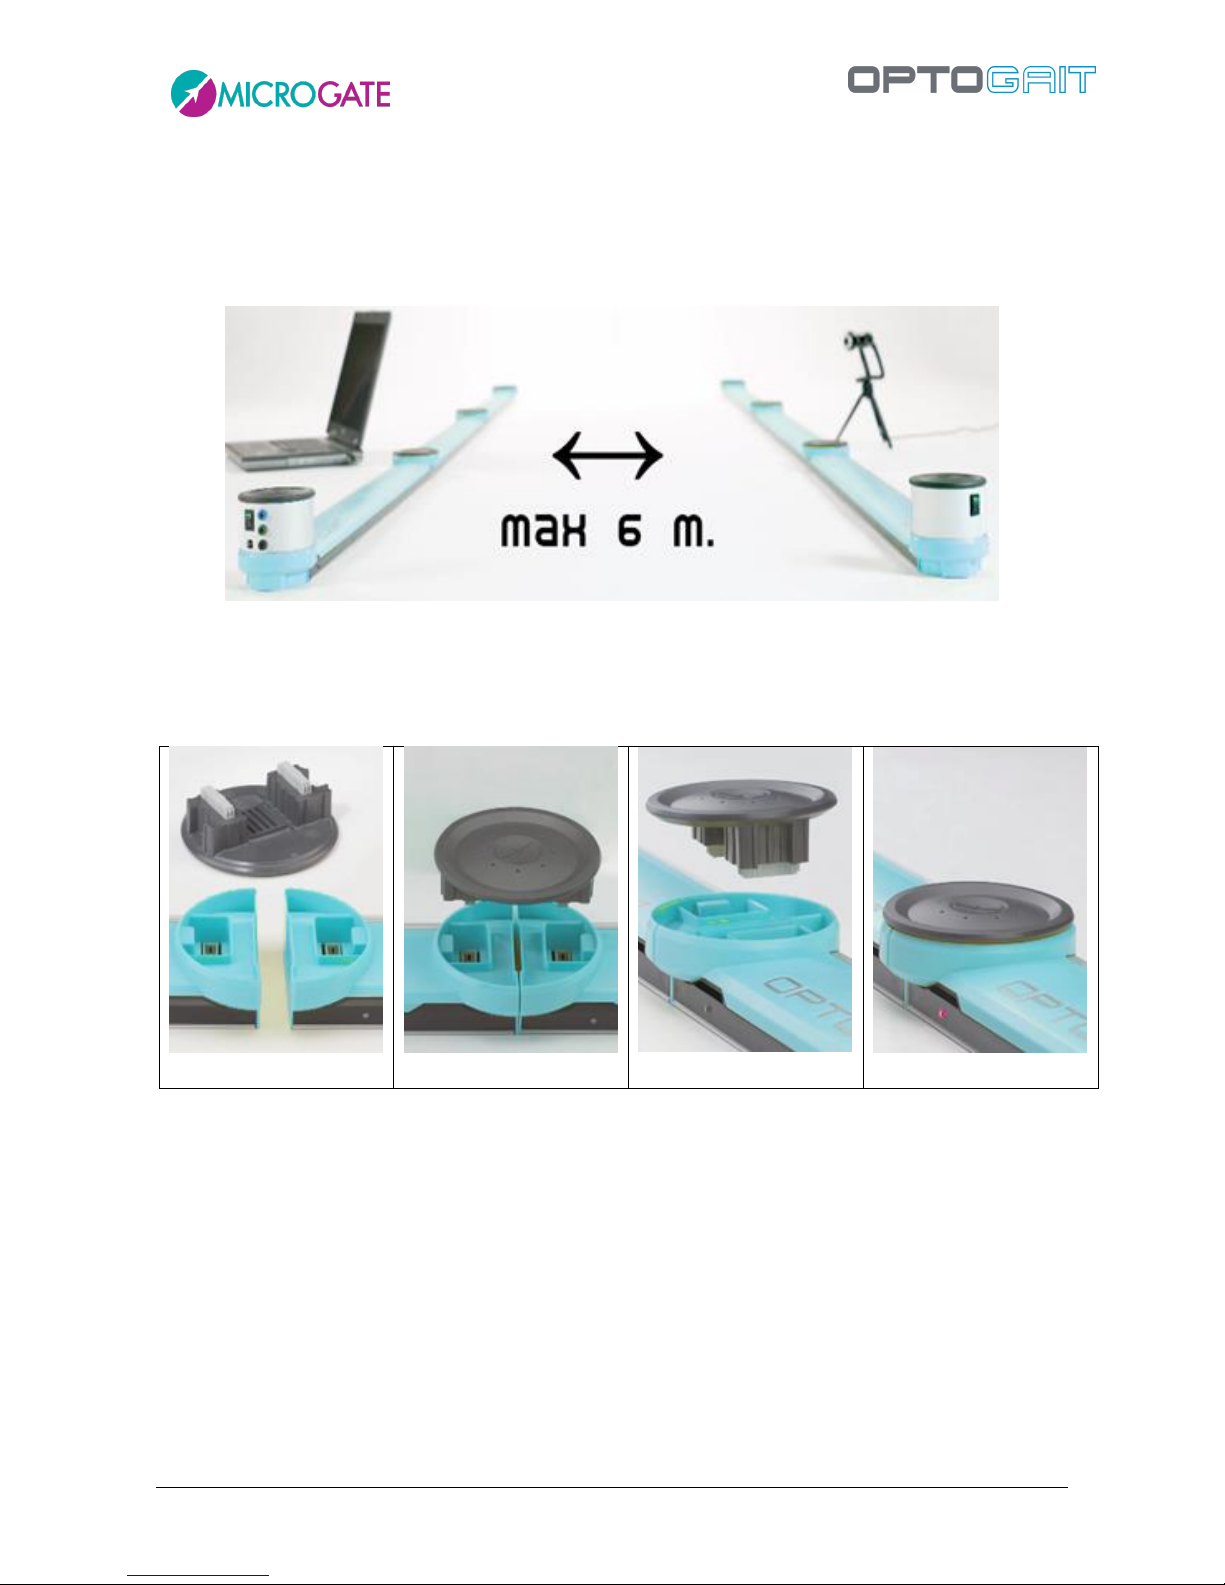
Figure 10 – Maximum distance
If a number of bars connected together are used, pay attention to the insertion of the caps
(see figures below). Check that the caps are firmly inserted. If insertion is incorrect, the
software may not function correctly.
Figure 11
Figure 12
Figure 13
Figure 14
Page 27
Version 1.9 Page 27 of 170
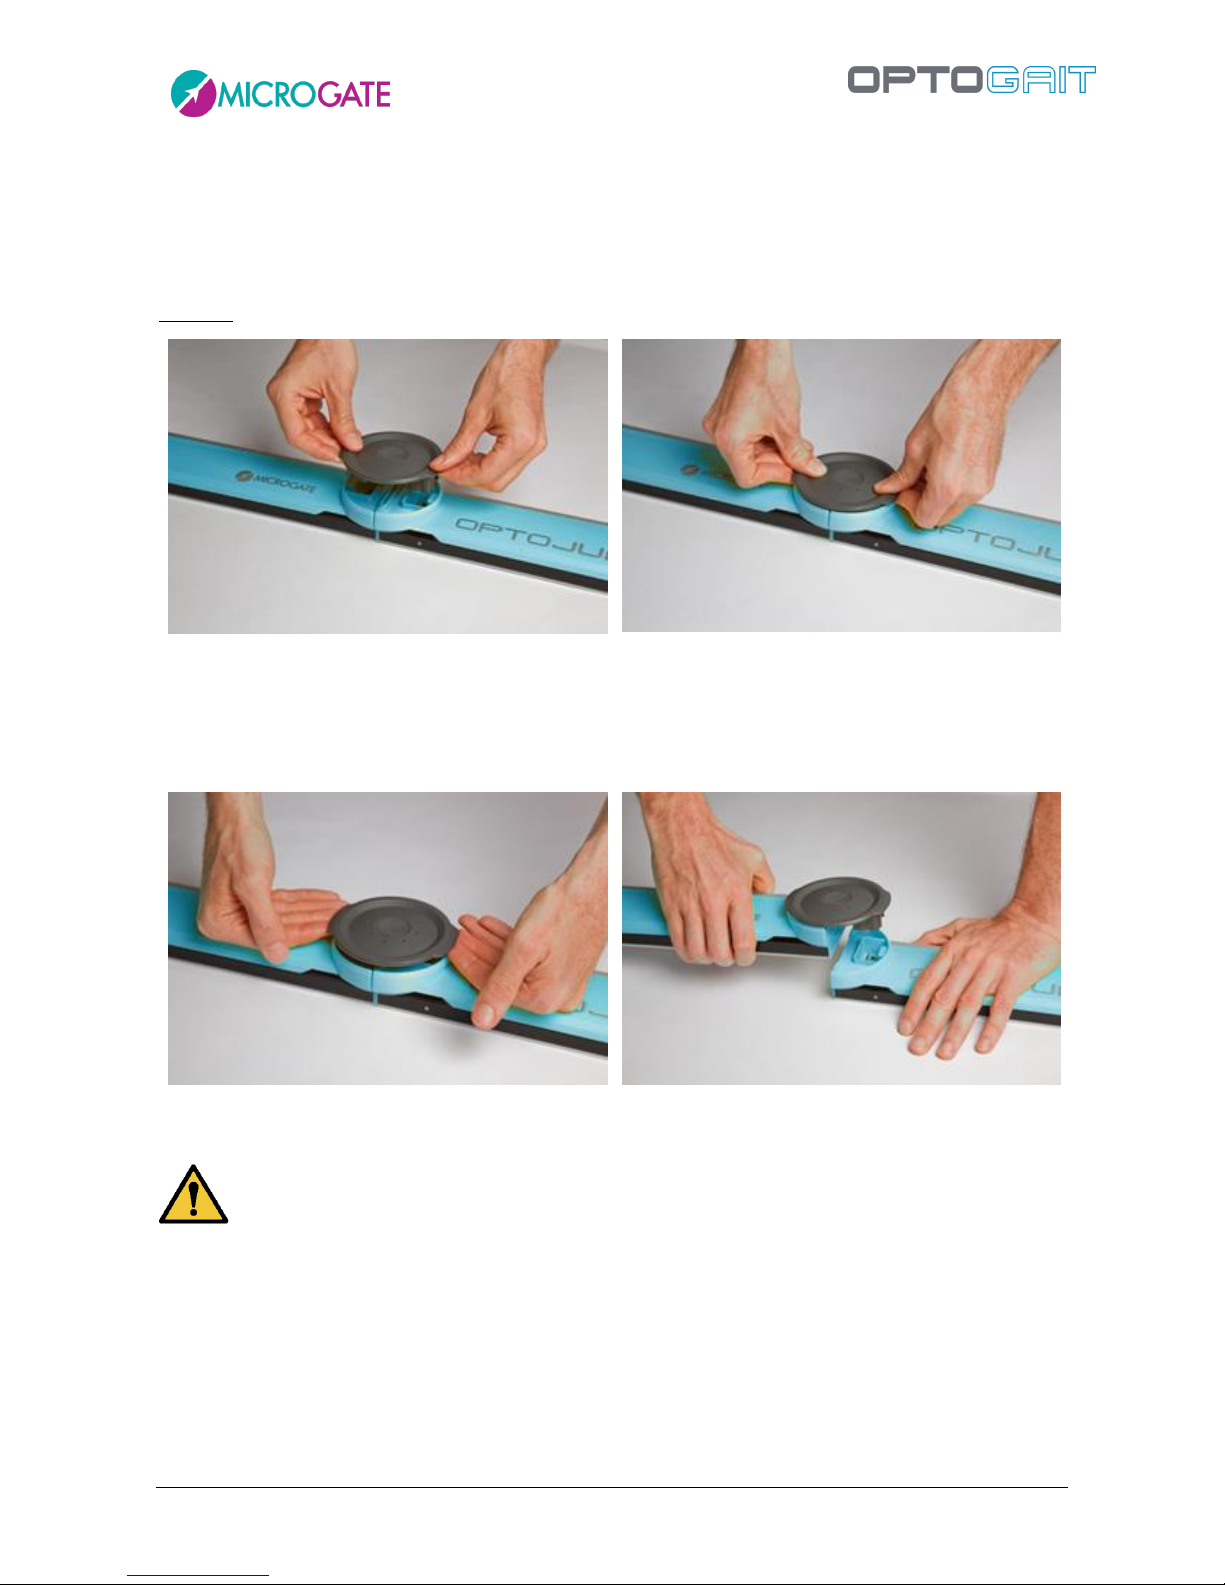
To mount the connection cap, insert the cap in the dedicated slots and apply light pressure on both
sides until it has been completely inserted (make sure it is parallel with the two bars; the two
connectors should slot in simultaneously).
The cap can only be inserted one way round. If you find that the cap will not go in, turn it 180°.
DO NOT force the cap if insertion is difficult: you run the risk of bending the connection pins.
Figure 15 – Cap mounting
Figure 16 – Inserting with light pressure
To remove the cap, grip the two side tabs and pull upwards symmetrically. Alternatively, you can
firmly hold one of the 2 bars down and carefully lift the other until the cap comes off.
Figure 17 – Cap removal
Figure 18 – Alternative method for removing the cap
Do not touch simultaneously the additional bars connectors (or the bars) and the patient
Page 28
Version 1.9 Page 28 of 170
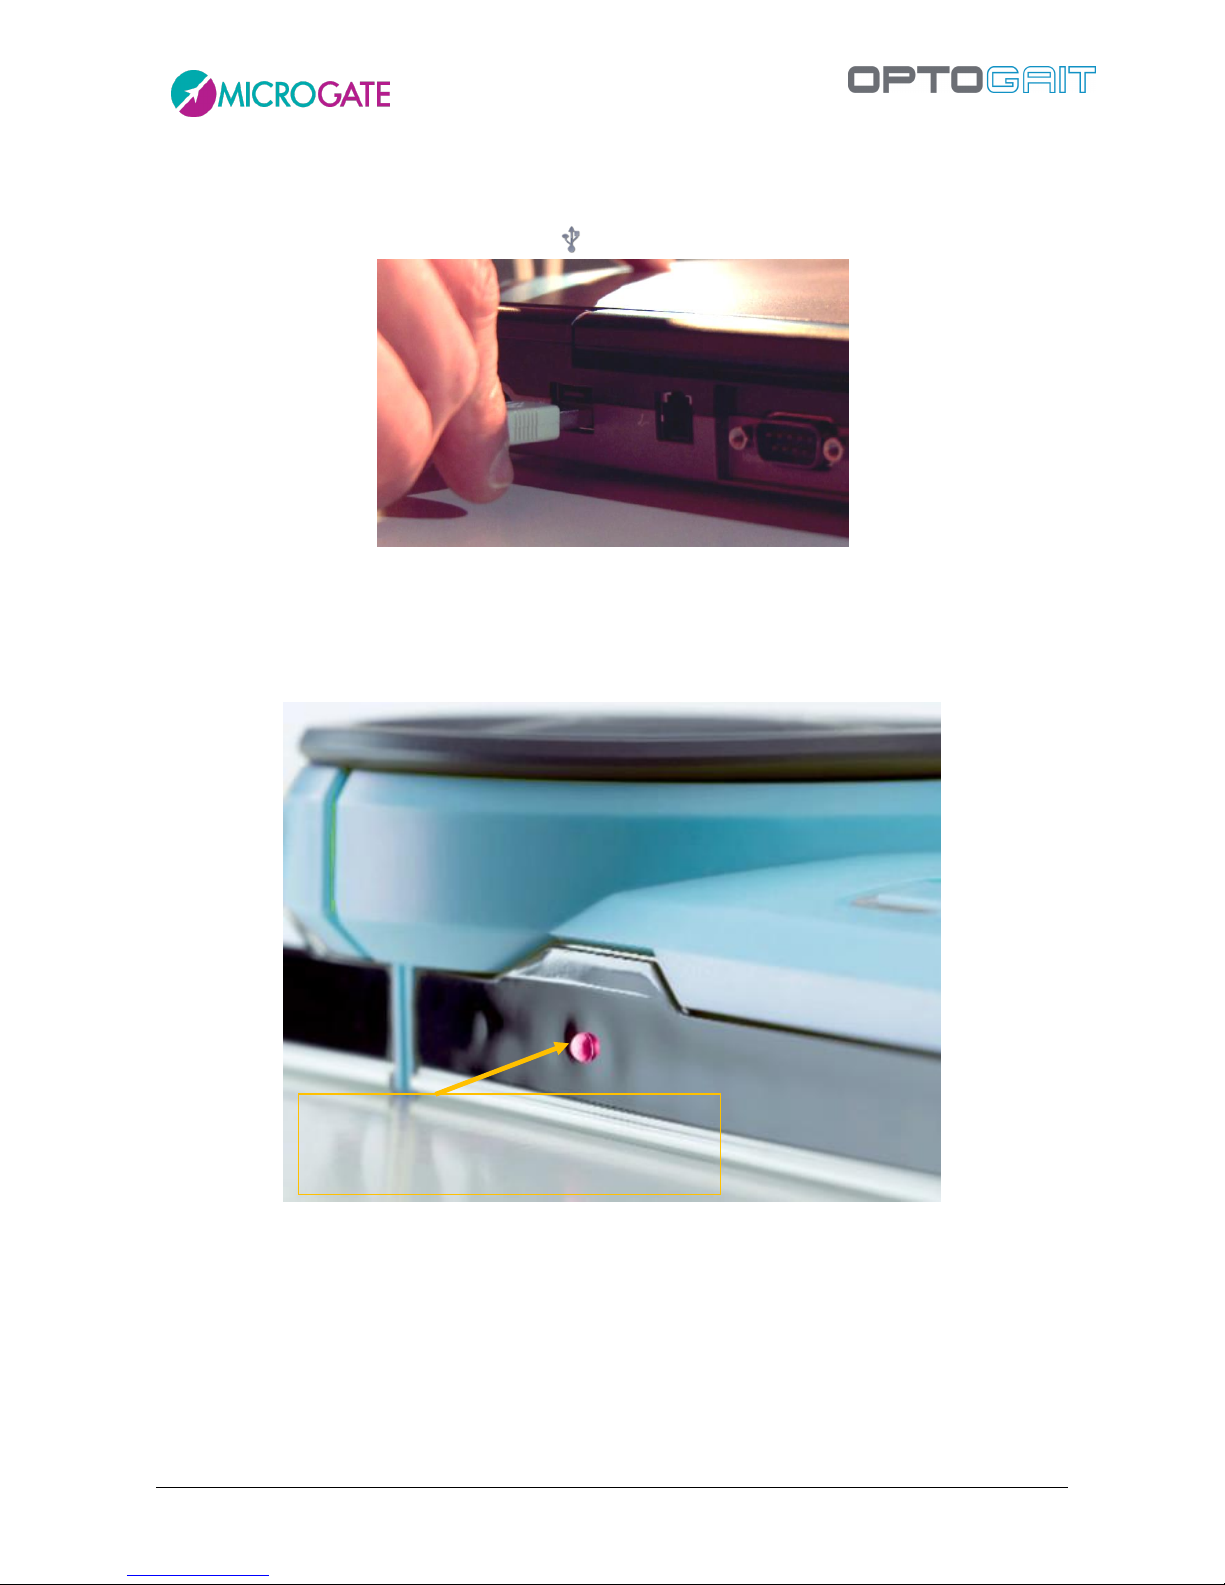
Connect the USB cable from interface Rx to the computer USB port. The USB port on the
computer is marked with the symbol .
Figure 19 - PC connection
If more than three OptoGait meters are used (three Tx bars and three Rx bars), we
recommend you use the adaptor.
Switch on the OptoGait device
Check that the bars are correctly positioned (Tx LED green)
Figure 20 – Led indicator
If the software is being installed for the first time or being re-installed, the operating system will
load the correct driver (see section above).
At this point, the OptoGait device is ready for use.
If other bars are connected, remember to switch the device off and switch it back on.
If you notice that the device is not working correctly, perform an OptoGait bars Test (see chap. 4.4.2
OptoGait HW Test).
Status indicator LED:
Green: no LED interrupted
Red: at least one LED interrupted
Page 29
Version 1.9 Page 29 of 170
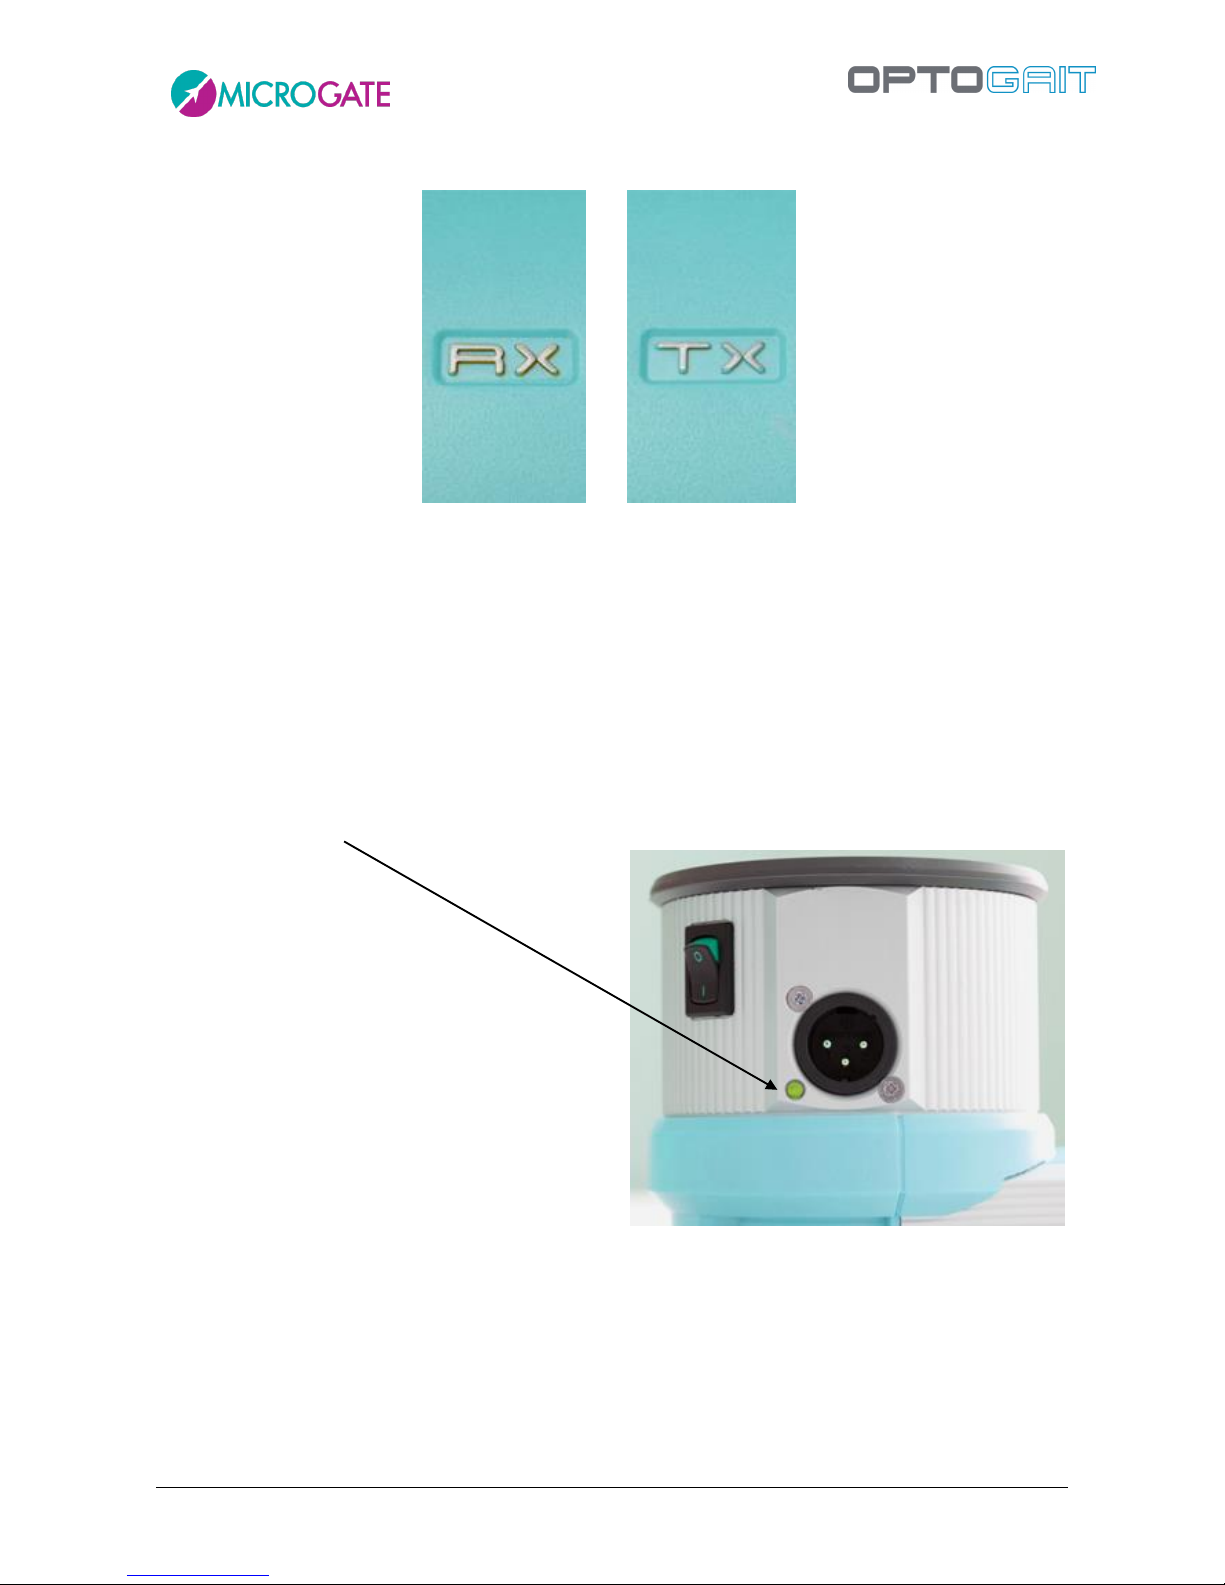
NB: Do not mix RX and TX bars. The bars are clearly marked and distinguishable.
Figure 21 - RX bar
Figure 22 - TX bar
3.3 POWER SUPPLY
OptoGait runs on batteries with a life dependent on the number of bars connected. The blinking
LED next to the adaptor connector shows the battery charge status:
Green-blinking = battery sufficiently charged
Red-blinking = low battery; the bars must be connected to the mains supply
Orange-blinking = battery being recharged
Figure 23- Battery charge status LED
Page 30
Version 1.9 Page 30 of 170
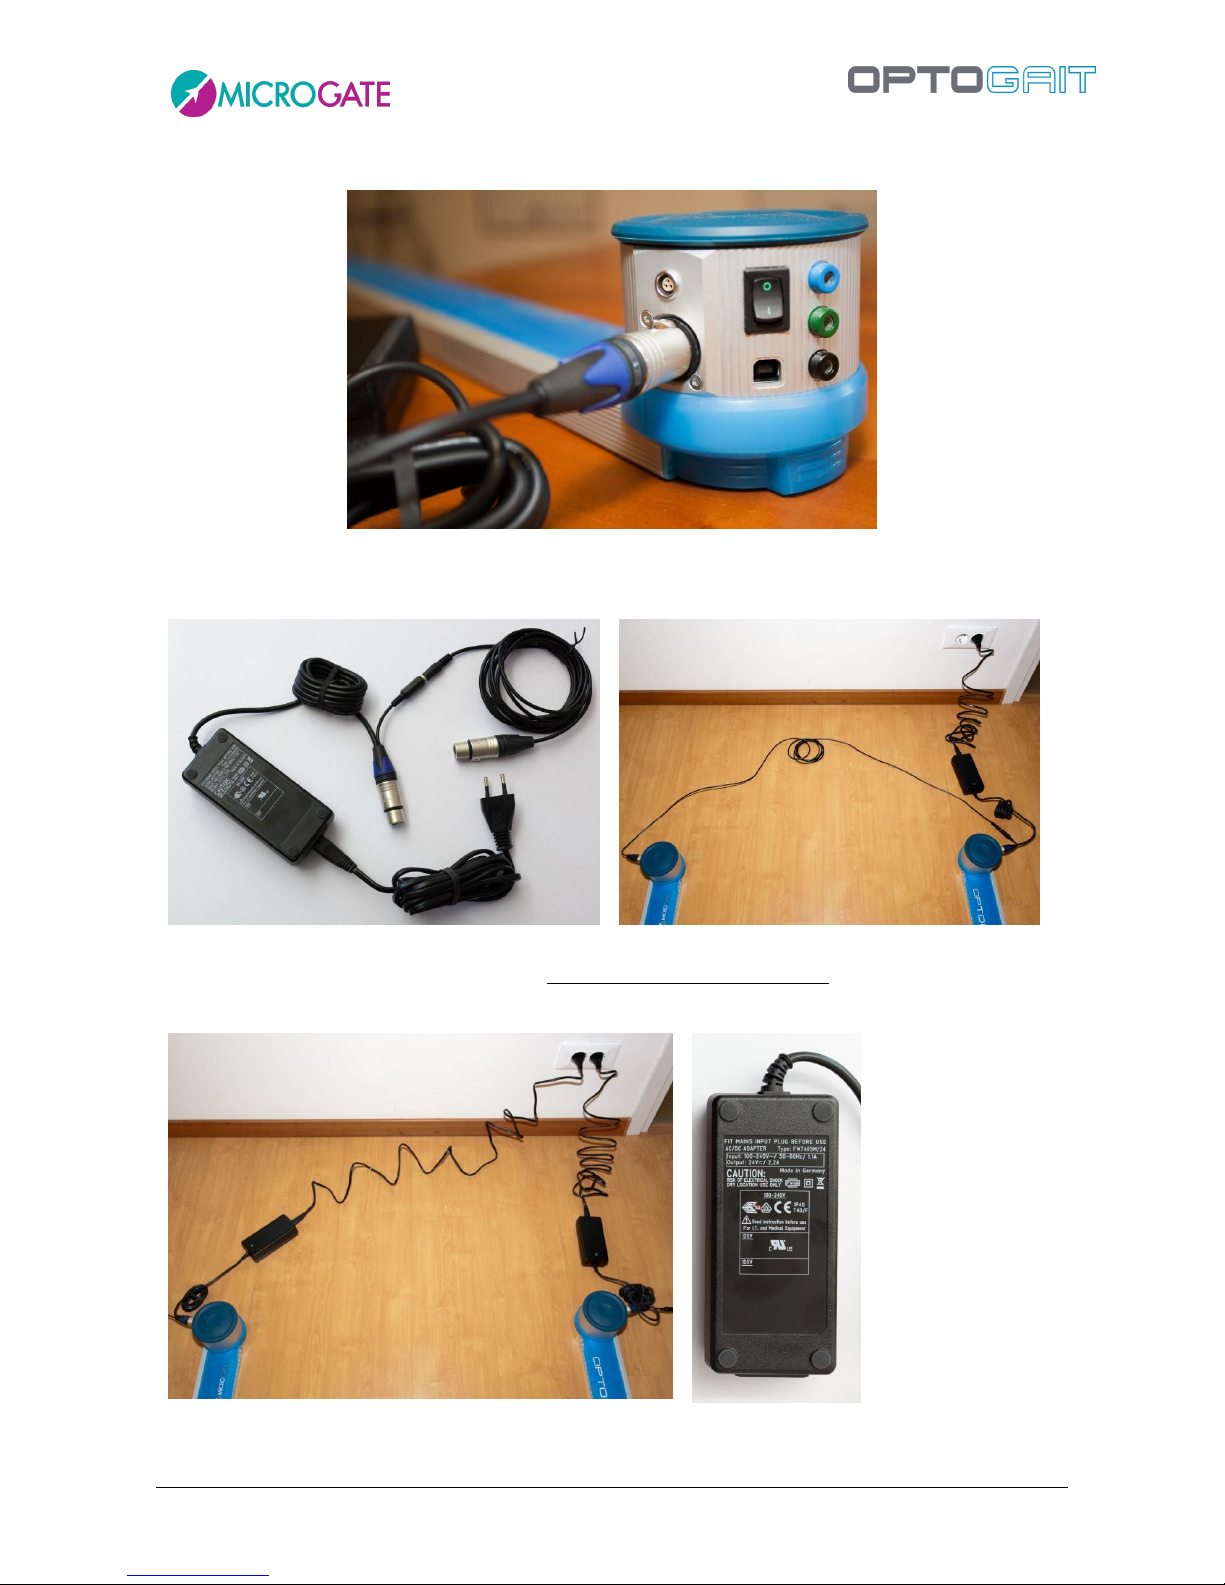
To recharge the battery, connect the adaptor plug to the dedicated socket on the drum.
Use only one power supply and the cable connecting the supply adapter with the second bar to
recharge the Single Meter (TX bar and RX with interface)
Figure 24- Adapter and cable for second bar
For the current supply and for recharging multiple meter linear systems, use two power supplies:
one for the TX bar and one for the RX bar. The power supply is certified for medical use
Figure 25- Two power supplies for multiple-meter systems
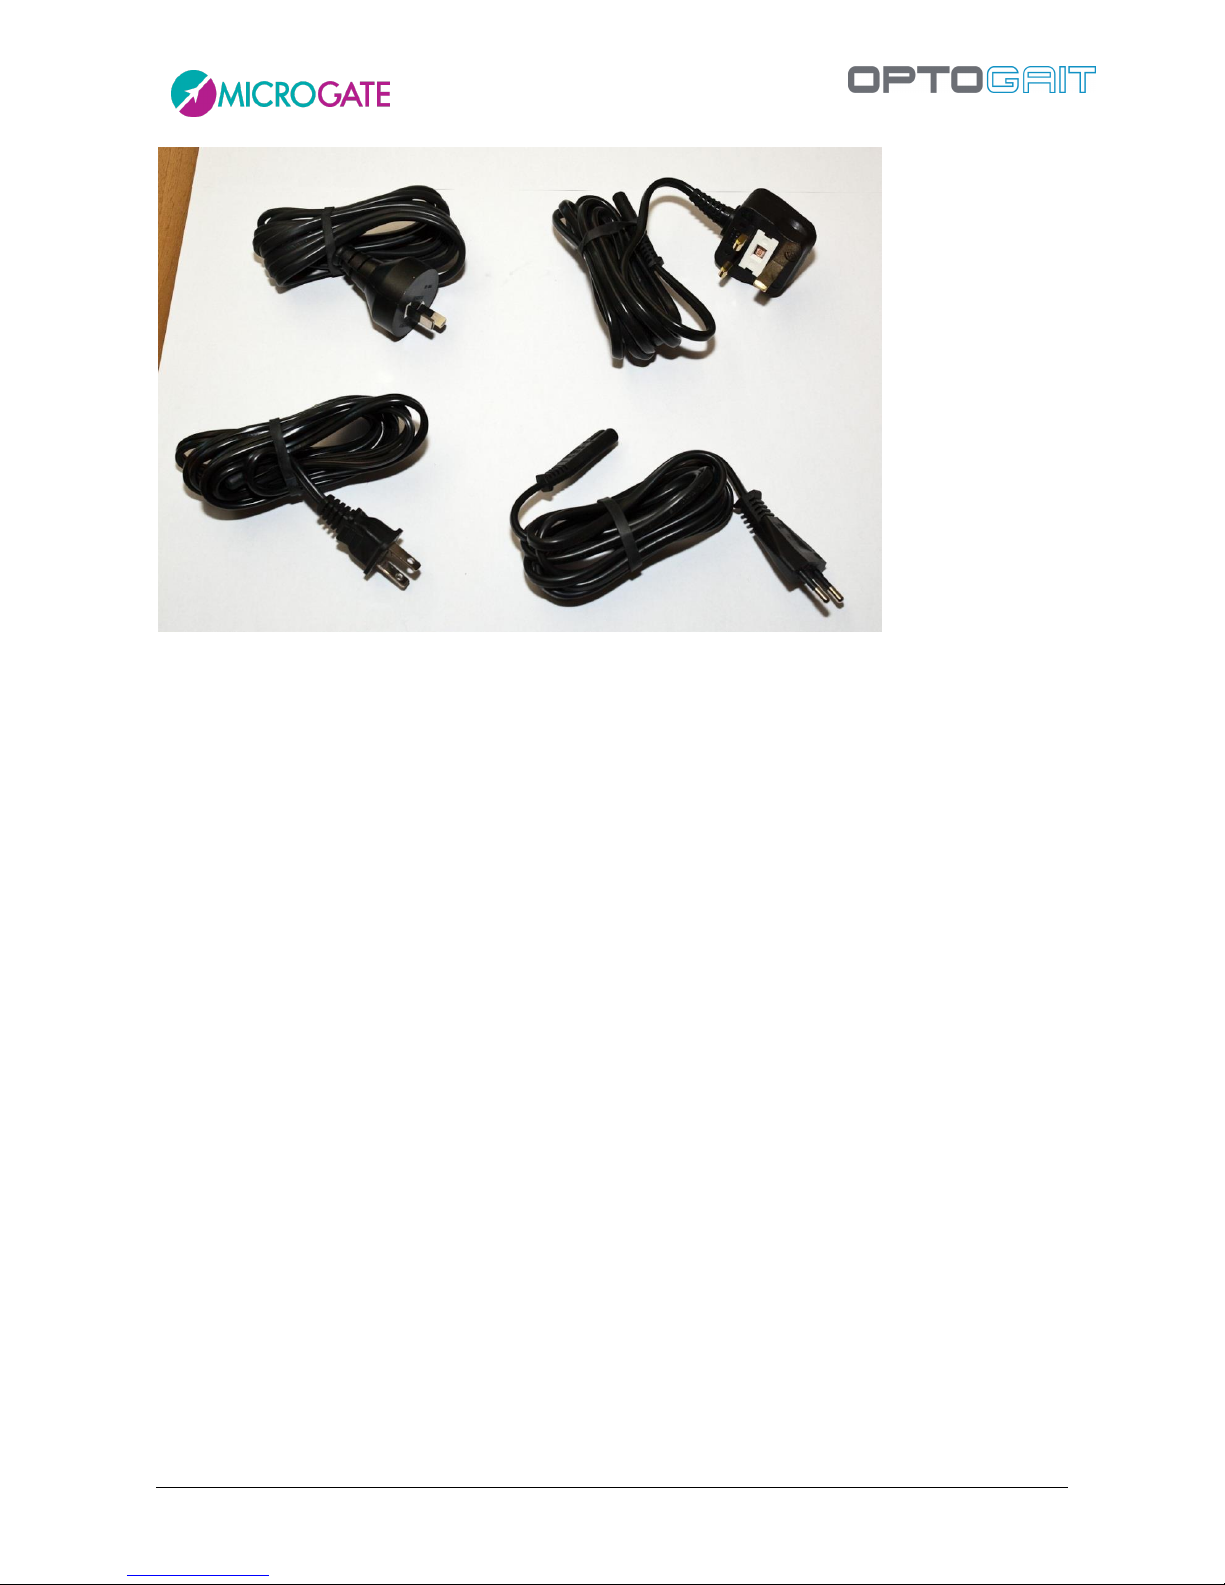
The supplied power plug is specific for the customer's country (EU, USA, UK, Japan)
Page 31
Version 1.9 Page 31 of 170
Figure 26 - Power cables for various countries
Page 32
Version 1.9 Page 32 of 170
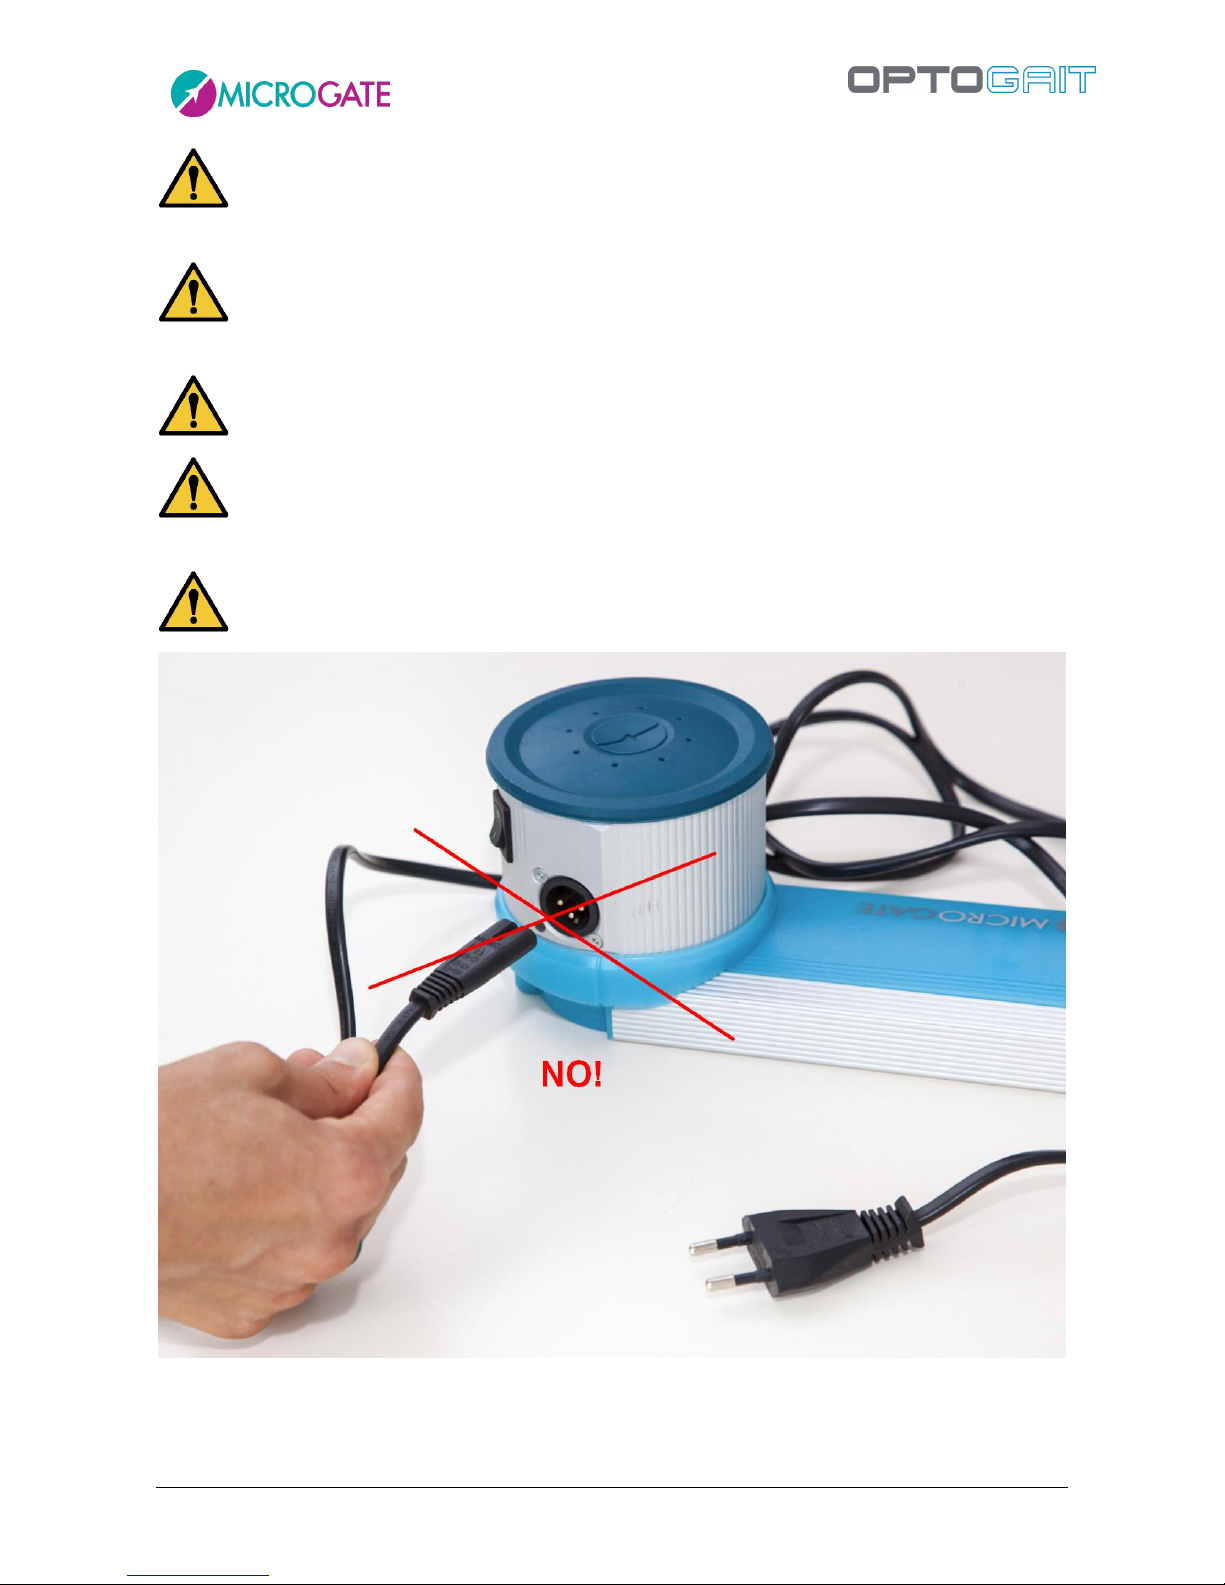
When using an external power supply, the device is disconnected from the power source
pulling the plug.
In order to avoid an electrical shock, the device must be exclusively connected to grounded
power sources.
DO NOT use power supplies other than the one supplied with the product.
OptoGait contains rechargeable Li-Ion batteries (1800 mAh). Battery substitution must
exclusively be carried out by authorized personnel.
DO NOT directly connect the cable to the 3-pole socket on the drum.
Page 33
Version 1.9 Page 33 of 170
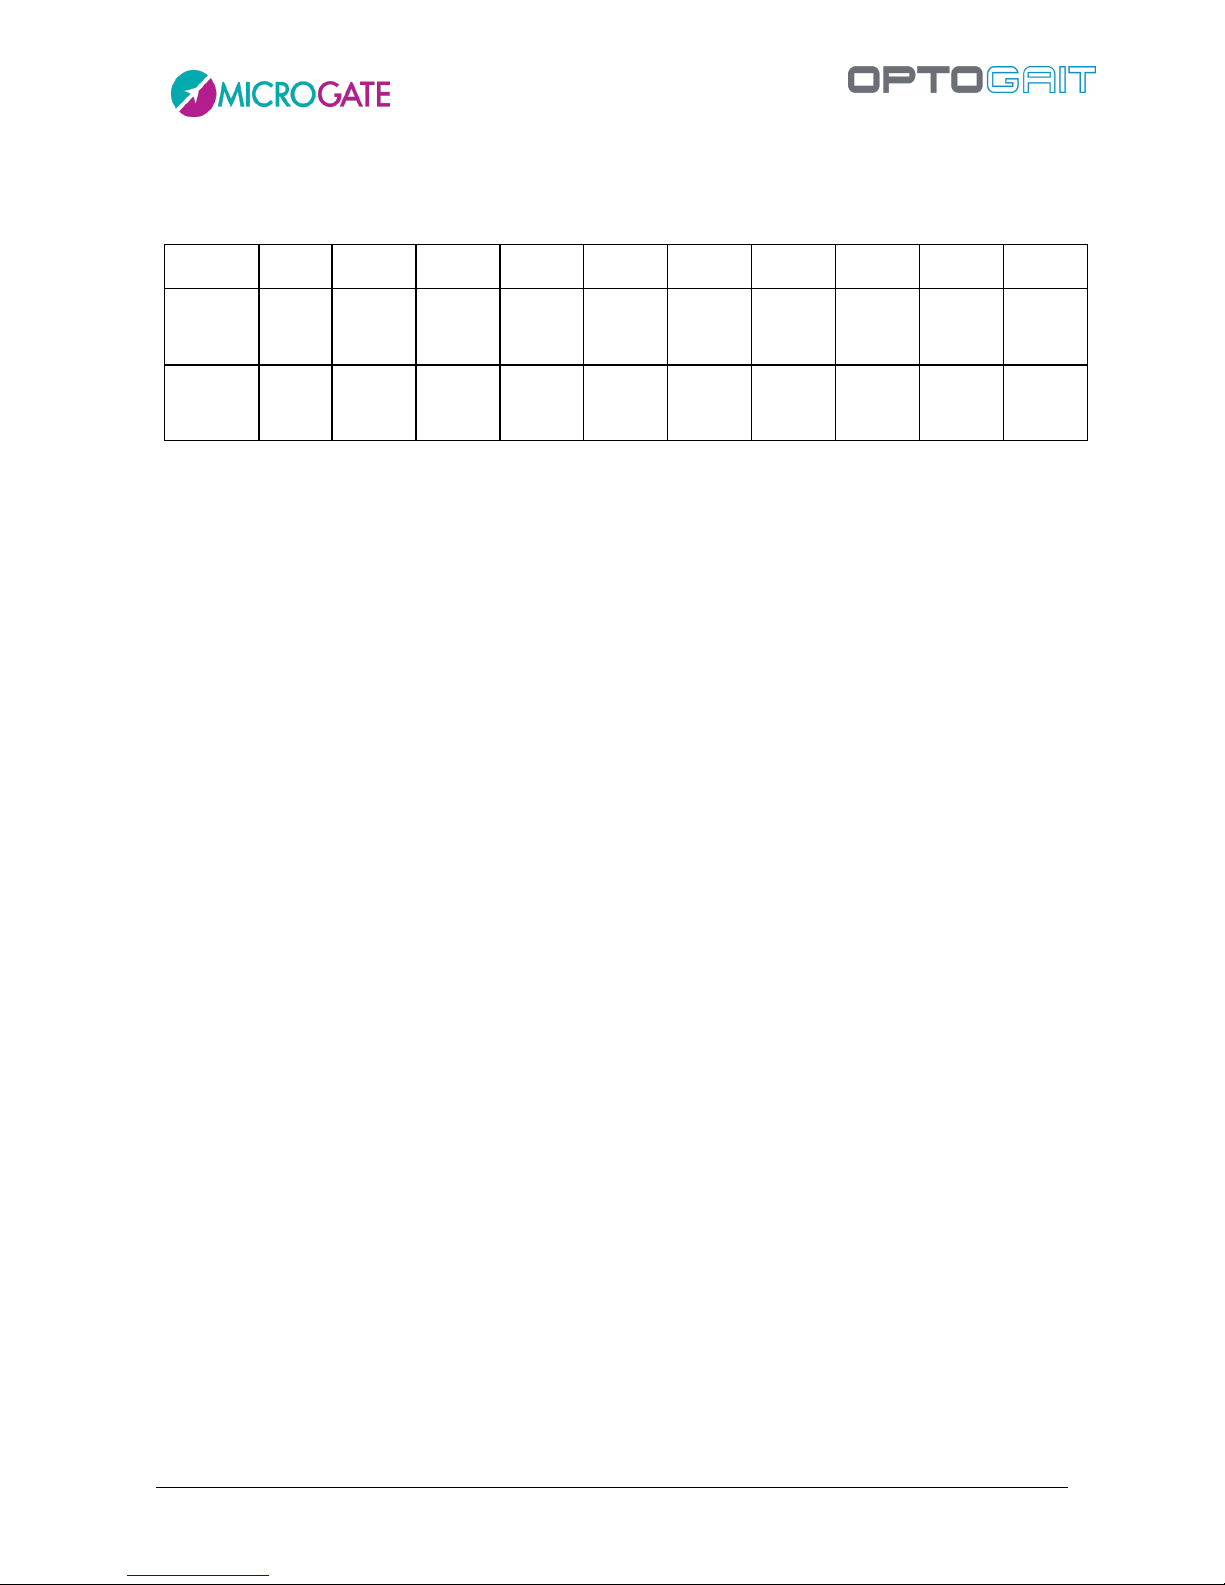
3.3.1 OPTOGAIT BATTERY LIFE
Battery life expressed in hours:
Bars 1 2 3 4 5 6 7 8 9 10
Theoreti
cal Tx96
11.54
5.88
3.93
2.88
2.27
1.86
1.57
1.34
1.14
1.02
Theoreti
cal Rx96
14.40
7.89
5.39
4.11
3.25
2.69
2.28
2.00
1.74
1.55
3.4 OPTOGAIT ELECTROMYOGRAPHY CONNECTOR
OptoGait can be used as a simple and non-invasive support for connection to EMG
(Electromyography) devices. The OptoGait digital outputs (or alternatively analogue) can be used as
“virtual footswitches”, completely eliminating the need for contact sensors on the sole of the
patient's foot.
This is a significant leap forward in terms of patient preparation speed and data reliability. The
correlation of EMG data with the Gait Analysis data supplied by OptoGait provides a complete
picture of the patient very quickly, on any natural surface or treadmill.
The OptoGait interface is equipped with a specific connection to enable the link with the EMG
device. The default connector on the connecting cable is a LEMO connector on the interface side
and a 3 poles 3.5mm Mini Jack on the EMG side. If you need another connector, please contact
Microgate.
Please note that the transmission of the impulses has a fixed delay of 300 milliseconds. To ensure
data accuracy, your EMG software will need to take this delay into account.
Also note that the OptoGait software must be run regularly even if the user does not need it. In
example, if the user wants to perform an EMG on a treadmill, the OptoGait software will need to be
set to perform a test on a treadmill (of the desired duration) and the test will need to be started and
stopped regularly to ensure that the impulses are assigned to the correct feet and that the error
filters are working properly. This of course also enables to perform EMG and gait analysis at the
same time.
Page 34
Version 1.9 Page 34 of 170
Figure 27 - EMG Lemo Connector
Figure 28 - Cable Lemo-Jack 3.5mm
4 DESCRIPTION OF FUNCTIONS
In this chapter all the functions of every menu of the OptoGait program will be described, starting
with the functions of the main menu.
4.1 PATIENTS
4.1.1 INSERT / EDIT PATIENTS
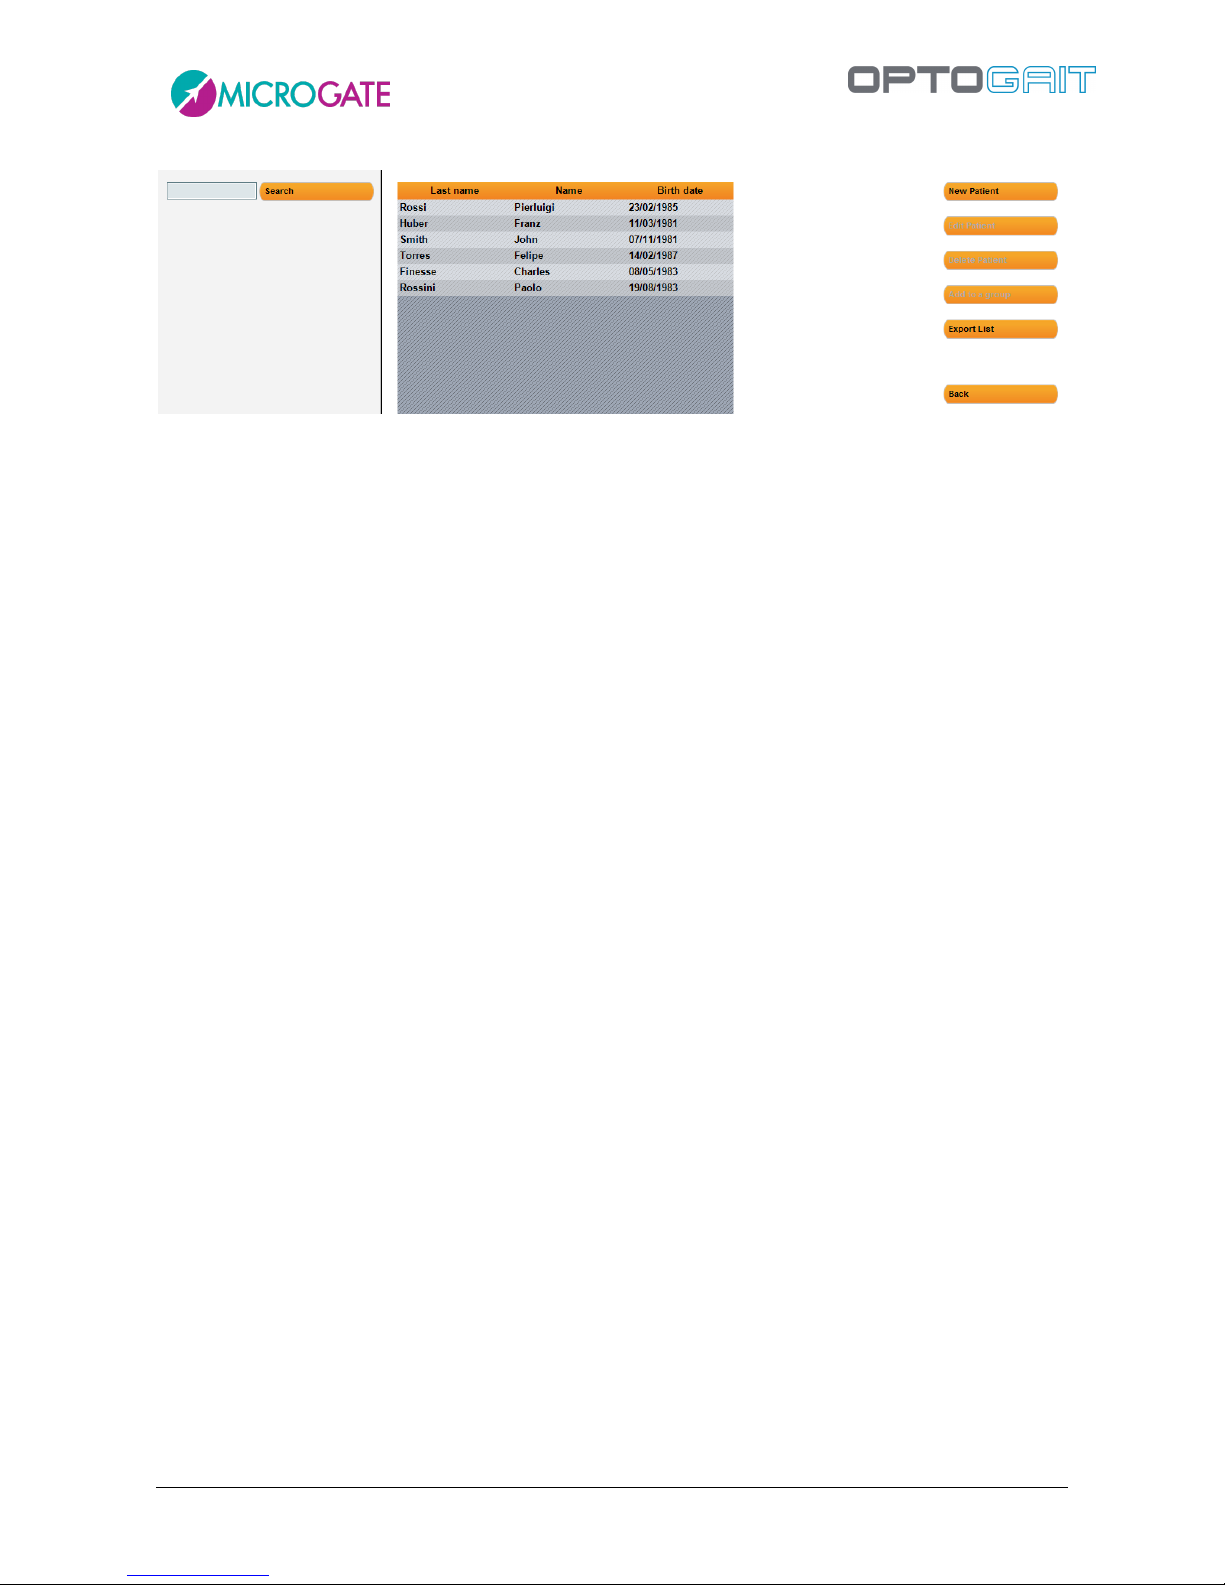
In this section all the patients stored are displayed.
Page 35
Version 1.9 Page 35 of 170
Figure 29 – Edit Patients
Click on the names of the columns (Last name, Name, Date of Birth) to order the list according to
that field; clicking on the same column again reverses the order (A…Z, Z…A).
Page 36
Version 1.9 Page 36 of 170
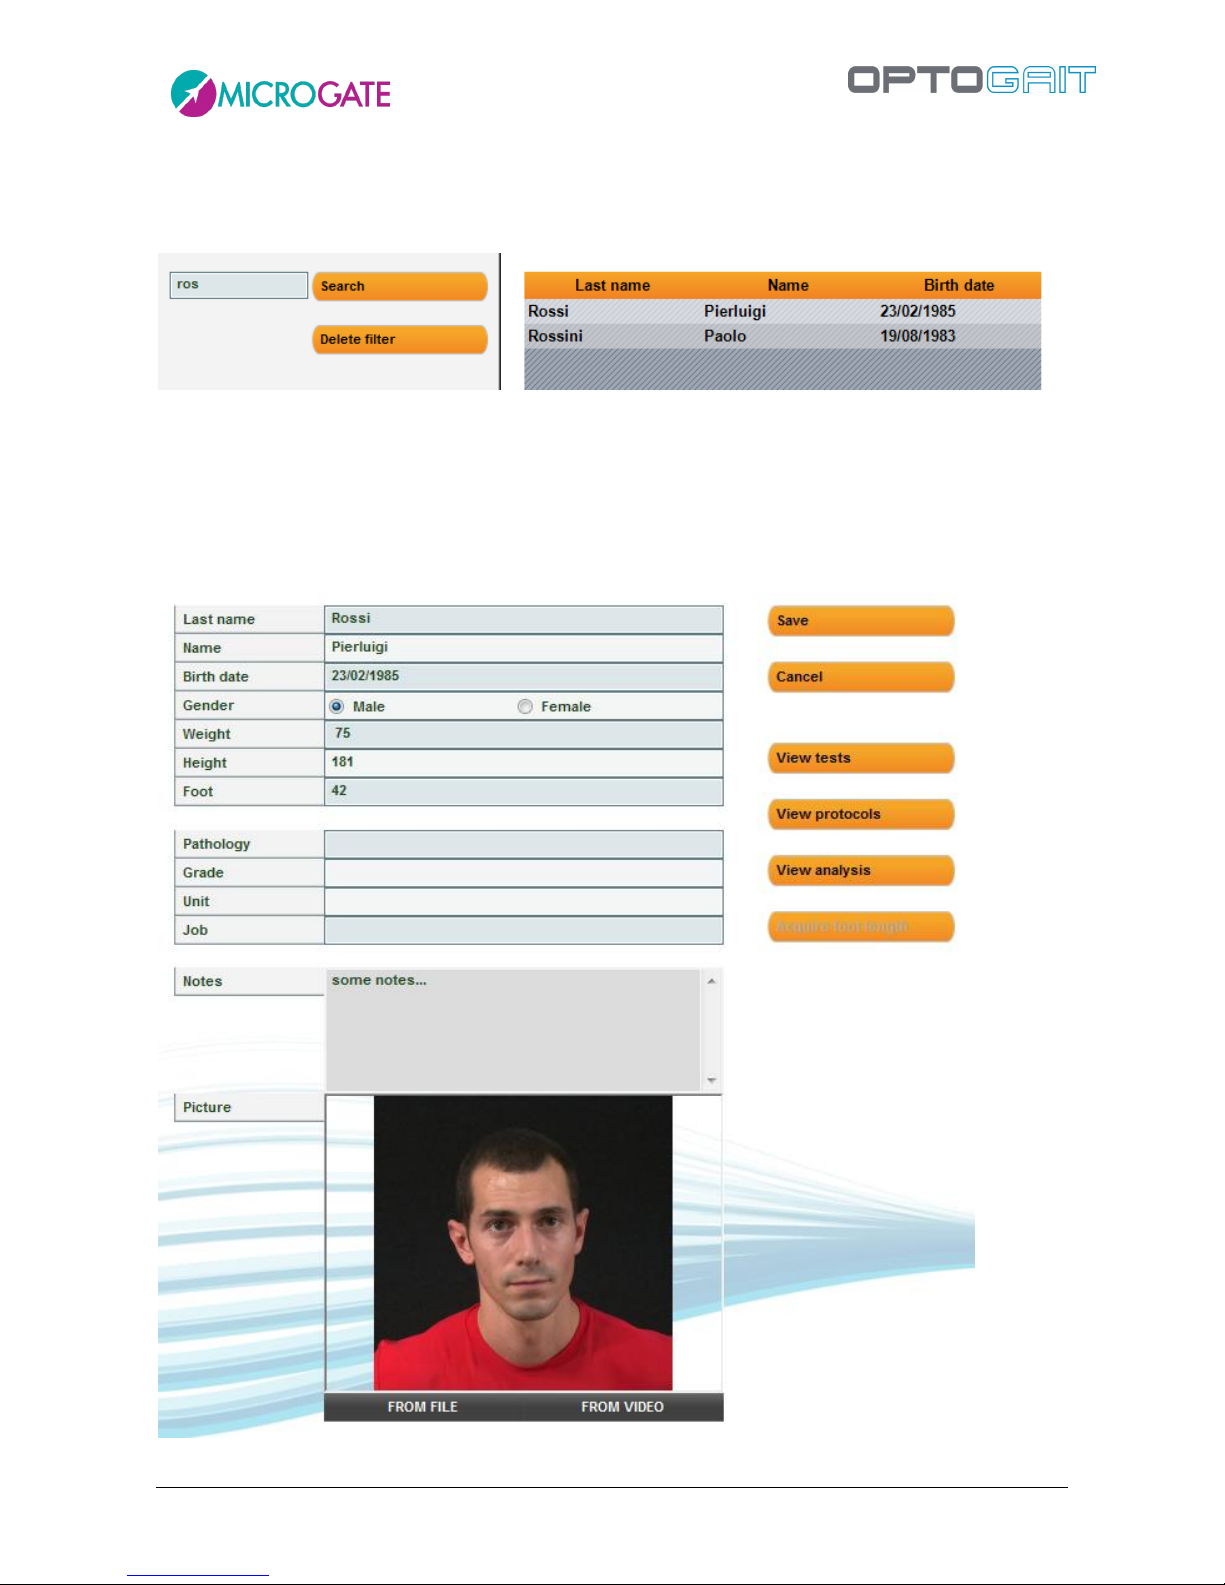
To search for a particular patient or to filter data (e.g. search for all patients beginning with “Ros”),
insert the text in the box at the top left and press <Search>. To remove the filter press <Delete
filter>.
Pressing the button <New Patient> opens a new panel in which the new patient’s data must be
inserted. Last name is the only compulsory field. Also, the weight (given in kg or pounds depending
on the unit of measurement chosen in Basic Configuration) is necessary if you wish to use the tests
to determine the value for total power or total energy.
Figure 30 - Patient Data input mask
Page 37
Version 1.9 Page 37 of 170
The function for associating each athlete with a photo is useful, especially for trainers and coaches
with many athletes to assess. This can be taken from a file previously saved on disk (in .jpg or .bmp
format), or taken 'on the spot' with a previously connected webcam. In the first case click on <From
File> and select the desired photo from a folder; in the second case, click on <From Video>, wait for
the Live image to appear, frame the patient and press <Acquire>.
4.1.1.1 PATIENT DATA INPUT MASK
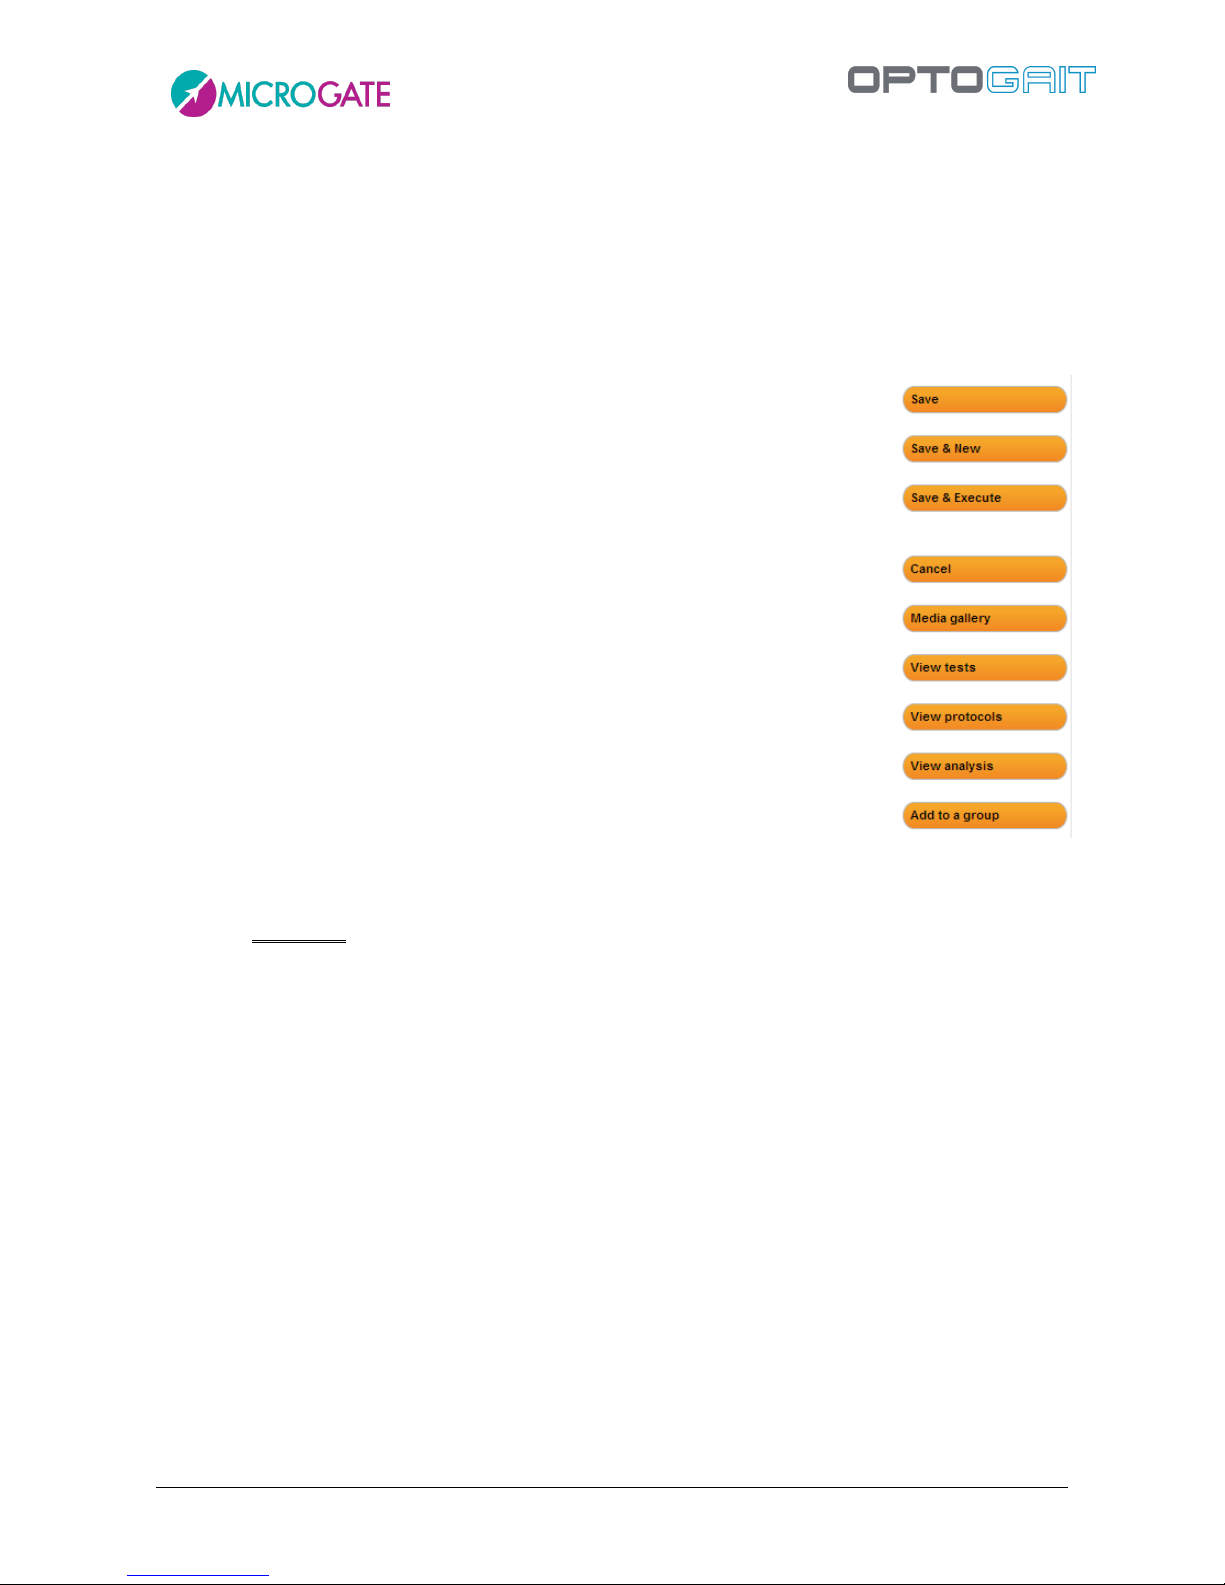
To edit the data of a stored patient, select the entry with the mouse and
press <Edit Patient>: within the patient data input mask, fields can be edited
and saved (or cancelled, returning to the list).
Furthermore, three buttons allow the user to view tests, protocols, and
analyses of the current patient (actually a filter is created as explained in
section 4.3.1)
The command <Capture foot> measures the foot in cm (i.e. in 'number of
LEDs’, which are then converted into centimetres or inches according to the
unit of measurement used). Click the button, position one foot inside the
bars (parallel to them) and click <Confirm>. After a few seconds the
measurement is displayed and can be confirmed or repeated.
The measurement is essential for the treadmill tests; the value is saved in
the database associated with the patient and is displayed in the mask; the
editable field 'foot' is only for personal data and can be used to write the
measurement in any unit (e.g. 41 EUR, 7 ½ US, 8 UK, etc.).
In the patients list the following commands are available: To eliminate him/her, press <Delete
Patient> (WARNING: When deleting a patient, all his/her tests, protocols, and analyses will be
deleted without any possibility to restore them).
To insert a patient into a group, select from the list, press <Add to a group>, select the group to
insert him/her in (possibly using the right arrow to select a dependent subgroup) and press <Add to
a group> again. Press <Back> to return to the patients’ list.
For the management of groups and other ways of associating with groups, we suggest you read the
next section.
By pressing <Export>, patients’ personal data can be exported to a file with the extension 'xml',
which can be used with Excel (Excel versions XP, 2003, 2007 and 2010) or with other programs.
Figure 31- Commands in the Edit panel
Page 38
Version 1.9 Page 38 of 170
4.1.1.2 IMPORTING AND EXPORTING PATIENTS’ PERSONAL DATA EXCEL
Once compiled in OptoGait, the Patients’ Personal Data can be exported
into an Excel-compatible format (XML Spreadsheet 2003). Press <Export
List> and specify the name and location of the XML file. If you have
Microsoft Excel installed on your computer, double-click on the file icon
to launch the program and view the columns with all relevant patients'
data.
If you already have a patients' list created with another
software, it can be imported with OptoGait Next
preparing a normal Excel file with the same format as
the export file (number, location, column headers and format 'XML Spreadsheet 2003'). It is
recommended to export an empty personal database to create a file template and then to fill it with
the desired information. Attention must be paid to the birth date format (DD/MM/YYYY) and the
'Gender' field (M or F). The pre-configured fields 'Sort' and 'Discipline' can only be one of those
available from the drop-down menu. Possible errors during the import are listed in a log window at
the end of the import (if the error is not blocking, the patient is added anyway, but with any possible
wrong fields empty).
Page 39
Version 1.9 Page 39 of 170
4.1.2 INSERT / EDIT GROUP
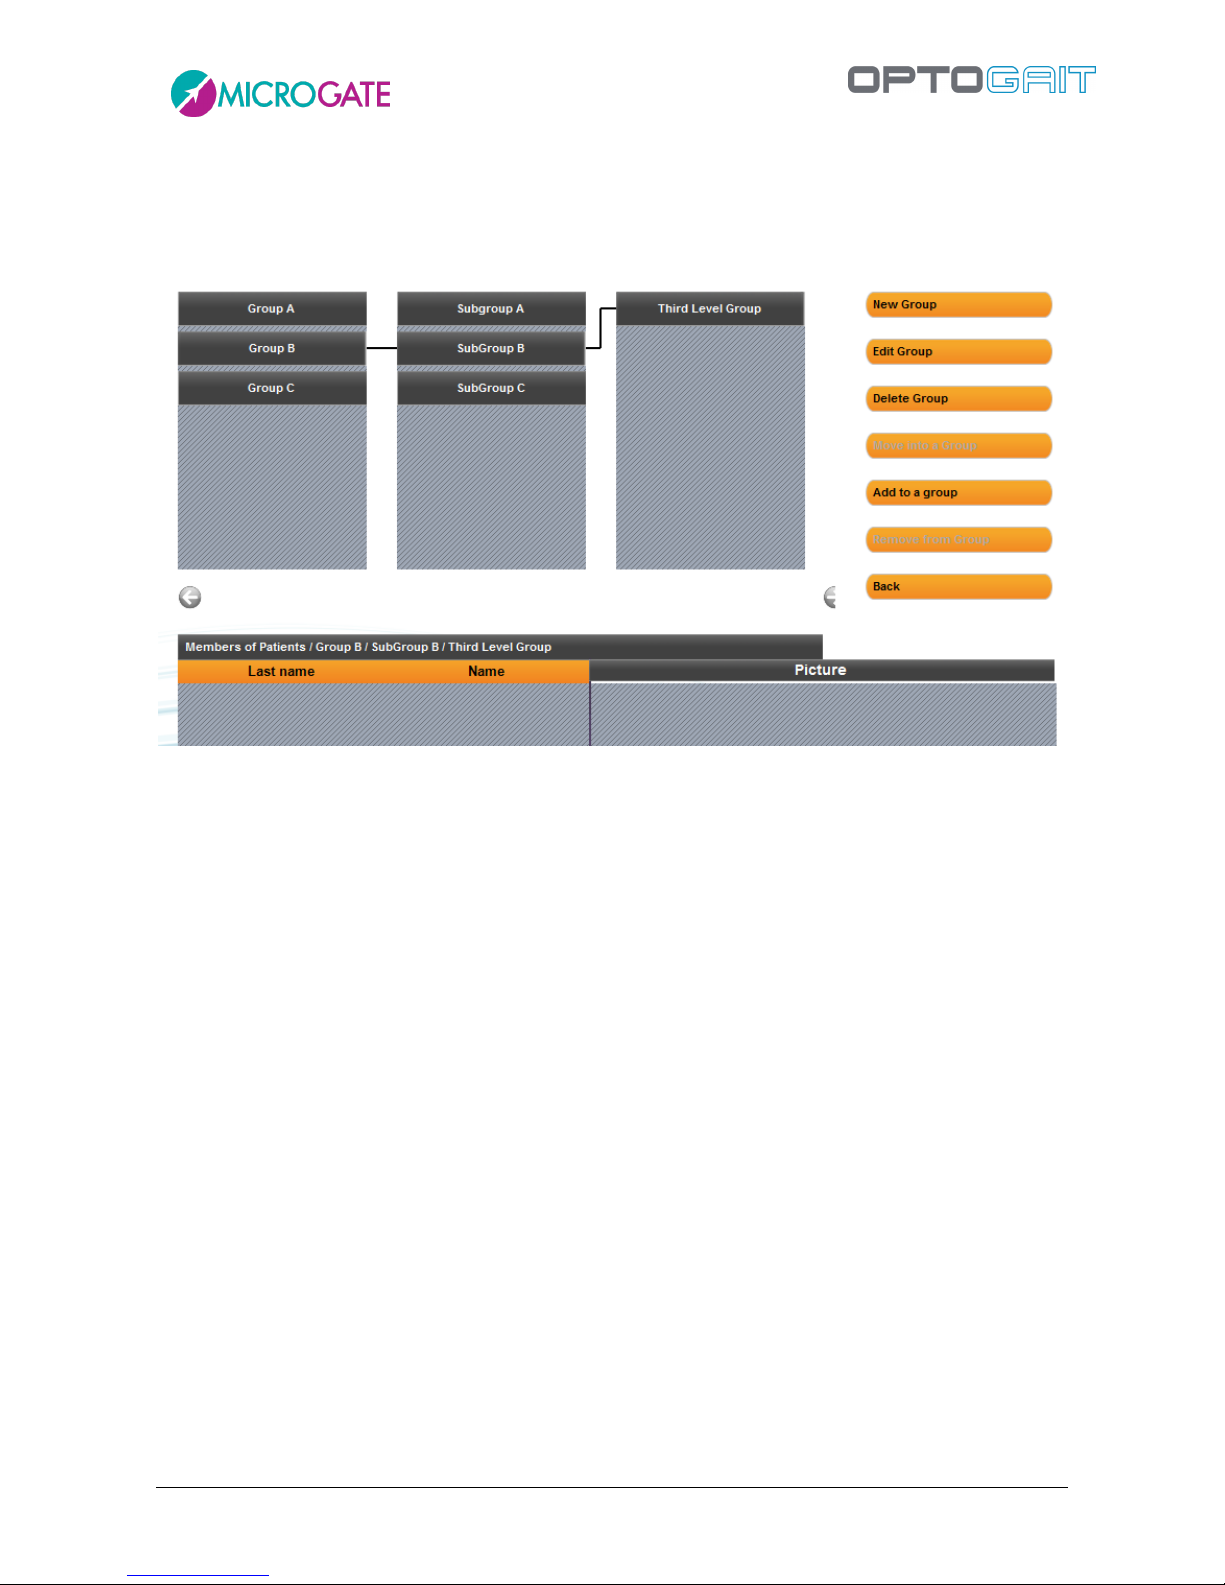
In this section infinite groups and subgroups can be created, making it easy to manage the patients’
personal data.
Figure 32 – Managing groups
As a default there is always a group called ‘Patients’ which is the Parent group of the ones we will
subsequently create. All the patients we insert are automatically added to this group.
To create a subgroup, choose the parent group, press <New Group>, key in the name and confirm
(e.g. if you want to create 'Group D' as a 2nd level group, select 'Patients' and press <New Group>,
whereas if you want to create a 4th level group under 'Subgroup C', make sure to select it before
pressing <New>).
When a group is selected, the grid below will show the patients belonging to the group chosen and
its 'relationship'.
Page 40
Version 1.9 Page 40 of 170
To add one or more patients to a group there are two other possibilities:
Select the group to which you want to add a patient and press <Add to a Group>, select one
or more patients by checking them in the grid and press <Confirm>. It is possible to use
<Select All> or <Deselect All> to speed up checking operations. Press <Cancel> to exit this
function without adding patients.
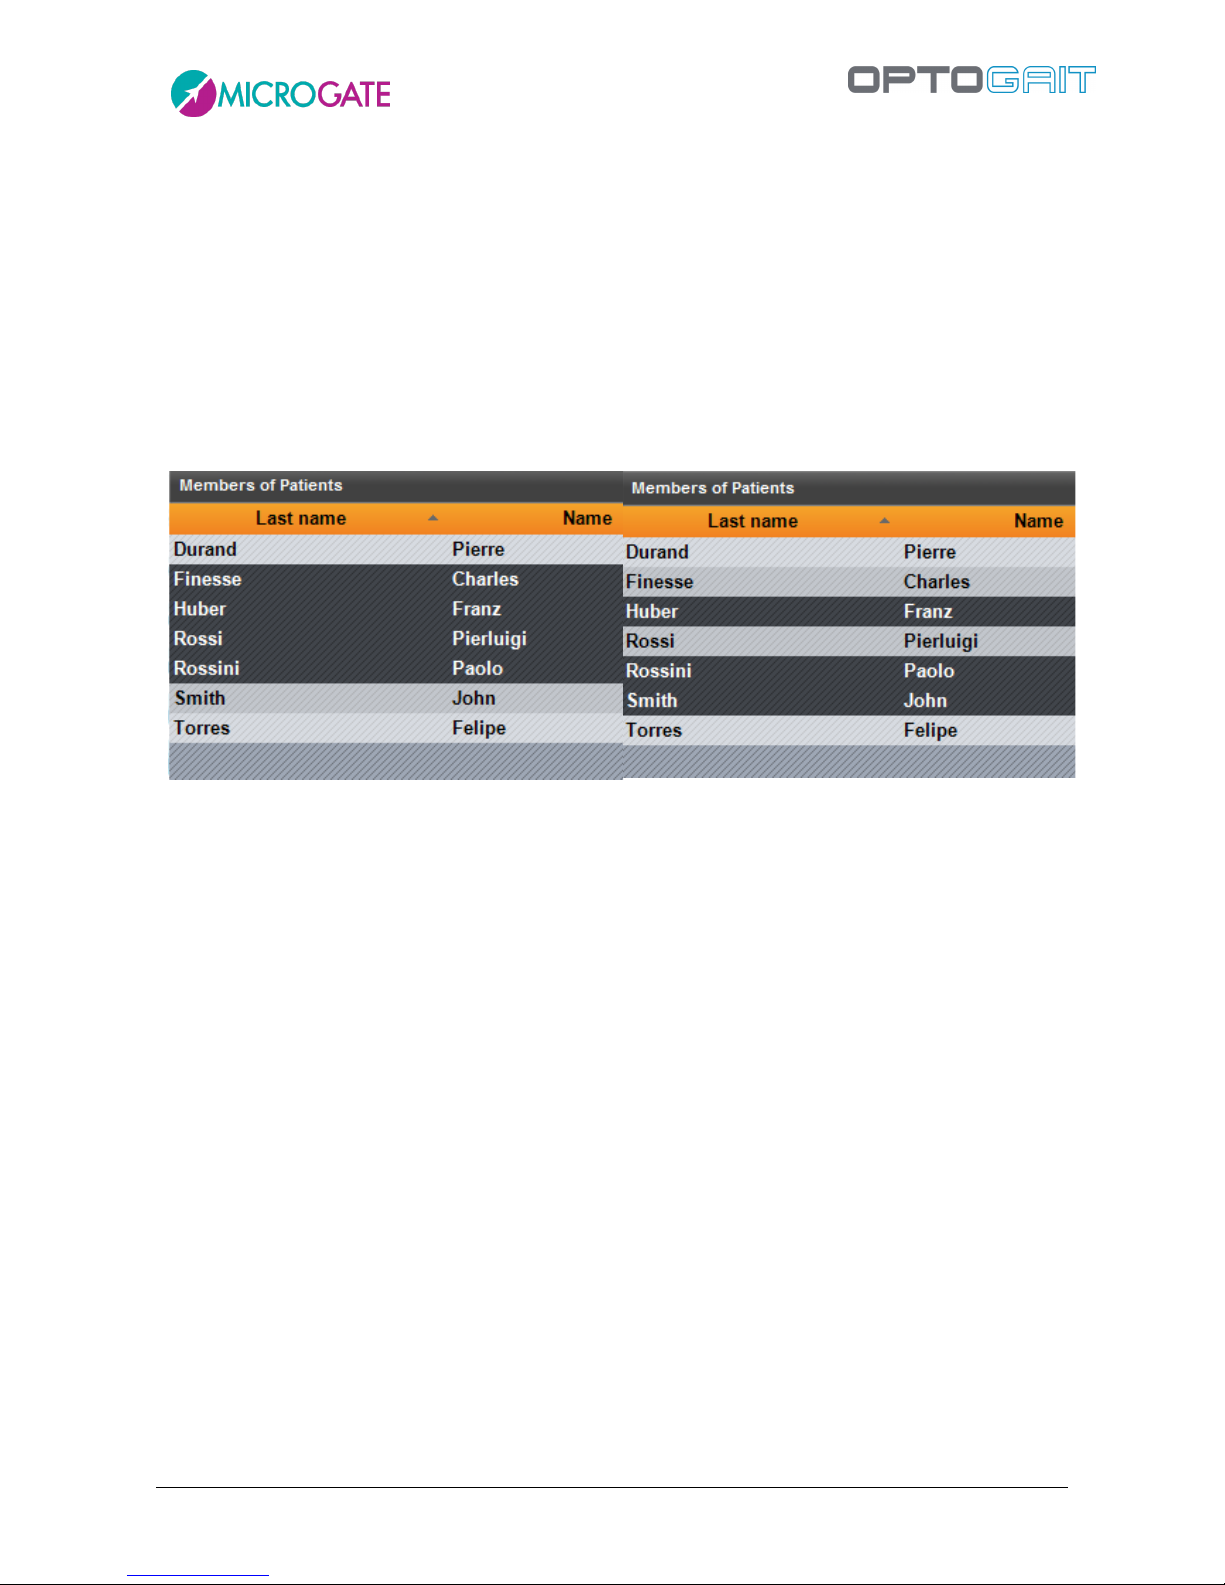
Select the root group 'Patients' (which contains all patients), select one or two patients by
clicking on them (see below) and drag them with the mouse (the classic drag ‘n drop
function) to the destination group. The message 'Done' will confirm that the operation has
been successfully completed. To make multiple selections, use the SHIFT keys to select a
range of patients (from… to…) or the CTRL key for selections that are not adjacent.
Selecting a range. Click on 'Finesse', keep SHIFT pressed,
click on 'Rossini'
Selecting a number of non-adjacent patients: keep CTRL
pressed and click on the patients
It is also possible to move patients from one group to another with these two methods:
Select the source group of a patient you want to move, select one or more patients,
press <Move into a Group>, select a destination group and press <Confirm move>.
Press <Cancel> to cancel the operation in progress.
Select the subgroup from which to transfer the patient or patients and perform the
same drag ‘n drop operations described above. The difference between operating from
the root group “Patients” or from others is that in the first case the patients are always
copied. When moved from one subgroup to another, they are transferred without
copying.
With <Delete Group> the group selected and its dependent subgroups are eliminated (but not the
patients that formed it), while with <Edit Group> its name can be changed.
With <Remove from Group> the patient selected in the grid is removed; the patient is not eliminated
from the database. The button is disabled when no patient is selected or when the first level group
“Patients” is displayed.
Page 41
Version 1.9 Page 41 of 170
4.1.3 MEDIAGALLERY
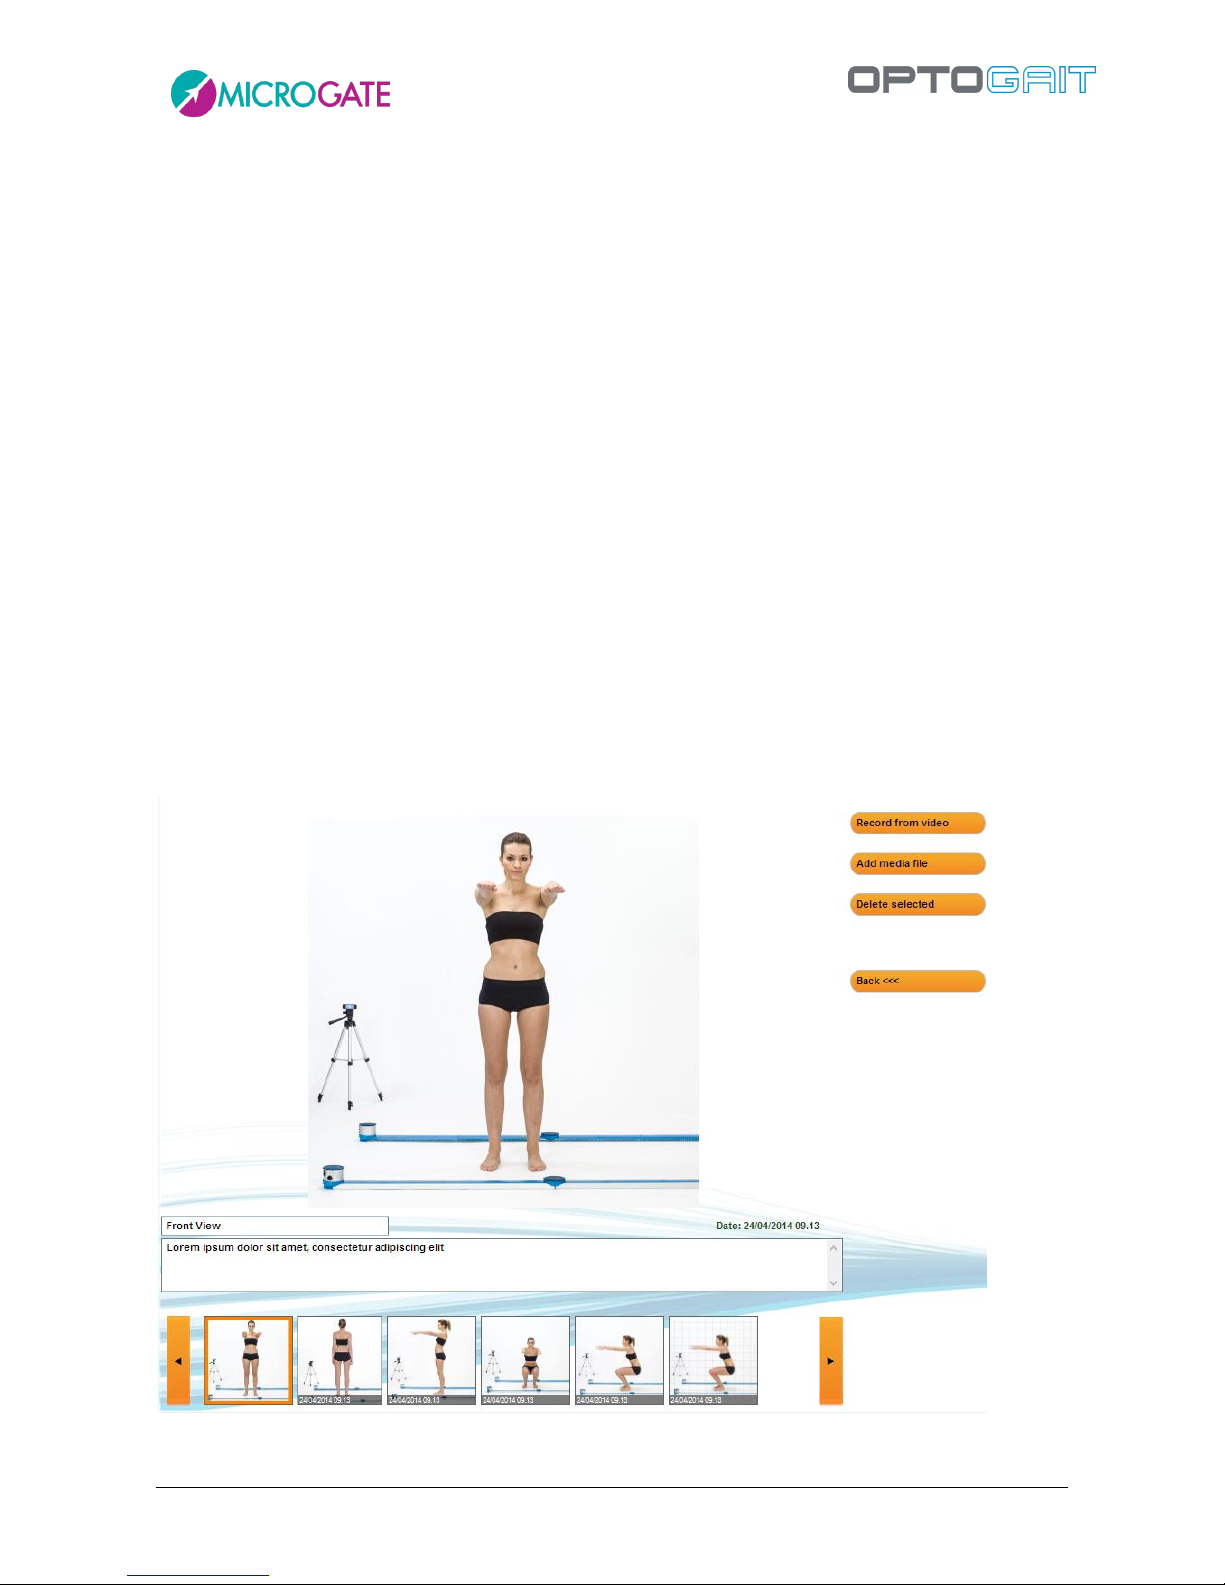
The patient panel can be used to access the "MediaGallery" module: the aim of this section is to
archive images and videos of postural situations without needing to carry out a test with the bars.
You can take photographs, record videos and capture stills, making the patient assume various
poses which are useful for evaluating his/her anthropometric measurements, posture or
pathologies. The photos or still images can be processed with editing tools as described in chapter
5.4
Files of images already taken and downloaded to PC (jpg, png, bmp) can either be imported or
recorded with the webcam used for normal tests. Here's how:
Enter the Personal Data panel of a patient and click the <MediaGallery> button.
To import existing photos, click the <Add media file> button, select 1 or more photograph files from
the disk. The photos will be imported and displayed as thumbnails at the bottom of the screen,
complete with entry date and time, while the full screen display shows the photo currently selected
(marked with the orange border).
To view a photo, click its thumbnail; to scroll through the carousel of thumbnails use the right/left
arrows on screen or on the keyboard. A title and description can be assigned to each photo simply
by entering the information in the relevant fields (the information is saved automatically on exiting
the fields).
Figure 33 - MediaGallery module
Page 42
Version 1.9 Page 42 of 170
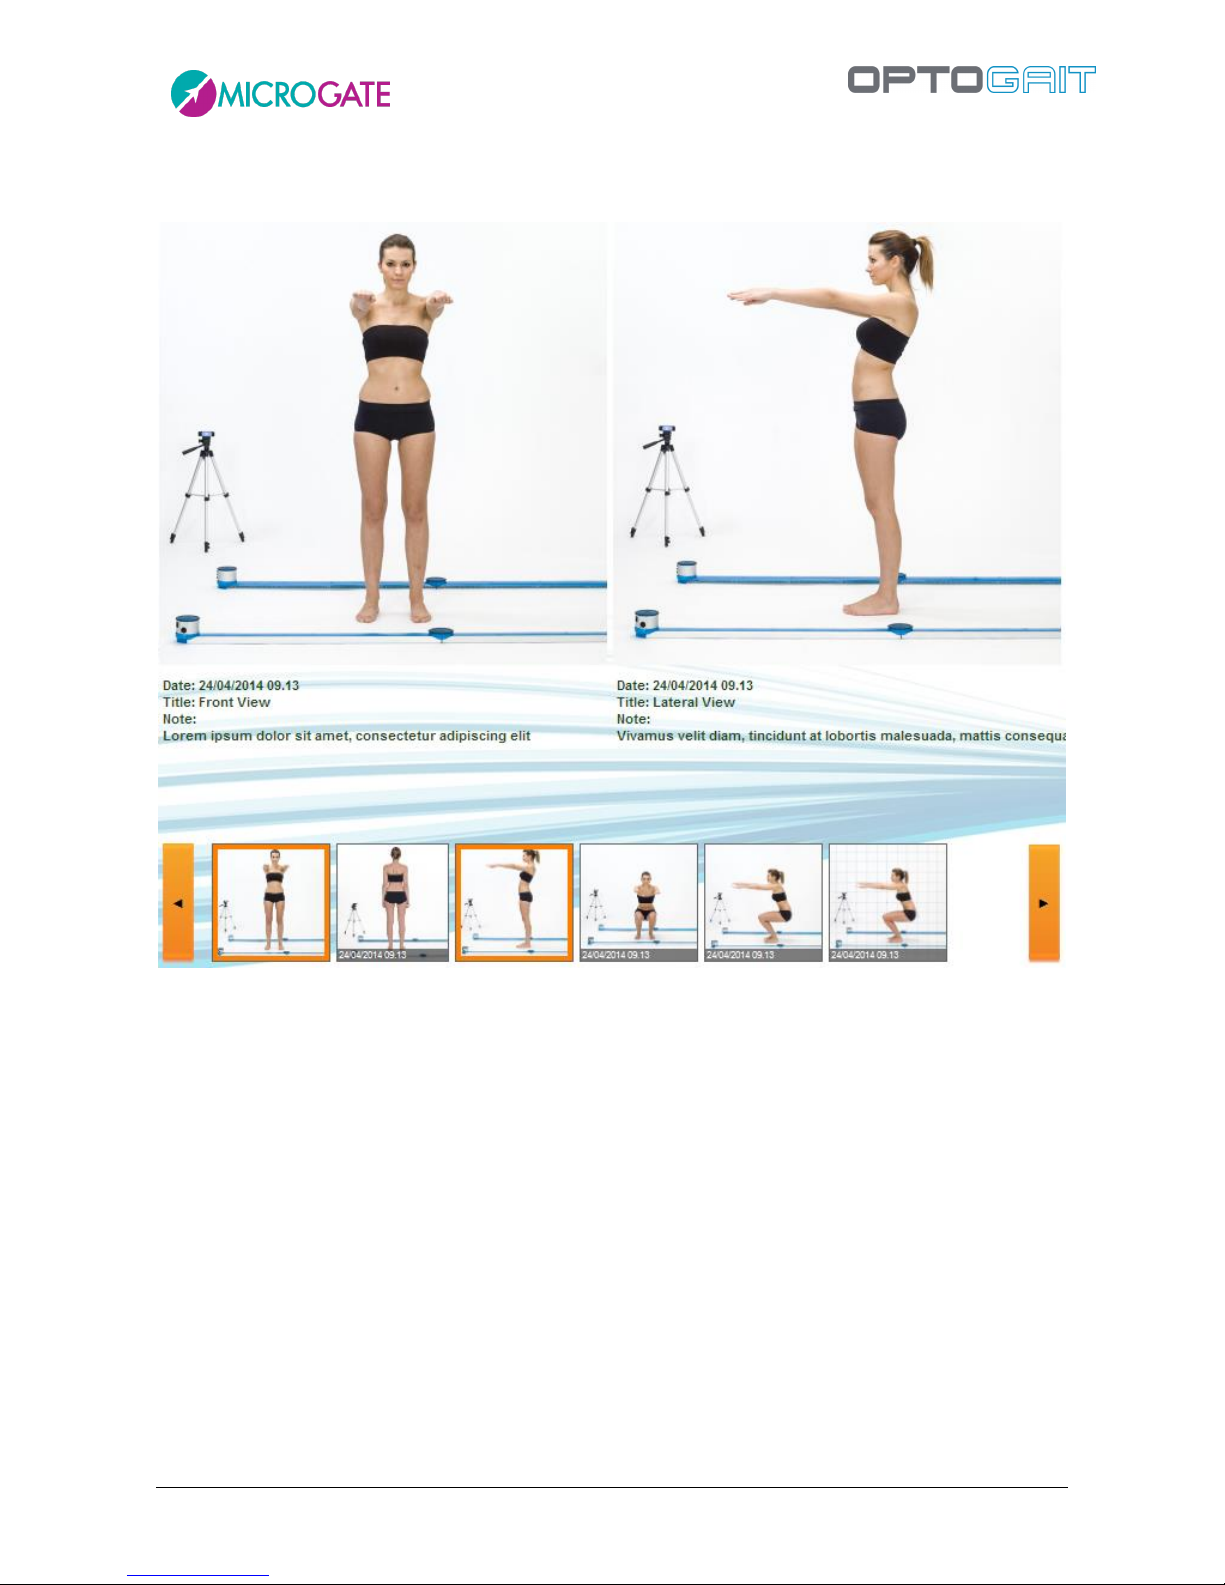
If we want to see two photos side by side (to make a comparison, for example), click the thumbnail
while pressing the CTRL key.
Figure 34 - Comparing two photos
Page 43
Version 1.9 Page 43 of 170
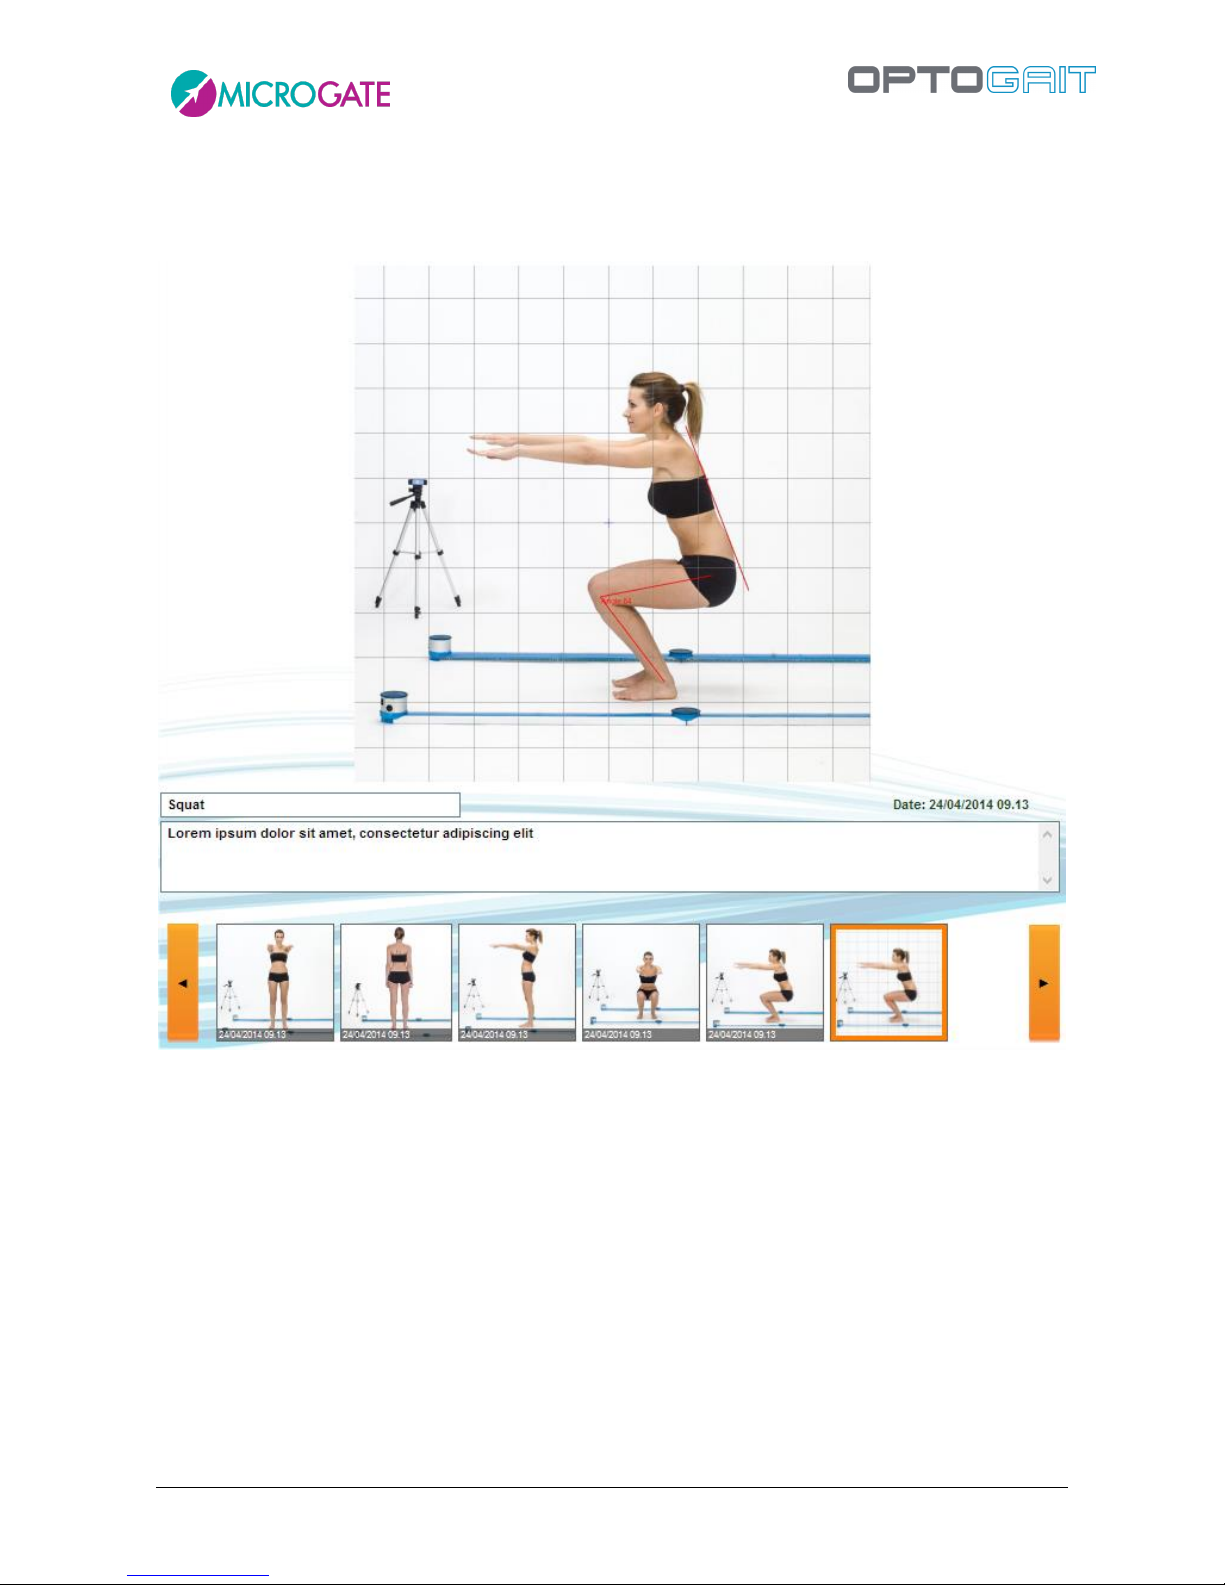
When we are viewing a single image (or a still taken from a video), we can double-click - directly
on the photo and not the thumbnail - to open the image editor with its various design tools,
angles, etc. If we click Save, the image is saved with our annotations.
Figure 35 - Photograph edited in the Still Image Analysis tool
Page 44
Version 1.9 Page 44 of 170
4.1.3.1 ACQUISITION FROM WEBCAM
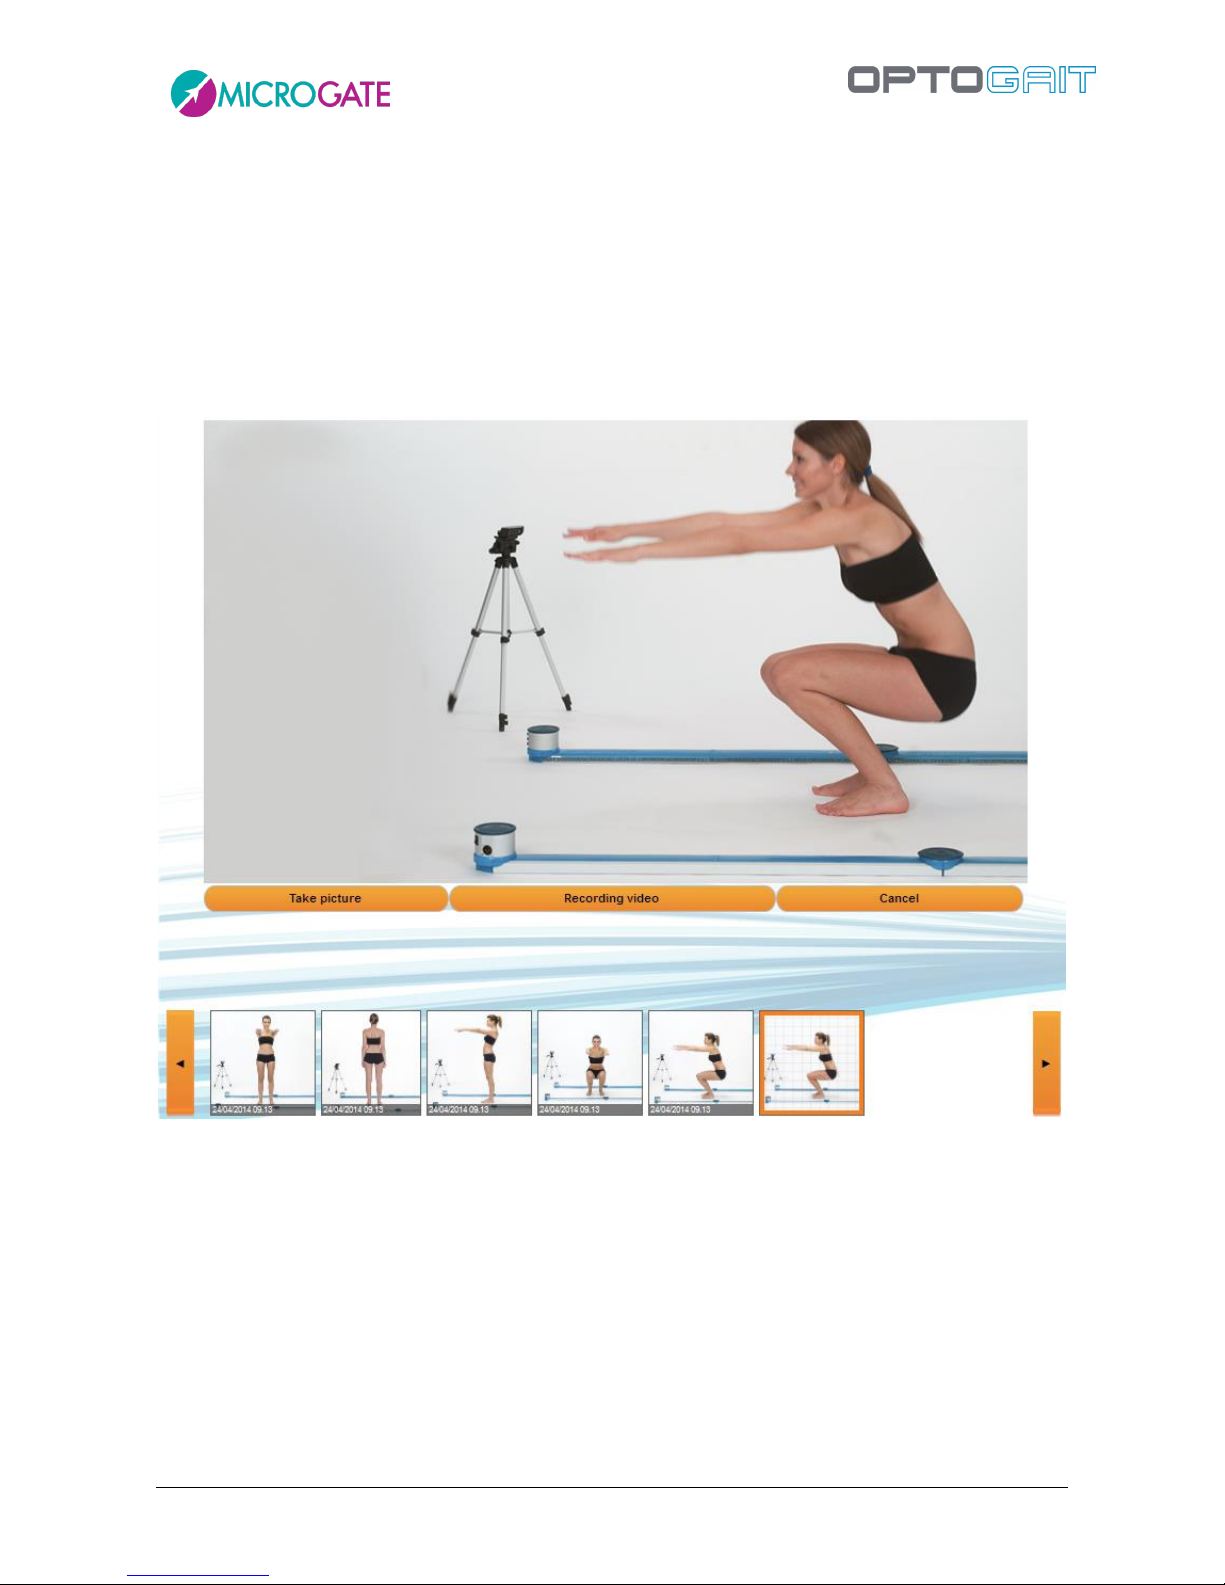
If no photographs have been taken and are ready to import, we can make use of the installed
webcam (perhaps setting it to the maximum resolution as described in chapter 4.4.1.4.2). Click
<Record from Video>. The webcam frame preview will be displayed. Click <Photo acquisition> to
take a photograph which will be automatically added to the carousel. Press <Start Video Recording>
to begin recording; the button (which has become <Stop Video Recording>) flashes to indicate
recording is in progress. When we click to stop the recording, the video is saved and added to the
carousel.
Figure 36 - Record Video from Webcam
Page 45
Version 1.9 Page 45 of 170
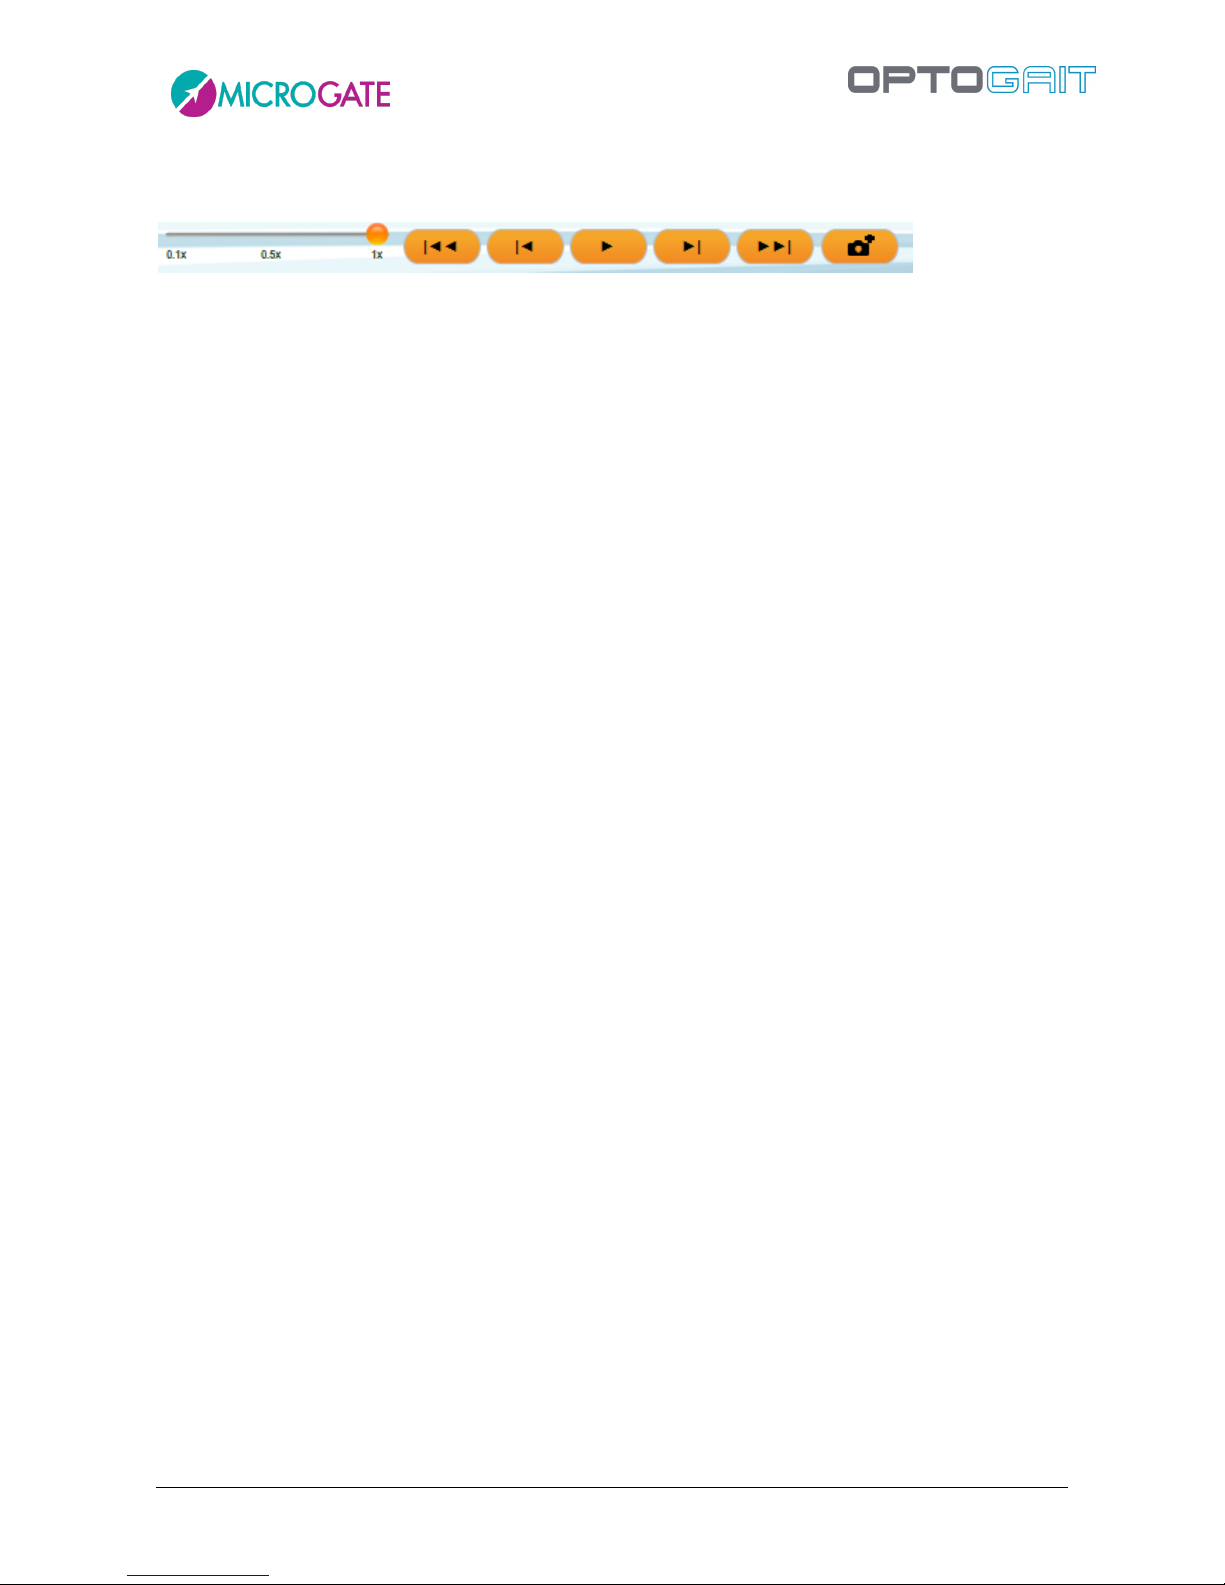
Once the video has been saved, its title and description can be edited by clicking on the thumbnail,
while clicking on the video itself begins playback, with the following buttons appearing underneath:
Slider for slow-motion playback (from 10% to 100%)
Go to first frame
Back one frame
Play/Stop
Forward one frame
Go to last frame
Save current still image
To delete a photo, video or still image, select it and click <Delete Selected>.
Page 46
Version 1.9 Page 46 of 170
4.2 TEST
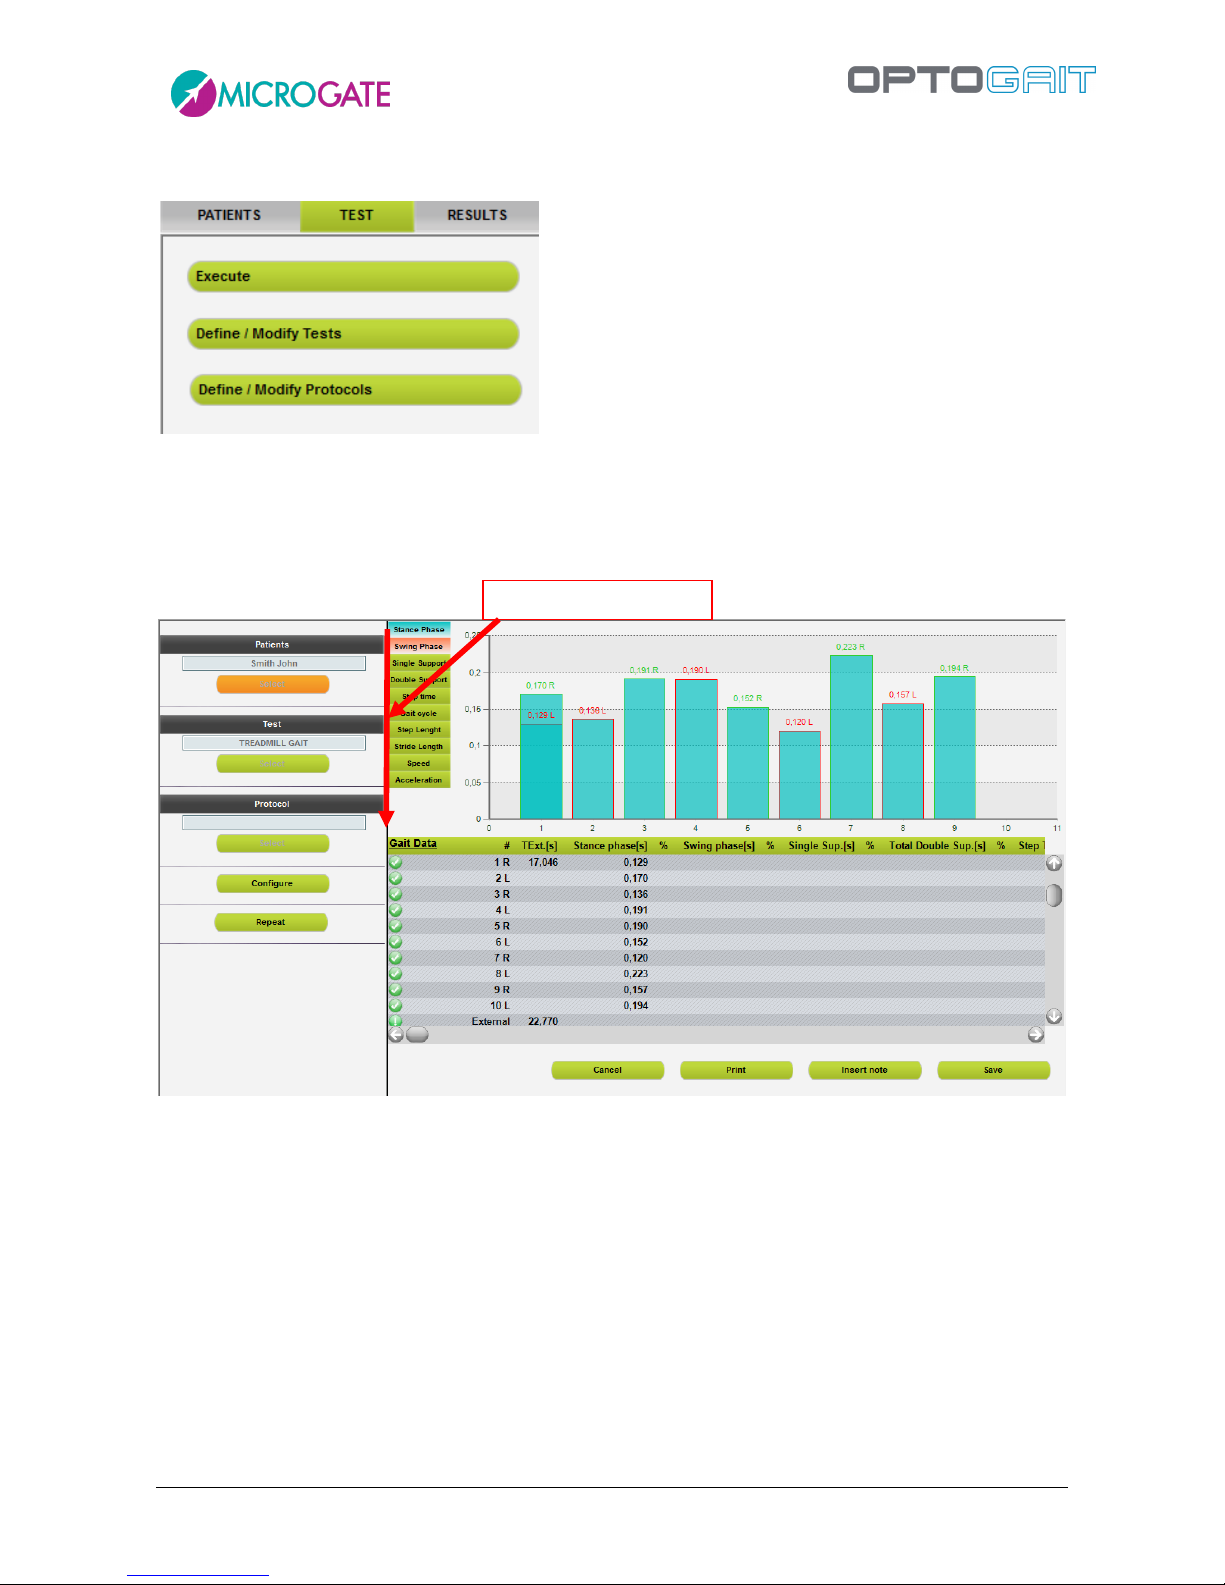
4.2.1 EXECUTE
In this section the pre-defined tests or protocols are carried out. To define a test or protocol, see
the sections below. In addition, before performing a test, at least one patient must be inserted in
the database.
Figure 37 - Execute
To perform a trial it is advisable (but not obligatory) to follow the direction of the operations
indicated by the red arrow at least the first time you enter this section.
The basic flow is
select the patient
select the test type (using tests or protocols)
optionally configure some viewing parameters
press Execute and have the patient perform the jump test or the running/gait test
Save, Cancel or Repeat the test
Data insert direction
Page 47

Version 1.9 Page 47 of 170
Let’s look at an example:
1. Choose one or more patients by pressing the orange <Select> button under the ‘Patients’
box, then tick one or more patients in the grid and press <Confirm>.
Shortcuts are possible using the <Select All> and <Deselect All> buttons, whereas if the
patient database has been organized in groups and subgroups, a group can be selected with
<Select Group>.
2. Select one or more tests by pressing the green <Select> button under the ‘Test’ box; then
tick one or more tests in the grid and press <Confirm>.
2a. As an alternative to the selection of a number of tests, it is possible to select a pre-defined
protocol. Click the green <Select> button under the 'Protocols' box, select the macrotypology and click on one of the protocols followed by the <Confirm> button. It is not
possible to select more than one protocol at once. When the protocol has been chosen, the
test list is compiled with the tests that define the protocol.
3. Check the configuration by pressing <Configure> (see chap. 4.2.1.1 Execute Configuration).
4. Execute the test by pressing <Execute> (or <Repeat> if a test has already been performed).
5. Wait for activation of the Webcam (if installed) and the sound signal that gives the ‘all clear’
to perform the chosen test.
6. Follow the instructions at the bottom left which, depending on the test definition, will tell
you to ‘enter’ or ‘exit’ the test area (i.e. the space between the bars).
7. Save the test performed with <Save>, watch the video again with <Review> or cancel the
test with <Cancel>. Press <Repeat> to have the patient repeat the test without moving to
the next test (or the next patient). If <Repeat> is pressed before saving, the test will be
deleted. Press <Insert Note> to add a note to the test that has just been completed.
Page 48
Version 1.9 Page 48 of 170
Test cycle
We have seen that it is possible to select more than one patient and/or trials, using multiple
selections or choosing a protocol, (a pre-defined sequence of pre-defined tests), and therefore have
a ‘cycle’ of tests performed. In this case the arrows will appear in the respective boxes for
moving the selected data.
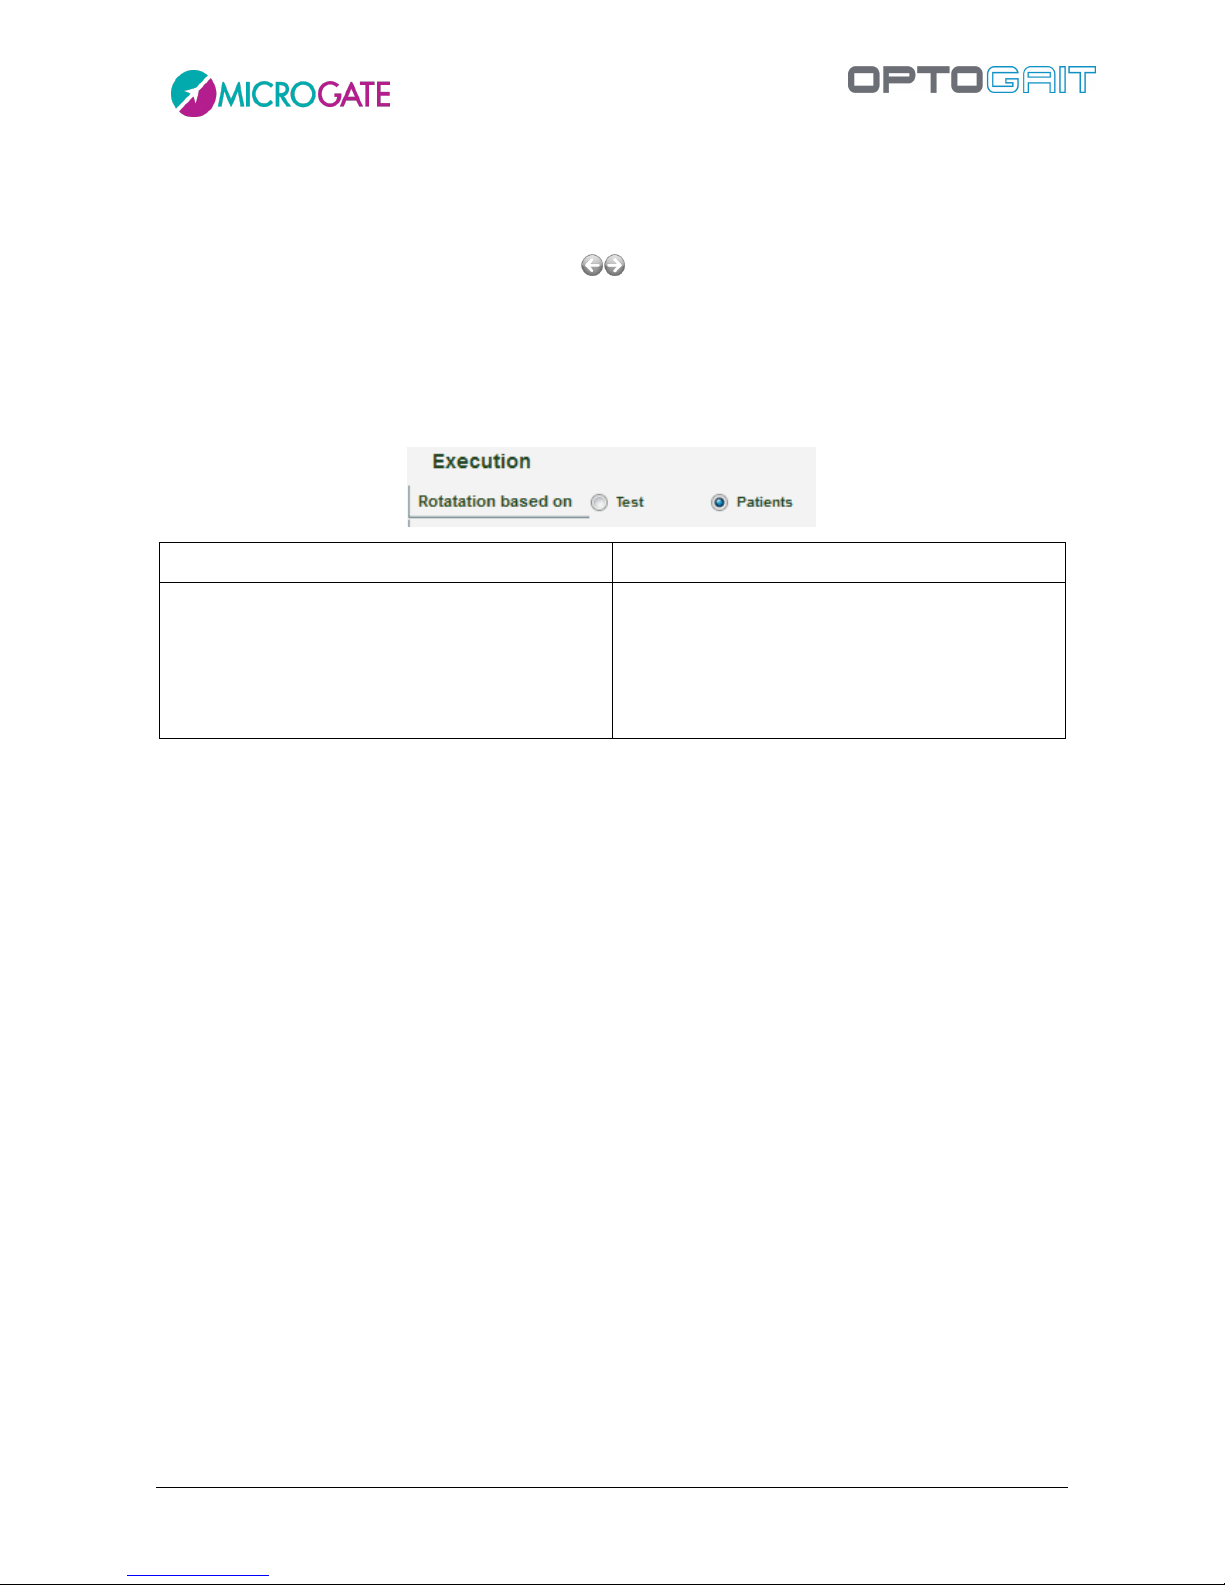
Let’s suppose we select two patients ('Rossi' and 'Smith') and two tests ('Squat jump', 'Stiffness').
Depending on how the parameter 'Rotation based on…' is set, the following types of sequence can
be set:
Rotation based on a Test
Rotation based on Patients
Rossi/Stiffness
Rossi/Squat jump
Smith/Stiffness
Smith/Squat jump
Rossi/Stiffness
Smith/Stiffness
Rossi/Squat jump
Smith/Squat jump
TIP: When patient, test or protocol selection is made, it is possible to double-click with the mouse
on the line of the grid to select the single data item and confirm automatically.
The videos are always acquired in size 640 x 480, even if they are displayed small.
The test acquisition can be simulated even if the OptoGait hardware device is not connected. The
keys that simulate the device are:
F8 – when pressed simulates the status “inside the measurement area”, when released
simulates the status “out of the measurement area”
F4 – every time it is pressed, it simulates an external impulse (e.g. photocell, etc.)
Note: the only function that cannot be simulated is the acquisition of a Sprint/Gait test: it is not
possible to know the length of steps. While this type of test is allowed, it will finish without the
acquisition of steps.
Page 49
Version 1.9 Page 49 of 170
4.2.1.1 EXECUTE CONFIGURATION
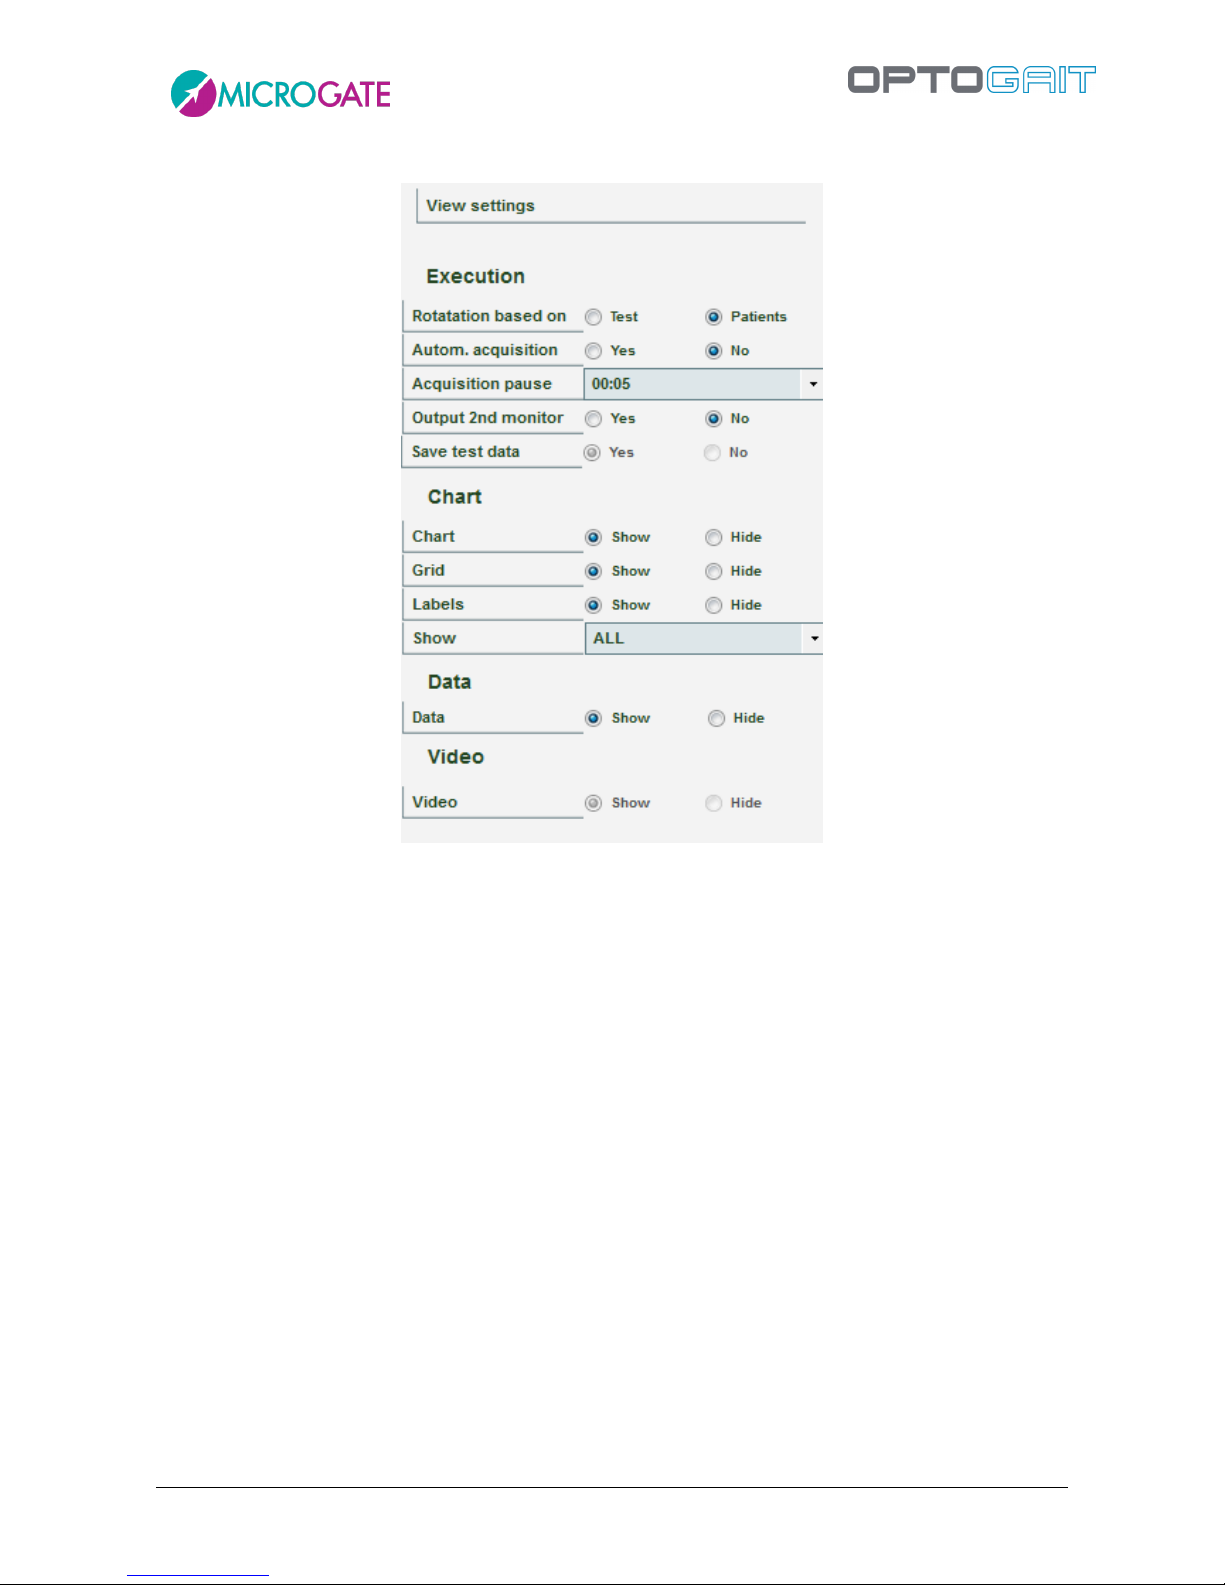
Figure 38 – Execute Configuration
Test data viewing can be configured by the user. The parameters are:
Execution
o Rotation based on: if more than one test or patient is selected, this indicates the
chosen mode
Test: after each performance, the next test begins for the same patient
Patient: after each test performance this goes on to the next patient doing
the same test
o Automatic acquisition: if this parameter is set to Yes, it is possible to skip the
manual saving phase at the end of each test; when the patient finishes a test, it is
saved, then, after a few seconds (as configured in the parameter ‘Acquisition
Pause’) the next test begins automatically (performed by the same patient or by
another, depending on the settings).
o Acquisition Pause: indicates the pause time between one test and another, which
are acquired automatically. Used only if Automatic Acquisition = YES
o Output 2nd monitor and Save Test Data: see chap. 4.2.1.2 on Video Feedback
o Metronome: see chap. 4.2.1.3
Page 50
Version 1.9 Page 50 of 170
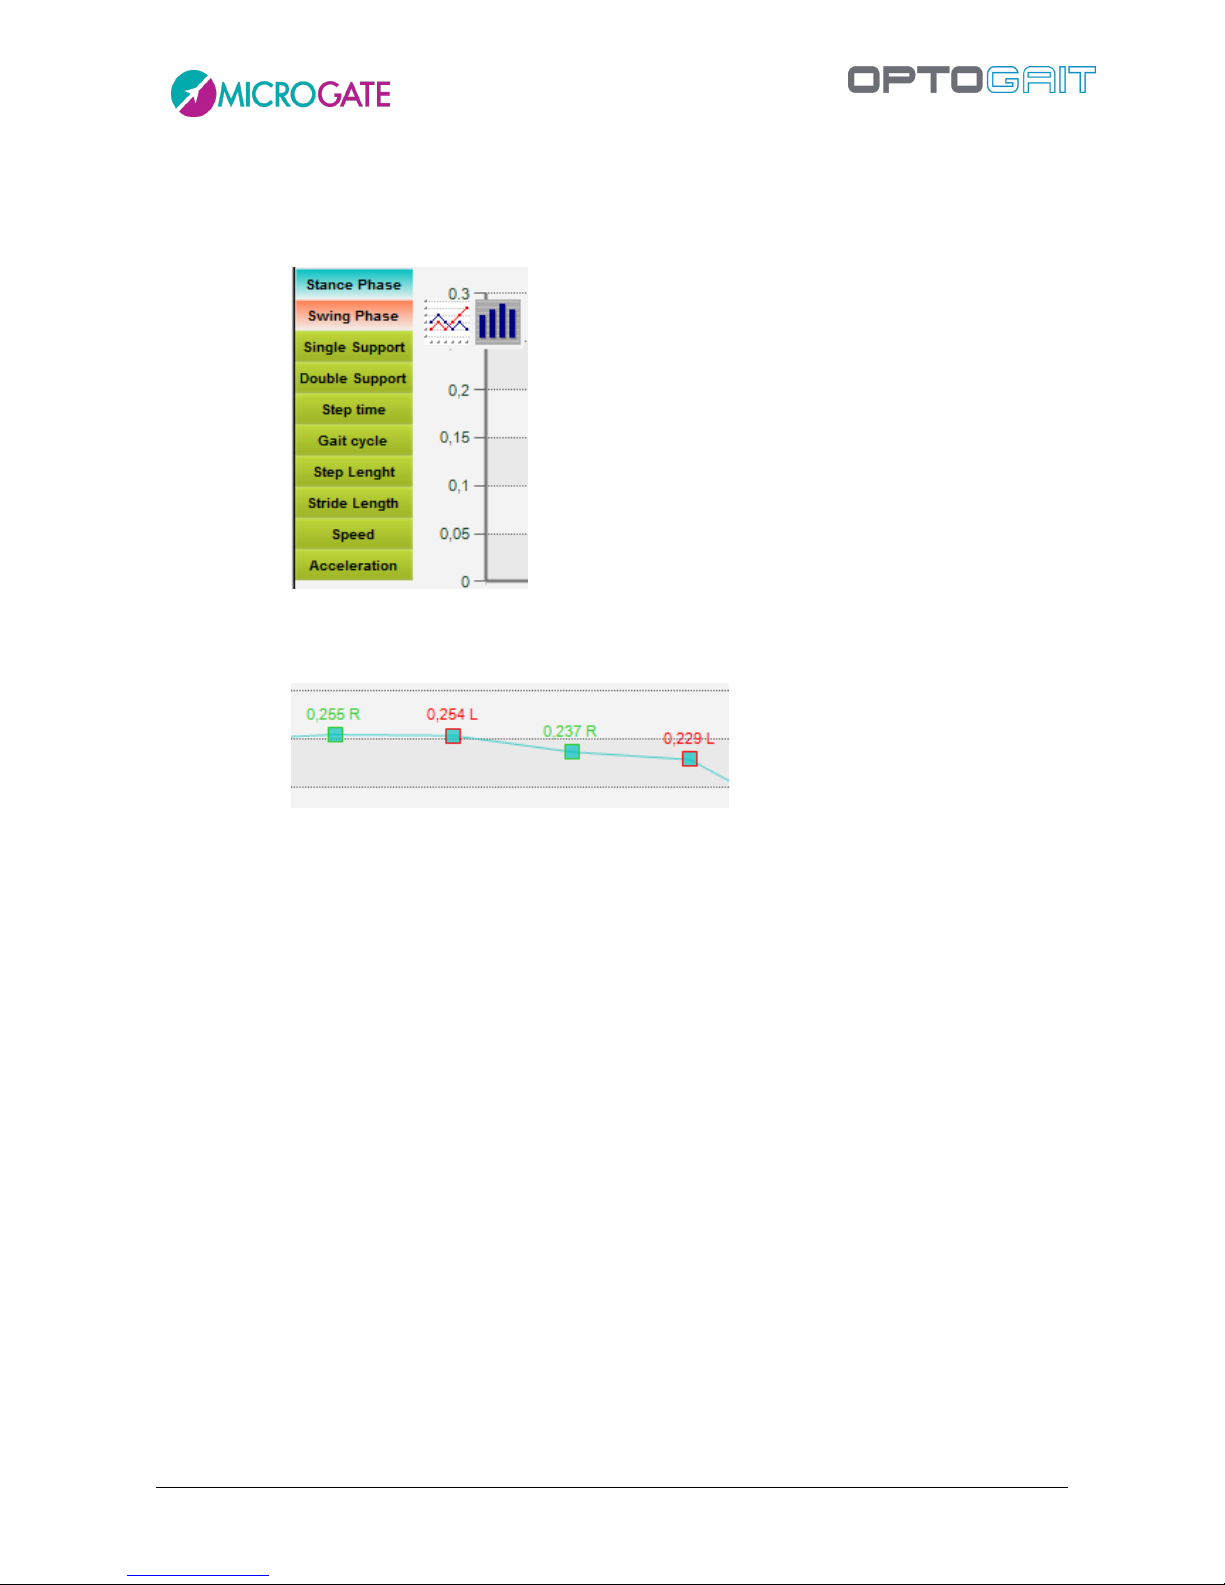
Chart
o Chart: shows/hides the chart during the execution; if ‘show’ is chosen, it is possible
to choose which values to display (Flight times, Contact times, Height, Power, Pace,
etc.) and how (bars or lines).
o Grid: shows/hides the white-dotted lines forming a grid on the chart.
o Labels: displays/hides the labels for the numerical values on each spot of the chart.
o View: displays the last N-number of acquired data.
o Statistics Charts: shows/hides the statistical pie chart based on warning and bad
thresholds (see chap. 0).
Data
o Data: shows/hides the numerical data table with its lines and columns.
Video
o Video: shows/hides the videos acquired by the webcam.
Page 51
Version 1.9 Page 51 of 170
4.2.1.2 VIDEO FEEDBACK
The main idea of this new feature is to show the patient directly some main parameters of the test
he/she is carrying out. This allows to request real-time 'corrections' of some trial anomalies, making
the test become an exercise, not only a diagnosis. Particular attention is paid to the concept of
asymmetry, i.e. the difference between right and left foot (expressed in %) with respect to a
particular parameter.
A classic example is a treadmill gait test, where the patient has a monitor in front of him/her (better
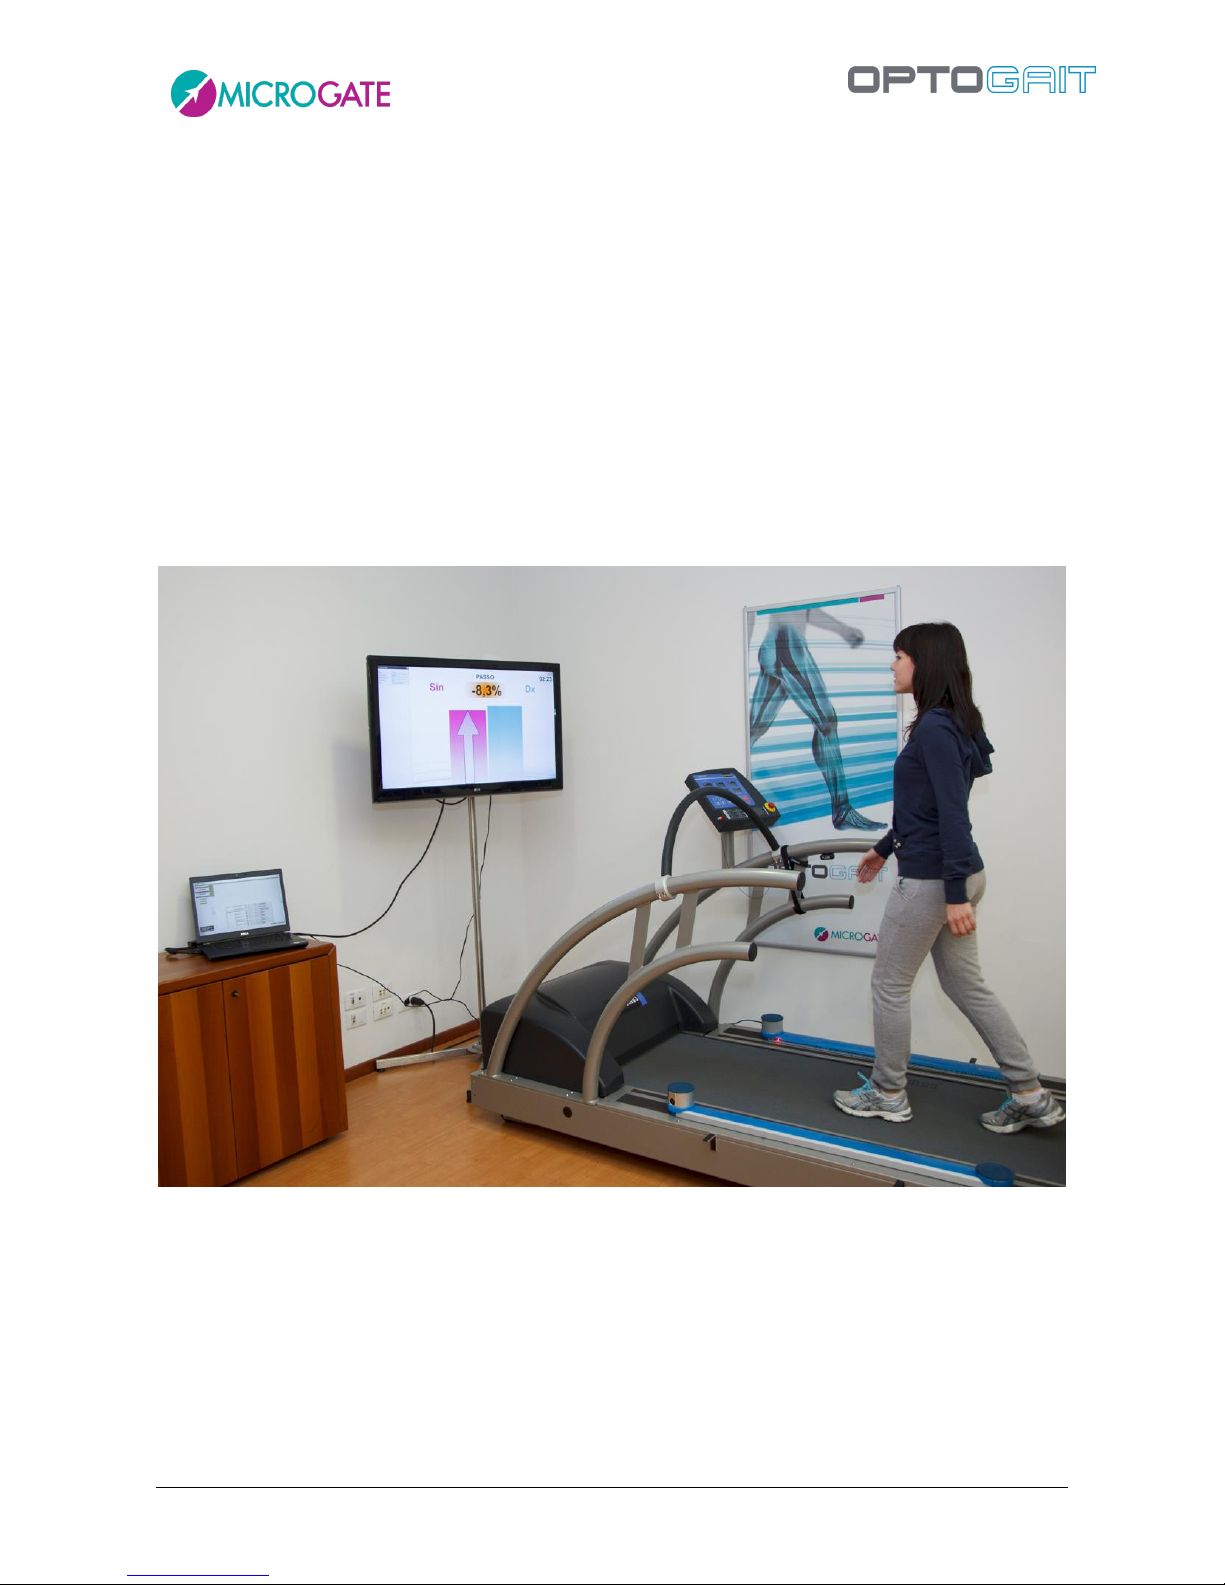
if a large-screen TV), where the operator can choose which parameter among those available to
display, depending on the pathology or rehabilitation.
During the gait test, the patient receives a numerical/graphical feedback (in the form of
green/orange/red colours and up/down arrow symbols) indicating what is not 'working' and how to
correct it (e.g. making the left gait longer or increasing the rhythm, etc.).
Page 52
Version 1.9 Page 52 of 170
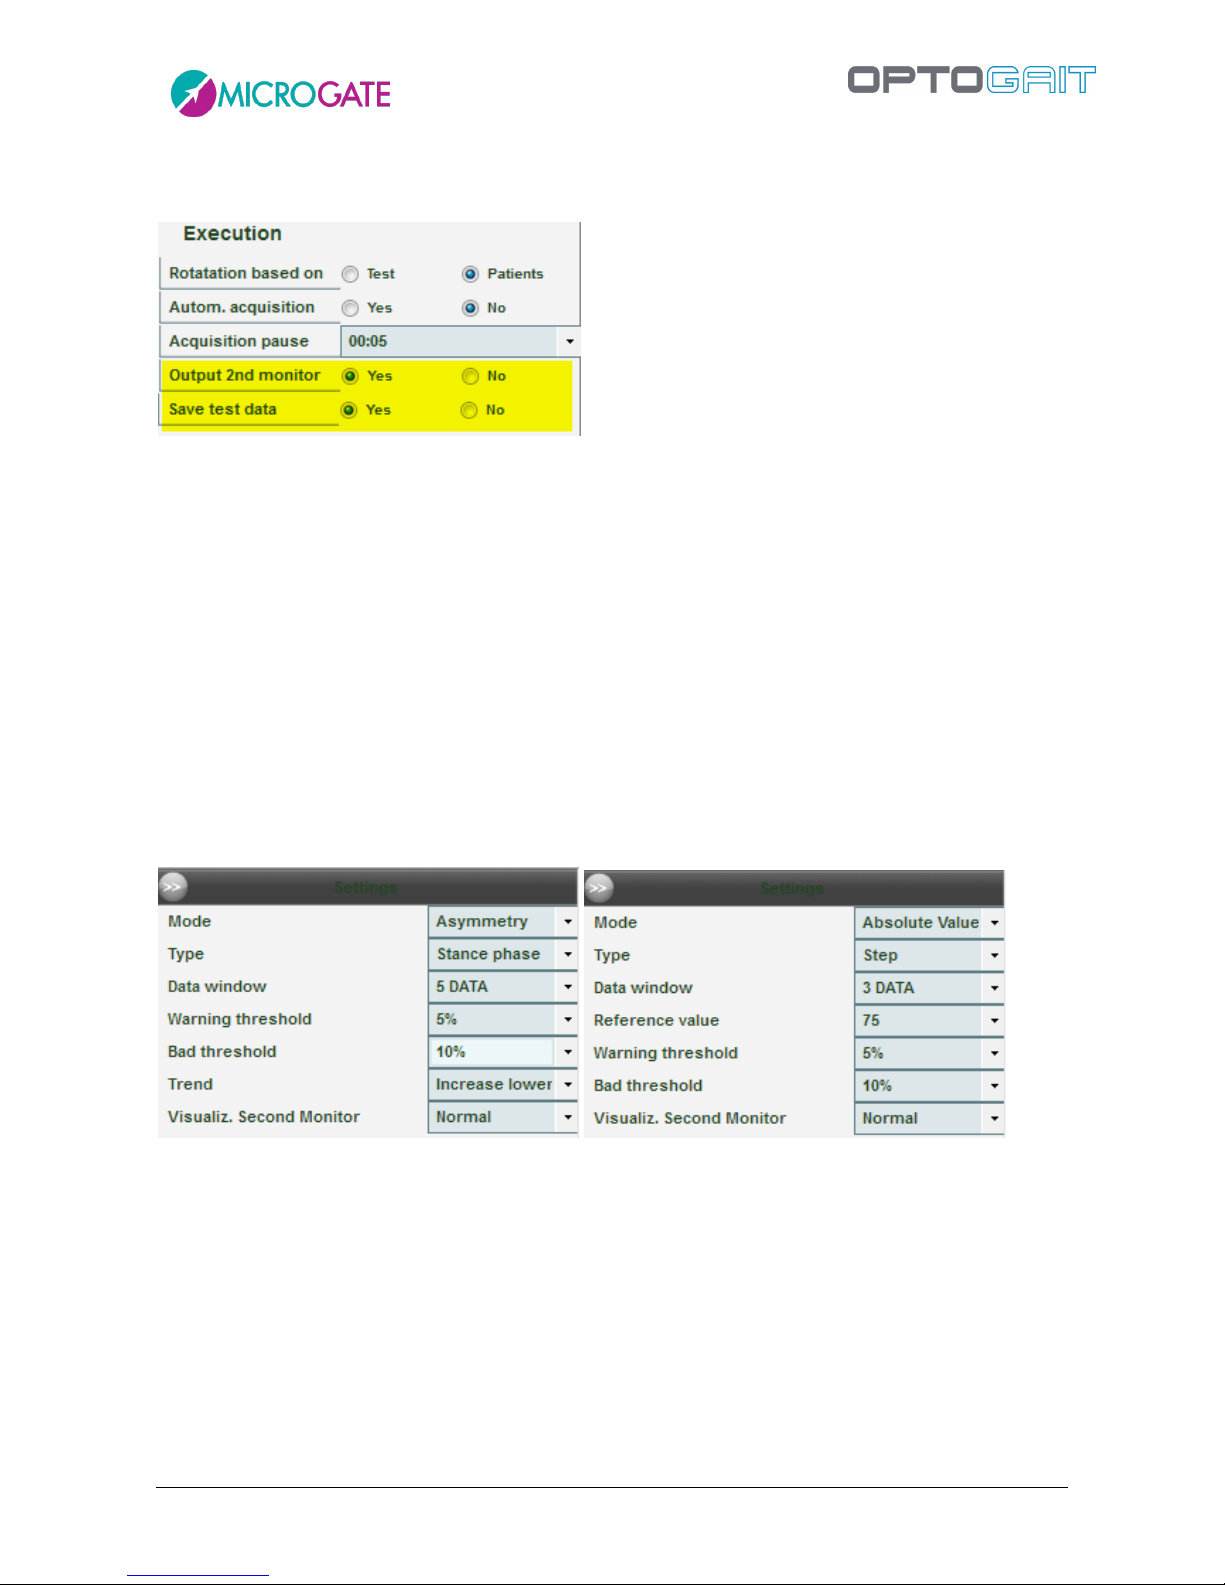
The new feature (available from version 1.7) is found in Test Module > Execute > Configure, with
the two parameters 'Output second monitor' and 'Save Test Data'.
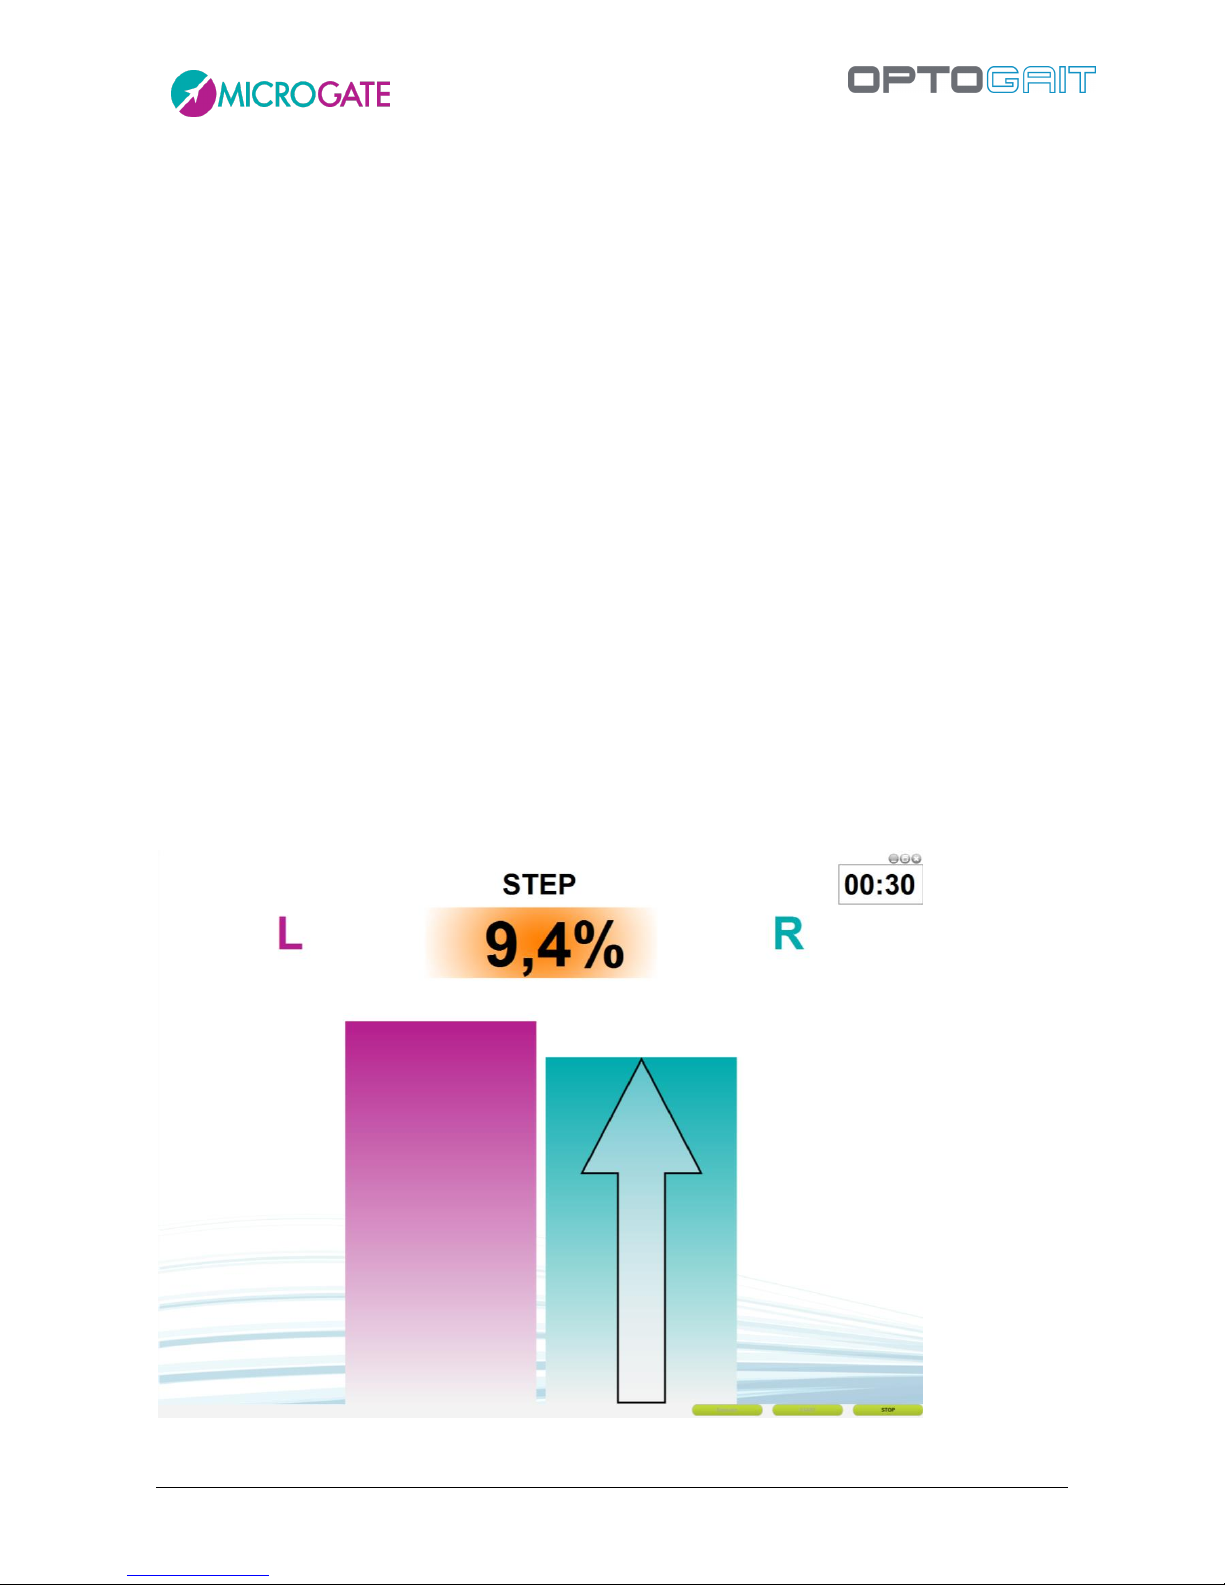
When the 'Output Second Monitor' option is selected, a window is created on the second monitor
(or on the same monitor, when the second one is not physically present), where the displaying of
the absolute value or the test parameter asymmetry can be configured (e.g. the step length for a
gait test) both as a numerical value and as a graphical bar display.
Instead the 'Save Test Data' parameter is used (if set on No) when, as previously described, the
patient must 'exercise' and it is not necessary to save the test at the end of the trial. In this case no
data 'sampling' and, most of all, no webcam video sampling is carried out, thus reducing the used
disk space (temporary video files and memory swap files) as well as CPU use.
The parameter to be displayed is configured in the main window on a side panel bar, which can be
minimized (>> key). The panel appears when the type of test and the patient performing it are
selected, because the values associated with the patient-test type pair are saved so that they can
be recalled exactly as they are whenever the test is repeated.
The parameters, which can be set, are the following:
Mode: select 'Absolute Value' (the values for the 'type' selected in the drop-down menu
below are shown) or 'Asymmetry' (the two right and left values and the delta values are
shown).
Type: the parameter to be displayed (changes depending on the test type carried out; e.g.
for a tapping test, the flight and contact times, rhythm, etc., for run tests, speed,
acceleration, etc., whereas for gait tests, regular gait analysis parameters, such as stance,
swing, single support, step length, etc.).
Page 53
Version 1.9 Page 53 of 170
Data Window: the amount of data used for calculating the asymmetry (the last N are
used); the higher the data, the better the 'average' and the more real the value, but it will
be more difficult for the patient to try and correct his/her asymmetry.
Reference Value: only appears when Mode = Absolute Value and is the value taken as a
reference when calculating the thresholds. Obviously it should be set in line with the type
of measurement selected (e.g. 30 cm for height, 0.5 s for flight time, 70 cm for step length,
etc.).
Warning Threshold: if the asymmetry is lower than this percentage, the value is displayed
on a green background, and if it is higher, the background colour is orange.
Bad Threshold: if the asymmetry is lower than this percentage, the value is displayed on an
orange background, and if it is higher, the background colour is red. Setting for example
the warning threshold at 5% and the bad threshold at 10% the following background
colours will be used:
- 0 <= value < 5 = green
- 5 <= value <10 = orange
- >= 10 = red
Trend: only appears if Mode = Asymmetry; if the asymmetry value exceeds the warning
threshold, an indication for the patient is displayed with an arrow on the value bar. The
indication can be to increase the lower value or to decrease the higher value.
View Type: choose between 'normal' (below) or 'Opto 4 Kids' (see next chapter).
Figure 39 - Example Output 2nd monitor with Asymmetry on the Step Length, normal view
Page 54
Version 1.9 Page 54 of 170
4.2.1.2.1 Opto 4 Kids
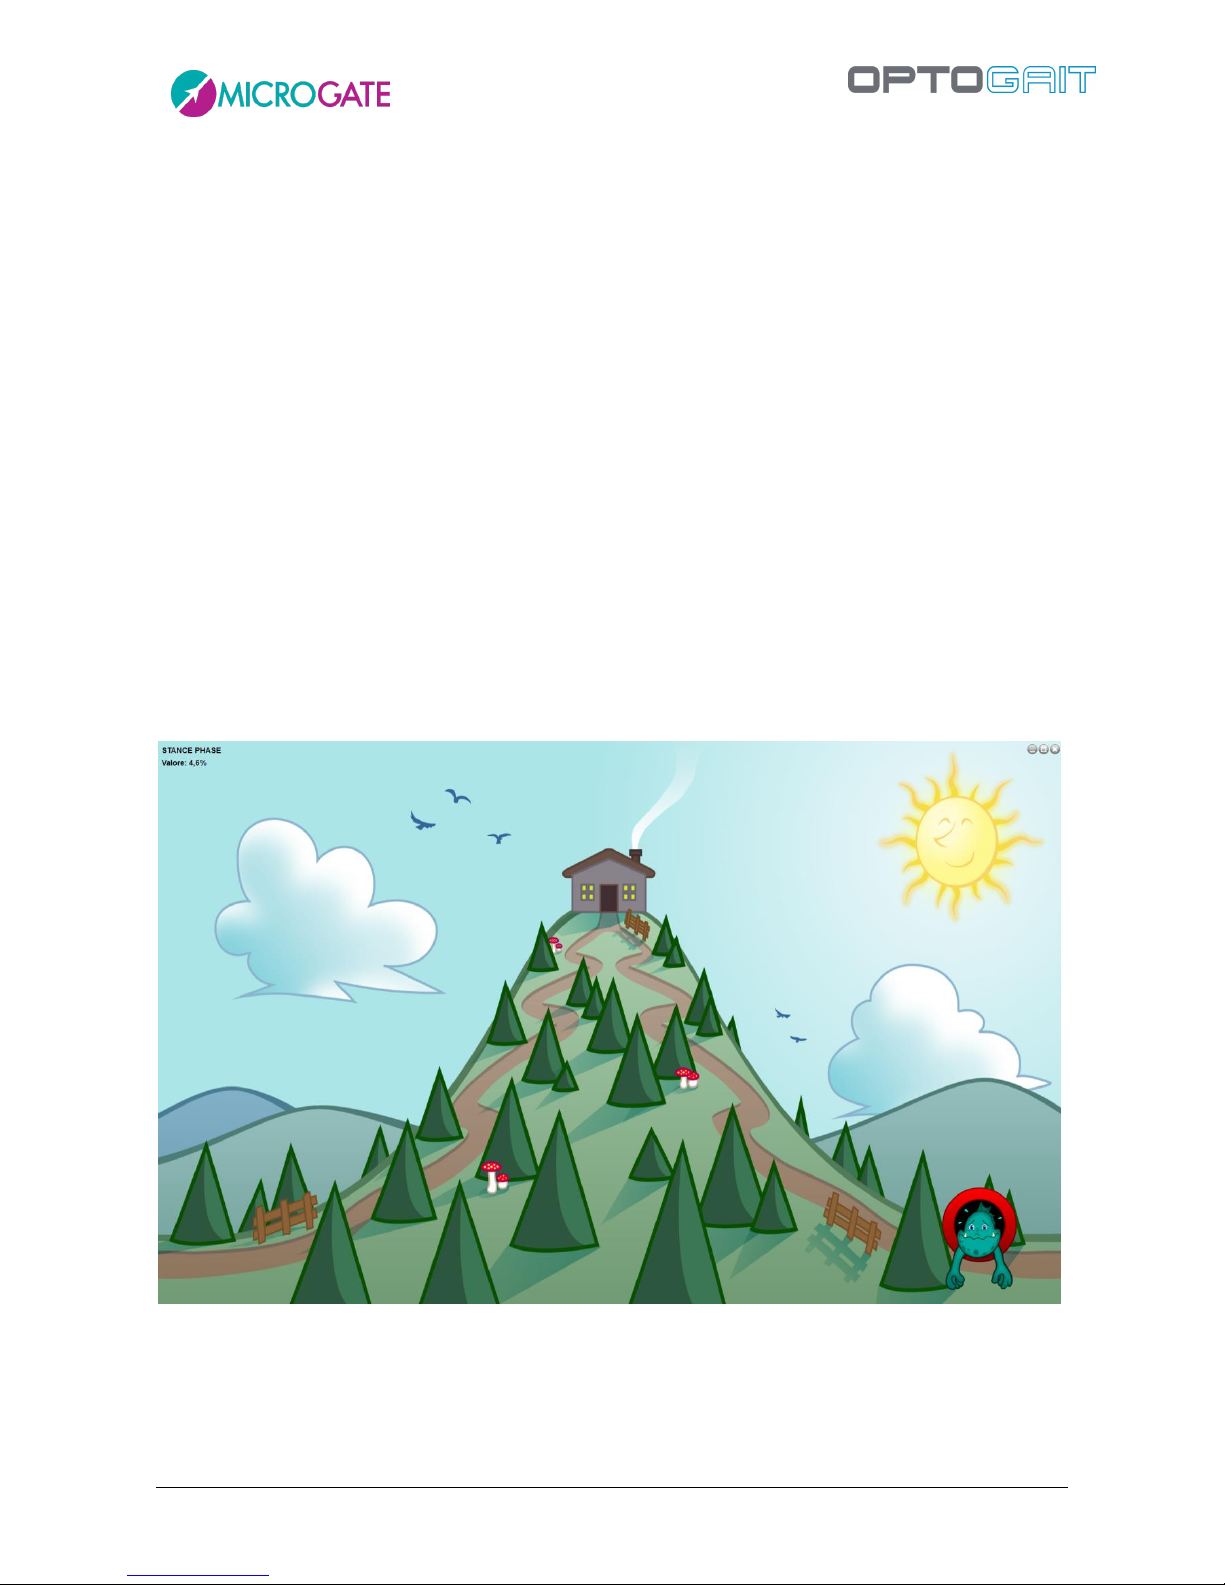
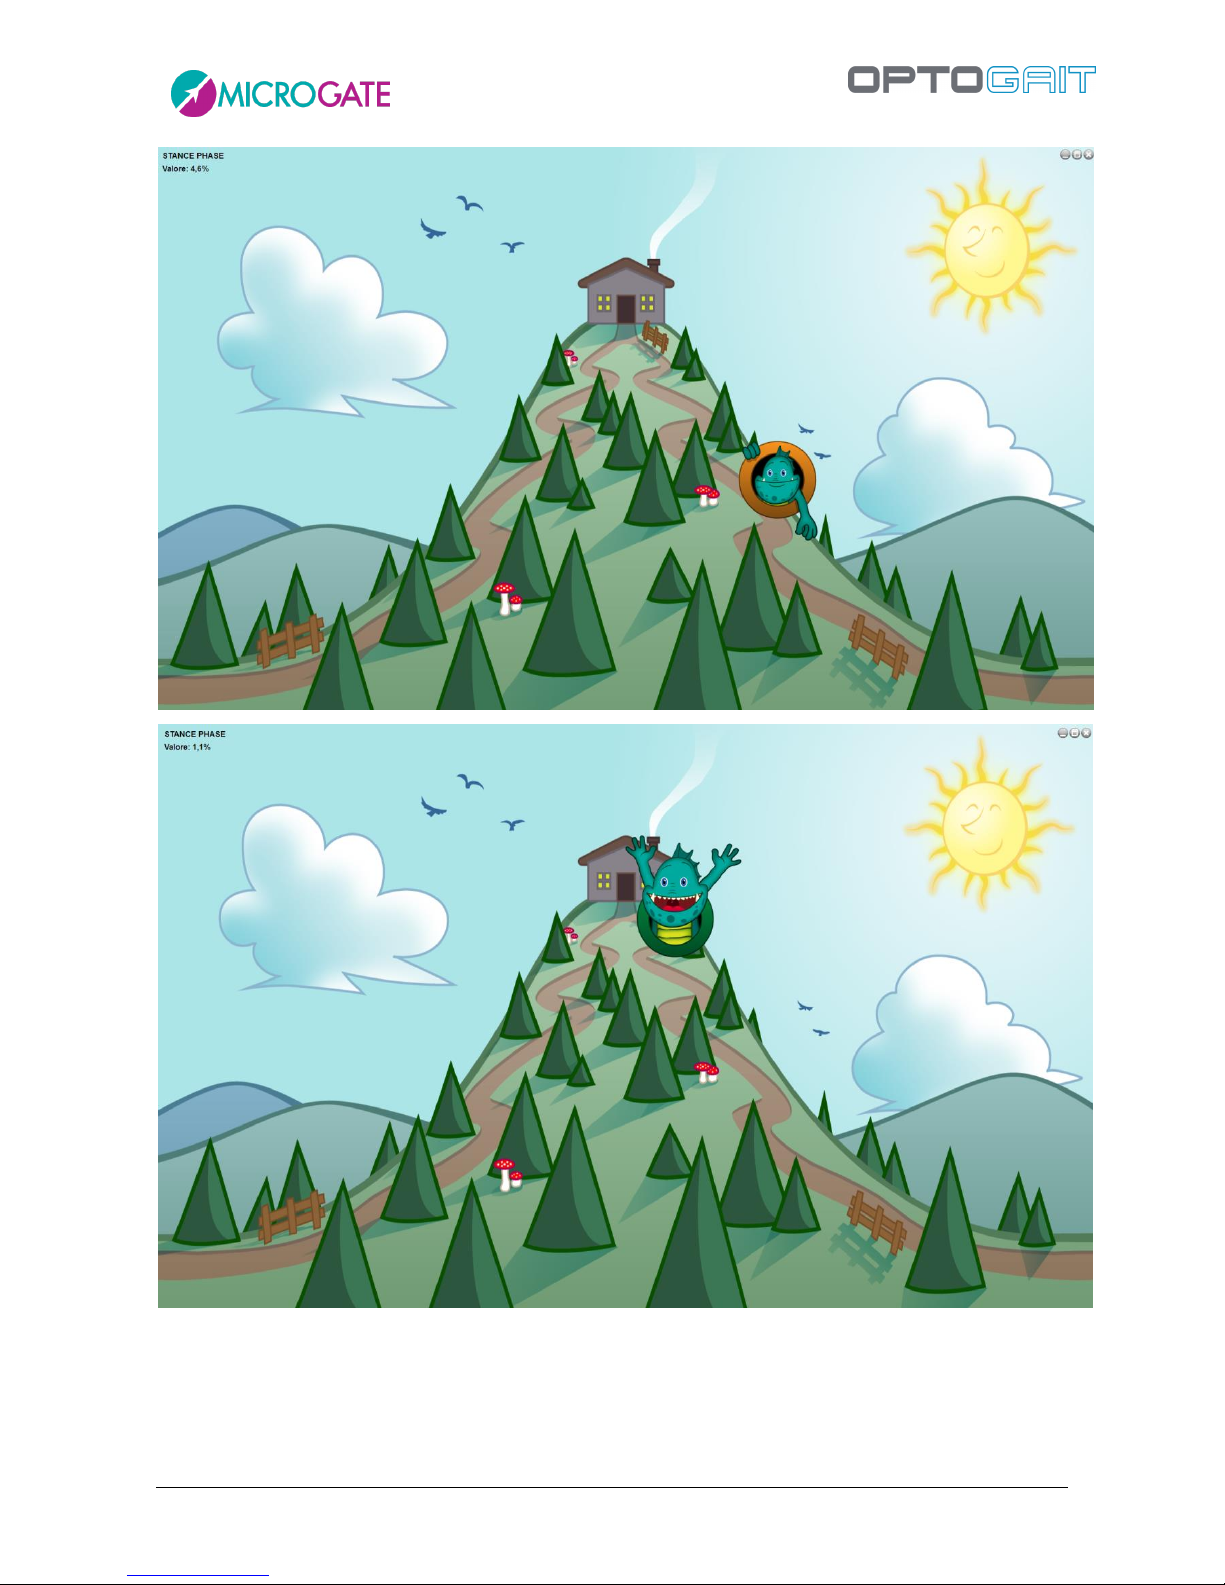
The special view 'Opto 4 Kids' is aimed at making tests fun for children, as they often get bored
(especially during long tests on the treadmill) and their interest is not engaged.
Instead of showing numeric values or histograms, which can be difficult for them to understand, we
have designed an animated cartoon-style background and a character who has to climb a mountain
(a baby dragon in this first version, but in future versions it will be possible to select a favourite
avatar).
The position and expression of the dragon indicate whether the exercise is being performed
correctly: a sad dragon at the foot of the mountain means high asymmetry or absolute values far
from the set reference values, while a happy dragon on top of the mountain means the target is
being reached.
The type of measurement and the current value appear in the top left-hand corner (useful
information for the adult operator running the exercise).
The operator (physiotherapist, doctor or technician) is responsible for encouraging the little patient
to reach the top of the mountain by giving the necessary instructions (e.g. "try to take longer steps
with your left leg", "try to speed up a bit"); the child will therefore be driven from a play perspective
and should find the motivation to improve his/her condition and have fun while exercising.
Figure 40 - Test Start
Page 55
Version 1.9 Page 55 of 170
Figure 41 - Two phases of the Opto 4 Kids video feedback
Page 56
Version 1.9 Page 56 of 170
4.2.1.3 METRONOME
While performing certain exercises (gait, walking on the spot, jumps), some patients find it easier to
maintain a cadence if they are able to follow a constant rhythmic sound. OptoGait has a virtual
'metronome' function which can be used to set the cadence in bpm (beats per minute) and the tone
(single or double).
In this software version, the sound is generated and reproduced by the PC sound card, as a reference
for the patient only; future releases should record metronome beats in addition to the test data,
correlating it with various events (e.g. step cadence, jump, etc.) which take place.
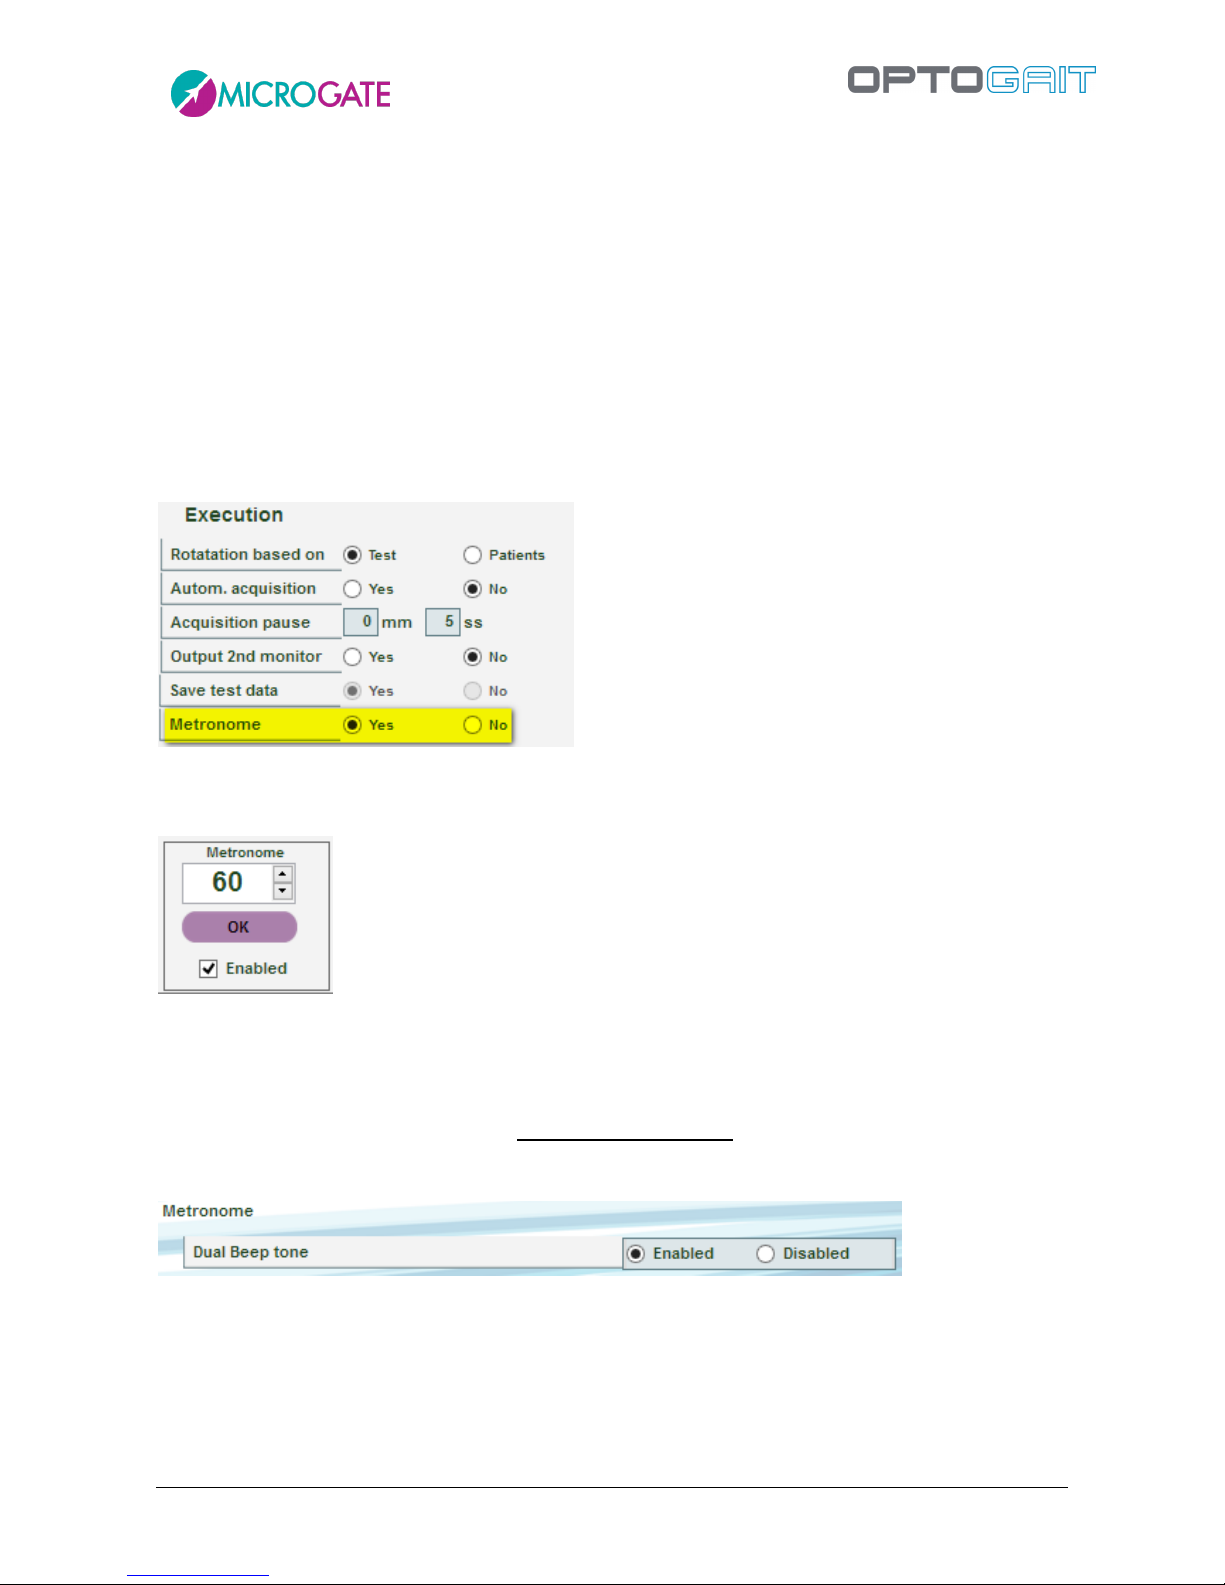
To activate the metronome during a test, go to Test > Execute > Configuration and select the YES
setting.
Once this option is activated, a small panel in the bottom left-hand corner will appear with each
test:
To generate the sounds, click the ACTIVE check box (this function. The OK button flashes at the set
rhythm.
The number of beats can be changed (between 10 and 200, in steps of 5) using the corresponding
slider or by entering the figure directly and confirming with OK.
In Utility > Basic Settings it is possible to set a single or two-tone sound.
Page 57
Version 1.9 Page 57 of 170
4.2.2 DEFINE / EDIT TESTS
In this section, the definitions of the tests to be performed can be defined or edited.
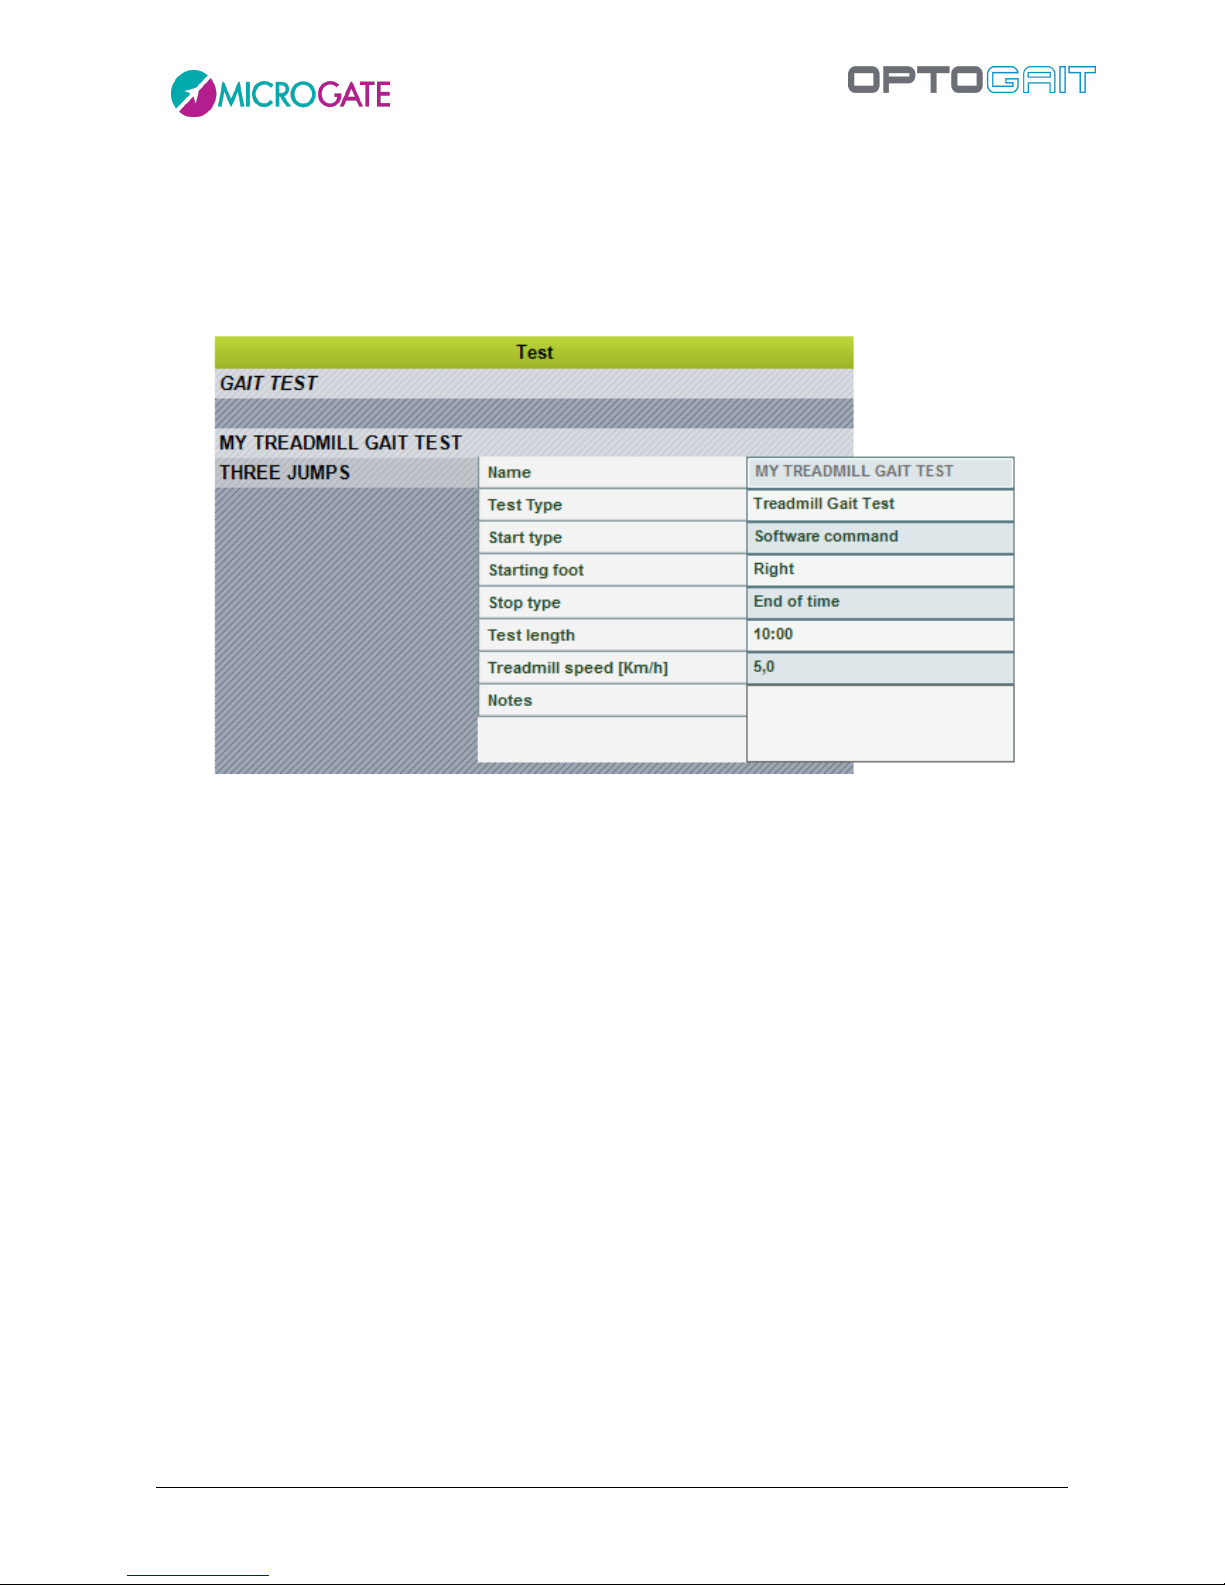
You can view the list of tests pre-defined by Microgate (in italic) or those you have added yourself
in the grid (in the example below ‘MY treadmill gait test’ is a test added by the user).
Figure 42 - Define Edit Test
If the mouse is pointed on a test, its characteristics (which are those that will be used to define a
new one) will be displayed.
By pressing <New Test>, the section for defining a test is opened.
The fields necessary for defining a test are the following:
Page 58

Version 1.9 Page 58 of 170
Name: name identifying the test type (e.g. ‘left foot monopodalic’ or ‘continuous jumps 30
seconds’, etc.)
Test Type: this type indication is very important and conditions the fields below, which
appear dynamically only after the type has been chosen from this drop-down menu:
o Jump Test: type of test that measures flight time (and consequently height), as well
as contact time during a series of jumps (in the former version this was called
Contact/Flight time)
o Reaction Times: measures the reaction time to a visual or sound stimulus
o Sprint and Gait Test: test for the analysis of a run or walk; in addition to flight and
contact times, step or stride length, other indicative parameters are also registered
(in the former version this was called Walkjump)
o Treadmill Running Test: test analysing running to be used on a treadmill (in the
former version this was called Rolljump).
o Treadmill Gait Test: test analysing gait to be used on a treadmill.
o Tapping Test: frequency test registering separate data for each foot.
Notes: Mnemonic general notes on the test definition.
Example movie: with the webcam connected it is possible to acquire a movie clip that can
be viewed in the future as a reminder. Press <Acquire> to acquire the movie and <Play> to
view it.
4.2.2.1 MAIN AND SECONDARY PARAMETERS
The parameters of a given test type are divided into Main Parameters and Secondary Parameters.
To switch from one mask to another, press the corresponding button on the right.
Secondary parameters are the same in the Utility menu under Basic Settings (chap.4.4.1.2, 4.4.1.3
and 4.4.1.5). When creating a new test definition, the values of these parameters are retrieved from
the general data. It is possible to edit them for a specific test for particular needs. All tests of that
type will then have the modified parameter. It is also possible to change one of these parameters in
a SINGLE test (the test of Mario Rossi on April 12th), without influencing the test definition itself.
Therefore it is important to understand how the secondary parameters have a hierarchical structure
and a sort of parent/child relation.
Basic Configuration Parameter
↓
Test Definition Parameter
↓
Single Test Parameter
For example:
Page 59
Version 1.9 Page 59 of 170
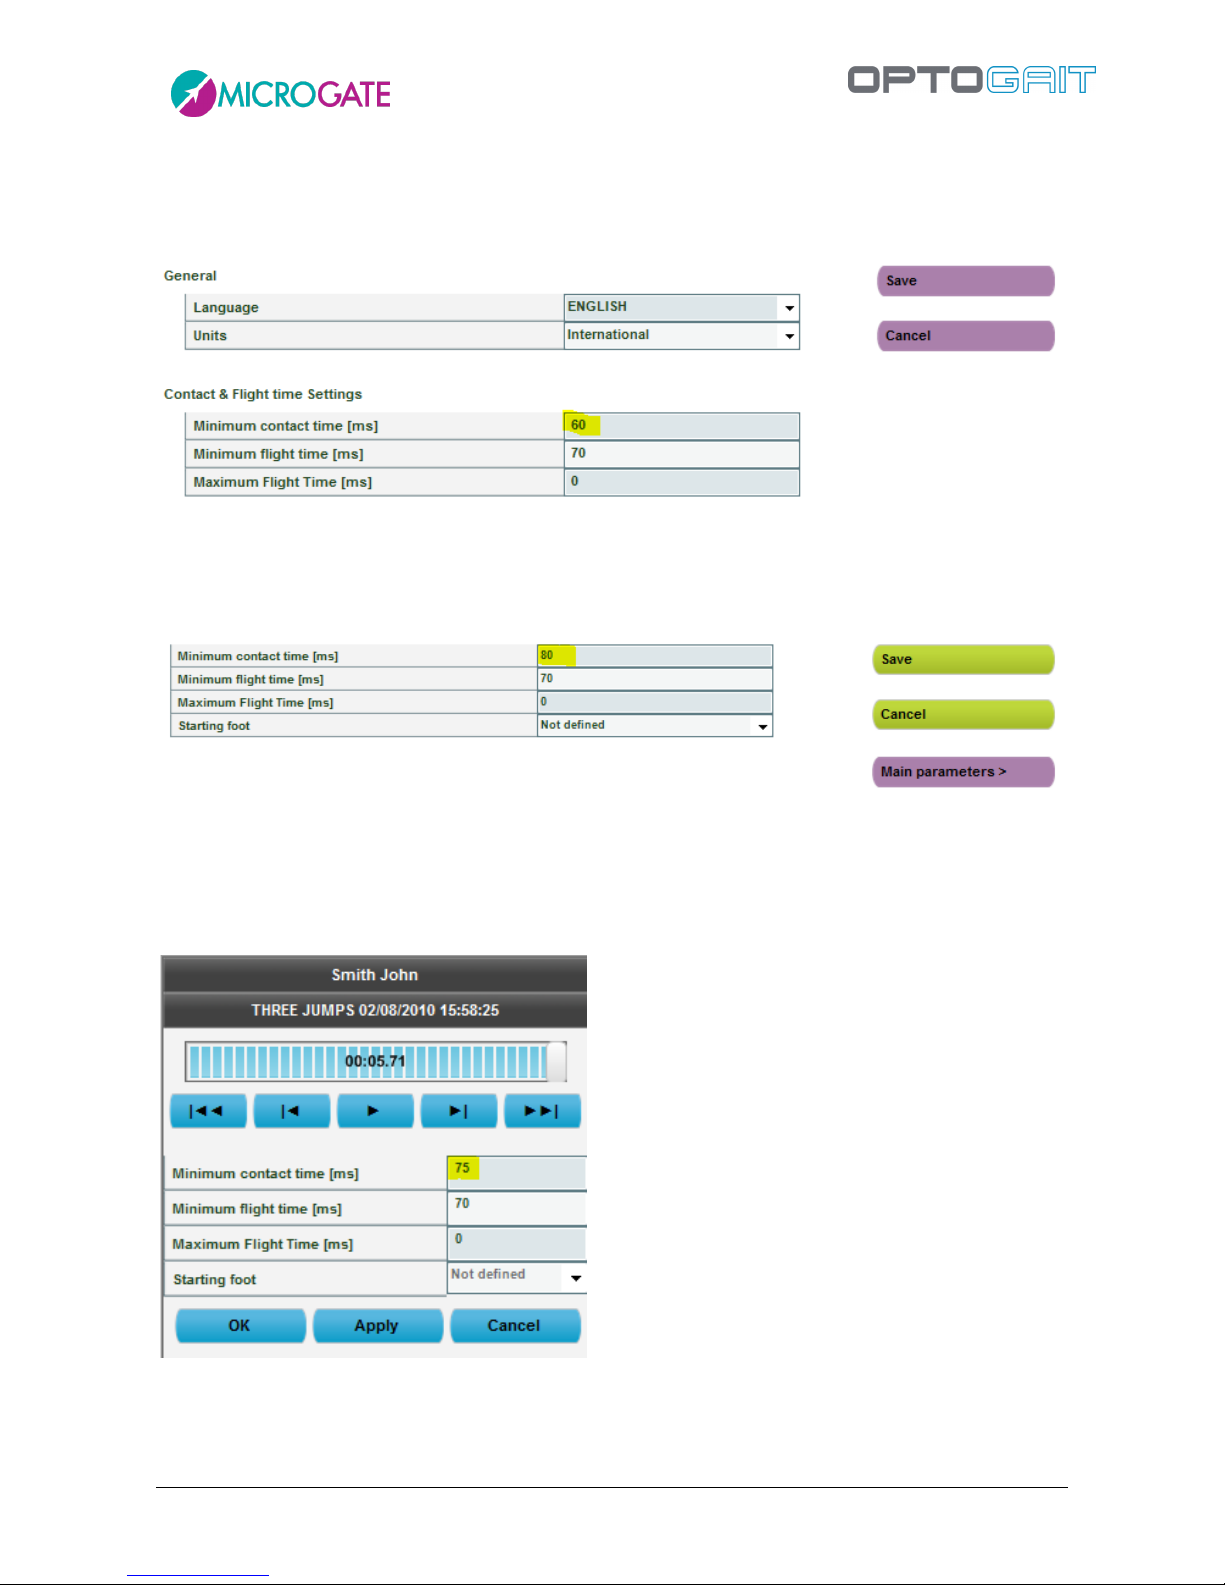
Under Utility/Basic Configuration set the ‘Minimum contact time’ to 60 ms. From this moment,
every time new types of ‘Jump Test’ are created, they will have a default value of 60 ms. If this value
is acceptable, no further changes have to be performed in ‘Secondary Parameters’.
Figure 43 - Basic Configuration Parameters
Let’s suppose that for special needs a new test type is needed (e.g., ‘Three Jumps’) with a different
value (e.g., 80 ms). Open <Secondary Parameters>, change the value, and save the test definition.
Figure 44 – Test Definition Parameters
Next, have the patient perform the test ‘Three Jumps’. The single test, having inherited the values
from its type, has the parameter 80 ms. Opening View Test (chap. 4.3.1) and pressing <Settings>,
the following window is displayed:
Figure 45 – Single Test Definition Settings
However it might be necessary to change the parameter ONLY for this single test. Insert for example
75 ms and press <OK> or <Apply>. After all values have been recalculated, the data in the table with
Page 60
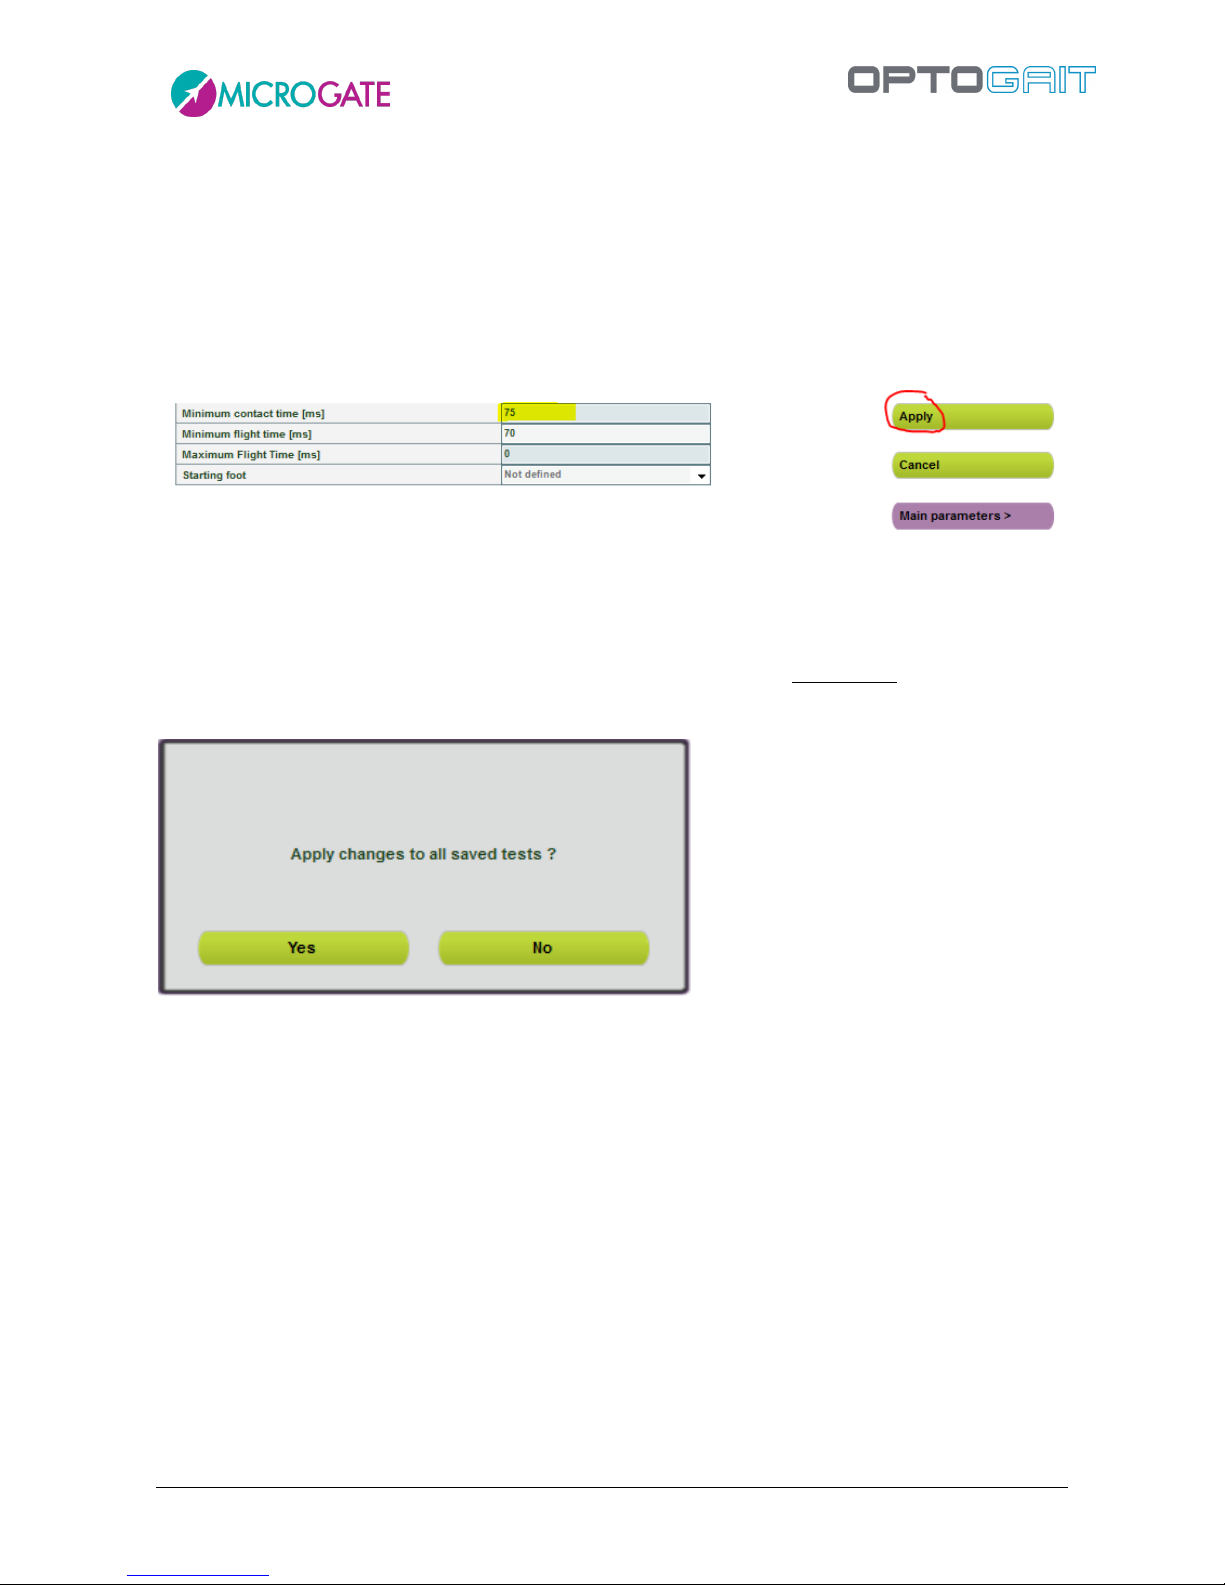
Version 1.9 Page 60 of 170
the numeric results and the charts will change. If the results are acceptable, confirm by pressing
<OK> and answer <YES> when asked to save the data (the difference between OK and Apply is that
<OK> asks to confirm saving the new parameters and closes the function, whereas <Apply> does
not close and allows to further adjust the parameters).
If now the correct value proves to be 75 ms (all future tests should have this value), the parameter
has to be changed in the test definition.
Figure 46 – Parameter editing in a Test Definition, when tests have already been performed with this definition.
TIP: With respect to Figure 44 the button is called <Apply> and not <Save>.
Now it is possible to decide whether this change should be applied to future tests (press <NO>) or
if the change should be applied to all tests performed with this type (overwriting possible custom
values set in the single tests); in the latter case, press <YES>.
Figure 47 – Confirming the parameter application to tests that have already been performed
Page 61
Version 1.9 Page 61 of 170
4.2.2.1.1 Parameter Template
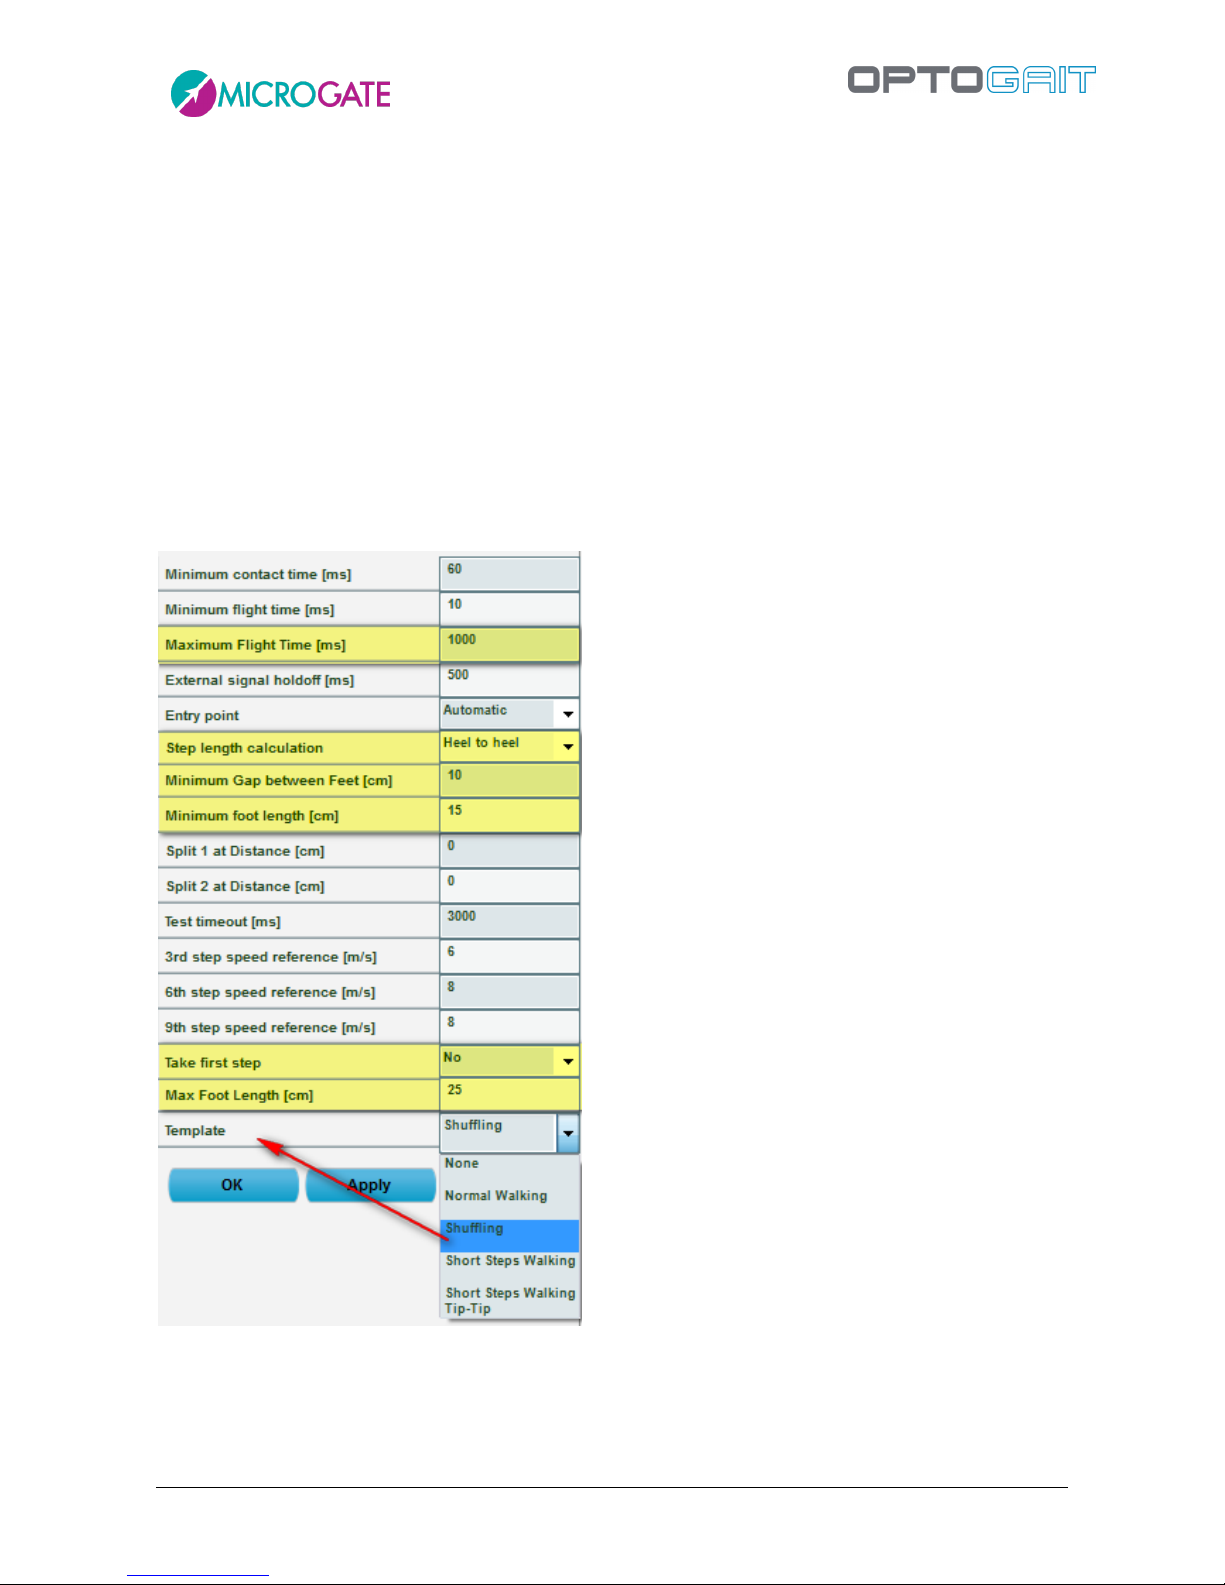
The 'Template' field allows setting of secondary test parameters (in the definition but also at test
level) following common usage cases. Let's suppose, for example, that a gait test is carried out on a
modular system, with the athlete performing very short strides (typical of people who have had an
injury), or shuffling the tip of the advancing foot. Instead of trying to change the parameters striving
to find the best filter setting, you can choose one of the existing templates (i.e. 'shuffling gait') with
parameters set automatically on the basis of our experience.
At present the templates apply only to the run/gait tests with modular systems, but in the future
the concept will be extended to all test types and it will be possible to extend the template library
via software upgrades.
The parameters changed by these first templates are those highlighted in the figure below.
Figure 48 –Parameters Template
Page 62

Version 1.9 Page 62 of 170
The available fields for the different test types are the following:
4.2.2.2 JUMP TEST
Main Parameters
Start type: indicates if the start of the test must take place with a ‘status change’ (i.e.
entering or exiting the bars) or with an ‘external impulse’ coming from the jack sockets (start
button, signal light, etc.).
Start: indicates if at the beginning of the test the patient must be ‘inside the area’ of the bars
or ‘outside the area’.
Stop Type: as for the start, the end of the test can take place because of a ‘Status change’ or
an ‘external impulse’, or (in the case of time tests) the end of the test time (e.g. a test “Jumps
15 seconds” will have the Stop type = ‘End of Time’).
Finish: for the Stop type = ‘Status change’ it is necessary to specify if, at the end of the test,
the patient must be ‘inside the area’ of the bars or ‘outside the area’; in the other two Stop
type cases this field does not appear.
Number of Jumps: appears only if the Stop type = ‘Status change’ and specifies how many
times the patient must jump (1 to 99).
Test Length: appears only if Stop type = ‘End of Time’ and specifies how many
minutes:seconds the test must last (from 00:01 to 09:59).
Secondary Parameters
Minimum contact time [ms]: allows you to set a minimum contact time in milliseconds; if
the system registers a contact time shorter than this value, it is considered incorrect and
added to the associated flight time (usually the previous one). This control can be
enabled/disabled by inserting the value 0.
Minimum flight time [ms]: allows you to set a minimum flight time in milliseconds; if the
system registers a flight time shorter than this value, it is considered incorrect and added to
the associated contact time. This control can be enabled/disabled by inserting the value 0.
Maximum flight time [ms]: allows you to set a maximum flight time in milliseconds; if the
flight time is higher, it is considered incorrect; if the system registers a flight time longer than
this value, the time is not considered.
Starting foot: if known, the foot with which the test starts (“right” or “left”) can be indicated,
otherwise leave as “not defined”.
Page 63

Version 1.9 Page 63 of 170
4.2.2.3 REACTION TIMES
Main Parameters
Start type: Indicates what type of reaction the test must assess, that is:
o “Visual stimulus”: on the PC screen a red circle becomes green after a random
period of time; the patient must ‘react’ to this stimulus (e.g., by jumping)
o “Acoustic stimulus”: the reaction stimulus is a sound emitted by the PC (using
either an internal loudspeaker or a sound board) after a random period of time.
o “Visual-Acoustic stimulus”: the visual (red/green circle) and the acoustic stimuli
(beep from the PC) alternate randomly
o “External impulse”: the start to calculate the reaction time is given by a device
(e.g. a start horn or a start button) connected to the jack sockets
Start: indicates if at the beginning of the test the patient must be ‘inside the area’ of the
bars or ‘outside the area’
Minimum pause: minimum pause time in minutes:seconds between one test and another
(the pause will have this minimum value, but, being random, it will almost always be longer)
Number of repetitions: indicates how many repetitions (from 1 to 99) the test must consist
of
Sequence type: the sequence can be ‘Automatic’ (the test repetitions follow each other
automatically) or ‘Manual’ (at the end of each repetition the start of the next test must be
confirmed)
Stop type: this can only happen by ‘Status change’
Secondary Parameters
Minimum contact time [ms]: see above
Minimum flight time [ms]: see above
Maximum flight time [ms]: see above
Reaction time range [ms]: indicates the time frame in milliseconds within which the
reaction signal must be given randomly.
Page 64

Version 1.9 Page 64 of 170
4.2.2.4 SPRINT AND GAIT TEST
Main Parameters
Start type: indicates if the start of the test must take place with a ‘status change’ (i.e.
entering or exiting the bars) or with an ‘external impulse’ coming from the jack sockets
Start: indicates if at the beginning of the test the patient must be ‘inside the area’ of the bars
or ‘outside the area’
Staring foot: if known, the foot with which the test starts (“right” or “left”) can be indicated,
otherwise leave as “not defined”
Stop type: indicates how the end of the test must be interpreted, (i.e. as ‘External impulse’
like a photocell at the end of the lane) or as ‘timeout’ (the number of milliseconds of Test
timeout can be customized in Utility – Basic Settings)
Finish: for the Stop type = ‘Timeout’ it is necessary to specify if, at the end of the test, the
patient must be ‘inside the area’ of the bars or ‘outside the area’
Test Length: appears only if Stop type = ‘End of Time’ and specifies how many
minutes:seconds the test must last (from 00:01 to 09:59)
Number of intermediate times: indicates how many intermediate times are inserted
between the start and the stop (0 to 99)
Template: see chap. 4.2.2.1.1
Secondary Parameters
Minimum contact time [ms]: see above
Minimum flight time [ms]: see above
Maximum flight time [ms]: see above
External signal hold off [ms]: is the hold off time between two consecutive external signals.
Caution has to be applied for this value, because it may depend on the type of test being
carried out.
Entry point: allows you to indicate if the entry point of the Sprint/Gait test is on the ‘interface
side’ (drum) or the ‘opposite side’. If ‘automatic’ is chosen, OptoGait automatically calculates
the direction, considering the LED nearest the centre of the foot as the beginning of the LEDs.
Step length calculation: allows you to choose whether to calculate step length as the
distance between the tips of two following feet or as the distance between the heels of two
following feet (see also Figure Figure 99).
Minimum gap between feet [cm]: is the minimum gap between the tiptoe of one foot and
the heel of the next foot.
Minimum foot length [cm]: is the minimum foot length in centimetres (or inches), used to
filter possible incorrect acquisitions.
Split 1 or 2 at distance [cm]: insert at how many cm from the start the first or second split
time will be taken; leave 0 to disable split times.
Page 65
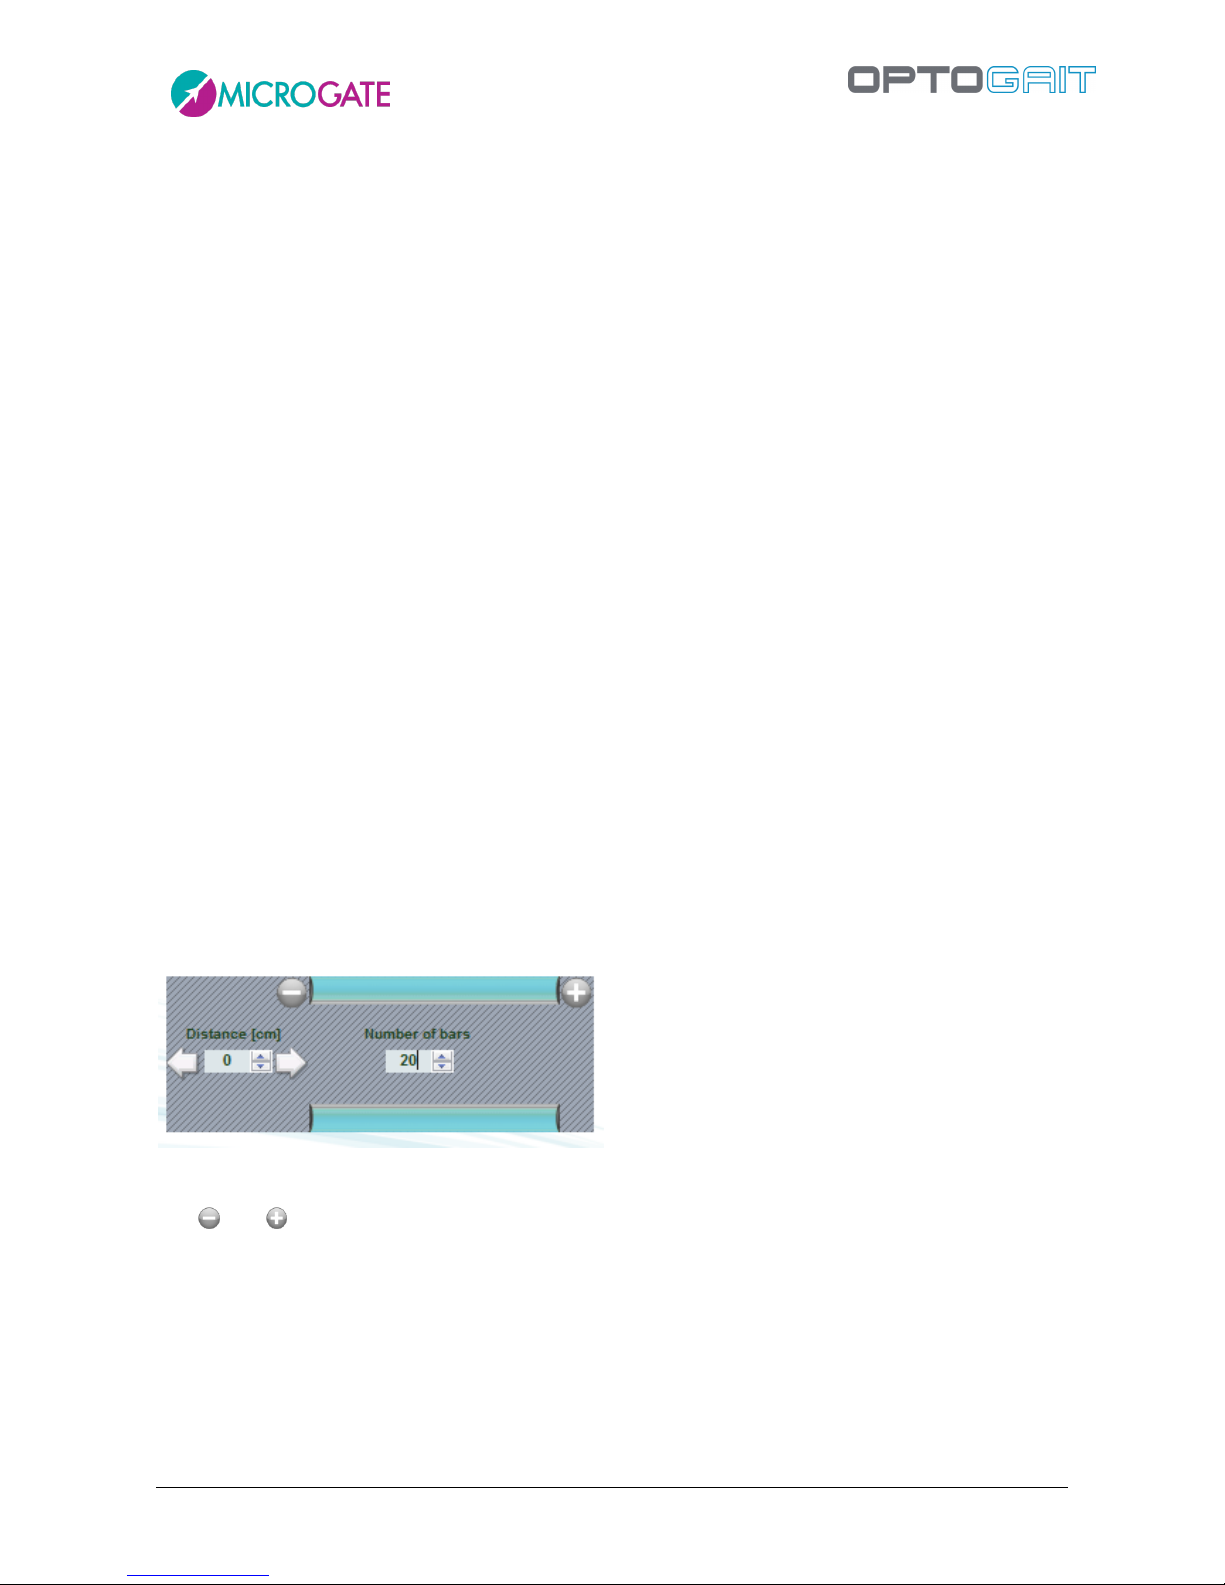
Version 1.9 Page 65 of 170
Test Timeout [ms]: this is the end of test timeout in milliseconds; if during a Sprint/Gait test
with ‘Timeout’ stop type no input or output signal is received from the measurement area
by the OptoGait device for a period longer than or equal to the time set here, the test is
considered completed.
3rd/6th/9th step speed reference: insert the reference speed for the 3rd/6th/9th step in
m/s; this option can be disabled by inserting the value 0.
Discard first step: discard the first N steps (N=input value) when entering the area; this
parameter (and the following) are useful when we want only consider the central part of the
test and we do not want enter&exit (usually with lower speed) to affect the average.
Discard last steps: discards the last N steps (N=input value) when exiting the area.
Foot filter at start/end of system: if set to YES does not consider the steps in and out of the
system if there are at least 2 obscured LEDs; in this way you avoid fingerprints half in and
half out of the measurement area.
Filter GaitR IN and Filter GaitR OUT [LED]: the two parameters expressed in number of
sensors (LEDs) indicate the minimum number of sensors interrupted by the gait and
triggering the start of the foot contact time (GaitR IN) and the end of the same time (GaitR
OUT). See also chap. 5.1.6
For this test type the structure of the system has to be defined as well, (i.e., how many bars the
system is composed of and whether there are gaps between the bars).
In the field ‘Number of bars’, the number of connected bars must be inserted. This field is necessary
for correct test acquisition. If the inserted number of bars differs from the number of bars actually
installed, the software will signal this error suspending the test currently in progress.
Example: A system is made of 20 meters of OptoGait bars, all connected, without gaps. The settings
to make are the following:
The and buttons are respectively for removing or adding blocks of OptoGait bars. This function
can be used, for example, in hurdle jumping, where between one hurdle and the next one
interruptions are made connecting bars with a flat cable.
The ‘Distance’ field is for indicating the distance between the blocks in centimetres. The first
‘Distance’ (D0) corresponds to the distance between the patient’s initial position and the first block.
For example, in athletics, if the start is from the blocks, the distance from the springboard to the
first block must be calculated. The other distances (D1, D2, etc.) indicate the distance between the
last lens of a bar and the first lens of the following bar (end and beginning of the two half moons).
Page 66
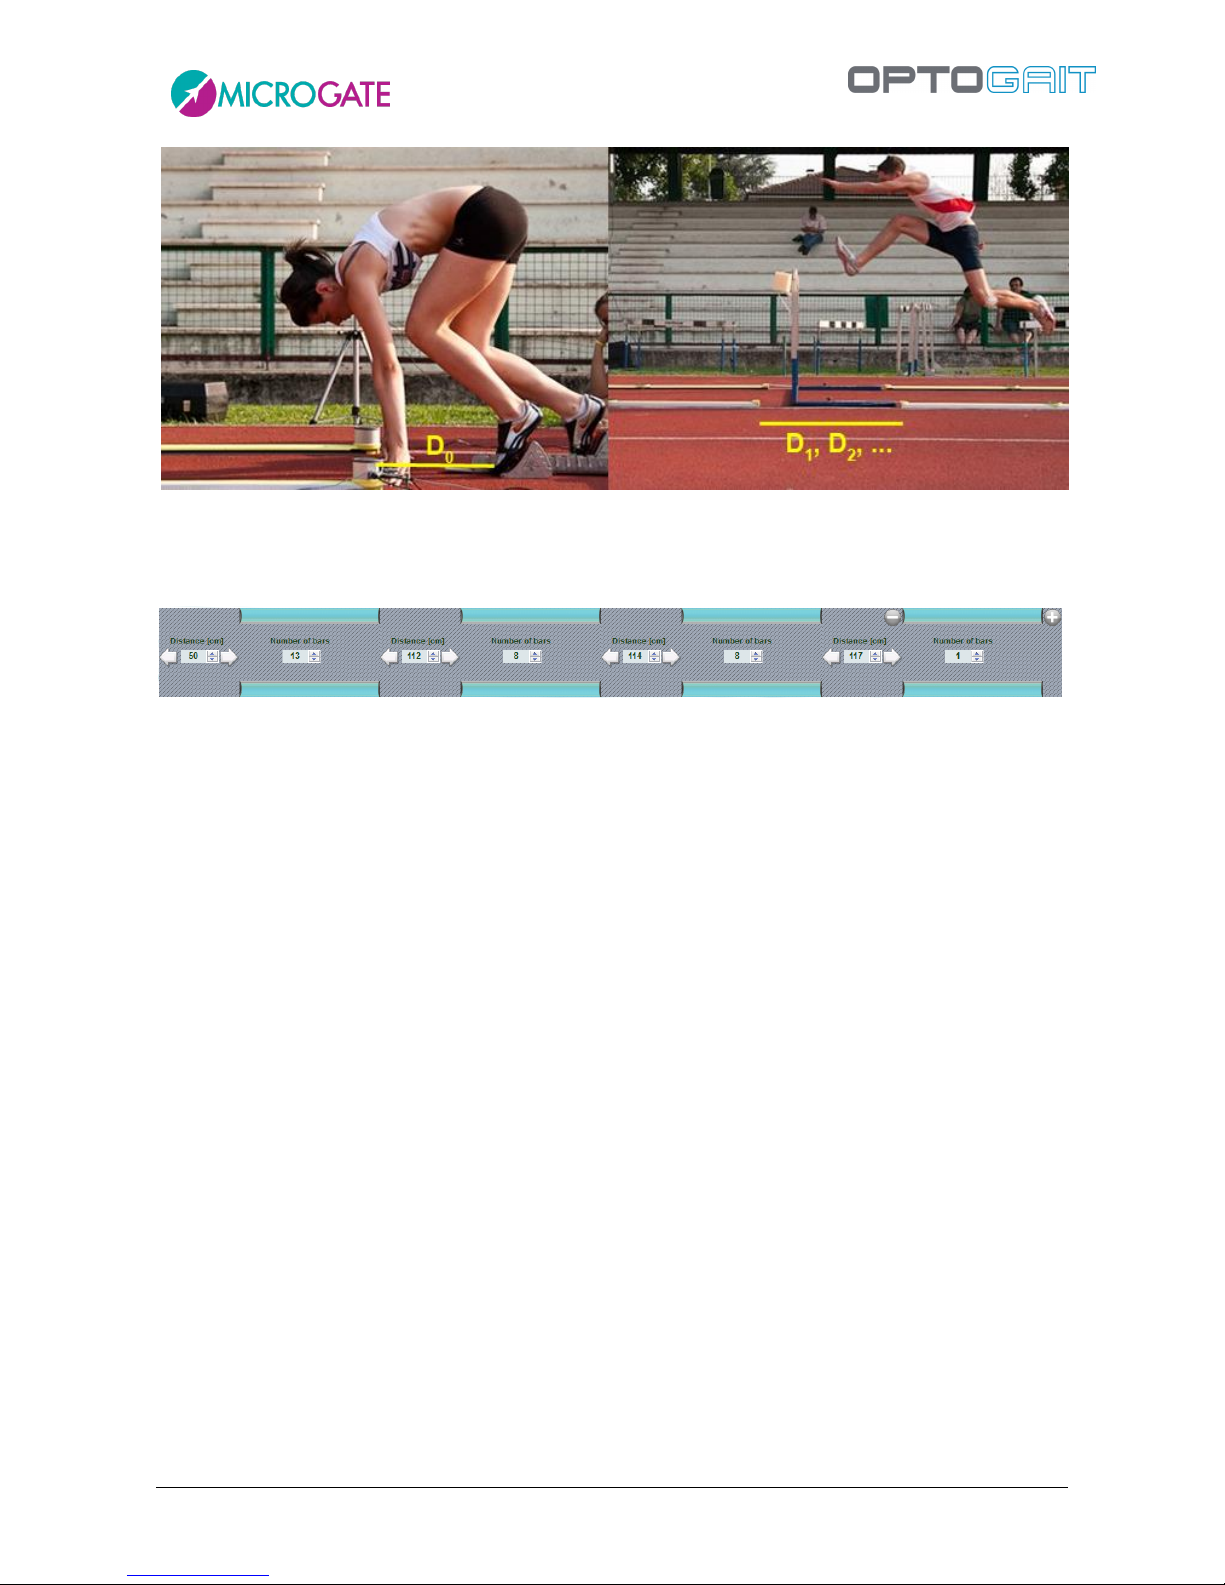
Version 1.9 Page 66 of 170
Figure 49– Example: bars with gap
A practical configuration example of a system of 30 m could be the following:
Starting block—50 cm – 13 meters OJ – hurdle – 8 meters – hurdle – 8 meters – hurdle – 1 meter
Figure 50 – Configuration of bar blocks
Page 67
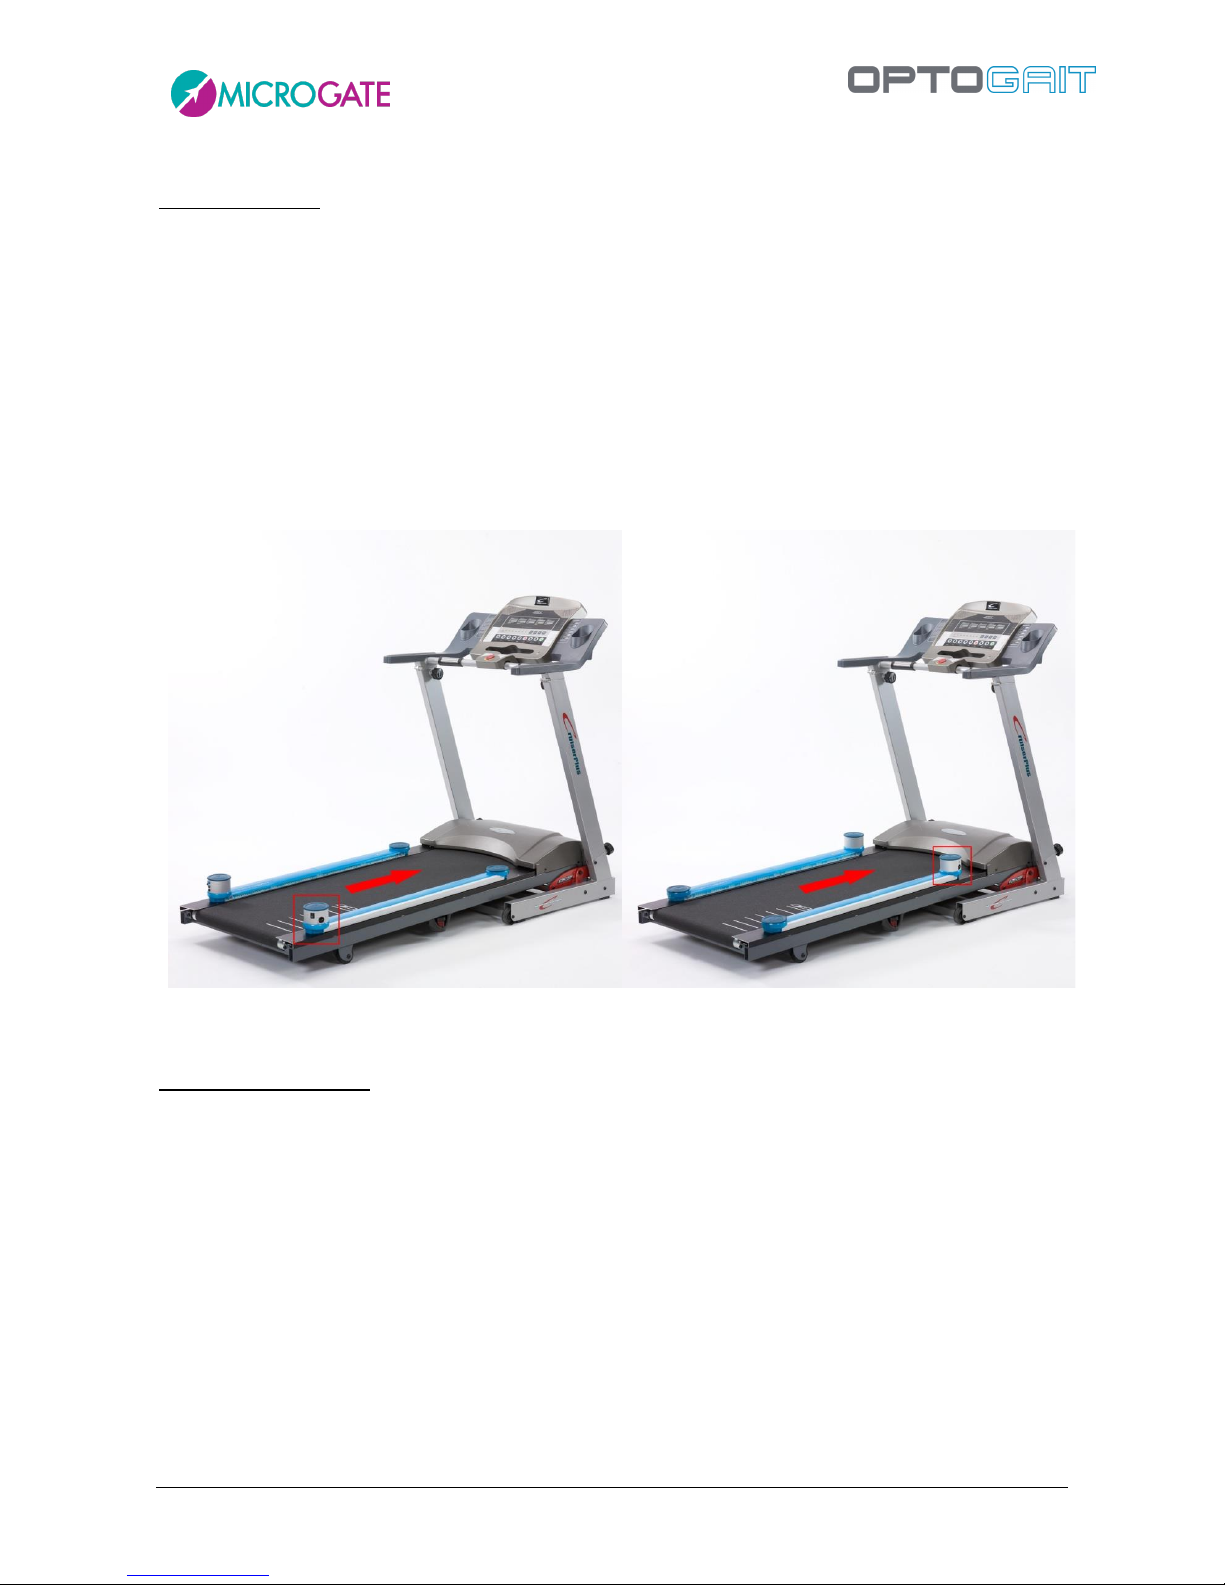
Version 1.9 Page 67 of 170
4.2.2.5 TREADMILL RUNNING TEST
Main Parameters
Start type: this can only be ‘Software command’ or ‘External Impulse’
Stop type: this can be ‘Software command’, 'End of Time' or ‘External Impulse’
Starting foot: see above
Test length: appears only if Stop type = ‘End of Time’ and specifies how many
minutes:seconds the test must last (from 00:01 to 59:59)
Treadmill speed: indicates the speed in km/h the treadmill is set at; the setting range is 0.1-
20.0 km/h with steps of 0.1.
Direction: indicates if the walking direction is 'Interface side' or 'Opposite side'. Therefore, if
the interface drums are at the end of the treadmill choose 'Opposite Side', or vice versa.
Figure 51 - Direction: OPPOSITE Side
Figure 52 - Direction: IINTERFACE Side
Secondary Parameters
Minimum contact time [ms]: see above
Minimum flight time [ms]: see above
Maximum flight time [ms]: see above
Step length calculation: see above
Minimum gap between feet [cm]: see above
Minimum foot length [cm]: see above
Filter GaitR IN and Filter GaitR OUT [LED]: see above
Page 68

Version 1.9 Page 68 of 170
4.2.2.6 TREADMILL GAIT TEST
Main Parameters
Start type: this can only be ‘Software command’ or ‘External Impulse’
Stop type: this can be ‘Software command’, 'End of Time' or ‘External Impulse’
Test length: appears only if Stop type = ‘End of Time’ and specifies how many
minutes:seconds the test must last (from 00:01 to 59:59)
Treadmill speed: indicates the speed in km/h the treadmill is set at; the setting range is 0.1-
20.0 km/h with steps of 0.1.
Direction: Indicates if the walking direction is 'Interface side' or 'Opposite side'. Therefore, if
the interface drums are at the end of the treadmill choose 'Opposite Side', or vice versa.
Secondary Parameters
Minimum contact time [ms]: see above
Minimum flight time [ms]: see above
Maximum flight time [ms]: see above
Step length calculation: see above
Minimum gap between feet [cm]: see above
Minimum foot length [cm]: see above
Filter GaitR IN and Filter GaitR OUT [LED]: see above
Automatic Data Filter: from 10% to 90% (default = deactivated); activating this parameter,
the user can check if the values for flight time, contact time, gait time, swing time, and step
length are within the average value +/- the chosen percentage. If one of these data is out
of range, the table line will be deleted from the calculation of average values and the
values on the grid will appear in strike-through format (e.g. average = 0.8, filter = 20%, all
values above 0.96 and below 0.64 will be deleted).
Page 69
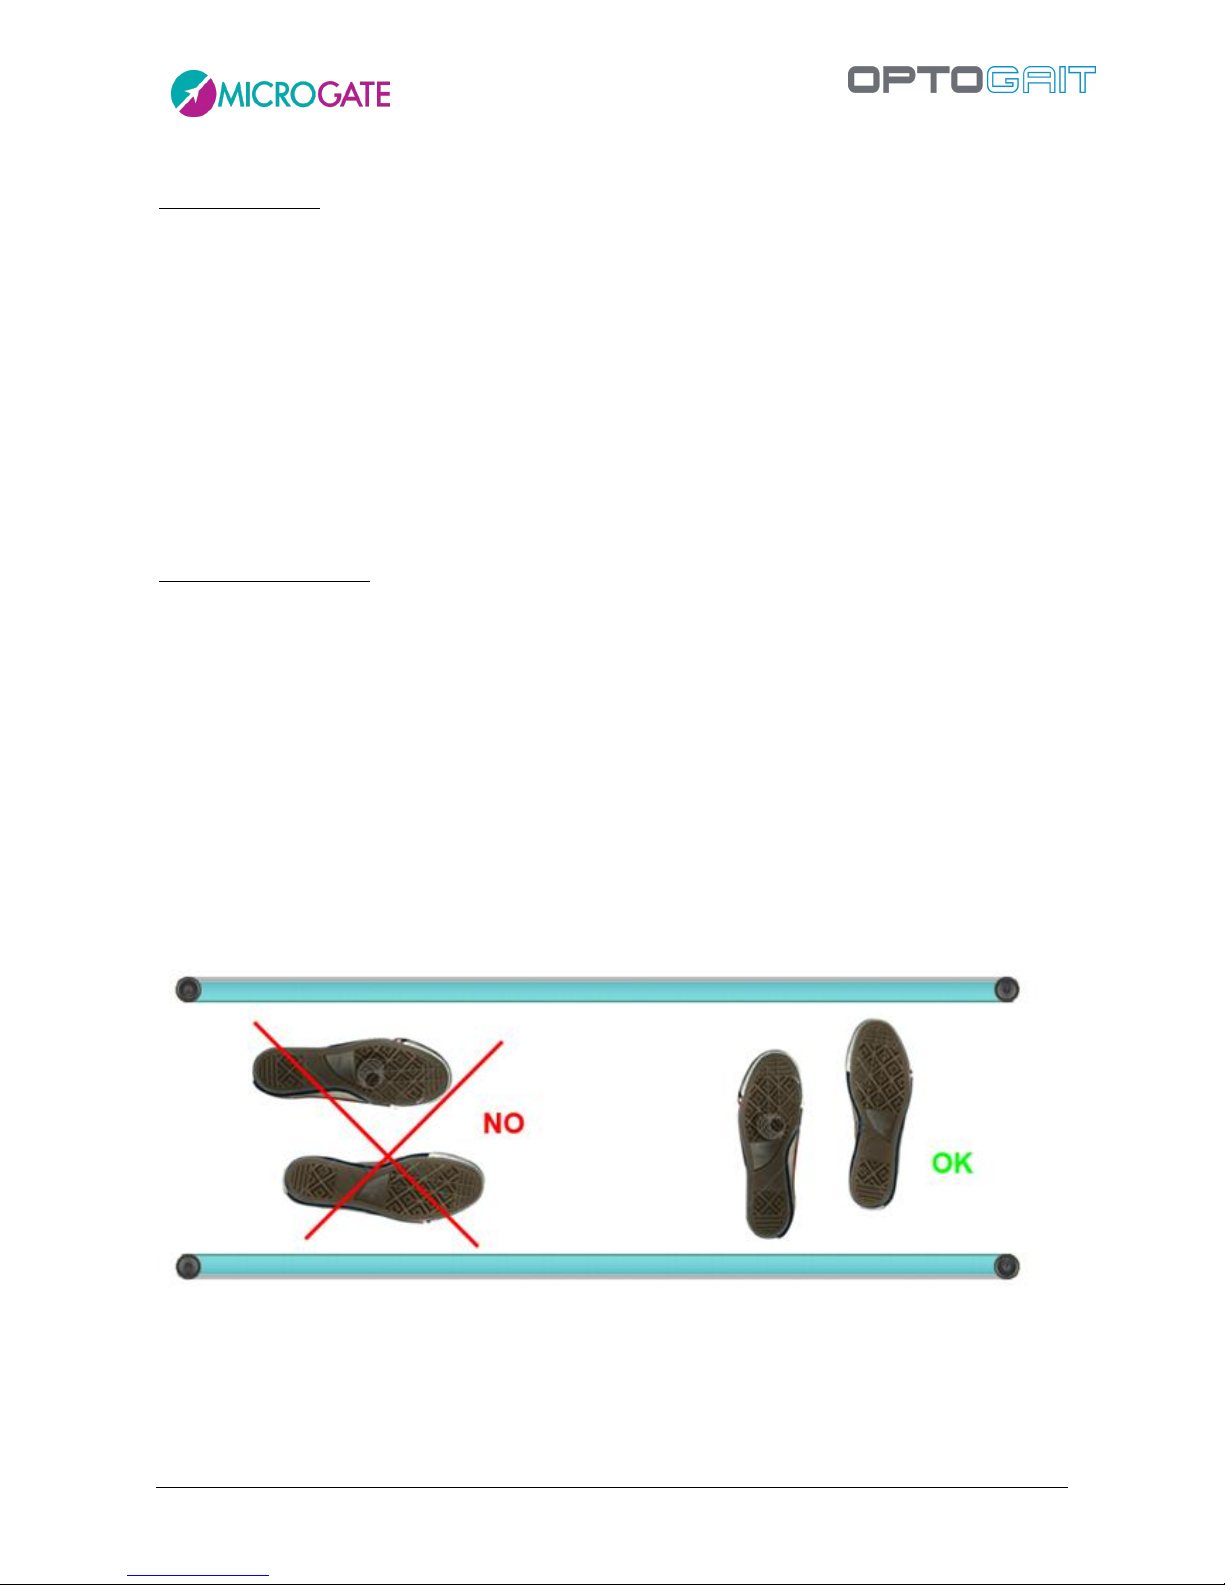
Version 1.9 Page 69 of 170
4.2.2.7 TAPPING TEST
Main Parameters
Start type: indicates if the start of the test must take place with a ‘status change’ (i.e.
entering or exiting the bars) or with an ‘external impulse’ coming from the jack sockets
Start: can only be ‘inside the area’
Staring foot: if known, the foot with which the test starts (“right” or “left”) can be indicated,
otherwise leave as “not defined”
Stop type: indicates how the end of the test must be interpreted, (i.e., as ‘External impulse’
like a photocell at the end of the lane) or as ‘Timeout’
Test Length: appears only if Stop type = ‘End of Time’ and specifies how many
minutes:seconds the test must last (from 00:01 to 09:59)
Secondary Parameters
Minimum contact time [ms]: see above
Minimum flight time [ms]: see above
Maximum flight time [ms]: see above
Minimum gap between feet [cm]: see above
Minimum foot length [cm]: see above
In order to perform a Tapping Test, it is important that the patient’s feet are vertical to the OptoGait
bars.
Figure 53 – Correct execution of a Tapping Test
Page 70
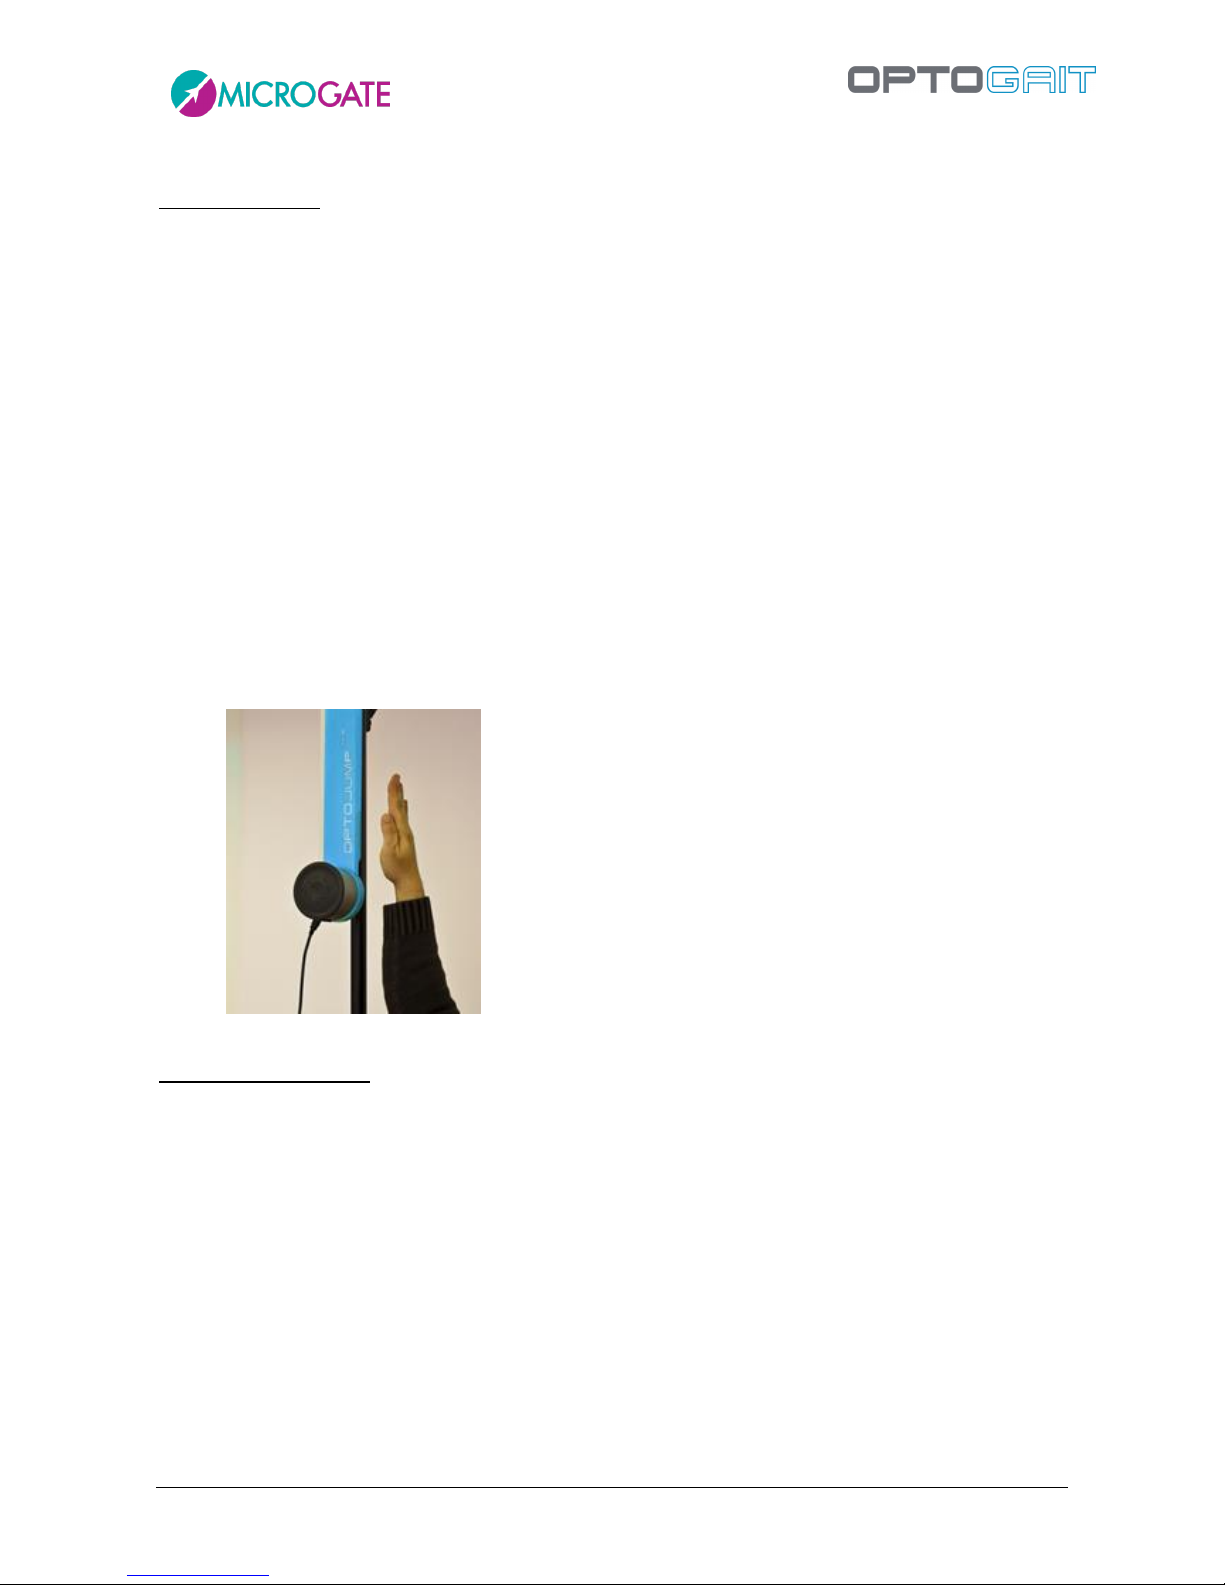
Version 1.9 Page 70 of 170
4.2.2.8 VERTEC LIKE TEST
Main Parameters
Start type: indicates if the start of the test must take place with a ‘status change’ (i.e.
entering or exiting the bars) or with an ‘external impulse’ coming from the jack sockets (start
button, signal light, etc.).
Start: indicates if at the beginning of the test the athlete must be ‘inside the area’ of the bars
or ‘outside the area’.
Stop type: as for the start, the end of the test can take place because of a ‘Status change’ or
an ‘external impulse’, or (in the case of time tests) the end of the test time (e.g. a test “Jumps
15 seconds” will have the Stop type = ‘End of Time’).
Finish: for the Stop type = ‘Status change’ it is necessary to specify if, at the end of the test,
the athlete must be ‘inside the area’ of the bars or ‘outside the area’; in the other two Stop
type cases this field does not appear
Number of Jumps: specifies how many times the athlete must jump (from 1 to 99)
Direction: the only possible option is 'opposite side', i.e. the drums of the bars must be
positioned in the lower part
Secondary Parameters
Minimum contact time [ms]: see above
Minimum flight time [ms]: see above
Maximum flight time [ms]: see above
Page 71
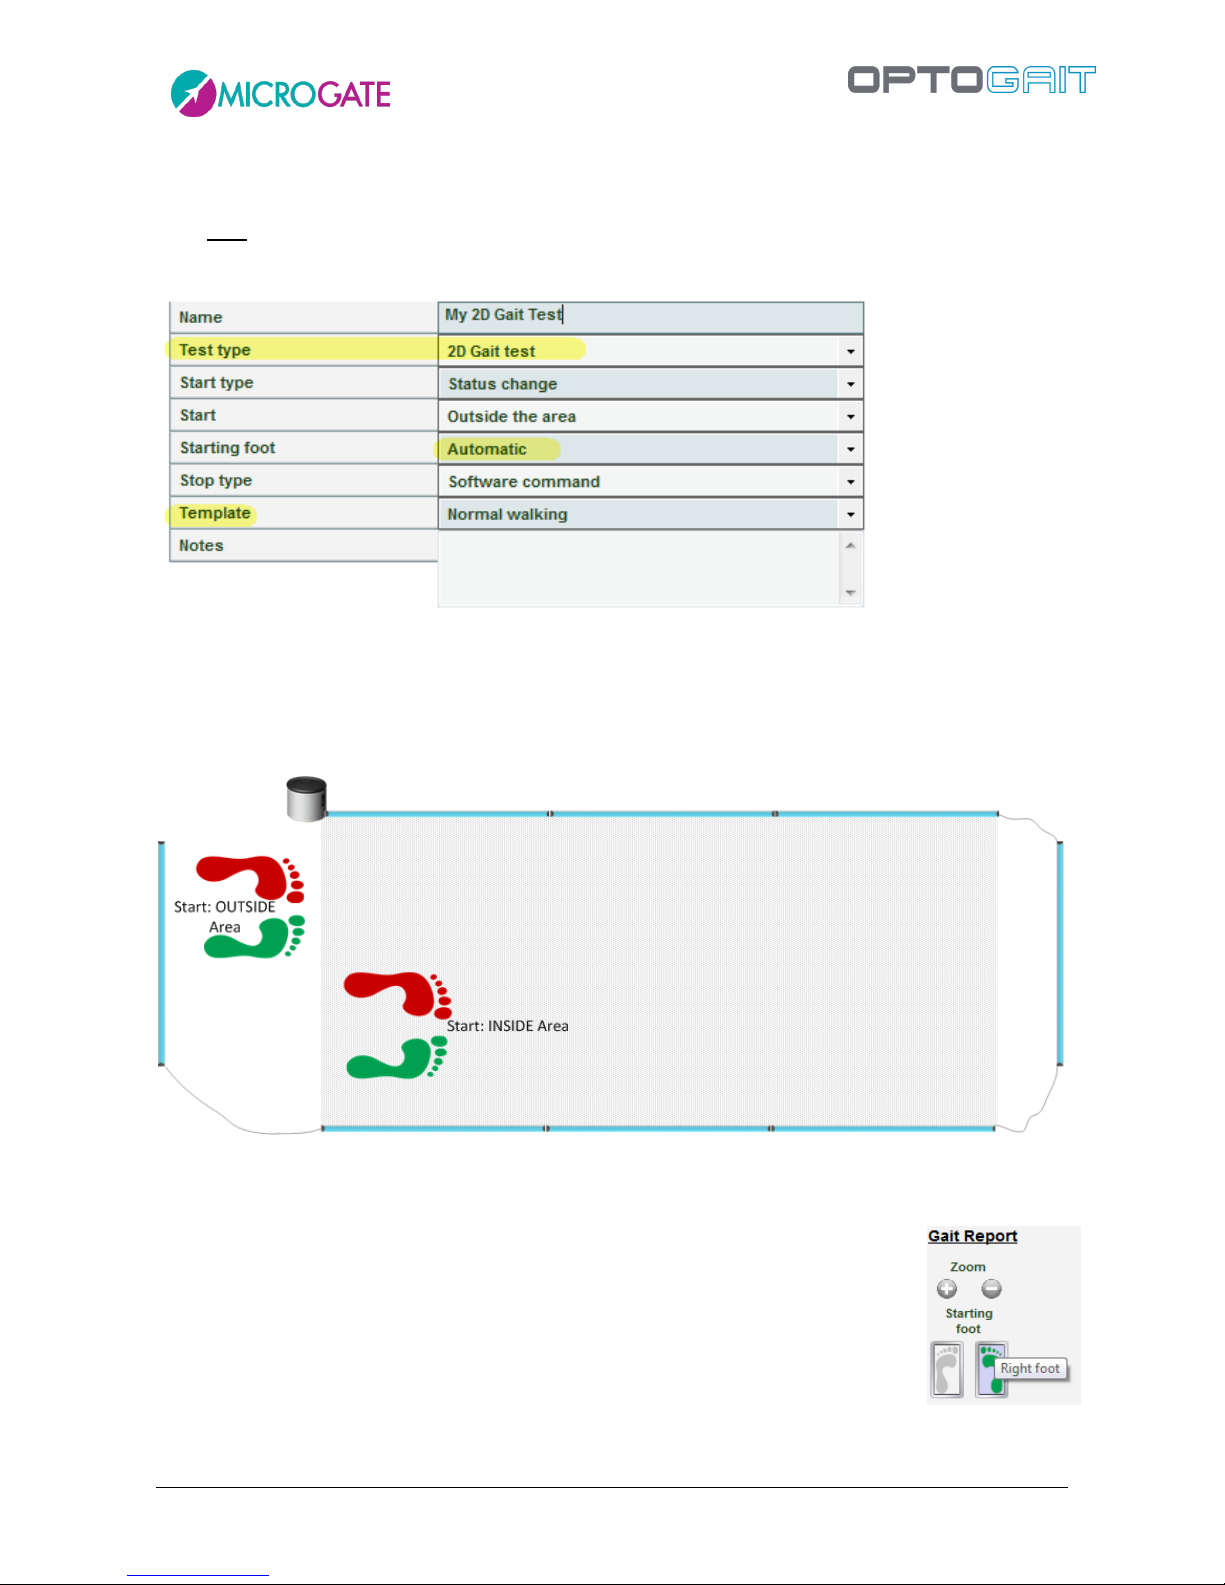
Version 1.9 Page 71 of 170
4.2.2.9 2D GAIT TEST
A new test type called '2D Gait Test' has been added from version 1.7 or higher. With this new type
it is NOT necessary to specify the number of bars connected (X and Y), as this is detected
automatically by the software (the only limitation is that the number of X bars must be >= Y bars).
As highlighted, the measurement area is always the area covered by the X bars and not by the whole
rectangle; this is very important with respect to the 'Start' parameter; if the athlete starts inside the
rectangle, but in any case before the beginning of the X bars, this must be defined as 'OUTSIDE the
Area'.
The 'Starting Foot' field contains only the Automatic option and therefore it is no longer necessary
to define beforehand if the gait begins with the right or left foot, as the Y bars detect it automatically.
For certain situations it is in any case still possible to change the starting foot during
the test phase (Results > View) using previous methods (right click on the grid and
'Change Starting Foot' context menu) or via a new function with two buttons in the
Gait Report section. Just press the icon of the required foot to set it as starting foot
(the one currently used is coloured, whereas the other is greyed out).
The 'Template' field, which previously contained various gait types besides the
normal one (shuffling gait, short steps, short steps tip-tip, etc.) has been considerably simplified;
Page 72
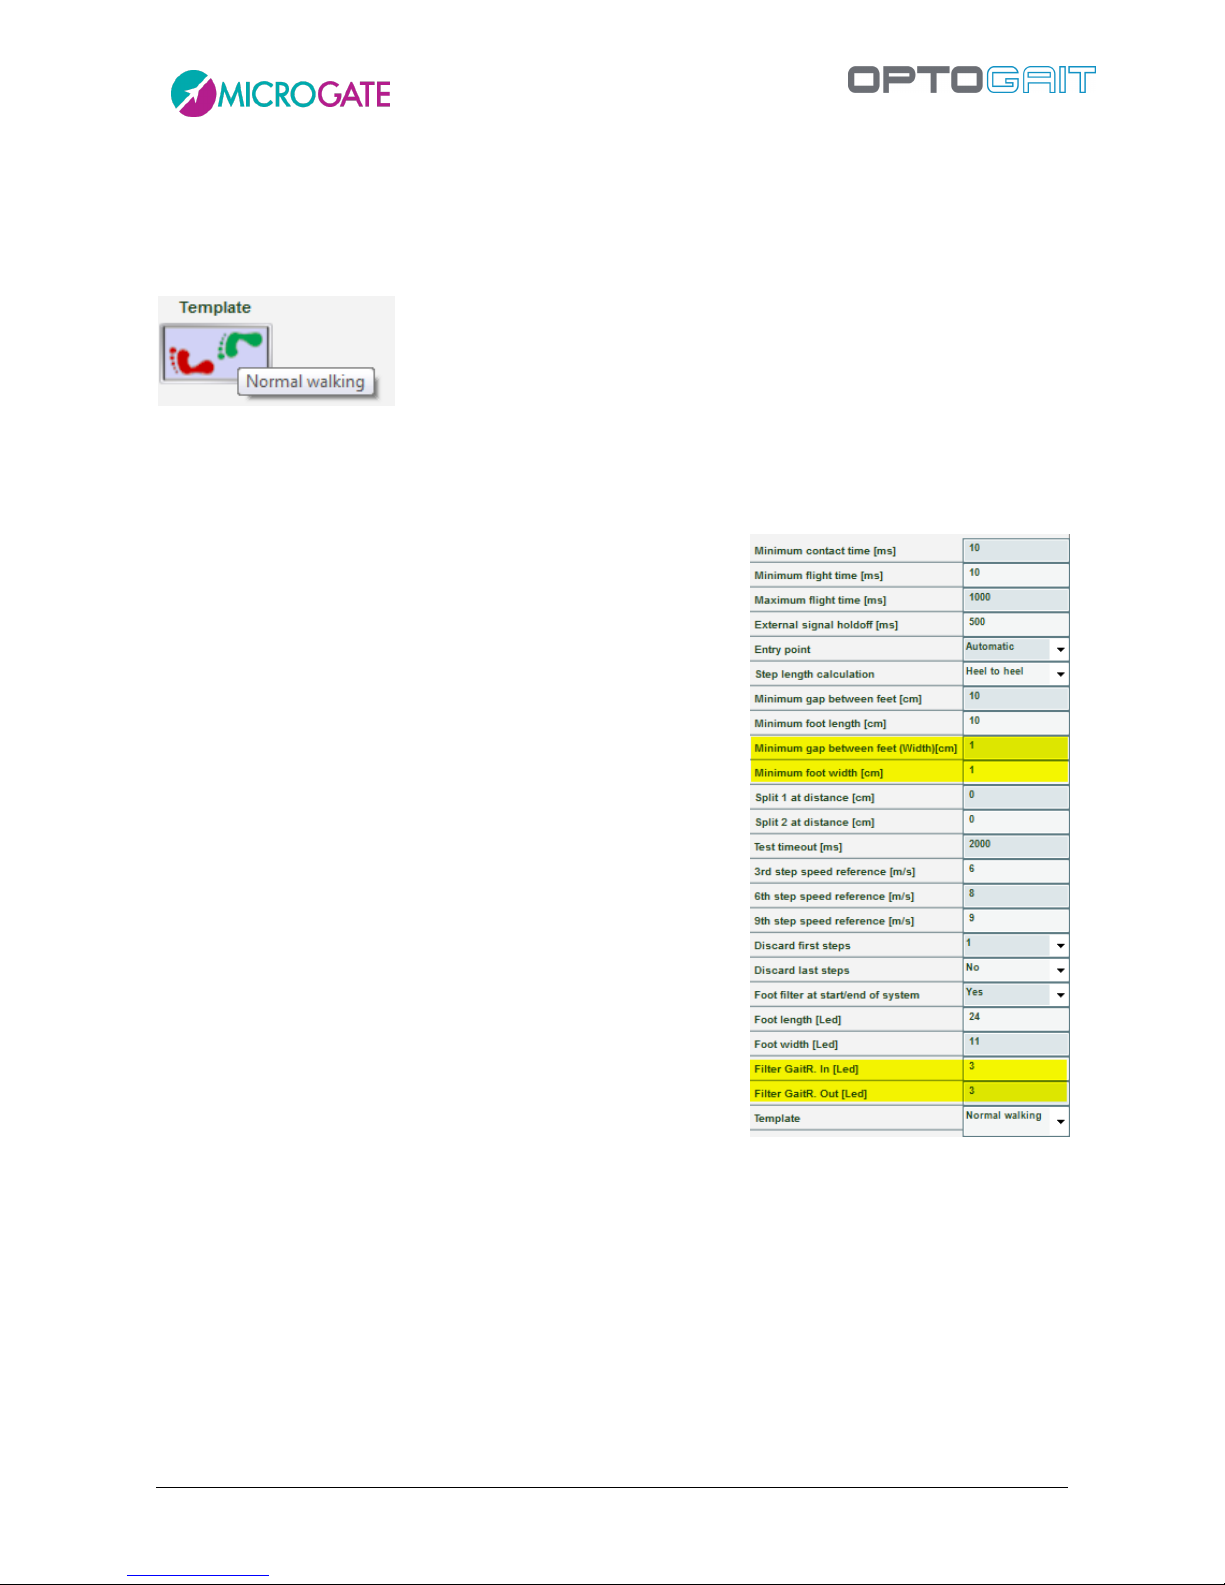
Version 1.9 Page 72 of 170
thanks to the greatly improved algorithms for the automatic recognition of various patterns, it has
been possible to reduce the various types to only two, i.e. 'Normal' and 'Superposed Feet'.
Similarly to the foot change, a rapid method has been added for changing the template directly from
the Gait Report using the relevant button.
In the Secondary Parameters of the 2D Gait Test there are 4 new parameters, which can already be
applied during test definition or during the trial analysis (<Parameters> button).
Minimum Distance Between Feet: parameter required
by the filter algorithms for specific cases
Minimum Foot Width: similar to the minimum foot
length; smaller measures are skipped, because they
are considered spurious
GaitR In and Out Filter: the two parameters expressed
in number of sensors (LEDs) indicate the minimum
number of sensors interrupted by the gait and
triggering the start of the foot contact time (GaitR IN)
and the end of the same time (GaitR OUT). See also
chap. 5.1.6
Page 73

Version 1.9 Page 73 of 170
After inserting the data, remember to press <Save> and return to the list of defined tests.
To review the parameters of a defined test, pass over them with the mouse, or double-click on them
(this is equivalent to pressing <Edit Test>).
Editing a test definition is only possible if no tests using this definition have already been performed.
The secondary parameters, on the other hand, can always be edited.
To delete a test definition, select it from the list and press <Delete Test>; all the tests connected to
this definition will be deleted!
To duplicate a test definition (useful, for example, if a left-foot test has been defined and the same
shall be applied to the right foot, or vice versa), select the test from the list and press <Duplicate
Test>. This creates a copy of the test, which can then be renamed and fully edited.
The buttons <Import Test> and <Export Test> are for copying the definition of a test from one
database to another. Press <Export Test> and save the XML file on your hard drive. Open another
database (or create a new one) and press <Import Test> choosing the file previously saved.
The tests preconfigured by Microgate can be duplicated, but not edited or eliminated.
Page 74
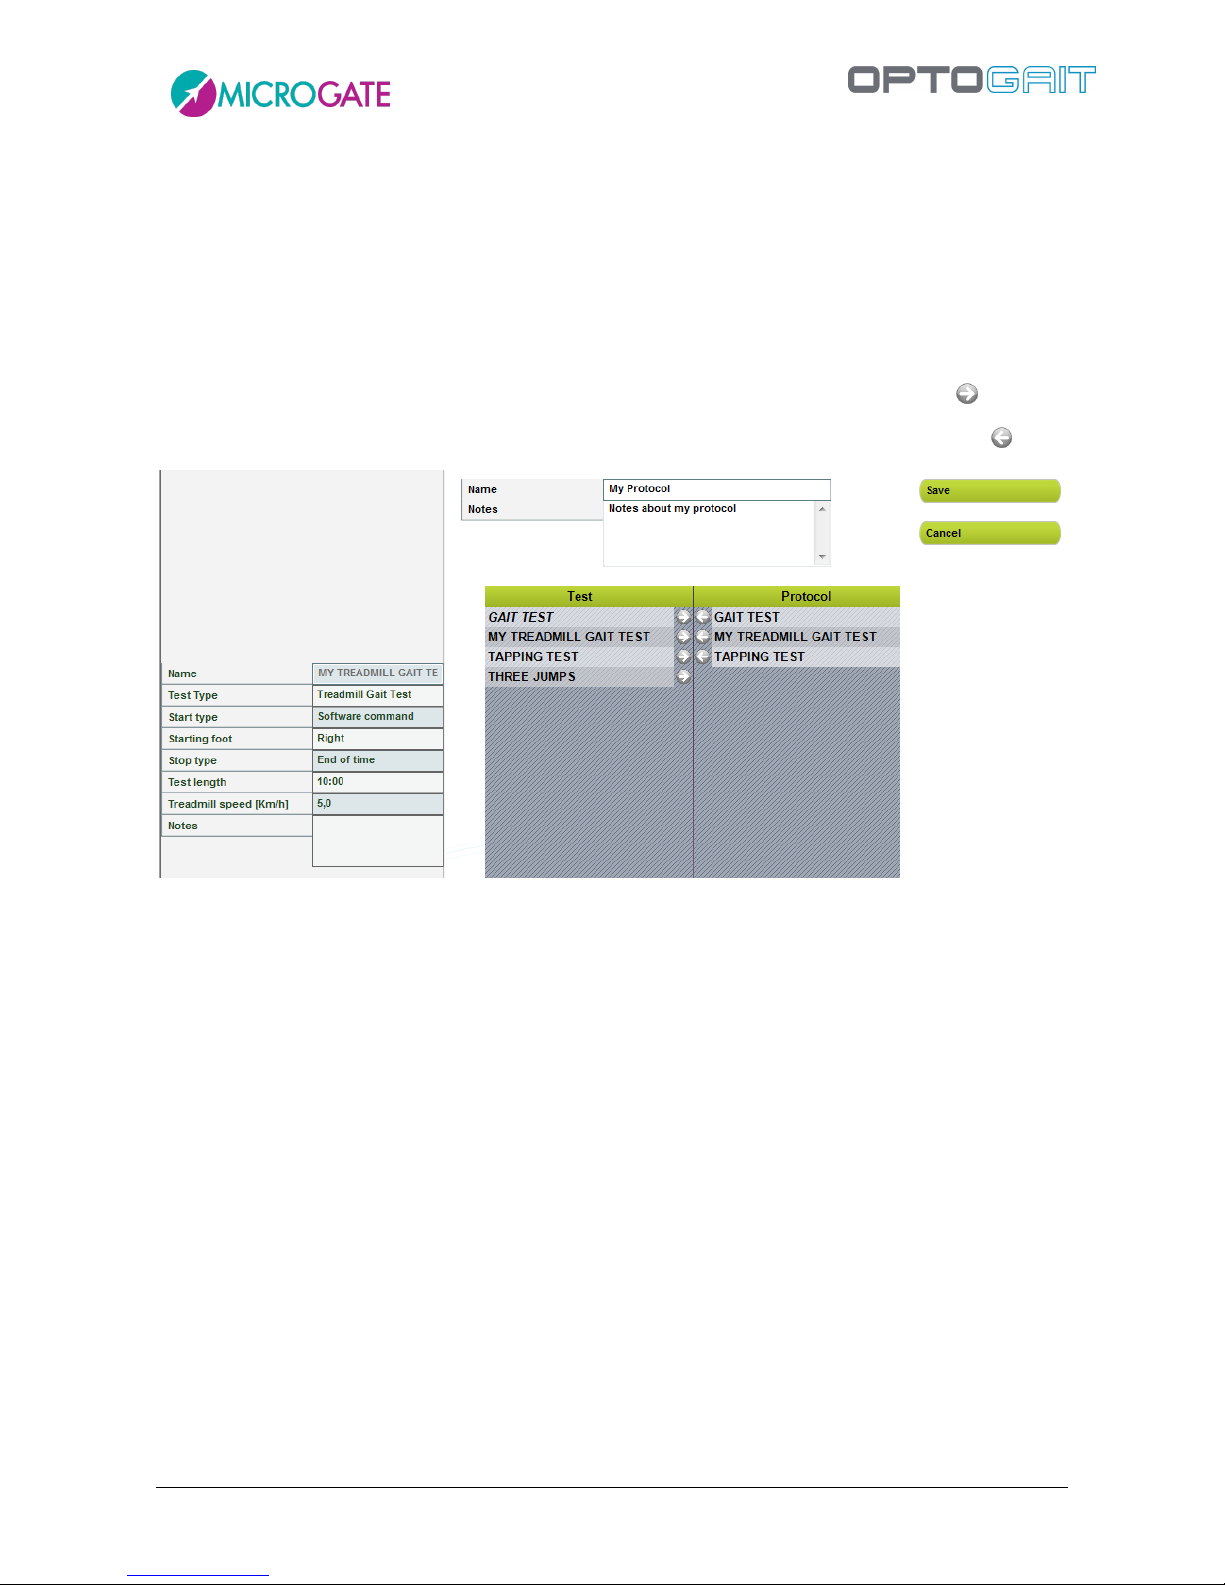
Version 1.9 Page 74 of 170
4.2.3 DEFINE / EDIT PROTOCOLS
In this section, the protocols to be performed can be defined or edited. The protocols can be
considered as a pre-defined series of tests to be performed in sequence (e.g., one ‘Squat jump’ +
one ‘CMJ’ + one ‘Jumps 15 seconds’).
To create a new protocol, ; select one of the three test macro-typologies (Performance, Gait
Analysis, Rehab) and press <New Protocol>. Insert a mnemonic name and optionally general notes.
Select the tests (in the desired order) that will make up this protocol, using the symbol
If a mistake has been made or a test has to be removed from the protocol, use the symbol
Figure 54 – Creation of a protocol
If you do not remember the parameters of a test definition, place the mouse cursor on it and its
characteristics will be displayed.
After inserting the data, press <Save> and return to the previous section.
The command <Edit Protocol> allows you to edit its name and notes and change its
composition.<Delete Protocol> deletes its definition. Unlike the deletion of a test definition, the
deletion of a protocol does not cause the chain-effect deletion of all correlated tests but only the
connection they had with the protocol. After its deletion, the tests performed by the patients will
be found again as ‘single tests’, no longer related to the protocol.
Page 75
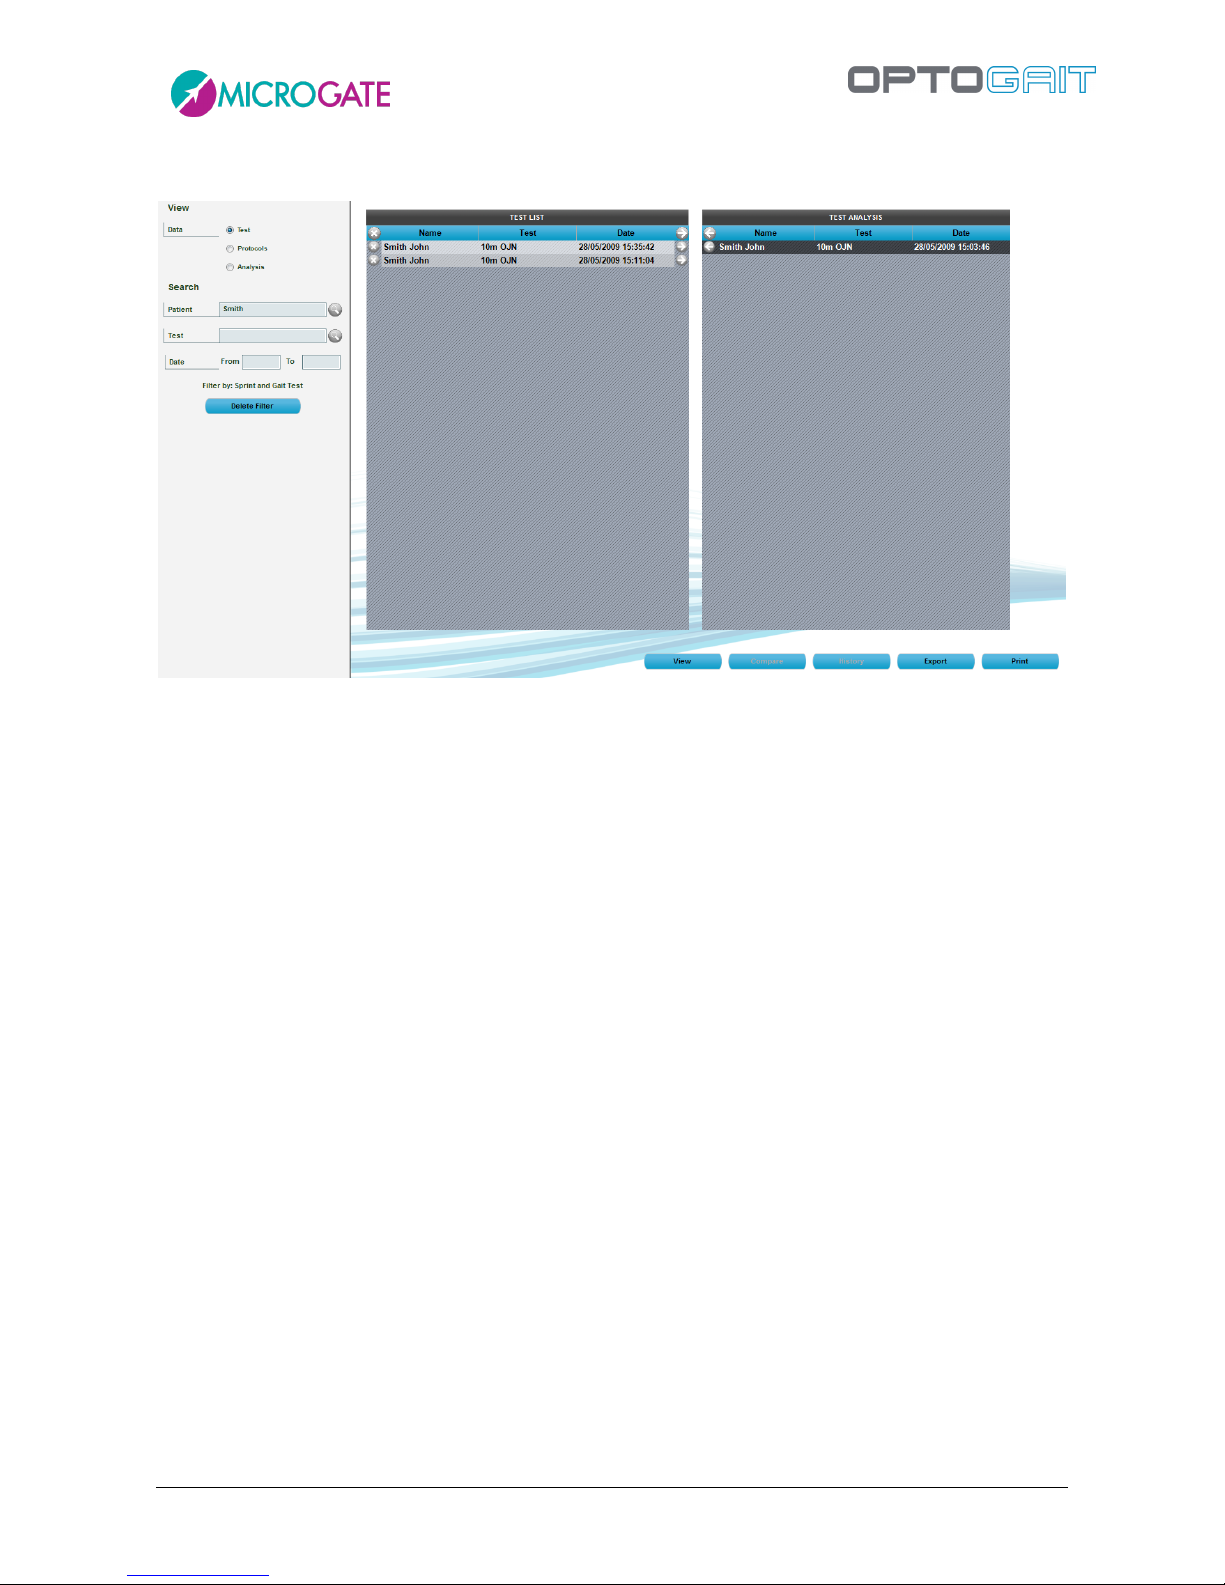
Version 1.9 Page 75 of 170
4.3 RESULTS
Figure 55 – Results
In the Results section, the performed tests or protocols are displayed. For better understanding,
these three terms are defined as follows:
Test is a single test (e.g. 15” jumps) performed on a certain date by a single patient.
Protocol: is a pre-defined list of tests to perform in sequence.
Analysis: when a single test is displayed or when two tests are compared, certain configuration
parameters may be set for the video, the table with numerical data, charts, reports, printouts, etc.
It is furthermore possible to draw on still pictures, insert notes, ‘sign’, delete incorrect data, etc. All
these operations can be saved in an Analysis (using a mnemonic name), which can then be recalled
without having to reset all parameters.
The RESULTS window is divided into 3 parts (from left to right):
FILTERS: panel for looking for a single test or for filtering according to various parameters
TEST LIST: contains all the tests made, possibly filtered by your parameters; the same
window also displays the list of saved analyses
TEST ANALYSIS: contains the tests/analyses manually selected for viewing, comparing,
printing, or exporting.
Page 76
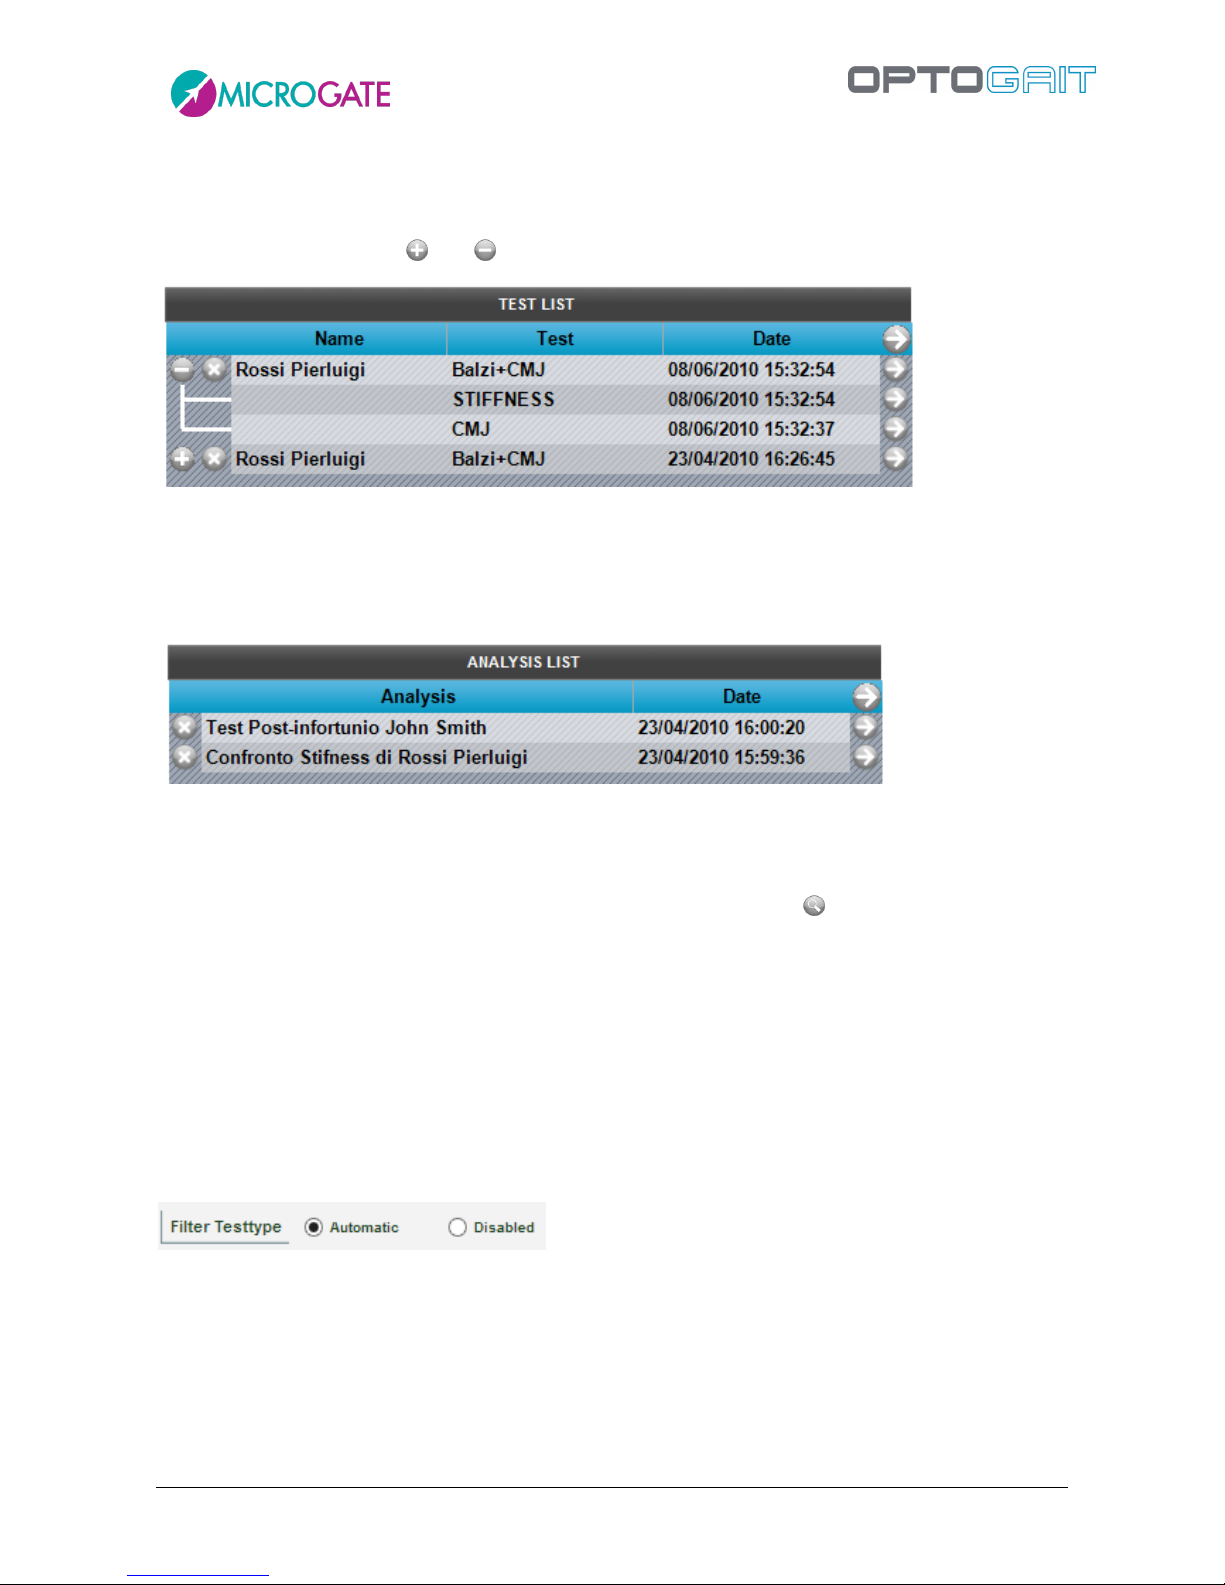
Version 1.9 Page 76 of 170
Filters Panel
With the ‘Data’ radio button, select whether single tests, protocols or analyses should be viewed.
In the latter case, with the and icons expand or collapse the tests contained in the protocols.
Figure 56 – Expanded Protocols List
Choosing 'Analyses’, all saved analyses will be viewed with the saving date (which can be much later
than the execution of the analysed tests).
Figure 57 – Saved Analyses
To look for a patient or a test/protocol, the data can be inserted manually into the search boxes
(e.g., key in ‘Rossi’ in the Patient field or ‘CMJ’ in the Test field) or press to display a list of patients
or tests to choose from. Similarly, it is possible to filter by data by inserting a range of data with the
calendar control.
The 'Test type filter' radio button can be used to apply an automatic filter to the test type: for
example, if 'Jumps 15 seconds' is selected for test analysis, the list on the left-hand side will only
show 'Jump Test' types and all others (gait, run, tapping, etc.) will be hidden. This makes it easier to
select other tests of the same type for comparison or history purposes. If, on the other hand, you
do not want to use this automatic filter (for example, when selecting a variety of tests to export),
set the filter to 'Disabled'.
To view all the tests and reset the various filters, press <Delete filter>.
Page 77
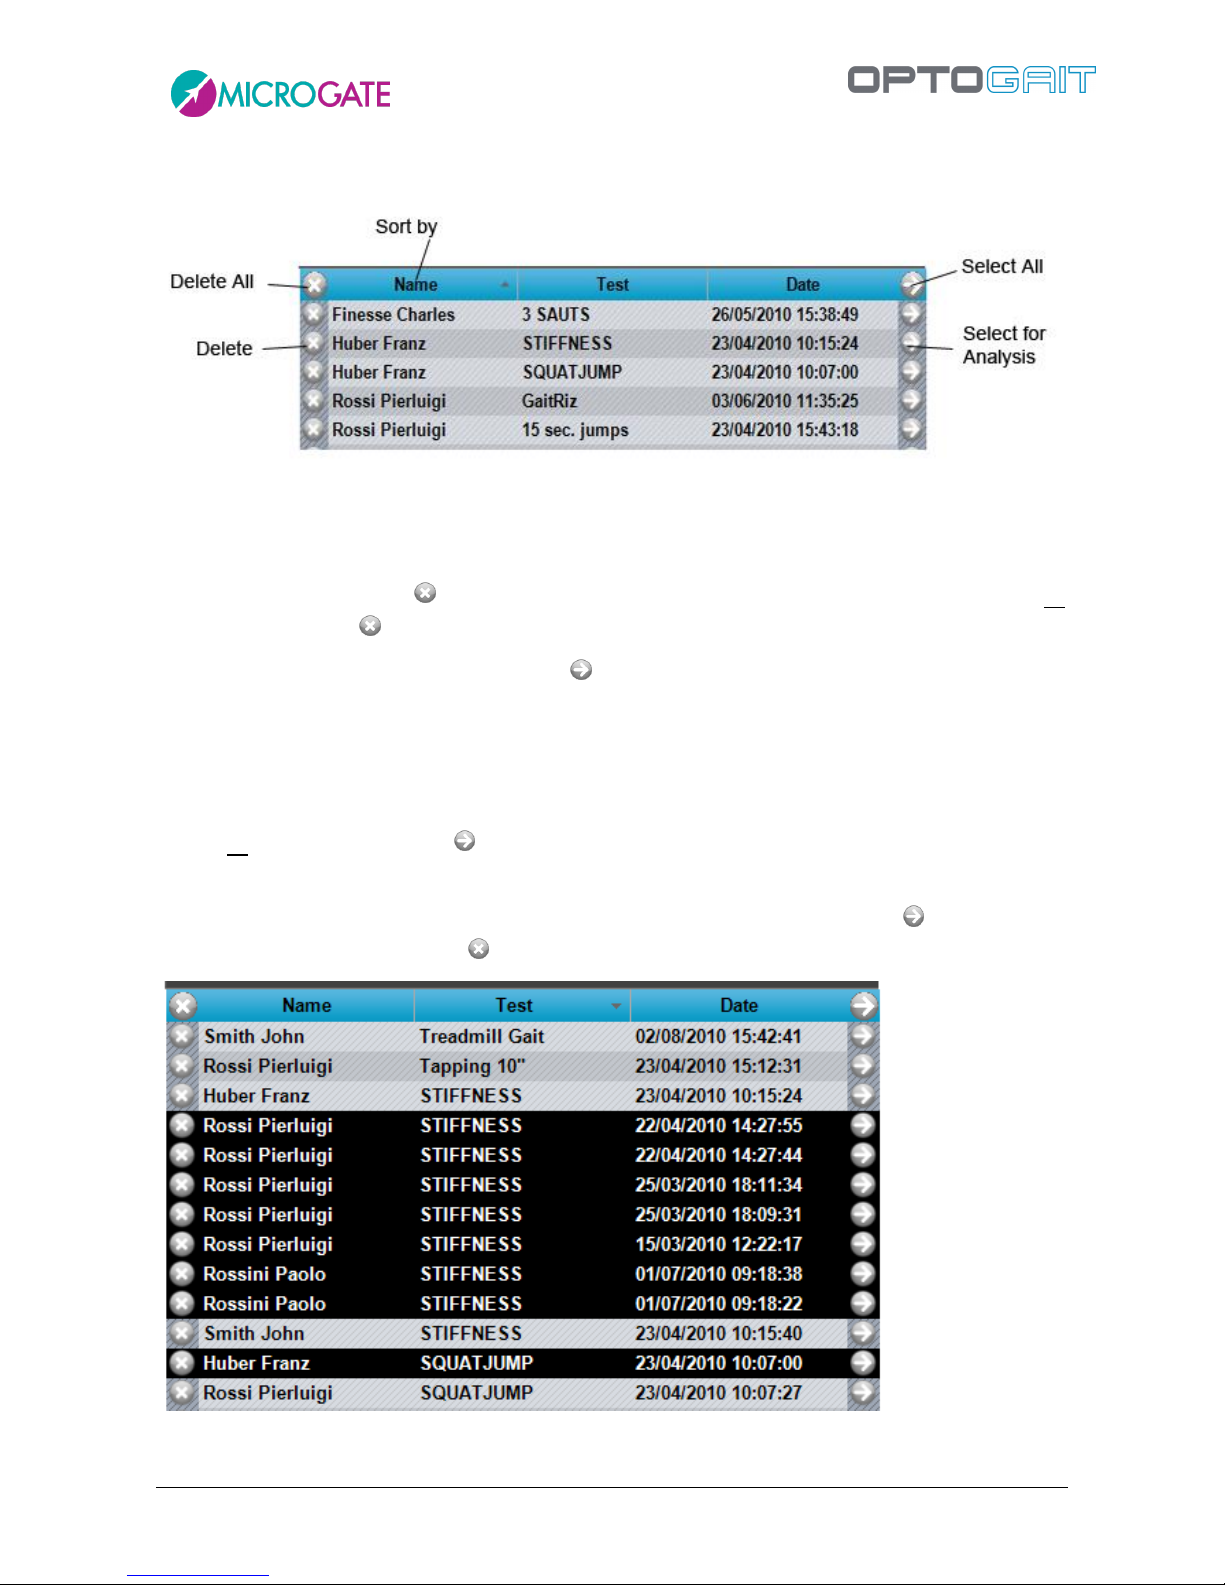
Version 1.9 Page 77 of 170
Test List
Figure 58 – Test List Components
Click on the column names (Patient, Test, Data) to display the list in order according to that field.
Press again to reverse the order (A…Z, Z…A).
To delete a test, press the symbol on the corresponding line of the chosen test; to delete all
displayed tests press on the table heading.
To select a test to analyse, press the symbol on the corresponding line (or double-click with the
mouse): the test will be moved from the LIST table to the ANALYSIS table and a filter will
automatically be set on the type of test (e.g., if a ‘Squatjump’ test is chosen, the Test List is filtered
in order to contain only ‘Jump tests’; this allows you to choose only tests of the same type to submit
to ‘Comparison’).
To add all displayed tests, press on the table heading.
To make multiple selections, use the SHIFT key to select a range of patients (from… to…) or the CTRL
key for selections that are not adjacent, as explained in section. 4.1.2. Pressing will move only
the selected tests, while pressing will delete those lines.
Figure 59 – Multiple selection
Page 78
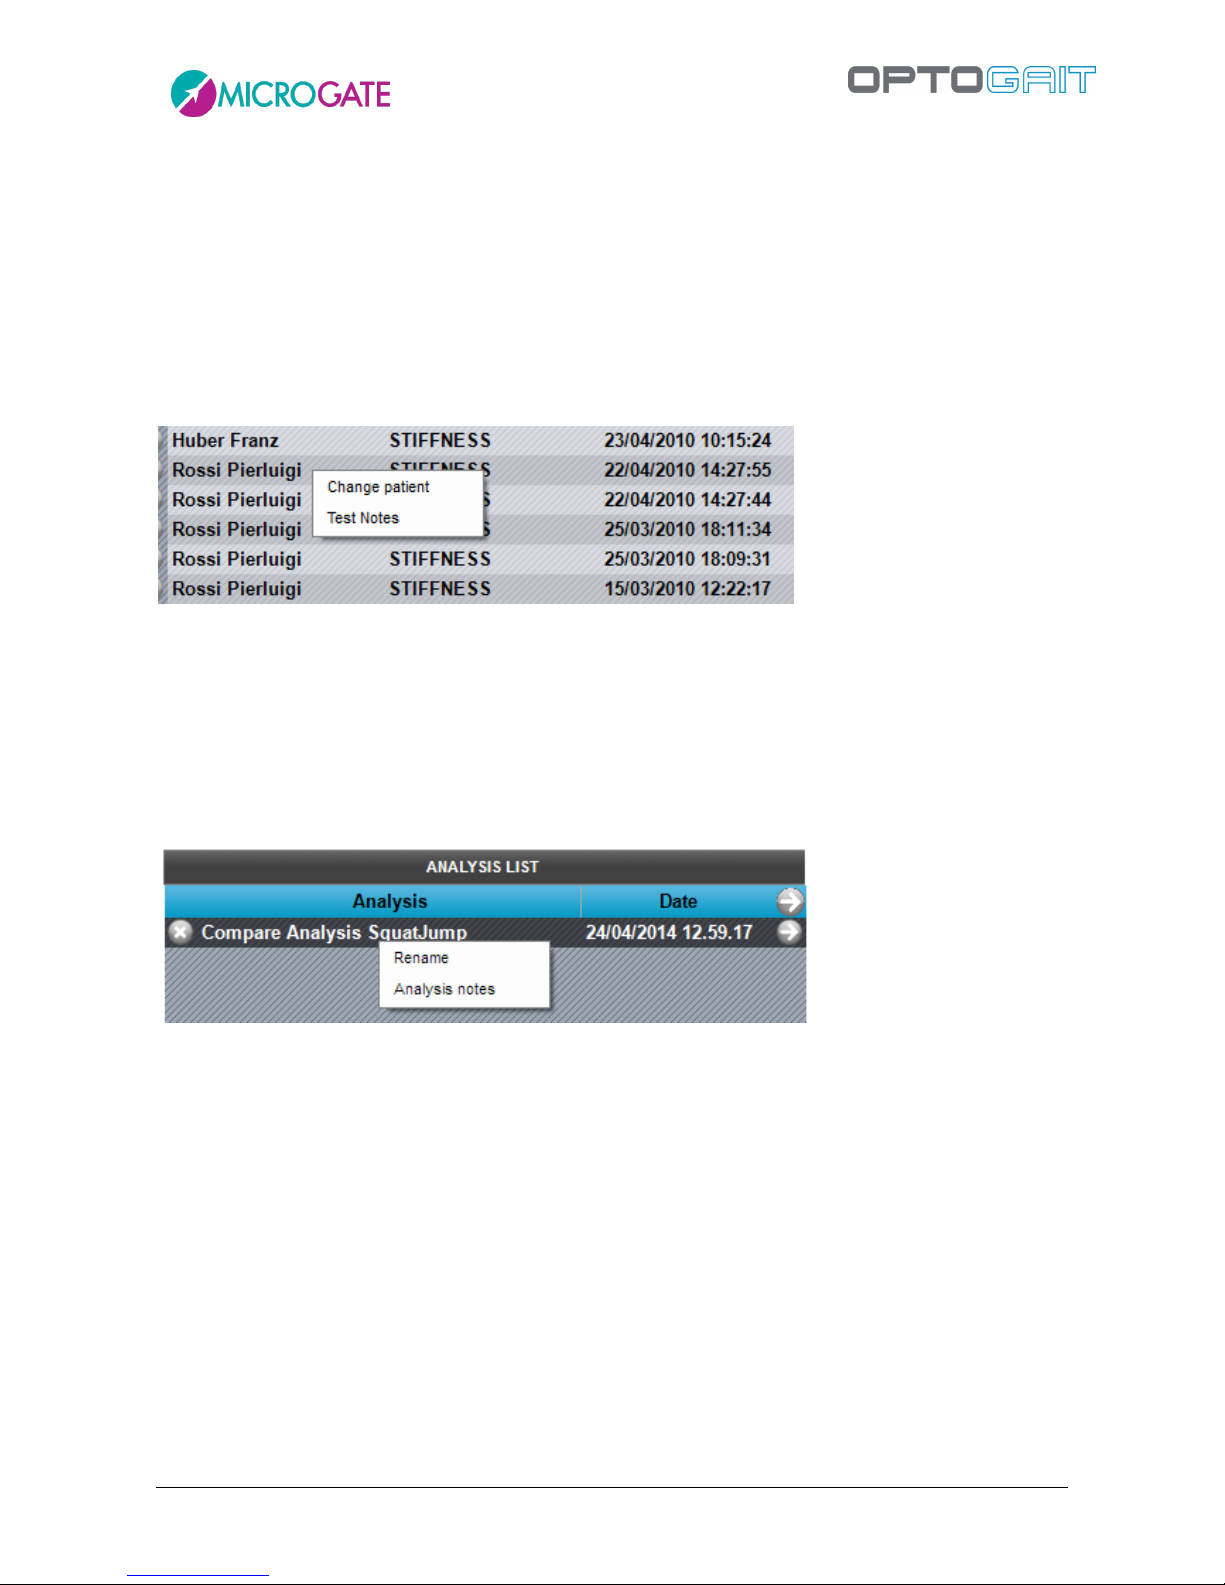
Version 1.9 Page 78 of 170
From the test list, it is possible to perform two operations by RIGHT-CLICKING on one test line. More
precisely:
Change person: allows you to associate a test with another person, if the wrong association
was made during execution; select the command and choose a patient from the displayed
mask; press <Confirm> to choose the new person. This function is also available on the
protocol list.
Edit note: allows you to view/edit the note inserted immediately after test completion; the
note will be printed on the report in the General Data section on the first page of the test.
Figure 60 – Context menu under a single test
Conversely, right-clicking on the list of saved analyses provides the following options:
Rename: allows you to change the name of the analysis
Analysis Notes: allows you to view/edit the note that has been entered; this note is printed
at the bottom of the report
Figure 61 – Context menu under the saved analysis
Page 79
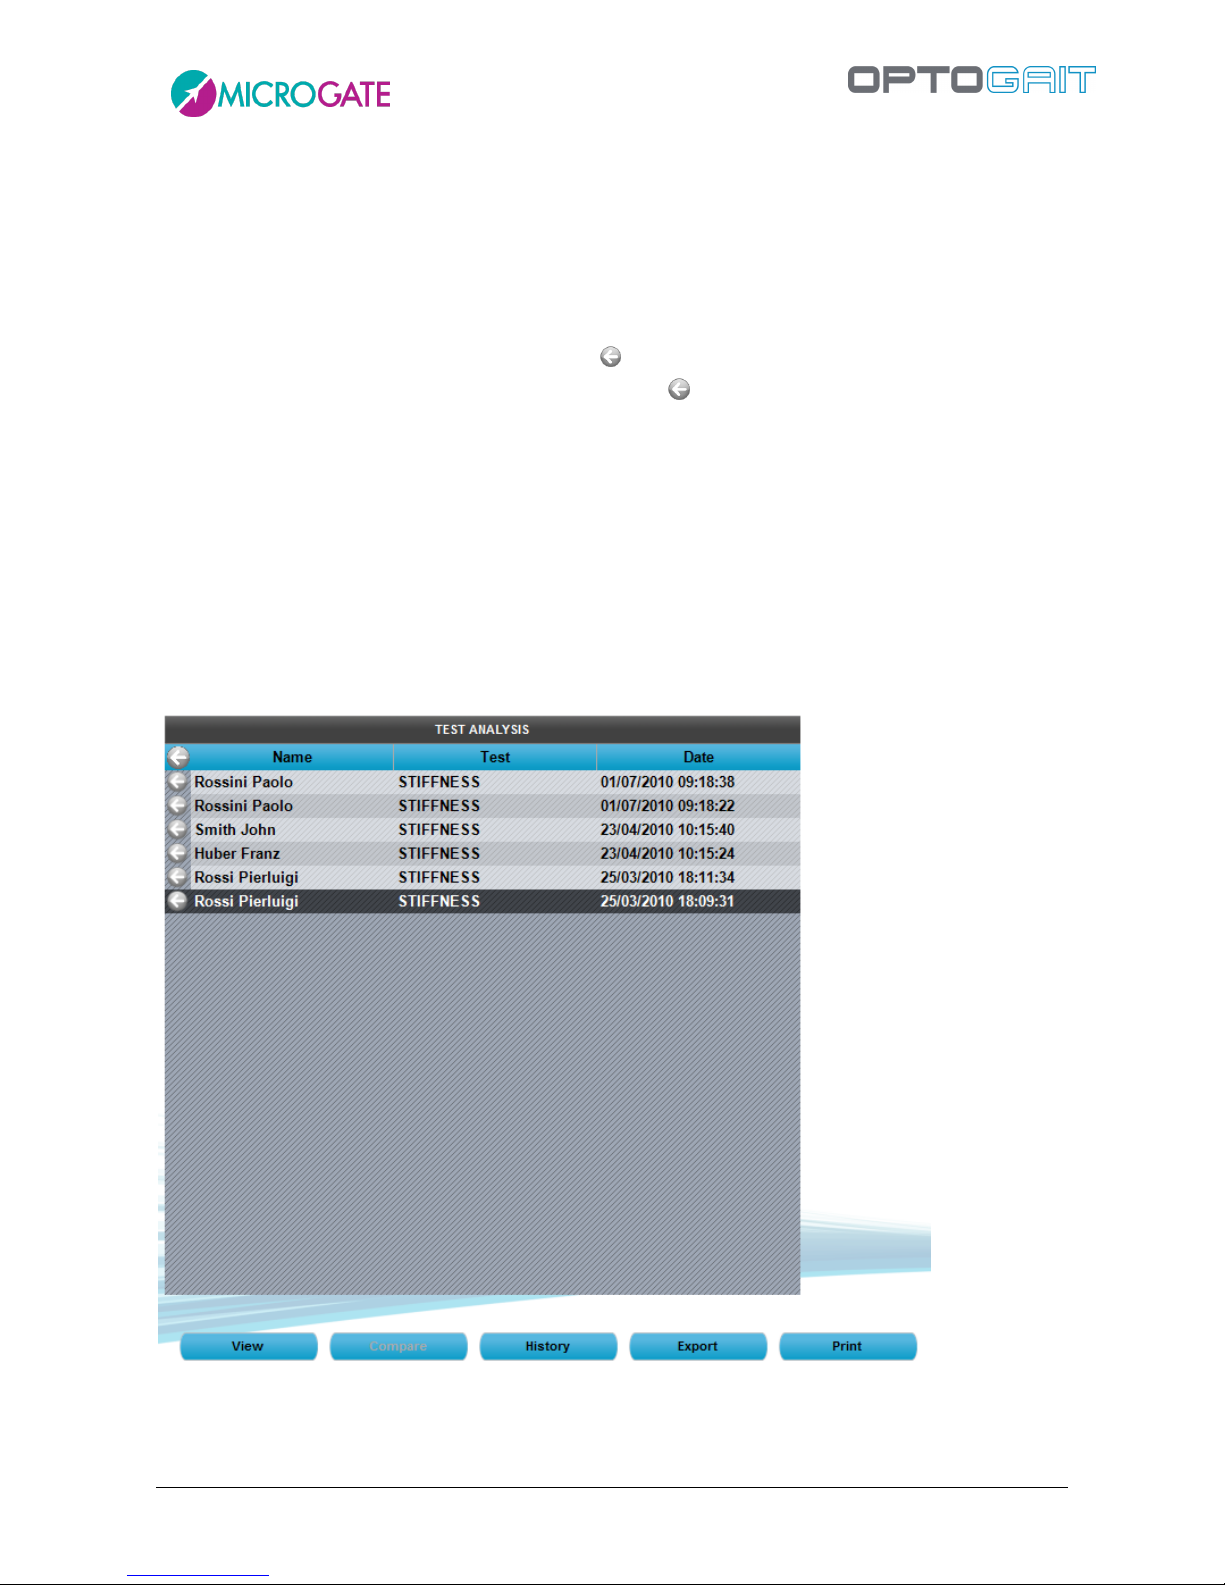
Version 1.9 Page 79 of 170
Test Analysis
To view a single test, select the corresponding line in the ‘TEST ANALYSIS’ table and press the button
<View> (or double-click with the mouse). See chap. 4.3.1 View.
To compare two tests, enter the relevant tests in the ‘TEST ANALYSIS’ table and press <Compare>.
See chap. 4.3.2 Compare. The button is disabled if the number of tests in the window is not two.
To remove a test from the analysis, press the symbol on the corresponding line in the 'TEST
ANALYSIS' table. To delete all the tests displayed, press on the table heading.
To analyse the history, insert two or more tests in the ‘TEST ANALYSIS’ table and press the button
<History>. See chap. 4.3.3 History.
To export the data to Excel, add at least one test to the ‘TEST ANALYSIS’ table and press <Export>.
A dialog box asks if the extended version (for each data line the test heading and patient’s data are
repeated) or the simple version (only numerical test data) should be displayed.
Pressing <Print>, n-number of reports (to be printed directly or saved in PDF format) are generated;
the number corresponds to the number of tests shown in the ‘Test analysis’ window. Before
generating the output, the output directory for the above files must be selected.
Figure 62 – Test list to analyse
Page 80
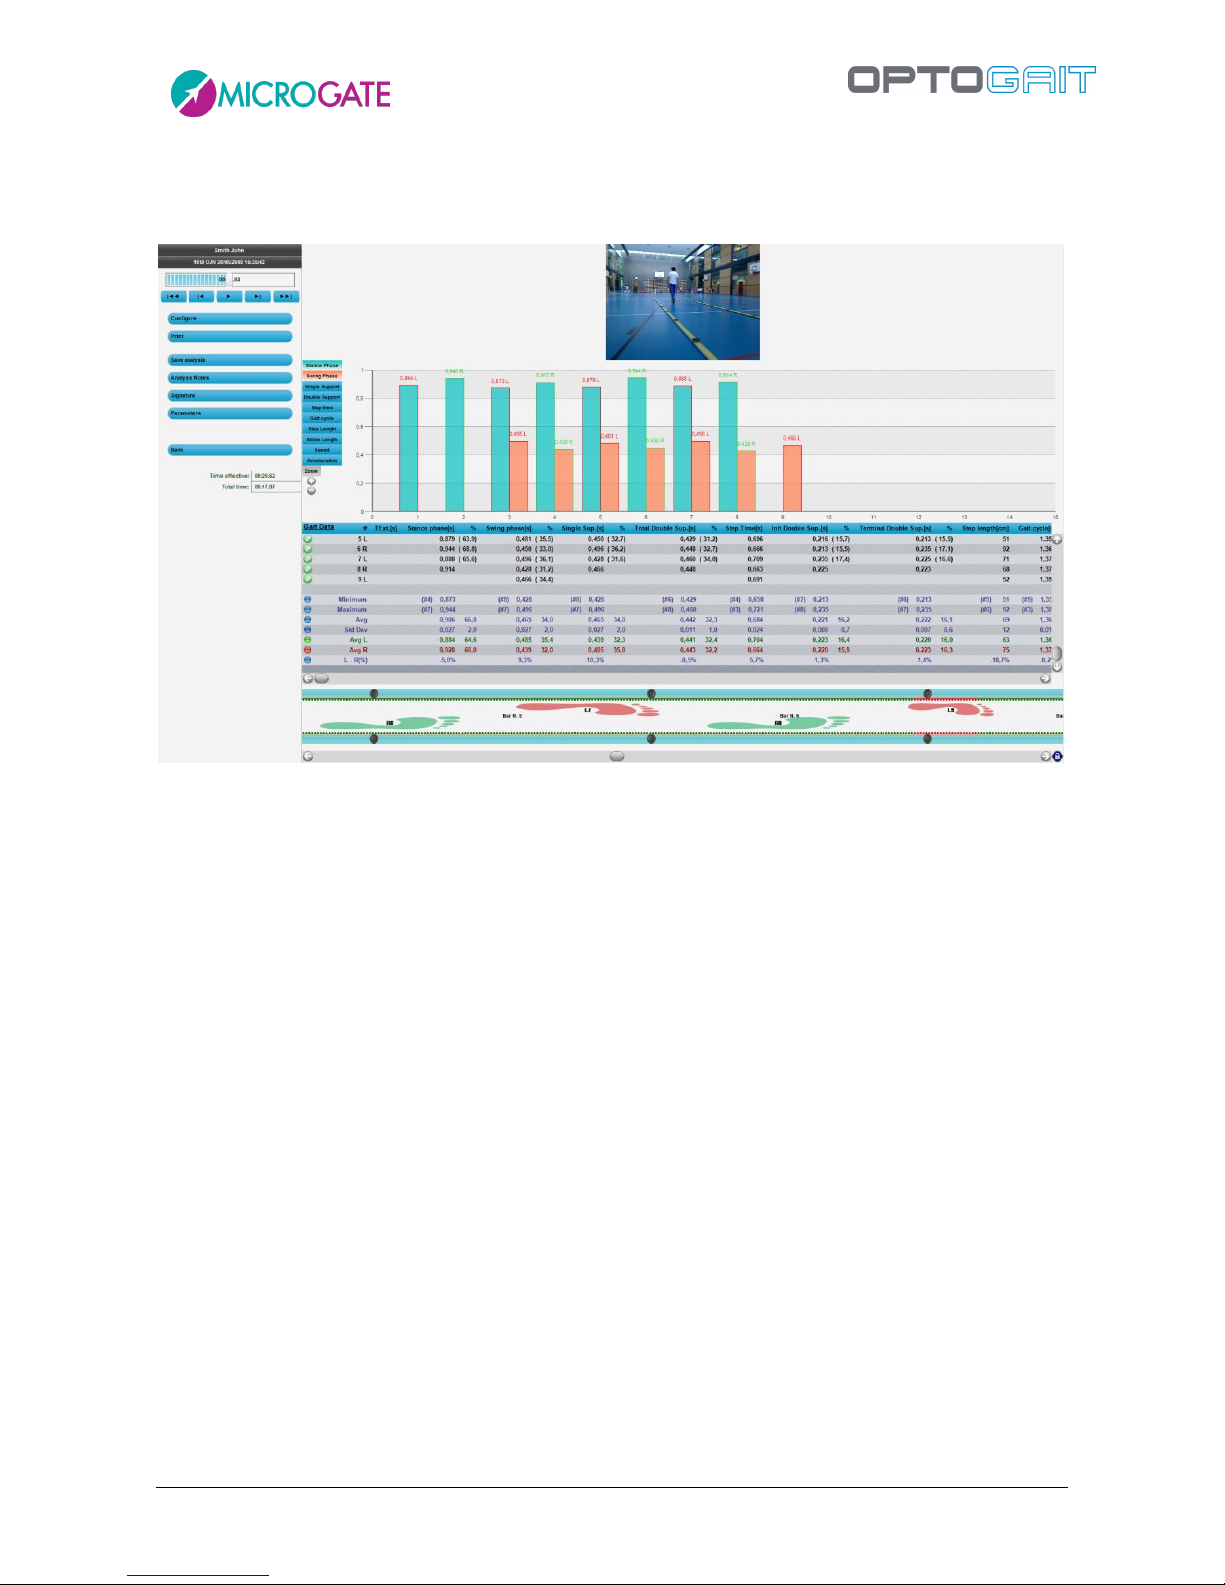
Version 1.9 Page 80 of 170
4.3.1 VIEW
In this section the test selected is displayed.
Figure 63 – View
The items on the left from top to bottom are the following:
name of the patient
test type and execution date
VCR player with slider and commands for managing the acquired video(s)
command buttons for activating various functions
<Back> button to close the mask View and go back to the Test list
total test data
On the right there are 4 types of information regarding the current test; each set of information can
be shown/hidden using the configuration commands.
The items from top to bottom are the following:
Videos acquired by (one or two) webcam(s); if the webcams are not connected when the
test is performed, a fixed image with the Microgate logo will appear
Charts displaying the results: it is possible to choose the chart type (lines or bars) and the
measurement to be displayed (times, heights, powers, etc.)
Table of numerical data: a grid with various lines and columns displays actually acquired
data and calculated data; at the bottom of the table statistical and aggregated data are
displayed (average, minimum, maximum, etc.)
OptoGait bars: displays the n-number of bars connected at the time the test is carried out
and which LEDs turn on during the test
Page 81

Version 1.9 Page 81 of 170
The table shows the list of all the external, flight and contact times acquired during the test. The
data has been processed to obtain further information such as jump heights, energy, developed
power, etc. See chap.5.1 Definition of Result Columns.
In the case of Sprint/Gait test, step length, speed, and acceleration are also displayed.
By checking the various rows, invalid flight and/or contact times can be deleted. See chap. 5.3.
In the bottom left area total test data is displayed, such as:
Effective time [mm:ss.dd]: actual time of the test in the format minutes, seconds and
milliseconds; this is the difference between the actual start of the test, calculated from the
first event (e.g. the first take-off from the ground), and the end of the test.
Total time [mm:ss.dd]: total time of the test in the format minutes, seconds and
hundredths of a second; this is the difference between the start of the test, signalled by the
acoustic signal, and the end of the test. If, for example, 10 seconds pass between the two
start beeps and the end of the test, and the patient begins to jump 3 seconds after the first
beep, the two values will be Total time = 10 and Effective time = 7.
Specific energy [J/kg]: specific energy produced during the test calculated with the
following formula:
Specific power [W/kg]: specific power produced during the test calculated with the
following formula:
Where Tf= Flight Time, Tc= Contact Time
Patient's weight [kg or lb]: patient's weight in kg or pounds
Total energy [J]: if the patient’s weight is available, this field contains the total energy
expressed by the patient during the test (SpecificEnergy * PatientWeight)
Total power [W]: if the patient’s weight is available, this field contains the total power
expressed by the patient during the test (SpecificPower * PatientWeight)
Page 82
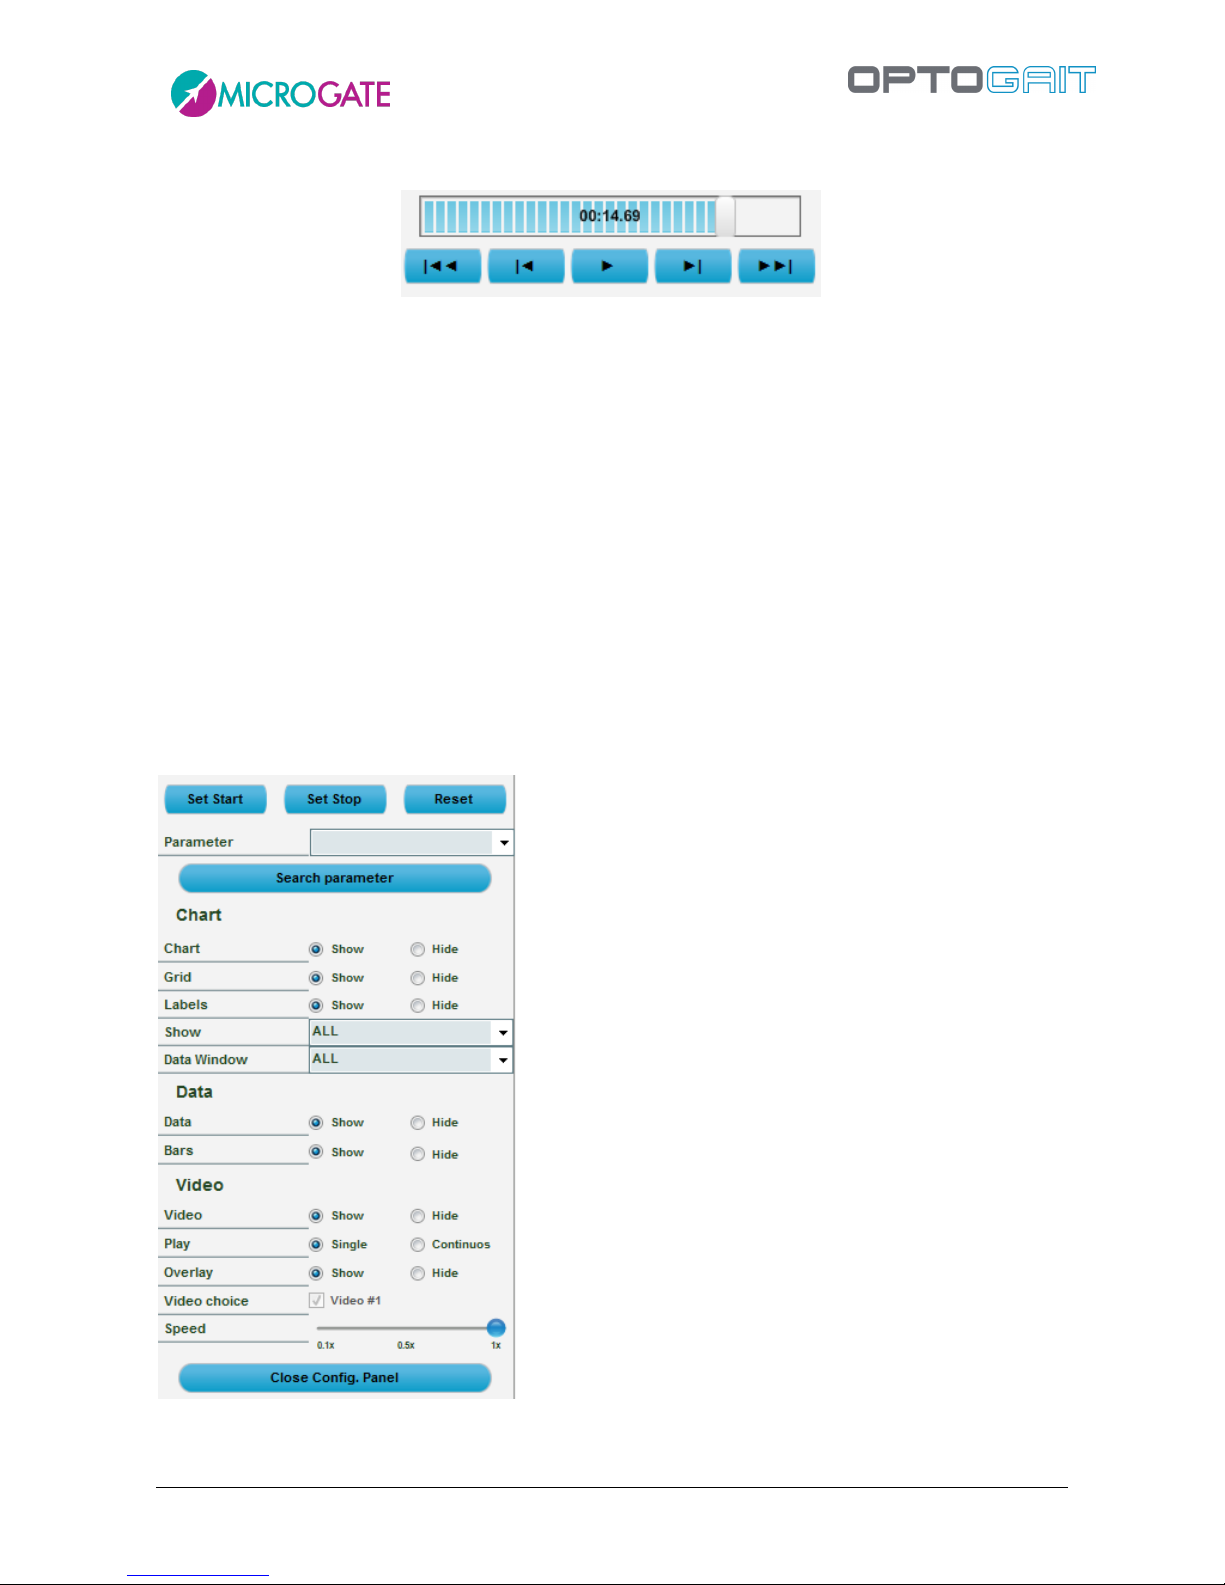
Version 1.9 Page 82 of 170
At the top left (see figure below) is the command panel for checking test progress.
Figure 64 – Command panel
From left to right the commands available are:
Back to the start of the test
Back one frame
Play/Stop
Forward one frame
Forward to the end of the test
Move the progress bar (slider) by moving the cursor with the mouse.
Instead of the buttons Back/Next, the right and left arrow keys on the keyboard can be used to move
forward/backward by single frames. The CTRL+Right Arrow and CTRL+Left Arrow can be used to
move by a thousandth of a second.
4.3.1.1 CONFIGURATION PANEL
Pressing <Configure> displays the choices available.
Figure 65 – Configuration Panel for the View test function
Page 83
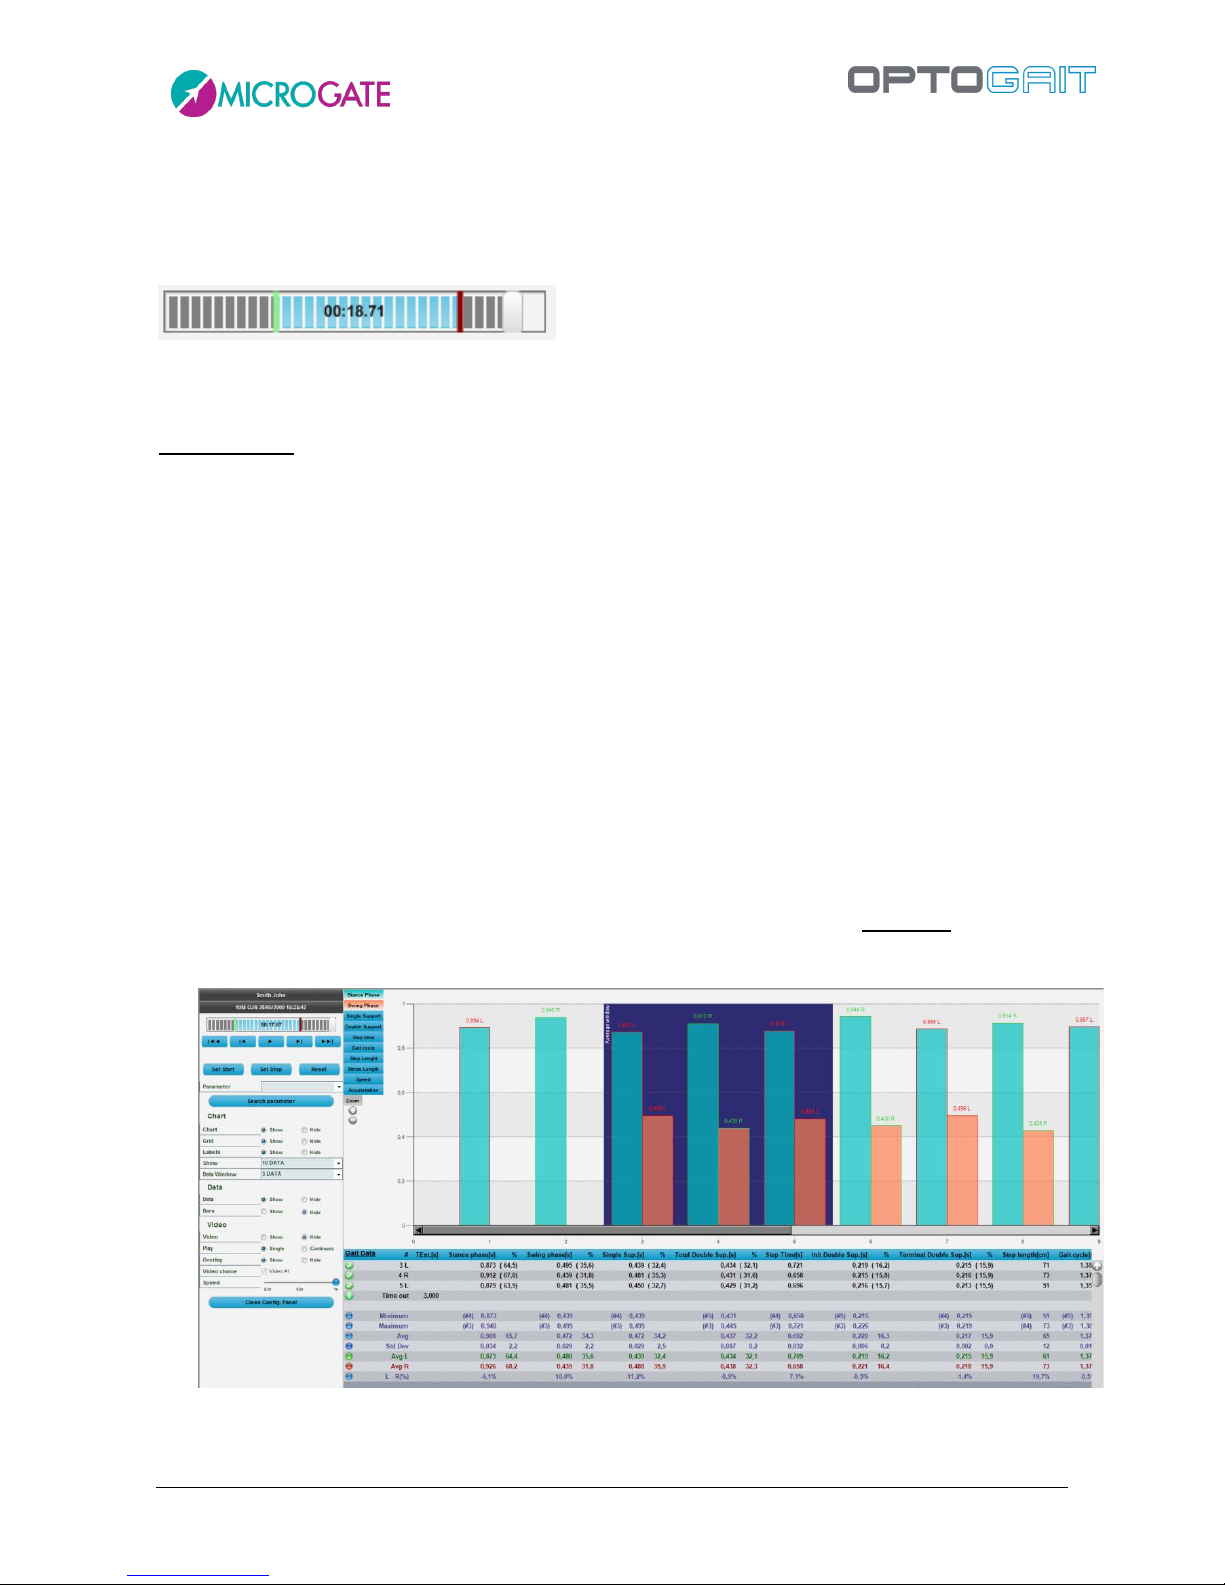
Version 1.9 Page 83 of 170
The <Set Start>, <Set Stop> buttons are for defining the start and end respectively of the part of
interest. Place the cursor at the start and finish points of the desired movie clip and press <Set Start>
and then <Set Stop>. Thus a part of the movie clip is isolated, deleting the uninteresting ‘dead’
periods.
Press <Reset> to cancel the ‘Start’ and ‘Stop’ references and restore them to their initial values.
Double-clicking anywhere on the timeline, the positioning time can be entered. The value must be
in milliseconds (i.e. for example 1871 to reach 18”.71).
With <Search Parameters>, it is possible to look for a parameter selected from the 'Parameter' dropdown menu; e.g. select 'first flight time' and press Search Parameter: you will see the film clip and
the slider used to move forward to the frame corresponding to the patient's first take-off from the
ground. By using ‘Next T.Flight’, you will go forward to the next corresponding event. This function
is very useful when comparing two tests.
The display of test data can be configured by the user:
Chart
o Chart: shows/hides the chart
o Grid: shows/hides the dotted lines forming a grid on the chart
o Labels: shows/hides the labels for the numerical values on the times on the chart
o View: shows all the data acquired or only certain data; in this case, a scrollbar
allows you to move to the right and left inside the chart
o Data Window: the table of numerical data displays the n-number of data based on
the window in blue shown in the chart. To move the window, right-click it with the
mouse and drag it onto the chart.
Figure 66 – Display 10 events at a time and take 3 of them into consideration (blue window)
Page 84
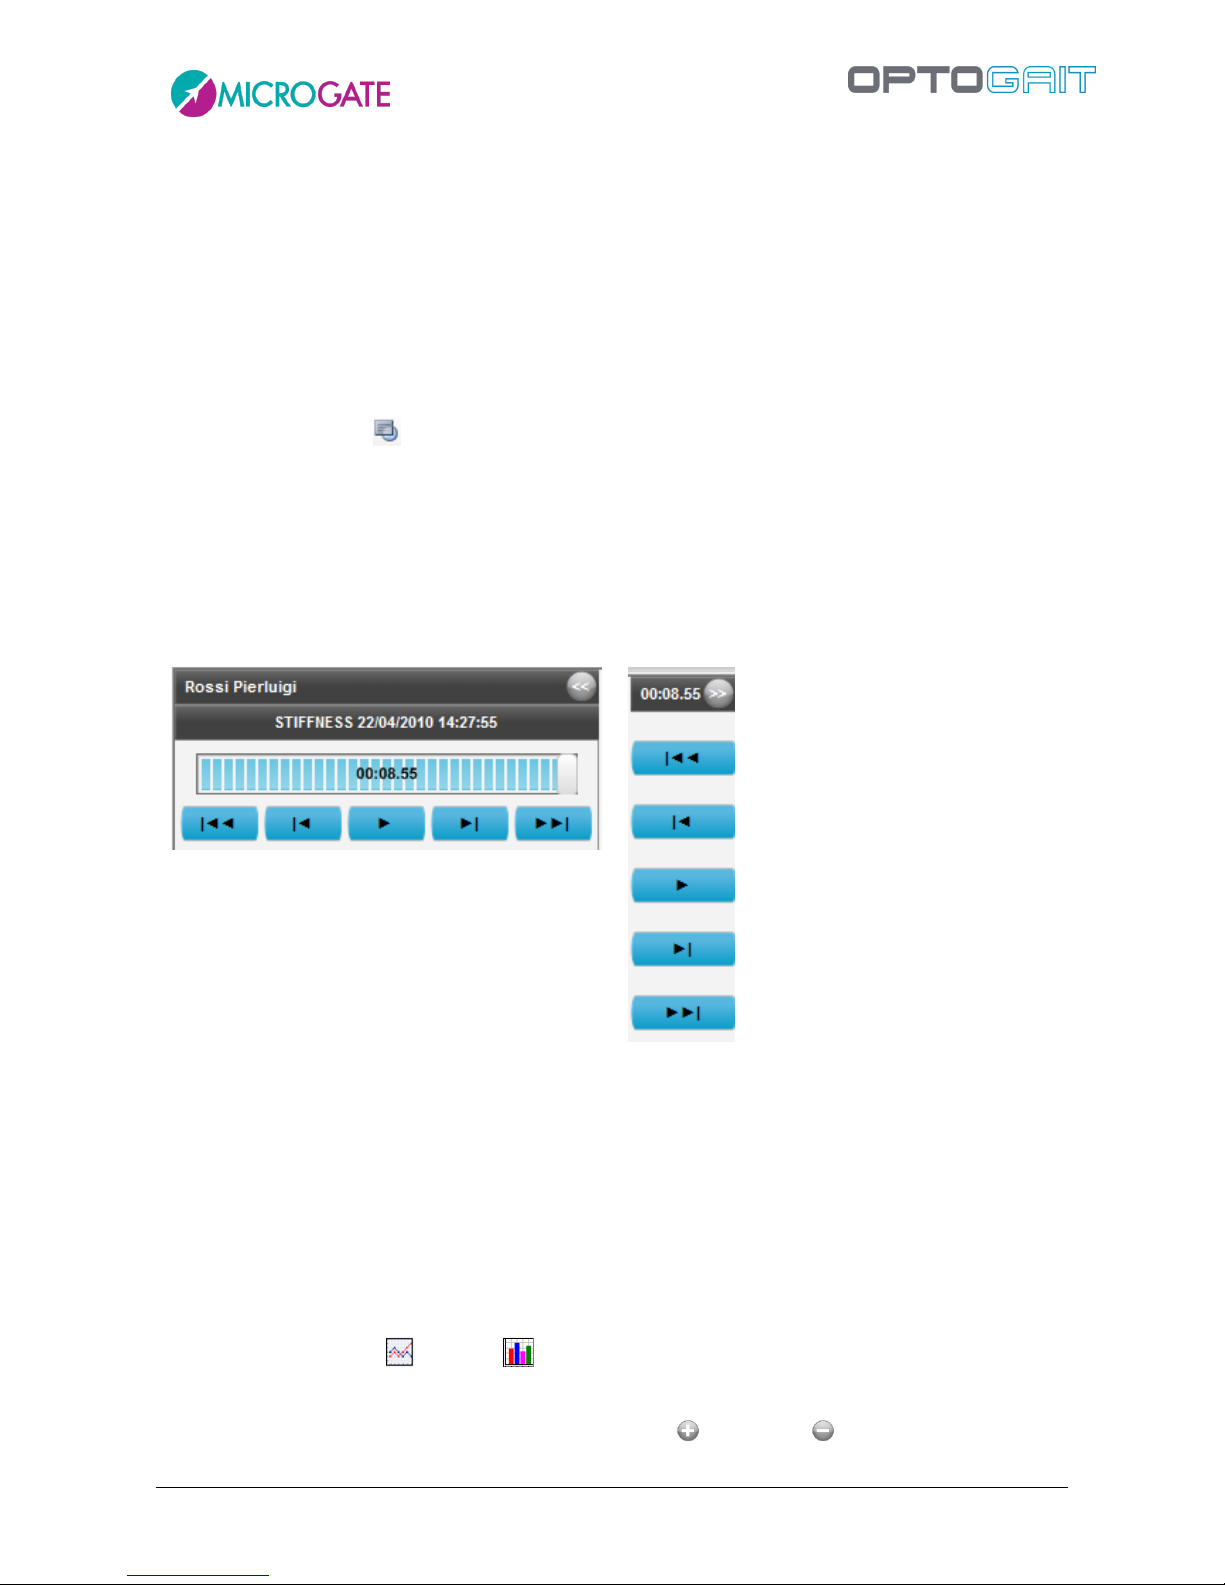
Version 1.9 Page 84 of 170
Data
o Data: shows/hides the grid with numerical data
o Bars: shows/hides the OptoGait bars
Video
o Video: shows/hides the acquired video
o Play: you can play ‘Single’ (only once) or ‘Continuous’ (looping the test)
o Overlay: using graphical tools draw on a still picture and save this image as an
overlay ( ); use this flag to show or hide it
o Video choice: allows you to choose whether to show or hide one of the two videos
o Speed: normal (1x) or slowed down by a factor from 0.1x to 0.9x
The Configuration panel can be closed (i.e., minimized) using the button << in the upper left corner.
Only the video commands (play, stop, ff-fw, rew, etc.) are available, allowing you to view the test.
Use >> to open the panel again.
Figure 67 – Open Configuration panel
Figure 68 – Closed Configuration panel
4.3.1.2 CHARTS
In OptoGait charts there are various viewing options. (for example, in Figure Figure 69 'Stance' and
'Swing' are displayed). To change view type, left-click with the mouse on another option (such as
‘Power’ or ‘Height’). The buttons have the same colours as the chart bars/lines and are therefore
used as legend.
In addition, if you place your cursor on one of the buttons, the displayed chart type will appear on
the right. It can be lines ( ) or bars ( ). To change the chart type, left-click on the corresponding
symbol.
By pressing the symbols under ‘Zoom’ you can increase ( ) or reduce ( ) the chart display.
Page 85
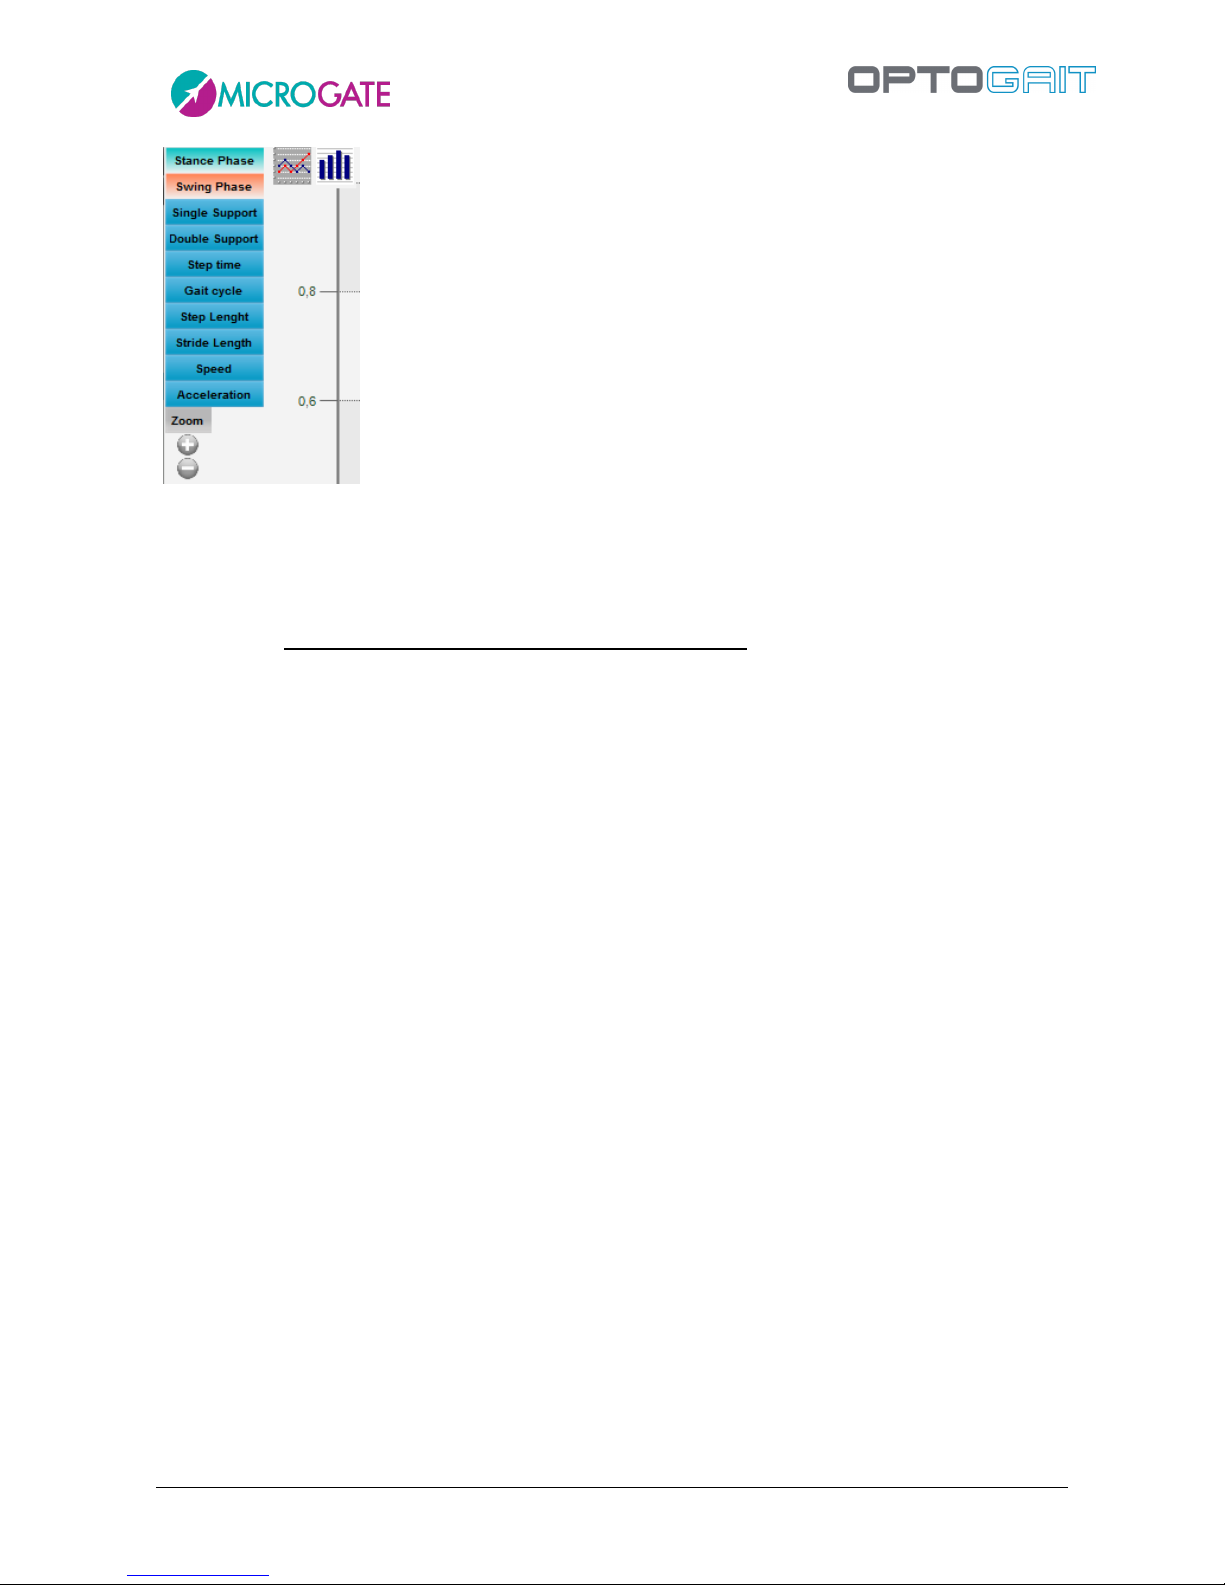
Version 1.9 Page 85 of 170
Figure 69 – Chart options
If a setting is not available, it is displayed in black. e.g. if no second webcam is connected, the option
'View video#2' is disabled).
The OptoGait software has a graphic tool for analysing images acquired by webcams. To enter this
section, just double-click with the mouse on the still picture to process (see chap. 5.4 Video
Analysis).
Press <Menu >> > to close the Configuration panel.
Page 86
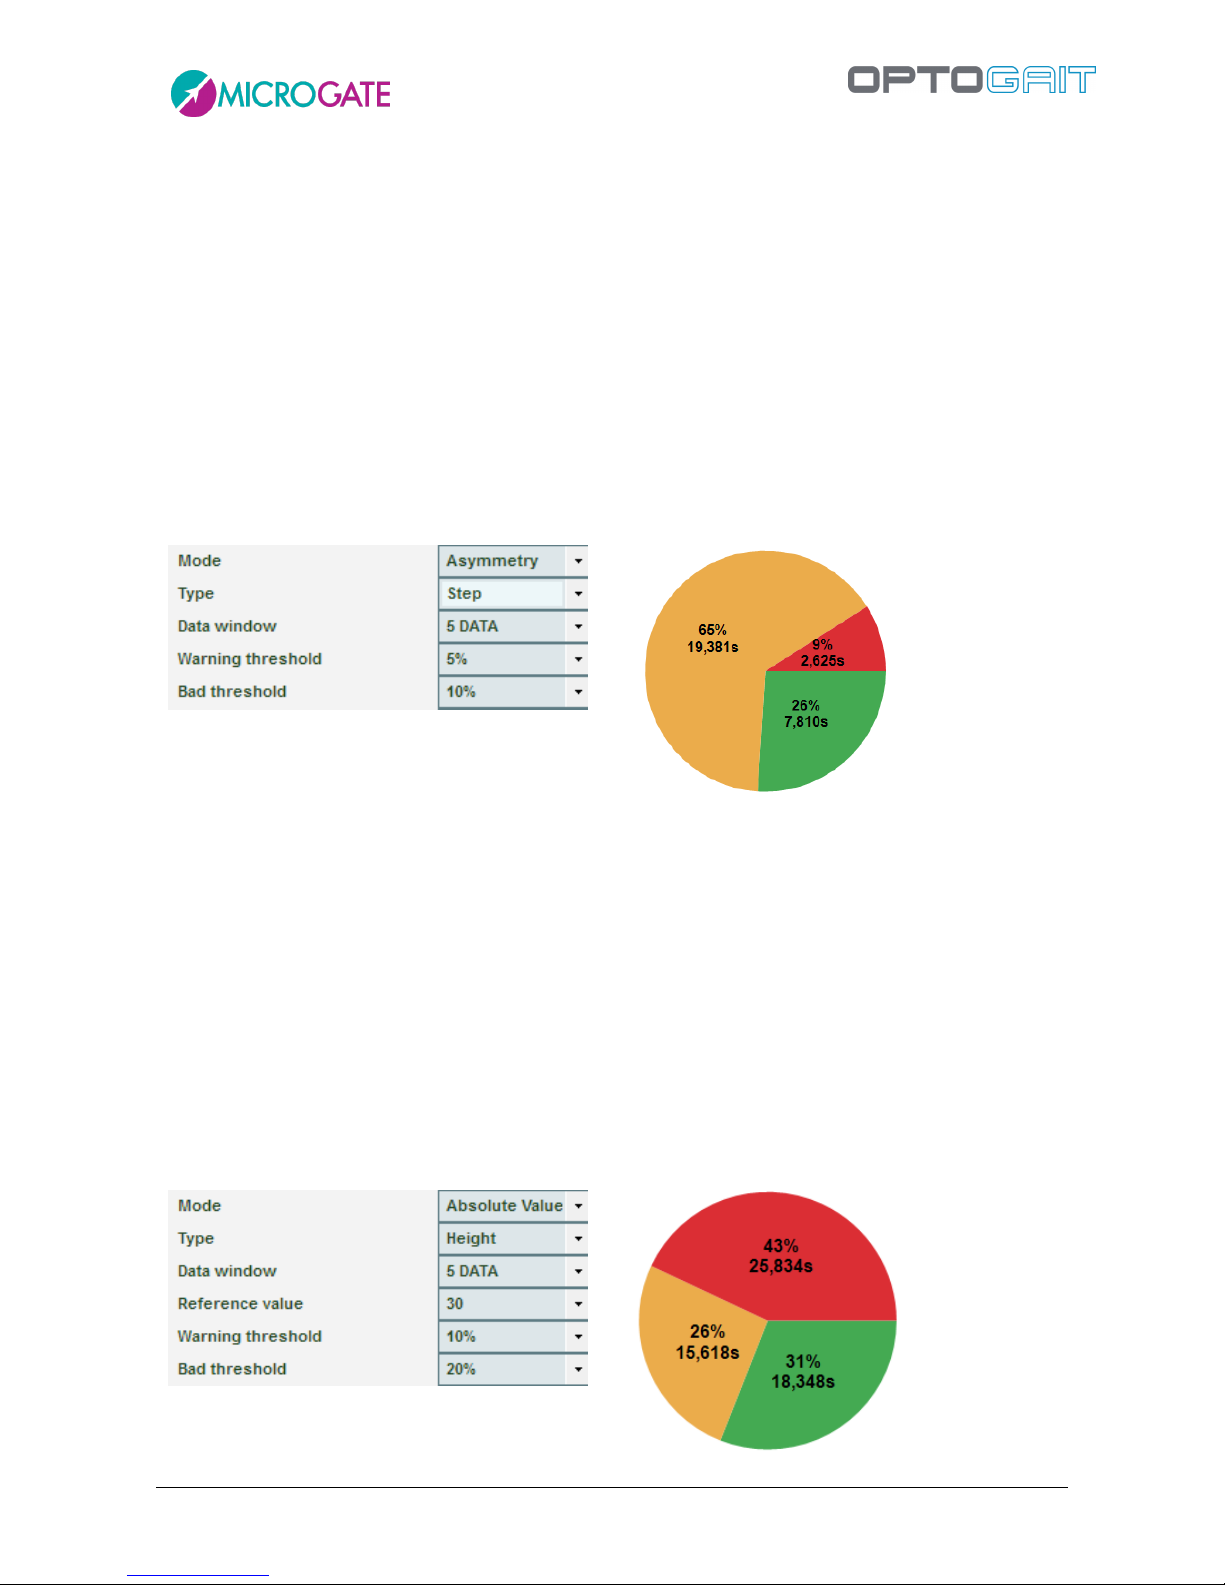
Version 1.9 Page 86 of 170
4.3.1.3 STATISTICS CHARTS
Both during a test and in the subsequent data viewing and analysis, instead of the charts described
in the previous chapter, it is possible to view a pie chart depicting the division of time elapsed
between specific thresholds defined previously.
The same panel used to configure the second monitor (see chap. 4.2.1.2) can also be used to indicate
which value is to be taken into consideration (Stance, Swing, Step Length, Jump Height, etc.) and
which warning threshold and bad threshold values are to be set.
The mode (Asymmetry or Absolute Value) is obviously the most important parameter to be set on
the basis of what is to be monitored.
In the example below we want to see how asymmetric (right/left) the patient is during a treadmill
gait test in terms of step length, in relation to the thresholds set:
The statistics chart shows that in a total of approximately 30 seconds testing, 26% (7.8 s) showed
asymmetry under 5%, 65% of the time (19.3 s) it was between 5% and 10%, and just 9% of the time
(2.6 s) asymmetry was over 10%.
The Data Window allows us to decide every how many events a calculation to work out which of the
three bands the patient falls into; e.g. by setting 5 DATA, every 5 steps (or jumps) the average of the
selected measurement is calculated, compared with the reference value and the established
thresholds and assigned to the good, warning or bad category.
In this second example, however, we see the use of 'Absolute Value' mode where, in a 'Jumps 60
seconds' test, the Height value is compared with a reference value of 30 cm: 31% of the time the
patient jumped over 27 cm (30 cm – 10% of the warning threshold), 26% of the time he/she jumped
between 24 and 27 cm, and 43% of the time he/she jumped under 24 cm.
Page 87
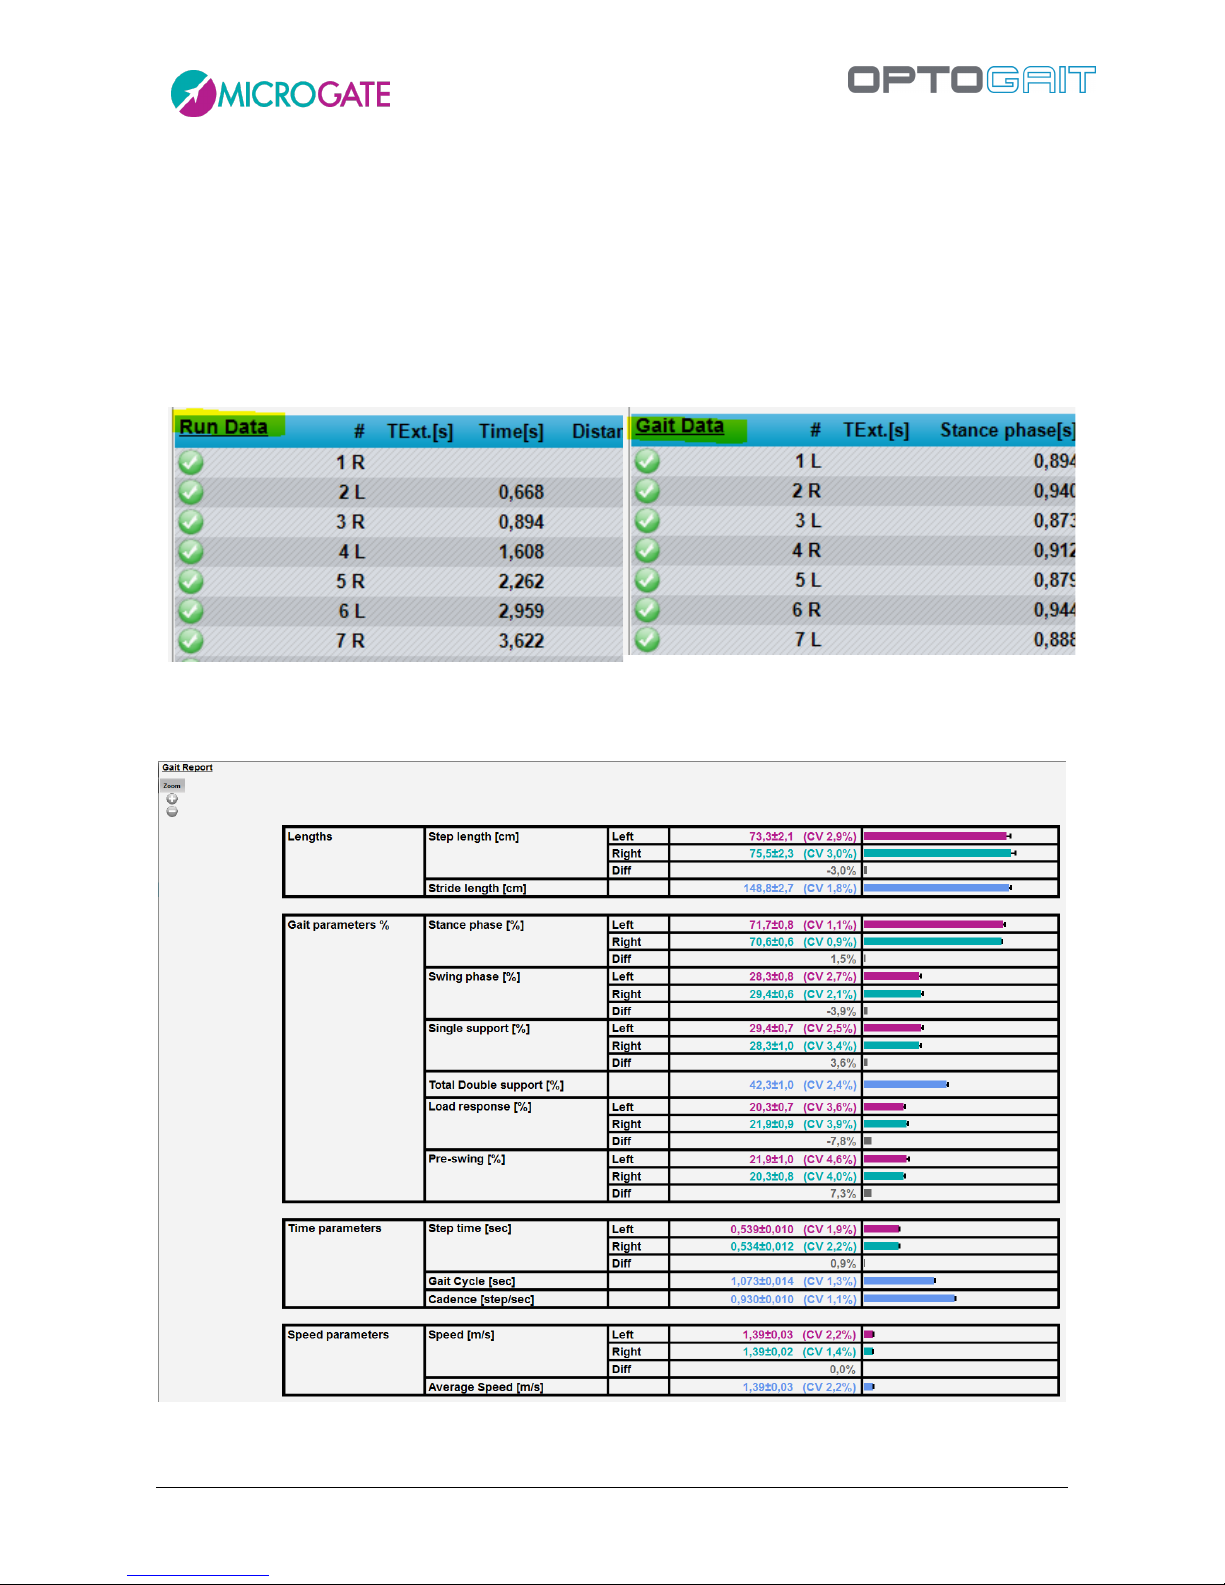
Version 1.9 Page 87 of 170
4.3.1.4 TABLE WITH NUMERICAL DATA
In ‘Jump Tests’ or ‘Reaction Tests’, the numerical data to display are few and therefore almost
always fit into one screen.
On the contrary, in Sprint/Gait tests (regular or with treadmill), the table of numerical data has many
columns (a horizontal scroll bar is shown); it was therefore decided to divide them into two pages,
the first containing typical Run Data and the second containing Gait Data.
To switch from one screen to another, click on the link on the top left corner of the table.
Figure 70 - Run & Gait Data
There is also a third type of data depiction called 'Gait Report', which can be zoomed with the +
and – button
.
Page 88
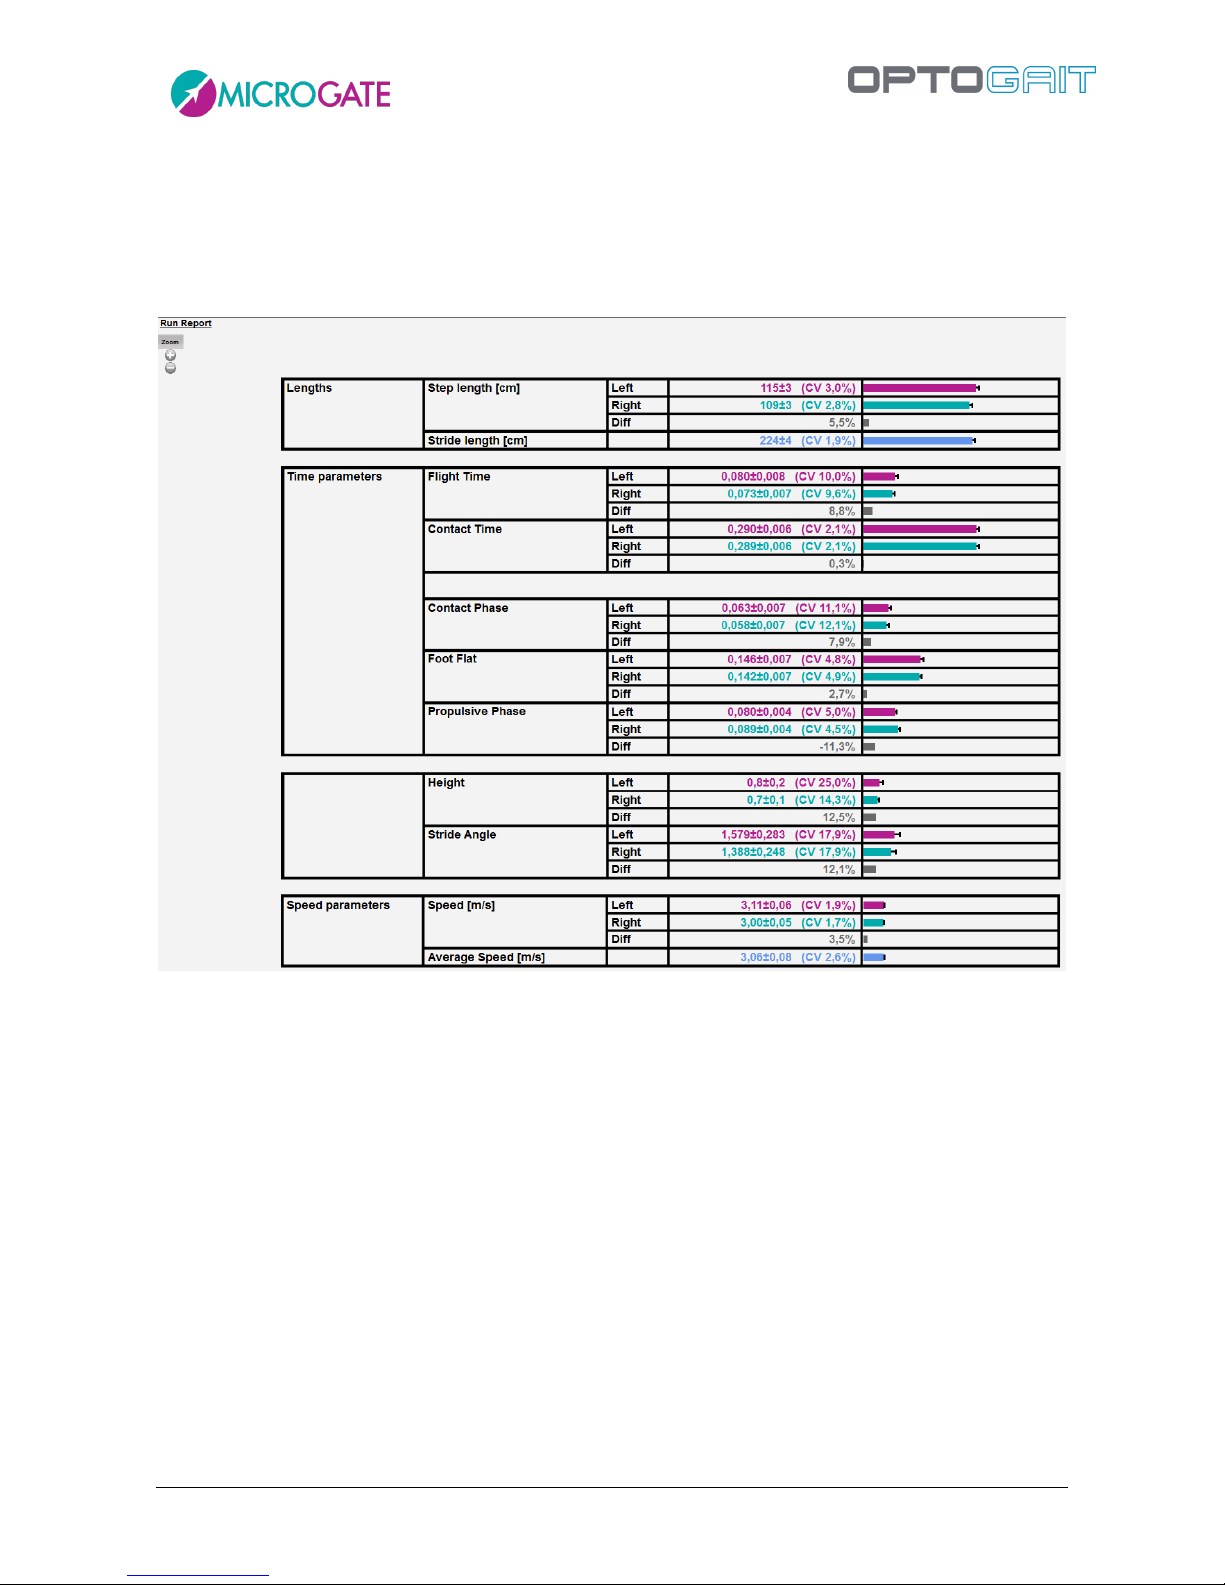
Version 1.9 Page 88 of 170
In the Run Test (on a modular system or on a treadmill) there is another possibility, i.e. to view a
dynamic report (Run Report) focusing on the asymmetry between the right and the left foot. Of
course, the report can be viewed also under Results and in the print report. To view the report, click
on the link highlighted in the upper left corner to toggle between Run Data, Gait Data, and Run
Report.
Figure 71 - Run Report
In Tapping Tests, four pages may be scrolled:
Left and right foot results
Left foot results
Right foot results
Comparison between right and left foot
Page 89
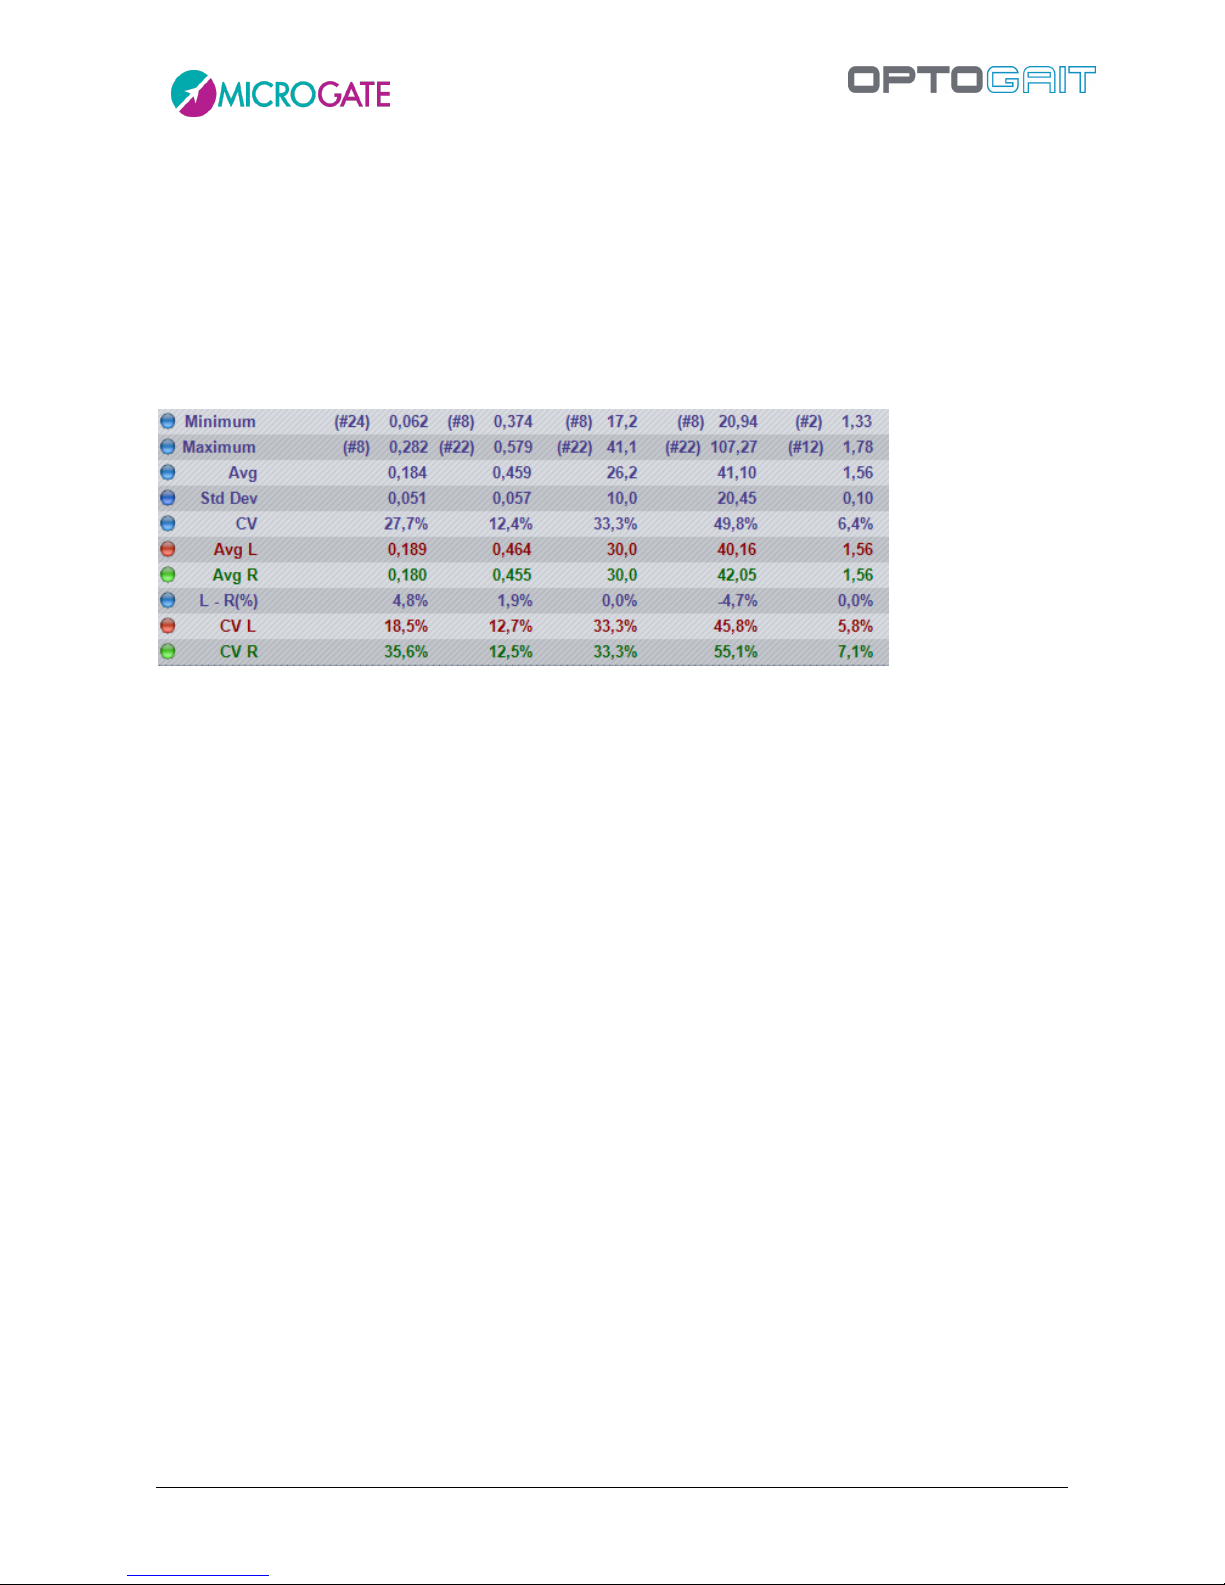
Version 1.9 Page 89 of 170
At the bottom of the data, some statistical data are calculated:
Minimum Value
Maximum Value
Average (µ)
Standard Deviation (σ)
Coefficient of Variation (CV: ratio of the standard deviation to the mean)
In some test types, values are calculated for each foot (left & right)
Figure 72 – Calculated statistical data
Page 90
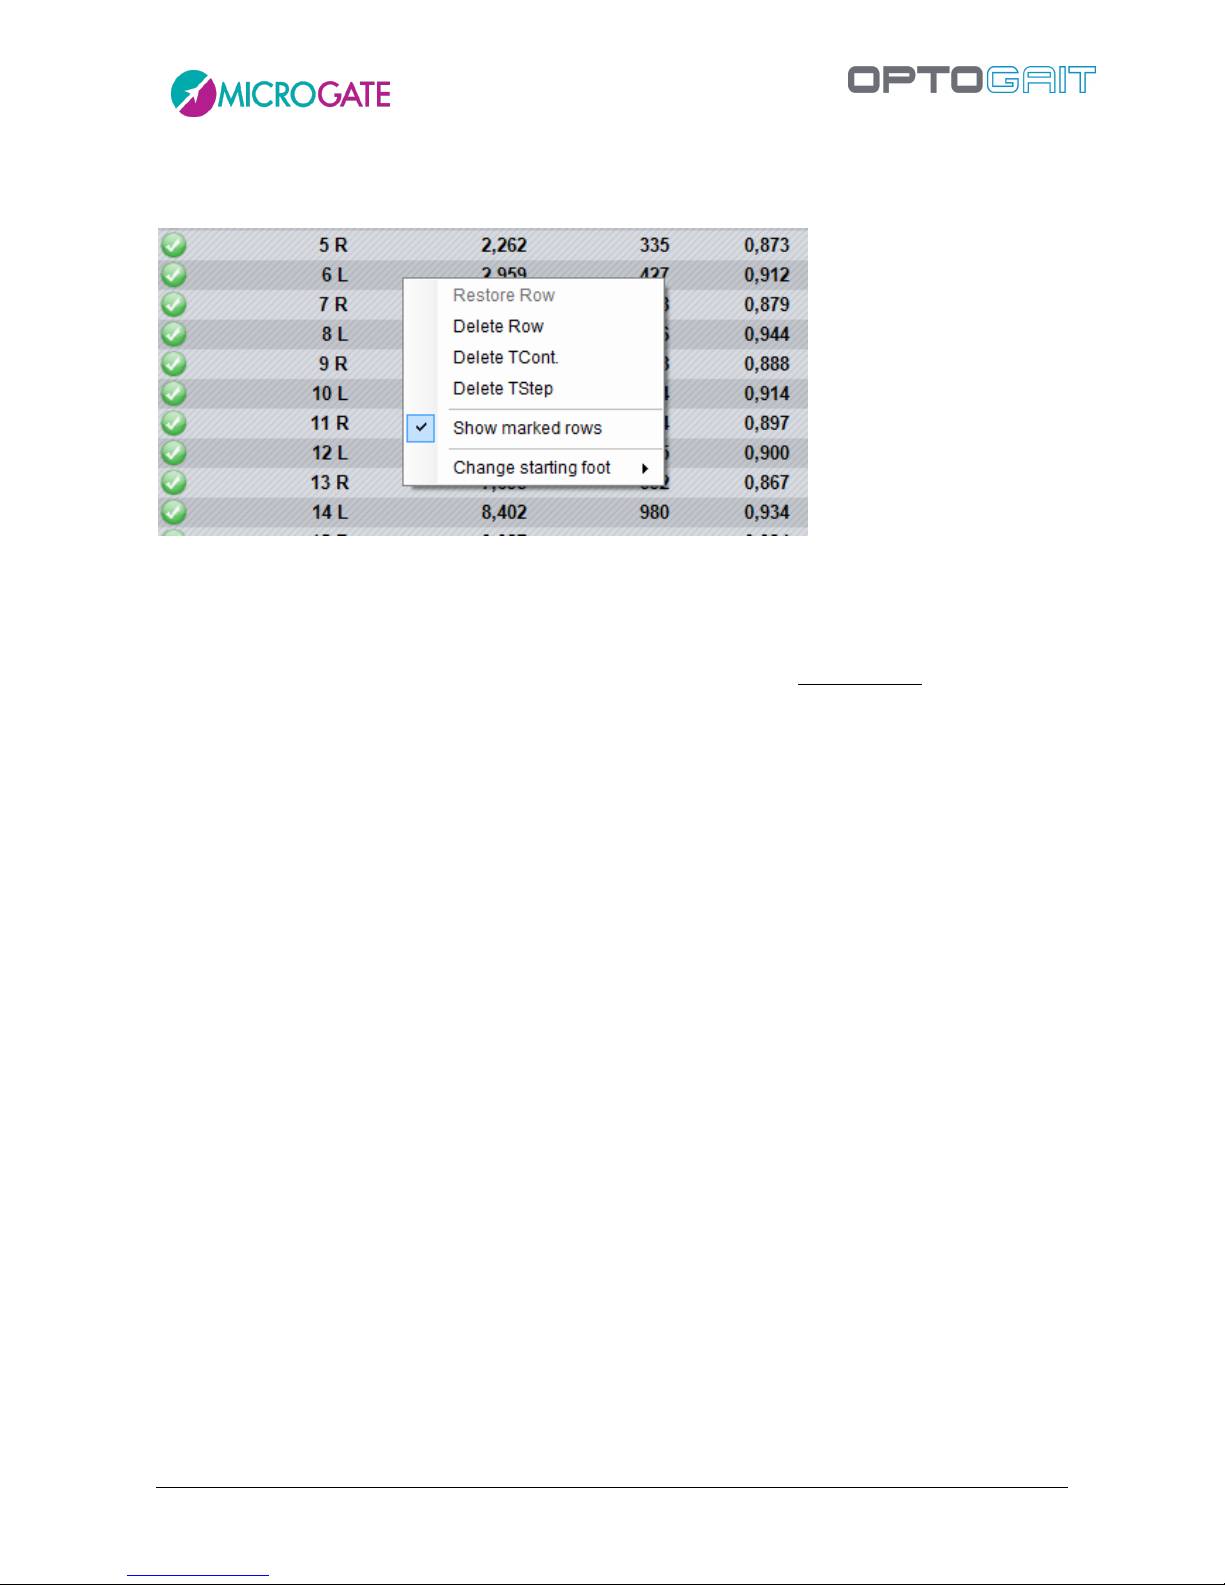
Version 1.9 Page 90 of 170
4.3.1.4.1 Row Management Menu
When RIGHT-clicking on a table row a context menu appears with the following items:
Figure 73 – Data row management menu
Restore row: allows you to reset a previously deleted row or a row connected to the row
above or below as valid
Delete row: deletes the selected row – deleted rows are not considered in the calculation of
averages and of total values for the test; they are displayed in strikethrough
Delete TCont.: deletes a contact time from the selected row; as a consequence the
associated contact and flight times are added to the flight time in the row above
Delete TFlight: deletes the flight time from the line row; as a consequence associated flight
and contact times are added to the contact time in the row below
Show marked rows: allows you to show/hide deleted rows or rows with deleted flight or
contact time
Change starting foot: allows you to set the right foot or the left foot as starting foot. It is
very useful to use the video to discern with which foot the patient has started. If you do not
have video recordings and you do not remember the foot, specify ‘Undefined’.
Page 91
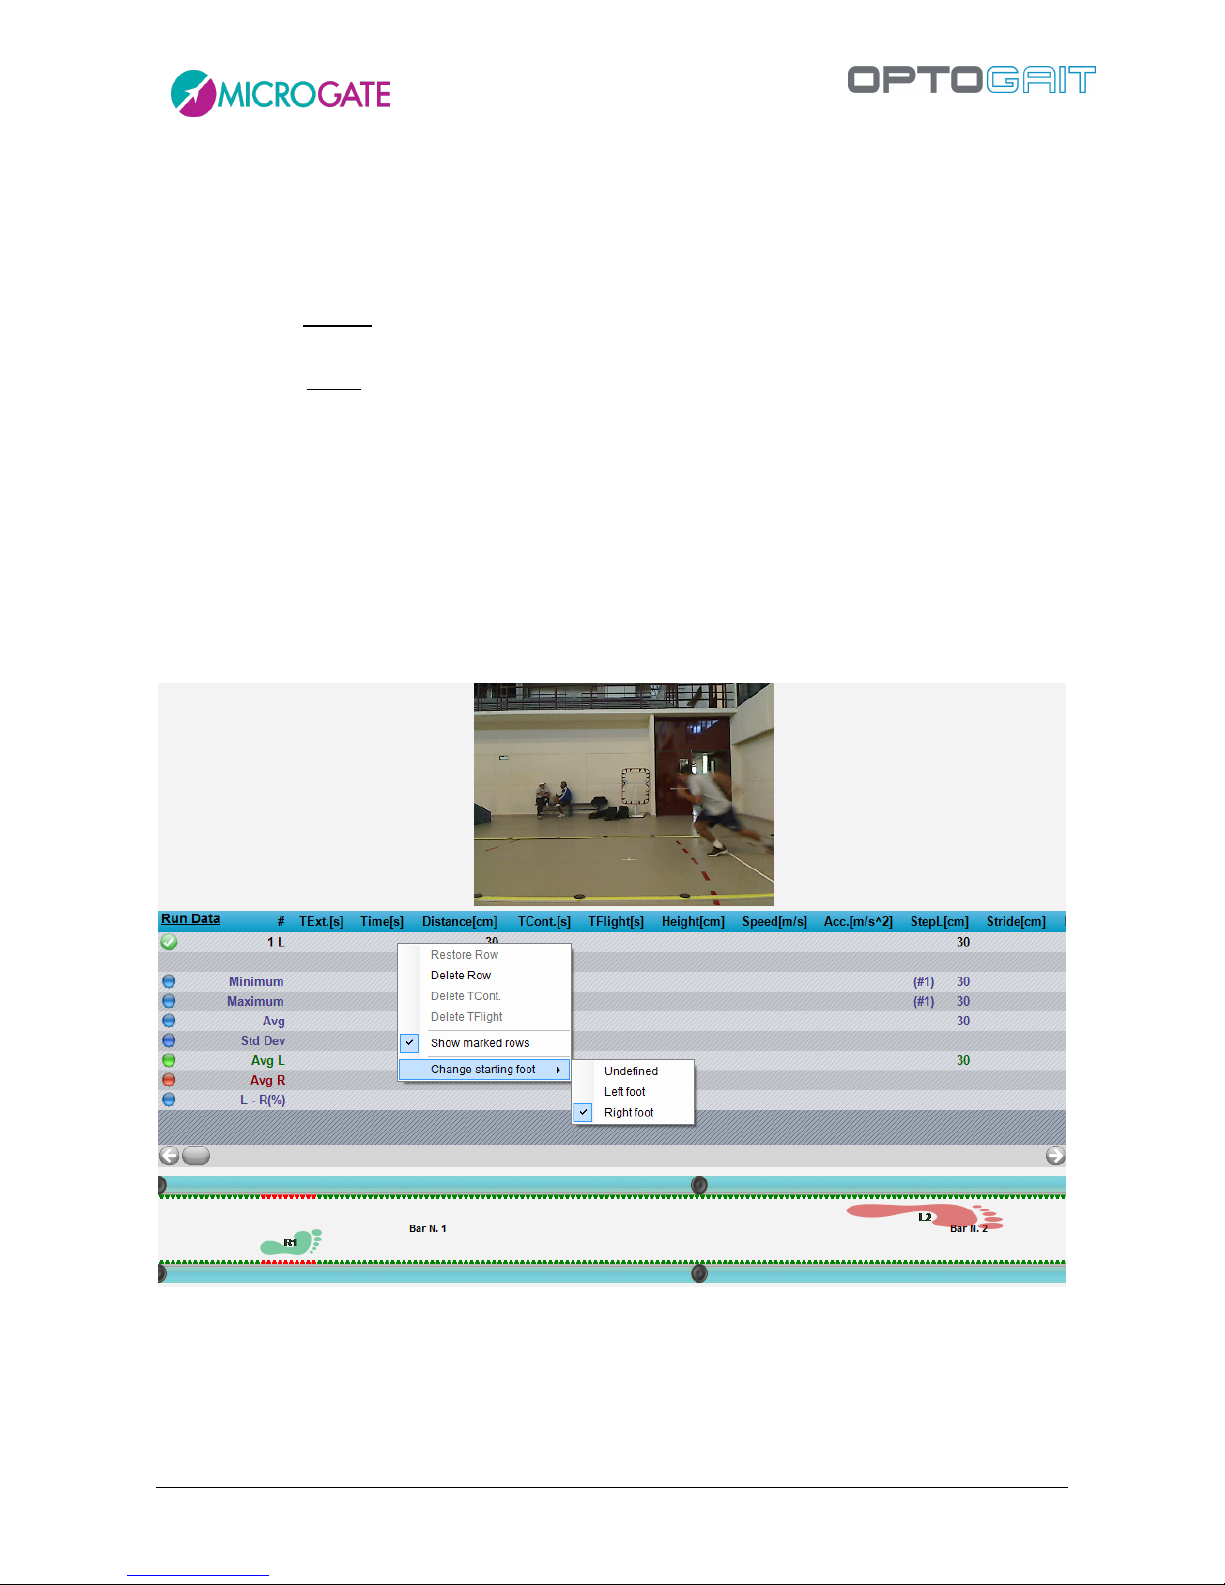
Version 1.9 Page 91 of 170
4.3.1.5 START FOOT
The Starting Foot can be defined during the creation of a test (see 'Define / Modify Test'), or
afterward - keeping it as 'not defined' - during the analysis.
Sprint and Gait Test on modular systems:
- Starting outside the test area: the starting foot is the first one to touch the ground inside the
area;
- Starting inside the test area: the starting foot is the one with the first contact after the
beginning of the test.
Assigning the starting foot after a test has been carried out is done in the 'Results' area. From 'View',
open the 'Configure' menu, select 'First Contact Time' from 'Parameter Research' and, viewing the
first contact time from the 'Data' window, right-click on the relevant line. At this point, select
'Change starting foot' from the displayed menu and make your choice.
E.g. In the following picture the athlete enters the Optojump test area with his RIGHT foot (as you
can see in the video) and then, using the menu, it is possible to assign that foot (confirmed by the
green footprint below).
Figure 74 – Sprint and Gait Test: assigning the starting foot
Should you realize that the assigned starting foot is wrong, just follow the above-stated procedure
and switch the selection.
Treadmill Running Test and Treadmill Gait Test.
In this case the foot touching the ground after the START command is assigned as starting foot.
Page 92
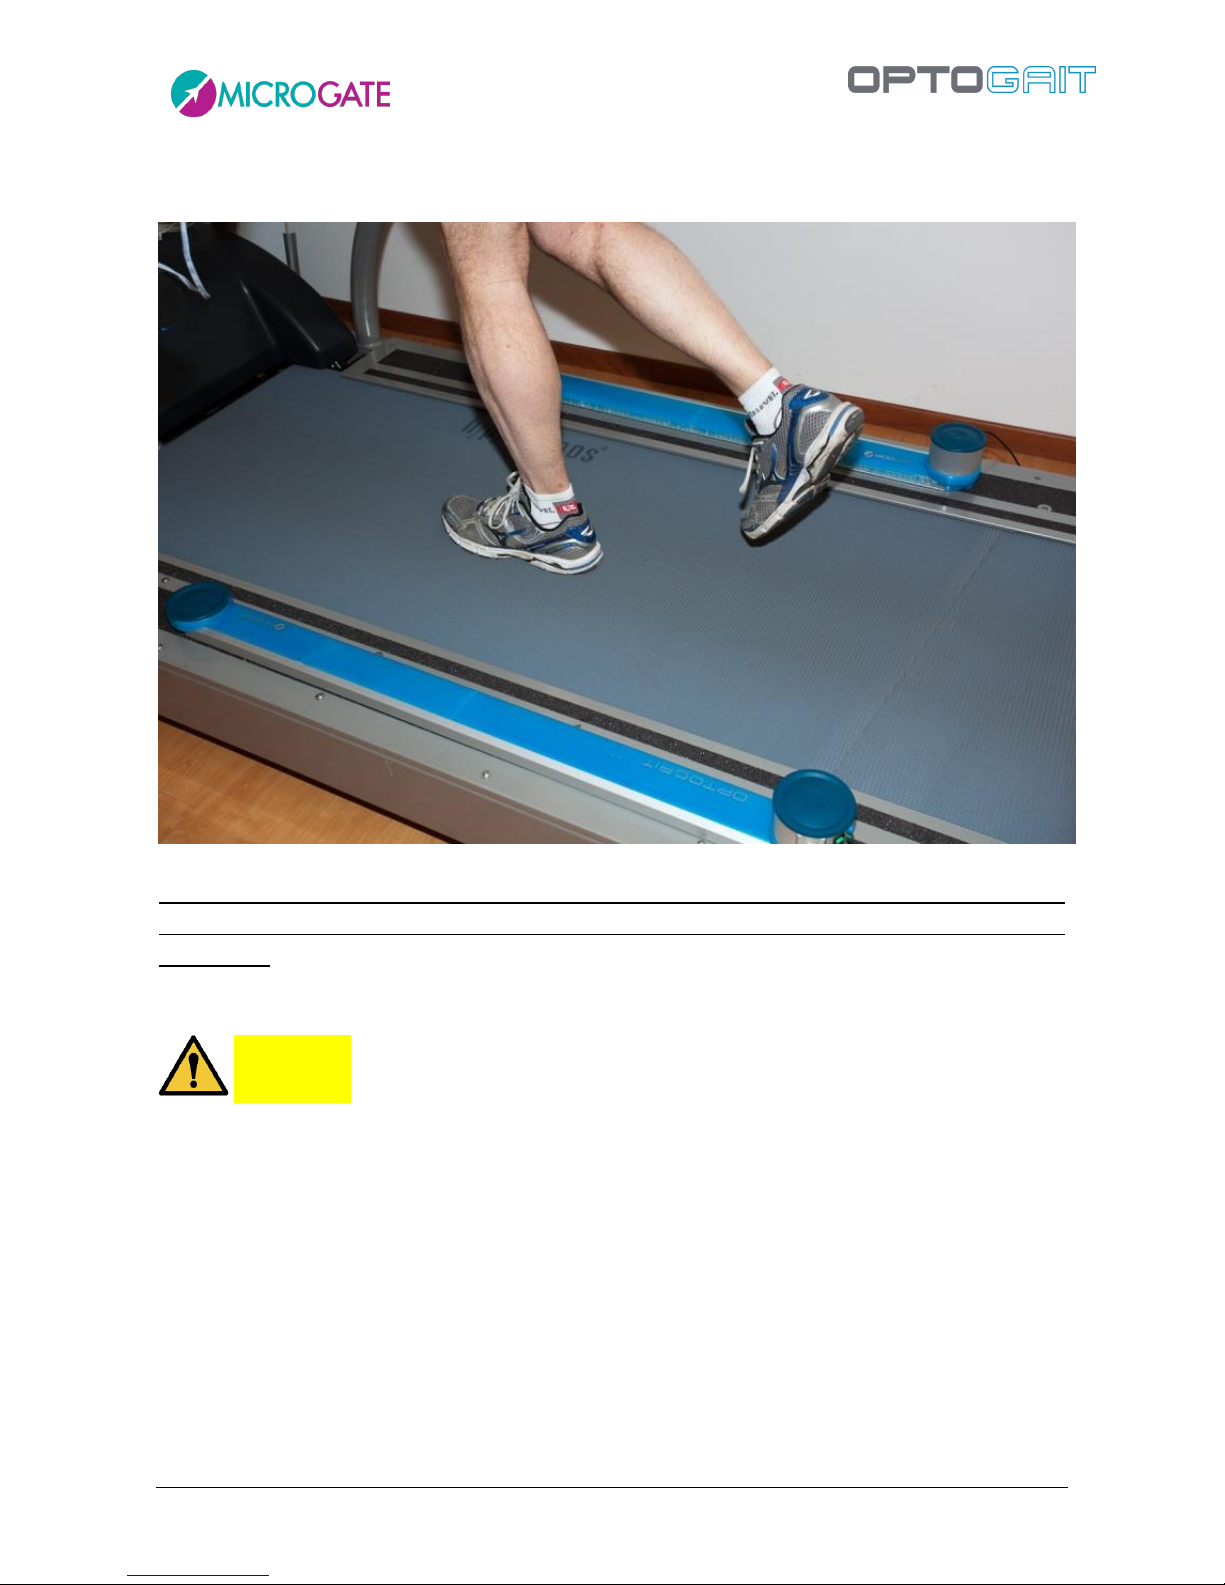
Version 1.9 Page 92 of 170
If the START is assigned during a double support, as occurs quite often in Gait Tests, the starting foot
is the one in front on the Treadmill.
Figure 75 - Defining the starting foot = right foot, pressing START at this moment
Assigning the starting foot before the test is of utmost importance when using OptoGait together
with a surface electromyography, in which case, the EMG software needs to know the starting foot
beforehand.
CAUTION
See chap. 1.5 for correct positioning of the bars on the treadmill.
Page 93
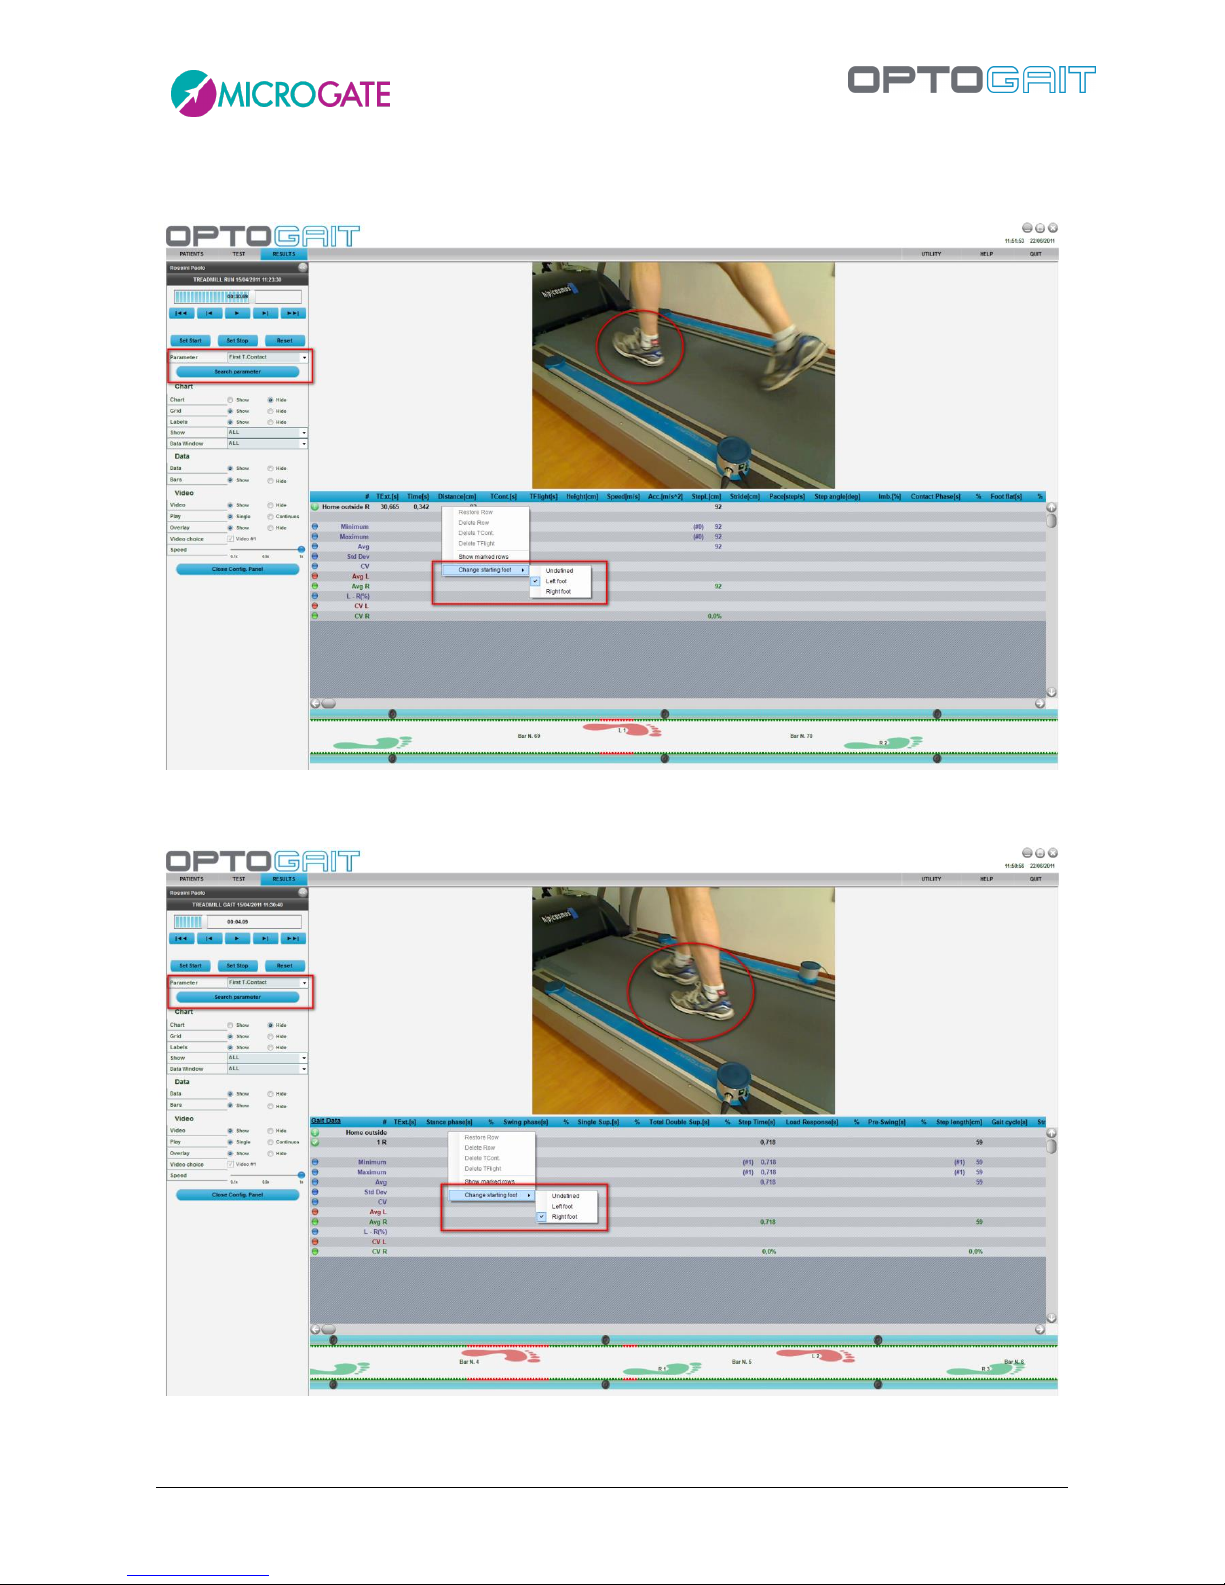
Version 1.9 Page 93 of 170
Of course it is possible to do this afterwards using the same method described above for the Sprint
and Gait Tests on modular systems (even as regards possible foot assigning errors).
Figure 76 - Treadmill Running Test: assigning the starting foot
Figure 77 - Treadmill Gait Test: assigning the starting foot (double support)
Page 94
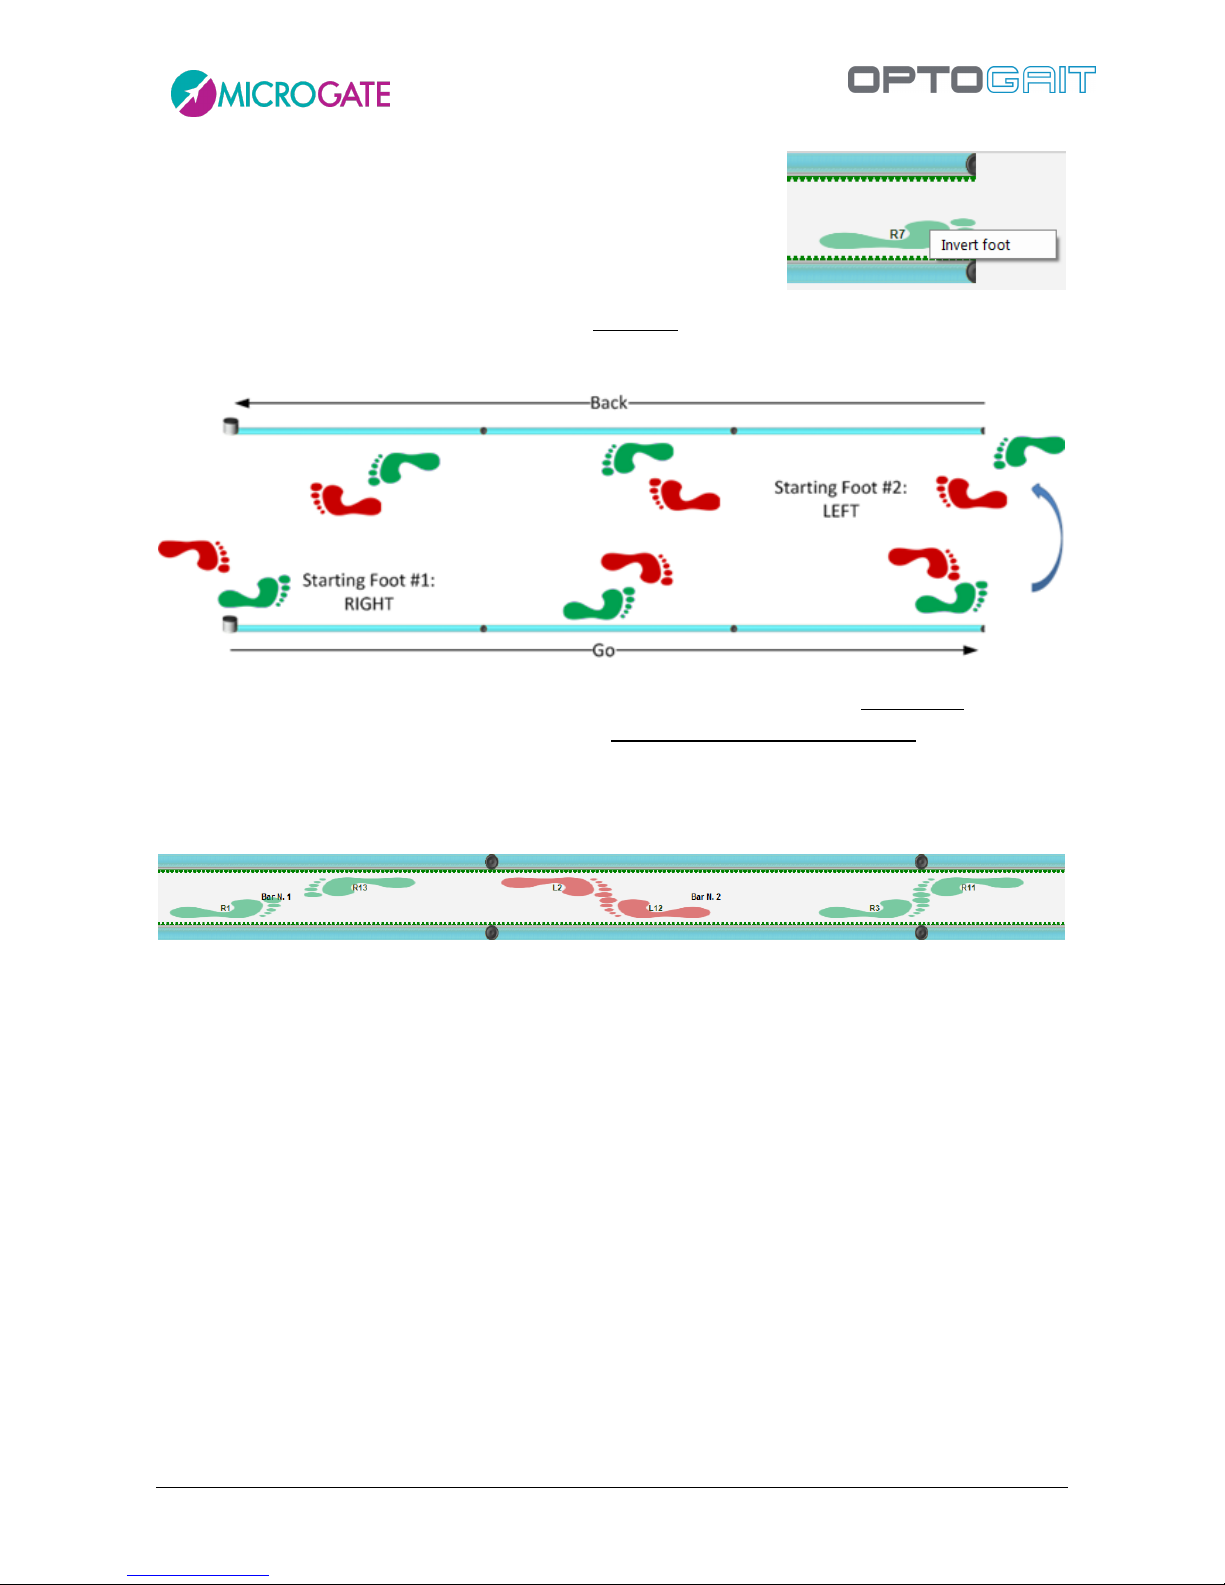
Version 1.9 Page 94 of 170
The starting foot of run and gait tests with modular systems can
be change several times. In a round-trip test, for example, it can
be useful to change the foot with which the athlete has entered
the area after having changed direction. By positioning the mouse
on the footprint to be changed and pressing the right button
'Invert foot' is viewed. Choosing this option, all following feet of the chosen foot are changed (e.g.
clicking on the footprint #7, the 7,8,9, etc. are inverted.).
In the round-trip used in modular systems, assigning a maximum flight time lower than the time it
takes the athlete to turn around in the test area, the ‘there’ footprints are deleted and substituted
with the ‘back’ footprints. Therefore, set the maximum flight time based upon one's needs (i.e. if
the ‘there’ and ‘back’ footprints are to be left superposed as shown in the figure, or the previous
ones deleted).
Figure 78 - There’ and ‘Back’ footprints
Page 95
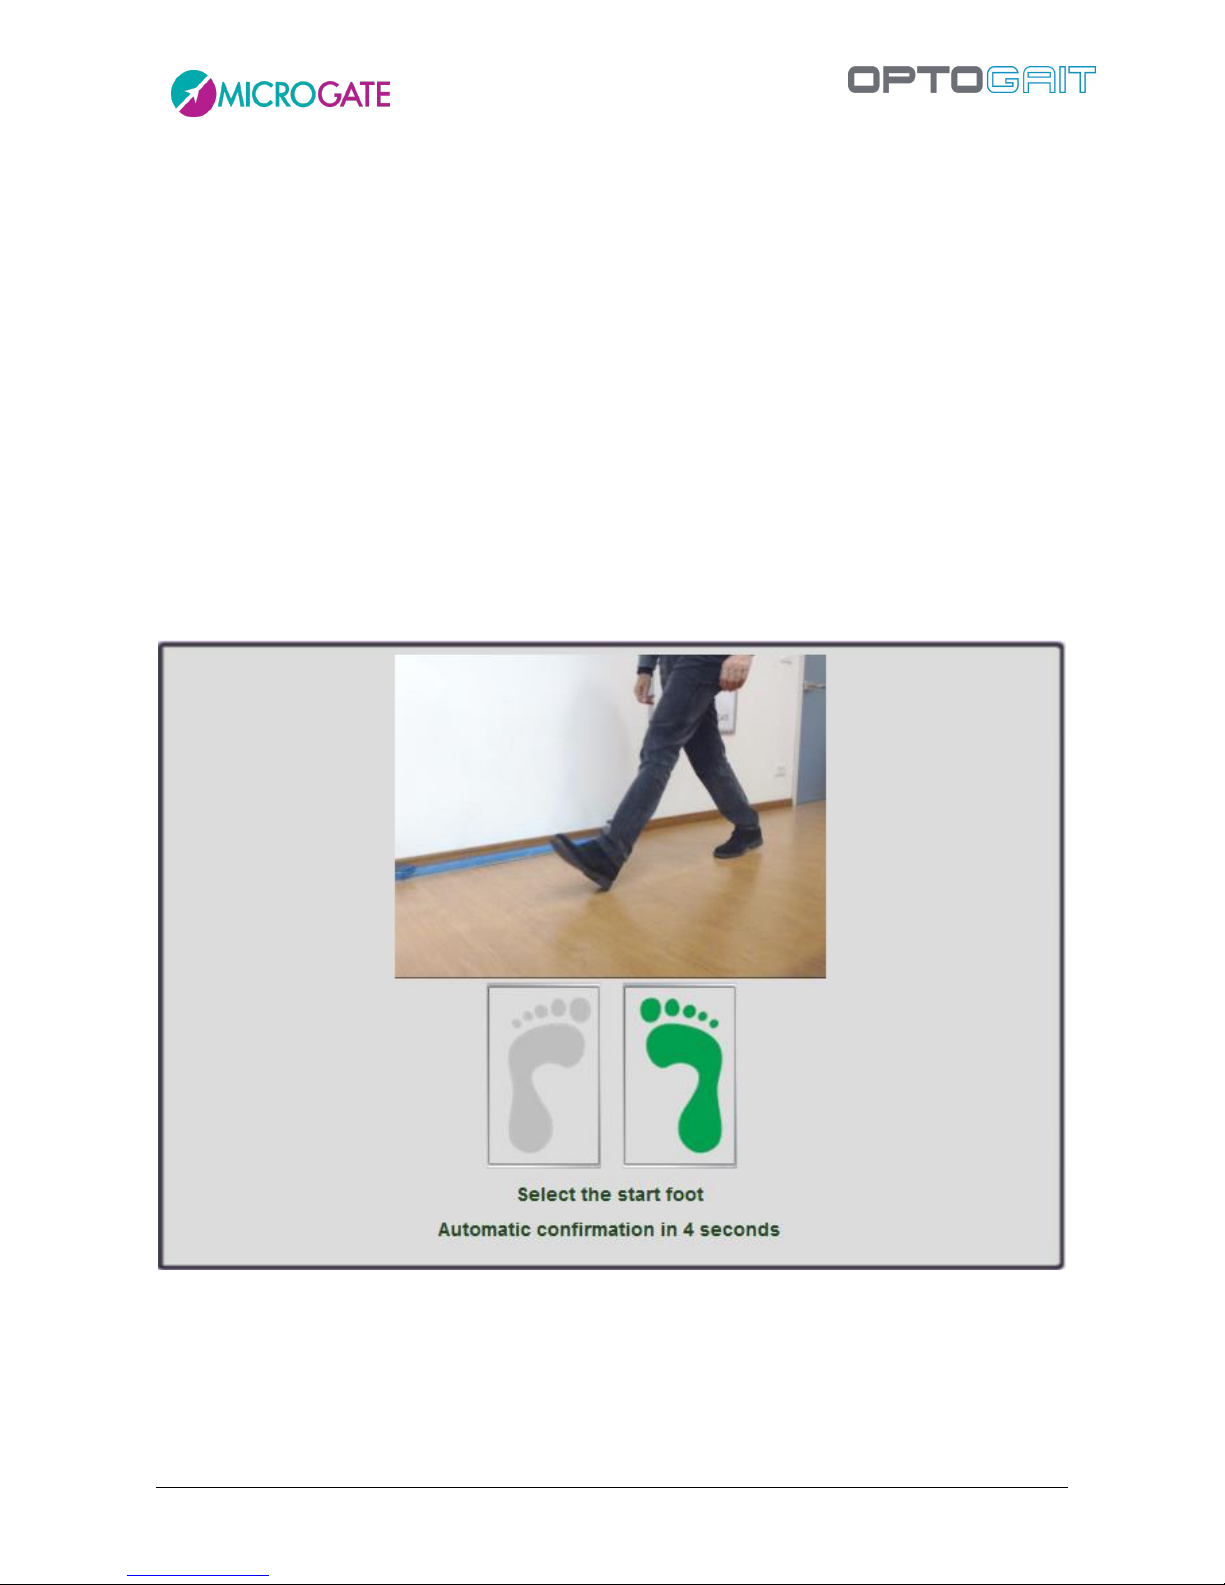
Version 1.9 Page 95 of 170
4.3.1.6 VIDEO PREVIEW POPUP: FIRST STEP PREVIEW
While in the new '2D Gait' test the starting foot recognition (first step) is automatic, in other test
types, such as Sprint and Gait (run and gait on linear systems), treadmill gait and treadmill running,
the operator must decide which foot is the one that began the test.
In order to help the user in this operation, which is sometimes difficult because the patient is far
away, a new feature called 'video preview popup' has been added, displaying a popup window for N
seconds (you can set N as you like), where the first frame of the trial is viewed, allowing the operator
to understand if the entering foot is the one specified or if it is the opposite foot.
During these N seconds, by watching the preview of the two webcams it is possible to confirm or
change the foot of the first step simply clicking on the right or left foot icon (or wait until the popup
closes automatically confirming the choice).
In the example below, the patient enters with the left foot, whereas the test was set differently (or
could have been set as 'undefined'). Clicking on the red icon of the left foot, the setting is
immediately inverted, therefore it does not need to be done afterwards from the Results Module.
Page 96
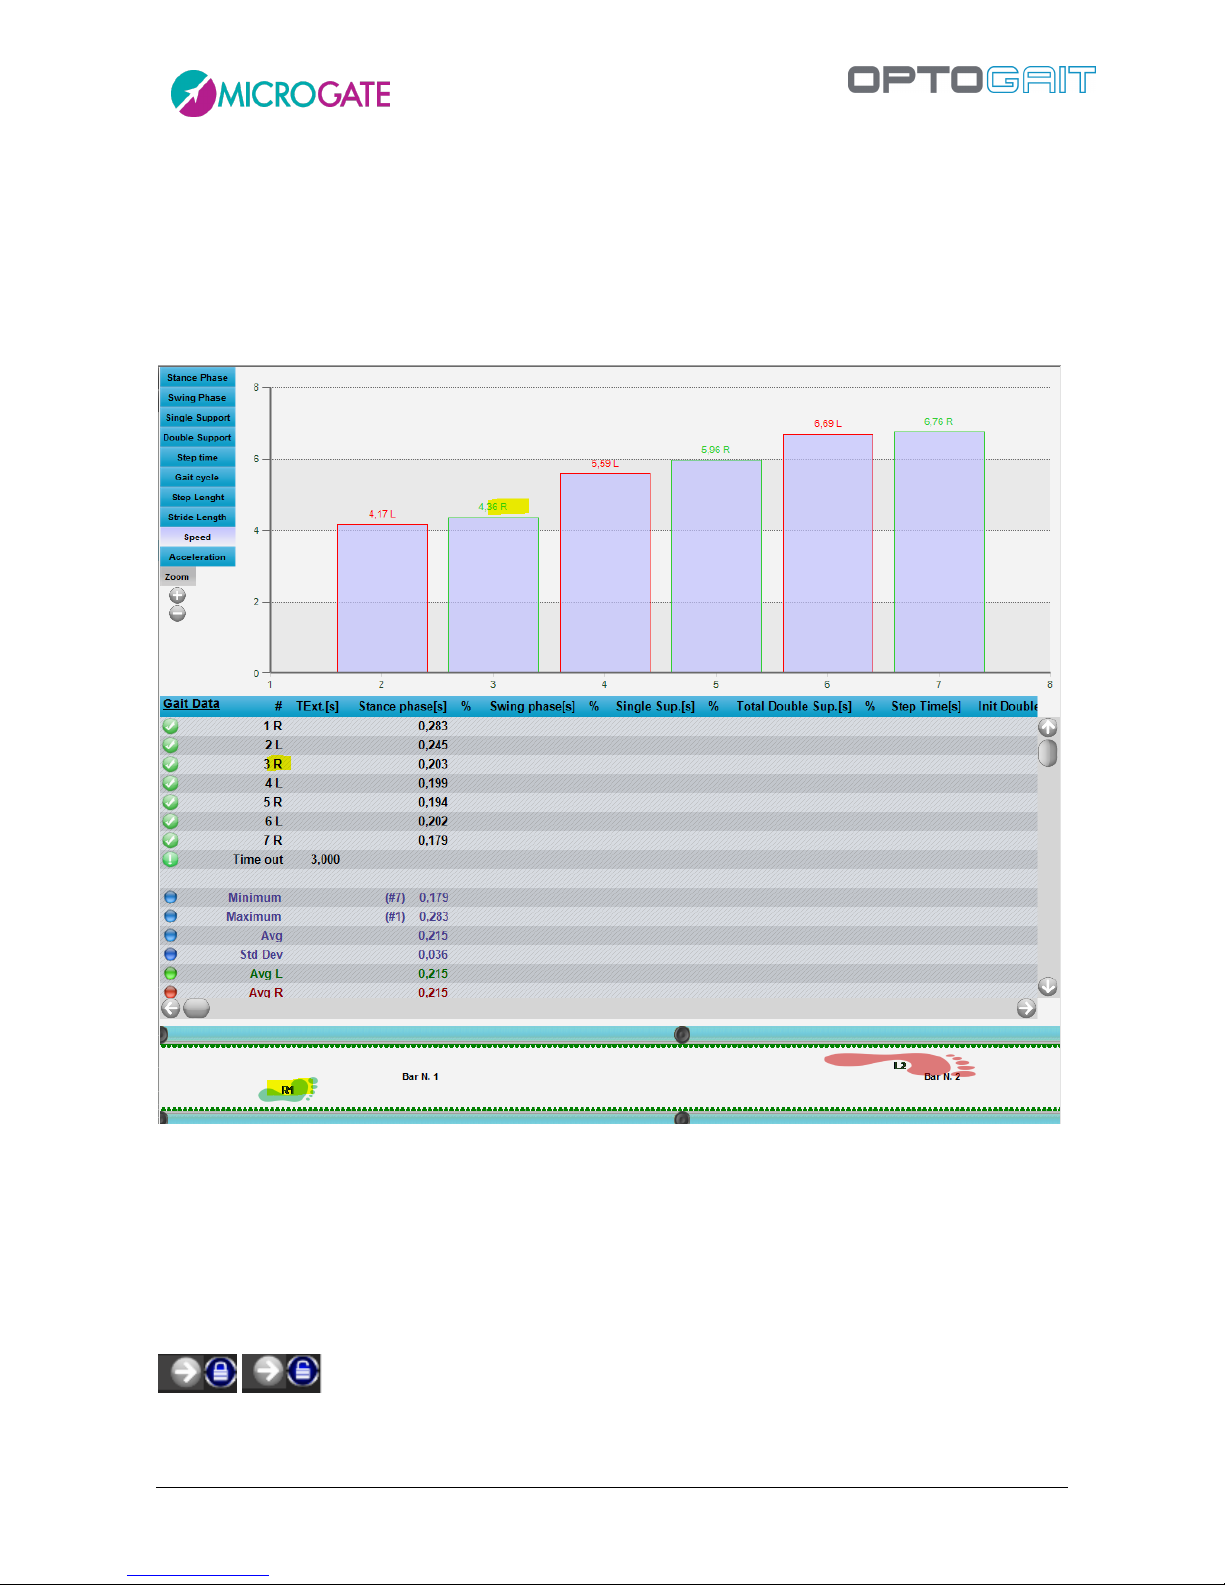
Version 1.9 Page 96 of 170
4.3.1.7 VIEWING OF THE OPTOGAIT BARS
The OptoGait bars allow you to view afterwards the LEDs that have been interrupted (in red) and, if
a starting foot has been set, to view the footfall thanks to the graphical footprints. The footprint
length is directly proportional to the number of interrupted LEDs.
Similarly, the labels of the numerical data chart and row values always display which foot they are
referring to.
Figure 79 – Indicating the foot on charts, tables and bars
When watching a run/gait video of a modular system composed of many meters, as the time
progresses, the bars scroll in synchronization with the video and the charts, allowing the user to
follow the LEDs interrupted during the test.
Bar scrolling can be disabled by clicking on the lock icon in the bottom right corner. The button has
a toggle function, so when clicked scrolling is enabled again.
From this view, a 'Measuring Ruler' can been used to see how many centimetres (or inches) there
are between a series of lit LEDs (or between two points). Double-click on the first LED and then on
Page 97
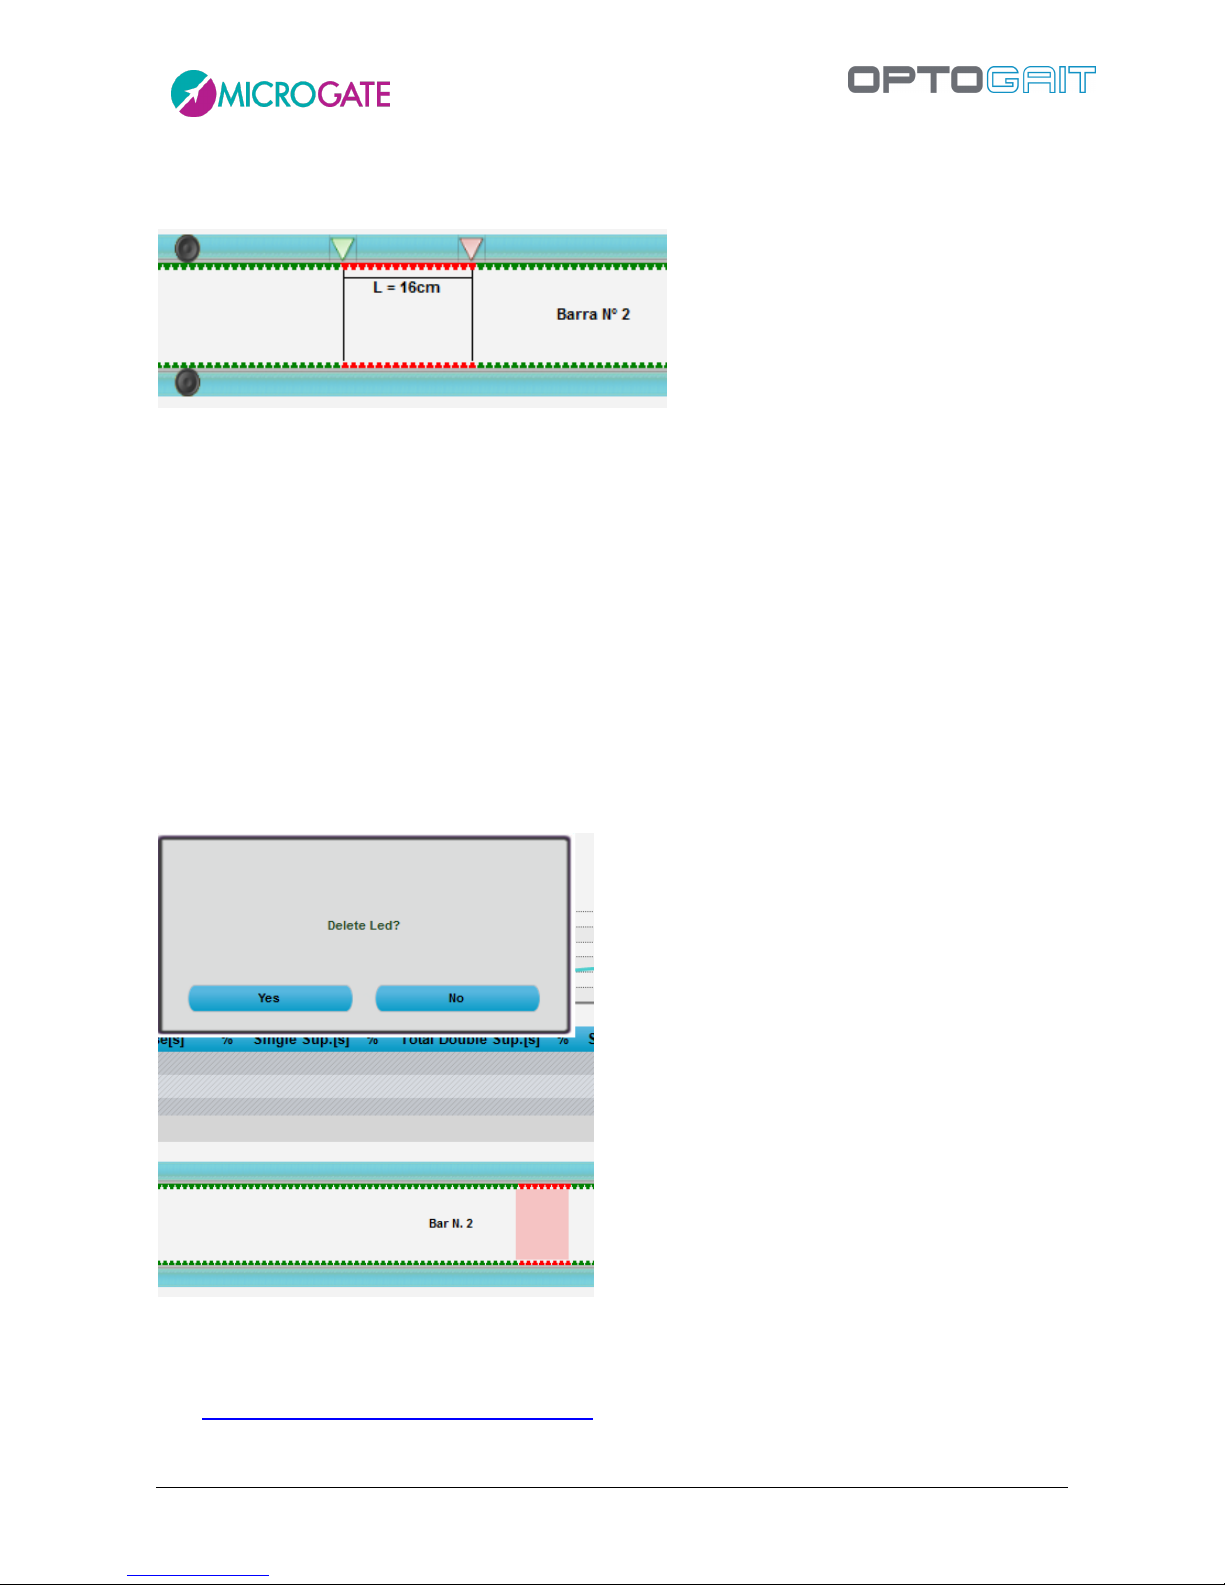
Version 1.9 Page 97 of 170
the second LED to view the measure (the markers are green and red for the first and second point).
Click anywhere on the bars and ESC to delete the measure.
Figure 80 - Measure in cm or inches of the distance between two points
In this view you can also temporarily delete a series of LEDs for a certain period of time. Unlike the
command <LED Filter> (see chap. 4.4.2), which excludes a series of LEDs for the entire test, this
allows you to also work during the test analysis and exclude a series of contiguous LEDs (or one
single LED) for a certain number of thousandths of seconds. Let us suppose, for example, that during
a treadmill gait test you realise that the patient has shuffled his/her foot by mistake and you want
to delete that series of LEDs for those 2 seconds: press and hold the CTRL key, click on the first
incorrect LED and (without releasing the CTRL key and the mouse button) drag the selection as far
as the second LED in your segment (a red-coloured area will indicate the part to be cancelled).
Confirm by pressing YES when prompted, if you want to delete the LEDs, and indicate the number
of thousandths of seconds for which the change is to be applied (in this example 2000), and the
numeric data table will be displayed. If you want to save the data, press <OK> in the upper left
corner. Otherwise, press <CANCEL>.
Figure 81 – Deleting LEDs for a certain amount of time
If you want to delete the whole series of LEDs (a complete footprint) for the entire test, press
CTRL+right mouse click on any red LED of the footprint and then confirm the deletion by pressing
YES. See also this article of our Knowledge Base for all the operations available in this view.
Page 98
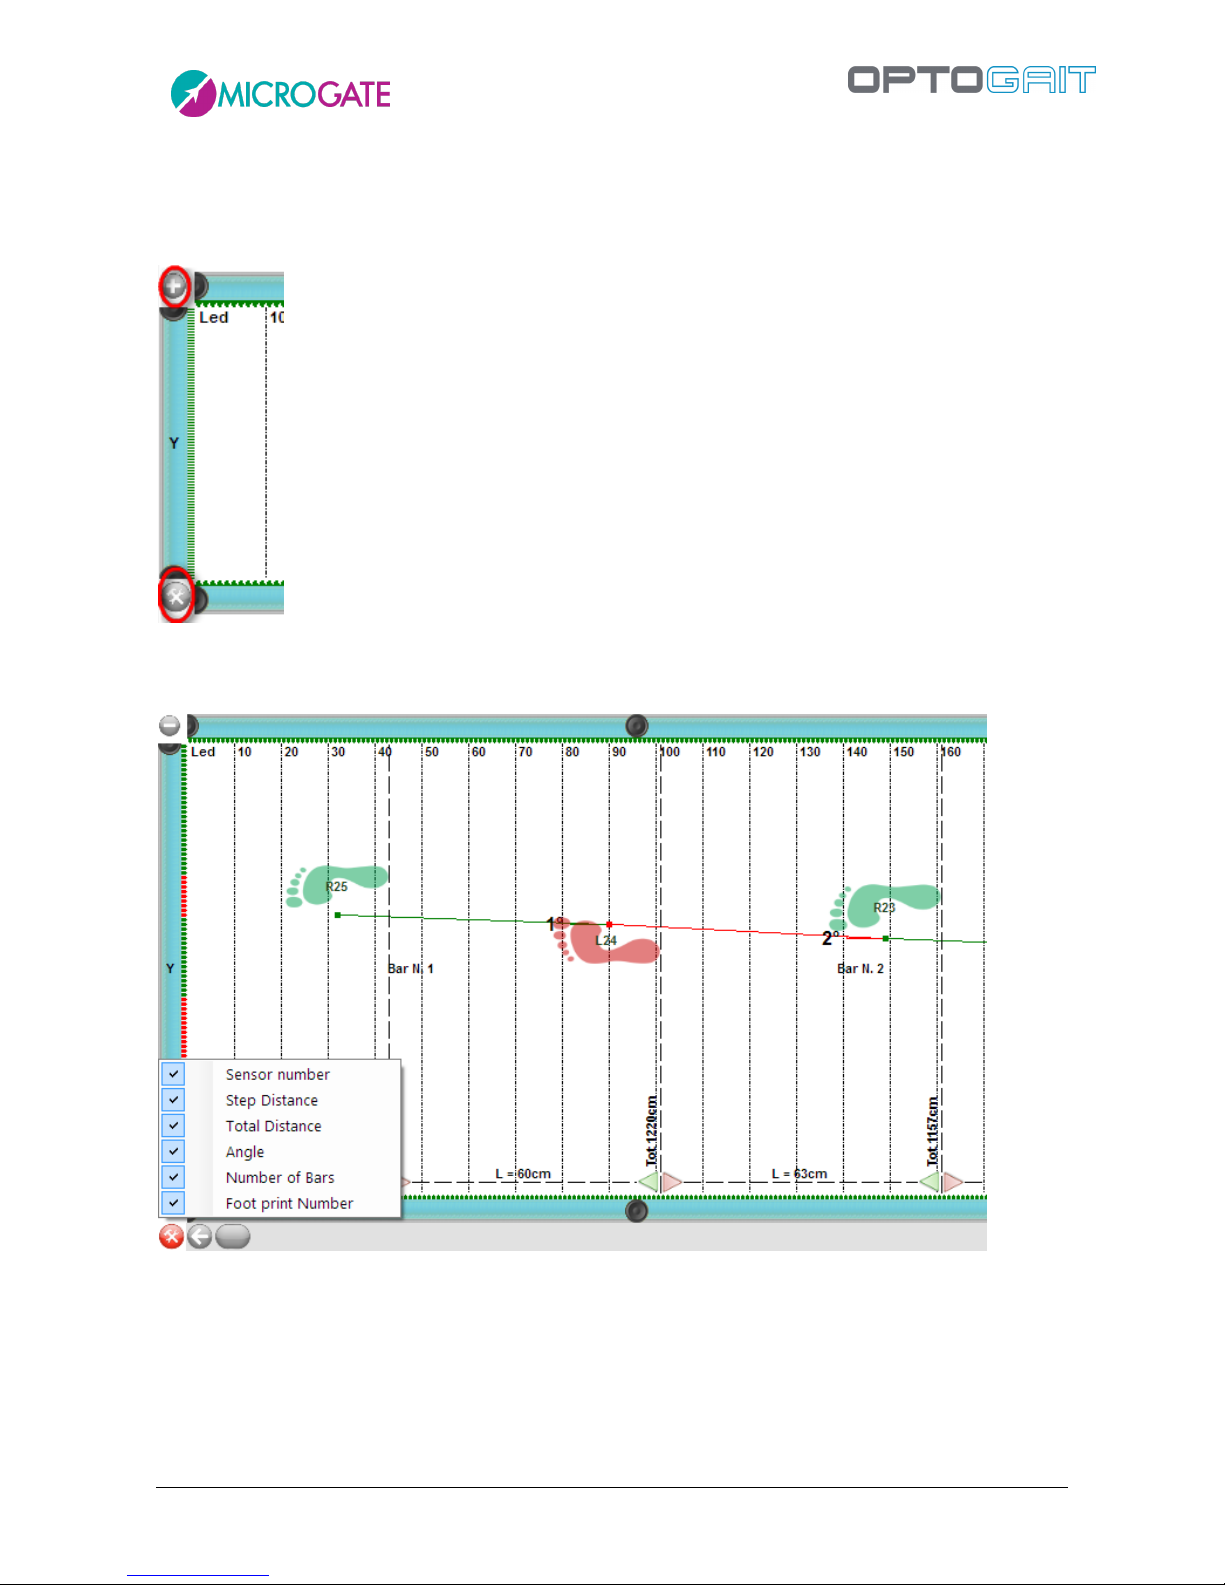
Version 1.9 Page 98 of 170
Zoom and Config Buttons on the Bars
Clicking on the "+" icon at the beginning of the displayed bars, the latter can be zoomed. Click on
the "-" icon to go back to normal view.
Using the Configure Bars button (useful mainly for run or gait tests) the information to be displayed
can be set. Partial and progressive distances between one step and another have been added.
Page 99
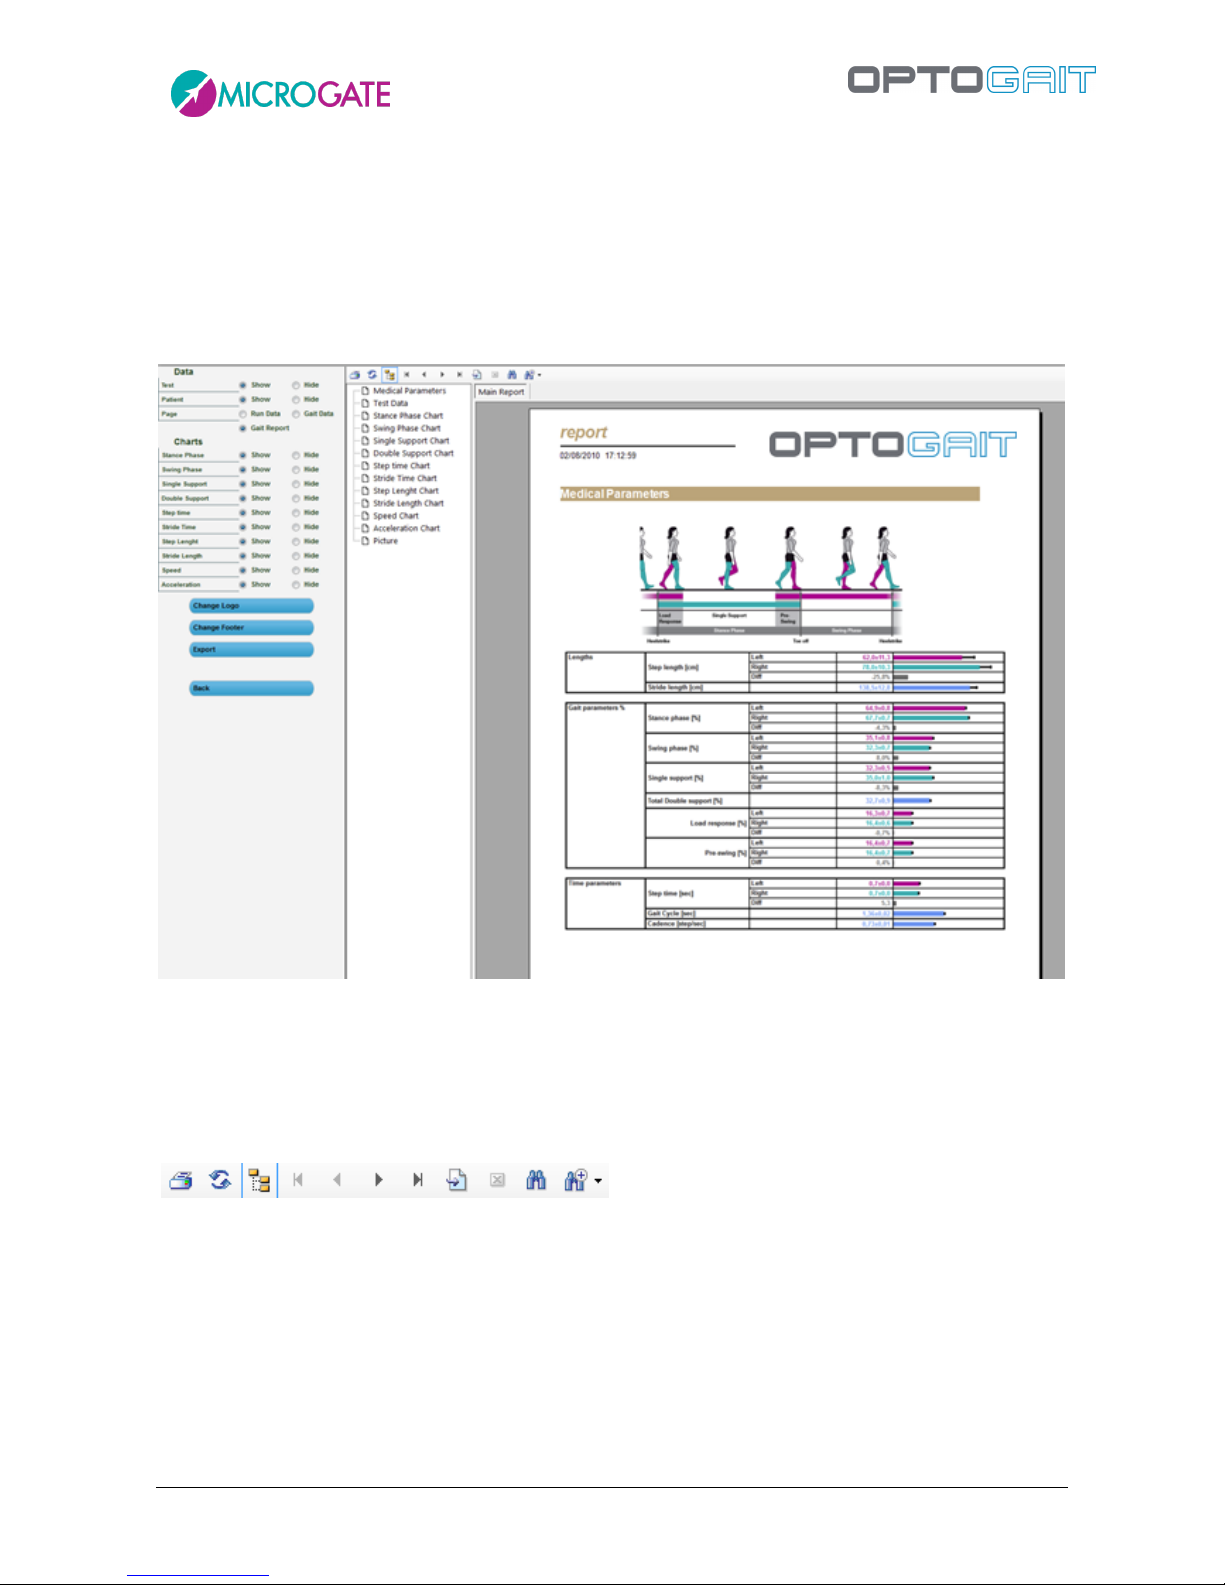
Version 1.9 Page 99 of 170
4.3.1.8 PRINT
When <Print> is pressed, a multi-page report is printed with the patient’s data, summarizing
(average) test data, numerical test data (times, heights, power, etc.) and all the charts of the
previous window.
A box containing the index with the pages allows you (by clicking on each page) to rapidly select the
desired section.
Figure 82 – Report Print
The radio buttons on the left allow you to show or hide particular sections of the report for both
Data and Charts. Press <Apply> after changing any of the parameters to view the changes to the
report.
The command toolbar above the report allows you to perform the following operations:
Figure 83 – Print Report Command Toolbar
Print the report on the printer set in the dialog box
Refresh the data
Show/Hide the page index
Go to first page
Go to previous page
Go to next page
Go to last page
Page 100
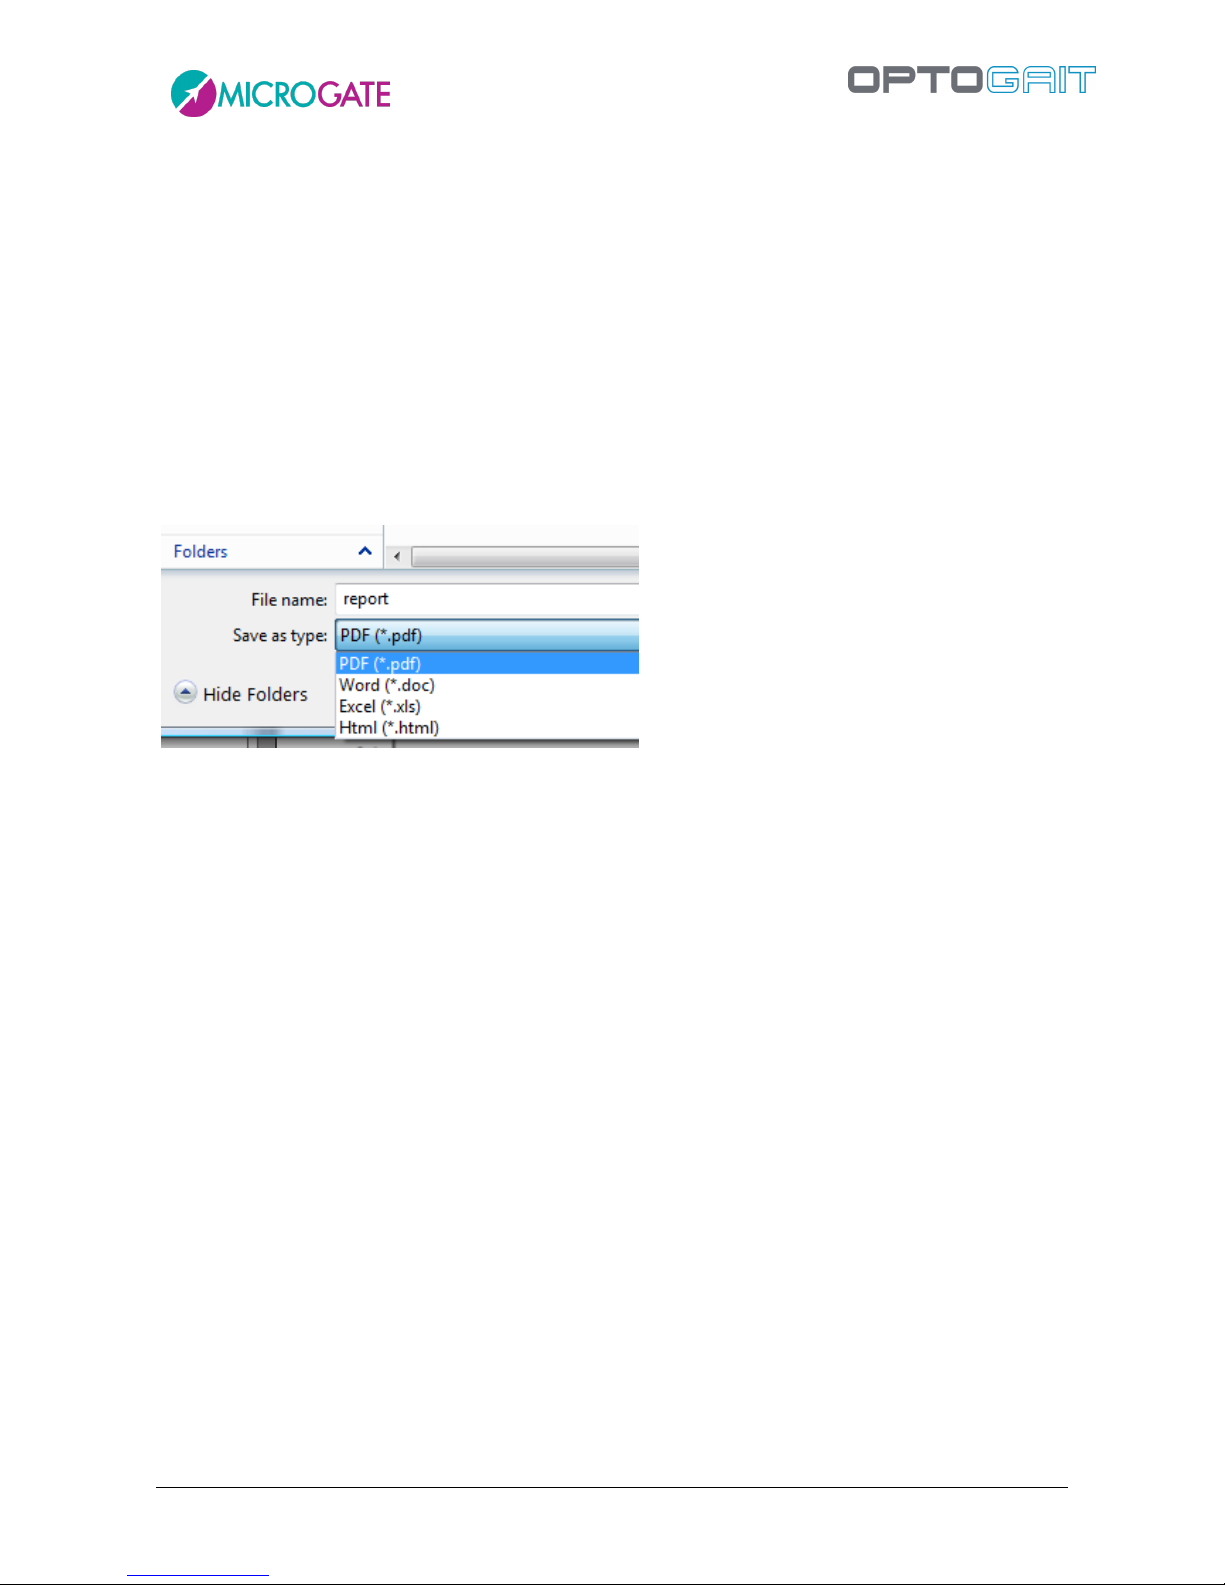
Version 1.9 Page 100 of 170
Go to page No.
Close the report
Search
Zoom
The buttons <Change logo> and <Change footer> allow you to customize the report adding your
logo and your personal data (respectively printed in the top right corner and on the bottom line).
Press <Export> on the left to export the report in PDF, Excel, Word or Html format.
Choose the desired format from the drop-down menu, select the position, name the file, and press
‘Save’.
Figure 84 – Dialog box for saving a report
The functionality of Report creation, printing and saving are offered by the external Crystal Report
component. If this does not work correctly, we advise you to check whether you have installed
different versions or editions of this software. If you have, uninstall the old versions and re-install
the OptoGait packet.
4.3.1.9 SAVE ANALYSIS
This function allows you to give the current settings configuration a mnemonic name, so that it can
be recalled from the list of saved analyses for future use.
4.3.1.10 ANALYSIS NOTES
This function allows you to add a note, which will be saved with the analysis. This note (DIFFERENT
from a note added immediately after completing the test) will be printed on the bottom line of the
report in the provided section, whereas the ‘test note’ is printed on the first page with the General
Data. Warning: the analysis note is saved with the analysis; by not storing it you will lose it.
4.3.1.11 SIGNATURE
The signature works in a way similar to the notes (e.g. ‘Mario Rossi, orthopedic specialist’). The
signature is printed on the bottom line of the report and saved with the analysis.
4.3.1.12 PARAMETERS
 Loading...