

Page 1

PICkit™ 3
Programmer/Debugger
User’s Guide
© 2009 Microchip Technology Inc. DS51795A
Page 2

Note the following details of the code protection feature on Microchip devices:
• Microchip products meet the specification contained in their particular Microchip Data Sheet.
• Microchip believes that its family of products is one of the most secure families of its kind on the market today, when used in the
intended manner and under normal conditions.
• There are dishonest and possibly illegal methods used to breach the code protection feature. All of these methods, to our
knowledge, require using the Microchip products in a manner outside the operating specifications contained in Microchip’s Data
Sheets. Most likely, the person doing so is engaged in theft of intellectual property.
• Microchip is willing to work with the customer who is concerned about the integrity of their code.
• Neither Microchip nor any other semiconductor manufacturer can guarantee the security of their code. Code protection does not
mean that we are guaranteeing the product as “unbreakable.”
Code protection is constantly evolving. We at Microchip are committed to continuously improving the code protection features of our
products. Attempts to break Microchip’s code protection feature may be a violation of the Digital Millennium Copyright Act. If such acts
allow unauthorized access to your software or other copyrighted work, you may have a right to sue for relief under that Act.
Information contained in this publication regarding device
applications and t he lik e is provided only for your convenience
and may be su perseded by upda t es . It is y our responsibility to
ensure that your application meets with your specifications.
MICROCHIP MAKES NO REPRESENTATIONS OR
WARRANTIES OF ANY KIND WHETHER EXPRESS OR
IMPLIED, WRITTEN OR ORAL, STATUTORY OR
OTHERWISE, RELATED TO THE INFORMATION,
INCLUDING BUT NOT LIMITED TO ITS CONDITION,
QUALITY, PERFORMANCE, MERCHANTABILITY OR
FITNESS FOR PURPOSE. Microchip disclaims all liability
arising from this information and its use. Use of Microchip
devices in life supp ort and/or safety ap plications is entir ely at
the buyer’s risk, and the buyer agrees to defend, indemnify and
hold harmless M icrochip from any and all dama ges, claims,
suits, or expenses re sulting from such use. No licens es are
conveyed, implicitly or otherwise, under any Microchip
intellectual property rights.
Trademarks
The Microchip name and logo, the Microchip logo, Accuron,
dsPIC, K
EELOQ, KEELOQ logo, MPLAB, PIC, PICmicro,
PICSTART, rfPIC, SmartShunt and UNI/O are registered
trademarks of Microchip Tec hnology Incorporated in the
U.S.A. and other countries.
FilterLab, Linear Active Thermistor, MXDEV, MXLAB,
SEEVAL, SmartSensor and The Embedded Control Solutions
Company are registered trademarks of Microchip Technology
Incorporated in the U.S.A.
Analog-for-the-Digital Age, Application Maestro, CodeGuard,
dsPICDEM, dsPICDEM.net, dsPICworks, dsSPEAK, ECAN,
ECONOMONITOR, FanSense, In-Circuit Serial
Programmin g , IC SP, ICE P I C , M in d i , MiWi, MPASM, MPLAB
Certified logo, MPLIB, MPLINK, mTouch, PICkit, PICDEM,
PICDEM.net, PICtail, PIC
32
logo, PowerCal, PowerInfo,
PowerMate, PowerT ool, REAL ICE, rfLAB, Select Mode, Total
Endurance, WiperLock and ZENA are trademarks of
Microchip Technology In corporated in the U.S.A. and other
countries.
SQTP is a service mark of Microchip Technology Incorporated
in the U.S.A.
All other trademarks mentioned herein are property of their
respective companies.
© 2009, Microchip Technology Incorporated, Printed in the
U.S.A., All Rights Reserved.
Printed on recycled paper.
Microchip received ISO/TS-16949:2002 certification for its worldwide
headquarters, design and wafer fabrication facilities in Chandler and
Tempe, Arizona; Gresham, Oregon and design centers in California
and India. The Company’s quality system processes and procedures
are for its PIC
devices, Serial EEPROMs, microperipherals, nonvolatile memory and
analog products. In addition, Microchip’s quality system for the design
and manufacture of development systems is ISO 9001:2000 certified.
®
MCUs and dsPIC® DSCs, KEELOQ
®
code hopping
DS51795A-page ii © 2009 Microchip Technology Inc.
Page 3

PICkit™ 3 USER’S GUIDE
Table of Contents
Preface ........................................................................................................................... 1
Chapter 1. Overview
1.1 Introduction .....................................................................................................9
1.2 PICkit 3 Programmer/Debugger Defined ........................................................ 9
1.3 How the PICkit 3 Programmer/Debugger Helps You ...................................11
1.4 PICkit 3 Programmer/Debugger Components ..............................................12
1.5 Device and Feature Support ..................... ...................................................13
Chapter 2. Theory of Operation
2.1 Introduction ...................................................................................................15
2.2 PICkit 3 vs. PICkit 2 .... .. ................................................................................ 15
2.3 Debugger to Target Communication ............................................................15
2.4 Communication Connections .......................................................................17
2.5 Debugging ................................................. ...................................................19
2.6 Requirements for Debugging .......................................................................20
2.7 Programm in g ............................... ................................................................. 22
2.8 Resources Used by the Debugger ...............................................................22
Chapter 3. Installation
3.1 Introduction ...................................................................................................23
3.2 Installing the Software .................................................................................. 23
3.3 Connecti n g the T a rg e t ............................................ ...................................... 23
3.4 Setting Up the Target Board ......................................................................... 24
3.5 Setting Up MPLAB IDE ................................................................................ 25
Chapter 4. General Setup
4.1 Introduction ...................................................................................................27
4.2 Starting the MPLAB IDE Software ................................................................ 27
4.3 Creating a Project ......................................................................................... 27
4.4 Viewing the Pr o je c t ......... ..................................................................... ......... 28
4.5 Building the Pr o je c t ............... .................................................................... ... 28
4.6 Setting Con figuration Bits ........ ............. .. ... .......................... .. ... ............. .. .. ... 28
4.7 Setting the Debugger or Programmer ..................... ...................... ...............28
4.8 Debugger/Programmer Limitations ..............................................................29
Chapter 5. PICkit 3 Debug Express
5.1 Introduction ...................................................................................................31
5.2 PICkit 3 Debug Expr e s s K it Contents .......... .......................... ... .. ............. .. ... 31
5.3 Installing the Hardware and Software ........................................................ ..31
© 2009 Microchip Technology Inc. DS51795A-page iii
Page 4

PICkit™ 3 User’s Guide
Chapter 6. Troubleshooting First Steps
6.1 Introduction ................................................................... ................................35
6.2 The 5 Questi o ns to A nsw e r First ................ .................................................. 35
6.3 Top 10 Reasons Why You Can’t Debug ...................................................... 35
6.4 Other Thing s to Con s id e r ............ ................................................................. 36
Chapter 7. Frequently Asked Questions (FAQs)
7.1 Introduction ................................................................... ................................37
7.2 How Does It Work ........................................................................................ 37
7.3 What’s Wrong ............................................................................................... 38
Chapter 8. Error Messages
8.1 Introduction ................................................................... ................................41
8.2 Specific Error Messages ..............................................................................41
8.3 General Co rr e ct iv e Ac t io n s .. ................ ........................................................ 44
Chapter 9. Debugger Function Summary
9.1 Introduction ................................................................... ................................49
9.2 Debugging Functions ................................................................................... 49
9.3 Debugging Dialogs/Windows .......................................................................51
9.4 Programm in g Fun c tions ..... .. ....................................................... ................. 55
9.5 Settings Dia lo g ............................................................................................. 56
Chapter 10. Hardware Specification
10.1 Introd uc t io n ..... ............................................................................................ 5 9
10.2 Highlig h t s .... ................................................................................................ 59
10.3 Declar a tion of Conform ity ......................................... .. .. ........................... .. . 59
10.4 USB Por t/Power ...... .. ........................................ .. .. .............. .. .. ............. ... .. . 60
10.5 PICkit 3 Programmer/Debugger ............................................................ ..... 60
10.6 Standard Communication Hardware ..........................................................61
10.7 Target Board Considerations ..................................................................... 63
Appendix A. PICkit 3 Schematics
Appendix B. Operational Advisory
Glossary .......................................................................................................................71
Index .............................................................................................................................91
Worldwide Sales and Service .....................................................................................94
DS51795A-page iv © 2009 Microchip Technology Inc.
Page 5

PICkit™ 3
USER’S GUIDE
Preface
NOTICE TO CUSTOMERS
All documentation becomes dated, and this manual is no exception. Microchip tools and
documentation are constantly evolving to meet customer needs, so some actual dialogs
and/or tool descriptions may differ from those in this document. Please refer to our web site
(www.microchip.com) to obtain the latest documentation available.
Documents are identified with a “DS” number. This number is located on the bottom of each
page, in front of the p age number. The numbering convention for the DS number is
“DSXXXXXA”, where “XXXXX” is the document number and “A” is the revision level of the
document.
For the most up-to-date information on development tools, see the MPLAB
Select the Help menu, and then Topics to open a list of available on-line help files.
®
IDE on-line help.
INTRODUCTION
This chapter contains general information that will be useful to know before using
PICkit™ 3 programmer/debugger. Items discussed include:
• Document Layout
• Conventions Used in this Guide
• Warranty Registration
• Recommended Reading
• The Microchip Web Site
• Development Systems Customer Change Notification Service
• Customer Support
© 2009 Microchip Technology Inc. DS51795A-page 1
Page 6

PICkit™ 3 User’s Guide
DOCUMENT LAYOUT
This document describes how to use the PICkit 2as a development tool to emulate and
debug firmware on a target board. The manual layout is as follows:
• Chapter 1. Overvi ew – An overview of the PICkit 3 programmer/debugger.
• Chapter 2. Theory of Operation – A simplified description of how the PICkit 3
programmer/debugger works .
• Chapter 3. Ins tallation – How to install the PICkit 3 programmer/debugger.
• Chapter 4. General Setup – Provides Instructions on how to get started using the
PICkit 3 programmer/debugger to program supported devices.
• Chapter 5. PICkit 3 Debug Express – Provides basic information on using the
PICkit™ 3 Debug Express.
• Chapter 6. Troubleshooting First Steps – Begins the troubleshooting process
by identifying first steps and common reasons for problems with debugging.
• Chapter 7. Frequently Asked Questions (FAQs) – Provides information on
solving common problems.
• Chapter 8. Error Messa ges – Provides specific error messages and general
corrective actions.
• Chapter 9. Debugger Function Summary – Summarizes the available
debugging functions.
• Chapter 10. Hardware Specification – Details hardware and electrical
specifications for the PICkit 3.
• Appendix A. PICkit 3 Schematics – Provides hardwar e sc hem atic dia gr ams for
the PICkit 3 programmer/debugger.
• Appendix B. Operational Advisory – Addresses operational issues to be
considered when designing applications.
DS51795A-page 2 © 2009 Microchip Technology Inc.
Page 7

CONVENTIONS USED IN THIS GUIDE
The following conventions may appear in this documentation:
DOCUMENTATION CONVENTIONS
Description Represents Examples
Arial font:
Italic Referenc ed books MPLAB
Initial caps A window the Output window
Quotes A field name in a window or
Underlined, italic with right
angle bracket
Bold characters A dialog button Click OK
Text in angle brackets < > A key on the keyboard Press <Enter>, <F1>
Courier New font:
Plain Sample source code #define START
Italic A variable argument file.o, where file can be
Square brackets [ ] Optional arguments mpasmwin [options]
Curly brackets and pipe
character: { | }
Ellipses... Replaces r epeated text var_name [,
Preface
®
IDE User’s Guide
Emphasized text ...is the only compiler...
A dialog the Settings dialog
A menu selection select Enable Programmer
“Save project before build”
dialog
A menu path File>Save
A tab Click the Power tab
Filenames autoexec.bat
File paths c:\mcc18\h
Keywords _asm, _endasm, static
Command-line options -Opa+, -Opa-
Bit values 0, 1
Constants 0xFF,’A’
any valid filename
file [options]
Choice of mut ually exclus ive
arguments; an OR selection
Represents code supplied by
user
errorlevel {0|1}
var_name...]
void main (void)
{ ...
}
© 2009 Microchip Technology Inc. DS51795A-page 3
Page 8

PICkit™ 3 User’s Guide
WARRANTY REGISTRATION
Please complete the enclosed Warranty Registration Card and mail it promptly.
Sending in the Warranty Registration Card entitles users to receive new product
updates. Interim software releases are available at the Microchip web site.
RECOMMENDED READING
This user's guide describes how to use PICkit 2. Other useful documents are listed
below. The following Microchip documents are available and recommended as
supplemental reference resources.
44-Pin Demo Board User’s Guide (DS41296)
Consult this document for instructions on how to use the 44-Pin demo board as a
development tool to emulate and debug firmware on a target board.
Low Pin Count Demo Board User’s Guide (DS51556)
Consult this document for instructions on how to use Microchip Technology’s low pin
count device (8-pin, 14-pin and 20-pin). This document includes a series of tutorials.
MPLAB
Consult this document for more information pertaining to the installation and features
of the MPLAB Integrated Development Environment (IDE) software. An on-line Help
version is also available.
In-Circuit Serial Programmer ™ (ICSP ™) Guid e (DS3 0277 )
This document contains helpful design guidelines for successful ICSP programming. It
includes application notes on hardware designs and the ICSP programming
specifications.
MP ASM™ Assembler, MPLINK™ Object Linker , MPLIB™ Object Librarian User’s
Guide (DS33014)
Describes how to use the Microchip PIC
(MPLINK linker), and librarian (MPLIB librarian).
README for PICkit™ 3 Debug Express
For the latest information on using the PICkit 3 Debug Express, read the “Readme for
PICkit 3.htm” file (an HTML file) in the Readmes subdirectory of the MPLAB IDE
installation directory . The Readme file contains updated information and known issues
that may not be included in this user’s guide.
PICkit™ 3 Debug Express C18 Lessons
These tutorials guide you through using the PICkit 3 Debug Express with the MPLAB
C Compiler for PIC18 MCU’s. They are available on the MPLAB IDE CDROM and on
the Microchip web site.
Readme Files
For the latest information on using other tools, read the tool-specific Readme files in
the Readmes subdirectory of the MPLAB IDE installation directory. The Readme files
contain updated information and known issues that may not be included in this user’s
guide.
®
IDE User’s Guide/Help (DS51519)
®
MCU assembler (MPASM assembler), linker
DS51795A-page 4 © 2009 Microchip Technology Inc.
Page 9

Preface
THE MICROCHIP WEB SITE
Microchip provides online support via our web site at www.microchip.com. This web
site is used as a means to make files and information easily available to customers.
Accessible by using your favorite internet browser, the web site contains the following
information:
• Product Support – Data sheets and errata, application notes and sample
programs, design resources, user’s guides and hardware support documents,
latest software releases and archived software
• General Technical Support – Frequently Asked Questions (FAQs), technical
support requests, online discussion groups, Microchip consultant program
member listing
• Business of Microchip – Product selector and ordering guides, latest Microchip
press releases, listing of seminars and events, listings of Microchip sales offices,
distributors and factory representatives
DEVELOPMENT SYSTEMS CUSTOMER CHANGE NOTIFICATION SERVICE
Microchip’s customer notification service helps keep customers current on Microchip
products. Subscribers will receive e-mail notification whenever there are changes,
updates, revisions or errata related to a specified product family or development tool of
interest.
To register, access the Microchip web site at www.microchip.com
Change Notification and follow the registration instructions.
The Development Systems product group categories are:
• Compilers – The latest info rmatio n on Microc hip C comp ilers, as semblers , linker s
and other language tools. These include all MPLAB C compilers; all MPLAB
assemblers (including MPASM™ assembler); all MPLAB linkers (including
MPLINK™ object linker); and all MPLAB librarians (including MPLIB™ object
librarian).
• Emulators – The latest information on Microchip in-circuit emulators.These
include the MPLAB REAL ICE™, MPLAB ICE 2000 in-circuit emulators
• In-Circuit Debuggers – The latest information on the Microchip in-circuit
debuggers. These include the MPLAB ICD 2, ICD 3, PICkit™ 2 and PICkit™ 3.
• MPLAB
Integrated Development Environment for development systems tools. This list is
focused on the MPLAB IDE, MPLAB IDE Project Manager, MPLAB Editor and
MPLAB SIM simulator, as well as general editing and debugging features.
• Programmers – The latest information on Microchip programmers. These include
the MPLAB PM3 device programmer and the PICSTART
PICkit 3 developm ent pr ogr am mers .
®
IDE – The latest information on Microchip MPLAB IDE, the Windows®
, click on Customer
®
Plus, PICkit 2 and
© 2009 Microchip Technology Inc. DS51795A-page 5
Page 10

PICkit™ 3 User’s Guide
CUSTOMER SUPPORT
Users of Microchip products can receive assistance through several channels:
• Distributor or Representative
• Local Sales Office
• Field Application Engineer (FAE)
• Technical Support
Customers should contact their distributor, representative or field application engineer
(FAE) for support. Local sales offices are also available to help customers. A listing of
sales offices and locations is included in the back of this document. See our web site
for a complete, up-to-date listing of sales offices.
Technical support is available through the web site at: http://support.microchip.com
.
DS51795A-page 6 © 2009 Microchip Technology Inc.
Page 11

PICkit™ 3 USER’S GUIDE
Part 1 – Getting Started
Chapter 1. Overview.......................................................................................................9
Chapter 2. Theory of Operation............................................. .....................................15
Chapter 3. Installation..................................................................................................23
Chapter 4. General Setup......................................... ...................................................27
Chapter 5. PICkit 3 Debug Express ............................................................................31
© 2009 Microchip Technology Inc. DS51795A-page 7
Page 12

PICkit™ 3 User’s Guide
NOTES:
DS51795A-page 8 © 2009 Microchip Technology Inc.
Page 13

PICkit™ 3 USER’S GUIDE
Chapter 1. Overview
1.1 INTRODUCTION
An overview of the PICkit 3 programmer/debugger system is given.
• PICkit 3 Progra mmer/Debugger Defined
• How the PICkit 3 Programmer/Debugger Helps You
• PICkit 3 Progra mme r/D ebugger Components
• Device and Feature Support
1.2 PICKIT 3 PROGRAMMER/DEBUGGER DEFINED
The PICkit 3 programmer/debugger (see Figure 1-1) is a simple, low-cost in-circuit
debugger that is controlled by a PC running MPLAB IDE (v8.20 or greater) software on
a Windows
development engineer’s toolsuite. The application usage can vary from software
development to hardware integration.
The PICkit 3 programmer/debugger is a debugger system used for hardware and
software development of Microchip PIC
Signal Controllers (DSCs) that are based on In-Circuit Serial Programming™ (ICSP™)
and Enhanced In-Circuit Serial Programming 2-wire serial interfaces. In addition to
debugger functions, the PICkit 3 programmer/debugger system also may be used as a
development programmer.
The debugger system executes code like an actual device because it uses a device
with built-in emulation circuitry, instead of a special debugger chip, for emulation. All
available features of a given device are accessible interactively, and can be set and
modified by the MPLAB IDE interface.
The PICkit 3 debugger was developed for emulating embedded processors with debug
facilities. The PICkit 3 features include:
• Full-speed USB support using Windows standard drivers
• Real-time execution
• Processors run at maximum speeds
• Built-in over-voltage/short circuit monitor
• Low voltage to 5V (1.8-5V range)
• Diagnostic LEDs (power, active, status)
• Read/write program and data memory of microcontroller
• Erase of all memory types (EEPROM, ID, configuration and program) with
verification
• Peripheral freeze at breakpoint
®
platform. The PICkit 3 programmer/debugger is an integral part of the
®
microcontrollers (MCUs) and dsPIC® Digital
Note: The PICkit 3 is intended for development programming. For production
programming, please consider the MPLAB PM3 device programmer or
other third party programmers designed for a production environment.
© 2009 Microchip Technology Inc. DS51795A-page 9
Page 14
PICkit™ 3 User’s Guide
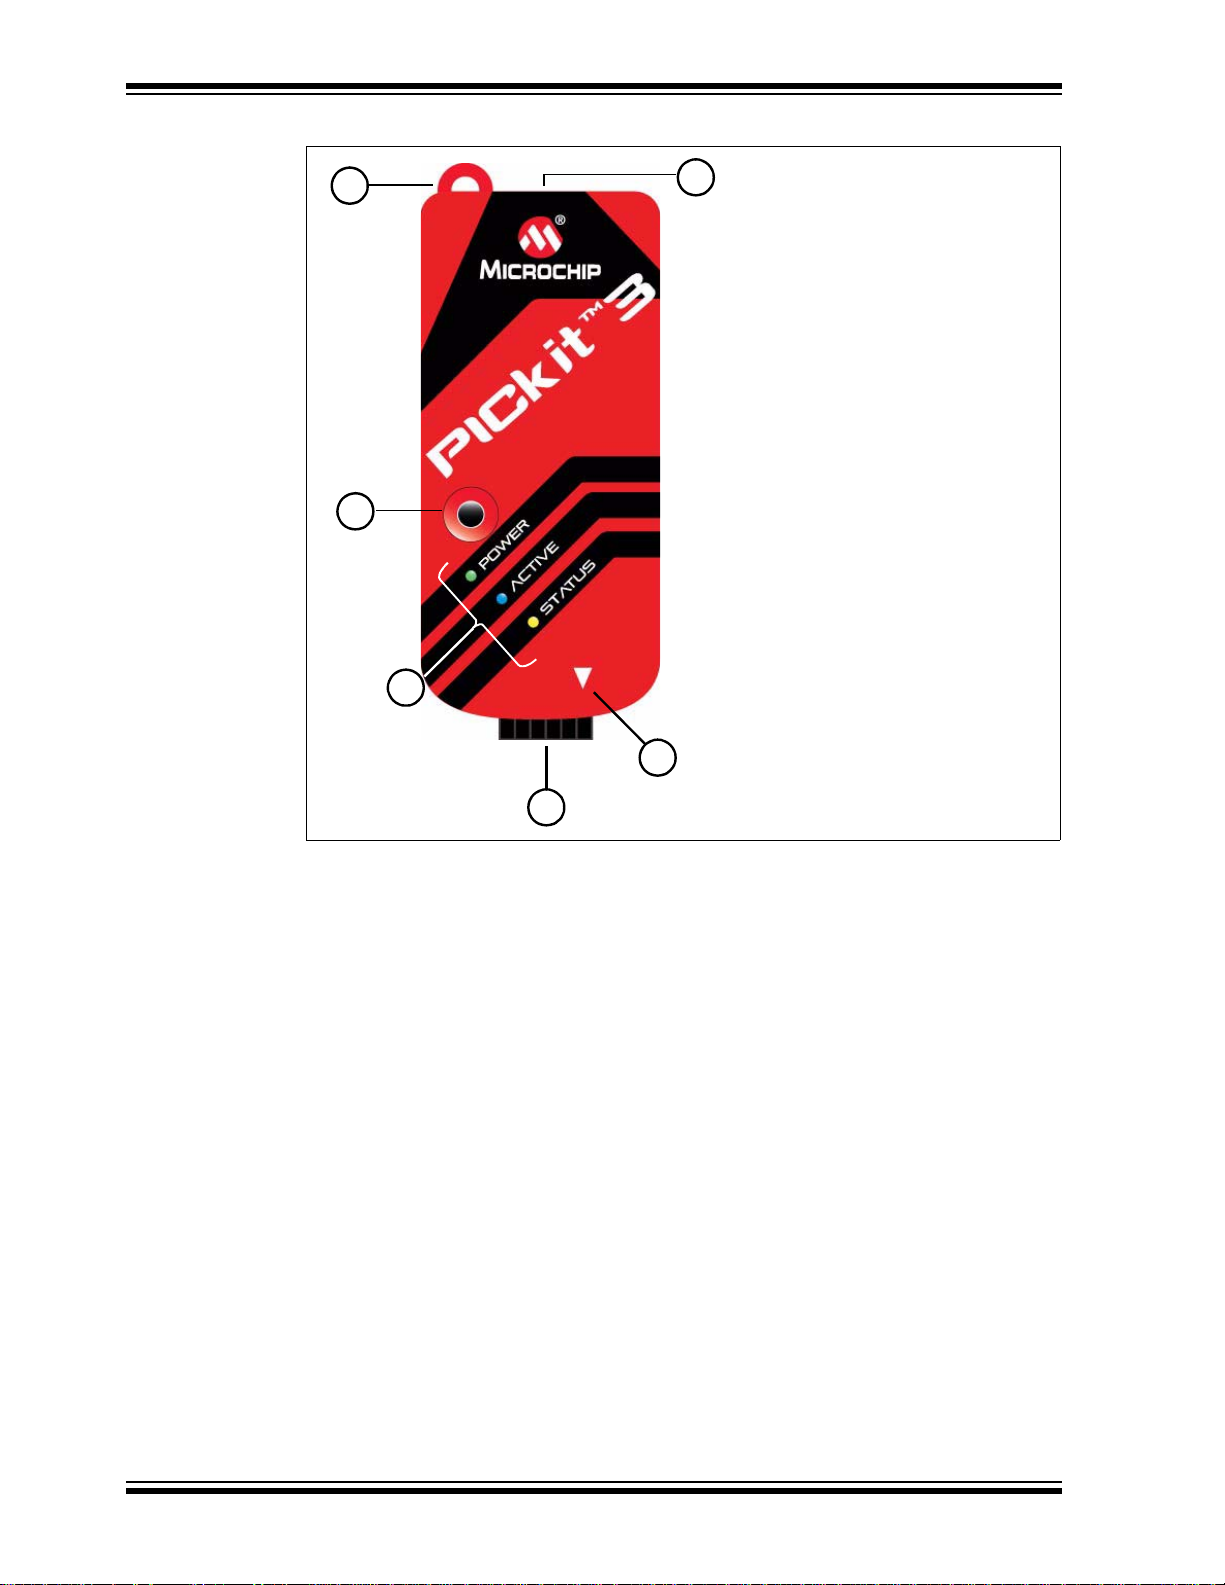
6
2
1
3
4
Legend:
1 – Lanyard Connection
2 – USB Port Connection
3 – Pin 1 Marker
4 – Programming Connector
5 – Status LEDs
6 – Push Button (future use)
5
FIGURE 1-1: PICkit™ 3 MCU PROGRAMMER/DEBUGGER
1.2.1 Lanyard Connection
A convenient lanyard connection is available on the programmer.
1.2.2 USB Port Connection
The USB port connection is a USB mini-B connector. Connect the PICkit 3 to the PC using
the supplied USB cable.
1.2.3 Pin 1 Marker
This marker designates the location of pin 1 for proper connector alignment.
1.2.4 Programming Connector
The programming connector is a 6-pin header (0.100" spacing) that connects to the
target device. See the pinout specification in Figure 1-2.
DS51795A-page 10 © 2009 Microchip Technology Inc.
Page 15
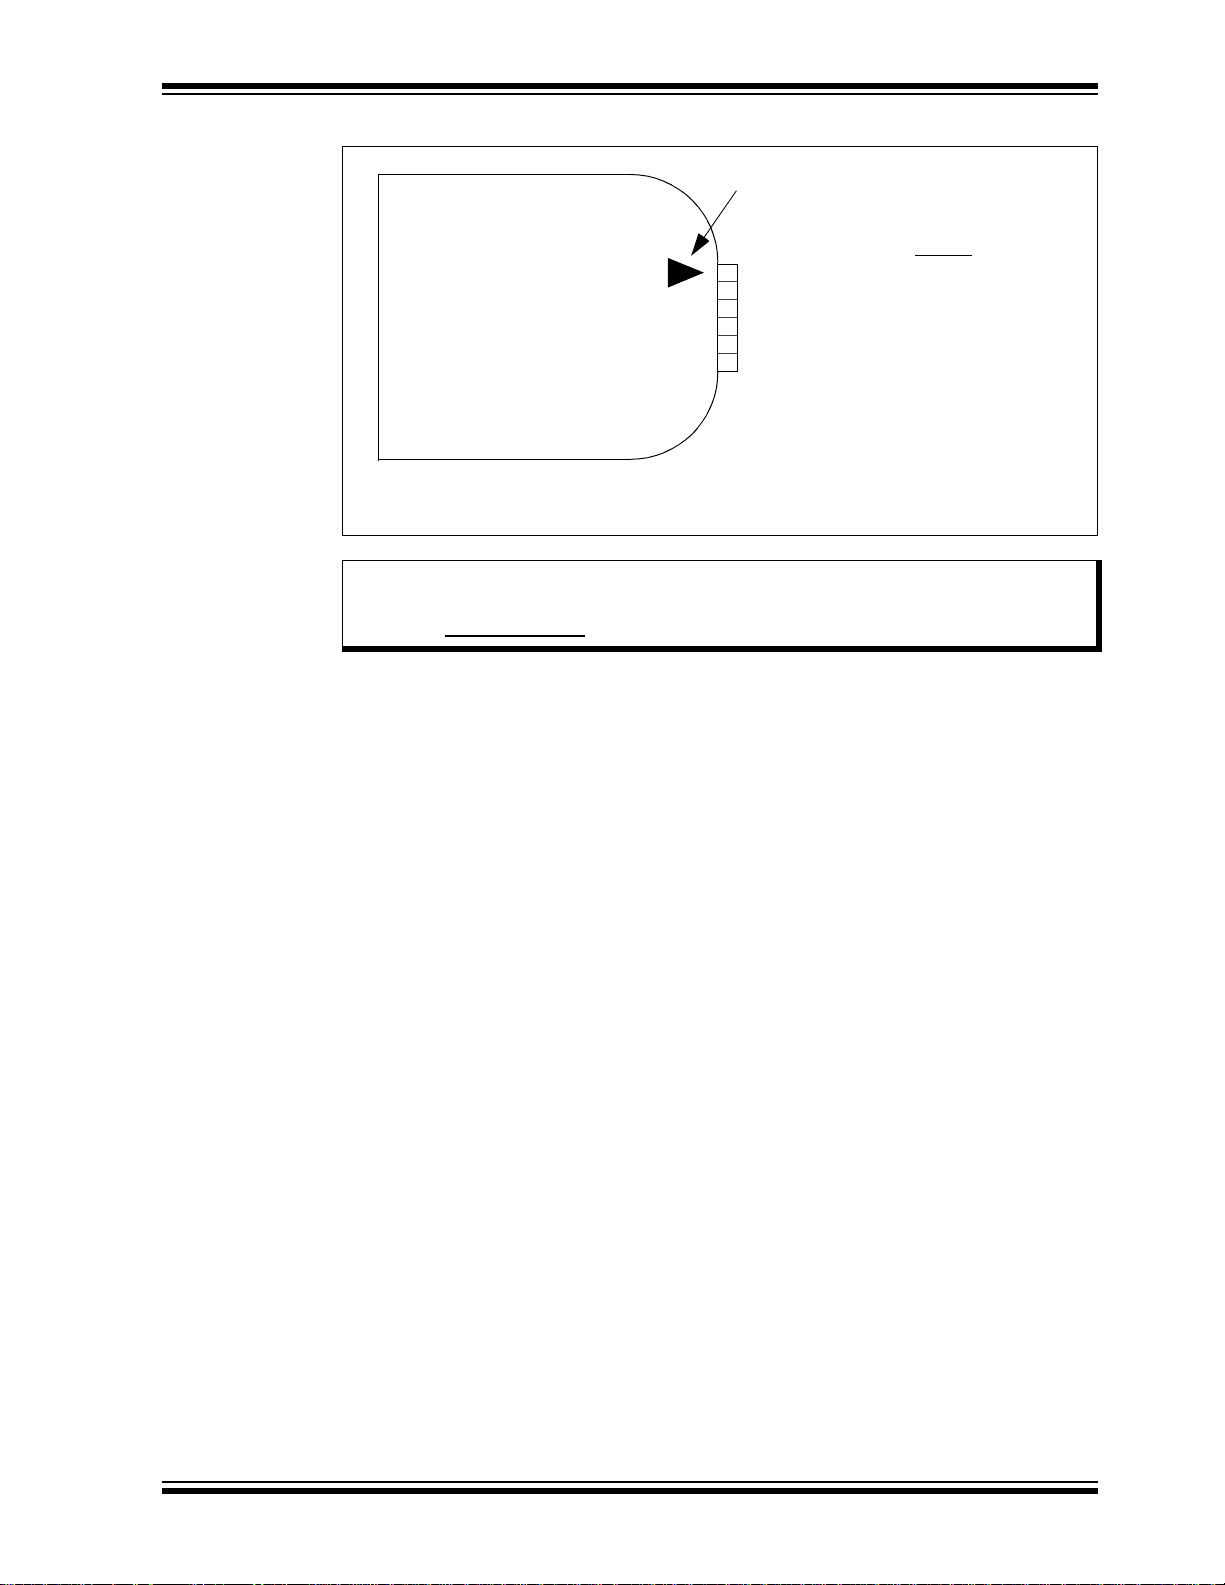
Overview
1
2
3
4
5
6
* The 6-pin header (0.100" spacing) accepts 0.025" square pins.
Pin Description*
1 = V
PP/MCLR
2 = VDD Target
3 = V
SS (ground)
4 = ICSPDAT/PGD
5 = ICSPCLK/PGC
6 = LVP
Pin 1 Indicator
FIGURE 1-2: PICKIT™ 3 PROGRAMMER CONNECTOR PINOUT
Note: The programming connector pin functions are different for programming
Serial EEPROMS and HCS devices. See the ReadMe file for the PICkit 3
(H
elp>Readme) included with the MPLAB IDE software for these pinouts.
1.2.5 Status LEDs
The Status LEDs indicate the status of the PICkit 3.
1. Power (green) – Power is supplied to the PICkit 3 via the USB port.
2. Active (blue) – The PICkit 3 has connection to the PC USB port and the
communication link is active.
3. Status:
Busy (yellow) – The PICkit 3 is busy with a function in progress, such as
programming.
Error (red) – The PICkit 3 has encountered an error.
1.3 HOW THE PICKIT 3 PROGRAMMER/DEBUGGER HELPS YOU
The PICkit 3 programmer/debugger allows you to:
• Debug your application on your own hardware in real time
• Debug with hardware breakpoints
• Set breakpoints based on internal ev ents
• Monitor internal file registers
• Emulate at full speed
• Program your device
© 2009 Microchip Technology Inc. DS51795A-page 11
Page 16
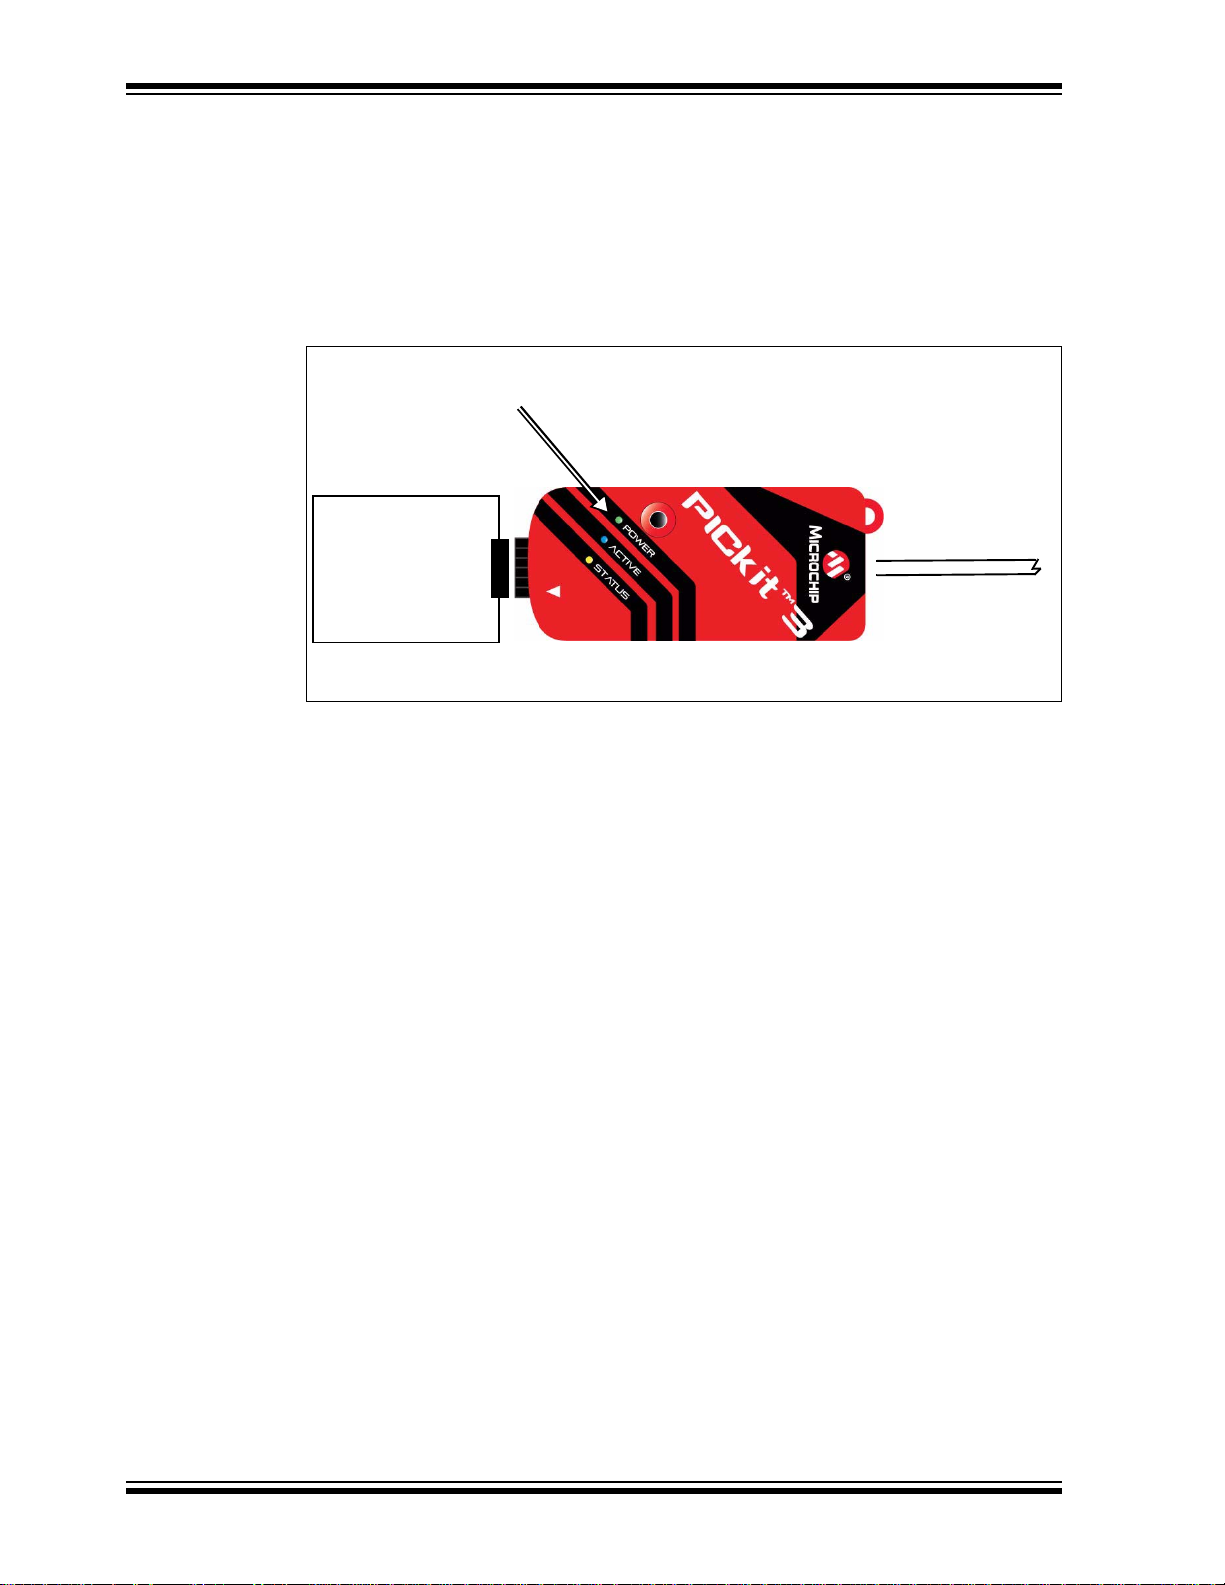
PICkit™ 3 User’s Guide
PICkit™ 3
To Tar g et Board
USB Cable to PC
Indicator
Lights
1.4 PICKIT 3 PROGRAMMER/DEBUGGER COMPONENTS
The components of the PICkit 3 programmer/debugger system are:
1. PICkit 3 with indicator lights for power, activity and status.
2. USB cable to provide communications between the debugger and a PC and to
provide power to the debugger.
3. CD-ROM with MPLAB IDE software and on-line documentation.
FIGURE 1-3: BASIC DEBUGGER SYSTEM
Additional hardware that may be ordered separately:
• PICkit 3 Debug Express Kit which includes:
- a 44-pin demo board with a PIC18F45K20 MCU
- free version of MPLAB C Compiler for PIC18 MCUs
- easy-to-understand lessons and tutorials
- other software utilities, examples with source code and full documentation
• Transition socket
• ICD headers
• MPLAB IDE processor extension kits
DS51795A-page 12 © 2009 Microchip Technology Inc.
Page 17
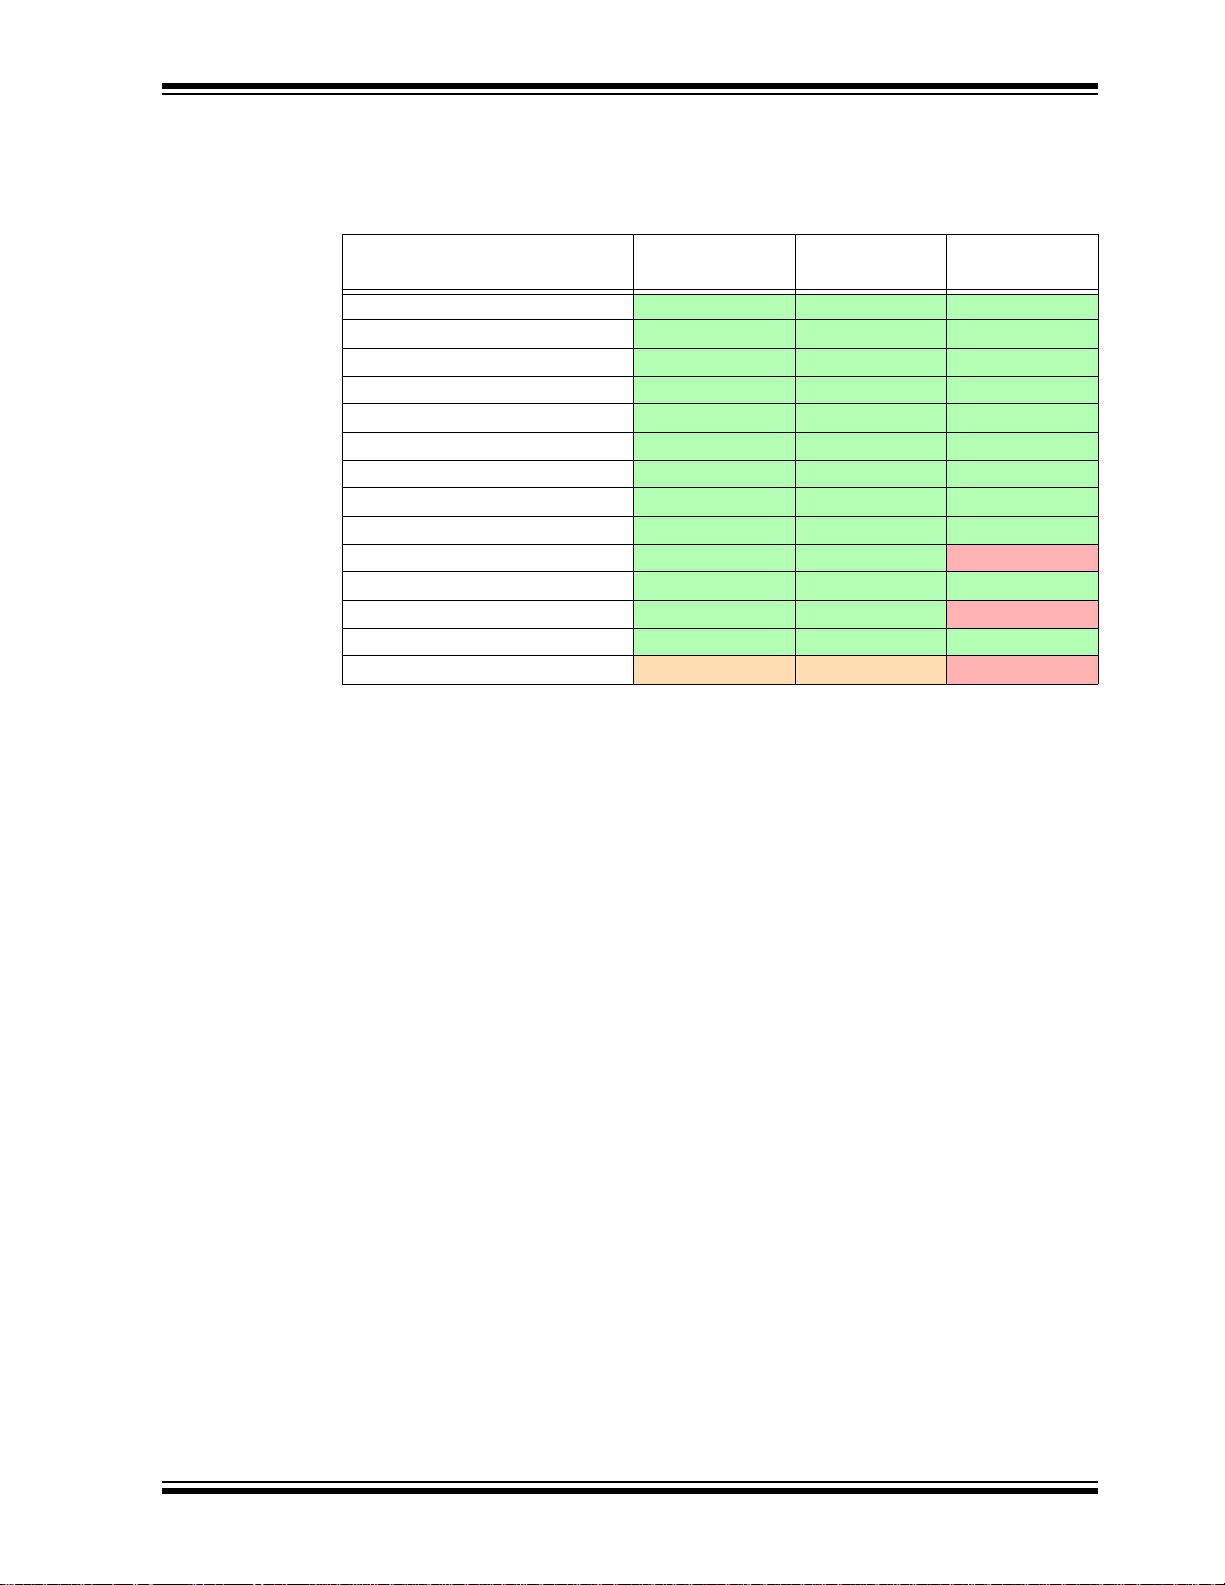
1.5 DEVICE AND FEATURE SUPPORT
Table 1-1 and Table 1-2 show the support for devices and device features.
TABLE 1-1: 16-BIT (DATA MEMORY) DEVICES
Feature
Reset application
Run, Halt C C C
Single step
Animate C C C
Full-speed emulation C C C
Hardware breakpoints
Peripheral freeze
Break on data fetch or write C C C
Break on stack overflow
Stopwatch
Pass counter C C C
WDT overflow
Standard speed communication
Processor Pak F F N
Legend:
C = Current support
D = Support dependent on device
F = No support now, but planned in the future
N = Support not available
Note 1: Current Switch Mode Power Supply (SMPS) devices: dsPIC30F1010/2020/2023.
2: This feature operates differently depending on the selected device.
(2)
dsPIC33F,
PIC24F/H
C C C
C C C
C C C
C C C
N N N
C C N
C C N
C C C
dsPIC30F
(1)
SMPS
Overview
dsPIC30F
© 2009 Microchip Technology Inc. DS51795A-page 13
Page 18
PICkit™ 3 User’s Guide
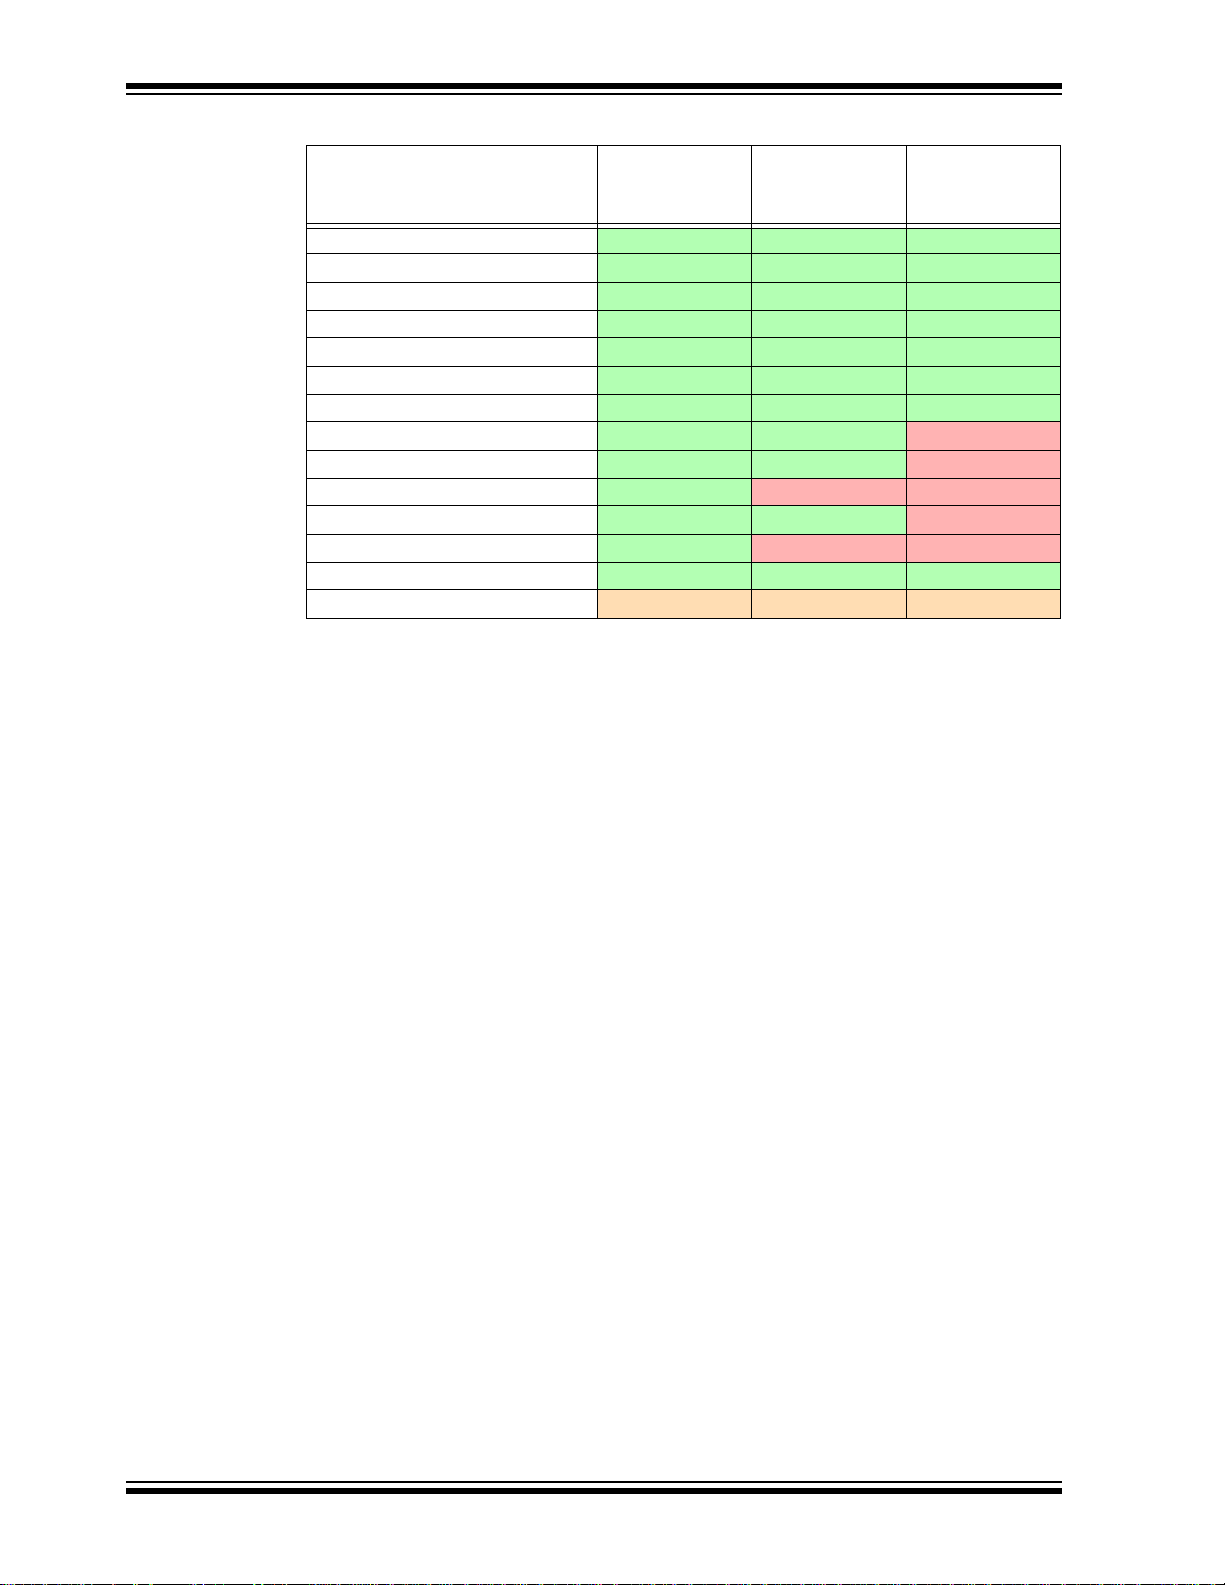
TABLE 1-2: 8-BIT (DATA MEMORY) DEVICES
Feature PIC18FXXJ
Reset application C C C
Run, Halt C C C
Single step
Animate C C C
Full-speed emulatio n C C C
Hardware breakpoints
Peripheral freeze
Break on data fetch or write C C N
Break on stack overflow
Stopwatch C N N
Pass counter C C N
WDT overflow
Standard speed communication
Processor Pak F F F
Legend:
C = Current support
F = No support now, but planned in the future
N = Support not available
Note 1: This feature operates differently depending on the selected device.
(1)
PIC18F,
PIC18F Enh,
PIC18FXXK
C C C
C C C
C C C
C C N
C N N
C C C
PIC12F, PIC16F
DS51795A-page 14 © 2009 Microchip Technology Inc.
Page 19

Chapter 2. Theory of Operation
2.1 INTRODUCTION
A simplified description of how the PICkit 3 programmer/debugger system works is
provided here. It is intended to provide enough information so a target board can be
designed that is compatible with the debugger for both emulation and programming
operations. The basic theory of in-circuit emulation and programming is described so
that problems, if encountered, are quickly resolved.
• PICkit 3 vs. PICkit 2
• Debugger to Target Communication
• Communication Connection s
• Debugging
• Requirements for Debugging
• Programming
• Resources Used by the Debugger
2.2 PICkit 3 VS. PICkit 2
The PICkit 3 programmer/debugger system is similar in function to the PICkit 2
in-circuit debugger system. Similarities of the two debuggers include:
• Powered via USB cable to PC
• Provides a programmable voltage power supply
The PICkit 3 differs from the PICkit 2 by providing:
• Extended EE program image space (512 Kbytes)
• True voltage reference
• Increased voltage range (1.8-5V V
PICkit™ 3 USER’S GUIDE
DD; 1.8-14V VPP)
2.3 DEBUGGER TO TARGET COMMUNICATION
The debugger system configurations are discussed in the following sections.
CAUTION
Do not change hardware connections while the PICkit 3 or target is powered.
Standard ICSP Device Communication
The debugger system can be configured to use standard ICSP communication for both
programming and debugging functions. This 6-pin connection is the same one used by
the PICkit 2 programmer/debugger.
© 2009 Microchip Technology Inc. DS51795A-page 15
Page 20
PICkit™ 3 User’s Guide
Target Device
or PIM
Power
PICkit™ 3
Mini-USB
to PC
cable
Target Board
Target Board
Transition Socket
Device-ICE
AC164110
Adapter
Header
Power
PICkit™ 3
Mini-USB
to PC
cable
The modular cable can be either (1) inserted into a matching socket at the target, where
the target device is on the target board (Figure 2-1), or (2) inserted into a standard
adapter/header board combo (available as a Processor Pak), which in then plugged
into the target board (Figure 2-2).
Note: Older header boards used a 6-pin (RJ-11) connector instead of an 8-pin
connector, so these headers may be connected to the debugger with the
AC164110 ICSP adapter.
For more on standard communication, see Chapter 10. “Hardware Specification”.
FIGURE 2-1: STANDARD DEBUGGER SYSTEM – DEVICE WITH
ON-BOARD ICE CIRCUITRY
FIGURE 2-2: STANDARD DEBUGGER SYSTEM – ICE DEVICE
DS51795A-page 16 © 2009 Microchip Technology Inc.
Page 21
2.4 COMMUNICATION CONNECTIONS
12345
6
Target
Connector
Target
Bottom Side
PC Board
VPP/MCLR
Vss
PGC
V
DD
PGD
LVP
2.4.1 Communication Target Connections
2.4.1.1 USING SINGLE IN-LINE CONNECTOR
Use the 6-pin in-line connector between the PICkit 3 programmer/debugger and the
target board connector. See Figure 2-1. Also see Table 2-1 and
Section 10.6 “Standard Communication Hardware”.
TABLE 2-1: TARGET CONNECTOR PINOUT
Connector Pin Microcontroller Pin
1MCLR/VPP
2VDD
3 Ground
4 PDG (ICSPDAT)
5 PGC (ICSPCLK)
6LVP
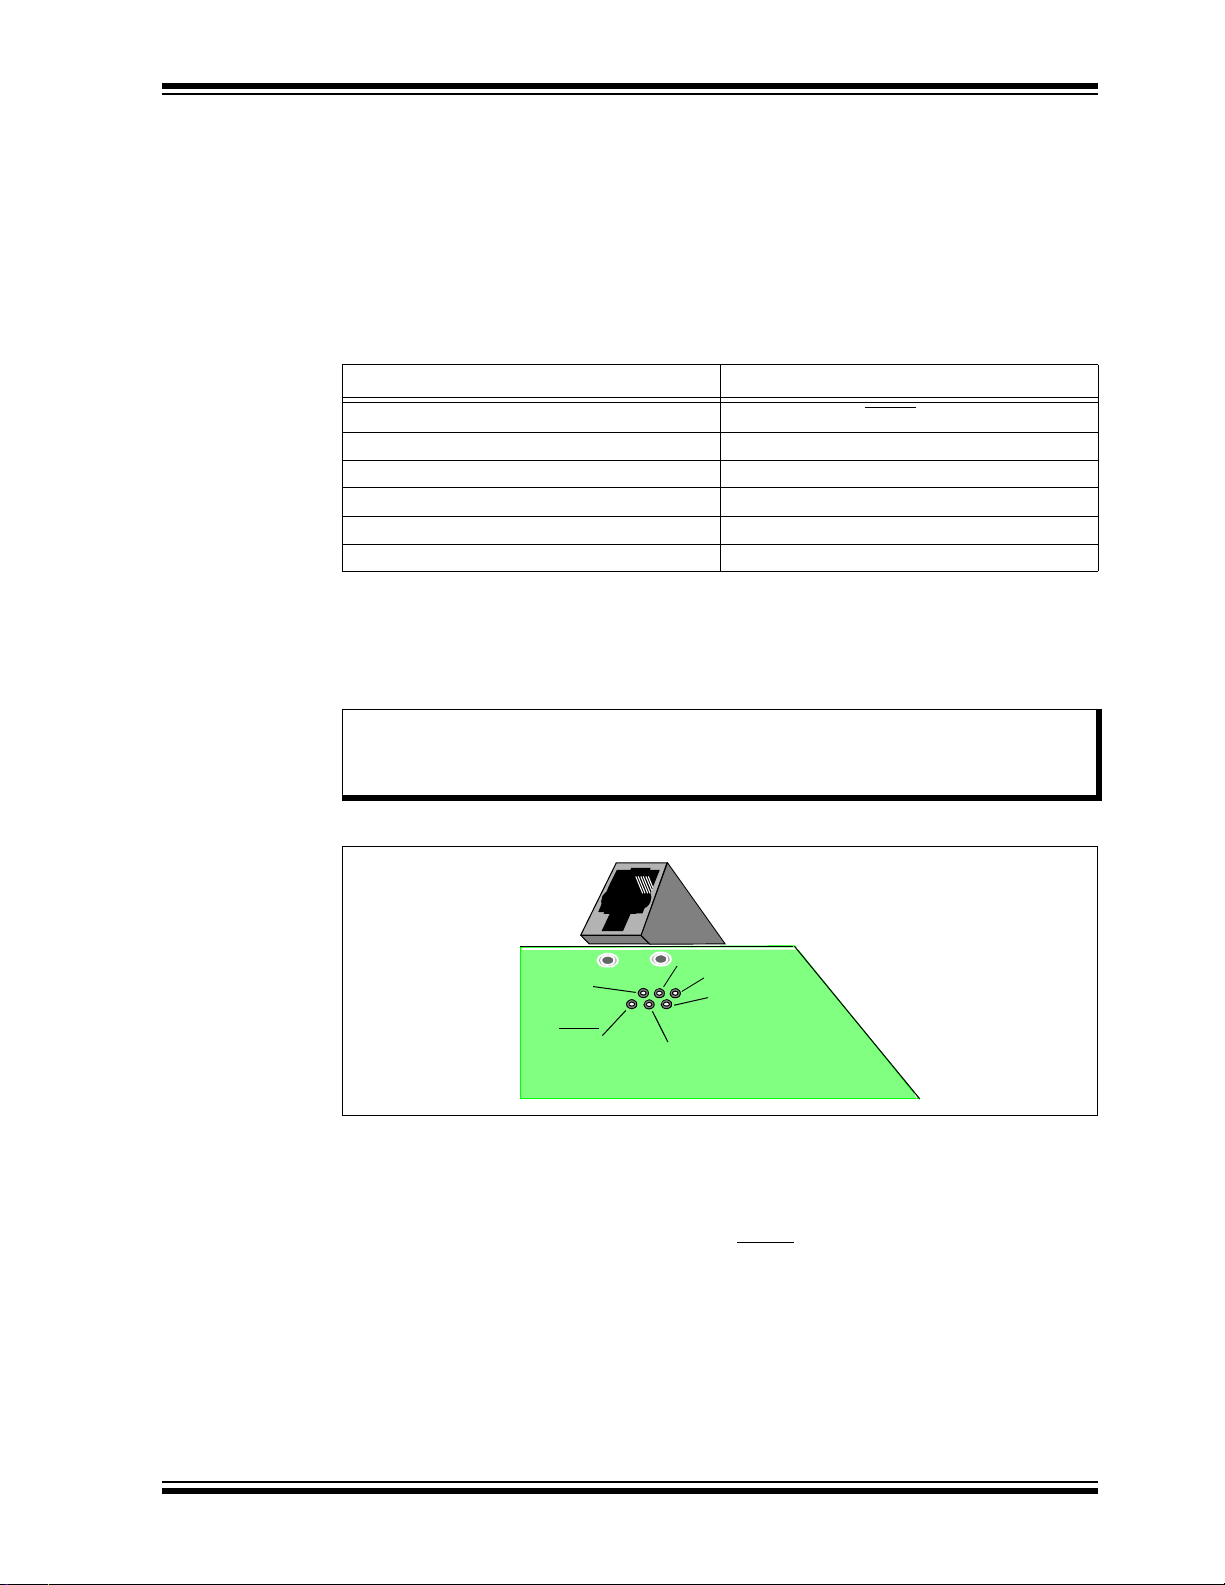
2.4.1.2 USING AN ADAPTER
Use the AC164110 adapter between the PICkit 3 programmer/debugger and the target
device with the modular interface (six conductor) cable. The pin numbering for the
connector is shown from the bottom of the target PC board in Figure 2-3.
Theory of Operation
Note: Cable connections at the debugger and target are mirror images of each
other, i.e., pin 1 on one end of the cable is connected to pin 6 on the other
end of the cable. See Section 10.6.2.3 “Modular Cable Specification”.
FIGURE 2-3: STANDARD RJ-11 CONNECTION AT TARGET
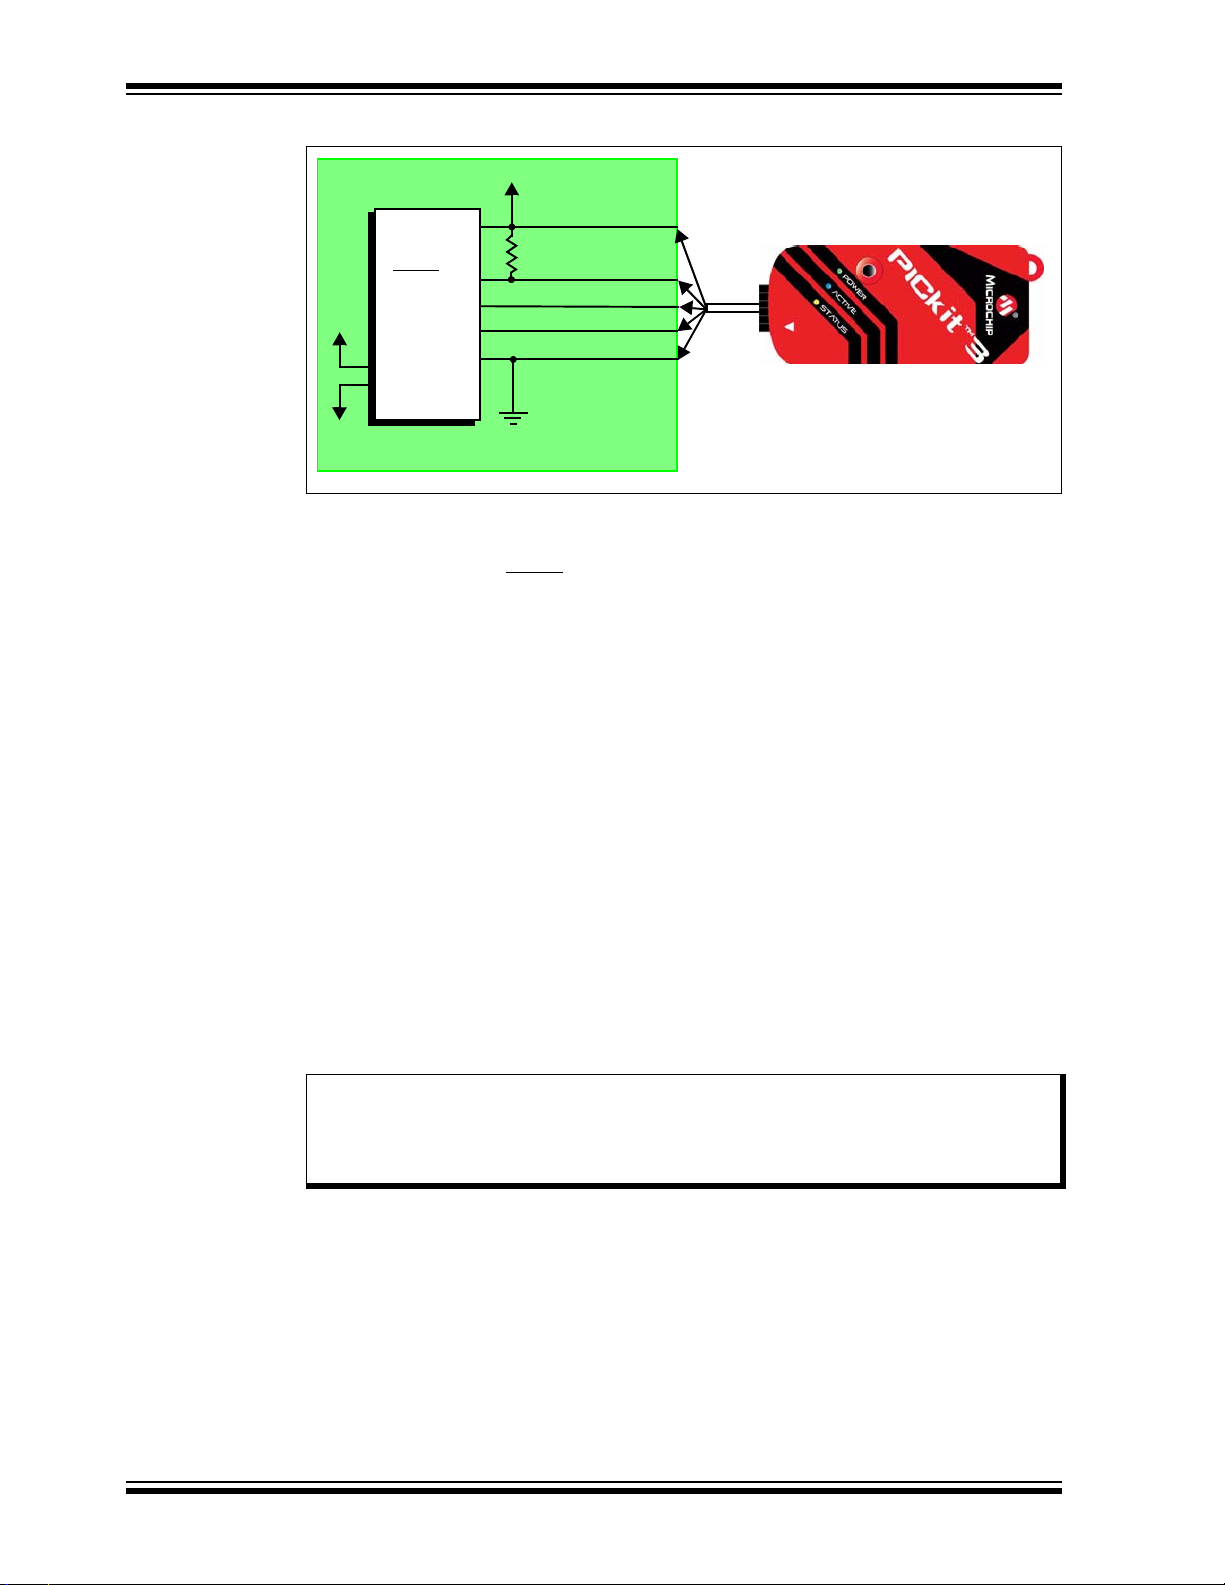
2.4.2 Target Connection Circuitry
Figure 2-4 shows the interconnections of the PICkit 3 programmer/debugger to the
connector on the target board. The diagram also shows the wiring from the connector
to a device on the target PC board. A pull-up resistor (usually around 10 kΩ) is
recommended to be connected from the V
strobed low to reset the device.
PP/MCLR line to VDD so that the line may be
© 2009 Microchip Technology Inc. DS51795A-page 17
Page 22
PICkit™ 3 User’s Guide
VDD
VPP/MCLR
PGC
PGD
V
SS
AVDD
AVSS
2
1
5
4
3
User Reset
4.7K-10K
Interface
Connector
Application
PC Board
Device
FIGURE 2-4: STANDARD CONNECTION TARGET CIRCUITRY
2.4.3 Target Powered
In the following descriptions, only three lines are active and relevant to core debugger
operation: pins 1 ( V
shown on Figure 2-4 for completeness. PICkit 3 has two configurations for powering
the target device: internal debugger and external target power.
The recommended source of power is external and derived from the target application.
In this configuration, target V
the target low voltage operation. If the debugger does not sense voltage on its V
(pin 2 of the interface connector), it will not operate.
PP/MCLR), 5 (PGC) and 4 (PGD). Pins 2 (VDD) and 3 (VSS) are
DD is sensed by the debugger to allow level translation for
DD line
2.4.4 Debugger Powered
The internal debugger power is limited to 30 mA. This may be of benefit for very small
applications that have the device V
for independent programming, but is not recommended for general usage as it imposes
more current demands from the USB power system derived from the PC.
Not all devices have the AV
DD and AVSS lines, but if they are present on the target
device, all must be connected to the appropriate levels in order for the debugger to
operate. They cannot be left floating.
In general, it is recommended that all V
the appropriate levels. Also, devices with a V
be connected to the appropriate capacitor or level.
Note: The interconnection is very simple. Any problems experienced are often
caused by other connections or components on these critical lines that
interfere with the operation of the PICkit 3 programmer/debugger, as
discussed in the following section.
DS51795A-page 18 © 2009 Microchip Technology Inc.
DD separated from the rest of the application circuit
DD/AVDD and VSS/AVSS lines be connected to
CAP line (PIC18FXXJ for example) should
Page 23
Theory of Operation
No!
No!
No!
No!
VPP/MCLR
PGC
PGD
1
5
4
Interface
Connector
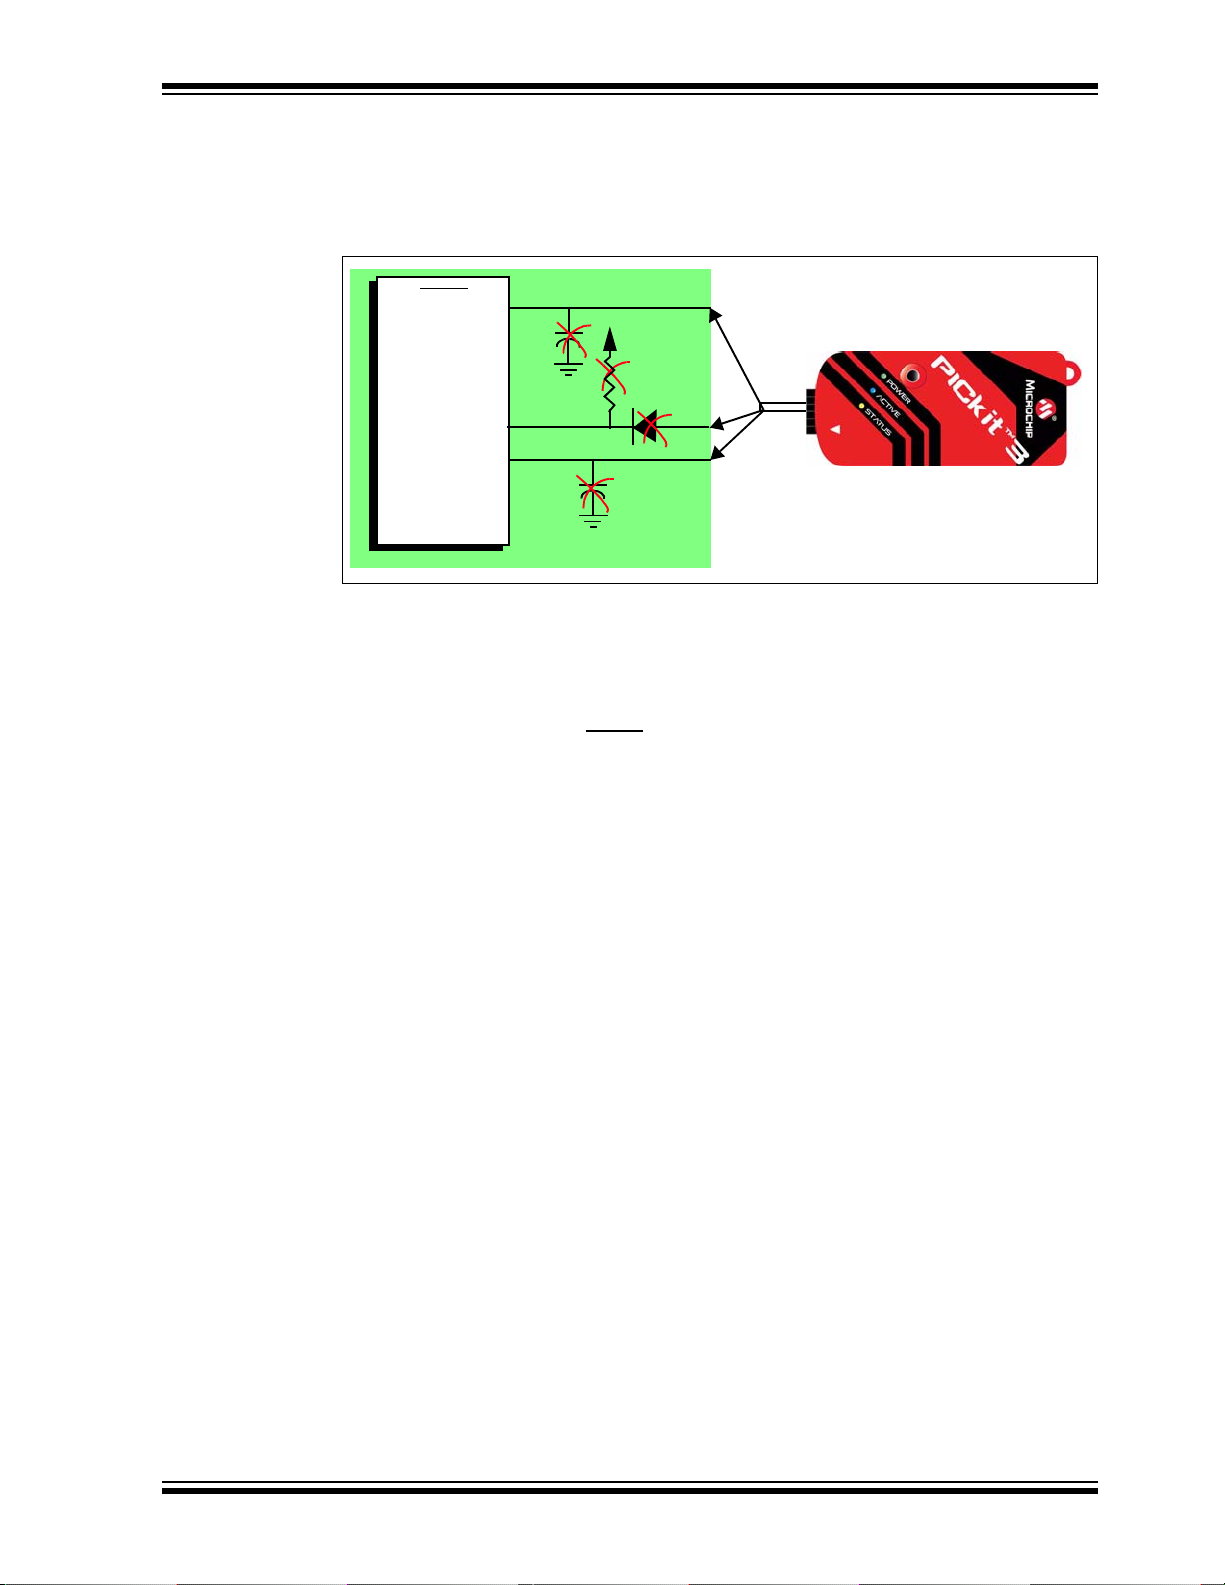
2.4.5 Circuits That Will Prevent the Debugger From Functioning
Figure 2-5 shows the active debugger lines with some components that will prevent the
PICkit 3 debugge r sys tem fro m func tio nin g.
FIGURE 2-5: IMPROPER CIRCUIT COMPONENTS
Specifically, these guidelines must be followed:
• Do not use pull-ups on PGC/PGD – they will disrupt the voltage levels, since
these lines have 4.7 kΩ pull-down resistors in the debugger.
• Do not use capacitors on PGC/PGD – they will prevent fast transitions on data
and clock lines during programming and debug communications.
• Do not us e capacitors on MCLR
simple pull-up resistor is generally sufficient.
• Do not use diodes on PGC/PGD – they will prevent bidirectional communication
between the debugger and the target device.
– they will prevent fast transitions of VPP. A
2.5 DEBUGGING
There are two steps to using the PICkit 3 programmer/debugger system as a debugger.
The first requires that an application be programmed into the target device (usually with
the PICkit 3 itself). The second uses the internal in-circuit debug hardware of the target
Flash device to run and test the application program. These two steps are directly
related to the MPLAB IDE operations :
1. Program the code into the target and activate special debug functions (see the
next section for details).
2. Use the debugger to set breakpoints and run.
If the target device cannot be programmed correctly, the PICkit 3
programmer/debugger will not be able to debug.
Figure 2-6 shows the basic interconnections required for programming. Note that this
is the same as Figure 2-4, but for the sake of clarity, the V
debugger are not shown.
© 2009 Microchip Technology Inc. DS51795A-page 19
DD and VSS lines from the
Page 24

PICkit™ 3 User’s Guide
+5V
Programming
4.7 kΩ
4.7 kΩ
VPP/MCLR
PGC
PGD
1
5
4
Internal Circuits
VSS
VDD
Voltage
FIGURE 2-6: PROPER CONNECTIONS FOR PROGRAMMING
A simplified diagram of some of the internal interface circuitry of the PICkit 3
programmer/debugger is shown. For programming, no clock is needed on the target
device, but power must be supplied. When programming, the debugger puts
programming levels on V
PGD. To verify that the part has been programmed correctly, clocks are sent to PGC
and data is read back from PGD. This conforms to the ICSP protocol of the device
under development.
PP/MCLR, sends clock pulses on PGC and serial data via
2.6 REQUIREMENTS FOR DEBUGGING
T o debug (set breakpoints, see registers, etc.) with the PICkit 3 programmer/debugger
system, there are critical elements that must be working correctly:
• The debugger must be connected to a PC. It must be powered by the PC via the
USB cable, and it must be communicating with the MPLAB IDE software via the
USB cable. See Chapter 3. “Installation” for details.
• The debugger must be connected as shown to the V
target device with the modular interface cable (or equivalent). V
also required to be connected between the debugger and target device.
• The target device must have power and a functional, running oscillator. If the
target device does not run, for any reason, the PICkit 3 programmer/debugger
cannot debug.
• The target device must have its configuration words programmed correctly:
- The oscillator Configuration bits should correspond to RC, XT , etc., depending
upon the target design.
- For some devices, the Watchdog Timer is enabled by default and needs to be
disabled.
- The target device must not have code protection enabled.
- The target device must not have table read protection enabled.
• LVP should be disabled.
Once the above conditions are met, you may proceed to the following:
• Sequence of Operations Leading to Debugging
• Debugging Details
PP, PGC and PGD pins of the
SS and VDD are
DS51795A-page 20 © 2009 Microchip Technology Inc.
Page 25
Theory of Operation
+5V
+12V
4.7 k
Ω
4.7 k
Ω
Internal Circ u its
Program
Memory
File
Registers
Internal
Debug
Registers
VPP/MCLR
PGC
PGD
1
5
4
Executive
Debug
Area Used by
Target
be
Running
must
for Debug
Executive
to Function
Area
VDD
Hardware
Stack Shared
by Debug Exec
Debug Exec
Reserved
for Debug
Executive
2.6.1 Sequence of Operations Leading to Debugging
Given that the requirements for debugging (see previous section) are met, these
actions can be performed when the PICkit 3 programmer/debugger is set as the current
debugger from the MPLAB IDE menu (Debugger>Select Tool>PICkit 3
• The application code is compiled/assembled by selecting Project>Build
Configuration>Debug.
• When Debugger>Program
is selected, the application code is programmed into
the device’s memory via the ICSP protocol as described above.
• A small “debug executive” program is loaded into the high area of program
memory of the target device automatically by MPLAB IDE. Since the debug
executive must reside in program memory, the application program must not use
this reserved space. Some devices have special memory areas dedicated to the
debug executive. Check your device data sheet for details.
• Special “in-circuit debug” registers in the target device are enabled. These allow
the debug executive to be activated by the debugger.
• The target device is held in reset by keeping the V
PP/MCLR line low.
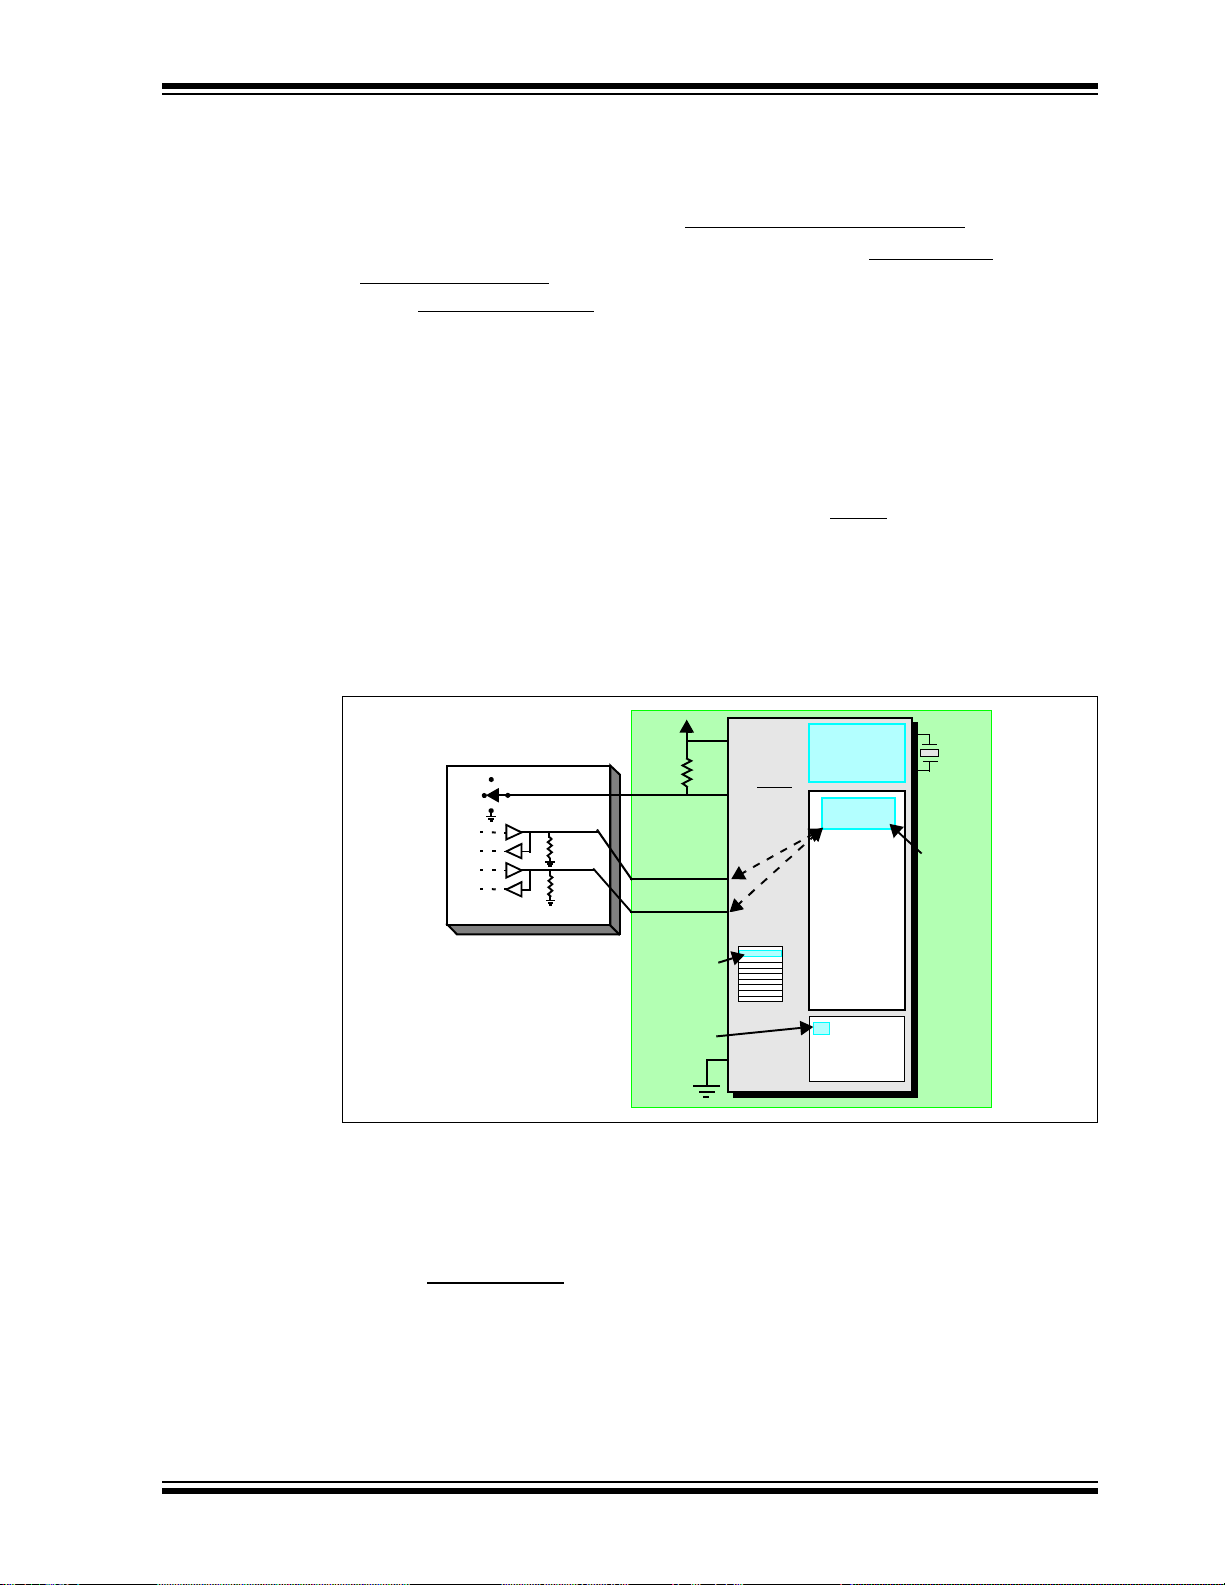
2.6.2 Debugging Details
Figure 2-7 illustrates the PICkit 3 programmer/debugger system when it is ready for
debugging.
):
FIGURE 2-7: PICkit™ 3 DEBUGGER READY FOR DEBUGGING
Typically , in order to find out if an application program will run correctly, a breakpoint is
set early in the program code. When a breakpoint is set from the user interface of
MPLAB IDE, the address of the breakpoint is stored in the special internal debug
registers of the target device. Commands on PGC and PGD communicate directly to
these registers to set the breakpoint address.
Next, the Debugger>Run
from MPLAB IDE. The debugger will then tell the debug executive to run. The target
will start from the reset vector and execute until the Program Counter reaches the
breakpoint address previously stored in the internal debug registers.
After the instruction at the breakpoint address is executed, the in-circuit debug
mechanism of the target device “fires” and transfers the device’s Program Counter to
the debug executive (much like an interrupt) and the user’s application is effectively
function or the Run icon (forward arrow) is usually pressed
© 2009 Microchip Technology Inc. DS51795A-page 21
Page 26

PICkit™ 3 User’s Guide
halted. The debugger communicates with the debug executive via PGC and PGD, gets
the breakpoint status information and sends it back to MPLAB IDE. MPLAB IDE then
sends a series of queries to the debugger to get information about the target device,
such as file register contents and the state of the CPU. These queries are ultimately
performed by the debug executive.
The debug executive runs just like an application in program memory. It uses some
locations on the stack for its temporary variables. If the device does not run, for
whatever reason, such as no oscillator, a faulty power supply connection, shorts on the
target board, etc., then the debug executive cannot communicate to the PICkit 3
programmer/debugger and MPLAB IDE will issue an error message.
Another way to get a breakpoint is to press the MPLAB IDE’s Halt button (the “pause”
symbol to the right of the Run arrow). This toggles the PGC and PGD lines so that the
in-circuit debug mechanism of the target device switches the Program Counter from the
user’s code in program memory to the debug executive. Again, the target application
program is effectively halted, and MPLAB IDE uses the debugger communications with
the debug executive to interrogate the state of the target device.
2.7 PROGRAMMING
Use the PICkit 3 programmer/debugger as a programmer to program an actual (non
-ICE/-ICD) device, i.e., a device not on a header board. Select “PICkit 3” from
Programmer>Select Programmer
the “Build Configuration” list box on the MPLAB IDE toolbar set to “Release”. Also, it
may be set by se lecting Project>Build Configuration>Release
All debug features are turned off or removed when the debugger is used as a
programmer. When using the Programmer>Program
MPLAB IDE will disable the in-circuit debug registers so the PICkit 3
programmer/debugger will program only the target application code and the
Configuration bits (and EEPROM data, if available and selected) into the target device.
The debug executive will not be loaded. As a programmer, the debugger can only
toggle the MCLR
register contents cannot be seen or altered.
The PICkit 3 programmer/debugger system programs the target using ICSP . V
and PGD lines should be connected as described previously . No clock is required while
programming, and all modes of the processor can be programmed, including code
protection, Watchdog Timer and table read protection.
line to reset and start the target. A breakpoint cannot be set, and
and compile/assemble your application code with
.
selection to program a device,
PP, PGC
2.8 RESOURCES USED BY THE DEBUGGER
For a complete list of resources used by the debugger for your device, please see the
on-line help file in MPLAB IDE for the PICkit 3 programmer/debugger.
DS51795A-page 22 © 2009 Microchip Technology Inc.
Page 27
Chapter 3. Installation
PICkit™ 3
To Target Board
USB Cable to PC
or Header
21
3.1 INTRODUCTION
How to install the PICkit 3 programmer/debugger system is discussed.
• Installing the Software
• Connecting the Target
• Setting Up the Target Board
• Setting Up MPLAB IDE
3.2 INSTALLING THE SOFTWARE
To install the MPLAB IDE software, first acquire the latest MPLAB IDE installation
executable (MPxxxxx.exe, where xxxxx represents the version of MPLAB IDE) from
either the Microchip web site (www.microchip.com) or the MPLAB IDE CD-ROM
(DS51123). Then run the executable and follow the screens to install MPLAB IDE.
Note: MPLAB IDE v8.20 or greater is required to use the PICkit 3
programmer/debugger.
PICkit™ 3 USER’S GUIDE
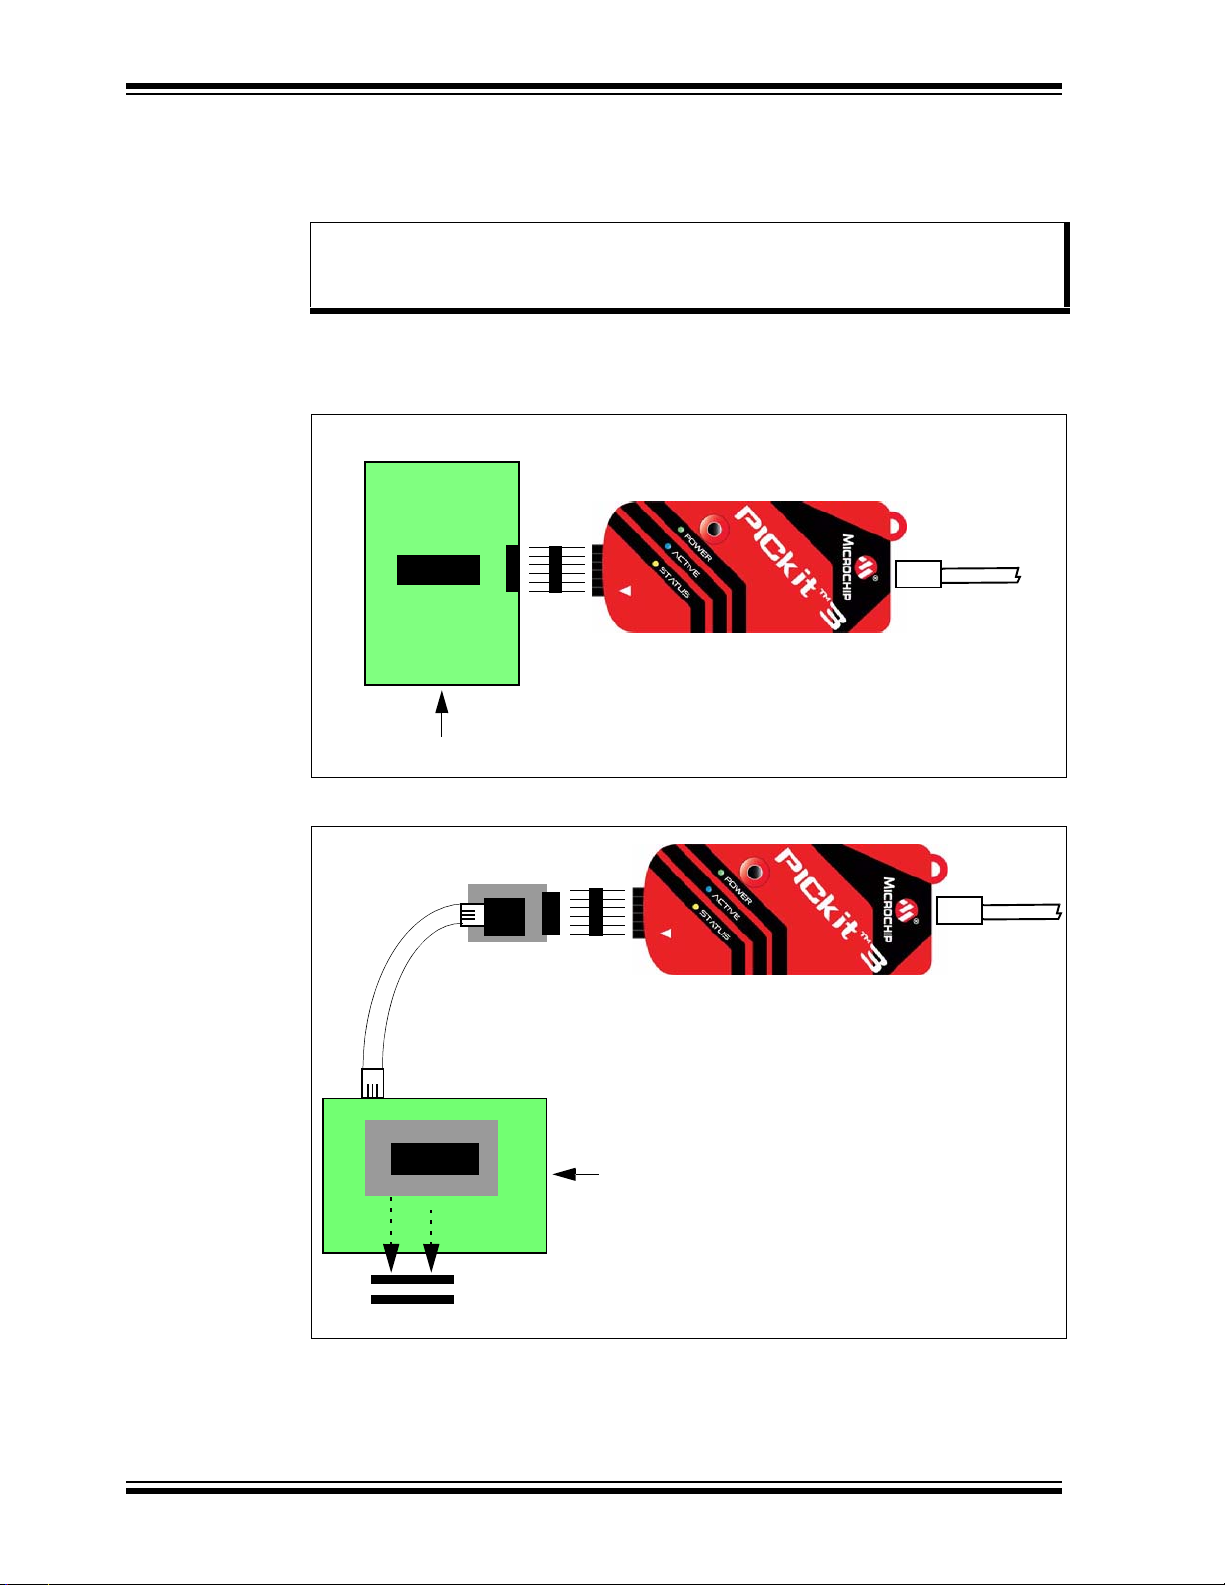
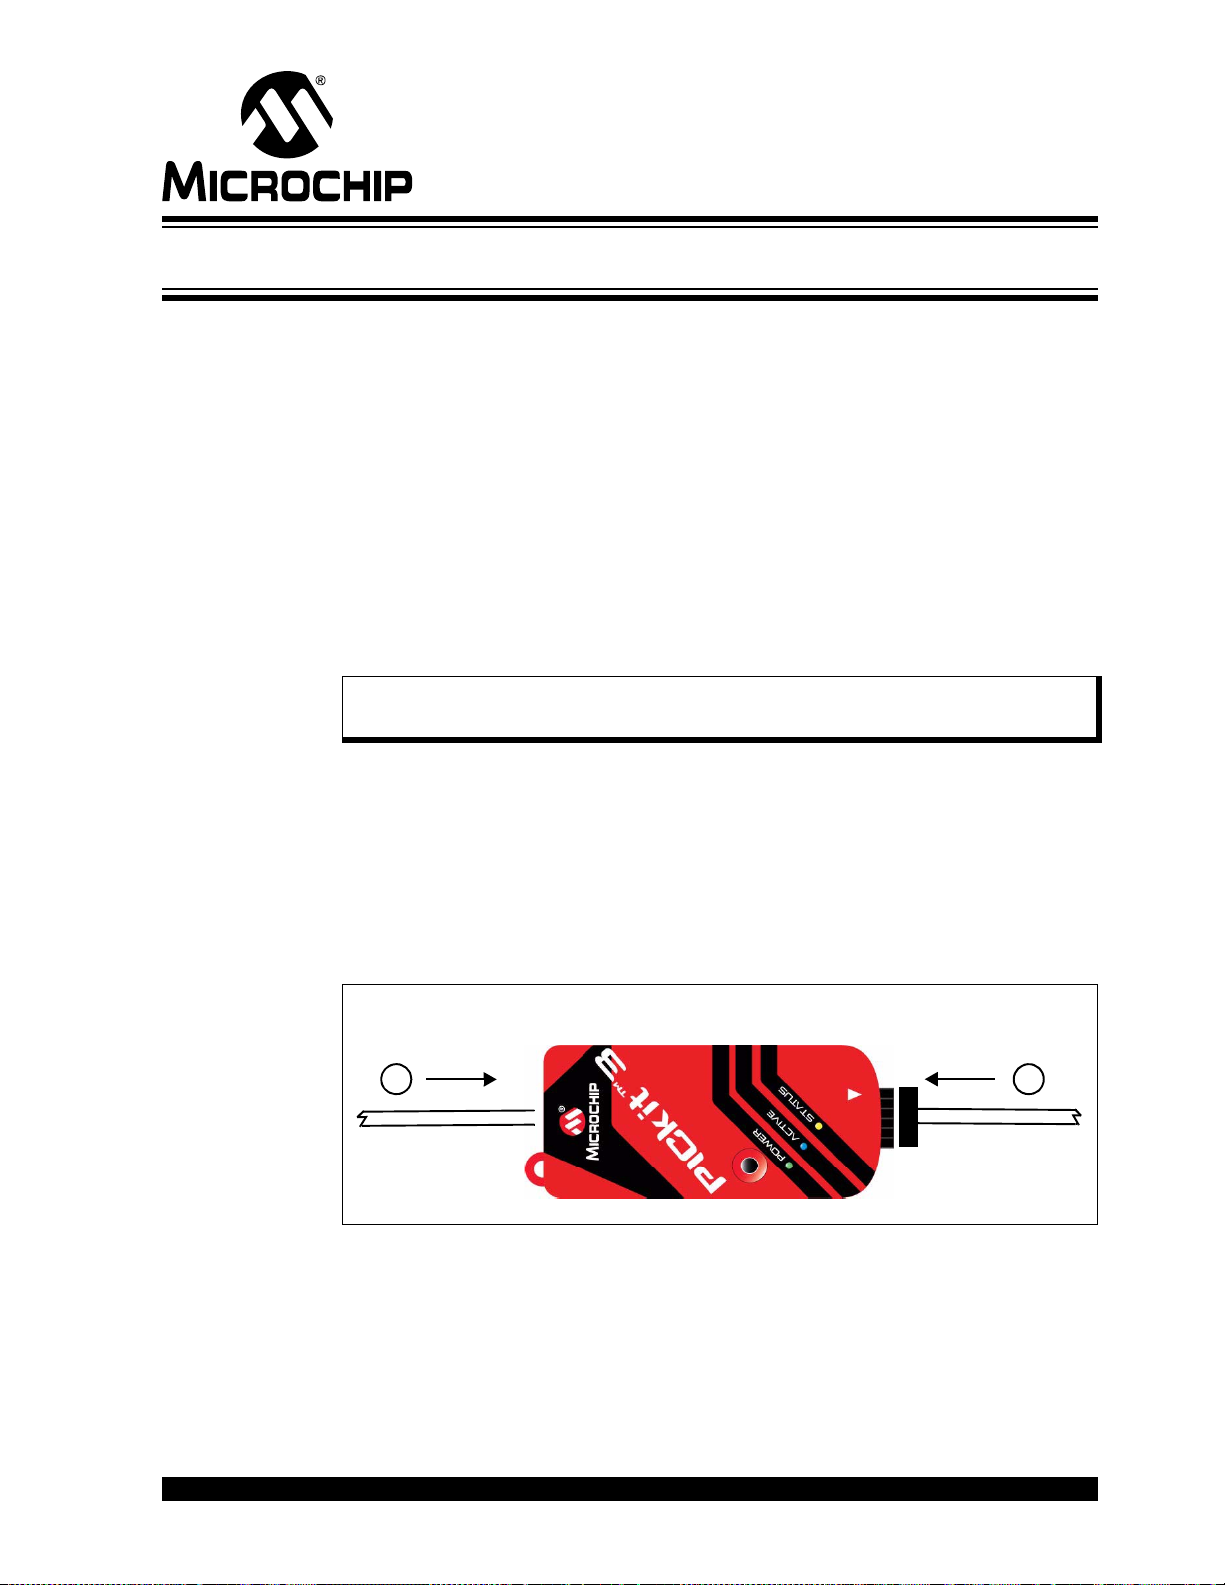
3.3 CONNECTING THE TARGET
A connection is built-in to select the type of communication with the target. See
Section 2.3 “Debugger to Target Communication” for more details and a diagram.
1. Plug in the USB/power cable if not already connected.
2. Attach the communication cable(s) between debugger and target if using RJ11
plug or connect directly to a 6-pin inline header.
FIGURE 3-1: INSERT COMMUNICATIONS AND USB/POWER CABLES
© 2009 Microchip Technology Inc. DS51795A-page 23
Page 28

PICkit™ 3 User’s Guide
3.4 SETTING UP THE TARGET BOARD
3.4.1 Using Production Devices
For production devices, the debugger may be connected directly to the target board.
The device on the target board must have built-in debug circuitry in order for the
PICkit 3 programmer/debugger to perform emulation with it. Consult the device data
sheet to see if the device has the needed debug circuitry, i.e., it should have a
“Background Debugge r Enab le ” Configuration bit.
Note: In the future, devices with circuitry that support ICD may be used.
The target board must have a connector to accommodate the communications chosen
for the debugger. For connection information, see Section 2.3 “Debugger to Target
Communication”, “Standard ICSP Device Communication”.
3.4.2 Using ICE Devices
For ICE devices, an ICE header board is required. The header board contains the
hardware necessary to emulate a specific device or family of devices. For more
information on ICE headers, see the “Header Board Specification” (DS51292).
Note: In the future, ICD header boards with ICD devices (Device-ICD) may be
used.
A transition socket is used with the ICE header to connect the header to the target
board. Transition sockets are available in various styles to allow a common header to
be connected to one of the supported surface mount package styles. For more
information on transition sockets, see the “Transition Socket Specification” (DS51194).
Header board layout will be different for headers or processor extension packs. For
connection information, see Section 2.3 “Debugger to Target Communication”,
“Standard ICSP Device Communication”.
3.4.3 Using an ICD Header
All Baseline and some Mid-Range PIC microcontrollers require a special –ICD device
mounted on a debug header circuit board to enable the debugging feature. For a list of
these devices and the required ICD header board part number, please see the “Header
Board Specification” (DS51292). The Header Board Specification is included on the
PICkit 3 CD-ROM, and is available online at www.microchip.com.
Each ICD header board comes with the necessary –ICD device, and is used on the
target board instead of the production microcontroller. However, most header boards
have an RJ-11 debug connector which requires the AC164110 RJ-11 to ICSP adapter
kit to connect it to PICkit 3. Figure 3-2 illustrates using the AC162061 ICD Header for
the PIC18F45K20 with the AC164110 adapter kit and Low Pin Count Demo Board.
DS51795A-page 24 © 2009 Microchip Technology Inc.
Page 29
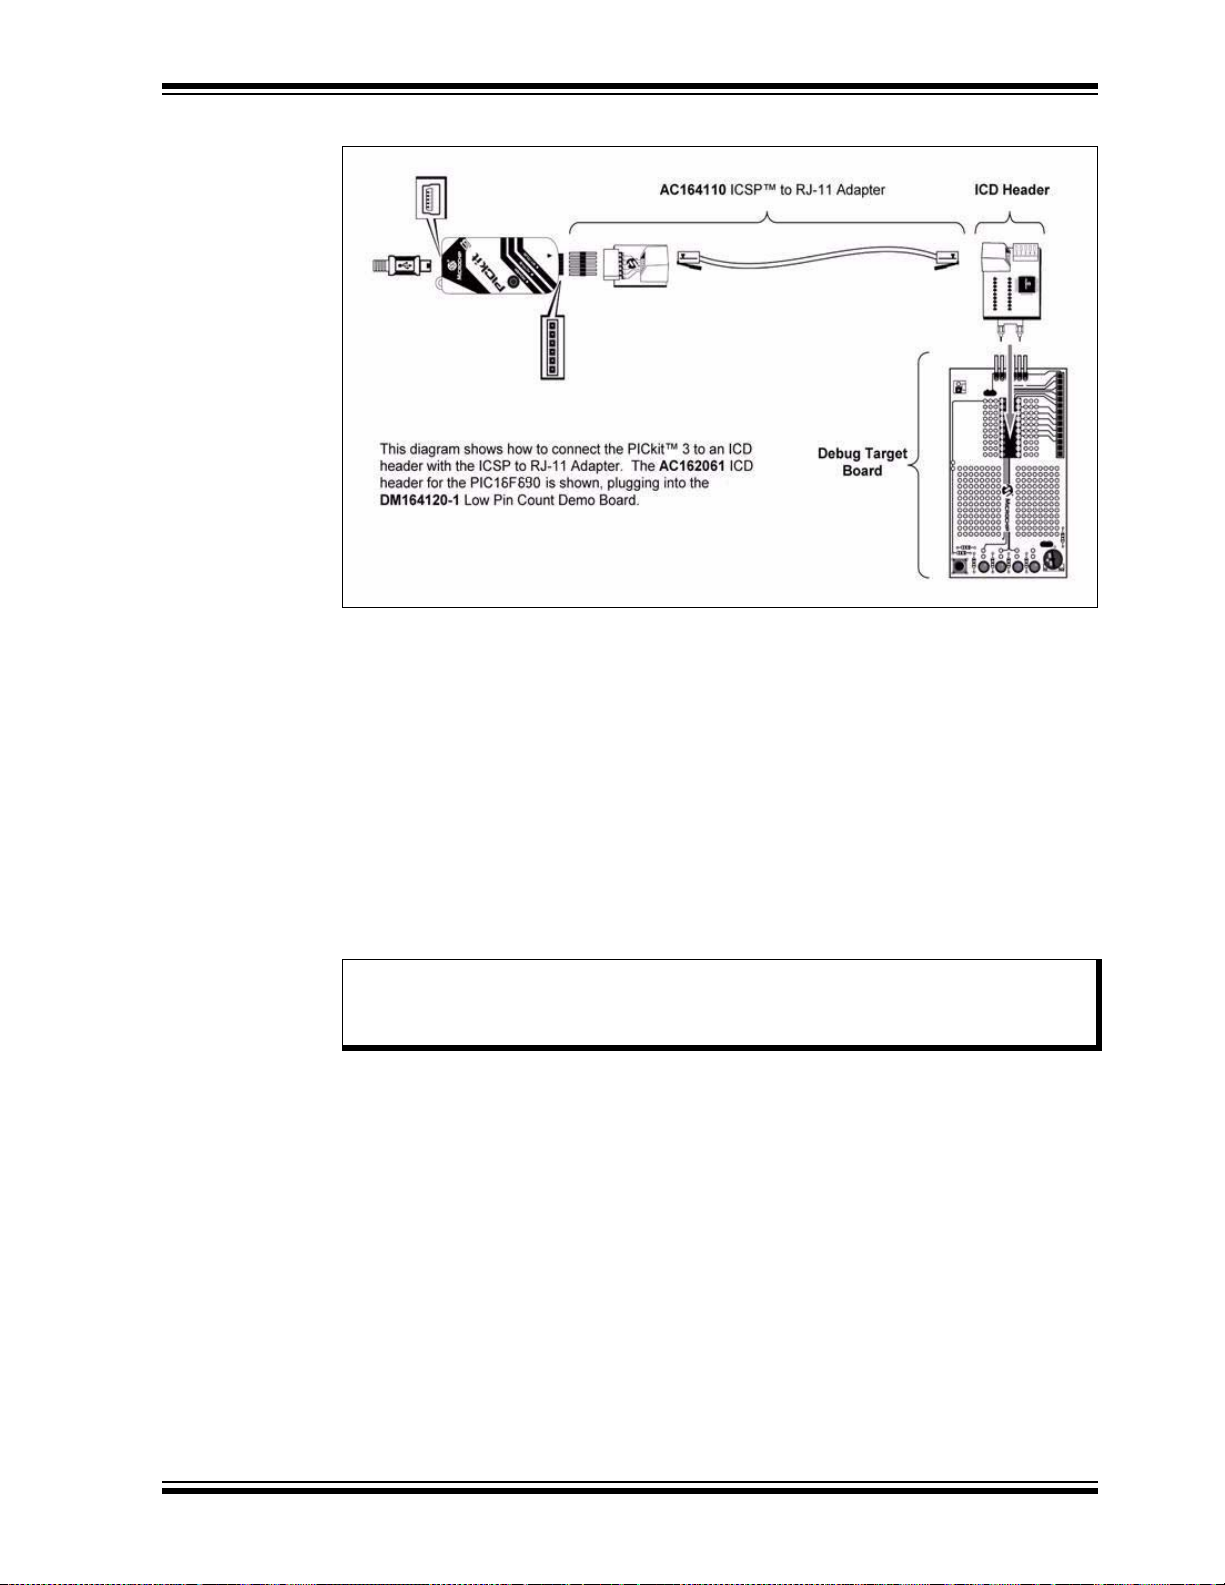
Installation
FIGURE 3-2: USING AN ICD HEADER BOARD
Many Mid-Range PIC microcontrollers and all PIC18 and 16-bit PIC microcontroller
devices do not require an ICD header and can be debugged directly through the ICSP
programming connections .
3.4.4 Powering the Target
These are configuration essentials:
• When using the USB connection, PICkit 3 can be powered from the PC but it can
only provide a limited amount of current, up to 30 mA, at V
small target board.
• The desired method is for the target to provide V
current. The additional benefit is that plug-and-play target detection facility is
inherited, i.e., MPLAB IDE will let you know in the Output window when it has
detected the target and has detected the device.
Note: The target voltage is only used for powering up the drivers for the ICSP
interface; the target voltage does not power up the PICkit 3. The PICkit 3
power is derived strictly from the USB port.
If you have not already done so, connect the PICkit 3 to the target using the appropriate
cables (see Section 3.3 “Connecting the Target”). Then power the target. If you are
powering the target through the PICkit 3, see Section 9.5.8 “Settings Dialog, Power
Tab” for instructions.
3.5 SETTING UP MPLAB IDE
Once the hardware is connected and powered, MPLAB IDE may be set up for use with
the PICkit 3 programmer/debugger.
On some devices, you must select the communications channel in the Configuration
bits, e.g., PGC1/EMUC1 and PGD1/EMUD1. Make sure the pins selected here are the
same ones physically connected to the device.
For more on setting up a project and getting started with PICkit 3, see Chapter
4. “General Setup”.
DD from 1.8-5V to a
DD since it can provide a higher
© 2009 Microchip Technology Inc. DS51795A-page 25
Page 30

PICkit™ 3 User’s Guide
NOTES:
DS51795A-page 26 © 2009 Microchip Technology Inc.
Page 31

PICkit™ 3 USER’S GUIDE
Chapter 4. General Setup
4.1 INTRODUCTION
How to get started using the PICkit 3 programmer/debugger is discussed.
• Starting the MPLAB IDE Software
• Creating a Project
• Viewing the Project
• Building the Project
• Setting Configuration Bits
• Setting the Debugger or Programmer
• Debugger/Programme r Lim itatio ns
4.2 STARTING THE MPLAB IDE SOFTWARE
After installing the MPLAB IDE software (Section 3.2 “Installing the Software”),
invoke it by using any of these methods:
•Select Star t>Progra ms>Microch ip>MPLAB I DE vx.xx> MPLAB IDE
the version number.
• Double click the MPLAB IDE desktop icon.
• Execute the fi le mplab.exe in the mplab ide\core subdirectory of the MPLAB
IDE installation directory.
For more information on using the software, see:
• “MPLAB IDE User's Guide” (DS51519) – Comprehensive guide for using MPLAB
IDE.
• The on-line help files – The most up-to-date information on MPLAB IDE and
PICkit 3 program mer /d ebug ger.
• Readme files – Last minute information on each release is included in Readme
for MPLAB IDE.txt and Readme for PICkit 3 Debugger.txt. Both files
are found in the Readmes subdirectory of the MPLAB IDE installation directory.
, where vx.xx i s
4.3 CREATING A PROJECT
The easiest way to create a new project is to select Project>Project Wizard. With the
help of the Project Wizard, a new project and the language tools for building that project
can be created. The wizard will guide you through the process of adding source files,
libraries, etc., to the various “nodes” on the project window. See MPLAB IDE
documentation for more detail on using this wizard. The basic steps are provided here:
• Select your device (e.g., PIC18F45K20)
• Select a language toolsuite (e.g., Microchip C Compiler Toolsuite)
• Name the project
• Add application files (e.g., program.c, support.s, counter.asm)
Note: If you do not have a custom linker script in your project, the Project
Manager will select the appropriate linker script for you.
© 2009 Microchip Technology Inc. DS51795A-page 27
Page 32

PICkit™ 3 User’s Guide
4.4 VIEWING THE PROJ ECT
After the Project Wizard has created a project, the project and its associated files are
visible in the Project window. Right click on any line in the project window tree to pop
up a menu with additional options for adding and removing files.
See MPLAB IDE documentation for more detail on using the Project window.
4.5 BUILDING THE PROJECT
After the project is created, the application needs to be built. This will create object
(hex) code for the application that can be programmed into the target by the PICkit 3
programmer/debugger.
To set build options, select Project>Build Options>Project
.
Note: On the Project Manager toolbar (View>Toolbars>Project Manager
“Debug” from the drop-down list when using the PICkit 3 as a debugger, or
select “Release” when using it as a programmer.
When done, choose Project>Build All
to build the project.
4.6 SETTING CONFIGURATION BITS
Although device Configuration bits may be set in code, they also may be set in the
MPLAB IDE Configuration window. Select Configure>Configuration Bits
the text in the “Settings” column, these can be changed.
Some Configuration bits of interest are:
• Watchdog T imer Enable – On most devices, the Watchdog Timer is enabled
initially. It is usually a good idea to disable this bit.
• Comm Channel Select – For some devices, you will need to select the communications channel for the device, e.g., PGC1/EMUC1 and PGD1/EMUD1. Make
sure the pins selected here are the same ones physically connected to the device.
• Oscillator – Select the configuration setting that matches the target oscillator.
4.7 SETTING THE DEBUGGER OR PROGRAMMER
Select Debugger>Select Tool>PICkit 3 to choose the PICkit 3 programmer/debugger
as the debug tool. The Debugger menu and MPLAB IDE toolbar will change to display
debug options once the tool is selected. Also, the Output window will open and
messages concerning PICkit 3 status and communications will be displayed on the
PICkit 3 tab. For more information, see Section 9.2 “Debugging Functions” and
Section 9.3 “Debugging Dialogs/Windows”.
Select Programmer>Select Programmer>PICkit
programmer/debugger as the programmer tool. The Programmer menu and MPLAB
IDE toolbar will change to display programmer options once the tool is selected. Also,
the Output window will open and messages concerning ICE status and
communications will be displayed on the PICkit 3 tab. For more information, see
Section 9.4 “Programming Functions”.
Select Debugger>Settings
(Section 9.5 “Settings Dialog”) and set up options as needed.
If errors occurs, see:
• Chapter 8. “Error Message s”
• Chapter 7. “Frequently Asked Questions (FAQs)”
or Programmer>Settings to open the Settings dialo g
), select
. By clicking on
3 to choose the PICkit 3
DS51795A-page 28 © 2009 Microchip Technology Inc.
Page 33

4.8 DEBUGGER/PROGRAMMER LIMITATIONS
For a complete list of debugger limitations for your device, please see the PICkit 3
on-line help file in MPLAB IDE by selecting Help>Topics>PICkit 3
General Setup
and click OK.
© 2009 Microchip Technology Inc. DS51795A-page 29
Page 34

PICkit™ 3 User’s Guide
NOTES:
DS51795A-page 30 © 2009 Microchip Technology Inc.
Page 35

PICkit™ 3 USER’S GUIDE
Chapter 5. PICkit 3 Debug Express
5.1 INTRODUCTION
The PICkit 3 Debug Express kit works in conjunction with the MPLAB IDE application
to run, stop and single-step through programs. One or more breakpoints can be set and
the processor can be reset. Once the processor is stopped, the register’s contents can
be examined and modified.
For more information on how to use MPLAB IDE, reference the following
documentation:
• MPLAB
• MPLAB
5.2 PICkit 3 DEBUG EXPRESS KIT CONTENTS
The PICkit 3 Debug Express kit (DV164131) contains the following items:
1. The PICkit 3 Development Programmer/Debugger
2. USB cable
3. 44-Pin Demo Board with device*
4. MPLAB IDE CD-ROM
5. PICkit 3 Debug Express C18 Lessons (tutorials) on CD-ROM
* The Explorer 16 board may also be used to debug.
®
IDE User’s Guide (DS51519)
®
IDE On-line Help
5.3 INSTALLING THE HARDWARE AND SOFTWARE
Install the PICkit 3 hard ware an d software, if no t already d one, as spec ifi ed in
Chapter 3. “Installation”.
Note: PICkit 3 Debug Express requires MPLAB IDE version 8.20 or later.
5.3.1 Reserved Resources
Due to the built-in in-circuit debugging capability of ICD devices and the ICSP function
offered by the debugger, the PICkit 3 Debug Express uses some on-chip resources
when debugging.
For information on device resources that are needed for in-circuit debugging, please
refer to the MPLAB PICkit 3 Help, found in the MPLAB IDE under Help>Topics
device reserved resource information found under “Resources Used By MPLAB
PICkit 3” is the same for the PICkit 3 Debug Express.
5.3.2 Connecting the Demo Board
The PIC18F45K20 included on the 44-Pin Demo Board can be debugged by simply
connecting the demo board to the PICkit 3 as shown in Figure 5-1.
. The
© 2009 Microchip Technology Inc. DS51795A-page 31
Page 36

PICkit™ 3 User’s Guide
FIGURE 5-1: CONNECTING THE DEMO BOARD TO THE PICkit™ 3
5.3.3 Configuration Bits and Debug Express
PIC microcontroller devices that do not require an ICD Header and may be debugged
directly contain a DEBUG
the debug mode on the PIC microcontroller.
This bit is automatically set appropriately by the MPLAB IDE when using PICkit 3
Debug Express and should not be specified in source code configuration settings.
bit in the Configuration Word(s) that enables and disables
CAUTION
The DEBUG configuration bit value should not be specified in source code Configuration settings under normal c onditions. Doing so may cause the bit to be asserte d whe n
programming a device outside the debugger. This will cause the device to function
improperly or not all at in the application circuit.
Many 16-bit PIC microcontroller devices such as PIC24 and dsPIC33 families have
multiple ICSP programming and debugging port pins labeled PGC1/EMUC1 and
PGD1/EMUD1, PGC2/EMUC2 and PGD2/EMUD2, etc. While any ICSP port may be
used for programming, only one port is active at a time for debugging. The active EMU
port is set in the device Configuration bits. If the active port setting does not match the
EMU port to which the PICkit 3 is connected, the device will be unable to enter debug
mode. In the MPLAB IDE Configuration Bits dialog, these bits are usually referred to as
the “Comm Channel Select” bits.
DS51795A-page 32 © 2009 Microchip Technology Inc.
Page 37

PICkit™ 3 USER’S GUIDE
Part 2 – Troubleshooting
Chapter 6. Troubleshooting First Steps..................................................................... 35
Chapter 7. Frequently Asked Questions (FAQs).......................................................37
Chapter 8. Error Messages.............................. .... ........................................................41
© 2009 Microchip Technology Inc. DS51795A-page 33
Page 38

PICkit™ 3 User’s Guide
NOTES:
DS51795A-page 34 © 2009 Microchip Technology Inc.
Page 39

PICkit™ 3 USER’S GUIDE
Chapter 6. Troubleshooting First Steps
6.1 INTRODUCTION
If you are having problems with PICkit 3 programmer/debugger operation, start here.
• The 5 Questions to Answer First
• Top 10 Reasons Why You Can’t Debug
• Other Things to Consider
6.2 THE 5 QUESTIONS TO ANSWER FIRST
1. What device are you working with? Often an upgrade to a newer version of
MPLAB IDE is required to support newer devices. That is, yellow light = untested
support.
2. Are you using a Microchip demo board or one of your own design? Have you followed the guidelines for resistors/capacitors for communications connections?
See Chapter 2. “Theory of Operation”.
3. Have you powered the target? The debugger cannot power the target if greater
than 30 mA.
4. Are you using a USB hub in your set up? Is it powered? If you continue to have
problems, try using the debugger without the hub (plugged directly into the PC.)
5. Are you using the standard communication cable (RJ-11) shipped with debugger? If you have made a longer cable, it can cause communications errors.
6.3 TOP 10 REASONS WHY YOU CAN’T DEBUG
1. The oscillator is not working. Check your Configuration bits setting for the
oscillator.
2. The target board is not powered. Check the power cable connection.
3. The debugger has become physically disconnected from the PC and/or the target board. Check the communications cables’ connections.
4. The device is code-protected. Check your Configuration bit’s setting for code
protection.
5. Y ou are trying to rebuild the project while in Release mode. Select Debug in the
Build Configuration drop-down list on the project toolbar, then rebuild the project.
6. The debugger is selected as a programmer, and not as a debugger, in MPLAB
IDE.
7. The debugger to PC communications has been interrupted. Reconnect to the
debugger in MPLAB IDE.
8. The target application has become corrupted or contains errors.Try rebuilding
and reprogramming the target application. Then initiate a Power-on Reset of the
target.
9. Other configuration settings are interfering with debugging. Any configuration
setting that would prevent the target from executing code will also prevent the
debugger from putting the code into debug mode.
10. The debugger cannot always perform the action requested. For example, the
debugger cannot set a breakpoint if the target application is currently running.
© 2009 Microchip Technology Inc. DS51795A-page 35
Page 40

PICkit™ 3 User’s Guide
6.4 OTHER THINGS TO CONSIDER
1. It is possible the error was a one-time glitch. Try the operation again.
2. There may be a problem programming in general. As a test, switch to programmer mode and program the target with the simplest application possible (e.g., a
program to blink an LED). If the program will not run, then you know that
something is wrong with the target setup.
3. It is possible that the target device has been damaged in some way (e.g., over
current.) Development environments are notoriously hostile to components.
Consider trying another target device.
4. Microchip Technology Inc. offers demonstration boards to support most of its
microcontrollers. Consider using one of these applications, which are known to
work, to verify correct PICkit 3 programmer/debugger functionality.
5. Review debugger debug operation to ensure proper application setup (Chapter
2. “Theory of Operation”.)
6. If the problem persists contact Microchip.
DS51795A-page 36 © 2009 Microchip Technology Inc.
Page 41

Chapter 7. Frequently Asked Questions (FAQs)
7.1 INTRODUCTION
Look here for answers to frequently asked questions about the PICkit 3
programmer/debu gge r system.
• How Does It Work
•What’s Wrong
7.2 HOW DOES IT WORK
• What's in the silicon that allows it to communicate with the PICkit 3
programmer/debugger?
PICkit 3 programmer/debugger can communicate with Flash silicon via the ICSP
interface. It uses the debug executive downloaded into program or test memory.
• How is the throughput of the pro ces sor affe cte d by ha ving to ru n the debug
executive?
The debug executive doesn’t run while in Run mode, so there is no throughput
reduction when running your code, i.e., the debugger doesn’t ‘steal’ any cycles
from the target device.
PICkit™ 3 USER’S GUIDE
• How does the PICkit 3 programmer/debugger compare with other in-circuit
emulators/debuggers?
Please refer to Section 2.2 “PICkit 3 vs. PICkit 2”.
• On the MPLAB ICE 2000/4000 debuggers, the data must come out on the
bus in order to perform a complex trigger on that data. Is this also required
on the PICkit 3 programmer/debugger? For example, co uld I halt based on a
flag going high?
The MPLAB ICE 2000/4000 debuggers use a special debugger chip (-ME) for
monitoring. There is no -ME with the PICkit 3 programmer/debugger so there are
no busses to monitor externally. With the PICkit 3 programmer/debugger, rather
than using external breakpoints, the built-in breakpoint circuitry of the debug
engine is used – the busses and breakpoint logic are monitored inside the part.
• Does the PICkit 3 programmer/debugger have complex bre akpoints like
MPLAB ICE 2000/4000?
No. But you can break based on a value in a data memory location or program
address. See Section 9.3.1 “Breakpoints Dialog” for more information.
• Is the PICkit 3 optoisolated or electrically isolated?
No. You cannot apply a floating or high voltage (120V) to the current system.
• What limitations are there with the standard cable?
The standard ICSP RJ-11 cable does not allow for clock speeds greater than
about 15 Mbps.
© 2009 Microchip Technology Inc. DS51795A-page 37
Page 42

PICkit™ 3 User’s Guide
• Will the PICkit 3 slow down the running of the program?
No, the device will run at any device speed as specified in the data sheet.
• Is it possible to debug a dsPIC DSC running at any speed?
The PICkit 3 is capable of debugging at any device speed as specified in the
device’s data sheet.
• What is the function of pin 6, the LVP pin?
Pin 6 is reserved for the LVP (Low-Voltage Programming) connection.
7.3 WHAT’S WRONG
• My PC went into power-down/hibernate mode, and now my debugger won’t
work. What happened?
When using the debugger for prolonged periods of time, and especially as a
debugger, be sure to disable the Hibernate mode in the Power Options Dialog
window of your PC’s operating system. Go to the Hibernate tab and clear or
uncheck the “Enable hibernation” check box. This will ensure that all
communication is maintained across all the USB subsystem components.
• I set my peripheral to NOT freeze on halt, but it is suddenly freezing. What's
going on?
For dsPIC30F/33F and PIC24F/H devices, a reserved bit in the peripheral control
register (usually either bit 14 or 5) is used as a Freeze bit by the debugger. If you
have performed a write to the entire register, you may have overwritten this bit.
(The bit is user-accessible in Debug mode.)
To avoid this problem, write only to the bits you wish to change for your application
(BTS, BTC) instead of to the entire register (MOV).
• When using a 16-bit device, an unexpected reset occurred. How do I
determine what caused it?
Some things to consider:
- To determine a reset source, check the RCON register.
- Handle traps/interrupts in an Interrupt Service Routine (ISR). You should
include trap.c style code, i.e.,
void __attribute__((__interrupt__)) _OscillatorFail(void);
:
void __attribute__((__interrupt__)) _AltOscillatorFail(void);
:
void __attribute__((__interrupt__)) _OscillatorFail(void)
{
INTCON1bits.OSCFAIL = 0; //Clear the trap flag
while (1);
}
:
void __attribute__((__interrupt__)) _AltOscillatorFail(void)
{
INTCON1bits.OSCFAIL = 0;
while (1);
}
:
- Use ASSERTs.
DS51795A-page 38 © 2009 Microchip Technology Inc.
Page 43

Frequently Asked Questions (FAQs)
• I have finished debugging my code. Now I’ve programmed my part, but it
won’t run. What’s wrong?
Some things to consider are:
- Have you selected the debugger as a programmer and then tried to program
a header board? A header board contains an -ICE/-ICD version of the device
and may not function like the actual device. Only program regular devices
with the debugger as a programmer. Regular devices include devices that
have on-board ICE/ICD circuitry, but are not the special -ICE/-ICD devices
found on header boards.
- Have you selected the debugger as a debugger and then tried to program a
production device? Programming a device when the debugger is a debugger
will program a debug executive into program memory and set up other device
features for debug (see Section 2.6.1 “Sequence of Operations Leading to
Debugging”). To program final (release) code, select the debugger as a
programmer.
- Have you selected “Release” from the Build Configuration drop-down list or
Project menu? You must do this for final (release) code. Rebuild your project,
reprogram the device, and try to run your code again.
• I don’t see my problem here. Now what?
Try the following resour ces:
- Chapter 9. “Limitations”
- Section 2.8 “Resources Used by the Debugger”
- Section 8.2 “Specific Error Messages”
- Section 8.3 “General Corrective Actions”
© 2009 Microchip Technology Inc. DS51795A-page 39
Page 44

PICkit™ 3 User’s Guide
NOTES:
DS51795A-page 40 © 2009 Microchip Technology Inc.
Page 45

Chapter 8. Error Messages
8.1 INTRODUCTION
The PICkit 3 programmer/debugger produces many different error messages; some
are specific and others can be resolved with general corrective actions.
• Specific Error Messages
• General Corrective Actions
8.2 SPECIFIC ERROR MESSAGES
PICkit 3 programmer/debugger error messages are listed below in numeric order.
Note: Numbers may not yet appear in displayed messages. Use the Search tab
on the Help viewer to find your message and highlight it below.
Text in error messages listed below of the form %x (a variable) will display as text
relevant to your particular situation in the actual error message.
PK3Err0001: Failed while writing to program memory.
PK3Err0002: Failed while writing to EEPROM.
PK3Err0003: Failed while writing to configuration memory.
See Section 8.3.1 “Read/Write Error Actions”.
PK3Err0005: PICkit 3 is currently busy and cannot be unloaded at this time.
If you receive this error when attempting to deselect the debugger as a debugger
or programmer:
1. Wait – give the debugger time to finish any application tasks. Then try to
deselect the debugger again.
2. Select Halt to stop any running applications. Then try to deselect the
debugger again.
3. Unplug the debugger from the PC. Then try to deselect the debugger again.
4. Shut down MPLAB IDE.
PK3Err0006: Failed while writing to user ID memory.
PK3Err0007: Failed while reading prog ram memory.
PK3Err0008: Failed while reading EEPROM.
PK3Err0009: Failed while reading configuration memory.
PK3Err0010: Failed while reading user ID memory.
See Section 8.3.1 “Read/Write Error Actions”.
PK3Err0011: Bulk erase failed.
See Section 8.3.1 “Read/Write Error Actions”.
If these do not work, try another device.
PICkit™ 3 USER’S GUIDE
© 2009 Microchip Technology Inc. DS51795A-page 41
Page 46

PICkit™ 3 User’s Guide
PK3Err0012: Download debug exec failed
If you receive this error while attempting to program from the Debugger menu:
1. Deselect the debugger as the debug tool.
2. Close your project and then close MPLAB IDE.
3. Restart MPLAB IDE and re-open your project.
4. Reselect the debugger as your debug tool and attempt to program your
target device again.
If this does not work, see Section 8.3.4 “Corrupted Installation Actions”.
PK3Err001 3: NMMR register write failed.
PK3Err0014: File register write failed.
See Section 8.3.2 “Debugger-to-Target Communication Error Actions”.
PK3Err0015: Data transfer was unsuccessful. %d byte(s) expected, %d byte(s)
transferred.
See Section 8.3.3 “Debugger-to-PC Communication Error Actions”.
PK3Err0016: Cannot transmit. PICkit 3 not found.
The debugger is not connected to the PC.
PK3Err0017: File register read failed.
PK3Err0018: NMMR register read failed.
PK3Err0019: Failed while reading emulation registers.
PK3Err0020: Failed while writing emulation registers.
See Section 8.3.2 “Debugger-to-Target Communication Error Actions”.
PK3Err0021: Command not echoed properly. Sent %x, received %x.
PK3Err0022: Failed to get PICkit 3 version information.
PK3Err0024: Download RS failed.
PK3Err0025: Download AP failed.
See Section 8.3.3 “Debugger-to-PC Communication Error Actions”.
PK3Err0026: Download program exec failed.
If you receive this error while attempting to program from the Debugger menu:
1. Deselect the debugger as the debug tool.
2. Close your project and then close MPLAB IDE.
3. Restart MPLAB IDE and re-open your project.
4. Reselect the debugger as your debug tool and attempt to program your
target device again.
If this does not work, see Section 8.3.4 “Corrupted Installation Actions”.
PK3Err0027: Bulk transfer failed due to invalid checksum
See Section 8.3.3 “Debugger-to-PC Communication Error Actions”.
Also, ensure that the cables used are the correct length.
PK3Err0028: Download device database failed
If you receive this error:
1. Try downloading again. It may be a one-time error.
2. Try manually downloading. Select Debugger>Settings
and click Manual Download. Select the highest number .jam file and click
Open.
, Configuration tab,
DS51795A-page 42 © 2009 Microchip Technology Inc.
Page 47

Error Messages
PK3Err0029: Communication failure. Unexpected command echo response %x
received from PICkit 3.
See Section 8.3.3 “Debugger-to-PC Communication Error Actions”.
PK3Err0030: Unable to read/find firmware File %s.
If the Hex file exists:
• Reconnect and try again.
• If this does not work, the file may be corrupted. Reinstall MPLAB IDE.
If the Hex file does not exist:
• Reinstall MPLAB IDE.
PK3Err0031: Failed to get PC.
PK3Err0032: Failed to set PC.
See Section 8.3.2 “Debugger-to-Target Communication Error Actions”.
PK3Err0033: %d bytes expected, %d bytes received.
See Section 8.3.3 “Debugger-to-PC Communication Error Actions”.
PK3Err0034: This version of MPLAB IDE does not support hardware revision
%06x. Please upgrade to the latest version of MPLAB IDE before continuing.
Find the l atest MPLAB IDE at www.microchip.com.
PK3Err0035: Failed to get Device ID.
See Section 8.3.1 “Read/Write Error Actions”.
PK3Err0036: MPLAB IDE has lost communication with PICkit 3.
See Section 8.3.3 “Debugger-to-PC Communication Error Actions”.
PK3Err0037: Timed out waiting for response from PICkit 3.
PK3Err0038: Failed to initialize PICkit 3.
PK3Err0039: PICkit 3 self-test failed.
For this error, the debugger is not responding:
1. Unplug and plug in the debugger.
2. Reconnect to the debugger in MPLAB IDE.
3. If the problem persists contact Microchip.
PK3Err0040: The target device is not ready for debugging. Please check your
configuration bit settings and program the device before proceeding.
You will receive this message when you have not programmed your device for
the first time and try to Run. If you receive this message after this, or immediately
after programming your device, please refer to Section 8.3.6 “Debug Failure
Actions”.
PK3Err0043: RS download failed.
PK3Err0044: AP download failed.
PK3Err0045: You must connect to a target device to use PICkit 3.
No power has been found.
1. Ensure V
2. Ensure that the target is powered.
3. Ensure that the target power is sufficient to be detected by the debugger (see
Chapter 10. “H a rdw are Specificatio n”.)
PK3Err0046: An error occurred while trying to read the stopwatch count. The
stopwatch count may not be accurate.
DD and GND are connected between the debugger and target.
© 2009 Microchip Technology Inc. DS51795A-page 43
Page 48

PICkit™ 3 User’s Guide
See Section 8.3.2 “Debugger-to-Target Communication Error Actions”.
PK3Err0047: Bootloader download failed.
See Section 8.3.3 “Debugger-to-PC Communication Error Actions”.
PK3Err0052: The current PICkit 3 hardware version %x, is out of date. This
version of MPLAB IDE will support only version %x or higher.
Did you click Cancel when asked to download the latest firmware? If so, you will
need to download it now. Select Debugger>Settings
click Manual Download. Select the highest number .jam file and click Open.
If you cannot find any files to download or if this does not work (corrupted file),
you will need to get the latest version of MPLAB IDE and install it. Find the latest
MPLAB IDE at www.microchip.com.
PK3Err0053: Unable to get PICkit 3 protocol versions.
See Section 8.3.3 “Debugger-to-PC Communication Error Actions”.
PK3Err0054: MPLAB IDE's PICkit 3 protocol definitions are out of date. Y ou must
upgrade MPLAB IDE to continue.
Find the latest MPLAB IDE at www.microchip.com.
PK3Err0055: Unable to set firmware suite version.
PK3Err0056: Unable to get voltages from PICkit 3.
See Section 8.3.3 “Debugger-to-PC Communication Error Actions”.
PK3Err0068: Failed while writing to boot FLASH memory.
PK3Err0069: Failed while reading boot FLASH memory.
PK3Err0070: Failed while writing peripheral memory.
PK3Err0071: Failed while reading peripheral memory.
See Section 8.3.1 “Read/Write Error Actions”.
PK3Err0073: Device is code protected.
The device on which you are attempting to operate (read, program, blank check
or verify) is code protected, i.e., the code cannot be read or modified. Check your
Configuration bits setting for code protection.
T o disable code protection, set or clear the appropriate Configuration bits in code
or in the Configuration Bits window (Configure>Configuration Bits
the device data sheet. Then erase and reprogram the entire device.
PK3Err0075: Unable to set power.
PICkit 3 cannot supply power to the target.
PK3Err0080: Failed setting shadow bit(s).
, Configuration tab, and
), according to
8.3 GENERAL CORRECTIVE ACTIONS
These general corrective actions may solve your problem:
• Read/Write Error Actions
• Debugger-to-Target Communication Error Actions
• Debugger-to-PC Communication Error Actions
• Corrupted Installation Actions
• USB Port Communication Error Actions
• Debug Failure Actions
• Internal Error Actions
DS51795A-page 44 © 2009 Microchip Technology Inc.
Page 49

Error Messages
8.3.1 Read/Write Error Actions
If you receive a read or write error:
1. Did you hit Abort? This may produce read/write errors.
2. Try the action again. It may be a one-time error.
3. Ensure that the target is powered and at the correct voltage levels for the device.
See the device data sheet for required device voltage levels.
4. Ensure that the debugger-to-target connection is correct (PGC and PGD are
connected.)
5. For write failures, ensure that “Erase all before Program” is checked on the
Program Memory tab of the Settings dialog.
6. Ensure that the cables used are of the correct length.
8.3.2 Debugger-to-Target Communication Error Actions
The PICkit 3 programmer/debugger and the target device are out-of-sync with each
other.
1. Select Reset and then try the action again.
2. Ensure that the cable(s) used are the correct length.
8.3.3 Debugger-to-PC Communication Error Actions
The PICkit 3 programmer/debugger and MPLAB IDE are out-of-sync with each other.
1. Unplug and then plug in the debugger.
1. Reconnect to the debugger.
2. Try the operation again. It is possible the error was a one time glitch.
3. The version of MPLAB IDE installed may be incorrect for the version of firmware
loaded on the PICkit 3 programmer/debugger. Follow the steps outlined in
Section 8.3.4 “ Corru pted Installation Actions”.
8.3.4 Corrupted Installation Actions
The problem is most likely caused by a incomplete or corrupted installation of MPLAB
IDE.
1. Uninstall all versions of MPLAB IDE from the PC.
2. Reinstall the desired MPLAB IDE version.
3. If the problem persists contact Microchip.
8.3.5 USB Port Communication Error Actions
The problem is most likely caused by a faulty or non-existent communications port.
1. Reconnect to the PICkit 3 programmer/debugger
2. Make sure the debugger is physically connected to the PC on the appropriate
USB port.
3. Make sure the appropriate USB port has been selected in the debugger Settings.
4. Make sure the USB port is not in use by another device.
5. If using a USB hub, make sure it is powered.
6. Make sure the USB drivers are loaded.
8.3.6 Debug Failure Actions
The PICkit 3 programmer/debugger was unable to perform a debugging operation.
There are numerous reasons why this might occur. See Section 6.3 “Top 10 Reasons
Why You Can’t Debug” and Section 6.4 “Other Things to Consider”.
© 2009 Microchip Technology Inc. DS51795A-page 45
Page 50

PICkit™ 3 User’s Guide
8.3.7 Internal Error Actions
Internal errors are unexpected and should not happen. They are primarily used for
internal Microchip development.
The most likely cause is a corrupted installation (Section 8.3.4 “Corrupted
Installation Actions”).
Another likely cause is exhausted system resources.
1. Try rebooting your system to free up memory.
2. Make sure you have a reasonable amount of free space on your hard drive (and
that it is not overly fragmented.)
If the problem persists contact Microchip.
DS51795A-page 46 © 2009 Microchip Technology Inc.
Page 51

PICkit™ 3 USER’S GUIDE
Part 3 – Reference
Chapter 9. Debugger Function Summary..................................................................49
Chapter 10. Hardware Specification...........................................................................59
© 2009 Microchip Technology Inc. DS51795A-page 47
Page 52

PICkit™ 3 User’s Guide
NOTES:
DS51795A-page 48 © 2009 Microchip Technology Inc.
Page 53

Chapter 9. Debugger Function Summary
9.1 INTRODUCTION
A summary of the PICkit 3 programmer/debugger functions on menus, in windows and
on dialogs is listed here.
• Debugging Functions
• Debugging Dialogs/Windows
• Programming Functions
• Settings Dialog
9.2 DEBUGGING FUNCTIONS
When you select the PICkit 3 from the Debugger menu, the following items will be
added to the MPLAB IDE functions:
• Debugger Menu – additional options are added to the drop-down menu
• Right Mouse Button Debugger Menu – additional options are added to this menu
• Toolbars/Status Bar – a toolbar appears below the menu bar; additional
information appears in the status bar
PICkit™ 3 USER’S GUIDE
9.2.1 Debugger Menu
Run F9
Execute program code until a breakpoint is encountered or until Halt is selected.
Execution starts at the current Program Counter (as displayed in the status bar). The
current Program Counter location is also represented as a pointer in the Program
Memory window. While the program is running, several other functions are disabled.
Animate
Animate causes the debugger to actually execute single steps while running, updating
the values of the registers as it runs.
Animate runs slower than the Run function, but allows you to view changing register
values in the Special Function Register window or in the Watch window.
To Halt Animate, use the menu option Debugger>Halt
Halt F5
Halt (stop) the execution of program code. When you click Halt, status information is
updated.
Step Into F7
Single step through program code.
For assembly code, this command executes one instruction (single or multiple cycle
instructions) and then halts. After execution of one instruction, all the windows are
updated.
, the toolbar Halt or <F5>.
© 2009 Microchip Technology Inc. DS51795A-page 49
Page 54

PICkit™ 3 User’s Guide
For C code, this command executes one line of C code, which may mean the execution
of one or more assembly instruction, and then halts. After execution, all the windows
are updated.
Note: Do not step into a SLEEP instruction.
Step Over F8
Execute the instruction at the current program counter location. At a CALL instruction,
Step Over executes the called subroutine and halts at the address following the CALL.
If the Step Over is too long or appears to “hang”, click Halt.
Step Out
Not available.
Reset > Processor Reset F6
Issue a Reset sequence to the target processor. This issues a MCLR
program counter to the Reset vector.
Breakpoints
Open the Breakpoint dialog (see Section 9.3.1 “Breakpoint s Dialog”). Use hardware
breakpoints to halt code execution at specified lines in your code. Set multiple
breakpoints in this dialog.
to reset the
Note: You may also right click or double click on a line of code to set a simple
breakpoint.
Program
Download your code to the target device.
Read
Read target memory. Information uploaded to MPLAB IDE.
Erase Flash Device
Erase all Flash memory.
Abort Operation
Abort any programming operation (e.g., program, read, etc.). Terminating an operation
will leave the device in an unknown state.
Reconnect
Attempt to re-establish communications between the PC and the PICkit 3
programmer/debugger. The progress of this connection is shown on the PICkit 3 tab of
the Output dialog.
Settings
Open the PICkit 3 Settings dialog (see Section 9.5 “Settings Dialog”). Set up
program and firmware options.
DS51795A-page 50 © 2009 Microchip Technology Inc.
Page 55

Debugger Function Summary
9.2.2 Right Mouse Button Debugger Menu
These debugger menu options will appear on the right mouse menus in code displays,
such as program memory and source code files. Descriptions of other menu options
not listed here can be found in the MPLAB IDE Help or the MPLAB Editor Help.
Set Breakpoint
Set or remove a breakpoint at the currently selected line.
Breakpoints
Remove, enable or disable all breakpoints.
Run To Cursor
Run the program to the current cursor location. Formerly Run to Here.
Set PC at Cursor
Set the Program Counter (PC) to the cursor location.
Center Debug Location
Center the current PC line in the window.
9.2.3 Toolbars/Status Bar
When the PICkit 3 programmer/debugger is selected as a debugger, these toolbars are
displayed in MPLAB IDE:
• Basic debug toolbar (Run, Halt, Animate, Step Into, Step Over, Step Out, Reset,
Breakpoints).
• Simple program toolbar (Program, Read, Erase Flash Device).
The selected debug tool (PICkit 3), as well as other development information, is
displayed in the status bar on the bottom of the MPLAB IDE desktop. Refer to the
MPLAB IDE on-line help for information on the contents of the status bar.
9.3 DEBUGGING DIALOGS/WINDOWS
Open the following debug dialogs and windows using the menu items mentioned in
Section 9.2 “Debugging Functions”.
• Breakpoints Dialog
- Set Breakpoint Dialog
- Stopwatch Dialog
- Event Break points Dialog
9.3.1 Breakpoints Dialog
To set up breakpoints, select Debugger>Breakpoints.
Set up different types of breakpoints in this dialog. Click on Add Breakpoint to add
breakpoints to the dialog window. Depending on your selected device, there may be
other buttons for more advanced breakpoint options.
© 2009 Microchip Technology Inc. DS51795A-page 51
Page 56

PICkit™ 3 User’s Guide
9.3.1.1 BREAKPOINT DIALOG WINDOW
Information about each breakpoint is visible in this window.
TABLE 9-1: BREAKPOINT DIALOG WINDOW
Control Function
Breakpoint Type Type of breakpoint – program or data
Address Hex address of breakpoint location
File Line #/Symbol Name File name and line number of breakpoint location
Enabled Check to enable a breakpoint
Once a breakpoint has been added to the window, you may right click on it to open a
menu of options:
• Delete – delete selected breakpoint
• Edit/View – open the Set Breakpoint Dialog
• Delete All – delete all listed breakpoints
• Disable All – disable all listed breakpoints
9.3.1.2 BREAKPOINT DIALOG BUTTONS
Use the buttons to add a breakpoint and set up additional break conditions. Also, a
stopwatch is available for use with breakpoints and triggers.
Note: Buttons displayed will depend on the selected device.
TABLE 9-2: BREAKPOINT DIALOG BUTTONS
Control Function Related Dialog
Add Breakpoint Add a breakpoint Section 9.3.2 “Set Breakpoint Dialog”
Stopwatch Set up the stopwatch Section 9.3.3 “Stopwatch Dialog”
Event Breakpoints Set up break on an event Section 9.3.4 “Event Breakpoints
Dialog”
DS51795A-page 52 © 2009 Microchip Technology Inc.
Page 57

Debugger Function Summary
9.3.2 Set Breakpoint Dialog
Click Add Breakpoint in the Breakpoints Dialog to display this dialog.
Select a breakpoint for the Breakpoints dialog here.
9.3.2.1 PROGRAM MEMORY TAB
Set up a program memory breakpoi nt here.
TABLE 9-3: PROGRAM MEMORY BREAKPOINT
Control Function
Address Location of breakpoint in hex
Breakpoint Type The type of program memory breakpoint. See the device data
sheet for mor e information on table reads/writes.
Program Memory Execution
address
TBLRD Program Memory – break on table read of above address
TBLWT Program Memory
Pass Count Break on pass count condition.
Always break
Break occurs Count instructions after Event
instructions before breaking after event specified in “Breakpoint
type”
Event must occur Count times
“Breakpoint type” occurs Count (0-255) times
– always break as specified in “Breakpoint type”
– break on execution of above
– break on table write to above address
– wait Count (0 - 255)
– break only aft er even t spec ified i n
9.3.2.2 DATA MEMORY TAB
Set up a data memory breakpoint here.
TABLE 9-4: DATA MEMORY BREAKPOINT
Control Function
Address Location of breakpoint in hex
Breakpoint Type The type of dat a memo ry breakp oint. See t he devic e data sheet fo r
more information on X Bus reads/writes.
X Bus Read
X Bus Read Specific Byte
address for the specific byte val ue in “Specific Value”
X Bus Read Specific Word
address for the specific word value in “Specific Value”
X Bus Write
X Bus Write Specific Byte
address for the specific byte val ue in “Specific Value”
X Bus Write Specific Word
address for the specific word value in “Specific Value”
Pass Count Break on pass count condition.
Always break – always break as specified in “Breakpoint type”
Break occurs Count instructions after Event
instructions before breaking after event specified in “Breakpoint
type”
Event must occur Count times
“Breakpoint type” occurs Count (0-255) times
– break on an X bus read of a bove address
– break on an X bus read of above
– break on an X bus read of above
– break on an X bus write of above address
– break on an X bus write of above
– break on an X bus write of above
– wait Count (0 - 255)
– break only aft er even t spec ified i n
© 2009 Microchip Technology Inc. DS51795A-page 53
Page 58

PICkit™ 3 User’s Guide
9.3.3 Stopwatch Dialog
Click Stopwatch in the Breakpoints Dialog to display the Stopwatch Setup dialog.
Use the stopwatch with breakpoints to time code execution. The stopwatch allows tim-
ing from one breakpoint/trigger condition to the next. The stopwatch value is in decimal.
TABLE 9-5: STOPWATCH SETUP
Control Function
Start Condition Select an available breakpoint or trigger condition to start the stop-
Stop Condition Select an available breakpoint or trigger condition to stop the stop-
Reset stopwatch on run Reset the stopwatch values to zero every time the program is run.
watch. Available breakpoints/triggers are those previously added
to the breakpoint dialog.
Select None to clear the start condition.
To halt the program run on this conditio n, check the che ck box n ext
to “Sta rt condition will cause the target device to halt”.
watch. Available breakpoints/triggers are those previously added
to the breakpoint dialog.
Select None to clear the stop condition.
To halt the program run on this conditio n, check the che ck box n ext
to “Stop condition will cause the target device to halt”.
To set a breakpoint in code, do one of the following:
• Double click or right click on a line of code to set up an individual breakpoint.
•Select Debugger>Breakpoints
to open the Breakpoints dialog and set up multiple
breakpoints and breakpoint conditions. See Section 9.3.1 “Breakpoints Dialog”
for more information.
To determine the time between the breakpoints, use the stopwatch:
1. Open the Breakpoints dialog (Debugger>Breakpoints
).
1. Click Stopwatch on the Breakpoints dialog to open the Stopwatch dialog.
2. Under “Start Condition”, select a breakpoint from the drop-down list. Also decide
if “Start condition will cause the target device to halt”.
3. Under “Stop Condition”, select another breakpoint from the drop-down list. Also
decide if “Stop condition will cause the target device to halt”.
4. Decide if there will be a “Reset stopwatch on run”.
5. Click OK.
9.3.4 Event Breakpoints Dialog
Click Event Breakpoints in the Breakpoints Dialog to display this dialog.
Select a condition where the program will always break:
• Break on Watchdog Timer – Break every time the Watchdog Timer times out.
Make sure the Watchdog Timer is enabled in the Configuration bits.
• Break on SLEEP instruction – Break when a SLEEP instruction is encountered in
the program.
DS51795A-page 54 © 2009 Microchip Technology Inc.
Page 59

9.4 PROGRAMMING FUNCTIONS
When you select the PICkit 3 programmer/debugger from the Programmer menu,
program items will be added to the following MPLAB IDE functions:
• Programmer Menu
• Toolbars/Status Bar
9.4.1 Programmer Menu
Program
Program specified memory areas: program memory, Configuration bits, ID locations
and/or EEPROM data. See the Settings dialog for programming options.
Verify
Verify programming of specified memory areas: program memory, Configuration bits,
ID locations and/or EEPROM data.
Read
Read specified memory areas: program memory, Configuration bits, ID locations
and/or EEPROM data. See the Settings dialog for read options.
Blank Check All
Check to see that all device memory is erased/blank.
Debugger Function Summary
Erase Flash Device
Erase all Flash memory.
Abort Operation
Abort any programming operation (e.g., program, read, etc.). Terminating an operation
will leave the device in an unknown state.
Reconnect
Attempt to re-establish communications between the PC and the PICkit 3
programmer/debugger. The progress of this connection is shown on the PICkit 3 tab of
the Output dialog.
Settings
Open the Programmer dialog (see Section 9.5 “Settings Dialog”). Set up program
and firmware options.
9.4.2 Toolbars/Status Bar
When the PICkit 3 programmer/debugger is selected as a programmer, these toolbars
are displayed in MPLAB IDE:
• Basic program toolbar (Program, Read, Verify, Erase Flash Device, Blank Check
All).
The selected programmer (PICkit 3), as well as other programming information, is
displayed in the status bar on the bottom of the MPLAB IDE desktop. Refer to the
MPLAB IDE on-line help for information on the contents of the status bar.
© 2009 Microchip Technology Inc. DS51795A-page 55
Page 60

PICkit™ 3 User’s Guide
9.5 SETTIN GS DIALOG
Select either Debugger>Settings or Programmer>Settings to open the Settings dialog
and set up the PICkit 3 programmer/debugger.
Note: Tabs displayed will depend on the selected device.
• Settings Dialog, Program Memory Tab
• Settings Dialog, Configuration Tab
• Settings Dialog, Freeze on Halt Tab
• Settings Dialog, Status Tab
• Settings Dialog, Clock Tab
• Settings Dialog, Secure Segment Tab
• Settings Dialog, Warnings Tab
• Settings Dialog, Power Tab
• Settings Dialog, Limitations Tab
9.5.1 Settings Dialog, Program Memory Tab
This tab allows you to set up debug/programming options.
TABLE 9-6: PROGRAM MEMORY OPTIONS
Allow PICkit 3 to select
memories and ranges
Manually select memories
and ranges
Memories:
Program Check to program Program Memory into target.
Configuration Check to program Configuration bits into target.
EEPROM Check to erase and then program EEPROM memory on
ID Check to program ID Memory into target.
Boot Flash If supported, check to program boot memory on target
Program Memory Range:
Start, End The starting and ending hex address range in program
Program Options
Erase all before Program Check to erase all memory before programming begins.
Preserve Program Memory
Range
:
If selected, the PICkit™ 3 uses your selected device and
default settings to determi ne what to program.
If selected, you must determine the Memories, Program
Memory Range, and Program Options for the selected
device.
Note: This memory is always programmed when
debugger selected as a debugger.
target, if available. Uncheck to erase EEPROM memory
on target.
memory for programming, reading, or verification.
If you receive a programming error due to an incorrect
end address, you need to perform a reconnect, correct
the end address and program again.
Note: The address range does not apply to the Erase
function. The Erase function will erase all data on the
device.
Unless programming new or already erased devices, it is
important to have this box checked. If not checked, the
device is not erased and program code will be merged
with the code already in the device.
Check to preserve memory range.
Start , End – The st arting and ending he x address rang e in
program memory for p reservati on.
DS51795A-page 56 © 2009 Microchip Technology Inc.
Page 61

Debugger Function Summary
TABLE 9-6: PROGRAM MEMORY OPTIONS (CONTINUED)
Automatically
Program after successful
build
Run after successful program After the application code is successfully programmed
9.5.2 Settings Dialog, Configuration Tab
Configure debugger operation on this tab.
TABLE 9-7: CONFIGURATION ITEMS
Download Firmware Set up firmware download options.
Auto Download Latest
Firmware
Manual Download Manually select a firmware file to download to the target device.
9.5.3 Settings Dialog, Freeze on Halt Tab
Select peripherals to freeze on halt on this tab.
PIC18 MCU Devices
To freeze/unfreeze all device peripherals on halt, check/uncheck the “Freeze on Halt”
checkbox. If this does not halt your desired peripheral, be aware that some peripherals
have no freeze on halt capability and cannot be controlled by the debugger.
After the application code successfully builds, program
this code into the device.
into the target device, run the code.
Check to allow automatic download of the latest version of
firmware for the target device (recommended).
dsPIC30F/33F, PIC24F/H and PIC32MX Devices
For peripherals in the list “Peripherals to Freeze on Halt”, check to freeze that
peripheral on a halt. Uncheck the peripheral to let it run while the program is halted. If
you do not see a peripheral on the list, check “All Other Peripherals”. If this does not
halt your desired peripheral, be aware that some peripherals have no freeze on halt
capability and cannot be controlled by the debugger.
To select all peripherals, including “All Other Peripherals”, click Check All. T o deselect
all peripherals, including “All Other Peripherals”, click Uncheck All.
9.5.4 Settings Dialog, Status Tab
View the status of your PICkit 3 system on this tab.
TABLE 9-8: STATUS ITEMS
Versions
Firmware Suite Version Debugger firmware suite version. The firmware suite consists of
the three items specified below.
Algorithm Plug-in Version Debugger algorithm plug-in version. For your selected device, an
algorithm is used to support the device plugged into the target.
OS Version Debugger operating system version.
Voltages
PICkit™ 3 V
PICkit 3 VDD Debugger VDD.
Refresh Voltages Sensing of Status tab items occurs when the tab is activated. To
PP Debugger VPP.
see updates, click this button.
© 2009 Microchip Technology Inc. DS51795A-page 57
Page 62

PICkit™ 3 User’s Guide
9.5.5 Settings Dialog, Clock Tab
The debug clock mode is selected on this tab. Check the box for “FRC in debug mode”
to use the fast RC clock while debugging.
Device emulation occurs at the speed of the processor. If it is running at low frequency
(for example 32kHz), all operations such as stepping, refreshing the watch window, etc.
are slow. However, some processors have a built-in Fast RC oscillator. If the “FRC in
debug mode” option is checked, after the application running at normal speed halts, it
switches to the faster oscillator enabling emulation and peripherals (if not frozen) to run
faster.
9.5.6 Settings Dialog, Secure Segment Tab
For CodeGuard™ Security devices, set up secure segment properties on this tab.
For more details on CodeGuard Security functionality, please refer to the CodeGuard
Security reference manual for 16-bit devices (DS70180) and dsPIC33F/PIC24H and
dsPIC30F device programming specifications found on our website.
TABLE 9-9: SECURE SEGMENT OPTIONS
Full Chip Programming Click to select to program all program memory segments.
Segment Programming Click to select segment programming. Select from:
- Boot, secure and general segments
- Secure and general segments
- General segment only
9.5.7 Settings Dialog, W arnings Tab
A list of all PICkit 3 programmer/debugger warnings are displayed on this tab.
• Check a warning to enable it. The warning will be displayed in the Output window.
• Uncheck a warning to disable it.
Warnings are not errors and will not stop your project from building. If you receive error
messages, please see Chapter 8. “Error Messages”.
9.5.8 Settings Dialog, Power Tab
Set up the power options on this tab.
Click in the checkbox to enable/disable “Power target circuit from PICkit 3”.
Adjust the slide bar to select the voltage. The value in the field changes according to
your adjustments.
9.5.9 Settings Dialog, Limitations T ab
This tab displays general limitations for the selected device. For specific limitation
information, click Details.
DS51795A-page 58 © 2009 Microchip Technology Inc.
Page 63

Chapter 10. Hardware Specification
10.1 INTRODUCTION
The hardware and electrical specifications of the PICkit 3 programmer/debugger
system are detail e d.
10.2 HIGHLIGHTS
This chapter discusses:
• Declaration of Conformity
• USB Port/Power
• PICkit 3 Programmer/Debugger
• Standard Communication Hardware
• Target Board Considerations
10.3 DECLARATION OF CONFORMITY
We
Microchip T echnology, Inc.
2355 W. Chandler Blvd.
Chandler, Arizona 85224-6199
USA
hereby declare that the product:
PICkit 3 Programmer/Debugger
complies with the following standards, provided that the restrictions stated in the
operating manual are observed:
Standards: EN61010-1 Laboratory Equipment
Microchip T echnology, Inc.
Date: January 2009
Important Information Concerning the Use of the PICkit 3 programmer/
Due to the special nature of the PICkit 3 programmer/debugger, the user is advised that
it can generate higher than normal levels of electromagnetic radiation which can
interfere with the operation of all kinds of radio and other equipment.
T o comply with the European Approval Regulations therefore, the following restrictions
must be observed:
1. The development system must be used only in an industrial (or comparable)
area.
2. The system must not be operated within 20 meters of any equipment which may
be affected by such emissions (radio receivers, TVs etc.).
PICkit™ 3 USER’S GUIDE
Debugger
© 2009 Microchip Technology Inc. DS51795A-page 59
Page 64

PICkit™ 3 User’s Guide
10.4 USB PORT/POWER
The PICkit 3 programmer/debugger is connected to the host PC via a mini Universal
Serial Bus (USB) port, version 2.0 compliant. The USB connector is located on the top
of the pod.
The system is capable of reloading the firmware via the USB interface.
System power is derived from the USB interface. The debugger is classified as a high
power system per the USB specification, and requires slightly more than 100 mA of
power from the USB to function in all operational modes (debugger/programmer).
Note: The PICkit 3 programmer/debugger is powered through its USB
connection. The target board is powered from its own supply. Alternatively,
the PICkit 3 can power it only if the target consumes less than 30 mA.
Cable Length – The PC-to-debugger cable length for proper operation is shipped in
the debugger kit.
Powered Hubs – If you are going to use a USB hub, make sure it is self-powered. Also,
USB ports on PC keyboards do not have enough power for the debugger to operate.
PC Hibernate/Power-Down Modes – Disable the hibernate or other power saver
modes on your PC to ensure proper USB communications with the debugger.
10.5 PICKIT 3 PROGRAMMER/DEBUGGER
The debugger consists of a main board enclosed in the casing with a USB connector
and a single in-line connector. On the debugger enclosure are indicator lights (LEDs).
10.5.1 Main Board
This component has the interface processor with integrated USB 2.0 interface capable
an SPI, serial EE for programming into the emulation device on-board Flash and LED
indicators.
10.5.2 Indicator Lights (LEDs)
The indicator lights have the following significance.
LED Color Description
Power Green Lit when power is first applied or when target is connected.
Active Blue Lit when the PICkit™ 3 has established communication with the
PC or sending/receiving commands.
Status Green Lit when the debugger is operating normally – standby.
Yellow Lit when an operation is busy.
Red Lit when the debugger has failed.
DS51795A-page 60 © 2009 Microchip Technology Inc.
Page 65

Hardware Specification
12345
6
Pin Name Function
1MCLR
/VPP Power
2V
DD_TGT Power on target
3 GND Ground
4 PGD (ICSPDAT) Standard Com Data
5 PGC (ICSPCLK) Standard Com Clock
6 LVP Low Voltage Programming
Bottom of
Target Board
Standard Socket
Target Board
Target Device
or PIM
10.6 STANDARD COMMUNICATION HARDWARE
For standard debugger communication with a target (Section 2.3 “Debugger to
Target Communication”, “Standard ICSP Device Communication“), use an adapter
with an RJ-11 connector.
T o use this type of communication with a header board, you may need a device-specific
Processor Pak, which includes an 8-pin connector header board containing the desired
ICE/ICD device and a standard adapter board.
Note: Older header boards used a 6-pin (RJ-11) connector instead of an 8-pin
connector, so these headers may be connected directly to the debugger.
For more on available header boards, see the “Header Board Specification”
(DS51292).
10.6.1 Standard Communication
The standard communication is the main interface to the target processor. It contains
the connections to the high voltage (V
connections required for programming and connecting with the target devices.
PP high-voltage lines can produce a variable voltage that can swing from 1.8 to
The V
14 volts to satisfy the voltage requirements for the specific emulation processor.
The V
DD sense connection draws current from the target processor.
The clock and data connections are interfaces with the following characteristics:
• Clock and data signals are in high-impedance mode (even when no power is
applied to the PICkit 3 programmer/debugger system)
• Clock and data signals are protected from high voltages caused by faulty targets
systems, or improper connections
• Clock and data signals are protected from high current caused from electrical
shorts in prototype or target systems
PP), VDD sense lines, and clock and data
FIGURE 10-1: 6-PIN STANDARD PINOUT
© 2009 Microchip Technology Inc. DS51795A-page 61
Page 66

PICkit™ 3 User’s Guide
Modular
Connector Pin
Microcontroller
Pin
6LVP
5 RB6
4RB7
3 Ground
2V
DD Target
1 VPP
1
6
Bottom view of Modular Connector
Pinout on Target Board
16
Front view of Modular Connector
on Target Board
Target Board
Transition Socket
Device-ICE
AC164110
Adapter
Header
Power
PICkit™ 3
Mini-USB
to PC
cable
10.6.2 Modular Cable and Connector
For standard communications, a modular cable connects the debugger and the target
application. The specifications for this cable and its connectors are listed below.
10.6.2.1 MODULAR CONNECTOR SPECIFICATION
• Manufacturer, Part Number – AMP Incorporated, 555165-1
• Distributor, Part Number – Digi-Key, A9031ND
The table within Figure 10-2 shows how the modular connector pins on an application
correspond to the microcontroller pins. This configuration provides full ICD
functionality.
FIGURE 10-2: MODULAR CONNECTOR PINOUT OF TARGET BOARD
10.6.2.2 MODULAR PLUG SPECIFICATION
DS51795A-page 62 © 2009 Microchip Technology Inc.
• Manufacturer, Part Number – AMP Incorporated, 5-554710-3
• Distributor, Part Number – Digi-Key, A9117ND
Page 67

10.6.2.3 MODULAR CABLE SPECIFICATION
• Manufacturer, Part Number – Microchip Technology, 07-00024
10.7 TA RGET BOARD CONSIDERATIONS
The target board should be powered according to the requirements of the selected
device (1.8V-5.0V) and the application.
Depending on the type of debugger-to-target communications used, there will be some
considerations for target board circuitry:
• Section 2.4.2 “Target Connection Circuitry”
• Section 2.4.5 “Circuits That Will Prevent the Debugger From Functioning”
Hardware Specification
© 2009 Microchip Technology Inc. DS51795A-page 63
Page 68

PICkit™ 3 User’s Guide
NOTES:
DS51795A-page 64 © 2009 Microchip Technology Inc.
Page 69

PICkit™ 3 USER’S GUIDE
Appendix A. PICkit 3 Schematics
PICkit 3 Development Programmer/Debugger schematic diagrams are shown here.
Demo board schematics are found in their respective user’s guides.
FIGURE A-1: PICKIT™ 3 SCHEMATIC DIAGRAM (PAGE 1 OF 2)
© 2009 Microchip Technology Inc. DS51795A-page 65
Page 70

PICkit™ 3 User’s Guide
USE
FIGURE A-2: PICKIT™ 3 SCHEMATIC DIAGRAM (PAGE 2 OF 2)
DS51795A-page 66 © 2009 Microchip Technology Inc.
Page 71

Appendix B. Operational Advisory
When designing applications that use the PICkit 3, these operational issues should be
considered:
• Oscillator Circuit Setup
• ICSP™ Implementation and Considerations
• Recommended Configuration
• Alternate Configuration
• Communication Channel
• Grounding and AC Applications
• Correcting Crosstalk
• Hibernation
OSCILLATOR CIRCUIT SETUP
Primary Oscillator
Often differences between the MPLAB IDE default settings and the unique target
requirements cause the following message to display in the output window “The target
device is not ready for debugging. Please check your configuration bit settings and program the device before proceeding.” T o correct this, set the Configuration bits to match
the oscillator setting of the target configuration.
For debugging operations, the application (target) oscillator must be functioning before
in-circuit debugging can take place. Ensure the oscillator configuration and the MPLAB
IDE Configuration bit setup are configured properly. For example, if your application
uses a 20 MHZ crystal oscillator, select the HS (High Speed) selection in MPLAB IDE.
For any other applicable device oscillator modes, consult the device data sheet.
PICkit™ 3 USER’S GUIDE
Crystal Oscill a tor
If the MPLAB ICD header or processor extension packs are used to connect to the
target, there may be problems with starting the crystal resonator. To avoid potential
problems, consider the foll owi ng:
1. Ensure the crystal is connected near the device footprint.
2. Keep all lines as short as possible in the target application without unnecessary
discontinuities such as PCB vias and test points.
3. Minimize any capacitive loading on these nodes.
4. Avoid using a socket for the placement of the crystal and capacitor. Solder the
devices directly to PCB pads.
ICSP™ IMPLEMENTATION AND CONSIDERATIONS
The PICkit 3 uses a serial signaling scheme to program and debug a target device. The
signals utilized are a clock and a data signal. In most devices they are also mapped to
a port (typically RB6 and RB7), but they are also defined in some data sheets as PGC
and PGD or ICSPCLK and ICSPDAT.
© 2009 Microchip Technology Inc. DS51795A-page 67
Page 72

PICkit™ 3 User’s Guide
Additionally, MCLR is also used as either a high voltage programming signal or as an
attention indicator to the device.
In order to have trouble free in-circuit debugging, careful planning must be done by the
designer to avoid any problems during the application development or production
phase of the product.
RECOMMENDED CONFIGURATION
The signals PGC and PGD are active bidirectional signals driven by the PICkit 3 and
target emulation device. If these signals can be kept free from any other passive circuits
or active logic in the application, it will ensure trouble free debugging and programming
sessions. Also, cable length and/or type may be negligible with this configuration.
Additionally, the MCLR
gramming some devices or to signal attention. In instances where the application has
a large capacitor, it will cause the signal rise and fall time to degrade. This will hinder
the ability of PICkit 3 and the device to communicate effectively. It is recommended to
keep the signal pulled up to V
features of the device to ensure a proper power-up sequence.
ALTERNATE CONFIGURATION
signal is used by PICkit 3 to provide the voltage used for pro-
DD with a 10K resistor, and to utilize the power-on timer
In some cases, especially with low pin count devices, the pins must be utilized by the
application.
If this is the case, as a minimum, a resistive isolation is required between the device
and the application active node. This will ensure that both the application circuit and
PICkit 3 are able to drive the PGC or PGD node to ground and to the proper V
Figure B-1 depicts this configuration.
FIGURE B-1: TYPICAL ICSP™ APPLICATION CIRCUIT
The resistive isolation value will differ depending on the application and how it is being
used. Values ranging from 1K to 10K are suggested. In any case, ensure the levels on
PGD and PGC can be driven to their appropriate logic voltage levels.
DD levels.
COMMUNICATION CHANNEL
Some devices have the flexibility to use one of several communication channels or pins
for programming and debugging. These channels are generally referred to in data
sheets as PGCx/PGDx, where x is channel number identifier. These channels are often
multiplexed with some peripherals (I
DS51795A-page 68 © 2009 Microchip Technology Inc.
2
C™, SPI, A/D). If your application uses those
Page 73

peripherals and pins which are common to the default PGC/PGD pins, you must select
PC
A/C
A/C
Optoisolated
Self-Powered
PICkit 3
Target
Application
Earth Ground
Target
Ground
USB Hub
HOT
a different channel and make provisions for the required ICSP connections.
Likewise, when using MPLAB IDE to communicate with the target using this new chan-
nel pin assignment, you must ensure that the Configuration bits in MPLAB IDE match
the connection channel in your target.
GROUNDING AND AC APPLICATIONS
PICkit 3 connects to earth ground from the USB connector interface through the PC.
For AC line powered applications which are not referenced to ground, this presents a
path where the different system voltage potential can cause damage to both systems.
In these instances, the PICkit 3 must be isolated. Carefully consider the ground system
and signal return connections before connecting the PICkit 3 to the target.
For hot or floating applications, a USB self-powered isolated hub should be used
between the PC and the PICkit 3 to provide isolation from the PC’s earth ground
through the USB cable (see Figure B-2). USB isolated Hub such as the following are
suggestions:
• High/Low-Speed 4-port USB HUB, Model UISOHUB 4, B&B Electronics Mfg. Co.
• High-Speed, 7-port USB HUB, Model HUB7P, SEALEVEL Systems, Inc.
Operational Advisory
WARNING
Using the PICkit 3 without ensuring ground isolation will result in
damage to the PICkit 3 or the target system as the full AC mains
voltage will be applied.
This condition can be hazardous to the operator in the form of an
electric shock. Therefore, take adequate precautions to avoid this
situation.
FIGURE B-2: EXAMPLE PICKIT™ 3 SETUP FOR NON-ISOLATED AC
POWER SYSTEMS
© 2009 Microchip Technology Inc. DS51795A-page 69
Using an optoisolated USB hub will create a hot area marked with the
dotted line in Figure B-2.
This condition can be hazardous to the operator in the form of an
electric shock, therefore, take adequate precautions to avoid this
situation.
WARNING
Page 74

PICkit™ 3 User’s Guide
12345
6
Target
Connector
Target
Bottom Side
PC Board
Vpp/MCLR
Vss
PGC
Vdd
PGD
LVP
CORRECTING CROSSTALK
In some cases a crosstalk problem may exist when the device is being programmed.
Due to the locations of the PGC and PGD pins, crosstalk may degrade the signal and
cause the PICkit 3 to fail programming of the target device. To correct this, try the
following:
• Construct a RJ12 modular cable. Keep the length as short as possible, preferably
under 6 inches. Also, remove the jacket from the cable, so that the conductors are
far apart from each other (especially the PGC and PGD signals). The standard
modular cable is wired as shown in Figure B-3, that is, RJ12 pin 1 on one end
connects to RJ12 pin 6 on the other end. This solves the problem in nearly all
cases.
FIGURE B-3: TARGET CONNECTOR PINOUT
HIBERNATION
Note 1: Noise-inducing equipment (motors, light dimmers, etc.) must be on
separate power strips from the target application and the PICkit 3.
When using the PICkit 3 for prolonged periods of time, especially while the debugger
is in emulation mode, disable the Hibernate mode in the Power Options Dialog window
of the PC’s operating system. Click on the Hibernate tab and clear or uncheck the
“Enable hibernation” check box. This will ensure that all communication is maintained
across all the USB subsystem components.
DS51795A-page 70 © 2009 Microchip Technology Inc.
Page 75

PICkit™ 3 USER’S GUIDE
Glossary
Absolute Section
A section with a fixed (absolute) address that cannot be changed by the linker.
Access Memory (PIC18 Only)
Special registers on PIC18 devices that allow access regardless of the setting of the
Bank Select Register (BSR).
Access Entry Points
Access entry points provide a way to transfer control across segments to a function
which may not be defined at link time. They support the separate linking of boot and
secure application segments.
Address
Value that identifies a location in memory.
Alphabetic Character
Alphabetic characters are those characters that are letters of the arabic alphabet
(a, b, …, z, A, B, …, Z).
Alphanumeric
Alphanumeric characters are comprised of alphabetic characters and decimal digits
(0,1, …, 9).
ANDed Breakpoints
Set up an ANDed condition for breaking, i.e., breakpoint 1 AND breakpoint 2 must
occur at the same time before a program halt. This can only be accomplished if a data
breakpoint and a program memory breakpoint occur at the same time.
Anonymous Structure
An unnamed structure.
Anonymous Structure
An unnamed structure that is a member of a C union. The members of an anonymous
structure may be accessed as if they were members of the enclosing union. For example, in the following code, hi and lo are members of an anonymous structure inside the
union caster.
union castaway
int intval;
struct {
char lo; //accessible as caster.lo
char hi; //accessible as caster.hi
};
} caster;
ANSI
American National Standards Institute is an organization responsible for formulating
and approving standards in the United States.
Application
A set of software and hardware that may be controlled by a PIC microcontroller.
© 2009 Microchip Technology Inc. DS51795A-page 71
Page 76

PICkit™ 3 User’s Guide
Archive
A collection of relocatable object modules. It is created by assembling multiple source
files to object files, and then using the archiver to combine the object files into one
library file. A library can be linked with object modules and other libraries to create
executable code.
Archiver
A tool that creates and manipulates libraries.
ASCII
American Standard Code for Information Interchange is a character set encoding that
uses 7 binary digits to represent each character. It includes upper and lower case
letters, digits, symbols and control characters.
Assembler
A language tool that translates assembly language source code into machine code.
Assembly Language
A programming language that describes binary machine code in a symbolic form.
Assigned Section
A section which has been assigned to a target memory block in the linker command file.
Asynchronously
Multiple events that do not occur at the same time. This is generally used to refer to
interrupts that may occur at any time during processor execution.
Asynchronous Stimulus
Data generated to simulate external inputs to a simulator device.
Attribute
Characteristics of variables or functions in a C pro gram which are used to describe
machine-specific properties.
Attribute, Section
Characteristics of sections, such as “executable”, “readonly”, or “data” that can be
specified as flags in the assembler .section directive.
Binary
The base two numbering system that uses the digits 0-1. The rightmost digit counts
ones, the next counts multiples of 2, then 2
Bookmarks
Use bookmarks to easily locate specific lines in a file.
Under the Edit menu, select Bookmarks to manage bookmarks. Toggle (enable /
disable) a bookmark, move to the next or previous bookmark, or clear all bookmarks.
Breakpoint, Hardware
An event whose execution will cause a halt.
Breakpoint, Software
An address where execution of the firmware will halt. Usually achieved by a special
break instruction.
Build
Compile and link all the source files for an application.
C
A general-purpose programming language which features economy of expression,
modern control flow and data structures, and a rich set of operators.
2
= 4, etc.
DS51795A-page 72 © 2009 Microchip Technology Inc.
Page 77

Glossary
Calibration Memory
A special function register or registers used to hold values for calibration of a PIC
microcontroller on-board RC oscillator or other device peripherals.
Central Processing Unit
The part of a device that is responsible for fetching the correct instruction for execution,
decoding that instruction, and then executing that instruction. When necessary, it works
in conjunction with the arithmetic logic unit (ALU) to complete the execution of the
instruction. It controls the program memory address bus, the data memory address
bus, and accesses to the stack.
Clean
Under the MPLAB IDE Project menu, Clean removes all intermediary project files, such
as object, hex and debug files, for the active project. These files are recreated from
other files when a project is built.
COFF
Common Object File Format. An object file of this format contains machine code,
debugging and other information.
Command Line Interface
A means of communication between a program and its user based solely on textual
input and output.
Compiler
A program that translates a source file written in a high-level language into machine
code.
Conditional Assembly
Assembly language code that is included or omitted based on the assembly-time value
of a specified expression.
Conditional Compilation
The act of compiling a program fragment only if a certain constant expression, specified
by a preprocessor directive, is true.
Configuration Bits
Special-purpose bits programmed to set PIC microcontroller modes of operation. A
Configuration bit may or may not be preprogrammed.
Control Directives
Directives in assembly language code that cause code to be included or omitted based
on the assembly-time value of a specified expression.
CPU
See Central Processing Unit.
Cross Reference File
A file that references a table of symbols and a list of files that references the symbol. If
the symbol is defined, the first file listed is the location of the definition. The remaining
files contain references to the symbol.
Data Directives
Data directives are those that control the assembler’s allocation of program or data
memory and provide a way to refer to data items symbolically; that is, by meaningful
names.
© 2009 Microchip Technology Inc. DS51795A-page 73
Page 78

PICkit™ 3 User’s Guide
Data Memory
On Microchip MCU and DSC devices, data memory (RAM) is comprised of General
Purpose Registers (GPRs) and Special Function Registers (SFRs). Some devices also
have EEPROM data memory.
Debugging Information
Compiler and assembler options that, when selected, provide varying degrees of information used to debug application code. See compiler or assembler documentation for
details on selecting debug options.
Deprecated Features
Features that are still supported for legacy reasons, but will eventually be phased out
and no longer used.
Device Programmer
A tool used to program electrically programmable semiconductor devices such as
microcontrollers.
Digital Signal Controller
A microcontroller device with digital signal processing capability, i.e., Microchip dsPIC
DSC devices.
Digital Signal Processing
The computer manipulation of digital signals, commonly analog signals (sound or
image) which have been converted to digital form (sampled).
Digital Signal Processor
A microprocessor that is designed for use in digital signal processing.
Directives
Statements in source code that provide control of the language tool’s operation.
Download
Download is the process of sending data from a host to another device, such as an
debugger, programmer or target board.
DSC
See Digital Signal Controller.
DSP
See Digital Signal Processor.
DWARF
Debug With Arbitrary Record Format. DWARF is a debug information format for ELF
files.
EEPROM
Electrically Erasable Programmable Read Only Memory. A special type of PROM that
can be erased electrically. Data is written or erased one byte at a time. EEPROM
retains its contents even when power is turned off.
ELF
Executable and Linking Format. An object file of this format contains machine code.
Debugging and other information is specified in with DWARF. ELF/DWARF provide
better debugging of optimized code than COFF.
Emulation
The process of executing software loaded into emulation memory as if it were firmware
residing on a microcontroller device.
DS51795A-page 74 © 2009 Microchip Technology Inc.
Page 79

Glossary
Emulation Memor y
Program memory contained within the debugger.
Debugger
Hardware that performs emulation.
Debugger System
The MPLAB ICE 2000 and MPLAB ICE 4000 debugger systems include the pod, processor module, device adapter, target board, cables, and MPLAB IDE software. The
PICkit 3 system consists of a pod, a driver (and potentially a receiver) card, target
board, cables, and MPLAB IDE software.
Endianess
The ordering of bytes in a multi-byte object.
Environment – IDE
The particular layout of the desktop for application development.
Environment – MPLAB PM3
A folder containing files on how to program a device. This folder can be transferred to
a SD/MMC card.
Epilogue
A portion of compiler-generated code that is responsible for deallocating stack space,
restoring registers and performing any other machine-specific requirement specified in
the runtime model. This code executes after any user code for a given function,
immediately prior to the function return.
EPROM
Erasable Programmable Read Only Memory. A programmable read-only memory that
can be erased usually by exposure to ultraviolet radiation.
Error File
A file containing error messages and diagnostics generated by a language tool.
Errors
Errors report problems that make it impossible to continue processing your program.
When possible, errors identify the source file name and line number where the problem
is apparent.
Event
A description of a bus cycle which may include address, data, pass count, external
input, cycle type (fetch, R/W), and time stamp. Events are used to describe triggers,
breakpoints and interrupts.
Executable Code
Software that is ready to be loaded for execution.
Export
Send data out of the MPLAB IDE in a standardized format.
Expressions
Combinations of constants and/or symbols separated by arithmetic or logical
operators.
Extended Microcontroller Mode
In extended microcontroller mode, on-chip program memory as well as external memory is available. Execution automatically switches to external if the program memory
address is greater than the internal memory space of the PIC17 or PIC18 device.
© 2009 Microchip Technology Inc. DS51795A-page 75
Page 80

PICkit™ 3 User’s Guide
Extended Mode
In Extended mode, the compiler will utilize the extended instructions (i.e., ADDFSR,
ADDULNK, CALLW, MOVSF, MOVSS, PUSHL, SUBFSR and SUBULNK) and the indexed
with literal offset addressing.
External Label
A label that has external linka ge.
External Linkage
A function or variable has external linkage if it can be referenced from outside the
module in which it is defined.
External Symbol
A symbol for an identifier which has external linkage. This may be a reference or a
definition.
External Symbol Resolutio n
A process performed by the linker in which external symbol definitions from all input
modules are collected in an attempt to resolve all external symbol references. Any
external symbol references which do not have a corresponding definition cause a linker
error to be reported.
External Input Line
An external input signal logic probe line (TRIGIN) for setting an event based upon
external signals.
External RAM
Off-chip Read/Write memory.
Fatal Error
An error that will halt compilation immediately. No further messages will be produced.
File Registers
On-chip data memory, including General Purpose Registers (GPRs) and Special
Function Registers (SFRs).
Filter
Determine by selection what data is included/excluded in a trace display or data file.
Flash
A type of EEPROM where data is written or erased in blocks instead of bytes.
FNOP
Forced No Op eration. A forced NOP cycl e is the second cycle of a two-c ycle instruction .
Since the PIC microcontroller architecture is pipelined, it prefetches the next instruction
in the physical address space while it is executing the current instruction. However, if
the current instruction changes the program counter, this prefetched instruction is
explicitly ignored, causing a forced NOP cycle.
Frame Pointer
A pointer that references the location on the stack that separates the stack-based
arguments from the stack-based local variables. Provides a convenient base from
which to access local variables and other values for the current function.
DS51795A-page 76 © 2009 Microchip Technology Inc.
Page 81

Glossary
Free-Standing
An implementation that accepts any strictly conforming program that does not use
complex types and in which the use of the features specified in the library clause (ANSI
‘89 standard clause 7) is confined to the contents of the standard headers <float.h>,
<iso646.h>, <limits.h>, <stdarg.h>, <stdbool.h>, <stddef.h> and
<stdint.h>.
GPR
General Purpose Register. The portion of device data memory (RAM) available for
general use.
Halt
A stop of program execution. Executing Halt is the same as stopping at a breakpoint.
Heap
An area of memory used for dynamic memory allocation where blocks of memory are
allocated and freed in an arbitrary order determined at runtime.
Hex Code
Executable instructions stored in a hexadecimal format code. Hex code is contained in
a hex file.
Hex File
An ASCII file containing hexadecimal addresses and values (hex code) suitable for
programming a device.
Hexadecimal
The base 16 numbering system that uses the digits 0-9 plus the letters A-F (or a-f). The
digits A-F represent hexadecimal digits with values of (decimal) 10 to 15. The rightmost
digit counts ones, the next counts multiples of 16, then 16
High Level Language
A language for writing programs that is further removed from the processor than
assembly.
ICD
In-Circuit Debugger. MPLAB ICD 3 is a Microchip’s in-circuit debugger.
ICE
In-Circuit Emulator. MPLAB ICE 2000 and MPLAB ICE 4000 are Microchip’s in-circuit
emulators.
ICSP
In-Circuit Serial Programming. A method of programming Microchip embedded
devices using serial communication and a minimum number of device pins.
IDE
Integrated Development Environment. MPLAB IDE is Microchip’s integrated
development environment.
Identifier
A function or variable name.
IEEE
Institute of Electrical and Electronics Engineers.
Import
Bring data into the MPLAB IDE from an outside source, such as from a hex file.
2
= 256, etc.
© 2009 Microchip Technology Inc. DS51795A-page 77
Page 82

PICkit™ 3 User’s Guide
Initialized Data
Data which is defined with an initial value. In C,
int myVar=5;
defines a variable which will reside in an initiali zed data section.
Instruction Set
The collection of machine language instructions that a particular processor
understands.
Instructions
A sequence of bits that tells a central processing unit to perform a particular operation
and can contain data to be used in the operation.
Internal Linkage
A function or variable has internal linkage if it can not be accessed from outside the
module in which it is defined.
International Organization for Standardization
An organization that sets standards in many businesses and technologies, including
computing and communications.
Interrupt
A signal to the CPU that suspends the execution of a running application and transfers
control to an Interrupt Service Routine (ISR) so that the event may be processed. Upon
completion of the ISR, normal execution of the application resumes.
Interrupt Handler
A routine that processes special code when an interrupt occurs.
Interrupt Request
An event which causes the processor to temporarily suspend normal instruction execution and to start executing an interrupt handler routine. Some processors have
several interrupt request events allowing different priority interrupts.
Interrupt Service Routine
A function that handles an interrupt.
Interrupt Service Routine
User-generated code that is entered when an interrupt occurs. The location of the code
in program memory will usually depend on the type of interrupt that has occurred.
Interrupt Vector
Address of an interrupt service routine or interrupt handler.
IRQ
See Interrupt Request.
ISO
See International Organization for Standardization.
ISR
See Interrupt Service Routine.
L-value
An expression that refers to an object that can be examined and/or modified. An l-value
expression is used on the left-hand side of an assignment.
Latency
The time between an event and its response.
DS51795A-page 78 © 2009 Microchip Technology Inc.
Page 83

Glossary
Librarian
See Archiver.
Library
See Archive.
Linker
A language tool that combines object files and libraries to create executable code,
resolving references from one module to another.
Linker Script Files
Linker script files are the command files of a linker. They define linker options and
describe available memory on the target platform.
Listing Directives
Listing directives are those directives that control the assembler listing file format. They
allow the specification of titles, paginati on and othe r li sting control.
Listing File
A listing file is an ASCII text file that shows the machine code generated for each C
source statement, assembly instruction, assembler directive, or macro encountered in
a source file.
Little Endian
A data ordering scheme for multibyte data whereby the least significant byte is stored
at the lower addresses.
Local Label
A local label is one that is defined inside a macro with the LOCAL directive. These
labels are particular to a given instance of a macro’s instantiation. In other words, the
symbols and labels that are declared as local are no longer accessible after the ENDM
macro is encountered.
Logic Probes
Up to 14 logic probes can be connected to some Microchip debuggers. The logic
probes provide external trace inputs, trigger output signal, +5V, and a common ground.
Loop-Back Test Board
Used to test the functionality of the MPLAB ICD 3 in-circuit debugger.
LVDS
Low Voltage Differential Signaling. A low noise, low-power, low amplitude method for
high-speed (gigabits per second) data transmission over copper wire.
LVDS differs from normal input/output (I/O) in a few ways:
Normal digital I/O works with 5 volts as a high (binary ‘1’) and 0 volts as a low (binary
‘0’). When you use a differential, you add a third option (-5 volts), which provides an
extra level with which to encode, and results in a higher maximum data transfer rate.
A higher data transfer rate means fewer wires are required, as in UW (Ultra Wide) and
UW-2/3 SCSI hard disks, which use only 68 wires. These devices require a high transfer rate over short distances. Using standard I/O transfer, SCSI hard drives would
require a lot more than 68 wires.
Low voltage means that the standard 5 volts is replaced by either 3.3 volts or 1.5 volts.
L VDS uses a dual wire system, running 180 degrees of each other. This enables noise
to travel at the same level, which in turn can get filtered more easily and effectively.
© 2009 Microchip Technology Inc. DS51795A-page 79
Page 84

PICkit™ 3 User’s Guide
With standard I/0 signaling, data storage is contingent upon the actual voltage level.
Voltage level can be affected by wire length (longer wires increase resistance, which
lowers voltage). But with LVDS, data storage is distinguished only by positive and negative voltage values, not the voltage level. Therefore, data can travel over greater
lengths of wire while maintaining a clear and consistent data stream.
Source: http://www.webopedia.com/TERM/L/LVDS.html.
Machine Code
The representation of a computer program that is actually read and interpreted by the
processor. A program in binary machine code consists of a sequence of machine
instructions (possibly interspersed with data). The collection of all possible instructions
for a particular processor is known as its “instruction set”.
Machine Language
A set of instructions for a specific central processing unit, designed to be usable by a
processor without being translat ed.
Macro
Macro instruction. An instruction that represents a sequence of instructions in abbreviated form.
Macro Directives
Directives that control the execution and data allocation within macro body definitions.
Makefile
Export to a file the instructions to Make the project. Use this file to Make your project
outside of MPLAB IDE, i.e., with a make.
Under Project>Build Options>Project
“Assemble/Compile/Link in the project directory” under “Build Directory Policy” for this
feature to work.
Make Project
A command that rebuilds an application, recompiling only those source files that have
changed since the last complete compilation.
MCU
Microcontroller Unit. An abbreviation for microcontroller. Also μC.
Memory Models
A representation of the memory available to the application.
Memory Model
A description that specifies the size of pointers that point to program memory.
Message
T ext displayed to alert you to potential problems in language tool operation. A message
will not stop operation.
Microcontroller
A highly integrated chip that contains a CPU, RAM, program memory, I/O ports and
timers.
Microcontroller Mode
One of the possible program memory configurations of PIC17 and PIC18 microcontrollers. In microcontroller mode, only internal execution is allowed. Thus, only the
on-chip program memory is available in microcontroller mode.
, Directories tab, you must have selected
DS51795A-page 80 © 2009 Microchip Technology Inc.
Page 85

Glossary
Microprocessor Mode
One of the possible program memory configurations of PIC17 and PIC18 microcontrollers. In microprocessor mode, the on-chip program memory is not used. The entire
program memory is mapped externally.
Mnemonics
Text instructions that can be translated directly into machine code. Also referred to as
opcodes.
MPASM™ Assembler
Microchip Technology’s relocatable macro assembler for PIC microcontroller devices,
KeeLoq
MPLAB ASM30
Microchip’s relocatable macro assembler for dsPIC digital signal controller and PIC24
PIC devices.
MPLAB C Compilers
Refers to the MPLAB C C compilers from Microchip:
• MPLAB C Compiler for PIC18 MCU Devices (formerly MPLAB C18)
• MPLAB C Compiler for dsPIC Digital Signal Controller and PIC24 PIC Devices
• MPLAB C Compiler for PIC32MX MCU’s (formerly MPLAB C32)
MPLAB ICD 2
Microchip’s in-circuit debugger that works with MPLAB IDE. The ICD supports Flash
devices with built-in debug circuitry. The main component of each ICD is the pod. A
complete system consists of a pod, header board (with a device-ICD), target board,
cables, and MPLAB IDE software.
MPLAB ICD 3 In-Circuit Debugger
Microchip’s in-circuit debuggers that works with MPLAB IDE. The MPLAB ICD 3
debugger supports PIC18F and PIC24 MCUs and dsPIC DSCs. The main component
of each ICE is the pod. A complete system consists of a pod, a driver (and potentially
a receiver) card, cables, and MPLAB IDE software.
MPLAB ICE 2000
Microchip’s in-circuit debugger that works with MPLAB IDE. MPLAB ICE 2000 supports
8-bit PIC MCUs. The main component of each ICE is the pod. A complete system consists of a pod, processor module, cables, and MPLAB IDE software.
MPLAB ICE 4000
Not recommended for new designs. See the MPLAB ICD 3 in-circuit debugger.
Microchip’s in-circuit debugger that works with MPLAB IDE. MPLAB ICE 4000 supports
PIC18F and PIC24 MCUs and dsPIC DSCs. The main component of each ICE is the
pod. A complete system consists of a pod, processor module, cables, and MPLAB IDE
software.
MPLAB IDE
Microchip’s Integrated Development Environment.
MPLAB LIB30
MPLAB LIB30 archiver/librarian is an object librarian for use with object modules
created us ing either MPLAB ASM30 or MPLAB C30 C compiler.
MPLAB LINK30
MPLAB LINK30 is an object linker for the Microchip MPLAB ASM30 assembler and the
Microchip MPLAB C30 C compiler.
®
devices and Microchip memory devices.
(formerly MPLAB C30)
© 2009 Microchip Technology Inc. DS51795A-page 81
Page 86

PICkit™ 3 User’s Guide
MPLAB PM3
A device programmer from Microchip. Programs PIC18 microcontrollers and dsPIC
digital signal controllers. Can be used with MPLAB IDE or stand-alone. Will obsolete
PRO MATE II.
MPLAB SIM
Microchip’s simulator that works with MPLAB IDE in support of PIC MCU and dsPIC
DSC devices.
MPLIB™ Object Librarian
Microchip’s librarian that can work with MPLAB IDE. MPLIB librarian is an object librarian for use with COFF object modules created using either MP ASM assembler (mpasm
or mpasmwin v2.0) or MPLAB C compilers.
MPLINK™ Object Linker
MPLINK linker is an object linker for the Microchip MPASM assembler and the Microchip MPLAB C co m pi le rs. MPLINK linker also may be us ed wi t h th e M ic rochip MPLIB
librarian. MPLINK linker is designed to be used with MPLAB IDE, though it does not
have to be.
MRU
Most Recently Used. Refers to files and windows available to be selected from MPLAB
IDE main pull down menus.
Native Data Size
For Native trace, the size of the variable used in a Watch window must be of the same
size as the selected device’s data memory: bytes for PIC18 devices and words for
16-bit device s.
Nesting Depth
The maximum level to which macros can include other macros.
Node
MPLAB IDE project component.
Non-Extended Mode
In Non-Extended mode, the compiler will not utilize the extended instructions nor the
indexed with literal offset addressing.
Non Real Time
Refers to the processor at a breakpoint or executing single-step instructions or MPLAB
IDE being run in simulator mode.
Non-Volatile Storage
A storage device whose contents are preserved when its power is off.
NOP
No Operation. An instruction that has no effect when executed except to advance the
program counter.
Object Code
The machine code generated by an assembler or compiler.
Object File
A file containing machine code and possibly debug information. It may be immediately
executable or it may be relocatable, requiring linking with other object files, e.g.,
libraries, to produce a complete executable program.
Object File Directives
Directives that are used only when creating an object file.
DS51795A-page 82 © 2009 Microchip Technology Inc.
Page 87

Glossary
Octal
The base 8 number system that only uses the digits 0-7. The rightmost digit counts
ones, the next digit counts multiples of 8, then 8
Off-Chip Memory
Off-chip memory refers to the memory selection option for the PIC17 or PIC18 device
where memory may reside on the target board, or where all program memory may be
supplied by the debugger. The Memory tab accessed from Options>Development
Mode provides the Off-Chip Memory selection dialog box.
One-to-One Project-Workspace Model
The most common configuration for application development in MPLAB IDE to is have
one project in one workspac e. Select Configure>Settings
one-to-one project-workspace model”.
Opcodes
Operational Codes. See Mnemonics.
Operators
Symbols, like the plus sign ‘+’ and the minus sign ‘-’, that are used when forming
well-defined expressions. Each operator has an assigned precedence that is used to
determine order of evaluation.
OTP
One Time Programmable. EPROM devices that are not in windowed packages. Since
EPROM needs ultraviolet light to erase its memory, only windowed devices are erasable.
Pass Counter
A counter that decrements each time an event (such as the execution of an instruction
at a particular address) occurs. When the pass count value reaches zero, the event is
satisfied. You can assign the Pass Counter to break and trace logic, and to any
sequential event in the complex trigger dialog.
PC
Personal Computer or Program Counte r.
PC Host
Any PC running a supported Windows operating system.
Persistent Data
Data that is never cleared or initialized. Its intended use is so that an application can
preserve data across a device reset.
Phantom Byte
An unimplemented byte in the dsPIC architecture that is used when treating the 24-bit
instruction word as if it were a 32-bit instruction word. Phantom bytes appear in dsPIC
hex files.
PIC MCUs
PIC microcontrollers (MCUs) refers to all Microchip microcontroller families.
PICSTART Plus
A developmental device programmer from Microchip. Programs 8-, 14-, 28-, and 40-pin
PIC microcontrollers. Must be used with MPLAB IDE software.
2
= 64, etc.
, Projects tab and check “Use
© 2009 Microchip Technology Inc. DS51795A-page 83
Page 88

PICkit™ 3 User’s Guide
Plug-ins
The MPLAB IDE has both built-in components and plug-in modules to configure the
system for a variety of software and hardware tools. Several plug-in tools may be found
under the Tools menu.
Pod
MPLAB REAL ICE system: The box that contains the emulation control circuitry for the
ICE device on the header or target board. An ICE device can be a production device
with built-in ICE circuitry or a special ICE version of a production device (i.e.,
device-ICE).
MPLAB ICD 2/3: The box that contains the debug control circuitry for the ICD device
on the header or target board. An ICD device can be a production device with built-in
ICD circuitry or a special ICD version of a production device (i.e., device-ICD).
MPLAB ICE 2000/4000: The external debugger box that contains emulation memory,
trace memory, event and cycle timers, and trace/breakpoint logic.
Power-on-Reset Emulation
A software randomization process that writes random values in data RAM areas to
simulate uninitialized values in RAM upon initial power application.
Pragma
A directive that has meaning to a specific compiler. Often a pragma is used to convey
implementation-defined information to the compiler. MPLAB C30 uses attributes to
convey this information.
Precedence
Rules that define the order of evaluation in expressions.
PRO MATE II
No longer in Production. See the MPLAB PM3 device programmer.
A device programmer from Microchip. Programs most PIC microcontrollers as well as
most memory and K
Profile
For MPLAB SIM simulator, a summary listing of executed stimulus by register.
Program Counter
The location that contains the address of the instruction that is currently executing.
Program Counter Unit
A conceptual representation of the layout of program memory. The program counter
increments by 2 for each instruction word. In an executable section, 2 program counter
units are equivalent to 3 bytes. In a read-only section, 2 program counter units are
equivalent to 2 bytes.
Program Memory
The memory area in a device where instructions are stored. Also, the memory in the
debugger or simulator containing the downloaded target application firmware.
Program Memory
The memory area in a device where instructions are stored.
Project
A project contains the files needed to build an application (source code, linker script
files, etc.) along with their associations to various build tools and build options.
EELOQ devices. Can be used with MPLAB IDE or stand-alone.
DS51795A-page 84 © 2009 Microchip Technology Inc.
Page 89

Glossary
Prologue
A portion of compiler-generated code that is responsible for allocating stack space, preserving registers and performing any other machine-specific requirement specified in
the runtime model. This code executes before any user code for a given function.
Prototype System
A term referring to a user's target application, or target board.
PWM Signals
Pulse-Width Modulation Signals. Certain PIC MCU devices have a PWM peripheral.
Qualifier
An address or an address range used by the Pass Counter or as an event before
another operation in a complex trigger.
Radix
The number base, hex, or decimal, used in specifying an address.
RAM
Random Access Memory (Data Memory). Memory in which information can be
accessed in any order.
Raw Data
The binary representation of code or data associated with a section.
Read Only Memory
Memory hardware that allows fast access to permanently stored data but prevents
addition to or modification of the data.
Real Time
When an in-circuit debugger or debugger is released from the halt state, the processor
runs in Real-Time mode and behaves exactly as the normal chip would behave. In
Real-Time mode, the real time trace buffer of an debugger is enabled and constantly
captures all selected cycles, and all break logic is enabled. In an in-circuit debugger or
debugger, the processor executes in real time until a valid breakpoint causes a halt, or
until the user halts the execution.
In the simulator, real time simply means execution of the microcontroller instructions as
fast as they can be simulated by the host CPU.
Real-Time Watch
A Watch window where the variables change in real-time as the application is run. See
individual tool documentation to determine how to set up a real-time watch. Not all tools
support real-time watches.
Recursive Calls
A function that calls itself, either directly or indirectly.
Recursion
The concept that a function or macro, having been defined, can call itself. Great care
should be taken when writing recursive macros; it is easy to get caught in an infinite
loop where there will be no exit from the recursion.
Reentrant
A function that may have multiple, simultaneously active instances. This may happen
due to either direct or indirect recursion or through execution during interrupt
processing.
© 2009 Microchip Technology Inc. DS51795A-page 85
Page 90

PICkit™ 3 User’s Guide
Relaxation
The process of converting an instruction to an identical, but smaller instruction. This is
useful for saving on code size. MPLAB ASM30 currently knows how to RELAX a CALL
instruction into an RCALL instruction. This is done when the symbol that is being called
is within +/- 32k instruction words from the current instruction.
Relocatable
An object whose address has not been assigned to a fixed location in memory.
Relocatable Section
A section whose address is not fixed (absolute). The linker assigns addresses to
relocatable sections through a process called relocation.
Relocation
A process performed by the linker in which absolute addresses are assigned to relocatable sections and all symbols in the relocatable sections are updated to their new
addresses.
ROM
Read Only Memory (Program Memory). Memory that cannot be modified.
Run
The command that releases the debugger from halt, allowing it to run the application
code and change or respond to I/O in real time.
Run-time Model
Describes the use of target architecture resources.
Scenario
For MPLAB SIM simulator, a particular setup for stimulus control.
Section
A portion of an application located at a specific address of memory.
Section Attribute
A characteristic ascribed to a section (e.g., an access section).
Sequenced Breakpoints
Breakpoints that occur in a sequence. Sequence execution of breakpoints is
bottom-up; the last breakpoint in the sequence occurs first.
Serialized Quick Turn Programming
Serialization allows you to program a serial number into each microcontroller device
that the Device Programmer programs. This number can be used as an entry code,
password or ID number.
SFR
See Special Function Registers.
Shell
The MPASM assembler shell is a prompted input interface to the macro assembler.
There are two MPASM assembler shells: one for the DOS version and one for the
Windows version.
Simulator
A software program that models the operation of devi c es.
DS51795A-page 86 © 2009 Microchip Technology Inc.
Page 91

Glossary
Single Step
This command steps though code, one instruction at a time. After each instruction,
MPLAB IDE updates register windows, watch variables, and status displays so you can
analyze and debug instruction execution. You can also single step C compiler source
code, but instead of executing single instructions, MPLAB IDE will execute all assembly
level instructions generated by the line of the high level C statement.
Skew
The information associated with the execution of an instruction appears on the processor bus at different times. For example, the executed opcodes appears on the bus as
a fetch during the execution of the previous instruction, the source data address and
value and the destination data address appear when the opcodes is actually executed,
and the destination data value appears when the next instruction is executed. The trace
buffer captures the information that is on the bus at one instance. Therefore, one trace
buffer entry will contain execution information for three instructions. The number of captured cycles from one piece of information to another for a single instruction execution
is referred to as the skew.
Skid
When a hardware breakpoint is used to halt the processor, one or more additional
instructions may be executed before the processor halts. The number of extra
instructions executed after the intended breakpoint is referred to as the skid.
Source Code
The form in which a computer program is written by the programmer. Source code is
written in a formal programming language which can be translated into machine code
or executed by an interpreter.
Source File
An ASCII text file containing source code.
Special Function Registers
The portion of data memory (RAM) dedicated to registers that control I/O processor
functions, I/O status, timers or other modes or peripherals.
SQTP
See Serialized Quick Turn Programming.
Stack, Hardware
Locations in PIC microcontroller where the return address is stored when a function call
is made.
Stack, Software
Memory used by an application for storing return addresses, function parameters, and
local variables. This memory is typically managed by the compiler when developing
code in a high-level language.
Static RAM or SRAM
Static Random Access Memory. Program memory you can read/write on the target
board that does not need refreshing frequently.
Status Bar
The Status Bar is located on the bottom of the MPLAB IDE window and indicates such
current information as cursor position, development mode and device, and active tool
bar.
Step Into
This command is the same as Single Step. S tep Into (as opposed to Step Over) follows
a CALL instruction into a subroutine.
© 2009 Microchip Technology Inc. DS51795A-page 87
Page 92

PICkit™ 3 User’s Guide
Step Over
Step Over allows you to debug code without stepping into subroutines. When stepping
over a CALL instruction, the next breakpoint will be set at the instruction after the CALL.
If for some reason the subroutine gets into an endless loop or does not return properly ,
the next breakpoint will never be reached. The Step Over command is the same as
Single Step except for its handling of CALL instructions.
Step Out
Step Out allows you to step out of a subroutine which you are currently stepping
through. This command executes the rest of the code in the subroutine and then stops
execution at the return address to the subroutine.
Stimulus
Input to the simulator, i.e., data generated to exercise the response of simulation to
external signals. Often the data is put into the form of a list of actions in a text file.
Stimulus may be asynchronous, synchronous (pin), clocked and register.
Stopwatch
A counter for measuring execution cycles.
Storage Class
Determines the lifetime of the memory assoc iated with the ide nti fie d objec t.
Storage Qualifier
Indicates special properties of the objects being declared (e.g., const).
Symbol
A symbol is a general purpose mechanism for describing the various pieces which
comprise a program. These pieces include function names, variable names, section
names, file names, struct/enum/union tag names, etc. Symbols in MPLAB IDE refer
mainly to variable names, function names and assembly labels. The value of a symbol
after linking is its value in memory.
Symbol, Absolute
Represents an immediate value such as a definition through the assembly .equ
directive.
System Window Control
The system window control is located in the upper left corner of windows and some dialogs. Clicking on this control usually pops up a menu that has the items “Minimize,”
“Maximize,” and “Close.”
Target
Refers to user hardware.
T arget Application
Software residi ng on the target board.
Target Board
The circuitry and programmable device that makes up the target application.
Target Processor
The microcontroller device on the target application board.
Template
Lines of text that you build for inserting into your files at a later time. The MPLAB Editor
stores templates in template files.
Tool Bar
A row or column of icons that you can click on to execute MPLAB IDE functions.
DS51795A-page 88 © 2009 Microchip Technology Inc.
Page 93

Glossary
Trace
An debugger or simulator function that logs program execution. The debugger logs program execution into its trace buffer which is uploaded to MPLAB IDE’s trace window.
Trace Memory
Trace memory contained within the debugger. Trace memory is sometimes called the
trace buffer.
Trace Macro
A macro that will provide trace information from debugger data. Since this is a software
trace, the macro must be added to code, the code must be recompiled or reassembled,
and the target device must be programmed with this code before trace will work.
Trigger Output
Trigger output refers to an debugger output signal that can be generated at any
address or address range, and is independent of the trace and breakpoint settings. Any
number of trigger output points can be set.
Trigraphs
Three-character sequences, all starting with ??, that are defined by ISO C as
replacements for single characters.
Unassigned Section
A section which has not been assigned to a specific target memory block in the linker
command file. The linker must find a target memory block in which to allocate an
unassigned section.
Uninitialized Data
Data which is defined without an initial value. In C,
int myVar;
defines a variable which will reside in an uninitialized data section.
Upload
The Upload function transfers data from a tool, such as an debugger or programmer,
to the host PC or from the target board to the debugger.
USB
Universal Serial Bus. An external peripheral interface standard for communication
between a computer and external peripherals over a cable using bi-serial transmission.
USB 1.0/1.1 supports data transfer rates of 12 Mbps. Also referred to as high-speed
USB, USB 2.0 supports data rates up to 480 Mbps.
Vector
The memory locations that an application will jump to when either a reset or interrupt
occurs.
Warning
An alert that is provided to warn you of a situation that would cause physical damage
to a device, software file, or equipment.
Warning
Warnings report conditions that may indicate a problem, but do not halt processing. In
MPLAB C30, warning messages report the source file name and line number, but
include the text ‘warning:’ to distinguish them from error messages.
Watch Variable
A variable that you may monitor during a debugging session in a Watch window.
© 2009 Microchip Technology Inc. DS51795A-page 89
Page 94

PICkit™ 3 User’s Guide
Watch Window
Watch windows contain a list of watch variables that are updated at each breakpoint.
Watchdog Timer
A timer on a PIC microcontroller that resets the processor after a selectable length of
time. The WDT is enabled or disabled and set up using Configuration bits.
WDT
See Watchdog Timer.
Workbook
For MPLAB SIM stimulator, a setup for generation of SCL stimulus.
Workspace
A workspace contains MPLAB IDE information on the selected device, selected debug
tool and/or programmer, open windows and their location, and other IDE configuration
settings.
DS51795A-page 90 © 2009 Microchip Technology Inc.
Page 95

Index
PICkit™ 3 USER’S GUIDE
Numerics
44-Pin Demo Board ................................................. 31
A
Abort Operation...................................................50, 55
Animate.................................................................... 49
AVdd........................................................................18
AVss......................................................................... 18
B
Blank Check.............................................................55
Breakpoints
Dialog................................................................ 51
Enabling............................................................51
Setup ................................................................ 50
Build Configuration..............................................22
, 35
C
Cables
Length..........................................................60
Capacitors...........................................................18
CD-ROM ..................................................................12
Circuits That Will Prevent the Debugger
From Functioning ................................................. 19
Code Protect............................................................ 20
CodeGuard Security ................................................ 58
Configuration Bits................................................20
Connector, 6-Pin...................................................... 10
Customer Notification Service....................................5
Customer Support......................................................6
, 63
, 19
, 28
D
Debug
Executive..........................................................22
Registers........................................................... 22
Debug Express ........................................................ 31
Debug Mode
Sequence of Operations................................... 21
Debug Read.............................................................50
Debug, Top Reasons Why You Can’t...................... 35
Device and Feature Support....................................13
Documentation
Conventions........................................................3
Layout................................................................. 2
Download Firmware.................................................57
Driver Board
Standard........................................................... 61
Durability, Card Guide.............................................. 60
E
Erase........................................................................ 55
Erase Flash Device..................................................50
F
Feature Support.......................................................13
Firmware Downloads...............................................57
Freeze on Halt..........................................................38
G
General Corrective Actions......................................44
H
Halt...........................................................................49
Hibernate mode.................................. ..... ...... .....38
Hubs, USB ............................................................... 60
, 60
I
ICD Headers ............................................................12
ICSP........................................................20
ICSPCLK..................................................................61
ICSPDAT..................................................................61
Indicator Lights.........................................................60
Internet Address, Microchip .......................................5
, 21, 22, 61
L
LEDs .................................................................. 11, 60
M
Modular Interface Cable...........................................20
MPLAB IDE.............................................................. 23
P
PC, Power Down................................................ 38, 60
PGC ..................................................17
PGD ..................................................17
PICkit 3 Components......................... ...................... 12
PICkit 3 Debug Express Kit......................................12
PICkit 3 Defined........................... ...... ..... ................... 9
PIM...........................................................................16
PK3Err0001..............................................................41
PK3Err0002..............................................................41
PK3Err0003..............................................................41
PK3Err0006..............................................................41
PK3Err0007..............................................................41
PK3Err0008..............................................................41
PK3Err0009..............................................................41
PK3Err0010..............................................................41
PK3Err0011..............................................................41
PK3Err0012..............................................................42
PK3Err0013..............................................................42
PK3Err0014..............................................................42
PK3Err0015..............................................................42
PK3Err0016..............................................................42
PK3Err0017..............................................................42
PK3Err0018..............................................................42
PK3Err0019..............................................................42
, 18, 19, 20, 21
, 18, 19, 20, 21
© 2009 Microchip Technology Inc. DS51795A-page 91
Page 96

PICkit™ 3 User’s Guide
PK3Err0020.............................................................. 42
PK3Err0021.............................................................. 42
PK3Err0022.............................................................. 42
PK3Err0023.............................................................. 42
PK3Err0024.............................................................. 42
PK3Err0025.............................................................. 42
PK3Err0026.............................................................. 42
PK3Err0027.............................................................. 42
PK3Err0028.............................................................. 42
PK3Err0029.............................................................. 43
PK3Err0030.............................................................. 43
PK3Err0031.............................................................. 43
PK3Err0032.............................................................. 43
PK3Err0033.............................................................. 43
PK3Err0034.............................................................. 43
PK3Err0035.............................................................. 43
PK3Err0036.............................................................. 43
PK3Err0037.............................................................. 43
PK3Err0038.............................................................. 43
PK3Err0039.............................................................. 43
PK3Err0040.............................................................. 43
PK3Err0041.............................................................. 43
PK3Err0043.............................................................. 43
PK3Err0044.............................................................. 43
PK3Err0045.............................................................. 43
PK3Err0046.............................................................. 43
PK3Err0047.............................................................. 44
PK3Err0052.............................................................. 44
PK3Err0053.............................................................. 44
PK3Err0054.............................................................. 44
PK3Err0055.............................................................. 44
PK3Err0056.............................................................. 44
PK3Err0063.............................................................. 44
PK3Err0068.............................................................. 44
PK3Err0069.............................................................. 44
PK3Err0070.............................................................. 44
PK3Err0071.............................................................. 44
PK3Err0073.............................................................. 44
PK3Err0075.............................................................. 44
Power-Down mode............................................. 38
Processor Extension Kits.........................................12
Program ............................................................. 50
Project Wizard..........................................................28
Pull-ups....................................................................19
, 60
, 55
R
Read...................................................................50, 55
Reading, Recommended.... ...... ..................................4
Readme......................................................................4
Reconnect.......................................................... 50
Reserved Resources by Device...............................22
Reset
Processor..........................................................50
Resistors..................................................................19
Run...........................................................................49
, 55
S
Secure Segments.....................................................58
SMPS.......................................................................13
Standard Communication
Connections......................................................17
Driver Board.................................................. ....61
Standard ICSP Device Communication ...................15
Step..........................................................................49
T
Table Read Protect ..................................................20
Target Connection
Circuitry.............................................................17
Improper Circuits...............................................19
Standard............................................................17
Target Device...........................................................20
Transition Socket........................... ...... ...... ...............12
Specification......................................................24
U
USB.................................................................... 60, 89
Cables...............................................................12
Hubs..................................................................60
USB Port ..................................................................10
V
Vcap.........................................................................18
Vdd..........................................................17
Verify........................................................................55
Vpp....................................................17, 18, 19, 20, 21
Vss ..........................................................17
, 18, 19, 20
, 18, 19, 20
W
Warranty Registration.................... ...... ...... ..... ...... ...... 4
Watchdog Timer.................................................20
Web Site, Microchip...................................................5
, 90
DS51795A-page 92 © 2009 Microchip Technology Inc.
Page 97

NOTES:
Index
© 2009 Microchip Technology Inc. DS51795A-page 93
Page 98

WORLDWIDE SALES AND SERVICE
AMERICAS
Corporate Office
2355 West Chandler Blvd.
Chandler, AZ 85224-6199
Tel: 480-792-7200
Fax: 480-792-7277
Technic al Support:
http://support.microchip.com
Web Address:
www.microchip.com
Atlanta
Duluth, GA
Tel: 678-957-9614
Fax: 678-957-1455
Boston
Westborough, MA
Tel: 774-760-0087
Fax: 774-760-0088
Chicago
Itasca, IL
Tel: 630-285-0071
Fax: 630-285-0075
Dallas
Addison, TX
Tel: 972-818-7423
Fax: 972-818-2924
Detroit
Farmington Hills, MI
Tel: 248-538-2250
Fax: 248-538-2260
Kokomo
Kokomo, IN
Tel: 765-864-8360
Fax: 765-864-8387
Los Angeles
Mission Viejo, CA
Tel: 949-462-9523
Fax: 949-462-9608
Santa Clara
Santa Clara, CA
Tel: 408-961-6444
Fax: 408-961-6445
Toronto
Mississauga, Ontario,
Canada
Tel: 905-673-0699
Fax: 905-673-6509
ASIA/PACIFIC
Asia Pacific Office
Suites 3707-14, 37th Floor
Tower 6, The Gateway
Harbour City, Kowloon
Hong Kong
Tel: 852-2401-1200
Fax: 852-2401-3431
Australia - Sydney
Tel: 61-2-9868-67 33
Fax: 61-2-9868-6755
China - Beijing
Tel: 86-10-8528-2 100
Fax: 86-10-8528-2104
China - Chengdu
Tel: 86-28-8665-5 511
Fax: 86-28-8665-7889
China - Hong Kong SAR
Tel: 852-2401-1200
Fax: 852-2401-3431
China - Nanjing
Tel: 86-25-8473-2 460
Fax: 86-25-8473-2470
China - Qingdao
Tel: 86-532-8502-7355
Fax: 86-532-8502-7205
China - Shanghai
Tel: 86-21-5407-5 533
Fax: 86-21-5407-5066
China - Shenyang
Tel: 86-24-2334-2 829
Fax: 86-24-2334-2393
China - Shenzhen
Tel: 86-755-8203-2660
Fax: 86-755-8203-1760
China - Wuhan
Tel: 86-27-5980-5 300
Fax: 86-27-5980-5118
China - Xiamen
Tel: 86-592-2388138
Fax: 86-592-2388130
China - Xian
Tel: 86-29-8833-7 252
Fax: 86-29-8833-7256
China - Zhuhai
Tel: 86-756-3210040
Fax: 86-756-3210049
ASIA/PACIFIC
India - Bangalore
Tel: 91-80-4182-8400
Fax: 91-80-4182-8422
India - New Delhi
Tel: 91-11-4160-8631
Fax: 91-11-4160-8632
India - Pune
Tel: 91-20-2566-1512
Fax: 91-20-2566-1513
Japan - Yokohama
Tel: 81-45-471- 6166
Fax: 81-45-471-6122
Korea - Daegu
Tel: 82-53-744-4301
Fax: 82-53-744-4302
Korea - Seoul
Tel: 82-2-554-7200
Fax: 82-2-558-5932 or
82-2-558-5934
Malaysia - Kuala Lumpur
Tel: 60-3-6201-9857
Fax: 60-3-6201-9859
Malaysia - Penang
Tel: 60-4-227-8870
Fax: 60-4-227-4068
Philippines - Manila
Tel: 63-2-634-9065
Fax: 63-2-634-9069
Singapore
Tel: 65-6334-8870
Fax: 65-6334-8850
Tai wan - Hsin Chu
Tel: 886-3-572-9526
Fax: 886-3-572-6459
Taiwan - Kaohsiung
Tel: 886-7-536-4818
Fax: 886-7-536-4803
Taiwan - Taipei
Tel: 886-2-2500-6610
Fax: 886-2-2508-0102
Thailand - Bangkok
Tel: 66-2-694-1351
Fax: 66-2-694-1350
EUROPE
Austria - Wels
Tel: 43-7242-2244-39
Fax: 43-7242-2244-393
Denmark - Copenhagen
Tel: 45-4450-2828
Fax: 45-4485-2829
France - Paris
Tel: 33-1-69-53 -63-20
Fax: 33-1-69-30-90-79
Germany - Munich
Tel: 49-89-627-144-0
Fax: 49-89-627-144-44
Italy - Milan
Tel: 39-0331-742611
Fax: 39-0331-466781
Netherlands - Drunen
Tel: 31-416-690399
Fax: 31-416-690340
Spain - Madrid
Tel: 34-91-708-08-90
Fax: 34-91-708-08-91
UK - Wokingham
Tel: 44-118-921-5869
Fax: 44-118-921-5820
01/02/08
DS51795A-page 94 © 2009 Microchip Technology Inc.
 Loading...