

Page 1

MPLAB® REAL ICE
In-Circuit Emulator
User’s Guide
™
© 2008 Microchip Technology Inc. DS51616B
Page 2

Note the following details of the code protection feature on Microchip devices:
• Microchip products meet the specification contained in their particular Microchip Data Sheet.
• Microchip believes that its family of products is one of the most secure families of its kind on the market today, when used in the
intended manner and under normal conditions.
• There are dishonest and possibly illegal methods used to breach the code protection feature. All of these methods, to our
knowledge, require using the Microchip products in a manner outside the operating specifications contained in Microchip’s Data
Sheets. Most likely, the person doing so is engaged in theft of intellectual property.
• Microchip is willing to work with the customer who is concerned about the integrity of their code.
• Neither Microchip nor any other semiconductor manufacturer can guarantee the security of their code. Code protection does not
mean that we are guaranteeing the product as “unbreakable.”
Code protection is constantly evolving. We at Microchip are committed to continuously improving the code protection features of our
products. Attempts to break Microchip’s code protection feature may be a violation of the Digital Millennium Copyright Act. If such acts
allow unauthorized access to your software or other copyrighted work, you may have a right to sue for relief under that Act.
Information contained in this publication regarding device
applications and t he lik e is provided only for your convenience
and may be su perseded by upda t es . It is y our responsibility to
ensure that your application meets with your specifications.
MICROCHIP MAKES NO REPRESENTATIONS OR
WARRANTIES OF ANY KIND WHETHER EXPRESS OR
IMPLIED, WRITTEN OR ORAL, STATUTORY OR
OTHERWISE, RELATED TO THE INFORMATION,
INCLUDING BUT NOT LIMITED TO ITS CONDITION,
QUALITY, PERFORMANCE, MERCHANTABILITY OR
FITNESS FOR PURPOSE. Microchip disclaims all liability
arising from this information and its use. Use of Microchip
devices in life supp ort and/or safety ap plications is entir ely at
the buyer’s risk, and the buyer agrees to defend, indemnify and
hold harmless M icrochip from any and all dama ges, claims,
suits, or expenses re sulting from such use. No licens es are
conveyed, implicitly or otherwise, under any Microchip
intellectual property rights.
Trademarks
The Microchip name and logo, the Microchip logo, Accuron,
dsPIC, K
EELOQ, KEELOQ logo, MPLAB, PIC, PICmicro,
PICSTART, PRO MA TE, rfPIC and SmartShunt are registered
trademarks of Microchip Technology Incorporated in the
U.S.A. and other countries.
FilterLab, Linear Active Thermistor, MXDEV, MXLAB,
SEEVAL, SmartSensor and The Embedded Control Solutions
Company are registered trademarks of Microchip Technology
Incorporated in the U.S.A.
Analog-for-the-Digital Age, Application Maestro, CodeGuard,
dsPICDEM, dsPICDEM.net, dsPICworks, dsSPEAK, ECAN,
ECONOMONITOR, FanSense, In-Circuit Serial
Programmin g , IC SP, ICEPIC, Mindi, MiW i , MPASM, MPLAB
Certified logo, MPLIB, MPLINK, mTouch, PICkit, PICDEM,
PICDEM.net, PICtail, PIC
32
logo, PowerCal, PowerInfo,
PowerMate, PowerT ool, REAL ICE, rfLAB, Select Mode, Total
Endurance, UNI/O, WiperLock and ZENA are trademarks of
Microchip Technology Incorporated in the U.S.A. and other
countries.
SQTP is a service mark of Microchip Technology Incorporated
in the U.S.A.
All other trademarks mentioned herein are property of their
respective companies.
© 2008, Microchip Technology Incorporated, Printed in the
U.S.A., All Rights Reserved.
Printed on recycled paper.
Microchip received ISO/TS-16949:2002 certification for its worldwide
headquarters, design and wafer fabrication facilities in Chandler and
Tempe, Arizona; Gresham, Oregon and design centers in California
and India. The Company’s quality system processes and procedures
are for its PIC
devices, Serial EEPROMs, microperipherals, nonvolatile memory and
analog products. In addition, Microchip’s quality system for the design
and manufacture of development systems is ISO 9001:2000 certified.
®
MCUs and dsPIC® DSCs, KEELOQ
®
code hopping
DS51616B-page ii © 2008 Microchip Technology Inc.
Page 3

MPLAB® REAL ICE™ IN-CIRCUIT
EMULATOR USER’S GUIDE
Table of Contents
Preface ...........................................................................................................................1
Part 1 – Getting Started
Chapter 1. Overview
1.1 Introduction .....................................................................................................9
1.2 Emulator Defined ............................................................................................9
1.3 How the Emula t o r H e lp s You ....................................................................... 10
1.4 Emulator Kit Components ............................................................................10
1.5 Device and Feature Support ........................................................................11
Chapter 2. Operation
2.1 Introduction ...................................................................................................13
2.2 Tool Compa r is o n s ........ ............................. ................................................... 13
2.3 Emulator Communications with the PC and Target .....................................14
2.4 Target Communication Connections ............................................................17
2.5 Trace Connections .......................................................................................20
2.6 Debugging with the Emulator .......................................................................23
2.7 Requirem e n t s F o r D e b ugg ing .............. .. ... ............. .. .. .............. .. .................. 23
2.8 Programm in g w ith th e Em u la to r ..... .. .. .......................................................... 2 6
2.9 Resource s U sed b y th e E mu la to r ................................................................. 26
Chapter 3. Installation
3.1 Introduction ...................................................................................................27
3.2 Installing the Software .................................................................................. 27
3.3 Installing th e USB D e vi c e D r iv e rs ............. ............... .................................... 27
3.4 Selecting Target Communications .............. ................................................. 28
3.5 Setting Up the Target ...................................................................................29
3.6 Connecti n g the L o gi c Pr o bes ....................................................................... 30
3.7 Setting Up MPLAB IDE ................................................................................ 30
© 2008 Microchip Technology Inc. DS51616B-page iii
Page 4

MPLAB® REAL ICE™ In-Circuit Emulator User’s Guide
Chapter 4. Tutorial
4.1 Introduction ................................................................................................... 31
4.2 Setting Up The Environment ........................................................................ 31
4.3 Creating the Application Code ......................................................................32
4.4 Running th e P roj e c t Wiz ar d .......................................................................... 35
4.5 Viewing the Pr o je c t .. ....................................................... .............................. 36
4.6 Creating a Hex Fi le ....................................................................................... 37
4.7 Viewing De bu g Op tions .......... ... .. ................................................................. 3 8
4.8 Setting Up the Demo Board ......................................................................... 40
4.9 Loading Program Code For Debugging .......................................................40
4.10 Running Debug Code ................................................................................. 41
4.11 Debugging Code Using Breakpoints ..........................................................41
4.12 Debugging Code Using A Runtime Watch ................................................. 47
4.13 Debugging Code Using Native Trace .........................................................48
4.14 Programming the Application ..................................................................... 51
4.15 Other Trace Methods – SPI or I/O Port Trace ............................................52
4.16 Other Trace Methods – PIC32 Instruction Trace .... ....................................57
Part 2 – Features
Chapter 5. General Setup
5.1 Introduction ................................................................................................... 61
5.2 Starting the MPLAB IDE Software ................................................................ 61
5.3 Creating a Project ......................................................................................... 62
5.4 Viewing the Pr o je c t .. ..................................................................................... 62
5.5 Building the Pr o je c t ................ ...................................................................... 63
5.6 Setting Con figuration Bits ............ .. .. ........................... .. .. ............. ... .. ............ 63
5.7 Setting the Emulator as the Debugger or Programmer ................................63
5.8 Debugger/Programmer Limitations ..............................................................64
Chapter 6. Basic Debug Functions
6.1 Introduction ................................................................................................... 65
6.2 Breakpoints and Stopwatch ..........................................................................65
6.3 External Triggers .......................................................................................... 66
Chapter 7. Debug for 8- and 16-Bit Devices
7.1 Introduction ................................................................................................... 67
7.2 Data Capture and Runtime Watches ............................................................67
7.3 Trace . .. ......................................................................................................... 67
Chapter 8. Debug for 32-Bit Devices
8.1 Introduction ................................................................................................... 75
8.2 Data Capture and Runtime Watches ............................................................75
8.3 PIC32 Instruction Trace ................................................................................ 75
DS51616B-page iv © 2008 Microchip Technology Inc.
Page 5

Part 3 – Reference
Chapter 9. Frequently Asked Questions (FAQ)
9.1 Introduction ...................................................................................................83
9.2 How Does It Work F A Q s ......... .. .......................................... ......................... 83
9.3 How Does Trace Work – 8 and 16 Bit Devices ............................................85
9.4 What’s Wrong ...............................................................................................86
Chapter 10. Error Messages
10.1 Introd uc t io n ................................................................................................. 8 9
10.2 Specific Error Messages ....................................... .....................................89
10.3 Gener a l C o rr ec tive Actions ............ .. .. ........................... .. .. ............. ... .. ....... 93
Chapter 11. Emulator Function Summary
11.1 Introd uc t io n ................................................................................................. 9 7
11.2 Debugging Functions .................................................................................97
11.3 Debugging Dialogs/Windows .....................................................................99
11.4 Progra mming Functio ns ........................................................................... 107
11.5 Settin gs D ia lo g ......................................................................................... 108
Table of Contents
Chapter 12. Hardware Specification
12.1 Introd uc t io n ............................................................................................... 11 3
12.2 Highlig h t s ........... ....................................................................................... 113
12.3 Declar a tion of Conform ity ................................................ .. .. ..................... 113
12.4 USB Por t/Power ............. ... .. ............. .. .. ........................... .. .. .............. .. .. ... 11 4
12.5 Emulato r Pod ................................ ............................................................ 114
12.6 Standard Communication Hardware ........................................................116
12.7 High-Speed Communication Hardware ....................................................119
12.8 Loop-Back Test Board ..............................................................................122
12.9 Target Board Considerations ................................................................... 122
Appendix A. Revision History ..................................................................................123
Glossary .....................................................................................................................125
Index ...........................................................................................................................141
Worldwide Sales and Service ..................................................................................144
© 2008 Microchip Technology Inc. DS51616B-page v
Page 6

MPLAB® REAL ICE™ In-Circuit Emulator User’s Guide
NOTES:
DS51616B-page vi © 2008 Microchip Technology Inc.
Page 7

MPLAB® REAL ICE™ IN-CIRCUIT
EMULATOR USER’S GUIDE
Preface
NOTICE TO CUSTOMERS
All documentation becomes dated, and this manual is no exception. Microchip tools and
documentation are constantly evolving to meet customer needs, so some actual dialogs
and/or tool descriptions may differ from those in this document. Please refer to our web site
(www.microchip.com) to obtain the latest documentation available.
Documents are identified with a “DS” number. This number is located on the bottom of each
page, in front of the p age number. The numbering convention for the DS number is
“DSXXXXXA”, where “XXXXX” is the document number and “A” is the revision level of the
document.
For the most up-to-date information on development tools, see the MPLAB
Select the Help menu, and then Topics to open a list of available on-line help files.
INTRODUCTION
®
IDE on-line help.
This chapter contains general information that will be helpful to know before using the
MPLAB REAL ICE in-circuit emulator. Items discussed include:
• Document Layout
• Conventions Used in this Guide
• Warranty Registration
• Recommended Reading
• The Microchip Web Site
• Development Systems Customer Change Notification Service
• Customer Support
© 2008 Microchip Technology Inc. DS51616B-page 1
Page 8

MPLAB® REAL ICE™ In-Circuit Emulator User’s Guide
DOCUMENT LAYOUT
This document describes how to use the MPLAB REAL ICE in-circuit emulator as a
development tool to emulate and debug firmware on a target board, as well as how to
program devices. The document is organized as follows:
Part 1 – Getting Started
• Chapter 1: Overview – What the MPLAB REAL ICE in-circuit emulator is, and
how it can help you develop your application.
• Chapter 2: Operation – The theory of MPLAB REAL ICE in-circuit emulator
operation. Explains configuration options.
• Chapter 3: Installation – How to install the emulator software and hardware.
• Chapter 4: Tutorial – A brief tutorial on using the emulator.
Part 2 – Features
• Chapter 5: General Setup – How to set up MPLAB IDE to use the emulator.
• Chapter 6: Basic Debug Functions – A description of basic emulator features
available in MPLAB IDE when the MPLAB REAL ICE in-circuit emulator is chosen
as the debug tool. This includes the debug features breakpoints, stopwatch, and
external triggering.
• Chapter 7: Debug for 8- and 16-Bit Devices – A description of data capture,
runtime watches and trace for 8- and 16-bit (data memory) devices. Includes the
types of trace available and how to setup and use trace.
• Chapter 8: Debug for 32-Bit Devices – A description of data capture, runtime
watches and trace for 32-bit devices. Includes hardware and software setup for
use of PIC32 instruction trace.
Part 3 – Reference
• Chapter 9: Frequently Asked Questions – A list of frequently-asked questions,
useful for troubleshooting.
• Chapter 10: Error Messages – A list of error messages and suggested
resolutions.
• Chapter 11: Emulator Function Summary – A summary of emulator functions
available in MPLAB IDE when the MPLAB REAL ICE emulator is chosen as the
debug or program tool.
• Chapter 12: Hardware Specification – The hardware and electrical
specifications of the emulator system. Includes a description of how to use the
loop-back test board.
DS51616B-page 2 © 2008 Microchip Technology Inc.
Page 9

CONVENTIONS USED IN THIS GUIDE
The following conventions may appear in this documentation:
TABLE 1: DOCUMENTATION CONVENTIONS
Description Represents Examples
Arial font:
Italic Referenc ed books MPLAB
Initial caps A window the Output window
Quotes A field name in a window or
Underlined, italic text with
right angle bracket
Bold A dialog button Click OK
Text in angle brackets < > A key on the keyboard Press <Enter>, <F1>
Courier font:
Plain Sample source code #define START
Italic A variable argument file.o, where file can be
Square brackets [ ] Optional arguments mpasmwin [options]
Curly brackets and pipe
character: { | }
Ellipses... Replaces r epeated text var_name [,
Preface
®
IDE User’s Guide
Emphasized text ...is the only compiler...
A dialog the Settings dialog
A menu selection select Enable Programmer
“Save project before build”
dialog
A menu path File>Save
A tab Click the Power tab
Filenames autoexec.bat
File paths c:\mcc18\h
Keywords _asm, _endasm, static
Command-line options -Opa+, -Opa-
Bit values 0, 1
Constants 0xFF, ’A’
any valid filename
file [options]
Choice of mut ually exclus ive
arguments; an OR selection
Represents code supplied by
user
errorlevel {0|1}
var_name...]
void main (void)
{ ...
}
WARRANTY REGISTRATION
Please complete the enclosed Warranty Registration Card and mail it promptly.
Sending in your Warranty Registration Card entitles you to receive new product
updates. Interim software releases are available at the Microchip web site.
© 2008 Microchip Technology Inc. DS51616B-page 3
Page 10

MPLAB® REAL ICE™ In-Circuit Emulator User’s Guide
RECOMMENDED READING
This document describes how to use the MPLAB REAL ICE in-circuit emulator. Other
useful documents are listed below. The following Microchip documents are available
and recommended as supplemental reference resources.
Release Notes for MPLAB REAL ICE In-Circuit Emulator
For the latest information on using the MPLAB REAL ICE in-circuit emulator, read the
“Readme for MPLAB REAL ICE Emulator.htm” file (an HTML file) in the Readmes
subdirectory of the MPLAB IDE installation directory. The release notes (Readme)
contains update information and known issues that may not be included in this user’s
guide.
MPLAB REAL ICE In-Circuit Emulator Setup (DS51615)
MPLAB REAL ICE In-Circuit Emulator Setup - PIC32MX (DS51687)
These posters show you how to hook up the hardware and install the software for the
MPLAB REAL ICE in-circuit emulator.
MPLAB REAL ICE In-Circuit Emulator On-line Help File
A comprehensive help file for the emulator is included with MPLAB IDE. Usage,
troubleshooting and hardware specifications are covered. This may be more up-to-date
than the printed documentation. Also, emulator reserved resources and limitations are
listed for various devices.
Header Board Specification (DS51292)
This booklet describes how to install and use MPLAB REAL ICE in-circuit emulator
headers. Headers are used to better debug selected devices using special -ICE device
versions, without the loss of pins or resources.
Transition Socket Specification (DS51194)
Consult this document for information on transition sockets available for use with
MPLAB REAL ICE in-circuit emulator and MPLAB ICD 2 in-circuit debugger headers,
as well as MPLAB ICE 2000/4000 device adaptors.
DS51616B-page 4 © 2008 Microchip Technology Inc.
Page 11

Preface
THE MICROCHIP WEB SITE
Microchip provides online support via our web site at www.microchip.com. This web
site is used as a means to make files and information easily available to customers.
Accessible by using your favorite Internet browser, the web site contains the following
information:
• Product Support – Data sheets and errata, application notes and sample
programs, design resources, user’s guides and hardware support documents,
latest software releases and archived software
• General Technical Support – Frequently Asked Questions (FAQs), technical
support requests, online discussion groups, Microchip consultant program
member listing
• Business of Microchip – Product selector and ordering guides, latest Microchip
press releases, listing of seminars and events, listings of Microchip sales offices,
distributors and factory representatives
DEVELOPMENT SYSTEMS CUSTOMER CHANGE NOTIFICATION SERVICE
Microchip’s customer notification service helps keep customers current on Microchip
products. Subscribers will receive e-mail notification whenever there are changes,
updates, revisions or errata related to a specified product family or development tool of
interest.
To register, access the Microchip web site at www.microchip.com, click on Customer
Change Notification and follow the registration instructions.
The Development Systems product group categories are:
• Compilers – The latest info rmatio n on Microc hip C comp ilers, as semblers , linker s
and other language tools. These include all MPLAB C compilers; all MPLAB
assemblers (including MPASM™ assembler); all MPLAB linkers (including
MPLINK™ object linker); and all MPLAB librarians (including MPLIB™ object
librarian).
• Emulators – The latest information on Microchip in-circuit emulators.These
include the MPLAB REAL ICE™, MPLAB ICE 2000 and MPLAB ICE 4000
in-circuit emulators
• In-Circuit Debuggers – The latest information on Microchip in-circuit debuggers.
These include the MPLAB ICD 2 in-circuit debugger and PICkit™ 2 debug
express.
• MPLAB
Integrated Development Environment for development systems tools. This list is
focused on the MPLAB IDE, MPLAB IDE Project Manager, MPLAB Editor and
MPLAB SIM simulator, as well as general editing and debugging features.
• Programmers – The latest information on Microchip programmers. These include
the MPLAB PM3 and PRO MATE
Plus and PICkit 1 and 2 development programmers.
®
IDE – The latest information on Microchip MPLAB IDE, the Windows®
®
II device programmers and the PICSTART®
© 2008 Microchip Technology Inc. DS51616B-page 5
Page 12

MPLAB® REAL ICE™ In-Circuit Emulator User’s Guide
CUSTOMER SUPPORT
Users of Microchip products can receive assistance through several channels:
• Distributor or Representative
• Local Sales Office
• Field Application Engineer (FAE)
• Technical Support
Customers should contact their distributor, representative or field application engineer
(FAE) for support. Local sales offices are also available to help customers. A listing of
sales offices and locations is included in the back of this document.
Technical support is available through the web site at: http://support.microchip.com
DS51616B-page 6 © 2008 Microchip Technology Inc.
Page 13

MPLAB® REAL ICE™ IN-CIRCUIT
EMULATOR USER’S GUIDE
Part 1 – Getting Started
Chapter 1. Overview.......................................................................................................9
Chapter 2. Operation....................................................................................................13
Chapter 3. Installation..................................................................................................27
Chapter 4. Tutorial........................................................................................................31
© 2008 Microchip Technology Inc. DS51616B-page 7
Page 14

MPLAB® REAL ICE™ In-Circuit Emulator User’s Guide
NOTES:
DS51616B-page 8 © 2008 Microchip Technology Inc.
Page 15

Chapter 1. Overview
1.1 INTRODUCTION
An overview of the MPLAB REAL ICE in-circuit emulator system is given.
• Emulator Defined
• How the Emulator Helps You
• Emulator Kit Components
• Device and Feature Support
1.2 EMULATOR DEFINED
MPLAB® REAL ICE™ IN-CIRCUIT
EMULATOR USER’S GUIDE
The MPLAB REAL ICE in-circuit emulator is an in-circuit emulator that is controlled by
a PC running MPLAB IDE software on a Windows
in-circuit emulator is an integral part of the development engineer's toolsuite. The
application usage can vary from software development to hardware integration to
manufacturing test to field service.
The MPLAB REAL ICE in-circuit emulator is a modern emulator system that supports
hardware and software development for selected Microchip PIC
(MCUs) and dsPIC
Serial Programming™ (ICSP™) programming capability and Standard DUT
Programming (STDP) 2-wire serial interfaces.
The emulator system will execute code in an actual device because these Microchip
devices have built-in emulation circuitry, instead of a special emulator chip, for
emulation. All available features of a given device are accessible interactively, and can
be set and modified by the MPLAB IDE interface.
The MPLAB REAL ICE emulation concept has these features:
• Processors run at maximum speeds
• Debugging can be done with the device in-circuit
• No emulation load on the processor bus
• Simple interconnection
• Capability to incorporate I/O port data input
• Trace (MPLAB IDE and Compiler Assisted) – 8 and 16-bit devices
• Hardware Trace – 32-bit devices
In addition to emulator functions, the MPLAB REAL ICE in-circuit emulator system also
may be used as a development programmer.
®
Digital Signal Controllers (DSCs) that are based on In-Circuit
®
platform. The MPLAB REAL ICE
®
microcont rollers
© 2008 Microchip Technology Inc. DS51616B-page 9
Page 16

MPLAB® REAL ICE™ In-Circuit Emulator User’s Guide
1.3 HOW THE EMULATOR HELPS YOU
The MPLAB REAL ICE in-circuit emulator system allows you to:
• Debug application on hardware in real time
• Debug with hardware breakpoints
• Debug with software breakpoints (device-dependent)
• Set breakpoints based on internal and/or external signals
• Monitor internal file register s
• Emulate full speed
• Program device
• Trace lines of code or log variable/expression values
1.4 EMULATOR KIT COMPONENTS
The components of the MPLAB REAL ICE in-circuit emulator system kit are listed
below.
1. CD-ROM with MPLAB IDE software and on-line documentation
2. Emulator pod
3. USB cable to provide communications between the emulator and a PC and to
provide power to the emulator
4. Standard driver board (MPLAB ICD 2 compatible) and cable to connect the
emulator pod to a header module or target board
5. Logic probes
6. Loop-back test board
Additional hardware that may be ordered separately:
7. Processor Extension Pack: High-speed driver board, ICE header/receiver board
and cables to connect the emulator pod to a target board
8. Performance Pack: High-speed driver board, high-speed receiver board and
cables to connect the emulator pod to a target board
9. High-speed to standard converter board
10. Transition socket
11. Opto-isolation board
DS51616B-page 10 © 2008 Microchip Technology Inc.
Page 17
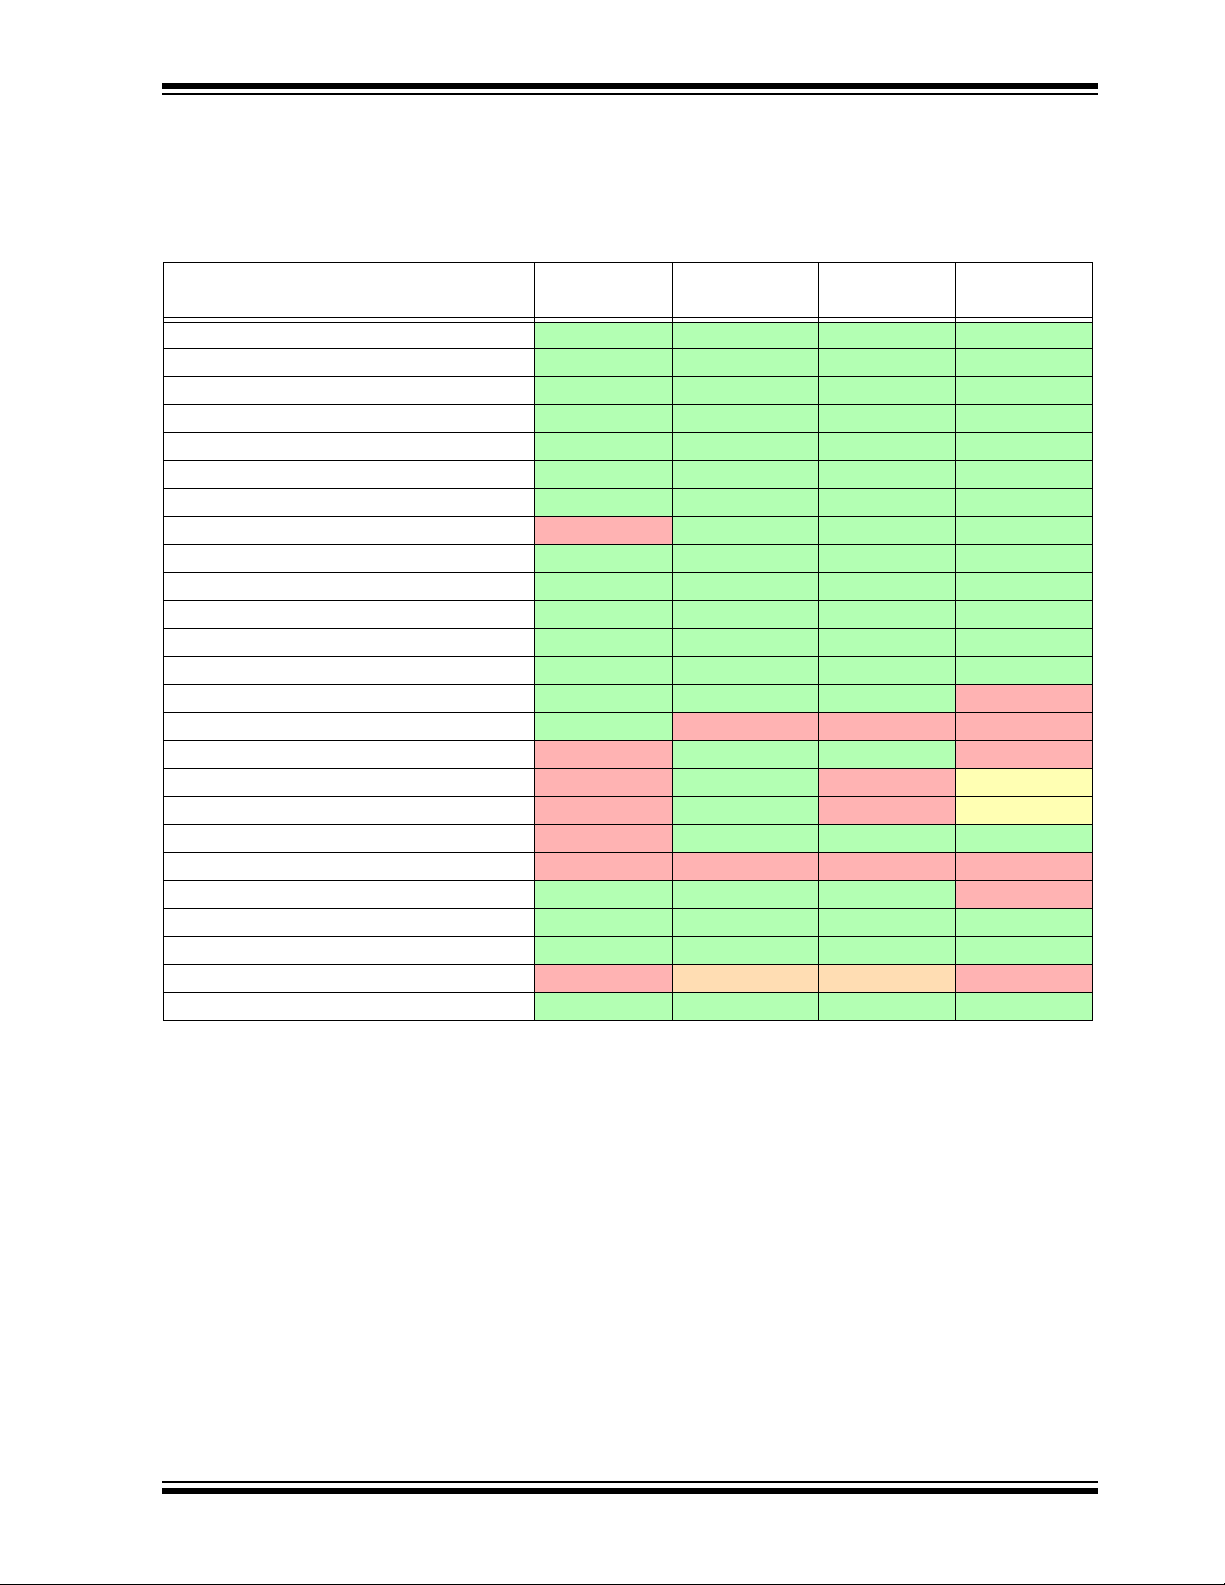
1.5 DEVICE AND FEATURE SUPPORT
Feature PIC32MX
dsPIC33F,
PIC24F/H
dsPIC30F
SMPS
(3)
dsPIC30F
Reset application C C C C
Run, Halt
C C C C
Single Step C C C C
Animate C C C C
Full Speed Emulation
C C C C
Hardware Breakpoints C C C C
Advanced Breakpoints C C C C
Software Breakpoint s
N C C C
Peripheral Freeze
(4)
C C C C
Break on data fetch or write
C C C C
Break on Stack overflow
C C C C
Stopwatch C C C C
Pass Counter C C C C
WDT overflow
C C C N
PIC32 Instruction Trace (built-in)
C N N N
Native Trace (built-in)
N C C N
SPI Trace
N C N
(1)
D
(1)
I/O Port Trace N C N
(2)
D
(2)
Trace Macros for C code N C C C
Trace Macros for ASM code
N N N N
Runtime Watch C C C N
Standard Speed Comm. C C C C
High Speed Comm.
C C C C
Processor Pak N F F N
Probe trigger C C C C
Legend:
C = Current support
D = Support dependent on device
F = No support now, but planned in the future
N = Support Not Available
Note 1: No SPI Trace for devices with SPI port pins multiplexed with PGC/PGD pins.
2: No I/O Port Trace for devices without a port with a full 8 bits available for trace OR devices with pin
counts of 44 or less.
3: Current Switch Mode Power Supply (SMPS) devices: dsPIC30F1010/2020/2023.
4: This feature operates differently depending on the selected device.
The following shows the current and future support for devices and device features,
depending on your selected device.
TABLE 1-1: 32-BIT AND 16-BIT (DATA MEMORY) DEVICES
Overview
© 2008 Microchip Technology Inc. DS51616B-page 11
Page 18
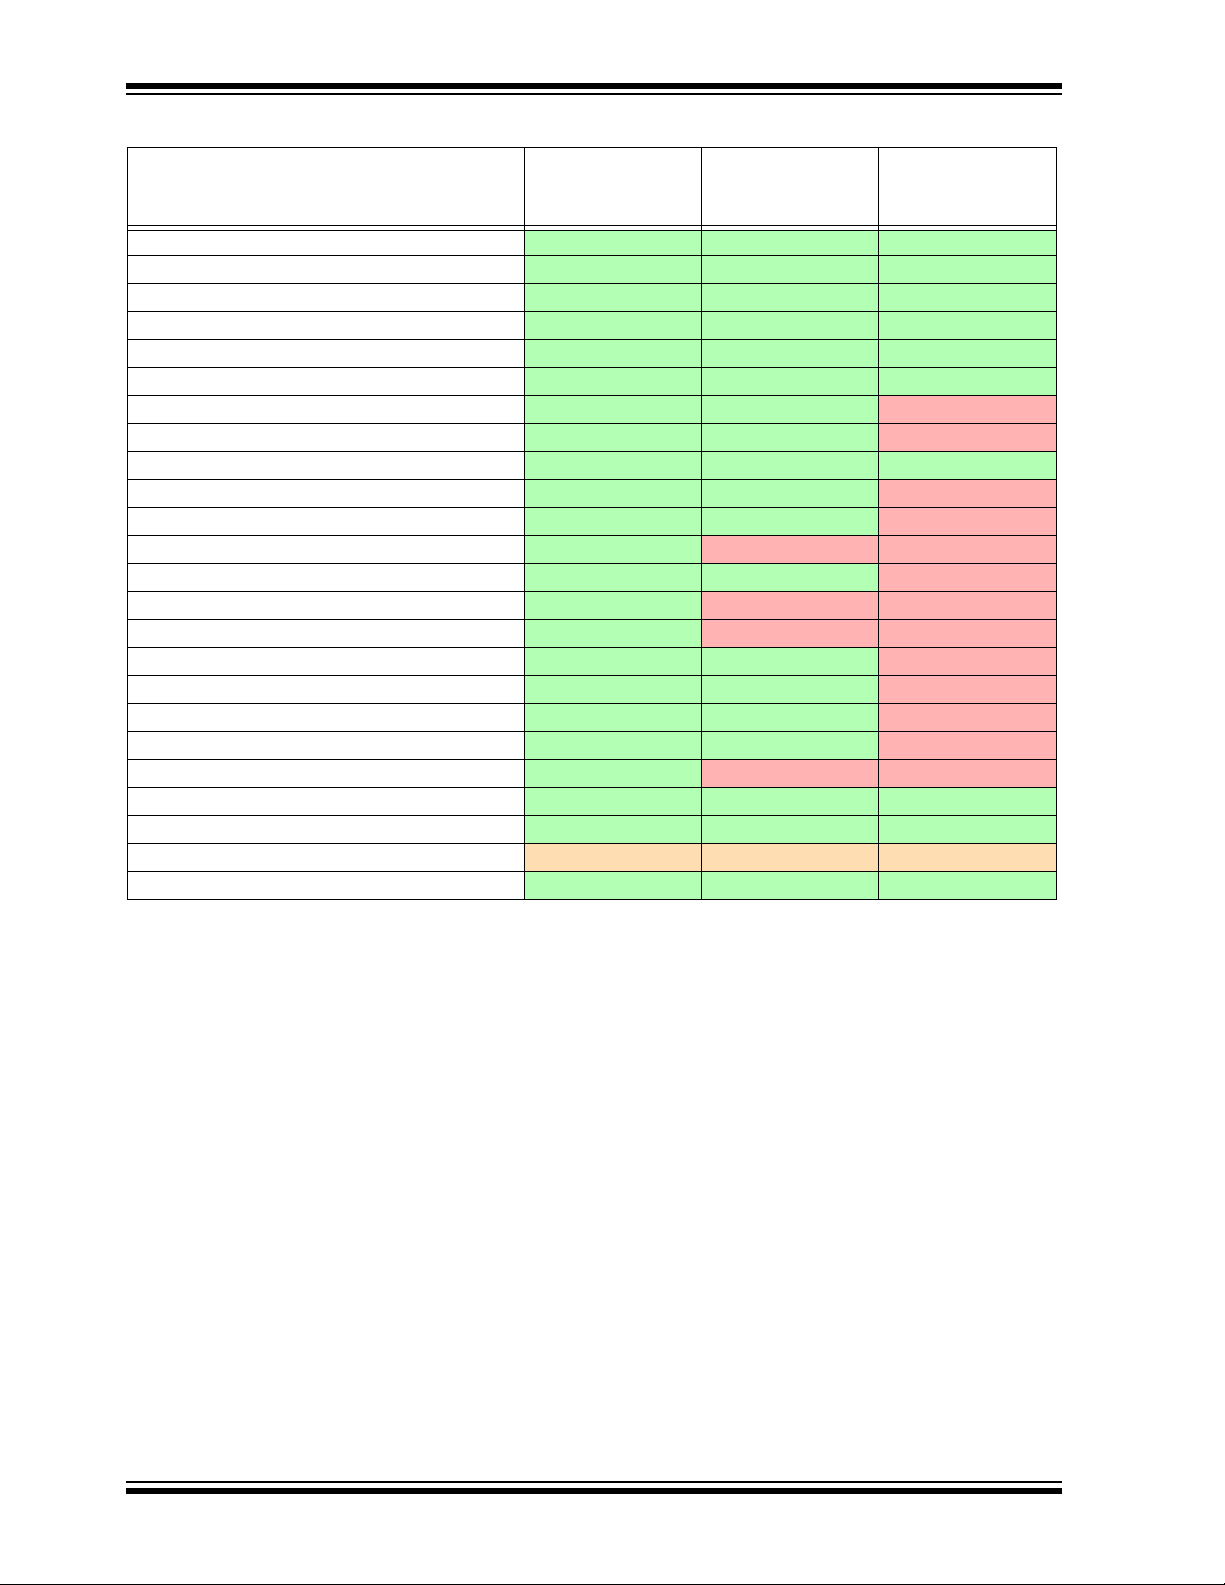
MPLAB® REAL ICE™ In-Circuit Emulator User’s Guide
Feature PIC18FXXJ
PIC18F,
PIC18F Enh,
PIC18FXXK
PIC16F
Reset application C C C
Run, Halt C C C
Single Step C C C
Animate
C C C
Full Speed Emulation C C C
Hardware Breakpoints C C C
Advanced Breakpoints
C C N
Software Breakpoint s C C N
Peripheral Freeze
(3)
C C C
Break on data fetch or write
C C N
Break on Stack overflow
C C N
Stopwatch
C N N
Pass Counter
C C N
WDT overflow C N N
Native Trace (built-in) C N N
SPI Trace
C C N
I/O Port Trace C C N
Trace Macros for C code C C N
Trace Macros for ASM code
C C N
Runtime Watch C N N
Standard Speed Comm. C C C
High Speed Comm.
C C C
Processor Pak F F F
Probe trigger C C C
Legend:
C = Current support
D = Support dependent on device
F = No support now, but planned in the future
N = Support Not Available
Note 1: No SPI Trace for devices with SPI port pins multiplexed with PGC/PGD pins.
2: No I/O Port Trace for devices without a port with a full 8 bits available for trace OR devices with pin
counts of 44 or less.
3: This feature operates differently depending on the selected device.
TABLE 1-2: 8-BIT (DATA MEMORY) DEVICES
DS51616B-page 12 © 2008 Microchip Technology Inc.
Page 19

2.1 INTRODUCTION
A simplifi ed desc ripti on of how t he MPL AB REAL ICE i n-cir cuit em ulator system works
is provided here. It is intended to provide enough information so a target board can be
designed that is compatible with the emulator for both emulation and programming
operations. The basic theory of in-circuit emulation and programming is described so
that problems, if encountered, are quickly resolved.
• Tool Comparisons
• Emulator Communications with the PC and Target
• Ta rget Comm uni ca tio n Conne cti ons
• Trace Connections
• Debugging with the Emulator
• Requirements For Debugging
• Programming with the Emulator
• Resources Used by the Emulator
MPLAB® REAL ICE™ IN-CIRCUIT
EMULATOR USER’S GUIDE
Chapter 2. Operation
2.2 TOOL COMPARISONS
The MPLAB REAL ICE in-circuit emulator system is a next generation In-Circuit
Emulator (ICE) system. It differs from classical in-circuit emulator systems in a single,
but important way: the production device and emulation device are the same. This
means that the actual device/emulated device differences are all but eliminated. For
example, speed bottlenecks caused by bringing internal busses off-chip and using
external memories on classical emulator systems are eliminated by using the actual
device for emulation.
Another significant benefit is that there is no time lag from when the device is released
to when an emulator module to support the device can be released. If a header board
is required, it can be developed to coincide with the device release, or lag it by a small
amount, which is a great improvement over the longer processor module development
times.
The MPLAB REAL ICE in-circuit emulator system surpasses in-circuit debugger
systems in speed and functionality (e.g., trace).
© 2008 Microchip Technology Inc. DS51616B-page 13
Page 20
MPLAB® REAL ICE™ In-Circuit Emulator User’s Guide
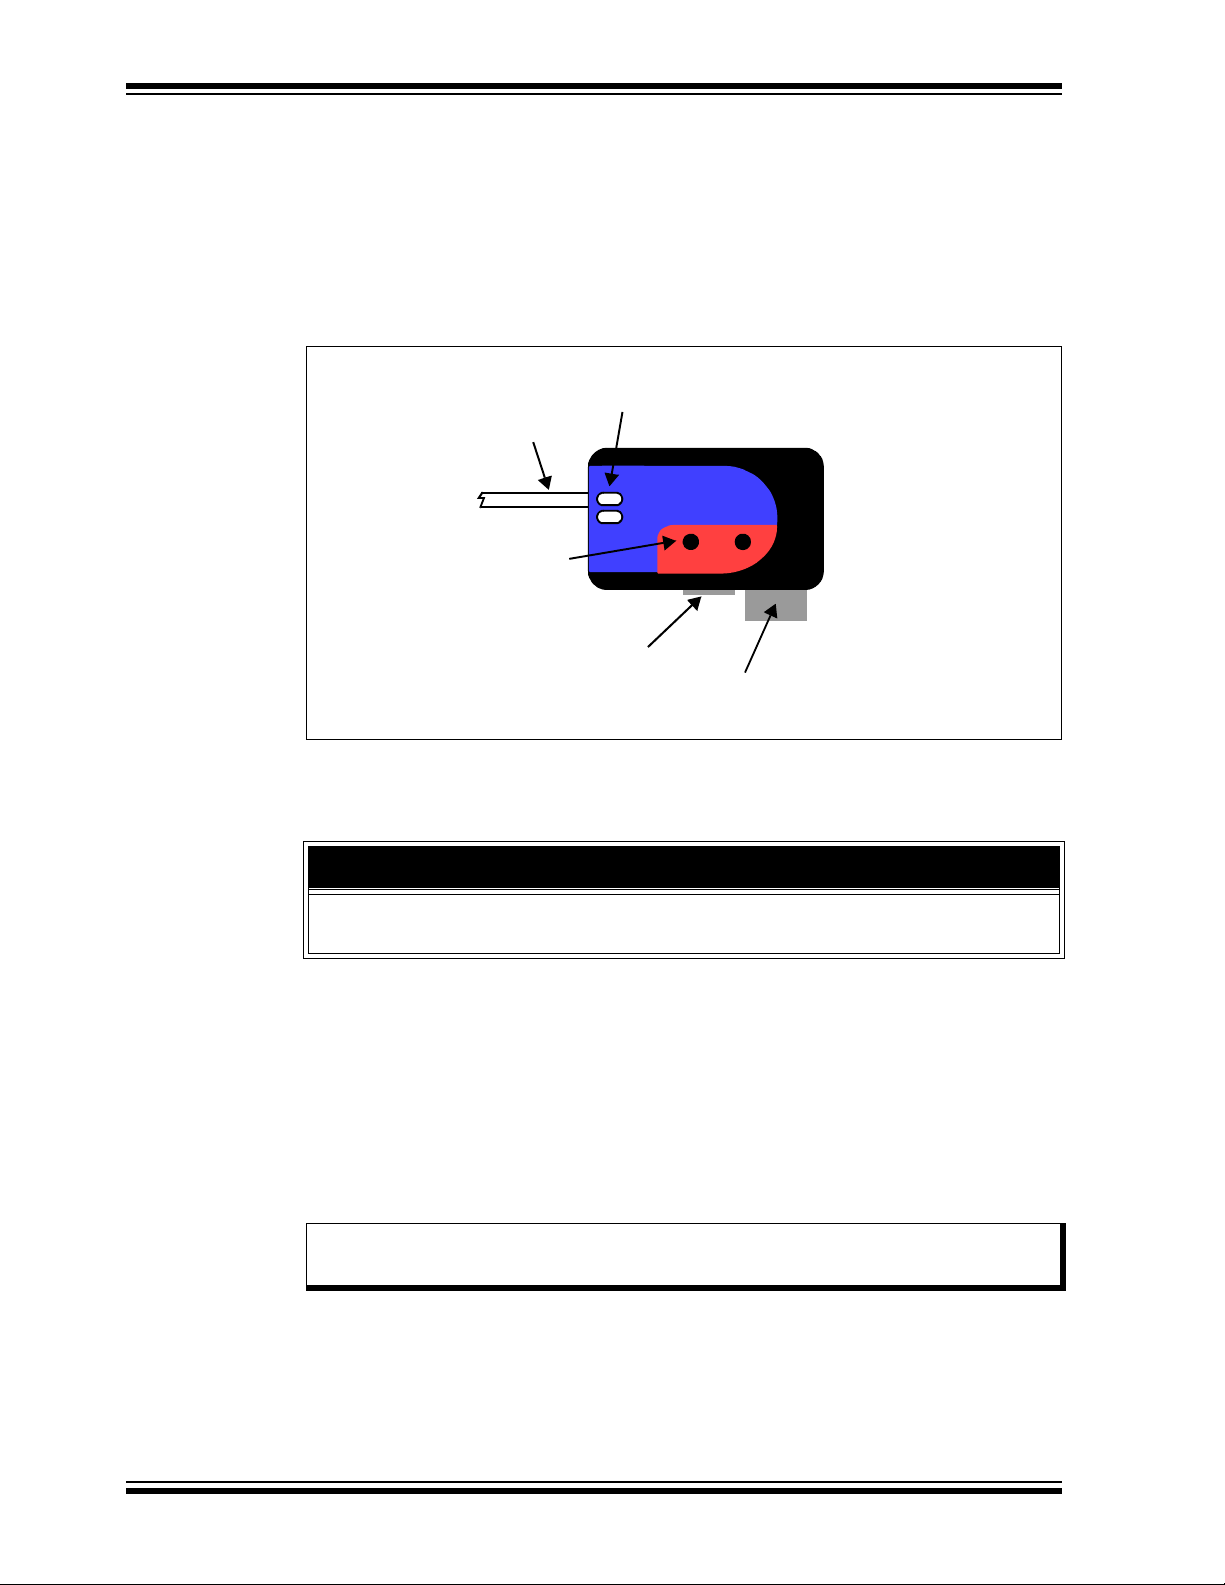
USB/Power
Emulator Pod
Logic Probe
Connector
Indicator
Lights
Push Buttons
ACTIVE
STATUS
RESETFUNCTION
Standard or High-Speed
Driver Board
2.3 EMULATOR COMMUNICATIONS WITH THE PC AND TARGET
The MPLAB REAL ICE in-circuit emulator system consists of these items:
• Emulator pod with indicator lights, push buttons and a logic probe connector
• USB cable to connect a PC to the emulator pod and power the pod
• Driver board and modular cable(s) to connect the emulator pod to an ICE header
or target board
FIGURE 2-1: BASIC EMULATOR SYSTEM
The emulator communicates with the PC and is powered through the USB cable.
The emulator communicates with the target through the configurations discussed in the
following sections.
CAUTION
Do not connect the hardware before installing the software and USB drivers. Also, do
not change hardware connections when the pod or target is powered.
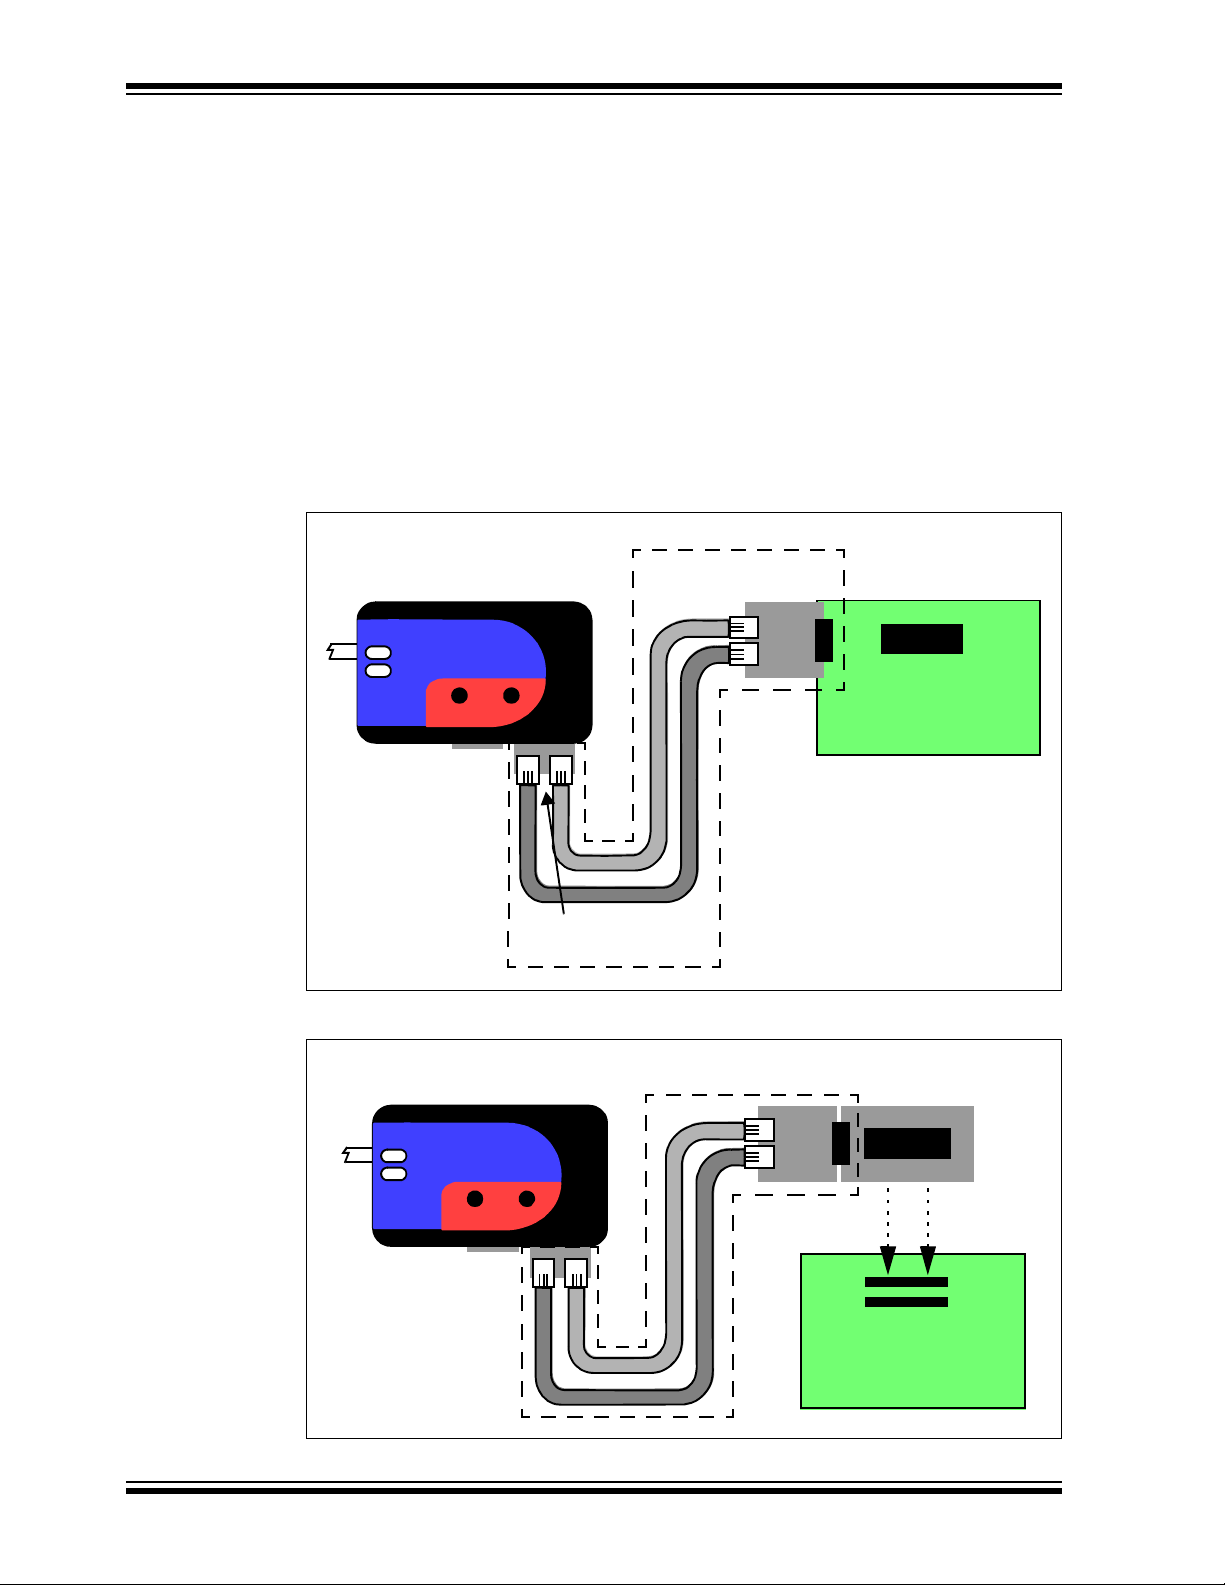
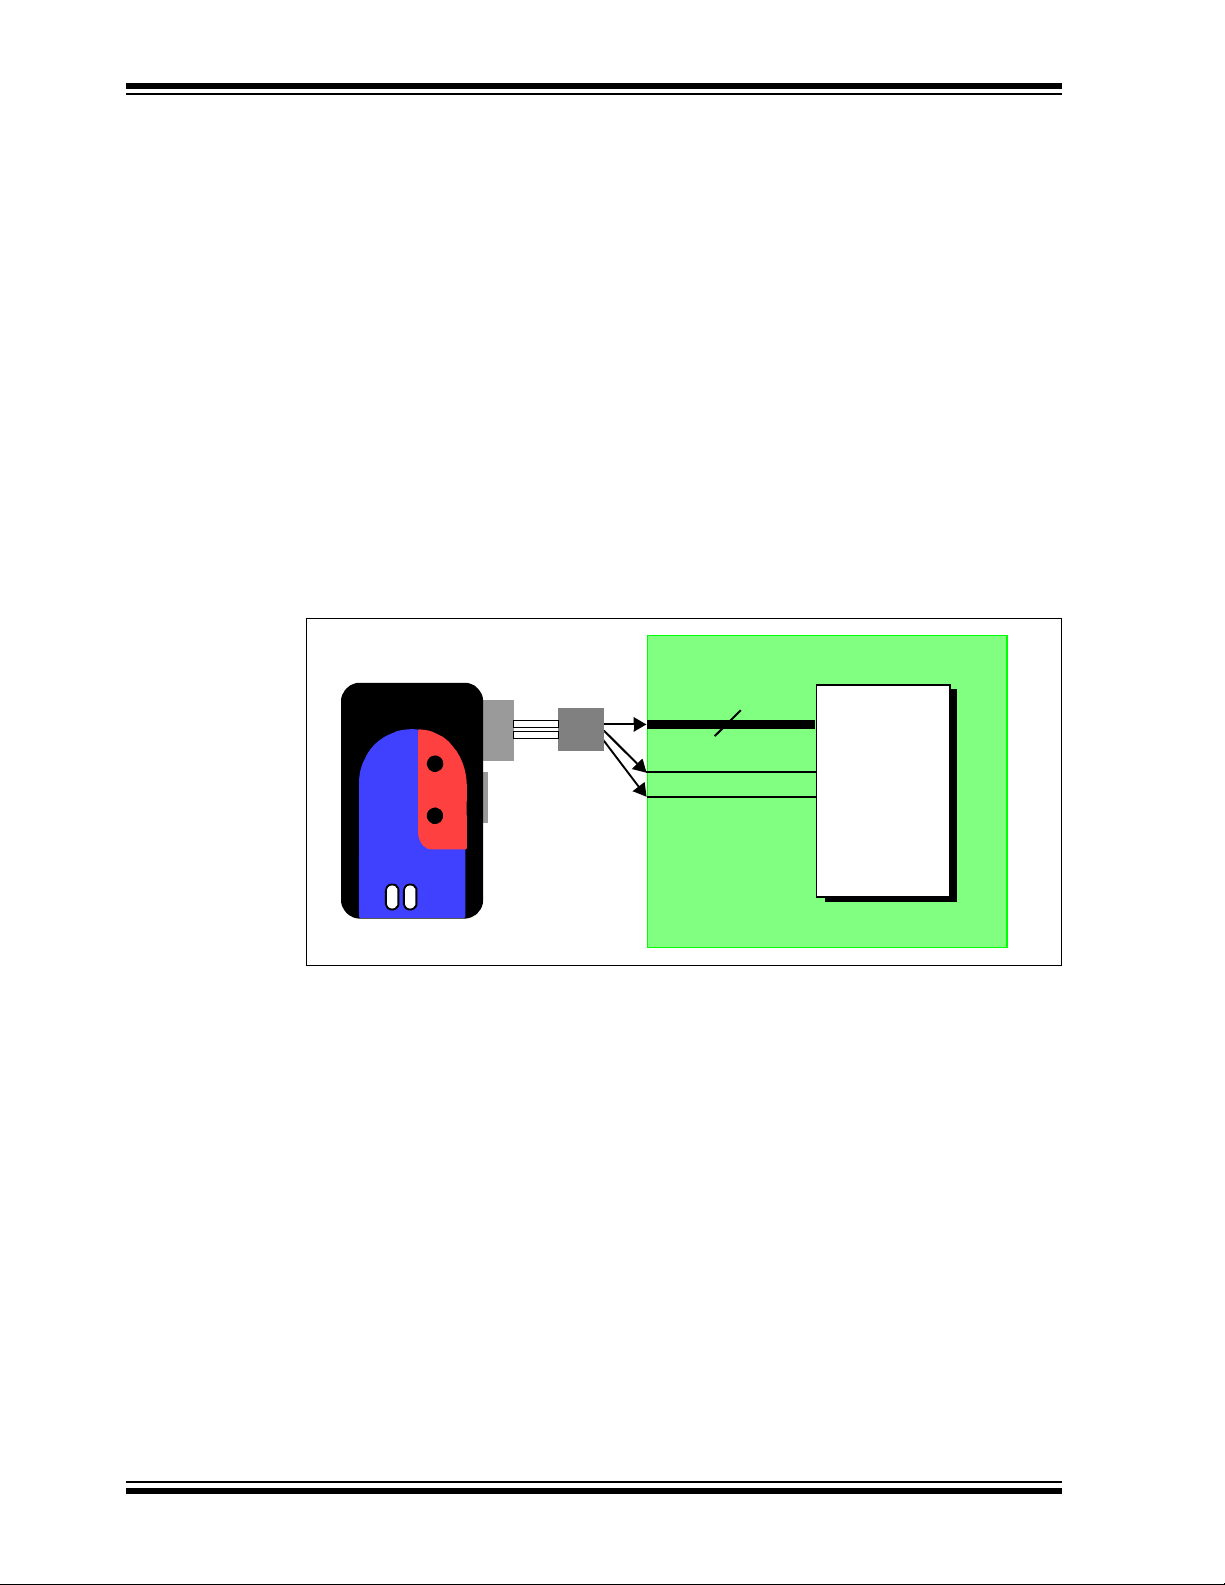
2.3.1 Standard Communication
The emulator system can be configured to use standard communication for both
programming and debugging functions. This 6-pin connection is the same one used by
other Microchip in-circuit debuggers.
The standard driver board is plugged into the emulator pod to configure the system for
communication with the target. The modular cable can be either (1) inserted into a
matching socket at the target, where the target device is on the target board
(Figure 2-2), or (2) inserted into a standard adapter/header board combo (available as
a Processor Pak), which in then plugged into the target board (Figure 2-3).
Note: Older header boards used a 6-pin (RJ-11) connector instead of an 8-pin
connector, so these headers may be connected directly to the emulator.
For more on standard communication, see Chapter 12. “Hardware Specification”.
DS51616B-page 14 © 2008 Microchip Technology Inc.
Page 21
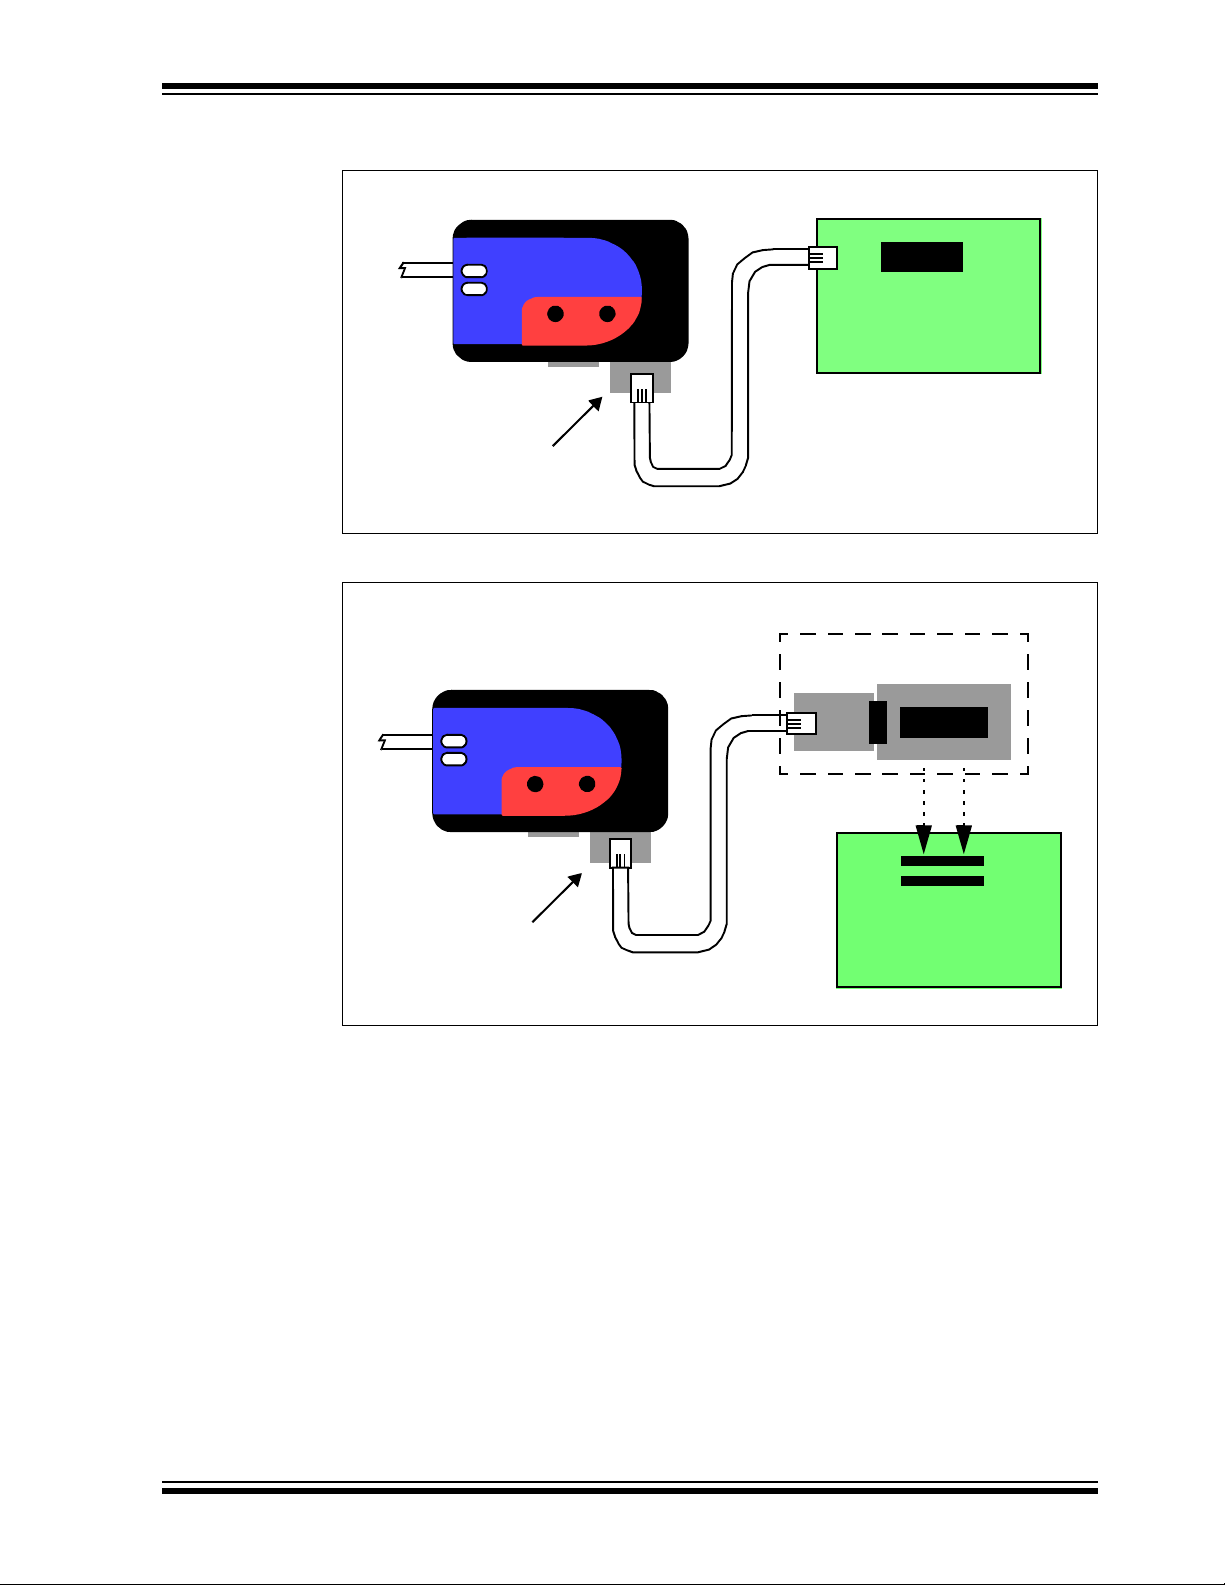
Operation
Emulator Pod
Target Board
Target Device
ACTIVE
STATUS
RESETFUNCTION
Standard
Driver Board
or PIM
Emulator Pod
T a rget Board
Transition Socket
ACTIVE
STATUS
RESETFUNCTION
Device-ICE
Processor Pak
Standard
Adapter
Header
Standard
Driver Board
FIGURE 2-2: STANDARD EMULATOR SYSTEM – DEVICE WITH
ON-BOARD ICE CIRCUITRY
FIGURE 2-3: STANDARD EMULATOR SYSTEM – ICE DEVICE
© 2008 Microchip Technology Inc. DS51616B-page 15
Page 22
MPLAB® REAL ICE™ In-Circuit Emulator User’s Guide
Emulator Pod
Target Board
High-Speed
Driver Board
Target Device
ACTIVE
STATUS
RESETFUNCTION
J2
J3
High-Speed
Receiver Bo ard
J2
J3
Performance Pak
or PIM
Emulator Pod
ACTIVE
STATUS
RESETFUNCTION
J2
J3
Target Board
Transition Socket
J2
J3
Device-ICE
Header from
Processor Pak
Performance Pak
2.3.2 High-Speed Communication
The emulator system can be configured to use high-speed communication for both
programming and debugging functions. This connection allows for higher speed
operations, a longer distance between the emulator and target, and additional tracing
functionality over a standard connection.
The high-speed driver board (from the Performance Pak) is plugged into the emulator
pod to configure the system for this type of communication with the target. The modular
cables can be inserted into matching sockets at the high-speed receiver board, which
is attached via an 8-pin connector into either (1) the target board, with an on-board
target device (Figure 2-4), or (2) the header board (from the Processor Pak), which in
then plugged into the target board (Figure 2-5).
For more on high-speed communication, see Chapter 12. “Hardware Specification”.
FIGURE 2-4: HIGH-SPEED EMULATOR SYSTEM – DEVICE WITH
ON-BOARD ICE CIRCUITRY
FIGURE 2-5: HIGH-SPEED EMULATOR SYSTEM – ICE DEVICE
DS51616B-page 16 © 2008 Microchip Technology Inc.
Page 23
2.4 TARGET COMMUNICATION CONNECTIONS
12345
6
Bottom of
Target Board
VPP/MCLR
VSS
PGC
V
DD
PGD
There are two driver boards available to closely match most application requirements.
The standard driver board can be used to connect to the myriad of demo boards and
applications that contain the RJ11 connector. The high-speed driver/receiver board
combination can be used for high-speed applications, for additional trace features, for
large (several feet) emulator-to-target distances and for noisy environments.
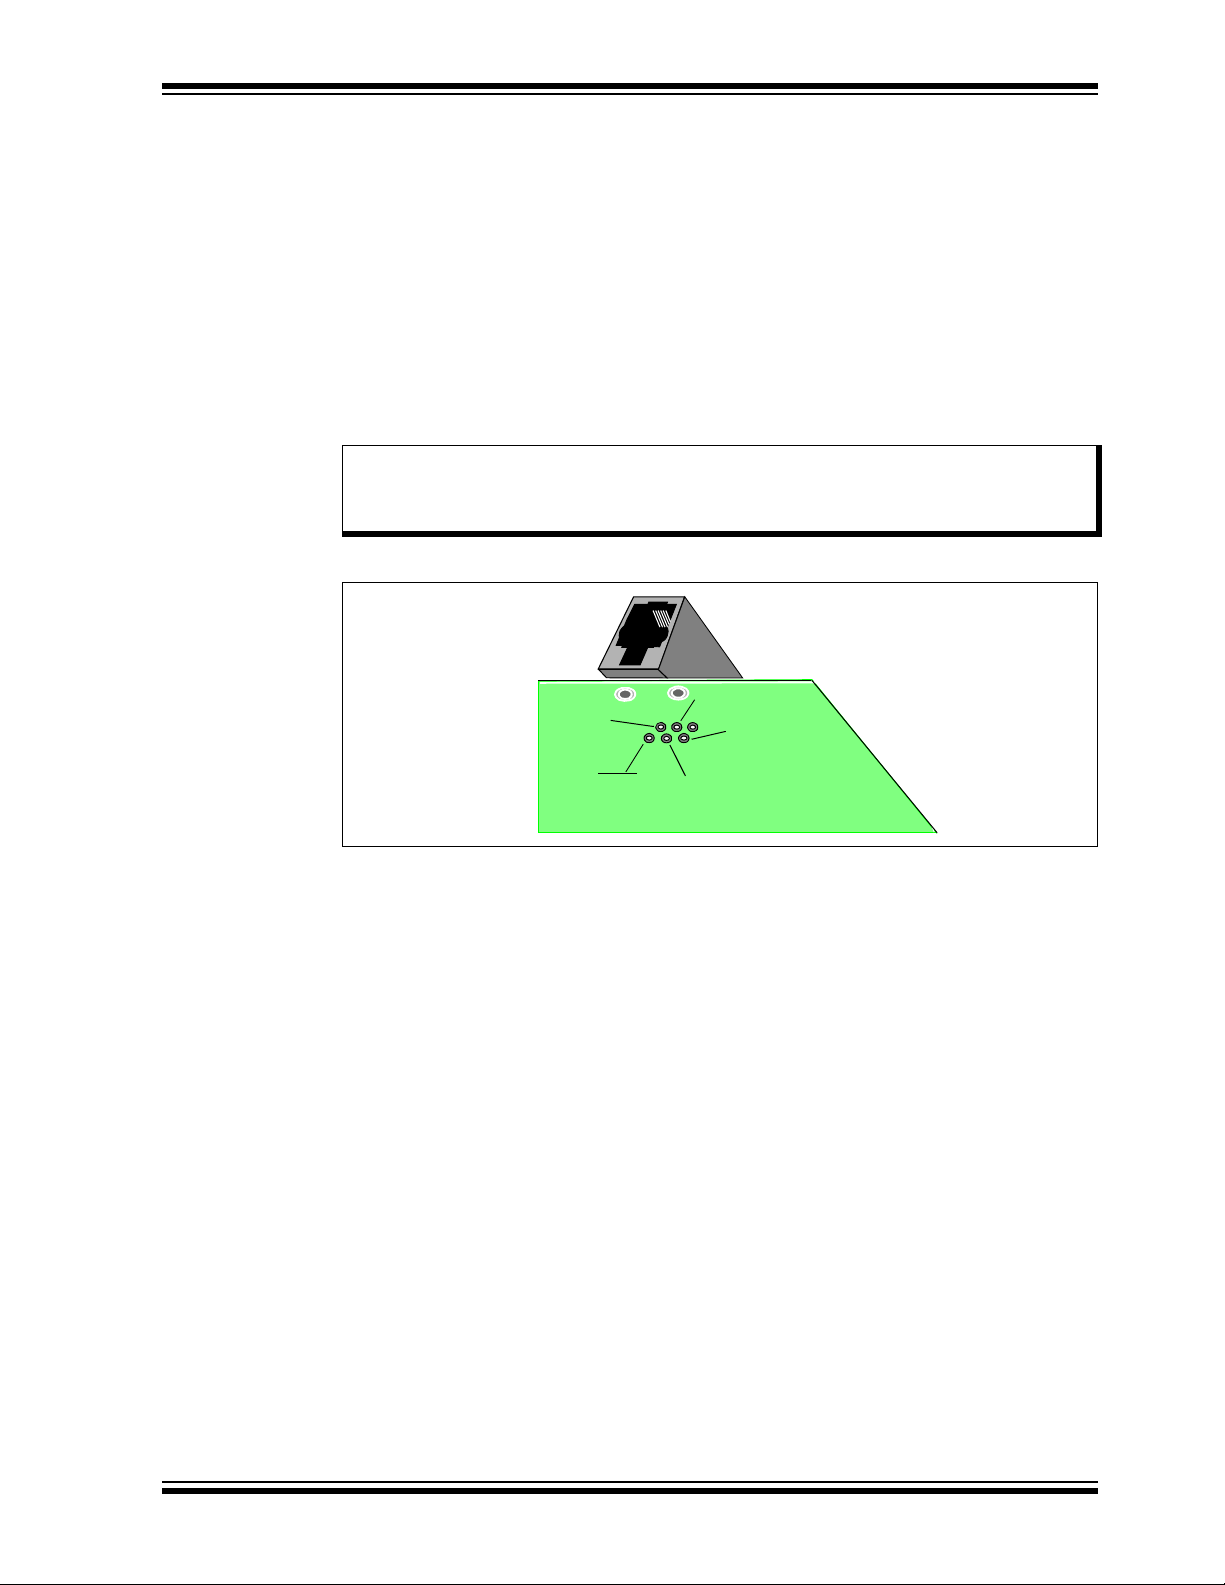
2.4.1 Standard Communicat ion Connection
Using the standard driver board, the MPLAB REAL ICE in-circuit emulator is connected
to the target device with the modular interface (six-conductor) cable. The pin
numbering for the connector is shown from the bottom of the target PC board in
Figure 2-6.
Note: Cable connections at the emulator and target are mirror images of each
other, i.e., pin 1 on one end of the cable is connected to pin 6 on the other
end of the cable. See Section 12.6.2.3 “Modular Cable Specification”.
FIGURE 2-6: STANDARD CONNECTION AT TARGET
Operation
© 2008 Microchip Technology Inc. DS51616B-page 17
Page 24
MPLAB® REAL ICE™ In-Circuit Emulator User’s Guide
1
2
3
4
5
6
7
8
J1
Top of
Target
Board
VPP/MCLR
VSS
PGC
V
DD
PGD
DAT*
CLK*
Used for optional SPI trace
capabilit y. See
Section 2.5.2 “SPI Trace
Connections (High-Speed
Communication Only)”.
*
V
DD
VPP/MCLR
PGC
PGD
V
SS
AV
DD
AV
SS
2
1
5
4
3
User Reset
4.7K-10K
Interface
Connector
Application
PC Board
Device
ACTIVE
STATUS
RESETFUNCTION
Emulator Pod
XTAL
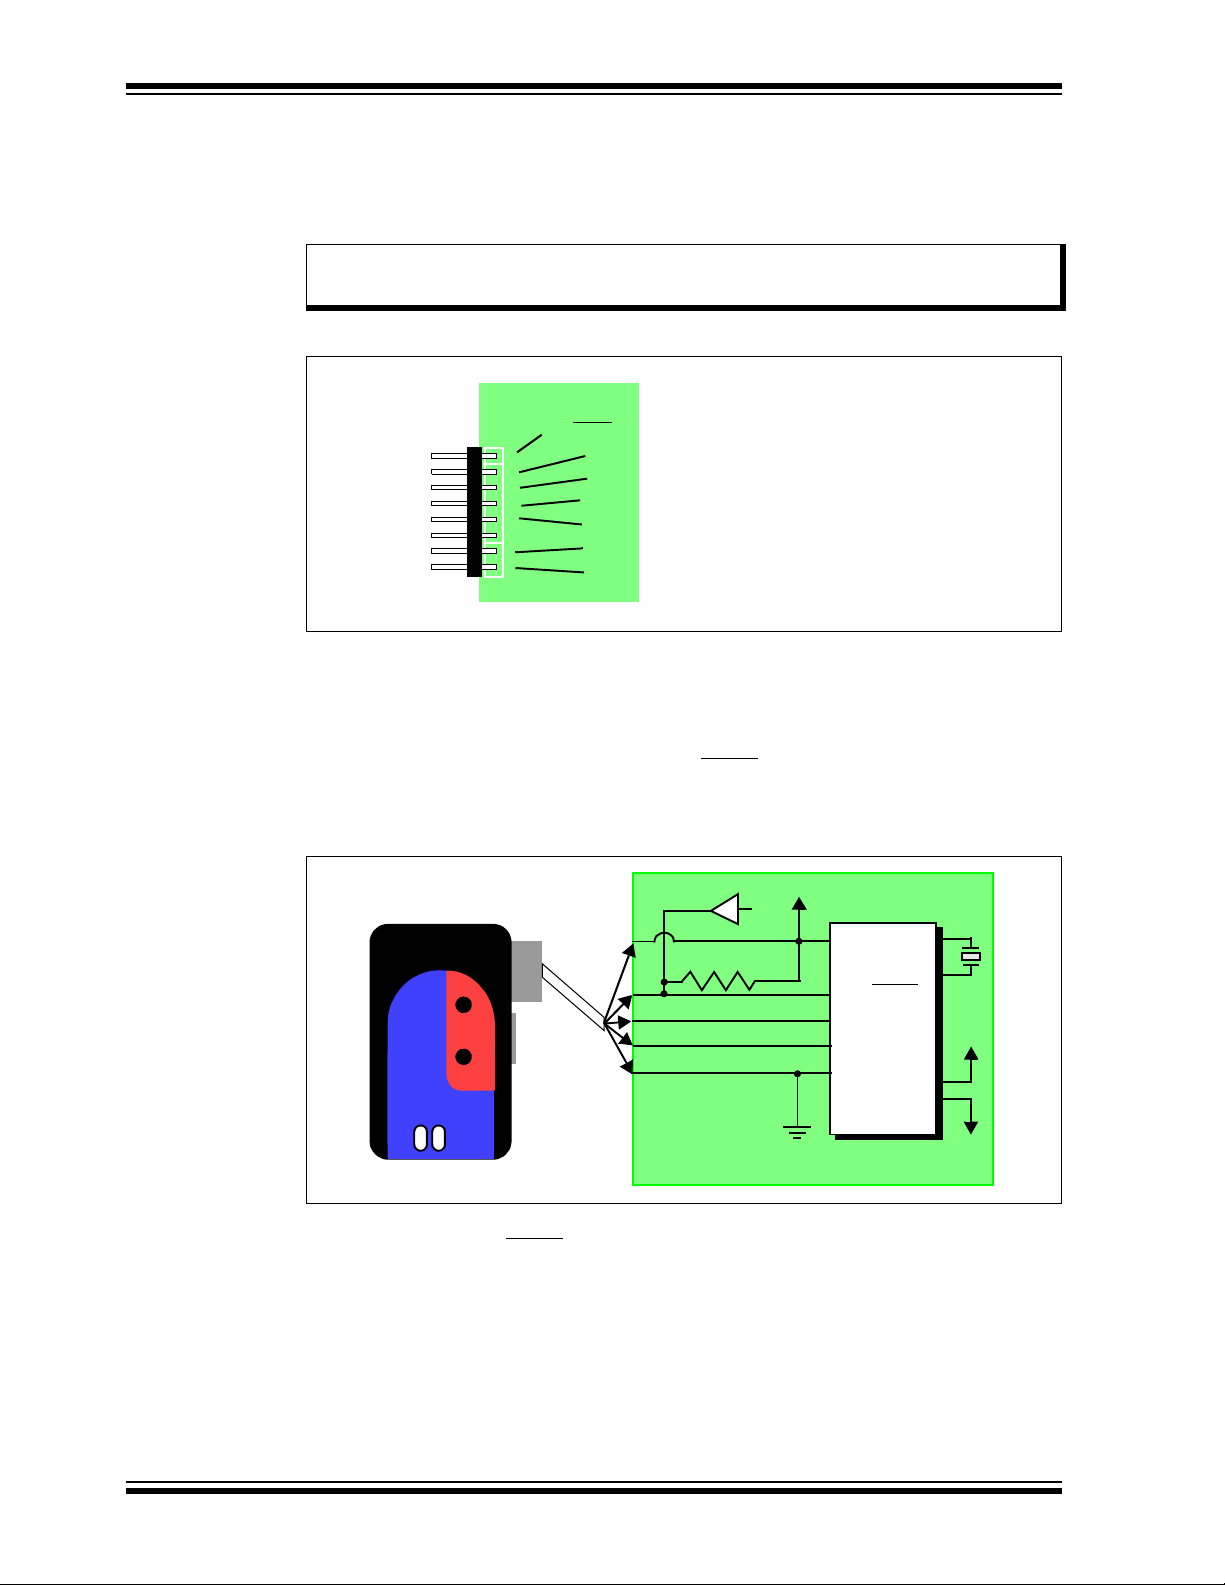
2.4.2 High-Speed Communication Connection
Using the high-speed driver/receiver board combination, the MPLAB REAL ICE
in-circuit emulator is connected to the target device with an 8-pin interface. The pin
numbering for the connector is shown from the top of the target PC board in Figure 2-7.
Note: Connections from the emulator to the target are shown in
Section 12.7 “High-Speed Communication Hardware”.
FIGURE 2-7: HIGH-SPEED CONNECTION AT TARGET
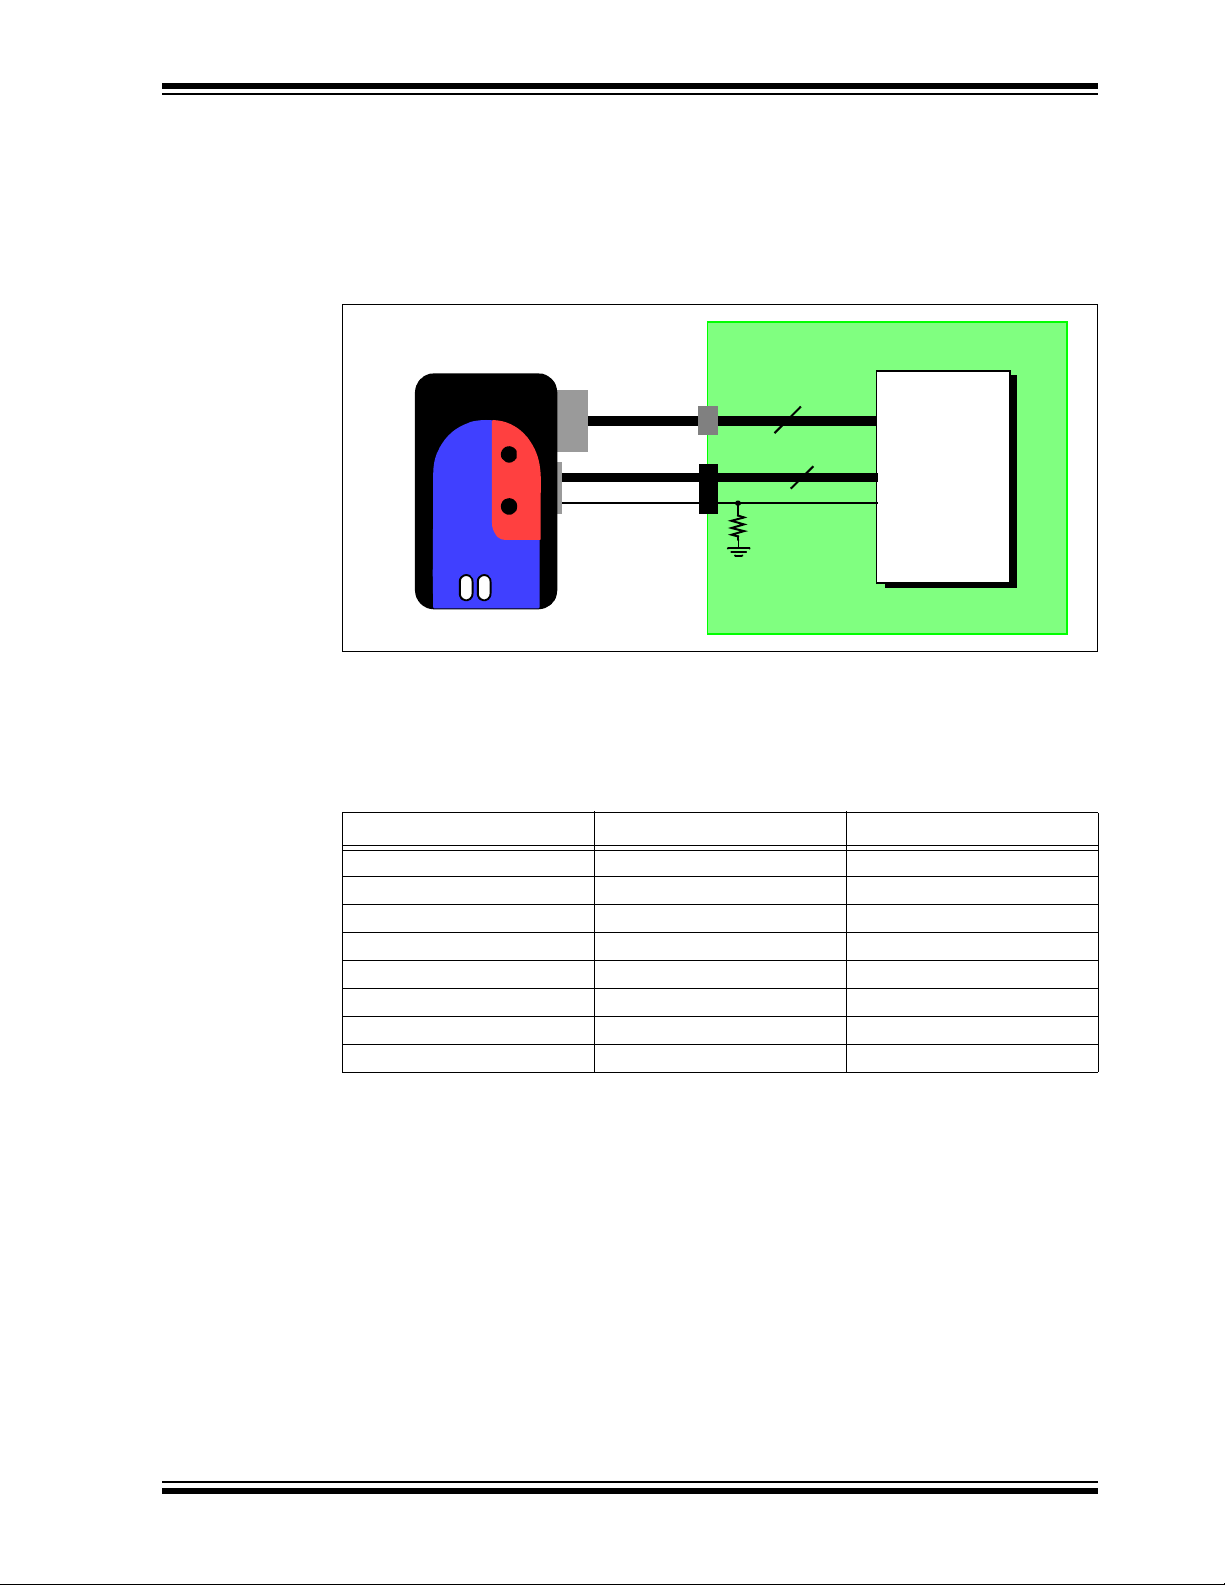
2.4.3 Target Connection Circuitry
Figure 2-8 shows the interconnections of the MPLAB REAL ICE in-circuit emulator to
the connector on the target board. The diagram also shows the wiring from the
connector to a device on the target PC board. A pull-up resistor (typically 10 kΩ) is
recommended to be connected from the V
strobed low to reset the device.
FIGURE 2-8: STANDARD CONNECTION TARGET CIRCUITRY
In the following descriptions, only three lines are active and relevant to core emulator
operation: pins 1 (V
shown on the above diagram for completeness, but are only sensed, not provided or
controlled, by the emulator.
Be aware that the target V
target low-voltage operation. If the emulator does not sense voltage on its V
DS51616B-page 18 © 2008 Microchip Technology Inc.
2 of the interface connector), it will not operate.
PP/MCLR), 5 (PGC) and 4 (PGD). Pins 2 (VDD) and 3 (VSS) are
DD is sensed by the emulator to allow level translation for
PP/MCLR line to VDD so that the line may be
DD line (pin
Page 25
Operation
No!
No!
No!
No!
VPP/MCLR
PGC
PGD
1
5
4
Interface
Connector
ACTIVE
STATUS
RESETFUNCTION
Emulator Pod
Not all devices have the AVDD and AVSS lines, but if they are present on the target
device, all must be connected to the appropriate levels in order for the emulator to
operate.
In general, it is recommended per device data sheet that all V
lines be connected to the appropriate levels. Also, devices with a V
PIC18FXXJ devices) should be connected to the appropriate capacitor or other internal
regulator device.
Note: The interconnection is very simple. Any problems experienced are often
caused by other connections or components on these critical lines that
interfere with the operation of the MPLAB REAL ICE in-circuit emulator
system, as discussed in the next section.
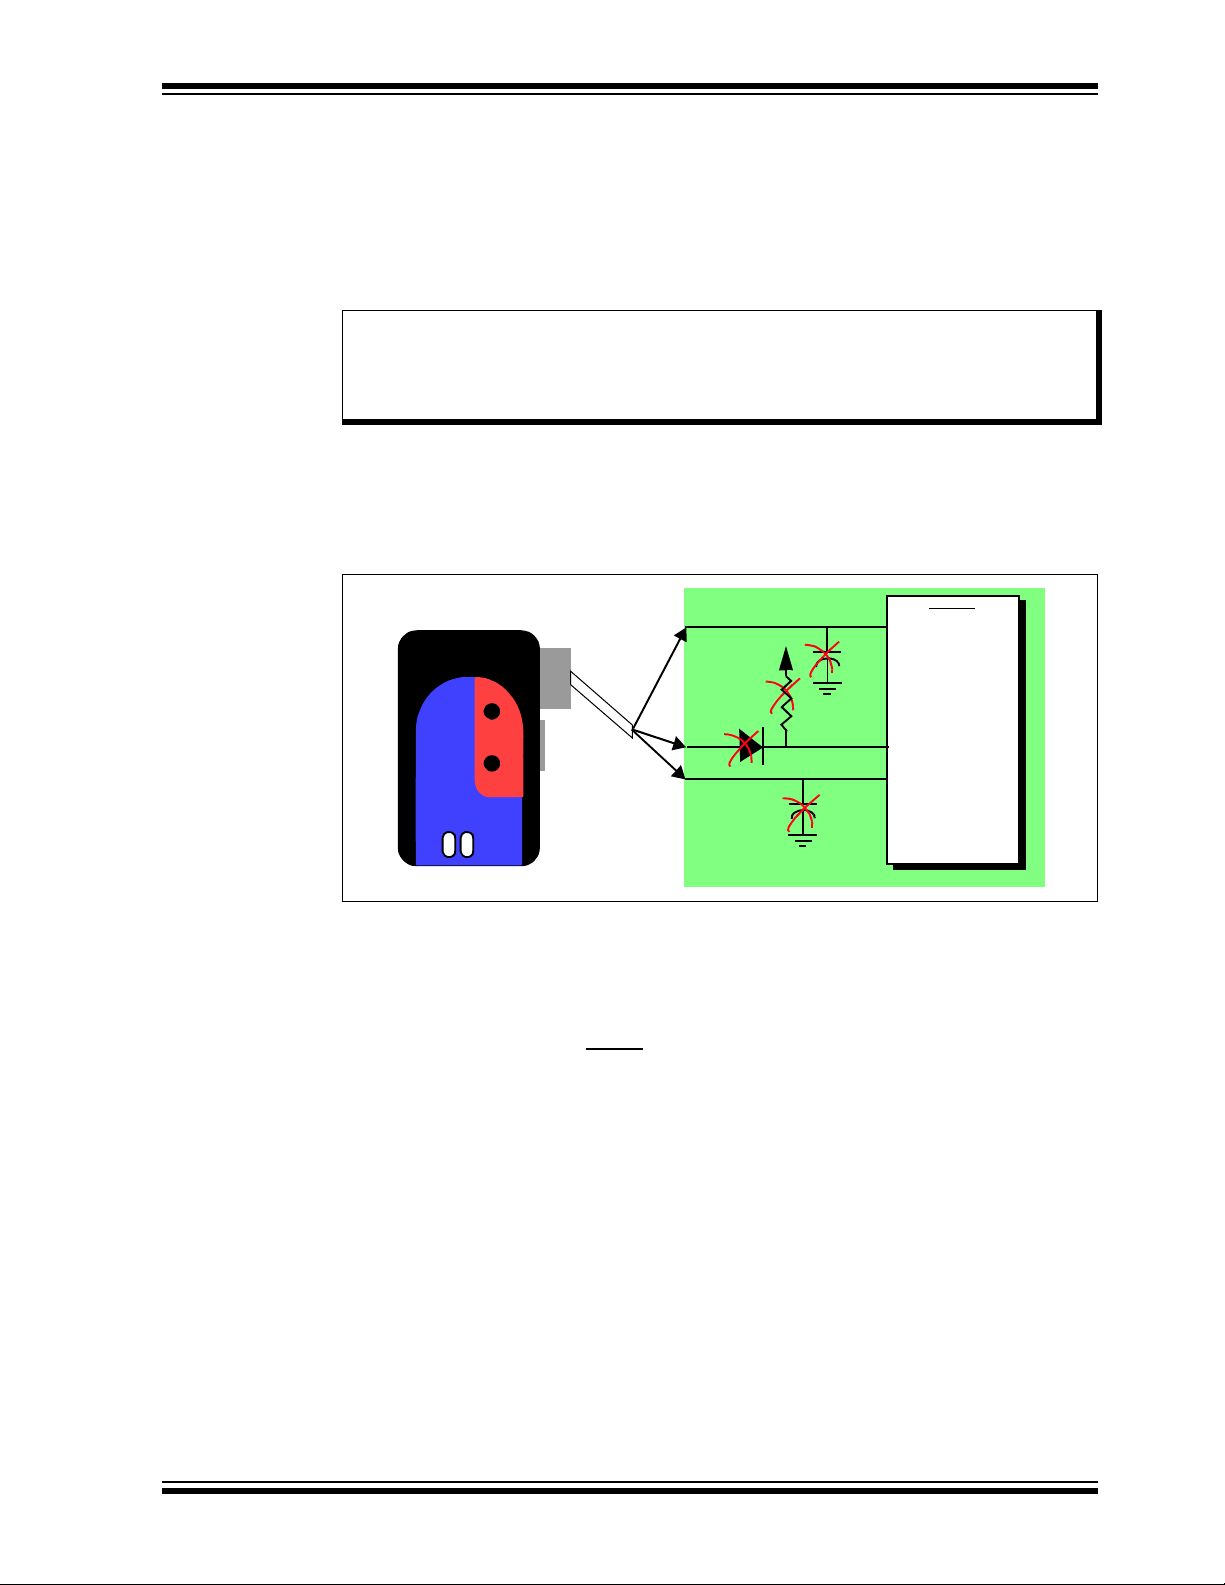
2.4.4 Circuits That Will Prevent the Emulator From Functioning
Figure 2-9 shows the active emulator lines with some components that will prevent the
MPLAB REAL ICE in-circuit emulator system from functioning.
FIGURE 2-9: IMPROPER CIRCUIT COMPONENTS
DD/AVDD and VSS/AVSS
CAP pin (like
© 2008 Microchip Technology Inc. DS51616B-page 19
Specifically, these guidelines must be followed:
• Do not use pull-ups on PGC/PGD – they will divide the voltage levels, since these
lines have 4.7 kΩ pull-down resistors in the emulator.
• Do not use capacitors on PGC/PGD – they will prevent fast transitions on data
and clock lines during programming and debug communications.
• Do not use capacitors on MCLR
– they will prevent fast transitions of VPP. A
simple pull-up resistor is generally sufficient.
• Do not use diodes on PGC/PGD – they will prevent bidirectional communication
between the emulator and the target device.
For other operational issues, see:
• Chapter 10. “Err or Messa ges”
• Chapter 9. “Frequently Asked Questions (FAQ)”
• Section 10.3.6 “Debug Failure Actions” (Top Reasons Why You Can’t Debug)
• Section 12.8 “Loop-Back Test Board”
Page 26
MPLAB® REAL ICE™ In-Circuit Emulator User’s Guide
7
8
Application
PC Board
5
DAT
CLK
Device
SPI
SDO
SCK
High-Speed
Interface
Connector
ACTIVE
STATUS
RESETFUNCTION
Emulator Pod
2.5 T RACE CONNECTIONS
When the emulator is selected as the debug tool, it has several trace capabilities,
depending on the device selected.
2.5.1 Native Trace Connections
No additional connections are necessary to use Native trace. The communications
connection will carry the trace information using the PGD/PGC/EMUC/EMUD pins.
However, the selected device must have this feature. If it does not, one of the other
trace methods may be used.
For more on this type of trace, see Section 7.3.3.1 “Native Trace”.
2.5.2 SPI Trace Connections (High-Speed Communication Only)
When using high-speed communications, streaming serial trace is an optional trace
available using the device SPI and pins 7 (DA T) and 8 (CLK). Figure 2-10 shows these
additional connections. As with pins 4 (PGD) and 5 (PGC) (Section 2.4.4 “Circuits
That Will Prevent the Emulator From Functioning”), do not use pull-up resistors,
capacitors or diodes.
FIGURE 2-10: SERIAL TRACE CONNECTIONS
DS51616B-page 20 © 2008 Microchip Technology Inc.
The DAT and CLK lines are intended for use with devices that do not have built-in
debug logic that allows tracing to use the PGD/PGC/EMUC/EMUD pins. The DAT line
connects to either the target device SPI port SDO1 or SDO2. The CLK line connects to
SCK1 or SCK2.
When you dedicate these pins to tracing, then any multiplexed function on these pins
can no longer be used by the application.
For more on this type of trace, see Section 7.3.3.3 “SPI Trace”.
Page 27
Operation
Interface
Connector
Application
PC Board
5
Device
PORTx
Probe
Connector
6:0
7
10KΩ
ACTIVE
STATUS
RESETFUNCTION
Emulator Pod
7
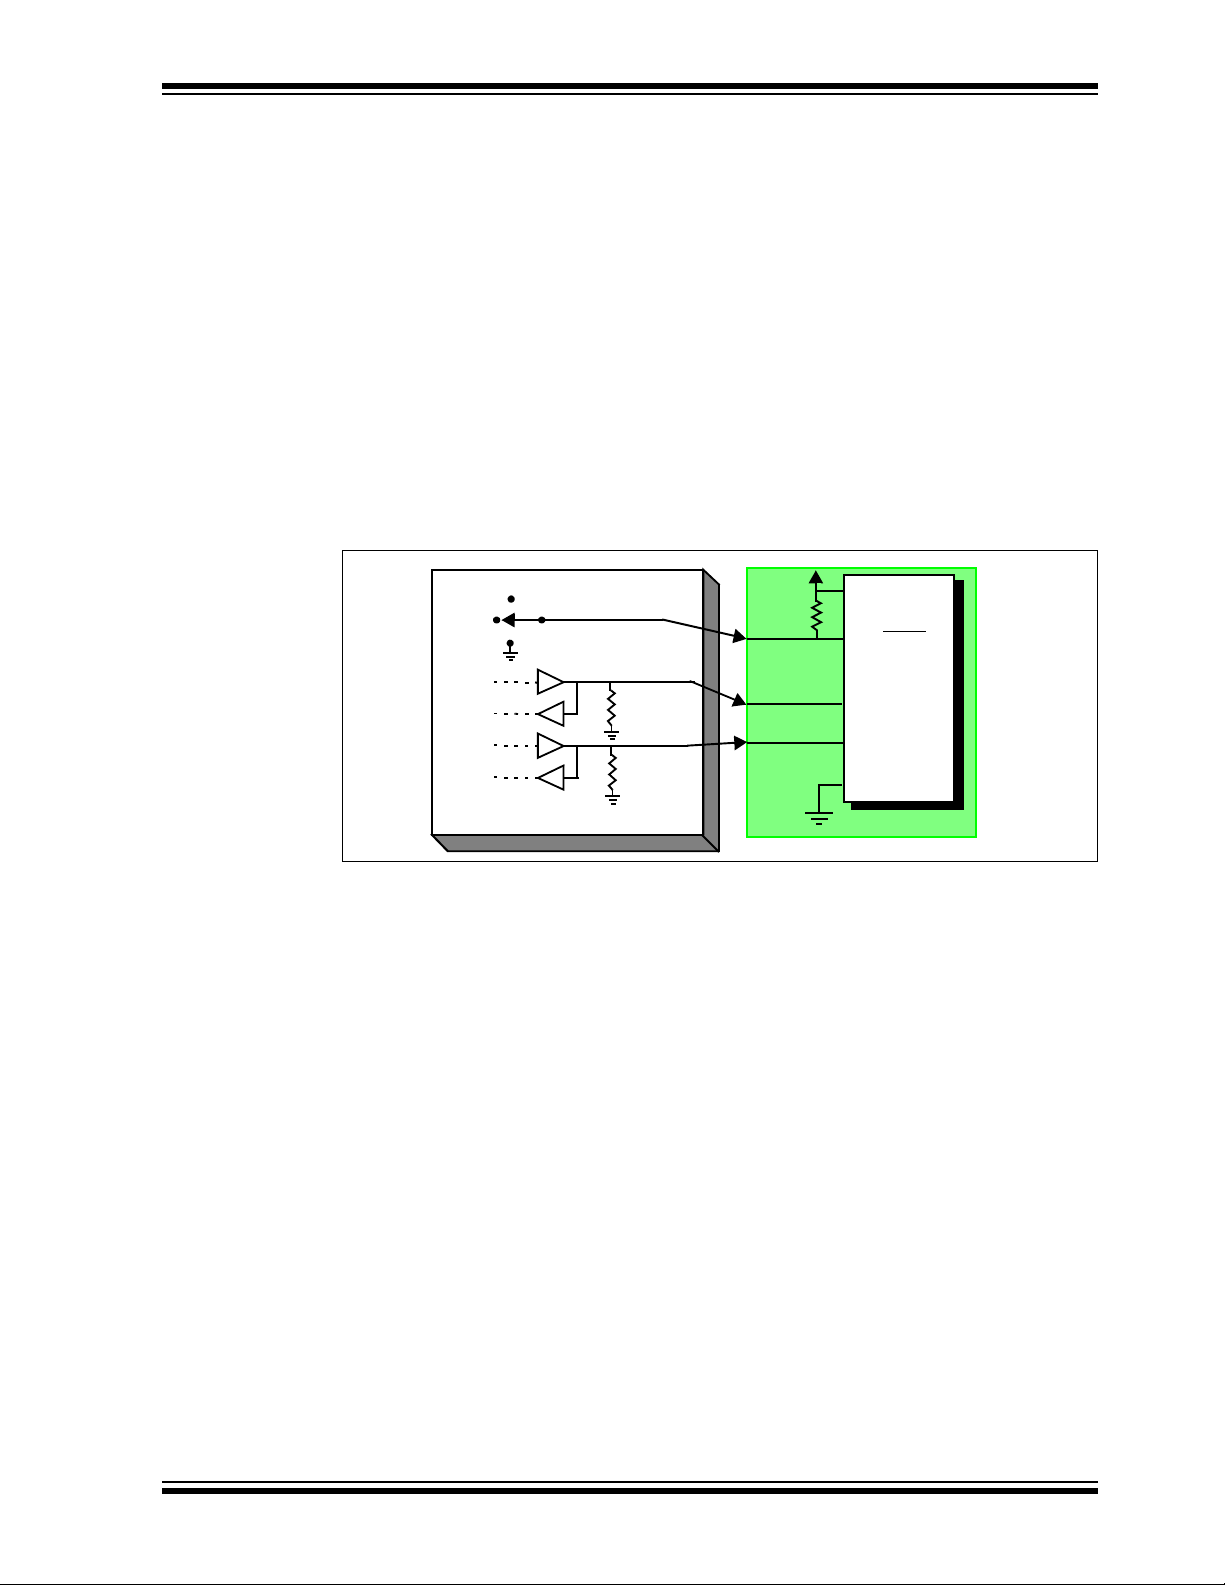
2.5.3 I/O Port T race Connections
Streaming parallel trace is possible using a device 8-pin I/O port and the emulator logic
probe connector. This provides greater trace speed and data quantity, but limits
emulator-to-target distance by the length of the logic probe connectors. Figure 2-11
shows these additional connections.
FIGURE 2-11: PARALLEL T RACE CONNECTIONS
For this trace configuration, seven (7) lines of data and one (1) line for clock are
transmitted. PORTx must be a port with 8 pins that has all 8 pins available for trace.
The port must not be multiplexed with the currently-used PGC and PGM pins.
A basic configuration is shown in Table 2-1: “I/O Port Trace Connection Example”.
TABLE 2-1: I/O PORT TRACE CONNECTION EXAMPLE
(2)
(1)
Content
Clock
PORTx pin Logic Probe pin
0 EXT0 Data
1 EXT1 Data
2 EXT2 Data
3 EXT3 Data
4 EXT4 Data
5 EXT5 Data
6 EXT6 Data
7 EXT7
Note 1: For pin descriptions, see Section 12.5.4 “Logic Probe/External Trigger Inter-
face”.
2: Use a 10KΩ pull-down resistor.
As in Section 2.4.4 “Circuits That Will Prevent the Emulator From Functioning”,
do not use pull-up resistors, capacitors or diodes on port pins, except as specified.
For more on this type of trace, see Section 7.3.3.2 “I/O Port Trace”.
© 2008 Microchip Technology Inc. DS51616B-page 21
Page 28
MPLAB® REAL ICE™ In-Circuit Emulator User’s Guide
PIM
Interface
Connector
Application
PC Board
5
Device
TRD3:0
Trace
Connector
ACTIVE
STATUS
RESETFUNCTION
Emulator Pod
TRCLK
5
2.5.4 PIC32 Instruction Trace Connections
PIC32 Instruction Trace is only available for PIC32MX MCU devices, and it is the only
type of trace available for these devices. Also, only some PIC32MX MCU devices have
the trace feature. Consult your device data sheet for details.
To use this trace, you will need the following hardware:
• PIC32MX Plug-In Module (PIM) containing a device that supports trace and a
trace port
• PIC32MX Trace Interface Kit (AC244006) containing a 12-inch trace cable and a
trace adapter board
To use the PIC32 Instruction Trace feature, see Section 8.3 “PIC32 Instruction
Trace”.
FIGURE 2-12: PIC32 TRACE CONNECTION
DS51616B-page 22 © 2008 Microchip Technology Inc.
Page 29
2.6 DEBUGGING WITH THE EMULATOR
+5V
Programming
4.7 k
Ω
4.7 k
Ω
VPP/MCLR
PGC
PGD
1
5
4
Internal Circuits
V
SS
V
DD
Voltage
There are two steps to using the MPLAB REAL ICE in-circuit emulator system as a
debugger. The first requires that an application be programmed into the target device.
The second uses the internal in-circuit debug hardware of the target Flash device to run
and test the application program. These two steps are directly related to the MPLAB
IDE operations:
1. Programming the code into the target and activating special debug functions
(see the next section for details).
2. Using the emulator to set breakpoints and run.
If the target device cannot be programmed correctly, the MPLAB REAL ICE in-circuit
emulator will not be able to debug.
Figure 2-13 shows the basic interconnections required for programming. Note that this
is the same as Figure 2-8, but for the sake of clarity, the V
emulator are not shown.
FIGURE 2-13: PROPER CONNECTIONS FOR PROGRAMMING
Operation
DD and VSS lines from the
A simplified diagram of some of the internal interface circuitry of the MPLAB REAL ICE
in-circuit emulator pod is shown. For programming, no clock is needed on the target
device, but power must be supplied. When programming, the emulator puts
programming levels on V
PP, sends clock pulses on PGC and serial data via PGD. To
verify that the part has been programmed correctly, clocks are sent to PGC and data is
read back from PGD. This conforms to the ICSP protocol of the device under
development.
2.7 REQUIREMENTS FOR DEBUGGING
To debug (set breakpoints, see registers, etc.) with the MPLAB REAL ICE in-circuit
emulator system, there are critical elements that must be working correctly:
• The emulator must be connected to a PC. It must be powered by the PC via the
USB cable, and it must be communicating with MPLAB IDE software via the USB
cable. See Chapter 3. “Installation” for details.
• The emulator must be connected as shown to the V
target device with the modular interface cable (or equivalent). V
© 2008 Microchip Technology Inc. DS51616B-page 23
also required to be connected between the emulator and target device.
• The target device must have power and a functional, running oscillator. If the
target device does not run, for whatever reason, the MPLAB REAL ICE in-circuit
emulator cannot debug.
PP, PGC and PGD pi n s of th e
SS and VDD are
Page 30

MPLAB® REAL ICE™ In-Circuit Emulator User’s Guide
• The target device must have its configuration words programmed correctly:
- The oscillator Configuration bits should correspond to RC, XT , etc., depending
upon the target design.
- For some devices, the Watchdog Timer is enabled by default and needs to be
disabled.
- The target device must not have code protection enabled.
- The target device must not have table read protection enabled.
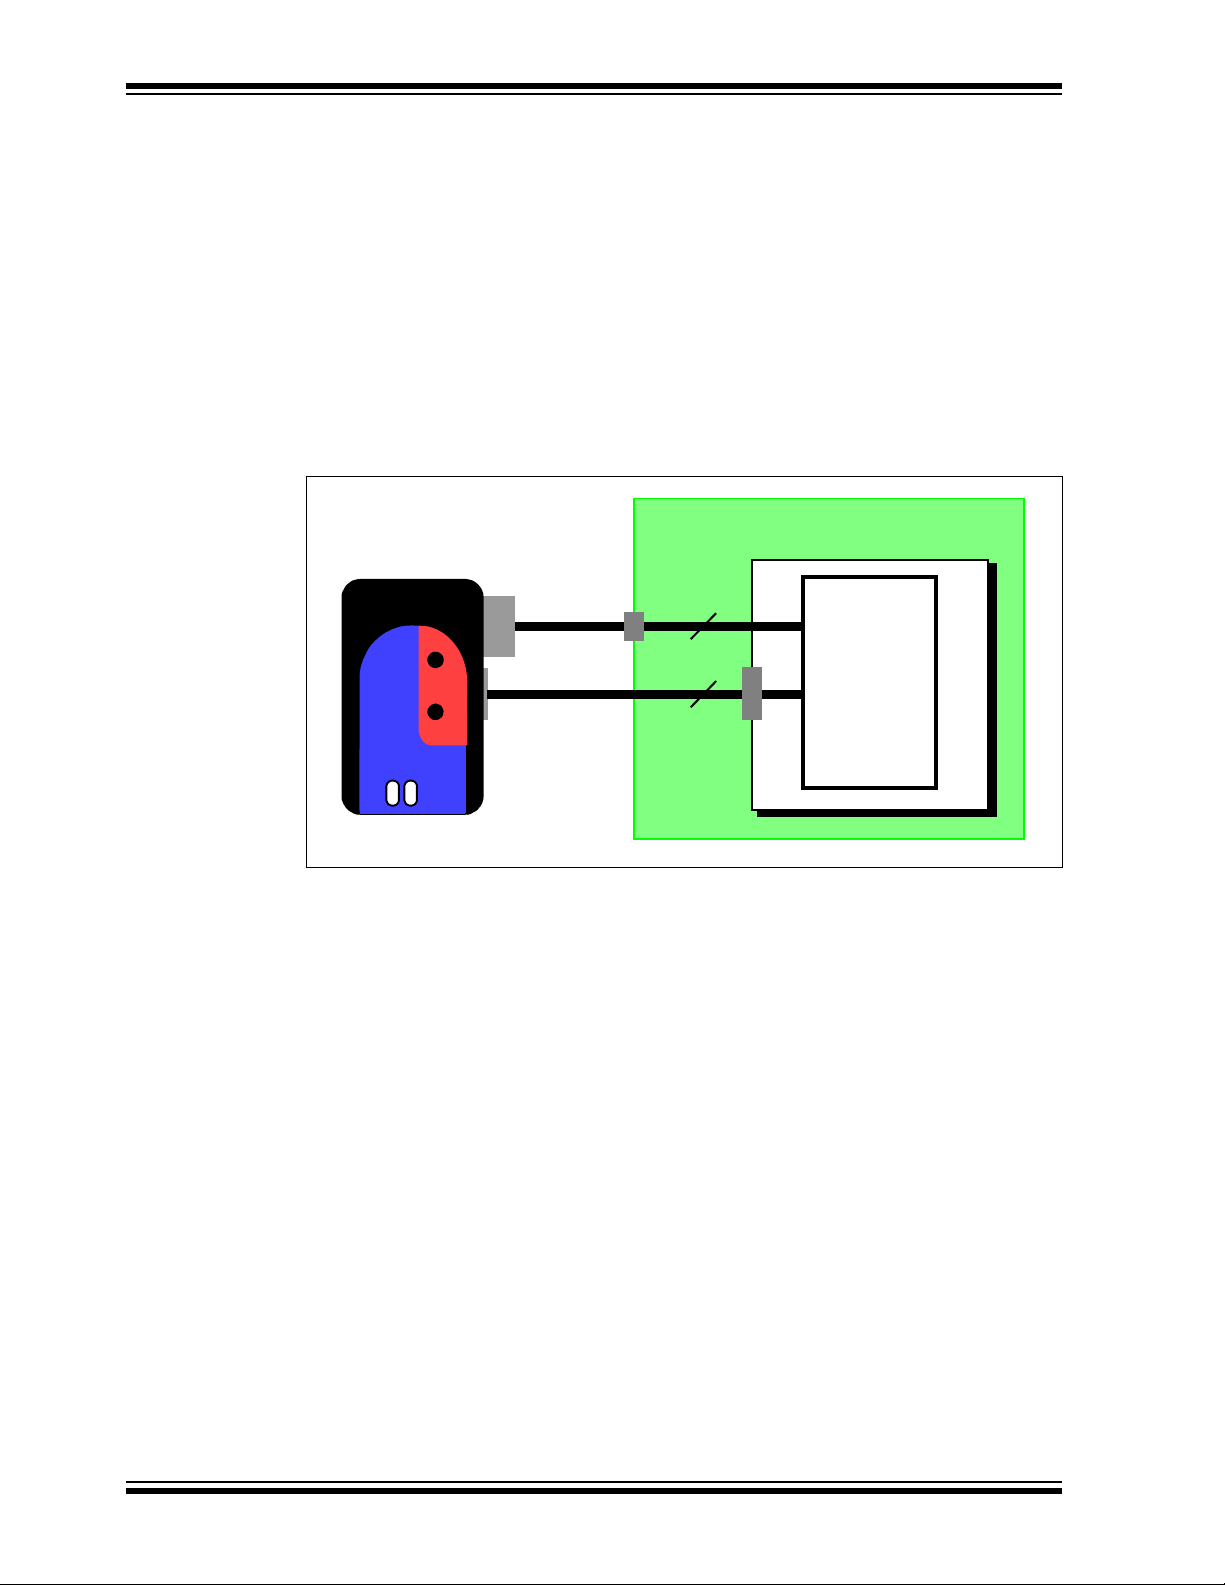
2.7.1 Sequence of Operations Leading to Debugging
Given that the Requirements For Debugging are met, these actions can be performed
when the MPLAB REAL ICE in-circuit emulator is set as the current debugger
(Debugger>Select Tool
• The application code is compiled/assembled with the “Build Configuration” list box
on the MPLAB IDE toolbar set to “Debug”. Also, it may be set by selecting
Project>Build Configuration>Debug
• When Debugger>Program
the device’s memory via the ICSP protocol as described above.
• A small “debug executive” program is loaded into the high area of program
memory of the target device. Since the debug executive must reside in program
memory, the application program must not use this reserved space. Some devices
have special memory areas dedicated to the debug executive. Check your device
data sheet for details.
• Special “in-circuit debug” registers in the target device are enabled by MPLAB
IDE. These allow the debug executive to be activated by the emulator.
• The target device is held in Reset by keeping the V
):
.
is selected, the application code is programmed into
PP/MCLR line low.
DS51616B-page 24 © 2008 Microchip Technology Inc.
Page 31

Operation
+5V
+12V
4.7 k
Ω
4.7 k
Ω
Internal Circu its
Program
Memory
File
Registers
Internal
Debug
Registers
VPP/MCLR
PGC
PGD
1
5
4
Executive
Debug
Area Used by
Target
be
Running
must
for Debug
Executive
to Function
Area
VDD
Hardware
Stack Shared
by Debug Exec
Debug Exec
Reserved
for Debug
Executive
2.7.2 Debugging Details
Figure 2-14 illustrates the MPLAB REAL ICE in-circuit emulator system when it is ready
for debugging.
FIGURE 2-14: MPLAB
®
REAL ICE™ IN-CIRCUIT EMULATOR READY FOR
DEBUGGING
Typically , in order to find out if an application program will run correctly, a breakpoint is
set early in the program code. When a breakpoint is set from the user interface of
MPLAB IDE, the address of the breakpoint is stored in the special internal debug
registers of the target device. Commands on PGC and PGD communicate directly to
these registers to set the breakpoint address.
Next, the Debugger>Run
function or the Run icon (forward arrow) is usually pressed
from MPLAB IDE. The emulator will then tell the debug executive to run. The target will
start from the Reset vector and execute until the Program Counter reaches the
breakpoint address previously stored in the internal debug registers.
After the instruction at the breakpoint address is executed, the in-circuit debug
mechanism of the target device “fires” and transfers the device’s Program Counter to
the debug executive (much like an interrupt) and the user’s application is effectively
halted. The emulator communicates with the debug executive via PGC and PGD, gets
the breakpoint status information and sends it back to MPLAB IDE. MPLAB IDE then
sends a series of queries to the emulator to get information about the target device,
such as file register contents and the state of the CPU. These queries are ultimately
performed by the debug executive.
The debug executive runs just like an application in program memory. It uses some
locations on the stack for its temporary variables. If the device does not run, for
whatever reason, such as no oscillator, a faulty power supply connection, shorts on the
target board, etc., then the debug executive cannot communicate to the MPLAB REAL
ICE in-circuit emulator and MPLAB IDE will issue an error message.
Another way to get a breakpoint is to press the MPLAB IDE’s Halt button (the “pause”
symbol to the right of the Run arrow). This toggles the PGC and PGD lines so that the
in-circuit debug mechanism of the target device switches the Program Counter from the
user’s code in program memory to the debug executive. Again, the target application
program is effectively halted, and MPLAB IDE uses the emulator communications with
the debug executive to interrogate the state of the target device.
© 2008 Microchip Technology Inc. DS51616B-page 25
Page 32

MPLAB® REAL ICE™ In-Circuit Emulator User’s Guide
2.8 PROGRAMMING WITH THE EMULATOR
Use the MPLAB REAL ICE in-circuit emulator as a programmer to program an actual
(non -ICE/-ICD) device, i.e., a device not on a header board. Select “MPLAB REAL
ICE” from Programmer>Select Programmer
code with the “Build Configuration” list box on the MPLAB IDE toolbar set to “Release”.
Also, it may be set by selecting Project >B ui ld Configu ra tio n> Rele as e
All debug features are turned off or removed when the emulator is used as a
programmer. When using the Programmer>Program
MPLAB IDE will disable the in-circuit debug registers so the MPLAB REAL ICE
in-circuit emulator will program only the target application code and the Configuration
bits (and EEPROM data, if available and selected) into the target device. The debug
executive will not be loaded. As a programmer, the emulator can only toggle the MCLR
line to reset and start the target. A breakpoint cannot be set, and register contents
cannot be seen or altered.
The MPLAB REAL ICE in-circuit emulator system programs the target using ICSP . Vpp,
PGC and PGD lines should be connected as described previously. No clock is required
while programming, and all modes of the processor can be programmed, including
code protect, Watchdog Timer enabled and table read protect.
2.9 RESOURCES USED BY THE EMULATOR
and compile/assemble your application
.
selection to program a device,
For a complete list of resources used by the emulator for your device, please see the
on-line help file in MPLAB IDE for the MPLAB REAL ICE in-circuit emulator.
DS51616B-page 26 © 2008 Microchip Technology Inc.
Page 33

MPLAB® REAL ICE™ IN-CIRCUIT
Chapter 3. Installation
3.1 INTRODUCTION
How to install the MPLAB REAL ICE in-circuit emulator system is discussed.
• Installing the Software
• Installing the USB Device Drivers
• Selecting Target Communications
• Setting Up the Target
• Connecting the Logic Probes
• Setting Up MPLAB IDE
3.2 INSTALLING THE SOFTWARE
To install the MPLAB IDE software, first acquire the latest MPLAB IDE installation
executable (MPxxxxx.exe, where xxxxx represents the version of MPLAB IDE) from
either the Microchip web site (www.microchip.com) or the MPLAB IDE CD-ROM
(DS51123). Then run the executable and follow the screens to install MPLAB IDE.
EMULATOR USER’S GUIDE
3.3 INSTALLING THE USB DEVICE DRIVERS
Installing MPLAB IDE will preinstall the USB device drivers for the MPLAB REAL ICE
in-circuit emulator. Therefore, once you have installed MPLAB IDE, connect the
emulator to the PC with a USB cable and follow the Windows
to automatically install the drivers.
Expanded USB device driver installation instructions may found at:
MPLAB IDE installation directory\REAL ICE\Drivers\ddri.htm
Note: If you change USB ports/hubs, you do not need to reinstall the drivers since
the emulator is serialized.
®
“New Hardware Wizard”
© 2008 Microchip Technology Inc. DS51616B-page 27
Page 34

MPLAB® REAL ICE™ In-Circuit Emulator User’s Guide
USB/Power
Emulator Pod
ACTIVE
STATUS
RESETFUNCTION
Standard or
Driver Board
From PC
Communications
Cable(s)
From Target
High-Speed
2
3
1
3.4 SELECTING TARGET COMMUNICATIONS
A driver board is inserted into the pod to select the type of communication with the
target, either standard (for header boards and many demo boards) or high speed (for
target boards over six inches away from the emulator). See Section 2.3 “Emulator
Communications with the PC and Target” for more details.
CAUTION
Neither the emulator nor target should be powered when inserting or removing a
driver board or damage to the driver board could result.
If you DID NOT have a driver board installed in the emulator when you installed the
drivers, unplug the USB/Power cable now. Then proceed with the installation
instructions below.
If you DID have a driver board installed in the emulator when you installed the drivers,
proceed to step three below.
To install a driver board:
1. Insert the desired driver board into the emulator pod
2. Plug in the USB/power cable
3. Attach the communication cable(s)
T o change a driver board, remove target power and unplug the USB, remove the board,
insert the other board, and then plug in the USB and power the target.
FIGURE 3-1: INSERT DRIVER BOARD AND USB/POWER CABLE
DS51616B-page 28 © 2008 Microchip Technology Inc.
Page 35

3.5 SETTING UP THE TARGET
Once the type of communication has been determined by inserting the corresponding
driver board into the emulator, the target must be set up to accommodate this, as well
as the type of target device to be used, i.e., regular or ICE.
Some devices have built-in debug circuitry. These “regular” devices may be used
directly by the emulator on the target.
Other devices have no built-in debug circuitry. For these devices, a special ICE device
(Device-ICE) is required, mounted on a header board. For more on header boards, see
the “Header Board Specification“ (DS51292).
Note: Some regular devices have ICE devices avaliable to provide dedicated
debug pins and (sometimes) memory.
3.5.1 Using Regular Devices
For regular devices, the emulator may be connected directly to the target board. The
device on the target board must have built-in debug circuitry in order for the MPLAB
REAL ICE in-circuit emulator to perform emulation with it. Consult the device data sheet
to see if the device has the needed debug circuitry, i.e., it should have a “Background
Debugger Enable” Configuration bit.
Installation
Note: In the future, devices with circuitry that support ICD may be used, though
only standard debug, and not emulator debug, functions will be available.
The target board must have a connector to accommodate to the communications
chosen for the emulator. For connection information, see Section 2.3.1 “Standard
Communication” or Section 2.3.2 “High-Speed Communication”.
3.5.2 Using ICE Devices and Header Boards
For ICE devices, an ICE header board is required. The header board contains the
hardware necessary to emulate a specific device or family of devices.
Note: In the future, ICD header boards with ICD devices (Device-ICD) may be
used, though only standard debug, and not emulator debug, functions will
be available.
A transition socket is used with the ICE header to connect the header to the target
board. Transition sockets are available in various styles to allow a common header to
be connected to one of the supported surface mount package styles. For more
information on transition sockets, see the “Transition Socket Specification” (DS51 194).
Header board layout will be different for standard or high-speed communications. For
connection information, see Section 2.3.1 “Standard Communication” or
Section 2.3.2 “High-Speed Communication”.
3.5.3 Powering the Target
If you have not already done so, connect the emulator pod to the target using the
appropriate cables for the driver board selected (see Section 3.4 “Selecting T arget
Communications”). Then power the target.
Note: The emulator cannot power the target.
© 2008 Microchip Technology Inc. DS51616B-page 29
Page 36

MPLAB® REAL ICE™ In-Circuit Emulator User’s Guide
3.6 CONNECTING THE LOGIC PROBES
The logic probes may be connected into the logic probe connector on the emulator pod.
These probes will allow halting the MPLAB REAL ICE in-circuit emulator by external
triggers, and will provide output triggers to synchronize external equipment such as
oscilloscopes and logic analyzers. See Section 6.3 “External Triggers” for setup
information.
This connector can also be used for trace. See:
• Section 2.5.3 “I/O Port Trace Connections”
• Section 2.5.4 “PIC32 Instruction Trace Connections”
3.7 SETTING UP MPLAB IDE
Once the hardware is connected and powered, MPLAB IDE may be set up for use with
the MPLAB REAL ICE in-circuit emulator.
On some devices, you must select the communications channel in the Configuration
bits, e.g., PGC1/EMUC1 and PGD1/EMUD1. Make sure the pins selected here are the
same ones physically connected to the device.
For more on setting up MPLAB IDE, see Chapter 5. “General Setup”.
DS51616B-page 30 © 2008 Microchip Technology Inc.
Page 37

4.1 INTRODUCTION
This tutorial walks you through the process of developing a simple project using the
sample programs counter.c and timer.c. This is an implementation of the
PIC24FJ128GA010 device using the Explorer 16 Demo Board (DM240001). The
program counter.c is a simple counting program. The incremental count, delayed by
using Timer 1 (timer.c), is displayed via Port A on the demo board’s LEDs.
Topics covered in this chapter:
• Setting Up The Environment
• Creating the Application Code
• Running the Project Wizard
• Viewing the Project
• Creating a Hex File
• Viewing Debug Options
• Setting Up the Demo Board
• Loading Program Code For Debugging
• Running Debug Code
• Debugging Code Using Breakpoints
• Debugging Code Using A Runtime Watch
• Debugging Code Using Native Trace
• Programming the App lication
• Other Trace Methods – SPI or I/O Port Trace
• Other Trace Methods – PIC32 Instruction Trace
MPLAB® REAL ICE™ IN-CIRCUIT
EMULATOR USER’S GUIDE
Chapter 4. Tutorial
4.2 SETTING UP THE ENVIRONMENT
Before beginning this tutorial, follow the steps in Chapter 3. “Installation” to set up the
MPLAB IDE software and MPLAB REAL ICE system hardware. Double-click on the
MPLAB IDE icon to launch the application. Once launched, the MPLAB IDE desktop
should appear.
© 2008 Microchip Technology Inc. DS51616B-page 31
Page 38

MPLAB® REAL ICE™ In-Circuit Emulator User’s Guide
FIGURE 4-1: MPLAB® IDE DESKTOP
4.2.1 Selecting the Device
To select the device for this tutorial:
1. Select Configure>Select Device
2. In the Device Selection dialog, choose “PIC24FJ128GA010” from the Device list
box. The light icon next to “MPLAB REAL ICE” in the “Microchip Tool
Programmer/Debugger Tool Support” sections should be green.
3. Click OK.
.
4.2.2 Selecting the Emulator as a Debugger
T o select MPLAB REAL ICE in-circuit emulator as a debugger, select Debugger>Select
Tool>REAL ICE. Then:
1. The Output window will open to display connection information. Depending on
the version of MPLAB IDE or the device selected, a message box may appear
indicating that the firmware needs to be updated. MPLAB IDE will automatically
install the new firmware. Also, since different MPLAB REAL ICE firmware is used
for different families of devices, this message box may appear when switching to
a different device.
2. The Debugger menu will show available emulator debug options.
3. A Debug toolbar will appear. Mouseover a button to see a pop-up of its function.
4.3 CREATING THE APPLICATION CODE
For this tutorial, two C programs will be used. The code for each is shown below.
1. Using Windows
2. Open an editor window by selecting File>New
program (counter.c) in this window and save to the project folder.
3. Open another editor window by selecting File>New
second program (timer.c) in this window and save to the project folder.
®
Explorer, create a project folder.
. Enter the code for the first
. Enter the code for the
DS51616B-page 32 © 2008 Microchip Technology Inc.
Page 39

Tutorial
counter.c
/*****************************************************************************
* MPLAB REAL ICE In-Circuit Emulator Tutorial
* Counting program
*
*****************************************************************************
* Demo Board: Explorer 16
* Processor: PIC24FJ128GA010
* Compiler: MPLAB C30
* Linker: MPLAB LINK30
* Company: Microchip Technology Incorporated
*
*****************************************************************************/
#include "p24FJ128GA010.h"
// Set up configuration bits
_CONFIG1( JTAGEN_OFF & GCP_OFF & GWRP_OFF & COE_OFF & FWDTEN_OFF & ICS_PGx2)
_CONFIG2( FCKSM_CSDCMD & OSCIOFNC_ON & POSCMOD_HS & FNOSC_PRI )
// Set up user-defined variables
#define INIT_COUNT 0
unsigned int counter;
int main(void)
{
// Set up PortA IOs as digital output
AD1PCFG = 0xffff;
TRISA = 0x0000;
// Set up Timer1
TimerInit();
// Initialize variables
counter = INIT_COUNT;
while (1) {
// Wait for Timer1 overflow
if (TimerIsOverflowEvent()){
counter++; //increment counter
PORTA = counter; //display on port LEDs
}// End of if...
}// End of while loop...
}// End of main()...
timer.c
/*****************************************************************************
* MPLAB REAL ICE In-Circuit Emulator Tutorial
* Timer program
*
*****************************************************************************
* Demo Board: Explorer 16
* Processor: PIC24FJ128GA010
* Compiler: MPLAB C30
* Linker: MPLAB LINK30
* Company: Microchip Technology Incorporated
*
© 2008 Microchip Technology Inc. DS51616B-page 33
Page 40

MPLAB® REAL ICE™ In-Circuit Emulator User’s Guide
*****************************************************************************/
#include "p24FJ128GA010.h"
//declare functions
extern void TimerInit(void);
extern unsigned char TimerIsOverflowEvent(void);
/*********************************************************************
* Function: TimerInit
*
* PreCondition: None.
*
* Input: None.
*
* Output: None.
*
* Overview: Initializes Timer1 for use.
*
********************************************************************/
void TimerInit(void)
{
PR1 = 0xFFFF;
IPC0bits.T1IP = 5;
T1CON = 0b1000000000010000;
IFS0bits.T1IF = 0;
}
/*********************************************************************
* Function: TimerIsOverflowEvent
*
* PreCondition: None.
*
* Input: None.
*
* Output: Status.
*
* Overview: Checks for an overflow event, returns TRUE if
* an overflow occured.
*
* Note: This function should be checked at least twice
* per overflow period.
********************************************************************/
unsigned char TimerIsOverflowEvent(void)
{
if (IFS0bits.T1IF)
{
IFS0bits.T1IF = 0;
TMR1 = 0;
return(1);
}
return(0);
}
/*********************************************************************
* EOF
********************************************************************/
DS51616B-page 34 © 2008 Microchip Technology Inc.
Page 41
4.4 RUNNING THE PROJECT WIZARD
The MPLAB C compiler for PIC24 MCUs and dsPIC DSCs (formerly MPLAB C30) will
be used in this project. You may either purchase the full compiler or download a free
evaluation version from the Microchip website.
1. To set up this project, select Project>Project Wizard
appear.
2. Proceed to the second dialog of the wizard. The PIC24FJ128GA010 should be
selected.
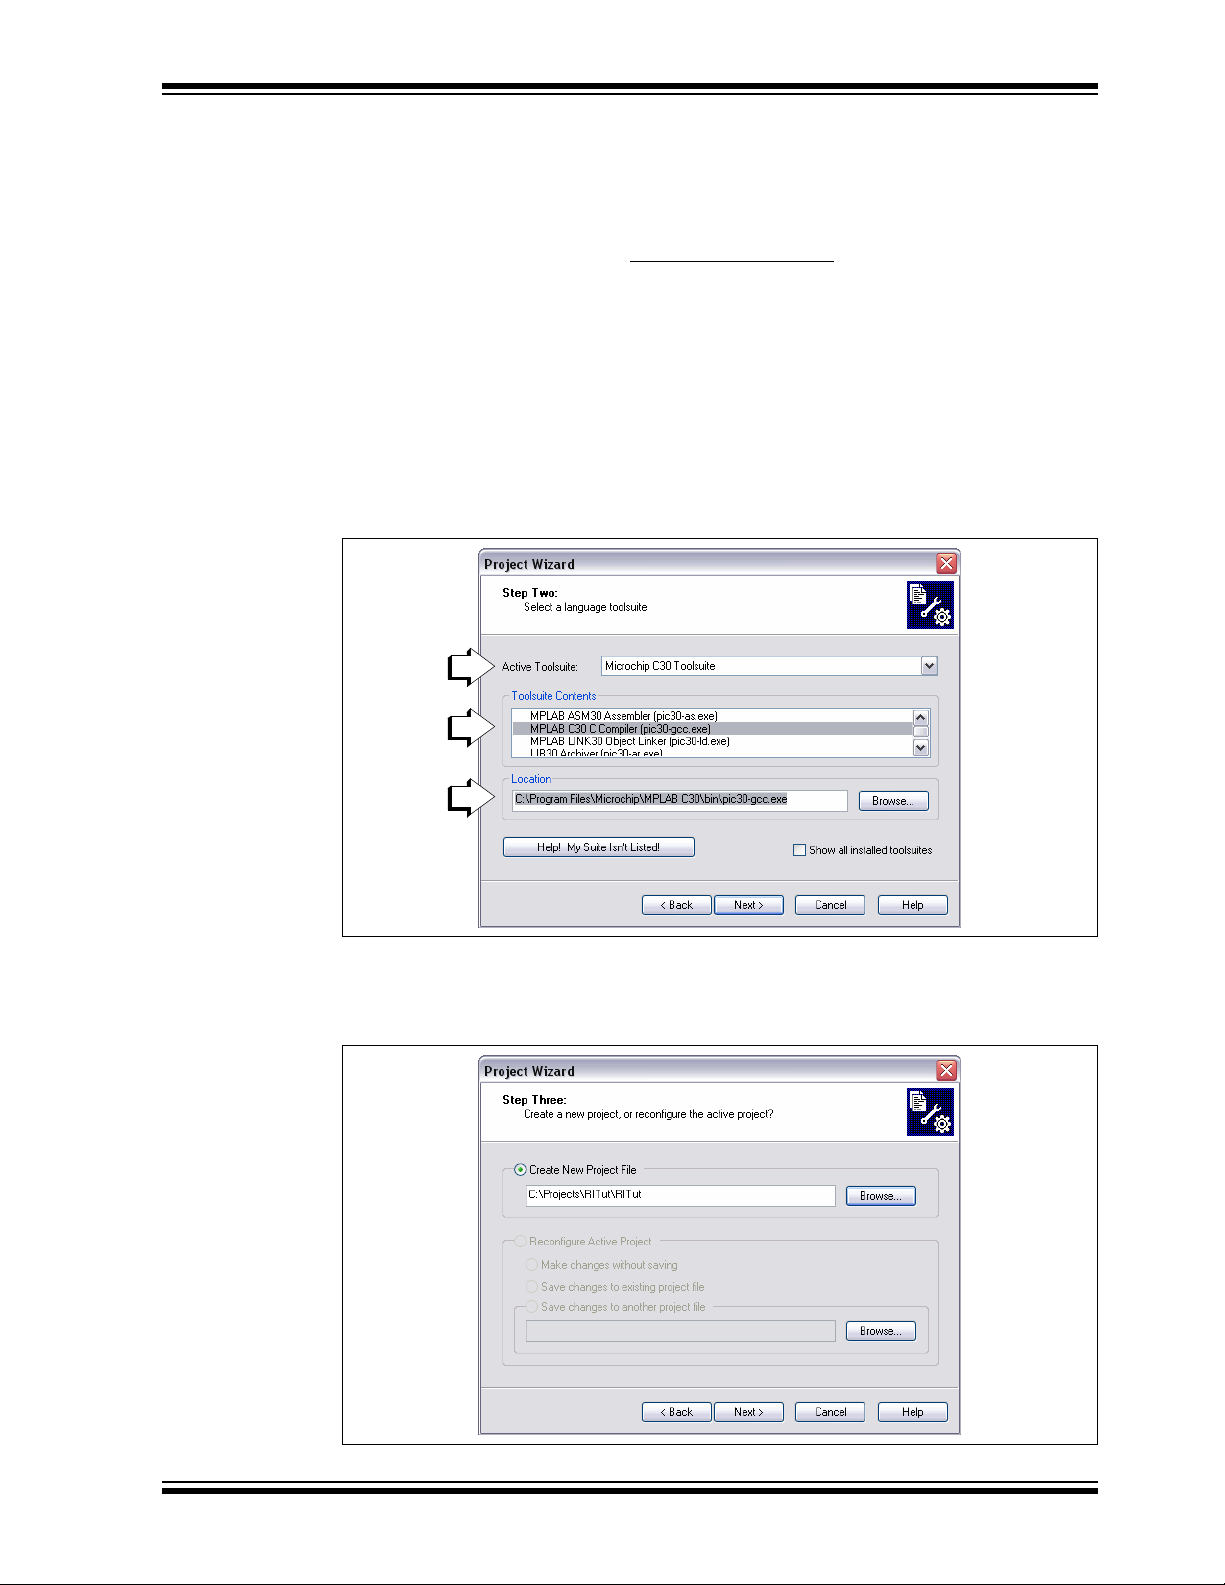
3. Proceed to the next dialog of the wizard to set up the language tools. In the
“Active T oolsuite” pull-down, select “Microchip C30 Toolsuite.” Make sure that the
tools are set to the proper executables, by default located in the directory
C:\Program Files\Microchip\MPLAB C30\bin. MPLAB C30 should be
pointing to pic30-gcc.exe and MPLAB LINK30 should be pointing to
pic30-ld.exe.
FIGURE 4-2: PROJECT WIZARD – TOOLSUITE SELECTION
Tutorial
. A Welcome screen will
4. Proceed to the next dialog of the wizard to give a name and location to your proj-
ect. You may Browse to find a location.
FIGURE 4-3: PROJECT WIZARD – PROJECT NAME
© 2008 Microchip Technology Inc. DS51616B-page 35
Page 42

MPLAB® REAL ICE™ In-Circuit Emulator User’s Guide
5. Proceed to the next dialog of the wizard where project files can be added. Files
can also be added later if something is missed.
For this example, browse to your project directory to find both files. Click on
counter.c to highlight it and then click on ADD>> to add it to the right pane.
Click on timer.c to highlight it and then click on ADD>> to add it to the right
pane.
Leave the “A” next to the file name. For more information on what this and other
letters mean, click the Help button on the dialog.
FIGURE 4-4: PROJECT WIZARD – ADD FILES
6. Proceed to the Summary screen. If you have made any errors, click <Back to
return to a previous wizard dialog. If everything is correct, click Finish.
4.5 VIEWING THE PROJ ECT
After exiting the wizard, the MPLAB IDE desktop will again be visible. Close all other
windows on the desktop to see the Project window.
FIGURE 4-5: PROJECT WINDOW
DS51616B-page 36 © 2008 Microchip Technology Inc.
Page 43

Tutorial
Additional files can be added to the project using the project window. Right click on any
line in the project window tree to pop up a menu with additional options for adding and
removing files.
Note: Although the header file
in the project, you do not need to add them to the project; MPLAB IDE will
find them for you.
4.6 CREATING A HEX FILE
To create a hex file for debugging:
• On the Project toolbar, select “Debug” from the Build Configuration drop-down list.
•Select Proj ect >B ui ld Al l
and select “Build All” from the popup menu.
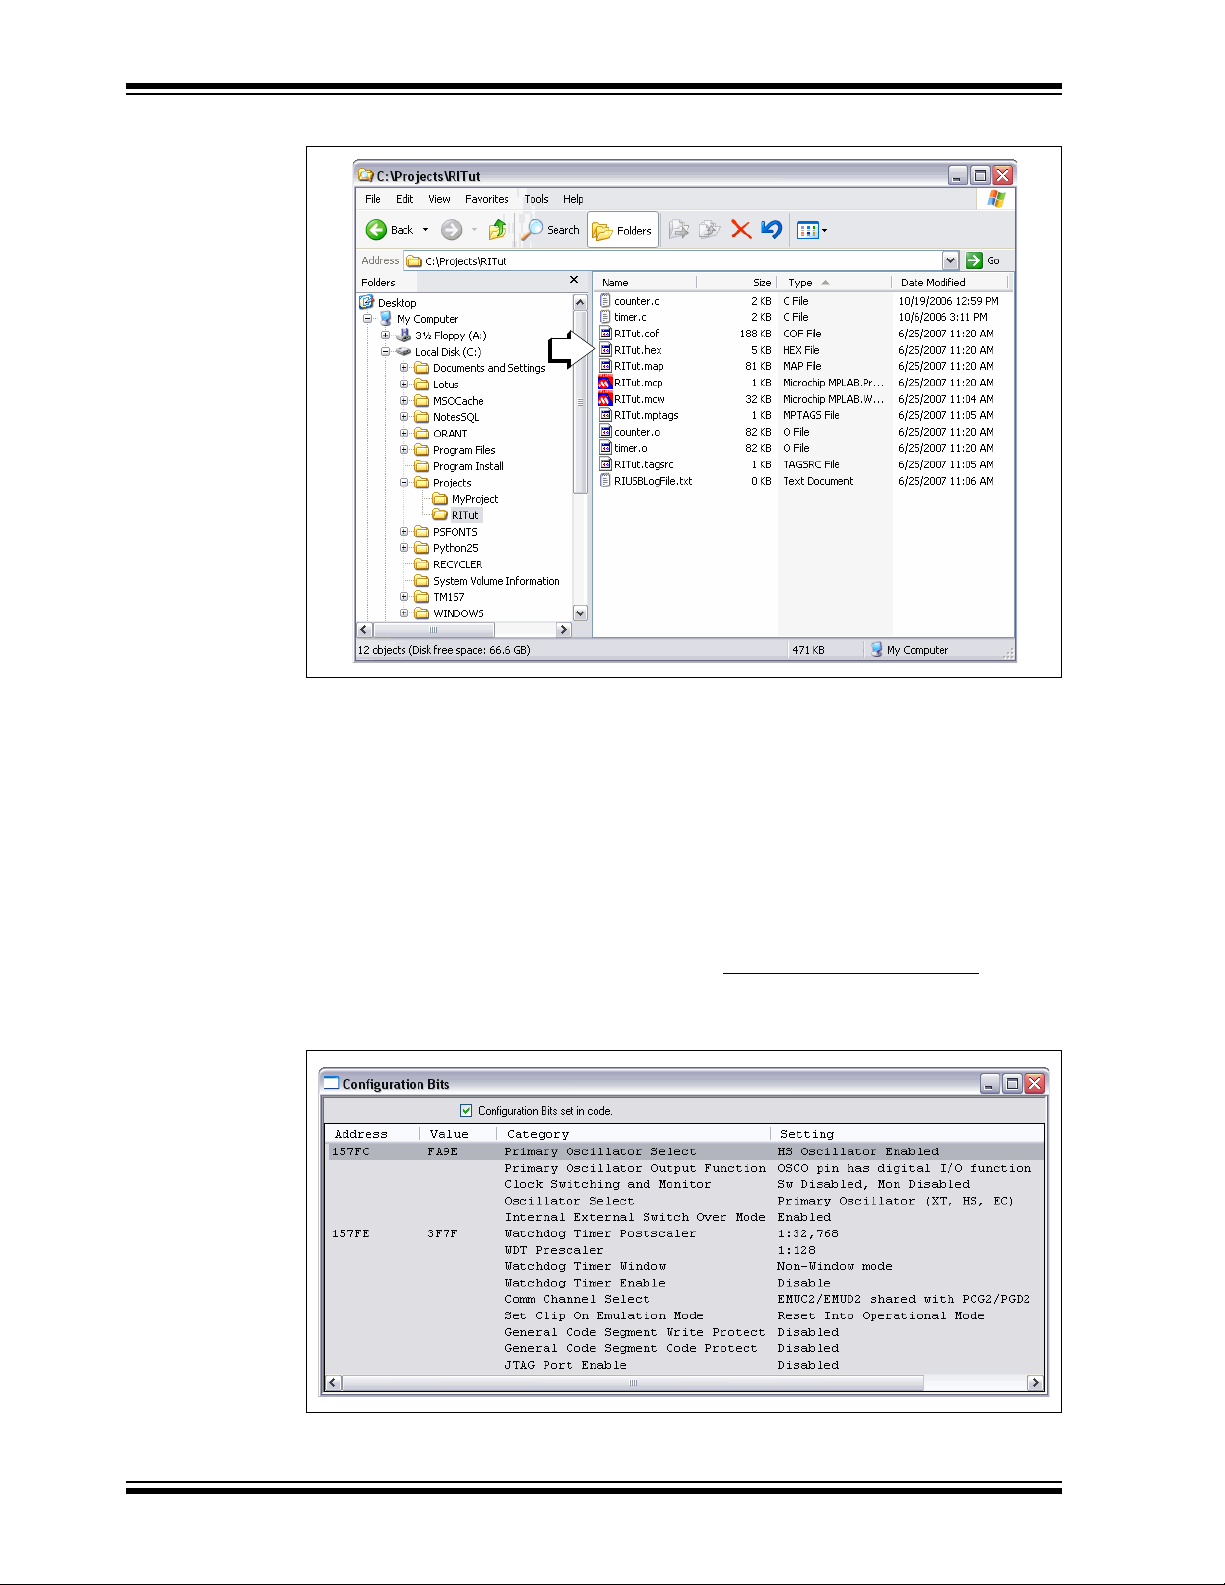
The project will build (Figure 4-6), and the resulting .hex file will have the same name
as the project (Figure 4-7). The hex file is the code that will be programmed into the
target device.
Note: Depending on the build options selected, your Output window may look dif-
ferent from Figure 4-6 (Project>Build Options>Project
MPLAB LINK30 tabs.)
FIGURE 4-6: OUTPUT WINDOW
p24FJ128GA010.h and a linker script file are used
or right click on the project name in the project window
, MPLAB C30 and
© 2008 Microchip Technology Inc. DS51616B-page 37
Page 44
MPLAB® REAL ICE™ In-Circuit Emulator User’s Guide
FIGURE 4-7: WINDOWS EXPLORER – PROJECT FILES
4.7 VIEWING DEBUG OPTIONS
Before you begin debugging your code, review the default settings of several items. In
your own projects, you may need to set these items differently.
4.7.1 Configuration Bits
In this tutorial, the relevant device Configuration bits are set in the counter.c code
using the _CONFIG1 and _CONFIG2 directives. For information on the function of these
PIC24FJ128GA010 configuration register bits, see the PIC24FJ128GA Family Data
Sheet (DS39 7 47).
Configuration bits also may be set by selecting Configure>Configuration Bits
unchecking “Configuration bits set in code”. Do not change any values for this tutorial.
FIGURE 4-8: CONFIGURATION BITS WINDOW
and
DS51616B-page 38 © 2008 Microchip Technology Inc.
Page 45

Tutorial
4.7.2 Programming Options
To set program options, select Debugger>Settings and click on the Program Memory
tab.
FIGURE 4-9: EMULATOR PROGRAM MEMORY TAB
Here you may allow the emulator to automatically choose the programming ranges
(recommended) or you may select ranges manually.
• The “Memories” section should have “Program” checked, and “EEPROM” and
“ID” unchecked. When using the MPLAB REAL ICE in-circuit emulator as a
debugger, Configuration bits will always be programmed and the “Configuration”
box will be checked and grayed out.
• For the PIC24FJ devices, all memory will be erased each time the chip is
programmed. Therefore, in the “Program Options” section, “Erase all before
Program” will have no effect.
• The “Program Memory” addresses (“Start” and “End” address) set the range of
program memory that will be read, programmed or verified.
When debugging code, you will frequently repeat the edit, rebuild, reprogram and run
sequence. To automate this, there are checkboxes “Program after successful build”
and “Run after successful program”. Leave these unchecked for now.
© 2008 Microchip Technology Inc. DS51616B-page 39
Page 46

MPLAB® REAL ICE™ In-Circuit Emulator User’s Guide
4.8 SETTING UP THE DEMO BOARD
Before beginning to debug, make sure the Explorer 16 Demo Board is set up properly.
For more information, see the “Explorer 16 Development Board User’s Guide”
(DS51589).
4.8.1 Demo Board Settings
Settings for this tutorial should be as follows:
• PIC24FJ128GA010 PIM (Plug-In Module) plugged into the board.
• S2: “PIM” selected; “PIC” selection for devices soldered onto the board.
• J7: “PIC24” selected; the emulator will communicate directly with the
PIC24FJ128GA010 and not the on-board PIC18LF4550 USB device.
• JP2: LEDs have been enabled by connecting Jumper 2.
• D1 on: Power being supplied to board.
4.8.2 Clock Speed
For data capture and trace, the emulator needs to know the instruction cycle speed.
Based on the previous demo board set up, the target oscillator will be 8MHz. This will
make instruction cycle speed = 8MHz / 2 = 4MIPS.
Select Debugger>Settings
, click on the Clock tab and enter the clock informati on.
4.9 LOADING PROGRAM CODE FOR DEBUGGING
Select Debugger>Program to program RITut.hex into the PIC24FJ128GA010 on the
Explorer 16 demo board.
Note: The debug executive code is automatically programmed in upper program
memory for MPLAB REAL ICE debug functions. Debug code must be
programmed into the target device to use the in-circuit debugging
capabilities of the MPLAB REAL ICE in-circuit emulator.
During programming, the REAL ICE tab of the Output dialog shows the current phase
of operation. When programming is complete, the dialog should look similar to
Figure 4-10.
FIGURE 4-10: OUTPUT WINDOW – MPLAB
®
REAL ICE™ TAB
Note: If you have trouble programming your device or communicating with the
emulator, unplug the Explorer 16 board and use the Loop-Back Test board
(Section 12.8 “Loop-Back Test Board”) to verify communications. For
additional help, see Chapter 9. “Frequently Asked Questions (FAQ)”.
DS51616B-page 40 © 2008 Microchip Technology Inc.
Page 47

4.10 RUNNING DEBUG CODE
The MPLAB REAL ICE in-circuit emulator executes in Real Time or in Step mode.
• Real Time execution occurs when the device is put in the MPLAB IDE’s Run
mode.
• Step mode execution can be accessed after the processor is halted.
These toolbar buttons can be used for quick access to commonly-used debug
operations.
Tutorial
Debugger
Menu
Toolbar
Buttons
Run Halt Animate Step
Into
Step
Over
Step
Out
Reset
Begin in Real Time mode:
1. Open the source files counter.c and timer.c (double-click on the file names
in the Project window or use File>Open
2. Select Debugger>Run
(or click the Run toolbar button).
).
3. Observe the LEDs. They will be counting up in binary.
4. Select Debugger>Halt
(or click the Halt toolbar button) to stop the program exe-
cution.
5. When the emulator halts, one of the open source code windows will pop to the
front and a green arrow will indicate where the program halted.
To use Step mode:
1. Select Debugger>Step Into
(or click the Step Into toolbar button) to execute one
instruction and then halt. The green arrow in the code listing will move accordingly.
2. Repeat as needed.
The step functions “Step Over” and “Step Out” are used with functions and discussed
in the MPLAB IDE documentation.
4.11 DEBUGGING CODE USING BREAKPOINTS
The example code in this tutorial has already been debugged and works as expected.
However, this code is still useful to demonstrate the debugging features of the MPLAB
REAL ICE in-circuit emulator. The first debug feature to be discussed are breakpoints.
Breakpoints stop code execution at a selected line of code.
The number of hardware and software breakpoints available and/or used is displayed
in the Device Debug Resource toolbar. See the MPLAB IDE documentation for more
on this feature.
• Setting Software Breakpoints
© 2008 Microchip Technology Inc. DS51616B-page 41
Page 48

MPLAB® REAL ICE™ In-Circuit Emulator User’s Guide
4.1 1.1 Choosing a Breakpoint Type
For the device used in this tutorial, you have the choice of using either hardware or
software breakpoints.
To set breakpoint options, select Debugger>Settings
tab. Select the type of breakpoint that best suits your application needs. For this tutorial,
we will begin using the default breakpoint type (hardware breakpoints.)
4.11.2 Setting a Single Hardware Breakpoint
To set a single breakpoint:
1. Select Debugger>Reset>Processor Reset
reset the example program.
2. Highlight or place the cursor on the following line of code from counter.c:
counter++; //increment counter
3. Double-click on the line, or right click on the line and then select Set Breakpoint
from the shortcut menu. This line is now marked as a breakpoint (B in red stop
sign) as shown in Figure 4-11.
FIGURE 4-11: SET BREAKPOINT
and click on the Configuration
(or click the Reset toolbar button) to
4. Select Debugger>Run
again in Real-Time mode. The program will halt at the line marked by the breakpoint, but now there will be a green arrow over the breakpoint symbol.
DS51616B-page 42 © 2008 Microchip Technology Inc.
(or click the Run toolbar button) to run the program once
Page 49

Tutorial
FIGURE 4-12: PROGRAM HALTED
5. Open a new Watch window to watch the counter variable change value as the
program executes. Select View>Watch
Watch_1 tab selected. Select “counter” from the list next to Add Symbol, and
then click the button. counter is added to the Watch window. Select “PORTA”
from the list next to Add SFR, and then click the button. PORTA is added to the
Watch window.The selected symbols should now be visible in the Watch window
as shown in Figure 4-13.
. The Watch dialog opens with the
FIGURE 4-13: WATCH WINDOW
6. Select Debugger>Run
again. The program will halt at the breakpoint and you will notice that the value
of both variables has incremented by 1.
7. Run again as desired to see the values increase. When done, use Debug-
ger>Reset>Processor Reset (or click the Reset toolbar button) to reset the pro-
cessor.
(or click the Run toolbar button) to run the program once
4.11.3 Setting Multiple Hardware Breakpoints
To set multiple breakpoints, either set numerous single breakpoints as specified in the
previous section or use the Breakpoints dialog (see Section 11.3.1 “Breakpoints
Dialog”). The Breakpoints dialog also allows you to control breakpoint interaction.
Note: If you exceed the maximum allowed number of breakpoints for your device,
MPLAB IDE will warn you.
© 2008 Microchip Technology Inc. DS51616B-page 43
Page 50

MPLAB® REAL ICE™ In-Circuit Emulator User’s Guide
1. Select Debugger>Breakpoints to open the Breakpoints dialog. The breakpoint
set in the previous section will be displayed in this dialog. Click the Add Break-
point button to add another breakpoint.
2. On the Program Memory tab of the Set Breakpoint dialog, enter “29E“ as the
hex Address and click OK.
FIGURE 4-14: SET BREAKPOINTS DIALOG
The additional breakpoint will appear below the previous breakpoint in the Breakpoints dialog and also as a breakpoint symbol next to the following line of code:
PORTA = counter; //display on port LEDs
The breakpoint symbol is yellow in this case because it was set based on an
address.
FIGURE 4-15: TWO BREAKPOINTS
3. Run the program to see it halt at the first breakpoint. The values in the Watch window will not change. Then run again to see it stop at the second breakpoint. (The
program may skid past this breakpoint.) Now the values in the Watch window will
change.
DS51616B-page 44 © 2008 Microchip Technology Inc.
Page 51

Tutorial
4.1 1.4 Using the Stopwatch with Breakpoints
To determine the time between the breakpoints, use the Stopwatch.
FIGURE 4-16: STOPWATCH DIALOG
1. Click Stopwatch (on the Breakpoints dialog) to open the Stopwatch dialog.
FIGURE 4-17: STOPWATCH DIALOG
2. Under “Start Condition”, click Select Start Condition and choose the first break-
point. Then uncheck “Start condition will cause the target device to halt”.
3. Under “Stop Condition”, click Select Stop Condition and choose the second
breakpoint. Then check “Stop condition will cause the target device to halt”.
4. Check “Reset stopwatch on run”.
5. Click OK.
6. Run the program until it halts. In the Output window, on the REAL ICE tab, the
number of cycles between the two instructions should be shown as:
Stopwatch cycle count = 3
7. Clear both breakpoints from the code by deleting them from the Breakpoints dia-
log, double-clicking on each line to remove them, or right clicking on each line
and selecting “Remove Breakpoint”. You can also right click and select
Break
points>Remove All Breakpoints to remove both at once.
© 2008 Microchip Technology Inc. DS51616B-page 45
Page 52

MPLAB® REAL ICE™ In-Circuit Emulator User’s Guide
4.11.5 Setting Software Breakpoints
To change the breakpoint type from hardware to software:
•Select Debugger>Settings and click on the Configuration tab.
• Click the radio button next to “Use Software Breakpoints”.
•Click OK.
You will now use software breakpoints instead of the hardware breakpoints used
previously.
Note: Using software breakpoints for debug impacts device endurance. There-
fore, it is recommended that devices used in this manner not be used as
production parts.
1. To set a single software breakpoint, follow the instructions in
Section 4.11.2 “Setting a Single Hardware Breakpoint”.
- When you set a software breakpoint, you will see the following in the Output
window:
Programming software breakpoint(s)...
Software breakpoint(s) set.
- If you have already set a hardware breakpoint in this tutorial, the variables will
already be added to the Watch window for use with the software breakpoint.
2. To set multiple software breakpoints, follow the instructions in
Section 4.11.3 “Setting Multiple Hardware Breakpoints”.
- There is no breakpoint skidding with software breakpoints, i.e., the program
halts on the breakpoint. This may affect how you see values change in the
Watch window.
- There is no maximum number of breakpoints with software breakpoints, i.e,
although this tutorial only uses two, the number of software breakpoints is
unlimited.
3. The stopwatch is meant to be used with hardware breakpoints. However, you can
use the stopwatch with software breakpoints, but they will be converted to hardware breakpoints as you select them. In the Output window, you will see:
Converting breakpoint types...
Breakpoint type conversion complete.
Follow the steps as specified in Section 4.11. 4 “Using the Stopwatch with
Breakpoints”.
4. Set the breakpoints to hardware again for the remainder of the tutorial. Select
Debugger>Settings
“Use Hardware Breakpoints” and then click OK.
, click on th e Configuration tab, click the radio button next to
DS51616B-page 46 © 2008 Microchip Technology Inc.
Page 53
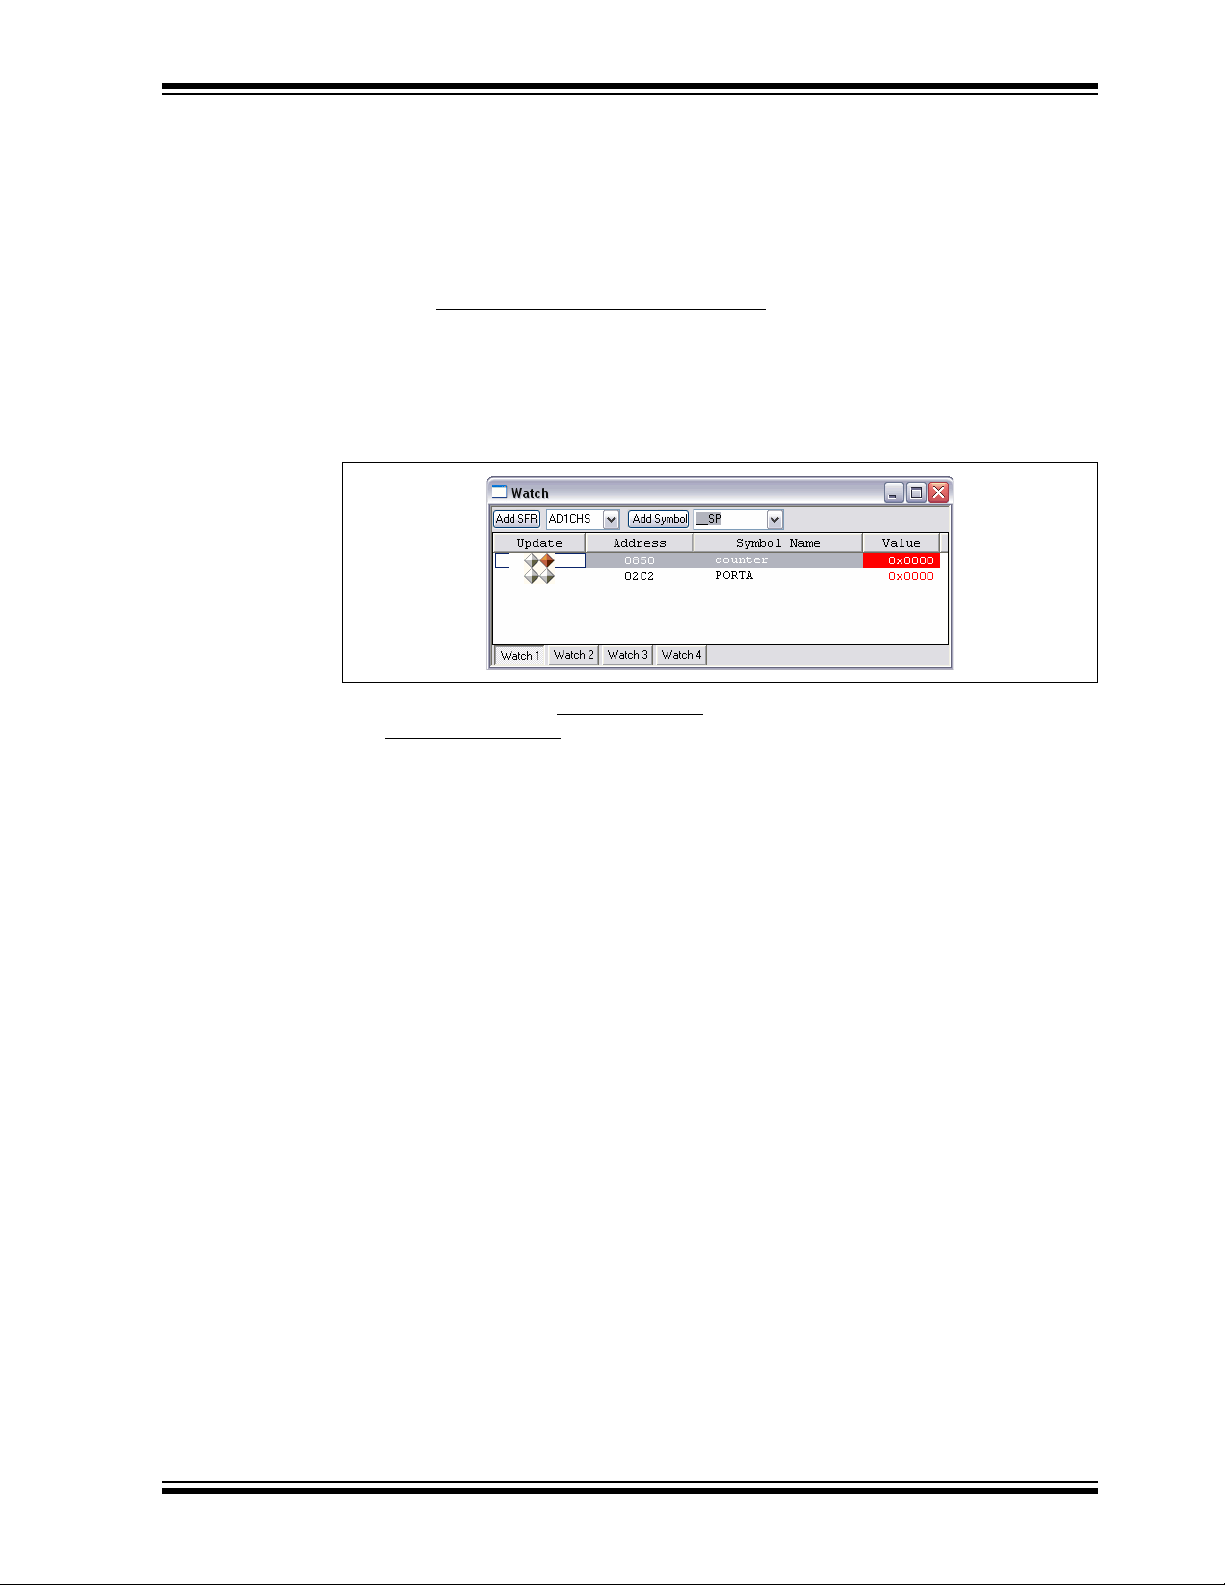
4.12 DEBUGGING CODE USING A RUNTIME WATCH
Set up a runtime watch to view changes to the counter symbol as the program runs.
For more information on runtime watches, see either Section 7.2 “Data Capture and
Runtime Watches” or Section 8.2 “Data Capture and Runtime Watches”
(PIC32MX devices only).
1. Remove all breakpoints from code. T o do this, right click on any line of code and
select Breakpoints>Remove All Breakpoints
2. In the Watch window, click on the counter Symbol Name to select that line.
Then click the second diamond in the first column of that line to enable a runtime
watch. (See Section 11.3.9 “Watch Window - Dat a Capture/Runtime W atch”
for more information.)
FIGURE 4-18: WATCH WINDOW SET FOR RUNTIME WATCH
Tutorial
.
3. Rebuild the project (Project>Build All
(Debugger>Program
4. Make sure the Watch window is visible. Then Run the program and watch the
counter values change real-time in the Watch window.
5. Halt the program.
6. Remove the runtime watch by clicking again on the second (brown) diamond.
The diamond then should no longer be colored.
7. Close the Watch window.
).
) and reprogram the target device
© 2008 Microchip Technology Inc. DS51616B-page 47
Page 54

MPLAB® REAL ICE™ In-Circuit Emulator User’s Guide
4.13 DEBUGGING CODE USING NATIVE TRACE
The trace function can be used to collect information on variables and code and store
it in a buffer while the code is executing.
In this section, Native trace will be used. For more information about tracing in general
using the MPLAB REAL ICE in-circuit emulator, see Chapter 7. “Debug for 8- and
16-Bit Devices”.
Note 1: Trace operation requires 16-bit C compiler v2.04 and above.
2: Real-time data capture triggers (from the previous section) cannot be
used at the same time as Native trace.
4.13.1 Logging a Var iabl e Value
To log a variable value:
1. Select Project >B ui ld Op tio ns >P roject, Trace tab. Check “Enable Trace” and
uncheck “Disable Trace Macros”. Then select the type of trace, i.e., “Native
Trace” for devices with built-in ICE support. Click OK.
FIGURE 4-19: BUILD OPTIONS DIALOG – NATIVE TRACE
DS51616B-page 48 © 2008 Microchip Technology Inc.
Page 55

Tutorial
2. Highlight the variable counter from the following line of code:
counter++; //increment counter
Right click on the highlighted variable and select “Log Selected C V alue” from the
pop-up menu. This causes the following macro line to be inserted above the line
containing the variable:
__LOG(id,counter);
where id is a log number auto-generated during build.
3. Rebuild the project (Project>Build All
4. After rebuilding, a Warning dialog will ask, “File has been modified. Do you want
to reload?”. Click Yes. When you examine your code, you will find that the log id
has been replaced with a unique number.
Note: To disable this warning and automatically reload, select
Configure>Settings
that were modified outside of the IDE”. Then click OK.
).
, Other tab, and check “Automatically reload files
5. Reprogram the device (Debugger>Program
6. Double-click on the following line to place a breakpoint there:
PORTA = counter; //display on port LEDs
7. Reset and run the program until it halts at the breakpoint. Repeat this three times.
8. Select View>Trace
right click and in the Trace window and select “Reload”. You should see variable
values logged in this window. To see the related code in the lower portion of the
window, you may need to click on a logged value in the upper portion of the window.
FIGURE 4-20: VIEW TRACE WINDOW – LOG VARIABLE
to view the trace data (Section 11.3.1 1 “Trace Window”) or
).
© 2008 Microchip Technology Inc. DS51616B-page 49
Page 56

MPLAB® REAL ICE™ In-Circuit Emulator User’s Guide
4.13.2 Tracing a Line of Code
To trace a line of code:
1. Remove the log macro line from code, i.e., highlight it and hit <Delete>.
2. Highlight or click on the following line of code:
counter++; //increment counter
Right click to select “Insert C Line Trace” from the pop-up menu. This causes the
following macro line to be inserted above the selected line:
__TRACE(id);
where id is a line trace number auto-generated during the build.
3. Rebuild the project (Project>Build All
4. After rebuilding, a Warning dialog will ask, “File has been modified. Do you want
to reload?” (if you have not already disabled this dialog.) Click Yes. When you
examine your code, you will find that the log id has been replaced with a unique
number.
5. Reprogram the device (Debugger>Program
6. Run the program until it halts at the breakpoint. Repeat this three times.
7. Select View>Trace
right click and in the Trace window and select “Reload”. Y ou should see address
values logged in this window. To see the related code in the lower portion of the
window, you may need to click on a logged value in the upper portion of the window.
to view the trace data (Section 11.3.1 1 “Trace Window”) or
).
).
FIGURE 4-21: VIEW TRACE WINDOW – TRACE LINE
4.13.3 Setting the Size of the Trace Buffer
In this tutorial, a breakpoint was used to ensure that the trace buffer did not overflow
with values from an executing program. A “for” instead of “while” loop could be used as
well to control the number of trace samples.
To set the size of the trace buffer:
1. Select Debugger>Settings
2. Enter a value for the trace buffer, not to exceed the maximum specified on this
tab.
, Trace tab.
DS51616B-page 50 © 2008 Microchip Technology Inc.
Page 57

4.13.4 Disabling Trace
To temporarily disable the trace capability:
1. Select Project>Build Options>Project, Trace tab. Check “Disable Trace Macros”.
Click OK.
2. Rebuild the project (Project>Build All
3. Reprogram the device (Debugger>Program
To permanently disable the trace capability:
1. Remove all trace and log macros from code.
2. Select Project>Build Options>Project
OK.
3. Rebuild the project (Project>Build All
4. Reprogram the device (Debugger>Program
4.14 PROGRAMMING THE APPLICATION
When the program is successfully debugged and running, the next step is to program
the device for stand-alone operation in the finished design. When doing this, the
resources reserved for debug are released for use by the application.
To program the application follow these steps:
1. Disable the MPLAB REAL ICE in-circuit emulator as the debug tool by selecting
Debugger>Select Tool>None
2. Enable the MPLAB REAL ICE in-circuit emulator as the programmer by selecting
Programmer>Select Programmer>REAL ICE
3. Optional: Set up the ID in Configure>ID Memory
memory.)
4. Set up the parameters for programming on the Programmer>Settings
Memory tab.
5. On the Project toolbar, select “Release” from the Build Configuration drop-down
list. Then select Project>Build All
6. Select Programmer>Program
The application should now be running on its own. Press the Reset (MCLR
the demo board to restart the count.
You can modify the program code to wait for a button press before beginning or to
terminate the program. Modifying the program will require you to select the emulator as
a debug tool.
1. Disable the MPLAB REAL ICE in-circuit emulator as the programmer by select-
ing Programmer>Select Programmer>None
2. Enable the MPLAB REAL ICE in-circuit emulator as the debug tool by selecting
Debugger>Select Tool>REAL ICE
3. Edit the counter.c code as desired. (This is left as an exercise for you.)
4. On the Project toolbar, select “Debug” from the Build Configuration drop-down
list. Then select Project>Build All
5. Select Debugger>Program
6. Run, step and debug your program as required.
.
Tutorial
).
).
, Trace tab. Uncheck “Enable Trace”. Click
).
).
.
.
(for devices that support ID
, Program
.
.
) button on
.
.
.
© 2008 Microchip Technology Inc. DS51616B-page 51
Page 58

MPLAB® REAL ICE™ In-Circuit Emulator User’s Guide
4.15 OTHER TRACE METHODS – SPI OR I/O PORT TRACE
The Explorer 16 board does not have the connections to perform either SPI or I/O Port
trace. Therefore, it must either be modified or a different board must be used that allows
access to the required device SPI and Port pins.
The PIC24FJ128GA010 device and code from the beginning of this tutorial will be used
in this section. Although this device has built-in (Native) trace capability, you may wish
to use the other types of trace for speed or pin resource reasons.
For devices that do not have Native trace capability, SPI and I/O Port trace are the only
forms of trace available. The procedures shown here can be modified to use with other
Microchip devices supported by the MPLAB REAL ICE in-circuit emulator.
• Using SPI Trace
• Using I/O Port Trace
4.15.1 Using SPI Trace
The Explorer 16 board does have a place for connecting with the PICkit 2. This
connection can be populated to provide connection to six of the eight high-speed
communication pins. The remaining two pins - to the SPI pins SCK and SDO - will have
to be hard-wired from two additional connector pins to the appropriate SPI pins on the
device. See Section 2.4.2 “High-Speed Communication Connection” for details.
Note: The Explorer 16 silkscreen label for pin 1 of the PICKIT2 connector is
incorrect. This is actually the location of pin 6.
You may also choose to use a target board of your own design that allows for access
to the necessary debug and SPI pins. Either way , a hardware connection between the
target board and the emulator’s high-speed connector is required. See
Section 2.5.2 “SPI Trace Connections (High-Speed Communication Only)” for
more information.
4.15.1.1 HARDWARE SETUP
To set up the hardware to use SPI Trace, do the following:
1. Obtain Microchip’s Performance Pak, which contains the emulator high-speed
communication boards and cables, if you have not already done so.
Note: High-speed communications is required to use SPI Trace.
2. Modify or create a target board, as specified above, so that it accommodates the
high-speed connector.
3. Using an unpowered emulator and target board, insert the high-speed driver
board into the emulator and the high-speed receiver board into the target board.
Connect the boards with the included cables. See Section 2.3.2 “High-Speed
Communication” for reference.
4. Power the emulator, and then the target board.
DS51616B-page 52 © 2008 Microchip Technology Inc.
Page 59
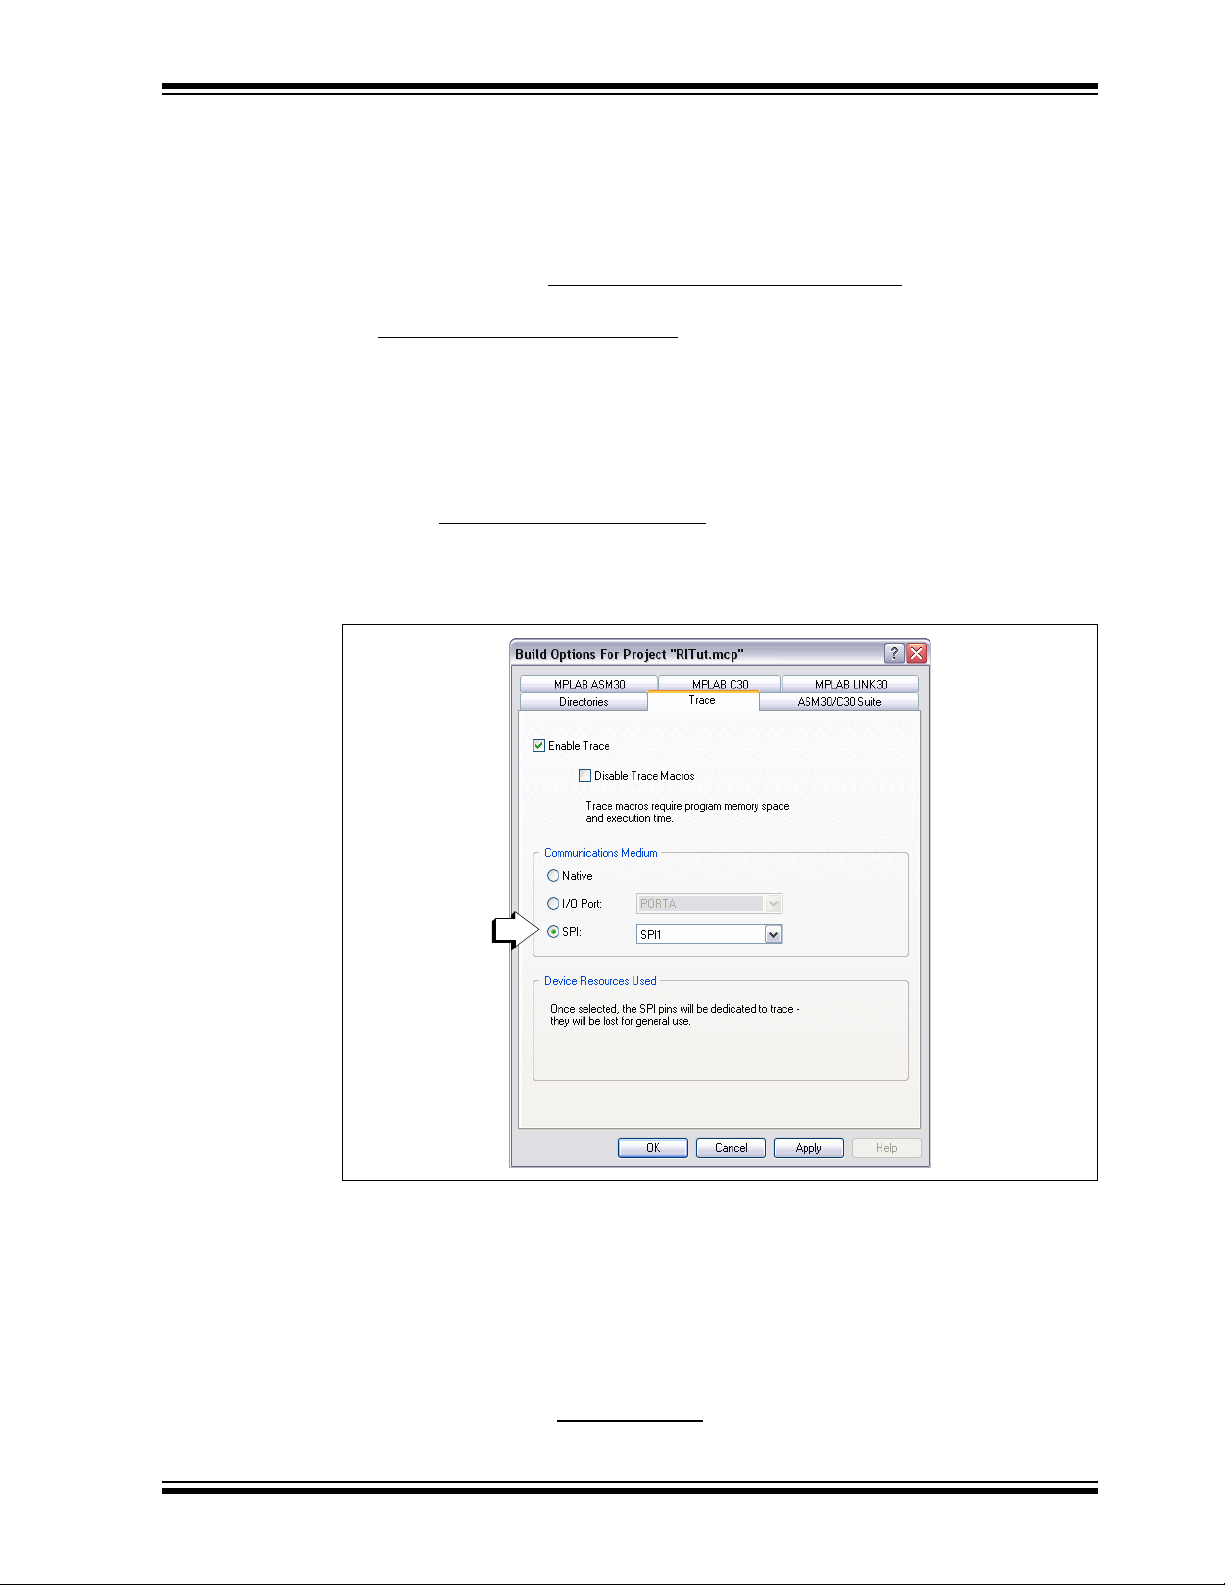
Tutorial
4.15.1.2 MPLAB IDE SETUP
To set up MPLAB IDE software to use SPI Trace, do the following:
1. Launch MPLAB IDE and open the project from this tutorial, if it is not already
open.
2. If the MPLAB REAL ICE in-circuit emulator is selected as the programmer, dis-
able it by selecting Programmer>Select Programmer>None
3. Enable the MPLAB REAL ICE in-circuit emulator as the debug tool by selecting
Debugger>Select Tool>REAL ICE
4. On the Project toolbar, select “Debug” from the Build Configuration drop-down
list. (For some devices, an i version of the linker script is also necessary for
debugging, e.g., 18F8722i.lkr.)
4.15.1.3 TRACE SETUP
To log a variable value using SPI Trace:
1. Select Project >B ui ld Op tio ns >P roject
uncheck “Disable Trace Macros”. Then select the SPI Trace and choose an SPI
port from the drop-down list. Click OK.
FIGURE 4-22: BUILD OPTIONS DIALOG – SPI TRACE
.
, Trace tab. Check “Enable Trace” and
.
2. Highlight the variable counter from the following line of code:
counter++; //increment counter
Right click on the highlighted variable and select “Log Selected C V alue” from the
pop-up menu. This causes the following macro line to be inserted above the line
containing the variable:
__LOG(id,counter);
where id is a log number auto-generated during build.
3. Rebuild the project (Project>Build All
© 2008 Microchip Technology Inc. DS51616B-page 53
).
Page 60

MPLAB® REAL ICE™ In-Circuit Emulator User’s Guide
4. After rebuilding, a Warning dialog will ask, “File has been modified. Do you want
to reload?”. Click Yes. When you examine your code, you will find that the log id
has been replaced with a unique number.
Note: To disable this warning and automatically reload, select
Configure>Settings
that were modified outside of the IDE”. Then click OK.
, Other tab, and check “Automatically reload files
5. Reprogram the device (Debugger>Program
6. Double-click on the following line to place a breakpoint there:
PORTA = counter; //display on port LEDs
7. Reset and run the program until it halts at the breakpoint. Repeat this three times.
8. Select View>Trace
right click and in the Trace window and select “Reload”. You should see variable
values logged in this window. To see the related code in the lower portion of the
window, you may need to click on a logged value in the upper portion of the window.
to view the trace data (Section 11.3.1 1 “Trace Window”) or
).
4.15.2 Using I/O Port Trace
You may choose to modify the Explorer 16 demo board or use a target board of your
own design to allow for access to the desired port pins. Either way, a hardware
connection between the target device’s port and the emulator’s logic probe connector
is required. See Section 2.5.3 “I/O Port Trace Connections” for details.
If you design your own board, you will also need to a connector for regular debug pins,
i.e., for either standard or high-speed communications. See Section 2.3 “Emulator
Communications with the PC and Target” for connection information.
4.15.2.1 HARDWARE SETUP
To set up the hardware to use I/O Port Trace, do the following:
1. Modify or create a target board, as specified above, so that it accommodates a
connection between the emulator and the device port.
2. Using an unpowered emulator and target board, connect the two using either
standard or high-speed communications.
3. Connect the emulator’s logic probe pins to the target device’s port pins using
logic probes or other connectors.
4. Power the emulator, and then the target board.
4.15.2.2 MPLAB IDE SETUP
To set up MPLAB IDE software to use I/O Port Trace, do the following:
1. Launch MPLAB IDE and open the project from this tutorial, if it is not already
open.
2. If the MPLAB REAL ICE in-circuit emulator is selected as the programmer, disable it by selecting Programmer>Select Programmer>None
3. Enable the MPLAB REAL ICE in-circuit emulator as the debug tool by selecting
Debugger>Select Tool>REAL ICE
4. On the Project toolbar, select “Debug” from the Build Configuration drop-down
list. (For some devices, an i version of the linker script is also necessary for
debugging, e.g., 18F8722i.lkr.)
DS51616B-page 54 © 2008 Microchip Technology Inc.
.
.
Page 61

Tutorial
4.15.2.3 TRACE SETUP
To log a variable value using I/O Port Trace:
1. Select Project >B ui ld Op tio ns >P roject
uncheck “Disable Trace Macros”. Then select the I/O Port Trace and choose an
port from the drop-down list. Click OK.
Note: Determining a port that may be dedicated to trace can be a difficult task
on complex devices with many functions multiplexed on port pins. One
suggestion is to use the MPLAB VDI visual device initializer. Not only
can you use it to create initialization code for your application, but you
can add a port to see if it conflicts with any of your other application
peripheral pins. MPLAB VDI information is stored with the workspace.
FIGURE 4-23: BUILD OPTIONS DIALOG – I/O PORT TRACE
, Trace tab. Check “Enable Trace” and
2. Highlight the variable counter from the following line of code:
counter++; //increment counter
Right click on the highlighted variable and select “Log Selected C V alue” from the
pop-up menu. This causes the following macro line to be inserted above the line
containing the variable:
__LOG(id,counter);
where id is a log number auto-generated during build.
3. Rebuild the project (Project>Build All
© 2008 Microchip Technology Inc. DS51616B-page 55
).
Page 62

MPLAB® REAL ICE™ In-Circuit Emulator User’s Guide
4. After rebuilding, a Warning dialog will ask, “File has been modified. Do you want
to reload?”. Click Yes. When you examine your code, you will find that the log id
has been replaced with a unique number.
Note: To disable this warning and automatically reload, select
Configure>Settings
that were modified outside of the IDE”. Then click OK.
, Other tab, and check “Automatically reload files
5. Reprogram the device (Debugger>Program
6. Double-click on the following line to place a breakpoint there:
PORTA = counter; //display on port LEDs
7. Reset and run the program until it halts at the breakpoint. Repeat this three times.
8. Select View>Trace
right click and in the Trace window and select “Reload”. You should see variable
values logged in this window. To see the related code in the lower portion of the
window, you may need to click on a logged value in the upper portion of the window.
to view the trace data (Section 11.3.1 1 “Trace Window”) or
).
DS51616B-page 56 © 2008 Microchip Technology Inc.
Page 63
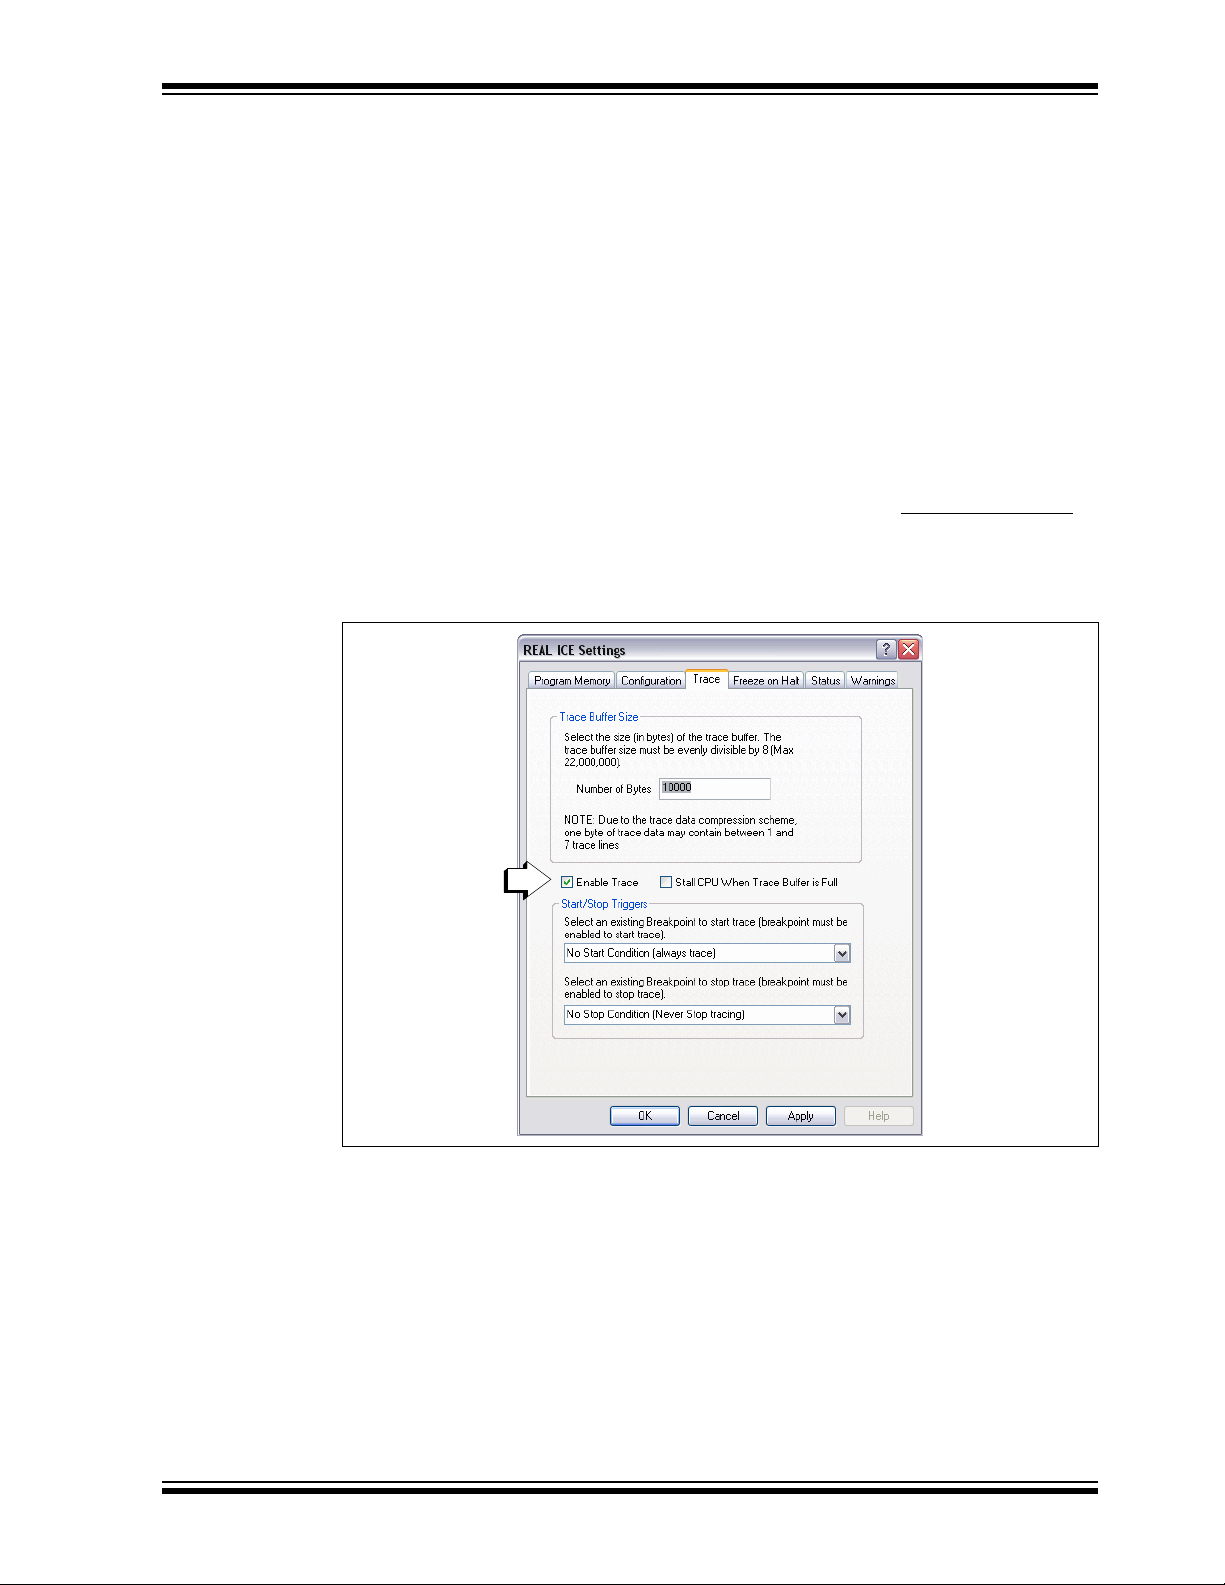
4.16 OTHER TRACE METHODS – PIC32 INSTRUCTION TRACE
PIC32 Instruction Trace is only available for PIC32MX MCU devices, and it is the only
type of trace available for these devices. Also, only some PIC32MX MCU devices have
the trace feature. Consult the device data sheet for details.
For example code and additional supporting hardware, refer to the Microchip website
(www.microchip.com).
To use this trace, you will need:
• PIC32MX Plug-In Module (PIM) containing a device that supports trace and a
trace port
• PIC32MX Trace Interface Kit (AC244006) containing a 12-inch trace cable and a
trace adapter board
The PIC32MX360F512L PIM (MA320001) will plug into an Explorer 16 board. Follow
the instructions specified in Section 8.3.2 “Setting Up and Using Trace”.
Once the hardware is connected, you enable trace through the Debugger>Settings
Trace tab (Figure 4-24). Trace data will appear in the Trace window (Figure 4-25).
For more information, see Section 8.3 “PIC32 Instruction Trace”.
FIGURE 4-24: PIC32 INSTRUCTION TRACE ENABLE
Tutorial
,
© 2008 Microchip Technology Inc. DS51616B-page 57
Page 64

MPLAB® REAL ICE™ In-Circuit Emulator User’s Guide
FIGURE 4-25: PIC32 INSTRUCTION TRACE DATA
DS51616B-page 58 © 2008 Microchip Technology Inc.
Page 65

MPLAB® REAL ICE™ IN-CIRCUIT
EMULATOR USER’S GUIDE
Part 2 – Features
Chapter 5. General Setup......................................... ................................. ..................61
Chapter 6. Basic Debug Functions.............................................................................65
Chapter 7. Debug for 8- and 16-Bit Devices ..............................................................67
Chapter 8. Debug for 32-Bit Devices..........................................................................75
© 2008 Microchip Technology Inc. DS51616B-page 59
Page 66

MPLAB® REAL ICE™ In-Circuit Emulator User’s Guide
NOTES:
DS51616B-page 60 © 2008 Microchip Technology Inc.
Page 67

MPLAB® REAL ICE™ IN-CIRCUIT
EMULATOR USER’S GUIDE
Chapter 5. General Setup
5.1 INTRODUCTION
How to get started using the MPLAB REAL ICE in-circuit emulator is discussed.
• Starting the MPLAB IDE Software
• Creating a Project
• Viewing the Project
• Building the Project
• Setting Configuration Bits
• Setting the Emulator as the Debugger or Programmer
• Debugger/Programme r Lim itatio ns
5.2 STARTING THE MPLAB IDE SOFTWARE
After installing the MPLAB IDE software (Section 3.2 “Installing the Software”),
invoke it by using any of these methods:
•Select Star t>Progra ms>Microch ip>MPLAB I DE vx.xx> MPLAB IDE
the version number.
• Double click the MPLAB IDE desktop icon.
• Execute the file mplab.exe in the \core subdirectory of the MPLAB IDE
installation directory.
For more information on using the software, see:
• “MPLAB IDE User's Guide” (DS51519) – Comprehensive guide for using MPLAB
IDE.
• “MPLAB IDE Quick Start Guide” (DS51281) – Chapters 1 and 2 of the user's
guide.
• The on-line help files – The most up-to-date information on MPLAB IDE and
MPLAB REAL ICE in-circuit emulator.
• Readme files – Last minute information on each release is included in Readme
for MPLAB IDE.txt and Readme for MPLAB REAL ICE Emulator.txt.
Both files are found in the Readmes subdirectory of the MPLAB IDE installation
directory.
, where vx.xx i s
© 2008 Microchip Technology Inc. DS51616B-page 61
Page 68

MPLAB® REAL ICE™ In-Circuit Emulator User’s Guide
5.3 CREATING A PROJECT
The easiest way to create a new project is to select Project>Project Wizard. With the
help of the Project Wizard, a new project and the language tools for building that project
can be created. The wizard will guide you through the process of adding source files,
libraries, linker scripts, etc. to the various “nodes” on the project window. See MPLAB
IDE documentation for more detail on using this wizard. The basic steps are provided
here:
• Select your device (e.g., PIC24FJ128GA010)
• Select a language toolsuite (e.g., Microchip C30 Toolsuite)
• Name the project
• Add application files (e.g., program.c, support.s, counter.asm)
• Add a linker script file (optional) - Most multi-file projects no longer require that
you add a linker script file to your project. See the language tool documentation
for details.
If you do need or want to add a linker script file, default linker scripts directories
are listed below. For some debug tools, an i version of the linker script is
necessary for debugging, e.g., 18F8722i.lkr.
MPLINK™ Object Linker used with:
•MPASM™ Assembler
C:\Program Files\Microchip\MPASM Suite\LKR
• MPLAB C Compiler for PIC18 MCUs (formerly MPLAB C18)
C:\MCC18\lkr
MPLAB Object Linker for PIC24 MCUs and dsPIC DSCs (formerly MPLAB LINK30)
used with:
• MPLAB Assembler for PIC24 MCUs and dsPIC DSCs (formerly MPLAB ASM30)
C:\Program Files\Microchip\MPLAB ASM30 Suite\Support\gld
• MPLAB C Compiler for PIC24 MCUs and dsPIC DSCs (formerly MPLAB C30)
C:\Program Files\Microchip\MPLAB C30\support\gld
C:\pic30_tools\support\gld
MPLAB Object Linker for PIC32MX MCUs (formerly MPLAB LINK32) used with:
• MPLAB Assembler for PIC32MX MCUs (formerly MPLAB ASM32)
C:\Program Files\Microchip\MPLAB ASM32 Suite\Support\ld
• MPLAB C Compiler for PIC32MX MCUs (formerly MPLAB C32)
C:\Program Files\Microchip\MPLAB C32\support\ld
5.4 VIEWING THE PROJ ECT
After the Project Wizard has created a project, the project and its associated files are
visible in the Project window (View>Project
using the Project window. Right click on any line in the project window tree to pop up a
menu with additional options for adding and removing files.
See MPLAB IDE documentation for more detail on using the Project window.
DS51616B-page 62 © 2008 Microchip Technology Inc.
). Additional files can be added to the project
Page 69

5.5 BUILDING THE PROJECT
After the project is created, the application needs to be built. This will create object
(hex) code for the application that can be programmed into the target by the MPLAB
REAL ICE in-circuit emu lat or.
To set build options, select Project>Build Options>Project
Note: On the Project Manager toolbar, select “Debug” from the drop-down list.
General Setup
.
When done, choose Project>Build All
to build the project.
5.6 SETTING CONFIGURATION BITS
Although device Configuration bits may be set in code, they also may be set in the
MPLAB IDE Configuration window. Select Configure>Configuration Bits
the text in the “Settings” column, these can be changed.
Some Configuration bits of interest are:
• Oscillator – Make sure the correct mode and other oscillator features are set to
match the physical setup on the target board.
• Watchdog T imer Enable – On most devices, the Watchdog Timer is enabled
initially. It is usually a good idea to disable this bit.
• Comm Channel Select – For some devices, you will need to select the communi-
cations channel for the device, e.g., PGC1/EMUC1 and PGD1/EMUD1. Make
sure the pins selected here are the same ones physically connected to the device.
• Code Protect/Table Read Protect – Disable these settings. If the emulator
cannot write to program memory or read from a table, it cannot operate properly.
• JTAG Port Enable – For PIC32MX devices, this port may need to be disabled to
prevent conflicts when using trace and other ICE features where pin conflicts can
result.
. By clicking on
5.7 SETTING THE EMULATOR AS THE DEBUGGER OR PROGRAMMER
Select Debugger>Select Tool>MPLAB REAL ICE to choose the MPLAB REAL ICE
in-circuit emulator as the debug tool. The Debugger menu and MPLAB IDE toolbar will
change to display debug options once the tool is selected. Also, the Output window will
open and messages concerning ICE status and communications will be displayed on
the MPLAB REAL ICE tab. For more information, see Section 11.2 “Debugging
Functions” and Section 11.3 “Debugging Dialogs/Windows”.
Select Programmer>Select Programmer>MPLAB REAL ICE
REAL ICE in-circuit emulator as the programmer tool. The Programmer menu and
MPLAB IDE toolbar will change to display programmer options once the tool is
selected. Also, the Output window will open and messages concerning ICE status and
communications will be displayed on the MPLAB REAL ICE tab. For more information,
see Section 11.4 “Programming Functions”.
Select Debugger>Settings
(Section 11.5 “Settings Dialog”) and set up options as needed.
If errors occurs, see:
• Chapter 10. “Err or Messa ges”
• Chapter 9. “Frequently Asked Questions (FAQ)”
• Section 10.3.6 “Debug Failure Actions” (Top Reasons Why You Can’t Debug)
• Section 12.8 “Loop-Back Test Board”
© 2008 Microchip Technology Inc. DS51616B-page 63
or Programmer>Settings to open the Settings dialo g
to choose the MPLAB
Page 70

MPLAB® REAL ICE™ In-Circuit Emulator User’s Guide
5.8 DEBUGGER/PROGRAMMER LIMITATIONS
For a complete list of emulator limitations for your device, please see the on-line help
file in MPLAB IDE for the MPLAB REAL ICE in-circuit emulator.
DS51616B-page 64 © 2008 Microchip Technology Inc.
Page 71

Chapter 6. Basic Debug Functions
6.1 INTRODUCTION
Basic MPLAB REAL ICE in-circuit emulator debug functions are discussed.
• Breakpoints and Stopwatch
• External Triggers
6.2 BREAKPOINTS AND STOPWATCH
Use breakpoints to halt code execution at specified lines in your code. Use the
stopwatch with breakpoints to time code execution.
Breakpoints and real-time data capture triggers use the same resources. Therefore,
the available number of breakpoints is actually the available number of combined
breakpoints/triggers.
The number of hardware and software breakpoints available and/or used is displayed
in the Device Debug Resource toolbar. See the MPLAB IDE documentation for more
on this feature.
To select hardware or software breakpoints:
1. Select Debugger>Settings
2. Select the desired type of breakpoints for your application. A list of features for
each breakpoint type - hardware or software - is shown under that type. (See
Section 11.5.2 “Settings Dialog, Configuration Tab” for more information.)
MPLAB® REAL ICE
IN-CIRCUIT EMULATOR
and click the Configuration tab.
™
Note: Using software breakpoints for debug impacts device endurance.
Therefore, it is recommended that devices used in this manner not be
used as production parts.
To set a breakpoint in code, do one of the following:
• Double-click or right click on a line of code to set up an individual breakpoint.
•Select Debugger>Breakpoints
breakpoints and breakpoint conditions. See Section 11.3.1 “Breakpoints Dia-
log” for more information.
To determine the time between the breakpoints, use the stopwatch:
1. Open the Breakpoints dialog (Debugger>Breakpoints
1. Click Stopwatch on the Breakpoints dialog to open the Stopwatch dialog.
2. Under “Start Condition”, click Select Start Condition and choose a breakpoint.
Also decide if “Start condition will cause the target device to halt”.
3. Under “Stop Condition”, click Select Stop Condition and choose another
breakpoint. Also decide if “Stop condition will cause the target device to halt”.
4. Decide if there will be a “Reset stopwatch on run”.
5. Click OK.
to open the Breakpoints dialog and set up multiple
).
© 2008 Microchip Technology Inc. DS51616B-page 65
Page 72

MPLAB® REAL ICE™ In-Circuit Emulator User’s Guide
6.3 EXTERNAL TRIGGERS
Select Debugger>Triggers to open the Triggers dialog to set up external triggers. See
Section 11.3.7 “Triggers Dialog” for more information.
Use external triggers to set up hardware triggers using the logic probe port. All pins
(whether used or unused) should either be pulled up or grounded. Floating pins may
produce false triggers.
To use probe pins as inputs, you must provide the circuitry to drive them (see Table
12-2: “Logic Probe Electrical Specifications” for drive levels.)
You will not be able to use external triggers if you are using the logic probe port for
another debug feature such as:
• Section 7.3.3.2 “I/O Port Trace”
• Section 8.3 “PIC32 Instruction Trace”
DS51616B-page 66 © 2008 Microchip Technology Inc.
Page 73

IN-CIRCUIT EMULATOR
Chapter 7. Debug for 8- and 16-Bit Devices
7.1 INTRODUCTION
The following debug functions are specific to 8- and 16-bit devices.
• Data Capture and Runtime Watches
•Trace
7.2 DATA CAPTURE AND RUNTIME WATCHES
Data capture provides streaming data from a device to the following:
• Data Monitoring and Control Interface (DMCI) – Tools menu
A runtime watch provides updating of a variable in the following windows during
program execution instead of on halt:
• Watch – View menu
• File Register – View menu
• Special Function Register (SFR) – View menu
Data captures and runtime watches use the same resource. Therefore, setting one or
both uses the resource for the selected symbol.
To set up data captures and/or runtime watches:
1. Select View>Watch
ime watches for specific data addresses. See Section 11.3.9 “Watch Wind ow -
Data Capture/Runtime W atch” for more information.
2. Select Debugger>Settings
the emulator needs to know the instruction cycle speed. (See
Section 11.5.6 “Settings Dialog, Clock Tab” for more information.) Enter your
information here.
3. Rebuild the project (Project>Build All
(Debugger>Program
4. Run the program. View the data in a DMCI window or watch variable values
change in an MPLAB IDE window.
to open the Watch window to set up data capture and/or runt-
and click the Clock tab. For data capture and trace,
) and reprogram the target device
).
MPLAB® REAL ICE
™
7.3 T RACE
This section will discuss the types of available trace for 8- and 16-bit devices and how
to use them. See Section 11.3.11 “Trace Window” for information on the trace
window.
• Requirements for Trace
• How Trace Works
• Types of Trace
• Setting Up the Project for Trace
• Setting Up Trace in MPLAB IDE
• Running Trace
• Tracing Tips
• Disabling Trace
© 2008 Microchip Technology Inc. DS51616B-page 67
Page 74

MPLAB® REAL ICE™ In-Circuit Emulator User’s Guide
• Resource Usage Examples
• More on Trace/Log ID Numbers
• Quick Trace Reference
7.3.1 Requirements for Trace
The following is required to use trace:
• For 16-bit devices (dsPIC30F/33F, PIC24F/H): MPLAB IDE v7.43 and above,
MPLAB C30 v2.04 and above. For these devices, only C code can be traced, not
assembly.
• For 8-bit devices (PIC18): MPLAB IDE v7.52 and above, MPASM toolsuite v5.10
and above, MPLAB C18 v3.10 and above.
• In-line assembly code (assembly code within C code) cannot be traced.
7.3.2 How Trace Works
Trace for the MPLAB REAL ICE in-circuit emulator (Instrumented Trace) is a solution
for providing basic trace information. Through the use of TRACE() and LOG() macros,
you can report program locations or variable values to MPLAB IDE while the application is running. Y ou may type these macro names in manually or right click in the editor
and select the macro to be inserted from the context menu. T o log a variable value, the
variable should be highlighted before selecting from the context menu.
FIGURE 7-1: EXAMPLE OF INSERTED LOG MACRO
There are three trace methods available at this time (see Section 7.3.3 “Types of
Trace”.) The mediums can be found on the Project>Build Options>Project
The choices inc lude Nativ e Trac e (utilize s PGC/PGD comm unication lines), SPI T rac e,
and I/O Port Trace. Not every method is available on every part, i.e., the options are
device specific. The Instrumented Trace library supports C and assembly projects on
PIC18F MCU devices, and C projects only on 16-bit devices.
, Trace tab.
DS51616B-page 68 © 2008 Microchip Technology Inc.
Page 75

Debug for 8- and 16-Bit Devices
FIGURE 7-2: BUILD OPTIONS TRACE TAB – NATIVE TRACE SELECTION
The trace and log information transmitted is identical regardless of the trace method
used. For TRACE(), a single value in the range of 64-127 is sent. A label generated
using this number is automatically inserted into the code so MPLAB IDE can identify in
the trace buffer the location which sent the value. For LOG(), a two-byte header is sent
followed by the value of the variable being logged. The first byte indicates the variable
type and is a value between 0 and 63. The second byte indicates the location which
sent the variable. Here, the location is represented by a value between 0 and 127. (See
Section 7.3.10 “More on Trace/Log ID Numbers”.)
Interrupts are disabled during every TRACE() and LOG() call. This is to ensure that
trace or log statements at an interrupt level do not interfere with a trace or log statement
that may already be in progress at the application level. A similar argument holds for
protecting statements within a low priority interrupt from being corrupted by ones from
a high priority interrupt.
7.3.3 Types of Trace
Currently there are three types of trace. All types are language tool version dependent
and stream data real-time to MPLAB IDE.
The pluses and minuses of using each trace type, as well as the type of communication
available (standard and/or high-speed), are summarized below.
Type of Trace
Advantage Disadvantage Std HS
Native Trace No dedicated pins
needed.
I/O Port Trace Fastest trace
method.
SPI Trace Faster than Native
Trace.
Note 1: Also requires connection from device port to emulator logic probe port.
Trace Usage Communication
Device must have built-in
debug circuitry.
An 8-bit port must be
dedicated to trace.
SPI pins must be dedicated
to trace.
15 MIPS
or less
(1)
Yes
No Yes
Greater than
15 MIPS
Yes
(1)
© 2008 Microchip Technology Inc. DS51616B-page 69
Page 76

MPLAB® REAL ICE™ In-Circuit Emulator User’s Guide
7.3.3.1 NATIVE TRACE
Native trace can be used with either standard or high-speed communications, with no
additional connections - the information is conveyed via the PGD/PGC/EMUC/EMUD
pins. This two-wire interface uses the trace macro format (see Section 7.3.5 “Setting
Up Trace in MPLAB IDE”).
If Native trace is used, then real-time data capture triggers cannot be used because of
hardware constraints. However, breakpoints are still available. To use data capture
triggers, you must disable Native trace (see Section 7.3.8 “Disabling Trace”).
7.3.3.2 I/O PORT TRACE
I/O Port trace can be used with either standard or high-speed communications. Trace
clock and data are provided from a device 8-pin I/O port through the MPLAB REAL ICE
in-circuit emulator logic probe connector.
The I/O port must have all 8 pins available for trace. The port must not be multiplexed
with the currently-used PGC and PGM pins. Therefore, review the data sheet of the
selected device to determine the uninitialized/default port pin states and change them
as necessary.
For hardware connections, see Section 2.5.3 “I/O Port Trace Connections”.
The port interface uses the trace macro format (see Section 7.3.5 “Setting Up Trace
in MPLAB IDE”).
7.3.3.3 SPI TRACE
SPI trace can be used only with high-speed communications. Trace clock and data are
provided through pins 7 (DAT) and 8 (CLK) of the high-speed connection.
For hardware connections, see Section 2.5.2 “SPI Trace Connections (High-Speed
Communication Only)”.
The SPI interface uses the trace macro format (see Section 7.3.5 “Setting Up Trace
in MPLAB IDE”).
7.3.4 Setting Up the Project for Trace
Refer to Chapter 5. “General Setup” for a discussion of how to set up MPLAB IDE
and an MPLAB IDE project to use the MPLAB REAL ICE in-circuit emulator.
To enable trace:
•Select Proj ect >B ui ld Op tions>Project
Options Dialog, Trace Tab (Device Dependent)”.)
• If it is not already selected, click to check “Enable Trace”. For full trace capability,
“Disable Trace Macros” should be unchecked.
• Select the type of trace you want (Section 7.3.3 “Types of Trace”).
•Click OK.
, Trace tab. (See Section 11.3.12 “Build
7.3.5 Setting Up Trace in MPLAB IDE
To set up MPLAB IDE to use trace for the MPLAB REAL ICE in-circuit emulator, first
set up options on the Settings dialog (Debugger>Settings
• Click the Clock tab. For data capture and trace, the emulator needs to know the
instruction cycle spe ed. (S ee Section 11.5.6 “Settings Dialog, Clock Tab” for
more information.)
• Click the Trace tab. The trace buffer can be set to a maximum value specified on
the tab. The trace buffer is circular, so data will wrap if the maximum is exceeded.
Next, enter trace macros in your application code.
.)
DS51616B-page 70 © 2008 Microchip Technology Inc.
Page 77

Debug for 8- and 16-Bit Devices
• To record a PC location, click on or highlight a line of code and then right click to
select “Insert Language Line Trace” from the pop-up menu, where Language can
be either C or ASM. This causes the following macro line to be inserted above the
selected line:
__TRACE(id);
where id is a line trace number auto-generated during the build. For more
information, see Section 7.3.10 “More on Trace/Log ID Numbers”.
Note: Inserting a macro into code may modify the logic flow of the program.
Please be sure that braces are present where necessary.
• The recording of a variable value is performed much in the same way. First high-
light the variable name or expression and then right click to select “Log Selected
Language Value” from the pop-up menu, where Language can be either C or
ASM. This causes the following macro line to be inserted above the line
containing the variable:
__LOG(id,selected variable);
where id is a log number auto-generated during build and selected variable
is the highlighted variable. For more information, see Section 7.3.10 “More on
Trace/Log ID Numbers”.
• To remove a trace point, simply highlight and then delete the Trace/Log macro.
7.3.6 Running Trace
1. On the Project Manager toolbar, select “Debug” from the Build Configuration
drop-down list.
2. Rebuild the project (Project>Build All
3. After rebuilding, if there are trace macros in code, a Warning dialog will ask, “File
has been modified. Do you want to reload?”. Click Yes. When you examine your
code, you will find that all ids have been replaced with unique numbers.
Note: To disable this warning and automatically reload, select
Configure>Settings
that were modified outside of the IDE”. Then click OK.
4. Reprogram the device (Debugger>Program
5. Run the program and then halt, or set a breakpoint to halt.
6. Select View>Trace
right click and in the Trace window and select “Reload”. For each __TRACE
macro, the line of code following the macro will appear in the trace window each
time it is passed. For each __LOG macro, the selected variable in the line of code
following the macro will appear in the trace window each time it is passed.
Note: To trace multiple lines of code or variables, you must place a macro
before each line/variable that you wish to trace.
Repeat these steps each time you change a trace point.
to view the trace data (Section 11.3.1 1 “Trace Window”) or
).
, Other tab, and check “Automatically reload files
).
7.3.7 Tracing Tips
When using __TRACE and __LOG macros in your code, consider the following:
• Focus on one area of an application and place __TRACE and __LOG macros so
that they form a “flow” in the Trace window. That way, you can follow the execution
flow and debug the application based on missing/incorrect trace points or an
abrupt end to the trace flow.
•Use __TRACE and __LOG macros with conditional statements in your code to aid
in debugging. Example: When a variable reaches a certain value, start logging it.
© 2008 Microchip Technology Inc. DS51616B-page 71
Page 78

MPLAB® REAL ICE™ In-Circuit Emulator User’s Guide
If(var > 5)
{
__LOG(ID, var)
}
• Leave __TRACE and __LOG macros in your code for future debugging, if this is
allowable. (For Project>Build Options>Project
Macros“.)
7.3.8 Disabling Trace
To temporarily turn off trace data collection:
1. Select Project>Build Options>Project
Click OK.
2. Rebuild the project (Project>Build All
3. Reprogram the device (Debugger>Program
To disable the full trace capability:
1. Remove all trace and log macros from code.
2. Select Project>Build Options>Project
OK.
3. Rebuild the project (Project>Build All
4. Reprogram the device (Debugger>Program
, Trace tab, select “Disable Trace
, Trace tab. Check “Disable Trace Macros”.
).
).
, Trace tab. Uncheck “Enable Trace”. Click
).
).
7.3.9 Resource Usage Examples
The following examples are for illustration only. Your results may vary based upon
compiler/assembler version, command line options, MPLAB IDE version, size of data
variable being logged, interrupt state, and device in use. All examples include argument setup, function call, and return time in their cycle counts.
The PIC18FXXJ MCU examples are compiled/assembled for non-priority interrupt
usage (30 instructions.) For priority interrupt usage, the value is 57, and for no interrupt
usage, the value is 15.
The dsPIC33F DSC examples show 9 instructions specified in the 16-bit library size for
memcpy().
EXAMPLE 7-1: PIC18FXXJ DEVICE RUNNING AT 4MHZ (1 MIPS) WITH
ASSEMBLY PROJECT
Native SPI I/O Port
Library Size (in instructions) 23 + 30 37 + 30 25 + 30
GPRs Used (in bytes) 8 6 6
__TRACE(id) instruction cycles 80 54 42
__LOG(id, BYTE) instruction cycles 168 90 57
EXAMPLE 7-2: PIC18FXXJ DEVICE RUNNING AT 40MHZ (10 MIPS) WITH C
PROJECT
Native SPI I/O Port
Library Size (in instructions ) 75 + 30 87 + 30 112 + 30
GPRs Used (in bytes) 10 8 8
__TRACE(id) instruction cycles 79 71 55
__LOG(id, INT) instruction cycles 225 169 162
DS51616B-page 72 © 2008 Microchip Technology Inc.
Page 79
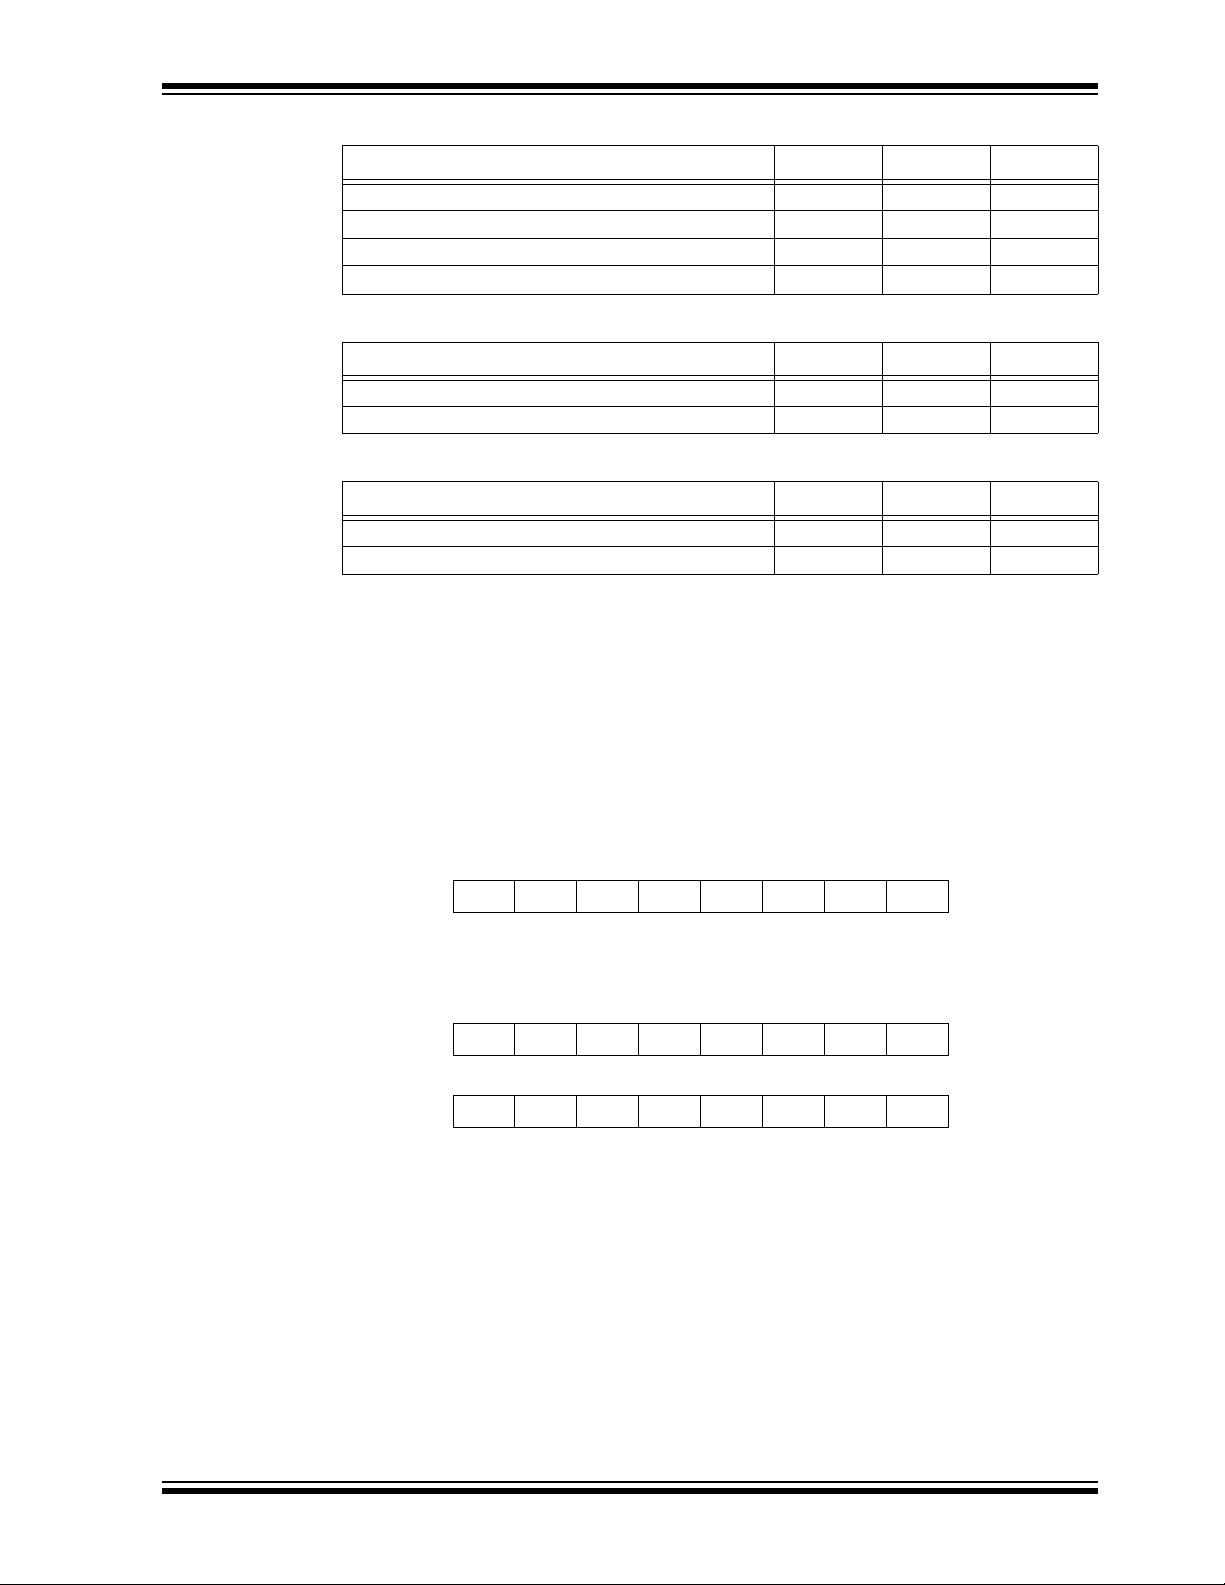
Debug for 8- and 16-Bit Devices
clock 1
bit 7 bit 0
n nnn nn
clock 0
bit 7 bit 0
t ttt tt
clock n
bit 7 bit 0
n nnn nn
EXAMPLE 7-3: dsPIC33F DEVICE RUNNING AT 10 MIPS WITH C PROJECT
Native SPI I/O Port
Library Size (in instructions) 87 + 9 92 + 9 93 + 9
GPRs Used (in bytes) 18 14 0
__TRACE(id) instruction cycles 80 53 32
__LOG(id, INT) instruction cycles 212 124 106
EXAMPLE 7-4: dsPIC33F DEVICE RUNNING AT 16 MIPS WITH C PROJECT
Native SPI I/O Port
__TRACE(id) instruction cycles 88 53 32
__LOG(id, INT) instruction cycles 227 138 106
EXAMPLE 7-5: dsPIC33F DEVICE RUNNING AT 34 MIPS WITH C PROJECT
Native SPI I/O Port
__TRACE(id) instruction cycles 100 53 32
__LOG(id, INT) instruction cycles 251 152 106
7.3.10 More on Trace/Log ID Numbers
MPLAB IDE will automatically generate the ID numbers required for a trace or log
macro. However, to understand the method behind the numbering, read further.
You can have 64 trace points and 128 log points. These limits are determined by port
trace (8 bits). Bit 7 is used as a clock, thus leaving 7 bits for data (128). Bit 6 is a flag
which indicates a trace record instead of a log record.
For a trace record (bit 6 is 1), the low order bits represent the trace number (nnnnnn).
Y ou could say 0-63 are the legal trace numbers and require the trace flag be set, but it
was just easier to combine the flag with the number and say the valid numbers are
64-127.
For a log record (bit 6 is 0), the low order bits identify the data type (t) and the log
number is sent in the next byte (nnnnnnn), thus freeing up a full 128 values.
© 2008 Microchip Technology Inc. DS51616B-page 73
Page 80

MPLAB® REAL ICE™ In-Circuit Emulator User’s Guide
7.3.11 Quick Trace Reference
If you are ne w to using the MPLAB REAL ICE in-circuit emulator trace feature, it is
recommended that you read through the entire trace section for a full understanding.
Use this section as a quick reference for trace.
1. Select Project>Build Options>Project
Trace” should be checked and “Disable Trace Macros” should be unchecked.
Select the type of trace you want. (Make sure your hardware can support this
choice.)
2. Select Debugger>Settings
speed. Click the Trace tab to change the size of the trace buffer.
3. Right click in your code to enter trace macros (__TRACE, __LOG) as desired.
4. On the Project Manager toolbar, select Debug from the Build Configuration
drop-down list.
5. Rebuild your project, reprogram your target device and run your program.
. Click the Clock tab and enter the instruction cycle
, Trace tab. For full trace capability, “Enable
DS51616B-page 74 © 2008 Microchip Technology Inc.
Page 81

MPLAB® REAL ICE™ IN-CIRCUIT
EMULATOR USER’S GUIDE
Chapter 8. Debug for 32-Bit Devices
8.1 INTRODUCTION
The following debug functions are specific to 32-bit devices:
• Data Capture and Runtime Watches
• PIC32 Instruction Trace
8.2 DATA CAPTURE AND RUNTIME WATCHES
At this time, MPLAB REAL ICE in-circuit emulator does not support data capture for
32-bit devices. Runtime watches, however, are supported.
A runtime watch provides updating of a variable in the following windows during
program execution instead of on halt:
• Watch – View menu
• File Register – View menu
• Special Function Register (SFR) – View menu
To set up runtime watches:
1. Select View>Watch
specific data addresses. See Section 11.3.9 “Watch Window - Data Cap-
ture/Runtime Watch” for more information.
2. Select Debugger>Settings
the instruction cycle speed. (See Section 11.5.6 “Settings Dialog, Clock T ab”
for more information.) Enter your information here.
3. Rebuild the project (Project>Build All
(Debugger>Program
4. Run the program. Watch variable values change in an MPLAB IDE window.
to open the Watch window to set up runtime watches for
and click the Clock tab. The emulator needs to know
) and reprogram the target device
).
8.3 PIC32 INSTRUCTION TRACE
This section will discuss trace for 32-bit devices and how to use it.
• Requirements for Trace
• Setting Up and Using Trace
• Trace Hardware Specifications
8.3.1 Requirements for Trace
The following is required to use trace for 32-bit (PIC32MX) devices:
• MPLAB IDE v8.00 and above
• MPLAB ASM32/LINK32/C32 v1.00 and above
• PIC32MX Plug-In Module (PIM) containing a device that supports trace and a
trace port
• PIC32MX Trace Interface Kit (AC244006) containing a 12-inch trace cable and a
trace adapter board
© 2008 Microchip Technology Inc. DS51616B-page 75
Page 82

MPLAB® REAL ICE™ In-Circuit Emulator User’s Guide
PIC
32
Trace Cable
Trace Port
PIM
Trace
Adapter
Communication Cable(s)
ACTIVE
STATUS
RESETFUNCTION
Emulator Pod
8.3.2 Setting Up and Using T race
If a PIC32MX MCU device has trace capability, it will be PIC32 Instruction Trace.
8.3.2.1 HARDWARE SETUP
To use the PIC32 Instruction Trace feature do the following:
• Plug the PIM into an unpowered target board.
• Install communication cable(s) between the emulator and your target board. See
Section 2.4 “Target Communication Connections”.
• Connect the trace cable from the trace port on the PIM to the trace adapter board.
Orient the cable as show in Figure 8-1.
• Plug the trace adapter board into the MPLAB REAL ICE in-circuit emulator logic
probe port. The top of the adapter board contains the connectors and should be
oriented upwards when plugging the board into the logic probe port (Figure 8-1).
• Power the target.
Note: When using trace, pins TRCLK and TRD3:0 are used. Therefore, you
cannot use the other functions multiplexed on these pins, namely RG14:12
and RA7:6.
FIGURE 8-1: TRACE CONNECTION
DS51616B-page 76 © 2008 Microchip Technology Inc.
8.3.2.2 MPLAB IDE SETUP
Once the hardware is connected, you enable trace in MPLAB IDE through the
Debug
ger>Settings, Trace tab. Simply check/uncheck the “Enable Trace” checkbox to
turn trace on/off (Figure 8-2). If no other options are selected, trace will continue to fill
the trace buffer with data, rolling over when the buffer is full, until a program Halt.
To “stall” the target CPU when the trace buffer is full, check that option on the Trace
tab. You can set the size of the trace buffer in the “Trace Buffer Size” section of the
dialog. A maximum size is specified in the section text.
To start and/or stop trace on triggers/breaks, set and enable breakpoints in your code
and then select them on this tab to start and/or stop trace.
Page 83
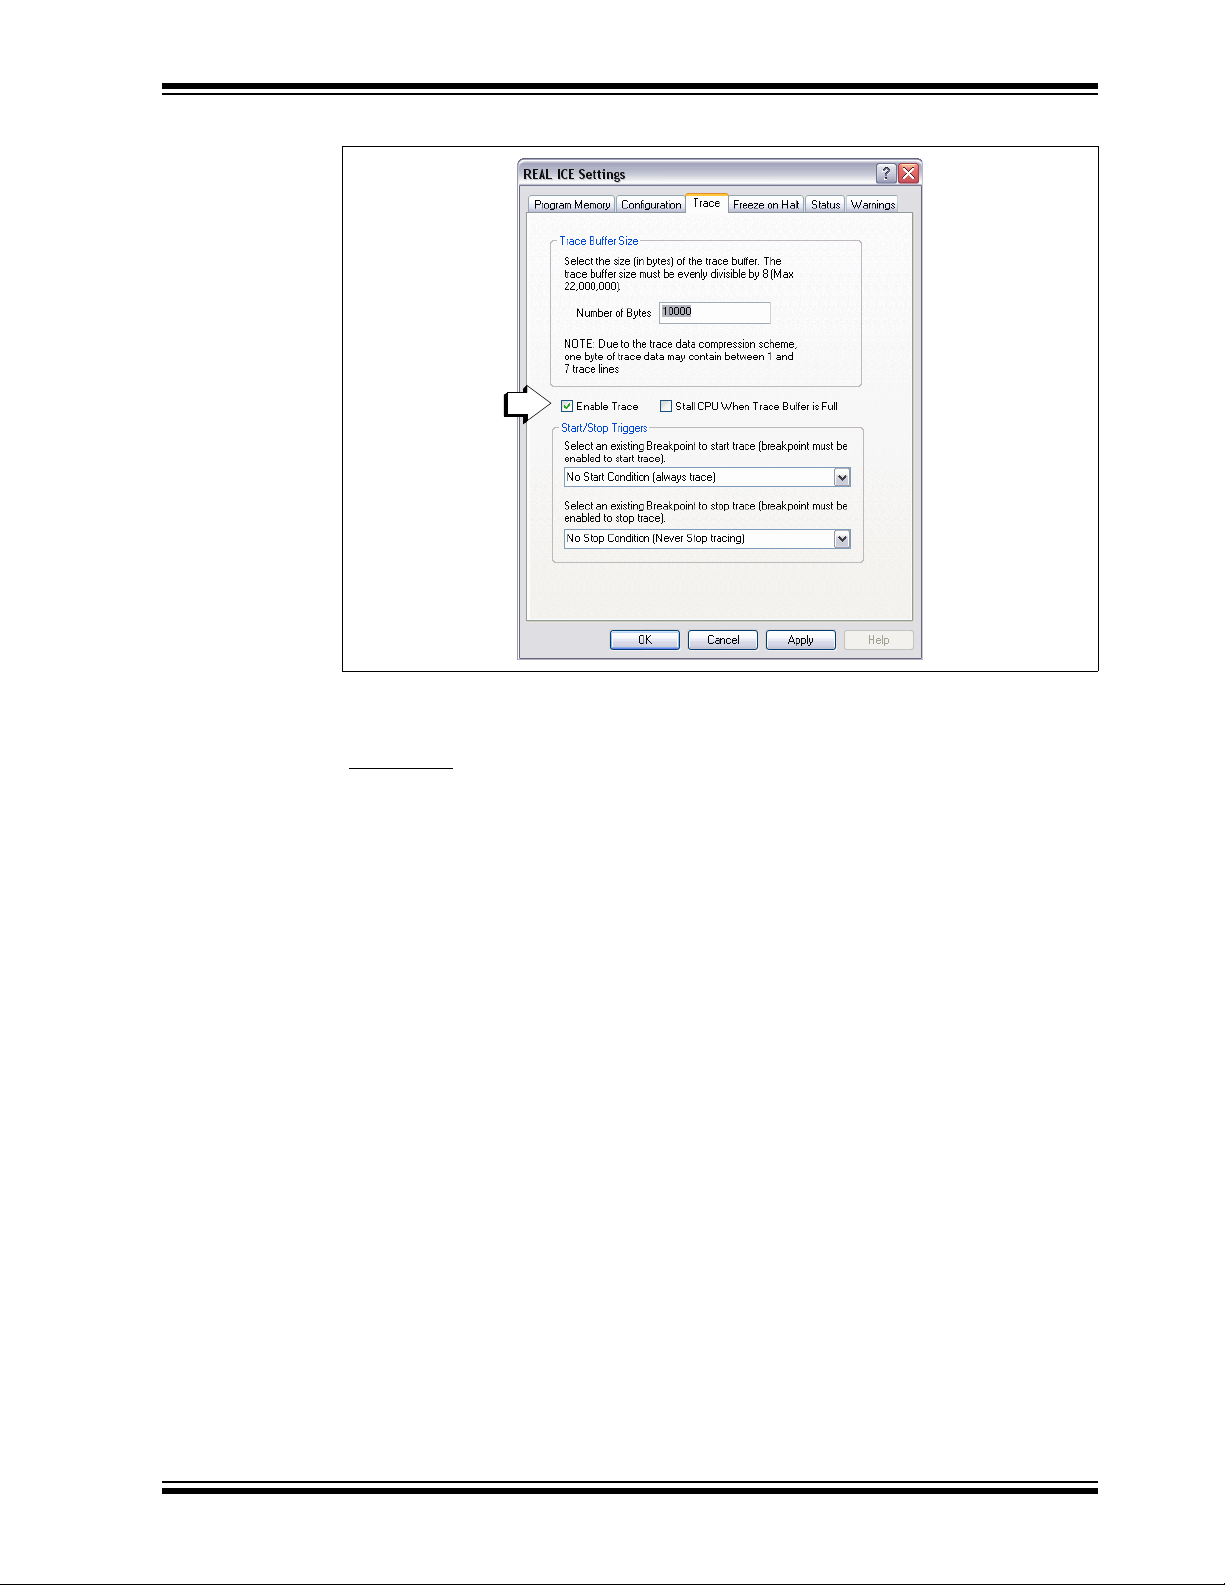
Debug for 32-Bit Devices
FIGURE 8-2: PIC32 INSTRUCTION TRACE ENABLE
8.3.2.3 VIEWING TRACE DATA
When trace is enabled and code is run, trace data will appear in the Trace window
(View>Trace
for an example of trace data in the Trace window.
). See Section 4.16 “Other Trace Methods – PIC32 Instruction Trace”
© 2008 Microchip Technology Inc. DS51616B-page 77
Page 84

MPLAB® REAL ICE™ In-Circuit Emulator User’s Guide
TRCLK
TRD0
TRD1
TRD2
TRD3
J1
1
3
5
2
4
6
TCLK
TRIG3
TRIG1
TRIG4
TRIG2
78
910
11 12
13 14
Reserved
Signal Map
J1 J2
TCLK TRCLK
TRIG1 TRD0
TRIG2 TRD1
TRIG3 TRD2
TRIG4 TRD3
J2
1
3
5
2
4
6
798
10
Reserved
Reserved
Reserved
Reserved
Reserved
Reserved
N:Blue, TRCLK:Yellow, TRDAT:Green
8.3.3 Trace Hardware Specifications
Specifications for hardware that supports PIC32 Instruction Trace are listed below.
8.3.3.1 PIC32MX TRACE INTERFACE KIT (AC244006)
The PIC32MX Trace Interface Kit consists of an adapter board and trace cable. Kit
component dimensions and a pin connection diagram for the adapter board are shown
below.
TABLE 8-1: KIT COMPONENT DIMENSIONS IN INCHES
Component Length Width Height
Adapter Board 0.900 0.800 0.6
Cable 12.0 0.5 0.0625
FIGURE 8-3: ADAP TER BOARD PIN CONNECTION DIAGRAM
8.3.3.2 PIC32MX360F512L PIM (MA320001)
The PIC32MX360F512L PIM contains a PIC32MX360F512L device and trace port
connector, since this device supports PIC32 Instruction Trace. PIM dimensions and pin
connection diagram are shown below.
TABLE 8-2: PIM DIMENSIONS IN INCHES
Component Length Width Height
PIC32MX360F512L PIM 1.55 1.55 0.9
DS51616B-page 78 © 2008 Microchip Technology Inc.
Page 85

Debug for 32-Bit Devices
1
15
16
25
75
62
51
26 36 37 50
100 76
V
s
s
V
D
D
co
r
e
Vss
Vss
VDD
VDD
MCLR
VDD Max = 3.6V
Vss
65
45
V
s
s
PIC32MX
VDD
J1
1
3
5
2
4
6
798
10
22
22
22
22
22
Trace
Port
46
VD
D
85
V
DD
2
13
24
27
PGD1
PGC1
PGD2
PGC2
TRCL
K
TRD3
T
R
D2
TRD
1
TRD
0
9192959697
0
0
0
0
0
Remove resistors to
isolate trace pins
from target board.
30 31
A
V
s
s
A
V
D
D
91
97
96
95
92
All processor pins
connected directly
to their respective
PIM pins unless
otherwise shown.
To PIM Ground
To PIM Ground
VDD/VDDcore:Red, VSS/GND:Blue, PGC:Yellow, PGD:Green, MCLR:Purple
FIGURE 8-4: PIC32MX360F51 2L PIM PIN CONNECTION DIAGRAM
© 2008 Microchip Technology Inc. DS51616B-page 79
Page 86

MPLAB® REAL ICE™ In-Circuit Emulator User’s Guide
NOTES:
DS51616B-page 80 © 2008 Microchip Technology Inc.
Page 87

MPLAB® REAL ICE™ IN-CIRCUIT
EMULATOR USER’S GUIDE
Part 3 – Reference
Chapter 9. Frequently Asked Questions (FAQ).........................................................83
Chapter 10. Error Messages........................................................................................89
Chapter 11. Emulator Function Summary..................................................................97
Chapter 12. Hardware Specification......................................................................... 113
© 2008 Microchip Technology Inc. DS51616B-page 81
Page 88

MPLAB® REAL ICE™ In-Circuit Emulator User’s Guide
NOTES:
DS51616B-page 82 © 2008 Microchip Technology Inc.
Page 89

Chapter 9. Frequently Asked Questions (FAQ)
9.1 INTRODUCTION
Look here for answers to frequently asked questions about the MPLAB REAL ICE
in-circuit emulator system.
• How Does It Work FAQs
• How Does Trace Work – 8 and 16 Bit Devices
•What’s Wrong
9.2 HOW DOES IT WORK FAQs
• What's in the silicon that allows it to communicate with the MPLAB REAL ICE
in-circuit emulator?
MPLAB REAL ICE in-circuit emulator can communicate with any silicon via the
ICSP interface. It uses the debug executive located in test memory.
• How is the throughput of the processor affected by having to run the debug
executive?
The debug executive doesn't run while in Run mode, so there is no throughput
reduction when running your code, i.e., the emulator doesn’t ‘steal’ any cycles
from the target device. However, when you are doing Native trace, each macro
inserted takes about 200 instructions. Therefore, this will affect timing.
For more information, see Section 7.3.9 “Resource Usage Examples”.
• How does the MPLAB REAL ICE in-circuit emulator compare with other in-circuit
emulators/debuggers?
Please refer to Section 2.2 “Tool Comparisons”.
• How does MPLAB IDE interface with the MPLAB REAL ICE in-circuit emulator to
allow more features than in-circuit debuggers?
For some devices, the MPLAB REAL ICE in-circuit emulator communicates using
the debug executive located in a special area of memory that does not use application program memory. Also, the debug exec is streamlined for more efficient
communication. The emulator contains an FPGA, large SRAM Buffers (1Mx8),
and a high speed USB interface. The program memory image is downloaded and
is contained in the SRAM to allow faster programming. The FPGA in the emulator
serves as an accelerator for interfacing with the device in-circuit debugger
modules.
• On tradit io na l em ul at o rs , t h e d at a mu st co me out on th e bu s in or de r t o p er f or m a
complex trigger on that data. Is this also required on the MPLAB REAL ICE
in-circuit emulator? For example, could I halt based on a flag going high?
Traditional emulators use a special emulator chip (-ME) for monitoring. There is
no -ME with the MPLAB REAL ICE in-circuit emulator so there are no busses to
monitor externally. With the MPLAB REAL ICE in-circuit emulator, rather than
using external breakpoints, the built-in breakpoint circuitry of the debug engine is
used; the busses and breakpoint logic are monitored inside the part.
MPLAB® REAL ICE™ IN-CIRCUIT
EMULATOR USER’S GUIDE
© 2008 Microchip Technology Inc. DS51616B-page 83
Page 90

MPLAB® REAL ICE™ In-Circuit Emulator User’s Guide
• Does the MPLAB REAL ICE in-circuit emulator have complex breakpoints?
Yes. You can break based on a value in a data memory location. You can also do
sequenced breakpoints, where several events are happening before it breaks, but
you can only do 2 sequences instead of 4, as you can in the MPLAB ICE 2000.
You can also do an AND condition and PASS counts. See
Section 11.3.1 “Breakpoints Dialog” for more information.
• One of the probe pins is labeled 5V. How much drive capability does this probe
have?
This is a monitoring function (allows you to see what V
and used on the driver buffers). The MPLAB REAL ICE in-circuit emulator cannot
provide power to the target.
• Are any of the driver boards optoisolated or electrically isolated?
They are DC optoisolated, but not AC optoisolated. To apply high voltage (120V)
to the current system, see the optional opto-isolation board (AC244005).
• What limitations are there with the 5 or 6 pins only?
The limitations are with the cable used. The standard ICSP RJ-11 cable does not
allows for clock speeds greater than about 15 Mb/sec. dsPIC33F DSCs running at
full speed are greater than the 15 Mb/sec limit. For these high-speed applications,
the Performance Pak (high-speed) cable interface is required.
• Will this slow down the running of the program?
There is no cycle stealing with the MPLAB REAL ICE in-circuit emulator. The
output of data is performed by the state machine in the silicon.
• How do I connect CLK and DAT when using high-speed communications?
These connections are optional and used for SPI trace. For more information, see
Section 2.5.2 “SPI Trace Connections (High-Speed Communication Only)”.
• What is meant by the data rate is limited to 15 MIPS, when using the standard
board? Is this caused by the core processor or transfer rate?
The standard board uses the RJ-11 cable and has a limitation on how fast data
can reliably be transmitted when using trace. The top end is when the processor
has an operational speed of 15 MIPS. The trace clock is derived from the main
system clock of the device.
• To debug a dsPIC
to do even basic debugging?
Basic debugging at any device frequency can be accomplished with either
standard or high-speed (Performance Pak) communications.
• If the high speed board is necessary for a dsPIC DSC to run at 30 MIPS, can this
be done using the high speed to standard converter board on the target side?
It is recommended that at high device operational frequencies, the slower cable
not be used. This introduces signal integrity issues, due to the lower quality of
cable transmission, when using the RJ-11 converter board.
• If the high-speed receiver board is used, do pins 7-8 have to be connected, or can
they just be left open?
They can be left open. The high-speed receiver board weakly pulls them down.
• What is the function of pin 6, the auxiliary pin?
There is no function on pin 6. It is a legacy connection, compatible with the typical
ICSP 6-pin header definition.
®
DSC running at 30 MIPS, is the high-speed board necessary
DD is actually being applied
DS51616B-page 84 © 2008 Microchip Technology Inc.
Page 91

Frequently Asked Questions (FAQ)
9.3 HOW DOES TRACE WORK – 8 AND 16 BIT DEVICES
• What's in the silicon that allows it to trace with the MPLAB REAL ICE in-circuit
emulator?
Tracing over the two-wire (ICSP) interface is supported with silicon that contains
the Version 2 PIC18F and dsPIC33F/PIC24X in-circuit debugger modules.
• When using trace, is this connection electrically isolated in any way, i.e., do the
triggers have any isolation?
They are buffered and DC adjusted to whatever V
buffers tristate when off. This minimal isolation makes the system fast and opens
the door to adapt to new and faster technologies. However, you may implement
more RS-232 isolation (4-6 lines) if desired, but this may impact your speed.
• Can we do trace by using the 5 or 6 ICSP pins only?
Tracing is possible using the standard ICSP interfac e.
• When would SPI trace be used? What extra advantage does this have?
The SPI trace is intended to be used for devices that do not have the advanced
debug engine for tracing. These typically would be some PIC18F and all PIC16F
MCU devices.
• In order to use the SPI trace, what is the hardware connection?
For serial SPI port trace, the device SPI SDO (serial data output) and SCK (serial
clock) are required. These pins must be connected, respectively, to the DAT and
CLK pin interface on the Performance Pak receiver board. See
Section 2.5.2 “SPI Trace Connections (High-Speed Communication Only)”
for more information.
• For SPI trace, which two pins are used?
SDO (Serial Data Output) → DAT (pin 7)
SCK (Serial Clock Output) → CLK (pin 8)
• What are the correct port settings to use SPI trace, i.e., mode, sync/async, etc.?
The setup is taken care of by MPLAB IDE, so you will not need to be concerned
about the code required for setting this. Trace will support 64 trace points and 128
log points.
SPI – Comm Protocol MODE1, clock high, sampled falling edge.
• What is the correct connection for using I/O Port (parallel port) trace?
The connection varies depending on the PORT used. There are port assignments
in MPLAB IDE that are displayed when the PORT is selected in the property
sheet. See Section 2.5.3 “I/O Port Trace Connections” for more information.
• Can we use any port?
The port must be available on the device and not multiplexed with the currently
used PGC and PGM pins.
• Of the 7 data and one clock, which one is the clock?
There are 7 bits of data to set up to 128 trace points. The clock is the MSB of the
port.
• Are these I/O ports used for trace available as general I/O during debugging?
For dsPIC30F/33F and PIC24F/H devices, you may write to the opposing 8-bit
part of the port provided byte write operations are used. The following example
will only write to the high side of the port.
#define high(num) (((BYTE *)&num)[1])
#define low(num) (((BYTE *)&num)[0])
high(PORTA) = 0x12;
For PIC18 devices, once the ports are defined to be used for trace, you should
not access them in your code.
DD level you are running. The
© 2008 Microchip Technology Inc. DS51616B-page 85
Page 92

MPLAB® REAL ICE™ In-Circuit Emulator User’s Guide
9.4 WHAT’S WRONG
• I cannot get trace to work. What’s wrong?
Things to consider:
- Certain tool versions are required to use trace. Please refer to either Chapter
7. “Debug for 8- and 16-Bit Devices” or Chapter 8. “Debug for 32-Bit
Devices”.
- For dsPIC30F/33F and PIC24F/H devices, only C code can be used with trace,
not assembly.
- In-line assembly code (assembly code within C code) cannot be traced.
- Native trace and real-time data capture triggers cannot be used together.
- For Port I/O Trace, all 8 pins must be dedicated to trace (i.e., not multiplexed
with the currently used PGC and PGM pins.)
- For Port I/O Trace, ensure that the chosen port is able to output 0x00 and 0xFF.
As a test, set the port TRIS to 0 (all outputs) and set the LAT to a value in the
watch window. The value written to LAT should appear on the port pins.
• My PC went into power-down/hibernate mode, and now my emulator won’t work.
What happened?
When using the emulator for prolonged periods of time, and especially as a
debugger, be sure to disable the Hibernate mode in the Power Options Dialog
window of your PC’s operating system. Go to the Hibernate tab and clear or
uncheck the “Enable hibernation” check box. This will ensure that all
communication is maintained across all the USB subsystem components.
• I set my peripheral to NOT freeze on halt, but it is suddenly freezing. What's going
on?
For dsPIC30F/33F and PIC24F/H devices, a reserved bit in the peripheral control
register (usually either bit 14 or 5) is used as a Freeze bit by the debugger. If you
have performed a write to the entire register, you may have overwritten this bit.
(The bit is user accessible in Debug mode.)
To avoid this problem, write only to the bits you wish to change for your application
(BTS, BTC) instead of to the entire register (MOV).
• When using a 16-bit device, unexpected reset occurred. How do I determine what
caused it?
Some things to consider:
- To determine a reset source, check the RCON registe r.
- Handle traps/interrupts in an interrupt service routine (ISR). You should include
trap.c style code, i.e.,
void __attribute__((__interrupt__)) _OscillatorFail(void);
:
void __attribute__((__interrupt__))
_AltOscillatorFail(void);
:
void __attribute__((__interrupt__)) _OscillatorFail(void)
{
INTCON1bits.OSCFAIL = 0; //Clear the trap flag
while (1);
}
:
void __attribute__((__interrupt__))
_AltOscillatorFail(void)
{
INTCON1bits.OSCFAIL = 0;
while (1);
DS51616B-page 86 © 2008 Microchip Technology Inc.
Page 93

Frequently Asked Questions (FAQ)
}
:
- Use ASSERTs.
• I have finished debugging my code. Now I’ve programmed my part, but it won’t
run. What’s wrong?
Some things to consider are:
- Have you selected the emulator as a programmer and then tried to program a
header board? A header board contains an -ICE/-ICD version of the device and
may not function like the actual device. Only program regular devices with the
emulator as a programmer. Regular devices include devices that have on-board
ICE/ICD circuitry, but are not the special -ICE/-ICD devices found on header
boards.
- Have you selected the emulator as a debugger and then tried to program a regular device? Programming a device when the emulator is a debugger will program
a debug executive into program memory and set up other device features for
debug (see Section 2.7.1 “Sequence of Operations Leading to Debugging”.)
To program final (release) code, select the emulator as a programmer.
- Have you selected “Release” from the Build Configuration drop-down list or Project menu? You must do this for final (release) code. Rebuild your project, reprogram the device, and try to run your code again.
• I didn’t set a software breakpoint, yet I have one in my code. What’s going on?
What you are seeing is a phantom breakpoint. Occasionally, a breakpoint can
become enabled when it shouldn’t be. Simply disable or delete the breakpoint.
• I don’t see my problem here. Now what?
Try the following resour ces:
- Chapter 10. “Limitations”
- Section 2.9 “Resources Used by the Emulator”
- Section 10.2 “Specific Error Messages”
- Section 10.3 “General Corrective Actions”
© 2008 Microchip Technology Inc. DS51616B-page 87
Page 94

MPLAB® REAL ICE™ In-Circuit Emulator User’s Guide
NOTES:
DS51616B-page 88 © 2008 Microchip Technology Inc.
Page 95

MPLAB® REAL ICE™ IN-CIRCUIT
Chapter 10. Error Messages
10.1 INTRODUCTION
The MPLAB REAL ICE in-circuit emulator produces many different error messages;
some are specific and others can be resolved with general corrective actions.
• Specific Error Messages
• General Corrective Actions
10.2 SPECIFIC ERROR MESSAGES
MPLAB REAL ICE in-circuit emulator error messages are listed below in numeric order.
Note: Numbers may not yet appear in displayed messages. Use the Search tab
on the Help viewer to find your message and highlight it below.
Text in error messages listed below of the form %x (a variable) will display as text
relevant to your particular situation in the actual error message.
RIErr0001: Failed while writing to program memory.
RIErr0002: Failed while writing to EEPROM.
RIErr0003: Failed while writing to configuration memory.
See Section 10.3.1 “Read/Write Error Actions”.
RIErr0005: REAL ICE is currently busy and cannot be unloaded at this time.
If you receive this error when attempting to deselect the emulator as a debugger or
programmer:
1. Wait - give the emulator time to finish any application tasks. Then try to deselect
the emulator again.
2. Select Halt to stop any running applications. Then try to deselect the emulator
again.
3. Unplug the emulator from the PC. Then try to deselect the emulator again.
4. Shut down MPLAB IDE.
RIErr0006: Failed while writing to user ID memory.
RIErr0007: Failed while reading program memory.
RIErr0008: Failed while reading EEPROM.
RIErr0009: Failed while reading configuration memory.
RIErr0010: Failed while reading user ID memory.
See Section 10.3.1 “Read/Write Error Actions”.
RIErr0011: Bulk erase failed.
See Section 10.3.1 “Read/Write Error Actions”.
If these do not work, try another device.
EMULATOR USER’S GUIDE
© 2008 Microchip Technology Inc. DS51616B-page 89
Page 96

MPLAB® REAL ICE™ In-Circuit Emulator User’s Guide
RIErr0012: Download debug exec failed
If you receive this error while attempting to program from the Debugger menu:
1. Deselect the emulator as the debug tool.
2. Close you project and then close MPLAB IDE.
3. Restart MPLAB IDE and re-open your project.
4. Reselect the emulator as your debug tool and attempt to program your target
device again.
If this does not work, see Section 10.3.4 “Corrupted Installation Actions”.
RIErr0013: NMMR register write failed.
RIErr0014: File register write failed.
See Section 10.3.2 “Emulator-to-Target Communication Error Actions”.
RIErr0015: Data transfer was unsuccessful. %d byte(s) expected, %d byte(s)
transferred.
See Section 10.3.3 “Emulator-to-PC Communication Error Actions”.
RIErr0016: Cannot transmit. REAL ICE not found.
The emulator is not connected to the PC.
RIErr0017: File register read failed.
RIErr0018: NMMR register read failed.
RIErr0019: Failed while reading emulation registers.
RIErr0020: Failed while writing emulation registers.
See Section 10.3.2 “Emulator-to-Target Communication Error Actions”.
RIErr0021: Command not echoed properly. Sent %x, received %x.
RIErr0022: Failed to get REAL ICE version information.
RIErr0023: Download FPGA failed.
RIErr0024: Download RS failed.
RIErr0025: Download AP failed.
See Section 10.3.3 “Emulator-to-PC Communication Error Actions”.
RIErr0026: Download program exec failed.
If you receive this error while attempting to program from the Debugger menu:
1. Deselect the emulator as the debug tool.
2. Close your project and then close MPLAB IDE.
3. Restart MPLAB IDE and re-open your project.
4. Reselect the emulator as your debug tool and attempt to program your target
device again.
If this does not work, see Section 10.3.4 “Corrupted Installation Actions”.
RIErr0027: Bulk transfer failed due to invalid checksum
See Section 10.3.3 “Emulator-to-PC Communication Error Actions”.
Also, ensure that the cables used are of the correct length.
RIErr0028: Download device database failed
If you receive this error:
1. Try downloading again. It may be a one-time error.
2. Try manually downloading. Select Debugger>Settings
click Manual Download. Select the highest-number .jam file and click Open.
RIErr0029: Communication failure. Unexpected command echo response %x
received from REAL ICE.
See Section 10.3.3 “Emulator-to-PC Communication Error Actions”.
, Configuration tab, and
DS51616B-page 90 © 2008 Microchip Technology Inc.
Page 97

Error Messages
RIErr0030: Unable to read/find firmware File %s.
If the Hex file exists:
• Reconnect and try again.
• If this does not work, the file may be corrupted. Reinstall MPLAB IDE.
If the Hex file does not exist:
• Reinstall MPLAB IDE.
RIErr0031: Failed to get PC.
RIErr0032: Failed to set PC.
See Section 10.3.2 “Emulator-to-Target Communication Error Actions”.
RIErr0033: %d bytes expected, %d bytes received.
See Section 10.3.3 “Emulator-to-PC Communication Error Actions”.
RIErr0034: This version of MPLAB IDE does not support hard ware revision %06x.
Please upgrade to the latest version of MPLAB IDE before continuing.
Find the latest MPLAB IDE at www.microchip.com.
RIErr0035: Failed to get Device ID.
See Section 10.3.1 “Read/Write Error Actions”.
RIErr0036: MPLAB IDE has lost communication with REAL ICE.
See Section 10.3.3 “Emulator-to-PC Communication Error Actions”.
RIErr0037: Timed out waiting for response from REAL ICE.
RIErr0038: Failed to intialize REAL ICE.
RIErr0039: REAL ICE self test failed.
For this error, the emulator is not responding:
1. Unplug and plug in the emulator.
2. Reconnect to the emulator in MPLAB IDE.
3. If the problem persists contact Microchip.
RIErr0040: The target device is not ready for debugging. Please check your
Configuration bit settings and program the device before proceeding.
Y ou will receive this message when you have not programmed your device for the first
time and try to Run. If you receive this message after this, or immediately after
programming your device, please refer to Section 10.3.6 “Debug Failure Actions”.
RIErr0041: While receiving streaming data, REAL ICE has gotten out of synch
with MPLAB IDE. To correct this you must reset the target device.
Data capture or Native trace has gotten out-of-sync with MPLAB IDE. First try to Halt,
Reset and then Run again. If this does not work:
1. Unplug and plug in the emulator.
2. Reconnect to the emulator in MPLAB IDE.
3. Check that the target speed is entered on the Clock tab of the Settings dialog.
4. Run again.
RIErr0045: You must connect to a target device to use MPLAB REAL ICE.
No power has been found.
1. Ensure V
2. Ensure that the target is powered.
3. Ensure that the target power is sufficient to be detected by the emulator (see
Chapter 12. “Hard ware Specificat ion ”.)
DD and GND are connected between the emulator and target.
© 2008 Microchip Technology Inc. DS51616B-page 91
Page 98

MPLAB® REAL ICE™ In-Circuit Emulator User’s Guide
RIErr0046: An error occurred while trying to read the stopwatch count. The
stopwatch count may not be accurate.
See Section 10.3.2 “Emulator-to-Target Communication Error Actions”.
RIErr0047: Bootloader download failed.
RIErr0048: Unable to set trace options.
See Section 10.3.3 “Emulator-to-PC Communication Error Actions”.
RIErr0049: Unable to open file for streaming data trace. Trace will be turned off.
The trace file cannot be opened.
1. Make sure the directory is not Read Only. Right click on it and check its
Properties. This file is located, by default, in:
C:\Program Files\Microchip\MPLAB IDE\REAL ICE.
2. Deselect and then reselect the emulator as the debug tool.
RIErr0050: Unable to set probe options.
See Section 10.3.3 “Emulator-to-PC Communication Error Actions”.
RIErr0051: Unrecognized trace data format received.
Data capture or Native trace has gotten out of sync with MPLAB IDE. First try to Halt,
Reset and then Run again. If this does not work:
1. Unplug and plug in the emulator.
2. Reconnect to the emulator in MPLAB IDE.
3. Check that the target speed is entered on the Clock tab of the Settings dialog.
4. Run again.
RIErr0052: The current REAL ICE hardware version %x, is out of date. This
version of MPLAB IDE will support only version %x or higher.
Did you click Cancel when asked to download the latest firmware? If so, you will need
to download it now. Select Debugger>Settings
Download. Select the highest number .jam file and click Open.
If you cannot find any files to download or if this does not work (corrupted file), you will
need to get the latest version of MPLAB IDE and install it. Find the latest MPLAB IDE
at www.microchip.com.
RIErr0053: Unable to get REAL ICE protocol versions.
See Section 10.3.3 “Emulator-to-PC Communication Error Actions”.
RIErr0054: MPLAB IDE's REAL ICE protocol definitions are out of date. Y ou must
upgrade MPLAB IDE to continue.
Find the latest MPLAB IDE at www.microchip.com.
RIErr0055: Unable to set firmware suite version.
RIErr0056: Unable to get voltages from REAL ICE.
See Section 10.3.3 “Emulator-to-PC Communication Error Actions”.
RIErr0057: Loopback could not be completed.
Ensure that you are using the Standard driver board and not the High-Speed driver
board for loopback. Also, see Section 10.3.2 “Emulator-to-Target Communication
Error Actions”.
RIErr0058: Loopback internal setup failure.
Emulator power supply failure. Contact Microchip technical support.
RIErr0059: Loopback clock feedback failure.
RIErr0060: Loopback data feedback failure.
Trigger/port pin failure. Contact Microchip technical support.
, Configuration tab, and click Manual
DS51616B-page 92 © 2008 Microchip Technology Inc.
Page 99

Error Messages
RIErr0061: Loopback VDD not detected. Please ensure your RJ-11 cable is
connected between the loopback board and the driver board. Unplug the REAL
ICE to try again.
Try the following:
1. Connect the cable between the loopback board and the Standard driver board.
2. Unplug and then plug in the emulator.
If this does not work, try a different cable and repeat the above steps.
RIErr0062: Loopback VPP failure.
Emulator power supply failure. Contact Microchip technical support.
RIErr0063: Loopback clock write failure.
RIErr0064: Loopback data write failure.
RIErr0065: Loopback clock read failure.
RIErr0066: Loopback data read failure.
Clock/data not being output from the emulator. Check your connections and try again.
RIErr0067: Failed to set/clear software breakpoint.
Reprogram and try again.
RIErr0068: Failed while writing to boot FLASH memory.
RIErr0069: Failed while reading boot FLASH memory.
RIErr0070: Failed while writing peripheral memory.
RIErr0071: Failed while reading peripheral memory.
See Section 10.3.1 “Read/Write Error Actions”.
RIErr0072: Unable to send freeze peripheral information.
See Section 10.3.3 “Emulator-to-PC Communication Error Actions”.
RIErr0073: Device is code protected.
The device on which you are attempting to operate (read, program, blank check or
verify) is code protected, i.e., the code cannot be read or modified. Check your
Configuration bits setting for code protection.
To disable code protection, set or clear the appropriate Configuration bits in code or in
the Configuration Bits window (Configure>Configuration Bits
data sheet. Then erase and reprogram the entire device.
RIErr0080: Failed setting shadow bit(s).
A file register read or write failed. See Section 10.3.2 “Emulator-to-Target
Communication Error Actions”.
), according to the device
10.3 GENERAL CORRECTIVE ACTIONS
These general corrective actions may solve your problem:
• Read/Write Error Actions
• Emulator-to-Target Communication Error Actions
• Emulator-to-PC Communication Error Actions
• Corrupted Installation Actions
• USB Port Communication Error Actions
• Debug Failure Actions
• Internal Error Actions
© 2008 Microchip Technology Inc. DS51616B-page 93
Page 100

MPLAB® REAL ICE™ In-Circuit Emulator User’s Guide
10.3.1 Read/Write Error Actions
If you receive a read or write error:
1. Did you hit Abort? This may produce read/write errors.
2. Try the action again. It may be a one time error.
3. Ensure that the target is powered and at the correct voltage levels for the device.
See the device data sheet for required device voltage levels.
4. Ensure that the emulator-to-target connection is correct (PGC and PGD are
connected.)
5. For write failures, ensure that “Erase all before Program” is checked on the
Program Memory tab of the Settings dialog.
6. Ensure that the cables used are of the correct length.
10.3.2 Emulator-to-Target Communication Error Actions
The MPLAB REAL ICE in-circuit emulator and the target device are out-of-synch with
each other.
1. Select Reset and then try the action again.
2. Ensure that the cable(s) used are of the correct length.
10.3.3 Emulator-to-PC Communication Error Actions
The MPLAB REAL ICE in-circuit emulator and MPLAB IDE are out of synch with each
other.
1. Unplug and then plug in the emulator.
1. Reconnect to the emulator.
2. Try the operation again. It is possible the error was a one time glitch.
3. The version of MPLAB IDE installed may be incorrect for the version of firmware
loaded on the MPLAB REAL ICE in-circuit emulator. Follow the steps outlined in
Section 10.3.4 “Corrupted Installation Actions”.
10.3.4 Corrupted Installation Actions
The problem is most likely caused by a incomplete or corrupted installation of MPLAB
IDE.
1. Uninstall all versions of MPLAB IDE from the PC.
2. Reinstall the desired MPLAB IDE version.
3. If the problem persists contact Microchip.
10.3.5 USB Port Communication Error Actions
The problem is most likely caused by a faulty or non-existent communications port.
1. Reconnect to the MPLAB REAL ICE in-circuit emulator
2. Make sure the emulator is physically connected to the PC on the appropriate
USB port.
3. Make sure the appropriate USB port has been selected in the emulator Settings.
4. Make sure the USB port is not in use by another device.
5. If using a USB hub, make sure it is powered.
6. Make sure the USB drivers are loaded.
10.3.6 Debug Failure Actions
The MPLAB REAL ICE in-circuit emulator was unable to perform a debugging
operation. There are numerous reasons why this might occur.
DS51616B-page 94 © 2008 Microchip Technology Inc.
 Loading...