


Page 1

MPLAB® ICD 4
In-Circuit Debugger
User’s Guide
2017 Microchip Technology Inc. DS50002596A
Page 2

Note the following details of the code protection feature on Microchip devices:
YSTEM
CERTIFIE DBYDNV
== ISO/TS16949==
• Microchip products meet the specification contained in their particular Microchip Data Sheet.
• Microchip believes that its family of products is one of the most secure families of its kind on the market today, when used in the
intended manner and under normal conditions.
• There are dishonest and possibly illegal methods used to breach the code protection feature. All of these methods, to our
knowledge, require using the Microchip products in a manner outside the operating specifications contained in Microchip’s Data
Sheets. Most likely, the person doing so is engaged in theft of intellectual property.
• Microchip is willing to work with the customer who is concerned about the integrity of their code.
• Neither Microchip nor any other semiconductor manufacturer can guarantee the security of their code. Code protection does not
mean that we are guaranteeing the product as “unbreakable.”
Code protection is constantly evolving. We at Microchip are committed to continuously improving the code protection features of our
products. Attempts to break Microchip’s code protection feature may be a violation of the Digital Millennium Copyright Act. If such acts
allow unauthorized access to your software or other copyrighted work, you may have a right to sue for relief under that Act.
Information contained in this publication regarding device
applications and the like is provided only for your convenience
and may be superseded by updates. It is your responsibility to
ensure that your application meets with your specifications.
MICROCHIP MAKES NO REPRESENTATIONS OR
WARRANTIES OF ANY KIND WHETHER EXPRESS OR
IMPLIED, WRITTEN OR ORAL, STATUTORY OR
OTHERWISE, RELATED TO THE INFORMATION,
INCLUDING BUT NOT LIMITED TO ITS CONDITION,
QUALITY, PERFORMANCE, MERCHANTABILITY OR
FITNESS FOR PURPOSE. Microchip disclaims all liability
arising from this information and its use. Use of Microchip
devices in life support and/or safety applications is entirely at
the buyer’s risk, and the buyer agrees to defend, indemnify and
hold harmless Microchip from any and all damages, claims,
suits, or expenses resulting from such use. No licenses are
conveyed, implicitly or otherwise, under any Microchip
intellectual property rights unless otherwise stated.
Microchip received ISO/TS-16949:2009 certification for its worldwide
headquarters, design and wafer fabrication facilities in Chandler and
Tempe, Arizona; Gresham, Oregon and design centers in California
and India. The Company’s quality system processes and procedures
are for its PIC
devices, Serial EEPROMs, microperipherals, nonvolatile memory and
analog products. In addition, Microchip’s quality system for the design
and manufacture of development systems is ISO 9001:2000 certified.
®
MCUs and dsPIC® DSCs, KEELOQ
®
code hopping
Trademarks
The Microchip name and logo, the Microchip logo, AnyRate, AVR,
AVR logo, AVR Freaks, BeaconThings, BitCloud, CryptoMemory,
CryptoRF, dsPIC, FlashFlex, flexPWR, Heldo, JukeBlox, KEELOQ,
KEELOQ logo, Kleer, LANCheck, LINK MD, maXStylus,
maXTouch, MediaLB, megaAVR, MOST, MOST logo, MPLAB,
OptoLyzer, PIC, picoPower, PICSTART, PIC32 logo, Prochip
Designer, QTouch, RightTouch, SAM-BA, SpyNIC, SST, SST
Logo, SuperFlash, tinyAVR, UNI/O, and XMEGA are registered
trademarks of Microchip Technology Incorporated in the U.S.A.
and other countries.
ClockWorks, The Embedded Control Solutions Company,
EtherSynch, Hyper Speed Control, HyperLight Load, IntelliMOS,
mTouch, Precision Edge, and Quiet-Wire are registered
trademarks of Microchip Technology Incorporated in the U.S.A.
Adjacent Key Suppression, AKS, Analog-for-the-Digital Age, Any
Capacitor, AnyIn, AnyOut, BodyCom, chipKIT, chipKIT logo,
CodeGuard, CryptoAuthentication, CryptoCompanion,
CryptoController, dsPICDEM, dsPICDEM.net, Dynamic Average
Matching, DAM, ECAN, EtherGREEN, In-Circuit Serial
Programming, ICSP, Inter-Chip Connectivity, JitterBlocker,
KleerNet, KleerNet logo, Mindi, MiWi, motorBench, MPASM, MPF,
MPLAB Certified logo, MPLIB, MPLINK, MultiTRAK, NetDetach,
Omniscient Code Generation, PICDEM, PICDEM.net, PICkit,
PICtail, PureSilicon, QMatrix, RightTouch logo, REAL ICE, Ripple
Blocker, SAM-ICE, Serial Quad I/O, SMART-I.S., SQI,
SuperSwitcher, SuperSwitcher II, Total Endurance, TSHARC,
USBCheck, VariSense, ViewSpan, WiperLock, Wireless DNA, and
ZENA are trademarks of Microchip Technology Incorporated in the
U.S.A. and other countries.
SQTP is a service mark of Microchip Technology Incorporated in
the U.S.A.
Silicon Storage Technology is a registered trademark of Microchip
Technology Inc. in other countries.
GestIC is a registered trademark of Microchip Technology
Germany II GmbH & Co. KG, a subsidiary of Microchip Technology
Inc., in other countries.
QUALITYMANAGEMENTS
DS50002596A-page 2 2017 Microchip Technology Inc.
ARM and Cortex are registered trademarks of ARM Limited in the
EU and other countries.
All other trademarks mentioned herein are property of their
respective companies.
© 2017, Microchip Technology Incorporated, All Rights Reserved.
ISBN: 978-1-5224-1585-5
Page 3

EU Declaration of Conformity
This declaration of conformity is issued by the manufacturer.
The development/evaluation tool is designed to be used for research and development in a laboratory environment. This
development/evaluation tool is not intended to be a finished appliance, nor is it intended for incorporation into finished appliances that are
made commercially available as single functional units to end users. This development/evaluation tool complies with EU EMC Directive
2004/108/EC and as supported by the European Commission's Guide for the EMC Directive 2004/108/EC (8th February 2010).
This development/evaluation tool complies with EU RoHS2 Directive 2011/65/EU.
This development/evaluation tool, when incorporating wireless and radio-telecom functionality, is in compliance with the essential
requirement and other relevant provisions of the R&TTE Directive 1999/5/EC and the FCC rules as stated in the declaration of conformity
provided in the module datasheet and the module product page available at www.microchip.com.
For information regarding the exclusive, limited warranties applicable to Microchip products, please see Microchip’s standard terms and
conditions of sale, which are printed on our sales documentation and available at www.microchip.com.
Signed for and on behalf of Microchip Technology Inc. at Chandler, Arizona, USA.
Object of Declaration:
Object of Declaration: MPLAB ICD-4 In-Circuit Debugger
2017 Microchip Technology Inc. DS50002596A-page 3
Page 4

MPLAB® ICD 4 User’s Guide
NOTES:
DS50002596A-page 4 2017 Microchip Technology Inc.
Page 5

MPLAB® ICD 4 USER’S GUIDE
Table of Contents
Preface ........................................................................................................................... 7
Part 1 – Getting Started
Chapter 1. About the Debugger
1.1 Introduction ................................................................................................... 13
1.2 MPLAB ICD 4 In-Circuit Debugger Description ............................................ 13
1.3 MPLAB ICD 4 In-Circuit Debugger Advantages ........................................... 14
1.4 MPLAB ICD 4 In-Circuit Debugger Components ......................................... 15
1.5 MPLAB ICD 4 Block Diagram ....................................................................... 16
Chapter 2. Operation
2.1 Introduction ................................................................................................... 17
2.2 Debugger to Target Communication ............................................................ 18
2.3 Target Communication Connections ............................................................ 20
2.4 Debugging .................................................................................................... 22
2.5 Requirements for Debugging ....................................................................... 23
2.6 Programming ................................................................................................ 25
2.7 Resources Used by the Debugger ............................................................... 25
Chapter 3. Debugger Usage
3.1 Introduction ................................................................................................... 27
3.2 Installation and Setup ................................................................................... 27
3.3 Debug Tutorial .............................................................................................. 28
3.4 Quick Debug/Program Reference ................................................................ 28
3.5 Debugger Limitations ................................................................................... 28
3.6 Connecting the Target Board ....................................................................... 29
3.7 Setting Up the Target Board ......................................................................... 30
3.8 Starting and Stopping Debugging ................................................................ 31
3.9 Viewing Processor Memory and Files .......................................................... 31
3.10 Breakpoints and Stopwatch ........................................................................ 32
Part 2 – Troubleshooting
Chapter 4. Troubleshooting First Steps
4.1 Introduction ................................................................................................... 37
4.2 The Five Questions to Answer First ............................................................. 37
4.3 Top Reasons Why You Can’t Debug ........................................................... 38
4.4 Other Things to Consider ............................................................................. 39
2017 Microchip Technology Inc. DS50002596A-page 5
Page 6

MPLAB® ICD 4 User’s Guide
Chapter 5. Frequently Asked Questions (FAQs)
5.1 Introduction ................................................................................................... 41
5.2 How Does It Work? ...................................................................................... 41
5.3 What’s Wrong? ............................................................................................. 42
Chapter 6. Error Messages
6.1 Introduction ................................................................................................... 45
6.2 Specific Error Messages .............................................................................. 45
6.3 General Corrective Actions .......................................................................... 53
6.4 Information Messages .................................................................................. 54
Part 3 – Reference
Appendix A. Debugger Function Summary
A.1 Introduction .................................................................................................. 57
A.2 Debugger Selection and Switching .............................................................. 57
A.3 Debugger Options Selection ........................................................................ 57
Appendix B. Hardware Specification
B.1 Introduction .................................................................................................. 63
B.2 Highlights ..................................................................................................... 63
B.3 USB Port/Communication ............................................................................ 63
B.4 MPLAB ICD 4 In-Circuit Debugger .............................................................. 64
B.5 Standard Communication Hardware ............................................................ 65
B.6 ICD Test Interface Module ........................................................................... 68
B.7 Target Board Considerations ....................................................................... 69
Appendix C. Revision History
Support .........................................................................................................................73
Glossary .......................................................................................................................75
Index .............................................................................................................................95
Worldwide Sales and Service .....................................................................................98
DS50002596A-page 6 2017 Microchip Technology Inc.
Page 7

MPLAB® ICD 4 USER’S GUIDE
Preface
NOTICE TO CUSTOMERS
All documentation becomes dated, and this manual is no exception. Microchip tools and
documentation are constantly evolving to meet customer needs, so some actual dialogs
and/or tool descriptions may differ from those in this document. Please refer to our web site
(www.microchip.com) to obtain the latest documentation available.
Documents are identified with a “DS” number. This number is located on the bottom of each
page, in front of the page number. The numbering convention for the DS number is
“DSXXXXXXXXA”, where “XXXXXXXX” is the document number and “A” is the revision level
of the document.
For the most up-to-date information on development tools, see the MPLAB
Help. Select the Help menu, and then Topics to open a list of available online Help files.
INTRODUCTION
This chapter contains general information that will be useful to know before using the
MPLAB ICD 4 In-Circuit Debugger. Items discussed in this chapter include:
• Document Layout
• Conventions Used in this Guide
• Recommended Reading
®
X IDE online
2017 Microchip Technology Inc. DS50002596A-page 7
Page 8

MPLAB® ICD 4 User’s Guide
DOCUMENT LAYOUT
This document describes how to use the MPLAB ICD 4 In-Circuit Debugger as a
development tool to emulate and debug firmware on a target board, as well as how to
program devices. The document is organized as follows:
Part 1 – Getting Started
• Chapter 1. About the Debugger – What the MPLAB ICD 4 In-Circuit Debugger is
and how it can help you develop your application.
• Chapter 2. Operation – The theory of MPLAB ICD 4 In-Circuit Debugger
operation. Explains configuration options.
• Chapter 3. Debugger Usage – A description of basic debug features available in
MPLAB X IDE when the MPLAB ICD 4 In-Circuit Debugger is chosen as the
debug tool. This includes the debug features for breakpoints and stopwatch.
Part 2 – Troubleshooting
• Chapter 4. Troubleshooting First Steps – The first things you should try if you
are having issues with debugger operation.
• Chapter 5. Frequently Asked Questions (FAQs) – A list of frequently asked
questions, useful for troubleshooting.
• Chapter 6. Error Messages – A list of error messages and suggested
resolutions.
Part 3 – Reference
• Appendix A. Debugger Function Summary – A summary of debugger functions
available in MPLAB X IDE when the MPLAB ICD 4 debugger is chosen as the
debug or program tool.
• Appendix B. Hardware Specification – The hardware and electrical
specifications of the debugger system.
• Appendix C. Revision History
DS50002596A-page 8 2017 Microchip Technology Inc.
Page 9

CONVENTIONS USED IN THIS GUIDE
This manual uses the following documentation conventions:
DOCUMENTATION CONVENTIONS
Description Represents Examples
Arial font:
Italic characters Referenced books MPLAB® IDE User’s Guide
Initial caps A window the Output window
Quotes A field name in a window or
Underlined, italic text with
right angle bracket
Bold characters A dialog button Click OK
N‘Rnnnn A number in verilog format,
Text in angle brackets < > A key on the keyboard Press <Enter>, <F1>
Courier New font:
Plain Courier New Sample source code #define START
Italic Courier New A variable argument file.o, where file can be
Square brackets [ ] Optional arguments mcc18 [options] file
Curly brackets and pipe
character: { | }
Ellipses... Replaces repeated text var_name [,
Preface
Emphasized text ...is the only compiler...
A dialog the Settings dialog
A menu selection select Enable Programmer
“Save project before build”
dialog
A menu path File>Save
A tab Click the Power tab
4‘b0010, 2‘hF1
where N is the total number of
digits, R is the radix and n is a
digit.
Filenames autoexec.bat
File paths c:\mcc18\h
Keywords _asm, _endasm, static
Command-line options -Opa+, -Opa-
Bit values 0, 1
Constants 0xFF, ‘A’
any valid filename
[options]
Choice of mutually exclusive
arguments; an OR selection
Represents code supplied by
user
errorlevel {0|1}
var_name...]
void main (void)
{ ...
}
2017 Microchip Technology Inc. DS50002596A-page 9
Page 10

MPLAB® ICD 4 User’s Guide
RECOMMENDED READING
This user's guide describes how to use MPLAB ICD 4 In-Circuit Debugger. Other useful
documents are listed below. The following Microchip documents are available and
recommended as supplemental reference resources.
Multi-Tool Design Advisory (DS51764)
Please read this first! This document contains important information about
operational issues that should be considered when using the MPLAB ICD 4 with your
target design.
Release Notes for MPLAB ICD 4 In-Circuit Debugger
For the latest information on using MPLAB ICD 4 In-Circuit Debugger, read the notes
under “Release Notes and Support Documentation” on the MPLAB X IDE Start Page.
The release notes contain update information and known issues that may not be
included in this user’s guide.
MPLAB ICD 4 Quick Start Guide Poster (DS50002538A)
This poster shows you how to connect the hardware and install the software for the
MPLAB ICD 4 In-Circuit Debugger using standard communications and a target board.
MPLAB ICD 4 In-Circuit Debugger Online Help File
A comprehensive help file for the debugger is included with MPLAB X IDE. Usage,
troubleshooting and hardware specifications are covered. This help file may be more
up-to-date than the printed documentation.
Processor Extension Pak and Header Specification (DS50001292)
This booklet describes how to install and use headers. Headers are used to better
debug selected devices, without the loss of pins or resources. See also the PEP and
Header online Help file.
Transition Socket Specification (DS51194)
Consult this document for information on transition sockets available for use with
headers.
DS50002596A-page 10 2017 Microchip Technology Inc.
Page 11

MPLAB® ICD 4 USER’S GUIDE
Part 1 – Getting Started
Chapter 1. About the Debugger .................................................................................. 13
Chapter 2. Operation.................................................................................................... 17
Chapter 3. Debugger Usage ........................................................................................ 27
2017 Microchip Technology Inc. DS50002596A-page 11
Page 12

MPLAB® ICD 4 User’s Guide
NOTES:
DS50002596A-page 12 2017 Microchip Technology Inc.
Page 13

MPLAB® ICD 4 USER’S GUIDE
Chapter 1. About the Debugger
1.1 INTRODUCTION
An overview of the MPLAB® ICD 4 In-Circuit Debugger system is provided in this
chapter.
• MPLAB ICD 4 In-Circuit Debugger Description
• MPLAB ICD 4 In-Circuit Debugger Advantages
• MPLAB ICD 4 In-Circuit Debugger Components
• MPLAB ICD 4 Block Diagram
1.2 MPLAB ICD 4 IN-CIRCUIT DEBUGGER DESCRIPTION
The MPLAB ICD 4 In-Circuit Debugger (DV164045) is Microchip’s fastest and most
cost-effective debugging and programming tool for Microchip PIC
(MCUs) and dsPIC
powerful and easy-to-use graphical user interface of MPLAB X Integrated
Development Environment (IDE). The MPLAB ICD 4 is connected to your PC through
a high-speed USB 3.0-compatible interface and is connected to the target with an
RJ-11 connector. The MPLAB ICD 4 also works with JTAG interfaces.
The debugger system executes code like an actual device because it uses a device
with built-in emulation circuitry instead of a special debugger chip. All available features
of a given device are accessible interactively and can be set and modified by the
MPLAB X IDE interface.
The MPLAB ICD 4 In-Circuit Debugger is compatible with any of these platforms:
• Microsoft Windows
• Linux
• Mac OSX™
The MPLAB ICD 4 debugger was developed for debugging embedded processors with
rich debug facilities which differ from conventional system processors in the following
aspects:
• Processors run at maximum speeds
• Capability to incorporate I/O port data input
• Advanced host communication interfaces (Windows, macOS and Linux)
• Advanced communication mediums and protocols
• Faster programming times
• Modular design (testability and maintainability)
In addition to debugger functions, the MPLAB ICD 4 In-Circuit Debugger system also
may be used as a device production programmer.
®
®
Digital Signal Controllers (DSCs). It debugs and programs with the
®
7 or later
®
Microcontrollers
2017 Microchip Technology Inc. DS50002596A-page 13
Page 14

MPLAB® ICD 4 User’s Guide
1.3 MPLAB ICD 4 IN-CIRCUIT DEBUGGER ADVANTAGES
The MPLAB ICD 4 In-Circuit Debugger system provides the following advantages:
Features/Capabilities:
• Connects to computer via high-speed USB 2.0 (480 Mbits/s) cable
• Comes with a standard Microchip debugging connector (RJ-11) and has the
option to use JTAG
• Programs devices using MPLAB X IDE or MPLAB IPE
• Supports multiple breakpoints, stopwatch, and source code file debugging
• Debugs your application on your own hardware in real time
• Sets breakpoints based on internal events
• Monitors internal file registers
• Debugs at full speed
• Configures pin drivers
• Field-upgradeable through an MPLAB X IDE firmware download
• Adds new device support and features by installing the latest version of MPLAB X
IDE (available as a free download at www.microchip.com/mplabx)
• Controls brightness of LEDs
• Includes a test module that can test all communications
Performance/Speed:
• More and faster memory
• A Real-Time Operating System (RTOS)
• No firmware download delays incurred when switching devices
• A 32-bit MCU running at 300 MHz
• A buffer memory of 2 MB
Safety:
• Receive feedback from debugger when external power supply is needed for target
• Supports target supply voltages from 1.2V to 5.5V
• Safely power up to 1A with an optional power supply
• Protection circuitries are added to the probe drivers to guard from power surges
from the target
•V
DD and VPP voltage monitors protect against overvoltage conditions/all lines
have over-current protection
• Programming/debugging pins are physically isolated via relays until voltage is
determined to be safe for connection, programmable resistor value, and direction
(pull-up, pull-down, or nonexistent).
• Controlled programming speed provides flexibility to overcome target board
design issues
• CE and RoHS compliant – conforms to industry standards
DS50002596A-page 14 2017 Microchip Technology Inc.
Page 15

About the Debugger
Mini USB Cable
Indicator
Bar
Modular Cable
to Target Board,
Header or ICD
ICD Test Interface
Board
Test Interface
Board
ICD Test Interface Module
Mini-B USB Cable
Modular Cable
1.4 MPLAB ICD 4 IN-CIRCUIT DEBUGGER COMPONENTS
The components of the MPLAB ICD 4 In-Circuit Debugger system are:
• A puck-shaped MPLAB ICD 4 unit housed in a durable, black case with a brushed
aluminum top which is accented with an LED indicator bar, and a Mini-B USB
connector, an RJ-45 connector, and a power connector
• A Mini-B USB cable to provide communication between the debugger and a
computer, and to provide power from the computer to the debugger
• A 6-inch modular cable (6-pin RJ-11 type) to connect the MPLAB ICD 4 unit to a
header module or target board
• An ICD Test Interface Module (AC164113) to self-test the debugger
FIGURE 1-1: BASIC DEBUGGER SYSTEM
2017 Microchip Technology Inc. DS50002596A-page 15
Additional hardware and accessories may be ordered separately from Microchip Direct
(http://www.microchipdirect.com):
• Power supply (Part Number AC002014) - to provide up to 1A of power to the
target application
• Transition sockets
• ICD headers
• MPLAB processor extension kits
Page 16

MPLAB® ICD 4 User’s Guide
1.5 MPLAB ICD 4 BLOCK DIAGRAM
DS50002596A-page 16 2017 Microchip Technology Inc.
Page 17

2.1 INTRODUCTION
A simplified theory of operation of the MPLAB ICD 4 In-Circuit Debugger system is
provided here. It is intended to provide enough information so that a target board can
be designed that is compatible with the debugger for both debugging and programming
operations. The basic theory of in-circuit debugging and programming is discussed so
that problems, if encountered, are quickly resolved.
• Debugger to Target Communication
• Target Communication Connections
• Debugging
• Requirements for Debugging
• Programming
• Resources Used by the Debugger
MPLAB® ICD 4 USER’S GUIDE
Chapter 2. Operation
DS50002596A-page 17 2017 Microchip Technology Inc.
Page 18

MPLAB® ICD 4 User’s Guide
2.2 DEBUGGER TO TARGET COMMUNICATION
Note: The MPLAB X IDE software must be installed prior to connecting the
MPLAB ICD 4 In-Circuit Debugger.
The debugger is connected to the computer via a USB cable for communication and
debugger power (not target power).
The debugger is connected to the target application for communication and data
collection. Refer to Section B.5.1 “Connecting an RJ-11 Type Cable to an RJ-45 Socket
on MPLAB ICD 4 In-Circuit Debugger” for pinout information.
The power supply (not included) is connected either to the target application (preferred
method) or the debugger to provide power to the target.
The debugger system configurations are discussed in the following sections.
Communication Failure.
Do not connect the hardware before installing the software and
USB drivers.
CAUTION
CAUTION
Debugger or Target Damage.
Do not change hardware connections while the debugger or target
is powered.
2.2.1 Standard ICSP Device Communication
The debugger system can be configured to use standard 6-pin ICSP (modular cable)
communication connection for both programming and debugging functions. The
modular cable can be inserted into either:
•a matching socket at the target, where the target device is on the target board
(Figure 2-1), or
• a standard adapter/header board combo (available as a Processor Extension
Pak), which is then plugged into the target board (Figure 2-2).
Note: Older header boards used a 6-pin (RJ-11 type) modular connector instead
of an 8-pin connector, so these headers may be connected directly to the
debugger.
For more on standard communication, see Section B.5.2 “Standard Communication”.
DS50002596A-page 18 2017 Microchip Technology Inc.
Page 19

Operation
Target Board
Target Device
External Power supplied to either target or debugger.
Debugger
USB
Device with on-board ICE circuitry
Target Board
Transition Socket
Device-ICE
Processor Extension Pak
Standard
Adapter
Header
Device-ICE
ICD Header
OR
External Power supplied to either target or debugger.
USB
Debugger
USB
FIGURE 2-1: STANDARD DEBUGGER SYSTEM – DEVICE WITH ON-BOARD ICE CIRCUITRY
FIGURE 2-2: STANDARD DEBUGGER SYSTEM – ICE DEVICE
2017 Microchip Technology Inc. DS50002596A-page 19
Page 20

MPLAB® ICD 4 User’s Guide
12345
6
Target
Connector
Target
Bottom Side
PC Board
VPP/MCLR
Vss
PGC
V
DD
PGD
Reserved
VDD
VPP/MCLR
PGC
PGD
V
SS
AVDD
AVSS
2
1
5
4
3
User Reset
50K
Interface
Connector
Application
PCB
Device
2.3 TARGET COMMUNICATION CONNECTIONS
2.3.1 Standard Communication Target Connection
Using the RJ-11 connector, the MPLAB ICD 4 In-Circuit Debugger is connected to the
target device with the modular interface (six conductor) cable. The pin numbering for
the connector is shown from the bottom of the target PCB in Figure 2-3.
Note: Cable connections on the debugger and target are mirror images of each
other, i.e., pin 1 on one end of the cable is connected to pin 6 on the other
end of the cable. See Section B.5.3.3 “Modular Cable Specification”.
FIGURE 2-3: STANDARD CONNECTION AT TARGET
2.3.2 Target Connection Circuitry
Figure 2-4 shows the interconnections of the MPLAB ICD 4 In-Circuit Debugger to the
connector on the target board. The diagram also shows the wiring from the connector
to a device on the target PCB. A pull-up resistor (usually around 50 k) connected from
the V
PP/MCLR line to the VDD is recommended so that the line may be strobed low to
reset the device.
FIGURE 2-4: STANDARD CONNECTION TARGET CIRCUITRY
DS50002596A-page 20 2017 Microchip Technology Inc.
Page 21

Operation
2.3.3 Target Power
There are two methods for externally powering the target:
• Externally Powered through Target
• Externally Powered through Debugger
In the following descriptions, only three lines are active and relevant to core debugger
operation: pins 1 (V
shown on Figure 2-4 for completeness.
When providing power to the target device, ensure that the target is not exposed to
voltages higher than the device V
Absolute maximum ratings for the device V
maximum rating conditions for any length of time may affect device reliability.
Functional operation of the device at conditions above the parameters indicated in the
device data sheets specification is not recommended.
See the device data sheet for required device voltage levels and maximum ratings.
2.3.3.1 EXTERNALLY POWERED THROUGH TARGET
The recommended method for powering the target device is an external power supply
connected directly to the target board. In this configuration, target V
debugger to allow level translation for the target low-voltage operation. If the debugger
does not sense voltage on its V
operate.
PP/MCLR), 5 (PGC), and 4 (PGD). Pins 2 (VDD) and 3 (VSS) are
DD rating.
DD must not be exceeded. Exposure to the
DD is sensed by the
DD line (pin 2 of the interface connector), it will not
2.3.3.2 EXTERNALLY POWERED THROUGH DEBUGGER
An alternative method of powering the target device is an external power supply
connected directly to the MPLAB ICD 4. Be aware that you must also select power from
the MPLAB ICD 4 debugger via MPLAB X IDE.
Not all devices have the AV
DD and AVSS lines, but if they are present on the target
device, all must be connected to the appropriate levels in order for the debugger to
operate. They cannot be left floating.
In general, it is recommended that all V
the appropriate levels. Also, devices with a V
DD/AVDD and VSS/AVSS lines be connected to
CAP line (PIC18FXXJ MCUs, for example)
should be connected to the appropriate capacitor or level.
Note: The interconnection is very simple. Any problems experienced are often
caused by other connections or components on these critical lines that
interfere with the operation of the MPLAB ICD 4 In-Circuit Debugger
system, as discussed in the following section.
2017 Microchip Technology Inc. DS50002596A-page 21
Page 22

MPLAB® ICD 4 User’s Guide
No!
No!
No!
No!
VPP/MCLR
PGC
PGD
1
5
4
Interface
Connector
2.3.4 Circuits That Will Prevent the Debugger From Functioning
Figure 2-5 shows the active debugger lines with some components that will prevent the
MPLAB ICD 4 In-Circuit Debugger system from functioning.
FIGURE 2-5: IMPROPER CIRCUIT COMPONENTS
In particular, these guidelines must be followed:
• Do not use pull-ups on PGC/PGD – they could disrupt the voltage levels.
• Do not use capacitors on PGC/PGD – they will prevent fast transitions on data
and clock lines during programming and debugging communications, and slow
programming times.
• Do not use capacitors on MCLR
simple pull-up resistor is generally sufficient.
• Do not use diodes on PGC/PGD – they will prevent bidirectional communication
between the debugger and the target device.
– they will prevent fast transitions of VPP. A
2.4 DEBUGGING
There are two steps to using the MPLAB ICD 4 In-Circuit Debugger system as a
debugger. The first requires that an application is programmed into the target device
(MPLAB ICD 4 can be used for this). The second uses the internal in-circuit debug
hardware of the target Flash device to run and test the application program. These two
steps are directly related to the MPLAB X IDE operations:
1. Programming the code into the target and activating special debug functions
(see the next section for details).
2. Using the debugger to set breakpoints and run.
For more information, refer to the MPLAB X IDE online Help.
If the target device cannot be programmed correctly, the MPLAB ICD 4 In-Circuit
Debugger will not be able to debug it.
For programming, no clock is needed on the target device, but power must be supplied.
When programming, the debugger puts programming levels on V
clock pulses on PGC, and serial data via PGD. To verify that the part has been
programmed correctly, clocks are sent to PGC and data is read back from PGD. This
conforms to the ICSP protocol of the device under development. See the device
programming specification for details.
DS50002596A-page 22 2017 Microchip Technology Inc.
PP/MCLR, sends
Page 23

2.5 REQUIREMENTS FOR DEBUGGING
To debug (set breakpoints, see registers, etc.) with the MPLAB ICD 4 In-Circuit
Debugger system, there are critical elements that must be working correctly:
• The debugger must be connected to a computer. It must be powered by the
computer via the USB cable, and it must be communicating with the MPLAB X
IDE software via the USB cable. See Section 3.3 “Debug Tutorial” for details.
• The target device must have power and a functional, running oscillator. If, for any
reason, the target device does not run, the MPLAB ICD 4 In-Circuit Debugger will
not be able to debug it.
• The target device must have its Configuration words programmed correctly.
These are set using the MPLAB X IDE.
- The oscillator Configuration bits should correspond to RC, XT, etc., depending
on the target design.
- For some devices, the Watchdog Timer is enabled by default and needs to be
disabled.
- The target device must not have code protection enabled.
- The target device must not have table read protection enabled.
- For some devices with more than one PGC/PGD pair, the correct pair needs
to be configured. This only refers to debugging, since programming will work
through any PGC/PGD pair.
When the conditions listed above are met, you may proceed to the following:
• Sequence of Operations Leading to Debugging
• Debugging Details
Operation
2.5.1 Sequence of Operations Leading to Debugging
Given that the Requirements for Debugging are met, these actions can be performed
when the MPLAB ICD 4 In-Circuit Debugger is set as the current tool from the MPLAB
X IDE menu (File>Project Properties
• When Debug>Debug Main Project
programmed into the device’s memory via the ICSP protocol as described at the
beginning of this section.
• A small “debug executive” program is loaded into the memory of the target device.
Since some architectures require that the debug executive must reside in program
memory, the application program must not use this reserved space. Some devices
have special memory areas dedicated to the debug executive. Check your device
data sheet for details.
• Special “in-circuit debug” registers in the target device are enabled by MPLAB X
IDE. These allow the debug executive to be activated by the debugger. For more
information on the device’s reserved resources, see Section 2.7 “Resources Used
by the Debugger”.
• The target device is run in Debug mode.
):
is selected, the application code is
2017 Microchip Technology Inc. DS50002596A-page 23
Page 24

MPLAB® ICD 4 User’s Guide
Program
Memory
File
Registers
Internal
Debug
Registers
VPP/MCLR
PGC
PGD
1
5
4
Executive
Debug
Area Used
Ta rg e t
be
Running
must
for Debug
Executive
to Function
Area
V
DD
Hardware
Stack Shared
by Debug
by Debug
Reserved
for Debug
Executive
MPLAB ICD 4
In-Circuit Debugger
Executive
Executive
2.5.2 Debugging Details
Figure 2-6 illustrates the MPLAB ICD 4 In-Circuit Debugger system when it is ready to
begin debugging.
FIGURE 2-6: MPLAB
DEBUGGING
®
ICD 4 IN-CIRCUIT DEBUGGER READY TO BEGIN
To find out whether an application program will run correctly, a breakpoint is typically
set early in the program code. When a breakpoint is set from the user interface of
MPLAB X IDE, the address of the breakpoint is stored in the special internal debug
registers of the target device. Commands on PGC and PGD communicate directly to
these registers to set the breakpoint address.
Next, the Debug>Debug Main Project
function is usually selected in MPLAB X IDE. The
debugger tells the debug executive to run. The target starts from the Reset vector and
executes until the program counter reaches the breakpoint address that was stored
previously in the internal debug registers.
After the instruction at the breakpoint address is executed, the in-circuit debug
mechanism of the target device “fires” and transfers the device’s program counter to
the debug executive (like an interrupt) and the user’s application is effectively halted.
The debugger communicates with the debug executive via PGC and PGD, gets the
breakpoint status information, and sends it back to MPLAB X IDE. MPLAB X IDE then
sends a series of queries to the debugger to get information about the target device,
i.e., file register contents and the state of the CPU. These queries are performed by the
debug executive.
The debug executive runs like an application in program memory. It uses some
locations on the stack for its temporary variables. If the device does not run, for
whatever reason (no oscillator, faulty power supply connection, shorts on the target
board, etc.), then the debug executive cannot communicate to the MPLAB ICD 4
In-Circuit Debugger, and MPLAB X IDE will issue an error message.
DS50002596A-page 24 2017 Microchip Technology Inc.
Page 25

Another way to set a breakpoint is to select Debug>Pause. This toggles the PGC and
PGD lines so that the in-circuit debug mechanism of the target device switches the
Program Counter from the user’s code in program memory to the debug executive.
Again, the target application program is effectively halted, and MPLAB X IDE uses the
debugger communications with the debug executive to interrogate the state of the
target device.
2.6 PROGRAMMING
Use the MPLAB ICD 4 as a programmer to program a non -ICE/-ICD device, i.e., a
device not on a header board. Set the MPLAB ICD 4 In-Circuit Debugger as the current
tool (File>Project Properties
• When Run>Run Main Project
the device’s memory via the ICSP protocol. No clock is required while programming, and all modes of the processor can be programmed – including code protect, Watchdog Timer enabled, and table read protect.
• A small “program executive” program may be loaded into the high area of
program memory for some target devices. This increases programming speeds
for devices with large memories.
• Special “in-circuit debug” registers in the target device are disabled by MPLAB X
IDE, along with all debug features. This means that a breakpoint cannot be set,
and register contents cannot be seen or altered.
• The target device is run in Release mode. As a programmer, the debugger can
only toggle the MCLR
Operation
) to perform these actions:
is selected, the application code is programmed into
line to Reset and start the target device.
2.7 RESOURCES USED BY THE DEBUGGER
For a complete list of resources used by the debugger for your device, see the online
Help file in MPLAB X IDE for the MPLAB ICD 4 In-Circuit Debugger. From the MPLAB
X IDE “Learn & Discover” page, click on Users Guide & Release Notes, then click on
the link for the “Reserved Resources for MPLAB ICD 4.”
2017 Microchip Technology Inc. DS50002596A-page 25
Page 26

MPLAB® ICD 4 User’s Guide
NOTES:
DS50002596A-page 26 2017 Microchip Technology Inc.
Page 27

Chapter 3. Debugger Usage
3.1 INTRODUCTION
The following topics are discussed regarding how to install and use the MPLAB ICD 4
In-Circuit Debugger.
• Installation and Setup
• Debug Tutorial
• Quick Debug/Program Reference
• Debugger Limitations
• Connecting the Target Board
• Setting Up the Target Board
• Starting and Stopping Debugging
• Viewing Processor Memory and Files
• Breakpoints and Stopwatch
3.2 INSTALLATION AND SETUP
Refer to the Help file “Getting Started with MPLAB X IDE” for details on installing the
IDE and setting up the debugger to work with it.
In summary:
1. Install MPLAB X IDE (http://www.microchip.com/mplab/mplab-x-ide).
A tutorial is available in the MPLAB X IDE online Help that is accessible from the
main menu bar Help>Tool Help Contents>MPLAB X IDE Help
2. Connect the MPLAB ICD 4 to the computer and allow the default USB drivers to
install. For more information on target connections, see Chapter 2. “Operation”.
MPLAB® ICD 4 USER’S GUIDE
.
Note: The debugger cannot power a target board. An external power supply
must be used. See Section 3.7.3 “Powering the Target Board”.
3. Select which language toolsuite/compiler you want to use for development and
install it on your computer.
4. Launch MPLAB X IDE.
5. Use the New Project wizard (File>New Project
6. Use the Project Properties dialog (File>Project Properties
7. Use the Project Properties dialog (File/Project Properties<Hardware Tool>
select the “ICD 4” tool and set up tool options for programming.
8. Run the project (build and run) from Run>Run Project
2017 Microchip Technology Inc. DS50002596A-page 27
) to create a new project.
) to set up options.
) to
.
Page 28

MPLAB® ICD 4 User’s Guide
Items of note are:
1. Each debugger contains a unique identifier which, when first installed, will be
recognized by the operating system, regardless of which computer USB port is
used.
2. MPLAB X IDE operation connects to the hardware tool at runtime (Run or Debug
Run). Configuration bits can only be viewed in the Configuration Bits window. To
set them in code, select Window>PIC Memory Views
tion Bits” from the Memory drop list, and select “Read/Write” from the Format
drop list to enable access to the settings.
3.3 DEBUG TUTORIAL
Refer to the MPLAB X IDE Help file titled “Getting Started with MPLAB X IDE,” and
navigate through the “Tutorial” to the “Running and Debugging Code.”
3.4 QUICK DEBUG/PROGRAM REFERENCE
The following table is a quick reference for using the MPLAB ICD 4 In-Circuit Debugger
as either a debugging or programming tool.
TABLE 3-1: DEBUG VS. PROGRAM OPERATION
Item Debug Program
Needed Hardware A computer and target application (Microchip demo board or your own design)
Debugger, USB cable, and power supply
Device with on-board debug circuitry or debug
header with special -ICE device
MPLAB X IDE
selection
Program Operation Programs application code into the device.
Debug Features
Available
Serial Quick-Time
Programming (SQTP)
Command-line
Operation
Project Properties, ICD 4 as Hardware Tool
Debug>Debug Main Project
Depending on the selections on the Project
Properties dialog, this can be any range of program
memory. In addition, a small debug executive is
placed in program memory and other debug
resources are reserved.
All for device – breakpoints, etc. N/A
N/A Use the MPLAB IPE to generate the
N/A Use IPECMD, found by default in:
Device (with or without on-board debug
circuitry)
Program Target Project toolbar button
Programs application code into the
device. Depending on the selections on
the Project Properties dialog, this can
be any range of program memory.
SQTP file.
C:\Program Files\Microchip\
MPLABX\<vx.xx>\mplab_ipe.
. Then, select “Configura-
3.5 DEBUGGER LIMITATIONS
For a complete list of debugger limitations for your device, see the online Help file in
MPLAB X IDE for the MPLAB ICD 4 In-Circuit Debugger.
DS50002596A-page 28 2017 Microchip Technology Inc.
Page 29

3.6 CONNECTING THE TARGET BOARD
Mini-B USB
3
From Power Supply*
Target
Board
1
From Computer
Communications Cable
From Target
2
*Optionally, the Microchip power supply (AC002014)
From Power Supply
3
Mini-B USB
Ta rg e t
Board
1
From Computer
Communications Cable
From Target
2
A connection is built in to select the type of communication with the target. See
Section 2.2 “Debugger to Target Communication” for more details and a diagram.
1. Connect the Mini-B USB cable between the debugger and the computer, if not
already connected.
2. Attach the communication cable(s) between debugger and target.
3. Connect power to target or debugger.
Note: In MPLAB X IDE, you can select the source from which to power the target.
In order to power the target from the MPLAB ICD 4 debugger, the power
supply must be connected to the debugger.
FIGURE 3-1: POWERING TARGET DIRECTLY
Debugger Usage
FIGURE 3-2: POWERING TARGET THROUGH DEBUGGER
2017 Microchip Technology Inc. DS50002596A-page 29
Page 30

MPLAB® ICD 4 User’s Guide
3.7 SETTING UP THE TARGET BOARD
The target must be set up for the type of target device to be used.
3.7.1 Using Production Devices
For production devices, the debugger may be connected directly to the target board.
The device on the target board must have built-in debug circuitry in order to debug with
the MPLAB ICD 4 In-Circuit Debugger. Consult the device data sheet to see whether
the device has the necessary debug circuitry, i.e., it should have a “Background
Debugger Enable” Configuration bit.
The target board must have a connector to accommodate the communications chosen
for the debugger. For connection information, see Section 2.2 “Debugger to Target
Communication”.
3.7.2 Using ICE Devices
For ICE devices, an ICE header board is required. The header board contains the
hardware that is necessary to emulate a specific device or family of devices. For more
information on ICE headers, see the “Processor Extension Pak and Header
Specification” (DS50001292).
A transition socket is used with the ICE header to connect the header to the target
board. Transition sockets are available in various styles to allow a common header to
be connected to one of the supported surface mount package styles. For more
information on transition sockets, see the “Transition Socket Specification” (DS51194).
Header board layout will be different for headers or processor extension packs. For
connection information, see Section 2.2 “Debugger to Target Communication”.
3.7.3 Powering the Target Board
There are two configurations for powering MPLAB ICD 4 and the target board:
• The target board is powered via an external power supply.
• The target board is powered through the MPLAB ICD 4, which is connected to an
external power supply.
An external power supply, Part Number AC002014, can be purchased from Microchip
Direct (www.microchipdirect.com).
If you have not already done so, connect the MPLAB ICD 4 to the target board using
the appropriate cables (see Section 3.6 “Connecting the Target Board”). Then, power
the target board.
DS50002596A-page 30 2017 Microchip Technology Inc.
Page 31

3.8 STARTING AND STOPPING DEBUGGING
To debug an application in MPLAB X IDE, you must create a project that contains your
source code so that the code may be built, programmed into your device, and executed
as specified below:
• To run your code, select either Debug>Debug Main Project
Project from the Run toolbar.
• To halt your code, select either Debug>Pause
• To run your code again, select either Debug>Continue
Debug toolbar.
• To step through your code, select either Debug>Step Into
Debug toolbar. Be careful not to step into a Sleep instruction or you will have to
perform a processor Reset to resume emulation.
• To step over a line of code, select either Debug>Step Over
Debug toolbar.
• To end code execution, select either Debug>Finish Debugger Session
Debugger Session from the Debug toolbar.
• To perform a processor Reset on your code, select either Debug>Reset
from the Debug toolbar.
Additional Resets, such as POR/BOR, MCLR
depending on the device.
Debugger Usage
or Debug Main
or Pause from the Debug toolbar.
or Continue from the
or Step Into from the
or Step Over from the
or Finish
or Reset
, and System, may be available,
3.9 VIEWING PROCESSOR MEMORY AND FILES
MPLAB X IDE provides several windows for viewing debug and memory information.
These are selectable from the Window menu. See MPLAB X IDE online Help for more
information on using these windows.
• Window>PIC Memory Views
Select from RAM, Flash, special function registers (SFRs), CPU, and Configuration bits.
• Window>Debugging
call stack, breakpoints, and stopwatch.
To view your source code, find the source code file you wish to view in the Projects window and double-click to open it in a Files window. Code in this window is color-coded
according to the processor and build tool that you have selected. To change the style
of color-coding, select Tools>Options
For more on the Editor, see NetBeans Help, IDE Basics>Basic File Features
- view debug information. Select from variables, watches,
- view data (RAM) and code (ROM) device memory.
, Fonts & Colors, Syntax tab.
.
2017 Microchip Technology Inc. DS50002596A-page 31
Page 32

MPLAB® ICD 4 User’s Guide
3.10 BREAKPOINTS AND STOPWATCH
Use breakpoints to halt code execution at specific lines in your code. Use the stopwatch
with breakpoints to time code execution.
• Breakpoint Resources
• Hardware or Software Breakpoint Selection
• Breakpoint and Stopwatch Usage
3.10.1 Breakpoint Resources
In 16-bit devices, breakpoints, data captures, and runtime watches use the same
resources. Therefore, the available number of breakpoints is actually the available
number of combined breakpoints/triggers.
In 32-bit devices, breakpoints use different resources than data captures and runtime
watches. Therefore, the available number of breakpoints is independent of the
available number of triggers.
The number of hardware and software breakpoints available and/or used is displayed
in the Dashboard window (Window>Dashboard
documentation for more on this feature. Not all devices have software breakpoints.
For limitations on breakpoint operation, including the general number of hardware
breakpoints per device, and hardware breakpoint skidding amounts, see the online
Help file in MPLAB X IDE for the MPLAB ICD 4 In-Circuit Debugger limitations.
). See the MPLAB X IDE
3.10.2 Hardware or Software Breakpoint Selection
To select hardware or software breakpoints:
1. Select your project in the Projects window. Then, select F
or right click and select “Properties”.
2. In the Project Properties dialog, select “ICD4” under “Categories”.
3. Under “Option Categories,” select “Debug Options”.
4. Check “Use software breakpoints” to use software breakpoints. Uncheck to use
hardware breakpoints.
Note: Using software breakpoints for debugging impacts device endurance.
Therefore, it is recommended that devices used in this manner are not
be used as production parts.
To help you decide which type of breakpoints to use (hardware or software), the
following table compares the features of each.
TABLE 3-2: HARDWARE VS. SOFTWARE BREAKPOINTS
Feature Hardware Breakpoints Software Breakpoints
Number of breakpoints Limited Unlimited
Breakpoints written to* Internal Debug Registers Flash Program Memory
Breakpoints applied to** Program Memory/Data Memory Program Memory only
Time to set breakpoints Minimal Dependent on oscillator
Breakpoint skidding Most devices. See the online Help,
Limitations section, for details.
* Where information about the breakpoint is written in the device.
** What kind of device feature applies to the breakpoint. This is where the breakpoint is set.
ile>Project Properties
speed, time to program Flash
Memory, and page size
No
DS50002596A-page 32 2017 Microchip Technology Inc.
Page 33

Debugger Usage
3.10.3 Breakpoint and Stopwatch Usage
Breakpoints halt execution of code. To determine the time between the breakpoints,
use the stopwatch.
Refer to the MPLAB X IDE online Help for instructions on how to set up and use breakpoints and the stopwatch.
2017 Microchip Technology Inc. DS50002596A-page 33
Page 34

MPLAB® ICD 4 User’s Guide
NOTES:
DS50002596A-page 34 2017 Microchip Technology Inc.
Page 35

MPLAB® ICD 4 USER’S GUIDE
Part 2 – Troubleshooting
Chapter 4. Troubleshooting First Steps..................................................................... 37
Chapter 5. Frequently Asked Questions (FAQs)....................................................... 41
Chapter 6. Error Messages.......................................................................................... 45
DS50002596A-page 35 2017 Microchip Technology Inc.
Page 36

MPLAB® ICD 4 User’s Guide
NOTES:
DS50002596A-page 36 2017 Microchip Technology Inc.
Page 37

MPLAB® ICD 4 USER’S GUIDE
Chapter 4. Troubleshooting First Steps
4.1 INTRODUCTION
If you are having problems with MPLAB ICD 4 In-Circuit Debugger operation, start
here.
• The Five Questions to Answer First
• Top Reasons Why You Can’t Debug
• Other Things to Consider
4.2 THE FIVE QUESTIONS TO ANSWER FIRST
1. Which device are you working with?
Often an upgrade to a newer version of MPLAB X IDE is required to support
newer devices.
2. Are you using a Microchip demo board or one of your own design?
Have you followed the guidelines for resistors/capacitors for communications
connections? See Chapter 2. “Operation”.
3. Have you powered the target?
An external power supply must be connected to the target (preferred) or the
debugger.
4. Are you using a USB hub in your set up? Is it powered?
If you continue to have problems, try using the debugger without the hub
(plugged directly into the computer).
5. Are you using the standard communication cable (RJ-11 type) shipped with the
debugger?
If you have made a longer cable, it could cause communications errors.
DS50002596A-page 37 2017 Microchip Technology Inc.
Page 38

MPLAB® ICD 4 User’s Guide
4.3 TOP REASONS WHY YOU CAN’T DEBUG
1. Oscillator not working. Check your Configuration bits setting for the oscillator.
If you are using an external oscillator, try using an internal oscillator. If you are
using an internal PLL, make sure your PLL settings are correct.
2. No power to the target board. Check the power cable connection.
3. Incorrect V
device. See the device programming specification for details.
4. Physical disconnect. The debugger has become physically disconnected from
the computer and/or the target board. Check the communications cables’
connections.
5. Communications lost. Debugger to PC communication has somehow been
interrupted. Reconnect to the debugger in MPLAB X IDE.
6. Device not seated. The device is not properly seated on the target board. If the
debugger is properly connected and the target board is powered, but the device
is absent or not plugged in completely, you may get the message:
Target Device ID (0x0) does not match expected Device ID (0x%x)
where %x is the expected device ID.
7. Device is code-protected. Check your Configuration bits settings for code
protection.
8. No device debug circuitry. You are trying to debug a production device that
does not have debugging capabilities. Use a debug header instead. (See the
“Processor Extension Pak and Debug Header Specification” (DS50001292) in
“Recommended Reading”.)
9. Application code corrupted. The target application has become corrupted or
contains errors. Try rebuilding and reprogramming the target application. Then
initiate a Power-On-Reset of the target.
10. Incorrect programming pins. You do not have the correct PGC/PGD pin pairs
programmed in your Configuration bits (for devices with multiple PGC/PGD pin
pairs).
DD voltage. The VDD voltage is outside the specifications for this
11. Additional setup required. Other configuration settings are interfering with
debugging. Any configuration setting that would prevent the target from
executing code will also prevent the emulator from putting the code into Debug
mode.
12. Incorrect brown-out voltage. Brown-out Detect voltage is greater than the
operating voltage V
debugged.
13. Incorrect connections. You have not followed the guidelines in Chapter 2.
“Operation”.
DD. This means the device is in Reset and cannot be
DS50002596A-page 38 2017 Microchip Technology Inc.
Page 39
4.4 OTHER THINGS TO CONSIDER
1. Use the ICD Test Interface module to verify that the debugger is functioning
correctly (Section B.6 “ICD Test Interface Module”).
2. There may be a problem programming in general. As a test, switch to Run mode
(Run>Run Project
(e.g., a program to blink an LED). If the program will not run, then you know that
something is wrong with the target setup.
3. It is possible that the target device has been damaged in some way (e.g., over
current). Development environments are notoriously hostile to components.
Consider trying another target device.
4. Review debugger operation to ensure proper application setup. For more
information, see Chapter 2. “Operation”.
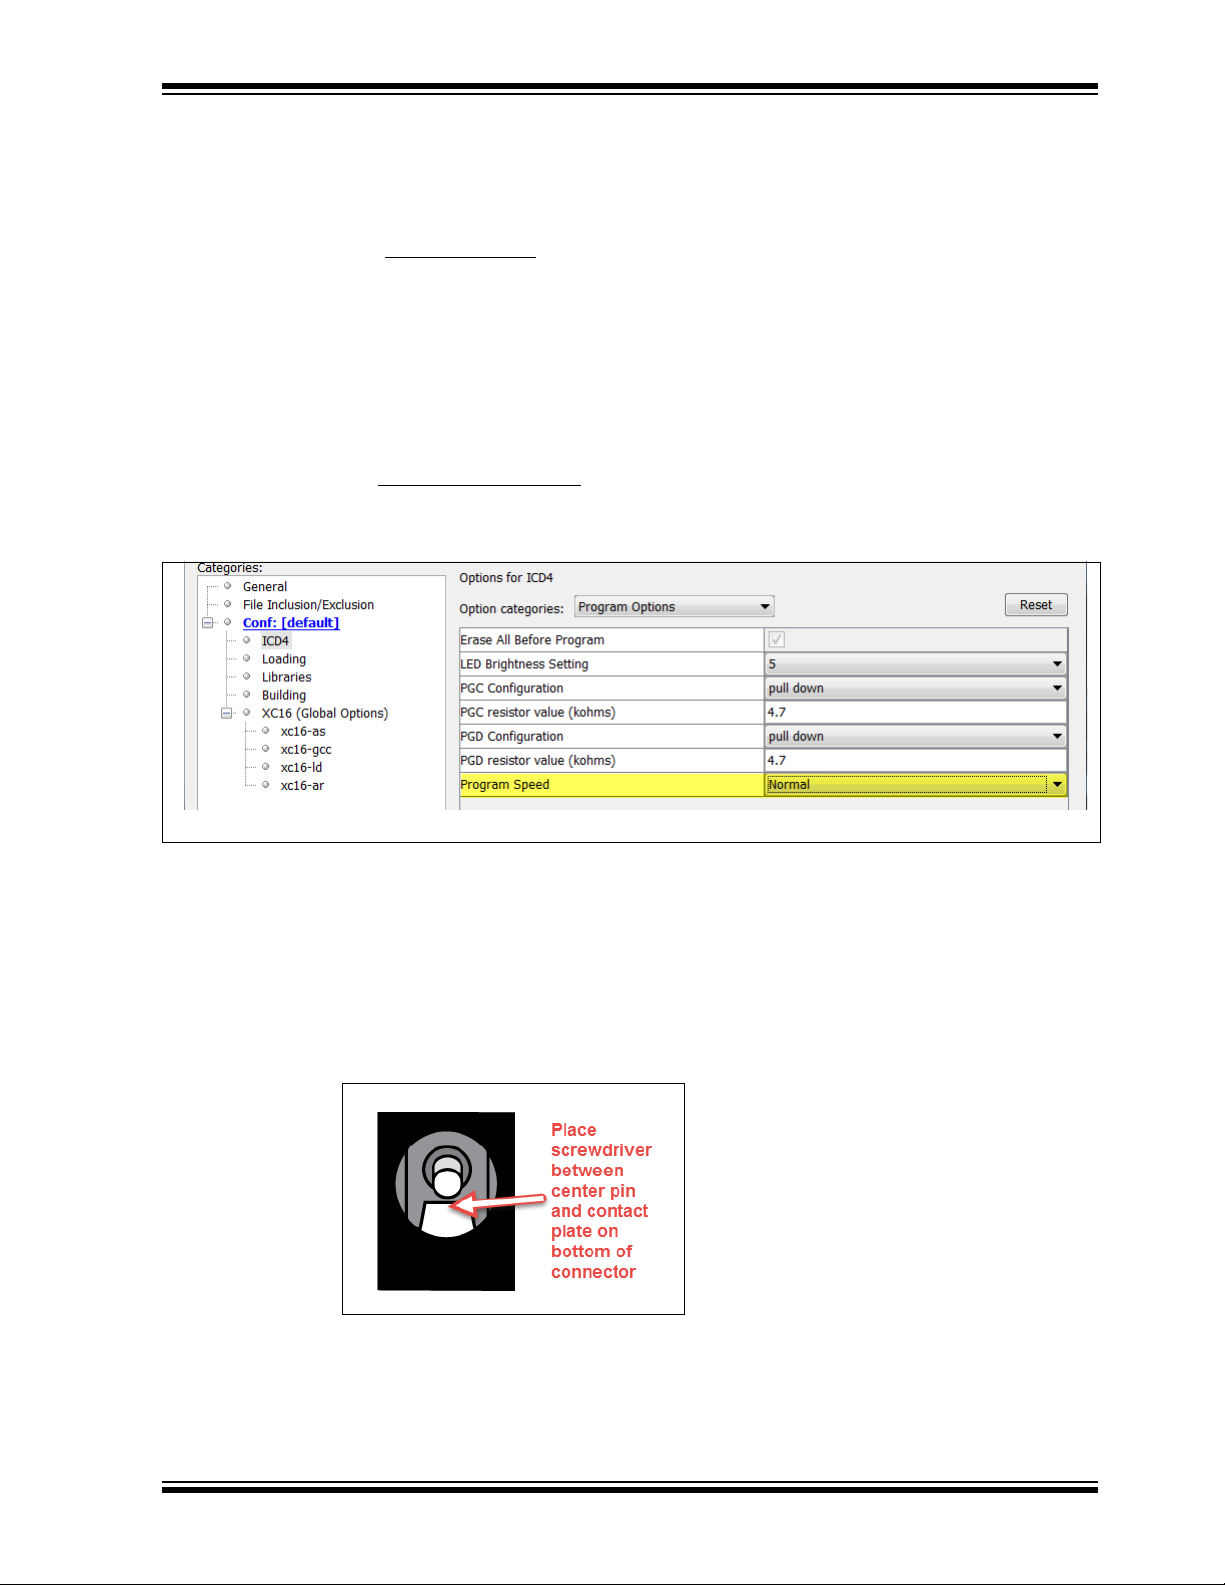
5. Your program speed may be set too high for your circuit. In MPLAB X IDE, go to
File>Project Properties
speed from the drop-down menu. The default is Normal.
FIGURE 4-1: PROGRAM SPEED OPTION
) and program the target with the simplest application possible
, Program Options, Program Speed and select a slower
Troubleshooting First Steps
6. If the MPLAB X IDE or MPLAB IPE cannot communicate with the MPLAB ICD 4
debugger (LEDs continually alternate between purple and blue), perform the following steps to force the debugger into Boatload mode:
a) Disconnect the Mini-B USB cable from the debugger.
b) Perform one of the following two options:
- If the recommended Microchip 9V power supply (AC002014) is
connected to the MPLAB ICD 4, unplug the power supply only from the
wall or power strip.
.
- If the recommended power supply is not being used, make sure no
power is connected to the debugger. Then, insert a small metal
screwdriver into the 9V female barrel connector so that it contacts the
center pin and the metal tang at the bottom of the jack.
2017 Microchip Technology Inc. DS50002596A-page 39
Page 40

MPLAB® ICD 4 User’s Guide
c) Next, plug the Mini-B USB cable back into the debugger.
d) As soon as both LEDs flash quickly, immediately unplug the power cable
from the debugger or remove the screwdriver (within 1 second). If the LEDs
are steady on purple, proceed to the next step. If the LEDs are blue, you did
not perform the action fast enough and must repeat the process starting at
step a).
e) Try to reestablish communication with the MPLAB X IDE or MPLAB IPE. If
successful, the latest firmware is automatically downloaded and the debugger goes through a built-in self-test. When complete, the LEDs are steady on
blue and the debugger is ready for operation.
Refer to Section B.4.2 “Indicator Lights (LEDs)” for more information on LED
modes and bootloader errors.
If the problem persists, contact Microchip Support.
DS50002596A-page 40 2017 Microchip Technology Inc.
Page 41

Chapter 5. Frequently Asked Questions (FAQs)
5.1 INTRODUCTION
Look here for answers to frequently asked questions about the MPLAB ICD 4 In-Circuit
Debugger system.
• How Does It Work?
• What’s Wrong?
5.2 HOW DOES IT WORK?
• What's in the silicon that allows it to communicate with the MPLAB ICD 4
In-Circuit Debugger?
MPLAB ICD 4 In-Circuit Debugger can communicate with Flash silicon via the
ICSP interface. It uses the debug executive located in test memory. For legacy
8-bit devices, the debug executive resides in Program memory.
• How is the throughput of the processor affected by having to run the debug
executive?
The debug executive doesn't run while in Run mode, so there is no throughput
reduction when running your code, i.e., the debugger doesn’t ‘steal’ any cycles
from the target device.
• How does MPLAB X IDE interface with the MPLAB ICD 4 In-Circuit Debugger
to allow more features than older debuggers?
MPLAB ICD 4 In-Circuit Debugger communicates using the debug executive
located in the test area. The debug executive is streamlined for more efficient
communication. The debugger contains an FPGA, large SRAM Buffers (1Mx8),
and a High-Speed USB interface. Program memory image is downloaded and is
contained in the SRAM to allow faster programming. The FPGA in the debugger
serves as an accelerator for interfacing with the device in-circuit debugger
modules.
• On traditional debuggers, the data must come out on the bus in order to perform a complex trigger on that data. Is this also required on the MPLAB ICD
4 In-Circuit Debugger? For example, could I halt, based on a flag going
high?
Traditional debuggers use a special debugger chip (-ME) for monitoring. There is
no -ME with the MPLAB ICD 4 In-Circuit Debugger, so there are no busses to
monitor externally. With the MPLAB ICD 4 In-Circuit Debugger, rather than using
external breakpoints, the built-in breakpoint circuitry of the debug engine is used –
the busses and breakpoint logic are monitored inside the part.
• Does the MPLAB ICD 4 In-Circuit Debugger have complex breakpoints?
Yes. You can break based on a value in a data memory location. You can also do
sequenced breakpoints, where several events have to occur before it breaks.
However, you can only do two sequences. You can also do the AND condition and
do PASS counts.
MPLAB® ICD 4 USER’S GUIDE
DS50002596A-page 41 2017 Microchip Technology Inc.
Page 42

MPLAB® ICD 4 User’s Guide
• What limitations are there with the standard cable?
The standard ICSP-RJ11 cable maximum clock frequency is approximately
15 MHz. Device interrogation during debugging occurs at frequencies below this
rate regardless of the CPU clock rate.
However, some advanced functions are synchronous to the CPU bus cycle (like
instrumented trace and data capture).
During data capture and when the CPU runs at its highest speed (40 MIPS for
example), the actual clock rate through the cable would exceed 15 MHz. In these
instances, trace and data capture cannot run reliably and the ICSP-RJ11 cable
cannot be used.
• Will this slow down the running of the program?
There is no cycle stealing with the MPLAB ICD 4 In-Circuit Debugger. The output
of data is performed by the state machine in the silicon.
• Is it possible to debug a dsPIC DSC running at any speed?
The MPLAB ICD 4 is capable of debugging at any device speed as specified in
the device’s data sheet.
5.3 WHAT’S WRONG?
• Performing a Verify fails after programming the device. Is this a
programming issue?
If Run Main Project is selected, the device will automatically run immediately
after programming. Therefore, if your code changes the flash memory, verification
could fail. To prevent the code from running after programming, select 'Hold in
Reset'.
• My computer went into power-down/hibernate mode, and now my debugger
won’t work. What happened?
When using the debugger for prolonged periods of time, and especially as a
debugger, be sure to disable the Hibernate mode in the Power Options Dialog
window of your computer’s operating system. Go to the Hibernate tab and clear or
uncheck the “Enable hibernation” check box. This will ensure that all
communication is maintained across all the USB subsystem components.
• I set my peripheral to NOT freeze on halt, but it is suddenly freezing. What's
going on?
For dsPIC30F/33F and PIC24F/H devices, a reserved bit in the peripheral control
register (usually either bit 14 or 5) is used as a Freeze bit by the debugger. If you
have performed a write to the entire register, you may have overwritten this bit.
(The bit is user-accessible in Debug mode.)
To avoid this problem, write only to the bits you wish to change for your application
(
BTS, BTC) instead of to the entire register (MOV).
• When using a 16-bit device, an unexpected Reset occurred. How do I
determine what caused it?
Some things to consider:
- To determine a Reset source, check the RCON register.
- Handle traps/interrupts in an Interrupt Service Routine (ISR). You should include
trap.c style code, i.e.,
void __attribute__((__interrupt__)) _OscillatorFail(void);
:
void __attribute__((__interrupt__)) _AltOscillatorFail(void);
:
void __attribute__((__interrupt__)) _OscillatorFail(void)
{
INTCON1bits.OSCFAIL = 0; //Clear the trap flag
DS50002596A-page 42 2017 Microchip Technology Inc.
Page 43

Frequently Asked Questions (FAQs)
while (1);
}
:
void __attribute__((__interrupt__)) _AltOscillatorFail(void)
{
INTCON1bits.OSCFAIL = 0;
while (1);
}
:
- Use ASSERTs. For example: ASSERT (IPL==7)
2017 Microchip Technology Inc. DS50002596A-page 43
Page 44

MPLAB® ICD 4 User’s Guide
NOTES:
DS50002596A-page 44 2017 Microchip Technology Inc.
Page 45

Chapter 6. Error Messages
6.1 INTRODUCTION
The MPLAB ICD 4 In-Circuit Debugger produces various error messages; some are
specific, some are informational, and others can be resolved with general corrective
actions. In general, read any instructions under your error message. If those fail to fix
the problem or if there are no instructions, refer to the following sections.
• Specific Error Messages
• General Corrective Actions
• Information Messages
6.2 SPECIFIC ERROR MESSAGES
6.2.1 Corrupted/Outdated Installation Errors
Failed to download firmware
If the Hex file exists:
• Reconnect and try again.
• If this does not work, the file may be corrupted. Reinstall MPLAB X IDE.
If the Hex file does not exist:
• Reinstall MPLAB IDE X.
MPLAB® ICD 4 USER’S GUIDE
Unable to download debug executive
If you receive this error while attempting to debug:
1. Deselect the debugger as the debug tool.
2. Close your project, and then close MPLAB IDE X.
3. Restart MPLAB IDE X, and re-open your project.
4. Reselect the debugger as the debug tool, and try to program the target device
again.
Unable to download program executive
If you receive this error while attempting to program:
1. Deselect the debugger as the programmer.
2. Close your project, and then close MPLAB IDE X.
3. Restart MPLAB IDE X, and re-open your project.
4. Reselect the debugger as the programmer, and try to program the target device
again.
If these actions fail to fix the problem, see Section 6.3.4 “Corrupted Installation
Actions”.
DS50002596A-page 45 2017 Microchip Technology Inc.
Page 46

MPLAB® ICD 4 User’s Guide
6.2.2 Debug Failure Errors
The target device is not ready for debugging. Please check your configuration bit
settings and program the device before proceeding.
You will receive this message if you try to Run before programming your device. If you
receive this message after trying to Run, or immediately after programming your
device:
The device is code protected.
The device on which you are attempting to operate (read, program, blank check, or
verify) is code protected, i.e., the code cannot be read or modified. Check your
Configuration bits setting for code protection.
Disable code protection, set or clear the appropriate Configuration bits in code or in the
Configuration Bits window according to the device data sheet. Then erase and
reprogram the entire device.
If these actions fail to fix the problem, see Section 6.3.2 “Debugger to Target Commu-
nication Error Actions” and Section 6.3.6 “Debug Failure Actions”.
6.2.3 Miscellaneous Errors
ICD 4 is busy. Please wait for the current operation to finish.
If you receive this error when attempting to deselect the debugger as a debugger or
programmer:
1. Wait—give the debugger time to finish any application tasks. Then, try to deselect the debugger again.
2. Select Halt to stop any running applications. Then, try to deselect the debugger
again.
3. Unplug the debugger from the computer. Then, try to deselect the debugger
again.
4. Shut down MPLAB IDE X.
DS50002596A-page 46 2017 Microchip Technology Inc.
Page 47

Error Messages
6.2.4 List of Error Messages
TABLE 6-1: ALPHABETIZED LIST OF ERROR MESSAGES
AP_VER=Algorithm Plugin Version
AREAS_TO_PROGRAM=The following memory area(s) will be programmed:
AREAS_TO_READ=The following memory area(s) will be read:
AREAS_TO_VERIFY=The following memory area(s) will be verified:
BLANK_CHECK_COMPLETE=Blank check complete, device is blank.
BLANK_CHECKING=Blank Checking...
BOOT_CONFIG_MEMORY=boot config memory
BOOT_VER=Boot Version
BOOTFLASH=boot flash
BP_CANT_B_DELETED_WHEN_RUNNING=software breakpoints cannot be removed while the target is running.
The selected breakpoint will be removed the next time the target halts.
CANT_CREATE_CONTROLLER=Unable to find the tool controller class.
CANT_FIND_FILE=Unable to locate file %s.
CANT_OP_BELOW_LVPTHRESH=The voltage level selected %f, is below the minimum erase voltage of %f. The
operation cannot continue at this voltage level.
CANT_PRESERVE_PGM_MEM=Unable to preserve program memory: Invalid range Start = %08x, End = %08x.
CANT_READ_REGISTERS=Unable to read target register(s).
CANT_READ_SERIALNUM=Unable to read the device serial number.
CANT_REMOVE_SWPS_BUSY=The ICD 4 is currently busy and cannot remove software breakpoints at this time.
CHECK_4_HIGH_VOLTAGE_VPP=CAUTION: Check that the device selected in MPLAB IDE (%s) is the same one
that is physically attached to the debug tool. Selecting a 5V device when a 3.3V device is connected can result in
damage to the device when the debugger checks the device ID. Do you wish to continue?
CHECK_PGM_SPEED=You have set the program speed to %s. The circuit on your board may require you to slow
the speed down. Please change the setting in the tool properties to low and try the operation again.
COMM_PROTOCOL_ERROR=A communication error with the debug tool has occurred. The tool will be reset and
should re-enumerate shortly.
COMMAND_TIME_OUT=ICD 4 has timeout out waiting for a response to command %02x.
CONFIGURATION=configuration
CONIFGURATION_MEMORY=configuration memory
CONNECTION_FAILED=Connection Failed.
CORRUPTED_STREAMING_DATA=Invalid streaming data has been detected. Run time watch or trace data may no
longer be valid. It is recommended that you restart your debug session.
CPM_TO_TARGET_FAILED=An exception occurred during ControlPointMediator.ToTarget().
DATA_FLASH_MEMORY=Data Flash memory
DATA_FLASH=data flash
DEBUG_INFO_PGM_FAILED=Could not enter debug mode because programming the debug information failed.
Invalid combinations of config bits may cause this problem
DEBUG_READ_INFO=Reading the device while in debug mode may take a long time due to the target oscillator
speed. Reducing the range that you'd like to read (under the ICD 4 project properties) can mitigate the situation. The
abort operation can be used to terminate the read operation if necessary.
DEVICE_ID_REVISION=Device Id Revision
DEVICE_ID=Device Id
DEVID_MISMATCH=Target Device ID (0x%x) is an Invalid Device ID. Please check your connections to the Target
Device.
2017 Microchip Technology Inc. DS50002596A-page 47
Page 48

MPLAB® ICD 4 User’s Guide
TABLE 6-1: ALPHABETIZED LIST OF ERROR MESSAGES (CONTINUED)
DISCONNECT_WHILE_BUSY=The tool was disconnected while it was busy.
EEDATA_MEMORY=EEData memory
EEDATA=EEData
EMULATION_MEMORY_READ_WRITE_ERROR=An error occurred while trying to read/write MPLAB's emulation
memory: Address=%08x
END=end
ENSURE_SELF_TEST_READY=Please ensure the RJ-11 cable is connected to the test board before continuing.
ENSURE_SELF_TEST_READY=Please ensure the RJ-11 cable is connected to the test board before continuing.
Would you like to continue?
ENV_ID_GROUP=Device Identification
ERASE_COMPLETE=Erase successful
ERASING=Erasing...
FAILED_2_PGM_DEVICE=Failed to program device
FAILED_CREATING_COM=Unable create communications object (RI4Com).
FAILED_CREATING_DEBUGGER_MODULES=Initialization failed: Failed creating the debugger module
FAILED_ESTABLISHING_COMMUNICATION=Unable to establish tool communications
FAILED_GETTING_DBG_EXEC=A problem occurred while trying to load the debug executive.
FAILED_GETTING_DEVICE_INFO=Initialization failed: Failed while retrieving device database (.pic) information
FAILED_GETTING_EMU_INFO=Initialization failed: Failed getting emulation database information
FAILED_GETTING_HEADER_INFO=Initialization failed: Failed getting header database information
FAILED_GETTING_PGM_EXEC=A problem occurred while trying to load the program executive.
FAILED_GETTING_TEX=Unable to obtain the ToolExecMediator
FAILED_GETTING_TOOL_INFO=Initialization failed: Failed while retrieving tool database (.ri4) information
FAILED_INITING_DATABASE=Initialization failed: Unable to initialize the too database object
FAILED_INITING_DEBUGHANDLER=Initialization failed: Unable to initialize the DebugHandler object
FAILED_PARSING_FILE=Failed to parse firmware file: %s
FAILED_READING_EMULATION_REGS=Failed to read emulation memory.
FAILED_READING_MPLAB_MEMORY=Unable to read %s memory from %0x08 to %0x08.
FAILED_SETTING_SHADOWS=Failed to properly set shadow registers.
FAILED_SETTING_XMIT_EVENTS=Unable to synchronize run time data semaphores.
FAILED_STEPPING=Failed while stepping the target.
FAILED_TO_GET_DEVID=Failed to get Device ID. Please make sure the target device is attached and try the operation again.
FAILED_TO_INIT_TOOL=Failed to initialize ICD 4
FAILED_UPDATING_BP=Failed to update breakpoint:\nFile: %s\naddress: %08x
FAILED_UPDATING_FIRMWARE=Failed to properly update the firmware.
FILE_REGISTER=file register
FIRMWARE_DOWNLOAD_TIMEOUT=REAL ICE 4 timeout out during the firmware download process.
FLASH_DATA_MEMORY=Flash data memory
FLASH_DATA=flash data
FPGA_VER=FPGA Version
FRCINDEBUG_NEEDS_CLOCKSWITCHING=To use FRC in debug mode the clock switching configuration bits setting must be enabled. Please enable clock switching and retry the requested operation.
DS50002596A-page 48 2017 Microchip Technology Inc.
Page 49

Error Messages
TABLE 6-1: ALPHABETIZED LIST OF ERROR MESSAGES (CONTINUED)
FW_DOESNT_SUPPORT_DYNBP=The current ICD 4 firmware does not support setting run time breakpoints for the
selected device. Please download firmware version %02x.%02x.%02x or higher.
GOOD_ID_MISMATCH=Target Device ID (0x%x) is a valid Device ID but does not match the expected Device ID
(0x%x) as selected.
HALTING=Halting...
HIGH=High
HOLDMCLR_FAILED=Hold in reset failed.
IDS_SELF_TEST_BOARD_PASSED=ICD4 is functioning properly. If you are still having problems with your target
circuit please check the Target Board Considerations section of the online help.
IDS_ST_CLKREAD_ERR=Test interface PGC clock line read failure.
IDS_ST_CLKREAD_NO_TEST=Test interface PGC clock line read not tested.
IDS_ST_CLKREAD_SUCCESS=Test interface PGC clock line read succeeded.
IDS_ST_CLKWRITE_ERR=Test interface PGC clock line write failure. Please ensure that the tester is properly
connected.
IDS_ST_CLKWRITE_NO_TEST=Test interface PGC clock line write not tested.
IDS_ST_CLKWRITE_SUCCESS=Test interface PGC clock line write succeeded.
IDS_ST_DATREAD_ERR=Test interface PGD data line read failure.
IDS_ST_DATREAD_NO_TEST=Test interface PGD data line read not tested.
IDS_ST_DATREAD_SUCCESS=Test interface PGD data line read succeeded.
IDS_ST_DATWRITE_ERR=Test interface PGD data line write failure.
IDS_ST_DATWRITE_NO_TEST=Test interface PGD data line write not tested.
IDS_ST_DATWRITE_SUCCESS=Test interface PGD data line write succeeded.
IDS_ST_LVP_ERR=Test interface LVP control line failure.
IDS_ST_LVP_NO_TEST=Test interface LVP control line not tested.
IDS_ST_LVP_SUCCESS=Test interface LVP control line test succeeded.
IDS_ST_MCLR_ERR=Test interface MCLR level failure.
IDS_ST_MCLR_NO_TEST=Test interface MCLR level not tested.
IDS_ST_MCLR_SUCCESS=Test interface MCLR level test succeeded.
IDS_TEST_NOT_COMPLETED=Interface test could not be completed. Please contact your local FAE/CAE to SAR
the unit.
INCOMPATIBLE_FW=The REAL ICE firmware in not compatible with the current version of MPLAB X software.
INVALID_ADDRESS=The operation cannot proceed because the %s address is outside the devices address range
of 0x%08x - 0x%08x.
MEM_RANGE_ERROR_BAD_END_ADDR=Invalid program range end address %s received. Please check the
manual program ranges on the debug tool's, "Memories to Program" property page.
MEM_RANGE_ERROR_BAD_START_ADDR=Invalid program range start address %s received. Please check the
manual program ranges on the debug tool's, "Memories to Program" property page.
MEM_RANGE_ERROR_END_LESSTHAN_START=Invalid program range received: end address %s < start
address %s. Please check the manual program ranges on the debug tool's, "Memories to Program" property page.
MEM_RANGE_ERROR_ENDADDR_NOT_ALIGNED=Invalid program range received: end address %s is not
aligned on a proper 0x%x address boundary. Please check the manual program ranges on the debug tool's,
"Memories to Program" property page.
MEM_RANGE_ERROR_STARTADDR_NOT_ALIGNED=Invalid program range received: start address %s is not
aligned on a proper 0x%x address boundary. Please check the manual program ranges on the debug tool's, "Memories to Program" property page.
2017 Microchip Technology Inc. DS50002596A-page 49
Page 50

MPLAB® ICD 4 User’s Guide
TABLE 6-1: ALPHABETIZED LIST OF ERROR MESSAGES (CONTINUED)
MEM_RANGE_ERROR_UNKNOWN=An unknown error has occurred while trying to validate the user entered
memory ranges.
MEM_RANGE_ERROR_WRONG_DATABASE=Unable to access data object while validating user entered memory
ranges.
MEM_RANGE_OUT_OF_BOUNDS=The selected program range, %s, does not fall within the proper range for the
memory area selected. Please check the manual program ranges on the debug tool's, "Memories to Program"
property page.
MEM_RANGE_STRING_MALFORMED=The memory range(s) entered on the, "Memories to Program" property
page (%s) is not formatted properly.
MISSING_BOOT_CONFIG_PARAMETER=Unable to find boot config start/end address in database.
MUST_SET_LVPBIT_WITH_LVP=The low voltage programming feature requires the LVP configuration bit to be
enabled on the target device. Please enable this configuration bit and try the operation again.
NEW_FIRMWARE=Now Downloading new Firmware for target device: %s
NMMR=NMMR
NO_DYNAMIC_BP_SUPPORT_AT_ALL=The current device does not support the ability to set breakpoints while the
devices is running. The breakpoint will be applied prior to the next time you run the device.
NO_PGM_HANDLER=Cannot program software breakpoints. The program handler has not been initialized.
NORMAL=Normal
OP_FAILED_FROM_CP=The requested operation failed because the device is code protected.
OpenIDE-Module-Name=ICD 4
OPERATION_NOT_SUPPORTED=This operation is not supported for the selected device
OUTPUTWIN_TITLE=ICD 4
PERIPHERAL=Peripheral
POWER_ERROR_NO_9V=The configuration is set for the tool to provide power to the target but the 9V power jack is
not detected. Please ensure the external 9V barrel jack is connected to the tool.
POWER_ERROR_NO_POWER_SRC=The configuration is set for the target board to supply its own power but no
voltage has been detected on VDD. Please ensure you have your target powered up and try again.
POWER_ERROR_POWER_SRC_CONFLICT=The configuration is set for the tool to provide power to the target but
there is voltage already detected on VDD. This is a conflict. Please ensure your target is not supplying voltage to the
tool and try again.
POWER_ERROR_SLOW_DISCHARGE= There seems to be excessive capacitance on VDD causing a slower system discharge and shutdown. Consider minimizing overall capacitance loading or use power from your target to avoid
discharge delays.
POWER_ERROR_UNKNOWN=An unknown power error has occurred."
POWER_ERROR_VDD_TOO_HIGH=The VDD voltage desired is out of range. It exceeds the maximum voltage of
5.5V.
POWER_ERROR_VDD_TOO_LOW=The VDD voltage desired is out of range. It is below the minimum voltage of
1.5V.
POWER_ERROR_VPP_TOO_HIGH=The VPP voltage desired is out of range. It exceeds the maximum voltage of
14.2V.
POWER_ERROR_VPP_TOO_LOW=The VPP voltage desired is out of range. It is below the minimum voltage of
1.5V.
PRESERVE_MEM_RANGE_ERROR_BAD_END_ADDR=Invalid preserve range end address %s received. Please
check the manual program ranges on the debug tool's, "Memories to Program" property page.
PRESERVE_MEM_RANGE_ERROR_BAD_START_ADDR=Invalid preserve range start address %s received.
Please check the manual program ranges on the debug tool's, "Memories to Program" property page.
DS50002596A-page 50 2017 Microchip Technology Inc.
Page 51

Error Messages
TABLE 6-1: ALPHABETIZED LIST OF ERROR MESSAGES (CONTINUED)
PRESERVE_MEM_RANGE_ERROR_END_LESSTHAN_START=Invalid preserve range received: end address %s
< start address %s. Please check the manual program ranges on the debug tool's, "Memories to Program" property
page.
PRESERVE_MEM_RANGE_ERROR_ENDADDR_NOT_ALIGNED=Invalid preserve range received: end address
%s is not aligned on a proper 0x%x address boundary. Please check the manual program ranges on the debug tool's,
"Memories to Program" property page.
PRESERVE_MEM_RANGE_ERROR_STARTADDR_NOT_ALIGNED=Invalid preserve range received: start address
%s is not aligned on a proper 0x%x address boundary. Please check the manual program ranges on the debug tool's,
"Memories to Program" property page.
PRESERVE_MEM_RANGE_ERROR_UNKNOWN=An unknown error has occurred while trying to validate the user
entered preserve ranges.
PRESERVE_MEM_RANGE_ERROR_WRONG_DATABASE=Unable to access data object while validating user
entered memory ranges.
PRESERVE_MEM_RANGE_MEM_NOT_SELECTED=You have selected to preserve an area of memory but have
not selected to program that area. Please check the preserved ranges on the debug tool's, "Memories to Program"
property page, and make sure that any preserved memory is also designated to be programmed.
PRESERVE_MEM_RANGE_OUT_OF_BOUNDS=The selected preserve range, %s, does not fall within the proper
range for the memory area selected. Please check the manual program ranges on the debug tool's, "Memories to
Program" property page.
PRESERVE_MEM_RANGE_STRING_MALFORMED=The preserve memory range(s) entered on the, "Memories to
Program" property page (%s) is not formatted properly.
PRESERVE_MEM_RANGE_STRING_MALFORMED=The preserve memory range(s) entered on the, "Memories to
Program" property page (%s) is not formatted properly.
PRESERVE_MEM_RANGE_WONT_BE_PROGRAMMED=Some or all of the preserve memory ranges (%s)
entered on the, "Memories to Program" property page, do not fall under the indicated program range(s) (%s) for the
memory selected. Please check the preserved ranges on the debug tool's, "Memories to Program" property page.
PROGRAM_COMPLETE=Programming/Verify complete
PROGRAM_MEMORY=program memory
PROGRAM=program
PROGRAMMING_DID_NOT_COMPLETE=Programming did not complete.
READ_COMPLETE=Read complete
READ_DID_NOT_COMPLETE=Read did not complete.
RELEASEMCLR_FAILED=Release from reset failed.
REMOVING_SWBPS_COMPLETE=Removing software breakpoints complete
REMOVING_SWBPS=Removing software breakpoints...
RESET_FAILED=Failed to reset the device
RESETTING=Resetting...
RUN_INTERRUPT_THREAD_SYNCH_ERROR=An internal run error has occurred. It is advised that you restart
your debug session. You may continue running but certain run time features may no longer work properly.
RUN_TARGET_FAILED=Unable to run the target device.
RUNNING=Running
SERIAL_NUM=Serial Number:\n
SETTING_SWBPS=Setting software breakpoints.......
STACK=stack
START_AND_END_ADDR=start address = 0x%x, end address = 0x%x
START=start
TARGET_DETECTED=Target voltage detected
2017 Microchip Technology Inc. DS50002596A-page 51
Page 52

MPLAB® ICD 4 User’s Guide
TABLE 6-1: ALPHABETIZED LIST OF ERROR MESSAGES (CONTINUED)
TARGET_FOUND=Target device %s found.
TARGET_HALTED=Target Halted
TARGET_NOT_READY_4_DEBUG=The target device is not ready for debugging. Please check your configuration
bit settings and program the device before proceeding. The most common causes for this failure are oscillator and/or
PGC/PGD settings.
TARGET_VDD=Target VDD:
TEST=test
TOOL_IS_BUSY=ICD 4 is busy. Please wait for the current operation to finish.
TOOL_VDD=VDD:
TOOL_VPP=VPP:
UNABLE_TO_OBTAIN_RESET_VECTOR=ICD 4 was unable to retrieve the reset vector address. This indicates that
no _reset symbol has been defined and may prevent the device from starting up properly.
UNKNOWN_MEMTYPE=Unknown memory type
UNLOAD_WHILE_BUSY=ICD 4 was unloaded while still busy. Please unplug and reconnect the USB cable before
using ICD 4 again.
UPDATING_APP=Updating firmware application...
UPDATING_BOOTLOADER=Updating firmware bootloader...
UPDATING_FPGA=Updating firmware FPGA...
USE_LVP_PROGRAMMING=NOTE: If you would like to program this device using low voltage programming, select
Cancel on this dialog. Then go to the Real ICE node of the project properties and check the Enable Low Voltage
Programming check box of the Program Options Option Category pane (low voltage programming is not valid for
debugging operations).
USERID_MEMORY=User Id Memory
USERID=user Id
VERIFY_COMPLETE=Verification successful.
VERIFY_FAILED=Verify failed
VERSIONS=Versions
VOLTAGES=Voltages
WOULD_YOU_LIKE_TO_CONTINUE=Would you like to continue?
DS50002596A-page 52 2017 Microchip Technology Inc.
Page 53

6.3 GENERAL CORRECTIVE ACTIONS
These general corrective actions may solve your problem:
• Read/Write Error Actions
• Debugger to Target Communication Error Actions
• Debugger to Computer Communication Error Actions
• Corrupted Installation Actions
• USB Port Communication Error Actions
• Debug Failure Actions
• Internal Error Actions
6.3.1 Read/Write Error Actions
If you receive a read or write error:
1. Did you hit Abort? This may produce read/write errors.
2. Try the action again. It may be a one-time error.
3. Ensure that the target is powered and at the correct voltage levels for the device.
See the device data sheet for required device voltage levels.
4. Ensure that the debugger-to-target connection is correct (PGC and PGD are
connected.)
5. For write failures, ensure that “Erase all before Program” is checked on the
Program Memory tab of the Settings dialog.
6. Ensure that the cable(s) are of the correct length.
Error Messages
6.3.2 Debugger to Target Communication Error Actions
If the MPLAB ICD 4 In-Circuit Debugger and the target device are not communicating
with each other.
1. Select Reset and then try the action again.
2. Ensure that the cable(s) are of the correct length.
6.3.3 Debugger to Computer Communication Error Actions
If the MPLAB ICD 4 In-Circuit Debugger and MPLAB IDE X are not communicating with
each other.
1. Unplug, and then plug in, the debugger.
1. Reconnect to the debugger.
2. Try the operation again. It is possible the error was a one-time event.
3. The version of MPLAB IDE X installed may be incorrect for the version of firm-
ware loaded on the MPLAB ICD 4 In-Circuit Debugger. Follow the steps outlined
in Section 6.3.4 “Corrupted Installation Actions”.
4. There may be an issue with the computer USB port. See Section 6.3.5 “USB Port
Communication Error Actions”.
6.3.4 Corrupted Installation Actions
The problem is most likely caused by a incomplete or corrupted installation of MPLAB
IDE X.
1. Uninstall all versions of MPLAB IDE X from the computer.
2. Reinstall the desired MPLAB IDE X version.
3. If the problem persists, contact Microchip Support.
2017 Microchip Technology Inc. DS50002596A-page 53
Page 54

MPLAB® ICD 4 User’s Guide
6.3.5 USB Port Communication Error Actions
The problem is most likely caused by a faulty or non-existent communications port.
1. Reconnect to the MPLAB ICD 4 In-Circuit Debugger.
2. Make sure the debugger is physically connected to the computer on the
appropriate USB port.
3. Make sure the appropriate USB port has been selected in the debugger Settings.
4. Make sure the USB port is not in use by another device.
5. If using a USB hub, make sure it is powered.
6. Make sure the USB drivers are loaded.
6.3.6 Debug Failure Actions
The MPLAB ICD 4 In-Circuit Debugger was unable to perform a debugging operation.
There are numerous reasons why this might occur. See Chapter 4. “Troubleshooting
First Steps”.
6.3.7 Internal Error Actions
Internal errors are not expected and should not happen. They are used for internal
Microchip development.
The most likely cause is a corrupted installation (Section 6.3.4 “Corrupted Installation
Actions”).
Another likely cause is exhausted system resources.
1. Try rebooting your system to free up memory.
2. Make sure you have a reasonable amount of free space on your hard drive (and
that it is not overly fragmented).
If the problem persists, contact Microchip Support.
6.4 INFORMATION MESSAGES
MPLAB ICD 4 In-Circuit Debugger informational messages are listed below:
ICD4Info0001: ICD4 is functioning properly. If you are still having problems with
your target circuit please check the Target Board Considerations section of the
online Help.
See Section B.7 “Target Board Considerations”.
DS50002596A-page 54 2017 Microchip Technology Inc.
Page 55

MPLAB® ICD 4 USER’S GUIDE
Part 3 – Reference
Appendix A. Debugger Function Summary............................................................... 57
Appendix B. Hardware Specification.......................................................................... 63
Appendix C. Revision History..................................................................................... 71
DS50002596A-page 55 2017 Microchip Technology Inc.
Page 56

MPLAB® ICD 4 User’s Guide
NOTES:
DS50002596A-page 56 2017 Microchip Technology Inc.
Page 57

MPLAB® ICD 4 USER’S GUIDE
Appendix A. Debugger Function Summary
A.1 INTRODUCTION
A summary of the MPLAB ICD 4 In-Circuit Debugger functions are summarized below.
• Debugger Selection and Switching
• Debugger Options Selection
A.2 DEBUGGER SELECTION AND SWITCHING
Use the Project Properties dialog to select or switch debuggers for a project. To switch
you must have more than one MPLAB ICD 4 In-Circuit Debugger connected to your
computer. MPLAB X IDE will differentiate between the two by displaying two different
serial numbers.
To select or change the debugger used for a project:
1. Open the Project Properties dialog by doing one of the following:
a) Click on the project name in the Projects window and select File>Project
Properties.
b) Right click on the project name in the Projects window and select “Proper-
ties”.
2. Under “Categories”, click on “