

Page 1
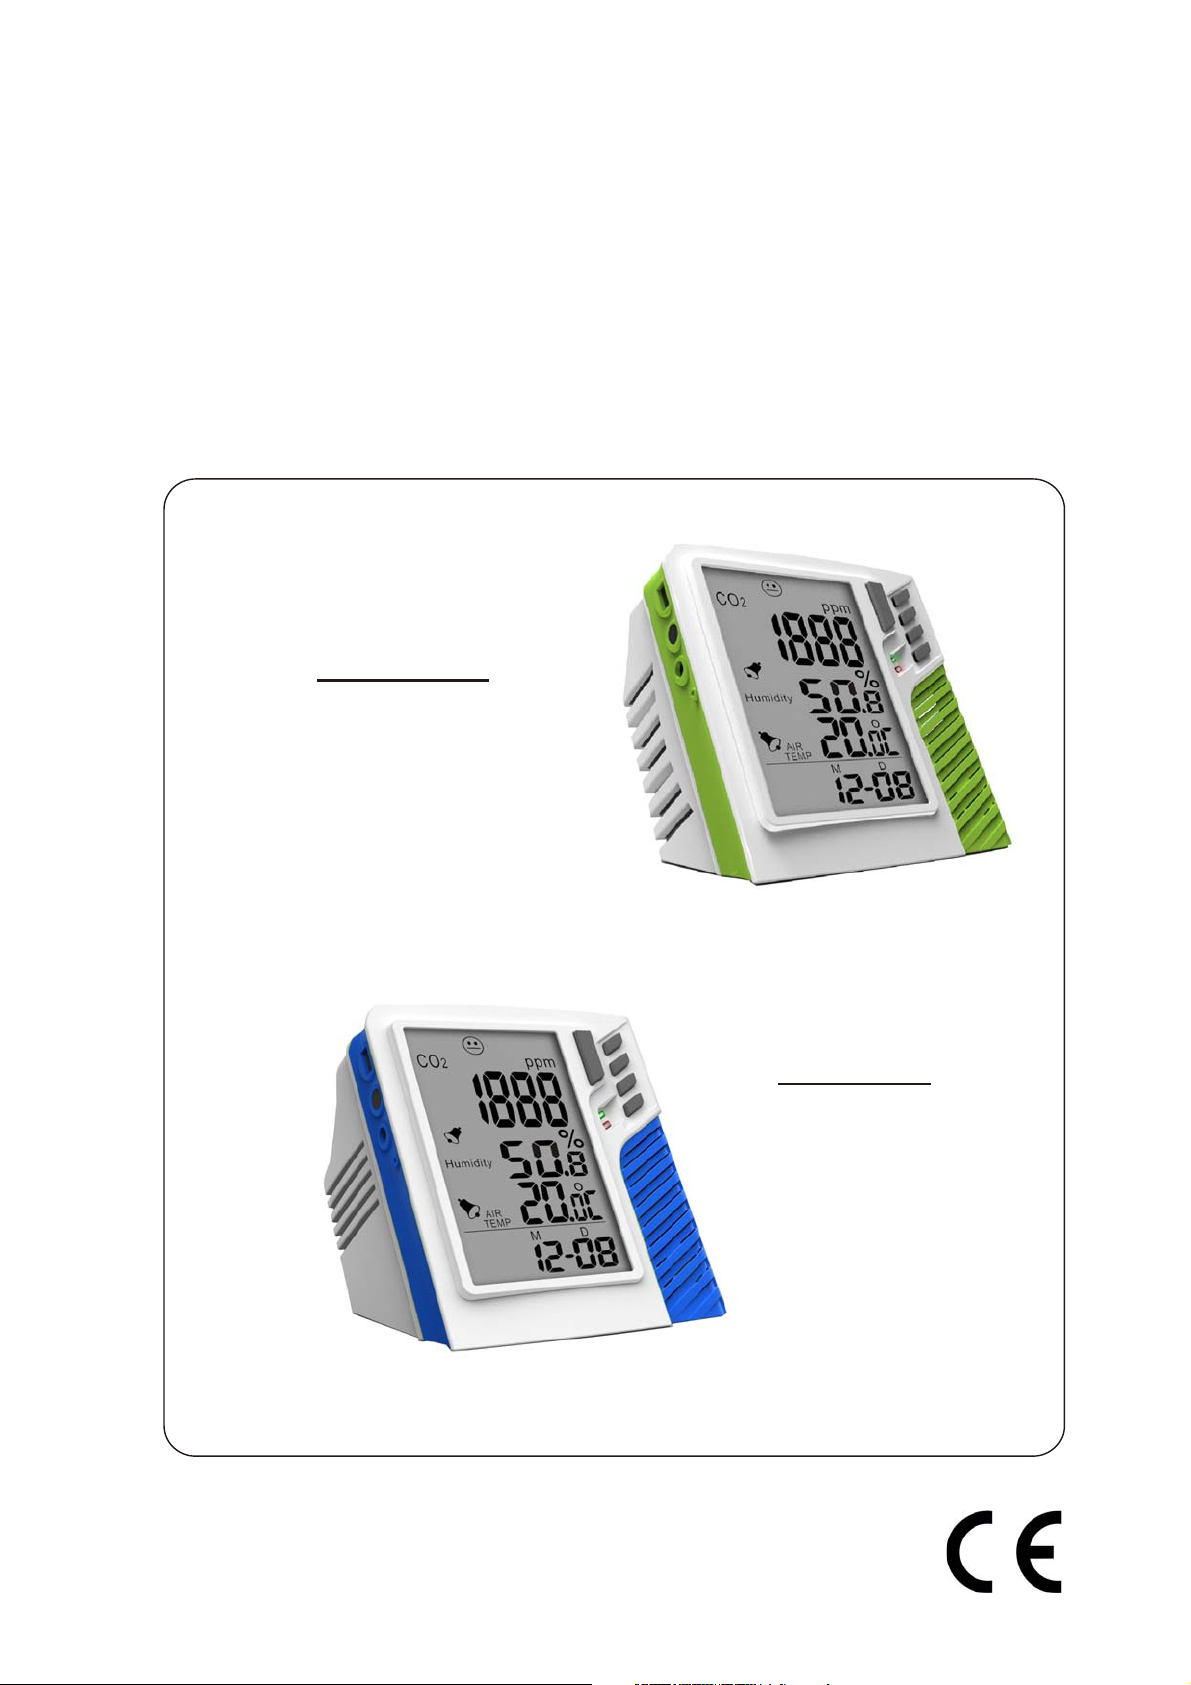
OPERATION MANUAL
IAQ CARBON DIOXIDE
(CO
Monitor
98136
98137(Backlight)
98138
98139 (Backlight)
2) MONITOR / LOGGER
Logger
98536
98537(Backlight)
98538
98539(Backlight)
Page 2

Table of contents
1. Introduction........................................................
2. Features............................................................
3. Material supplied...............................................
4. Power supply.....................................................
5. LCD display.......................................................
6. Keypad(Controls)................................................
Operation
7.
a)Power on/off...................................................
b)Taking measurement........................................
c) CO
2 Mode......................................................
d)TRH Mode.....................................................
e)Temperature unit selection...............................
8.Maintenance.......................................................
9. ABC(Automatic Baseline Calibration)...................
10.Disable ABC function..........................................
11.Backlight function...............................................
1
1
2
2
2
3
3
4
4
6
7
7
7
8
9
12.Datalogging function...........................................
13.Setting date&time
a)Real time and date............................................
b)Month/Date and Hour/Min..................................
c)Alarm setting....................................................
d)CO
2 alarm level setting.....................................
14.Logger setup
A. Install logger driver for windows.......................
B. Install the logger software for Windows XP........
Run the software from Windows XP......................
Reminder...........................................................
Logger status.....................................................
Logger setting....................................................
Schedule/Real time/Key start mode.....................
Zoom in/zoom out...............................................
Line color selection
.............................................
9
10
10
11
11
12
12
13
14
14
15
17
16
16
Logger function..................................................
15.Specifications....................................................
16.Trouble shooting /CE..........................................
17.Warranty............................................................
18.CO
2 levels and guide lines..................................
17
18
19
20
21
Page 3

INTRODUCTION
Thank you for purchasing MIC’s desktop CO2 monitor.
It is used to measure CO
2 concentration,air temperature
and relative humidity with visible and audible alarms. This
2 monitor is an ideal instrument for indoor air quality
CO
(IAQ) diagnosis and HVAC system performance
verification.
Carbon dioxide (CO
earth's atmosphere. The concentration of CO
2) is a gaseous component of the
2 in natural
ambient air is about 0.04% or 400ppm. With each breath,
human convert oxygen (O
2) into carbon dioxide(CO2).
Although carbon dioxide is invisible and odorless, an
increased CO
2-content makes is apparent because
human will notice increased fatigue and reduced
concentration.
FEATURES
1). Super large LCD simultaneously display of CO2 level,
Temp., Relative humidity, Calendar (Y/M/D) and Time
(clock).
2). Six (6) smiley icons indicate indoor air quality levels
(350/450/700/1000/2500/5000ppm), easy to
understand CO
3). Stable NDIR sensor for CO
2 concentration.
2 detection
4). High alarm threshold is selectable.
5). Automatic Baseline Calibration (ABC) function
6). Audible warning for high CO
2 concentration!!
7). Dew point/ Wet bulb Temperature measurement.
(98138.98139.98538.98539 only)!
8). Heat Index /WBGT Temperature calculation.
(98538.98539 only)
9). Backlight function ( 98137.98139.98537.98539 only)
1
Page 4
MATERIAL SUPPLIED
><
><
(1) Meter
(2) Adaptor (9V+10%, >=0.5A)
(3) Operation manual
(4) Box with color sleeve
POWER SUPPLY
The meter is powered by an AC adaptor (9V/0.5 A
output)
LCD DISPLAY
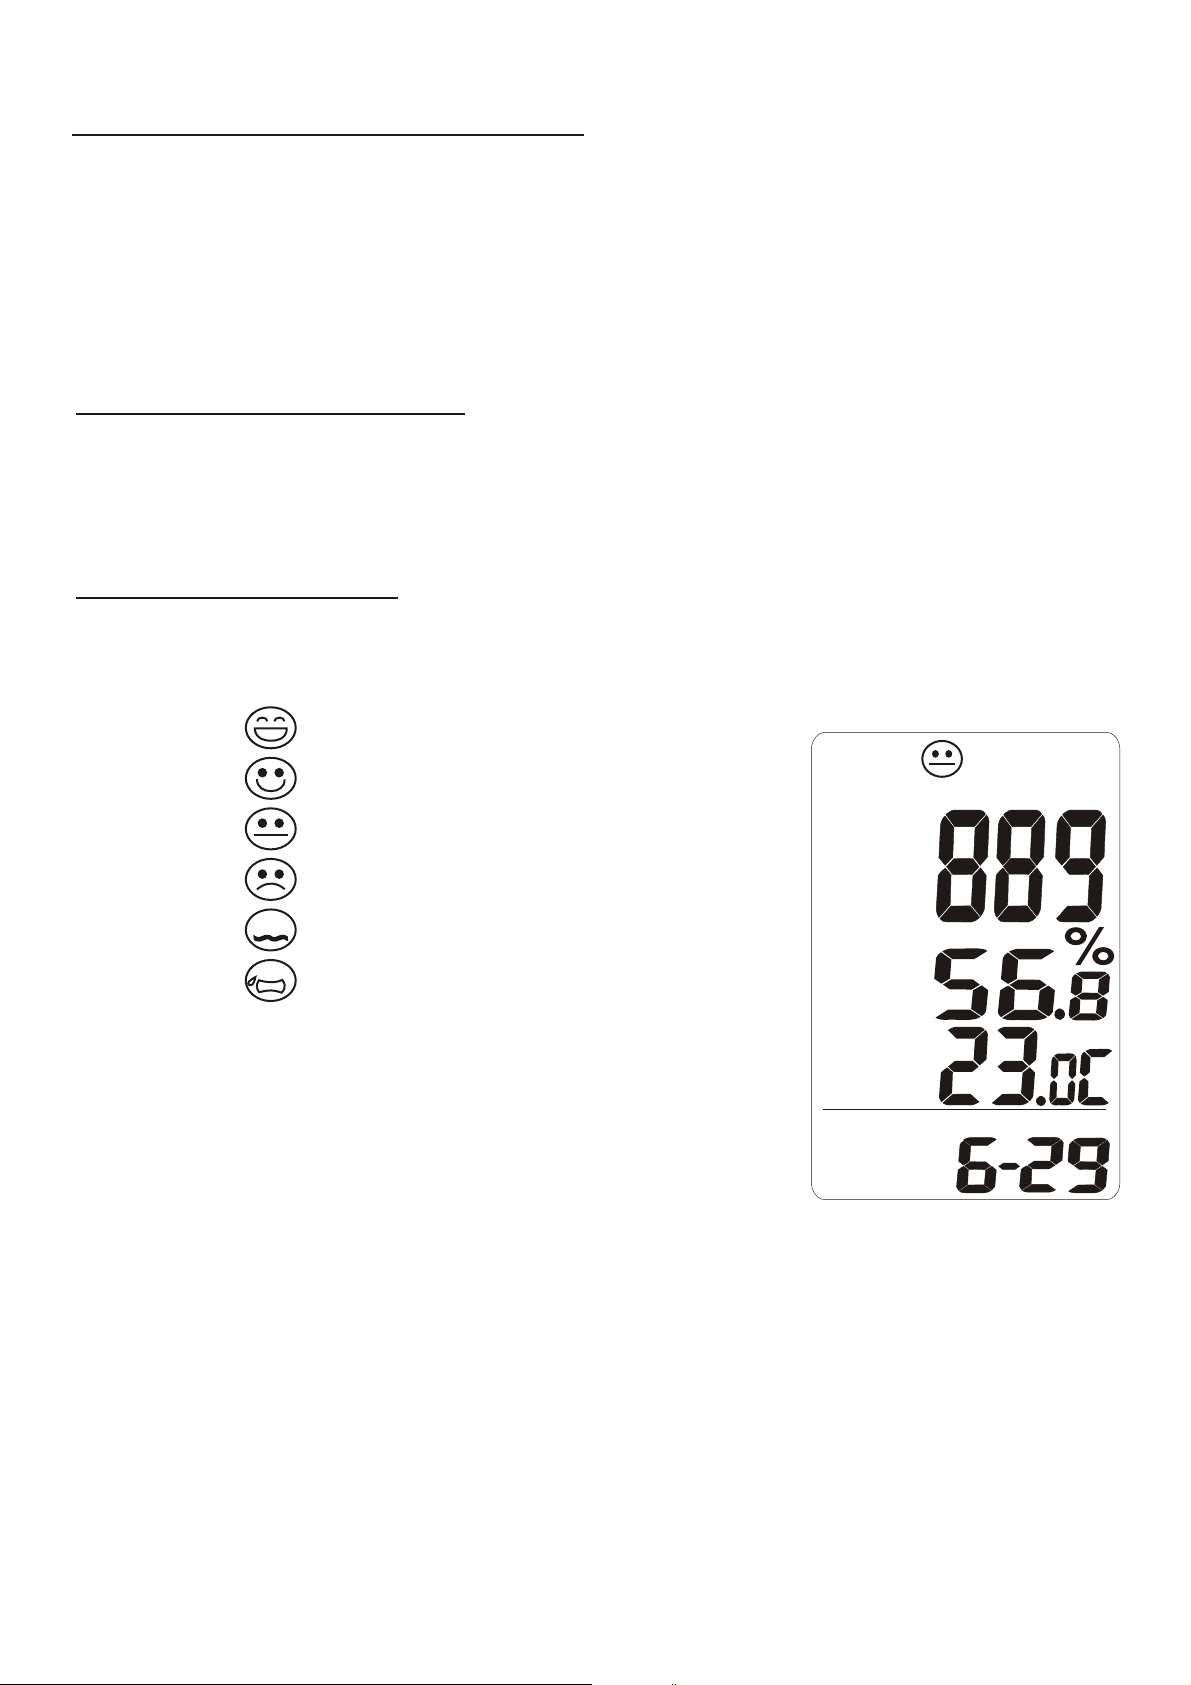
Symbols:
1) ppm : CO
2 unit
2) icon : 350ppm a450ppm
icon : 450ppm a 700ppm
3)
4) icon : 700ppm a 1000ppm
5) icon : 1000ppm a 2500ppm
6) icon : 2500ppm a 5000ppm
7) icon : 5000ppm ൹
8) Air Temp.: Ambient Temperature
9) DPT: Dew point temperature
10) WBT: Wet bulb temperature
11) MH : Month / Hour
12) DM: Date / Minute
13) lps% , cfm/p:Vent rate
CO
2
Humidity
AIR
TEMP
ppm
o
MD
14) TWA: Time Weighted Average (8 hours)
15) STEL: Short-Term Exposure Limit (15 minutes weighted
average )
16)Logging: When it is in the recording mode
17)VOC, NO
2, WBGT, hpa, mbar ,EXT TEMP are not
available in these models
2
Page 5
KEYPAD (CONTROLS)
1) MODE : CO2 mode,TWA,STEL,lps%, cfm/P
Reset Max.Min, STEL,TWA
(98138.98139.98538.98539)
2)
3)
SEL./R : Edit Date,Time or alarm level
TRH.M. : Temp. Humidity mode. DPT,WBT.
(98138.98139.98538.98539)
Setting/ Next
4) UNIT : Select Temp. unit and backlight
5) POWER : Enter date and time,alarm setting mode
Logger mode: Button start or stop.
OPERATION
(a) POWER ON/OFF
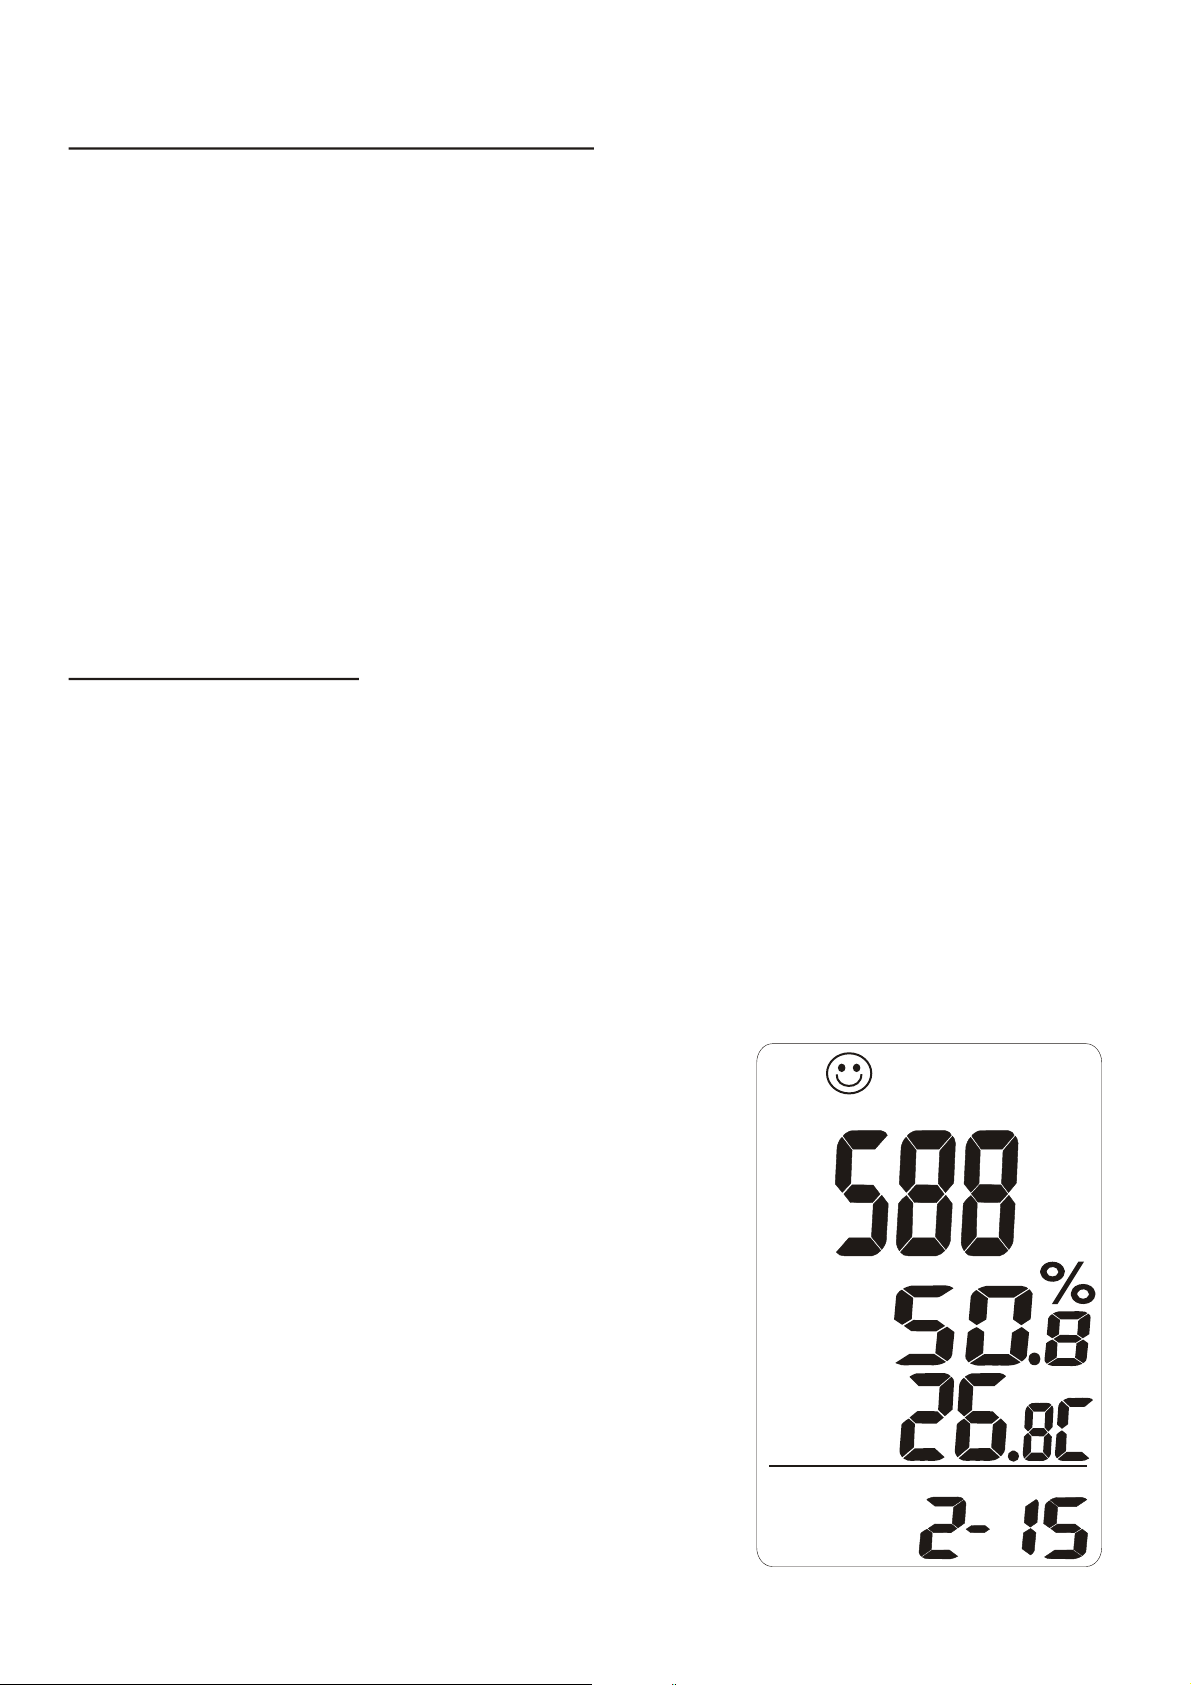
Plug with adaptor, meter turns on automatically . LCD
shows current CO
Six(6) smiley icons indicate the indoor air quality level
and appear on the top of first layer display
2, RH & Temperature, Date and Time.
Note:
(1) Reset time whenever you turn on
the meter.
(2) Please use properly power
source, input voltage: 100~240
VAC,50-60Hz
Output voltage: DC 7.5~9.0V
Output current: 0.5A,or the
meter will be damaged.
CO2
Humidity
AIR
TEMP
ppm
o
MD
3
Page 6
(b) TAKING MEASUREMENT
The meter starts the measurements when powered
on and updates reading every 6 sec.
Response time is 10 sec. for CO
2, 2 Sec. for RH.
If the operation environment changes (ex. From high to
low temp.), it takes approx. 30 sec. for CO
2 sensor to
respond and approx. 30 minutes for RH into stable
measurement.
NOTE: Do not hold the meter close to your mouth
or any other source of CO
2.
RECORDING MEASUREMENT (Model 9853X series)
While recording, the green LED light is flashing and
“Logging” icon is flashing on LCD,too. If you have set up
Hi, Lo alarm value, the red LED will be flashing while
detecting the value which exceeds the threshold.
( c) CO2 MODE
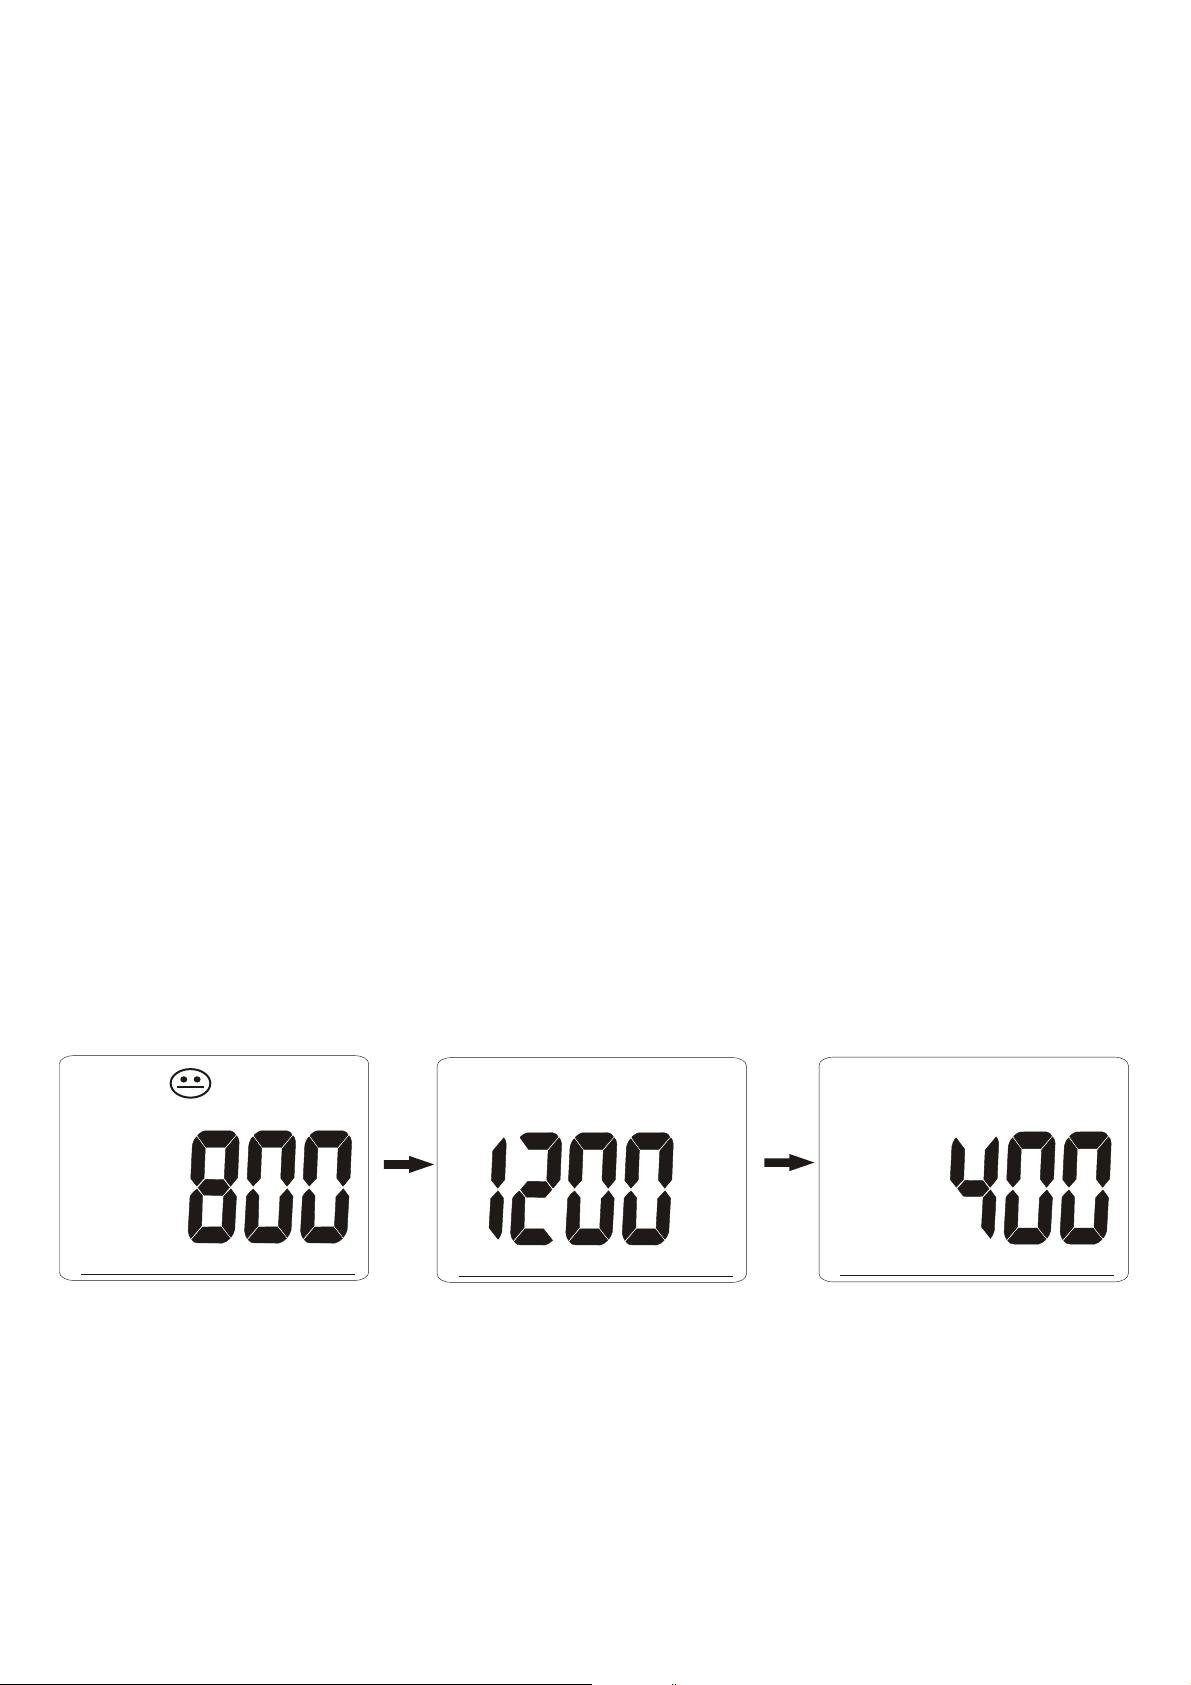
In the CO
display. The top layer of display will cycle 3 from CO
2 Mode, press MODE button to switch CO2
2,
Maximum, Minimum and 98138,98538 features function
TWA, STEL, lps% & cfm/p.
CO
2
ppm
CO
2
ppm
MAX
CO
ppm
2
MIN
4
Page 7
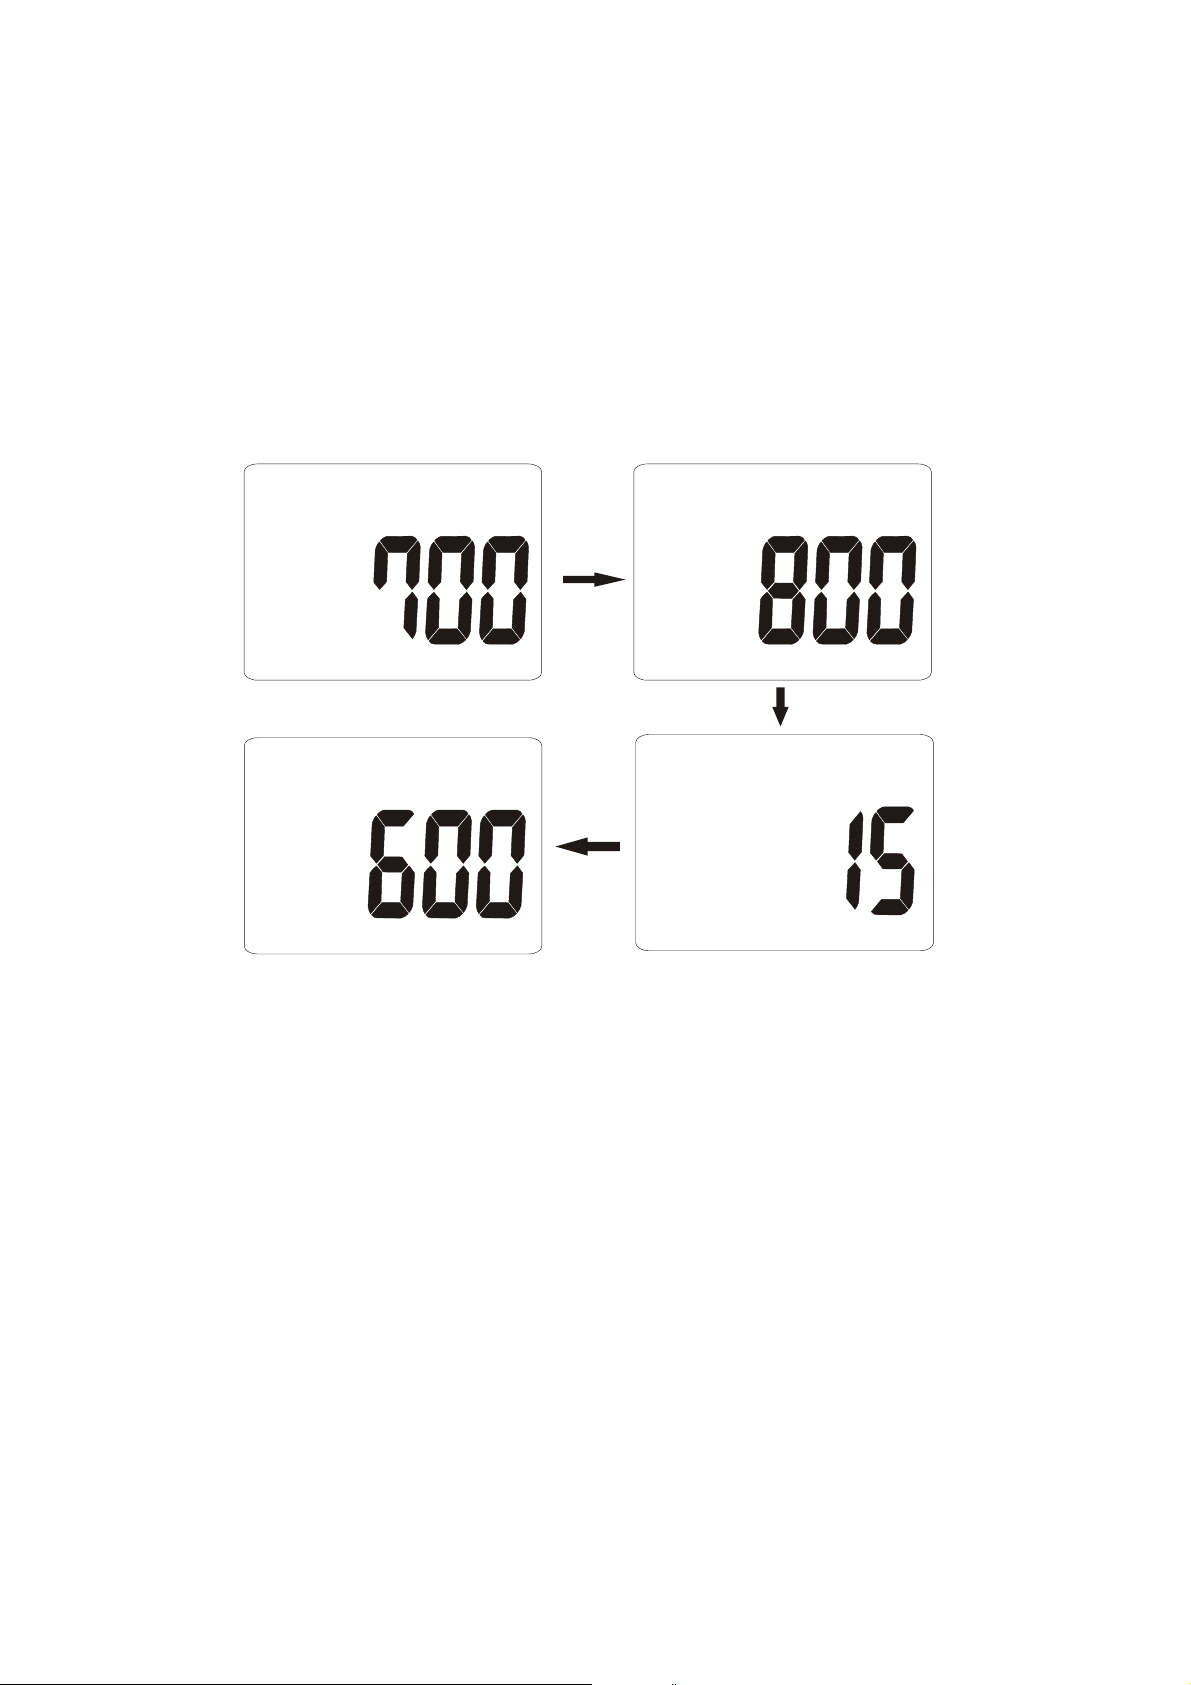
Note 1:
a)
MAXIMUM. MINIMUM:
The unit automatically records maximum reading
and minimum reading after powered on.
b) RESET MAX/MIN:
MAX or MIN mode,
Max.or Min values.
or MIN, you will not be easy to see the difference.
Press MODE button to get MAX or MIN reading, under
Long press MODE button to reset
If current CO
2 reading is near MAX
CO2
TWA
ppm
CO2
ppm
STEL
CO2
ppm
lps
%
CO2
VENT.R
ppm
cfm/p
VENT.R
TWA,STEL,lps%,cfm/p
Note 2 (98138.98139.98538.98539 only):
a) TWA: ( Time Weighted Average 8 hours)
The meter keeps updating the reading every minute. If
the meter has been powered on for less than 8 hours,
the TWA value will be the weighted average of readings
since powered on.
b) STEL: (Short-Term Exposure Limit in 15 minutes
weighted average)The meter keeps updating readings
every minute. If the meter has been powered on for less
than 15 minutes, the STEL value shows the weighted
average of reading taken since powered on.
5
Page 8
c) lps%: Liters Per Second per person.
d) cfm/p: Cubic Feet per Minute per Person
Assuming a conference room with Max. capacity of = 200
persons , If designed ventilation rate= 7 l/s person
The amount of ventilation required= 1,400 l/s (or 5-040!
CMH), if number of person is 70, the amount of ventilation
only need 490 l/s, we don’t need ventilate 1,400 l/s for
saving energy.
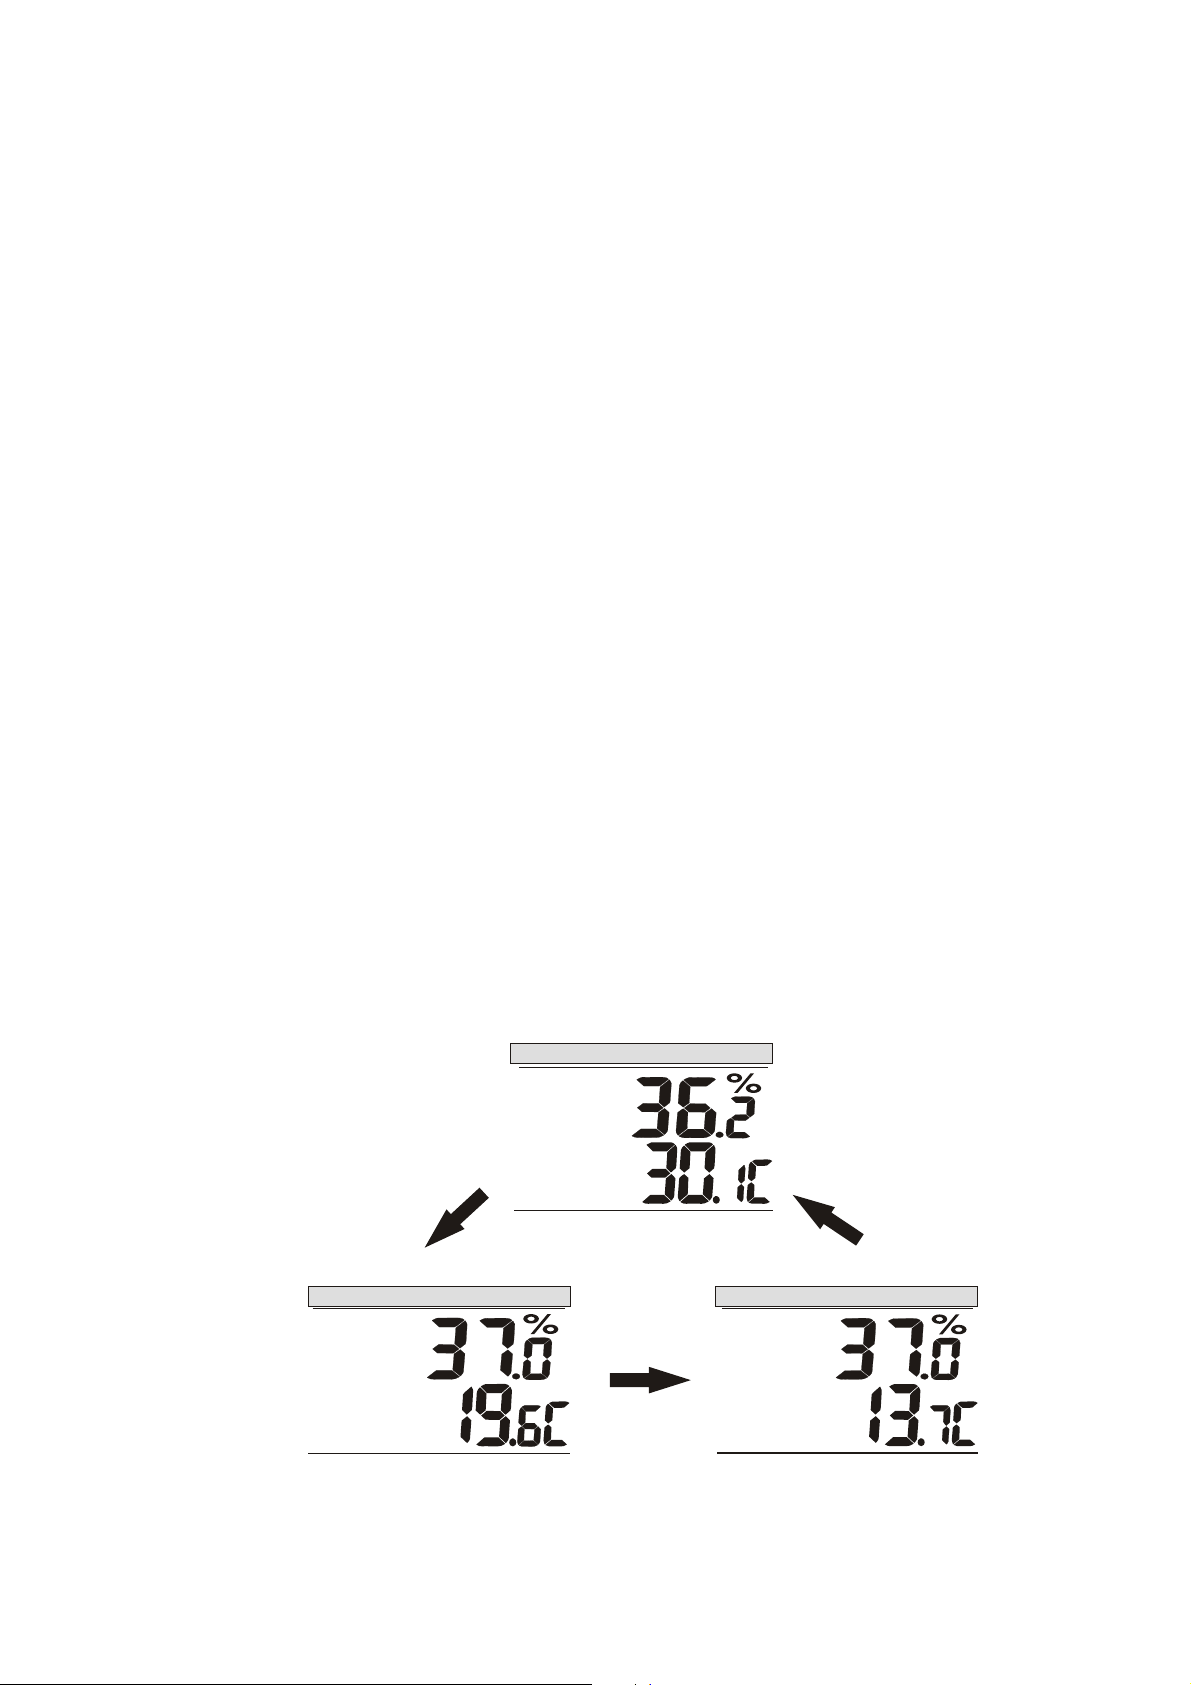
(d) TRH MODE : Temperature / Relative Humidity mode
In the TRH Mode, the meter displays both related humidity
and air Temperature simultaneously.
Press TRH.M button, the second layer of display will
cycle from:
HUMIDITY + AIR TEMP.,
HUMIDITY + WET BULB,(
HUMIDITY + DEW POINT
98138.98139.98538.98539 only)
(
98138.98139.98538.98539 only)
(Ref.2)
HUMIDITY
HUMIDITY
DPT
+
WET BULB
HUMIDITY
HUMIDITY
o
+ TEMPERATURE
AIR
TEMP
o
HUMIDITY
HUMIDITY
WBT
+
DEW POIN T
o
6
Page 9
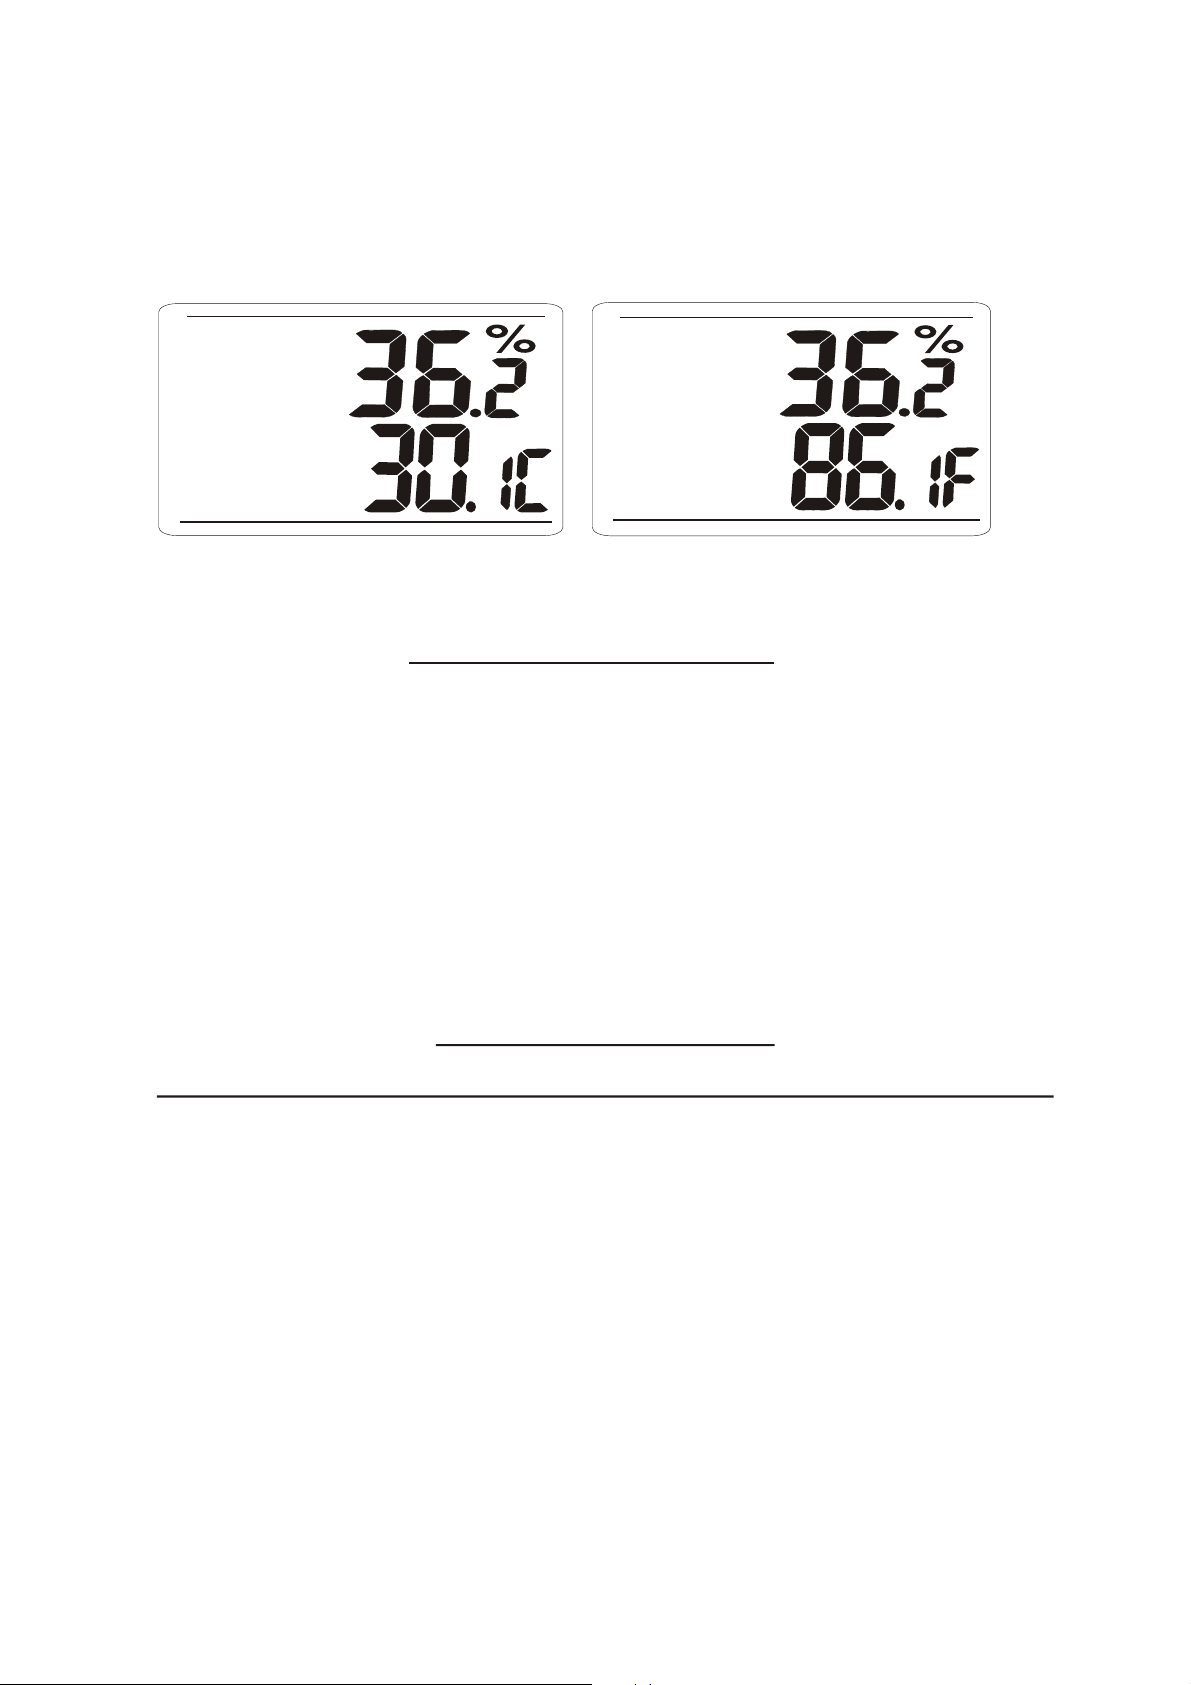
(e) Temperature unit (°C or °F) selection
Press UNIT button to toggle the temperature unit
(°C or°F) .
HUMIDITY
o
AIR
TEMP
HUMIDITY
o
AIR
TEMP
MAINTENANCE
Cleaning and storage:
1). The meter should be cleaned with a damp cloth and mild
detergent when necessary.
2). Store the meter in an area with moderate temperature
and humidity.
CALIBRATION
ABC (Automatic Baseline Calibration)
The monitor is designed with high accuracy NDIR CO2
sensor with ABC (Automatic Baseline Calibration) function
which establishes a baseline calibration to eliminate the
zero drift of the infrared sensor.
The ABC function is always “ON” when the meter is turned
on. ABC is designed to calibrate the meter at the minimum
2 reading detected during 7.5 days continuous
CO
monitoring (power on).
7
Page 10
DISABLE ABC FUNCTION
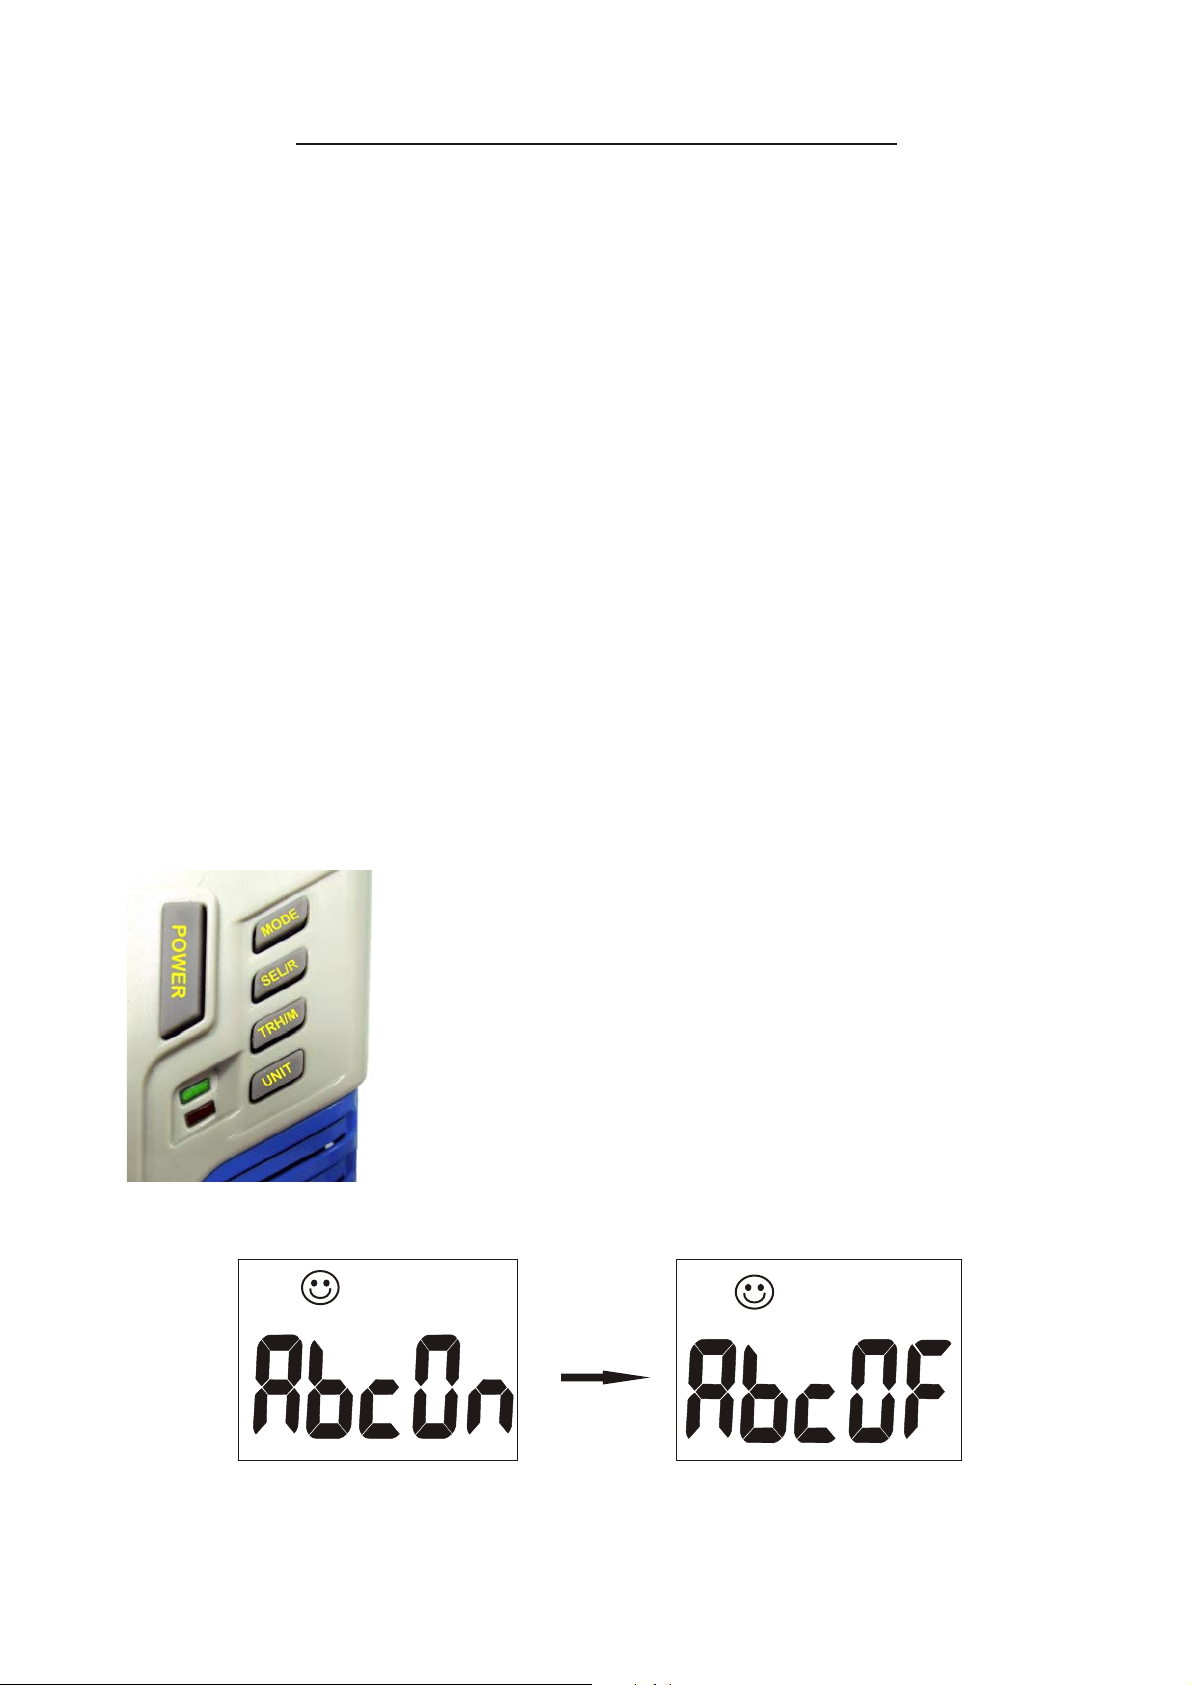
The meter is default with ABC for automatically
It assumes that the area being tested receives fresh air with
a CO
during the seven days. It is not suitable to use desktop CO
in closed areas with consistently high CO
2 level of approximately 400ppm at some period of time
2
2 levels 24 hours a
day.
For example, if the monitor is located in 24 hours area, such
as hospital or convenient stores, the ABC function should
be turned off for not being calibrated with high CO
2 level.
When adaptor plug in, long press POWER button to turn off
the meter. Hold MODE+UNIT and press POWER button.
Display shows “AbcOn”. Press SEL/R to select ABC
function ON or OFF. Press TRH/M to save setting and meter
will restart automatically.
Co
Step1:Long press POWER turn off meter
Step2:Hold MODE+UNIT
Step3:Press POWER to enter ABC function.
Display shows below.
Step4:Press SEL/R to select AbcOn or off.
Step5:Press TRH/M to save. Meter restarts
automatically.
2
ppm
Press
SEL./R
Co
2
ppm
8
Page 11
BACKLIGHT FUNCTION
(98137(U).98139.98537.98539)
When monitoring CO
2, Temp. RH in the dark area, press
and hold UNIT button for 5 seconds to activate backlight
Press and hold UNIT button again to turn off the
function of backlight.
DATALOGGING FUNCTION
(98536.98538.98537.98539)
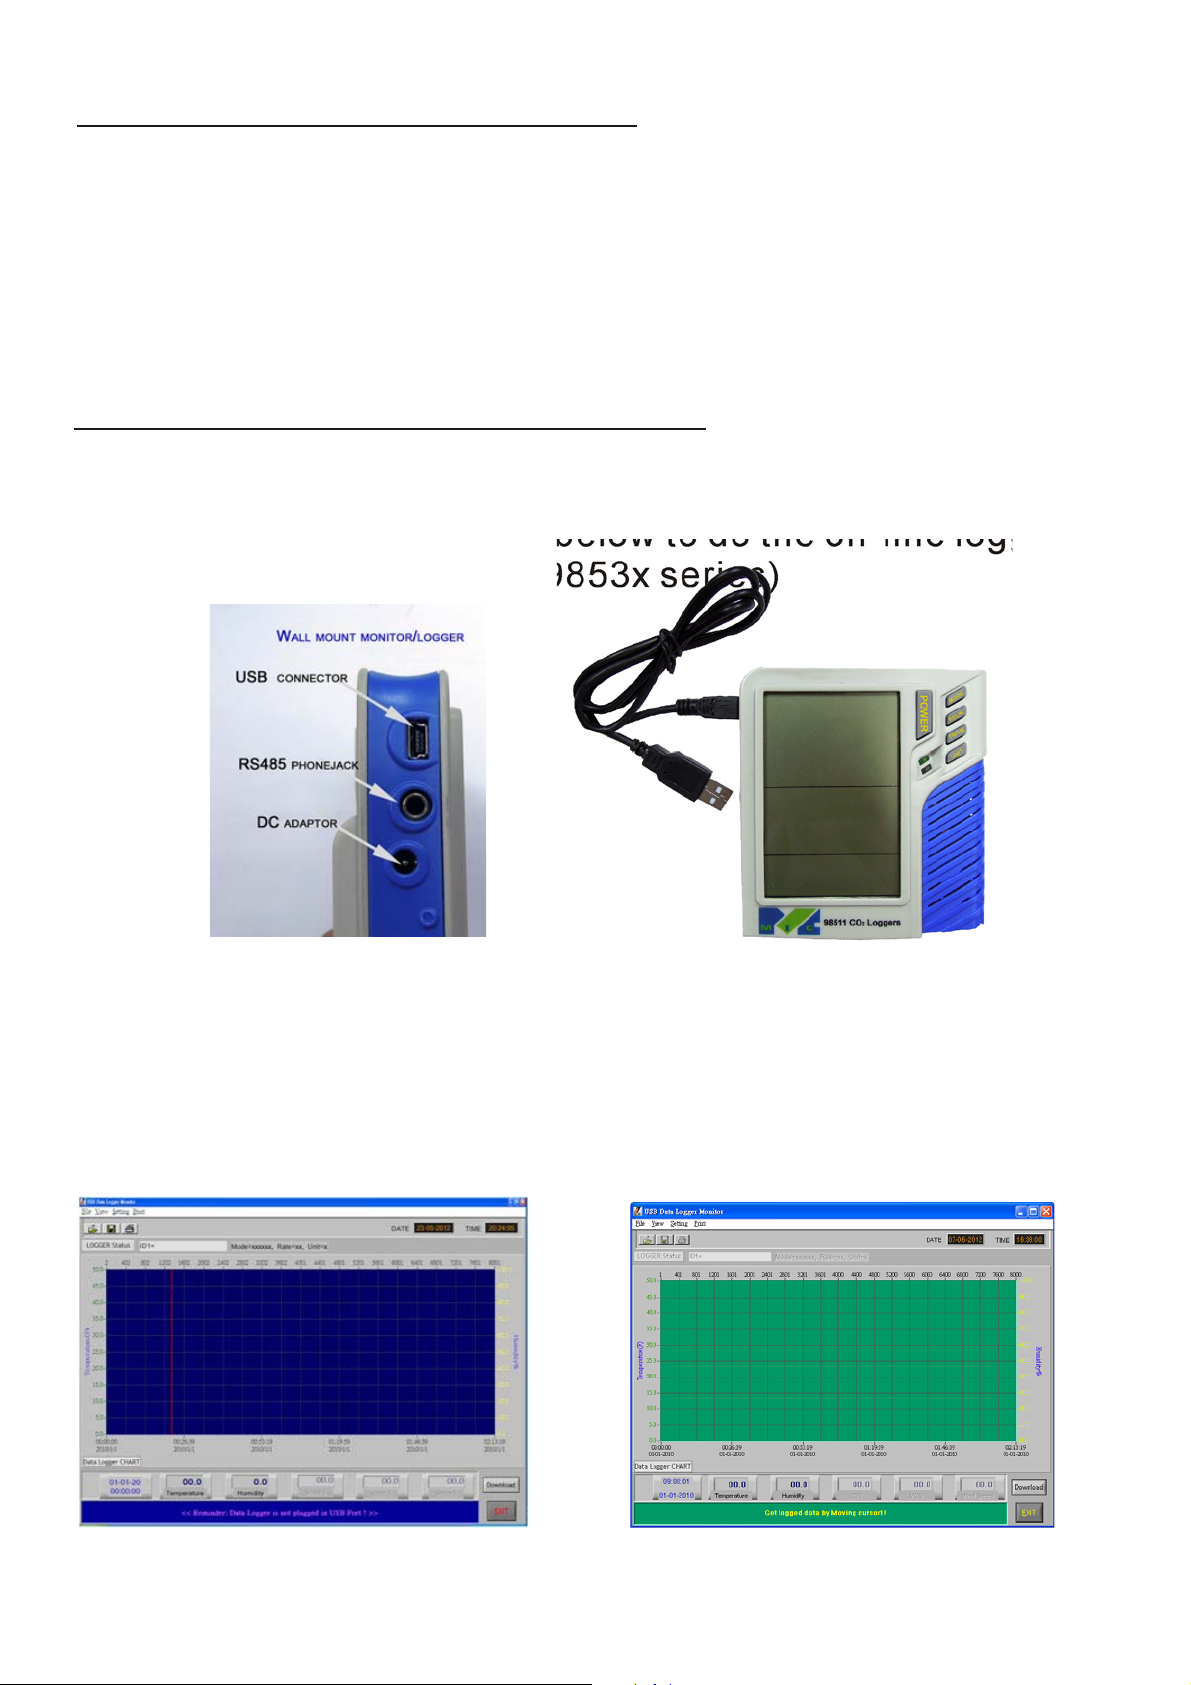
If you want record the CO
with supplied USB cable as below to do the on-line logging
function (Model 98137U or 9853x series)
2 concentration, Temp.RH, plug
NOTE: Ensure to set up date and time first
Plug mini USB cable onto logger unit, and the male
USB plug onto computer, follow the instruction manual to
install datalogger software.
The main screen shows :
Logger screen On-line logging screen
(98137U only)
9
Page 12
SETTING DATE & TIME
a) Real time and date:
The meter shows Mo./Date and Hr/Min on the 3rd
layer of display, and each cycle is 16 seconds.
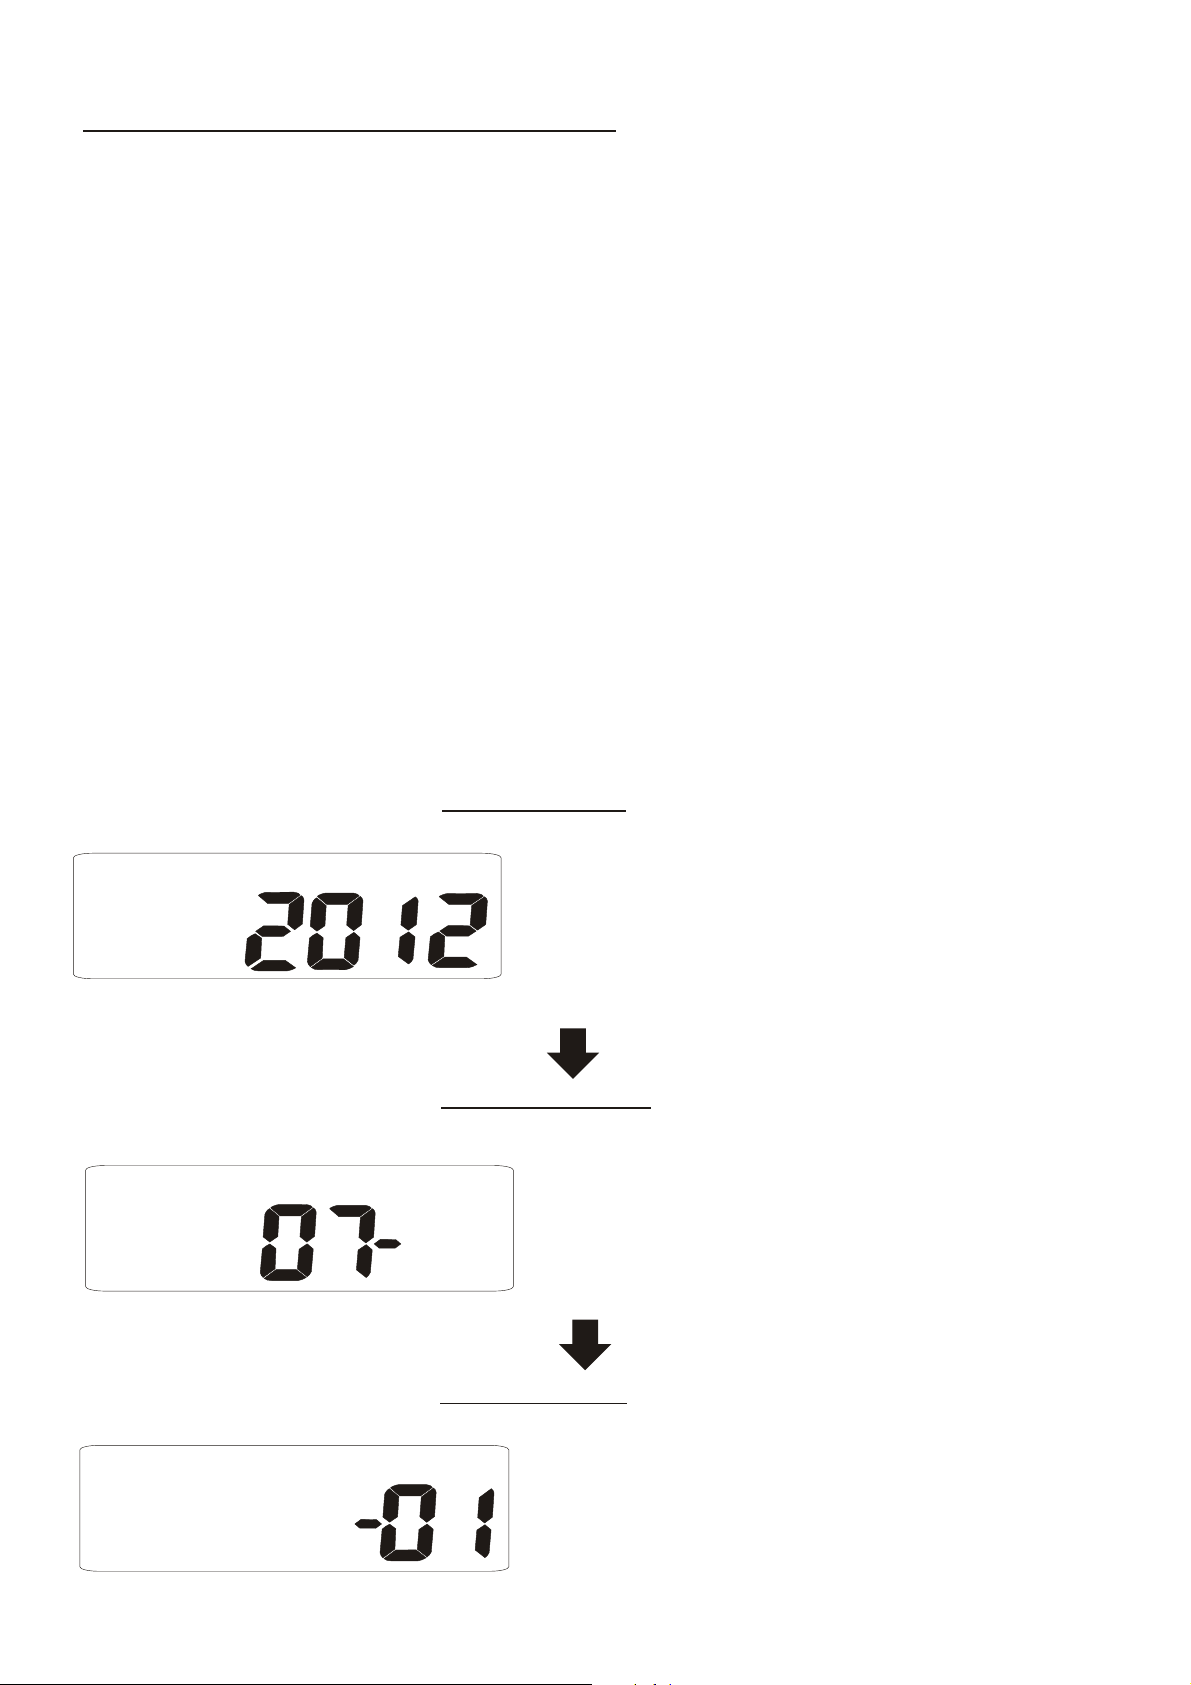
b) Month/Date and Hour/Min
Press POWER button to enter the real date and
time setting. The time default is 24-hours format.
Though the logger shows only Month/Date, the
setting up for YEAR,too.
Enter setting up mode, edit by SEL/R or press
TRH/M button to the next setting. After Month
and date setting, it displays Hour and Minute ,
the same operation to set up, always press TRH/M
to save and exit.
Setting Year
Setting Month
M
D
When the number “2012"flash, press
SEL./R button to increase year(2010-
2030).Press TRH/M button to save
and move to next setting.
When the number “07" flash
on the LCD, press SEL./R button
to increase Mo. (01-12). Press
TRH/M button to save and move to
next setting.
M
Setting Date
When the number “01" flash on the LCD
D
, press SEL./R button to increase
Date (01-31). Press TRH/M button to
save and move to next setting.
10
Page 13
H
H
c) Alarm setting
M
M
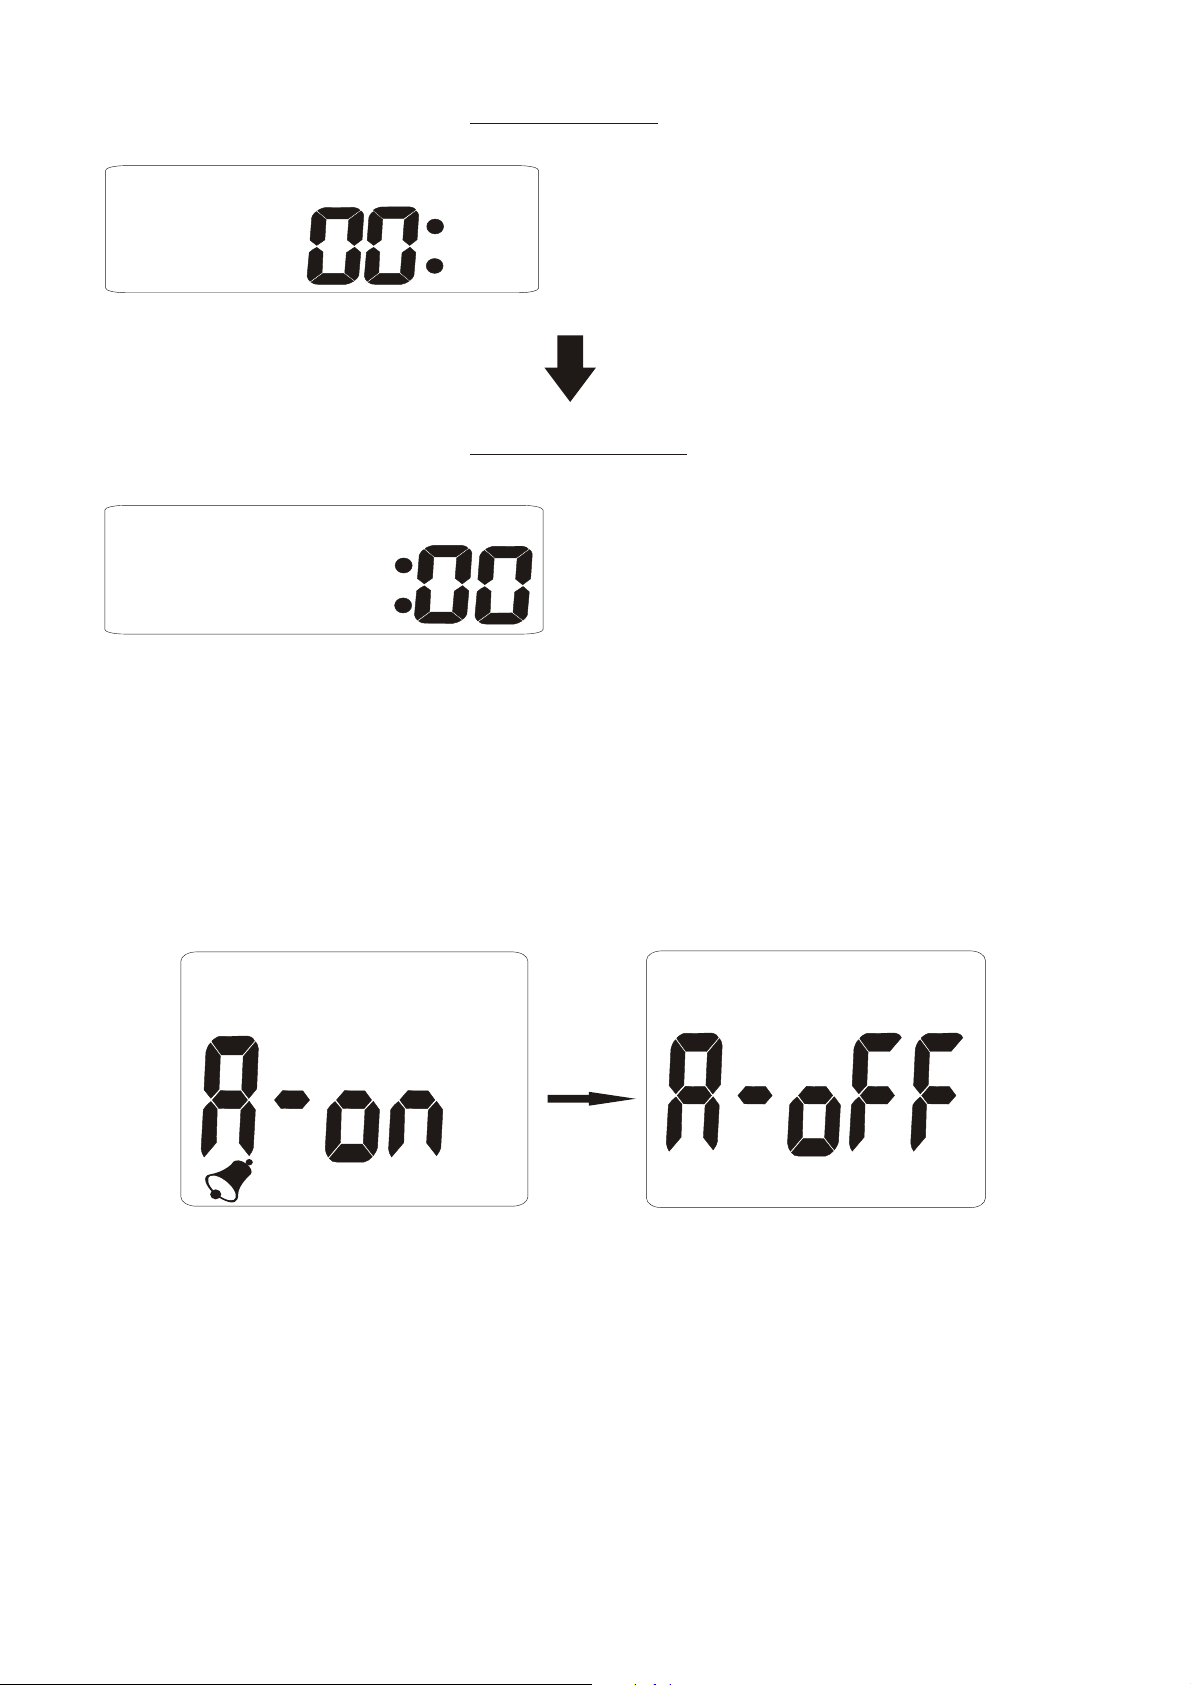
Setting Hour
When the number “00" appear
on the LCD, press SEL./R button
to increase Hr (01-24). Press
TRH/M button to save and move to
next setting.
Setting Minute
When the number “00" appear
on the LCD, press SEL./R button
to increaser Min. (00-59). Press
TRH/M button to save and move to
next setting.
After the real date and time is set, the meter will
show “A-on” on the top layer of display, press SEL./R
button to select Alarm on or off. If alarm is on, press
TRH/M button to save the setting and move to CO
alarm setting.
CO2
ppm
Press
CO2
SEL./R
ppm
d) CO2 alarm level setting
2
The meter shows CO
1000 ppm as the default
2
value on the top layer of display. To change Hi
alarm value by pressing SEL./R button to increase
the value. If you pressing the SEL./R button, the
number starts from Units digit, Tens digit,
Hundreds digit and then Thousands digit. Press
2
TRH/M button to save and return to CO
normal
measurement.
11
Page 14
Logger setup:
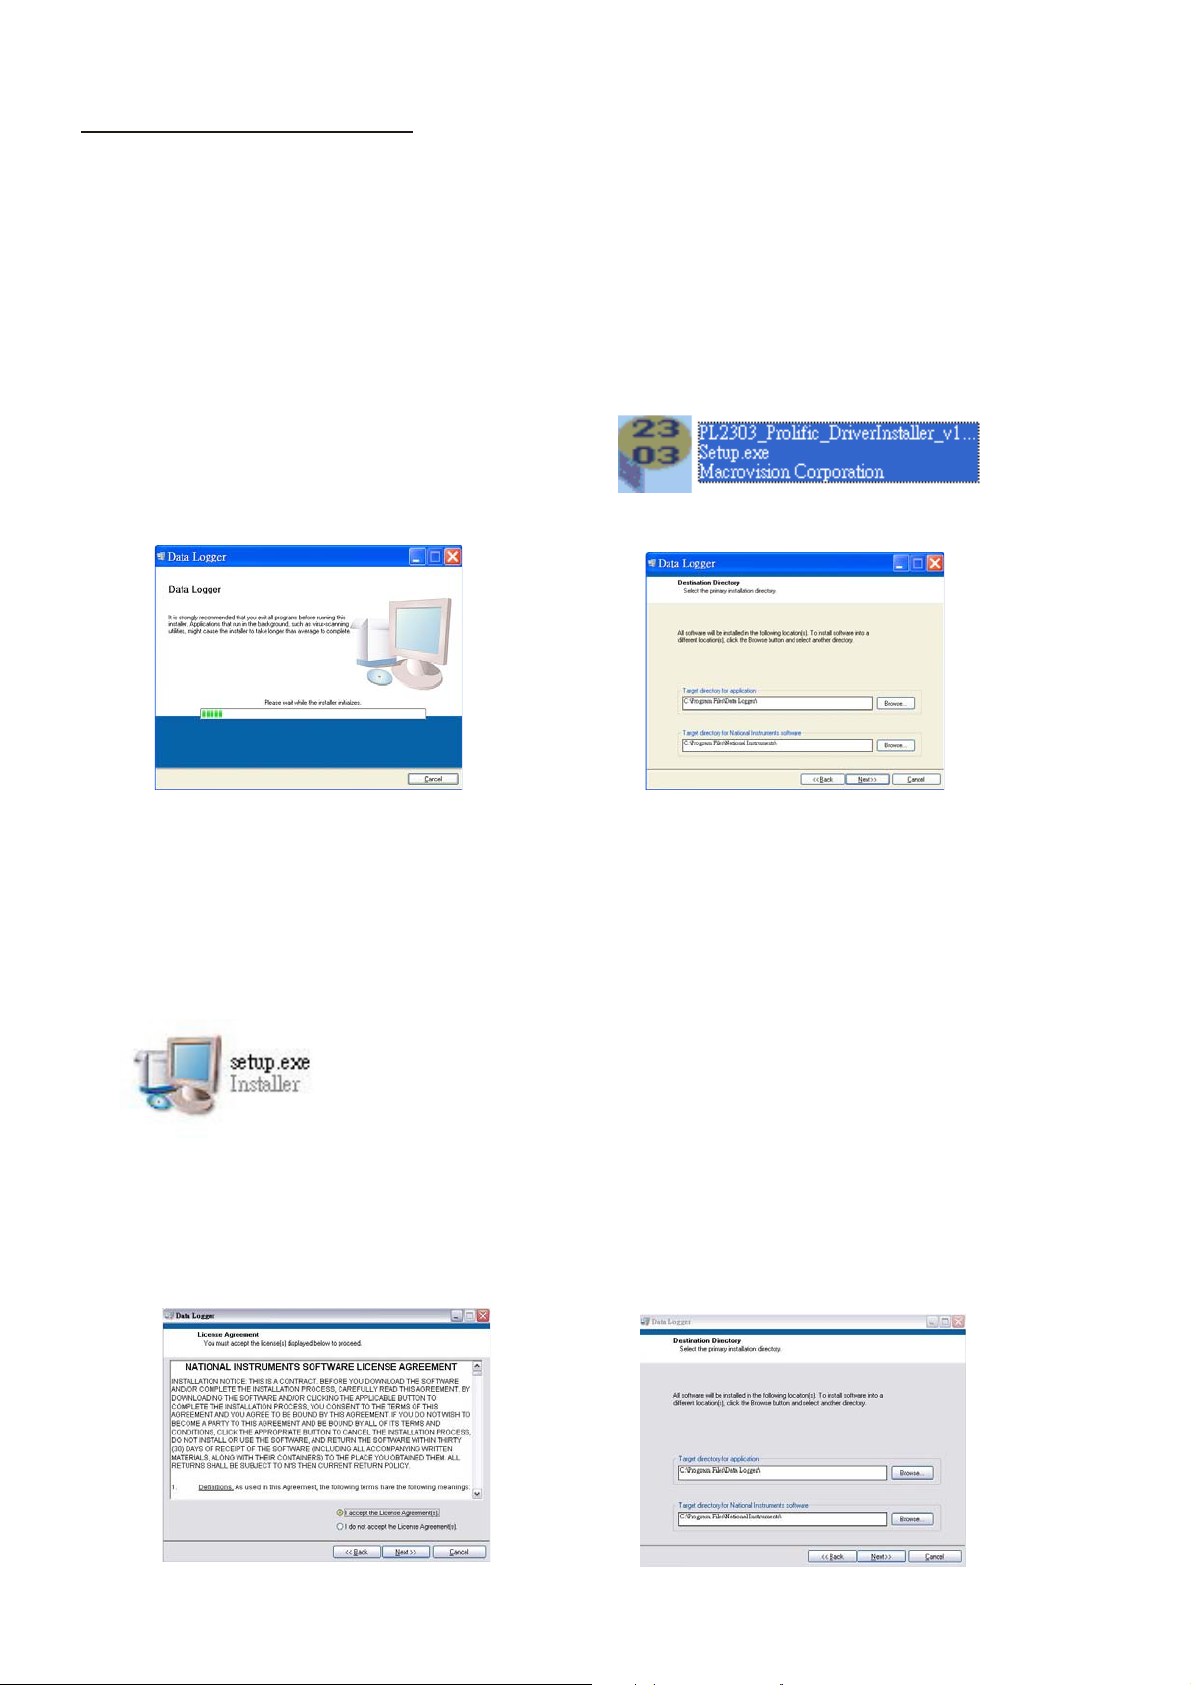
A. Install logger driver for Windows
The PL2303_Prolific_DriverInstaller_v110.exedriver is for
Windows operation system,follow the installation steps
hereunder:
1. Put the CD into CD driver, click
PL2303_Prolific_DriverInstaller_v110.exe for
installation the driver.
2.The set up status
3.Click “NEXT” to continue
4、After complete the installation , press “ Finished”。
B. Install the logger software for Windows XP
Please follow the following steps to install the software
1.Put CD into CD driver , click “ Setup.exe MSI Installer
Bootstrapper National Instruments” to install
2.Select the destination folder you are go to save by click
“Browse”button
3.Once you finish selecting ,press “Next”.
4.Select “I accept the License Agreemen:(s)” and press NEXT \
button.
12
Page 15
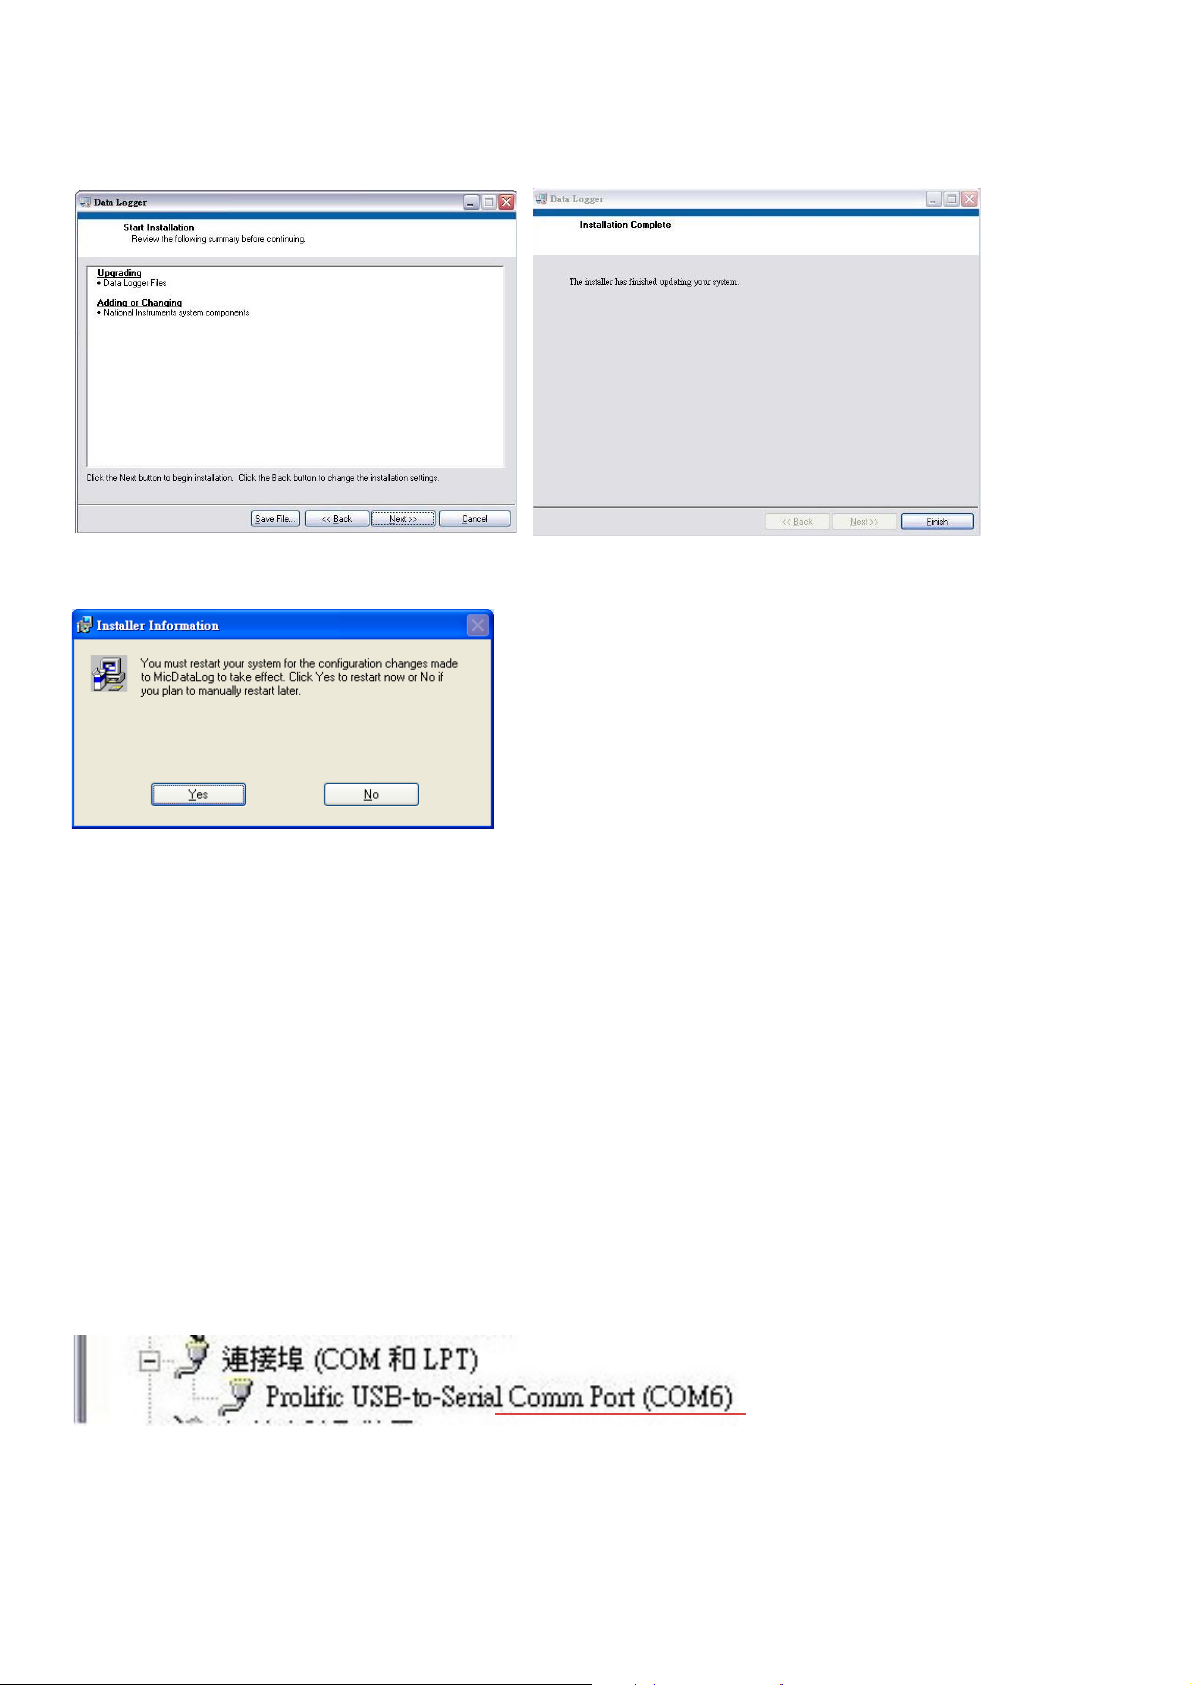
5.Click NEXT button when you see the following.
6.Press FINISH button to complete the installation.
7、Restart the Windows XP system
. Run the software from Windows XP
1. Plug the USB datalogger into USB port, since you have already
Installed the USB driver, computer will automatically detect logger ,
click “ My computer””Content” in hardware content, click “Device
manager” to find the listed (COMx) listed under Ports(COM & LPT
as below with red circle.
If you may Prolific USB-to-Serial Comm. Port , it means the logger is
connected to computer properly.
2. Install logger driver for Windows)
3.Select logger software folder ( The 3 step of logger
rd
software installation)
13
Page 16
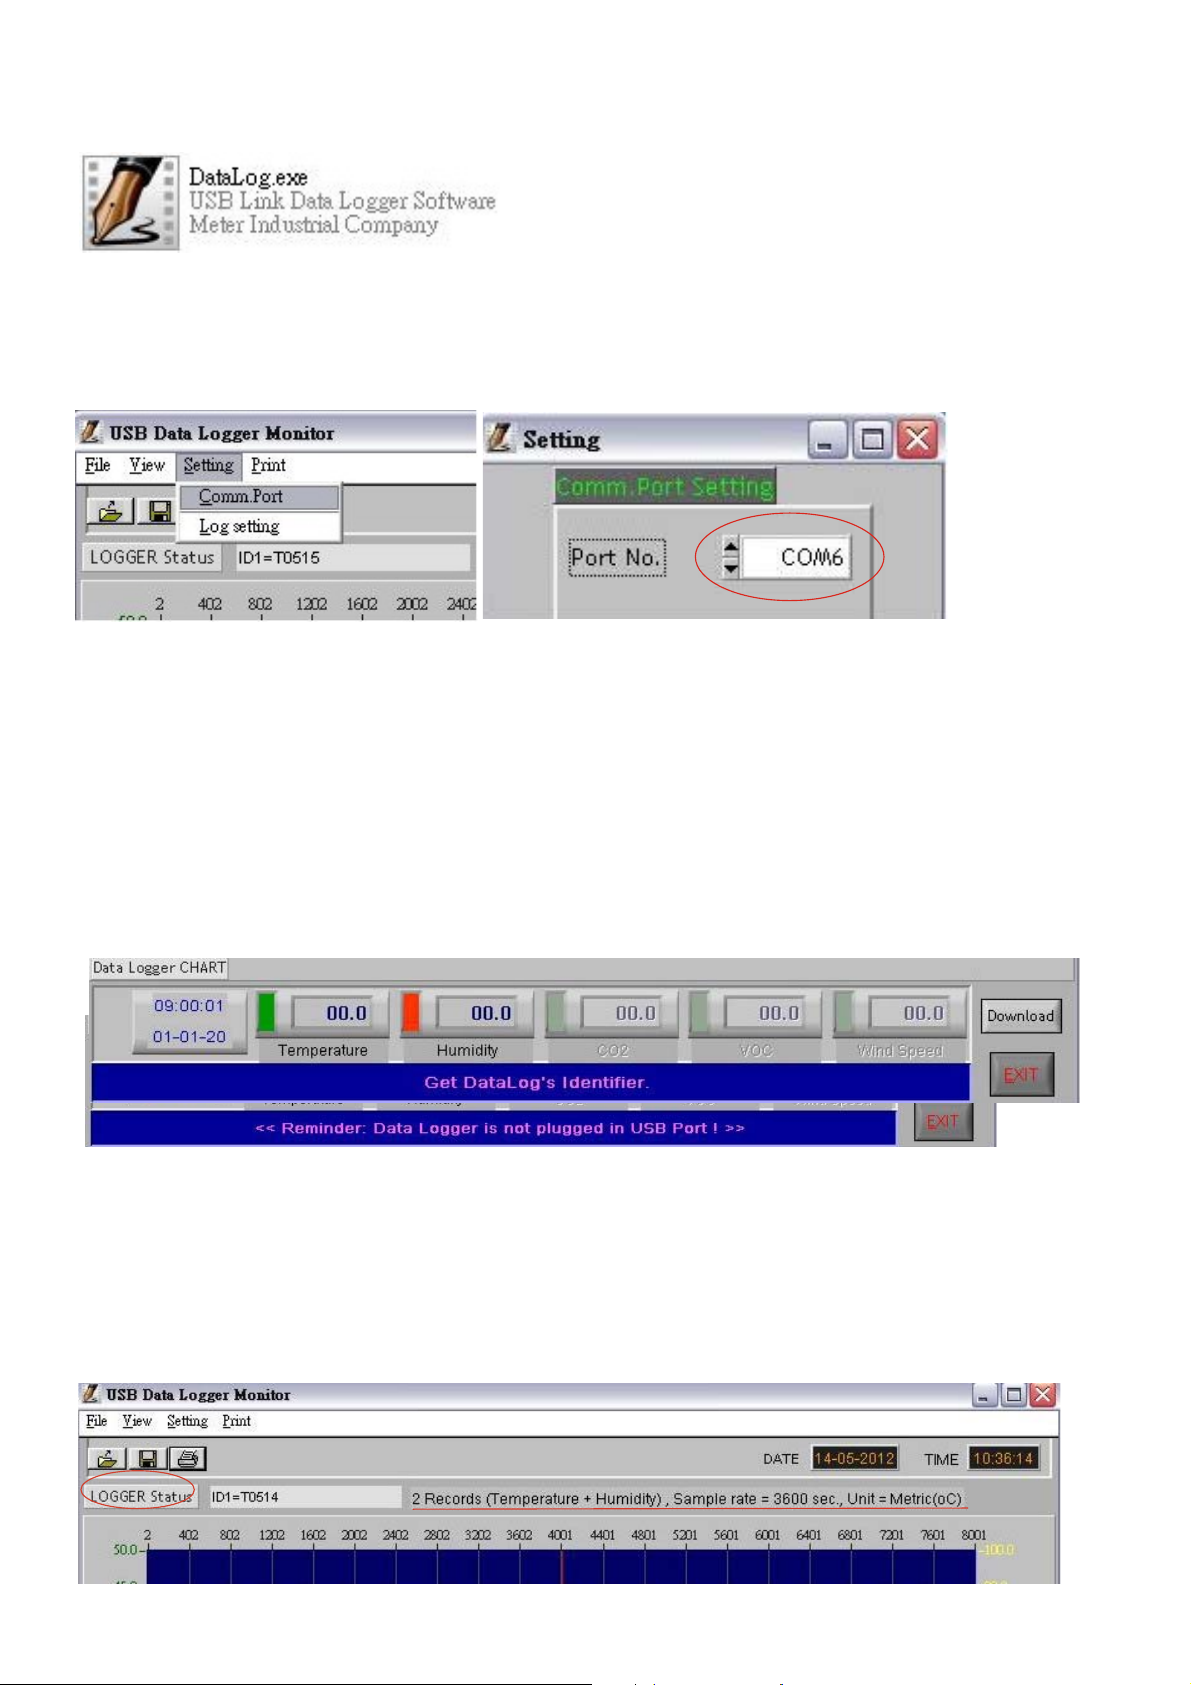
3.Clck below
4. The screen of logger software as below:
5. Click “Setting” ”Comm port “ select the port number as you
see from step 2, then press OK button.
Reminder:
Software is installed completed,”Get Datalog’s
Identifier”shows below, then press SETTING button to enter Log
setting(pic.1)
Note: If logger is not plugged in USB port, the warning message
“Reminder: Data Logger is not plugged in USB port!” shows
below(pic.2)Make sure logger is plugged in and choose the correct
COM port.
(Pic.1)
(Pic.2)
LOGGER Status:
Before download data, press LOGGER status to show ID, Records,
Sample rate, Unit.
NOTE: Once Download button is pressed, recording is inactivated.
14
Page 17
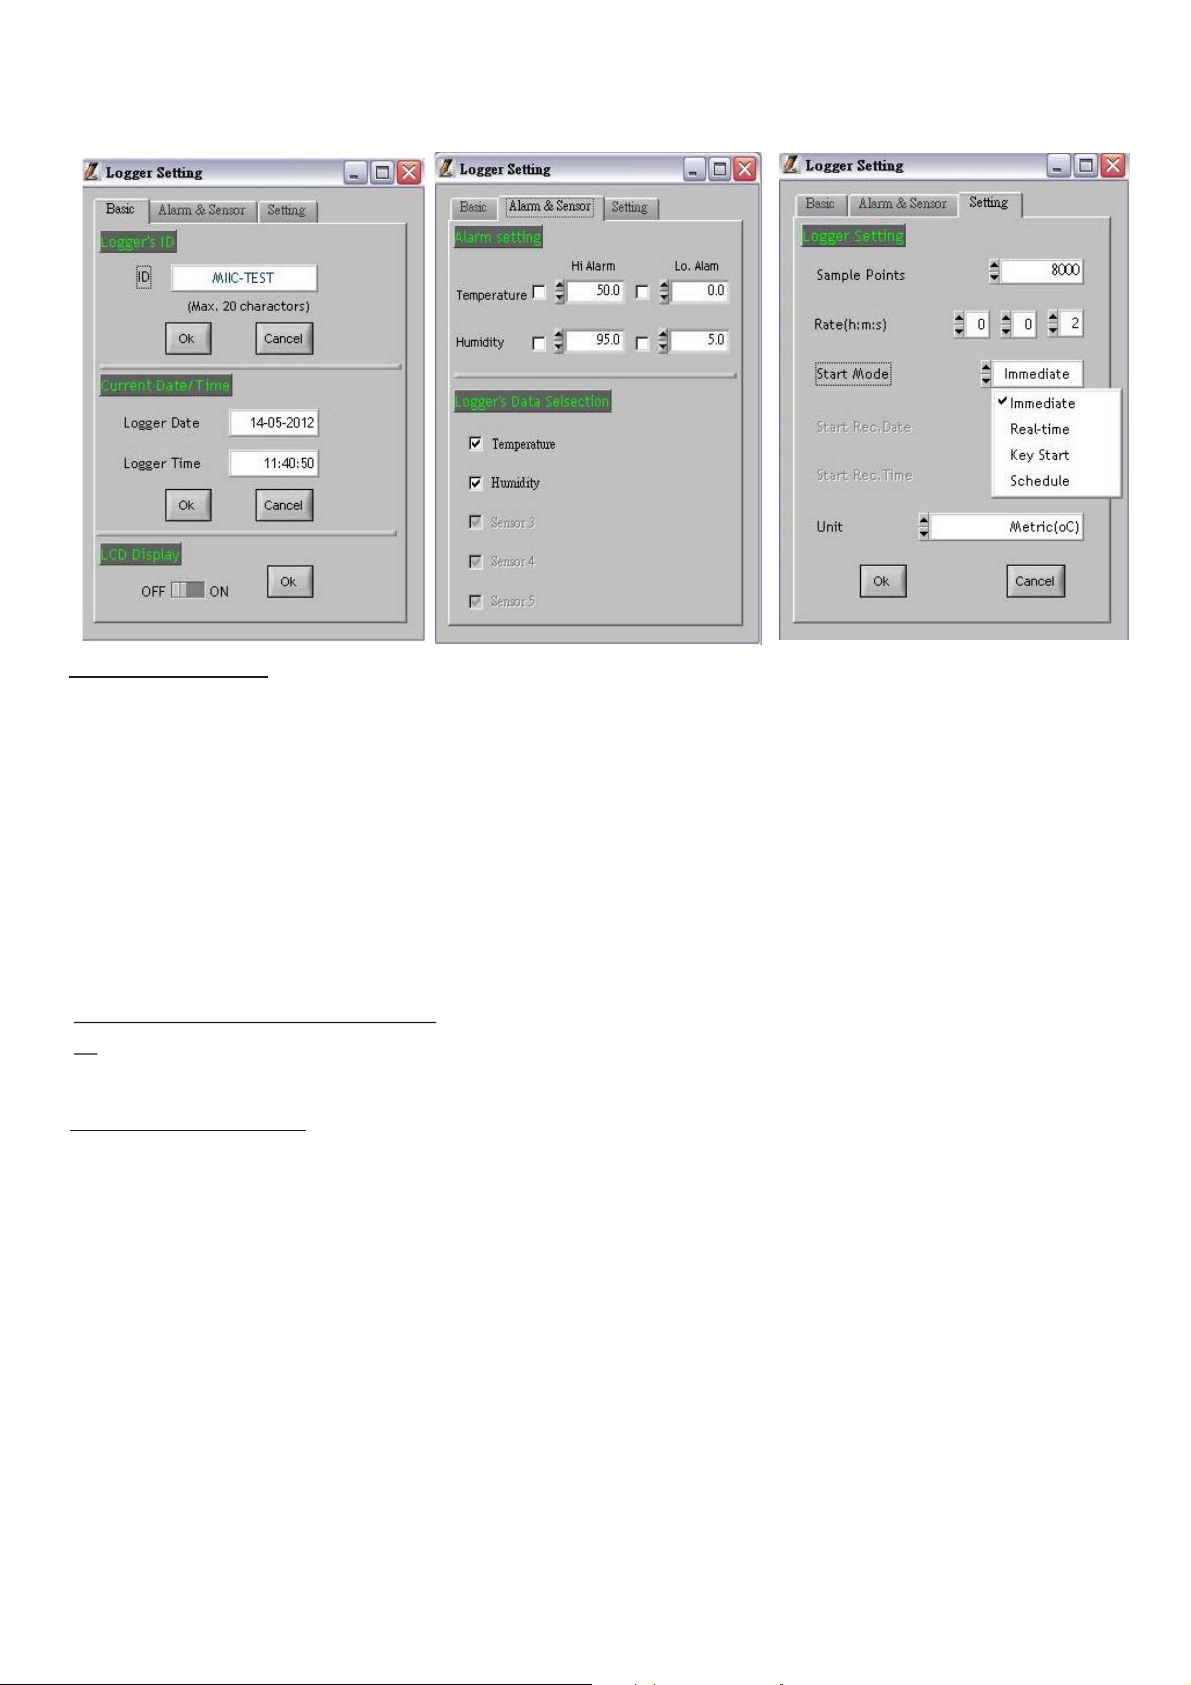
Logger Setting:
(Pic.3)
BASIC:(Pic.3)
1:ID setting
Maximum 20 characters , name your logger ,press OK button to confirm.
(Pic.4)
(Pic.5)
2:Current Date/Time
Clock setting, the system automatically shows current date and time of
your pc. Press OK to confirm.(Note:Schedule date & time refer to current
pc date
3:LCD display set (N/A for non-LCD models)
Press ON ( Logger LCD still illuminated after complete recording ), or OFF(
LCD is not illuminated after complete recording. Press OK after selection.
ALARM&SENSOR:(Pic.4)
Select Temp./Humidity alarm, set Hi/Lo Temp. and H/Lo Humidity values.
Select the parameter you want to record.
SETTING:(Pic.5)
1: Set sample point (K=1,000 multiple basis within total memory points)
For examples:
16K memory store 8,000 points each of 2 parameters
store 16,000 points of selected parameter
32K memory store 16,000 points each of 2 parameters
or store 32,000 points of selected parameter
Press OK to confirm the sample points and parameters.
2:Select Unit : Select Temperature unit °C/°F,press OK to confirm.
3:Set sample rate, start mode to record
Select “second(0~59)” time interval.
Select 5 start modes from: ”Immediately”,“Schedule”,“Real-time” (PC is
always connected with the logger unit),”Key start” (Start recording by
pressing button) .
“hour(1~6), “minute(0~59)”,
and “Roll-over”
15
Page 18
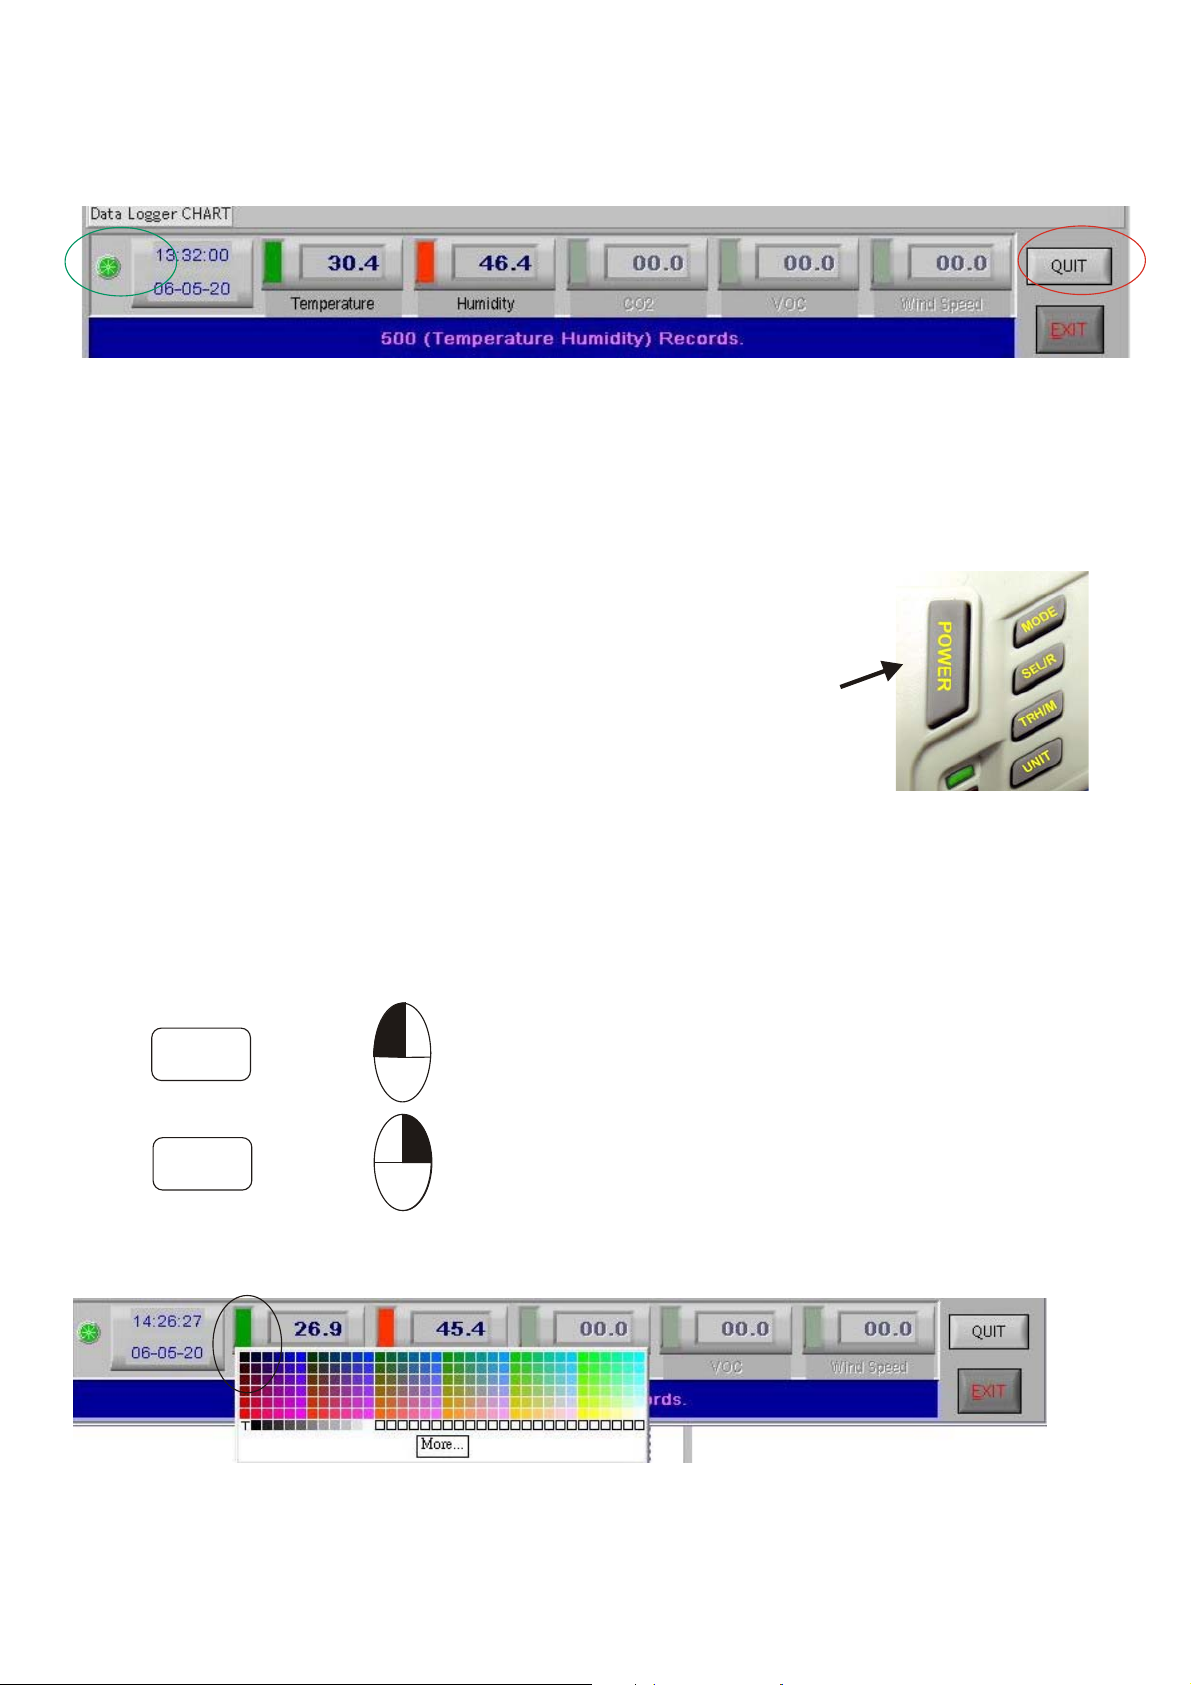
Schedule start mode:
Select the date and time to start recording.
Real-time start mode:
1.After set start mode at real-time,datalogger starts login
records. When logger records, the green LED at left corner shows
it is under recording.
2.In real-time mode, it shows “QUIT” button instead of
“DOWNLOAD” at the right corner. Press QUIT to stop real-time
recording.
Key-start mode:
Press
Select the mode to record once press the
POWER button.
Roll-over mode:
Select the mode to record after download the data without
reset up each parameter and selection.
Only “Real-time” mode roll-over when data is full.
Zoom in/out
Hold
Hold
Ctrl
Ctrl
Click left key
+
Click right key
+
Mouse
Mouse
Screen graph zoom in
=
Screen graph zoom out
=
Line color selecting:
1.Click the color beside the reading(Temp. RH), color box shows below.
2.Move mouse to review and select color.
3.Click to save, the color appear on line and bar.
16
Page 19
Logger function:
Download data:
Press DOWNLOAD button, data download in few seconds. Graph shows
automatically
NOTE: Please do not press DOWNLOAD button if you won’t stop record.
You can press LOGGER STATUS button to see record points.
Data area/Message area
Next to “DOWNLOAD” button, data area shows the cursor parameter’s
value. Next to “EXIT” button shows “Reminder and Warning “ message.
Retrieve file:
Press RETRIEVE FILE button to select file and show the graph.
Save data:
Press SAVE button to save txt. file. Or Excel , PDF file (Available
soon by updating newest logger software version)
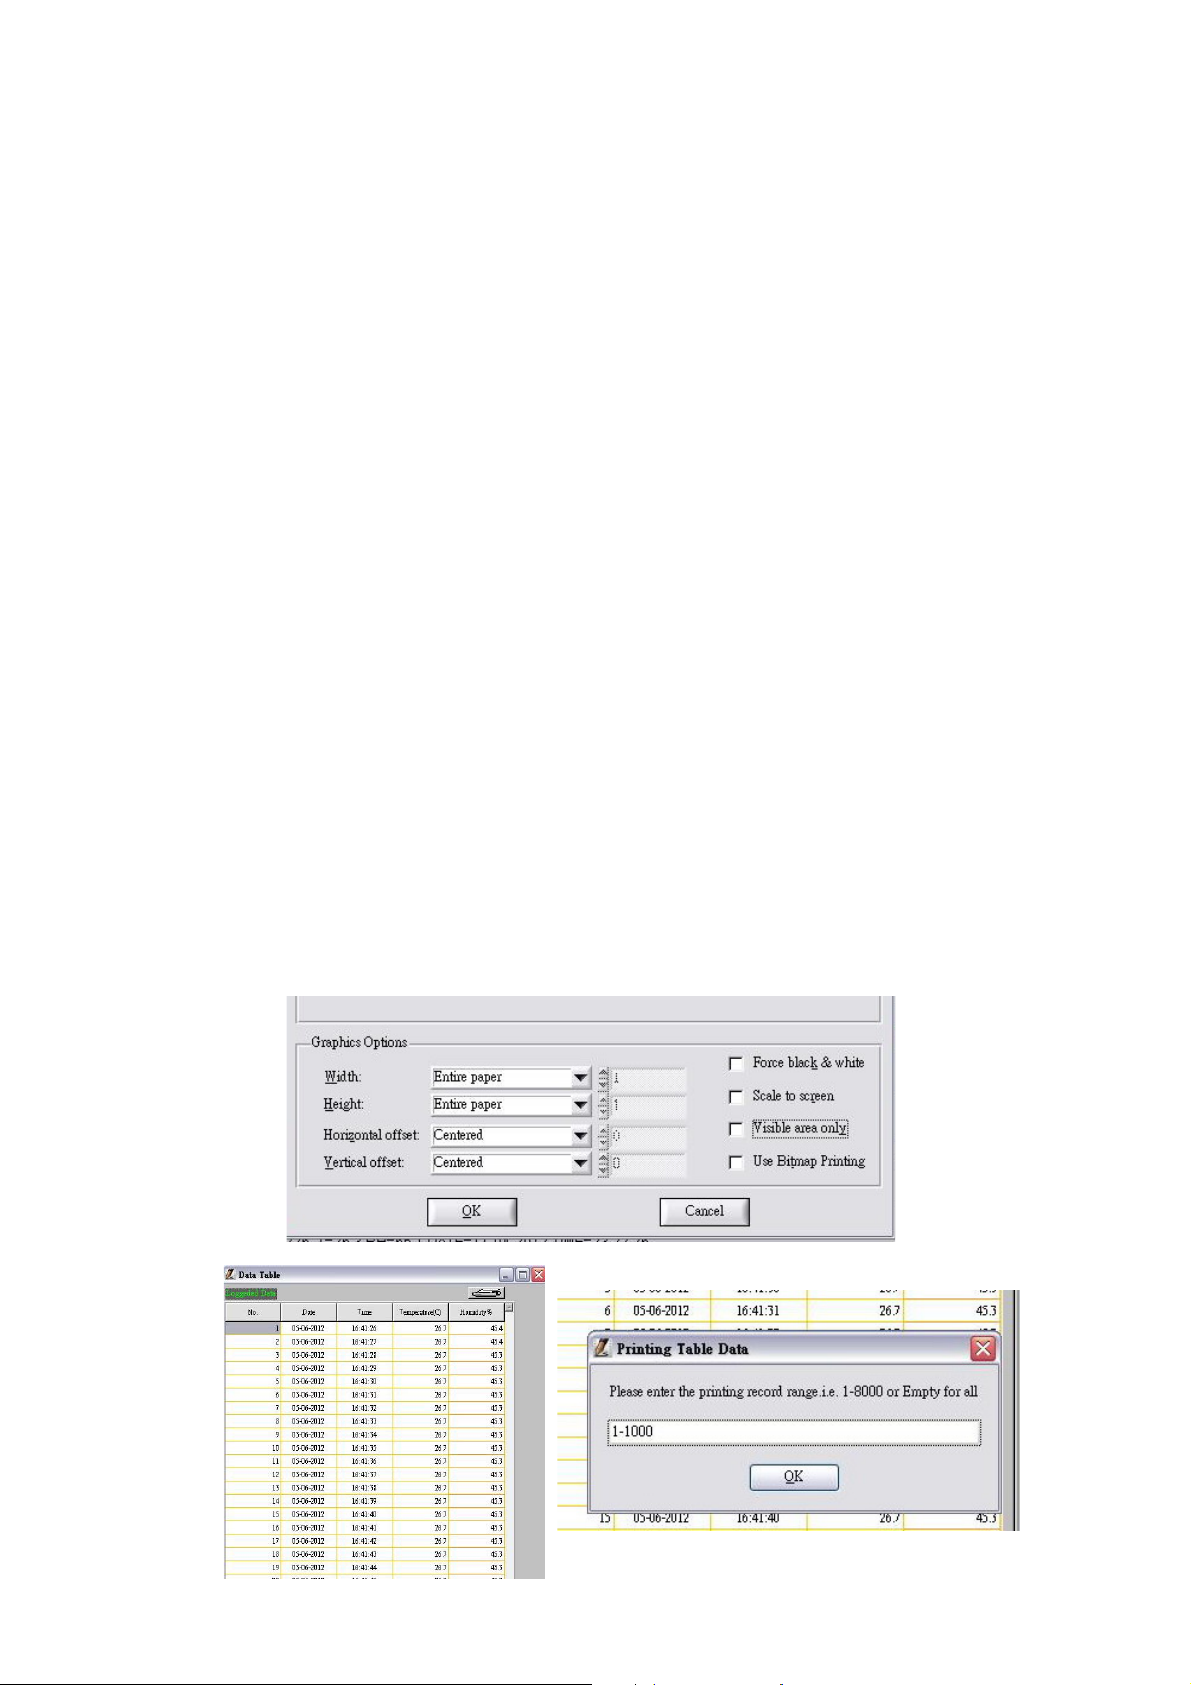
Print graph:
Press PRINT button and print graph. Follow the print setting below
to print full screen graph. Press OK to print pdf file.(pic.6)
View Data Table:
Press View button to get data table with details.(pic.7)
Print Table Data:
Press table data, the screen shows the record range, enter the start
number to the end number (For example: 1~500 or 200~1000...or
leave it blank for printing all data ).(pic.8)
√
√
(pic.6)
(pic.7)
(pic.8)
17
Page 20

98136 98138 98536 98538
98137 98139 98537 98539
Backlight
display
SPECIFICATIONS
-137 (YES) -139 (YES) -537(YES) -539(YES)
CO2 meas.
Range
CO2
accuracy
Audible
alarm
Hi/Lo
threshold
setting
Logger
mode
Temp.rang
e
Temp.
accuracy
0~9999 ppm
±75ppm+5% of rdg (0~2000ppm), others out of specified
N/A
N/A
N/A N/A YES YES
-10~50к -40~85к -10~50к -40~85к
±0.6к (-10~50к), others ±1.2к
YES
YES
RH range
RH
accuracy
TWA.STEL N/A YES N/A YES
VENT rate:
lps%,
cfm/P
Dew Point
Temp.
Wet Bulb
Temp.
USB
Interface
N/A N/A N/A YES
N/A YES N/A YES
N/A YES N/A YES
±5%RH( at25к ,10~90RH), others ±7%RH
0.1% ~ 99.9%RH10.0% ~ 90.0%RH
YESN/A
18
Page 21

TROUBLE SHOOTING
(1) When meter appears break character, please find
out if meter ever dropped to the floor. If “yes”,
please contact with local distributor for technical
service.
(2) Error codes:
E-1 : CO2 sensor is failed
E-2 : Humidity sensor is failed
E-3 : Temp. sensor is failed
E-4 : Operation Temp. is too high
E-5 : Operation Temp. is too low
E-6 : Some hardware are failed
Note: If above error codes appear on the display,
please contact with local distributor for technical
service.
CE CERTIFICATE
The product complies with EMC directive 2004/108/EC
Technical standard:
Emission
EN 61326-1:2006 Class B
EN 55011:2009/A1:2010 Group 1 Class B
Immunity
EN 61326-1:2006
EN 61000-4-2:2009
EN 61000-4-3:2006/A2:2010
19
Page 22

WARRANTY
This instrument is warranted for two years from the date of
purchase (One year limited warranty applies to cables). A
Return Authorization letter must be issued before returning
for any reason. This warranty does not apply to defects
resulting from action of the user such as misuse, abuse,
alteration neglect, improper wiring, improper maintenance or
repair, or unauthorized modification, damage resulting from
leaking batteries, operation outside of specification.
During the warranty period the manufacturer reserved the
right to decide either to repair or replace the product. The
meters are to be returned along with good packing to prevent
any damage in shipment and insured against possible
damage or loss.
The two years’ warranty doesn’t apply to:
Accessories and batteries (not covered by
warranty).
Claims is not acceptable for improper use (including
adaptation to particular applications not foreseen in
the instructions manual) or improper combination
with incompatible accessories or equipment, or by
previous attempts for repair carried out by none
skilled or unauthorized personnel.
20
Page 23

CO2 LEVELS AND GUIDELINES
Non-enforced reference levels:
a) 250~350ppm– Background (normal) outdoor air
level.
b) 350~1,000ppm – Typical level found in occupied
spaces with good air exchange.
c) 1,000~2,000ppm – Level associated with
complaints of drowsiness and poor air.
d) 2,000~5,000ppm – Level associated with
headaches, sleepiness, and stagnant, stale, stuffy
air. Poor concentration, loss of attention,
increased heart rate and slight nausea may also be
present.
e) > 5,000 ppm – Exposure may lead to serious
oxygen deprivation resulting in permanent brain
damage, coma and even death.
Regulatory exposure limits:
ASHRAE Standard 62-1989: 1000ppm. CO2
concentration in occupied building should not exceed
1000ppm.
OSHA: 5000ppm: Time weighted average over five 8-hour
work days should not exceed 5000ppm
Building bulletin 101 (Bb101): 1500ppm. UK standards
for schools say that CO2 at averaged over the whole
day(i.e. 9am to 3.30 pm) should not exceed 1500ppm.
Germany, Japan, Australia, UK...: 5000ppm. 8 hours
weighted average in occupational exposure limit is
5000ppm.
21
 Loading...