

Page 1
Energy Master
MI 2883
Instruction manual
Version 2.1.1, Code No. 20 752 521
Page 2

Distributor:
Mark on your equipment certifies that this equipment meets the requirements of the EU
(European Union) concerning safety and interference causing equipment regulations
Manufacturer:
METREL d.d.
Ljubljanska cesta 77
1354 Horjul
Slovenia
web site: http://www.metrel.si
e-mail: metrel@metrel.si
© 2016 METREL
No part of this publication may be reproduced or utilized in any form or by any means
without permission in writing from METREL.
2
Page 3

MI 2883 Energy Master Table of contents
1 Introduction ........................................................................................................... 7
1.1 Main Features .................................................................................................. 7
1.2 Safety considerations ....................................................................................... 8
1.3 Applicable standards ........................................................................................ 9
1.4 Abbreviations ................................................................................................. 10
2 Description ................................................................................................ .......... 19
2.1 Front panel ..................................................................................................... 19
2.2 Connector panel ............................................................................................. 20
2.3 Bottom view ................................................................................................... 21
2.4 Accessories .................................................................................................... 21
2.4.1 Standard accessories .............................................................................. 21
2.4.2 Optional accessories ............................................................................... 21
3 Operating the instrument ................................................................................... 22
3.1 Instrument status bar ..................................................................................... 23
3.2 Instrument keys .............................................................................................. 23
3.3 Instrument memory (microSD card)................................................................ 24
3.4 Instrument Main Menu.................................................................................... 25
3.4.1 Instrument submenus .............................................................................. 26
3.5 U, I, f ................................ ................................ .............................................. 28
3.5.1 Meter ....................................................................................................... 28
3.5.2 Scope ...................................................................................................... 30
3.5.3 Trend ...................................................................................................... 32
3.6 Power ............................................................................................................. 33
3.6.1 Meter ....................................................................................................... 34
3.6.2 Trend ...................................................................................................... 36
3.7 Energy ........................................................................................................... 39
3.7.1 Meter ....................................................................................................... 39
3.7.2 Trend ...................................................................................................... 40
3.7.3 Efficiency ................................................................................................ 41
3.8 Harmonics / interharmonics ............................................................................ 44
3.8.1 Meter ....................................................................................................... 44
3.8.2 Histogram (Bar) ....................................................................................... 46
3.8.3 Harmonics Average Histogram (Avg Bar) ................................................ 47
3.8.4 Trend ...................................................................................................... 49
3.9 Flickers .......................................................................................................... 51
3.9.1 Meter ....................................................................................................... 51
3.9.2 Trend ...................................................................................................... 52
3.10 Phase Diagram .............................................................................................. 54
3.10.1 Phase diagram ........................................................................................ 54
3.10.2 Unbalance diagram ................................................................................. 55
3.10.3 Unbalance trend ...................................................................................... 57
3.11 Temperature .................................................................................................. 58
3.11.1 Meter ....................................................................................................... 58
3.11.2 Trend ...................................................................................................... 59
3.12 Underdeviation and overdeviation .................................................................. 59
3.12.1 Meter ....................................................................................................... 59
3.12.2 Trend ...................................................................................................... 60
3.13 Signalling ....................................................................................................... 62
3.13.1 Meter ....................................................................................................... 62
3.13.2 Trend ...................................................................................................... 63
3
Page 4

MI 2883 Energy Master Table of contents
3.13.3 Table ....................................................................................................... 64
3.14 General Recorder ........................................................................................... 65
3.15 Events table ................................................................................................... 67
3.16 Alarms table ................................................................................................... 71
3.17 Rapid voltage changes (RVC) table ............................................................... 73
3.18 Memory List ................................................................................................... 74
3.18.1 General Record ....................................................................................... 76
3.18.2 Waveform snapshot ................................................................................ 79
3.19 Measurement Setup submenu ....................................................................... 81
3.19.1 Connection setup .................................................................................... 81
3.19.2 Event setup ............................................................................................. 86
3.19.3 Alarm setup ............................................................................................. 88
3.19.4 Signalling setup ....................................................................................... 89
3.19.5 Rapid voltage changes (RVC) setup ....................................................... 90
3.20 General Setup submenu ................................................................................ 91
3.20.1 Time & Date ............................................................................................ 91
3.20.2 Time & Date ............................................................................................ 92
3.20.3 Language ................................................................................................ 92
3.20.4 Instrument info ................................................................ ........................ 93
3.20.5 Lock/Unlock ............................................................................................ 93
3.20.6 Colour model ........................................................................................... 95
4 Recording Practice and Instrument Connection ............................................... 97
4.1 Measurement campaign ................................................................ ................. 97
4.2 Connection setup ......................................................................................... 101
4.2.1 Connection to the LV Power Systems ................................................... 101
4.2.2 Connection to the MV or HV Power System .......................................... 106
4.2.3 Current clamp selection and transformation ratio setting ....................... 107
4.2.4 Temperature probe connection ............................................................. 111
4.2.1 Printing support ..................................................................................... 111
4.3 Instrument connection to powerView v3.0 .................................................... 113
4.4 Number of measured parameters and connection type relationship ............. 121
5 Theory and internal operation .......................................................................... 124
5.1 Measurement methods................................................................................. 124
5.1.1 Measurement aggregation over time intervals ....................................... 124
5.1.2 Voltage measurement (magnitude of supply voltage) ............................ 124
5.1.3 Current measurement (magnitude of supply current) ............................ 125
5.1.4 Frequency measurement ...................................................................... 125
5.1.5 Power measurement (Standard compliance: IEEE 1459-2010) ............. 126
5.1.6 Energy .................................................................................................. 131
5.1.7 Harmonics and interharmonics .............................................................. 132
5.1.8 Signalling .............................................................................................. 134
5.1.9 Flicker ................................................................................................... 135
5.1.10 Voltage and current unbalance.............................................................. 136
5.1.11 Underdeviation and overdeviation ................................ ......................... 136
5.1.12 Voltage events ................................................................ ...................... 137
5.1.13 Alarms ................................................................................................... 141
5.1.14 Rapid voltage changes (RVC) ............................................................... 142
5.1.15 Data aggregation in GENERAL RECORDING ...................................... 143
5.1.16 Flagged data ......................................................................................... 146
5.1.17 Waveform snapshot .............................................................................. 147
4
Page 5

MI 2883 Energy Master Table of contents
5.2 EN 50160 Standard Overview ...................................................................... 147
5.2.1 Power frequency ................................................................................... 148
5.2.2 Supply voltage variations ...................................................................... 148
5.2.3 Supply voltage unbalance ..................................................................... 148
5.2.4 THD voltage and harmonics .................................................................. 148
5.2.5 Interharmonic voltage ............................................................................ 149
5.2.6 Mains signalling on the supply voltage .................................................. 149
5.2.7 Flicker severity ...................................................................................... 149
5.2.8 Voltage dips .......................................................................................... 149
5.2.9 Voltage swells ....................................................................................... 150
5.2.10 Short interruptions of the supply voltage ............................................... 150
5.2.11 Long interruptions of the supply voltage ................................................ 150
5.2.12 Energy Master recorder setting for EN 50160 survey ............................ 150
6 Technical specifications ................................................................................... 152
6.1 General specifications .................................................................................. 152
6.2 Measurements ............................................................................................. 152
6.2.1 General description ............................................................................... 152
6.2.2 Phase Voltages ..................................................................................... 153
6.2.3 Line voltages ......................................................................................... 154
6.2.4 Current ................................ ................................................................ .. 154
6.2.5 Frequency ............................................................................................. 156
6.2.6 Flickers ................................................................................................. 156
6.2.7 Combined power ................................................................................... 156
6.2.8 Fundamental power .............................................................................. 157
6.2.9 Nonfundamental power ......................................................................... 157
6.2.10 Power factor (PF) .................................................................................. 158
6.2.11 Displacement factor (DPF) or Cos φ) .................................................... 158
6.2.12 Energy .................................................................................................. 159
6.2.13 Voltage harmonics and THD ................................................................. 159
6.2.14 Current harmonics, THD and k-factor .................................................... 159
6.2.15 Voltage interharmonics ......................................................................... 160
6.2.16 Current interharmonics .......................................................................... 160
6.2.17 Signalling .............................................................................................. 160
6.2.18 Unbalance ............................................................................................. 160
6.2.19 Overdeviation and Underdeviation ........................................................ 160
6.2.20 Time and duration uncertainty ............................................................... 161
6.2.21 Temperature probe ............................................................................... 161
6.3 Recorders .................................................................................................... 161
6.3.1 General recorder ................................................................................... 161
6.3.2 Waveform snapshot .............................................................................. 162
6.4 Standards compliance .................................................................................. 163
6.4.1 Compliance to the IEC 61557-12 .......................................................... 163
6.4.2 Compliance to the to the IEC 61000-4-30 ............................................. 164
7 Maintenance ...................................................................................................... 165
7.1 Inserting batteries into the instrument ........................................................... 165
7.2 Batteries ....................................................................................................... 166
7.3 Firmware upgrade ................................ ........................................................ 167
7.3.1 Requirements ........................................................................................ 167
7.3.2 Upgrade procedure ............................................................................... 168
7.4 Power supply considerations ........................................................................ 171
5
Page 6

MI 2883 Energy Master Table of contents
7.5 Cleaning ....................................................................................................... 171
7.6 Periodic calibration ....................................................................................... 172
7.7 Service ......................................................................................................... 172
7.8 Troubleshooting ........................................................................................... 172
6
Page 7

MI 2883 Energy Master Introduction
1 Introduction
Energy Master is handheld multifunction instrument for power quality analysis and
energy efficiency measurements.
Figure 1.1: Energy Master instrument
1.1 Main Features
Full compliance with power quality standard IEC 61000-4-30 Class S.
Simple and powerful recorder with microSD memory card (sizes up to 32 GB are
supported).
3 voltage channels with wide measurement range: up to 1000 Vrms, CAT III /
1000 V, with support for medium and high voltage systems.
Simultaneous voltage and current (7 channels) sampling, 16 bit AD conversion
for accurate power measurements and minimal phase shift error.
4 current channels with support for automatic clamp recognition and range
selection.
Compliance with IEC 61557-12 and IEEE 1459 (Combined, fundamental,
nonfundamental power) and IEC 62053-21 (Energy).
7
Page 8
MI 2883 Energy Master Introduction
The instrument has been designed to ensure maximum operator safety. Usage in
a way other than specified in this manual may increase the risk of harm to the
operator!
Do not use the instrument and/or accessories if any visible damage is noticed!
The instrument contains no user serviceable parts. Only an authorized dealer
can carry out service or adjustment!
All normal safety precautions have to be taken in order to avoid risk of electric
shock when working on electrical installations!
Only use approved accessories which are available from your distributor!
Instrument contains rechargeable NiMH batteries. The batteries should only be
replaced with the same type as defined on the battery placement label or in this
manual. Do not use standard batteries while power supply adapter/charger is
connected, otherwise they may explode!
Hazardous voltages exist inside the instrument. Disconnect all test leads,
remove the power supply cable and switch off the instrument before removing
battery compartment cover.
Maximum nominal voltage between any phase and neutral input is 1000 V
RMS
.
Maximum nominal voltage between phases is 1730 V
RMS
.
4.3’’ TFT colour display.
Powerful troubleshooting tools: transient recorder with envelope and level
triggering.
PC Software PowerView v3.0 is an integral part of a measuring system which
provides easiest way to download, view and analyse measured data or print
reports.
o PowerView v3.0 analyser exposes a simple but powerful interface for
downloading instrument data and getting quick, intuitive and descriptive
analysis. Interface has been organized to allow quick selection of data
using a Windows Explorer-like tree view.
o User can easily download recorded data, and organize it into multiple sites
with many sub-sites or locations.
o Generate charts, tables and graphs for your power quality data analysing,
and create professional printed reports.
o Export or copy / paste data to other applications (e.g. spreadsheet) for
further analysis.
o Multiple data records can be displayed and analysed simultaneously.
o Merge different logging data into one measurement, synchronize data
recorded with different instruments with time offsets, split logging data into
multiple measurements, or extract data of interest.
1.2 Safety considerations
To ensure operator safety while using the Energy Master instruments and to minimize
the risk of damage to the instrument, please note the following general warnings:
8
Page 9

MI 2883 Energy Master Introduction
Always short unused voltage inputs (L1, L2, L3) with neutral (N) input to prevent
measurement errors and false event triggering due to noise coupling.
Do not remove microSD memory card while instrument is recording or reading
data. Record damage and card failure can occur.
Electromagnetic compatibility(EMC)
EN 61326-2-2: 2013
Electrical equipment for measurement, control
and laboratory use – EMC requirements –
Part 2-2: Particular requirements - Test
configurations, operational conditions and
performance criteria for portable test, measuring
and monitoring equipment used in low-voltage
distribution systems
Emission: Class A equipment (for industrial
purposes)
Immunity for equipment intended for use in
industrial locations
Safety (LVD)
EN 61010-1: 2010
Safety requirements for electrical equipment for
measurement, control and laboratory use –
Part 1: General requirements
EN 61010-2-030: 2010
Safety requirements for electrical equipment for
measurement, control and laboratory use –
Part 2-030: Particular requirements for testing and
measuring circuits
EN 61010-031: 2002 + A1: 2008
Safety requirements for electrical equipment for
measurement, control and laboratory use –
Part 031: Safety requirements for hand-held
probe assemblies for electrical measurement and
test
EN 61010-2-032: 2012
Safety requirements for electrical equipment for
measurement, control and laboratory use
Part 031: Safety requirements for hand-held
probe assemblies for electrical measurement and
test
Measurement methods
IEC 61000-4-30: 2015 Class S
Part 4-30: Testing and measurement techniques –
Power quality measurement methods
IEC 61557-12: 2007
Equipment for testing, measuring or monitoring of
protective measures – Part 12: Performance
measuring and monitoring devices (PMD)
IEC 61000-4-7: 2002 + A1: 2008
Part 4-7: Testing and measurement techniques –
General guide on harmonics and interharmonics
measurements and instrumentation for power
1.3 Applicable standards
The Energy Master are designed and tested in accordance with the following standards:
9
Page 10

MI 2883 Energy Master Introduction
supply systems and equipment connected thereto
IEC 61000-4-15 : 2010
Part 4-15: Testing and measurement techniques –
Flickermeter – Functional and design
specifications
IEC 62053-21 : 2003
Part 21: Static meters for active energy (Class 1)
IEC 62053-23 : 2003
Part 23: Static meters for reactive energy (Class
2)
IEEE 1459 : 2010
IEEE Standard Definitions for the Measurement of
Electric Power Quantities Under Sinusoidal,
Nonsinusoidal, Balanced, or Unbalanced
Conditions
EN 50160 : 2010
Voltage characteristics of electricity supplied by
public electricity networks
GOST R 54149 : 2010
Electric energy. Electromagnetic compatibility of
technical equipment. Power quality limits in the
public power supply systems
CF
I
Current crest factor, including CF
Ip
(phase p current crest
factor) and CF
IN
(neutral current crest factor). See 5.1.3
for definition.
CF
U
Voltage crest factor, including CF
Upg
(phase p to phase g
voltage crest factor) and CF
Up
(phase p to neutral voltage
crest factor). See 5.1.2 for definition.
DPF
ind/cap
Instantaneous phase power displacement (fundamental)
power factor or cos , including DPFp
ind
(phase p power
displacement).
Minus sign indicates generated power and plus sign
indicates consumed power. Suffix ind/cap represents
inductive/capacitive character.
Note about EN and IEC standards:
Text of this manual contains references to European standards. All standards of EN
6XXXX (e.g. EN 61010) series are equivalent to IEC standards with the same number
(e.g. IEC 61010) and differ only in amended parts required by European harmonization
procedure.
1.4 Abbreviations
In this document following symbols and abbreviations are used:
10
Page 11
MI 2883 Energy Master Introduction
DPF
ind/cap
Recorded phase displacement (fundamental) power
factor or cos , including DPFp
ind/cap
(phase p power
displacement).
Minus sign indicates generated
power and plus sign indicates
consumed power. Suffix
ind/cap represents inductive/
capacitive character. This
parameter is recorded
separately for each quadrant
as shown on figure. See 5.1.5
for definition.
DPF
+
totind
DPF
+
totcap
Instantaneous positive sequence fundamental power
factor.
Minus sign indicates generated power and plus sign
indicates consumed power. Suffix ind/cap represents
inductive/capacitive character. See 5.1.5 for definition.
DPF
+
totind
DPF
+
totcap
Recorded total effective
fundamental power factor.
Minus sign indicates generated
power and plus sign indicates
consumed power. Suffix ind/cap
represents inductive/capacitive
character. This parameter is
recorded separately as shown
on figure. See 5.1.5 for
definition.
Dı
Phase current distortion power, including Dıp (phase p
current distortion power). See 5.1.5 section: Power
measurement (Standard compliance: IEEE 1459-2010)
for definition.
Deı
tot
Total effective current distortion power. See 5.1.5 section:
Power measurement (Standard compliance: IEEE 1459-
2010) for definition.
DH
Phase harmonics distortion power, including DHp (phase
p harmonics distortion power). See 5.1.5 section: Power
measurement (Standard compliance: IEEE 1459-2010)
for definition.
DeH
Total effective harmonics distortion power. See 5.1.5
section: Total nonfundamental power measurements for
definition.
Dᴠ
Phase voltage distortion power, including Dᴠp (phase p
voltage distortion power). See 5.1.5 section: Power
measurement (Standard compliance: IEEE 1459-2010)
for definition.
Deᴠ
tot
Total effective voltage distortion power. See 5.1.5
270
0
DPFind+
Lead
Lag
DPFcap+
DPFcap-
DPFind-
180
0
90
0
0
0
+P-P
-Q
+Q
I
II
III IV
270
0
Lead
Lag
180
0
90
0
0
0
+P-P
-Q
+Q
I
II
III IV
DPF
+
totind+
DPF
+
totcap+
DPF
+
totcap-
DPF
+
totind-
11
Page 12

MI 2883 Energy Master Introduction
section: Power measurement (Standard compliance:
IEEE 1459-2010) for definition.
Ep
Recorded phase combined (fundamental and
nonfundamental) active energy, including Ep
p
+/-
(phase p
active energy). Minus sign indicates generated energy
and plus sign indicates consumed energy. See 5.1.6 for
definition.
Ep
tot
Recorded total combined (fundamental and
nonfundamental) active energy. Minus sign indicates
generated and plus sign indicates consumed energy. See
5.1.6 for definition.
Eq
Recorded phase fundamental reactive energy, including
Eq
p
+/-
(phase p reactive energy). Minus sign indicates
generated and plus sign indicates consumed energy. See
5.1.6 for definition.
Eq
tot
Recorded total fundamental reactive energy. Minus sign
indicates generated and plus sign indicates consumed
energy. See 5.1.6 for definition.
f, freq
Frequency, including freq
U12
(voltage frequency on U12),
freqU1 (voltage frequency on U1 and freqI1 (current
frequency on I1). See 5.1.4 for definition.
i-
Negative sequence current ratio (%). See 5.1.10 for
definition.
i0
Zero sequence current ratio (%). See 5.1.10 for definition.
I
+
Positive sequence current component on three phase
systems. See 5.1.10 for definition.
I-
Negative sequence current component on three phase
systems. See 5.1.10 for definition.
I0
Zero sequence current components on three phase
systems. See 5.1.10 for definition.
I
Rms(1/2)
RMS current measured over 1 cycle, commencing at a
fundamental zero crossing on an associated voltage
channel, and refreshed each half-cycle, including Ip
Rms(1/2)
(phase p current), I
NRms(1/2)
(neutral RMS current)
Ifund
Fundamental RMS current Ih1 (on 1st harmonics),
including Ifundp (phase p fundamental RMS current) and
IfundN (neutral RMS fundamental current). See 5.1.7 for
definition
Ih
n
nth current RMS harmonic component including Iph
n
(phase p; nth RMS current harmonic component) and INh
n
(neutral nth RMS current harmonic component). See 5.1.7
for definition
Iih
n
nth current RMS interharmonic component including Ipih
n
(phase p; nth RMS current interharmonic component) and
INih
n
(neutral n
th
RMS current interharmonic component).
12
Page 13

MI 2883 Energy Master Introduction
See 5.1.7 for definition
I
Nom
Nominal current. Current of clamp-on current sensor for 1
Vrms at output.
I
Pk
Peak current, including IpPk (phase p current) including INPk
(neutral peak current)
I
Rms
RMS current, including IpRms (phase p current), INRms
(neutral RMS current). See 5.1.3 for definition.
P
Instantaneous phase active
combined (fundamental and
nonfundamental) power,
including Pp (phase p active
power). Minus sign indicates
generated and plus sign
indicates consumed power. See
5.1.5 for definitions.
P
Recorded phase active (fundamental and
nonfundamental) power, including P
p
(phase p active
power). Minus sign indicates generated and plus sign
indicates consumed power. See 5.1.5 for definitions.
P
tot
Instantaneous total active
combined (fundamental and
nonfundamental) power. Minus
sign indicates generated and
plus sign indicates consumed
power. See 5.1.5 for definitions.
P
tot
Recorded total active (fundamental and nonfundamental)
power. Minus sign indicates generated and plus sign
indicates consumed power. See 5.1.5 for definitions.
Pfund
Instantaneous active fundamental power, including
Pfund
p
(phase p active fundamental power). Minus sign
indicates generated and plus sign indicates consumed
power. See 5.1.5 for definitions.
Pfund+
Recorded phase active fundamental power, including
Pfund
p
(phase p active fundamental power). Minus sign
indicates generated and plus sign indicates consumed
power. See 5.1.5 for definitions.
P+,
P
+
tot
Instantaneous positive sequence of total active
fundamental power. Minus sign indicates generated and
plus sign indicates consumed power.
See 5.1.5 for definitions.
P
+
tot
Recorded positive sequence of total active fundamental
power. Minus sign indicates generated and plus sign
270
0
Lead
Lag
180
0
90
0
0
0
+P
-P
I
II
III IV
+P-P
270
0
Lead
Lag
180
0
90
0
0
0
+Ptot
I
II
III IV
+Ptot
-Ptot
-Ptot
13
Page 14

MI 2883 Energy Master Introduction
indicates positive sequence of consumed power.
See 5.1.5 for definitions.
P
H
Instantaneous phase active harmonic power, including
P
Hp
(phase p active harmonic power). Minus sign
indicates generated and plus sign indicates consumed
power. See 5.1.5 for definitions.
P
H
Recorded phase active harmonics power, including P
Hp
(phase p active harmonic power). Minus sign indicates
generated and plus sign indicates consumed power. See
5.1.5 for definitions.
P
Htot
Instantaneous total active harmonic power. Minus sign
indicates generated and plus sign indicates consumed
power. See 5.1.5 for definitions.
P
Htot
Recorded total active harmonics power. Minus sign
indicates generated and plus sign indicates consumed
active power. See 5.1.5 for definitions.
PF
ind
PF
cap
Instantaneous phase combined
(fundamental and
nonfundamental) power factor,
including PFpind/cap (phase p
power factor). Minus sign
indicates generated power and
plus sign indicates consumed
power. Suffix ind/cap
represents inductive/capacitive
character.
Note: PF = DPF when harmonics are not present. See
5.1.5 for definition.
PF
ind
PF
cap
Recorded phase combined
(fundamental and
nonfundamental) power factor.
Minus sign indicates generated
power and plus sign indicates
consumed power. Suffix
ind/cap represents inductive/
capacitive character. This
parameter is recorded separately for each quadrant as
shown on figure.
PFe
totind
PFe
totcap
Instantaneous total effective combined (fundamental and
nonfundamental) power factor.
Minus sign indicates generated power and plus sign
indicates consumed power. Suffix ind/cap represents
inductive/capacitive character. See 5.1.5 for definition.
PFe
totind
Recorded total effective combined (fundamental and
nonfundamental) power factor.
270
0
+PFind
Lead
Lag
+PFcap
-PFcap
-PFind
180
0
90
0
0
0
+P-P
-Q
+Q
I
II
III IV
270
0
PFind
+
Lead
Lag
PFcap
+
PFcap
-
PFind
-
180
0
90
0
0
0
+P-P
-Q
+Q
I
II
III IV
14
Page 15

MI 2883 Energy Master Introduction
PFe
totcap
Minus sign indicates
generated power and plus sign
indicates consumed power.
Suffix ind/cap represents
inductive/capacitive character.
This parameter is recorded
separately for each quadrant
as shown on figure.
P
lt
Phase long term flicker (2 hours), including P
ltpg
(phase p
to phase g long term voltage flicker) and P
ltp
(phase p to
neutral long term voltage flicker). See 5.1.9 for definition.
Pst
Short term flicker (10 minutes) including P
stpg
(phase p to
phase g short term voltage flicker) and P
stp
(phase p to
neutral voltage flicker). See 5.1.9 for definition.
P
st(1min)
Short term flicker (1 minute) including P
st(1min)pg
(phase p
to phase g short term voltage flicker) and P
st(1min)p
(phase
p to neutral voltage flicker). See 5.1.9 for definition.
P
inst
Instantaneous flicker including P
instpg
(phase p to phase g
instantaneous voltage flicker) and P
instp
(phase p to
instantaneous voltage flicker). See 5.1.9 for definition.
N
Instantaneous combined (fundamental and
nonfundamental) nonactive phase power including Np
(phase p nonactive phase power). Minus sign indicates
generated and plus sign indicate consumed nonactive
power. See 5.1.5 for definition.
N
ind
N
cap
Recorded phase combined
(fundamental and
nonfundamental) nonactive
power including N
cap/ind
p (phase
p nonactive phase power).
Suffix ind/cap represents
inductive/capacitive character.
Minus sign indicates generated
and plus sign indicates consumed fundamental reactive
power. This parameter is recorded separately for each
quadrant as shown on figure. See 5.1.5 for definition.
Qfund
Instantaneous fundamental reactive phase power
including Qp (phase p reactive phase power). Minus sign
indicates generated and plus sign indicates consumed
fundamental reactive power. See 5.1.5 for definition.
270
0
PFetotind
+
Lead
Lag
PFetotcap
+
PFetotcap
-
PFetotind
-
180
0
90
0
0
0
+P-P
-Q
+Q
I
II
III IV
270
0
Nind
+
Lead
Lag
Ncap
-
Ncap
+
Nind
-
180
0
90
0
0
0
+P-P
-Q
+Q
I
II
III IV
15
Page 16

MI 2883 Energy Master Introduction
Qfund
ind
Qfund
cap
Recorded phase fundamental
reactive power. Suffix ind/cap
represents inductive/capacitive
character. Minus sign indicates
generated and plus sign
indicates consumed
fundamental reactive power.
This parameter is recorded
separately for each quadrant as
shown on figure. See 5.1.5 for definition.
Q
+
totcap
Q
+
totind
Instantaneous positive sequence of total fundamental
reactive power. Suffix ind/cap represents inductive/
capacitive character. Minus sign indicates generated and
plus sign indicates consumed reactive power. See 5.1.5
for definition.
Q
+
totind
Q
+
totcap
Recorded positive sequence of total fundamental reactive
power. Suffix ind/cap represents inductive/capacitive
character. Minus sign indicates generated and plus sign
indicates consumed reactive power. This parameter is
recorded separately for each quadrant.
S
Combined (fundamental and nonfundamental) phase
apparent power including Sp (phase p apparent power).
See 5.1.5 for definition.
Se
tot
Combined (fundamental and nonfundamental) total
effective apparent power. See 5.1.5 for definition.
Sfund
Phase fundamental apparent power, including Sfundp
(phase p fundamental apparent power). See 5.1.5 for
definition.
S
+
tot
Positive sequence of total fundamental effective apparent
power. See 5.1.5 for definition.
Sᴜfund
tot
Unbalanced fundamental apparent power. See 5.1.5 for
definition.
Sɴ
Phase nonfundamental apparent power, including Sɴp
(phase p nonfundamental apparent power). See 5.1.5 for
definition.
Seɴ
Total nonfundamental effective apparent power. See
5.1.5 for definition.
Sн
Phase harmonic apparent power, including Sнp (phase p
harmonic apparent power). See 5.1.5 for definition.
Seн
tot
Total harmonic effective apparent power. See 5.1.5 for
definition.
THD
I
Total harmonic distortion current (in % or A), including
THDIp (phase p current THD) and THD
IN
(neutral current
THD). See 5.1.7 for definition
270
0
Qind
+
Lead
Lag
Qcap
-
Qcap
+
Qind
-
180
0
90
0
0
0
+P-P
-Q
+Q
I
II
III IV
16
Page 17

MI 2883 Energy Master Introduction
THDU
Total harmonic distortion voltage related (in % or V)
including THD
Upg
(phase p to phase g voltage THD) and
THDUp (phase p to neutral voltage THD). See 5.1.10 for
definition.
u-
Negative sequence voltage ratio (%). See 5.1.10 for
definition.
u0
Zero sequence voltage ratio (%). See 5.1.10 for
definition.
U, U
Rms
RMS voltage, including U
pg
(phase p to phase g voltage)
and Up (phase p to neutral voltage). See 5.1.2 for
definition.
U
+
Positive sequence voltage component on three phase
systems. See 5.1.10 for definition.
U-
Negative sequence voltage component on three phase
systems. See 5.1.10 for definition.
U0
Zero sequence voltage component on three phase
systems. See 5.1.10 for definition.
U
Dip
Minimal U
Rms(1/2)
voltage measured during dip occurrence
Ufund
Fundamental RMS voltage (Uh1 on 1st harmonics),
including Ufund
pg
(phase p to phase g fundamental RMS
voltage) and Ufundp (phase p to neutral fundamental RMS
voltage). See 5.1.7 for definition
UhN,
nth voltage RMS harmonic component including Upgh
N
(phase p to phase g voltage nth RMS harmonic
component) and Uph
N
(phase p to neutral voltage n
th
RMS
harmonic component). See 5.1.7 for definition.
UihN
nth voltage RMS interharmonic component including
Upgih
N
(phase p to phase g voltage n
th
RMS interharmonic
component) and Upih
N
(phase p to neutral voltage n
th
RMS interharmonic component). See 5.1.7 for definition.
Nth RMS interharmonic voltage component measured
between phases. See 5.1.7 for definition.
U
Int
Minimal U
Rms(1/2)
voltage measured during interrupt
occurrence.
U
Nom
Nominal voltage, normally a voltage by which network is
designated or identified.
U
Over
Voltage overdeviation, difference between the measured
value and the nominal value of a voltage, only when the
measured value is greater than the nominal value.
Voltage overdeviation measured over recorded interval,
expressed in % of nominal voltage including U
pgOver
(phase p to phase g voltage) and UpOver (phase p to
neutral voltage). See 5.1.11 for details.
U
Pk
Peak voltage, including U
pgPk
(phase p to phase g
17
Page 18

MI 2883 Energy Master Introduction
voltage) and UpPk (phase p to neutral voltage)
U
Rms(1/2)
RMS voltage refreshed each half-cycle, including
U
pgRms(1/2)
(phase p to phase g half-cycle voltage) and
Up
Rms(1/2)
(phase p to neutral half-cycle voltage). See
5.1.11 for definition.
U
Swell
Maximal U
Rms(1/2)
voltage measured during swell
occurrence.
U
Sig
Mains signalling RMS voltage, including U
Sigpg
(phase p to
phase g half-cycle signalling voltage) and U
Sig
p (phase p
to neutral half-cycle signalling voltage). Signalling is a
burst of signals, often applied at a non-harmonic
frequency, that remotely control equipment. See 5.2.6 for
details.
U
Under
Voltage underdeviation, difference between the
measured value and the nominal value of a voltage, only
when the voltage is lower than the nominal value. Voltage
underdeviation measured over recorded interval and
expressed in % of nominal voltage, including U
pgUnder
(phase p to phase g voltage) and U
pUnder
(phase p to
neutral voltage). See 5.1.11 for details.
∆U
max
Maximum absolute difference between any of the U
Rms(1/2)
values during the RVC event and the final arithmetic
mean 100/120 U
Rms(1/2)
value just prior to the RVC event.
For poly-phase systems, the ∆U
max
is the largest ∆U
max
on any channel. See 5.1.14 for details.
∆U
ss
Absolute difference between the final arithmetic mean
100/120 U
Rms(1/2)
value just prior to the RVC event and
the first arithmetic mean 100/120 U
Rms(1/2)
value after the
RVC event. For poly-phase systems, the ∆Uss is the
largest ∆Uss on any channel. See 5.1.14 for details.
18
Page 19
MI 2883 Energy Master Description
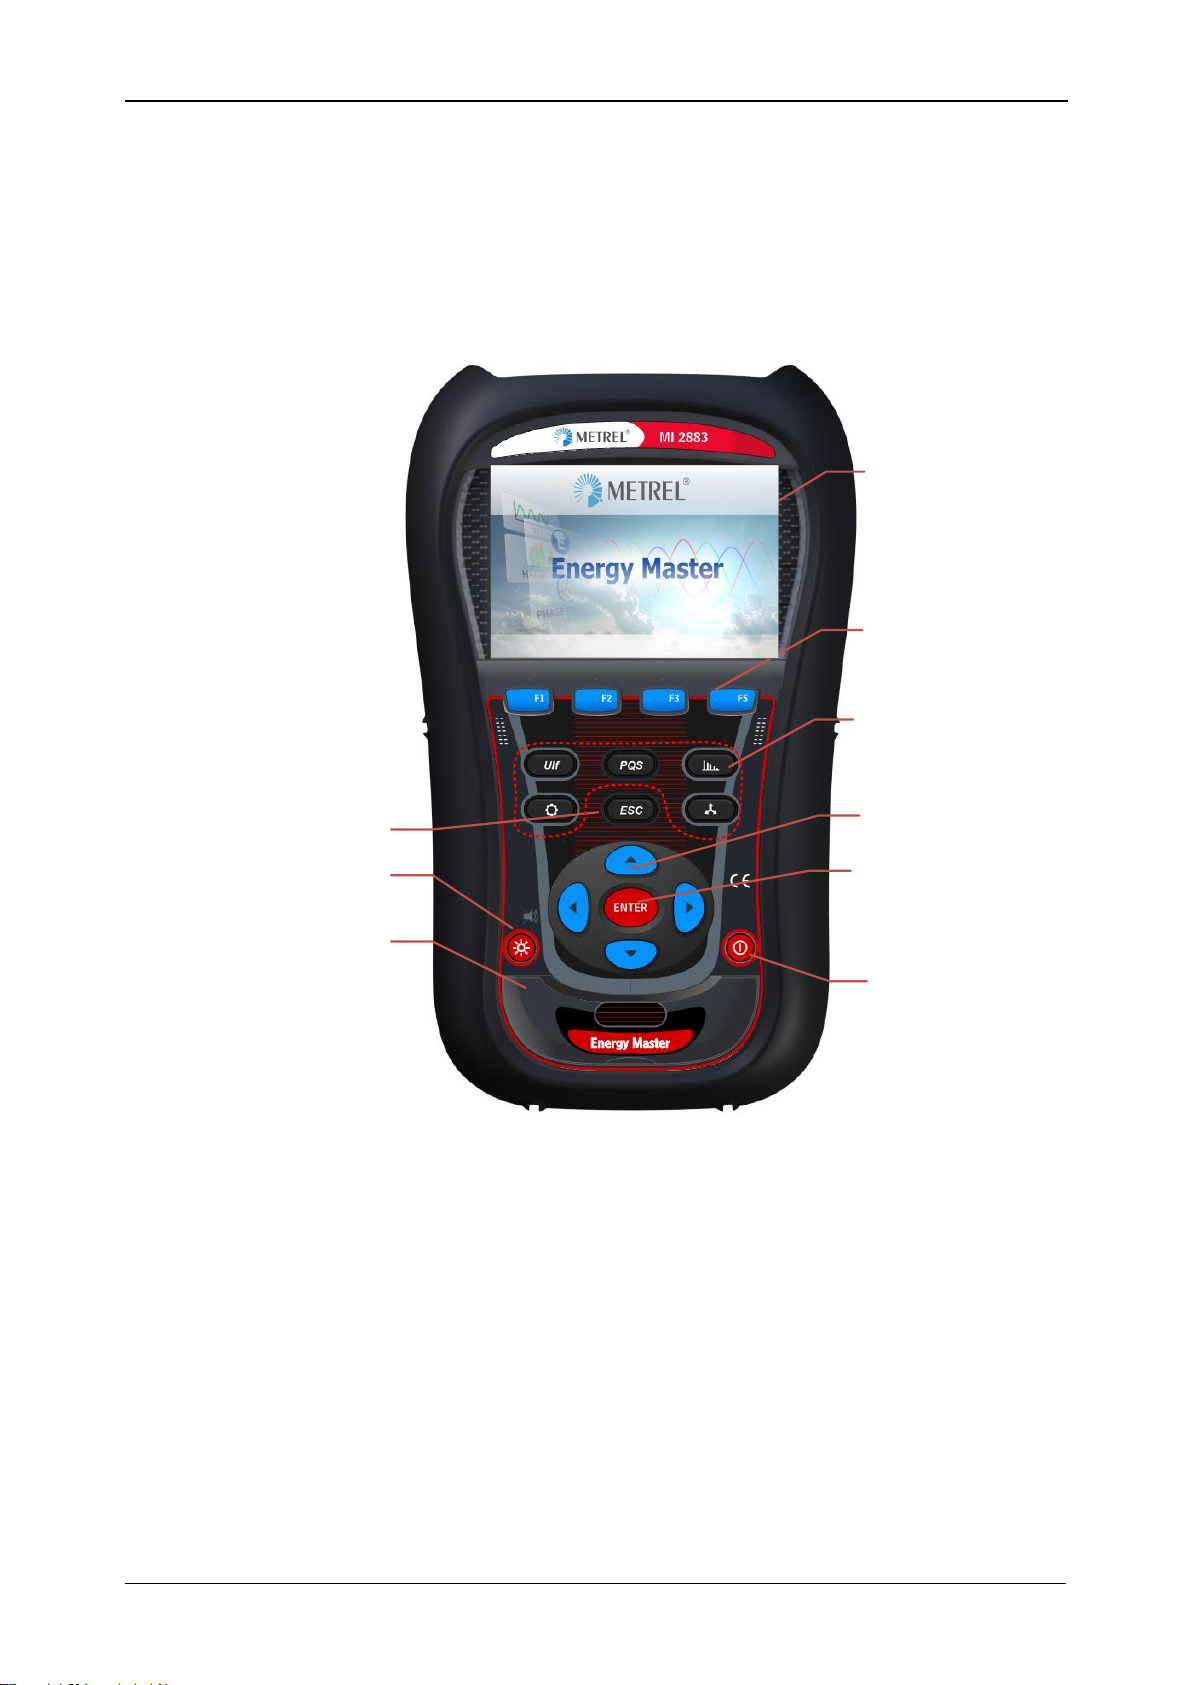
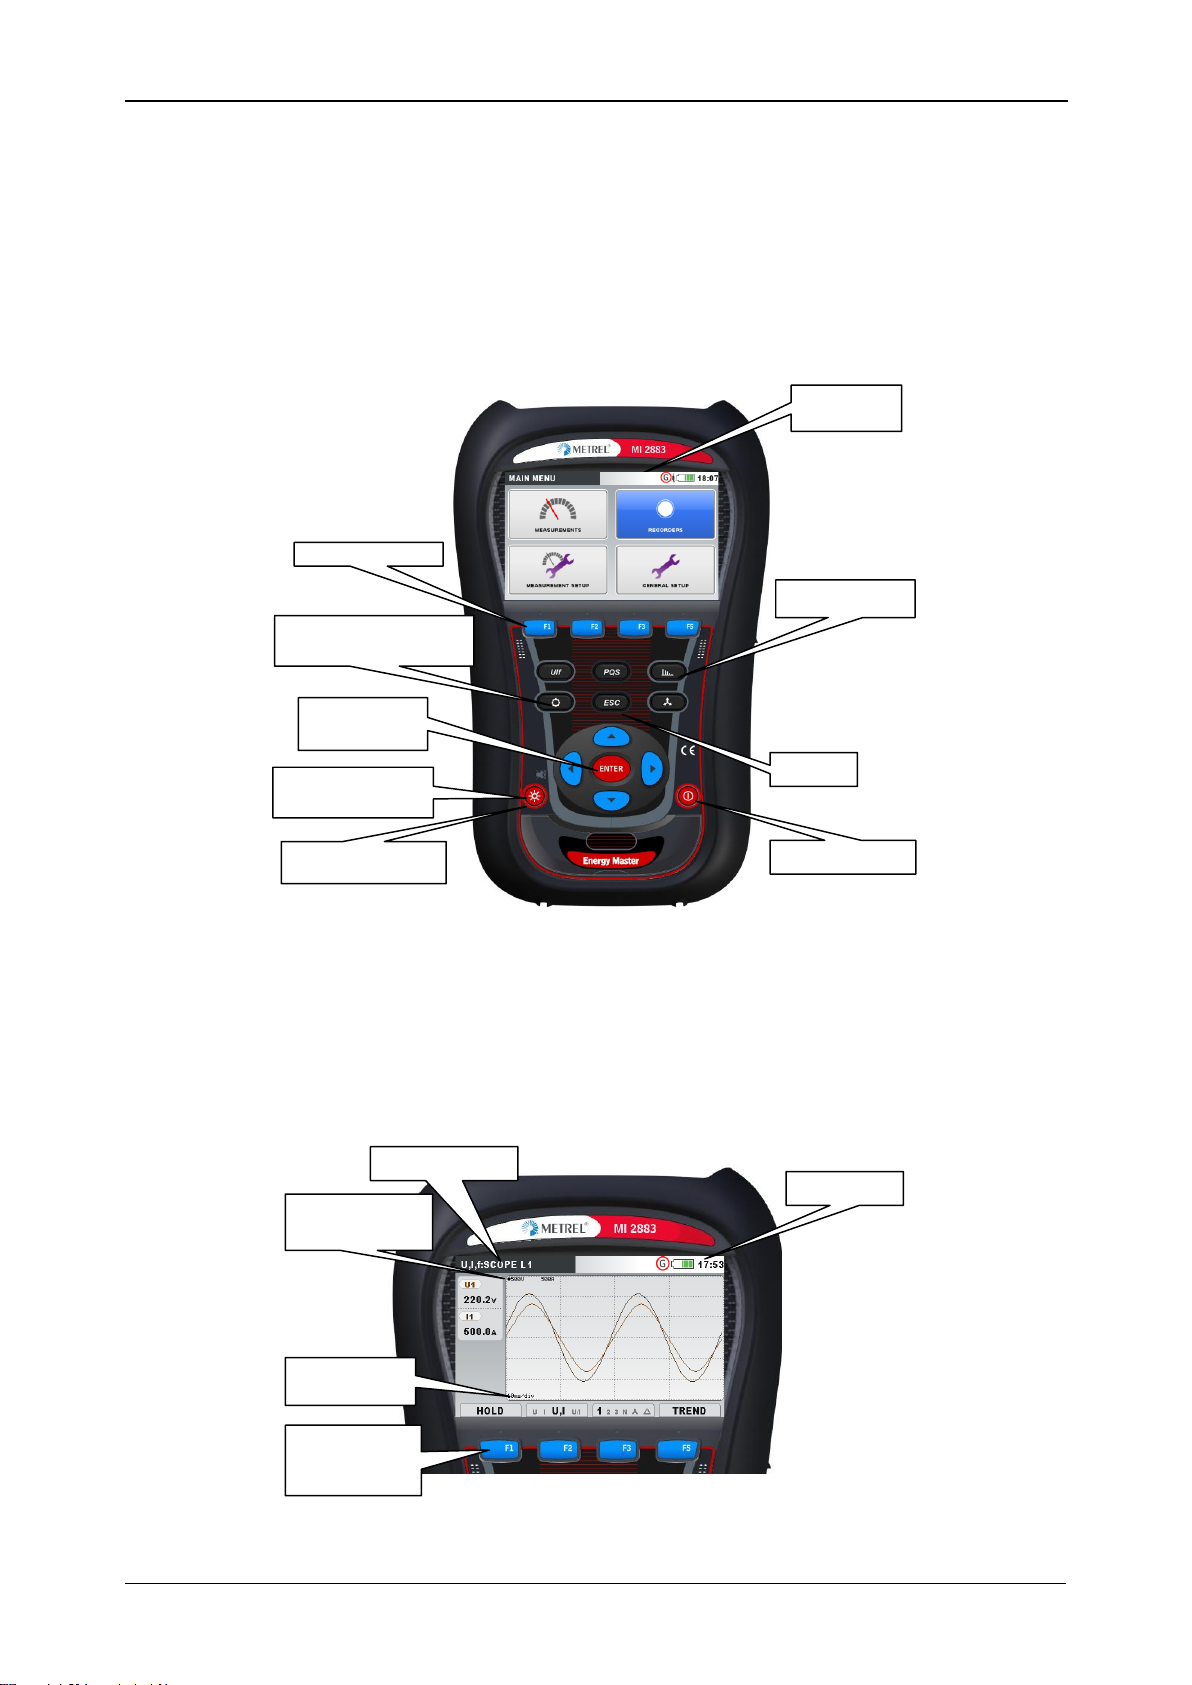
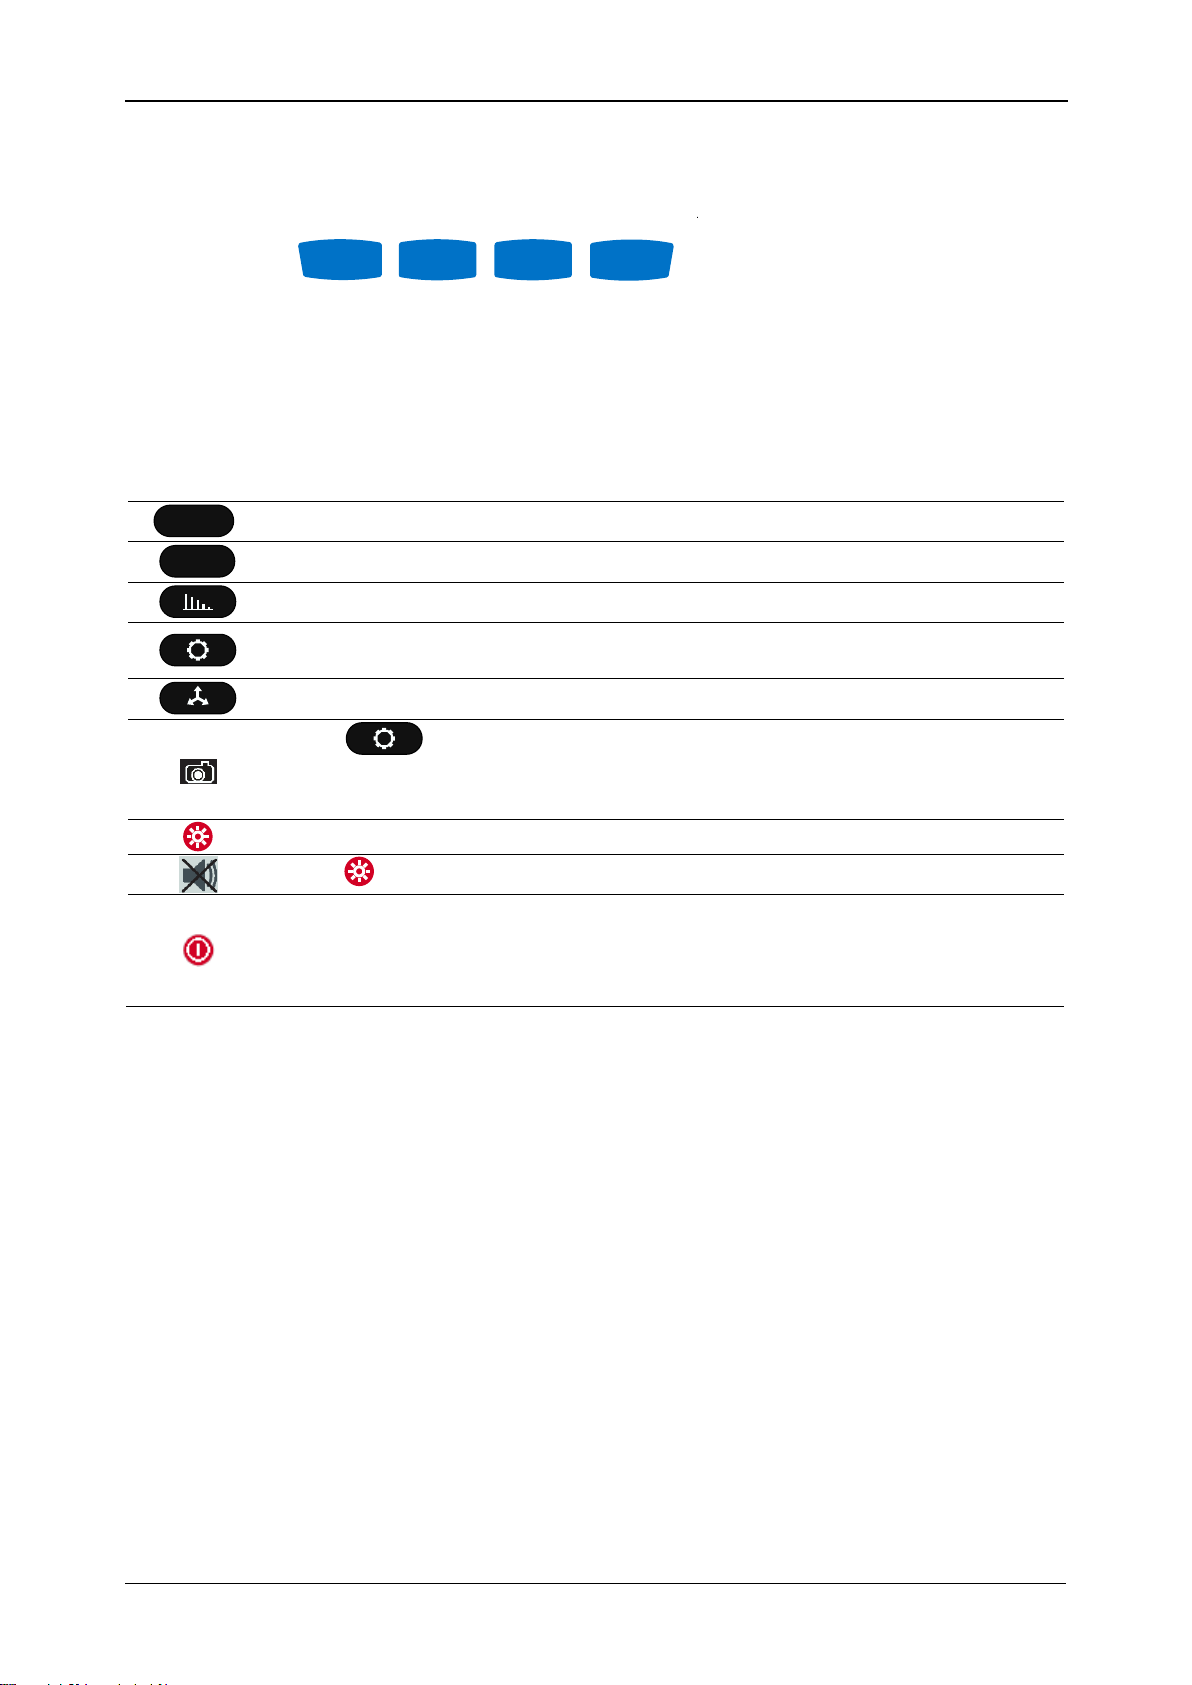
1. LCD
Colour TFT display, 4.3 inch, 480 x 272 pixels.
2. F1 – F4
Function keys.
3. ARROW keys
Moves cursor and select parameters.
4. ENTER key
Step into submenu.
5. ESC key
Exits any procedure, confirms new settings.
6. SHORTCUT keys
Quick access to main instrument functions.
7. LIGHT key
(BEEP OFF)
Adjust LCD backlight intensity: high/low//off
If the LIGHT key is pressed for more than 1.5 seconds,
beeper will be disabled. Press & hold again to enable it.
1
2
3
4
5
9
7
8
6
2 Description
2.1 Front panel
Front panel layout:
Figure 2.1: Front panel
19
Page 20
MI 2883 Energy Master Description
8. ON-OFF key
Turns on/off the instrument.
9. COVER
Communication ports and microSD card slot protection.
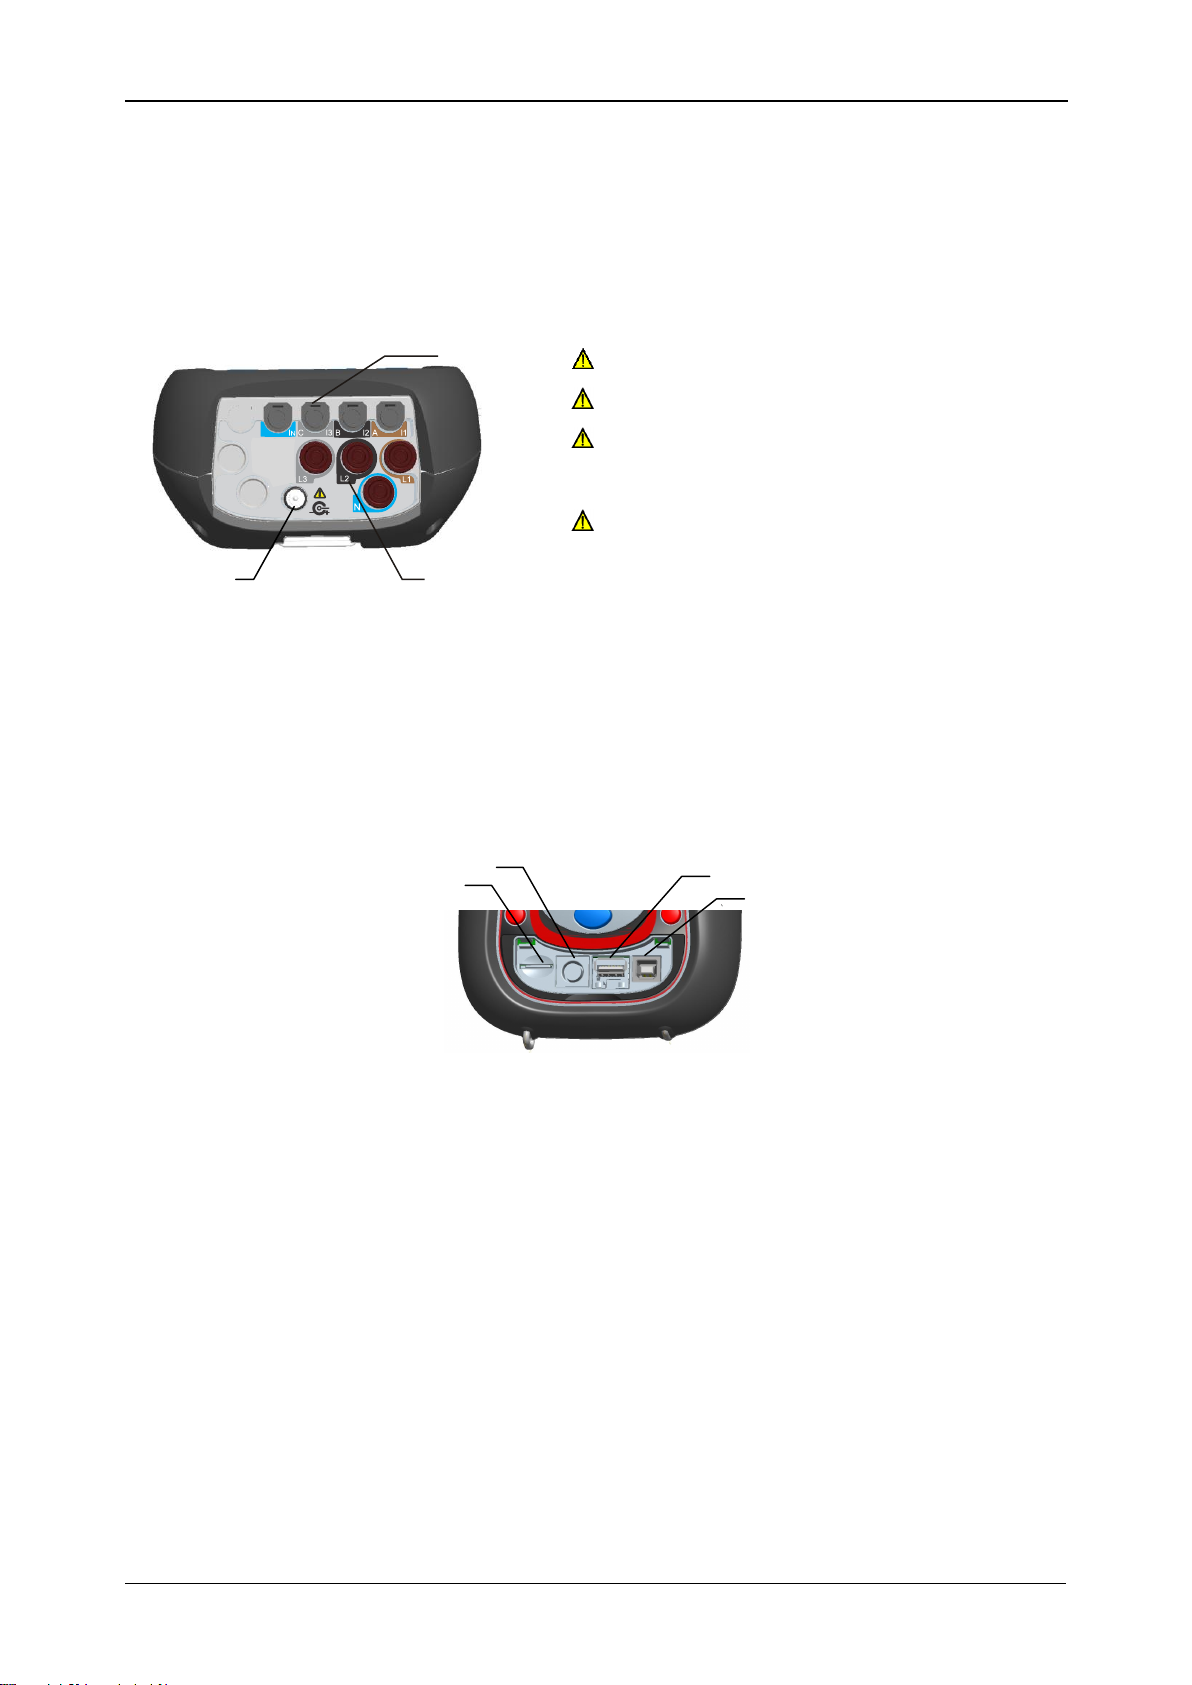
1
23
N
Warnings!
Use safety test leads only!
Max. permissible nominal voltage
between voltage input terminals and
ground is 1000 V
RMS
!
Max. short-term voltage of external power
supply adapter is 14 V!
1
2
3
4
2.2 Connector panel
Figure 2.2: Top connector panel
Top connector panel layout:
1 Clamp-on current transformers (I1, I2, I3, IN ) input terminals.
2 Voltage (L1, L2, L3, N) input terminals.
3 12 V external power socket.
Figure 2.3: Side connector panel
Side connector panel layout:
1 MicroSD card slot.
2 Serial connector (used to connect printer).
3 Ethernet connector – not in use.
4 USB connector.
20
Page 21
MI 2883 Energy Master Description
1
2
3
Description
Pieces
Flexible current clamp 3000 A / 300 A / 30 A (A 1227)
3
Colour coded test probe
4
Colour coded crocodile clip
4
Colour coded voltage measurement lead
4
USB cable
1
RS232 cable
1
12 V / 1.2 A Power supply adapter
1
NiMH rechargeable battery, type HR 6 (AA)
6
Soft carrying bag
1
Compact disc (CD) with PowerView v3.0 and manuals
1
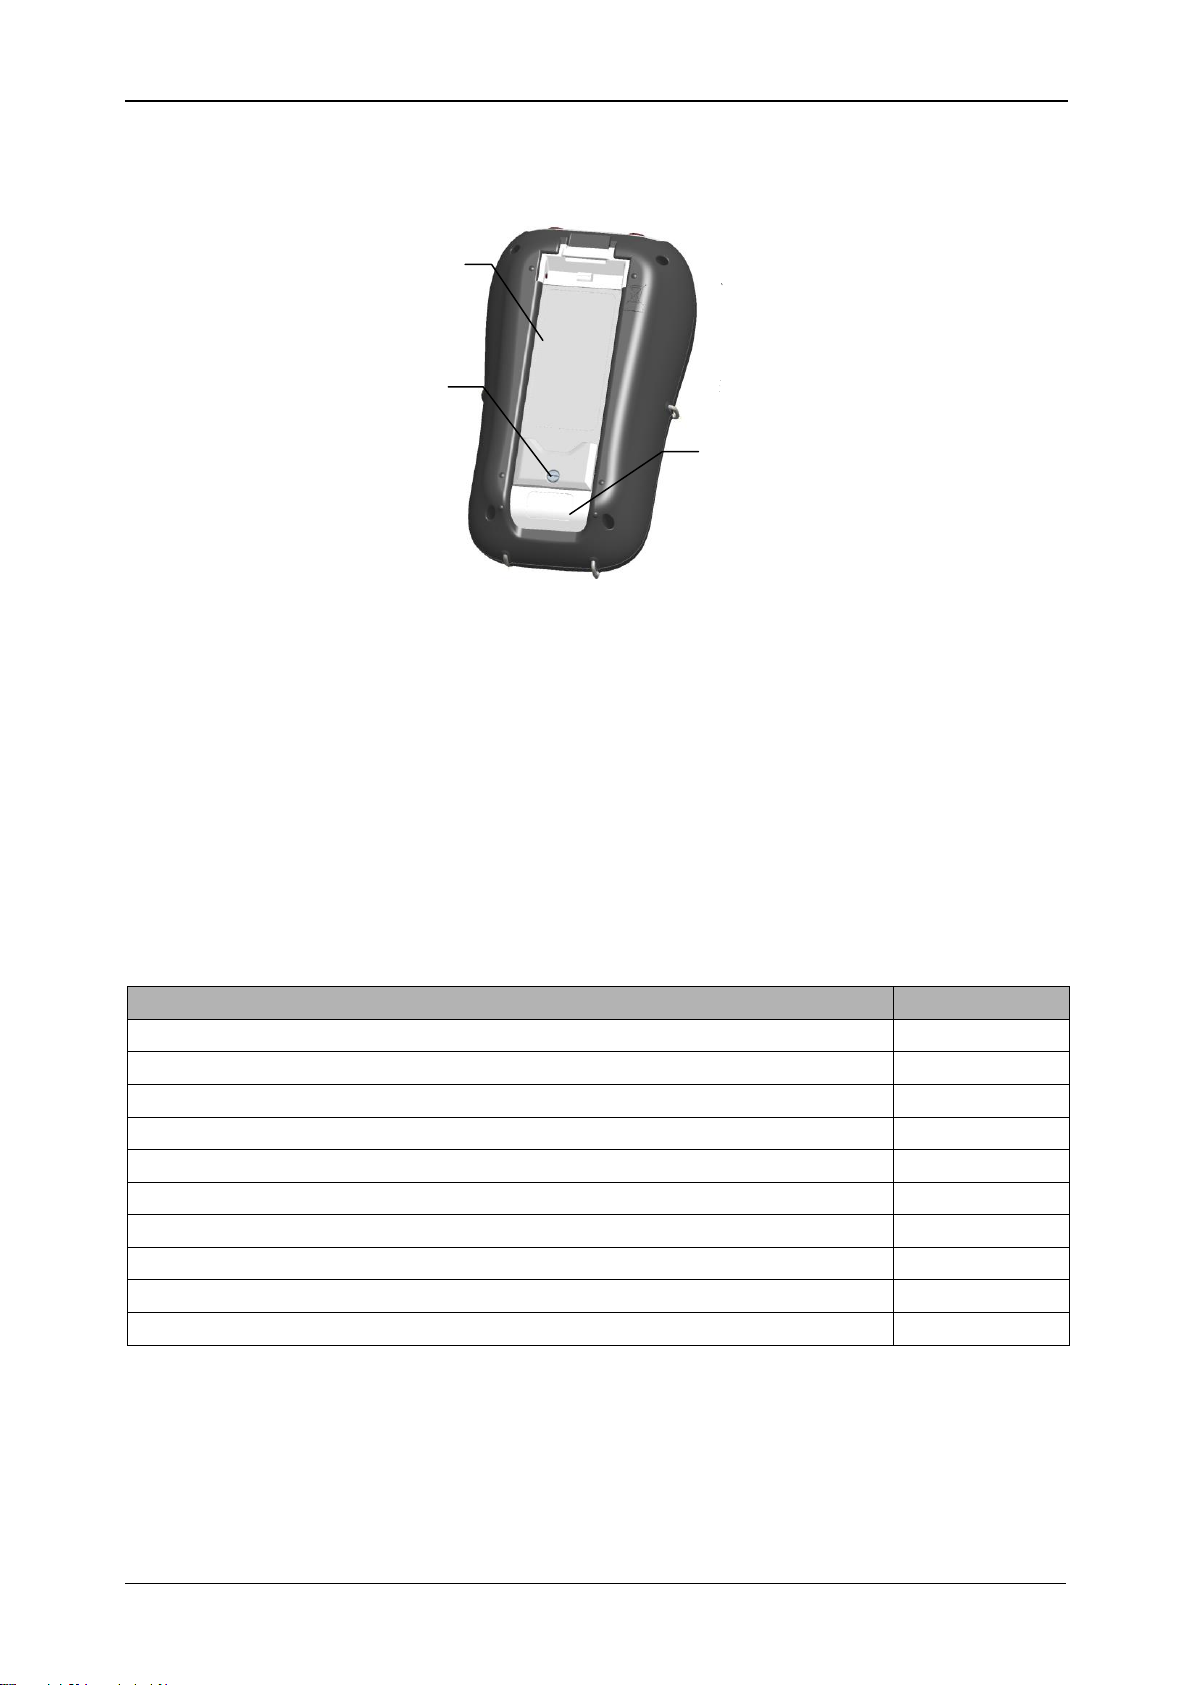
2.3 Bottom view
Figure 2.4: Bottom view
Bottom view layout:
1. Battery compartment cover.
2. Battery compartment screw (unscrew to replace the batteries).
3. Serial number label.
2.4 Accessories
2.4.1 Standard accessories
Table 2.1: Energy Master standard accessories
2.4.2 Optional accessories
See the attached sheet for a list of optional accessories that are available on request
from your distributor.
21
Page 22
MI 2883 Energy Master Operating the instrument
Escape
Function keys
Cursor keys,
Enter
Press & Hold to
disable beeper
Power On/Off
Status bar
Backlight On/Off
Shortcut keys
Press & Hold for
waveform snapshoot
Screen Name
Y-axsis scale
X-axsis
scale (time)
Options for
function keys
(F1 – F4)
Status Bar
3 Operating the instrument
This section describes how to operate the instrument. The instrument front panel
consists of a colour LCD display and keypad. Measured data and instrument status are
shown on the display. Basic display symbols and keys description is shown on figure
below.
During measurement campaign various screens can be displayed. Most screens share
common labels and symbols. These are shown on figure below.
Figure 3.2: Common display symbols and labels during measurement campaign
Figure 3.1: Display symbols and keys description
22
Page 23
MI 2883 Energy Master Operating the instrument
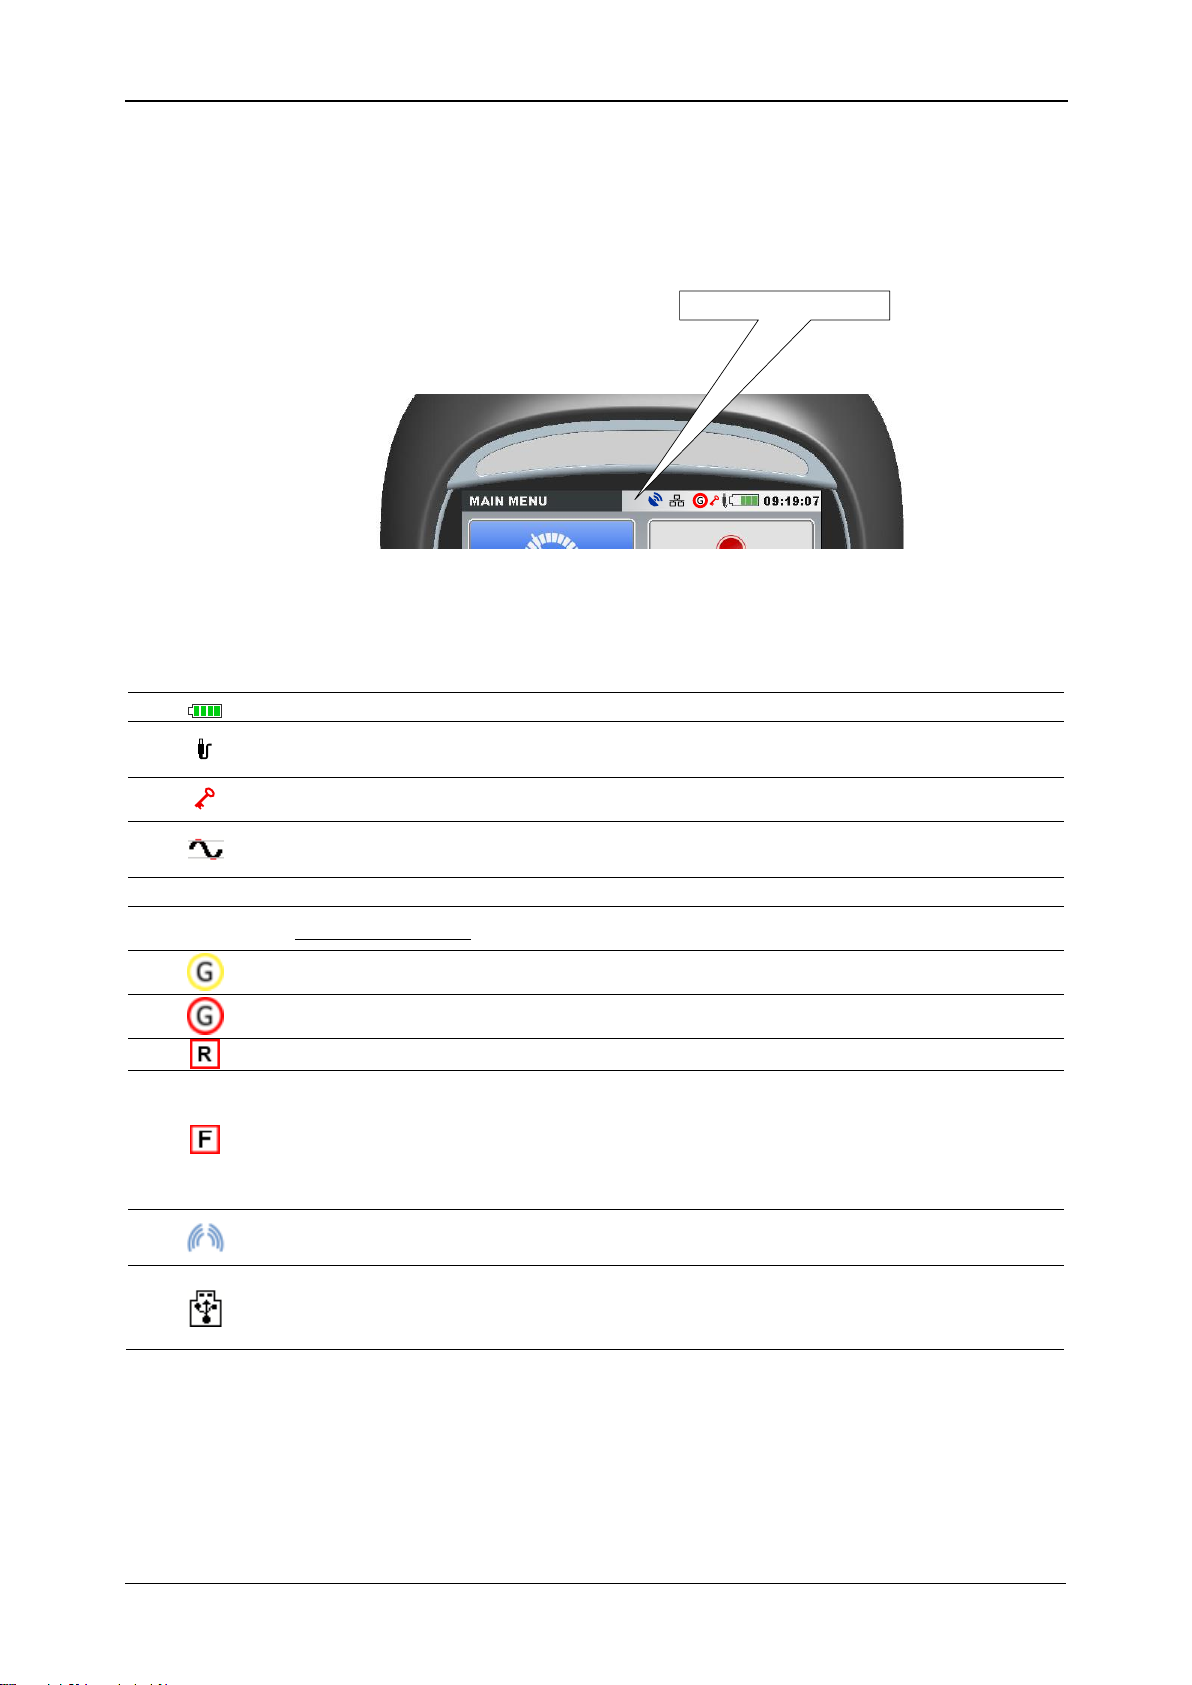
Status bar
Indicates battery charge level.
Indicates that charger is connected to the instrument. Batteries will be
charged automatically when charger is present.
Instrument is locked (see section 3.20.5 for details).
AD converter over range. Selected Nominal voltage or current clamps
range is too small.
09:19
Current time.
Recorder status:
General recorder is active, waiting for trigger.
General recorder is active, recording in progress.
Memory list recall. Shown screen is recalled from instrument memory.
Flagged data mark. While observing recorded data this mark will
indicate that observed measurement results for given time interval can
be compromised due to interrupt, dip or swells occurrence. See section
5.1.16 for further explanation.
Signalling voltage is present on voltage line at monitored frequencies.
See sections 3.13 and 3.19.4 for further explanation.
USB stick communication mode. In this mode selected record can be
transferred from microSD card to USB stick. USB communication with
PC is disabled while in this mode. See section 3.18 for details.
3.1 Instrument status bar
Instruments status bar is placed on the top of the screen. It indicates different
instrument states. Icon descriptions are shown on table below.
Figure 3.3: Instrument status bar
Table 3.1: Instrument status bar description
3.2 Instrument keys
Instrument keyboard is divided into four subgroups:
Function keys
Shortcut keys
Menu/zoom manipulation keys: Cursors, Enter, Escape
23
Page 24
MI 2883 Energy Master Operating the instrument
UIf
Shows UIF Meter screen from MEASUREMENT submenu
PQS
Shows Power meter screen from MEASUREMENT submenu
Shows Harmonics meter screen from MEASUREMENT submenu
Shows Connection Setup screen from MEASUREMENT SETUP
submenu
Shows Phase diagram screen from MEASUREMENT submenu
Hold key for 2 seconds to trigger WAVEFORM SNAPSHOT.
Instrument will record all measured parameters into file, which can be
then analysed by PowerView.
Set backlight intensity (high/low/off).
Hold key for 2 s to disable/enable beeper sound signals.
Switch On/off the instrument.
Note: instrument will not power off if any recorder is active.
Note: Hold key for 5 seconds in order to reset instrument, in case of
failure.
F1
F2
F3
F4
Other keys: Light and Power on/off keys
Function keys are multifunctional. Their current
function is shown at the bottom of the screen and depends on selected instrument
function.
Shortcut keys are shown in table below. They provide quick access to the most
common instrument functions.
Table 3.2: Shortcut Keys and other Function keys
Cursor, Enter and Escape keys are used for moving through instrument menu structure,
entering various parameters. Additionally, cursor keys are used for zooming graphs and
moving graph cursors.
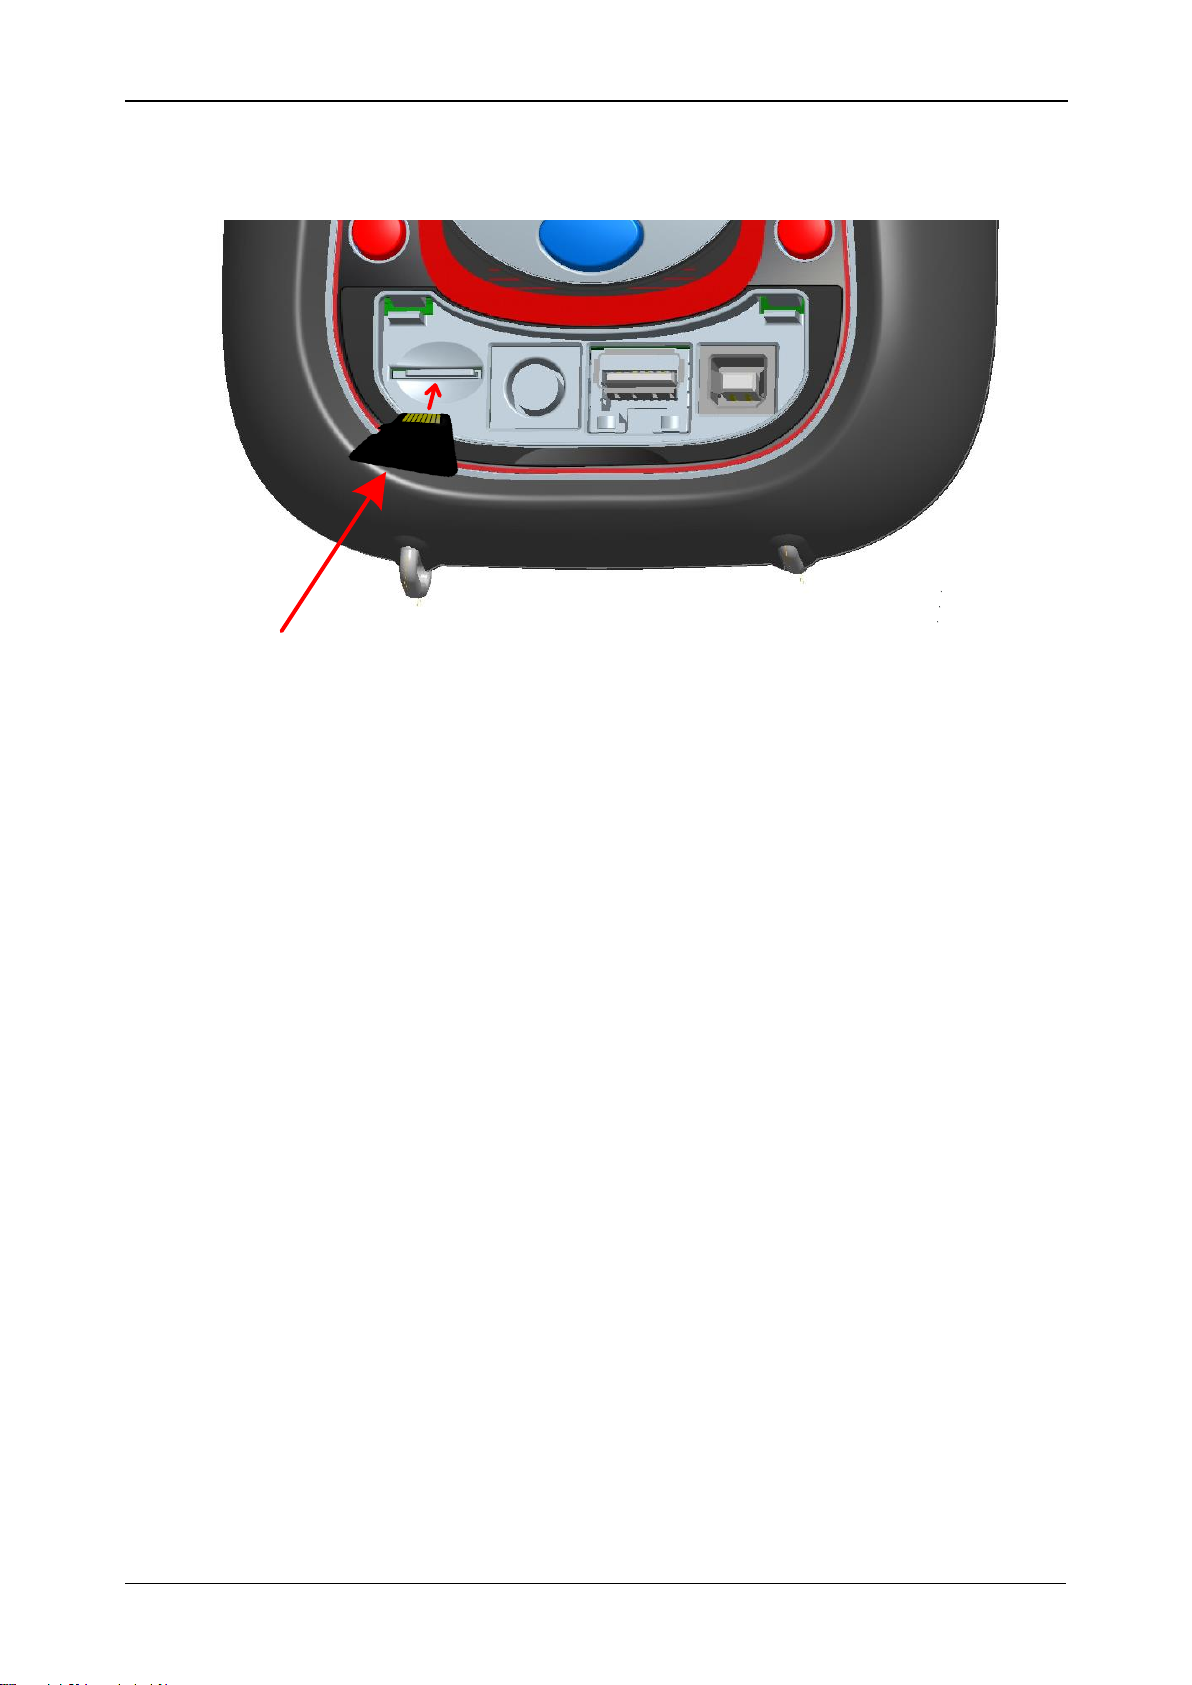
3.3 Instrument memory (microSD card)
Energy Master use microSD card for storing records. Prior instrument use, microSD
card should be formatted to a single partition FAT32 file system and inserted into the
instrument, as shown on figure below.
24
Page 25
MI 2883 Energy Master Operating the instrument
microSD Card
Figure 3.4: Inserting microSD card
1. Open instrument cover
2. Insert microSD card into a slot on the instrument (card should be putted
upside down, as shown on figure)
3. Close instrument cover
Note: Do not turn off the instrument while microSD card is accessed:
- during record session
- observing recorded data in MEMORY LIST menu
Doing so may cause data corruption, and permanent data lost.
Note: SD Card should have single FAT32 partition. Do not use SD cards with multiple
partitions.
3.4 Instrument Main Menu
After powering on the instrument the “MAIN MENU” is displayed. From this menu all
instrument functions can be selected.
25
Page 26
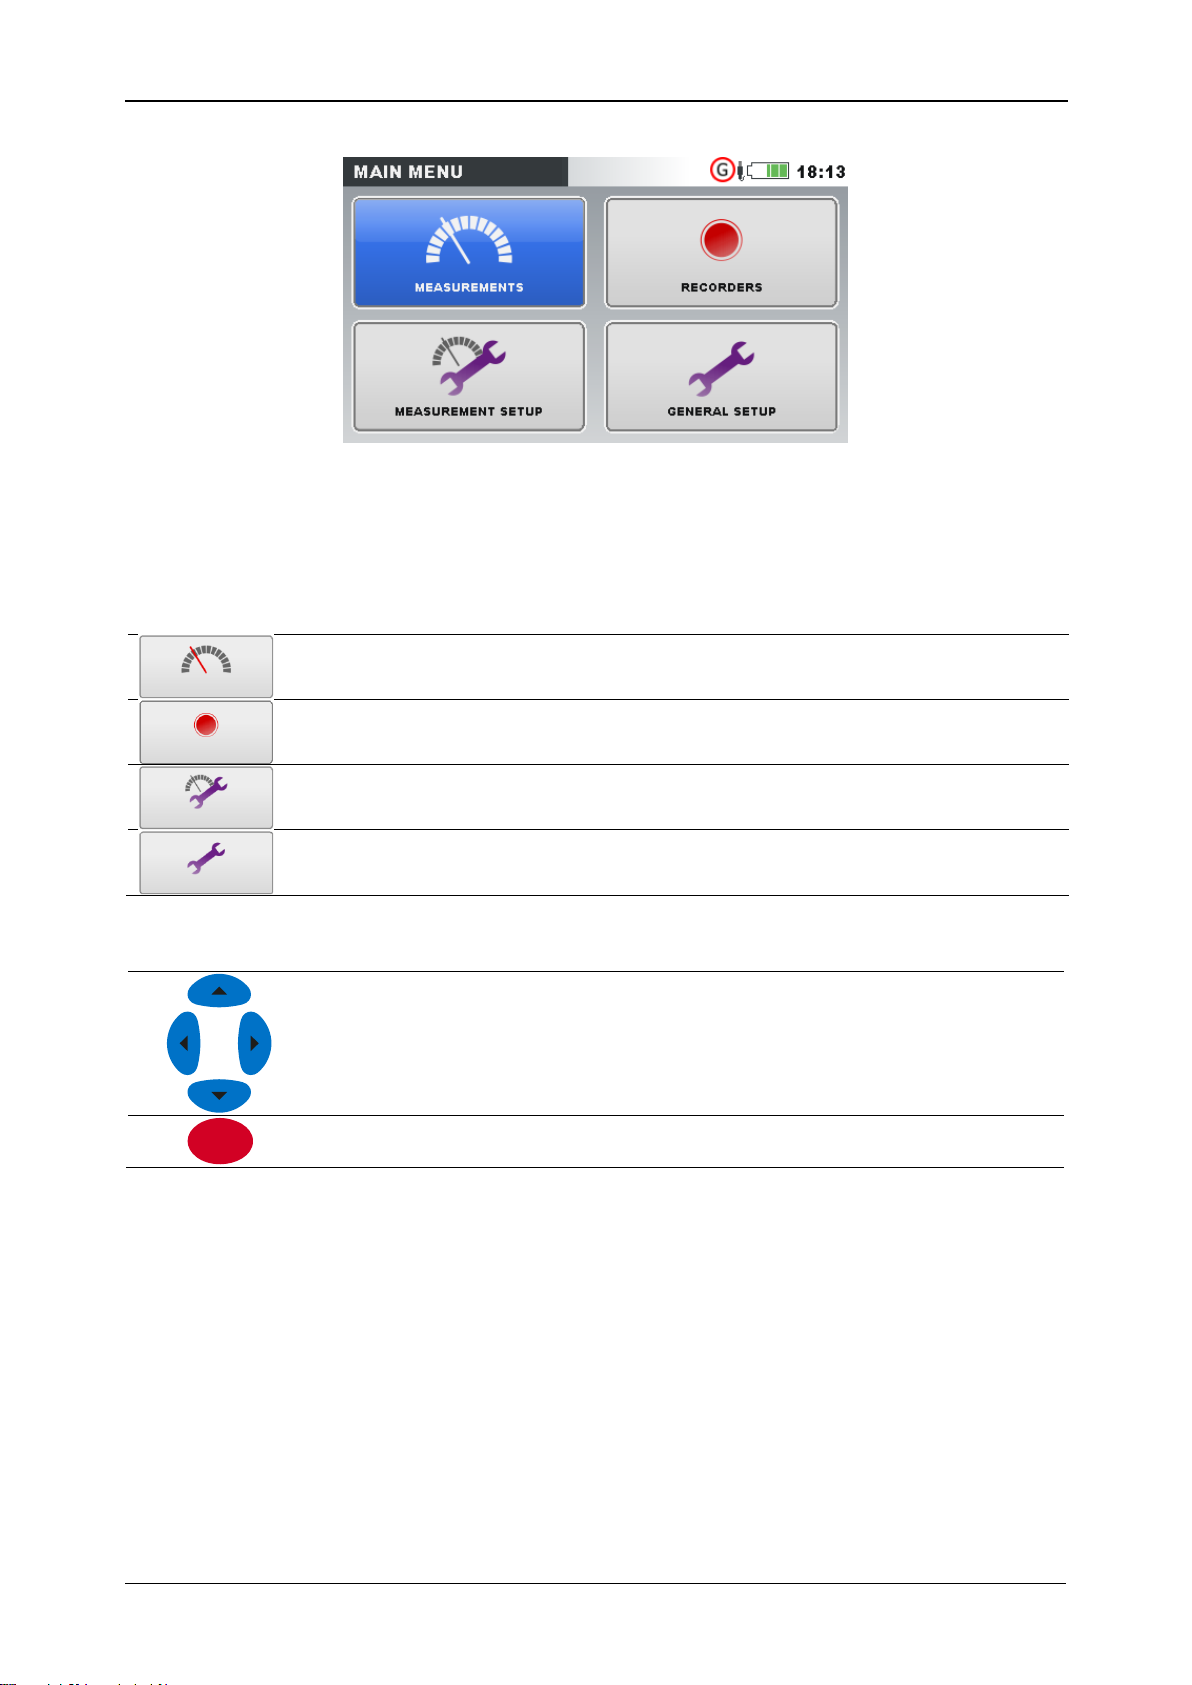
MI 2883 Energy Master Operating the instrument
MEASUREMENT submenu. Provide access to various instrument
measurement screens
RECORDER submenu. Provide access to instrument recorders
configuration and storage.
MEASUREMENT SETUP submenu. Provide access to the
measurement settings.
GENERAL SETUP submenu. Provide access to the various instrument
settings.
Selects submenu.
Enters selected submenu.
ENTER
Figure 3.5: “MAIN MENU”
Table 3.3: Instrument Main menu
Table 3.4: Keys in Main menu
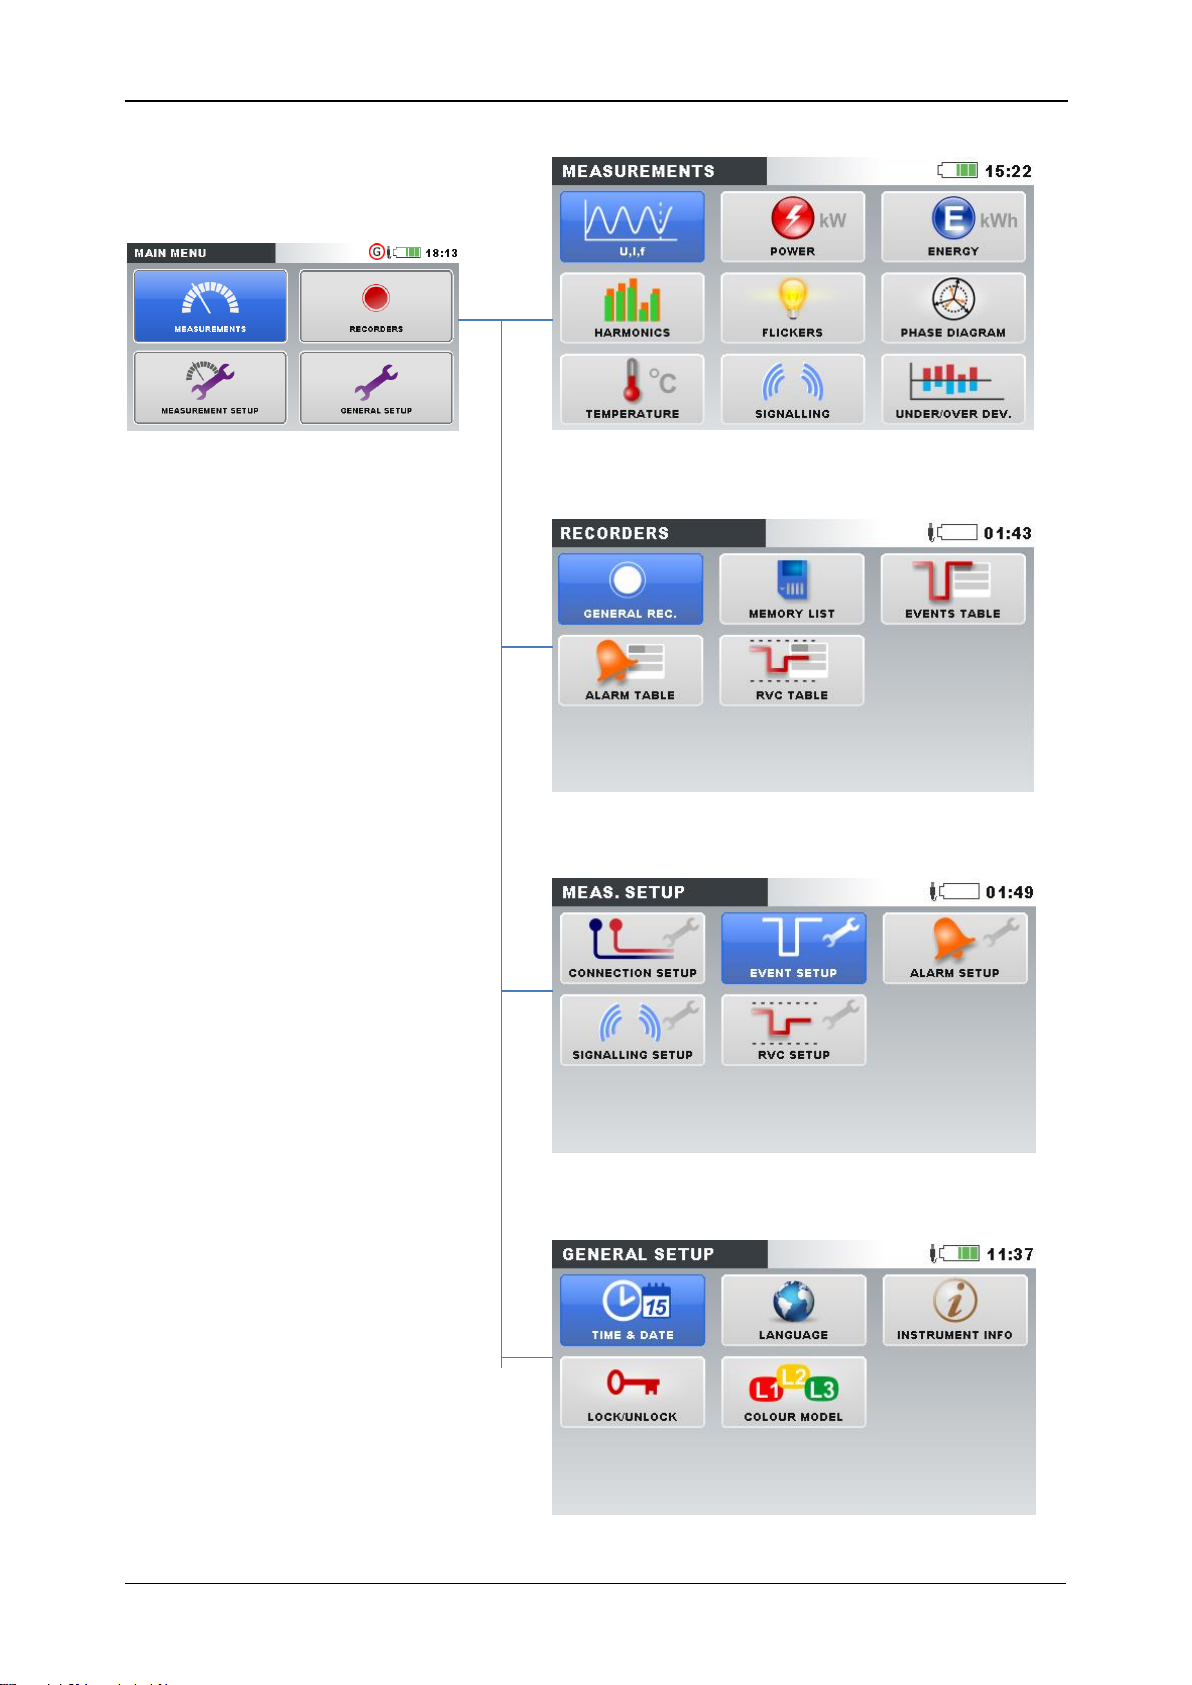
3.4.1 Instrument submenus
By pressing ENTER key in Main menu, user can select one of four submenus:
Measurements – set of basic measurement screens,
Recorders – setup and view of various recordings,
Measurement setup – measurement parameters setup,
General setup – configuring common instrument settings.
List of all submenus with available functions are presented on following figures.
26
Page 27
MI 2883 Energy Master Operating the instrument
Figure 3.6: Measurements submenu
Figure 3.7: Recorders submenu
Figure 3.8: Measurement setup submenu
Figure 3.9: General setup submenu
27
Page 28
MI 2883 Energy Master Operating the instrument
Selects function within each submenu.
Enters selected function.
Returns to the “MAIN MENU”.
ENTER
Table 3.5: Keys in submenus
3.5 U, I, f
Voltage, current and frequency parameters can be observed in the “U, I, f” screens.
Measurement results can be viewed in a tabular (METER) or a graphical form (SCOPE,
TREND). TREND view is active only in RECORDING mode. See section 3.14 for
details.
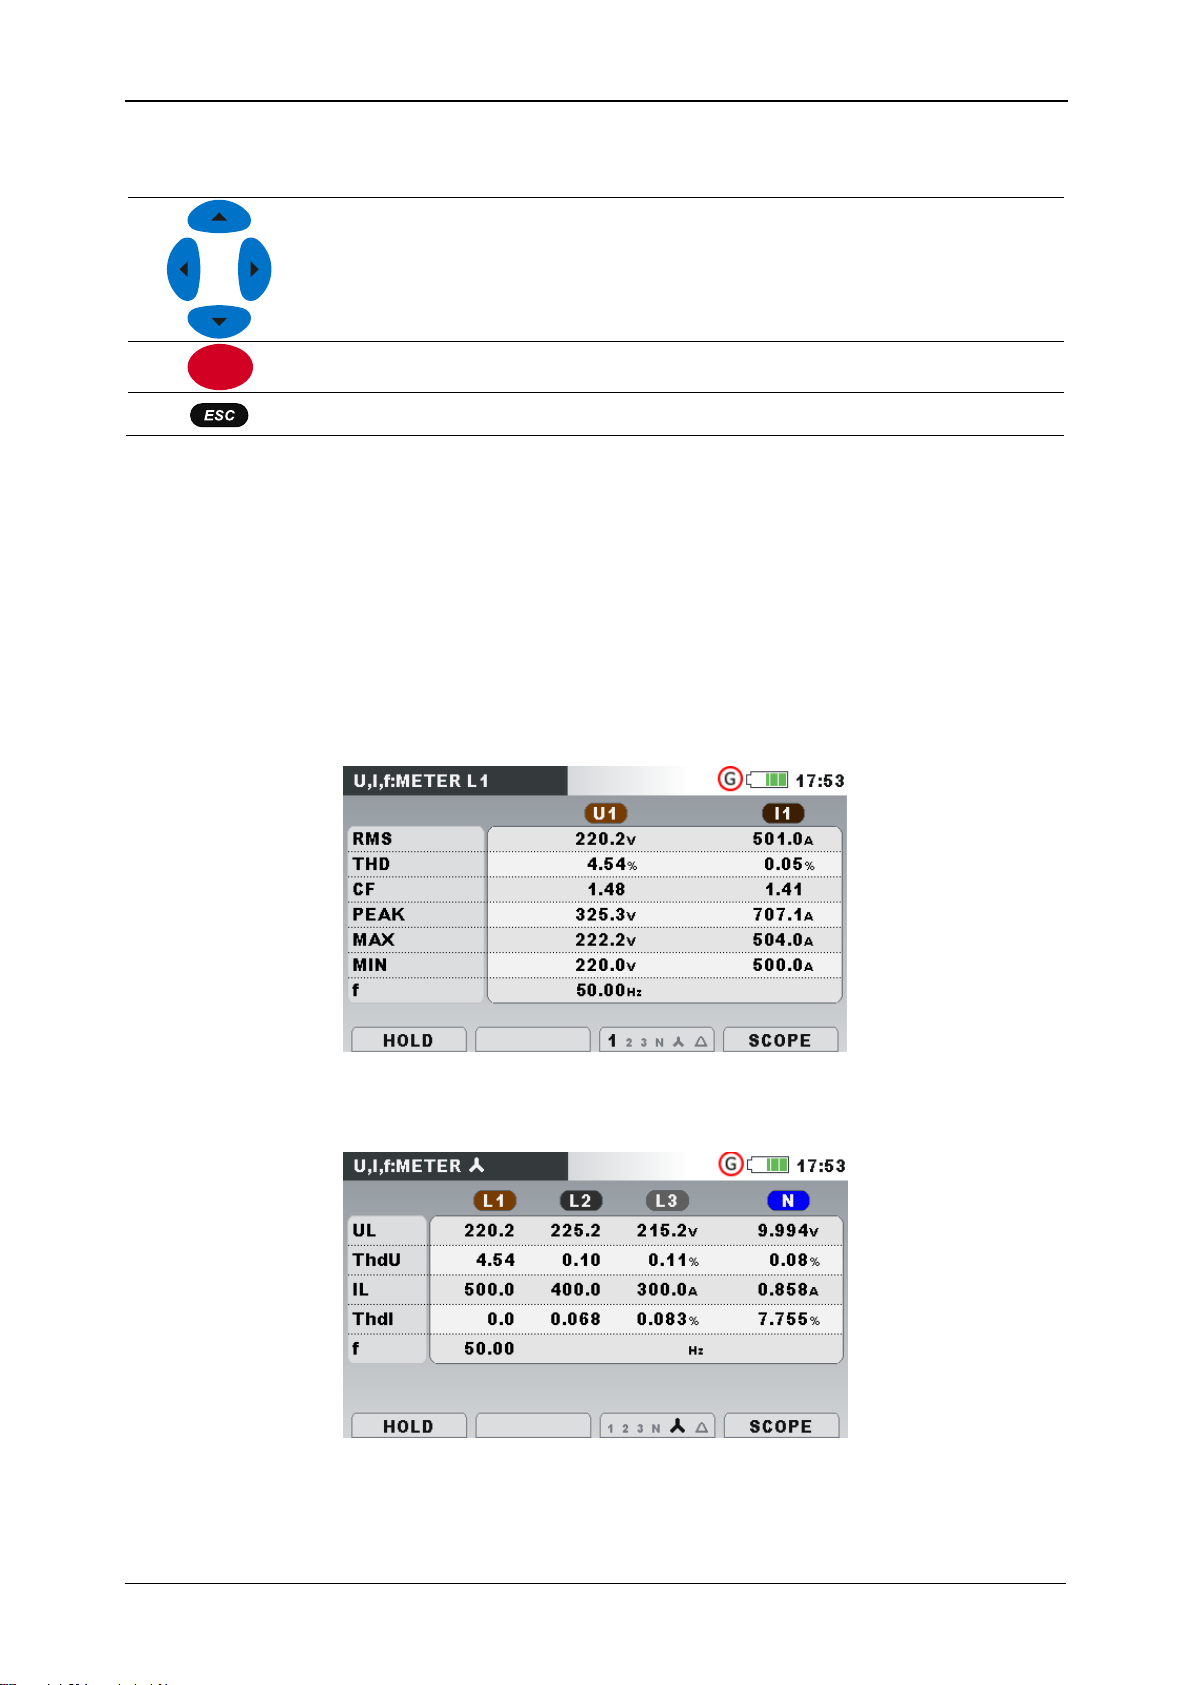
3.5.1 Meter
By entering U, I, f option, the U, I, f – METER tabular screen is shown (see figures
below).
Figure 3.10: U, I, f meter phase table screens (L1, L2, L3, N)
28
Page 29
MI 2883 Energy Master Operating the instrument
RMS
UL
IL
True effective value U
Rms
and I
Rms
THD
ThdU
ThdI
Total harmonic distortion THDU and THDI
CF
Crest factor CFU and CFI
PEAK
Peak value UPk and IPk
MAX
Maximal U
Rms(1/2)
voltage and maximal I
Rms(1/2)
current, measured
after RESET (key: F2)
MIN
Minimal U
Rms(1/2)
voltage and minimal I
Rms(1/2)
current, measured after
RESET (key: F2)
f
Frequency on reference channel
HOLD
Holds measurement on display. Hold clock time will be
displayed in the right top corner.
RUN
Runs held measurement.
RESET
Resets MAX and MIN values (U
Rms(1/2)
and I
Rms(1/2)
).
1 2 3 N Δ
Shows measurements for phase L1.
1 2 3 N Δ
Shows measurements for phase L2.
1 2 3 N Δ
Shows measurements for phase L3.
1 2 3 N Δ
Shows measurements for neutral channel.
F1
F2
F3
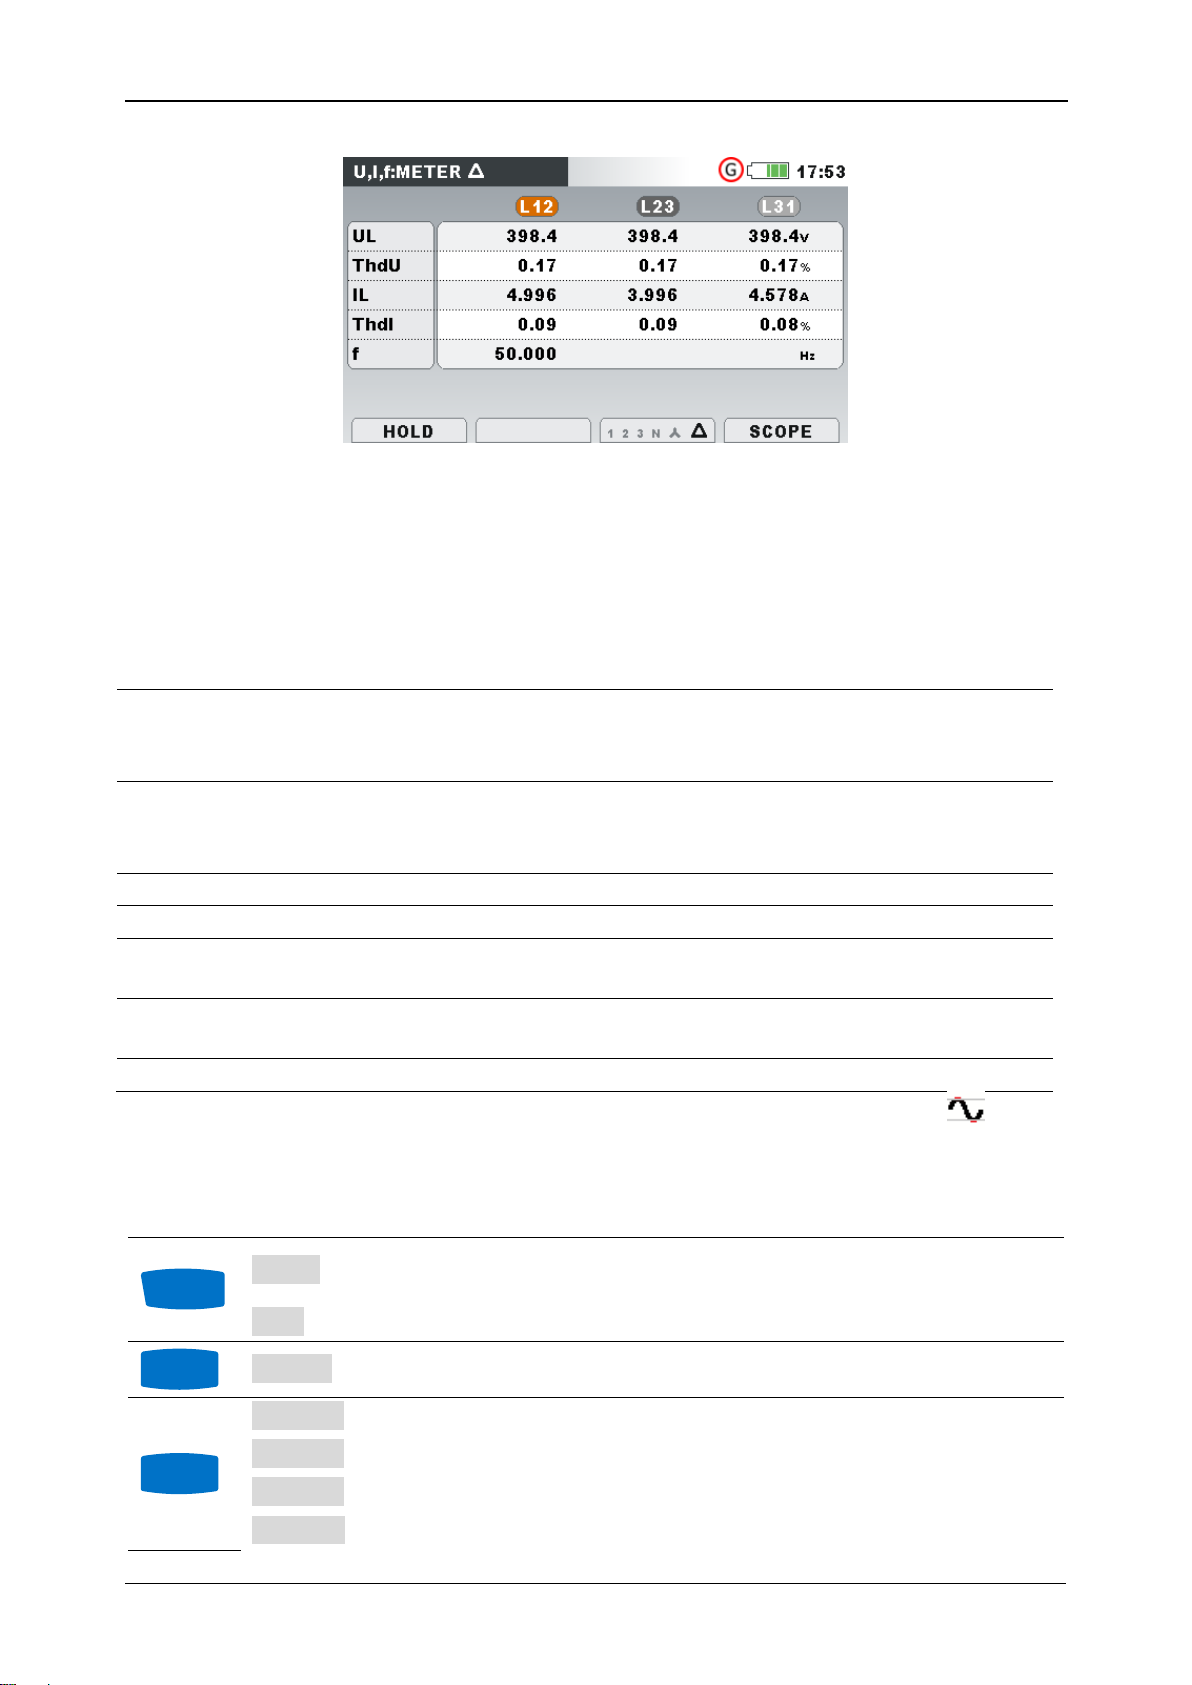
Figure 3.11: U, I, f meter summary table screens
In those screens on-line voltage and current measurements are shown. Descriptions of
symbols and abbreviations used in this menu are shown in table below.
Table 3.6: Instrument screen symbols and abbreviations
Note: In case of overloading current or overvoltage on AD converter, icon will be
displayed in the status bar of the instrument.
Table 3.7: Keys in Meter screens
29
Page 30
MI 2883 Energy Master Operating the instrument
1 2 3 N Δ
Shows measurements for all phases.
1 2 3 N Δ
Shows measurements for all phase to phase voltages.
12 23 31 Δ
Shows measurements for phase to phase voltage L12.
12 23 31 Δ
Shows measurements for phase to phase voltage L23.
12 23 31 Δ
Shows measurements for phase to phase voltage L31.
12 23 31 Δ
Shows measurements for all phase to phase voltages.
METER
Switches to METER view.
SCOPE
Switches to SCOPE view.
TREND
Switches to TREND view (available only during recording).
Triggers Waveform snapshot.
Returns to the “MEASUREMENTS” submenu.
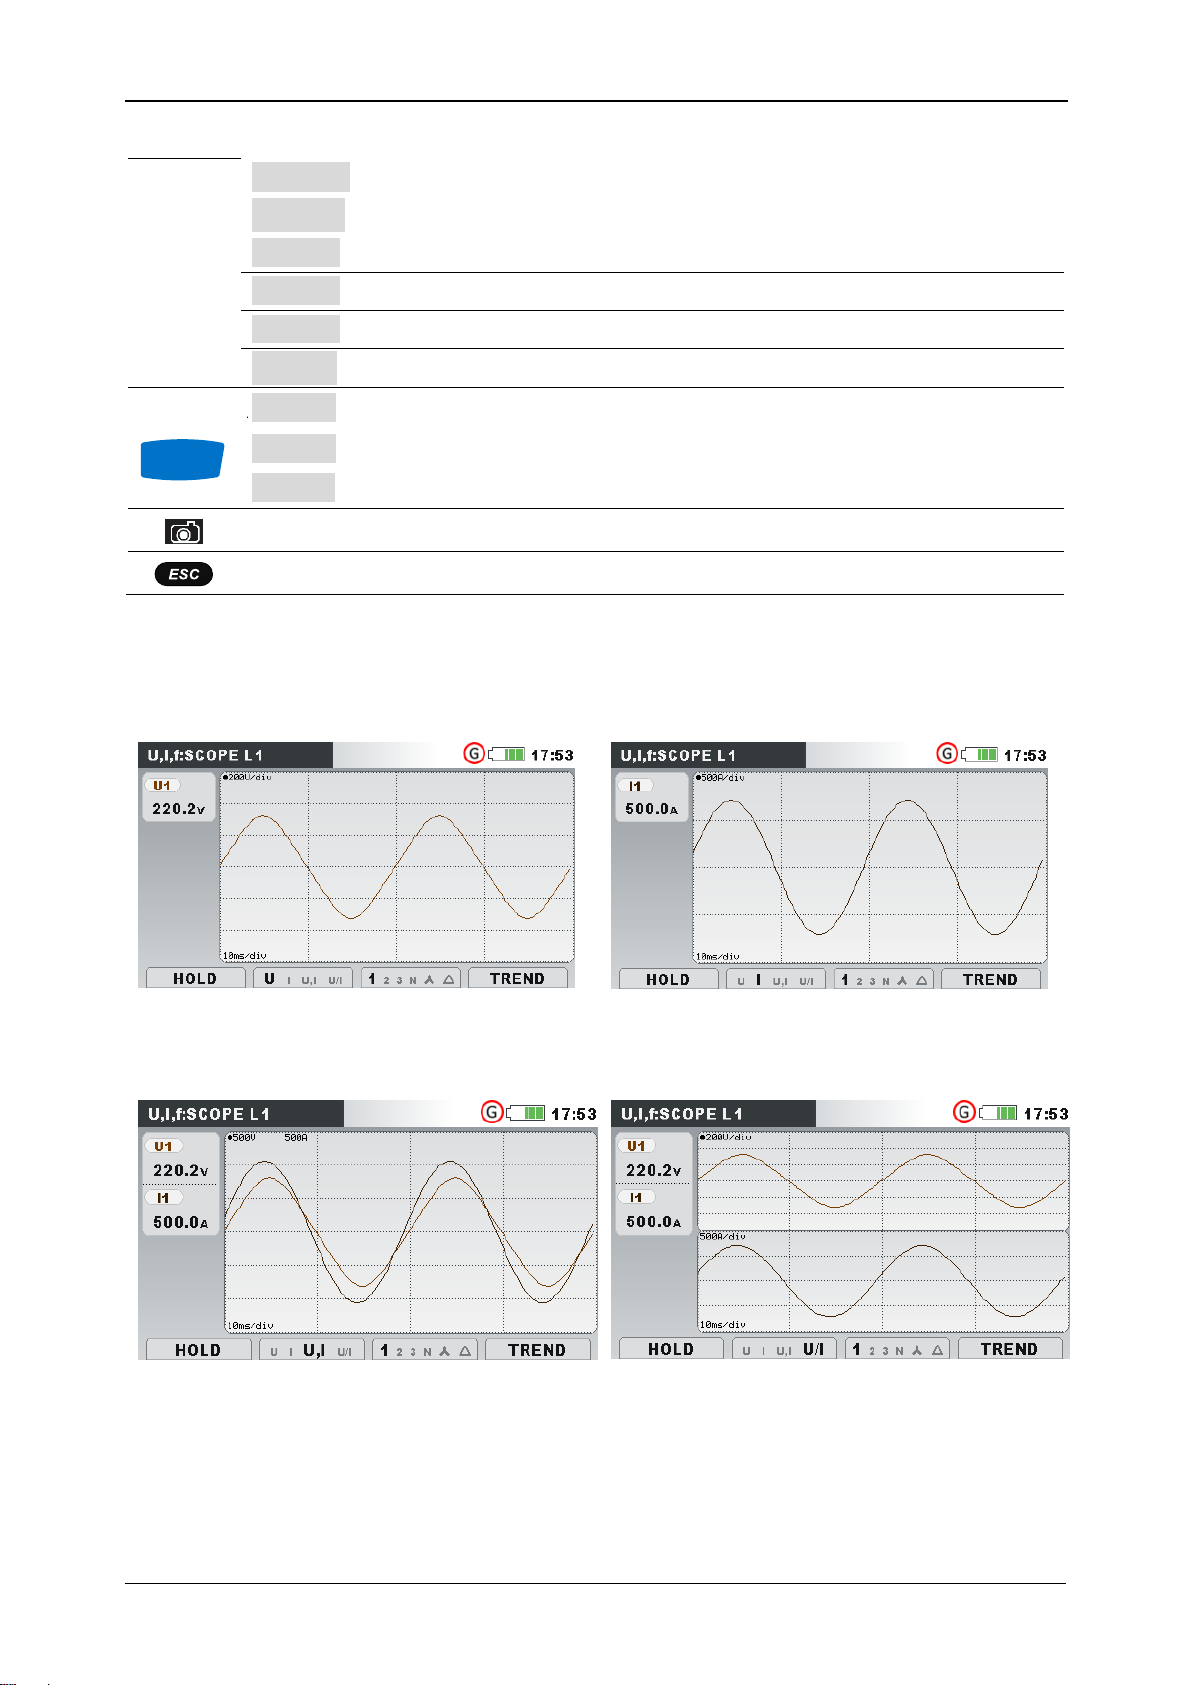
Figure 3.12: Voltage only waveform
Figure 3.13: Current only waveform
Figure 3.14: Voltage and current
waveform (single mode)
Figure 3.15: Voltage and current
waveform (dual mode)
F4
3.5.2 Scope
Various combinations of voltage and current waveforms can be displayed on the
instrument, as shown below.
30
Page 31

MI 2883 Energy Master Operating the instrument
U1, U2, U3
True effective value of phase voltage: U1, U2, U3
U12, U23, U31
True effective value of phase-to-phase (line) voltage: U12, U23, U31
I1, I2, I3, In
True effective value of current: I1, I2, I3, IN
HOLD
Holds measurement on display.
RUN
Runs held measurement.
Selects which waveforms to show:
U I U,I U/I
Shows voltage waveform.
U I U,I U/I
Shows current waveform.
U I U,I U/I
Shows voltage and current waveform (single graph).
U I U,I U/I
Shows voltage and current waveform (dual graph).
Selects between phase, neutral, all-phases and line view:
1 2 3 N Δ
Shows waveforms for phase L1.
1 2 3 N Δ
Shows waveforms for phase L2.
1 2 3 N Δ
Shows waveforms for phase L3.
1 2 3 N Δ
Shows waveforms for neutral channel.
1 2 3 N Δ
Shows all phase waveforms.
1 2 3 N Δ
Shows all phase-to-phase waveforms.
12 23 31 Δ
Shows waveforms for phase L12.
12 23 31 Δ
Shows waveforms for phase L23.
12 23 31 Δ
Shows waveforms for phase L31.
12 23 31 Δ
Shows all phase waveforms.
METER
Switches to METER view.
SCOPE
Switches to SCOPE view.
TREND
Switches to TREND view (available only during recording).
Selects which waveform to zoom (only in U/I or U+I).
Sets vertical zoom.
Sets horizontal zoom.
Triggers Waveform snapshot.
Returns to the “MEASUREMENTS” submenu.
F1
F2
F3
F4
ENTER
Table 3.8: Instrument screen symbols and abbreviations
Table 3.9: Keys in Scope screens
31
Page 32

MI 2883 Energy Master Operating the instrument
Figure 3.16: Voltage trend (all voltages)
Figure 3.17: Voltage trend (single
voltage)
Figure 3.18: Voltage and current trend
(single mode)
Figure 3.19: Voltage and current trend
(dual mode)
Figure 3.20: Trends of all currents
Figure 3.21: Frequency trend
3.5.3 Trend
While GENERAL RECORDER is active, TREND view is available (see section 3.14 for
instructions how to start recorder).
Voltage and current trends
Current and voltage trends can be observed by cycling function key F4 (METERSCOPE-TREND).
32
Page 33

MI 2883 Energy Master Operating the instrument
U1, U2, U3,
U12, U23,
U31
Maximal ( ), average ( ) and minimal ( ) value of phase RMS voltage
U1, U2, U3 or line voltage U12, U23, U31 for time interval (IP) selected by
cursor.
I1, I2, I3, In
Maximal ( ), average ( ) and minimal ( ) value of current I1, I2, I3, IN
for time interval (IP) selected by cursor.
f
Maximal ( ), active average ( ) and minimal ( ) value of frequency at
synchronization channel for time interval (IP) selected by cursor.
10.May.2013
12:02:00
Timestamp of interval (IP) selected by cursor.
32m 00s
Current GENERAL RECORDER time
(d - days, h - hours, m - minutes, s - seconds)
Selects between the following options:
U I f U,I U/I
Shows voltage trend.
U I f U,I U/I
Shows current trend.
U I f U,I U/I
Shows frequency trend.
U I f U,I U/I
Shows voltage and current trend (single mode).
U I f U,I U/I
Shows voltage and current trend (dual mode).
Selects between phases, neutral channel, all-phases view:
1 2 3 N
Shows trend for phase L1.
1 2 3 N
Shows trend for phase L2.
1 2 3 N
Shows trend for phase L3.
1 2 3 N
Shows trend for neutral channel.
1 2 3 N
Shows all phases trends.
12 23 31 Δ
Shows trend for phases L12.
12 23 31 Δ
Shows trend for phases L23.
12 23 31 Δ
Shows trend for phases L31.
12 23 31 Δ
Shows all phase-to-phase trends.
METER
Switches to METER view.
SCOPE
Switches to SCOPE view.
TREND
Switches to TREND view.
Moves cursor and selects time interval (IP) for observation.
Returns to the “MEASUREMENTS” submenu.
F2
F3
F4
Table 3.10: Instrument screen symbols and abbreviations
Table 3.11: Keys in Trend screens
3.6 Power
In POWER screens instrument shows measured power parameters. Results can be
seen in a tabular (METER) or a graphical form (TREND). TREND view is active only
33
Page 34

MI 2883 Energy Master Operating the instrument
Figure 3.22: Power measurements
summary (combined)
Figure 3.23: Power measurements
summary (fundamental)
Figure 3.24: Detailed power
measurements at phase L1
Figure 3.25: Detailed total power
measurements
P
Depending on the screen position:
In Combined column: Combined (fundamental and
nonfundamental) active power (P1, P2, P3, P
tot
,)
In Fundamental column: Fundamental active phase power
(Pfund1, Pfund2, Pfund3)
N
Combined (fundamental and nonfundamental) nonactive power
(N1, N2, N3, N
tot
,)
Q
Fundamental reactive phase power (Qfund1, Qfund2, Qfund3)
S
Depending on the screen position:
while GENERAL RECORDER is active. See section 3.14 for instructions how to start
recorder. In order to fully understand meanings of particular power parameter see
sections 5.1.5.
3.6.1 Meter
By entering POWER option from Measurements submenu the tabular POWER
(METER) screen is shown (see figure below).
Description of symbols and abbreviations used in POWER (METER) screens are shown
in table below.
Table 3.12: Instrument screen symbols and abbreviations (see 5.1.5 for details) –
instantaneous values
34
Page 35

MI 2883 Energy Master Operating the instrument
In Combined column: Combined (fundamental and
nonfundamental) apparent phase power (S1, S2, S3)
In Fundamental column: Fundamental active phase power
(Sfund1, Sfund2, Sfund3)
P+
Positive sequence of total active fundamental power (P
+
tot
)
Q+
Positive sequence of total reactive fundamental power (Q
+
tot
)
S+
Positive sequence of total apparent fundamental power (S
+
tot
)
DPF+
Positive sequence power factor (fundamental, total)
Se
Combined (fundamental and nonfundamental) total effective
apparent power (Se
tot
)
Sɴ
Phase nonfundamental apparent power (Sɴ
1
, Sɴ
2
, Sɴ3)
Seɴ
Total effective nonfundamental apparent power (Seɴ
tot
)
Dı
Phase current distortion power (Dı1, Dı2, Dı
3
)
Deı
Total effective current distortion power (Deı
tot
)
Dᴠ
Phase voltage distortion power (Dᴠ1, Dᴠ2, Dᴠ
3
)
Deᴠ
Total effective voltage distortion power (Deᴠ
tot
)
Pн
Phase and total harmonic active power (P
H1
+
,P
H2
+
,P
H3
+
,P
Htot
)
PF
Phase combined (fundamental and nonfundamental) power factor
(PF1, PF2, PF3)
PFe
Total effective combined (fundamental and nonfundamental)
power factor (PFe)
DPF
Phase fundamental power factor (DPF1, DPF2, DPF3,) and
positive sequence total power factor (DPF+)
Harmonic Pollut.
Harmonic pollution according to the standard IEEE 1459
Load unbalance
Load unbalance according to the standard IEEE 1459
HOLD
Holds measurement on display. Hold clock time will be
displayed in the right top corner.
RUN
Runs held measurement.
VIEW
Switches between Combined, Fundamental and
Nonfundamental view.
1 2 3 T
Shows measurements for phase L1.
1 2 3 T
Shows measurements for phase L2.
1 2 3 T
Shows measurements for phase L3.
1 2 3 T
Shows brief view on measurements on all phases in a single
screen.
1 2 3 T
Shows measurement results for TOTAL power
measurements.
F1
F2
F3
Table 3.13: Keys in Power (METER) screens
35
Page 36

MI 2883 Energy Master Operating the instrument
METER
Switches to METER view.
TREND
Switches to TREND view (available only during recording).
Triggers Waveform snapshot.
Returns to the “MEASUREMENTS” submenu.
P1±, P2±,
P3±, Pt±
View: Combined power
Maximal ( ), average ( ) and minimal ( ) value of consumed
(P
1
+
, P
2
+
, P
3
+
, P
tot
+
) or generated (P
1
-
, P
2
-
, P
3
-
, P
tot
-
) active
combined power for time interval (IP) selected by cursor.
P1±, P2±,
P3±, P+±
View: Fundamental power
Maximal ( ), average ( ) and minimal ( ) value of consumed
(Pfund
1
+
, Pfund
2
+
, Pfund
3
+
, P+
tot
+
) or generated (Pfund
1
-
, Pfund2,
Pfund3, P+
tot
-
) active fundamental power for time interval (IP)
selected by cursor.
Ni1±, Ni2±,
Ni3±, Nit±
View: Combined power
Maximal ( ), average ( ) and minimal ( ) value of consumed
(N
1ind
+
, N
2ind
+
, N
3ind
+
, N
totind
+
) or generated (N
1ind
-
, N
2ind
-
, N
3ind
-
,
N
totind
-
) inductive combined nonactive power for time interval (IP)
selected by cursor.
Nc1±, Nc2±,
Nc3±, Nct±
View: Combined power
Maximal ( ), average ( ) and minimal ( ) value of consumed
(N
1cap
+
, N
2cap
+
, N
3cap
+
, N
totcap
+
) or generated (N
1cap
-
, N
2cap
-
, N
3cap
-
,
N
totcap
-
) capacitive combined nonactive power for time interval (IP)
selected by cursor.
S1, S2, S3, Se
View: Combined power
Maximal ( ), average ( ) and minimal ( ) value of combined
apparent power (S1, S2, S3, Se
tot
) for time interval (IP) selected by
cursor.
F4
3.6.2 Trend
During active recording TREND view is available (see section 3.14 for instructions how
to start GENERAL RECORDER).
Figure 3.26: Power trend screen
Table 3.14: Instrument screen symbols and abbreviations
36
Page 37

MI 2883 Energy Master Operating the instrument
S1, S2, S3, S+
View: Fundamental power
Maximal ( ), average ( ) and minimal ( ) value of fundamental
apparent power (Sfund1, Sfund2, Sfund3, S
+
tot
) for time interval
(IP) selected by cursor.
PFi1±, PFi2±,
PFi3±, PFit±
View: Combined power
Maximal ( ), average ( ) and minimal ( ) value of inductive
power factor (1st quadrant: PF
1ind
+
, PF
2ind
+
, PF
3ind
+
, PF
totind
+
and 3rd
quadrant: PF
1ind
-
, PF
2ind
-
, PF
3ind
-
, PF
totind
-
) for time interval (IP)
selected by cursor.
PFc1±, PFc2±,
PFc3±, PFct±
View: Combined power
Maximal ( ), average ( ) and minimal ( ) value of capacitive
power factor (4th quadrant: PF
1cap
+
, PF
2cap
+
, PF
3cap
+
, PF
totcap
+
and
2nd quadrant: PF
1cap
-
, PF
2cap
-
, PF
3cap
-
, PF
totcap
-
) for time interval
(IP) selected by cursor.
Qi1±, Qi2±, Qi3±,
Q+i±
View: Fundamental power
Maximal ( ), average ( ) and minimal ( ) value of consumed
(Q
1ind
+
, Q
2ind
+
, Q
3ind
+
, Q
+
totind
+
) or generated (Q
1ind
-
, Q
2ind
-
, Q
3ind
-
,
Q
+
totind
-
) fundamental reactive inductive power for time interval (IP)
selected by cursor.
Qc1±, Qc2±,
Qc3±, Q+c±
View: Fundamental power
Maximal ( ), average ( ) and minimal ( ) value of consumed
(Q
1cap
+
, Q
2cap
+
, Q
3cap
+
, Q
+
captot
+
) or generated (Q
1cap
-
, Q
2cap
-
, Q
3cap
-
,
Q
+
captot
-
) fundamental reactive capacitive power for time interval
(IP) selected by cursor.
DPFi1±,
DPFi2±,
DPFi3±
DPF+it±
View: Fundamental power
Maximal ( ), average ( ) and minimal ( ) value of inductive
displacement power factor (1st quadrant: DPF
1ind
+
, DPF
2ind
+
,
DPF
3ind
+
, DPF
totind
+
, and 3rd quadrant: DPF
1ind
-
, DPF
2ind
-
, DPF
3ind
-
DPF
totind
-
,) for time interval (IP) selected by cursor.
DPFc1±,
DPFc2±,
DPFc3±
DPF+ct±
View: Fundamental power
Maximal ( ), average ( ) and minimal ( ) value of capacitive
displacement power factor (4th quadrant: DPF
1cap
+
, DPF
2cap
+
,
DPF
3cap
+
, DPF
totcap
+
, and 2nd quadrant: DPF
1cap
-
, DPF
2cap
-
,
DPF
3cap
-
, DPF
totcap
+
) for time interval (IP) selected by cursor.
Sn1, Sn2,
Sn3, Sen
View: Nonfundamental power
Maximal ( ), average ( ) and minimal ( ) value of consumed or
generated nonfundamental apparent power (Sɴ
1
, Sɴ2, Sɴ3, Seɴ
tot
)
for time interval (IP) selected by cursor.
Di1, Di2,
Di3, Dei
View: Nonfundamental power
Maximal ( ), average ( ) and minimal ( ) value of consumed or
generated phase current distortion power (Dı
1
, Dı2, Dı3, Deı
tot
) for
time interval (IP) selected by cursor.
Dv1, Dv2,
Dv3, Dev
View: Nonfundamental power
Maximal ( ), average ( ) and minimal ( ) value of consumed or
generated phase voltage distortion power (Dv1, Dv2, Dv3, Dev
tot
)
for time interval (IP) selected by cursor.
Ph1±, Ph2±,
Ph3±, Pht±
View: Nonfundamental power
Maximal ( ), average ( ) and minimal ( ) value of consumed
37
Page 38

MI 2883 Energy Master Operating the instrument
(P
H1
+
, P
H2
+
, P
H3
+
, P
Htot
+
) or generated (P
H1
-
, P
H2
-
, P
H3
-
, P
Htot
-
) active
harmonic power for time interval (IP) selected by cursor.
VIEW
Selects which measurement should instrument
represent on graph:
Consumed or Generated
Measurements related to consumed (suffix: +)
or generated power (suffix: -).
Combined, Fundamental or Nonfundamental
Measurement related to fundamental power,
nonfundamental power or combined.
Keys in VIEW window:
Selects option.
Confirms selected option.
Exits selection window without
change.
If Combined power is selected:
P Ni Nc S PFi Pfc
Shows combined active power trend.
P Ni Nc S PFi Pfc
Shows combined inductive nonactive power trend.
P Ni Nc S PFi Pfc
Shows combined capacitive nonactive power trend.
P Ni Nc S PFi Pfc
Shows combined apparent power trend.
P Ni Nc S PFi Pfc
Shows inductive power factor trend.
P Ni Nc S Pfi PFc
Shows capacitive power factor trend.
If Fundamental power is selected:
P Qi Qc S DPFi DPfc
Shows fundamental active power trend.
P Qi Qc S DPFi DPfc
Shows fundamental inductive reactive power trend.
P Qi Qc S DPFi DPfc
Shows fundamental capacitive reactive power trend.
P Qi Qc S DPFi DPfc
Shows fundamental apparent power trend.
P Qi Qc S DPFi DPfc
Shows inductive displacement power factor trend.
P Qi Qc S DPfi DPFc
Shows capacitive displacement power factor trend.
If Nonfundamental power is selected:
Sn Di Dv Ph
Shows nonfundamental apparent power trend.
Sn Di Dv Ph
Shows nonfundamental current distortion power.
Sn Di Dv Ph
Shows nonfundamental voltage distortion power.
F1
ENTER
F2
Table 3.15: Keys in Power (TREND) screens
38
Page 39

MI 2883 Energy Master Operating the instrument
Sn Di Dv Ph
Shows nonfundamental active power.
Selects between phase, all-phases and Total power
view:
1 2 3 T
Shows power parameters for phase L1.
1 2 3 T
Shows power parameters for phase L2.
1 2 3 T
Shows power parameters for phase L3.
1 2 3 T
Shows power parameters for phases L1, L2 and L3 on
the same graph.
1 2 3 T
Shows Total power parameters.
METER
Switches to METER view.
TREND
Switches to TREND view (available only during recording).
Moves cursor and selects time interval (IP) for observation.
Returns to the “MEASUREMENTS” submenu.
Ep+
Ep-
Consumed (+) phase (Ep
1
+
, Ep
2
+
, Ep
3
+
) or total (Ep
tot
+
) active energy
Generated (-) phase (Ep
1
-
, Ep
2
-
, Ep
3
-
) or total (Ep
tot
-
) active energy
Eq+
Eq-
Consumed (+) phase (Eq
1
+
, Eq
2
+
, Eq
3
+
) or total (Eq
tot
+
) fundamental
reactive energy
Generated (-) phase (Eq
1
-
, Eq
2
-
, Eq
3
-
) or total (Eq
tot
-
) fundamental reactive
energy
Start
Recorder start time and date
Duration
Recorder elapsed time
F3
F4
3.7 Energy
3.7.1 Meter
Instrument shows status of energy counters in energy menu. Results can be seen in a
tabular (METER) form. Energy measurement is active only if GENERAL RECORDER is
active. See section 3.14 for instructions how to start GENERAL RECORDER. The
meter screens are shown on figures below.
Figure 3.27: Energy counters screen
Table 3.16: Instrument screen symbols and abbreviations
39
Page 40

MI 2883 Energy Master Operating the instrument
HOLD
Holds measurement on display.
RUN
Runs held measurement.
TOT LAST CUR
Shows energy registers for whole record.
TOT LAST CUR
Shows energy registers for last interval.
TOT LAST CUR
Shows energy registers for current interval.
1 2 3 T
Shows energy parameters for phase L1.
1 2 3 T
Shows energy parameters for phase L2.
1 2 3 T
Shows energy parameters for phase L3.
1 2 3 T
Shows all phases energy.
1 2 3 T
Shows energy parameters for Totals.
METER
Switches to METER view.
TREND
Switches to TREND view.
EFF
Switches to EFFICIENCY view.
Triggers Waveform snapshot.
Returns to the “MEASUREMENTS” submenu.
Ep+
Ep-
Consumed (+) phase (Ep
1
+
, Ep
2
+
, Ep
3
+
) or total (Ep
tot
+
) active energy
Generated (-) phase (Ep
1
-
, Ep
2
-
, Ep
3
-
) or total (Ep
tot
-
) active energy
Eq+
Eq-
Consumed (+) phase (Eq
1
+
, Eq
2
+
, Eq
3
+
) or total (Eq
tot
+
) fundamental
reactive energy
Generated (-) phase (Eq
1
-
, Eq
2
-
, Eq
3
-
) or total (Eq
tot
-
) fundamental reactive
energy
Start
Recorder start time and date
Duration
Recorder elapsed time
F1
F2
F3
F4
Table 3.17: Keys in Energy (METER) screens
3.7.2 Trend
TREND view is available only during active recording (see section 3.14 for instructions
how to start GENERAL RECORDER).
Figure 3.28: Energy trend screen
Table 3.18: Instrument screen symbols and abbreviations
40
Page 41

MI 2883 Energy Master Operating the instrument
Ep+ Eq+ Ep- Eq-
Shows active consumed energy for time interval (IP)
selected by cursor.
Ep+ Eq+ Ep- Eq-
Shows reactive consumed energy for time interval (IP)
selected by cursor.
Ep+ Eq+ Ep- Eq-
Shows active generated energy for time interval (IP)
selected by cursor.
Ep+ Eq+ Ep- Eq-
Shows reactive generated energy for time interval (IP)
selected by cursor.
1 2 3 T
Shows energy records for phase L1.
1 2 3 T
Shows energy records for phase L2.
1 2 3 T
Shows energy records for phase L3.
1 2 3 T
Shows all phases energy records.
1 2 3 T
Shows energy records for Totals.
METER
Switches to METER view.
TREND
Switches to TREND view.
EFF
Switches to EFFICIENCY view.
Returns to the “MEASUREMENTS” submenu.
P avg+
P+ avg+
P avgP+ avg-
Consumed phase fundamental active power (Pfund
1
+
, Pfund
2
+
, Pfund
3
+
)
Positive sequence of total fundamental consumed active power (P
+
tot
+
)
Generated phase fundamental active power (Pfund
1
-
, Pfund
2
-
, Pfund
3
-
)
Positive sequence of total fundamental generated active power (P
+
tot
-
)
Shown active power is averaged over chosen time interval (key: F2)
TOT – shows total average (for complete record) active power
LAST – shows average active power in the last interval
MAX - shows average active power in interval where Ep was
F2
F3
F4
Table 3.19: Keys in Energy (TREND) screens
3.7.3 Efficiency
EFFICIENCY view is available only during active recording (see section 3.14 for
instructions how to start GENERAL RECORDER).
Figure 3.29: Energy efficiency screen
Table 3.20: Instrument screen symbols and abbreviations
41
Page 42

MI 2883 Energy Master Operating the instrument
maximal.
Qi avg+
Qi+ avg+
Qi avgQi+ avg-
Consumed phase fundamental inductive reactive power (Qfund
ind1
+
,
Qfund
ind2
+
, Qfund
ind3
+
)
Positive sequence of total inductive fundamental consumed reactive power
(Q
+
tot
+
)
Generated phase fundamental inductive reactive power (Qfund
ind1
-
,
Qfund
ind2
-
, Qfund
ind3
-
)
Positive sequence of total inductive fundamental generated reactive power
(Q
+
tot
-
)
Shown fundamental inductive reactive power is averaged over chosen time
interval (key: F2)
TOT – shows total average (for complete record) fundamental
inductive reactive power
LAST – shows average fundamental inductive reactive power in the
last interval
MAX – shows average fundamental inductive reactive power in
interval where Ep was maximal.
Qc avg+
Qc+ avg+
Qc avgQc+ avg-
Consumed phase fundamental capacitive reactive power (Qfund
cap1
+
,
Qfund
cap2
+
, Qfund
cap3
+
)
Positive sequence of total capacitive fundamental consumed reactive
power (Q
+
tot
+
)
Generated phase fundamental capacitive reactive power (Qfund
cap1
-
,
Qfund
cap2
-
, Qfund
cap3
-
)
Positive sequence of total capacitive fundamental generated reactive
power (Q
+
tot
+
)
Shown fundamental capacitive reactive power is averaged over chosen
time interval (key: F2)
TOT – shows total average (for complete record) fundamental
capacitive reactive power
LAST – shows average fundamental capacitive reactive power in
the last interval
MAX – shows average fundamental capacitive reactive power in
interval where Ep was maximal.
Sn avg
Sen avg
Phase nonfundamental apparent power (Sɴ1, Sɴ2, Sɴ3)
Total effective nonfundamental apparent power (Seɴ).
Shown nonfundamental apparent power is averaged over chosen time
interval (key: F2)
TOT – shows total average (for complete record) of nonfundamental
apparent power
LAST – shows average nonfundamental apparent power in the last
interval
MAX – shows average nonfundamental apparent power in interval
where Ep was maximal.
Su
Fundamental unbalanced power, according to the IEEE 1459-2010
Ep+
Ep-
Consumed phase (Ep
1
+
, Ep
2
+
, Ep
3
+
) or total (Ep
tot
+
) active energy
Generated phase (Ep
1
-
, Ep
2
-
, Ep
3
-
) or total (Ep
tot
-
) active energy
Shown active energy depends on chosen time interval (key: F2)
42
Page 43

MI 2883 Energy Master Operating the instrument
TOT – shows accumulated energy for complete record
LAST – shows accumulated energy in last interval
MAX – shows maximal accumulated energy in any interval
Eq+
Eq-
Consumed (+) phase (Eq
1
+
, Eq
2
+
, Eq
3
+
) or total (Eq
tot
+
) fundamental
reactive energy
Generated (-) phase (Eq
1
-
, Eq
2
-
, Eq
3
-
) or total (Eq
tot
-
) fundamental reactive
energy
Shown reactive energy depends on chosen time interval (key: F2)
TOT – shows accumulated energy for complete record
LAST – shows accumulated energy in last interval
MAX – shows accumulated reactive energy in interval where Ep
was maximal.
Conducto
rs
utilisation
Shows conductor cross section utilisation for chosen time interval
(TOT/LAST/MAX):
GREEN colour – represents part of conductor cross section
(wire) used for active energy transfer (Ep)
RED colour – represents part of conductor cross section
(wire) used for fundamental reactive energy transfer (Eq)
BLUE colour – represents part of conductor cross section
(wire) used for nonfundamental (harmonic) apparent energy
transfer (Sɴ)
BROWN colour – represents unbalanced power (SU) portion
flowing in polyphase system in respect to phase power flow.
Date
End time of shown interval.
Max.
Power
Demand
Shows three intervals where measured active power was maximal.
VIEW
Switches between Consumed (+) and Generated (-) energy
view.
TOT LAST MAX
Shows parameters for complete record duration
TOT LAST MAX
Shows parameters for last (complete) recorded interval
TOT LAST MAX
Shows parameters for interval, where active energy was
maximal
1 2 3 T
Shows energy records for phase L1.
1 2 3 T
Shows energy records for phase L2.
1 2 3 T
Shows energy records for phase L3.
1 2 3 T
Shows all phases energy records.
1 2 3 T
Shows energy records for Totals.
METER
Switches to METER view.
TREND
Switches to TREND view.
EFF
Switches to EFFICIENCY view.
Returns to the “MEASUREMENTS” submenu.
F1
F2
F3
F4
Table 3.21: Keys in Energy (TREND) screens
43
Page 44

MI 2883 Energy Master Operating the instrument
RMS
RMS voltage / current value
THD
Total voltage / current harmonic distortion THDU and THDI in % of
fundamental voltage / current harmonic or in RMS V, A.
k
k-factor (unit-less) indicates the amount of harmonics that load
generate
DC
Voltage or current DC component in % of fundamental voltage /
current harmonic or in RMS V, A.
h1 … h50
n-th harmonic voltage Uhn or current Ihn component in % of
fundamental voltage / current harmonic or in RMS V, A.
ih0 … ih50
n-th interharmonic voltage Uihn or current Iihn component in % of
fundamental voltage / current harmonic or in RMS V, A.
HOLD
Holds measurement on display. Hold clock time will be
displayed in the right top corner.
RUN
Runs held measurement.
F1
3.8 Harmonics / interharmonics
Harmonics presents voltage and current signals as a sum of sinusoids of power
frequency and its integer multiples. Sinusoidal wave with frequency k-times higher than
fundamental (k is an integer) is called harmonic wave and is denoted with amplitude
and a phase shift (phase angle) to a fundamental frequency signal. If a signal
decomposition with Fourier transformation results with presence of a frequency that is
not integer multiple of fundamental, this frequency is called interharmonic frequency and
component with such frequency is called interharmonic. See 5.1.7 for details.
3.8.1 Meter
By entering HARMONICS option from Measurements submenu the tabular
HARMONICS (METER) screen is shown (see figure below). In this screens voltage and
current harmonics or interharmonics and THD are shown.
Figure 3.30: Harmonics and interharmonics (METER) screens
Description of symbols and abbreviations used in METER screens are shown in table
below.
Table 3.22: Instrument screen symbols and abbreviations
Table 3.23: Keys in Harmonics / interharmonics (METER) screens
44
Page 45

MI 2883 Energy Master Operating the instrument
VIEW
Switches view between Harmonics and Interharmonics.
Switches units between:
RMS (Volts ,Amperes)
% of fundamental harmonic
Keys in VIEW window:
Selects option.
Confirms selected option.
Exits selection window without
change.
Selects between single phase, neutral, all-phases and line
harmonics / interharmonics view.
1 2 3 N
Shows harmonics / interharmonics components for phase L1.
1 2 3 N
Shows harmonics / interharmonics components for phase L2.
1 2 3 N
Shows harmonics / interharmonics components for phase L3.
1 2 3 N
Shows harmonics / interharmonics components for neutral
channel.
1 2 3 N
Shows harmonics / interharmonics components for all phases
on single screen.
12 23 31 Δ
Shows harmonics / interharmonics components for phase
L12.
12 23 31 Δ
Shows harmonics / interharmonics components for phase
L23.
12 23 31 Δ
Shows harmonics / interharmonics components for phase
L31.
12 23 31 Δ
Shows harmonics / interharmonics components for phase-tophase voltages.
METER
Switches to METER view.
BAR
Switches to BAR view.
AVG
Switches to AVG (average) view (available only during
recording).
TREND
Switches to TREND view (available only during recording).
Shifts through harmonic / interharmonic components.
Triggers Waveform snapshot.
Returns to the “MEASUREMENTS” submenu.
F2
ENTER
F3
F4
45
Page 46

MI 2883 Energy Master Operating the instrument
Ux h01 … h50
Instantaneous voltage harmonic / interharmonic component in V
RMS
and in % of fundamental voltage
Ix h01 … h50
Instantaneous current harmonic / interharmonic component in A
RMS
and in % of fundamental current
Ux DC
Instantaneous DC voltage in V and in % of fundamental voltage
Ix DC
Instantaneous DC current in A and in % of fundamental current
Ux THD
Instantaneous total voltage harmonic distortion THDU in V and in %
of fundamental voltage
Ix THD
Instantaneous total current harmonic distortion THDI in A
RMS
and in
% of fundamental current
HOLD
Holds measurement on display.
RUN
Runs held measurement.
VIEW
Switches view between harmonics and interharmonics.
Keys in VIEW window:
Selects option.
Confirms selected option.
Exits selection window without
change.
F1
F2
ENTER
3.8.2 Histogram (Bar)
Bar screen displays dual bar graphs. The upper bar graph shows instantaneous voltage
harmonics and the lower bar graph shows instantaneous current harmonics.
Figure 3.31: Harmonics histogram screen
Description of symbols and abbreviations used in BAR screens are shown in table
below.
Table 3.24: Instrument screen symbols and abbreviations
Table 3.25: Keys in Harmonics / interharmonics (BAR) screens
46
Page 47

MI 2883 Energy Master Operating the instrument
Selects between single phases and neutral channel
harmonics / interharmonics bars.
1 2 3 N
Shows harmonics / interharmonics components for phase L1.
1 2 3 N
Shows harmonics / interharmonics components for phase L2.
1 2 3 N
Shows harmonics / interharmonics components for phase L3.
1 2 3 N
Shows harmonics / interharmonics components for neutral
channel.
12 23 31
Shows harmonics / interharmonics components for phase
L12.
12 23 31
Shows harmonics / interharmonics components for phases
L23.
12 23 31
Shows harmonics / interharmonics components for phases
L31.
METER
Switches to METER view.
BAR
Switches to BAR view.
AVG
Switches to AVG (average) view (available only during
recording).
TREND
Switches to TREND view (available only during recording).
Scales displayed histogram by amplitude.
Scrolls cursor to select single harmonic / interharmonic bar.
Toggles cursor between voltage and current histogram.
Triggers Waveform snapshot.
Returns to the “MEASUREMENTS” submenu.
F3
F4
ENTER
3.8.3 Harmonics Average Histogram (Avg Bar)
During active GENERAL RECORDER, Harmonics average histogram AVG view is
available (see section 3.14 for instructions how to start GENERAL RECORDER). In this
view average voltage and current harmonic values are shown (averaged from beginning
of the recording to the current moment). Harmonics average histogram screen displays
dual bar graphs. The upper bar graph shows average voltage harmonics and the lower
bar graph shows average current harmonics.
47
Page 48

MI 2883 Energy Master Operating the instrument
Ux h01 … h50
Average voltage harmonic / interharmonic component in V
RMS
and in
% of fundamental voltage (from beginning of the recording)
Ix h01 … h50
Average current harmonic / interharmonic component in A
RMS
and in
% of fundamental current
Ux DC
Average DC voltage in V and in % of fundamental voltage
Ix DC
Average DC current in A and in % of fundamental current
Ux THD
Average total voltage harmonic distortion THDU in V and in % of
fundamental voltage
Ix THD
Average total current harmonic distortion THDI in A
RMS
and in % of
fundamental current
VIEW
Switches view between harmonics and interharmonics.
Keys in VIEW window:
Selects option.
Confirms selected option.
Exits selection window without
change.
Selects between single phases and neutral channel
harmonics / interharmonics bars.
1 2 3 N
Shows harmonics / interharmonics components for phase L1.
1 2 3 N
Shows harmonics / interharmonics components for phase L2.
1 2 3 N
Shows harmonics / interharmonics components for phase L3.
1 2 3 N
Shows harmonics / interharmonics components for neutral
F2
ENTER
F3
Figure 3.32: Harmonics average histogram screen
Description of symbols and abbreviations used in AVG screens are shown in table
below.
Table 3.26: Instrument screen symbols and abbreviations
Table 3.27: Keys in Harmonics / interharmonics (AVG) screens
48
Page 49

MI 2883 Energy Master Operating the instrument
channel.
12 23 31
Shows harmonics / interharmonics components for phase
L12.
12 23 31
Shows harmonics / interharmonics components for phases
L23.
12 23 31
Shows harmonics / interharmonics components for phases
L31.
METER
Switches to METER view.
BAR
Switches to BAR view.
AVG
Switches to AVG (average) view (available only during
recording).
TREND
Switches to TREND view (available only during recording).
Scales displayed histogram by amplitude.
Scrolls cursor to select single harmonic / interharmonic bar.
Toggles cursor between voltage and current histogram.
Triggers Waveform snapshot.
Returns to the “MEASUREMENTS” submenu.
F4
ENTER
3.8.4 Trend
During active GENERAL RECORDER, TREND view is available (see section 3.14 for
instructions how to start GENERAL RECORDER). Voltage and current harmonic /
interharmonic components can be observed by cycling function key F4 (METER-BARAVG-TREND).
49
Page 50

MI 2883 Energy Master Operating the instrument
ThdU
Interval maximal ( ) and average ( ) value of total voltage harmonic
distortion THDU for selected phase
ThdI
Interval maximal ( ) and average ( ) value of total current harmonic
distortion THDI for selected phase
Udc
Interval maximal ( ) and average ( ) value of DC voltage component
for selected phase
Idc Interval maximal ( ) and average ( )value of selected DC current
component for selected phase
Uh01...Uh50
Uih01…Uih50
Interval maximal ( ) and average ( ) value for selected n-th voltage
harmonic / interharmonic component for selected phase
Ih01…Ih50
Iih01…Ih50
Interval maximal ( ) and average ( )value of selected n-th current
harmonic / interharmonic component for selected phase
VIEW
Switches between harmonics or interharmonics view.
Switches measurement units between RMS V,A or % of
fundamental harmonic.
Selects harmonic number for observing.
Keys in VIEW window:
Selects option.
Confirms selected option.
Exits selection window without
change.
F2
ENTER
Figure 3.33: Harmonics and interharmonics trend screen
Table 3.28: Instrument screen symbols and abbreviations
Table 3.29: Keys in Harmonics / interharmonics (TREND) screens
50
Page 51

MI 2883 Energy Master Operating the instrument
Selects between single phases and neutral channel harmonics /
interharmonics trends.
1 2 3 N
Shows selected harmonics / interharmonics components for
phase L1.
1 2 3 N
Shows selected harmonics / interharmonics components for
phase L2.
1 2 3 N
Shows selected harmonics / interharmonics components for
phase L3.
1 2 3 N
Shows selected harmonics / interharmonics components for
neutral channel.
12 23 31
Shows selected harmonics / interharmonics components for
phase to phase voltage L12.
12 23 31
Shows selected harmonics / interharmonics components for
phase to phase voltage L23.
12 23 31
Shows selected harmonics / interharmonics components for
phase to phase voltage L31.
METER
Switches to METER view.
BAR
Switches to BAR view.
AVG
Switches to AVG (average) view (available only during
recording).
TREND
Switches to TREND view (available only during recording).
Moves cursor and select time interval (IP) for observation.
Returns to the “MEASUREMENTS” submenu.
F3
F4
3.9 Flickers
Flickers measure the human perception of the effect of amplitude modulation on the
mains voltage powering a light bulb. In Flickers menu instrument shows measured
flicker parameters. Results can be seen in a tabular (METER) or a graphical form
(TREND) - which is active only while GENERAL RECORDER is active. See section
3.14 for instructions how to start recording. In order to understand meanings of
particular parameter see section 5.1.8.
3.9.1 Meter
By entering FLICKERS option from MEASUREMENTS submenu the FLICKERS tabular
screen is shown (see figure below).
51
Page 52

MI 2883 Energy Master Operating the instrument
Urms
True effective value U1, U2, U3, U12, U23, U31
Pinst,max
Maximal instantaneous flicker for each phase refreshed each 10 seconds
Pst(1min)
Short term (1 min) flicker P
st1min
for each phase measured in last minute
Pst
Short term (10 min) flicker Pst for each phase measured in last 10 minutes
Plt
Long term flicker (2h) Pst for each phase measured in last 2 hours
HOLD
Holds measurement on display. Hold clock time will be
displayed in the right top corner.
RUN
Runs held measurement.
METER
Switches to METER view.
TREND
Switches to TREND view (available only during recording).
Triggers Waveform snapshot.
Returns to the “MEASUREMENTS” submenu.
F1
F4
Figure 3.34: Flickers table screen
Description of symbols and abbreviations used in METER screen is shown in table
below. Note that Flickers measurement intervals are synchronised to real time clock,
and therefore refreshed on minute, 10 minutes and 2 hours intervals.
Table 3.30: Instrument screen symbols and abbreviations
Table 3.31: Keys in Flickers (METER) screen
3.9.2 Trend
During active recording TREND view is available (see section 3.14 for instructions how
to start recording). Flicker parameters can be observed by cycling function key F4
(METER -TREND). Note that Flicker meter recording intervals are determinate by
standard IEC 61000-4-15. Flicker meter therefore works independently from chosen
recording interval in GENERAL RECORDER.
52
Page 53

MI 2883 Energy Master Operating the instrument
Pst1m1,
Pst1m2,
Pst1m3,
Pst1m12,
Pst1m23,
Pst1m31
Maximal ( ), average ( ) and minimal ( ) value of 1-minute short
term flicker P
st(1min)
for phase voltages U1, U2, U3 or line voltages
U12, U23, U31
Pst1,
Pst2,
Pst3,
Pst12,
Pst23,
Pst31
Maximal ( ), average ( ) and minimal ( ) value of 10-minutes
short term flicker P
st
for phase voltages U1, U2, U3 or line voltages
U12, U23, U31
Plt1,
Plt2,
Plt3,
Plt12,
Plt23,
Plt31
Maximal ( ), average ( ) and minimal ( ) value of 2-hours long
term flicker P
lt
in phase voltages U1, U2, U3 or line voltages U12,
U23, U31
Figure 3.35: Flickers trend screen
Table 3.32: Instrument screen symbols and abbreviations
53
Page 54

MI 2883 Energy Master Operating the instrument
Selects between the following options:
Pst Plt Pstmin
Shows 10 min short term flicker Pst.
Pst Plt Pstmin
Shows long term flicker Plt.
Pst Plt Pstmin
Shows 1 min short term flicker P
st1min
.
Selects between trending various parameters:
1 2 3
Shows selected flicker trends for phase L1.
1 2 3
Shows selected flicker trends for phase L2.
1 2 3
Shows selected flicker trends for phase L3.
1 2 3
Shows selected flicker trends for all phases (average
only).
12 23 31 Δ
Shows selected flicker trends for phases L12.
12 23 31 Δ
Shows selected flicker trends for phases L23.
12 23 31 Δ
Shows selected flicker trends for phases L31.
12 23 31 Δ
Shows selected flicker trends for all phases (average
only).
METER
Switches to METER view.
TREND
Switches to TREND view (available only during recording).
Moves cursor and selects time interval (IP) for observation.
Returns to the “MEASUREMENTS” submenu.
F2
F3
F4
Table 3.33: Keys in Flickers (TREND) screens
3.10 Phase Diagram
Phase diagram graphically represent fundamental voltages, currents and phase angles
of the network. This view is strongly recommended for checking instrument connection
before measurement. Note that most measurement issues arise from wrongly
connected instrument (see 4.1 for recommended measuring practice). On phase
diagram screens instrument shows:
Graphical presentation of voltage and current phase vectors of the measured
system,
Unbalance of the measured system.
3.10.1 Phase diagram
By entering PHASE DIAGRAM option from MEASUREMENTS submenu, the following
screen is shown (see figure below).
54
Page 55

MI 2883 Energy Master Operating the instrument
U1, U2, U3
Fundamental voltages Ufund1, Ufund2, Ufund3 with relative phase
angle to Ufund
1
U12, U23, U31
Fundamental voltages Ufund12, Ufund23, Ufund31 with relative phase
angle to Ufund
12
I1, I2, I3
Fundamental currents Ifund1, Ifund2, Ifund3 with relative phase angle
to Ufund1 or Ufund12
HOLD
Holds measurement on display. Hold clock time will be
displayed in the right top corner.
RUN
Runs held measurement.
U I
I U
Selects voltage for scaling (with cursors).
Selects current for scaling (with cursors).
METER
Switches to PHASE DIAGRAM view.
UNBAL.
Switches to UNBALANCE DIAGRAM view.
TREND
Switches to TREND view (available only during recording).
Scales voltage or current phasors.
Triggers Waveform snapshot.
Returns to the “MEASUREMENTS” submenu.
F1
F2
F4
Figure 3.36: Phase diagram screen
Table 3.34: Instrument screen symbols and abbreviations
Table 3.35: Keys in Phase diagram screen
3.10.2 Unbalance diagram
Unbalance diagram represents current and voltage unbalance of the measuring system.
Unbalance arises when RMS values or phase angles between consecutive phases are
not equal. Diagram is shown on figure below.
55
Page 56

MI 2883 Energy Master Operating the instrument
U0
I0
Zero sequence voltage component U
0
Zero sequence current component I
0
U+
I+
Positive sequence voltage component U
+
Positive sequence current component I
+
UI-
Negative sequence voltage component U
-
Negative sequence current component I
-
u-
i-
Negative sequence voltage ratio u
-
Negative sequence current ratio i-
u0
i0
Zero sequence voltage ratio u
0
Zero sequence current ratio i0
HOLD
Holds measurement on display. Hold clock time will be
displayed in the right top corner.
RUN
Runs held measurement.
U I
I U
Shows voltage unbalance measurement and selects voltage
for scaling (with cursors)
Shows current unbalance measurement and selects current
for scaling (with cursors)
METER
Switches to PHASE DIAGRAM view.
UNBAL.
Switches to UNBALANCE DIAGRAM view.
TREND
Switches to TREND view (available only during recording).
Scales voltage or current phasors.
Triggers Waveform snapshot.
Returns to the “MEASUREMENTS” submenu.
F1
F2
F4
Figure 3.37: Unbalance diagram screen
Table 3.36: Instrument screen symbols and abbreviations
Table 3.37: Keys in Unbalance diagram screens
56
Page 57

MI 2883 Energy Master Operating the instrument
u- Maximal ( ), average ( ) and minimal ( ) value of negative
sequence voltage ratio u-
u0 Maximal ( ), average ( ) and minimal ( ) value of zero sequence
voltage ratio u0
i- Maximal ( ), average ( ) and minimal ( ) value of negative
sequence current ratio i-
i0
Maximal ( ), average ( ) and minimal ( ) value of zero sequence
current ratio i0
U+
Maximal ( ), average ( ) and minimal ( ) value of positive sequence
voltage U+
U-
Maximal ( ), average ( ) and minimal ( ) value of negative
sequence voltage U-
U0
Maximal ( ), average ( ) and minimal ( ) value of zero sequence
voltage U0
I+
Maximal ( ), average ( ) and minimal ( ) value of positive sequence
current I+
I-
Maximal ( ), average ( ) and minimal ( ) value of negative
sequence current I-
I0
Maximal ( ), average ( ) and minimal ( ) value of zero sequence
current I0
U+ U- U0
I+ I- I0
u+ u0 i+ i0
Shows selected voltage and current unbalance
measurement (U+, U-, U0, I+, I-, I0, u-, u0, i-, i0).
METER
Switches to PHASE DIAGRAM view.
UNBAL.
Switches to UNBALANCE DIAGRAM view.
TREND
Switches to TREND view (available only during recording).
F2
F4
3.10.3 Unbalance trend
During active recording UNBALANCE TREND view is available (see section 3.14 for
instructions how to start GENERAL RECORDER).
Figure 3.38: Symmetry trend screen
Table 3.38: Instrument screen symbols and abbreviations
Table 3.39: Keys in Unbalance trend screens
57
Page 58

MI 2883 Energy Master Operating the instrument
Moves cursor and selects time interval (IP) for observation.
Returns to the “MEASUREMENTS” submenu.
1
0
C
Current temperature in Celsius degrees
0
F
Current temperature in Fahrenheit degrees
HOLD
Holds measurement on display. Hold clock time will be
displayed in the right top corner.
RUN
Runs held measurement.
METER
Switches to METER view.
TREND
Switches to TREND view (available only during recording).
Triggers Waveform snapshot.
Returns to the “MEASUREMENTS” submenu.
F1
F4
3.11 Temperature
Energy Master instrument is capable of measuring and recording temperature with
Temperature probe A 13541. Temperature is expressed in both units, Celsius and
Fahrenheit degrees. See following sections for instructions how to start recording. In
order to learn how to set up neutral clamp input with the temperature sensor, see
section 4.2.4.
Optional accessory
3.11.1 Meter
Figure 3.39: Temperature meter screen
Table 3.40: Instrument screen symbols and abbreviations
Table 3.41: Keys in Temperature meter screen
58
Page 59

MI 2883 Energy Master Operating the instrument
T:
Maximal ( ), average ( ) and minimal ( ) temperature value for last
recorded time interval (IP)
0
C
0
F
Shows temperature in Celsius degrees.
0
C
0
F
Shows temperature in Fahrenheit degrees.
METER
Switches to METER view.
TREND
Switches to TREND view (available only during recording).
Returns to the “MEASUREMENTS” submenu.
F2
F4
3.11.2 Trend
Temperature measurement TREND can be viewed during the recording in progress.
Records containing temperature measurement can be viewed from Memory list and by
using PC software PowerView v3.0.
Figure 3.40: Temperature trend screen
Table 3.42: Instrument screen symbols and abbreviations
Table 3.43: Keys in Temperature trend screens
3.12 Underdeviation and overdeviation
Underdeviation and overdeviation parameters are useful when it is important to avoid,
for example, having sustained undervoltages being cancelled in data by sustained
overvoltages. Results can be seen in a tabular (METER) or a graphical form (TREND)
view - which is active only while GENERAL RECORDER is active. See section 3.14 for
instructions how to start recording. In order to understand meanings of particular
parameter see section 5.1.11.
3.12.1 Meter
By entering DEVIATION option from MEASUREMENTS submenu the UNDER/OVER
DEVIATION tabular screen is shown (see figure below).
59
Page 60

MI 2883 Energy Master Operating the instrument
Urms
True effective value U1, U2, U3, U12, U23, U31
Uunder
Instantaneous underdeviation voltage U
Under
expressed in voltage and %
of nominal voltage
Uover
Instantaneous overdeviation voltage U
Over
expressed in voltage and % of
nominal voltage
HOLD
Holds measurement on display. Hold clock time will be
displayed in the right top corner.
RUN
Runs held measurement.
Selects between trending various parameters
Δ
Shows under/over deviations measurements for all phase
voltages
Δ
Shows under/over deviations measurements for all phase to
phase voltages
METER
Switches to METER view.
TREND
Switches to TREND view (available only during recording).
Triggers Waveform snapshot.
Returns to the “MEASUREMENTS” submenu.
F1
F3
F4
Figure 3.41: Underdeviation and overdeviation table screen
Description of symbols and abbreviations used in METER screen is shown in table
below.
Table 3.44: Instrument screen symbols and abbreviations
Table 3.45: Keys in Underdeviation and overdeviation (METER) screen
3.12.2 Trend
During active recording TREND view is available (see section 3.14 for instructions how
to start recording). Underdeviation and overdeviation parameters can be observed by
cycling function key F4 (METER -TREND).
60
Page 61

MI 2883 Energy Master Operating the instrument
Uunder1
Uunder2
Uunder3
Uunder12
Uunder22
Uunder31
Interval average ( ) value of corresponding underdeviation voltage
U
1Under
, U
2Under
, U
3Under
, U
12Under
, U
23Under
, U
31Under
, expressed in % of
nominal voltage.
Uover1
Uover2
Uover3
Uover12
Uover23
Uover31
Interval average ( ) value of corresponding overdeviation voltage
U
1Over
, U
2Over
, U
3Over
, U
12Over
, U
23Over
, U
31Over
, expressed in % of
nominal voltage.
Selects between the following options:
Under Over
Shows underdeviation trends
Under Over
Shows overdeviation trends
Selects between trending various parameters:
Δ
Shows trends for all phase under/over deviations
Δ
Shows trends for all lines under/over deviations
METER
Switches to METER view.
TREND
Switches to TREND view (available only during recording).
Moves cursor and selects time interval (IP) for observation.
Returns to the “MEASUREMENTS” submenu.
F2
F3
F4
Figure 3.42: Underdeviation and overdeviation TREND screen
Table 3.46: Instrument screen symbols and abbreviations
Table 3.47: Keys in Underdeviation and Overdeviation (TREND) screens
61
Page 62

MI 2883 Energy Master Operating the instrument
Sig1
316.0 Hz
True effective value signal voltage (U
Sig1
, U
Sig2
, U
Sig3
, U
Sig12
, U
Sig23
,
U
Sig31
) for a user-specified carrier frequency (316.0 Hz in shown
example) expressed in Volts or percent of fundamental voltage
Sig2
1060.0 Hz
True effective value signal voltage (U
Sig1
, U
Sig2
, U
Sig3
, U
Sig12
, U
Sig23
,
U
Sig31
) for a user-specified carrier frequency (1060.0 Hz in shown
example) expressed in Volts or percent of fundamental voltage
RMS
True effective value of phase or phase to phase voltage U
Rms (U1
, U2,
U3, U12, U23, U31)
HOLD
Holds measurement on display. Hold clock time will be
displayed in the right top corner.
F1
3.13 Signalling
Mains signalling voltage, called “ripple control signal” in certain applications, is a burst of
signals, often applied at a non-harmonic frequency, that remotely control industrial
equipment, revenue meters, and other devices. Before observing signalling
measurements, user should set-up signalling frequencies in signalling setup menu (see
section 3.19.4).
Results can be seen in a tabular (METER) or a graphical form (TREND) - which is
active only while GENERAL RECORDER is active. See section 3.14 for instructions
how to start recording. In order to understand meanings of particular parameter see
section 5.1.8.
3.13.1 Meter
By entering SIGNALLING option from MEASUREMENTS submenu the SIGNALLING
tabular screen is shown (see figure below).
Figure 3.43: Signalling meter screen
Description of symbols and abbreviations used in METER screen is shown in table
below.
Table 3.48: Instrument screen symbols and abbreviations
Table 3.49: Keys in Signalling (METER) screen
62
Page 63

MI 2883 Energy Master Operating the instrument
RUN
Runs held measurement.
METER
Switches to METER view.
TREND
Switches to TREND view (available only during recording).
TABLE
Switches to TABLE view (available only during recording).
Triggers Waveform snapshot.
Returns to the “MEASUREMENTS” submenu.
Usig1, Usig2, Usig3,
Usig12, Usig23, Usig31
Maximal ( ), average ( ) and minimal ( ) value of (U
Sig1
,
U
Sig2
, U
Sig3
, U
Sig12
, U
Sig23
, U
Sig31
) signal voltage for a user-
specified Sig1/Sig2 frequency (Sig1 = 316.0 Hz / Sig2 =
1060.0 Hz in shown example).
14.Nov.2013
13:50:00
Timestamp of interval (IP) selected by cursor.
22h 25m 00s
Current GENERAL RECORDER time (Days
hours:min:sec)
Selects between the following options:
f1 f2
Shows signal voltage for a user-specified signalling
frequency (Sig1).
f1 f2
Shows signal voltage for a user-specified signalling
frequency (Sig2).
Selects between trending various parameters:
1 2 3
Shows signalling for phase 1
F4
F2
F3
3.13.2 Trend
During active recording TREND view is available (see section 3.14 for instructions how
to start recording). Signalling parameters can be observed by cycling function key F4
(METER -TREND).
Figure 3.44: Signalling trend screen
Table 3.50: Instrument screen symbols and abbreviations
Table 3.51: Keys in Signalling (TREND) screen
63
Page 64

MI 2883 Energy Master Operating the instrument
1 2 3
Shows signalling for phase 2
1 2 3
Shows signalling for phase 3
1 2 3
Shows signalling for all phases (average only)
12 23 31 Δ
Shows signalling for phase to phase voltage L12.
12 23 31 Δ
Shows signalling for phase to phase voltage L23.
12 23 31 Δ
Shows signalling for phase to phase voltage L31.
12 23 31 Δ
Shows signalling for all phase to phase voltages (average
only).
METER
Switches to METER view.
TREND
Switches to TREND view (available only during recording).
TABLE
Switches to TABLE view (available only during recording).
Moves cursor and select time interval (IP) for observation.
Returns to the “MEASUREMENTS” submenu.
No
Signalling event number
L
Phases on which signalling event occurred
F
Flag indication
0 – none of intervals are flagged
1 – at least one of intervals inside recorded
signalling is flagged
Sig
Frequency on which signalling occurred, defined as “Sign.
1” frequency (f1) and “Sign. 2” frequency (f2) in
F4
3.13.3 Table
During active recording TABLE view is available (see section 3.14 for instructions how
to start recording), by cycling function key F4 (METER –TREND - TABLE). Signalling
events can be here observed as required by standard IEC 61000-4-30. For each
signalling event instrument capture waveform which can be observed in PowerView.
Figure 3.45: Signalling table screen
Table 3.52: Instrument screen symbols and abbreviations
64
Page 65

MI 2883 Energy Master Operating the instrument
SIGNALLING SETUP menu. See 3.19.4 for details.
START
Time when observed Signalling voltage crosses threshold
boundary.
MAX
Maximal voltage level recorder captured during signalling
events
Level
Threshold level in % of nominal voltage Un, defined in
SIGNALLING SETUP menu. See 3.19.4 for details.
Duration
Duration of captured waveform, defined in SIGNALLING
SETUP menu. See 3.19.4 for details.
f1
1st observed signalling frequency.
f2
2nd observed signalling frequency.
METER
Switches to METER view.
TREND
Switches to TREND view (available only during recording).
TABLE
Switches to TABLE view (available only during recording).
Moves cursor through signalling table.
Returns to the “MEASUREMENTS” submenu.
General recorder is active, waiting for start condition to be
met. After start conditions are met (defined start time),
instrument will capture waveform snapshot and start
F4
Table 3.53: Keys in Signalling (TABLE) screen
3.14 General Recorder
Energy Master has ability to record measured data in the background. By entering
GENERAL RECORDER option from RECORDERS submenu, recorder parameters can
be customized in order to meet criteria about interval, start time and duration for the
recording campaign. General recorder setup screen is shown below:
Figure 3.46: General recorder setup screen
Description of General recorder settings is given in the following table:
Table 3.54: General recorder settings description and screen symbols
65
Page 66

MI 2883 Energy Master Operating the instrument
(activate) General recorder.
General recorder is active, recording in progress
Note: Recorder will run until one of the following end
conditions is met:
STOP key was pressed by user
Given Duration criteria was met
Maximal record length was reached
SD CARD is full
Note: If recorder start time is not explicitly given, recorder
start depends on Real Time clock multiple of interval. For
example: recorder is activated at 12:12 with 5 minute
interval. Recorder will actually start at 12:15.
Note: If during record session instrument batteries are
drained, due to long interruption for example, instrument
will shut down automatically. After power restauration, it
will automatically start new recording session.
Interval
Select General recorder aggregation interval. The smaller
the interval is, more measurements will be used for the
same record duration.
Include events
Select whether events are included in the record.
On: Record events signatures in table form (see
3.15 for details)
Off: Events are not recorded
Include alarms
Select whether alarms are included in the record.
On: Record alarm signatures in table form (see
3.16 for details)
Off: Alarms are not recorded
Include signalling
events
Select whether signalling events according to the IEC
61000-4-30 should be included in the record.
On: Signalling events included in the record
Off: Signalling events are not recorded
Start time
Define start time of recording:
Manual, pressing function key F1
At the given time and date.
Duration
Define recording duration. General recorder will record
measurement for given time duration:
Manual,
1, 6 or 12 hours, or
1, 2, 3, 7, 15, 30, 60 days.
Recommended/maximal
record duration:
Show recommended and maximal Duration parameter for
giver recording Interval.
Available memory
Show SD card free space
66
Page 67

MI 2883 Energy Master Operating the instrument
START
STOP
Starts the recorder.
Stops the recorder.
CONFIG
Shortcut to Connection setup. See 4.2 for details.
CHECK C.
Check connection settings. See 3.19.1 for details.
Enters recorder starting date/time setup.
Keys in Set start time window:
Selects parameter to be changed.
Modifies parameter.
Confirms selected option.
Exits Set start time window without modifications.
Selects parameter to be changed.
Modifies parameter.
Returns to the “RECORDERS” submenu.
F1
F3
F4
ENTER
ENTER
Table 3.55: Keys in General recorder setup screen
3.15 Events table
In this table captured voltage dips, swells and interrupts are shown. Note that events
appear in the table after finishing, when voltage return to the normal value. All events
can be grouped according to IEC 61000-4-30. Additionally for troubleshooting purposes
events can be separated by phase. This is toggled by pressing function key F1.
Group view
In this view voltage event are grouped according to IEC 61000-4-30 (see section 5.1.11
for details). Table where events are summarized is shown below. Each line in table
represents one event, described by event number, event start time, duration and level.
Additionally in colon “T” event characteristics (Type) is shown (see table below for
details).
67
Page 68

MI 2883 Energy Master Operating the instrument
Date
Date when selected event has occurred
No.
Unified event number (ID)
L
Indicate phase or phase-to-phase voltage where event has occurred:
1 – event on phase U1
2 – event on phase U2
3 – event on phase U3
12 – event on voltage U12
23 – event on voltage U23
31 – event on voltage U31
Note: This indication is shown only in event details, since one grouped
event can have many phase events.
Start
Event start time (when first U
Rms(1/2)
) value crosses threshold.
T
Indicates type of event or transition:
D – Dip
I – Interrupt
S – Swell
Level
Minimal or maximal value in event U
Dip
, U
Int
, U
Swell
Duration
Event duration.
Figure 3.47: Voltage events in group view screen
By pressing “ENTER” on particular event we can examine event details. Event is split by
phase events and sorted by start time.
Figure 3.48: Voltage event in detail view screen
Table 3.56: Instrument screen symbols and abbreviations
68
Page 69

MI 2883 Energy Master Operating the instrument
PH
Group view is shown. Press to switch on “PHASE” view.
PH
Phase view is shown. Press to switch on “GROUP” view.
ALL INT
Shows all types of events (dips and swell). Interrupts are
treated as special case of voltage dip event. START time and
Duration in table is referenced to complete voltage event.
ALL INT
Shows poly-phase voltage interrupts only, according to the
IEC 61000-4-30 requirements. START time and Duration in
table is referenced to voltage interrupt only.
STAT
Shows event statistics (by phases).
EVENTS
Returns to “EVENTS” view.
Selects event.
F1
F2
F4
Table 3.57: Keys in Events table group view screens
69
Page 70

MI 2883 Energy Master Operating the instrument
Enters detail event view.
Returns to Events table group view screen.
Returns to “RECORDERS” submenu.
Date
Date when selected event has occurred
No.
Unified event number (ID)
L
Indicate phase or phase-to-phase voltage where event has occurred:
1 – event on phase U1
2 – event on phase U2
3 – event on phase U3
12 – event on voltage U12
23 – event on voltage U23
31 – event on voltage U31
Start
Event start time (when first U
Rms(1/2)
) value crosses threshold.
T
Indicates type of event or transition:
D – Dip
I – Interrupt
S – Swell
Level
Minimal or maximal value in event U
Dip
, U
Int
, U
Swell
Duration
Event duration.
ENTER
Phase view
In this view voltage events are separated by phases. This is convenient view for
troubleshooting. Additionally user can use filters in order to observe only particular type
of event on a specific phase. Captured events are shown in a table, where each line
contains one phase event. Each event has an event number, event start time, duration
and level. Additionally in colon “T” type of event is shown (see table below for details).
Figure 3.49: Voltage events screens
You can also see details of each individual voltage event and statistics of all events.
Statistics show count registers for each individual event type by phase.
Table 3.58: Instrument screen symbols and abbreviations
70
Page 71

MI 2883 Energy Master Operating the instrument
PH
Group view is shown. Press to switch on “PHASE” view.
PH
Phase view is shown. Press to switch on “GROUP”
view.
Filters events by type:
DIP INT SWELL
Shows all event types.
DIP INT SWELL
Shows dips only.
DIP INT SWELL
Shows interrupts only.
DIP INT SWELL
Shows swells only.
Filters events by phase:
1 2 3 T
Shows only events on phase L1.
1 2 3 T
Shows only events on phase L2.
1 2 3 T
Shows only events on phase L3.
1 2 3 T
Shows events on all phases.
12 23 31 T
Shows only events on phases L12.
12 23 31 T
Shows only events on phases L23.
12 23 31 T
Shows only events on phases L31.
12 23 31 T
Shows events on all phases.
STAT
Shows event summary (by types and phases).
EVENTS
Returns to EVENTS view.
Selects event.
Enters detail event view.
Returns to Events table phase view screen.
Returns to the “RECORDERS” submenu.
F1
F2
F3
F4
ENTER
Table 3.59: Keys in Events table phase view screens
3.16 Alarms table
This screen shows list of alarms which went off. Alarms are displayed in a table, where
each row represents an alarm. Each alarm is associated with a start time, phase, type,
slope, min/max value and duration (see 3.19.3 for alarm setup and 5.1.13 for alarm
measurement details).
71
Page 72

MI 2883 Energy Master Operating the instrument
Date
Date when selected alarm has occurred
Start
Selected alarm start time (when first U
Rms
value cross threshold)
L
Indicate phase or phase-to-phase voltage where event has occurred:
1 – alarm on phase L1
2 – alarm on phase L2
3 – alarm on phase L3
12 – alarm on line L12
23 – alarm on line L23
31 – alarm on line L31
Slope
Indicates alarms transition:
Rise – parameter has over-crossed threshold
Fall – parameter has under-crossed threshold
Min/Max
Minimal or maximal parameter value during alarm occurrence
Duration
Alarm duration.
Filters alarms according to the following
parameters:
UIF C. Pwr F. Pwr NF. Pwr
Flick Sym H iH Sig Temp
All alarms.
UIF C. Pwr F. Pwr NF. Pwr
Flick Sym H iH Sig Temp
Voltage alarms.
UIF C. Pwr F. Pwr NF. Pwr
Flick Sym H iH Sig Temp
Combined power alarms.
UIF C. Pwr F. Pwr NF. Pwr
Flick Sym H iH Sig Temp
Fundamental power alarms.
UIF C. Pwr F. Pwr NF. Pwr
Flick Sym H iH Sig Temp
Nonfundamental power alarms.
UIF C. Pwr F. Pwr NF. Pwr
Flick Sym H iH Sig Temp
Flicker alarms.
UIF C. Pwr F. Pwr NF. Pwr
Flick Sym H iH Sig Temp
Unbalance alarms.
F2
Figure 3.50: Alarms list screen
Table 3.60: Instrument screen symbols and abbreviations
Table 3.61: Keys in Alarms table screens
72
Page 73

MI 2883 Energy Master Operating the instrument
UIF C. Pwr F. Pwr NF. Pwr
Flick Sym H iH Sig Temp
Harmonics alarms.
UIF C. Pwr F. Pwr NF. Pwr
Flick Sym H iH Sig Temp
Interharmonics alarms.
UIF C. Pwr F. Pwr NF. Pwr
Flick Sym H iH Sig Temp
Signalling alarms.
UIF C. Pwr F. Pwr NF. Pwr
Flick Sym H iH Sig Temp
Temperature alarms.
Filters alarms according to phase on which
they occurred:
1 2 3 N 12 23 31 T
Shows only alarms on phase L1.
1 2 3 N 12 23 31 T
Shows only alarms on phase L2.
1 2 3 N 12 23 31 T
Shows only alarms on phase L3.
1 2 3 N 12 23 31 T
Shows only alarms on neutral channel.
1 2 3 N 12 23 31 T
Shows only alarms on phases L12.
1 2 3 N 12 23 31 T
Shows only alarms on phases L23.
1 2 3 N 12 23 31 T
Shows only alarms on phases L31.
1 2 3 N 12 23 31 T
Shows only alarms on channels which are not
channel dependent
1 2 3 N 12 23 31 T
Shows all alarms.
Selects an alarm.
Returns to the “RECORDERS” submenu.
F3
3.17 Rapid voltage changes (RVC) table
In this table captured RVC events are shown. Events appear in the table after finish,
when voltage is in the steady state. RVC events are measured and represented
according to IEC 61000-4-30. See 5.1.14 for details.
Figure 3.51: RVC Events table group view screen
73
Page 74

MI 2883 Energy Master Operating the instrument
No.
Unified event number (ID)
L
Indicate phase or phase-to-phase voltage where event has occurred:
1 – event on phase U1
2 – event on phase U2
3 – event on phase U3
12 – event on voltage U12
23 – event on voltage U23
31 – event on voltage U31
Start
Event start time (when first U
Rms(1/2)
) value crosses threshold.
Duration
Event duration.
dMax
∆Umax - maximum absolute difference between any of the U
Rms(1/2)
values during the RVC event and the final arithmetic mean 100/120
U
Rms(1/2)
value just prior to the RVC event.
dUss
∆Uss - is the absolute difference between the final arithmetic mean
100/120 U
Rms(1/2)
value just prior to the RVC event and the first arithmetic
mean 100/120 U
Rms(1/2)
value after the RVC event.
STAT
Shows event statistics (phase by phase).
RVC
Returns to RVC Events table group view screen.
Selects RVC Event.
Returns to RVC Events table group view screen.
Returns to “RECORDERS” submenu.
F4
Table 3.62: Instrument screen symbols and abbreviations
Table 3.63: Keys in RVC Events table group view screens
3.18 Memory List
Using this menu user can view and browse saved records. By entering this menu,
information about records is shown.
74
Page 75

MI 2883 Energy Master Operating the instrument
Record No
Selected record number, for which details are shown / Number of all
records.
FILE NAME
Record name on SD Card. By convention file names are created by
following rules: Rxxxxyyy.REC, where:
xxxx if record number 0000 ÷ 9999
yyy represent record type
o SNP – waveform snapshot
o GEN – general record. General record generates also
AVG, EVT, PAR, ALM, SEL files, which can be found
on SD Card and are imported into PowerView.
Type
Indicates type of record, which can be one of following:
Snapshot,
General record.
Interval
General record recording interval (integration period)
Duration
Record duration
Start
General record start time.
End
General record stop time.
Size
Record size in kilobytes (kB) or megabytes (MB).
VIEW
Views details of currently selected record.
CLEAR
Clears selected record.
USB STICK
Enable USB memory stick support.
COPY
Copy current record to USB memory stick.
CLR ALL
Opens confirmation window for clearing all saved
records.
Keys in confirmation window:
Selects YES or NO.
F1
F2
F3
F4
Figure 3.52: Memory list screen
Table 3.64: Instrument screen symbols and abbreviations
Table 3.65: Keys in Memory list screen
75
Page 76

MI 2883 Energy Master Operating the instrument
Confirms selection.
Exits confirmation window without
clearing saved records.
Browses through records (next or previous record).
Returns to the “RECORDERS” submenu.
Record No.
Selected record number, for which details are shown.
FILE NAME
Record name on SD Card
Type
Indicate type of record: General record.
Interval
General record recording interval (integration period)
Start
General record start time.
End
General record stop time.
Size
Record size in kilobytes (kB) or megabytes (MB).
VIEW
Switches to the CHANNELS SETUP menu screen.
Particular signal groups can be observed by pressing
on F1 key (VIEW).
ENTER
F1
3.18.1 General Record
This type of record is made by GENERAL RECORDER. Record front page is similar to
the GENERAL RECORDER setup screen, as shown on figure below.
Figure 3.53: Front page of General record in MEMORY LIST menu
Table 3.66: Recorder settings description
Table 3.67: Keys in General record front page screen
76
Page 77

MI 2883 Energy Master Operating the instrument
Keys in CHANNELS SETUP menu screen:
Selects particular signal group.
Enters particular signal group
(TREND view).
Exits to MEMORY LIST menu.
CLEAR
Clears the last record. In order to clear complete
memory, delete records one by one.
CLR ALL
Opens confirmation window for clearing all saved
records.
Keys in confirmation window:
Selects YES or NO.
Confirms selection.
Exits confirmation window without
clearing saved records.
Browses through records (next or previous record).
Selects parameter (only in CHANNELS SETUP menu).
Returns to the “RECORDERS” submenu.
F1
ENTER
F2
F4
ENTER
F1
By pressing VIEW, in CHANNELS SETUP menu, TREND graph of selected
channel group will appear on the screen. Typical screen is shown on figure below.
77
Page 78

MI 2883 Energy Master Operating the instrument
Memory list recall. Shown screen is recalled from memory.
Indicates position of the cursor at the graph.
U1, U2, U3:
Maximal ( ), average ( ) and minimal ( ) recorded value of phase
voltage U
1Rms
, U
2Rms
, U
3Rms,
for time interval selected by cursor.
U12, U23,
U31:
Maximal ( ), average ( ) and minimal ( ) recorded value of phase-tophase voltage U
12Rms
, U
23Rms
, U
31Rms
for time interval selected by
cursor.
Ip:
Maximal ( ), average ( ) and minimal ( ) recorded value of current
I
1Rms
, I
2Rms
, I
3Rms
, I
NRms
, for time interval selected by cursor.
38m 00s
Time position of cursor regarding to the record start time.
10.May.2013
12:08:50
Time clock at cursor position.
Selects between the following options:
U I f U,I U/I
Shows voltage trend.
U I f U,I U/I
Shows current trend.
U I f U,I U/I
Shows frequency trend.
U I f U,I U/I
Shows voltage and current trends (single mode).
U I f U,I U/I
Shows voltage and current trends (dual mode).
Selects between phase, neutral, all-phases and view:
1 2 3 N
Shows trend for phase L1.
1 2 3 N
Shows trend for phase L2.
1 2 3 N
Shows trend for phase L3.
1 2 3 N
Shows trend for neutral channel.
1 2 3 N
Shows all phases trends.
12 23 31 Δ
Shows trend for phases L12.
12 23 31 Δ
Shows trend for phases L23.
F2
F3
Figure 3.54: Viewing recorder U,I,f TREND data
Table 3.68: Instrument screen symbols and abbreviations
Table 3.69: Keys in Viewing recorder U,I,f TREND screens
78
Page 79

MI 2883 Energy Master Operating the instrument
12 23 31 Δ
Shows trend for phases L31.
12 23 31 Δ
Shows all phase to phase trends.
Moves cursor and select time interval (IP) for observation.
Returns to the “CHANNELS SETUP” menu screen.
Record No.
Selected record number, for which details are shown.
FILE NAME
Record name on SD Card
Type
Indicate type of record:
Snapshot.
Start
Record start time.
Size
Record size in kilobytes (kB).
VIEW
Switches to CHANNELS SETUP menu screen.
Particular signal group can be observed by pressing on F1
key (VIEW).
F1
Note: Other recorded data (power, harmonics, etc.) has similar manipulation principle
as described in previous sections of this manual.
3.18.2 Waveform snapshot
This type of record can be made by using key (press and hold key).
Figure 3.55: Front page of Snapshot in MEMORY LIST menu
Table 3.70: Recorder settings description
Table 3.71: Keys in Snapshot record front page screen
79
Page 80

MI 2883 Energy Master Operating the instrument
Keys in CHANNELS SETUP menu screen:
Selects particular signal group.
Enters particular signal group
(METER or SCOPE view).
Exits to MEMORY LIST menu.
CLEAR
Clears the last record. In order to clear complete memory,
delete records one by one.
CLR ALL
Opens confirmation window for clearing all saved records.
Keys in confirmation window:
Selects YES or NO.
Confirms selection.
Exits confirmation window without
clearing saved records.
Browses through records (next or previous record).
Returns to the “RECORDERS” submenu.
F1
ENTER
F2
F4
ENTER
F1
By pressing VIEW in CHANNELS SETUP menu METER screen will appear.
Typical screen is shown on figure below.
Figure 3.56: U,I,f meter screen in recalled snapshot record
80
Page 81

MI 2883 Energy Master Operating the instrument
Connection setup
Setup measurement parameters.
Event setup
Setup event parameters.
Alarm setup
Setup alarm parameters.
Signalling setup
Setup signalling parameters.
RVC setup
Setup “Rapid voltage changes” (RVC) parameters.
Selects option from the “MEASUREMENT SETUP” submenu.
Enters the selected option.
Returns to the “MAIN MENU” screen.
ENTER
Note: For more details regarding manipulation and data observing see previous
sections of this manual.
Note: WAVEFORM SNAPSHOT is automatically created at the start of GENERAL
RECORDER.
3.19 Measurement Setup submenu
From the “MEASUREMENT SETUP” submenu measurement parameters can be
reviewed, configured and saved.
Figure 3.57: MEASUREMENT SETUP submenu
Table 3.72: Description of Measurement setup options
Table 3.73: Keys in Measurement setup submenu screen
3.19.1 Connection setup
In this menu user can setup connection parameters, such as nominal voltage,
frequency, etc. After all parameters are provided, instrument will check if given
parameters complies with measurements. In case of incompatibility instrument will show
Connection check warning ( ) before leaving menu.
81
Page 82

MI 2883 Energy Master Operating the instrument
Nominal voltage
Set nominal voltage. Select voltage according to the
network voltage. If voltage is measured over potential
transformer then press ENTER for setting transformer
parameters:
Voltage ratio: Potential transformer ratio Δ :
Transformer type
Additional
transformer ratio
Primary
Secondary
Symbol
Delta
Star
1
√
3
⁄
Star
Delta
√
3
Star
Star 1
Delta
Delta 1
Note: Instrument can always measure accurately at up
to 150% of selected nominal voltage.
Phase Curr. Clamps
Neutral Curr. Clamps
Selects phase clamps for phase current measurements.
Figure 3.58: “CONNECTION SETUP” screen
Table 3.74: Description of Connection setup
82
Page 83

MI 2883 Energy Master Operating the instrument
Note: For Smart clamps (A 1227, A 1281) always select
“Smart clamps”.
Note: Use “None" option for voltage measurements
only.
Note: See section 4.2.3 for details regarding further
clamps settings.
Connection
Method of connecting the instrument to multi-phase
systems (see 4.2.1 for details).
1W: 1-phase 3-wire system;
2W: 2-phase 4-wire system;
3W: 3-phase 3-wire system;
83
Page 84

MI 2883 Energy Master Operating the instrument
4W: 3-phase 4-wire system;
OpenD: 3-phase 2 -wire (Open Delta) system.
Synchronization
Synchronization channel. This channel is used for
instrument synchronization to the network frequency.
Also a frequency measurement is performed on that
channel. Depending on Connection user can select:
1W, 2W, 4W: U1 or I1.
3W, OpenD: U12, or I1.
System frequency
Select system frequency. According to this setting 10 or
12 cycle interval will be used for calculus (according to
IEC 61000-4-30):
50 Hz – 10 cycle interval
60 Hz – 12 cycle interval
84
Page 85

MI 2883 Energy Master Operating the instrument
Connection check
Check if measurement results comply with given limits.
Measurement will be marked with OK sign ( ) if
measurement results are within following limits:
Voltage: 90% ÷ 110% of nominal voltage
Current: 10% ÷ 110% of nominal current (Current clamp
range)
Frequency: 42.5 ÷ 57.5 Hz for 50Hz and 51 ÷ 69 Hz for
60Hz system frequency
U-I Phase angle: ±900
Voltage and current sequence: 1 – 2 – 3
Each measurement, which is not within those limits, will
be market with Fail sign ( ).
Default parameters
Set factory default parameters. These are:
Nominal voltage: 230V (L-N);
Voltage ratio: 1:1;
Δ : 1
Phase current clamps: Smart Clamps;
Neutral current clamps: None;
Connection: 4W;
Synchronization: U1
System frequency: 50 Hz.
Dip voltage: 90 % U
Nom
Dip hysteresis: 2 % U
Nom
Interrupt voltage: 5 % U
Nom
Interrupt hysteresis: 2 % U
Nom
Swell voltage: 110 % U
Nom
Swell hysteresis: 2 % U
Nom
Signalling frequency1: 316 Hz
Signalling frequency2:1060 Hz
Signalling record duration: 10 sec
Signalling threshold: 5 % of nominal voltage
RVC threshold: 3 % of nominal voltage
RVC hysteresis: 25 % of RVC threshold
Clear Alarm setup table
85
Page 86

MI 2883 Energy Master Operating the instrument
Selects Connection setup parameter to be modified.
Changes selected parameter value.
Enters into submenu.
Confirms Factory reset.
Returns to the “MEASUREMENT SETUP” submenu.
Nominal voltage
Indication of type (L-N or L-L) and value of nominal voltage.
Swell Threshold
Set swell threshold value in % of nominal voltage.
Swell Hysteresis
Set swell hysteresis value in % of nominal voltage.
Dip Threshold
Set dip threshold value in % of nominal voltage.
Dip Hysteresis
Set dip hysteresis value in in % of nominal voltage.
Interrupt Threshold
Set interrupt threshold value in % of nominal voltage.
Interrupt Hysteresis
Set interrupt hysteresis in % of nominal voltage.
HELP
Shows help screens for Dip, Swell and Interrupt. See
5.1.12 for details.
ENTER
F2
Table 3.75: Keys in Connection setup menu
3.19.2 Event setup
In this menu user can setup voltage events and their parameters. See 5.1.11 for further
details regarding measurement methods. Captured events can be observed through
EVENTS TABLE screen. See 3.15 and 5.1.11 for details.
Figure 3.59: Event setup screen
Table 3.76: Description of Event setup
Table 3.77: Keys in Event setup screen
86
Page 87

MI 2883 Energy Master Operating the instrument
Keys in CHANNELS SETUP menu screen:
PREV
Previous help screen
NEXT
Next help screen
Move between help screens.
Move back to EVENT SETUP
screen
Selects Voltage events setup parameter to be modified.
Changes selected parameter value.
Returns to the “MEASUREMENT SETUP” submenu.
F1
F2
ENTER
87
Page 88

MI 2883 Energy Master Operating the instrument
1st column Quantity
(P+, Uh5, I,
on figure above)
Select alarm from measurement group and then
measurement itself.
2nd column Phase
(TOT, L1,
on figure above)
Select phases for alarms capturing
L1 – alarms on phase L1;
L2 – alarms on phase L2;
L3 – alarms on phase L3;
LN – alarms on phase N;
L12 – alarms on line L12;
L23 – alarms on line L23;
L31 – alarm on line L31;
ALL – alarms on any phase;
TOT – alarms on power totals or non-phase
measurements (frequency, unbalance).
3rd column Condition
( “>” on figure above)
Select triggering method:
< trigger when measured quantity is lower than threshold
(FALL);
> trigger when measured quantity is higher than threshold
(RISE);
4th column Level
Threshold value.
5th column Duration
Minimal alarm duration. Triggers only if threshold is crossed
for a defined period of time.
Note: It is recommended that for flicker measurement,
3.19.3 Alarm setup
Up to 10 different alarms, based on any measurement quantity which is measured by
instrument, can be defined. See 5.1.13 for further details regarding measurement
methods. Captured events can be observed through ALARMS TABLE screens. See
3.16 and 5.1.13 for details.
Figure 3.60: Alarm setup screens
Table 3.78: Description of Alarm setup
88
Page 89

MI 2883 Energy Master Operating the instrument
recorder is set to 10 min.
ADD
Adds new alarm.
REMOVE
Clears selected or all alarms:
EDIT
Edits selected alarm.
Enters or exits a submenu to set an alarm.
Cursor keys. Selects parameter or changes value.
Cursor keys. Selects parameter or changes value.
Confirms setting of an alarm.
Returns to the “MEASUREMENT SETUP” submenu.
Nominal voltage
Indication of type (L-N or L-L) and value of nominal
voltage.
SIGN. 1 FREQUENCY
1st observed signalling frequency.
SIGN. 2 FREQUENCY
2nd observed signalling frequency.
F1
F2
F3
ENTER
Table 3.79: Keys in Alarm setup screens
3.19.4 Signalling setup
Mains signalling voltage, called “ripple control signal” in certain applications, is a burst of
signals, often applied at a non-harmonic frequency, that remotely control industrial
equipment, revenue meters, and other devices.
Two different signalling frequencies can be defined. Signals can be used as a source for
the user defined alarm and can also be included in recording. See section 3.19.3 for
details how to set-up alarms. See section 3.14 for instructions how to start recording.
Figure 3.61: Signalling setup screen
Table 3.80: Description of Signalling setup
89
Page 90

MI 2883 Energy Master Operating the instrument
DURATION
Duration of RMS record, which will be captured after
treshold value is reached.
THRESHOLD
Threshold value expressed in % of nominal voltage,
which will trigger recording of signalling event.
Enters or exits a submenu to set signalling frequency.
Toggles between given parameters.
Changes selected parameter.
Returns to the “MEASUREMENT SETUP” submenu.
Nominal voltage
Indication of type (L-N or L-L) and value of nominal
voltage.
RVC THRESHOLD
RVC threshold value expressed in % of nominal voltage for
steady state voltage detection.
RVC HYSTERESIS
RVC hysteresis value expressed in % of RVC threshold.
Toggles between given parameters.
ENTER
Table 3.81: Keys in Signalling setup screen
3.19.5 Rapid voltage changes (RVC) setup
RVC is a quick transition in RMS voltage occurring between two steady-state
conditions, and during which the RMS voltage does not exceed the dip/swell thresholds.
An voltage is in a steady-state condition if all the immediately preceding 100/120 U
Rms(½)
values remain within an set RVC threshold from the arithmetic mean of those 100/120
U
set by the user according to the application, as a percentage of U
(100 values for 50 Hz nominal and 120 values for 60 Hz). The RVC threshold is
Rms(½)
, within 1 ÷ 6 %.
Nom
See section 5.1.14 for details regarding RVC measurement. See section 3.14 for
instructions how to start recording.
Figure 3.62: RVC setup screen
Table 3.82: Description of RVC setup
Table 3.83: Keys in RVC setup screen
90
Page 91

MI 2883 Energy Master Operating the instrument
Changes selected parameter.
Returns to the “MEASUREMENT SETUP” submenu.
Time & Date
Set time, date and time zone.
Language
Select language.
Instrument info
Information about the instrument.
Lock/Unlock
Lock instrument to prevent unauthorized access.
Colour Model
Select colours for displaying phase measurements.
Selects option from the “GENERAL SETUP” submenu.
Enters the selected option.
Returns to the “MAIN MENU” screen.
ENTER
3.20 General Setup submenu
From the “GENERAL SETUP” submenu communication parameters, real clock time,
language can be reviewed, configured and saved.
Figure 3.63: GENERAL SETUP submenu
Table 3.84: Description of General setup options
Table 3.85: Keys in General setup submenu
3.20.1 Time & Date
Time, date and time zone can be set in this menu.
91
Page 92

MI 2883 Energy Master Operating the instrument
Clock source
Show clock source:
RTC – internal real time clock
Time zone
Selects time zone.
Current Time & Date
Show/edit current time and date
Selects parameter to be changed.
Modifies parameter.
Selects between the following parameters: hour, minute, second,
day, month or year.
Enters Date/time edit window.
Returns to the “GENERAL SETUP” submenu.
ENTER
3.20.2 Time & Date
Figure 3.64: Set date/time screen
Table 3.86: Description of Set date/time screen
Table 3.87: Keys in Set date/time screen
3.20.3 Language
Different languages can be selected in this menu.
92
Page 93

MI 2883 Energy Master Operating the instrument
Selects language.
Confirms the selected language.
Returns to the “GENERAL SETUP” submenu.
Returns to the “GENERAL SETUP” submenu.
ENTER
Figure 3.65: Language setup screen
Table 3.88: Keys in Language setup screen
3.20.4 Instrument info
Basic information concerning the instrument (company, user data, serial number,
firmware version and hardware version) can be viewed in this menu.
Figure 3.66: Instrument info screen
Table 3.89: Keys in Instrument info screen
3.20.5 Lock/Unlock
Energy Master has the ability to prevent unauthorized access to all important instrument
functionality by simply locking the instrument. If instrument is left for a longer period at
an unsupervised measurement spot, it is recommended to prevent unintentional
stopping of record, instrument or measurement setup modifications, etc. Although
93
Page 94

MI 2883 Energy Master Operating the instrument
Pin
Four digit numeric code used for Locking/Unlocking the
instrument.
Press ENTER key for changing the Pin code. “Enter PIN”
window will appear on screen.
Note: Pin code is hidden (****), if the instrument is locked.
Lock
The following options for locking the instrument are
available:
Disabled
Enabled
Selects parameter to be modified.
Change value of the selected digit in Enter pin window.
Selects digit in Enter pin window.
Locks the instrument.
Opens Enter pin window for unlocking.
Opens Enter pin window for pin modification.
Accepts new pin.
Unlocks the instrument (if pin code is correct).
Returns to the “GENERAL SETUP” submenu.
MEASUREMENTS
Allowed access.
Waveform snapshot functionality is blocked.
RECORDERS
No access.
MEASUREMENT SETUP
No access.
ENTER
instrument lock prevents unauthorized changing of instrument working mode, it does not
prevent non-destructive operations as displaying current measurement values or trends.
User locks the instrument by entering secret lock code in the Lock/Unlock screen.
Figure 3.67: Lock/Unlock screen
Table 3.90: Description of Lock/Unlock screen
Table 3.91: Keys in Lock/Unlock screen
Following table shows how locking impacts instrument functionality.
Table 3.92: Locked instrument functionality
94
Page 95

MI 2883 Energy Master Operating the instrument
GENERAL SETUP
No access except to Lock/Unlock menu.
EDIT
Opens edit colour screen (only available in custom model).
F1
Figure 3.68: Locked instrument screen
Note: In case user forget unlock code, general unlock code “7350” can be used to
unlock the instrument.
3.20.6 Colour model
In COLOUR MODEL menu, user can change colour representation of phase voltages
and currents, according to the customer needs. There are some predefined colour
schemes (EU, USA, etc.) and a custom mode where user can set up its own colour
model.
Figure 3.69: Colour representation of phase voltages
Table 3.93: Keys in Colour model screens
95
Page 96

MI 2883 Energy Master Operating the instrument
Keys in Edit colour screen:
L1 L2 L3 N
Shows selected colour for phase L1.
L1 L2 L3 N
Shows selected colour for phase L2.
L1 L2 L3 N
Shows selected colour for phase L3.
L1 L2 L3 N
Shows selected colour for neutral
channel N.
Selects colour.
Returns to the “COLOUR MODEL” screen.
Selects Colour scheme.
Confirms selection of Colour scheme and returns to the “GENERAL
SETUP” submenu.
Returns to the “GENERAL SETUP” submenu without modifications.
F1
ENTER
ENTER
96
Page 97

MI 2883 Energy Master Recording Practice and Instrument Connection
4 Recording Practice and Instrument
Connection
In following section recommended measurement and recording practice is described.
4.1 Measurement campaign
Power quality measurements are specific type of measurements, which can last many
days, and mostly they are performed only once. Usually recording campaign is
performed to:
Statistically analyse some points in the network.
Troubleshoot malfunctioning device or machine.
Since measurements are mostly performed only once, it is very important to properly set
measuring equipment. Measuring with wrong settings can lead to false or useless
measurement results. Therefore instrument and user should be fully prepared before
measurement begins.
In this section recommended recorder procedure is shown. We recommend to strictly
follow guidelines in order to avoid common problems and measurement mistakes.
Figure below shortly summarizes recommended measurement practice. Each step is
then described in details.
Note: PC software PowerView v3.0 has the ability to correct (after measurement is
done):
wrong real-time settings,
wrong current and voltage scaling factors.
False instrument connection (messed wiring, opposite clamp direction), can’t be fixed
afterwards.
97
Page 98

MI 2883 Energy Master Recording Practice and Instrument Connection
Time & Date setup
Recharge batteries
Clear memory
Step 1:
Instrument Setup
Step 2:
Measurement Setup
Nominal voltage
Transf. voltage ratio
Step 2.2:
Voltage range & ratio
Phase diagram
U,I,f meter screen
Power meter screen
Step 3:
Inspection
Clamp type
Clamp range
Step 2.3:
Clamps setup
Conn.Type(4W,3W,1W)
Sync channel:U1 | I1 | U12
Freqency: 50 Hz | 60 Hz
Step 2.1:
Sync. & wiring
Preform measuremement
Save waveform snapshoots
Step 4:
On Line Measurement
Prepare instrument for new measurement,
before going to measuring site. Check:
Is it time and date correct?
Are batteries in good condition?
Is it Memory List empty? If it is not,
download all data from previous
measurements and release storage for
new measurement.
Setup Power Master according
to the measurement point
nominal voltage, currents, load
type. Optionally enable events or
alarms and define parameter
thresholds.
Double check Measurement setup
using Phase diagram, and various
scope and metering screens
Using power metering check if
power is flowing in right direction
(power should be positive for load
and negative for generator
measurements)
Nominal voltage
Thresholds
Step 2.4:
Event Setup
Define alarm and
its parameters
Step 2.5:
Alarm Setup
Select recording start
time and interval
Include alarms and
events into recorder
Start waveform recorder
Step 5:
Recorder setup
Recording in progress
Download data
Analyse data
Create report
Export to Excel or Word
Step 7:
Report generation (PowerView v3.0)
Start
In Office
On Measuring siteIn office
Stop recorder
Power off instrument
Remove wiring
Analyze recorderd data with
instrument (Memory List,
Event and Alarm tables)
Step 6:
Measurement conclusion
Sig. Freq. 1
Sig. Freq. 2
Step 2.6:
Signalling Setup
Figure 4.1: Recommended measurement practice
98
Page 99

MI 2883 Energy Master Recording Practice and Instrument Connection
Step 1: Instrument setup
On site measurements can be very stressful, and therefore it is good practice to prepare
measurement equipment in an office. Preparation of Energy Master include following
steps:
Visually check instrument and accessories.
Warning: Don’t use visually damaged equipment!
Always use batteries that are in good condition and fully charge them before you
leave an office.
Note: In problematic PQ environment where dips and interrupts frequently occurs
instrument power supply fully depends on batteries! Keep your batteries in good
condition.
Download all previous records from instrument and clear the memory. (See
section 3.17 for instruction regarding memory clearing).
Set instrument time and date. (See section 3.20.1 for instruction regarding time
and date settings).
Step 2: Measurement setup
Measurement setup adjustment is performed on measured site, after we find out details
regarding nominal voltage, currents, type of wiring etc.
Step 2.1: Synchronization and wiring
Connect current clamps and voltage tips to the “Device under measurement”
(See section 4.2 for details).
Select proper type of connection in “Connection setup” menu (See section 3.19.1
for details).
Select synchronization channel. Synchronization to voltage is recommended,
unless measurement is performed on highly distorted loads, such as PWM
drives. In that case current synchronization can be more appropriate. (See
section 3.19.1 for details).
Select System frequency. System frequency is default mains system frequency.
Setting this parameter is recommended if to measure signalling or flickers.
Step 2.2: Nominal voltage and ratio
Select instrument nominal voltage according to the network nominal voltage.
Note: For 4W and 1W measurement all voltages are specified as phase-toneutral (L-N). For 3W and Open Delta measurements all voltages are specifies
as phase-to-phase (L-L).
Note: Instrument assures proper measurement up to 150 % of chosen nominal
voltage.
In case of indirect voltage measurement, select appropriate “Voltage ratio”
parameters, according to transducer ratio. (See section 3.19.1 and 4.2.2 for
details).
99
Page 100

MI 2883 Energy Master Recording Practice and Instrument Connection
Step 2.3: Current clamps setup
Using “Select Clamps” menu, select proper Phase and Neutral channel current
clamps (see sections 3.19.1 for details).
Select proper clamps parameters according to the type of connection (see
section 4.2.3 for details).
Step 2.4: Event setup
Select threshold values for: swell, dip and interrupts (see sections 3.19.2 and 3.15 for
details).
Step 2.5: Alarm setup
Use this step if you would like only to check if some quantities cross some predefined
boundaries (see sections 3.16 and 3.19.3 for details).
Step 2.6: Signalling setup
Use this step only if you are interested in measuring mains signalling voltage. See
section 3.19.4 for details.
Step 3: Inspection
After setup instrument and measurement is finished, user need to re-check if everything
is connected and configured properly. Following steps are recommended:
Using PHASE DIAGRAM menu check if voltage and current phase sequence is
right regarding to the system. Additionally check if current has right direction.
Using U, I, f menu check if voltage and current have proper values.
Check voltage and current THD.
Note: Excessive THD can indicate that too small range was chosen!
Note: In case of AD converter overvoltage or overloading current, icon will
be displayed.
Using POWER menu check signs and indices of active, nonactive, apparrent
power and power factor.
If any of these steps give you suspicious measurement results, return to Step 2 and
double check measurement setup parameters.
Step 4: On-line measurement
Instrument is now ready for measurement. Observe on line parameters of voltage,
current, power, harmonics, etc. according to the measurement protocol or customer
demands.
Note: Use waveform snapshots to capture important measurement. Waveform
snapshot capture all power quality signatures at once (voltage, current, power,
harmonics, flickers).
Step 5: Recorder setup and recording
Using GENERAL RECORDER menu select type of recording and configure recording
parameters such as:
100
 Loading...