

Page 1
ATMOS 41 INTEGRATOR GUIDE
SENSOR DESCRIPTION
The ATMOS41 All-in-One Weather Station is designed for continuous monitoring of environmental variables,
including all standard weather measurements (see Measurement Specifications). All sensors are integrated
into a single unit, requiring minimal installation effort. Ultra-low power consumption and a robust, no
moving parts design that prevents errors because of wear or fouling make the ATMOS41 ideal for long-term,
remote installations.
APPLICATIONS
• Weather monitoring
• Microenvironment monitoring
• Spatially distributed environmental monitoring
• Crop weather monitoring
• Fire danger monitoring/mapping
• Weather networks
18171-08
7.31.2020
ADVANTAGES
• Robust, no moving parts design
• Small form factor
• Integrated design for easy installation
• Low-input voltage requirements
• Low-power design supports battery-operated
dataloggers
• Supports the SDI-12 three-wire interface
• Tilt sensor informs user of out-of-level conditions
• No configuration necessary
• Measures all standard weather variables (plus
several others)
PURPOSE OF THIS GUIDE
METER Group provides the information in this
integrator's guide to help ATMOS41 All-in-One
Weather Station customers establish communication
between these sensors and their data acquisition
equipment or field data loggers. Customers using data
loggers that support SDI-12 sensor communications
should consult the data logger user manual. METER
sensors are fully integrated into the METER system of
plug-and-play sensors, cellular-enabled data loggers,
and data analysis software.
COMPATIBLE FIRMWARE VERSIONS
This guide is compatible with firmware versions
5.30 or newer.
METER Group, Inc. USA
2365 NE Hopkins Court, Pullman, WA 99163
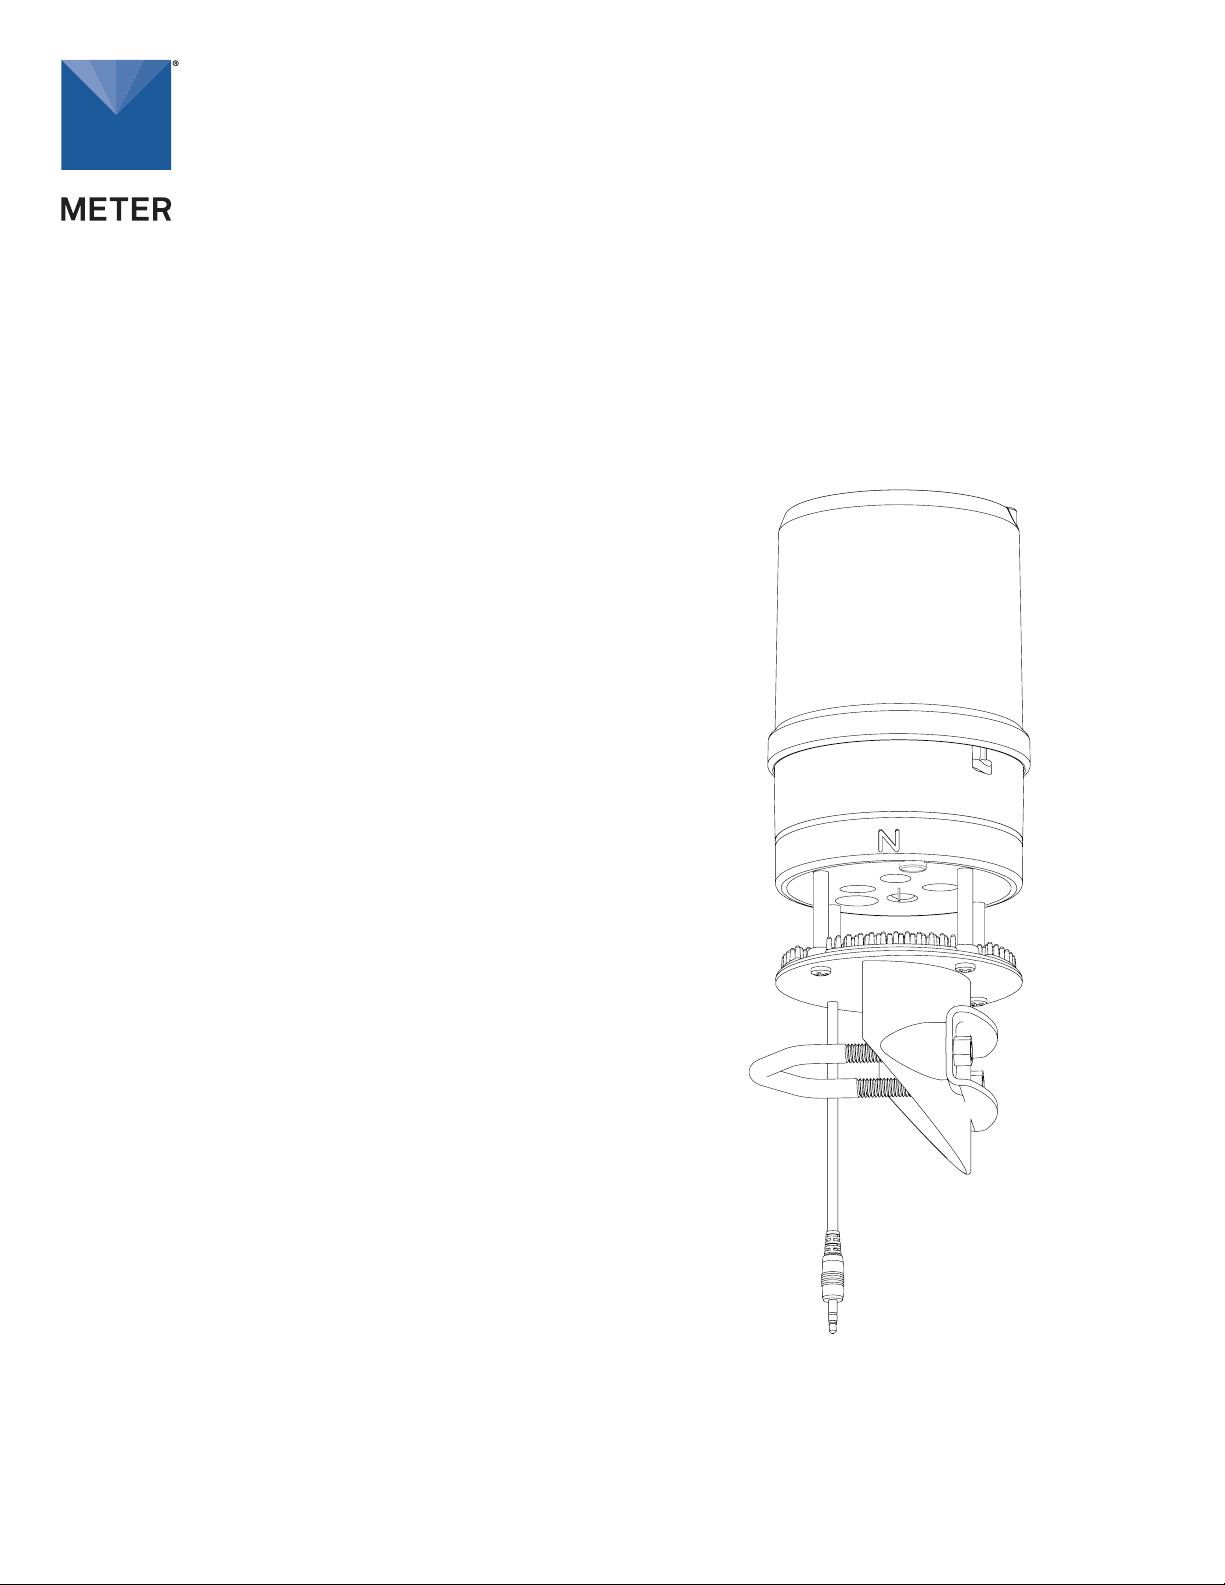
Figure 1 ATMOS 41 All-in-One Weather Station
Page 2
SPECIFICATIONS
MEASUREMENT SPECIFICATIONS
Solar Radiation
Range 0–1750 W/m
Resolution 1 W/m
Accuracy
±5% of measurement typical
2
2
Humidity Sensor Temperature
Range –40 to 50 °C
Resolution 0.1 °C
Accuracy ±1.0 °C
Precipitation
Range 0–400 mm/h
Resolution 0.017 mm
Accuracy ±5% of measurement
from 0 to 50 mm/h
Vapor Pressure
Range 0–47 kPa
Resolution 0.01 kPa
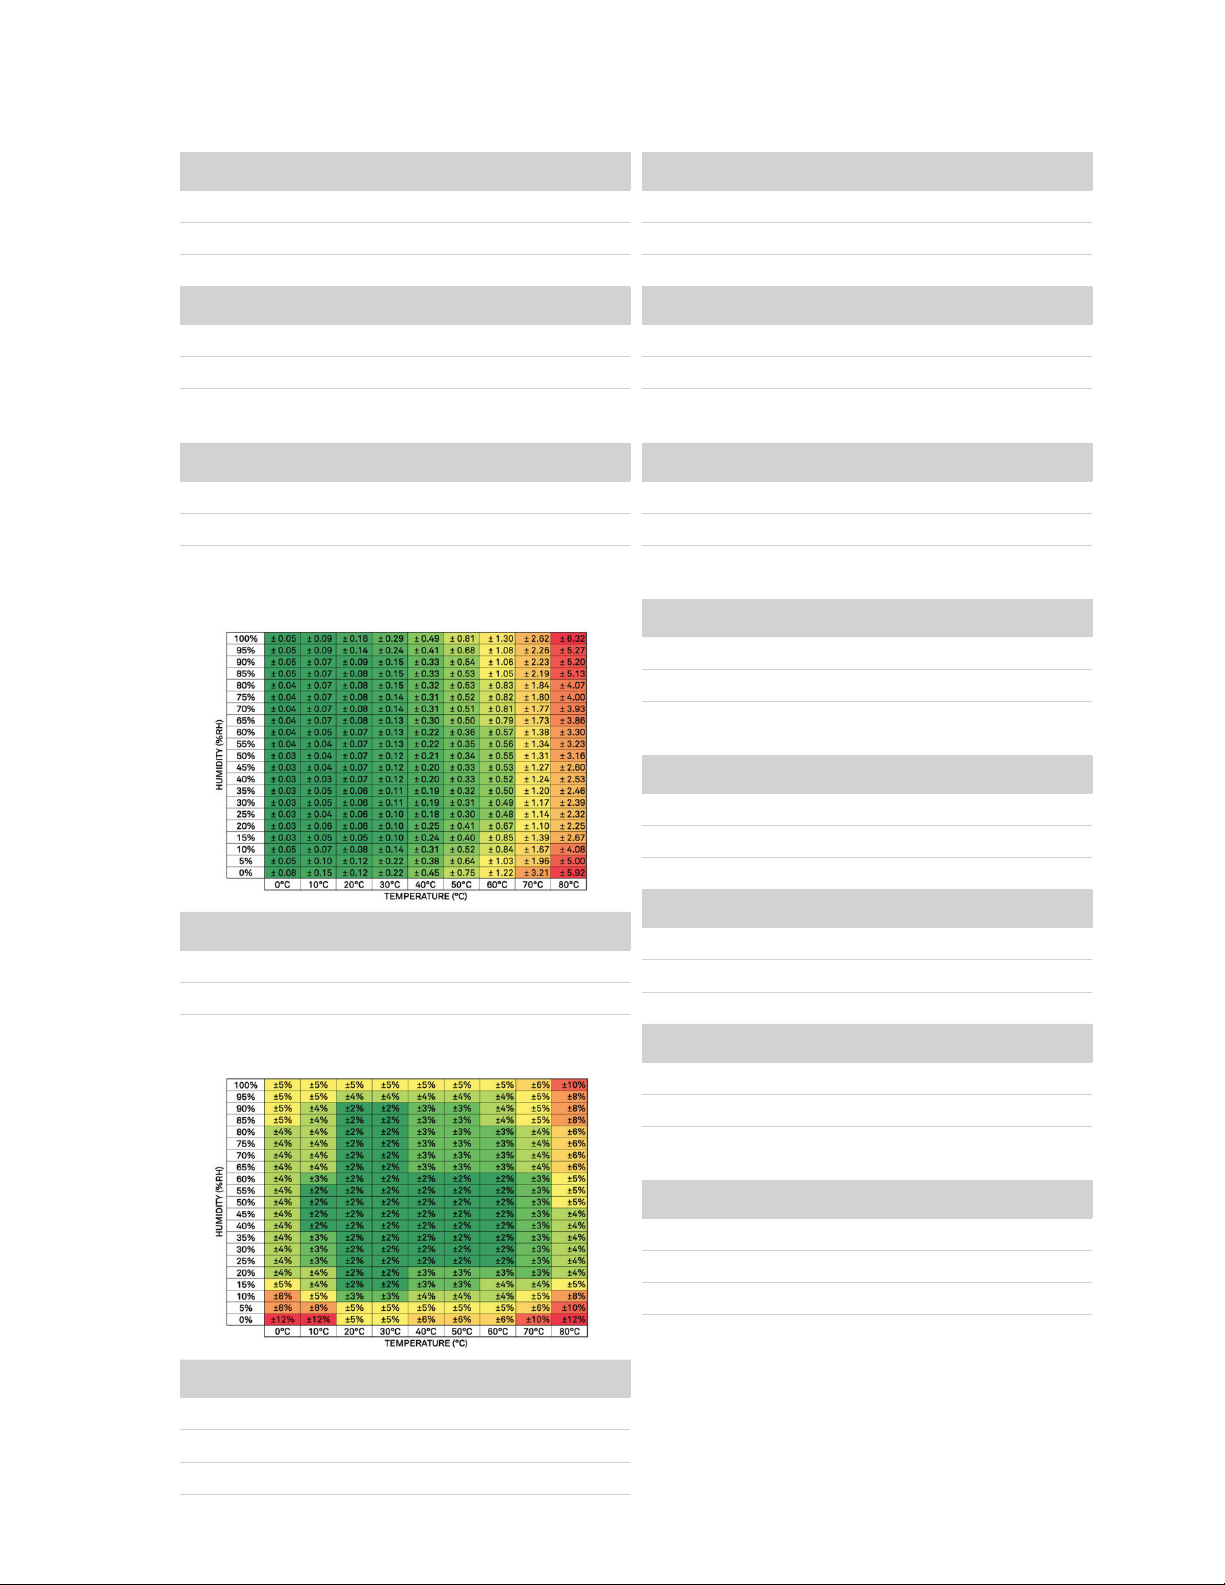
Accuracy Varies with temperature
and humidity, ±0.2 kPa
typical below 40 °C
Barometric Pressure
Range 50–110 kPa
Resolution 0.01 kPa
Accuracy ±0.1 kPa from –10 to 50 ºC
±0.5 kPa from –40 to 60 ºC
Horizontal Wind Speed
Range 0–30 m/s
Resolution 0.01 m/s
Accuracy The greater of 0.3 m/s or
3% of measurement
Wind Gust
Range 0–30 m/s
Resolution 0.01 m/s
Accuracy The greater of 0.3 m/s or
3% of measurement
Wind Direction
Range 0°–359°
Resolution 1°
Accuracy ±5°
Relative Humidity
Range 0–100% RH (0.00–1.00)
Resolution 0.1% RH
Accuracy Varies with temperature
and humidity, ±3% RH typical
Air Temperature
Range –50 to 60 °C
Resolution 0.1 °C
Accuracy ±0.6 °C
Tilt
Range –90° to 90°
Resolution 0.1°
Accuracy ±1°
Lightning Strike Count
Range 0–65,535 strikes
Resolution 1 strike
Accuracy Variable with distance,
>25% detection at <10 km typical
Lightning Average Distance
Range 0–40 km
Resolution 3 km
Accuracy Variable
2
Page 3

COMMUNICATION SPECIFICATIONS
Output
SDI-12 communication
PHYSICAL SPECIFICATIONS
Dimensions
Diameter 10 cm (3.94 in)
Height 34 cm (13.38 in), includes rain
gauge filter
Operating Temperature Range
Minimum –50 °C
Typical NA
Maximum 60 °C
NOTE: Barometric pressure and relative humidity sensors
operate accurately at a minimum of –40 °C.
ELECTRICAL AND TIMING CHARACTERISTICS
Supply Voltage (VCC to GND)
Minimum 3.6 VDC continuous
Typical NA
Maximum 15.0 VDC continuous
NOTE: ATMOS 41 must be continuously powered to workproperly.
NOTE: For the ATMOS 41 to meet digital logic levels specified
by SDI-12, it must be excited to 3.9 VDC or greater.
Digital Input Voltage (logic high)
Minimum 2.8 V
Typical 3.6 V
Maximum 5.0 V
Digital Input Voltage (logic low)
Minimum –0.3 V
Typical 0.0 V
Maximum 0.8 V
Digital Output Voltage (logic high)
Minimum NA
Typical 3.6 V
Maximum NA
NOTE: For the ATMOS 41 to meet digital logicl levels specified
by SDI-12, it must be excited to 3.9 VDC or greater.
Power Line Slew Rate
Minimum 1.0 V/ms
Typical NA
Maximum NA
Data Logger Compatibility
METER ZL6 and EM60 data loggers or any data
aquisition systems capable of switched 3.6- to
15.0-VDC excitation and SDI-12 communication
Cable Length
5 m (standard)
75 m (maximum custom cable length)
NOTE: Contact Customer Support if nonstandard cable length
is needed.
Connector Types
3.5-mm stereo plug connector or stripped and
tinned wires
Current Drain (during measurement)
Minimum 0.2 mA
Typical 8.0 mA
Maximum 33.0 mA
Current Drain (while asleep)
Minimum 0.2 mA
Typical 0.3 mA
Maximum 0.4 mA
Power Up Time (SDI ready)—aRx! Commands
Minimum NA
Typical 10 s
Maximum NA
Power Up Time (SDI ready)—Other Commands
Minimum NA
Typical 310 ms
Maximum NA
Power Up Time (SDI-12, DDI disabled)
Minimum NA
Typical 240 ms
Maximum NA
Measurement Duration
Minimum NA
Typical 110 ms
Maximum 3,000 ms
3
Page 4
Power (brown)
Ground
GND
GND
220PF
COMPLIANCE
Manufactured under ISO 9001:2015
EM ISO/IEC 17050:2010 (CE Mark)
EQUIVALENT CIRCUIT AND CONNECTION TYPES
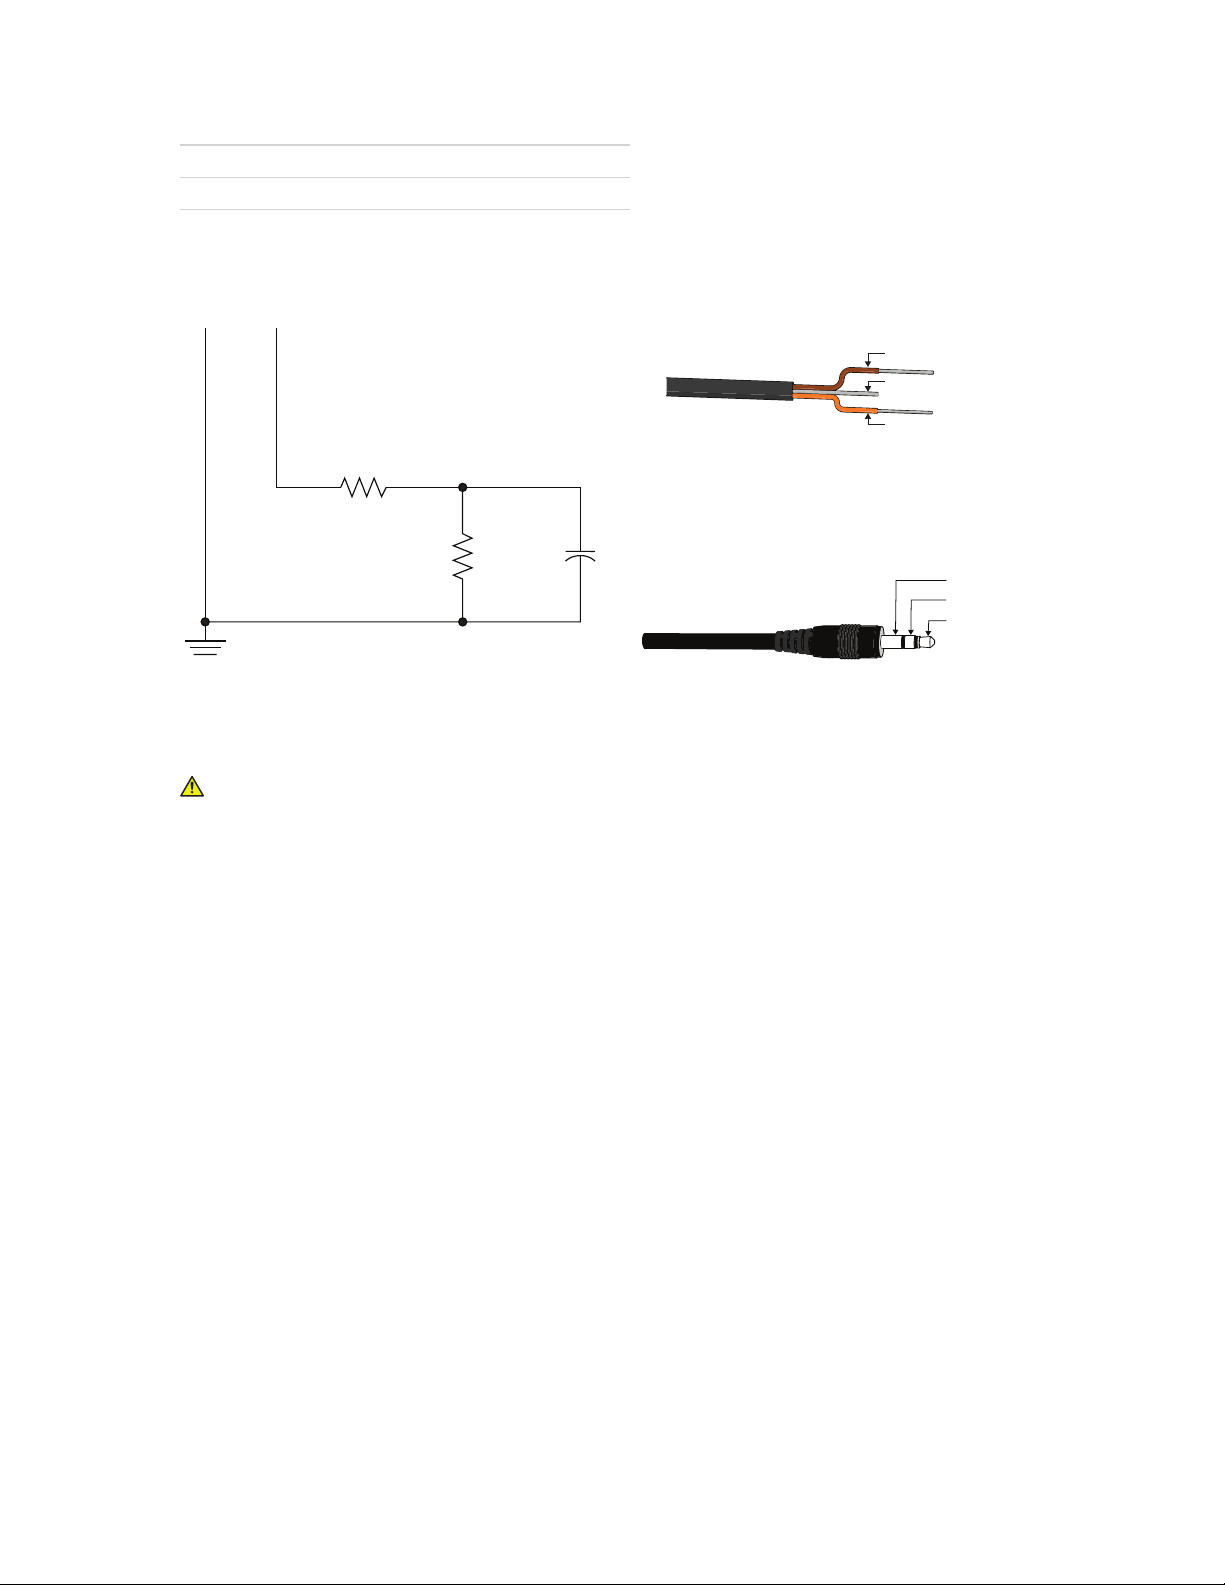
Refer to Figure 2 and Figure 3 to connect the ATMOS 41 to a logger. Figure 2 provides a low-impedance variant
of the recommended SDI-12 specification.
PIGTAIL CABLE
DATA
Ground (bare)
Digital
communication (orange)
R1
510
R2
100K
Figure 2 Equivalent circuit diagram
C1
NOTE: Some early ATMOS41 units may have the older Decagon
wiring scheme where the power supply is white, the digital out is
red, and the bare wire is ground.
STEREO CABLE
Digital communication
Power
Figure 3 Connection types
PRECAUTIONS
METER sensors are built to the highest standards, but misuse, improper protection, or improper
installation may damage the sensor and possibly void the warranty. Before integrating sensors into a sensor
network, followthe recommended installation instructions and implement safeguards to protect the sensor
from damaging interference.
SURGE CONDITIONS
Sensors have built-in circuitry that protects them against common surge conditions. Installations in
lightning-prone areas, however, require special precautions, especially when sensors are connected to a
well-grounded third-party logger.
Visit metergroup.com for articles containing more information.
CABLES
Improperly protected cables can lead to severed cables or disconnected sensors. Cabling issues can be
caused by many factors, including rodent damage, driving over sensor cables, tripping over the cable, not
leaving enough cable slack during installation, or poor sensor wiring connections. To relieve strain on the
connections and prevent loose cabling from being inadvertently snagged, gather and secure the cable
travelling between the ATMOS 41 and the data acquisition device to the mounting mast in one or more places.
Install cables in conduit or plastic cladding when near the ground to avoid rodent damage. Tie excess cable to
the data logger mast to ensure cable weight does not cause sensor to unplug.
SENSOR COMMUNICATIONS
METER digital sensors feature a 3-wire interface following SDI-12 protocol for communicating
sensor measurements.
SDI12 INTRODUCTION
SDI-12 is a standards-based protocol for interfacing sensors to data loggers and data acquisition equipment.
Multiple sensors with unique addresses can share a common 3-wire bus (power, ground, and data). Two-way
communication between the sensor and logger is possible by sharing the data line for transmit and receive
4
Page 5

as defined by the standard. Sensor measurements are triggered by protocol command. The SDI-12 protocol
requires a unique alphanumeric sensor address for each sensor on the bus so that a data logger can send
commands to and receive readings from specific sensors.
Download the SDI-12 Specification v1.3 and learn more about the SDI-12 protocol.
DDI SERIAL INTRODUCTION
The DDI serial protocol is the method used by the METER family of data loggers for collecting data from
the sensor. This protocol uses the data line configured to transmit data from the sensor to the receiver only
(simplex). Typically, the receive side is a microprocessor UART or a general-purpose IO pin using a bitbang
method to receive data. Sensor measurements are triggered by applying power to the sensor. When the
ATMOS41 is set to address 0, a DDI serial string is sent on power up, identifying the sensor.
INTERFACING THE SENSOR TO A PC
The serial signals and protocols supported by the sensor require some type of interface hardware to be
compatible with the serial port found on most personal computers (or USB-to-serial adapters). There are
several SDI-12 interface adapters available in the marketplace; however, METER has not tested any of these
interfaces and cannot make a recommendation as to which adapters work with METER sensors. METER data
loggers and the ZSC and PROCHECK handheld devices can operate as a computer-to-sensor interface for
making on-demand sensor measurements. For more information, please contact Customer Support.
METER SDI12 IMPLEMENTATION
METER sensors use a low-impedance variant of the SDI-12 standard sensor circuit (Figure 2). During the
power-up time, sensors output some sensor diagnostic information and should not be communicated with
until the power-up time has passed. After the power up time, the sensors are compatible with all commands
listed in the SDI-12 Specification v1.3 except for the continuous measurement commands (aR0–aR9 and
aRC0–aRC9) and the concurrent measurement commands (aC–aC9 and aCC0–aCC9). M, R, and C command
implementations are found on pages 8–9.
Out of the factory, all METER sensors start with SDI-12 address 0 and print out the DDI serial startup string
during the power up time. This can be interpreted by non-METER SDI-12 sensors as a pseudo-break condition
followed by a random series of bits.
The ATMOS 41 will omit the DDI serial startup string (sensor identification) when the SDI-12 address is
nonzero.
ATMOS41 INTERNAL MEASUREMENT SEQUENCE
Upon power up, the ATMOS41 initializes an internal timer to 55. This internal timer is incremented by 1 every
second and resets to 0 after incrementing to 59. In addition, issuing an averaging command (aM!, aR0!, aR3!,
aR7!, and aC!) resets this timer to 55.
While powered up, the ATMOS41 continuously counts drops from the precipitation sensor and takes solar
radiation, wind, and air temperature measurements every 10 s at internal timer intervals of 0, 10, 20, 30, 40,
50 and logs these values internally. Orientation, vapor pressure, atmospheric pressure, and relative humidity
are measured every 60 s at the internal timer interval of 4 and logged internally. The aR4! command will output
instantaneous measurements of these parameters.
The aM!, aR0!, aR3!, aR7!, and aC! commands (and subsequent D commands when necessary) will compute
and output the averages, accumulations, or maximums of these measurements (and derived measurements)
and reset internal averaging counters and accumulators. Therefore, it is not necessary to oversample
the ATMOS41 and compute averages, accumulations, and maximums in external data systems. Less
frequent sampling has the additional benefit of decreasing data acquisition systems and ATMOS41 power
consumption. If the aM!, aR0!, aR3!, aR7!, and aC! commands are issued more frequently than 2 times their
measurement interval, the ATMOS41 will not average the measurements and will output instantaneous
values. The ATMOS 41 has four error codes available: general error code −9999, calibrations lost or corrupt
−9992, sensor undervoltage condition −9991, and invalid wind measurement error code −9990.
SDI12 CONFIGURATION
Table1 lists the SDI-12 communication configuration.
5
Page 6
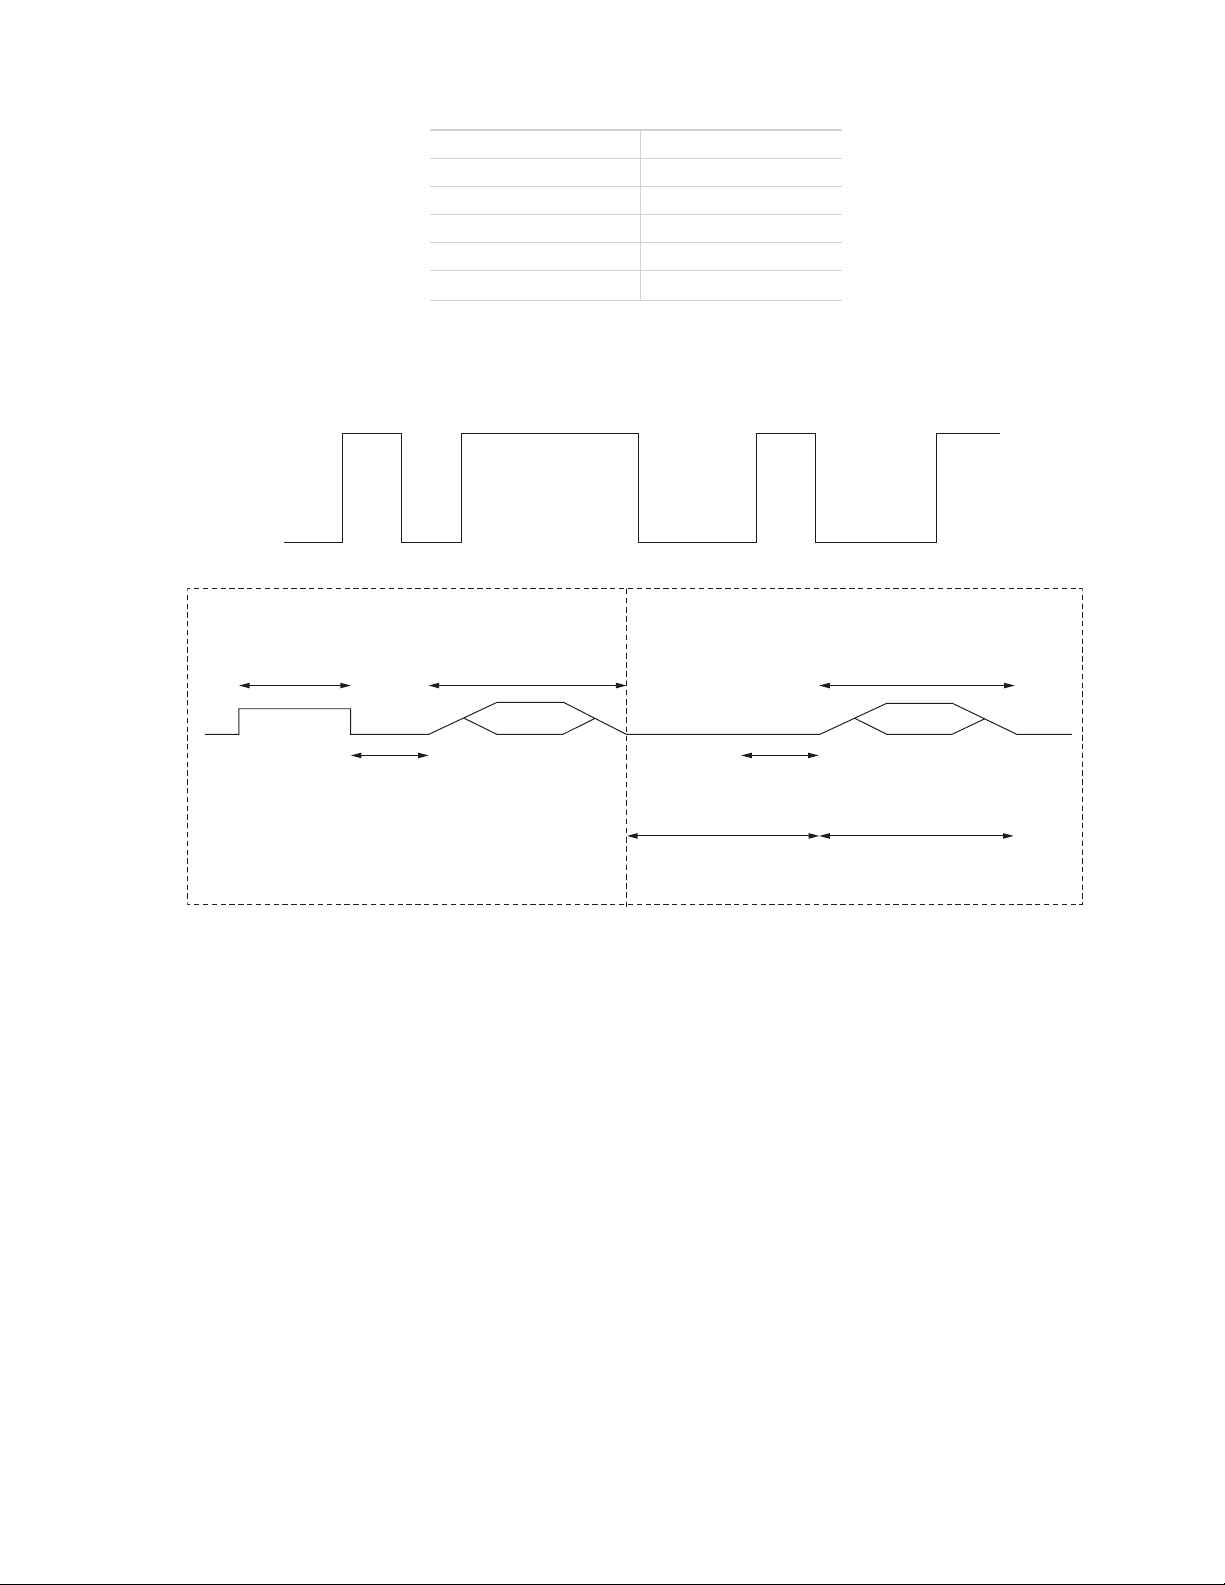
Table1 SDI-12 communication configuration
Baud Rate 1,200
Start Bits 1
Data Bits 7 (LSB first)
Parity Bits 1 (even)
Stop Bits 1
Logic Inverted (active low)
SDI12 TIMING
All SDI-12 commands and responses must adhere to the format in Figure 4 on the data line. Both the
command and response are preceded by an address and terminated by a carriage return line feed combination
and follow the timing shown in Figure 5.
START STOPD0 D1 D2 D3 D4 D5 D6 EP
Figure 4 Example SDI-12 transmission of the character 1 (0x31)
SENSORDATA LOGGER
Break
(at least 12 ms)
Marking
(at least 8.33 ms)
Command Response
Marking
(at least 8.33 ms)
Maximum time*Sensor must respond
within 15 ms
*Maximum time is dependent upon the amount of data returned for the command sent.
Figure 5 Example data logger and sensor communication
COMMON SDI12 COMMANDS
This section includes tables of common SDI-12 commands that are often used in an SDI-12 system and the
corresponding responses from METER sensors.
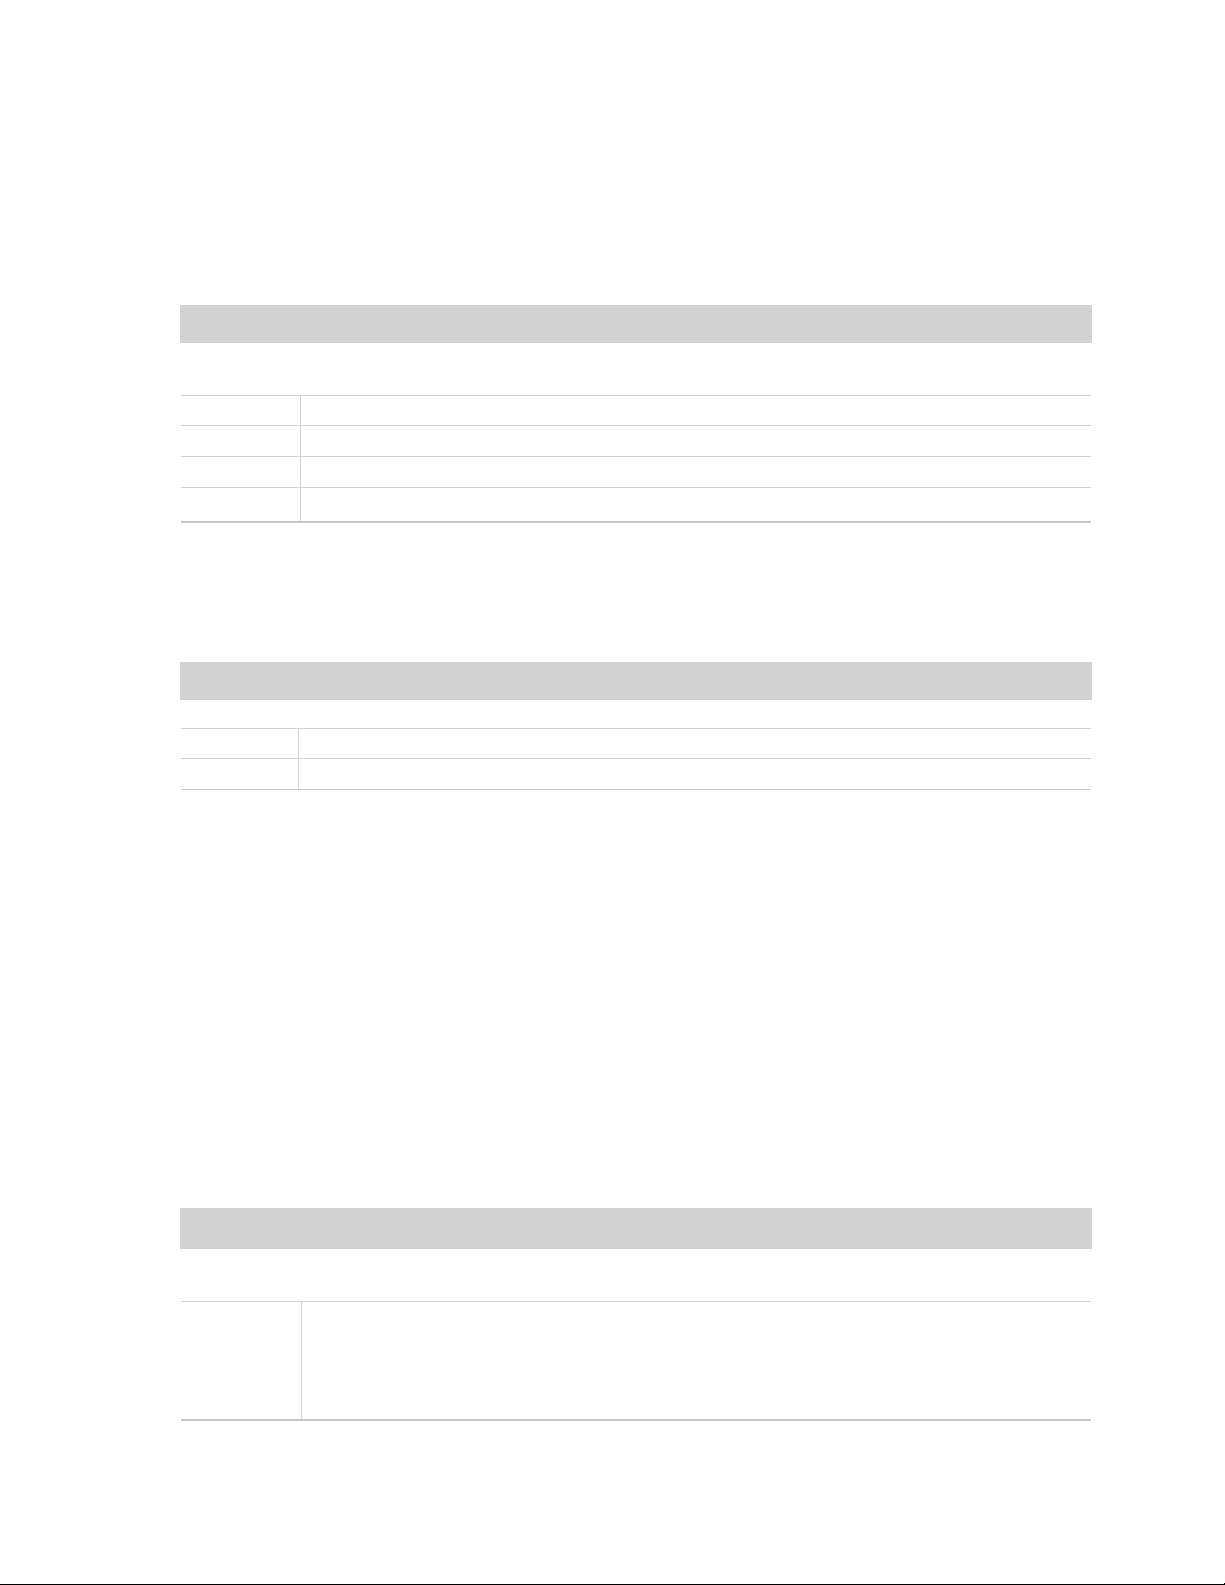
IDENTIFICATION COMMAND aI!
The Identification command can be used to obtain a variety of detailed information about the connected
sensor. An example of the command and response is shown in Example 1, where the command is in bold and
the response follows the command.
6
Page 7
Example 1 1I!113METER␣ ␣ ␣ ATM41␣404631800001
Fixed
Character
Parameter
1I!
1
13
METER ␣ ␣ ␣
ATM41␣
404
631800001
Length Description
3
1
2
8
6
3
≤13,
variable
Data logger command
Request to the sensor for information from sensor address 1.
Sensor address
Prepended on all responses, this indicates which sensor on the bus is returning the
following information.
Indicates that the target sensor supports SDI-12 Specification v1.3
Vendor identification string
(METER and three spaces ␣ ␣ ␣ for all METER sensors)
Sensor model string
This string is specific to the sensor type. For the ATMOS 41, the string is ATM41 ␣.
Sensor version
This number divided by 100 is the METER sensor version (e.g., 404 is version 4.04).
Sensor serial number
This is a variable length field. It may be omitted for older sensors.
CHANGE ADDRESS COMMAND aAB!
The Change Address command is used to change the sensor address to a new address. All other commands
support the wildcard character as the target sensor address except for this command. All METER sensors
have a default address of 0 (zero) out of the factory. Supported addresses are alphanumeric (i.e., a–z, A–Z, and
0–9). An example output from a METER sensor is shown in Example 2, where the command is in bold and the
response follows the command.
Example 2 1A0!0
Fixed
Character
Parameter
1A0!
0
Length Description
4
1
Data logger command
Request to the sensor to change its address from 1 to a new address of 0.
New sensor address.
For all subsequent commands, this new address will be used by the target sensor.
ADDRESS QUERY COMMAND (?!)
While disconnected from a bus, the Address Query command can be used to determine which sensors are
currently being communicated with. Sending this command over a bus will cause a bus contention where all
the sensors will respond simultaneously and corrupt the data line. This command is helpful when trying to
isolate a failed sensor. Example 3 shows an example of the command and response, where the command is in
bold and the response follows the command. The question mark (?) is a wildcard character that can be used in
place of the address with any command except the Change Address command.
Example 3 ?!0
Fixed
Parameter
?!
0
Character
Length Description
2
1
Data logger command
Request for a response from any sensor listening on the data line
Sensor address.
Returns the sensor address to the currently connected sensor.
COMMAND IMPLEMENTATION
The following tables list the relevant Measurement (M), Continuous (R), Concurrent (C), and Verification (V)
commands and subsequent Data (D) commands when necessary.
7
Page 8
MEASUREMENT COMMANDS IMPLEMENTATION
Measurement (M) commands are sent to a single sensor on the SDI-12 bus and require that subsequent Data
(D) commands are sent to that sensor to retrieve the sensor output data before initiating communication with
another sensor on the bus.
Please refer to Table2 and Table3 for an explanation of the command sequence and see Table10 for an
explanation of response parameters.
Table2 aM! command sequence
Command Response
This command reports average, accumulated, or maximum values.
Please see ATMOS41 Internal Measurement Sequence for more details.
aM! atttn
aD0! a+<solar>+<precipitation>+<strikes>
aD1! a+<windSpeed>+<windDirection>+<gustWindSpeed>
aD2! a±<airTemperature>+<vaporPressure>+<atmosphericPressure>
NOTE: The measurement and corresponding data commands are intended to be used back to back. After a measurement command
is processed by the sensor, a service request a <CR><LF> is sent from the sensor signaling the measurement is ready. Either wait
until ttt seconds have passed or wait until the service request is received before sending the data commands. See the SDI-12
Specifications v1.3 document for more information.
Table3 aM1! command sequence
Command Response
This command reports instantaneous values.
aM1! atttn
aD0! a±<xOrientation>±<yOrientation>+<nullValue>
NOTE: The measurement and corresponding data commands are intended to be used back to back. After a measurement command
is processed by the sensor, a service request a <CR><LF> is sent from the sensor signaling the measurement is ready. Either wait
until ttt seconds have passed or wait until the service request is received before sending the data commands. See the SDI-12
Specifications v1.3 document for more information.
CONTINUOUS MEASUREMENT COMMANDS IMPLEMENTATION
Continuous (R) measurement commands trigger a sensor measurement and return the data automatically
after the readings are completed without needing to send a D command.
The aR4! command must be used at intervals of 10 s or greater for the response to be returned within 15.0 ms
as defined in the SDI-12 standard.
aR0!, aR3!, and aR4! return more characters in their responses than the 75-character limitation called out in
the SDI-12 Specification v1.3. It is recommended to use a buffer that can store at least 116 characters.
Please refer to Table4 through Table7 for an explanation of the command sequence and see Table10 for an
explanation of response parameters.
Table4 aR0! measurement command sequence
Command Response
This command reports average, accumulated, or maximum values.
Please see ATMOS41 Internal Measurement Sequence for more details regarding timing of this command.
aR0! a+<solar>+<precipitation>+<strikes>+<strikeDistance>+<windSpeed>
+<windDirection>+<gustWindSpeed>±<airTemperature>+<vaporPressure>
+<atmosphericPressure>+<relativeHumidity>±<humiditySensorTemperature>
±<xOrientation>±<yOrientation>+<nullValue>±<NorthWindSpeed>
±<EastWindSpeed>
NOTE: This command does not adhere to the SDI-12 response format. See METER SDI-12 Implementation for more information.
8
Page 9
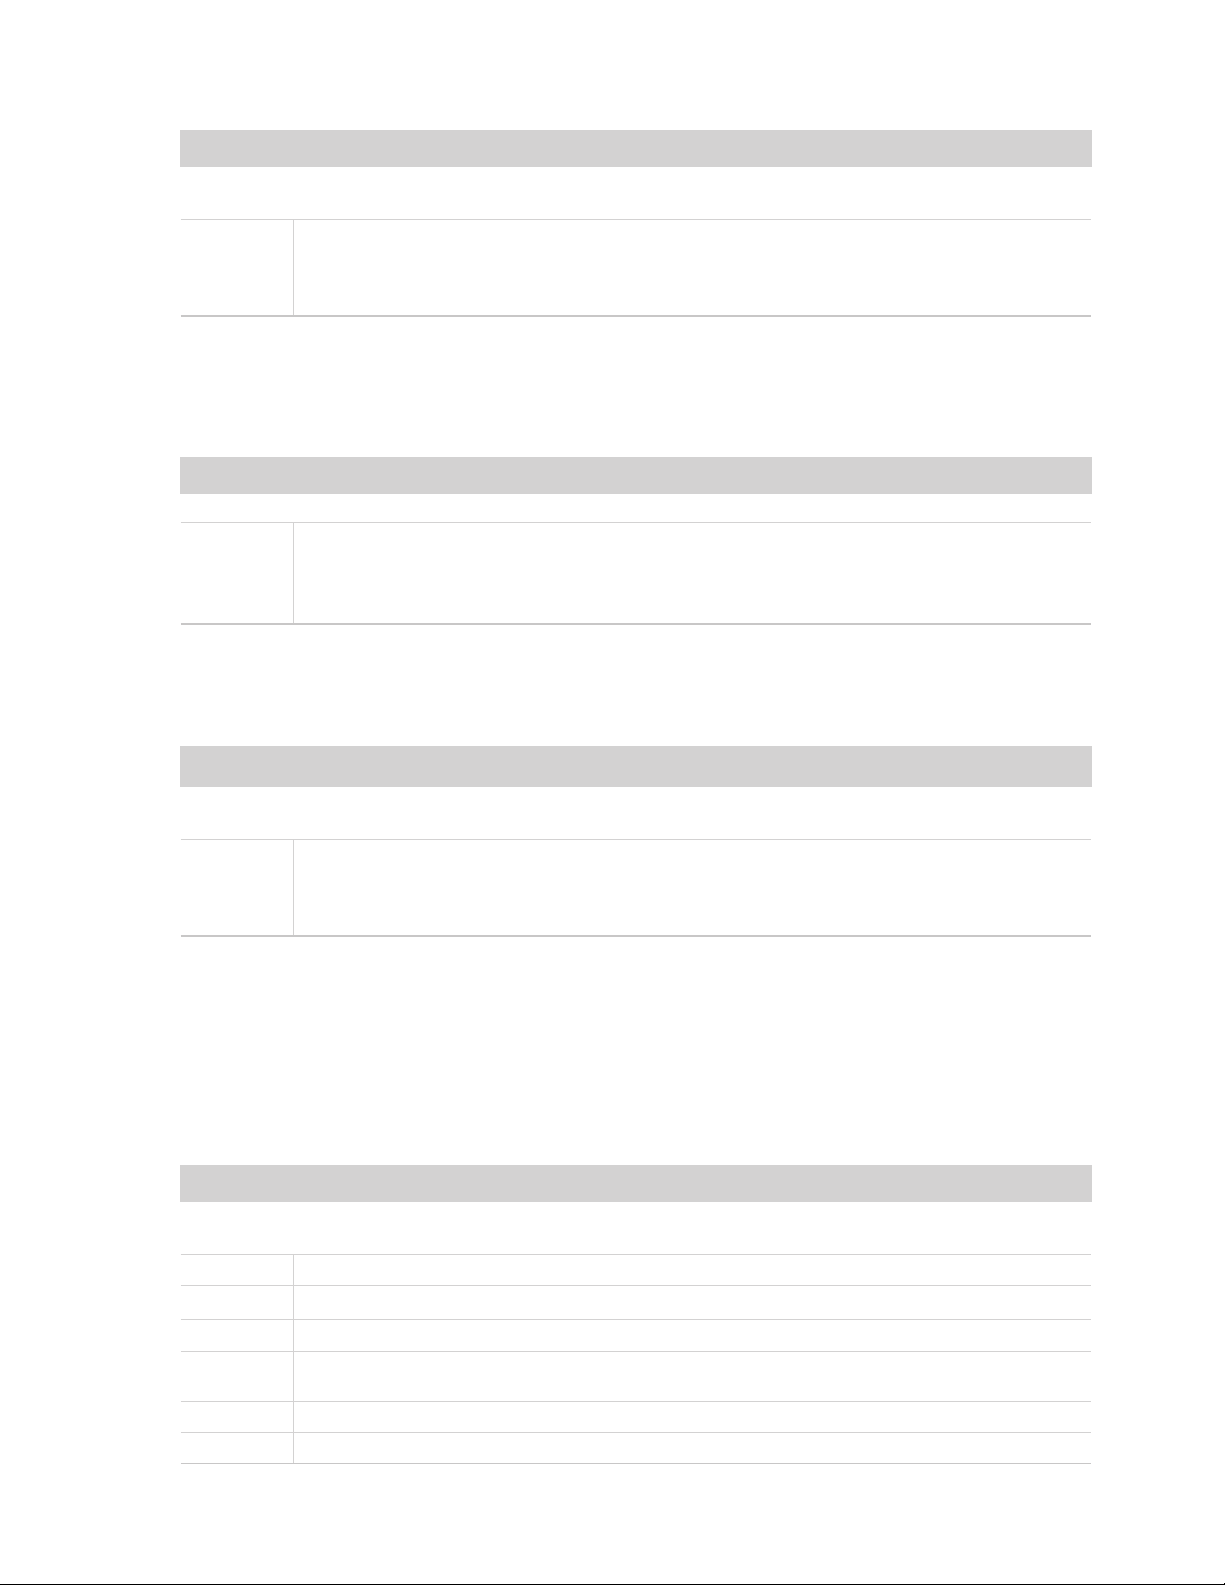
Table5 aR3! measurement command sequence
Command Response
This command reports average, accumulated, or maximum values.
Please see ATMOS41 Internal Measurement Sequence for more details.
aR3! a<TAB><solar> <precipitation> <strikes> <strikeDistance> <NorthWindSpeed>
<EastWindSpeed> <gustWindSpeed> <airTemperature> <vaporPressure>
<atmosphericPressure> <xOrientation> <yOrientation> <nullValue>
<humiditySensorTemperature><CR><sensortype><Checksum><CRC>
NOTE: This command does not adhere to the SDI-12 response format. However, it does adhere to SDI-12 timing if it is sent at intervals
>10 s. See METER SDI-12 Implementation for more information.
The values in this command are space delimited. As such, a + sign is not assigned between values and a - sign is only present if the
value is negative.
Table6 aR4! measurement command sequence
Command Response
This command reports instantaneous values.
aR4! a<TAB><solar> <precipitation> <strikes> <strikeDistance> <NorthWindSpeed>
<EastWindSpeed> <gustWindSpeed> <airTemperature> <vaporPressure>
<atmosphericPressure> <xOrientation> <yOrientation> <nullValue>
<humiditySensorTemperature><CR><sensortype><Checksum><CRC>
NOTE: This command does not adhere to the SDI-12 response format or timing. See METER SDI-12 Implementation for more information.
The values in this command are space delimited. As such, a + sign is not assigned between values and a - sign is only present if the
value is negative.
Table7 aR7! measurement command sequence
Command Response
This command reports average, accumulated, or maximum values.
Please see ATMOS41 Internal Measurement Sequence for more details regarding timing of this command.
aR7! a+<solar>+<precipitation>+<strikes>+<strikeDistance>+<windSpeed>
+<windDirection>+<gustWindSpeed>±<airTemperature>+<vaporPressure>
+<atmosphericPressure>+<relativeHumidity>±<humiditySensorTemperature>
±<xOrientation>±<yOrientation>
NOTE: See METER SDI-12 Implementation for more information.
CONCURRENT MEASUREMENT COMMANDS IMPLEMENTATION
Concurrent (C) measurement commands are typically used with sensors connected to a bus. Measurements
are initiated with a C command and subsequent D commands are sent to the sensor to retrieve the readings.
Please refer to Table8 for an explanation of the command sequence and see Table10 for an explanation of
response parameters.
Table8 aC! measurement command sequence
Command Response
This command reports average, accumulated, or maximum values.
Please see ATMOS41 Internal Measurement Sequence for more details.
aC! atttnn
aD0! a+<solar>+<precipitation>+<strikes>+<strikeDistance>
aD1! a+<windSpeed>+<windDirection>+<gustWindSpeed>
aD2!
aD3! a±<xOrientation>±<yOrientation>+<nullValue>
aD4! a±<NorthWindSpeed>±<EastWindSpeed>+<gustWindSpeed>
NOTE: Please see the SDI-12 Specifications v1.3 document for more information.
a±<airTemperature>+<vaporPressure>+<atmosphericPressure>+<relativeHumidity>±
<humiditySensorTemperature>
9
Page 10

VERIFICATION COMMAND IMPLEMENTATION
The Verification (V) command is intended to give users a means to determine information about the current
state of the sensor. The V command is sent first, followed by D commands to read the response.
Please refer to Table9 for an explanation of the command sequence and Table10 for an explanation of those
response parameters.
Table9 aV! measurement command sequence
Command Response
aV! atttnn
aD0! a+<meta>
NOTE: Please see the SDI-12 Specifications v1.3 document for more information.
PARAMETERS
Table10 lists the parameters, unit measurement, and a description of the parameters returned in command
responses for ATMOS 41.
Table10 Parameter Descriptions
Parameter Unit Description
Positive or negative sign denoting sign of the next value
±
a
n
nn
ttt
<TAB>
<CR>
<LF>
<solar>
<precipitation>
<strikes>
<strikeDistance>
<NorthWindSpeed>
<EastWindSpeed>
<windSpeed>
<gustWindSpeed>
<windDirection>
<airTemperature>
<vaporPressure>
—
—
—
—
s
—
—
—
W/m²
mm
—
km
m/s
m/s
m/s
m/s
°
°C
kPa
SDI-12 address
Number of measurements (fixed width of 1)
Number of measurements with leading zero if necessary (fixed width of 2)
Maximum time measurement will take (fixed width of 3)
Tab character
Carriage return character
Line feed character
Solar radiation
(average since the last measurement or instantaneous value depending on SDI-12
command used)
Rainfall since the last measurement
Number of lightning strikes detected since last measurement
Average strike distance from sensor since last measurement
Wind speed from the northerly direction (negative values denote southerly direction)
(average since the last measurement or instantaneous value depending on SDI-12
command used)
Wind speed from the easterly direction (negative values denote westerly direction)
(average since the last measurement or instantaneous value depending on SDI-12
command used)
Combined wind speed magnitude of the <NorthWindSpeed> and <EastWindSpeed>
(average since the last measurement or instantaneous value depending on SDI-12
command used)
Maximum measured <windSpeed> since the last measurement
Wind heading clockwise from north reference
(average since the last measurement or instantaneous value depending on SDI-12
command used)
Air temperature
(average since the last measurement or instantaneous value depending on SDI-12
command used)
Vapor pressure
(average since the last measurement or instantaneous value depending on SDI-12
command used)
10
Page 11
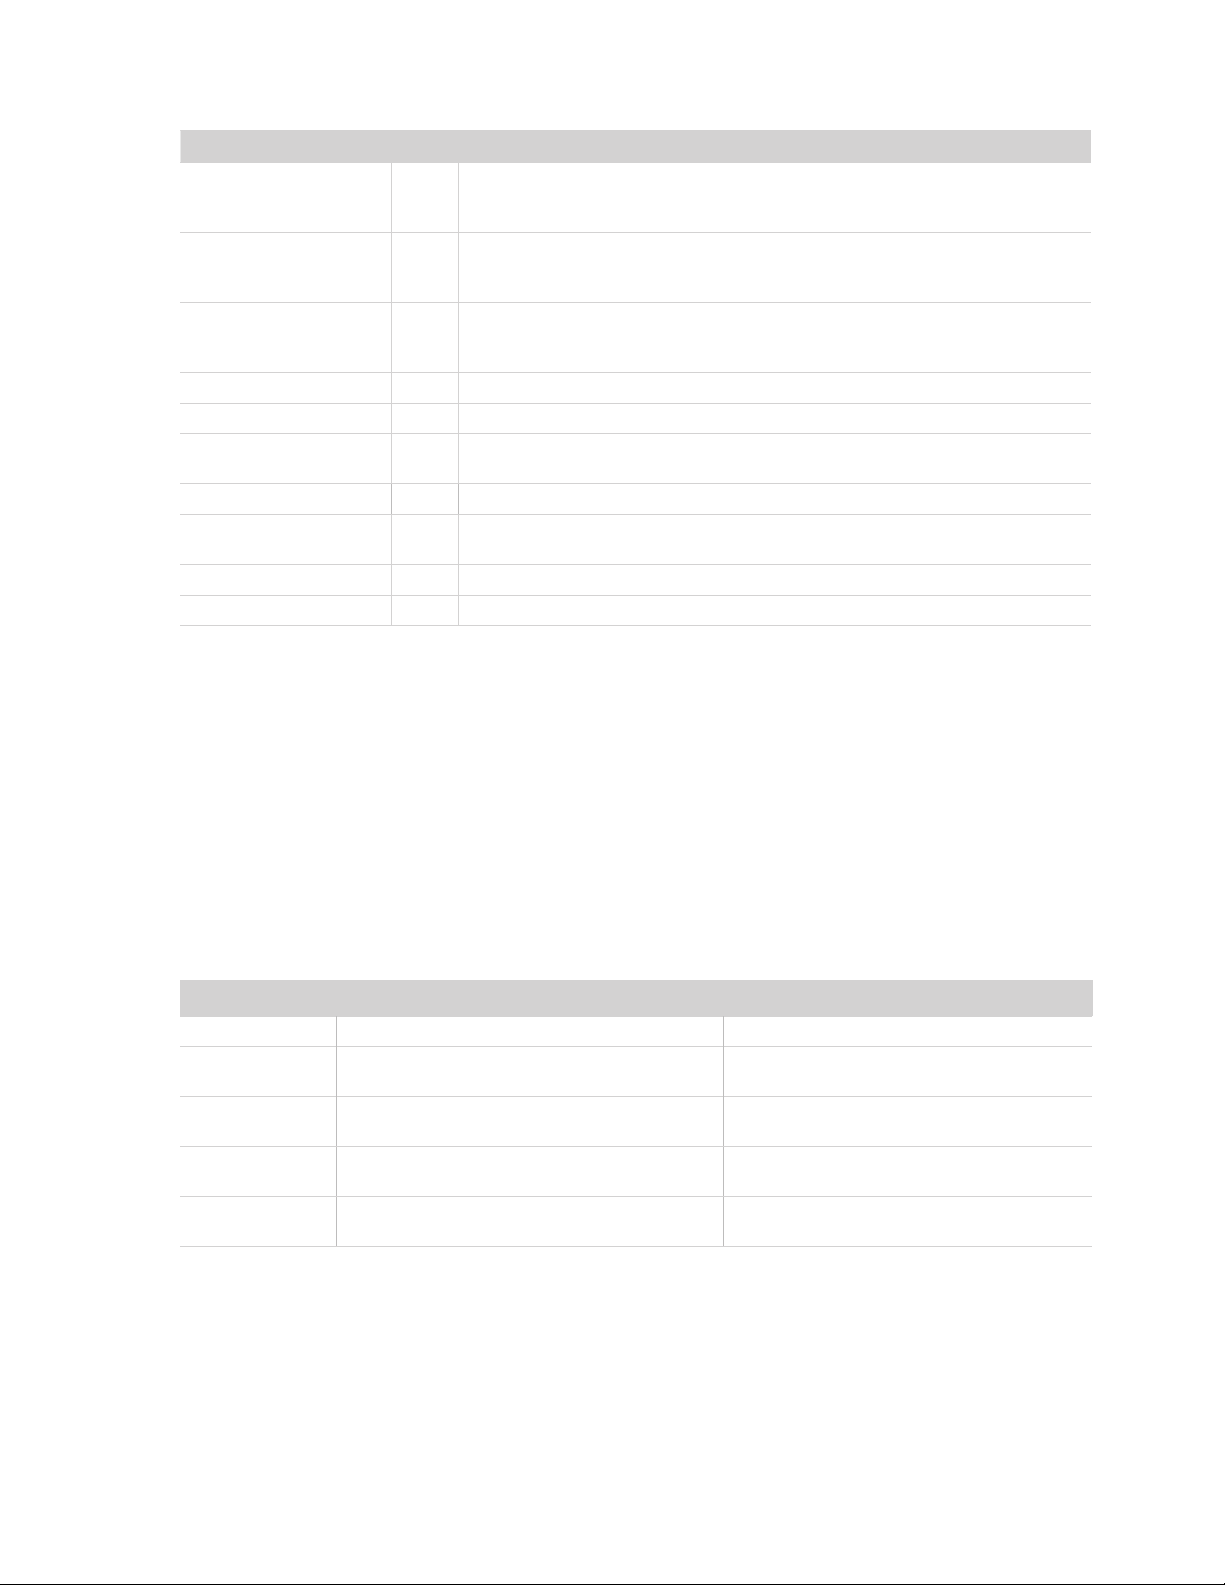
Table 9 Parameter Descriptions (continued)
Parameter Unit Description
Atmospheric pressure
(average since the last measurement or instantaneous value depending on SDI-12
<atmosphericPressure>
<relativeHumidity>
<humiditySensor
Temperature>
<xOrientation>
<yOrientation>
<nullValue>
<meta>
<sensortype>
<Checksum>
<CRC>
kPa
command used)
Relative humidity as a dimensionless fraction computed with either average or
instantaneous values of <vaporPressure> and <airTemperature>, depending on
RH
SDI-12 command used
Internal temperature measured with the relative humidity sensor
(average since the last measurement or instantaneous value depending on SDI-12
°C
command used)
X orientation angle (0 is level) (last measured value)
°
Y orientation angle (0 is level) (last measured value)
°
This parameter is reported as 0. Previous firmware versions reported a compass
—
heading, which has been removed.
Auxiliary sensor information. See Table 11.
—
ASCII character denoting the sensor type
—
For ATMOS 41, the character is the right square bracket ] character
METER serial checksum
—
METER serial 6-bit CRC
—
SENSOR METADATA VALUE
The sensor metadata value contains information to help alert users to sensor-identified conditions that may
compromise optimal sensor operation. The output of the aV! aD0! sequence will output a <meta> integer value.
This integer represents a binary bitfield, with each individual bit representing an error flag.
Table11 lists the possible error flags that can be set by the TEROS 21. If multiple error flags are set, the sensor
metadata integer value will be the sum of the individual values. To decode an integer value not explicitly
in Table11, find the largest error flag value that will fit in the integer value and accept that error as being
present. Then, subtract that error flag value from the integer value and repeat the process on the remainder
until the result is zero. For example, a sensor metadata integer value of 208 is the sum of the individual
error flag values 128+64+16, so this sensor sensor secondary temperature measurement error flag, sensor
firmware corrupt error flag, and the sensor misorientation error flag.
Table11 Error flag values and issue resolution
Error Flag Value Issue Present Resolution
0 No issue present
16 Sensor misorientation error will likely affect readings
64
128 Sensor firmware is corrupt
256 Sensor calibrations lost or corrupted
Sensor thermistor is broken and sensor is using a
backup measurement
–
Use the ZENTRA Utility app to reorient the X
orientation or Y orientation of the sensor.
Contact Customer Support. Irreversible sensor
damage is likely.
Contact Customer Support for instructions on
reloading firmware.
Contact Customer Support for instructions on
reloading sensor calibrations.
DDI SERIAL CHECKSUM
These checksums are used in the continuous commands R3 and R4 as well as DDI serial response. The legacy
checksum is computed from the start of the transmission to the sensor identification character.
11
Page 12

Legacy checksum example input is <TAB>0 0.000 1 1 0.22 0.21 0.30 24.3 1.26 92.74 –1.5 –4.0 0 24.4<CR>]Ah
and the resulting checksum output is A.
char LegacyChecksum(char * Response)
{
int length, sum = 0, i, crc;
// Finding the length of the response string
length = strlen(Response);
// Adding characters in the response together
for( i = 0; i < length; i++ ){
sum += Response[i];
}
// Converting checksum to a printable character
crc = sum % 64 + 32;
return crc;
}
The more robust CRC6, supported in firmware version 4.61 or newer, utilizes the CRC-6-CDMA2000-A polynomial
with the value 48 added to the results to make this a printable character and is computed from the start of the
transmission to the legacy checksum character.
CRC6 checksum example input is <TAB>0 0.000 1 1 0.22 0.21 0.30 24.3 1.26 92.74 –1.5 –4.0 0 24.4<CR>]Ah
and the resulting checksum is the character h.
12
Page 13

unit8_t CRC6_Offset (uint8_t * buffer, uint16_t bytes)
{
uint16_t byte;
uint8_t bit;
uint8_t crc = 0xfc; // Set upper 6 bits to 1’s
// Loop through all the bytes in the buffer
for(byte = 0; byte < bytes; byte++)
{
// Get the next byte in the buffer and XOR it with the crc
crc ^= buffer[byte];
// Loop through all the bits in the current byte
for(bit = 8; bit > 0; bit--)
{
// If the uppermost bit is a 1...
if(crc & 0x80)
{
// Shift to the next bit and XOR it with a polynomial
crc = (crc << 1) ^ 0x9c;
}
else
{
// Shift to the next bit
crc = crc << 1;
}
}
}
// Shift upper 6 bits down for crc
crc = (crc >> 2);
// Add 48 to shift crc to printable character avoiding \r \n and !
return (crc + 48);
}
CUSTOMER SUPPORT
NORTH AMERICA
Customer service representatives are available for questions, problems, or feedback Monday through Friday,
7:00 am to 5:00 pm Pacific time.
Email: [email protected]
Phone: +1.509.332.5600
Fax: +1.509.332.5158
Website: metergroup.com
EUROPE
Customer service representatives are available for questions, problems, or feedback Monday through Friday,
8:00 to 17:00 Central European time.
Email: [email protected]
Phone: +49 89 12 66 52 0
Fax: +49 89 12 66 52 20
Website: metergroup.de
If contacting METER by email, please include the following information:
13
Page 14

Name
Address
Phone number
NOTE: For products purchased through a distributor, please contact the distributor directly for assistance.
Email address
Instrument serial number
Description of problem
REVISION HISTORY
The following table lists document revisions.
Revision Date Compatible Firmware Description
08 7.31.2020 5.30
07 1.24.2020 5.01
06 8.9.2019 5.01
05 10.31.2018 4.67
04 7.16.2018 4.67
03 6.5.2018 4.65
02 12.7.2017 4.61
01 9.15.2017 4.61
00 10.27.2017 4.49
Added Verification command implementation.
Updated specifications.
Removed Sensor Bus Considerations.
Corrected Tables 5, 6, and 7.
Added explanation of when measurements are taken.
Updated specifications.
Modified bus configurations
Added R7 command.
Modified R0 command note.
Increased temperature range.
Modified digital input voltage logic high specifications.
Removed reference to compass.
Updated specifications.
Added Concurrent (C) command.
Reduced wind speed specification.
Added CRC6.
Initial release.
14
 Loading...