

Page 1
Megger
User Manual
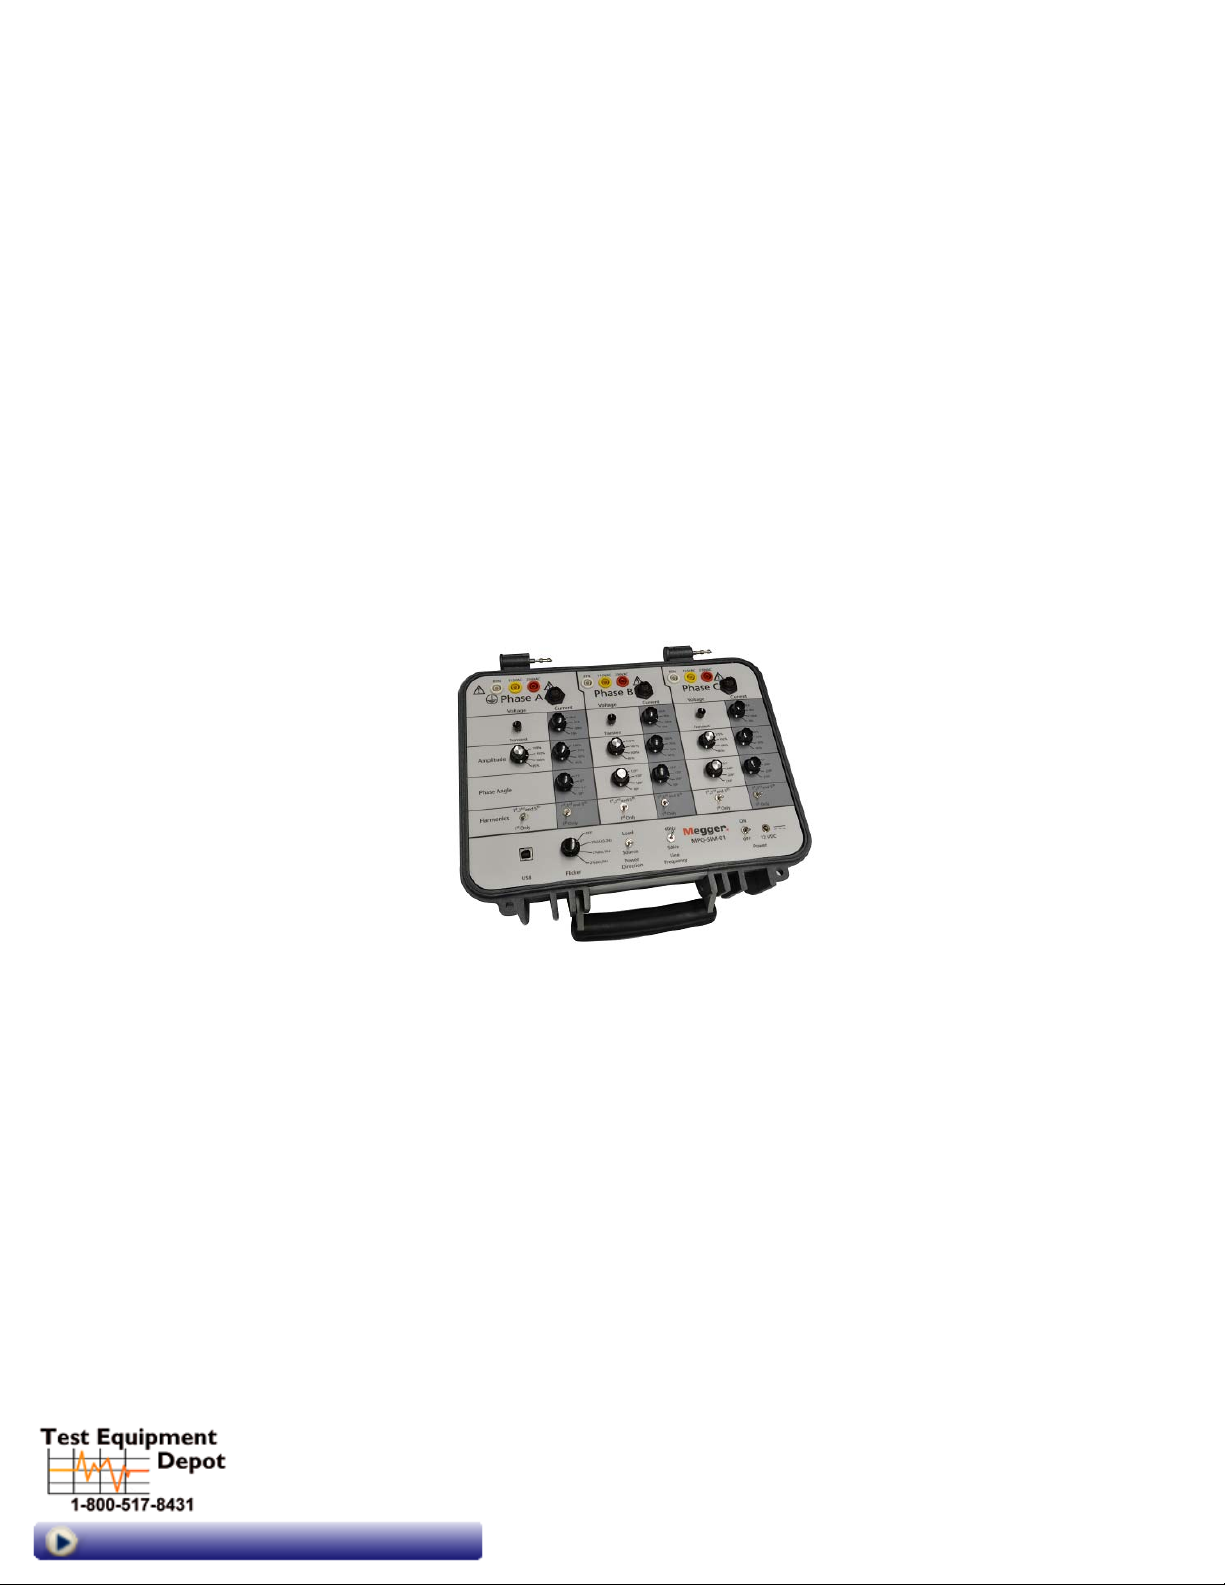
MPQSIM
Power Quality Simulator
AVTMMPQSIM
Rev 1
May 2017
99 Washington Street
Melrose, MA 02176
Phone 781-665-1400
Toll Free 1-800-517-8431
Visit us at www.TestEquipmentDepot.com
Page 2

Page 3

MPQSIM
User Manual
Page 4

Copyright© 2017 by Megger. All rights reserved.
The information presented in this manual is believed to be adequate for the intended use of the product.
f the product or its individual instruments are used for purposes other than those specified herein,
I
confirmation of their validity and suitability must be obtained from Megger. Refer to the warranty
information below. Specifications are subject to change without notice.
WARRANTY
Products supplied by Megger are warranted against defects in material and workmanship for a period of
one year following shipment. Our liability is specifically limited to replacing or repairing, at our option,
defective equipment. Equipment returned to the factory for repair must be shipped prepaid and insured.
Contact your MEGGER representative for instructions and a return authorization (RA) number. Please
indicate all pertinent information, including problem symptoms. Also specify the serial number and the
catalog number of the unit. This warranty does not include batteries, lamps or other expendable items,
where the original manufacturer’s warranty shall apply. We make no other warranty. The warranty is
void in the event of abuse (failure to follow recommended operating procedures) or failure by the
customer to perform specific maintenance as indicated in this manual.
M
Page 5

Table of Contents
1 INTRODUCTION ............................................................................................................................................. 1
2 RECEIVING INFORMATION ...................................................................................................................... 3
MPQ-SIM-01 ........................................................................................................................................................ 3
Contents Received: ............................................................................................................................................... 3
3 OVERVIEW ......................................................................................................................................................... 5
Intended Use ......................................................................................................................................................... 5
Applications .......................................................................................................................................................... 5
Definitions ............................................................................................................................................................. 6
4 SPECIFICATIONS ............................................................................................................................................. 7
5 SAFETY ................................................................................................................................................................ 9
Warnings and Safety Precautions ....................................................................................................................... 9
Safety and Warning Symbols ........................................................................................................................... 10
6 PRODUCT INSTALLATION ...................................................................................................................... 11
Connector Layout / Interconnect .................................................................................................................. 11
7 PRODUCT OPERATION ............................................................................................................................. 15
Operation Controls and Modes ...................................................................................................................... 15
Initial Settings ..................................................................................................................................................... 16
Simulations ......................................................................................................................................................... 17
Power Reversal .................................................................................................................................................. 17
Method # 1 Real Time Demand DVM Screen ................................................................................... 17
Method # 2 Real Time Demand Scope Screen ................................................................................... 18
Method # 3 Recording Data .................................................................................................................. 18
Active Power vs. Reactive Power.................................................................................................................... 19
Method # 1 Real Time Demand DVM Screen ................................................................................... 19
Method # 2 Recording Data .................................................................................................................. 19
Displacement Power Factor (Leading and Lagging Current) ..................................................................... 20
Method # 1 Real Time Demand DVM Screen ................................................................................... 20
Method # 2 Real Time Demand Scope Screen ................................................................................... 20
Method # 3 Recording Data .................................................................................................................. 21
Harmonic Effect on Power ............................................................................................................................. 22
Method # 1 Real Time Demand DVM Screen ................................................................................... 22
Method # 2 Recording Data .................................................................................................................. 22
Voltage Dips / Sags .......................................................................................................................................... 23
Voltage Swells .................................................................................................................................................... 24
Voltage Transients ............................................................................................................................................. 24
Phase Angle Event ............................................................................................................................................ 25
Voltage and Current Harmonics ..................................................................................................................... 26
Method # 1 Real Time Harmonics DMM Screen .............................................................................. 26
Method # 2 Real Time Harmonics Scope Screen ............................................................................... 26
Method # 3 Recording Data .................................................................................................................. 27
Flicker .................................................................................................................................................................. 28
AVTMMPQSIM Rev 1 May 2017
i
Page 6

Method # 1 Real Time Flicker DVM Screen ....................................................................................... 28
Method # 2 Recording Data ................................................................................................................... 28
8 UNIT MAINTENANCE ................................................................................................................................. 29
Instructions for Cleaning and Decontamination ........................................................................................... 29
9 SPARE PARTS .................................................................................................................................................. 31
ADDENDUM A SAMPLE QUICK TRAINING ......................................................................................... 33
ADDENDUM B SAMPLE DEMAND TRAINING.................................................................................... 37
ADDENDUM C SAMPLE POWER QUALITY TRAINING ................................................................... 43
ADDENDUM D COMPLETE 115V MPQ SETUP FILE .......................................................................... 63
ADDENDUM E COMPLETE 230V MPQ SETUP FILE .......................................................................... 65
AVTMMPQSIM Rev 1 May 2017
ii
Page 7

1
INTRODUCTION
Thank you for purchasing the MPQSIM Power Quality Simulator, from Megger.
If you find any discrepancies in the product or its accessories or have any comments,
please send them to Megger via fax, e-mail or phone.
AVTMMPQSIM Rev 1 May 2017
1
Page 8

M
M
2
AVTMMPQSIM Rev 1 May 2017
Page 9

2
RECEIVING INFORMATION
MPQ-SIM-01
Contents Received:
QTY. PART NO. DESCRIPTION
1 1007-055 Power Quality Simulator
1 90017-548 AC Adapter
3 2008-124 Current Cables
When your Megger product arrives, check the equipment received against the
packaging list to ensure that all materials are present. Notify Megger of any shortages.
Examine the contents for damage received during transit. If any damage is
discovered, file a claim with the carrier at once and notify Megger or it’s nearest
authorized sales representative, giving a detailed description of the damage.
AVTMMPQSIM Rev 1 May 2017
3
Page 10

M
M
4
AVTMMPQSIM Rev 1 May 2017
Page 11

3
OVERVIEW
Intended Use
Applications
The MPQSIM is a power quality event simulator. This simulator is intended for use with
the Megger MPQ line of power quality analyzers. The MPQSIM power quality simulator
box is a training tool that simulates various power quality phenomenons. The MPQSIM is
not intended to be used for instrument calibration or troubleshooting.
Applications include:
Demonstrating Power Quality Phenomenon
Power Quality Phenomenon Locating and Identification Training.
NOTE: If this product is to be used in an industrial location with high ambient
EMI levels, some degradation of performance may occur. If this
degradation is objectionable, the unit should be moved to a more benign
location.
AVTMMPQSIM Rev 1 May 2017
5
Page 12

M
Definitions
Term Definition
Power Quality
Transient
Amplitude
Phase Angle
Harmonics
Flicker
Source
Load
Line Frequency
The concept of powering and grounding sensitive equipment
in a manner that is suitable to the operation of that equipment.
A sudden, non-power frequency change in the steady-state
condition of voltage, current, or both.
In this document amplitude will refer to the percentage of
change from 100% of the RMS voltage and or current value.
In this document phase angle will refer to the number of
degrees between the phase voltages as well as the number of
degrees between the phase voltage and phase current.
Sinusoidal components of periodic waves that have
frequencies that are multiples of the fundamental frequency.
The MPQSIM product creates 3
Flicker is a very specific problem related to human perception
and incandescent light bulbs. It is not a general term for
voltage variations. The MPQSIM product produces voltage
variations over time that will create Flicker phenomenon in
incandescent lighting.
The source of electrical generation or supply.
The load of an electrical generator or supply.
The fundamental AC frequency of the power network.
rd
and 5th order harmonics.
6
AVTMMPQSIM Rev 1 May 2017
Page 13

4
SPECIFICATIONS
DC Input Voltage:
AC Adapter:
Nominal Output Voltage:
Voltage Selections Accuracy:
(% of nominal)
nt Ranges:
Curre
Current Accuracy:
Nominal Pha
Phase Angle Selection
(from nominal)
Phase Accuracy:
Voltage Transient Amplitude:
Voltage Transient Rise Time:
Voltage Transient Duration:
Harmonic Orders:
se Angles:
12VDC +/-0.5VDC
100-240VAC 50/60
115VAC +/- 1.2VAC
230VAC +/- 2.4VAC
85.0 %+/- 0.5%
102.0% +/- .2%
115.0% +/- 0.5%
10A, 100A, 1000A & 6000
+/-2% Full Scale
0°, 120°, 240°
-30°, -11°, 0°, +11°
+/-1.5°
1075 +/-50Vpk
18 +/-5μsec
35+/-10μsec
rd
3
and 5th
Hz
A
Harmonic Amplitudes
Frequency Output:
Frequency Accuracy:
Flicker:
(Square wave modulation)
Physical size
Weight:
Operating Temperature:
Storage Temperature:
Humidity:
AVTMMPQSIM Rev 1 May 2017
7
10.0 +/-3.% of fundamental
50Hz / 60Hz
+/-0.05Hz
2% ∆U @ 0.2
2% ∆U @ 1.0Hz
2% ∆U @ 5.0Hz
14.2” x 12.0” x 7.6”
(36cm x 30.5cm x 19.3cm)
11.5lbs (5.2kg)
0C to +40C
-20C to +
0 to 95% non-condensing
50C
z
H
Page 14

M
Altitude:
EMF
Safety
IP Rating
CAT Rating
2000 meters
IEC 61326:2012 Class A, Basic Immunity
IEC61010-1
40
CAT II @ 300V
8
AVTMMPQSIM Rev 1 May 2017
Page 15
5
SAFETY
Warnings and Safety Precautions
WARNING!
Death, serious injury, or fire hazard could result from improper
use/installation of this instrument. Read and understand this
manual before installing this instrument.
Installation of this instrument MUST be performed in compliance with the
National Electric Code and any additional safety requirements applicable to
your installation.
Installation, operation and maintenance of this instrument MUST be
performed by qualified personnel only. The National Electrical Code defines
a qualified person as one familiar with the construction and operation of the
equipment and the hazards involved.
Do not leave the instrument connected to the system under test when not in
use.
Do not touch circuit connections or any metal that is exposed due to
damaged insulation.
Do not use the instrument or connect it to any external system if it shows
any visible signs of damage, malfunction or if it has been stored in
unfavorable conditions.
Always inspect the instrument prior to use.
Replace any defective parts or return the instrument to an authorized center
for repair.
Do not use the instrument or connect it to any external system if the
enclosure is open or any parts of the enclosure are missing.
Only use specified batteries as described by this document, if applicable.
The instrument shall not be used if any parts are damaged.
This instrument is not intrinsically safe and must not be used in hazardous
The following safety precautions MUST be taken whenever this product is installed.
AVTMMPQSIM Rev 1 May 2017
atmospheres.
9
Page 16
M
These warnings and safety precautions are to be used where appropriate when
following instructions in this manual.
Wear safety glasses and insulated gloves when making connections to
power circuits
Hands, shoes, floor/ground must be dry when making any connection to
a power line
CAUTION!
If this equipment is used in the manner not specified by
the manufacturer, the protection provided by the
equipment may be impaired.
PROTECTIVE TERMINAL
The Phase C RTN banana jack must be connected to
Earth Ground prior to the connection of any of the other
voltage output banana jacks.
Safety and Warning Symbols
SYMBOL REFERENCE DESCRIPTION
IEC 60417-5031 (2002-10) Direct current
d
IEC 60417-5019 (2006-08) Protective conductor terminal
g
Warning, possibility of electric shock
F
ISO 7000-0434B (2004-01) Caution
G
The crossed out wheeled bin placed on
Megger products is a reminder not to
dispose of the product at the end of its life
WEEE
with general waste. Megger is registered
in the UK as a Producer of Electrical and
Electronic Equipment. The Registration
No is WEE/DJ2235XR.
10
AVTMMPQSIM Rev 1 May 2017
Page 17
6
PRODUCT INSTALLATION
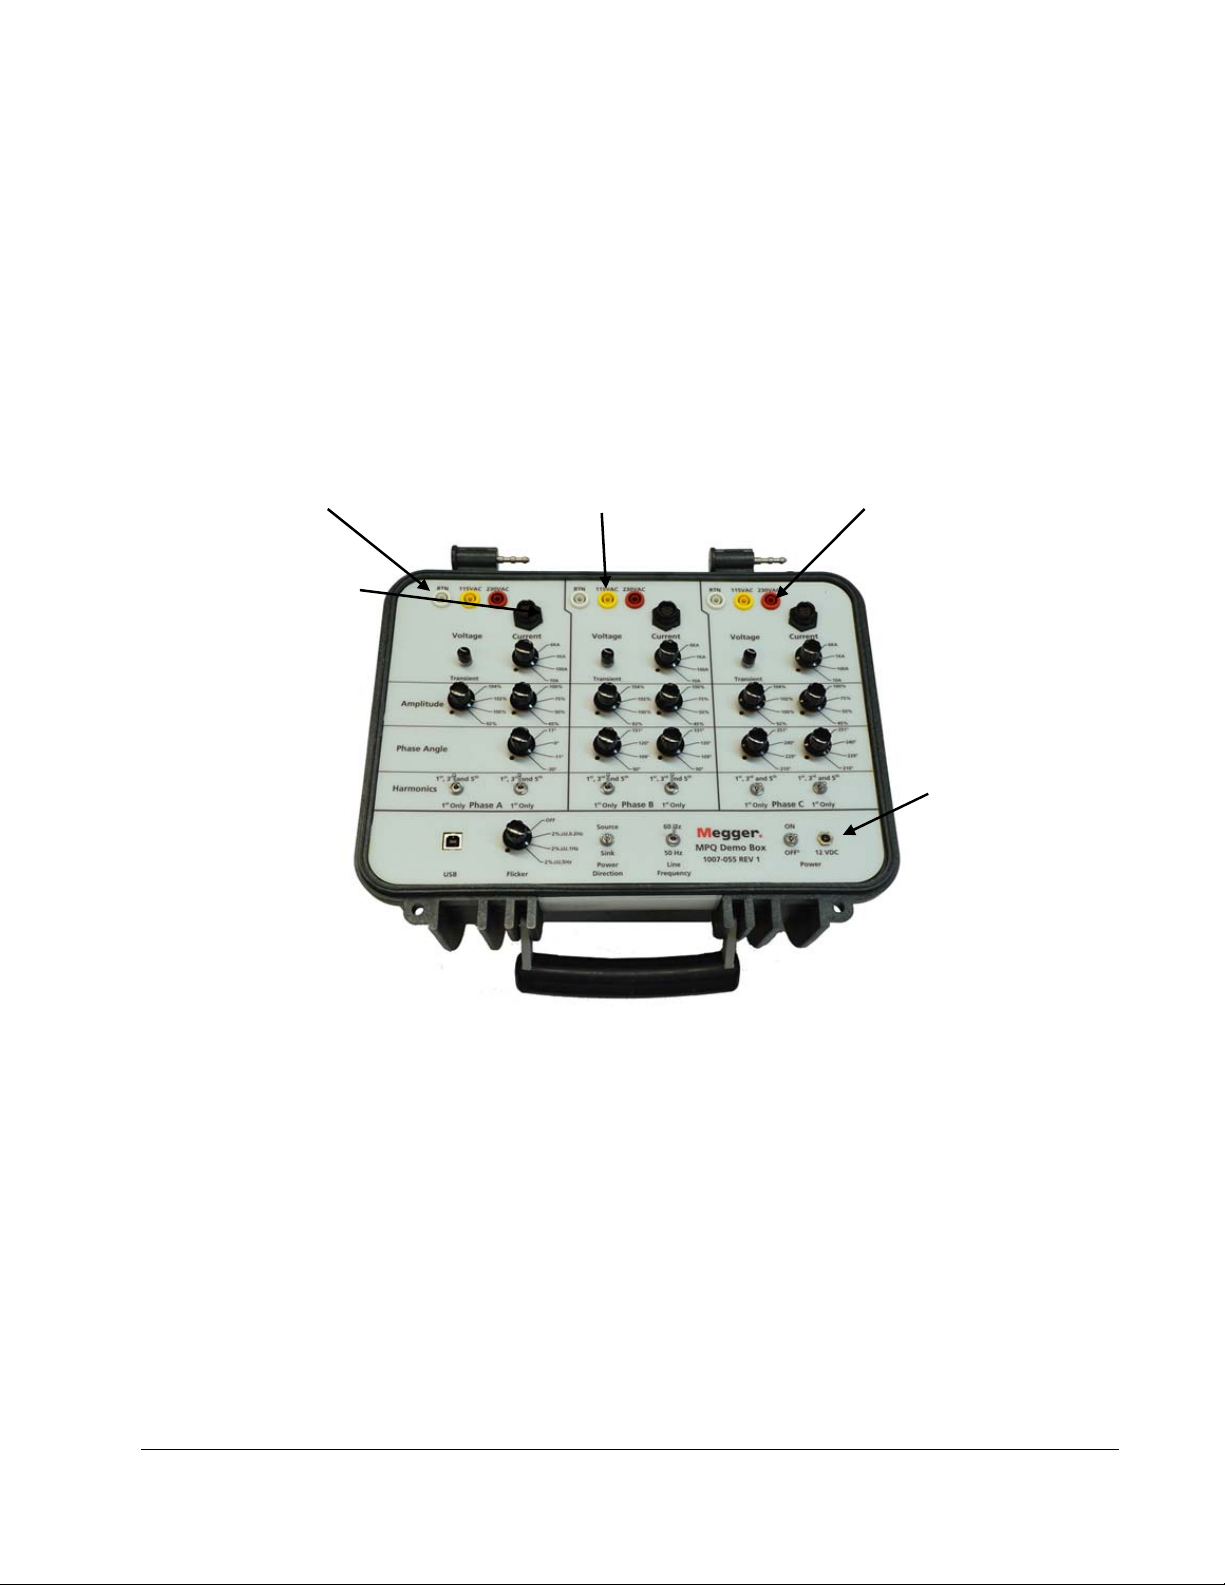
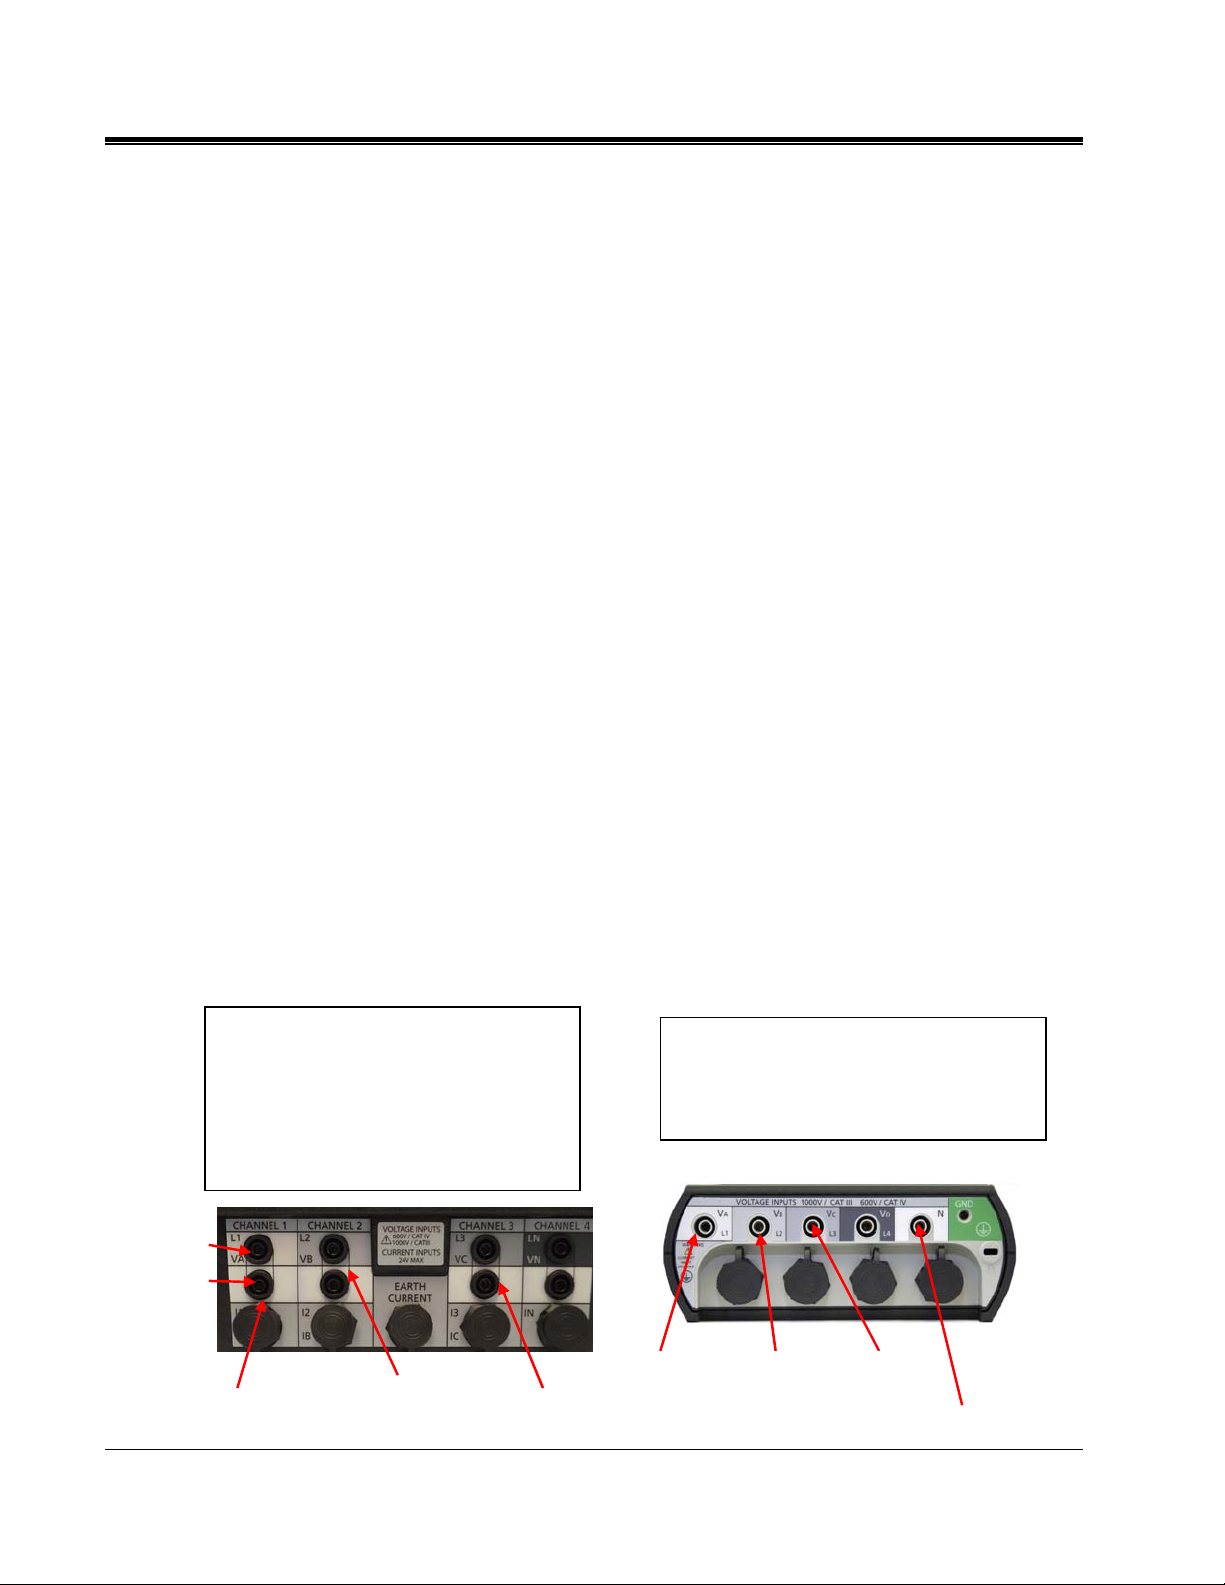
Connector Layout / Interconnect
White Jacks - Return
Current Channel
Connectors
Plug the AC Adapter into the AC Adapter jack of the MPQSIM product.
Yellow Jacks – 115VAC
Red Jacks – 230VAC
AC Adapter
Jack
When used with an MPQ1000:
1. Connect the Phase C RTN jack on the MPQSIM to Earth Ground.
2. Connect the GND input on the MPQ1000 to Earth Ground.
3. Plug the Phase A voltage lead (supplied with the Megger PQ Product) between
the Phase A 115V or 230V banana jack on the MPQ-SIM and the Phase A
voltage input of the MPQ1000.
4. Plug the Phase B voltage lead (supplied with the Megger PQ Product) between
the Phase B 115V or 230V banana jack on the MPQ-SIM and the Phase B voltage
input of the MPQ1000.
AVTMMPQSIM Rev 1 May 2017
11
Page 18
M
5. Plug the Phase C voltage lead (supplied with the Megger PQ Product) between
6. Plug the Neutral lead (supplied with the Megger PQ Product) between the Phase
When used with the MPQ2000:
1. Connect the Phase C RTN jack on the MPQSIM to Earth Ground.
2. Connect the GND input on the MPQ2000 to Earth Ground.
3. Using two of the white Jumper Leads (supplied with the Megger PQ Product),
4. Using the voltage leads supplied with the Megger PQ Product connect the Phase
the Phase C 115V or 230V banana jack on the MPQ-SIM and the Phase C voltage
input of the MPQ1000.
A RTN banana jack on the MPQ-SIM and the Neutral lead of the MPQ1000.
connect the VA-Low, VB-Low and VC-Low banana jack inputs on the MPQ2000
together in daisy-chain fashion.
A high input on the MPQ2000 analyzer to either the Phase A 115V or 230V
banana jack on the MPQ-SIM.
5. Using the voltage leads supplied with the Megger PQ Product connect the Phase
A low input to the Phase A RTN jack on the MPQ-SIM.
6. Using the voltage leads supplied with the Megger PQ Product connect the Phase
B high input on the MPQ2000 analyzer to either the Phase B 115V or 230V
banana jack on the MPQ-SIM.
7. Using the voltage leads supplied with the Megger PQ Product connect the Phase
C high input on the MPQ2000 analyzer to either the Phase C 115V or 230V
banana jack on the MPQ-SIM.
The MPQ2000 has differential voltage
inputs. Using the jumpers supplied with
MPQ2000 jump the voltage neutrals (lows)
together. Then connect the jumped
neutrals to the Phase A neutral jack on the
PQ Simulator. Then plug each channel to
the corresponding voltage channel on the
PQ simulator.
High
Low
The MPQ1000 has a common neutral so no
jumpers are required. Plug each channel to
the corresponding voltage channel on the
PQ simulator. Plug the neutral lead into the
Phase A neutral jack of the simulator.
Phase A
Voltage
Phase B
Voltage
Phase C
Voltage
12
Phase A
Voltage
Phase B
Voltage
Phase C
Voltage
Neutral / Return
AVTMMPQSIM Rev 1 May 2017
Page 19
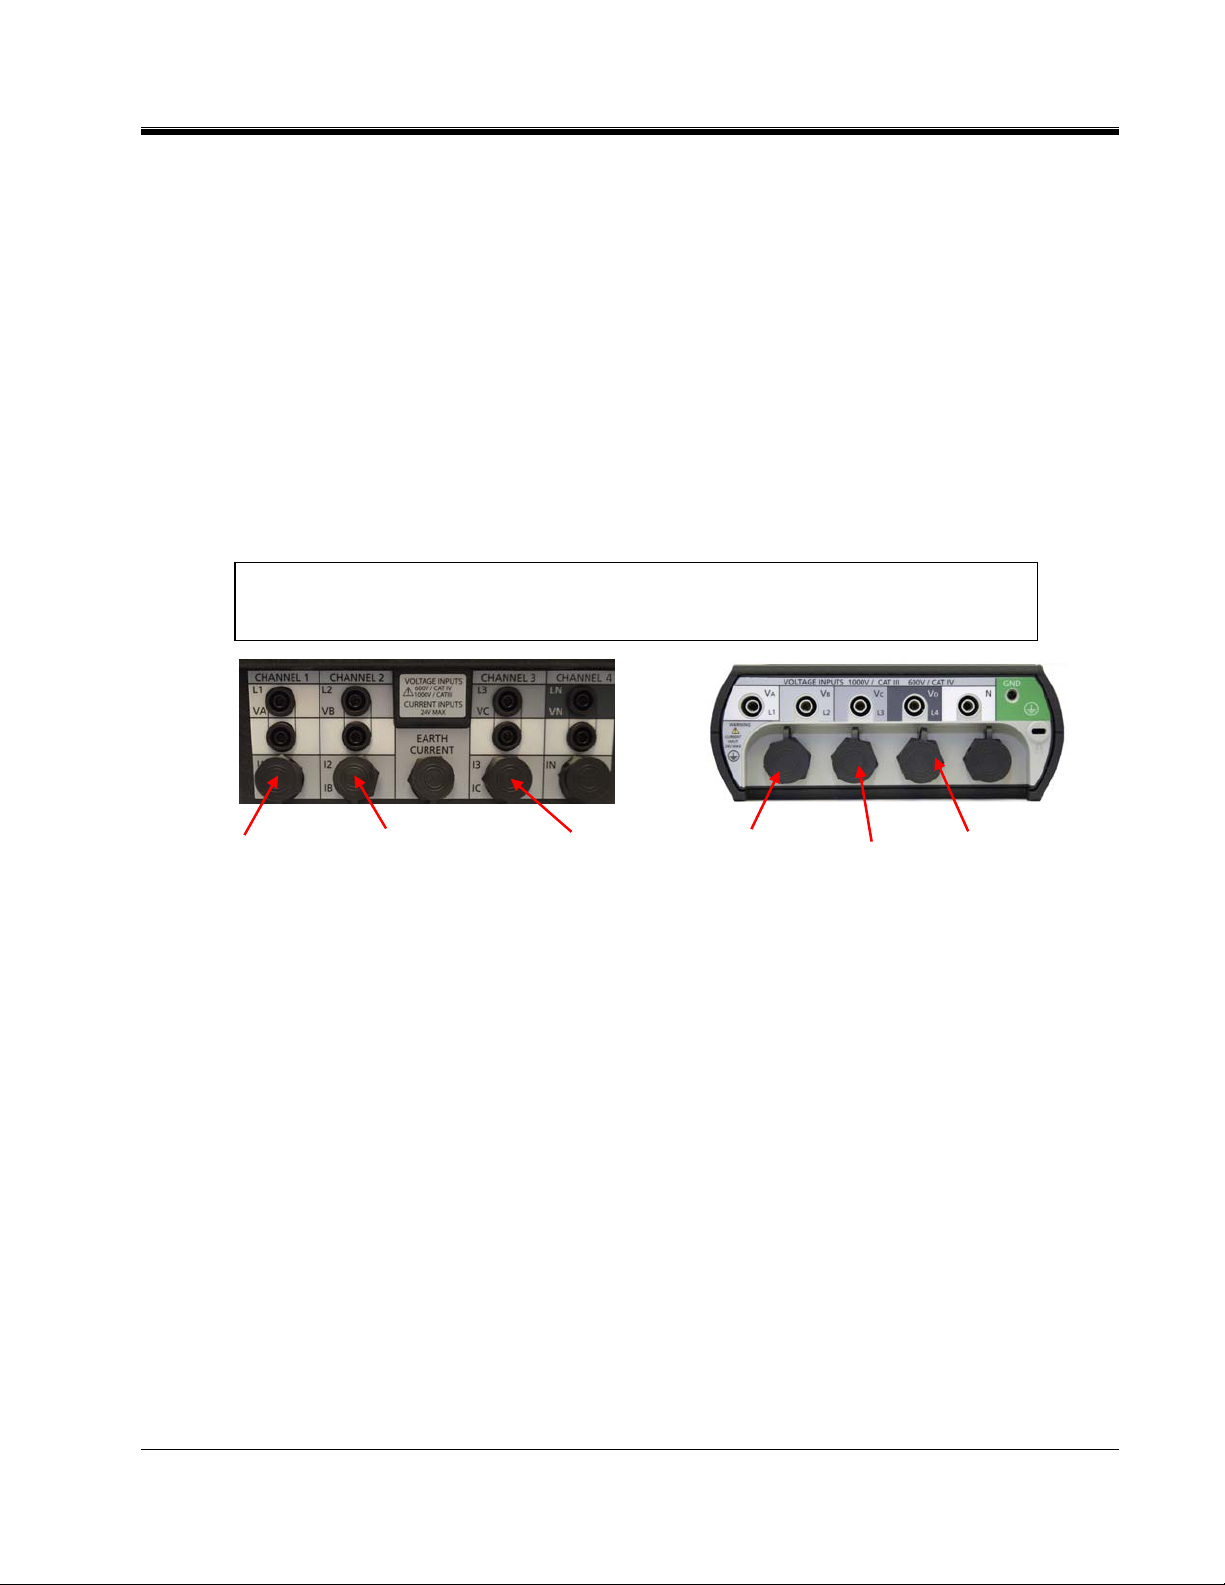
PRODUCT INSTALLATION
8. Plug the Phase A current lead into the MPQSIM Phase A current connector.
9. Plug the other side of the Phase A current lead into the Phase A current
connector of the Megger PQ Product.
10. Plug the Phase B current lead into the MPQSIM Phase B current connector.
11. Plug the other side of the Phase B current lead into the Phase B current
connector of the Megger PQ Product.
12. Plug the Phase C current lead into the MPQSIM Phase C current connector.
13. Plug the other side of the Phase A current lead into the Phase A current
connector of the Megger PQ Product.
Both the MPQ1000 and MPQ2000 use the same type self-identifying current clamps. No actual
current clamps are required to use the PQ Simulator with an MPQ Analyzer. Connect the MPQ
Analyzer CT connector directly to the PQ Simulator using the provided current cable.
Phase A
Current
Phase B
Current
Phase C
Current
Phase A
Current
Phase B
Current
Phase C
Current
AVTMMPQSIM Rev 1 May 2017
13
Page 20

M
M
14
AVTMMPQSIM Rev 1 May 2017
Page 21
7
PRODUCT OPERATION
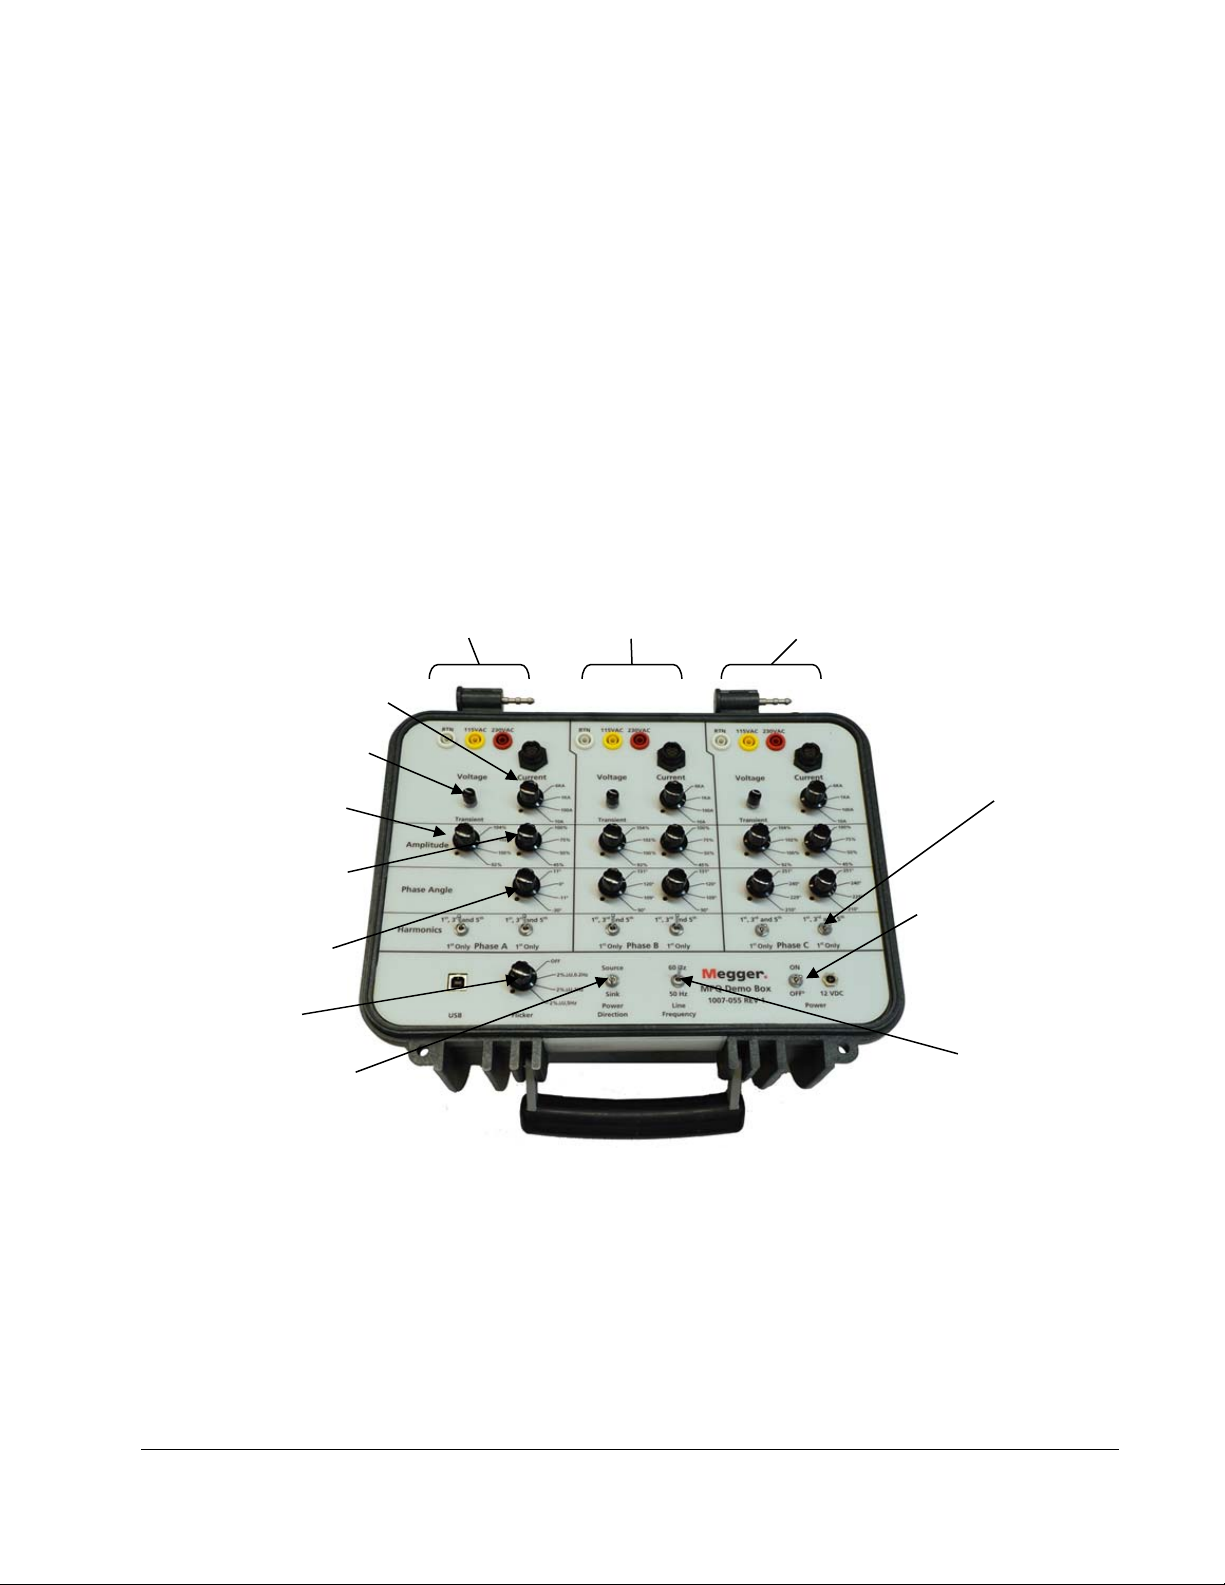
Operation Controls and Modes
The following section describes the operation of the MPQSIM Power Quality
Simulator. This section will describe in a step by step manner how to operate the unit.
Definitions of switch and control functions.
Current Selector
Transient Button
Amplitude
Selector Voltage
Amplitude
Selector Current
Phase Angle
Selector
Flicker
Source / Load
Selection
CONTROL FUNCTION
Phase A Section
Phase B Section
Phase C Section
Current and Voltage
Harmonic Switches
Power On / Off
Frequency
Selection
Current Selector
Transient Button
Amplitude Selector
(Voltage)
AVTMMPQSIM Rev 1 May 2017
Sets the full scale range of the simulated current probe.
Applies a momentary transient pulse on the voltage
signal.
Sets the voltage amplitude. This value is set as a
percentage of the voltage output. If the voltage output
being used is 230VAC then 100% = 230VAC and 80% =
184V.
15
Page 22

M
CONTROL FUNCTION
Amplitude Selector
(Current)
Phase Angle Selector
(Voltage)
Phase Angle Selector
(Current)
Harmonics Switch
Flicker Selector
Power Direction Switch
Line Frequency Switch
Power Switch
Initial Settings
Sets the current amplitude. This value is set as a
percentage of the full scale current range. If the current
selector is set to 6000A output then 100% = 6000AAC
and 80% = 4800AAC.
Sets the voltage phase angles. Phase A is used as the
reference.
Sets the current phase angles. The Phase A Voltage is
used as the reference.
Turns ON and OFF the voltage and / or current
harmonics.
Sets the level and rate of voltage variation which causes
flicker in incandescent lighting.
Sets the power flow. The power flow can either be from
the source or the load.
Sets the fundamental line frequency. The line frequency
can be at either 50Hz or 60Hz.
Turns the MPQSIM ON and OFF.
Connect the Power Quality Simulator to the Megger MPQ Analyzer as described in
Section 6.
Set the controls to the following initial settings.
CONTROL SETTING
PHASE A
Phase A Current Range
Phase A Voltage Amplitude
Phase A Current Amplitude
Phase A Current Angle
Phase A Voltage Harmonics
Phase A Current Harmonics
PHASE B
Phase B Current Range
Phase B Voltage Amplitude
Phase B Current Amplitude
Phase B Voltage Angle
Desired Current Range
100%
100%
0°
OFF
OFF
Desired Current Range
100%
100%
120°
Phase B Current Angle
120°
AVTMMPQSIM Rev 1 May 2017
16
Page 23

PRODUCT OPERATION
CONTROL SETTING
PHASE C
GENERAL
Flicker
Power Direction
Line Frequency
Power
Simulations
Phase B Voltage Harmonics
Phase B Current Harmonics
Phase C Current Range
Phase C Voltage Amplitude
Phase C Current Amplitude
Phase C Voltage Angle
Phase C Current Angle
Phase C Voltage Harmonics
Phase C Current Harmonics
OFF
OFF
Desired Current Range
100%
100%
240°
240°
OFF
OFF
OFF
SOURCE
Desired Frequency
ON
Power Reversal
Verify the Power Quality instrument connected to the simulator is programmed to
record power in a 4-wire wye 3-wattmeter configuration.
Method # 1 Real Time Demand DVM Screen
1. Verify the controls are set to their initial settings.
2. View the real time demand (DVM screen) and note the KW is positive.
3. Set the Power Direction switch on the PQ Simulator to Sink.
4. The KW now reads negative. This indicates a reversal of power.
NOTE: The current vectors are now 180° out of phase with the voltage. Current
vectors should never exceed 90° of the voltage. If the current does exceed
90° of the voltage angle then this indicates a reverse power flow.
AVTMMPQSIM Rev 1 May 2017
17
Page 24

M
Method # 2 Real Time Demand Scope Screen
1. Verify the controls are set to their initial settings.
2. View the Phase A voltage and current on the scope screen.
3. Note the current is in Phase with the Voltage.
4. Set the Power Direction switch on the PQ Simulator to Sink.
Method # 3 Recording Data
1. Verify the Power Quality instrument connected to the simulator has a
NOTE: The current is now 180° out of phase with the voltage. This indicates a
reversal of power.
programmed demand interval of no more than 1 minute. This simulation will
require that at least 6 demand intervals are captured. The longer the demand
interval the longer this test will take.
2. Verify the controls are set to their initial settings.
3. Start the unit recording.
4. Allow the unit to record for at least 2 demand intervals.
5. Set the Power Direction switch on the PQ Simulator to Sink.
6. Allow the unit to record for at least 2 demand intervals.
7. Set the Power Direction Switch back to Source.
8. Allow the unit to record for at least 2 demand intervals.
9. Stop the recording.
10. View the Active Power (KW).
11. Note that during the phase reversal the KW value went negative.
18
AVTMMPQSIM Rev 1 May 2017
Page 25

Active Power vs. Reactive Power
Verify the Power Quality instrument connected to the simulator is programmed to
record power in a 4-wire wye 3-wattmeter configuration.
Method # 1 Real Time Demand DVM Screen
1. Verify the controls are set to their initial settings.
2. View the real time demand (DVM screen) and note the KW displays a value and
the KVAR is near 0.
3. Set any of the Current Phase Angle selectors to 30° from its nominal angle.
(-30° for Phase A, 90° for Phase B or 210° for Phase C)
NOTE: The KW value for the selected channel goes down while the KVAR
value goes up. As inductive load is added the phase angle increases which
reduces the active power and increases the reactive power.
Method # 2 Recording Data
PRODUCT OPERATION
1. Verify the Power Quality instrument connected to the simulator has a
programmed demand interval of no more than 1 minute. This simulation will
require that at least 6 demand intervals are captured. The longer the demand
interval the longer this test will take.
2. Verify the controls are set to their initial settings.
3. Start the unit recording.
4. Allow the unit to record for at least 2 demand intervals.
5. Set any of the Current Phase Angle selectors to 30° from its nominal angle.
(-30° for Phase A, 90° for Phase B or 210° for Phase C)
6. Allow the unit to record for at least 2 demand intervals.
7. Set the Current Phase Angle Selectors back to their nominal angles
(0°, 120° and 240°).
8. Allow the unit to record for at least 2 demand intervals.
9. Stop the recording.
10. View the Active Power (KW) and Reactive Power (KVAR).
NOTE: As the phase angle increases the reactive power increases and the active
power decreases.
AVTMMPQSIM Rev 1 May 2017
19
Page 26

M
Displacement Power Factor (Leading and Lagging Current)
Verify the Power Quality instrument connected to the simulator is programmed to
record power in a 4-wire wye 3-wattmeter configuration.
Method # 1 Real Time Demand DVM Screen
1. Verify the controls are set to their initial settings.
2. Set the Phase A, B and C Current Phase Angle selector switches to -11°.
3. View the real time demand (DVM screen) and note the DPF for each channel is
4. Set the Phase A, B and C Current Phase Angle selector switches to 11°.
5. View the real time demand (DVM screen) and note the DPF for each channel is
positive.
negative.
NOTE: When the load is inductive (as in a motor) the current lags the voltage.
This will be seen as a positive displacement power factor (DPF). When
the load is capacitive (as in a cap bank) the current leads the voltage.
This will be seen as a negative displacement power factor (DPF).
The sign of the DPF will always equal the sign of the KVAR.
Method # 2 Real Time Demand Scope Screen
1. Verify the controls are set to their initial settings.
2. Set the Phase A Phase Angle selector switch to -30°.
3. View the Phase A voltage and current on the scope screen.
4. Note the current lags the voltage.
5. Set the Phase A Phase Angle selector switch to 11°.
6. View the Phase A voltage and current on the scope screen.
NOTE: The current now leads the voltage.
NOTE: When the load is inductive (as in a motor) the current lags the voltage.
This will be seen as a positive displacement power factor (DPF). When
the load is capacitive (as in a cap bank) the current leads the voltage.
This will be seen as a negative displacement power factor (DPF).
The sign of the DPF will always equal the sign of the KVAR.
20
AVTMMPQSIM Rev 1 May 2017
Page 27

Method # 3 Recording Data
1. Verify the Power Quality instrument connected to the simulator has a
programmed demand interval of no more than 1 minute. This simulation will
require that at least 8 demand intervals are captured. The longer the demand
interval the longer this test will take.
2. Verify the controls are set to their initial settings.
3. Set the Voltage Phase A, B and C Phase Angle selector switches to 11°.
4. Start the unit recording.
5. Allow the unit to record for at least 3 demand intervals.
6. Set the Voltage Phase A, B and C Phase Angle selector switches to -30°.
7. Allow the unit to record for at least 3 demand intervals.
PRODUCT OPERATION
8. Set the Voltage Phase A, B and C Phase Angle selector switches to 11°.
9. Allow the unit to record for at least 2 demand intervals.
10. Stop the recording.
11. View the Displacement Power Factor (DPF).
NOTE: When the phase angle was 30° the DPF was positive. When the phase
angle was -30° the DPF was negative.
NOTE: When the load is inductive (as in a motor) the current lags the voltage.
This will be seen as a positive displacement power factor (DPF). When
the load is capacitive (as in a cap bank) the current leads the voltage.
This will be seen as a negative displacement power factor (DPF).
The sign of the DPF will always equal the sign of the KVAR.
AVTMMPQSIM Rev 1 May 2017
21
Page 28

M
Harmonic Effect on Power
Verify the Power Quality instrument connected to the simulator is programmed to
record power in a 4-wire wye 3-wattmeter configuration.
Method # 1 Real Time Demand DVM Screen
1. Verify the controls are set to their initial settings.
2. Set the Phase A, B and C Current Phase Angle selector switches to 30°.
3. View the real time demand (DVM screen) and note the Apparent Power (KVA),
the Active Power (KW) and the Reactive Power (KVAR).
NOTE: The Power Triangle holds true
S = Apparent Power
P = Active Power
Q = Reactive Power
4. Set the voltage and current harmonic switches to ON.
5. View the real time demand (DVM screen) and note the Apparent Power (KVA),
the Active Power (KW) and the Reactive Power (KVAR).
NOTE: The power triangle now has increased errors. This shows that power
triangle does not hold true for non-sinusoidal waveforms.
Method # 2 Recording Data
1. Verify the Power Quality instrument connected to the simulator has a
programmed demand interval of no more than 1 minute. This simulation will
require that at least 6 demand intervals are captured. The longer the demand
interval the longer this test will take.
2. Verify the controls are set to their initial settings.
3. Set the Phase A, B and C Phase Angle selector switches to 30°.
4. Start the unit recording.
5. Allow the unit to record for at least 3 demand intervals.
6. Set the voltage and current harmonic switches to ON.
Test Equipment Depot - 800.517.8431
99 Washington Street, Melrose, MA 02176
TestEquipmentDepot.com
Page 29

PRODUCT OPERATION
7. Allow the unit to record for at least 3 demand intervals.
8. Stop the recording.
9. View the Apparent Power (KVA), the Active Power (KW) and the Reactive
Power (KVAR).
NOTE: The Power Triangle holds true when the harmonics are off.
S = Apparent Power
P = Active Power
Q = Reactive Power
The power triangle now has increased errors when the harmonics are on. This shows
that power triangle does not hold true for non-sinusoidal waveforms.
Voltage Dips / Sags
1. Verify the Power Quality instrument connected to the simulator has a
programmed sag / dip limit of no more that 10% of the MPQSIM voltage output
that it is connected.
NOTE: If you wish to record RMS values as well it may be best to set the RMS
2. Verify the controls are set to their initial settings.
3. Start the unit recording.
storage interval to 3 seconds, so you do not need to wait a long period to
acquire saved RMS intervals.
4. Allow the unit to record for several seconds.
5. Note there are no recorded Sags / Dip events.
6. Set one of the voltage phase Amplitude selector switches to 85%.
7. Allow the unit to record for several seconds.
8. Set the voltage phase Amplitude selector switch back to 100%.
9. Allow the unit to record for several seconds.
10. Note the unit now displays a Sag / Dip event.
11. Stop the recording.
12. The Sag event can now be viewed on the unit.
AVTMMPQSIM Rev 1 May 2017
23
Page 30

M
Voltage Swells
Verify the Power Quality instrument connected to the simulator has a programmed
swell limit of no more that 10% of the MPQSIM voltage output that it is connected.
1. Verify the controls are set to their initial settings.
2. Start the unit recording.
3. Allow the unit to record for several seconds.
4. Note there are no recorded Swell events.
5. Set one of the voltage phase Amplitude selector switches to 115%.
NOTE: If you wish to record RMS values as well it may be best to set the RMS
storage interval to 3 seconds, so you do not need to wait a long period to
acquire saved RMS intervals.
6. Allow the unit to record for several seconds.
7. Set the voltage phase Amplitude selector switch back to 100%.
8. Allow the unit to record for several seconds.
9. Note the unit now displays a Swell event.
10. Stop the recording.
11. The Swell event can now be viewed on the unit.
Voltage Transients
1. Verify the Power Quality instrument connected to the simulator has a
programmed with sag and swell limit of no more that 10% of the MPQSIM
voltage output that it is connected.
2. Verify the Power Quality instrument connected to the simulator has a
programmed with transient limit of 140.00 for a 115VAC voltage connection or a
transient limit of 280.00 for a 230VAC voltage connection.
NOTE: If you wish to record RMS values as well it may be best to set the RMS
storage interval to 3 seconds, so you do not need to wait a long period to
acquire saved RMS intervals.
3. Verify the controls are set to their initial settings.
AVTMMPQSIM Rev 1 May 2017
24
Page 31

4. Start the unit recording.
5. Allow the unit to record for several seconds.
6. Note there are no recorded Transient events.
7. Depress and release one of the transient buttons.
8. Allow the unit to record for several seconds.
9. Note the unit now displays a Transient event.
10. Stop the recording.
11. The Transient event can now be viewed on the unit.
Phase Angle Event
1. Verify the Power Quality instrument connected to the simulator has the following
settings programmed.
PRODUCT OPERATION
a. Phase Ange Events – Enabled
b. Rotation – ABC
c. Phase A Nominal Angle = 0
d. Phase B Nominal Angle = 120
e. Phase C Nominal Angle = 240
f. Phase B Angle Deviation = 2.00
g. Phase C Angle Deviation = 2.00
NOTE: If you wish to record RMS values as well it may be best to set the RMS
storage interval to 3 seconds, so you do not need to wait a long period to
acquire saved RMS intervals.
2. Verify the controls are set to their initial settings.
3. Start the unit recording.
4. Allow the unit to record for several seconds.
5. Note there are no phase angle events.
6. Set Phase B Voltage Angle to 131°
7. Allow the unit to record for several seconds.
AVTMMPQSIM Rev 1 May 2017
25
Page 32

M
8. Set Phase B Voltage Angle to 120°
9. Allow the unit to record for several seconds.
10. Note the unit now displays a Phase Angle Event.
11. Set Phase C Voltage Angle to 251°
12. Allow the unit to record for several seconds.
13. Set Phase C Voltage Angle to 240°
14. Allow the unit to record for several seconds.
15. Note the unit now displays another Phase Angle Event.
16. Stop the recording.
17. The Phase Angle events can now be viewed on the unit
Voltage and Current Harmonics
Verify the Power Quality instrument connected to the simulator is programmed to
record power in a 4-wire wye 3-wattmeter configuration.
Method # 1 Real Time Harmonics DMM Screen
1. Verify the controls are set to their initial settings.
2. Verify the Voltage and Current Harmonic switches are set to OFF.
3. View the real time harmonics in the units real time DMM screen and note the
harmonic content is near 0.
4. Set the Phase A, B and C Voltage Harmonics to ON.
5. View the real time harmonics in the units real time DMM screen and note the 3rd
order and 5th order voltage harmonics now display
Method # 2 Real Time Harmonics Scope Screen
1. Verify the controls are set to their initial settings.
2. Verify the Voltage and Current Harmonic switches are set to OFF.
3. View the real time harmonics in the units real time Scope screen and note the
harmonic content is near 0.
4. Set the Phase A, B and C Current Harmonics to ON.
AVTMMPQSIM Rev 1 May 2017
26
Page 33

5. View the real time harmonics in the unit’s real time Scope screen and note the 3rd
order and 5th order current harmonics now display.
6. Set the Phase A, B and C Voltage Harmonics to ON.
7. View the real time harmonics in the units real time Scope screen and note the 3rd
order and 5th order voltage harmonics now display.
Method # 3 Recording Data
1. Verify the Power Quality instrument connected to the simulator is programmed
to record power in a 4-wire wye 3-wattmeter configuration and has the following
settings programmed.
a. RMS Storage Interval – 3 Seconds
b. Timed Waveform Capture – Enabled
c. Timed Capture Rate = 1 Minute
d. Timed Capture Duration in Cycles = 6
PRODUCT OPERATION
e. Enable THD Recording = Enabled
f. Enable IEC Harmonics Recording = Enabled
g. THD / Harmonic Storage Interval = 3 Seconds
2. Verify the controls are set to their initial settings.
3. Verify the Voltage and Current Harmonic switches are set to OFF.
4. Start the unit recording.
5. Allow the unit to record for at least 30 seconds to 1 minute.
6. Set the Phase A, B and C Current Harmonics to ON.
7. Allow the unit to record for at least 30 seconds to 1 minute.
8. Set the Phase A, B and C Voltage Harmonics to ON.
9. Allow the unit to record for at least 30 seconds to 1 minute.
10. Set the Phase A, B and C Voltage and Current Harmonics to OFF.
11. Allow the unit to record for at least 30 seconds to 1 minute.
12. Stop the recording.
13. You can now view the recorded harmonic on the unit.
NOTE: You can transfer the data to the PC for a more advanced analysis.
AVTMMPQSIM Rev 1 May 2017
27
Page 34

M
Flicker
Method # 1 Real Time Flicker DVM Screen
1. Verify the controls are set to their initial settings.
2. Load a setup file into the MPQ Analyzer that has flicker recording enabled. (Pst
3. Verify the flicker knob on the unit Power Quality Simulator is set to OFF.
4. View the real time flicker on the flicker portion of the DVM screen and note the
5. Set the flicker knob on the Power Quality Simulator to one of the flicker settings.
6. Note the instantaneous flicker value on the MPQ DVM screen is now showing a
and Plt)
flicker content is near 0.
value.
7. Wait one minute for the Pst 1 Minute value to display.
Method # 2 Recording Data
1. Verify the Power Quality instrument connected to the simulator is programmed
to record power in a 4 wire wye 3 wattmeter configuration and has the flicker
capture enabled. (Pst and Plt)
2. Verify the controls are set to their initial settings.
3. Set the flicker knob on the Power Quality Simulator to one of the flicker settings.
4. Start the MPQ Analyzer recording.
5. Let the unit record for 30 minutes, in order to record several flicker intervals.
6. Stop the recording and view the flicker data on the unit or download the data to
the Megger PQ PC software.
28
AVTMMPQSIM Rev 1 May 2017
Page 35

8
UNIT MAINTENANCE
Instructions for Cleaning and Decontamination
This unit has no field serviceable parts within it.
The unit should not be cleaned with anything more than a clean dry cloth.
AVTMMPQSIM Rev 1 May 2017
29
Page 36

M
M
30
AVTMMPQSIM Rev 1 May 2017
Page 37

9
SPARE PARTS
PART NO. DESCRIPTION
2008-124 Current Cable
90017-548 AC Adapter
\
AVTMMPQSIM Rev 1 May 2017
31
Page 38

M
M
32
AVTMMPQSIM Rev 1 May 2017
Page 39

ADDENDUM A
SAMPLE QUICK TRAINING
This Addendum is meant to offer a possible sample training routine for the MPQ line
of power quality analyzers.
1. Initial PQ Simulator Configuration
Configure the PQ Simulator as shown in Section 7 Initial Settings of this manual
2. Program the MPQ Analyzer
Programming the MPQ Analyzer for 115V input from simulator.
Voltage sag / dip limit
Voltage swell limit
Fast transient limit
THD limit
RMS storage interval
See Addendum D - Complete 115V MPQ Setup File for full setup file.
108.00
132.00
400.00
5.0
3 Seconds
Programming the MPQ Analyzer for 230V input from simulator.
Voltage sag / dip limit
Voltage swell limit
Fast transient limit
THD limit
RMS storage interval
See Addendum E - Complete 230V MPQ Setup File for full setup file.
207.00
262.00
600.00
5.0
3 Seconds
Connect the unit to the simulator as shown in Section 6 Product Installation of this
manual.
3. Operation of Scope Mode and DVM Mode
a. View the voltages and demand values on the DVM screen of the MPQ Analyzer.
b. View the waveforms on the Scope screen of the MPQ Analyzer. Scroll through
the phases.
AVTMMPQSIM Rev 1 May 2017
33
Page 40

M
4. Harmonic Bar Chart
a. View the waveforms on the Scope screen of the MPQ Analyzer. Scroll through the
b. Turn ON the Voltage Harmonics switch on the PQ Simulator. The harmonics are
c. Turn OFF the Voltage Harmonics switch ON the PQ Simulator.
5. Phase Angles
a. View the Vectors on the Unbalance screen of the MPQ Analyzer.
b. Change the Current phase angles on the PQ Simulator. View the changes on the
c. Set the Current phase angles on the PQ Simulator back to nominal.
6. Source Reversal
a. View the demand values on the DVM screen of the MPQ Analyzer.
phases.
displayed.
vector diagram.
b. Set the Power Direction Switch on the PQ Simulator to SINK. The KW values are
now negative, indicating reversed power flow.
NOTE: This can also be viewed in the scope mode and in the unbalance vectors
as currents being 180° out of phase.
c. Set the Power Direction Switch on the PQ Simulator to SOURCE.
7. Leading/Lagging Current
a. View the Waveforms on the Scope screen of the MPQ Analyzer.
b. Change the Current phase angle on the PQ Simulator to -30°. The current now lags
the voltage. This is indicative of an inductive load, such as a motor.
c. View the Vectors on the Unbalance screen of the MPQ Analyzer.
d. View the phase rotation caused by a lagging current.
e. Change the Current phase angle on the PQ Simulator to +11°.
f. View the Waveforms on the Scope screen of the MPQ Analyzer.
The current now leads the voltage. This is indicative of a capacitive load, such as a cap bank.
g. View the Vectors on the Unbalance screen of the MPQ Analyzer.
NOTE: The phase rotation caused by a leading current.
h. Set the Current phase angles on the PQ Simulator back to nominal.
AVTMMPQSIM Rev 1 May 2017
34
Page 41

ADDENDUM A- SAMPLE QUICK TRAINING
8. Start a Recording
Start the MPQ Recording.
9. Create a SAG / DIP
a. Allow the unit to record for approximately 15 seconds (minimum).
b. Start a SAG / DIP on one of the voltage phases by setting the voltage selector to
85%.
c. Wait about 1 second.
d. Stop the SAG / DIP by setting the voltage selector back to 100%. The record screen
now will register a sag.
10. Create a Swell
a. Allow the unit to record for approximately 15 seconds (minimum).
b. Start a SWELL on one of the voltage phases by setting the voltage selector to
115%.
c. Wait about 1 second.
d. Stop the SWELL by setting the voltage selector back to 100%. The record screen
now will register a swell.
11. Create a Transient
a. Allow the unit to record for approximately 15 seconds (minimum).
b. Create a transient by depressing and releasing one of the transient switched on
the PQ Simulator. The record screen now will register a transient.
12. Create THD Event
a. Allow the unit to record for approximately 15 seconds (minimum).
b. Start a THD Event by turning ON one of the voltage harmonic switches.
c. Wait about 2 second.
d. Stop the THD Event by turning OFF one of the voltage harmonic switches.
The record screen now will register a THD Event.
13. Create a Phase Event
a. Allow the unit to record for approximately 15 seconds (minimum).
b. Start a Phase Event by setting one of the Voltage Phase switches to +11°.
c. Wait about 1 second.
d. Stop the Phase Event by setting the voltage phase switch selector back to
nominal. The record screen now will register a Phase Event.
AVTMMPQSIM Rev 1 May 2017
35
Page 42

M
14. Turn on Harmonics
a. Allow the unit to record for approximately 15 seconds (minimum).
b. Turn ON one of the voltage and current harmonic switches.
c. Let the unit record for about 1 minute.
d. Turn OFF the voltage and current harmonic switches.
e. Let the unit record for about another 15 seconds then stop the recording.
15. View the data on the MPQ Analyzer
a. View the RMS Charts.
b. View the Power Charts.
c. View the Harmonic Charts.
d. View the Event Data Charts.
NOTE: This data can also be transferred and viewed in the Megger PQ software.
36
AVTMMPQSIM Rev 1 May 2017
Page 43

ADDENDUM B
SAMPLE DEMAND TRAINING
This Addendum is meant to offer a possible sample training to illustrate power and
energy parameters.
1. Initial PQ Simulator Configuration
Configure the PQ Simulator as shown in Section 7: Initial Settings of this manual.
2. Program the MPQ Analyzer
Programming the MPQ Analyzer for 115V input from simulator.
Voltage sag / dip limit
Voltage swell limit
Fast transient limit
THD limit
RMS storage interval
Demand Configuration
Demand Storage Interval
See Addendum 4 - Complete 115V MPQ Setup File for full setup file.
Programming the MPQ Analyzer for 230V input from simulator.
Voltage sag / dip limit
Voltage swell limit
Fast transient limit
THD limit
RMS storage interval
Demand Configuration
Demand Storage Interval
108.00
132.00
400.00
5.0
3 Seconds
4-Wire Wye 3-Wattmeter
5 Minutes
207.00
262.00
600.00
5.0
3 Seconds
4-Wire Wye 3-Wattmeter
5 Minutes
See Addendum 5 - Complete 230V MPQ Setup File for full setup file.
Connect the unit to the simulator as shown in Section 6 Product Installation of this
manual.
Test Equipment Depot - 800.517.8431
99 Washington Street, Melrose, MA 02176
TestEquipmentDepot.com
Page 44

M
3. RMS and Demand Values
a. View the voltages and demand values on the DVM screen of the MPQ Analyzer.
Confirm the following:
The Displacement Power Factor (DPF) is the power factor of the fundamental value.
(COS of the phase angle between the voltage and current)
b. View the waveforms on the Scope screen of the MPQ Analyzer. Scroll through
NOTE: The phase angles of the voltage and current. Voltages and current are at
0, 120 and 240. This is true under purely resistive loads only.
The KW is positive. This indicates the power is flowing from the source to
the load.
The KVAR is near zero. This indicates there is minimal phase shifting due to
reactive loads.
The DPF is 1.0 and is positive. This is a sign of a resistive load.
the phases. The currents are in phase with the voltages.
4. Phase Rotation
a. View the Vectors and Power Factor on the DVM Power screen of the MPQ
Analyzer.
The phase rotation is as follows:
Phase A Voltage = 0°
Phase B Voltage = 120°
Phase C Voltage = 240°
This is an ABC Phase rotation.
b. Swap Phase B and C voltage inputs.
The phase rotation is as follows:
Phase A Voltage = 0°
Phase B Voltage = 240°
Phase C Voltage = 120°
This is an ACB phase rotation
Notice the currents are still in an ABC Phase rotation. The Phase B and C current
phase angles now have a phase angle difference of greater than 90° from their
voltages.
AVTMMPQSIM Rev 1 May 2017
38
Page 45

ADDENDUM B - SAMPLE DEMAND TRAINING
Different phase rotations can be used however the current phase angle can never be
more than 90° away from the phase voltage. This is a sign that something is not
connected properly.
c. Swap Phase B and C voltage inputs back to normal.
5. Phase Angles and Power Factor
a. View the Phase A Voltage and Current Waveforms on the Scope screen of the
MPQ Analyzer.
b. Change the Phase A Current phase angle on the PQ Simulator to -30°.
This simulates an inductive load, such as a motor.
The current now lags the voltage. This is because the coil is resistant to the change in ac current, per
Lenz law.
Lenz's law states that when an electromagnetic field (EMF) is generated by a change in
magnetic flux. The polarity of the induced EMF is such, that it produces a current
that's magnetic field opposes the change which produces it.
c. View the Vectors and Power Factor on the DVM Power screen of the MPQ
Analyzer. The phase rotation due to the lagging current moves the current vector
clockwise.
NOTE: The DPF is now less than 1.0 and is positive. A positive DPF is a
sign of a lagging current (Inductive load).
d. Change the Phase A Current phase angle on the PQ Simulator to +11°. This
simulates a capacitive load such as a cap bank.
e. View the Waveforms on the Scope screen of the MPQ Analyzer. The current
now leads the voltage. This is because the capacitors will charge and discharge as
the voltage changes. This creates a phase shift.
f. View the Vectors and Power Factor on the DVM Power screen of the MPQ
Analyzer. The phase rotation due to the leading current moves the current vector
counter-clockwise.
NOTE: The DPF is now less than 1.0 and is negative. A negative DPF is a
sign of a leading current (Capacitive load).
g. Set the Current phase angles on the PQ Simulator back to nominal.
AVTMMPQSIM Rev 1 May 2017
39
Page 46

M
6. Source Reversal
a. View the demand values on the DVM screen of the MPQ Analyzer.
b. Set the Power Direction Switch on the PQ Simulator to SINK. The KW values are
If the KW is negative when the power quality device is connected this can be an
indication that the current probes are backwards. Verify the arrows on the current
probes point toward the load.
c. Set the Power Direction Switch on the PQ Simulator to SOURCE.
7. Power Triangle
now negative, indicating reversed power flow. The power is now flowing from the load to the
source. This can be due to local sources such as solar power locations, distributed generation
devices.
NOTE: This can also be viewed in the scope mode and in the unbalance vectors
as currents being 180° out of phase.
a. View the demand values on the DVM screen of the MPQ Analyzer.
NOTE:
Active Power (P): measured in W / (KW): Performs real work
Reactive Power (Q): measured in VAR / (KVAR): Out of phase power,
does not perform real work.
Apparent Power (S): measured in VA / (KVA)
POWER TRIANGLE
b. Change the Phase A Current phase angle on the PQ Simulator to -30°. The
KVAR on Phase A increased due to the increase in reactive current caused by the added
inductive load.
AVTMMPQSIM Rev 1 May 2017
40
Page 47

ADDENDUM B - SAMPLE DEMAND TRAINING
However the power triangle still holds true. √
The more reactive power in a system the greater the amount of apparent power
(KVA) is required. As inductive loads are added to a network they increase the lag in
the current. This increases the amount of reactive power in that network. The energy
provider needs to create larger amounts of apparent power to carry that burden. By
switching in a capacitive load such as a capacitor bank, this compensates for the
lagging current and therefore reduces the reactive power in the network. This means
the energy provider can produce less apparent power to run the network. This makes
the energy provider more efficient.
c. Set the Current phase angles on the PQ Simulator back to nominal.
8. Harmonic Effects on the Power Triangle
a. View the demand values on the DVM screen of the MPQ Analyzer.
NOTE: the √
b. Change the Phase A Current phase angle on the PQ Simulator to -30°. The
KVAR on Phase A increased due to the increase in reactive current caused by
the added inductive load.
c. Turn ON the Phase A Voltage and Current Harmonics on the PQ Simulator. The
power triangle does NOT hold true √
.
The power triangle only holds true for sinusoidal waveforms. Once harmonics are
introduced the waveform is no longer sinusoidal, therefore the power triangle will
have errors. In the real world virtually all power will have some amount of harmonics.
This means that calculating a single power parameter based on the other two will
always have some error. In a PQ Instrument these values need to be measured values
not calculated values.
There is now a difference between the DPF and the TPF.
This is because the Displacement Power Factor (DPF) is the power factor of the
fundamental value only (COS of the phase angle between the voltage and current).
The True Power Factor (TPF) is the power factor of the fundamental plus the
harmonics (TPF = KW/KVA).
The greater the difference between the TPF and DPF, the greater the harmonic
content.
d. Set the Current phase angles on the PQ Simulator back to nominal.
AVTMMPQSIM Rev 1 May 2017
41
Page 48

M
9. Start a recording
a. Change the Phase A Current phase angle on the PQ Simulator to -30°.
b. Change the Phase B Current phase angle on the PQ Simulator to -30°.
c. Change the Phase C Current phase angle on the PQ Simulator to -30°.
d. Start the MPQ Recording.
Allow the unit to record for 20 minutes.
10. Energy
a. Stop the recording.
b. View the recorded energy graph on the unit.
Confirm the following:
NOTE: The KW, KVA and KVA values on the DVM Demand screen.
Each KWH 5 minute interval = KW/12
Each KVAR 5 minute interval = KVAR/12
Each KVA 5 minute interval = KVA/12
This is because the demand interval was set to 5 minutes. There are 12 (5 minute)
intervals in an hour. So the power is aggregated over a 5 minute interval to calculate
energy. If the demand interval was set to 15 minutes then the energy would be
aggregated 4 times every hour. So if the active power draw was constant the over the
15 minute demand interval then the KWH = KW/4.
When verifying revenue meters the demand aggregation should be set to the same
value as the revenue meter.
NOTE: This data can also be transferred and viewed in the Megger PQ software.
42
AVTMMPQSIM Rev 1 May 2017
Page 49

ADDENDUM C
SAMPLE POWER QUALITY TRAINING
This Addendum is meant to offer a possible sample training to illustrate power quality
phenomenon.
1. Initial PQ Simulator configuration
Configure the PQ Simulator as shown in Section 7 Initial Settings of this manual.
2. Program the MPQ Analyzer
Programming the MPQ Analyzer for 115V input from simulator.
Voltage sag / dip limit
Voltage swell limit
Fast transient limit
THD limit
RMS storage interval
See Addendum 4 Complete 115V MPQ Setup File for full setup file.
Programming the MPQ Analyzer for 230V input from simulator.
Voltage sag / dip limit
Voltage swell limit
Fast transient limit
THD limit
RMS storage interval
See Addendum 5 Complete 230V MPQ Setup File for full setup file.
Connect the unit to the simulator as shown in Section 6 Product Installation of this
manual.
108.00
132.00
400.00
5.0
3 Seconds
207.00
262.00
600.00
5.0
3 Seconds
AVTMMPQSIM Rev 1 May 2017
43
Page 50

M
3. RMS, Phases and THD
a. View the voltages and current values on the DVM screen of the MPQ Analyzer.
b. View the phase angles of the voltage and current on the DVM screen of the
c. View the scope screen of the MPQ Analyzer.
Verify RMS voltages and currents are correct. This should always be done prior
to performing a power quality investigation.
MPQ Analyzer.
NOTE: Always verify the voltage phase angles are correct per the power
configuration.
Always verify the current angles are less than 90° from their respective
voltage angles.
Current phase angle can never be more than 90° away from the phase
voltage. This is a sign that something is not connected properly.
Examinations of voltage waveforms can indicate power quality problem. These can
include harmonic distortion, notching and noise.
d. View the scope harmonics screen of the MPQ Analyzer.
Examinations of the harmonics can indicate power quality problems without the need
of doing a recording.
NOTE: Harmonics can cause various problems, including heating of
transformers, and motors, reduced efficiency in motors, neutral line
overheating, capacitor bank failures, as well as equipment failure.
Even harmonics (2, 4, 6…etc) are indications of a faulty rectifier.
Negative sequence harmonics (5, 11, 17…etc) have magnetic fields that
rotate opposite the fundamental. This creates inefficiencies in motors.
Odd Zero Sequence harmonics also known as triplens (3, 9, 15…etc)
do not cancel out. They add together. This can create high neutral
currents.
44
AVTMMPQSIM Rev 1 May 2017
Page 51

ADDENDUM C - SAMPLE POWER QUALITY TRAINING
4. Unbalance
a. View the Vectors and Unbalance on the SCOPE/UNBALANCE screen of the
MPQ analyzer.
b. Change the Phase A Current phase angle on the PQ Simulator to -30°.
c. Change the Phase A Voltage to 85% on the PQ Simulator. Note the change in the
unbalance.
NOTE: Voltage unbalance causes heating in neutral lines, motors, unbalanced
currents and uncharacteristic harmonics for electronic equipment such as
adjustable speed drives.
|
High-efficiency motors can be more susceptible to negative sequence
unbalance.
Negative sequence harmonics have a magnetic field that rotate opposite of
the fundamental.
This can lead to loss of efficiency as it resists the rotation of the motor.
The negative sequence factor [(negative sequence / positive sequence) *
100] is most the key unbalance value to reference when working with
motor loads.
Negative sequence unbalance is the basis of most international standards
for unbalance.
It is recommended that the voltage unbalance be within 2% for 95% of
the time measured over a period of a week at 10 minute intervals. For
systems with large single-phase loads, the unbalance can be as high as
3%.
d. Use the UP/DOWN button on the MPQ analyzer to change from an IEC
Unbalance measurement to an ANSI unbalance measurement.
The ANSI method of measuring unbalance compares the individual line-to-line voltage to the average
of the sum of all the line to line voltages. This value can be influenced by the zero sequence voltage as
well as by the negative sequence voltage.
ANSI C84.1-2006 recommends that voltage unbalance be limited to 3%.
e. Change the Phase A Current phase angle on the PQ Simulator to 0°.
f. Change the Phase A Voltage to 100% on the PQ Simulator.
AVTMMPQSIM Rev 1 May 2017
45
Page 52

M
5. Harmonics
a. View the Harmonics Bar Chart on the SCOPE / HARMONICS screen of the
b. Turn on the voltage and current harmonics on the PQ simulator. Note the
c. View the waveform on the SCOPE screen of the MPQ analyzer. Note the
Immediate effects of harmonics can include the misoperation of electronic controls
or uninterruptible power supplies. Over time harmonic distortion can results in
increased heating in transformers, motors, capacitors and conductors. In addition
voltage distortion can excite resonances overloading customer power factor
correction equipment.
AC current flowing though coils create eddie currents. These eddie current create
magnetic fields in opposition of the flow of current. This causes the current to be
pushed out to the edge of the wire. This is known as "skin effect". As the skin effect
increases the usable cross sectional area of the wire decreases. This increases the
impedance of the wire which in turn increases the heat. The higher the harmonic
order the greater this effect. Eddie current losses increase with approximately the
square of the frequency.
MPQ analyzer.
change in the harmonic bar chart as the harmonics are applied.
distortion.
IEC 61000-2-2 specifies harmonic distortion compatibility levels dependent on the
harmonic order. The compatibility level for the voltage THD is 8% for 95% of the
time measured over a period of a week at 10 minute intervals.
IEEE 519 recommends voltage distortion limits of 8% for the total harmonic
distortion (THD) IEEE 519 recommends individual harmonic components limits be
at 5%. The compatibility level is for 95% of the time measured over a period of a
week at 10 minute intervals.
d. Turn off the voltage and current harmonics on the PQ simulator.
6. Start a Recording
Before starting a recording it is always recommended to verify several parameters.
a. Go to the DVM screen of the MPQ Analyzer. Verify the voltages and currents
look correct.
b. Go to the DVM / POWER screen of the MPQ Analyzer
Verify the KW is positive. If it is not then the power flow is reversed. This
can be demonstrated by placing the SOURCE / LOAD switch on the PQ
Simulator in the SOURCE position.
Verify the voltage phases angles are correct per the programmed power
configuration. This can be demonstrated by reversing the cable connection
of one of the voltage lead cables.
AVTMMPQSIM Rev 1 May 2017
46
Page 53

ADDENDUM C - SAMPLE POWER QUALITY TRAINING
Verify the current phases angles are correct. Each phase current should be
within 90° of its phase voltage. If it is not within 90° then the current clamp
may be backwards.
Once these parameters are verified, start the recording by pressing the record button
on the MPQ Analyzer.
7. Create a Sag/Dip
a. Allow the unit to record for approximately 15 seconds (minimum).
b. Start a SAG / DIP on one of the voltage phases by setting the voltage selector to
85%.
c. Wait about 1 second.
d. Stop the SAG / DIP by setting the voltage selector back to 100%. Note the record
screen now will register a sag.
Facility operations can be affected by both long and short duration dips (sags).
Momentary voltage dips (sags) lasting less than 100 ms are often sufficient to cause
disruptions to equipment and operations. Momentary or short duration dips (sags)
can occur more frequently. Dips (sags) can be generated from either the load side of
the source side. Large loads turning on this can create high inrush currents that
create momentary dips (sags) on the voltage. Dips (sags) can also result from faults on
distribution circuits and transmission circuits.
Short duration dips (sags) are defined as a decrease in rms voltage between 0.1 pu and
0.9 pu for durations from 0.5 cycles to 1 min. Under-voltages with durations
exceeding 1 minute are considered to be long term duration events.
A dip (sag) event can either be a single phase event or a poly-phase phase event.
A dip (sag) is initiated when the ½ cycle RMS voltage of a single phase falls below the
dip (sag) threshold. The event ends when all phases are within above the dip (sag)
threshold plus any hysteresis programmed by the user.
The recommended thresholds for dip (sag) detection is 0.9pu the RMS value
aggregated every 1/2 cycle.
For example:
A 230V system the dip (sag) limit would be 228V.
A 120V system the dip (sag) limit would be 108V.
AVTMMPQSIM Rev 1 May 2017
47
Page 54

M
8. Create a Swell
a. Allow the unit to record for approximately 15 seconds (minimum).
b. Start a SWELL on one of the voltage phases by setting the voltage selector to
c. Wait about 1 second.
d. Stop the SWELL by setting the voltage selector back to 100%. Note the record
Facility operation scan be affected by swells. Swells can cause systems and operations
to trip off line. Swells can be caused by switching off a large load, load shedding, or
switching on a large capacitor bank. Swells can also be caused by system fault
conditions.
For example: a single line to ground (SLG) fault can cause a temporary voltage rise
(swell) on the un-faulted phases.
A swell is defined as an increase in rms voltage above 1.1 pu for durations from 0.5
cycle to 1 min.
115%.
screen now will register a swell.
A swell is initiated when the 1/2 cycle RMS voltage of a single phase rises above the
swell threshold. The event ends when all phases are below the swell threshold minus
any hysteresis programmed by the user.
The recommended thresholds for swell detection is 1.1pu the the RMS value
aggregated every 1/2 cycle.
For example:
A 230V system the dip (sag) limit would be 253V.
A 120V system the dip (sag) limit would be 132V.
9. Create a Transient (Low Frequency / High Frequency / EFT)
a. Allow the unit to record for approximately 15 seconds (minimum)
b. Create a transient by depressing and releasing one of the transient switched on
the PQ Simulator. Note the record screen now will register a transient.
Transient over-voltages can result in degradation or immediate dielectric failure in all
classes of equipment. Repetitive lower magnitude application of transients decreases
equipment mean time between failures. High magnitude and fast rise time of transient
over-voltages contribute to insulation breakdown in electrical equipment. This
equipment can include rotating machinery, transformers, capacitors, cables, current
and potential transformers (CTs and PTs), as wells as switchgear. In electronic
equipment, power supply component failures can result from transients. Transients
can also cause tripping of Adjustable Speed Drives due to the dc link overvoltage
protection circuitry.
48
AVTMMPQSIM Rev 1 May 2017
Page 55

ADDENDUM C - SAMPLE POWER QUALITY TRAINING
Transients are caused by lightning or almost any switching event on the power
system.
Transients can be categorized into several categories.
Oscillatory transients: These are typically low frequency transients in the few
hundred Hz range. They are caused by capacitor bank
switching.
Impulse transients: These are typically high frequency transients in the few hundred
KHz range. They are caused by lightning or equipment
switching operations. They can be either uni-directional or bidirectional.
Impulsive transients can pass through transformers and appear on the low side of the
transformer. They are not reduced by the turns ratio. This can cause damage on
equipment connected to the low side of the transformer.
Extremely Fast Transients (EFT): These typically have rise times in the nano-
seconds. The EFT has limited energy and is
typically dampened out by just a few meters of
wire.
These only become an issue in locations with short cable runs, such as off shore
platforms or mines.
AVTMMPQSIM Rev 1 May 2017
49
Page 56

M
10. Create a THD Event
a. Allow the unit to record for approximately 15 seconds (minimum).
b. Turn ON one of the voltage and current harmonic switches.
c. Let the unit record for about 1 minutes.
d. Turn OFF the voltage and current harmonic switches.
e. Let the unit record for about another 15 seconds then stop the recording.
The MPQ PQ Analyzer will record harmonics as a trended value. It will also record
Total Harmonic Distortion (THD) as a PQ event.
A THD event is initiated when the THD value (aggregated over a 200msec period) of
a single channel rises above the THD threshold. The event ends when the THD
value (aggregated over a 200msec period) of a single channel drops below the THD
threshold.
Note THD value for current channels can be misleading. THD is represented as a
percentage of the fundamental value. The voltage fundamental value is a constant
value. The current fundamental value can fluctuate based on the changing load
impedance. This make THD evaluation on current channel difficult. IEEE 519
recommends using Total Demand Distortion (TDD) to analyze current distortion.
TDD references the harmonic content of the current channels to the maximum
average current drawn within the test interval. This can be analyzed in the PC
software provided the unit is programmed to capture periodic waveforms.
11. Create a Phase Event (Loss of phase)
a. Allow the unit to record for approximately 15 seconds (minimum).
b. Start a Phase Event by setting one of the Voltage Phase switches to +11°.
c. Wait about 1 second.
d. Stop the Phase Event by setting the voltage phase switch selector back to
nominal. Note the record screen now will register a Phase Event.
The phase angle shift (jump) manifests itself as a shift in zero crossing of the
instantaneous voltage. Change in the phase angle of the voltage can affect powerelectronics converter and relays that use phase angle information for their firing
instant. The inconsistent nature of renewable energy such as wind and solar can lead
to inverters turning on and off leading to phase shift phenomenon. These can also be
caused by system faults.
The phase angle is referenced from Phase A voltage. The phase angle of the Phase B
Voltage and Phase C voltage are measured relative to Phase A voltage. If the Phase B
or C voltage deviated by more than the programmed amount from nominal then a
phase shift event occurs.
AVTMMPQSIM Rev 1 May 2017
50
Page 57

ADDENDUM C - SAMPLE POWER QUALITY TRAINING
12. View the Data on the Unit
a. Allow the unit to record for at least 10 minutes to obtain enough data for
adequate charts.
b. Stop the unit recording.
c. Press the HOME button.
d. Select VIEW DATA.
View the RMS Charts: Scroll through the phase and note the RMS variation
throughout the test period. The RMS variation should
not exceed 10% of nominal for 95% of the test interval.
It is recommended that this value is measured in 10
minute intervals over a period of 1 week.
View the Unbalance Charts: View the Unbalance data and note the unbalance
deviation throughout the test period. It is recommended
that the voltage unbalance does not exceed 2% of
nominal for 95% of the test interval. It is recommended
that this value is measured in 10 minute intervals over a
period of 1 week.
View the THD Chart: View the THD data for the various channels and note
the deviation throughout the test period. It is
recommended that the voltage THD does not exceed
8% of nominal for 95% of the test interval. It is
recommended that this value is measured in 10 minute
intervals over a period of 1 week.
View the Harmonic Charts: View the Zero Sequence harmonics and Negative
Sequence Harmonics. The PQ simulator will generate
3rd and 5th order harmonic. The third harmonic is a
zero sequence harmonic. The 5th harmonic is a negative
sequence harmonic. Per EN50160 standards 3rd
harmonic should not exceed 5% of the declared value.
The 5th harmonic should not exceed 6% of the declared
value.
IEEE519 recommends that the individual harmonics do not exceed 5% of the
fundamental value.
13. View the Event Data Charts
View the Dip/Sag events: Note the start and stop times as well as the duration and
the channel that triggered the event.
View the Swell events: Note the start and stop times as well as the duration and
View the THD events: Note the start and stop times as well as the duration and
AVTMMPQSIM Rev 1 May 2017
the channel that triggered the event.
the channel that triggered the event.
51
Page 58

M
14. Transfer the Data to a PC
For the MPQ series of Power Quality Analyzers this can be done using the SD card,
the USB stick or a direct link to the PC using the USB cable or Ethernet cable.
15. Analyze the Data on the PC
Highlight the name of the data file in the data file bar.
16. Create a Summary and Setup report
Click on the CREATE REPORT button then select the "Summary and Setup" report
and click CREATE.
This report provides data on the following.
Test duration
Unit configuration
Overall demand and power projections
The maximum and minimum voltages & current recorded during the test
interval
A breakdown of the total number of events recorded during the test interval
AVTMMPQSIM Rev 1 May 2017
52
Page 59

ADDENDUM C - SAMPLE POWER QUALITY TRAINING
17. Create an Out Of Limits-Brief report
Click on the SETUP button to return to the report screen. Select the "Out Of Limits
- Brief" report and click CREATE.
This report provides a brief view of the out of limits data. The report only shows the
data for the channel that triggered the out of limits event.
18. Create an Out Of Limits-Detailed report
Click on the SETUP button to return to the report screen then select the "Out Of
Limits-Detailed" report and click CREATE.
This report provides a full report of the out of limits data. The report shows the data for all the
channels for each out of limits event.
AVTMMPQSIM Rev 1 May 2017
53
Page 60

M
19. Create an RMS chart
Click on the CREATE CHART button then select the "RMS" chart and click
CREATE.
NOTE: Tthe ability to zoom and create scan lines to examine individual
intervals. When analyzing dip (sag) and swell events one method is to
examine the direction of the voltage event and the current. If the voltage
dips while the current swells this an indication that the event was on the
load side. If the voltage and current are in the same direction this is a
sign that the event was on the source side. Minimum voltage and
maximum current should be plotted together when performing this
analysis.
Please note” this is only an indication, it does not holds true in all cases.
AVTMMPQSIM Rev 1 May 2017
54
Page 61

ADDENDUM C - SAMPLE POWER QUALITY TRAINING
20. Create an Unbalance chart
Click on the SETUP button to return to the chart selection screen then select the
"IEC Unbalance" chart and click CREATE.
NOTE: The unbalance can be shown as negative and zero sequence unbalance in
the IEC unbalance chart and in an ANSI configuration in the ANSI
unbalance chart.
AVTMMPQSIM Rev 1 May 2017
55
Page 62

M
21. Create a THD chart
Click on the SETUP button to return to the chart selection screen then select the
"THD" chart and click CREATE.
You can create THD charts to view the total harmonic distortion on the voltage
channels and the current channels if you wish. However you can also create TDD
total demand distortion charts to view the harmonic distortion on the current
channels. TDD provides a better method for viewing current waveform distortion
since the reference value is not changing.
AVTMMPQSIM Rev 1 May 2017
56
Page 63

ADDENDUM C - SAMPLE POWER QUALITY TRAINING
22. Create a Harmonics chart
Click on the SETUP button to return to the chart selection screen then select the
"IEC Harmonics" chart and click CREATE.
You can view both harmonics and inter-harmonics. You can select which harmonic
orders you wish to view. You can also view the harmonics as a percentage of the
fundamental or as an RMS value.
AVTMMPQSIM Rev 1 May 2017
57
Page 64

M
23. Create a Waveform Chart
Click on the SETUP button to return to the chart selection screen. Then select the
"Waveforms" chart and click CREATE.
On all charts you can double click on the trace. This will open a window that will
allow you to alter the trace parameters or view the values of each data point. You can
change the line weight. This is a nice feature when you want to copy the chart into a
report. A thicker trace is easier to view. You can view the data points, then copy and
paste them into Excel for further analysis or data-basing. This way you can view the
waveforms in Excel.
58
AVTMMPQSIM Rev 1 May 2017
Page 65

ADDENDUM C - SAMPLE POWER QUALITY TRAINING
24. Create a Detailed Harmonic Analysis
Click on CHART/HARMONIC ANALYSIS.
Then select the cycle of the waveform to be analyzed and click CREATE.
This chart will allow you to select the waveform of interest, the cycle of interest and
create a detailed harmonic analysis of the waveform. It can be viewed as either text or
as a bar chart. The user can also zoom into the bar chart. Using the detailed harmonic
analysis helps characterize waveforms. For example a 6 pulse converter can be
identified by the predominate level of 5th and 7th harmonics.
When analyzing current waveform harmonics the K factor can be viewed. This value
is used to select de-rated transformers. This verifies a transformer is selected that will
not overheat due to actual harmonic content.
25. Create a Power Harmonic Analysis
AVTMMPQSIM Rev 1 May 2017
59
Page 66

M
Click on CHART/POWER HARMONIC ANALYSIS.
Then select the Cycle of the Waveform to be analyzed and click CREATE.
This chart will allow you to see which direction the different harmonic orders are
coming from. This can be viewed as text or as a bar chart.
60
AVTMMPQSIM Rev 1 May 2017
Page 67

ADDENDUM C - SAMPLE POWER QUALITY TRAINING
26. Create a PQ Event Waveform Analysis
Click on CREATE CHART/ PQ EVENT WAVEFORM ANALYSIS.
This chart allows you to view all the out of limits event data. You will also see the
traces associated with those events. In addition you can filter the events you wish to
view.
This chart also allows you to create a detailed harmonic analysis of the event.
AVTMMPQSIM Rev 1 May 2017
61
Page 68

M
27. Create a PQ Timed Waveform Analysis
Click on CREATE CHART/PQ TIMED WAVEFORM ANALYSIS.
This chart allows you to analyze all the timed waveforms that were recorded. The
MPQ unit can take waveform snap shots throughout the test interval. This screen
allows you to analyze that data.
This screen will average together each cycle of each individual waveform capture then
perform an FFT on that averaged cycle. It will then plot the individual harmonics
orders of the waveform captures.
A scan line can then be moved back and forth through the chart. The actual
waveform for that interval can be viewed. In addition a harmonic bar chart of that
waveform can be viewed.
This is different from IEC Harmonic recording. The IEC Harmonic recording is a
continuous value that is aggregated over a periodic interval, typically 10 minutes.
The PQ timed waveform analysis chart shows the FFT analysis of the waveform
snapshots. So this data may not match the IEC Harmonic data, since it is not
aggregated over a periodic interval.
AVTMMPQSIM Rev 1 May 2017
62
Page 69

ADDENDUM D
COMPLETE 115V MPQ SETUP FILE
DESCRIPTION SETUP COMMENTS
Power Wiring Connection
Enable Power
Calculations
Demand Interval
Enable RMS Recording
Record
RMS Storage Interval
Enable IEC Unbalance
Recording
Clock Hour Orientation
Enable IEC Flicker
Recording
Enable Frequency
Recording
4 Wire Wye 3
Wattmeter
Enabled
5 Minute This is not a normal interval used in
Enabled
MIN, MAX, RMS
3 Seconds This is not a normal interval used in
Enabled
Enabled
Not Enabled This test takes some time to perform
Enabled
the real world. This is just a short
interval to accumulate data quickly
for demonstration.
the real world. This is just a short
interval to accumulate data quickly
for demonstration.
and is not suitable for a short
demonstration.
Enable Instant Flicker
Recording
Hysteresis Value
Enable Sub-cycle event
capture
Enable Phase Events
Enable RVC Events
Rotation
Voltage Sag / Dip Limits
Voltage Swell Limits
AVTMMPQSIM Rev 1 May 2017
Disabled This is a special test used for
troubleshooting of flicker failures and
factory testing.
2% Standard value
Enabled
Enabled
Disabled
ACB
108.00
132.00
63
Page 70

M
DESCRIPTION SETUP COMMENTS
Current Limits
Sub-cycle Limit
Ratio
CT Full Scale
Nominal Angle
Angle Deviation
Fast Transient
THD Limit
Timed Waveform Capture
Timed Capture Duration
Exceedance Capture PreTriggers
Exceedance Capture Post
Triggers
THD / Harmonics
Disabled
240.00
1.0
6000.0
0, 120, 240
2.0
400.00
5.00
Enabled at 1 Minute This is not a normal interval used in
the real world. This is just a short
interval to accumulate data quickly
for demonstration.
6 Cycles
9
20
Enabled
THD / Harmonic Interval
Voltage for RVC and
Mains Signaling
Declared Voltage
Memory Mode
Default Frequency
Mains Signaling
3 Seconds This is not a normal interval used in
the real world. This is just a short
interval to accumulate data quickly
for demonstration.
Auto
NA
Stop When Full
60
Disabled
64
AVTMMPQSIM Rev 1 May 2017
Page 71

ADDENDUM E
COMPLETE 230V MPQ SETUP FILE
DESCRIPTION SETUP COMMENTS
Power Wiring Connection
Enable Power
Calculations
Demand Interval
Enable RMS Recording
Record
RMS Storage Interval
Enable IEC Unbalance
Recording
Clock Hour Orientation
Enable IEC Flicker
Recording
4 Wire Wye 3 Wattmeter
Enabled
5 Minute This is not a normal interval
used in the real world. This
is just a short interval to
accumulate data quickly for
demonstration.
Enabled
MIN, MAX, RMS
3 Seconds This is not a normal interval
used in the real world. This
is just a short interval to
accumulate data quickly for
demonstration.
Enabled
Enabled
Not Enabled This test takes some time to
perform and is not suitable
for a short demonstration.
Enable Frequency
Recording
Enable Instant Flicker
Recording
Hysteresis Value
Enable Sub-cycle event
capture
Enable Phase Events
Enable RVC Events
Rotation
Voltage Sag / Dip Limits
AVTMMPQSIM Rev 1 May 2017
Enabled
Disabled This is a special test used
for troubleshooting of flicker
failures and factory testing.
2% Standard value
Enabled
Enabled
Disabled
ACB
207.00
65
Page 72

M
DESCRIPTION SETUP C
Voltage Swell Limits
Current Limits
Sub-cycle Limit
Ratio
CT Full Scale
Nominal Angle
Angle Deviation
Fast Transient
THD Limit
Timed Waveform Capture
Timed Capture Duration
Exceedance Capture PreTriggers
262.00
Disabled
400.00
1.0
6000.0
0, 120, 240
2.0
600.00
5.00
Enabled at 1 Minute This is not a normal interval
6 Cycles
9
OMMENTS
used in the real world. This
is just a short interval to
accumulate data quickly for
demonstration.
Exceedance Capture Post
Triggers
THD / Harmonics
THD / Harmonic Interval
Voltage for RVC and
Mains Signaling
Declared Voltage
Memory Mode
Default Frequency
Mains Signaling
20
Enabled
3 Seconds This is not a normal interval
used in the real world. This
is just a short interval to
accumulate data quickly for
demonstration.
Auto
NA
Stop When Full
50
Disabled
99 Washington Street
Melrose, MA 02176
Phone 781-665-1400
Toll Free 1-800-517-8431
Visit us at www.TestEquipmentDepot.com
AVTMMPQSIM Rev 1 May 2017
66
 Loading...