

Page 1

FRAX User's Manual
Version 2.5
© 2011 Megger Sweden AB
Released in 2011-06-01
Page 2

USER'S MANUAL
for
Sweep Frequency Response Analyzer
FRAX 99, 101 and 150
Notice of copyright & proprietary rights
© 2011 Megger Sweden AB. All rights reserved.
The contents of this manual for FRAX 2.5.2272 are the property of Megger Sweden AB. No part of this work may be
reproduced or transmitted in any form or by any means, except as permitted in written license agreement with Megger
Sweden AB. Megger Sweden AB has made every reasonable attempt to ensure the completeness and accuracy of this
document. However, the information contained in this manual is subject to change without notice, and does not
represent a commitment on the part of Megger Sweden AB. Any attached hardware schematics and technical
descriptions, or software listings that disclose source code, are for informational purposes only. Reproduction in whole or
in part to create working hardware or software for other than Megger Sweden AB products is strictly prohibited, except as
permitted by written license agreement with Megger Sweden AB.
TRADEMARK NOTICES
FRAX is a trademark of Megger Sweden AB. All other brand and product names mentioned in this document are
trademarks or registered trademarks of their respective companies.
Megger Sweden AB, Eldarvagen 4, SE-187 75 TÄBY, Sweden
Tel: +46 8 510 195 00, Fax: +46 8 510 195 95
E-mail: seinfo@megger.com Internet: www.megger.com
Page 3

Table of Contents
IContents
1 FRAX
Safety First
................................................................................................................................... 11.1
FRAX Technical Specifications
................................................................................................................................... 21.2
Instrument Panels
................................................................................................................................... 31.3
Bluetooth Communication (only FRAX-101)
................................................................................................................................... 71.4
Built-in Battery Pack and Charger
................................................................................................................................... 91.5
Sweep Frequency Response
................................................................................................................................... 101.6
Calibration
................................................................................................................................... 111.7
Disposal
................................................................................................................................... 111.8
2 Quick Start Tutorial
Saftey First
................................................................................................................................... 112.1
Preparatory Procedures
................................................................................................................................... 122.2
Start Up FRAX and Establish Communication
................................................................................................................................... 122.3
Create a New Test
................................................................................................................................... 132.4
Test Lead Connection
................................................................................................................................... 142.5
1
11
Test System Verification
................................................................................................................................... 162.6
Start Measurement
................................................................................................................................... 192.7
View Data
................................................................................................................................... 202.8
Export Data
................................................................................................................................... 202.9
3 Installing FRAX Software
PC Requirements
................................................................................................................................... 213.1
Welcome Screen
................................................................................................................................... 213.2
License Agreement
................................................................................................................................... 213.3
Already Installed
................................................................................................................................... 213.4
Installation Location
................................................................................................................................... 223.5
Shortcuts Screen
................................................................................................................................... 233.6
20
Page 4

FRAX User's ManualII
Installation Progress
................................................................................................................................... 233.7
Installation Complete
................................................................................................................................... 243.8
4 FRAX Software
File Menu
................................................................................................................................... 264.1
Edit Menu
................................................................................................................................... 394.2
Configuration Menu
................................................................................................................................... 404.3
Windows Menu
................................................................................................................................... 564.4
Action Buttons
................................................................................................................................... 574.5
Legend
................................................................................................................................... 594.6
Views
................................................................................................................................... 624.7
5 Appendices
Appendix A: Calibration Instruction
................................................................................................................................... 645.1
Appendix B: Optional Active Probes
................................................................................................................................... 705.2
Appendix C: Adjusting Output Voltage
................................................................................................................................... 715.3
Appendix D: Sweep Name Settings
................................................................................................................................... 725.4
Appendix E: FRAX cables and clamps
................................................................................................................................... 765.5
24
64
Page 5
FRAX
1
1
FRAX
Congratulations to your choice of FRAX Sweep Frequency Response Analyzer by Megger. We
at Megger have done our best and will continue do our best to satisfy our customers. Please
visit our home page at www.paxdiagnostics.com and do not hesitate to contact us directly.
Most dielectric and mechanical failures in large power transformers are preceded by
mechanical changes in the winding structure. These displacements in the winding structure
may be the result of transportation damage, short circuit forces, or natural aging effects on
the insulating structures used to support the windings. Detection of these displacements
before dielectric failure reduces maintenance costs, and improves system reliability.
FRAX Sweep Frequency Response Analyzer (SFRA) is designed to detect winding
displacements in power transformers or faults in the magnetic core. The system provides
attenuation signature curves that can easily be compared for deviations which indicate:
Core movements
Winding deformations and displacements
Faulty core grounds
Partial winding collapse
Hoop buckling
Broken or loosened clamping structures
Shorted turns and open windings
Unique features of FRAX:
High accuracy
Small size and low weight
Powerful analysis tools that are intuitive and easy to use
Wireless, Bluetooth, communication between laptop an instruments allows flexibility in the
field (FRAX-101 only)
Galvanic isolated USB interface for personnel and equipment safety
More safety and technical details are given in the following sections:
Safety First
FRAX Technical Specifications
Instrument panels: Front, Rear
Sweep Frequency Response
Test System Verification
Calibration
Disposal
1.1 Safety First
FRAX is a Sweep Frequency Response Analyzer designed for measuring of power transformers
in the field and at manufacturing sites.
Always follow local safety regulations.
Make certain that all personnel working with FRAX instrument have been trained in its use
and that all applicable safety precautions are taken.
Always connect the instrument to protective earth/ground using the separate earth/ground
cable. The earth/ground cable should be the first connection made and the last removed.
Do not use any accessories that are not intended for use together with the FRAX.
Refer all servicing to qualified personnel.
Page 6

2
General
FRA Method:
Sweep frequency (SFRA)
Frequency Range:
1 Hz - 10 MHz, user selectable
Extended Frequency Range:
0.1 Hz - 25 MHz, user selectable
Number of Points:
User selectable, maximum 32,000
Points Spacing:
Logarithmic, linear or combination of both
Dynamic Range/Internal Noise:
Dynamic Range/Internal Noise: >130dB (FRAX-99
>115dB). Extended range >110dB
Accuracy:
±0.5 dB (FRAX-99 ±1 dB) down to -100dB
IF Bandwidth/Integration Time:
User selectable
Software:
FRAX for Windows 2000/XP/Vista
PC Communication:
Bluetooth (FRAX-101) and galvanic isolated USB
Calibration Interval:
Maximum 3 years
Standards:
Fulfill requirements in CIGRE Brochure 342,
Mechanical Condition Assessment of Transformer
Windings using FRA and Chinese standard DL/T
911-2004, FRA on Winding Deformation of Power
Transformers
Analog Output
Channels:
1
Compliance Voltage:
0.2 - 20 V peak-to-peak
Measurement Voltage at 50 Ohm
0.1 - 10 V peak-to-peak
Output Impedance:
50 Ohms
Protection:
Short-circuit protected
Analog Inputs
Channels:
2
Sampling:
Simultaneously, 100MS/s
Input Impedance:
50 Ohms
Physical
Instrument Weight
1.4 kg/3.1 lsb, 1.9 kg (FRAX-101 with Battery)
6 kg (13 lb) (FRAX-150)
Dimensions
250 x 169 x 52 mm (9.84 x 6.65 x 2.05 in.)
305 mm x 194 mm x 360 mm (12 in. x 7.6 in. x
14.2 in.) (FRAX-150)
Input Voltage
90-135VAC and 170-264VAC, 47-63 Hz
Environmental
Operating Ambient Temperature:
-20° to 50°C (-4 to 122°F), Bluetooth 0° to 50°C
-5° to 50°C (23 to 122°F) for FRAX-150
Operating Relative Humidity:
< 90% non-condensing
Storage Ambient Temperature:
-20° to 70°C
Storage Relative Humidity:
< 90% non-condensing
CE Standards:
IEC61010 (LVD) EN61326 (EMC)
PC requirements
FRAX User's Manual
1.2 FRAX Technical Specifications
Page 7
Operating System
Windows 2000, Windows XP or Windows Vista
Processor
Pentium 500 MHz or higher
Memory/Hard Drive
256MByte / 30MByte free or more
Interface
Bluetooth (FRAX-101 only) and USB
Specifications are subject to change without notice.
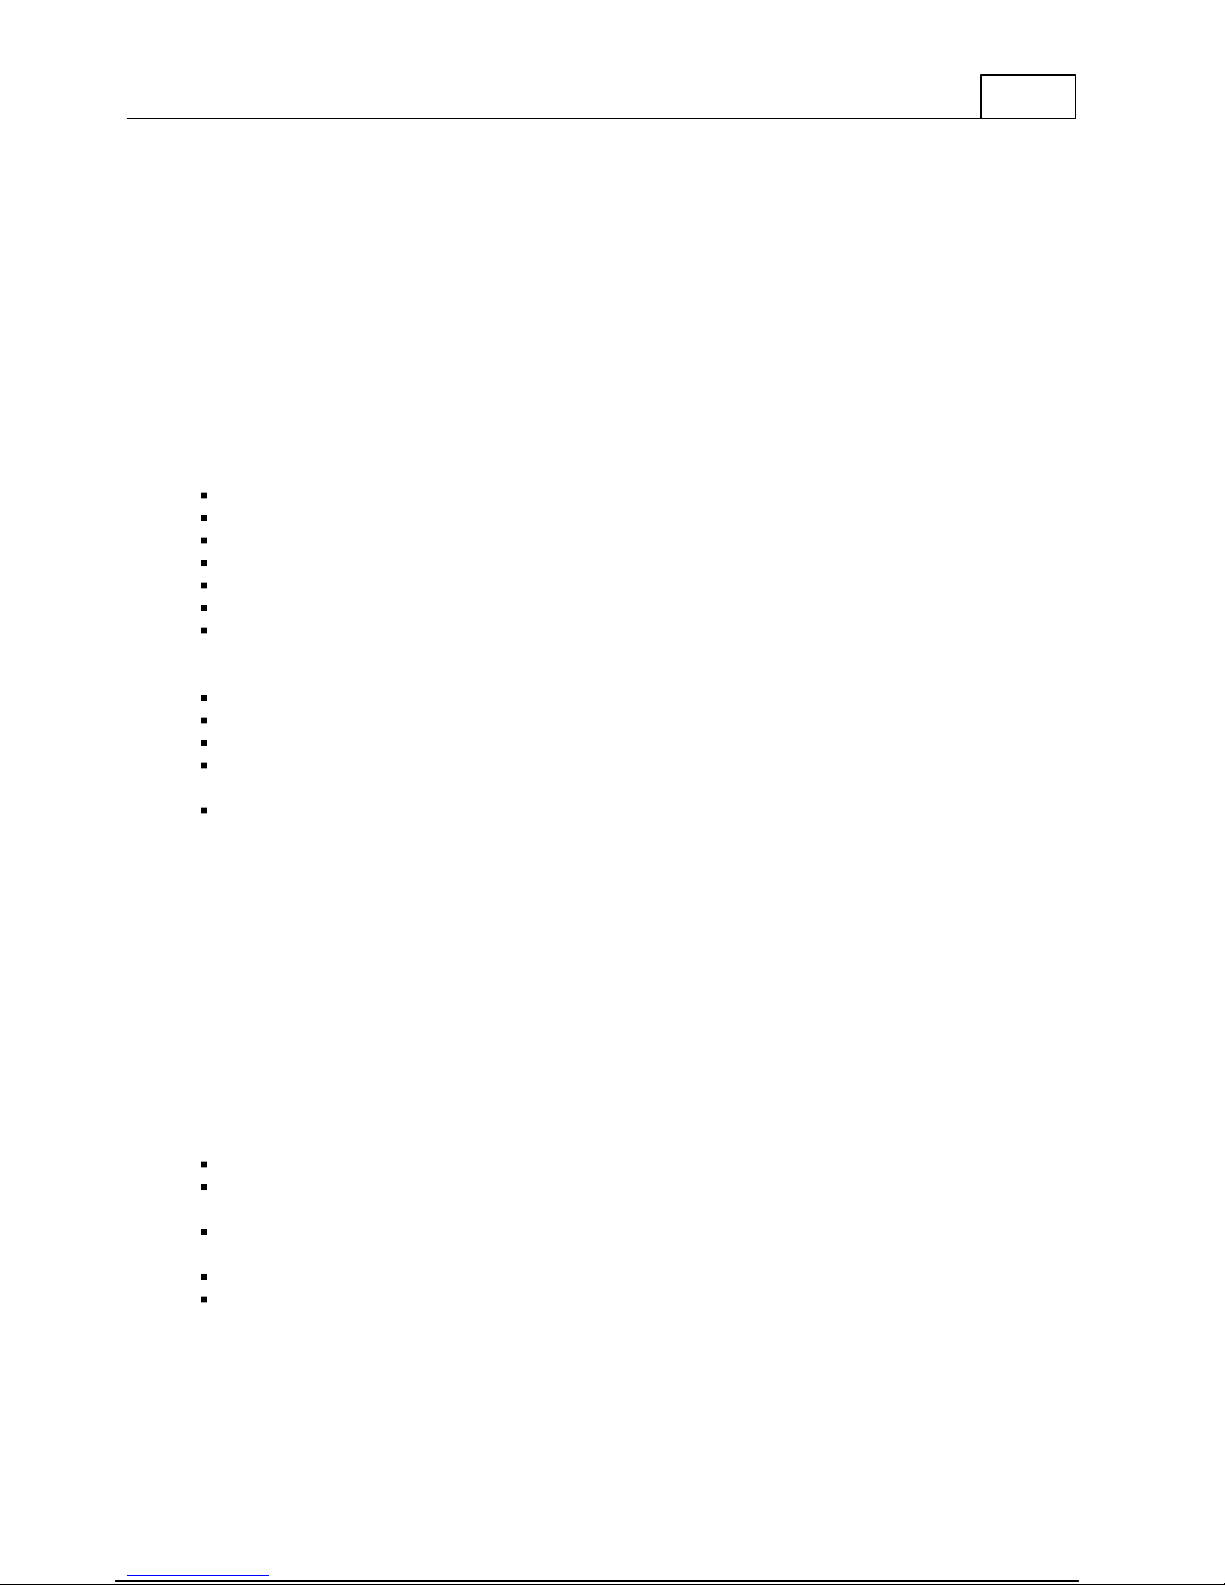
Left-hand side, top down:
On/Off:
On/Off-switch, to turn the instrument On/Off, Switch labeled
I (On) and 0 (Off).
DC Input:
DC-input, to connect the AC/DC adapter.
USB:
USB-connector type B, to connect a USB cable to PC
Antenna (only FRAX-101):
Bluetooth module, enables Bluetooth communication
Right-hand side, top
down:
Generator (Yellow):
Generator output connected to Reference at Red Clip
Reference (Red):
Reference input connected to Generator at Red Clip
Measure (Black):
Measure input Connected to Black Clip
1.3 Instrument Panels
1.3.1 FRAX-101/FRAX-99
FRAX
3
1.3.1.1
Front Panel
Page 8
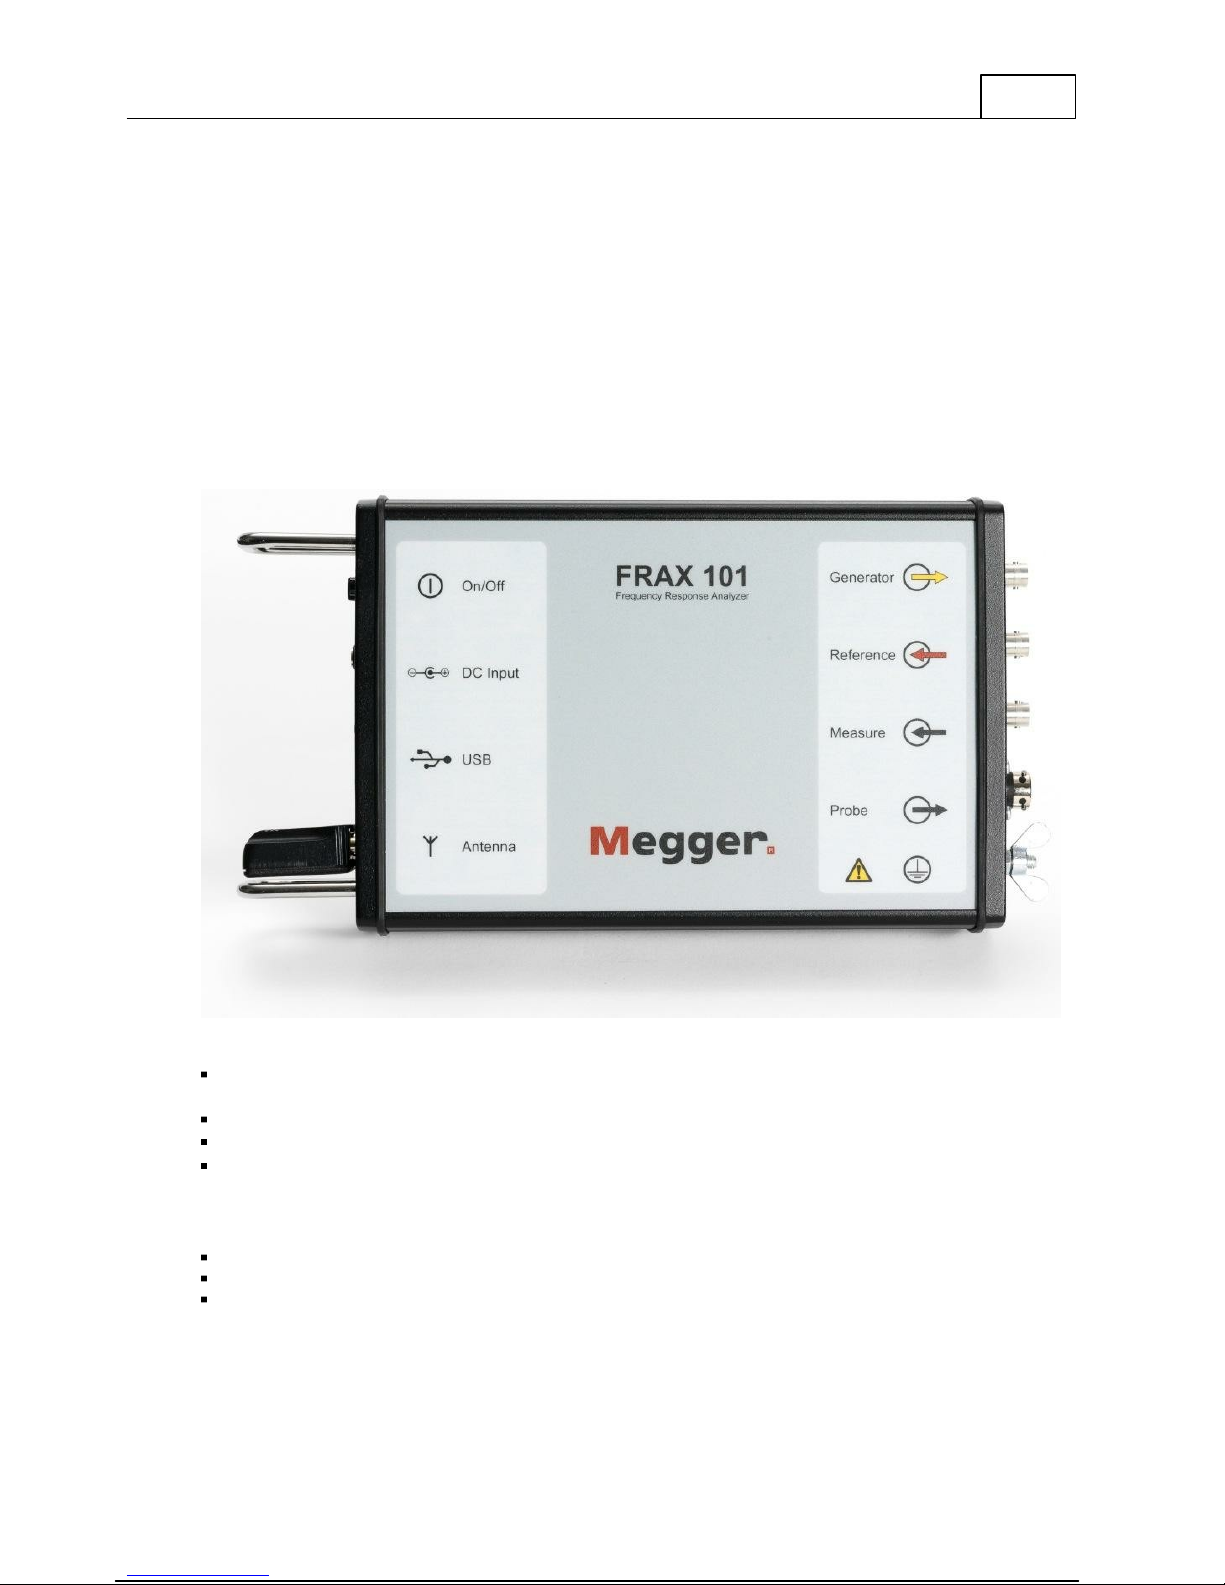
4
Protective Earth/Ground
symbol and Protective
Earth/Ground connector
Always connect the instrument to station earth/ground using
the separate earth/ground cable. The separate earth/ground
wire should be the first connection made and the last
removed.
Probe
Connector for active probes. Optional and available on order.
Caution, risk of danger
symbol
Refers to follow instructions stated in User's Manual to ensure
safety. See Safety First.
Left-hand side, top down:
Informative text
Serial number
Right-hand side, top
down:
DC input
DC-input, to connect the double insulated AC/DC adapter.
DC symbol. Polarity Symbol.
CE-mark
Megger guarantee that this product complies with relevant
CE directives and corresponding standards.
Calibration date
FRAX User's Manual
1.3.1.2
Rear Panel
Page 9
1.3.2 FRAX-150
Left-hand side, top down:
USB:
USB-connectors
Network:
For connecting the FRAX-150 to LAN
Serial port:
For serial communication.
Right-hand side, top
down:
Protective Earth/Ground
connector
Always connect the instrument to station earth/ground using
the separate earth/ground cable. The separate earth/ground
wire should be the first connection made and the last
removed.
Power connector
Generator (Yellow):
Generator output connected to Reference at Red Clip
Reference (Red):
Reference input connected to Generator at Red Clip
Measure (Black):
Measure input Connected to Black Clip
Tab
Backspace (or with shift) Delete
Shift key
FRAX
5
Below the screen is a standard qwerty keyboard containing some special keys.
On the right of the screen are some function buttons. They are
Page 10
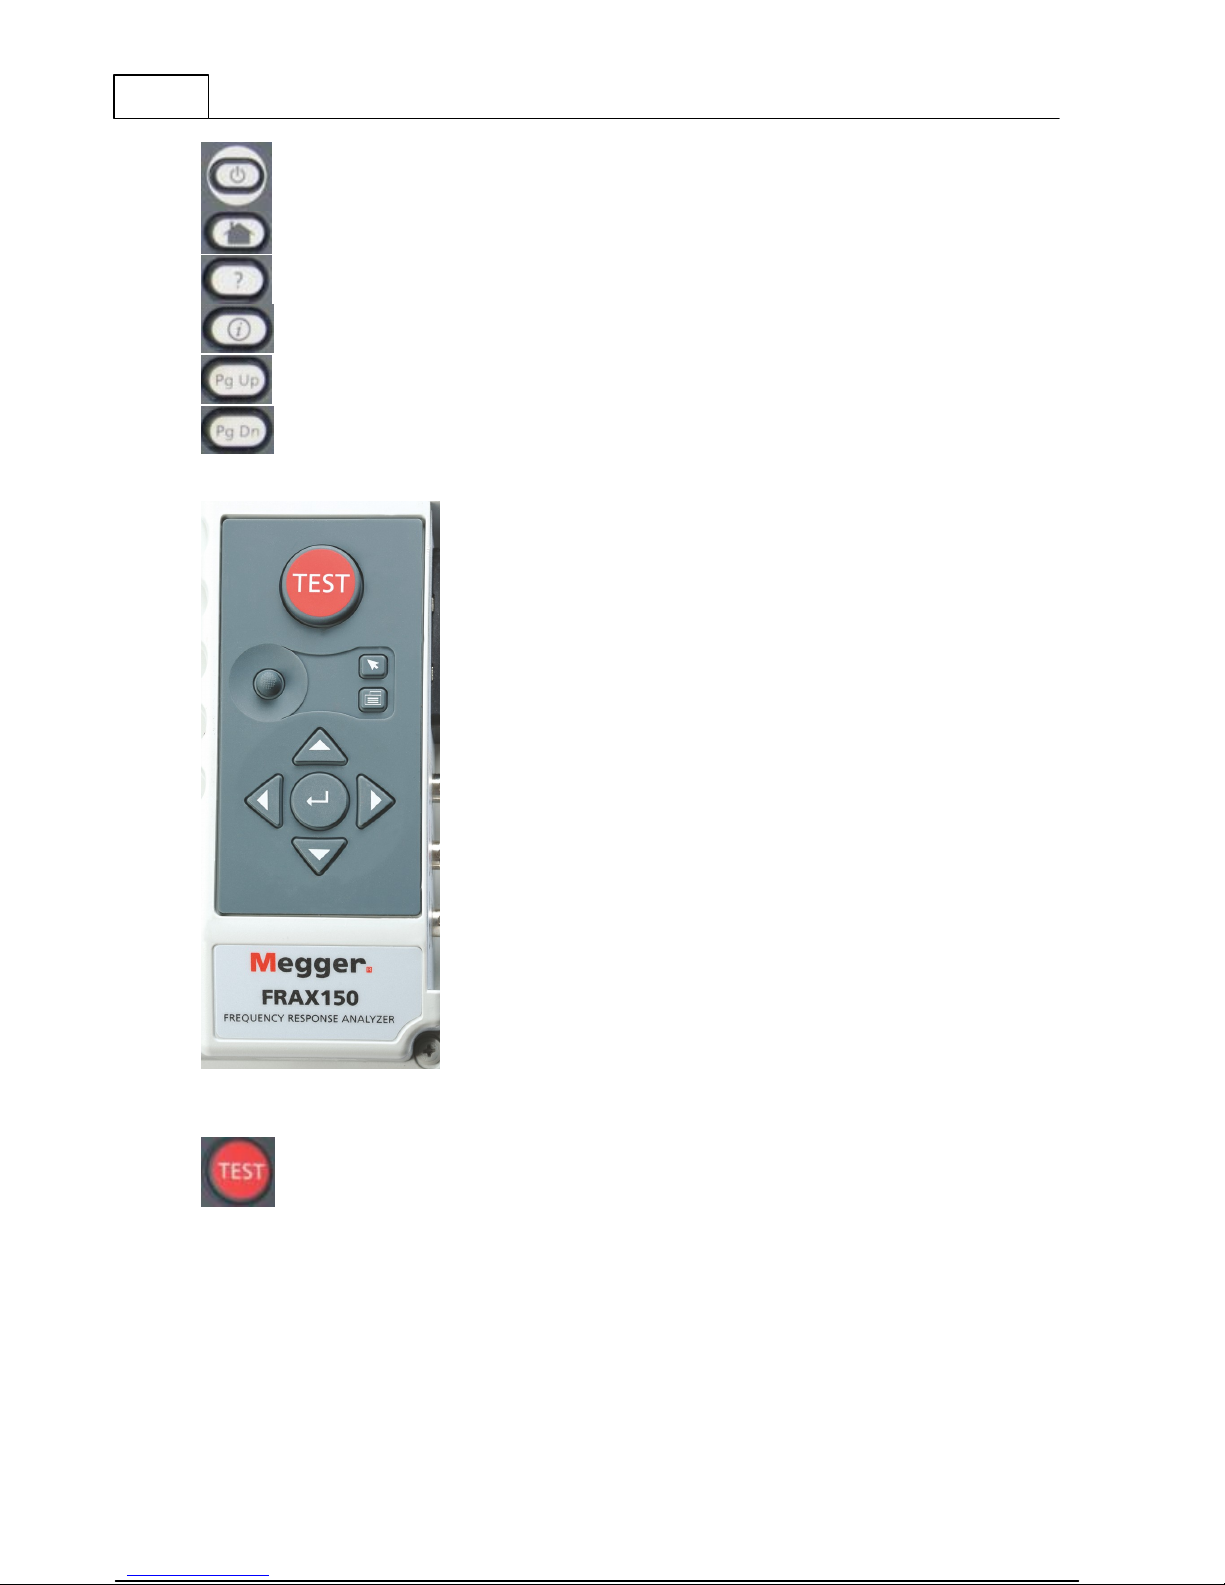
6
Power down. Shuts down the FRAX-150 computer.
Home (not used)
Help
Information (not used)
Page Up
Page Down
FRAX User's Manual
On the right you will find the navigation panel.
In the middle of the navigation panel you will find the controls for the pointer and buttons
for left (top) and right click (bottom). The navigation panel also contains:
Test button. Press this to start a new test or measurement. This button has the
same functionality as the "Start" button on the FRAX-150 screen.
Page 11
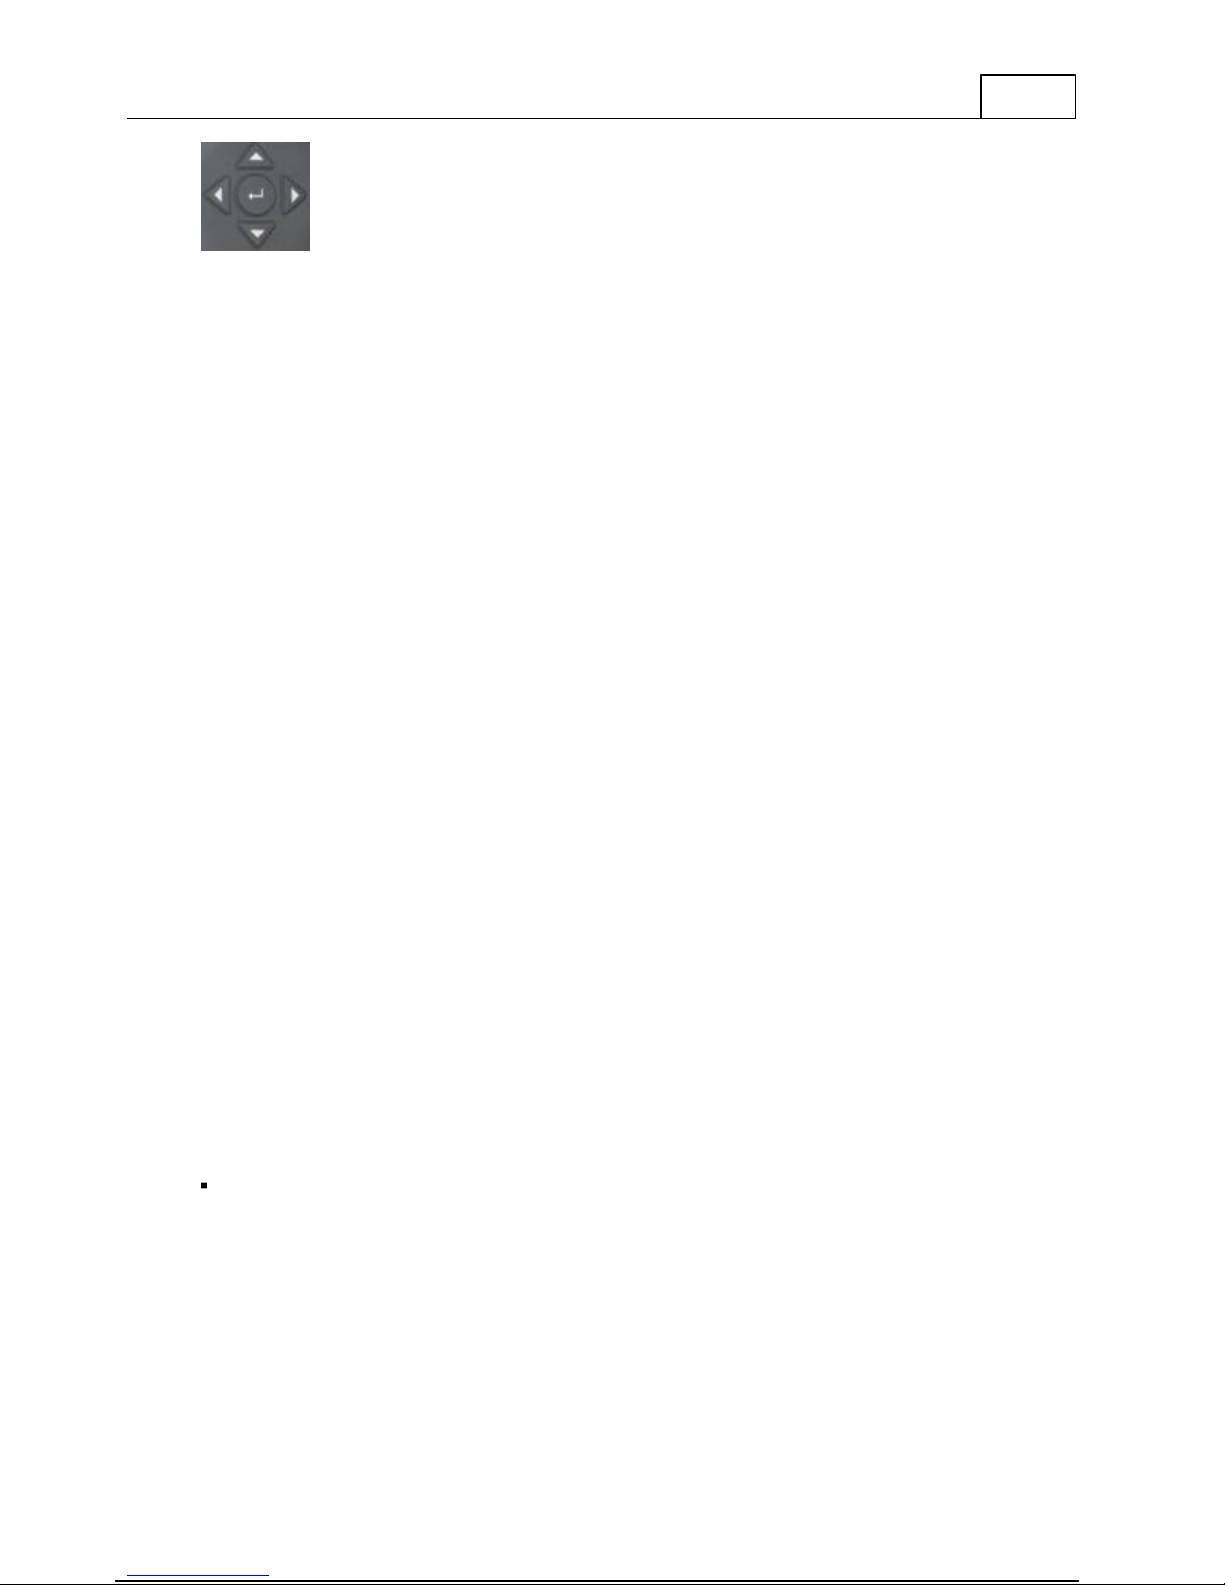
Arrow buttons and center Enter button
Power Class
Max Output
Power
Expected Range
Class 1
100 mW
100m / 330 feet
Class 2
2.5 mW
10 m / 33 feet
Class 3
1 mW
1m /3.3 feet
There is a momentary pushbutton switch on the back of the unit that is required for firmware
updates only.
1.4 Bluetooth Communication (only FRAX-101)
Bluetooth is a standard for wireless serial communication. Simply speaking, Bluetooth
replaces a serial cable between your laptop and the FRAX instrument.
The output power of Bluetooth modules are divided into three classes:
The Bluetooth module used in FRAX-101 is class 1. Also, the Bluetooth USB Adapter that
comes as a standard accessory with FRAX is class 1. Using this adapter communicating with
FRAX, you will get class 1 communication.
FRAX
7
Many laptops of today has in-built Bluetooth capability, most common is class 2. Since the
Bluetooth module used in FRAX-101 has excellent receiving properties, a built-in Bluetooth
device may be suitable in many situations. However in field/substation environments
Bluetooth class 1 is recommended.
To configure a built-in Bluetooth device, please follow the manufacturers instruction. To
configure the Bluetooth USB Adapter that comes with the FRAX, install the included
Bluetooth software
Note,
it is reported that in some cases an activated built-in Bluetooth and using an external
USB Bluetooth Adapter can create some conflicts in Windows. If this happens, uninstall both
adapters and reinstall only the one you plan to use.
First time you communicate with FRAX via Bluetooth, you need to establish your Bluetooth
communication before attempting to connect the FRAX Software to the FRAX instrument.
The following steps show how to add a connection between the FRAX instrument and the
computer using the Anycom USB-250 Bluetooth USB Adapter. Please note that the procedure
is managed by your operating system directly. Thus, the procedure necessary on your
computer may differ from the following steps, and it should be regarded as an example.
Start the My Bluetooth Places application and click on "Add Bluetooth Device"
befo re
you insert the adapter into the USB-port.
Page 12
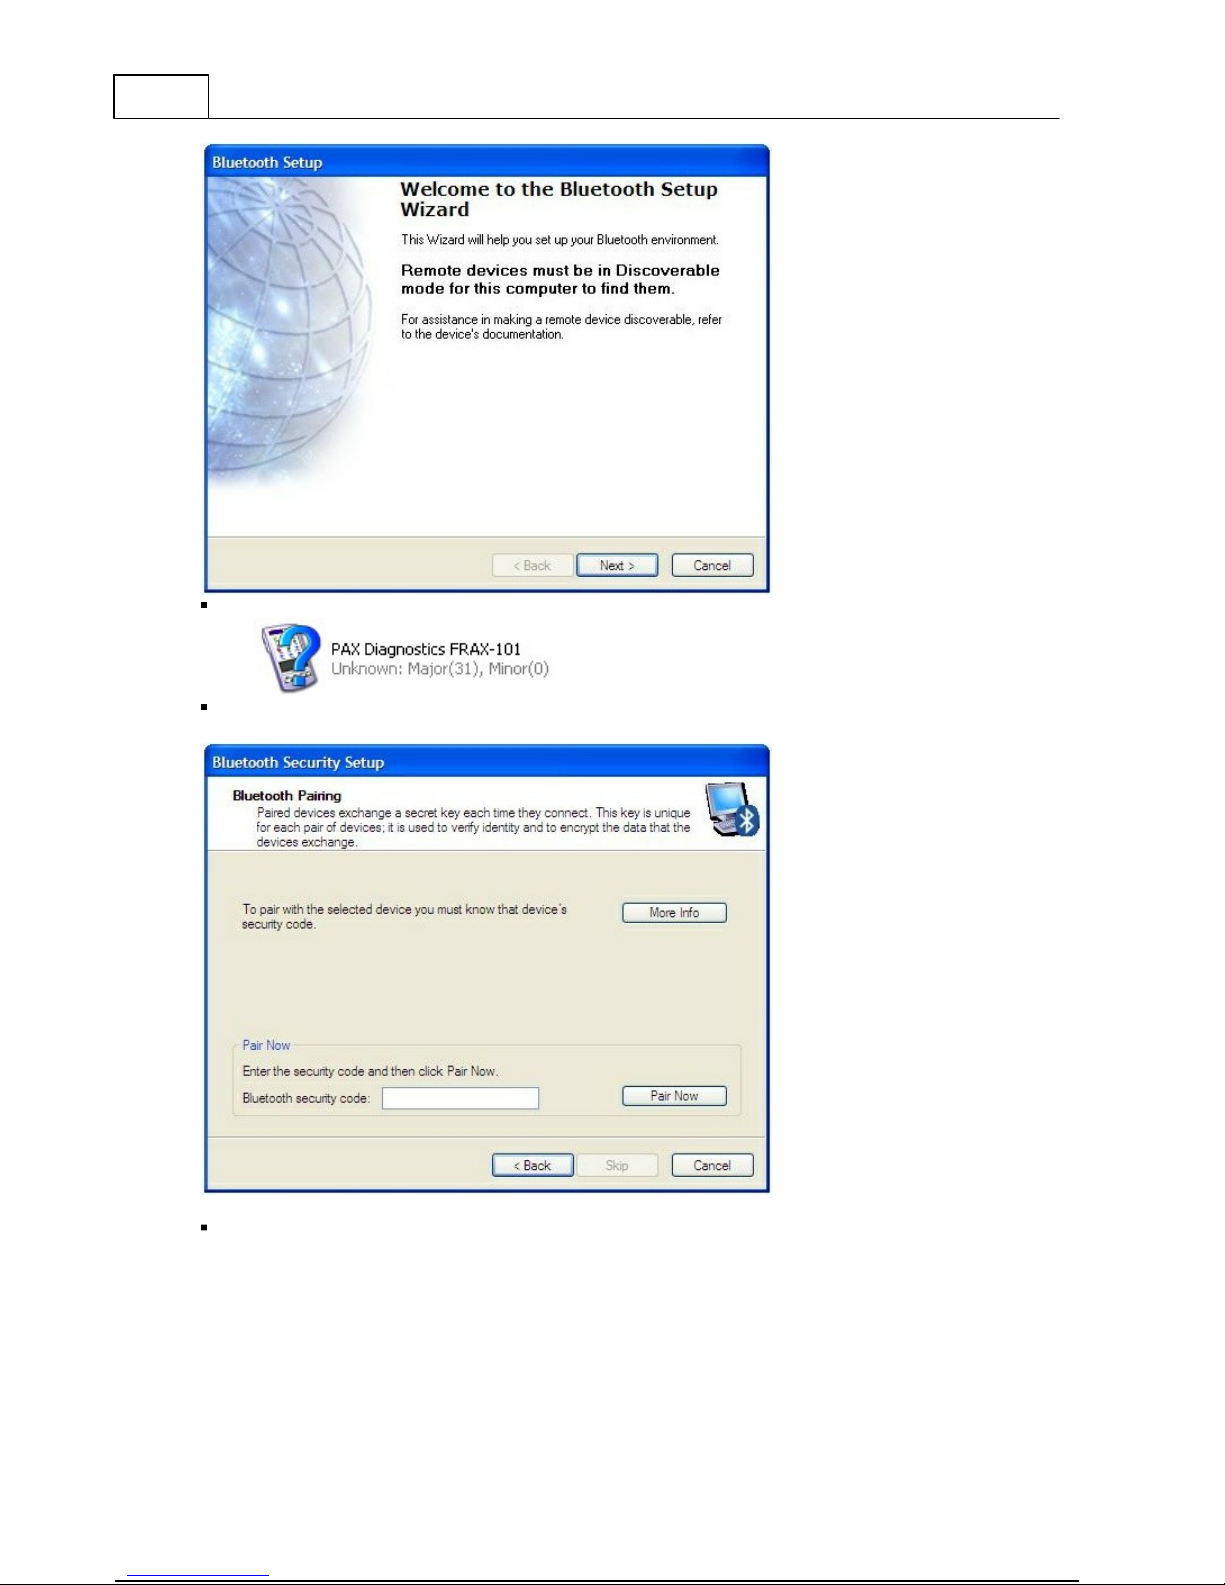
8
FRAX User's Manual
Add the device called "PAX Diagnostics".
A pass code is needed. Enter the code "0000" (four zeroes) as the pass code.
Select the PAX Diagnostics device.
Page 13
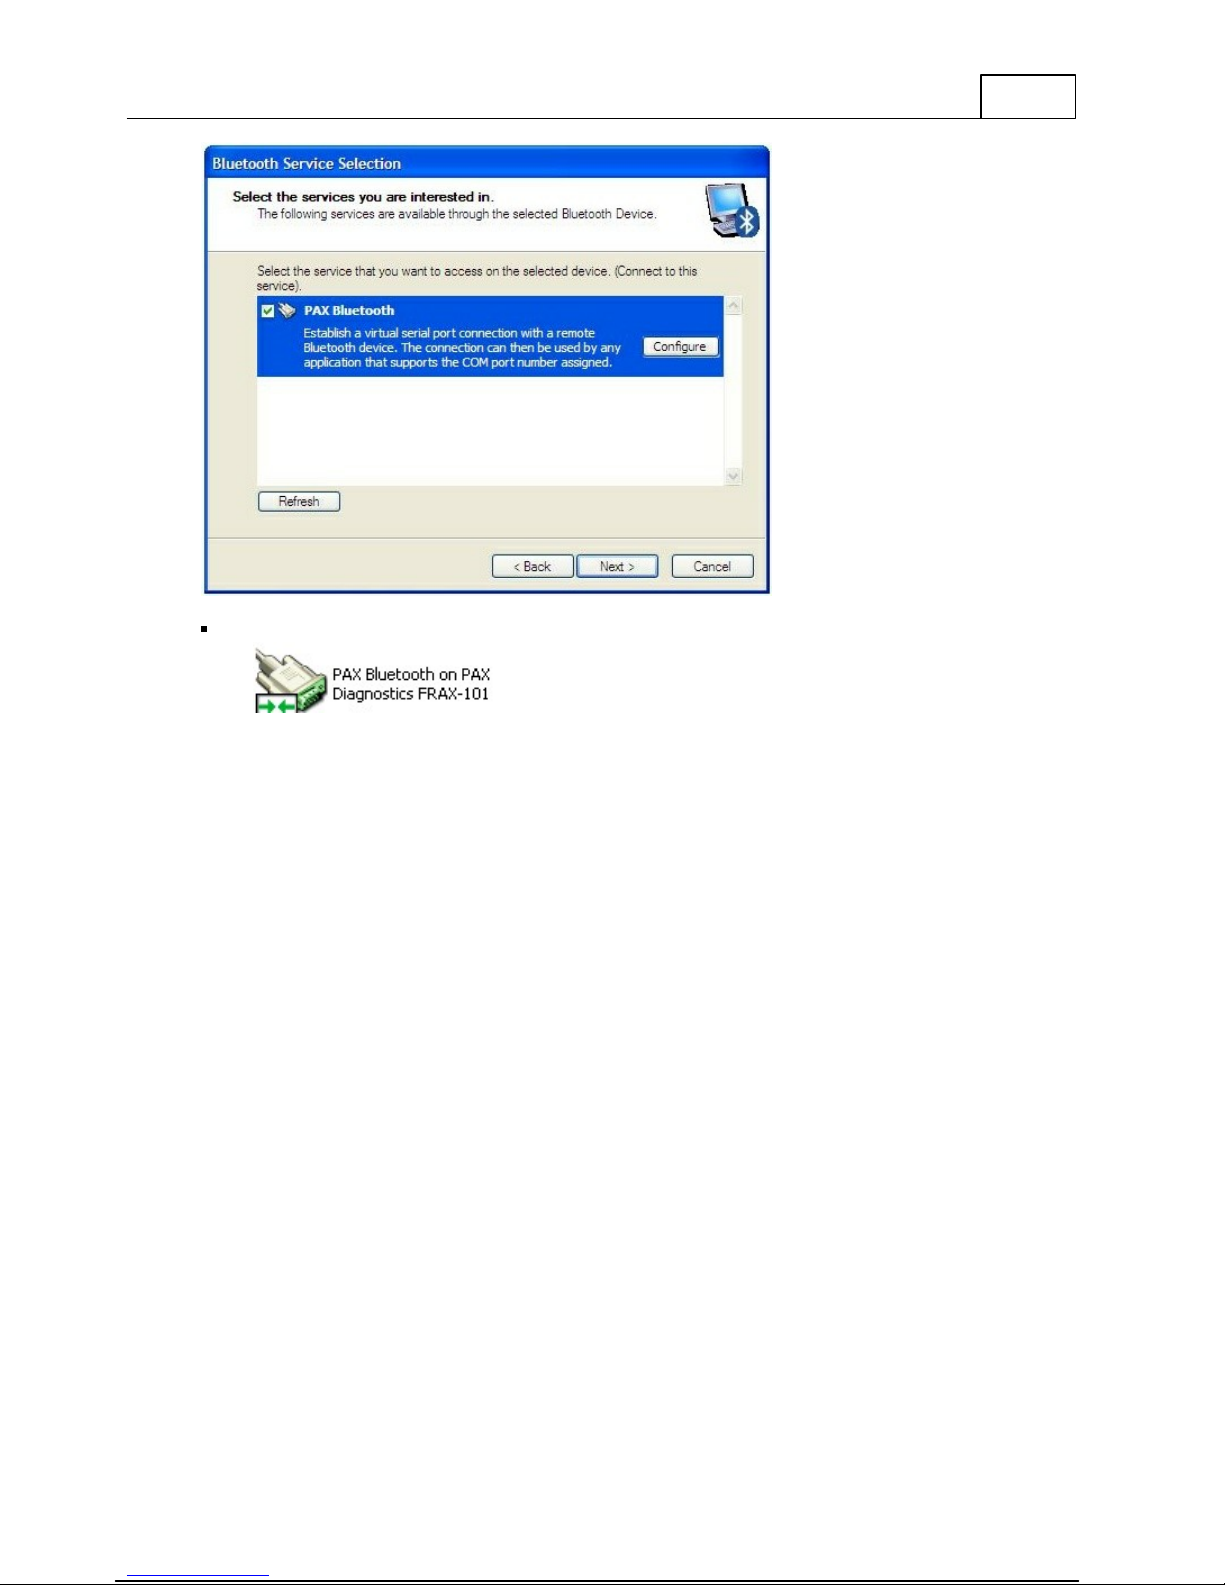
Make sure that it is registered as a serial connection.
FRAX
9
You can now connect to your FRAX unit from the FRAX software.
Observe that the procedure described above only needs to be done once. Next time you start
the computer simply insert the USB adapter using same USB port or use built-in Bluetooth.
Important! If you install the external USB dongle in a different USB port on your computer,
you may get a different serial COM port assigned to that USB port. Either connect to your
other USB port or change the COM port in the FRAX communication setting. Then start FRAX
software and press connect.
1.5 Built-in Battery Pack and Charger
As an option, FRAX-101 is delivered with a built-in battery pack and charger. The battery is of
Li-Ion type, 4.8Ah, 11.1V. The charger is powered from the standard AC/DC adapter that is
delivered with the instrument.
FRAX-101 automatically enters low power consumption mode when waiting for a
measurement and because a typical sweep takes approximately 1 minute, the battery lasts for
at least 3 hours of measuring or more than 12 hours idle.
Charging is performed automatically when the AC/DC adapter is connected. The FRAX-101
does not have to be turned on. To ensure long battery life, batteries will not be charged if the
battery charge is higher than 90% or if the temperature is above 40C. A complete charge
takes approximately 8 hours.
The blue LED gives indication of charging status:
Page 14
10
LED not lit:
FRAX turned off, or FRAX is switched on, battery empty.
LED
blinking:
Charging
LED lit:
IFRAX connected to AC/DC adapter, Battery is fully charged (or charging
disabled of other reason see above)
LED lit:
FRAX runs on batteries (AC/DC adapter not connected)
FRAX User's Manual
1.6 Sweep Frequency Response
The FRAX "Generator" (Gen.) generates a sinusoidal voltage at a selected frequency and
measures the input voltages, amplitude and phase, on two input channels "Reference" (Ref.)
and "Measure" (Meas.). The instrument stores "Amplitude" and "Phase" data for both
"Reference" channel and "Measure" channel as well as the ratio "Measure" divided by
"Reference". The values can be plotted and exported as Magnitude, Phase, Impedance,
Impedance-Phase, Admittance and more. The Custom models function make it possible to
calculate almost any parameter based on the measured/stored data.
FRAX uses the sine correlation technique. This means that the input voltages are multiplied by
a sine and a cosine, and then averaged over an integer multiple of the interval of time. The
sine, cosine and the voltage applied have exactly the same frequency. The sine correlation
technique is well known and is suitable for Sweep Frequency Response Analysis (SFRA)
measurements. Since the signals on the two input channels are treated the same way, the
phase resolution between these two channels is very high. The rejection of DC offset and
harmonics - referred to as the applied voltage - are in theory infinite. By increasing the
integration cycles, the rejection gradually improves.
The IF Bandwidth is commonly used as a parameter defining the bandwidth around the
applied signal analyzed. An IF bandwidth of 10% of active frequency is equivalent to 12
cycles of integration.
Page 15
1.7 Calibration
The instrument is calibrated before leaving the factory. The recommended calibration interval
is one (1) year. The instrument can be calibrated by Megger or any calibration institute that
follows the calibration instruction given in Appendix A, Calibration Instructions.
1.8 Disposal
FRAX and its accessories are all manufactured after August 12, 2005. Megger is responsible for
the disposal of old FRAX units. The FRAX unit can be sent back to Megger for disposal at any
time at no additional charge.
FRAX
11
2
Quick Start Tutorial
This tutorial provides an introduction on how to use FRAX and FRAX software. They are
intentionally kept brief so that you can start using the instrument and software as quickly as
possible. The objective is not to teach you every single detail but to familiarize you with the
basic principles.
The quick start tutorial is divided into the following sections:
Safety First
Preparatory Procedures
Start Up FRAX and Establish Communication
Create a New File
Test Lead Connection
Start Measurement
View Data
Export data
2.1 Saftey First
FRAX is a Sweep Frequency Response Analyzer designed for measuring power transformers in
the field and at manufacturing sites.
Always follow local safety regulations.
Make certain that all personnel who work with FRAX instrument have been trained in its
use and that all applicable safety precautions are taken.
Always connect the instrument to protective earth/ground using the separate earth/ground
cable. The earth/ground cable should be the first connection made and the last removed.
Page 16
12
FRAX User's Manual
Do not use any accessories that are not intended to use with the FRAX.
Refer all servicing to qualified personnel.
2.2 Preparatory Procedures
Always follow local safety regulations!
The transformer must be disconnected from the net, which means that any connection to
the transformer bushings including neutral(s) must be disconnected.
The transformer tank must be properly grounded.
If the transformer is equipped with a Load Tap Changer (LTC), the position of the LTC will
influence the FRA measurement. The recommendation is to put the LTC in the position to
include all tap windings in circuit ("Extreme Raise" position), and note that this LTC
position is used. If making measurements at several tap positions, make sure to note each
tap position.
If the transformer is equipped with a De-Energized Tap Changer (DETC), the position of the
DETC will influence the FRA measurement. The recommendation is to leave it at the
nominal tap position unless otherwise specified. Make sure to note the DETC position in the
Nameplate section of the software.
1. Connect the FRAX instrument to station earth/ground near the power transformer to be
measured using the separate earth/ground wire (at bottom of transformer if instrument is
operated beside the transformer, at another good connection to transformer at top of
transformer if instrument is used on top of transformer). The separate earth/ground wire
should be the first connection made and the last removed.
2. Connect the test lead BNC connectors to the FRAX instrument, Generator (yellow),
Reference (red) and Measure (black).
3. Connect the AC/DC Adapter to the FRAX and a power source that meets local safety
regulations
4. If not using Bluetooth communication, connect the USB cable to the FRAX and your
computer.
5. Turn on the FRAX.
6. Start FRAX-software on your PC and establish communication, see Establish Communication
.
and
the AC/DC Adapter specifications or use optional in-built battery supply.
2.3 Start Up FRAX and Establish Communication
If using Bluetooth communication:
Establish Bluetooth communication, see also detailed description Bluetooth Wireless
Communication. Usually you will be assigned a serial port number, e.g. 8 that should be
used when FRAX establish connection. Note that FRAX Software remembers the last used
port.
If using USB communication:
connect the USB cable to the computer and to the FRAX.
the computer should display a message that it found new hardware
Start up the FRAX Software and establish communication
Start up FRAX Software
"Connect" by select Connect in under menu File, by clicking the Connect-button on the
right hand side of window or use the F7-key. If connections are set-up properly the window
name will change from "FRAX (Disconnected)" to FRAX (Connected). If the connection
Page 17
Quick Start Tutorial
Quick Test
Makes a single sweep test with the Sweep label of your choice
Multiple Sweeps
Makes it possible to select a pre-defined test template or design
"Sweep groups"
Use Measurement as
Template
Makes it possible to use an earlier measurement as template for a new
measurement
doesn't work, you will get an error message suggesting what to do, normally selecting the
suggested port number with a green symbol next to it.
13
2.4 Create a New Test
A test starts by creating a sequence of sweeps and decide where to save data by use of "New
Test".
Use the command "New Test" from the File menu or use of Ctrl+N or use of the button
"New Test".
The "Measurement type" window will appear. In "Measurement type" window, select the tab
of your choice:
If you select the "Multiple Sweeps" tab you will be given a choice of different pre-defined
templates for different transformer designs. Select Sweeps that you want to make and press
OK. Note that you can always add new sets of sweeps with different names.
If you selected "Quick Test" or "Multiple Sweeps" in the "Measurement type" dialog, an
almost empty nameplate will appear. The "Test date:" is automatically added from your PC
system date. Please fill in the Nameplate data (no field is required) and press "OK". The
selected measurement sweeps are visible in the in the Test Browser.
Page 18
14
FRAX User's Manual
If the "Measurement type" "Use Measurement as Template" is used the Nameplate contains
the Template Nameplate as default, except the "Test Date" that is automatically added from
your PC system.
After enter Nameplate information and press "OK". A "Save As.." dialog where you can select
the file structure and a name of your choice . The default directory will be
first start and then the directory you used last time. The file name will be formatted as
selected in default filename settings. Click Save to save the file.
Note that you can always add information to the "Nameplate" at any time. This feature
makes it possible to add notes during the measurement.
Fore more details see New Test in chapter FRAX Software, File menu.
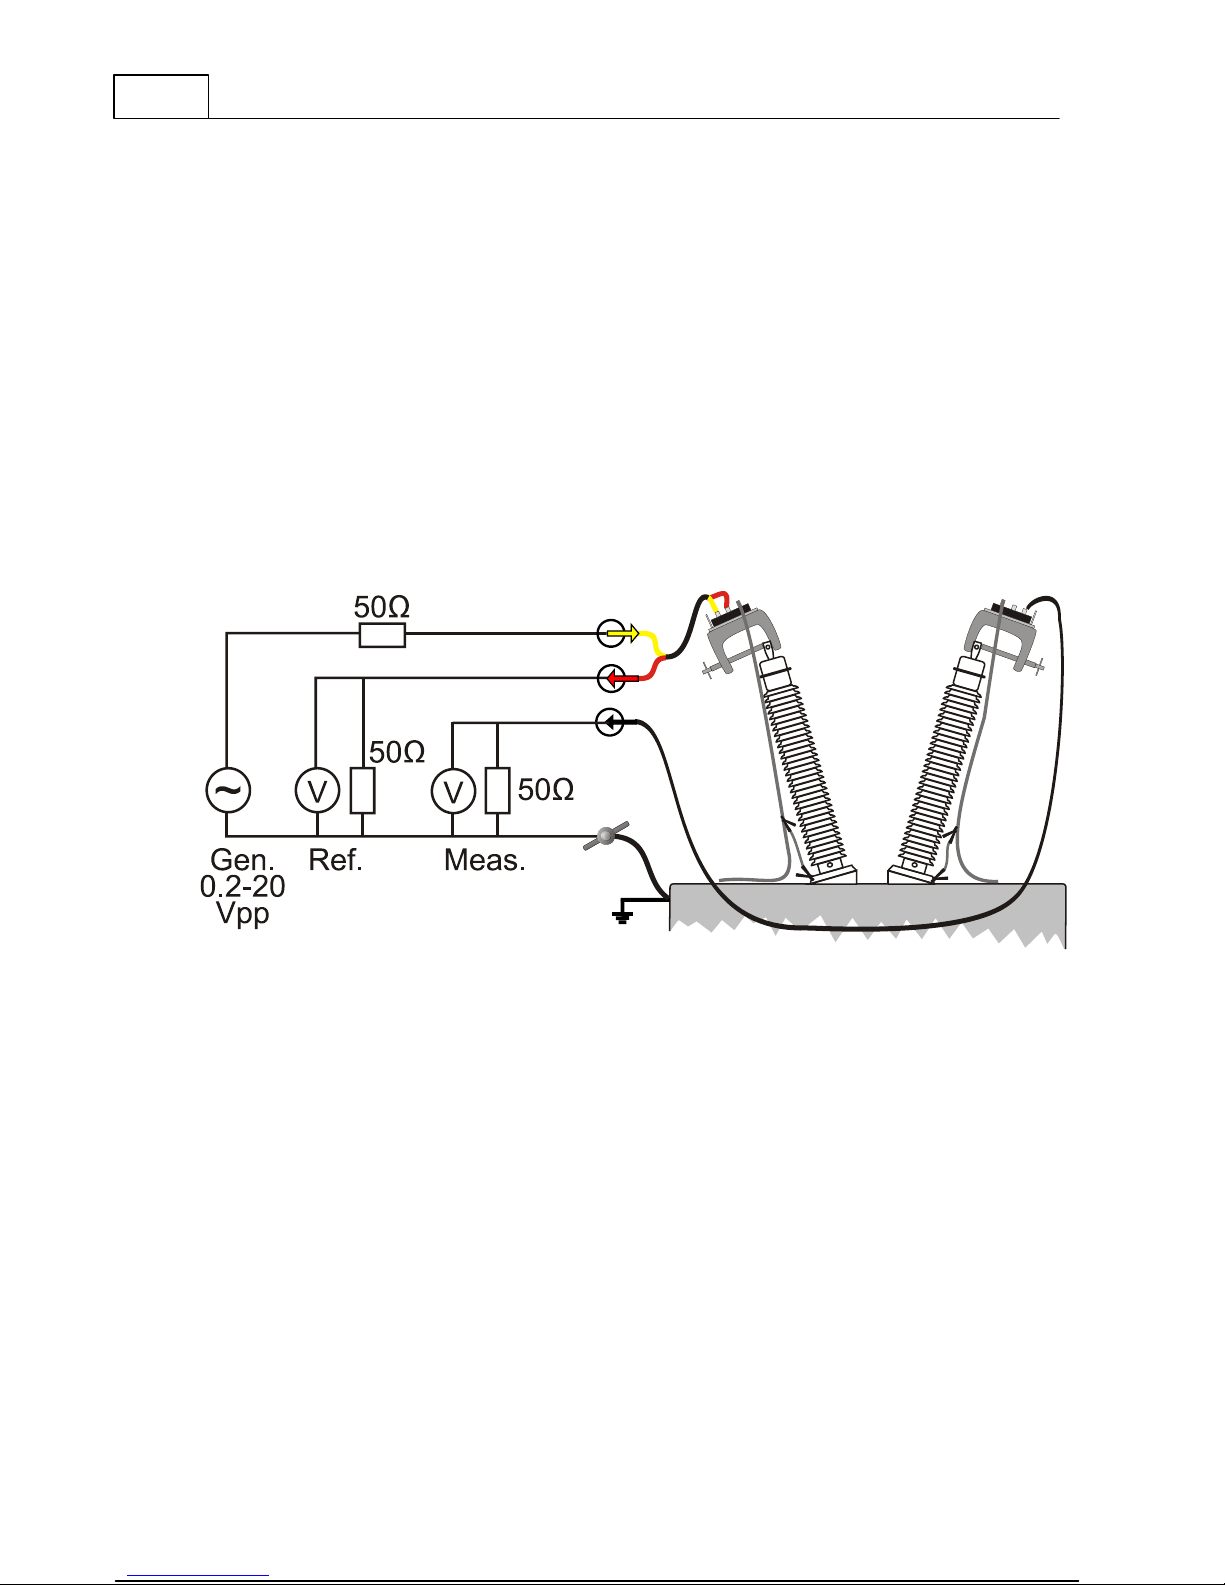
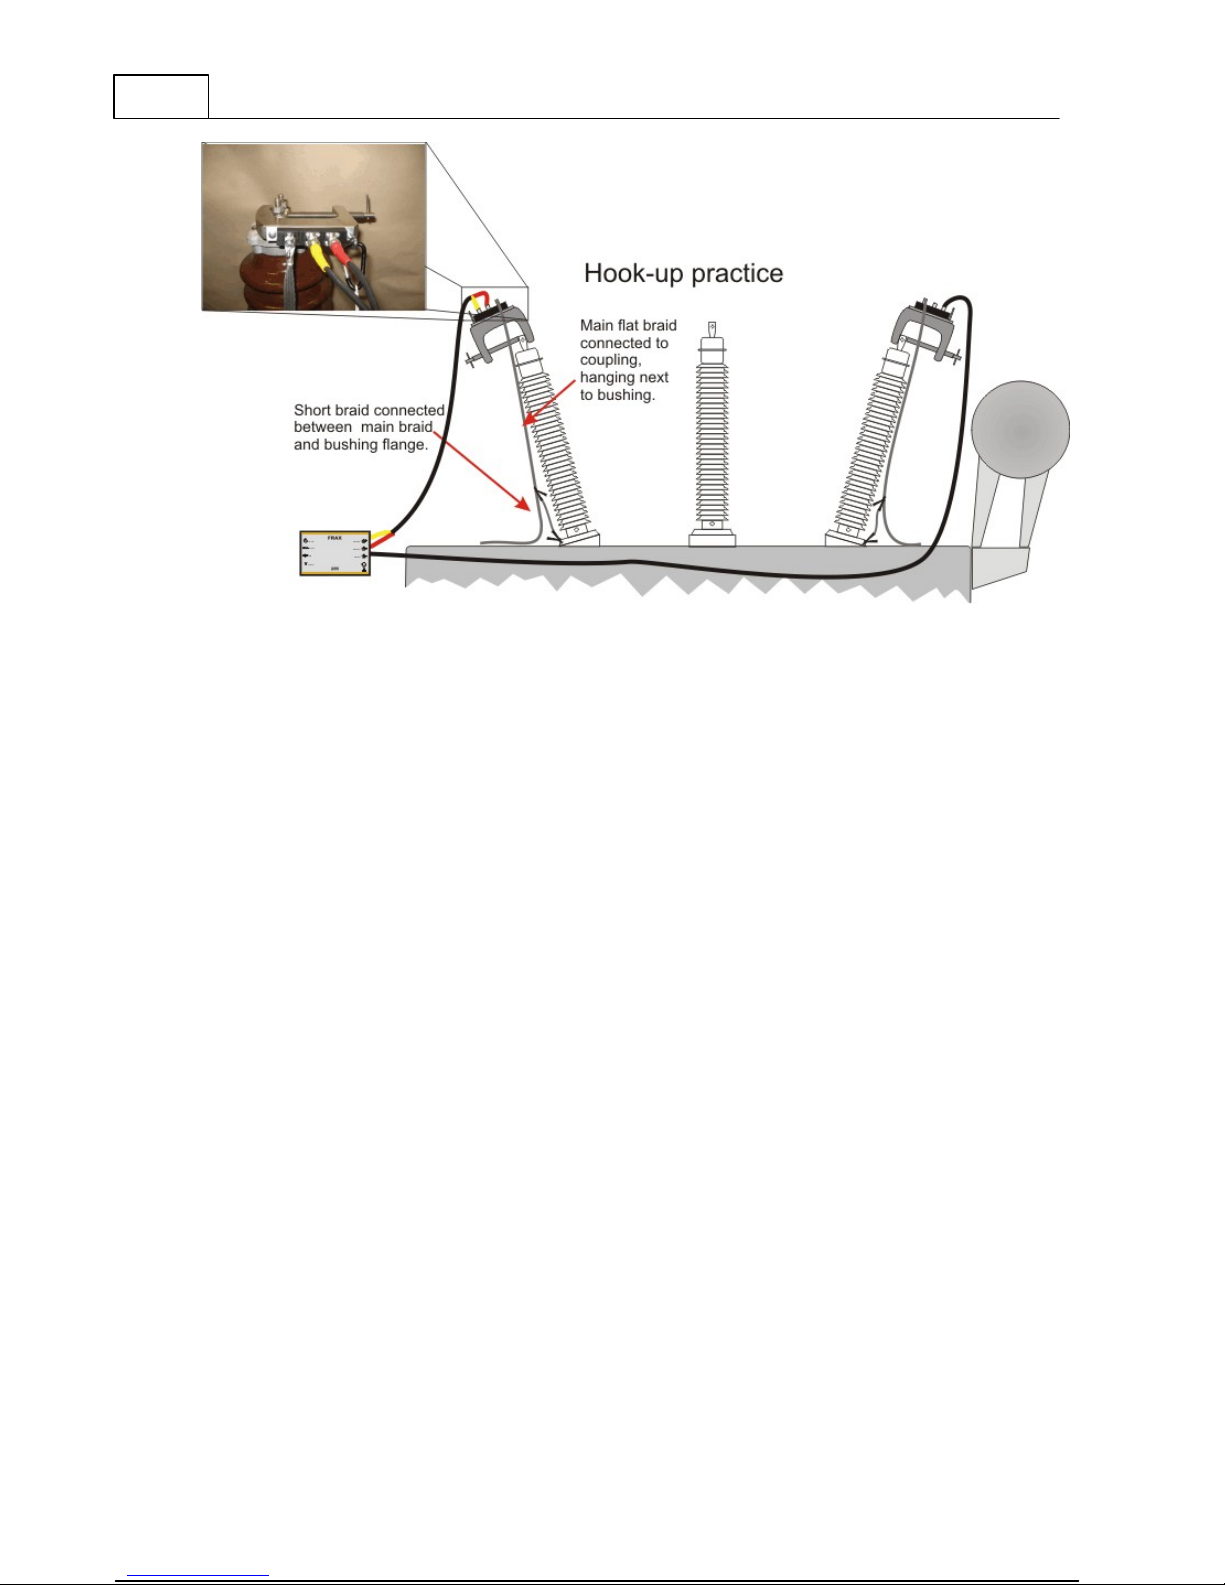
2.5 Test Lead Connection
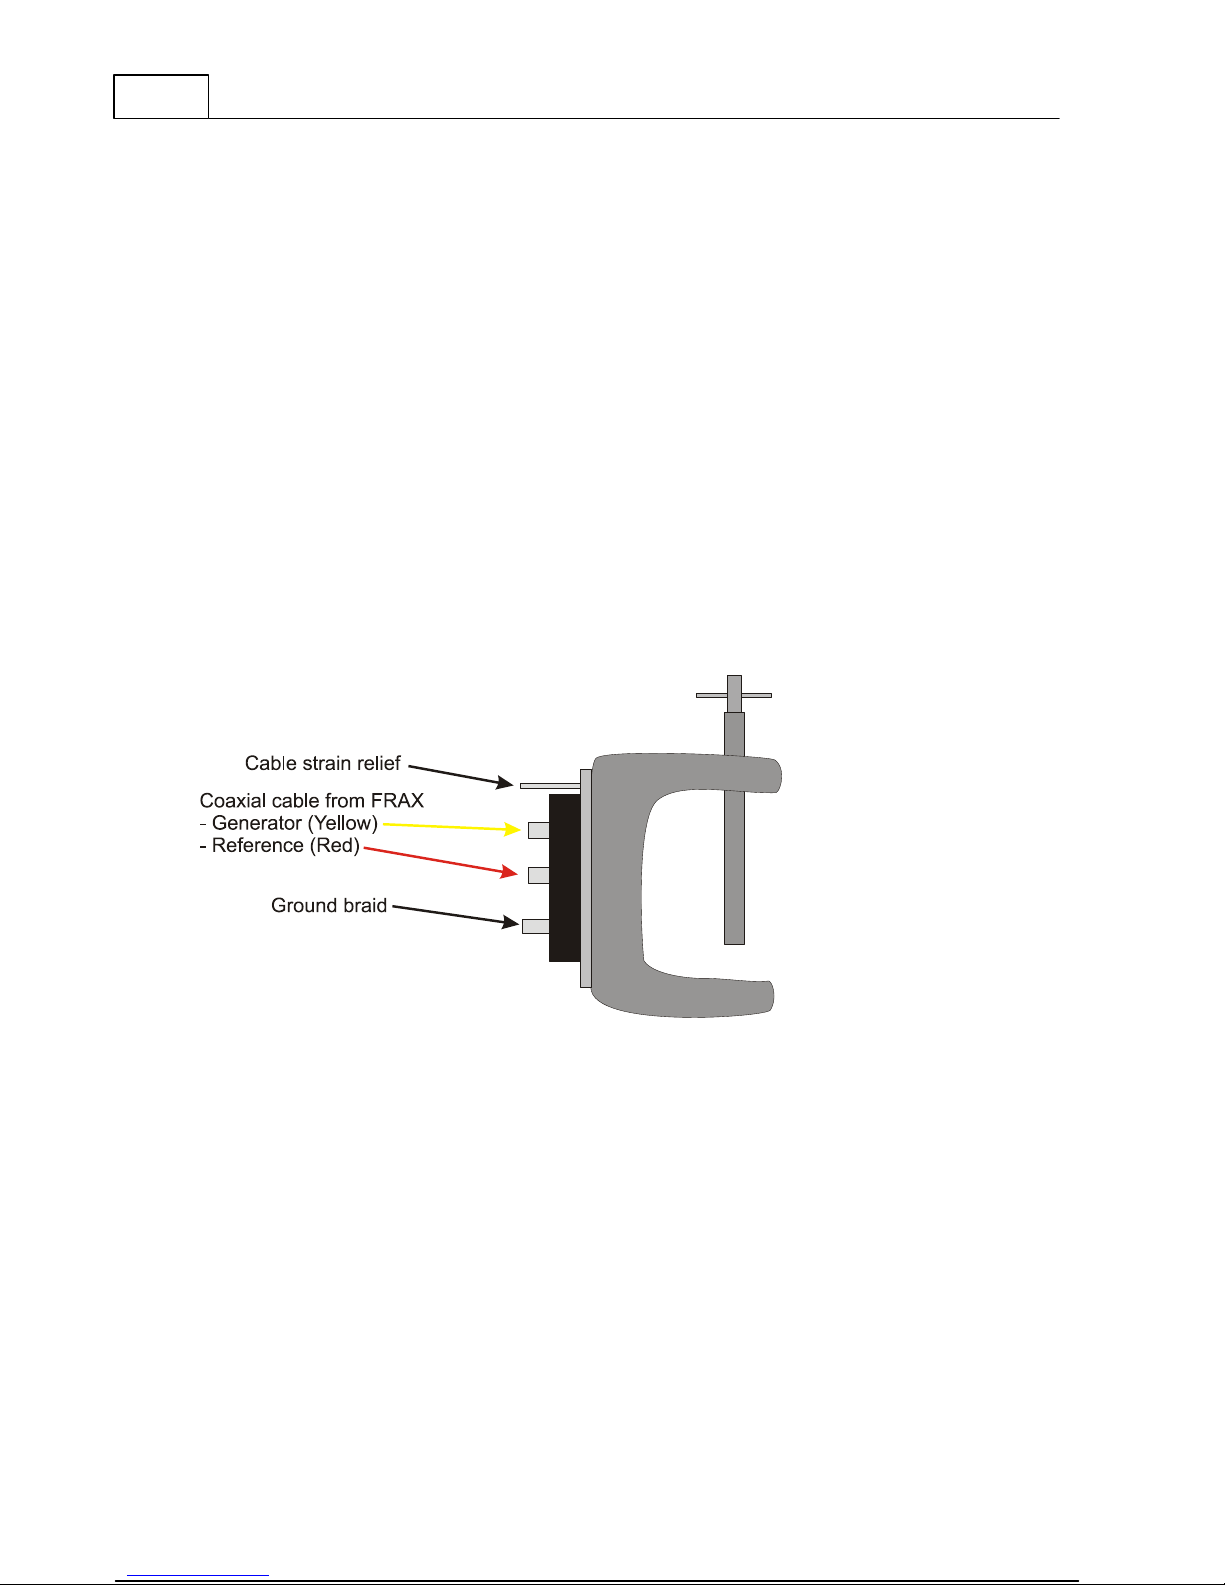
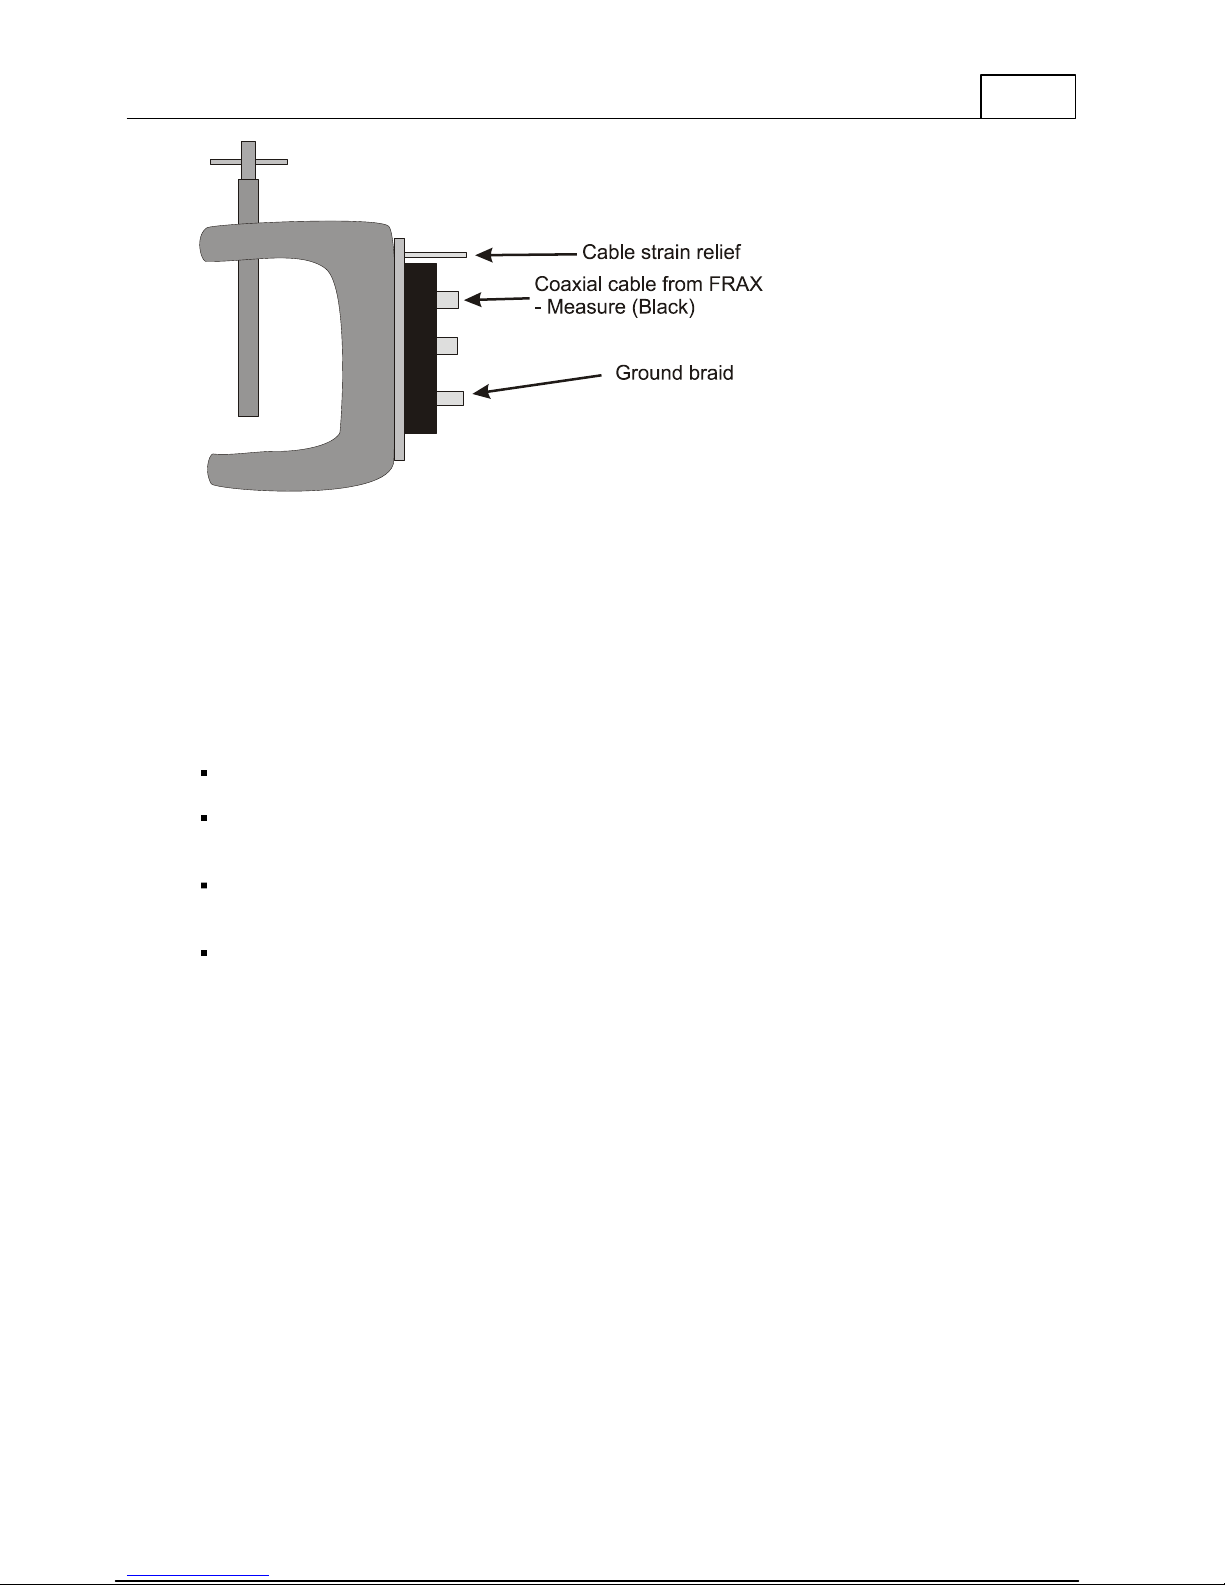
The new innovative FRAX clamp helps the user to connect and achieve repeatable test results
in the simplest way possible. It handles both round and flat connectors and is easy to attach
to any bushing. The firm grip allows heavy cables and accessories to be mounted near the
bushing without any risk of the clamp falling off. The new clamp offers all necessary
connectors (BNC, ground braid, cable strain relief) in one clamp. See Appendix E: FRAX cables
and clamps.
My Docum ents
on
Page 19
Quick Start Tutorial
15
Make sure to follow local safety regulations! Local safety regulations most certainly prescribe
all bushing connections to be earthed/grounded when working on the transformer e.g.
connecting the FRAX test leads. The ground braid shall go from the top clamp the shortest
way to the bottom of the bushing. Good ground connection is essential.
Important! The test connection polarity is important since reversed polarity will produce
different results. The user has to establish a polarity convention. In this software it is assumed,
and recommended, that H1-H0 imply the red/yellow connectors (source and reference) is
connected to H1 and the black (measure) is connected to H0.
Connect FRAX test leads:
Make sure to remove paint and or rust from the nuts or bolts used on the flange for proper
measurement ground connections.
Connect the red and yellow (source and reference) to the clamp at the top of a bushing and
corresponding ground braid to the base of bushing. Make sure that the braid do not touch
any conducting part at top of bushing.
Connect the black (measure) lead to the clamp at the top of the other bushing and the
corresponding ground braid to the base of bushing. Make sure that the braid do not touch
any conducting part at top of bushing.
Following local safety regulations, remove possible ground connections from top of the
bushings.
Using an easy repeatable cable setup is crucial to ensure reliable FRA results.
Page 20
16
FRAX User's Manual
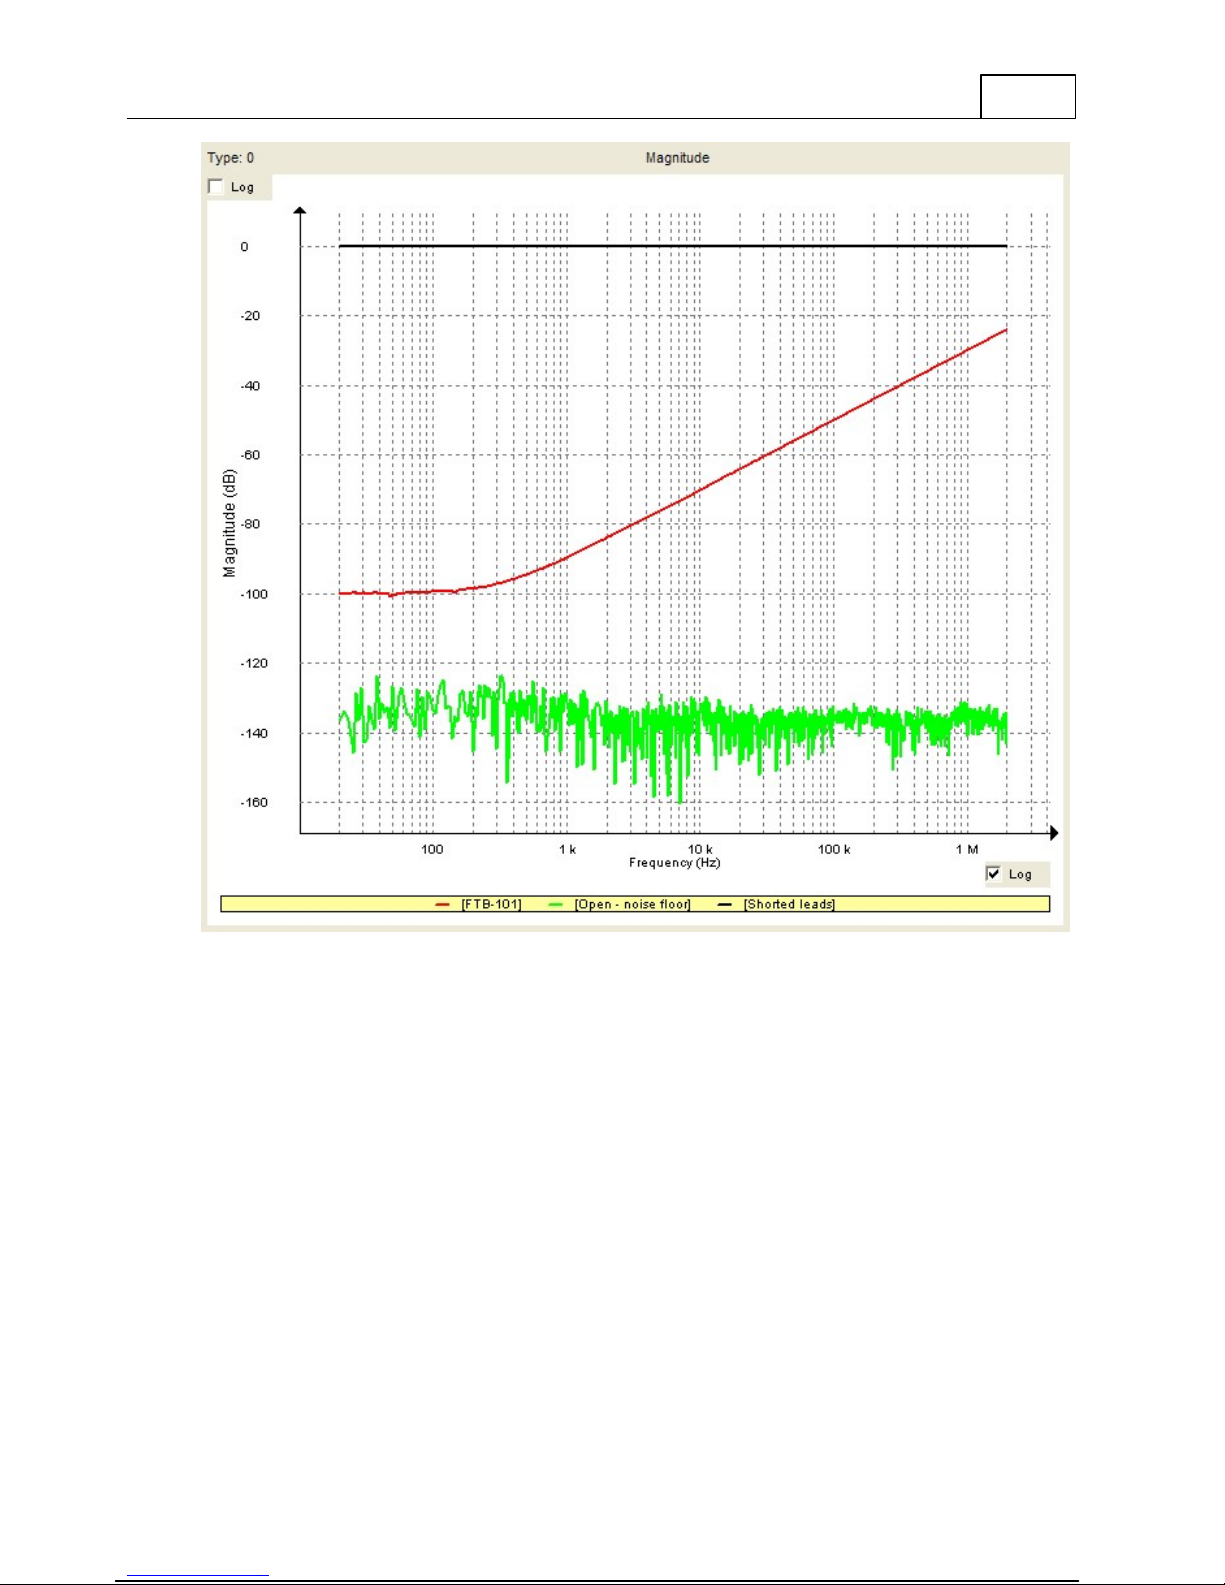
2.6 Test System Verification
Test leads should be checked for continuity and integrity before use. The best means for
checking lead integrity and correct operation of the equipment is to perform the FRA selfcheck using a standard test object. This check is especially valuable for checking FRA test
equipment, since there is generally no intuitive way of knowing if the test equipment is
giving correct results when making field measurements.
Page 21
Quick Start Tutorial
17
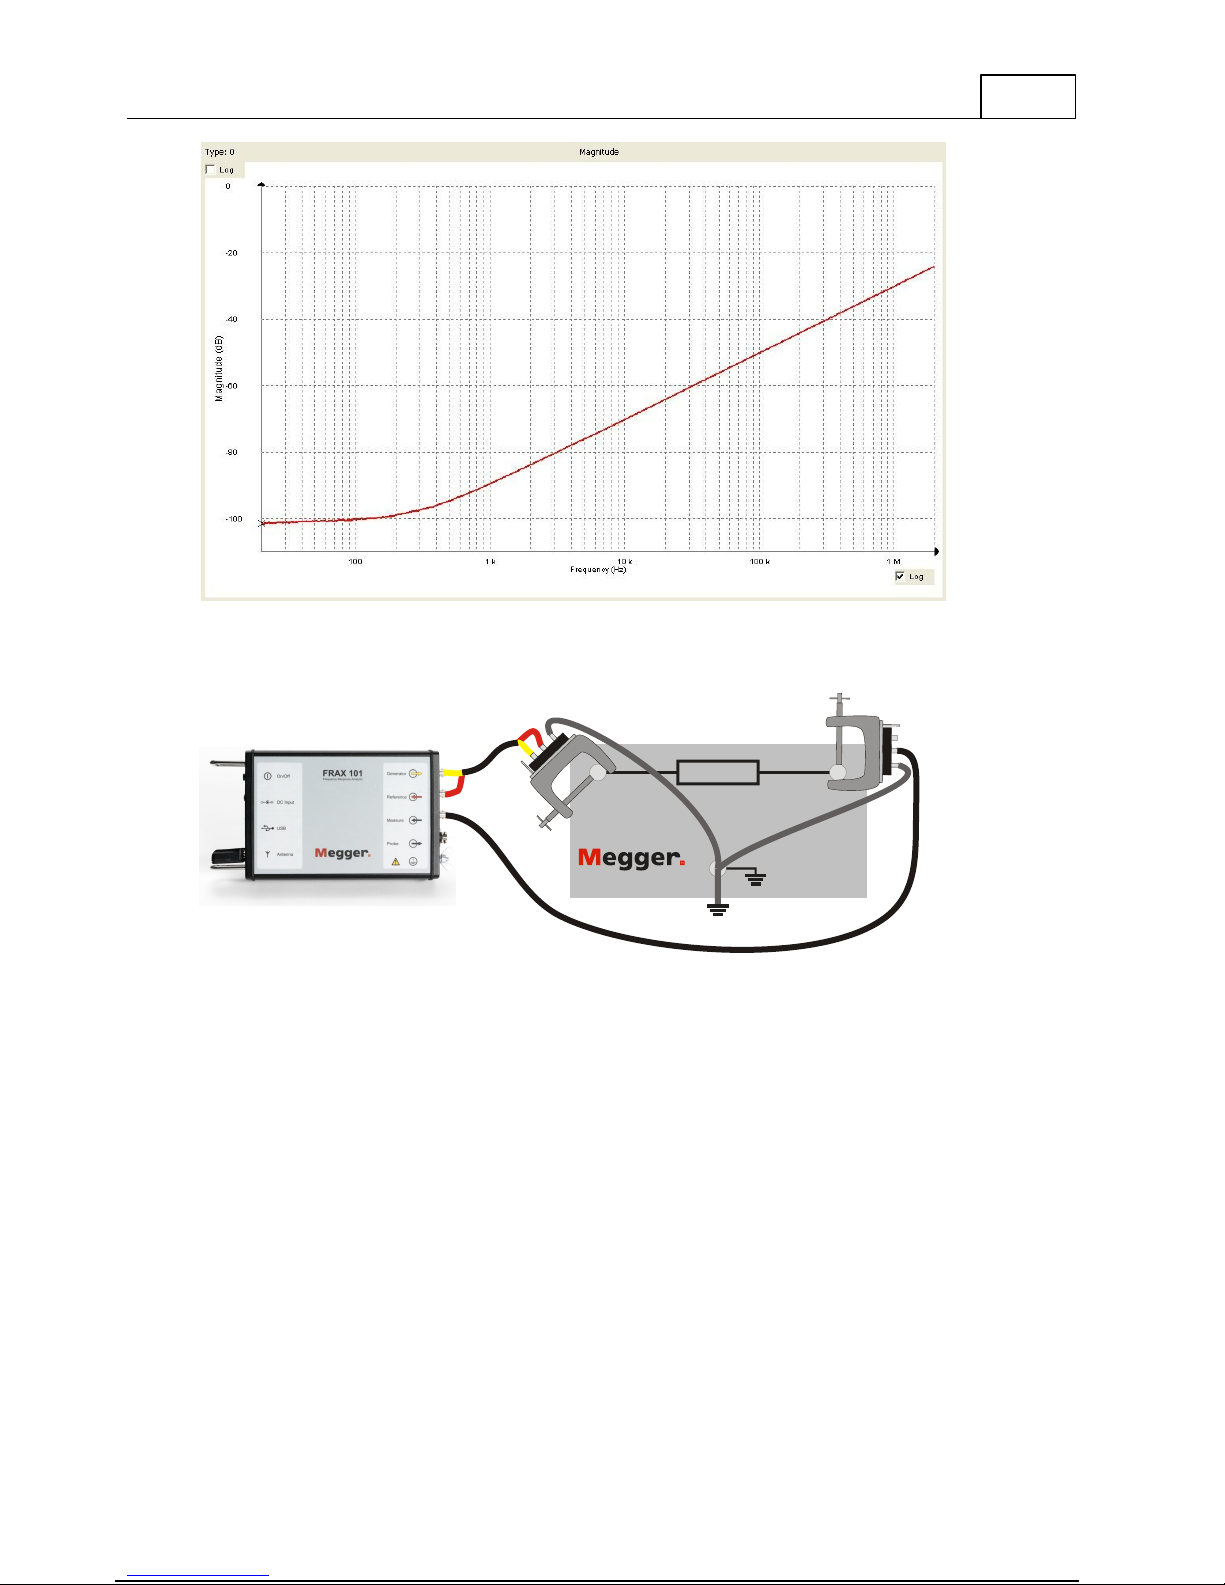
Here you can see the result of test measurements. Showing short circuit measurement (black)
1), open circuit measurement using FRAX-101 (green)2) and FTB-101 measurement (red).
1) A simple test to check the integrity of test leads is a short circuit test. Simply connect the
"Source"/"Reference" and "Measure" clip together and connect the respective measurement
earth/ground together. The result should be an almost straight line around 0 dB (black).
2) An open circuit measurement should in theory provide a 0-response, i.e. a minus infinity
dB-response. However, all measurement systems have internal noise and the test leads will
also add some response from open clips ends. Separate the "Source"/"Reference" clip from
the "Measure" clip. The clips itself will give some influence at highest frequencies, if you
disconnect the "Measure" coaxial cable from the FRAX unit you will see the noise in the
measurement system (green)
Page 22
18
FRAX User's Manual
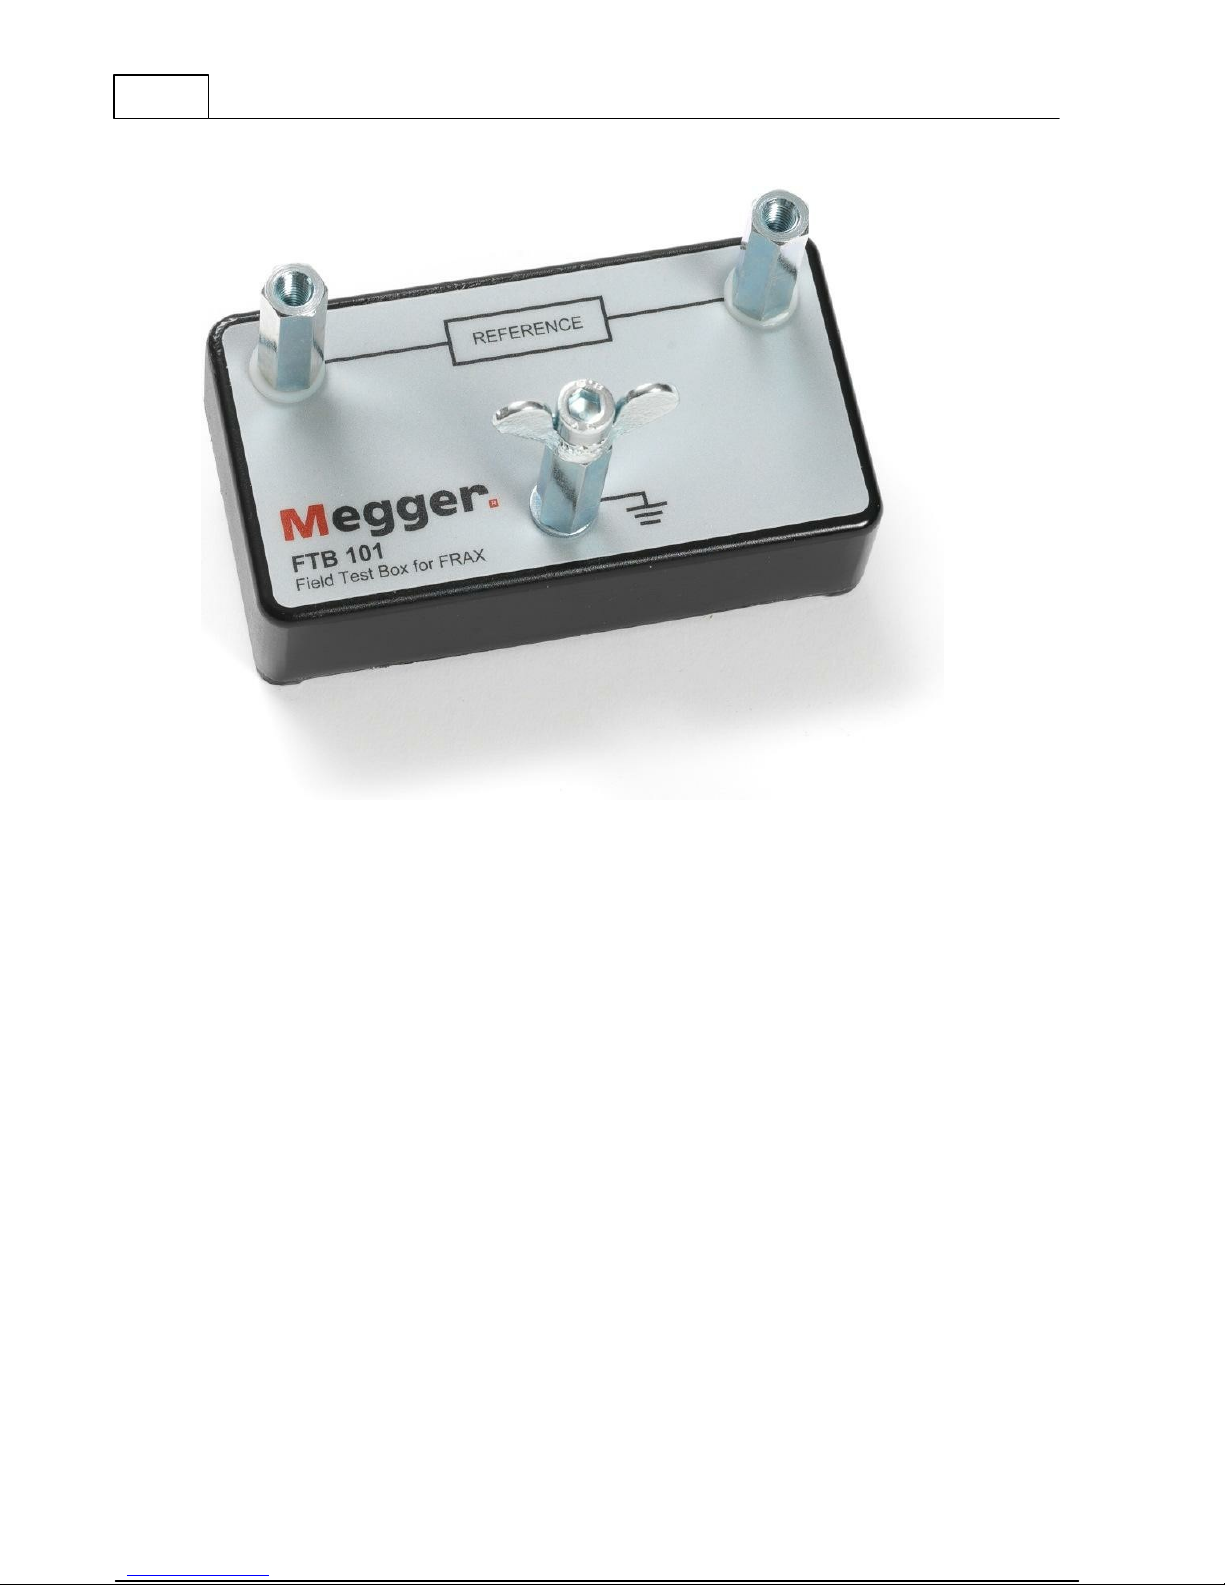
2.6.1 FTB-101
FTB-101 is a field test box that is intended to be used to verify the leads and the equipment as
recommended by CIGRE and several others. Use the FTB-101 and make a test sweep. If the
hook-up and the equipment is is good working order the sweep should look as the picture.
You can compare the results with the file
and is available from the installation folder, usually
FTB-101.frax
that is shipped with the FRAX software
C:\Program
Files\M eg g er\FRAX \ M easurem ent ex am ples
Page 23
Quick Start Tutorial
Use the FTB-101 and make a test sweep1). If the hook-up and the equipment is in good
working order the sweep should look as the picture. You can compare the results with the
file
FTB-101.frax
that is shipped with the FRAX software.
19
1) Connect the "Source"/"Reference" clip to the left-hand side connector and the braid from
the clip to the bottom connector. Connect "Measure" clip to the right-hand side connector
and the braid from the clip to the bottom connector. Also connect the bottom connector to
ground/earth (otherwise the system will face some interference at 50/60Hz).
2.7 Start Measurement
Execute measurement by selecting a measurement in the Legend at the left side. In the
picture below the blue color shows that H2-H1 (Open) is selected. Start the measurement by
pressing the Start button, F9-key or selecting Start under the File menu.
FT B 10 1
Field Test Box for FRAX
REFERENCE
Page 24
20
FRAX User's Manual
2.8 View Data
You can view data in the FRAX Software, for more details try it out and see FRAX Software
2.9 Export Data
If you want to use the data in other software you can use the data files directly or export the
data of your choice, see Export... under FRAX Software, File menu.
3
Installing FRAX Software
Please select one of the sub entries:
PC Requirements
Welcome Screen
License Agreement
Installation Location
Shortcuts Screen
Installation Progress
Installation Complete
Page 25
3.1 PC Requirements
Operating system
Windows 2000, Windows XP or later
Processor
Pentium 500 MHz or higher
Memory
256 MB RAM or more
Hard drive
Minimum 30 MB free
Drive
CD-ROM
Interface
Bluetooth (FRAX-101 only) and USB
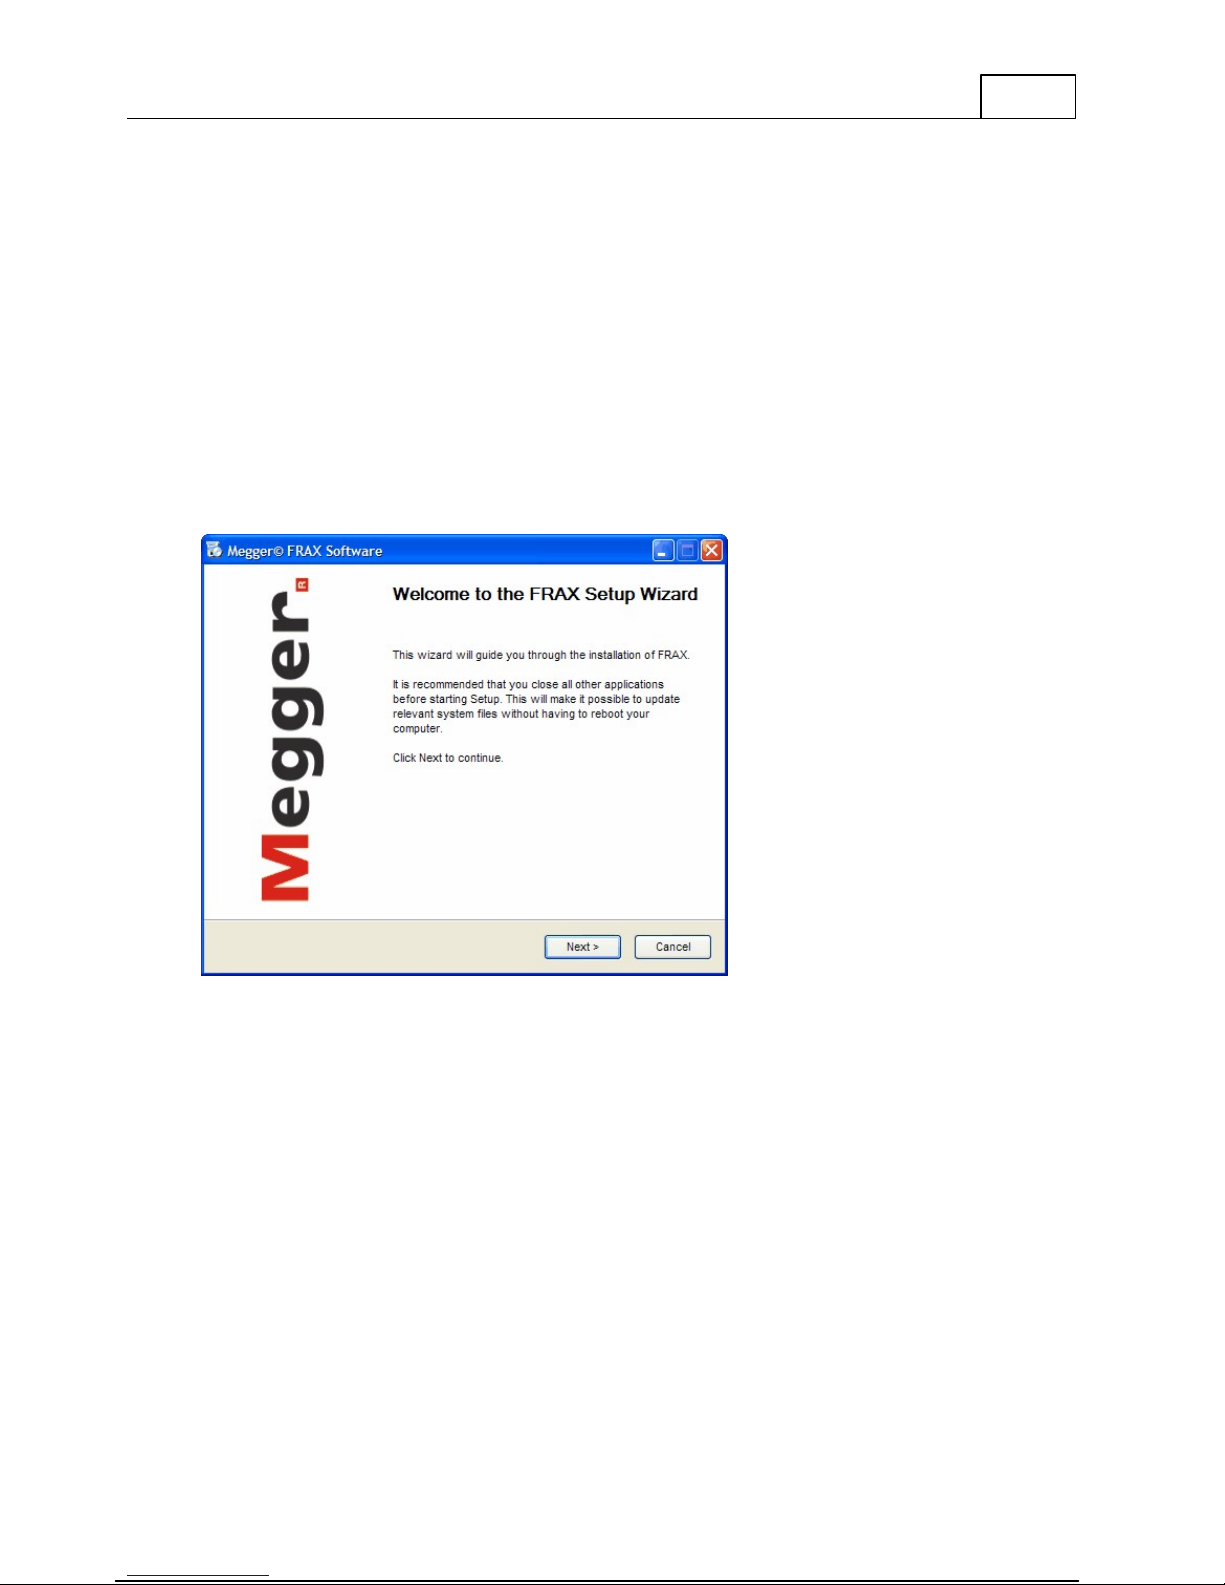
3.2 Welcome Screen
Welcome to Megger Installer for FRAX.
To install FRAX Software press Next witch will bring you to License Agreement
Installing FRAX Software
21
3.3 License Agreement
Read the license and check the "I accept the terms in the License Agreement" checkbox. This
will enable the Next button. To continue the installation press Next. This will bring you to
Installation Location.
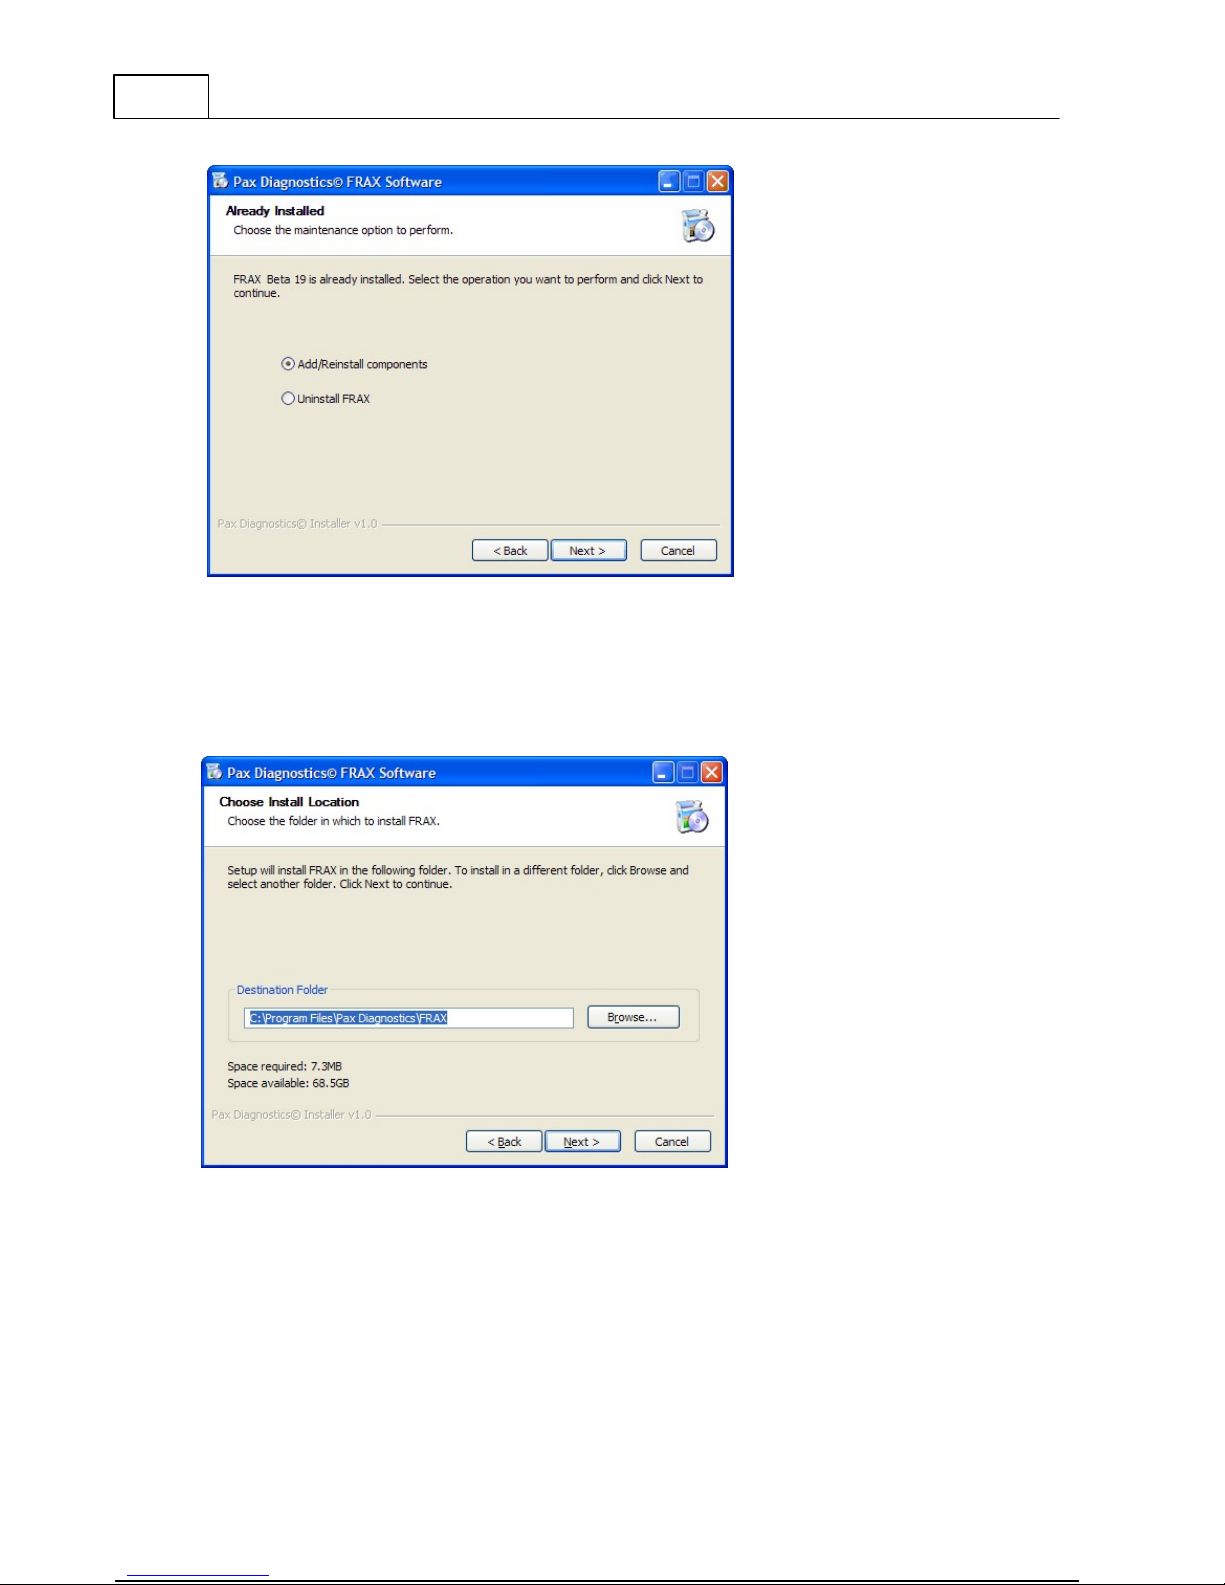
3.4 Already Installed
If the FRAX software is previously installed you are asked if you want to uninstall the older
version or not. It is recommended that you uninstall the previously installed version before
installing a new version. If you choose to keep the old version you have to specify a different
directory for the new version.
Page 26
22
FRAX User's Manual
3.5 Installation Location
Select the location to which the FRAX Software will be installed. Make sure you have enough
space available on your hard drive. To continue the installation press Next. This will take you
to the Shortcuts Screen.
Page 27
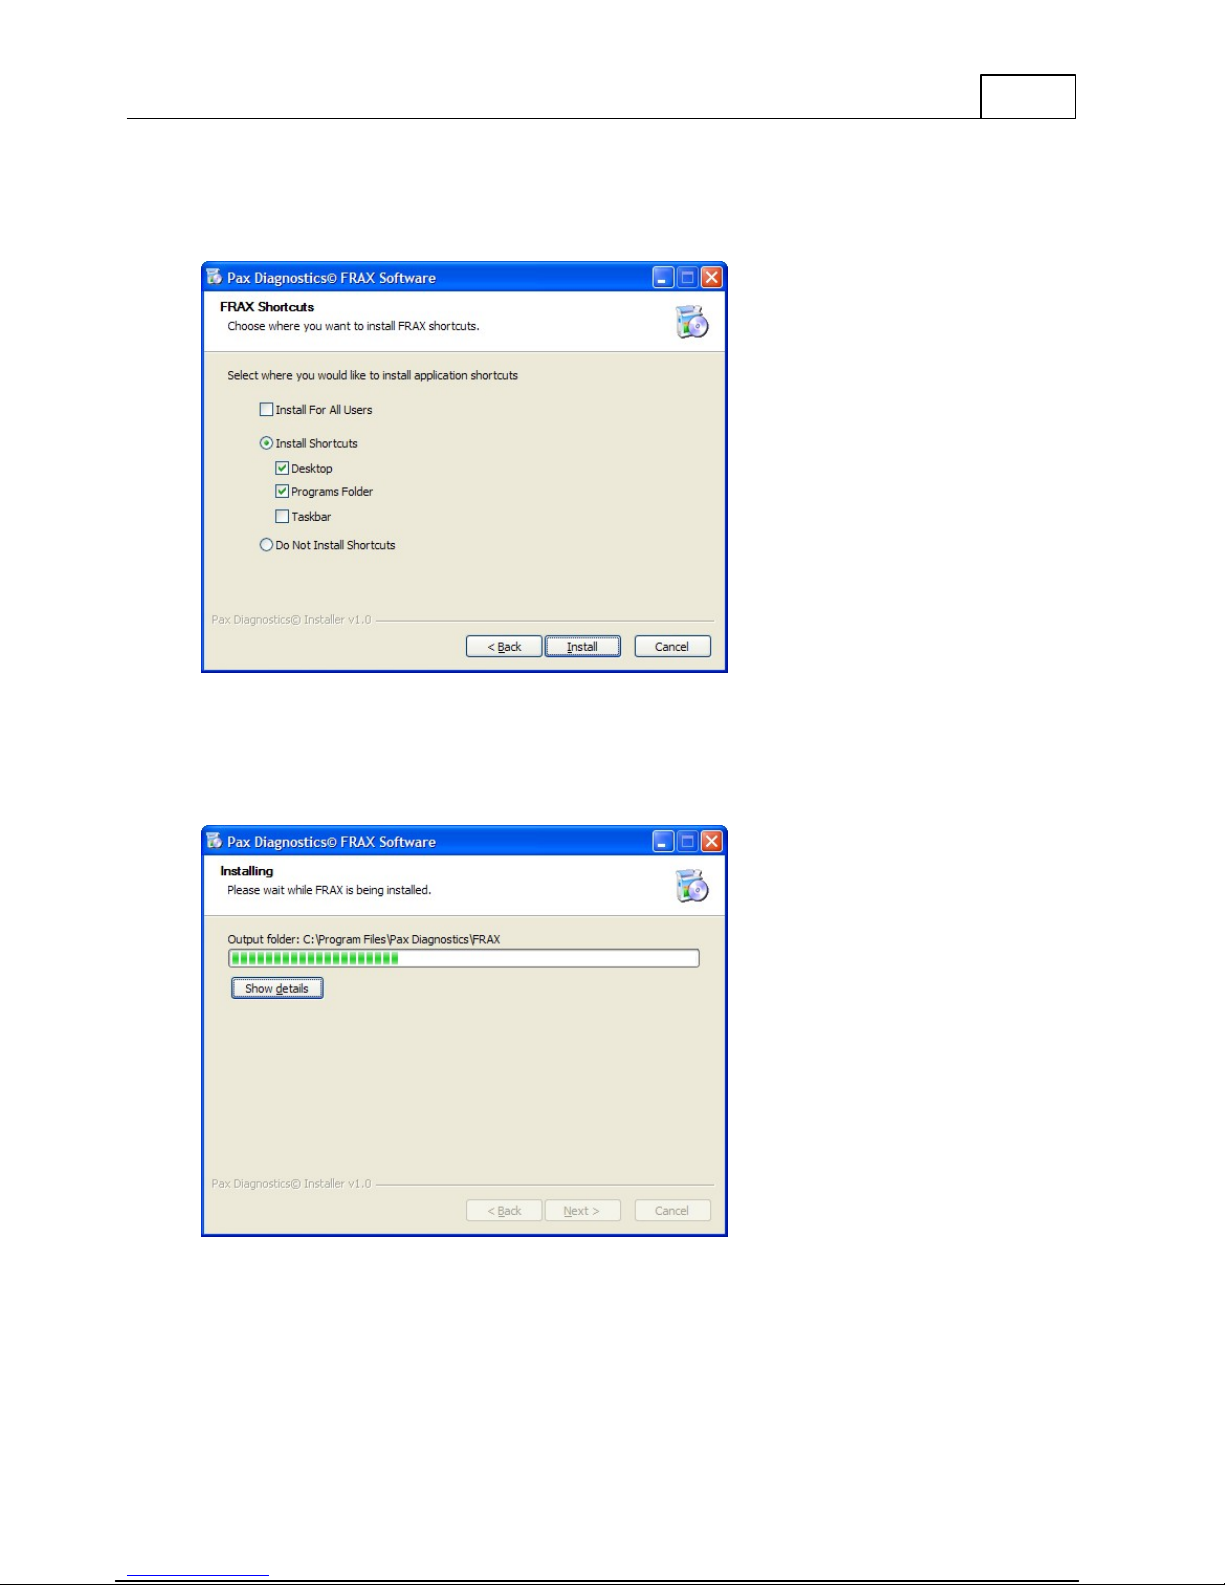
3.6 Shortcuts Screen
This is where you select the shortcuts to be installed. You are now ready to install the
software. To install the application press Install. This will bring you to Installation Progress.
Installing FRAX Software
23
3.7 Installation Progress
The application executables and registry items are being installed. When the files has been
installed you will automatically be transferred to Installation Complete.
Page 28

24
FRAX User's Manual
3.8 Installation Complete
Congratulations!
The installation is now complete. You can now start the FRAX Software.
4
FRAX Software
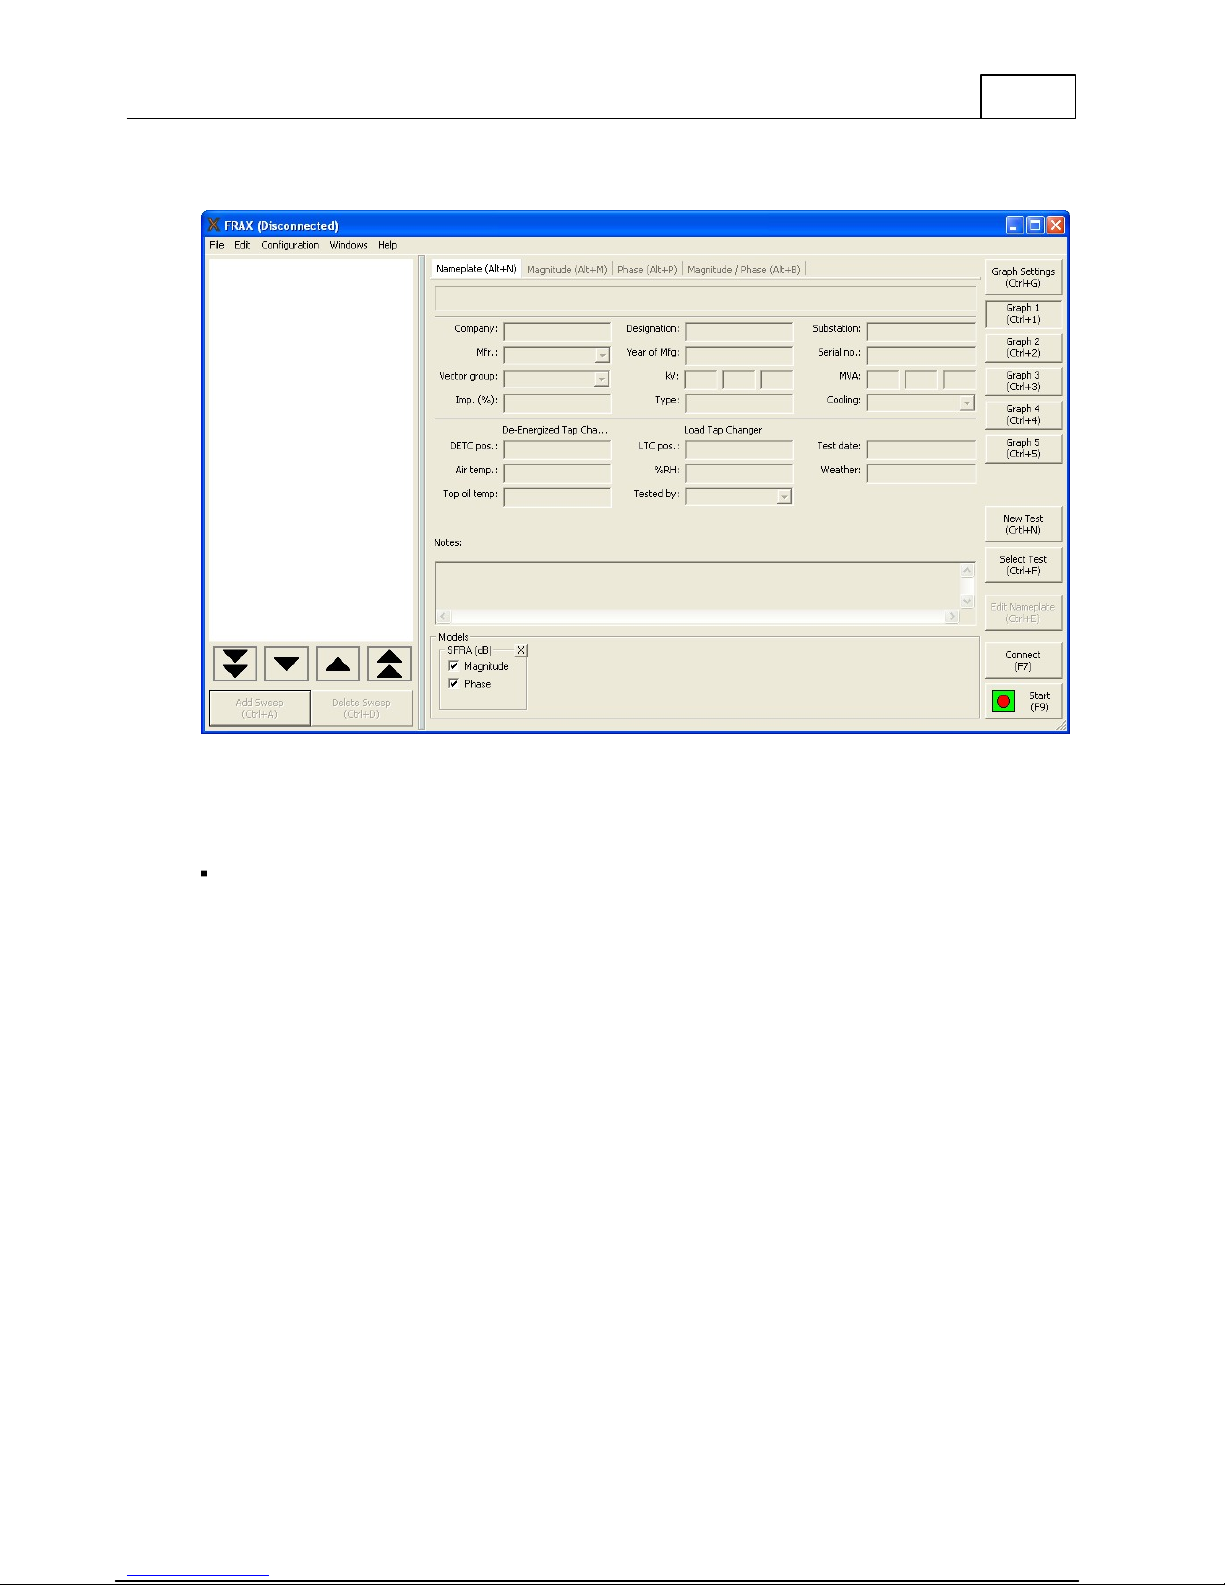
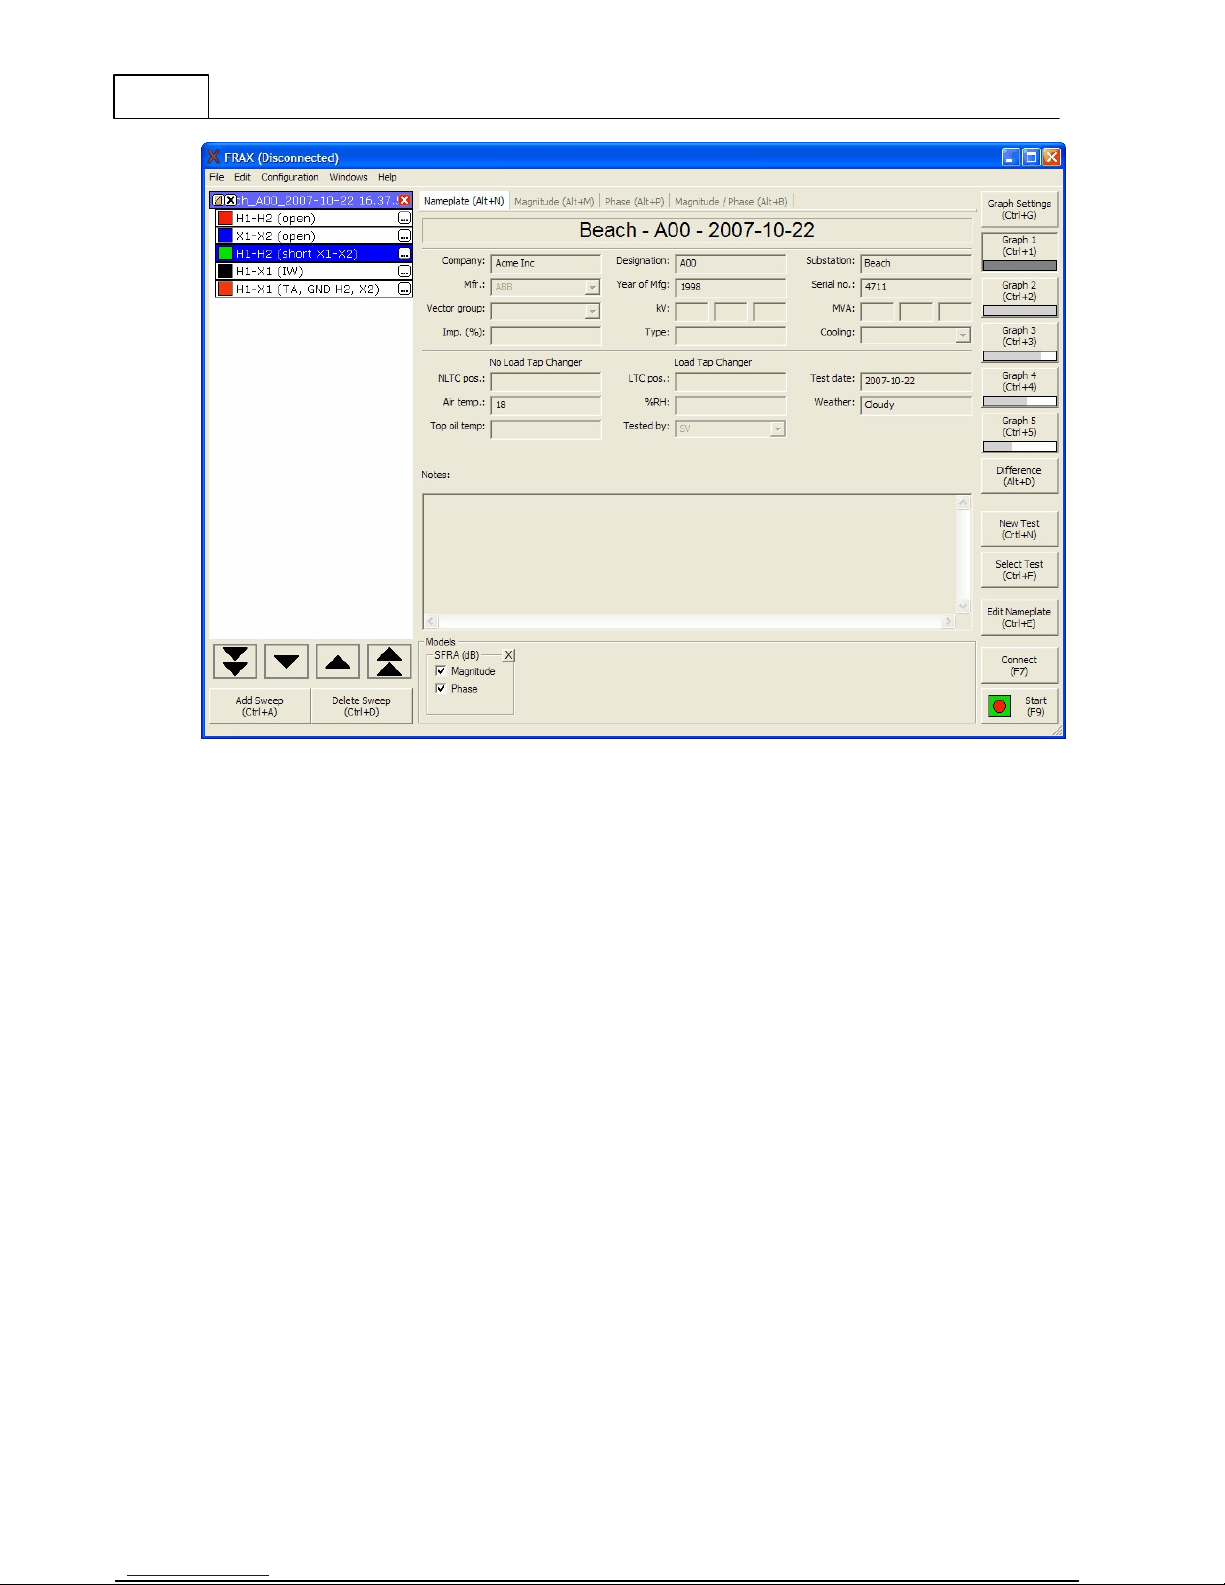
The FRAX Main Window is shown below. In this section it is assumed that the FRAX software
is installed and has started up properly. For issues regarding installation of FRAX Software,
see section Installing FRAX Software.
The FRAX Software Main Window is divided into three sections:
The test browser or Legend to the left (empty in screen shot below) with four arrow buttons
for selecting Measurement File or Measurement Sweep in the test browser. Also the buttons
Add Sweep and Delete Sweep are included in this section of the window.
The large area in the middle presents the Nameplate, and the selected graph options in
different tabs.
The action buttons to the right can be used with touch screen, or mouse click. They are also
assigned to specific keyboard shortcuts and all buttons except Graph 1 to Graph 4 can be
selected in the File or Configuration menus.
Between the legend and the rest of the window is a splitter bar that can be used to adjust the
relative size of the two parts of the window. Just drag it into the desired position and release
it there. The resizing is limited to ensure that the program is usable at all time.
Page 29

FRAX Software
25
During the first six months the program will report all abnormal program terminations to our
software department for debugging purposes.
Page 30

26
Menu Command
Description
New Test...
(Ctrl+N)
Creates a new measurement file to save data in
Load Test...
(Ctrl+L)
Loads a previous performed measurement file
Select Test...
(Ctrl+F)
Open the test database to be able to select one or
more tests to open
Close Test
(Ctrl+I)
Close a measurement file
Report...
Creates a report
Export...
(Alt+E)
Export active measurements to a *.csv or *.txt file
Import...
(Alt+I)
Load files in other file formats.
Print...
(Ctrl+P)
Makes a simple print-out of the currently selected tab.
Add Sweep...
(Ctrl+A)
Adds an additional sweep into a measurement file
Delete Sweep
(Ctrl+D)
Deletes a sweep (performed or empty) from a
measurement file
Edit nameplate...
(Ctrl+E)
Opens the measurements file nameplate to allow
editing
Difference
(Alt+D)
Calculates the difference between two sweeps active
in the graph and plot results
Connect
(F7)
Connect the FRAX software to the FRAX instrument
Disconnect
(F8)
Disconnect the FRAX software from the FRAX
instrument
Start Measurement
(F9)
Start measurement of selected sweep in test browser
Stop Measurement
(F10)
Stop active measurement
Recent files
The latest files opened.
FRAX User's Manual
4.1 File Menu
Page 31

Exit
(Alt+F4)
Terminates the FRAX Software
4.1.1 New Test ... (Ctrl+N)
Quick Test
Make a single sweep test with the Sweep label of your choice
Multiple Sweeps
Make it possible to use and design "Sweep groups" containing one
or more sweeps of your choice
Use Measurement as
Template
Make it possible to use an earlier performed measurement as
template for a new measurement
The software requires a file and a folder location to save its data. The command "New Test"
opens the "Save As" dialog.
FRAX Software
27
4.1.1.1
Measurement Type
The first window appear in New Test is the Measurement type window
In "Measurement type" window, select the tab of your choice:
In the "Quick Test" tab, simply enter the "measurement name" of your choice and hit "OK".
In the "Multiple Sweeps" tab, you select one of the pre-defined test templates containing one
or more sweeps. To modify the predefined sweep plans, use the buttons "Add" and "Delete".
The names can be changed by selecting a "Sweep group" or "Sweep name" and enter a new
name. Select a "Sweep group" and select which Sweeps that should be included by setting
the cross in front of the sweep name(s) and then hit "OK". For more information see
Appendix D
Note that the "Measurements Settings" in "Quick Test" and "Multiple Sweeps" are taken
from the FRAX measurement settings.... in the configuration menu. However, you can change
the "Measurement settings" sweep by sweep in the legend before performing the
measurements.
Page 32

28
FRAX User's Manual
In the "Use Measurement as Template" tab, you can select an earlier measurement as
template for the new measurement. Hit the "Load File" button and load the Measurement
file of your choice or use "Select Test" to find an earlier measurement in the database. The
"Sweep names" in the selected previous measurement are shown. An “X” indicates the
sweeps in the selected file were actually measured last time. Check or uncheck the sweeps you
want to include and Press "OK". The sweep names and measurement settings used in the
selected file are loaded.
Page 33

FRAX Software
29
4.1.1.2
Nameplate
If you select "Quick Test" or "Multiple Sweeps" in the "Measurement type" dialog, an almost
empty nameplate will appear. The "Test date:" is by default filled in with your PC system
date. Please fill in the Nameplate (no field is required). Press "OK". Note that you can always
add or change information to the "Nameplate" by clicking the Edit Nameplate button. This
feature makes it possible to add notes during measurement.
If "Measurement type" "Use Measurement as Template" is selected, the data from the selected
file is entered automatically, except the test date that is filled in with your PC system date.
Page 34

30
FRAX User's Manual
4.1.1.3
Save As
The "Save As" dialog suggests a file name based on your selected format that you have
chosen in configuration menu, submenu Default Filename Settings. The default directory will
be
My Docum ents
on first start and then the directory you used last time. You can change the
file name to a name of your choice and save the file in a directory of your choice. The file
extension will always be ".frax". Click the "Save" button or hit the "Enter" key.
Page 35

FRAX Software
31
Note: When you save the file to the
several persons share the same computer and need to be able to view each other's
measurements it is a good idea to instead save files to a common folder such as the
\Docum ents and Settings\All Users\D o cum ents
4.1.2 Load Test... (Ctrl+L)
Loads a previously performed measurement into the graph view. The default directory will
be
My Docum ents
The FRAX software comes with a few examples of actual SFRA measurements as well as a
reference measurment using the FTB-101. They are located in the installation folder, usually
\Program Files\M egg er\FRAX \M easurem ent exam ples
on first start and then the directory you used last time.
4.1.3 Select Test... (Ctrl+F)
Find a previously performed test in the test database and load it into the graph view.
A dialog showing the files in the database will be shown.
My Docum ents
directory.
folder it will only be accessible for you. If
C:
C:
By clicking on the column headings (Substation, Designation and so on) you can sort the list
alphabetically according to that entry.
You can change the order of the columns by dragging the column header to your desired
position or drag them away to remove them. To add more headings click on the Customize
Page 36

32
FRAX User's Manual
button for a list.
To see the full nameplate of a test click the Nameplate button.
To group the tests according to any heading by dragging it into the gray area at the top.
The FRAX indexer works in the background and checks all monitored directories for new or
changed files. When you open a file from a directory that is not indexed you will get a
question if you want this directory to be indexed. If it is a directory with valid measurements
you should answer yes if you want those files to show up in the Select Test database.
4.1.4 Close Test (Ctrl+I)
The measurement that is selected in the test browser is closed if "Close File" in the "File
menu", or Ctrl+I is selected,
A Measurement can also be closed by clicking the right hand side right corner of the legend.
See arrow in picture below.
4.1.5 Report
The Report uses Microsoft Word as report generator. It will only work if you have Microsoft
Word installed on your computer.
The FRAX150 does not come with MS Word installed and due to the limited hardware it
should not be attempted. For making reports on the FRAX150 we recommend either using
the print function or copy the file to a USB memory and transfer it to your desktop PC for
analysis and report.
Page 37

FRAX Software
33
The Report dialog allows you to select a report template and generate (press "Generate") a
report using the current data and the template. A Word document is generated that can be
edited, printed or converted to another document format using third party software such as
pdf995 or PDFCreator.
You can also create a new report template, delete and/or modify an existing template.
Creating new or modify is straightforward and is easily done when you have an open test file
in the FRAX software. The example below shows how to "Modify" an existing template. Edit
the document on right hand side using ordinary Microsoft Word functions and add your logo
in header. Simply use drag-and-drop to place data fields and graphs from left-hand side into
your report.
Save the new template and return to the Report dialog.
Page 38

34
FRAX User's Manual
The graph number in the report designer corresponds with the type number of the graph. The
easiest way to get the type number is to look at the top left corner of the graph view.
To get the curves on the report you will also need to have them in the FRAX software. Make
sure both models and views are loaded.
4.1.6 Export... (Alt+E)
Activate the function by clicking the Export button or selecting Export in the menu. A "Save
As" dialog will be displayed so you can specify where to store the file. The drop down box
allows you to choose what type of export you want to make. If you don't add a file extension
it will be added, i.e. .txt for a column type export and .xfra for a CIGRE Brochure 342 file.
Page 39

FRAX Software
35
CIGRE Brochure 342 (XFRA)
XFRA or Export FRA is a storage file format recommended in CIGRE Brochure 342. When
exporting to XFRA you are given the opportunity to inspect and make alterations to what will
be written to the file. Pay attention to the terminal settings, especially if you are using
custom sweep names that don't use the default sweep names.
Column type export
Exports active sweeps to a *.txt file. Make sure that only graphs you want to export are visible
in the Graph, as only active graphs are exported. Example: If you look at a magnitude graph,
only magnitude will be exported, if Magnitude and Phase is visible, both Magnitude and
Phase will be exported.
Select suitable export details and press OK.
Page 40

36
FRAX User's Manual
CSV Export
Exports the entire file, selected sweeps or all visible sweeps to a *.csv file. If you use selected
view as data source make sure that only graphs you want to export are visible in the Graph, as
Page 41

only active graphs are exported. Example: If you look at a magnitude graph, only magnitude
will be exported, if Magnitude and Phase is visible, both Magnitude and Phase will be
exported. If you select to export magnitude and phase the selected view is not important.
Select suitable export details and press OK. The csv format has two alternative formats
1. Number decimal = . (point) and Column separator = , (comma) or
2. Number decimal = , (comma) and column separator = ; (semi-colon).
Doble export
The Doble export exports the data of the currently selected sweep to a Doble .sfra file. Make
sure you select the sweep you want to export as only that sweep will be exported.
4.1.7 Import... (Alt+I)
It is possible to load files in various file formats. Among others, XML (e.g. Test1.sfra) and CSV
(e.g. Test2.csv) formatted files from several vendors are supported. The software tries to
automatically detect the file format when "All supported files" is selected in the File type list.
You can also manually select the file format you are about to import in this list.
When importing from Doble and Omicron files the available information will also be
displayed in the nameplate. Omicron import will also use the same curve color and thickness
as in the Omicron file. Depending on computer capacity importing a file may take some time.
FRAX Software
37
The Frameworx CSV import requires that the sweep data is structured as a valid CSV file. The
first column of the first row should be named "Frequency" and the rest of the first row
should be the name of the sweeps. The rest of the rows should be first the frequency, then
the magnitude of the different sweeps. For example:
"Frequency","U-O (BT shorted)"),"V-O (BT shorted)","W-O (BT shorted)"
9.988430,-0.152518,-0.168878,-0.142561
10.477400,-0.154312,-0.170738,-0.144106
10.966300,-0.156267,-0.172563,-0.146208
11.478600,-0.158071,-0.174424,-0.147808
12.014100,-0.160185,-0.176427,-0.149681
and so on.
4.1.8 Print... (Ctrl+P)
Makes a simple direct to printer print-out for field use. The print out will be of the currently
selected tab, i.e. if you have the magnitude graph view tab selected the print-out will contain
the magnitude curve. The print-out will also contain a simple list of the nameplate data. The
print out of nameplate data will be in English only. For more advanced reports with more
options to format the output we suggest that you either use the report function or use the
copy functions, i.e. copy view, copy legend and copy view + legend to copy a screen dump to
the clipboard and then paste them into the program of your choice.
Note that the FRAX150 only supports the Pentax PocketJet 3 Thermal Single Sheet printer aka
Brother PocketJet 3 USB printer. Megger part number 36493.
Page 42

38
FRAX User's Manual
4.1.9 Add Sweep... (Ctrl+A)
"Add sweep" adds an additional sweep into a selected Measurement file structure. You must
fill in a "Sweep name" to be able add a new Sweep (press "OK"). The default "Measurements
settings" are used.
4.1.10 Delete Sweep (Ctrl+D)
Deletes a sweep (with or without data) from a Measurement file structure. Note: the sweep
and possible data will be permanently deleted.
4.1.11 Edit Nameplate... (Ctrl+E)
Opens the measurements file Nameplate for editing.
Some of the fields have a drop-down box; if you fill in the field and then press enter, the
software will ask if you would like to save the entered text as preset choice for next time. You
may delete a text from the list by selecting the text and press the delete key on your
keyboard.
4.1.12 Difference (Alt+D)
The Difference function is available only when two measurement sweeps are displayed in the
graph.
Page 43

4.1.13 Connect (F7)
Menu Command
Description
Copy View
Copy the current view to the clipboard.
Copy Legend
Copy the legend to the clipboard.
Copy View + Legend
(Ctrl+C)
Copy the current view and the legend to the
clipboard.
Change Sweep Color
(Alt+O)
Changes the color and line width of the selected
sweep curve.
Connects the FRAX software to the FRAX-101 instrument.
For more information about connection please see Connection Settings and Bluetooth
communication.
4.1.14 Disconnect (F8)
Disconnect the FRAX software from the FRAX instrument.
4.1.15 Start measurement (F9)
Start measurement of selected sweep in Legend.
4.1.16 Stop measurement (F10)
Stop active measurement.
FRAX Software
39
4.1.17 Exit (Alt+F4)
Terminates the FRAX Software.
4.2 Edit Menu
4.2.1 Copy View
Copy the current view into the clipboard. It can then be pasted into another program.
Page 44

40
Menu
Command
Description
FRAX User's Manual
4.2.2 Copy Legend
Copy the Legend into the clipboard.
4.2.3 Copy View + Legend (Alt+C)
Copy the current View and the Legend into the clipboard. For more information check Copy
View and Copy Legend.
4.2.4 Change Sweep Color (Alt+O)
This dialog allows you to change the color and line width of the selected sweep curve and
change the thickness of the line.
The thickness of the line can either be set as the default or a custom width. It is also possible
to set a new default curve for all lines by pressing the "Default" button.
4.3 Configuration Menu
Page 45

Change
Language...
Change the language in FRAX Software menus and more
Connection
Settings...
Set the COM-port for communicating with the FRAX instrument
Measurement
Settings...
(Ctrl+M)
Set default measurement settings such as start frequency,
integration time and more.
Graph
Settings...
(Ctrl+G)
Set axes and more in the FRAX software graph
Graph Views...
Set graphs to use
Models...
Set models to use with graphs
Analyzers...
Set analyzers to use.
Default
Filename
Settings...
Change the default filename format.
4.3.1 Change Language...
Selecting one of the available languages will change language in menus and dialogs in the
FRAX software. The language settings will also define what pre-defined sweep name template
to use, for most languages you can choose between IEEE or IEC. A software restart is required
to activate the language change after you have selected the new language.
FRAX Software
41
4.3.2 Connection Settings...
The PC uses a COM-port to communicate with the FRAX instrument. It will use different COMports for USB and Bluetooth communication. The FRAX software will try to find the active
COM-port and provide suggestions if no FRAX instrument was found.
COM-ports marked with green indicate that a FRAX instrument was found on that COM-port.
Red means that no FRAX instrument was found.
Page 46

42
FRAX User's Manual
4.3.3 Measurement Settings... (Ctrl+M)
The default measurement settings are specified in this dialog. All new measurement sweeps
except sweeps based on "Use Measurement as Template" will have these settings initially.
A measurement sweep can consist of one or more (max 15) measurement bands with different
settings. Normally the frequency settings are set in such a way that the next band continues
the previous band. The first screen shot below shows the default setting, the second screen
shot below shows a three band setting.
"Start Frequency" and "Stop Frequency" of the sweep, or of the band if several bands are
used.
"P / D": In logarithmic scale, "Points / Decade" (P / D) is the number of measurement points,
equally spaced in a logarithmic scale, per decade. Example: 200 "P / D" between 10 Hz to 1000
Hz gives 400 measurement points logarithmic distributed between 10 Hz to 1000 Hz (two
decades). In linear scale, "P / D" is the total number of measurement points, linearly
distributed. Example: 200 P / D from 10 Hz to 1000 Hz gives 200 measurement points linearly
distributed. Less than 10 P / D is not recommended.
"Min skip time" and "Min skip cycles" defines the number of cycles applied before
measurement starts. "Min time" and Min cycles" defines the number of cycles in
measurement. Example: A measurement is performed at 100 Hz, "Min time" = 0.1s and "Min
cycles" = 12. Since 12 cycles is greater than 10 cycles = 0.1s the system measures at 100 Hz
using 12 cycles. Same settings at 1000 Hz means that the system measures 100 cycles since 0.1s
= 100 cycles is greater than 12 cycles. Note! Min Cycles = 12 equals an IF Bandwidth of 10%.
The default sweep settings are as below.
Page 47

FRAX Software
P/D
Freq bands (Hz)
Meas points
Approx. meas.
time (s)
FRAX Default
50
20 - 200
50
100
200 - 2 k
100
200
2 - 20 k
200
300
20 - 200 k
300
400
200 k - 2 M
400
Total:
1050
64
43
To perform the measurement sweep faster, the low frequency range can be modified by
dense out measurement points and/or lower the integration time ("Min Cycles"). Below are
examples of various sweeps.
On the FRAX-101 and 150 it is possible to set the sweep to be performed in reverse, i.e. to
measure from the highest frequency to the lowest. This is a single setting for all bands.
On the FRAX-101 and 150 it is also possible to scale down the output voltage from the
standard 10 V, see Appendix C, Adjusting Output Voltage.
Sample settings
Here are some examples on various measurement settings.
Page 48

44
FRAX fast
40
20 - 200
4060200 - 2 k
60802 - 20 k
80
100
20 - 200 k
100
160
200 k - 2 M
160
Total:
440
37
Fixed P/D
settings
Example
100
20 - 2 M
500
Omicron default
160
20 - 2 M
800
76
Doble default
200
20 - 2 M
1000
93
Omicron max
320
20 - 2 M
1600
145
Doble max
360
20 - 2 M
1800
163
FRAX max
6400
20 - 2 M
32000
FRAX User's Manual
4.3.4 Graph Settings... (Ctrl+G)
In the Graph settings dialog you set auto scale or range and spacing for the axis. The Dialog
has one tab for the Magnitude and one tab for Phase, as well as a tab for the combination of
Magnitude and Phase. In the bottom you have a check box that makes changes that affect all
graphs.
Page 49

FRAX Software
45
4.3.5 Graph Views...
In the Graph Views dialog, you can configure which graphs you want access to as a separate
tab. The default selections include Magnitude, Phase, and Magnitude / Phase, as shown
below. To select a graph, check or uncheck the box to the left of its name.
Page 50

46
FRAX User's Manual
To edit or delete a custom graph, select the graph in the list and then click the Delete or
Edit... buttons.
To add a custom graph, click the Add... button, and the following dialog is shown.
Page 51

FRAX Software
47
To add a graph type, type a name and a description in the box, and click the Add button.
Enter a description and a number in the Graph Type box. The number is used as a unique id
for this particular graph. You can also use pre-defined types via the Get... button.
Page 52

48
)0/1(log20
10
ChChMagnitude
FRAX User's Manual
4.3.6 Models...
In the Models dialog, you can select what models to use when a graph is plotted. When using
an active probe, the model for the probe should be used. No other models should be used
together with a probe model. In the dialog below, the SFRA (dB) model is selected. This is the
most commonly used model.
Selected models are shown below the graphs in the main window and can be selected and de-
selected by clicking the small check box.
If "Reference" voltage is Ch0 and Measure voltage is Ch1, the following equations are used in
calculations. Note that all standard models display phase in degrees, but in custom models
defined below phases are in radians (1 radians = 180/Pi degrees)
SFRA (dB)
Page 53

FRAX Software
)0()1()0/1( ChPhaseChPhaseChChPhasePhase
0/1 ChChMagnitude
)0()1()0/1( ChPhaseChPhaseChChPhasePhase
Ch1)/Ch1-(Ch0*50 Ch1)/I-(Ch0 U/I Z
Phase(Z) Phase
Ch1))-(Ch0*Ch1/(50 1/Z Y
Phase(Z)- )( Phase YPhase
SFRA (Linear)
Impedance
Admittance
Two additional models are available and that is R and L model that plots its results in
Impedance view. The R and L models are very useful evaluate why curve deviate at low
frequencies in short-circuit measurements, increase of R at lowest frequencies may be a poor
contact, change of L may be winding movement. Also comparing R when frequency increase,
typically in the range 50-400 Hz may give valuable information; this is also called FRSL
(Frequency Response of Stray Losses)
To create a custom model, check Custom Model in the Models dialog as shown above and
click OK. Then, click the button named "..." in the Custom Model frame in the main window.
This brings up a window called Model Options.
49
Page 54

50
FRAX User's Manual
The screenshot above, the custom model designed by Megger for the Active Voltage probe
AVP-101, illustrates some of the features of Custom Models. Type 0 represents the SFRA(dB)
Magnitude graph and since the AVP-101 has a ratio of 10, the equation becomes 20*log10
((ch1*ratio)/ch0). The phase is just the phase, but since all phase variables (Vars...) come in
radians and we want to plot in degrees we multiply the phase by 360/(2*Pi), ph2 = ph1-ph0).
The buttons Units, Vars, Func, and Graph Types provide lists with available units, variables,
mathematical functions, and graph types that can be used within formulas. Please note that a
formula only affects one graph type. That is, a type must be unique for each formula, and
two or more formulas can not share the same type. Click the Save button to save the model.
The model is listed as "User defined" in the Models dialog for later use.
Page 55

4.3.7 Analyzers...
FRAX Software
51
Analyzing data will only very briefly be described in this Users’s manual. Please refer to
Megger’s application documentation and relevant guides and standards e.g.
IEC 60076-18 (a draft at time of printing this User’s Manual)
IEEE PC57.149 (a draft at time of printing this User’s Manual)
CIGRE Brochure 342
Chinese standard DL/T 911-2004
In the low frequency region, the End-to-End Open measurement reflect the magnetization
impedance, deviation in this area may indicate shorted turns or core related problems. Note
however, that residual magnetism that NOT is a failure mode, also affect this region.
In the low frequency region, the End-to-End Short measurement reflect the leakage
impedance, even small deviation in this area (>0.3 dB) may indicate severe winding
deformation.
Interpretation at higher frequencies is not covered in this User’s manual but below are
Analyzers are used to help interpret data described.
Check the box to activate an analyzer. An analyzer shows up as a separate tab in the main
screen.
The DL/T 911-2004 Analyzer is based on the Electric Power Industry Standard of People’s
Republic of China, DL/T 911-2004. The analyzer calculates the relative factor Rxy from the
correlation LRxy and implementation is only possible using SFRA Magnitude in dB-scale.
The Correlation analysis uses same calculations as DL/T 911-2004 Analyzer but here you are
able to modify, if analysis is based on LRxy or Rxy, variable for calculation e.g. Magnitude in
dB or Impedance, number of frequency ranges analyzed, frequency limits and interpretation
limits. You can make these modifications by select the Correlation analysis and press the
Settings... button.
Page 56

52
2
1
0
1
0
)(
N
1
-)(
1
N
K
N
K
x
kXkX
N
D
2
1
0
1
0
)(
N
1
-)(
1
N
K
N
K
y
kYkY
N
D
FRAX User's Manual
Important note: Calculations of LRxy and LRxy is based on discrete mathematics described
under the DL/T 911-2004 Analyzer section. Therefore, same traces measured with logarithmic
or linearly spaced measurement points will give slightly different result. Mathematics
describing a continuous trace is best approximated using linear spaced measurement points.
Furthermore, the DL/T 911-2004 standard also assumes linearly spaced measurement points.
4.3.7.1
DL/T 911-2004 Analyzer
Use the test browser to select the two sweeps you want to compare. The results for the
combinations of the first three selected sweeps is displayed in a table at the top. If more than
three sweeps are selected, the analyzer will only display the first three. The calculations are
performed automatically and the "Conclusion" is presented in the table.
To see the curves and details of a certain combination, select it in the table.
The DL/T 911-2004 Analyzer computes the relative factor Rxy function for the three different
frequency ranges (1kHz-100kHz, 100kHz-600kHz and 600kHz-1MHz) according to equations in
A1, A2, A3 and A4. The value for each frequency range is assigned a "Winding Deformation
degree" and finally the Conclusion is set as the worst "Winding Deformation degree". Note
that RHF<0.6 is not assigned to any "Winding deformation degree".
A.1 Calculate the standard variance of these two sequences
A.2 Calculate the covariance of these two sequences
Page 57

FRAX Software
2
1
0
)(-)(
N
K
kYkY
N
1
X(k)
N
1
-X(k)
N
1
C
2
1N
0K
1N
0K
xY
yx
DD / CLR
xyxy
othersLRg
LR
XY
xy
)1(1
10110
R
10
xy
Winding Deformation degree
Relative Factors
R
Severe Deformation
R
LF
< 0.6
Obvious Deformation
1.0>
R
LF
0.6 or
R
MF
< 0.6
Slight Deformation
2.0>
R
LF
1.0 or 0.6
R
MF
< 1.0
Normal Winding
R
LF
2.0,
R
MF
1.0 and
R
HF
0.6
R
LF
represents the relative factor when the curve is in low frequency band (1kHz~100kHz);
R
MF
represents the relative factor when the curve is in medium frequency band
(100kHz~600kHz);
R
HF
represents the relative factor when the curve is in high frequency band
(600kHz~1000kHz).
53
A.3 Calculate the normalization covariance factor of these two sequences
A.4 Calculate the relative factor Rxy meeting the project requirements as per the
following formula:
A.5 Judge the degree of deformation of transformer winding as per Table A.1
Table A.1 Relation between relative factors and degree of transformer winding
deformation (only for reference)
4.3.7.2
Correlation Analysis
The Correlation analyzer is by default a copy of the DL/T 911-2004 analyzer. It uses the same
calculations to get the values. The difference is that it is possible to create and change limits
and frequency ranges to create a custom analyzer.
Use the test browser to select the two curves you want to compare. If more than two curves
are selected, the analyzer will only display the first two curves selected. The calculations are
performed automatically and the "Conclusion" is presented below the table.
Page 58

54
FRAX User's Manual
To change the settings for the analysis click the "Settings" button in the analyzer selection
dialog. This brings up a dialog where the settings can be adjusted. In bottom right corner you
select if the evaluation variable is the correlation coefficient (LRxy) or the Rxy-factor. You can
add or remove frequency ranges; you can modify the frequency settings and interpretation
criteria.
Page 59

FRAX Software
55
4.3.8 Default Filename Settings
Specify the default filename settings that will be used in the New File Save As dialog.
Data time format (YYYY-MM-DD hh.mm.ss)
Generate a file name of format "YYYY-MM-DD hh.mm.ss.txt" based on the system time in
Page 60

56
Menu Command
Description
Output window
(Ctrl+O)
Toggle show/hide the Output window
FRAX User's Manual
your PC.
According to nameplate
Generate a file name based on data entered into the nameplate in the format
su bstatio n_d esignation _ date tim e.frax
Number format (Dxxxxxxx)
Generate a file name starting with the number entered into the edit field. Once a new file
has been created the number will be incremented. You can select what number to start
from.
4.4 Windows Menu
.
4.4.1 Output Window (Ctrl+O)
Opens an Output window that displays all communication between PC and FRAX instrument.
Click on the "Last row" button to see new lines when they become available during the
continuous communication.
Page 61

4.5 Action Buttons
Action buttons for faster access to common functions.
FRAX Software
57
4.5.1 Graph Settings
Same as the menu item Graph settings... (Ctrl+G).
Page 62

58
FRAX User's Manual
4.5.2 Graph View Settings
These five buttons controls the graph settings specified in Graph Settings dialog.
4.5.3 New Test
Same as the menu item New Test ... (Ctrl+N).
4.5.4 Select Test
The same as the menu item Select Test... (Ctrl+F)
4.5.5 Edit Nameplate
Same as the menu item Edit Nameplate... (Ctrl+E). This button is only enabled when a file is
selected in the Legend.
4.5.6 Connect
Same as the menu item Connect (F7).
Page 63

4.5.7 Start
Button Icon
Description
This icon means that you are not connected to the system.
1. No file is selected in the Legend.
2. No sweep is selected in the Legend.
3. The selected sweep is already measured.
Measurement in progress.
Ready to start measurement.
The start button is a multi-functional button. You can get action suggestions by pressing the
start button.
You can press the button at any time. If you are unsure of what action to take, the
application provides suggestions.
FRAX Software
59
4.6 Legend
The legend or Test Browser is where you will spend most of your time. This is where you
change the Measurement settings for a single sweep and control the Graphs.
Fore more information about the usage of the Legend please read the sub-chapters Usage and
Sweep Measurement Settings.
Page 64

60
FRAX User's Manual
This is a typical legend view.
4.6.1 Usage
Usage overview
You can navigate the legend by either using the arrow buttons at the bottom of the legend. You
can also use Alt+arrow keys Up and Alt+arrow key Down to navigate between sweeps or
Alt+Page Up or Alt+Page Down to change File.
If you have many sweeps or several files open at the same time a scroll bar will be shown
to the right of the legend making it possible to scroll up and down to see all sweeps.
It is also possible to change the order of the sweeps in a file. Click and hold on a sweep
and then drag it to the desired position and then let go to drop it in place.
Legend Action Button Description
Below is a typical measurement file. A file is a container of measured sweeps.
File Description
Page 65

FRAX Software
File function
button
Description
or
Hide / Show inactive sweeps in the file.
or
Enable / Disable sweeps in the file.
Close the file.
Sweep function
button
Description
or
Enable / Disable the sweep. The color and line width can be set
for each sweep. You can change the color and line width by
right clicking on the icon.
or
Measured / Empty sweep. Clicking on this icon change the
measurement settings for the sweep.
The file header contains 3 function buttons and the name of the file.
Sweep Description
The sweep contains 2 function buttons and the name of the sweep. Below is a list of
different sweeps with different attributes.
61
4.6.2 Sweep Measurement Settings
This window lets you change the settings for the sweep. You can only change the settings for
"empty" sweeps (no measurement data).
You can change the default measurement settings for new sweeps by pressing Ctrl+M.
Page 66

62
FRAX User's Manual
4.7 Views
There are several views available. The Nameplate view is always present and the "Magnitude
(Alt-M), Phase (Alt+P) and Magnitude / Phase (Alt+B) are also present when you first start your
software. You can easily change the view by clicking the view-tab above the view. Also you
can change views and create your own views, see further Graph views...
Below you see the Magnitude view with one measurement loaded.
Page 67

FRAX Software
63
Page 68

64
FRAX User's Manual
5
Appendices
5.1 Appendix A: Calibration Instruction
The calibration of a FRAX can be performed through an automated process by use of the
FraxCal software. The FraxCal utilizes an Agilent 34401A or or an Fluke 8845A/8846A DMM
(digital multi meter) and a FRAX calibration adapter connected to the FRAX generator output
and measuring input channels.
Preparing for calibration
To perform the automatic calibration the following equipment is necessary:
Agilent 34401 DMM or Fluke 8845A/8846A
FRAX calibration set including the following:
Calibration Adapter CAL-101
1 pce DB-9 standard serial cable
1 pce 2 x 4mm banana plug to BNC coaxial converter
3 pcs 50 ohm coaxial cables with BNC connectors, 0.5 meter length
1 pce 50 ohm coaxial cable with BNC connectors, 2 meter length
FraxCal software
Note that the coaxial cables from the FRAX to the calibration box needs to be of equal
length.
Connecting the equipment
Install the FraxCal software on your computer (Windows XP or Windows Vista)
Connect the FRAX AC/DC adapter and put the FRAX mains switch in the ON position (I)
Ground the FRAX using the ground screw.
Connect the FRAX with the USB cable to one of the USB ports on the computer
Connect the DMM to the computer, using the serial cable. If the computer lacks a serial
interface, a serial/USB adapter can be used.
Connect the FRAX to the Calibration Adapter CAL-101 according to the figure below:
0.5 meter 50 ohm coaxial cable from FRAX Generator to CAL-101 IN
0.5 meter 50 ohm coaxial cable from FRAX Reference to BNC Y adapter
0.5 meter 50 ohm coaxial cable from FRAX Measure to BNC Y adapter
BNC adapter to CAL-101 OUT
2 meter 50 ohm coaxial cable from CAL-101 DET to DMM using the BNC to banana
adapter
Page 69

Performing the calibration
Appendices
65
Start the FraxCal software by double clicking the FraxCal icon on your desktop. The start page
of the software is presented in the figure below.
The software will automatically detect the serial number of the FRAX unit and the last
calibration date. It will also automatically suggest current date to be the new calibration
date. The date can be changed by the user. The software will also automatically detect the
communication ports for the FRAX and the DMM.
To start the calibration, press “Start Calibration”.
Page 70

66
FRAX User's Manual
During the calibration process, the software will keep you informed about the progress. The
process takes approximately 12 minutes. After successfully completed calibration, the
following message will appear.
All calibration data is stored in the FRAX instrument. No written report can be obtained from
the software, thus suggesting a separate calibration report to be created manually. Do not
forget to apply the sticker on the FRAX back panel, informing the FRAX user about the last
calibration date.
Although the FRAX does not need to be calibrated more often than every two years, we
recommend that you calibrate the unit every year.
Verification
After a successful calibration, we recommend to do a “short” measurement to verify that the
FRAX performs as expected. Connect as described in the figure below.
Page 71

Appendices
67
Measure from 10 Hz to 10 MHz and the measured data should be 0 dB with a maximum
deviation of +/- 0.1 dB.
Also make a verification using the built-in calibration reference. Connect as explained in the
figure below.
Run standard sweep from 20 Hz – 2 MHz.
When looking at standard view Magnitude Curve should be around -80 dB between 10 Hz –
100 kHz.
Unclick Magnitude, use model CAL-510k Curve should be 0 dB, +/- 0.3 dB between 100 Hz – 10
kHz.
To add the 510k model:
Insert the file CAL-510k.model (on the attached USB stick) in the CustomModels directory, see
below
Page 72

68
FRAX User's Manual
To add model click:
Menu Configuration
Menu Models
Select CAL-510k
Page 73

Appendices
69
On each CAL 101, there is a resistance value on the s/n label.
To ensure the best possible verification; enter this resistance value here.
In this example, we have used 510 kΩ.
Page 74

70
FRAX User's Manual
5.2 Appendix B: Optional Active Probes
Active Probes have been discontinued and is not included in this User’s Manual. However, the
FRAX SW version 2.5 still supports use of probes after installation of Models as in earlier FRAX
SW versions. Please refer to earlier User’s Manuals or Megger’s Support.
Page 75

5.3 Appendix C: Adjusting Output Voltage
Appendices
71
On the FRAX-101 and 150 the output voltage level may be adjusted from the standard/default
10 Volts up to 12 and down to 0.1 Volt, by changing a file in the FRAX directory.
The file name is named "connectioncommands.txt" and it is in the directory you installed
the FRAX software to, usually C:\Program Files\Megger\FRAX
To use the file to adjust the output voltage add the command gen:gainx=k to the file.
K is a factor for setting the output voltage. K=1 means output voltage is FRAX standard/
default = 10 V output. By changing k, the voltage can be adjusted.
Examples:
k = 0.2828 means output voltage = 0.2828*10V = 2.828 Vpeak = 2 V RMS (used by
FRAnalyzer, Omicron)
k = 0.05 means output voltage = 0.05*10V = 0.5 V (= HP 4195A output voltage)
Open/edit the file with Notepad. K must be a number between 1.2 and 0.01, use decimal
POINT. Save the changes. After changing k you need to disconnect/connect to FRAX to
activate the new setting.
NO TE: If yo u run V ista y o u m ay experience th at y o u do not h ave th e rig h ts to chan ge/save
th e file. If so, ri g h t-clic k on the file, properties, select security and edit the u ser rig h t. Anoth er
possibility is to ru n Notepad as adm inistrator an d open th e file from Notepad (n o t doub leclic k in th e F RAX fo ld er).
NO TE: Don't forg et to chan ge bac k to orig inal k = 1 after the m easu rem ent session!
Page 76

72
FRAX User's Manual
5.4 Appendix D: Sweep Name Settings
There are two predefined sweep plans for each language, one IEEE based on the DRAFT D9 of
the IEEE PC57.149 and one IEC based on CIGRE Brochure 342, 2008 and a draft of IEC 60076-18.
All predefined sweep plans can be modified to suit your use. To do so use the buttons "Add"
and "Delete". The names can be changed by selecting a "Sweep group" or "Sweep name" and
enter a new name. Select a "Sweep group" and select which Sweeps that should be included
by setting the cross in front of the sweep name(s) and then hit "OK".
The files containing the sweep plans are located in the MeasData directory, e.g. for Windows
XP at C:\Documents and Settings\User1\Application Data\FRAX\MeasData. The modified
sweep groups can be found in X_Edit_DefaultTemplates.xml in respective folder for selected
language. If you make new sweep groups and want to distribute them you can use the file
UserTemplates.xml and rename it to a suitable name. When adding a sweep plan file just put
it in the MeasData directory, at e.g. for Windows XP at C:\Documents and Settings\User1
\Application Data\FRAX\MeasData and the FRAX software will read from it. Note that the
available sweep plans are displayed in alphabetical order based on the sweep plan file so if
you want to make sure your own sweep groups are displayed first name the file to something
like 1custom.xml or !!myfile.xml.
The basis of FRA analysis is comparison with reference measurements; if reference
measurements are available, it is strongly recommended to repeat those measurements
exactly as the reference measurements were set up.
For all new measurements the current drafts of IEC and IEEE have some differences. Also the
phase labeling is different, note however, you can always change name in the template, e.g.
change 1u, 1v and 1w to e.g. R, S and T.
In the IEEE Draft of PC57.149, it is recommended to follow the basic principle to measure
windings from head-to-tail and consequently the recommended test connections will depend
on winding configuration. The pre-defined templates in FRAX 2.5 covers the most common
types of configurations/vector groups and you may change direction of low voltage and
tertiary winding measurements to comply with the IEEE recommendation. The recommended
measurements are the end-to-end measurements both open and short-circuited and others are
optional. The De-Energized Tap Changer (DETC) should be in position as found and recorded
in Nameplate, Load Tap Changer (LTC) shall be set in Extreme Rise position (also to be noted
in nameplate). See Sample Connections below.
In the DRAFT of IEC 60076-18 it is recommended to measure all windings End-to-End Open,
and the winding with a load tap changer in “Max” i.e. the LTC position that place all LTC
winding in series, and the LTC in a position that does not include the regulating winding,
called OUT-position in template. Note that End-to End Short-circuit is optional. IEC also
recommends to measure in the direction referring to bushing labeling, i.e. no modification is
necessary to measure an YnYn6 compared to an YnYn4, and this is taken care of in the
implementation.
If delta windings can be split into individual phases (six bushings brought out) then the
measurement shall be made with the windings split. For large generator transformers where
it is inconvenient to remove the phase to phase connections in service it is recommended that
the baseline measurement in the factory and during commissioning is performed both with
the delta open and closed.
For delta tertiary or stabilizing windings, the delta shall be closed. For delta tertiary or
Page 77

Appendices
IEC and ANSI/IEEE
Alternative ANSI/IEEE
End-to-End Open
Open Circuit Self Admittance (OC)
End-to-End Short-Circuit
Short Circuit Self Admittance (SC)
Capacitive Inter-Winding (CIW)
Inter-Winding (IW)
Inductive Inter-Winding (IIW)
Transfer Admittance (TA)
IEC and ANSI/IEEE
Example IEC
Example ANSI/IEEE
End-to-End Open
1u-1n [open]
H1-H0 [open]
End-to-End Short-Circuit
1u-1n [short]
H1-H0 [short]
Capacitive Inter-Winding (CIW)
1u-2u [CIW]
H1-X1 [IW]
Inductive Inter-Winding (IIW)
1u-2u [IIW, GND 1n, 2n]
H1-X1 [TA, GND H0,X0]
73
stabilizing windings that are earthed at one corner in service, the earth shall be removed if
possible without removing liquid or gas. Always make notes about actual set-up used in the
notes section of nameplate
Zig-zag connected windings shall be measured as star windings with a neutral connection (if
accessible).
Phase shifting transformers: The standard measurement shall be from input terminal to
output terminal on each phase and from the neutral of the shunt winding to the output
terminal on each phase, each on neutral tap and on each extreme tap, a total of 18
measurements. If the phase shifting transformer is of the two core type that has external
interconnections that can be removed on site then it shall be treated as two separate
transformers.
Series reactors shall be measured from input terminal to output terminal on each phase, a
total of three measurements for a three-phase reactor. Shunt reactors shall be treated as a star
winding on a transformer, a total of three measurements for a three-phase reactor without
taps and six for a reactor with taps.
Sample Connections:
Page 78

74
FRAX User's Manual
1) In the “En-to-End Open” (Open Circuit Self Admittance, OC) the signal is applied to one end
of each winding in turn, and the transmitted signal is measured at the other end. The lowfrequency range of this test is basically a low voltage measurement of the voltage dependent
single phase excitation current.
2) The “End-to-End Short-Circuit (Short Circuit Self Admittance, SC) is measured as the “Endto-End Open” measurement but with one or more windings shorted. The low-frequency range
of this test is basically a low voltage measurement of the single phase impedance.
Page 79

Appendices
75
3) In the Capacitive Inter-Winding, CIW (Inter-Winding, IW) measurement, the signal is
applied to one end of a winding and the response is measured at one end of another winding
on the same phase (not connected to the first one). The lowest-frequency range of this test is
basically a capacitance and dissipation/power factor measurement (e.g. CHL).
4)In the Inductive Inter-Winding, IIW (Transfer Admittance, TA) measurement, the signal is
applied to a terminal on the HV side, and the response is measured on the corresponding
terminal on the LV side, with the other end of both windings being grounded. Example of
labeling is “A-a1 [IIW, GND N,n1]” where GND N, n1 means ground terminal N (H0) and
ground terminal n1 (X0). The low-frequency range of this test is determined by the winding
turns ratio (slightly affected by the 50 Ohm load at the “Meas”-side.)
Page 80

76
FRAX User's Manual
5.5 Appendix E: FRAX cables and clamps
The FRAX clamps and cables are field tested, rugged accessories ensuring repeatable and
accurate measurements. Coaxial cables are covered with an extra protective cover and strain
relief is fitted on all 9 and 18 meter cables to ensure a long and trouble free life of service.
Ground braids made of tin plated copper ensure good contact, make them easy to work with
and increase life of service compared to e.g. aluminium.
The FRAX clamps handles both round and flat connectors. Easy to attach and a firm grip
avoids any risk of clamps falling off.
The C-clamp is used to connect the FRAX to the bushing. All necessary connectors (BNC, braid,
ground, cable strain relief) are included in one clamp. The smaller G-clamp is used to connect
the braids to ground. Both models are part of the standard cable set delivered with a FRAX.
Page 81

5.5.1 Bushing connection
The C-clamp can be fastened on any type of bushing up to Ø 90 mm. The M12 screw ensures
good electrical and mechanical contact. No risk of a clamp falling down due to heavy cables
and braids.
The clamp is delivered with a M12 hat nut, which can be used when you want to avoid the
screw making marks on a sensitive surface.
Appendices
77
Page 82

78
FRAX User's Manual
5.5.1.1
Generator cable connection (yellow/red)
Cable strain relief
Coaxial cable from FRAX
-Generator (Yellow)
-Reference (Red)
Ground braid connected to
ground. Keep the braid
straight along the bushing
and ground the braid at the
base of the bushing. Ensure
good connection.
The first 50 cm of the braid is
insulated to avoid any
electric connection to the
bushing.
Page 83

Appendices
79
5.5.1.2
Measure Cable connection (black)
Cable strain relief
Coaxial cable from FRAX
(Measure)
Ground braid connected to ground.
Keep the braid straight along the
bushing and ground the braid at
the base of the bushing. Ensure
good connection to ground using
the G-clamp.
Page 84

80
FRAX User's Manual
5.5.2 Ground braid practice
The ground braid shall go from the C-clamp the shortest way to the bottom of the bushing.
Good ground connection is essential for reliable test results. Look at the next two pages for
more information.
The braid cable set consists of 4 x 3 meter tin plated copper braids. Many transformers have
bushings shorter than 3 m, which suggests two braids, one for each bushing, to be enough
when it comes to length.
The remaining braids can be used if bushings are taller than 3 m. See picture below how to
joint two braids.
The C-clamp allows a two braid practice, not necessary when using FRAX, but useful if
compatibility with previous two braid measurements is required.
Page 85

Appendices
81
5.5.2.1
G-clamp connection to ground
The new, unique ground clamp handles both nuts and bolts as well as other round and flat
connectors, making it the most easy-to-use and versatile ground connection available.
The G-clamp is easy to attach, easy to tighten the braid, which ensuring a quick and reliable
procedure for shortest braid practice, which is essential to get repeatable measurements.
The sharp, adjustable M4 pin screw penetrates any paint or oxide, making it easy to get a
good, solid ground connection on almost any surface.
Page 86

82
FRAX User's Manual
5.5.2.2
Ground braid connection
The clamp can be attached to ground in many ways. See previous section.
To attach and tighten the braid: open up the braid plate by loosening the wing nuts.
Page 87

Appendices
Place the braid between the G-clamp and the braid plate. Tighten the braid to create a
straight line from the C-clamp to the G-clamp. Tighten the wing nuts.
83
For extra flexibility when connecting the braids to ground, the short braid with clamp
included in the ground braid set can be used.
Page 88

84
FRAX User's Manual
5.5.3 Field Test Box FTB 101
Connect C-clamp
to FTB101
Connect the
Measure cable
Attach the G-clamp
to ground on the
FTB101
Connect the
braid to the
G-clamp
Connect the ground
cable from FRAX
to the G-clamp
Connect C-clamp
to FTB101
Connect the
Generator cable
Connect the
braid to the
G-clamp
 Loading...