

Page 1

CareLink SmartSync™ Viva™ Consulta™ Syncra™ Advisa™ Ensura™ Application Help for CRT-P devices
Caution: Federal law (USA) restricts this device to sale by or on the order of a physician.
Page 2

Medtronic, Medtronic with rising man logo, and Medtronic logo are trademarks of Medtronic. Third-party trademarks (“TM*”) belong to their respective owners. The
following list includes trademarks or registered trademarks of a Medtronic entity in the United States and/or in other countries.
AdaptivCRT™, Advisa DR MRI™, Advisa SR MRI™, Advisa™, Capture Management™, Cardiac Compass™, CardioSync™, CareLink SmartSync™, CareLink™,
Consulta™, Ensura™, OptiVol™, Paceart Optima™, Paceart™, Quick Look™, SessionSync™, SureScan™, Syncra™, Viva™
Page 3

Contents
1 Introduction . . . . . . . . . . . . . . . . . . . . . . . . . . . . . . . . . . . . . . . . . . . . . . . . . . . . . . . . . . . . . . . . . . . . . . . . . . . . . . . . . . . . . . . . 5
1.1 Description . . . . . . . . . . . . . . . . . . . . . . . . . . . . . . . . . . . . . . . . . . . . . . . . . . . . . . . . . . . . . . . . . . . . . . . . . . . . . . . . . . . . . . . . . . . . 5
1.2 Intended use of the implantable device app . . . . . . . . . . . . . . . . . . . . . . . . . . . . . . . . . . . . . . . . . . . . . . . . . . . . . . . . . . . . . . . . . . 5
1.3 Warnings and precautions . . . . . . . . . . . . . . . . . . . . . . . . . . . . . . . . . . . . . . . . . . . . . . . . . . . . . . . . . . . . . . . . . . . . . . . . . . . . . . . . 5
1.4 Potential adverse events . . . . . . . . . . . . . . . . . . . . . . . . . . . . . . . . . . . . . . . . . . . . . . . . . . . . . . . . . . . . . . . . . . . . . . . . . . . . . . . . . 6
1.5 Download or order the instructions for use . . . . . . . . . . . . . . . . . . . . . . . . . . . . . . . . . . . . . . . . . . . . . . . . . . . . . . . . . . . . . . . . . . . 6
1.6 IT network, tablet, and data information . . . . . . . . . . . . . . . . . . . . . . . . . . . . . . . . . . . . . . . . . . . . . . . . . . . . . . . . . . . . . . . . . . . . . 6
1.7 Reporting errors and serious incidents . . . . . . . . . . . . . . . . . . . . . . . . . . . . . . . . . . . . . . . . . . . . . . . . . . . . . . . . . . . . . . . . . . . . . . 7
2 Overview of the interface . . . . . . . . . . . . . . . . . . . . . . . . . . . . . . . . . . . . . . . . . . . . . . . . . . . . . . . . . . . . . . . . . . . . . . . . . . . . . 7
2.1 Areas . . . . . . . . . . . . . . . . . . . . . . . . . . . . . . . . . . . . . . . . . . . . . . . . . . . . . . . . . . . . . . . . . . . . . . . . . . . . . . . . . . . . . . . . . . . . . . . . . 7
2.2 Status indicators . . . . . . . . . . . . . . . . . . . . . . . . . . . . . . . . . . . . . . . . . . . . . . . . . . . . . . . . . . . . . . . . . . . . . . . . . . . . . . . . . . . . . . . . 7
3 Reinterrogating the implanted device . . . . . . . . . . . . . . . . . . . . . . . . . . . . . . . . . . . . . . . . . . . . . . . . . . . . . . . . . . . . . . . . . . 9
3.1 Reinterrogate the implanted device . . . . . . . . . . . . . . . . . . . . . . . . . . . . . . . . . . . . . . . . . . . . . . . . . . . . . . . . . . . . . . . . . . . . . . . . . 9
4 Responding to device status indicator warnings . . . . . . . . . . . . . . . . . . . . . . . . . . . . . . . . . . . . . . . . . . . . . . . . . . . . . . . . . 9
4.1 About device status indicator warnings . . . . . . . . . . . . . . . . . . . . . . . . . . . . . . . . . . . . . . . . . . . . . . . . . . . . . . . . . . . . . . . . . . . . . . 9
4.2 Respond to the AT/AF THERAPIES DISABLED warning . . . . . . . . . . . . . . . . . . . . . . . . . . . . . . . . . . . . . . . . . . . . . . . . . . . . . . . 9
4.3 Respond to the WARNING – DEVICE ELECTRICAL RESET warning . . . . . . . . . . . . . . . . . . . . . . . . . . . . . . . . . . . . . . . . . . . . . 9
4.4 Respond to the SERIOUS DEVICE ERROR warning . . . . . . . . . . . . . . . . . . . . . . . . . . . . . . . . . . . . . . . . . . . . . . . . . . . . . . . . . 10
5 Using the Live Rhythm Monitor . . . . . . . . . . . . . . . . . . . . . . . . . . . . . . . . . . . . . . . . . . . . . . . . . . . . . . . . . . . . . . . . . . . . . . . 10
5.1 About the Live Rhythm Monitor . . . . . . . . . . . . . . . . . . . . . . . . . . . . . . . . . . . . . . . . . . . . . . . . . . . . . . . . . . . . . . . . . . . . . . . . . . . 10
5.2 Markers . . . . . . . . . . . . . . . . . . . . . . . . . . . . . . . . . . . . . . . . . . . . . . . . . . . . . . . . . . . . . . . . . . . . . . . . . . . . . . . . . . . . . . . . . . . . . . 10
5.3 Adjust the Live Rhythm Monitor display . . . . . . . . . . . . . . . . . . . . . . . . . . . . . . . . . . . . . . . . . . . . . . . . . . . . . . . . . . . . . . . . . . . . 11
5.4 Freeze live waveform traces . . . . . . . . . . . . . . . . . . . . . . . . . . . . . . . . . . . . . . . . . . . . . . . . . . . . . . . . . . . . . . . . . . . . . . . . . . . . . . 12
6 Using the eStrip recorder . . . . . . . . . . . . . . . . . . . . . . . . . . . . . . . . . . . . . . . . . . . . . . . . . . . . . . . . . . . . . . . . . . . . . . . . . . . . 12
6.1 About the eStrip recorder . . . . . . . . . . . . . . . . . . . . . . . . . . . . . . . . . . . . . . . . . . . . . . . . . . . . . . . . . . . . . . . . . . . . . . . . . . . . . . . . 12
6.2 Modify the display of waveform traces . . . . . . . . . . . . . . . . . . . . . . . . . . . . . . . . . . . . . . . . . . . . . . . . . . . . . . . . . . . . . . . . . . . . . 12
6.3 Configure waveform strip preferences . . . . . . . . . . . . . . . . . . . . . . . . . . . . . . . . . . . . . . . . . . . . . . . . . . . . . . . . . . . . . . . . . . . . . . 12
6.4 Access waveform strips . . . . . . . . . . . . . . . . . . . . . . . . . . . . . . . . . . . . . . . . . . . . . . . . . . . . . . . . . . . . . . . . . . . . . . . . . . . . . . . . . 13
6.5 Change the length of a waveform strip . . . . . . . . . . . . . . . . . . . . . . . . . . . . . . . . . . . . . . . . . . . . . . . . . . . . . . . . . . . . . . . . . . . . . 13
6.6 Measure time intervals . . . . . . . . . . . . . . . . . . . . . . . . . . . . . . . . . . . . . . . . . . . . . . . . . . . . . . . . . . . . . . . . . . . . . . . . . . . . . . . . . . 13
6.7 Draw notes . . . . . . . . . . . . . . . . . . . . . . . . . . . . . . . . . . . . . . . . . . . . . . . . . . . . . . . . . . . . . . . . . . . . . . . . . . . . . . . . . . . . . . . . . . . 13
6.8 Edit the title of a waveform strip . . . . . . . . . . . . . . . . . . . . . . . . . . . . . . . . . . . . . . . . . . . . . . . . . . . . . . . . . . . . . . . . . . . . . . . . . . . 14
6.9 Use the Holter feature . . . . . . . . . . . . . . . . . . . . . . . . . . . . . . . . . . . . . . . . . . . . . . . . . . . . . . . . . . . . . . . . . . . . . . . . . . . . . . . . . . 14
7 Viewing summary data using the Quick Look screen . . . . . . . . . . . . . . . . . . . . . . . . . . . . . . . . . . . . . . . . . . . . . . . . . . . . 14
7.1 About the Quick Look screen . . . . . . . . . . . . . . . . . . . . . . . . . . . . . . . . . . . . . . . . . . . . . . . . . . . . . . . . . . . . . . . . . . . . . . . . . . . . . 14
7.2 View the Quick Look screen . . . . . . . . . . . . . . . . . . . . . . . . . . . . . . . . . . . . . . . . . . . . . . . . . . . . . . . . . . . . . . . . . . . . . . . . . . . . . . 14
8 Using emergency VVI pacing . . . . . . . . . . . . . . . . . . . . . . . . . . . . . . . . . . . . . . . . . . . . . . . . . . . . . . . . . . . . . . . . . . . . . . . . 15
8.1 Enable emergency VVI pacing . . . . . . . . . . . . . . . . . . . . . . . . . . . . . . . . . . . . . . . . . . . . . . . . . . . . . . . . . . . . . . . . . . . . . . . . . . . 15
9 Suspending and resuming tachyarrhythmia detection . . . . . . . . . . . . . . . . . . . . . . . . . . . . . . . . . . . . . . . . . . . . . . . . . . . 15
9.1 Suspend and resume tachyarrhythmia detection . . . . . . . . . . . . . . . . . . . . . . . . . . . . . . . . . . . . . . . . . . . . . . . . . . . . . . . . . . . . . 15
10 Programming patient information . . . . . . . . . . . . . . . . . . . . . . . . . . . . . . . . . . . . . . . . . . . . . . . . . . . . . . . . . . . . . . . . . . . . 15
10.1 Program the patient information . . . . . . . . . . . . . . . . . . . . . . . . . . . . . . . . . . . . . . . . . . . . . . . . . . . . . . . . . . . . . . . . . . . . . . . . . 15
11 Programming implantable device settings . . . . . . . . . . . . . . . . . . . . . . . . . . . . . . . . . . . . . . . . . . . . . . . . . . . . . . . . . . . . 16
11.1 Parameter symbols . . . . . . . . . . . . . . . . . . . . . . . . . . . . . . . . . . . . . . . . . . . . . . . . . . . . . . . . . . . . . . . . . . . . . . . . . . . . . . . . . . . . 16
11.2 Program the parameters . . . . . . . . . . . . . . . . . . . . . . . . . . . . . . . . . . . . . . . . . . . . . . . . . . . . . . . . . . . . . . . . . . . . . . . . . . . . . . . 17
11.3 Create custom parameter sets . . . . . . . . . . . . . . . . . . . . . . . . . . . . . . . . . . . . . . . . . . . . . . . . . . . . . . . . . . . . . . . . . . . . . . . . . . 17
11.4 Retrieve parameter sets . . . . . . . . . . . . . . . . . . . . . . . . . . . . . . . . . . . . . . . . . . . . . . . . . . . . . . . . . . . . . . . . . . . . . . . . . . . . . . . . 17
11.5 Program data collection preferences . . . . . . . . . . . . . . . . . . . . . . . . . . . . . . . . . . . . . . . . . . . . . . . . . . . . . . . . . . . . . . . . . . . . . 18
3
Page 4

11.6 View parameter changes . . . . . . . . . . . . . . . . . . . . . . . . . . . . . . . . . . . . . . . . . . . . . . . . . . . . . . . . . . . . . . . . . . . . . . . . . . . . . . . 19
12 Viewing and analyzing diagnostic data . . . . . . . . . . . . . . . . . . . . . . . . . . . . . . . . . . . . . . . . . . . . . . . . . . . . . . . . . . . . . . . 19
12.1 View OptiVol events . . . . . . . . . . . . . . . . . . . . . . . . . . . . . . . . . . . . . . . . . . . . . . . . . . . . . . . . . . . . . . . . . . . . . . . . . . . . . . . . . . . 19
12.2 View clinical diagnostic data . . . . . . . . . . . . . . . . . . . . . . . . . . . . . . . . . . . . . . . . . . . . . . . . . . . . . . . . . . . . . . . . . . . . . . . . . . . . 19
12.3 View device and lead diagnostic data . . . . . . . . . . . . . . . . . . . . . . . . . . . . . . . . . . . . . . . . . . . . . . . . . . . . . . . . . . . . . . . . . . . . . 21
13 Performing system tests . . . . . . . . . . . . . . . . . . . . . . . . . . . . . . . . . . . . . . . . . . . . . . . . . . . . . . . . . . . . . . . . . . . . . . . . . . . 22
13.1 Configure the test preferences for the Live Rhythm Monitor . . . . . . . . . . . . . . . . . . . . . . . . . . . . . . . . . . . . . . . . . . . . . . . . . . . 22
13.2 Perform an Underlying Rhythm Test . . . . . . . . . . . . . . . . . . . . . . . . . . . . . . . . . . . . . . . . . . . . . . . . . . . . . . . . . . . . . . . . . . . . . . 22
13.3 Perform a Sensing Test . . . . . . . . . . . . . . . . . . . . . . . . . . . . . . . . . . . . . . . . . . . . . . . . . . . . . . . . . . . . . . . . . . . . . . . . . . . . . . . . 23
13.4 Perform a Pacing Threshold Test . . . . . . . . . . . . . . . . . . . . . . . . . . . . . . . . . . . . . . . . . . . . . . . . . . . . . . . . . . . . . . . . . . . . . . . . . 24
13.5 Perform a Lead Impedance Test . . . . . . . . . . . . . . . . . . . . . . . . . . . . . . . . . . . . . . . . . . . . . . . . . . . . . . . . . . . . . . . . . . . . . . . . . 24
13.6 Perform a CardioSync Optimization Test . . . . . . . . . . . . . . . . . . . . . . . . . . . . . . . . . . . . . . . . . . . . . . . . . . . . . . . . . . . . . . . . . . 25
13.7 Perform a Magnet Test . . . . . . . . . . . . . . . . . . . . . . . . . . . . . . . . . . . . . . . . . . . . . . . . . . . . . . . . . . . . . . . . . . . . . . . . . . . . . . . . . 25
13.8 Perform EP Study tests to induce arrhythmias . . . . . . . . . . . . . . . . . . . . . . . . . . . . . . . . . . . . . . . . . . . . . . . . . . . . . . . . . . . . . . 26
13.9 Perform EP Study tests to deliver manual therapies . . . . . . . . . . . . . . . . . . . . . . . . . . . . . . . . . . . . . . . . . . . . . . . . . . . . . . . . . 27
14 Using the SessionSync feature . . . . . . . . . . . . . . . . . . . . . . . . . . . . . . . . . . . . . . . . . . . . . . . . . . . . . . . . . . . . . . . . . . . . . . 28
14.1 View the SessionSync connection status . . . . . . . . . . . . . . . . . . . . . . . . . . . . . . . . . . . . . . . . . . . . . . . . . . . . . . . . . . . . . . . . . . 28
14.2 Send device data and reports to the Paceart Optima system . . . . . . . . . . . . . . . . . . . . . . . . . . . . . . . . . . . . . . . . . . . . . . . . . . 29
14.3 End the patient session with the automatic SessionSync feature . . . . . . . . . . . . . . . . . . . . . . . . . . . . . . . . . . . . . . . . . . . . . . . 29
15 Using session tools . . . . . . . . . . . . . . . . . . . . . . . . . . . . . . . . . . . . . . . . . . . . . . . . . . . . . . . . . . . . . . . . . . . . . . . . . . . . . . . 29
15.1 Connect to the base . . . . . . . . . . . . . . . . . . . . . . . . . . . . . . . . . . . . . . . . . . . . . . . . . . . . . . . . . . . . . . . . . . . . . . . . . . . . . . . . . . . 29
15.2 Start or return to a concurrent analyzer session . . . . . . . . . . . . . . . . . . . . . . . . . . . . . . . . . . . . . . . . . . . . . . . . . . . . . . . . . . . . . 30
15.3 Save the implantable device data . . . . . . . . . . . . . . . . . . . . . . . . . . . . . . . . . . . . . . . . . . . . . . . . . . . . . . . . . . . . . . . . . . . . . . . . 30
15.4 About Read From File sessions . . . . . . . . . . . . . . . . . . . . . . . . . . . . . . . . . . . . . . . . . . . . . . . . . . . . . . . . . . . . . . . . . . . . . . . . . . 30
15.5 End the patient session . . . . . . . . . . . . . . . . . . . . . . . . . . . . . . . . . . . . . . . . . . . . . . . . . . . . . . . . . . . . . . . . . . . . . . . . . . . . . . . . 30
16 Working with reports and saved device data . . . . . . . . . . . . . . . . . . . . . . . . . . . . . . . . . . . . . . . . . . . . . . . . . . . . . . . . . . 30
16.1 Configure the report preferences . . . . . . . . . . . . . . . . . . . . . . . . . . . . . . . . . . . . . . . . . . . . . . . . . . . . . . . . . . . . . . . . . . . . . . . . 30
16.2 Generate reports . . . . . . . . . . . . . . . . . . . . . . . . . . . . . . . . . . . . . . . . . . . . . . . . . . . . . . . . . . . . . . . . . . . . . . . . . . . . . . . . . . . . . 31
16.3 View or export saved reports and implantable device data . . . . . . . . . . . . . . . . . . . . . . . . . . . . . . . . . . . . . . . . . . . . . . . . . . . . 31
4
Page 5

1 Introduction
1.1 Description
About the implantable device app
The CareLink SmartSync Viva Consulta Syncra Advisa Ensura Application (referred to as the implantable device app) allows you to
program the settings of the following implantable devices and view stored device data:
Implantable pulse generators (IPG) Cardiac resynchronization therapy pacemakers (CRT-P)
Advisa DR MRI SureScan Viva CRT-P
Advisa DR Consulta CRT-P
Advisa SR MRI SureScan Syncra CRT-P
Use the implantable device app to perform the following tasks:
• Review the presenting rhythm
• Verify the status of the implantable device
• Assess the clinical effectiveness of the implantable device
• View or enter patient information
• Program parameters
• Save or export data
The implantable device app is a component of the CareLink SmartSync device manager.
Note: The CareLink SmartSync Viva Consulta Syncra Advisa Ensura Application model number is D00U008.
About this app help
This app help applies to use of the implantable device app with CRT-P models only. The features described in this app help apply to
the Viva CRT-P Model C6TR01 device. To determine which features are available for another implantable device model, refer to the
clinician manual for that device.
1.2 Intended use of the implantable device app
1.2.1 Intended use
The intended purpose is to interrogate, program, or execute tests on a Medtronic cardiac device.
1.2.2 Intended users
The implantable device app is intended for use by healthcare professionals or Medtronic representatives in a clinical or hospital
environment.
1.2.3 Intended patient population
The implantable device app is intended for use with patients who either have or are receiving a supported implantable device.
1.2.4 Expected clinical benefits
The clinical benefit of the implantable device app is the ability to interrogate and program Medtronic implantable devices and test
cardiac leads.
1.2.5 Indications for use
For information about the indications for the implantable devices that are compatible with the implantable device app, refer to the
clinician manuals for the implantable devices.
1.2.6 Contraindications
There are no known contraindications for the use of the implantable device app.
Note: For information about contraindications for the implantable devices that are compatible with the implantable device app, refer
to the clinician manuals for the implantable devices.
1.3 Warnings and precautions
These warnings and precautions apply when using the implantable device app in combination with the other device manager
components.
Note: For warnings and precautions about the use of the implantable devices that are compatible with the implantable device app,
refer to the clinician manuals for the implantable devices.
5
Page 6

Importance of instructions for use – Before using the implantable device app, Medtronic recommends that you do the following:
• Read the implantable device instructions for use.
• Read the device manager instructions for use.
• Carefully assess the patient’s condition and the implantable device system to determine the appropriate settings for tests and
device programming.
Improper use of the implantable device app could result in erroneous programming, inadvertent pacing, improper operation of
telemetry, or incorrect operation of measurement functions.
Tablet and app interaction – Due to the dynamic nature of the tablet environment, operating system events such as notifications,
alarms, and messaging can take priority and, therefore, move the implantable device app to the background. Tapping, pressing
buttons, and using gestures on the tablet can also result in moving the implantable device app to the background or closing the
implantable device app. For example, the implantable device app moves to the background if you lock the tablet.
When the implantable device app moves to the background or closes, telemetry with the implantable device is paused or lost, which
results in the following scenarios:
• If detection has been suspended and there is no magnet present, the implantable device resumes detection within a few seconds.
• If a test is in progress, whether the test continues or stops depends on the type of test. For more information, refer to the section
on performing system tests in this app help.
When you restore the implantable device app from the background, the implantable device app attempts to re-establish
communication with the implantable device and displays the system status. If the implantable device app was closed, you must
interrogate the implantable device to re-establish communication with the implantable device.
Electromagnetic interference – If electromagnetic interference (EMI) occurs during a telemetry session, EMI can prevent the
proper programming or confirmation of values. For more information about EMI, refer to the Medical Procedure and EMI Warnings and
Precautions Manual for Health Care Professionals.
1.4 Potential adverse events
There are no known potential adverse events related to the use of this implantable device app.
For information about potential adverse events related to the use of the implantable devices that are compatible with the implantable
device app, refer to the clinician manuals for the implantable devices.
1.5 Download or order the instructions for use
To view, download, print, or order a PDF version of this app help, go to www.medtronic.com/manuals, or contact a Medtronic
representative.
The PDF version of this app help can be viewed using a current version of any major internet browser. For best results, use Adobe™*
Acrobat™* Reader software with the browser.
Paper copies of this app help are available to customers free of charge. They should arrive in 3 to 7 days. To order, go to
www.medtronic.com/manuals or contact a Medtronic representative.
1.6 IT network, tablet, and data information
1.6.1 Required IT network characteristics and configuration
To use the implantable device app, your tablet must have Bluetooth® wireless technology1. An Internet connection is optional.
Bluetooth wireless technology
You must enable Bluetooth wireless technology on your tablet. The Bluetooth connection allows the hardware components of the
device manager to communicate with the device manager app that is installed on the tablet.
Failure to provide Bluetooth communication access prevents the device manager components from communicating with each other
and with implantable devices. As a result, the device manager app is unable to establish a Bluetooth connection with the patient
connector. The patient connector is used to interrogate and program the implantable device.
Internet
To configure your network, follow the processes and policies of your organization.
Internet access is not required to export and print reports. However, failure to provide access to an information technology (IT) network
(for example, a Wi-Fi™* or cellular network) results in the inability to export and print reports using a wireless connection.
1
The Bluetooth® word mark is a registered trademark of Bluetooth SIG, Inc. Any use of the word mark by Medtronic is under license.
6
Page 7

1.6.2 Supported tablets and technical specifications
The tablet on which the device manager app is installed must meet the requirements in the CareLink SmartSync Tablet Compatibility
Technical Manual. To download or order the CareLink SmartSync Tablet Compatibility Technical Manual, go to
www.medtronic.com/manuals, or contact a Medtronic representative.
Note: The device manager app may not be compatible with the most current version of the tablet operating system.
1.6.3 Intended information flows
Data from the implantable device flows through the device manager components in the following sequential order:
1. Implantable device
2. Patient connector
3. Implantable device app
All information in transit is protected for security.
1.7 Reporting errors and serious incidents
If a serious incident related to the CareLink SmartSync app occurs, immediately report the incident to Medtronic and the applicable
competent authority or regulatory body.
If you find information in this app help that is incorrect, contact a Medtronic representative.
2 Overview of the interface
2.1 Areas
The implantable device app is divided into 3 areas:
• The 2 status bars at the top of the screen display status information about the device manager components and the patient
session. The top status bar also displays the SUSPEND, RESUME, and EMERGENCY buttons, as well as the (Menu) button.
• The Live Rhythm Monitor, which appears below the status bars, displays real-time waveform traces.
• The work area, which is the largest area of the screen, displays the parameters, fields, and controls for the current window.
2.2 Status indicators
The status bar at the top of the screen displays the status of the base, the tablet, the patient connector, and the implantable device.
For more information, tap
Table 1. Base status indicators
Indicator Description
Table 2. Tablet status indicators
Indicator Description
on the status bar.
The base is connected to the device manager app.
The base is connected to the device manager app, and an analyzer session is in progress.
There is no base connected to the device manager app.
Note: A green dot indicates that a base was recently connected
to the device manager app, but is not connected now.
The tablet is connected to an IT network.
Note: The status indicator shows the remaining percentage of
the tablet battery.
The tablet is not connected to an IT network.
Note: The status indicator shows the remaining percentage of
the tablet battery.
7
Page 8

Table 3. Patient connector status indicators
Indicator Description
The patient connector is connected to the device manager app.
The patient connector battery is good.
The patient connector is connected to the device manager app.
The patient connector is charging.
The patient connector is connected to the device manager app.
The patient connector battery is low.
The patient connector is connected to the device manager app.
The patient connector battery is critically low.
There is no patient connector connected to the device manager
app.
Note: A green dot indicates that a patient connector was recently
connected to the device manager app, but is not connected now.
Table 4. Implantable device status indicators
Indicator Description
The implantable device is connected to the patient connector.
The connection is either strong or moderate. To improve the connection, move the implantable device and the instruments closer
together and away from anything else that causes interference.
The implantable device is connected to the patient connector.
The connection is weak. To improve the connection, move the
implantable device and the instruments closer together and away
from anything else that causes interference.
The connection with the implantable device has been lost. The
device manager attempts to establish the connection and restore
communication. Move the tablet closer to the base or the patient
connector and away from anything else that causes interference.
Table 5. Connection status indicators
Indicator Description
The Bluetooth connection between the device manager app and
the base or the patient connector is strong.
The Bluetooth connection between the device manager app and
the base or the patient connector is moderate.
To improve the connection, move the tablet closer to the base or
the patient connector and away from anything else that causes
interference.
The connection between 2 system components has been lost.
Move the 2 system components closer together and away from
anything else that causes interference. The device manager
attempts to establish the connection and restore communication.
There is a USB connection between the base and the patient
connector.
The connection with the implantable device is weak.
To improve the connection, move the implantable device and the
instruments closer together and away from anything else that
causes interference.
The connection with the implantable device is moderate.
8
Page 9

Table 5. Connection status indicators (continued)
Indicator Description
To improve the connection, move the implantable device and the
instruments closer together and away from anything else that
causes interference.
The connection with the implantable device is strong.
3 Reinterrogating the implanted device
3.1 Reinterrogate the implanted device
During a device implant or a patient follow-up appointment, you can reinterrogate the implanted device.
Note: For information on how to perform an initial interrogation, refer to the device manager app help.
1. Tap > INTERROGATE.
2. If the INTERROGATE HOW MUCH? window appears, select one of the following options, then tap START:
• To display all of the information stored on the implanted device, tap All.
• To display only the information stored on the implanted device since the last patient session, tap Since Last Session.
4 Responding to device status indicator warnings
4.1 About device status indicator warnings
The implantable device automatically monitors for internal conditions that affect implantable device operation and require attention.
If any such conditions occur, the implantable device saves the status indicator to its memory. The implantable device app displays the
status indicator warning in a message window when you interrogate the implantable device. The status indicator warning is also
displayed in the OBSERVATIONS area on the Quick Look screen.
Caution: If the implantable device app displays a status indicator warning for the implantable device, contact a Medtronic
representative.
4.2 Respond to the AT/AF THERAPIES DISABLED warning
Respond to the AT/AF THERAPIES DISABLED status indicator warning for the implantable device:
1. Complete one of the following actions:
• If the status indicator warning has an OK button, tap OK to close the message.
• If the status indicator warning has a CLEAR button, tap CLEAR to remove the status indicator.
2. Review the arrhythmia episode records and evaluate atrial lead integrity.
3. Adjust therapy parameters as needed.
4.3 Respond to the WARNING – DEVICE ELECTRICAL RESET warning
If the device is not yet implanted, do not implant the device. Contact a Medtronic representative.
A device reset is a safety feature that can automatically change parameter values or clear diagnostic data in response to a problem
with the implantable device memory. If a device status indicator warning for a reset appears, you must clear the device status indicator.
You may need to reprogram the implantable device to the desired parameters.
After a device reset, the device records a status indicator. For a device reset that requires attention, the status indicator warning for
the implantable device describes how the reset affected device data. Read the message accompanying the indicator and follow the
on-screen instructions carefully. If the message indicates that the reset affected implantable device parameters, you must reprogram
the implantable device to restore the previous settings.
1. Respond to the status indicator warning:
a. Remove any sources of electromagnetic interference (EMI).
b. Notify a Medtronic representative.
c. To clear the status indicator, tap CLEAR in the window.
A confirmation window appears, indicating that all previously interrogated data in the implantable device app will be
cleared.
d. Tap CONTINUE.
e. Interrogate the implantable device.
9
Page 10

2. Determine the events leading up to the device reset:
a. To determine the time and date of the device reset, note the time and date when counter data was last cleared.
b. If the device is implanted, determine what the patient was doing at the time and date of the device reset.
c. Save the implantable device data.
d. Send the implantable device data to a Medtronic representative.
3. Reprogram the implantable device:
a. Verify the programmed device parameters and reprogram them as necessary.
Note: If the reset affected the parameters, the implantable device automatically paces in VVI mode at 65 bpm until the
parameters are reprogrammed.
b. Verify that the implantable device date and time are correct. If necessary, reprogram the date and time.
c. To verify that the battery voltage of the implantable device is acceptable, check the BATTERY AND LEAD
MEASUREMENTS window.
d. Conduct lead impedance and pacing threshold tests as desired.
4.4 Respond to the SERIOUS DEVICE ERROR warning
If the implantable device app displays a SERIOUS DEVICE ERROR status indicator warning, contact a Medtronic representative.
Immediate replacement of the device is recommended.
To respond to the SERIOUS DEVICE ERROR status indicator warning, complete the following actions:
1. To clear the status indicator, tap CLEAR in the window.
A confirmation window appears, indicating that all previously interrogated data in the implantable device app will be cleared.
2. Tap CONTINUE.
3. To verify that the battery voltage of the implantable device is acceptable, check the BATTERY AND LEAD MEASUREMENTS
window.
4. Verify the programmed device parameters and reprogram them as necessary.
Note: The implantable device automatically paces in VVI mode at 65 bpm until the parameters are reprogrammed.
5 Using the Live Rhythm Monitor
5.1 About the Live Rhythm Monitor
The Live Rhythm Monitor displays markers and telemetered EGM waveform traces from the implanted device. If the device manager
app is connected to the base, the Live Rhythm Monitor displays ECG waveform traces from the base.
During patient sessions, you can view live waveform traces, freeze waveform traces, and access waveform strips.
In addition to waveform traces, the Live Rhythm Monitor displays the following information:
• The current heart rate and interval measured by the implanted device
• Annotations above the waveform trace showing when programming occurred (if parameters have been programmed)
The display of waveform traces in the Live Rhythm Monitor varies, depending on the EGM sources that you select during data
collection setup.
5.2 Markers
Markers on the waveform trace indicate events such as pacing, sensing, detection, and delivered therapies.
Note: Any interruption in telemetry with the implanted device can result in missing markers on the waveform trace display.
Markers that indicate atrial events appear above the waveform trace. Markers that indicate ventricular events appear below the
waveform trace.
Table 6. Pacing markers
Marker Description
Atrial pace
Atrial sense
Atrial refractory sense
10
Page 11

Table 6. Pacing markers (continued)
Marker Description
Atrial sense in PVAB
Ventricular pace
Ventricular sense
Ventricular refractory sense
Proactive pace
Mode switch
Unrecognized marker
Biventricular pace
Table 7. Detection and therapy markers
Marker Description
AT/AF sense
Fast AT/AF sense
AT/AF detection
Fast AT/AF detection
Fast A&V detection
VT monitor detection
Tachycardia pace
5.3 Adjust the Live Rhythm Monitor display
To change the size, order, and presentation of waveforms, complete the following actions:
1. To expand the Live Rhythm Monitor, tap .
2. To change the size, color, and order of the waveform traces, complete the following actions:
• To change the waveform source, tap on the waveform source list and select a source.
• To decrease the size of the displayed waveform trace, tap .
• To adjust the size of the displayed waveform trace to its maximum size without clipping or overlapping other waveform traces,
tap .
• To increase the size of the displayed waveform trace, tap .
• To change the color of the waveform trace, tap and select a color, then close the window.
3. Configure the following additional adjustment options:
11
Page 12

Option Description
Clipping When ON, truncates the tops and bottoms of waveforms that
have high amplitudes.
ECG Filter When ON, can improve the clarity of the ECG in the presence
of interference.
Artifacts When ON, displays line boundaries at the beginning and end
of each wave. This feature is also known as pacing artifact
enhancement.
Sweep Speed Allows you to control how quickly the waveform trace is drawn
across the screen. When you select a fast sweep speed, the
waveform trace appears wide. When you select a slow sweep
speed, the waveform trace appears narrow.
NORMALIZE Adjusts the size of all displayed waveform traces to their max-
imum size without clipping or overlapping.
CALIBRATE Adds a reference signal to the waveform trace of ECG.
OK Closes the adjustment options.
4. To minimize the Live Rhythm Monitor, tap .
5.4 Freeze live waveform traces
To capture a waveform strip and to generate a report, complete the following actions:
1. From the Live Rhythm Monitor, tap .
2. To modify the waveform strip, use the options on the FROZEN STRIP window.
3. To generate a report of the waveform strip, complete the following actions:
a. Tap the PDF button.
b. Select the strips that you want to include in the report.
c. Tap GENERATE REPORT > OK.
6 Using the eStrip recorder
6.1 About the eStrip recorder
You can use the eStrip recorder to view waveform strips, add and modify waveform strips, and generate reports of waveform strips.
To open the eStrip recorder, tap > ESTRIP RECORDER. You can also open the eStrip recorder by freezing live waveform traces
( ) from the Live Rhythm Monitor.
When you open the eStrip recorder, the FROZEN STRIP window appears and displays the last 30 min of all waveform traces from the
Live Rhythm Monitor. You can scroll horizontally along the waveform traces, or you can quickly navigate a waveform trace by using the
Holter feature. Highlights on the waveform traces indicate waveform strips.
Waveform strips are available to view for the duration of the patient session, including strips that are older than 30 min. To view the
waveform strips, use the strips list or the Holter feature.
6.2 Modify the display of waveform traces
Modify the display of waveform traces using the following options from the FROZEN STRIP window:
• To change the sweep speed for the waveform traces, tap
When you select a fast sweep speed, the waveform trace appears wide. When you select a slow sweep speed, the waveform trace
appears narrow.
• To change the waveform source, tap on the waveform source list and select a source.
• To increase the size of the displayed waveform trace, tap . This option decreases the mV/mm value.
• To decrease the size of the displayed waveform trace, tap . This option increases the mV/mm value.
6.3 Configure waveform strip preferences
To set clipping and artifacts options, or to set the default duration for new waveform strip highlights, configure waveform strip
preferences:
1. From the FROZEN STRIP window, tap .
2. Use the following options:
on the sweep speed list and select a value.
12
Page 13

Option Description
Clipping When ON, truncates the tops and bottoms of waveforms that
have high amplitudes.
Show Artifacts When ON, displays line boundaries at the beginning and end
of each wave. This feature is also known as pacing artifact
enhancement.
HIGHLIGHT DURATION Allows you to set the default duration for all new waveform strip
highlights.
3. To save your preferences, tap OK.
6.4 Access waveform strips
To view, modify, and generate reports of waveform strips, complete the following actions in the FROZEN STRIP window:
1. To view waveform strips, perform one of the following actions:
• To select a waveform strip, tap STRIPS, then tap a waveform strip from the list.
Note: In the STRIPS list, the NOTES field displays or when the waveform strip includes a pinned caliper measurement
or annotation.
• To view the previous or next waveform strip, tap or .
2. To add or remove a waveform strip, perform one of the following actions:
• To add a waveform strip, tap the following button:
• To remove a waveform strip, tap its green header, then tap the following button:
Note: You cannot remove test strips or any strips that were automatically generated when you started the session.
3. To modify the waveform strip, use the options on the FROZEN STRIP window.
4. To generate a report of the waveform strip, complete the following actions:
a. Tap the PDF button.
b. Select the strips that you want to include in the report.
c. Tap GENERATE REPORT > OK.
6.5 Change the length of a waveform strip
To change the length of a waveform strip, complete the following actions:
Note: You cannot change the length of test strips or any strips that were automatically generated when you started the session.
1. From the FROZEN STRIP window, choose a strip, then tap its green header.
2. Drag the vertical border of the waveform strip to make it longer or shorter.
If you want to move the waveform strip, drag the horizontal border to the right or left.
6.6 Measure time intervals
To measure time intervals on the waveform strip, use the caliper tool:
1. From the FROZEN STRIP window, tap .
2. Use the following options:
• To adjust the caliper, drag .
• To walk the caliper, tap .
• To pin the caliper and include the caliper measurement in a strip report that you generate, tap .
• To undo or redo a pinned caliper, tap or .
3. To close the caliper tool, tap .
6.7 Draw notes
To annotate the waveform strip, draw notes on the waveform strip. If you generate a report of the strip, the notes that you draw on the
waveform strip are included in the report.
1. From the FROZEN STRIP window, tap
2. Draw on the waveform strip.
.
13
Page 14

3. Optionally, tap or to remove or reinsert drawings.
4. To disable the drawing mode, tap .
6.8 Edit the title of a waveform strip
To edit the title of a waveform strip, complete the following actions:
Note: You cannot edit the titles of test strips or any strips that were automatically generated when you started the session.
1. From the FROZEN STRIP window, choose a strip.
2. From the green header of the strip, tap the strip title.
3. Tap the strip title again to display the keyboard and enter a new title.
6.9 Use the Holter feature
To navigate quickly along a waveform trace, use the Holter feature in the FROZEN STRIP window:
1. To select the waveform trace that you want to view, tap
2. Tap HOLTER.
The blue rectangle indicates the section of the waveform trace that is displayed in the FROZEN STRIP window. A green
rectangle indicates a waveform strip.
3. Use the following options:
• To navigate along the waveform trace, tap and .
• Tap an area of the waveform trace to display that area in the FROZEN STRIP window.
on the top waveform source list and select a source.
7 Viewing summary data using the Quick Look screen
7.1 About the Quick Look screen
The Quick Look screen provides a summary of the most important indicators of the implanted-system operation and the patient’s
condition since the last patient session. The screen includes links to more detailed status and diagnostic information stored in the
implanted device.
Use the Quick Look screen to view the following information:
• Device and lead status information that indicates whether the implanted system is operating as expected
• Information about arrhythmia episodes and provided therapies, which helps to assess the patient’s clinical status since the last
follow-up appointment
• System-defined observations about unexpected conditions, along with suggestions on how to optimize the implanted device
settings
• Information to verify that the device is delivering biventricular pacing most or all of the time
Note: The Quick Look screen displays the information collected and stored in the implanted device memory since the last patient
session. However, the OBSERVATIONS section can also reflect programming changes made during the current patient session.
To update the Quick Look data during a patient session, reinterrogate the implanted device.
7.2 View the Quick Look screen
To view the Quick Look screen, tap
Section Description
REMAINING LONGEVITY Displays the estimated time remaining until Recommended Replacement Time (RRT).
IMPEDANCE (Ω)
THRESHOLD (V @ ms)
AMPLITUDE (mV)
> Quick Look. You can view the following information:
To view more details, tap REMAINING LONGEVITY.
Displays information about the lead status, which allows you to assess the performance
and integrity of leads and identify any unusual conditions.
The graphs display lead impedance, capture threshold, and sensing amplitude measurements recorded over the last 12 months. The graph legends show the most recent
measurements for each lead.
Use the following options:
• To view detailed lead trend data, tap LEAD TRENDS.
• To view more details about the most recent measurements, tap LAST MEASURED.
• Where applicable, to hide or show the atrial, RV, or LV lead data on the graphs, tap A,
RV, or LV.
14
Page 15

Section Description
% OF TIME Displays information that helps you to assess the patient’s AV conduction status and to
evaluate the effectiveness of programmed implanted device settings.
Note: The paced and sensed event counters do not count all events recorded by the
implanted device. Some device features (for example, Ventricular Safety Pacing) affect
the way events are counted. Also, due to rounding, the percentages may not add up to
100%.
TREATED Displays the number of treated arrhythmia episodes that occurred since the last patient
session.
To view more details, tap TREATED.
MONITORED Displays the number of monitored arrhythmia episodes that occurred since the last patient
session.
To view more details, tap MONITORED.
Cardiac Compass Opens the Cardiac Compass TRENDS window, which provides a picture of the patient’s
condition during the last 14 months. The trend information can help you assess whether
the implanted device therapies or antiarrhythmic drugs are effective.
RATE HISTOGRAMS Opens the RATE HISTOGRAMS window, which displays information about heart rates
recorded between patient sessions. The data can help you to monitor the patient’s condition and assess the effectiveness of therapies.
OBSERVATIONS Displays observations that are based on an analysis of programmed parameters and data
collected since the last patient session. The OBSERVATIONS section can also reflect
programming changes made during the current patient session. Observations alert you to
unexpected conditions related to implanted device and lead status, parameter settings,
arrhythmia episodes, and clinical status.
When you select one of the displayed observations, the arrow next to the OBSERVA-
TIONS section title becomes active if more information about the selected observation is
available. To view the relevant details, tap OBSERVATIONS.
8 Using emergency VVI pacing
8.1 Enable emergency VVI pacing
To quickly enable high-output ventricular pacing, program emergency VVI pacing:
1. Verify that telemetry is established between the implanted device and the patient connector.
2. Tap EMERGENCY.
3. Tap PROGRAM.
The implanted device delivers emergency VVI pacing and the EMERGENCY PROGRAM - SUCCESSFUL window appears.
4. Close the EMERGENCY PROGRAM - SUCCESSFUL window.
5. When the emergency is resolved, tap EXIT EMERGENCY to close the EMERGENCY - VVI PACING window.
6. Reprogram the implanted device settings to values appropriate for the patient.
9 Suspending and resuming tachyarrhythmia detection
9.1 Suspend and resume tachyarrhythmia detection
To suspend tachyarrhythmia detection temporarily within the implantable device, tap SUSPEND.
To resume tachyarrhythmia detection within the implantable device, tap RESUME.
10 Programming patient information
10.1 Program the patient information
To store information about the patient, the implantable device, and the lead for later use, enter and program the patient information into
the implantable device memory. When you program the information into the memory, the implantable device app includes the patient
name, the patient ID, and the serial number of the implantable device on reports.
Typically, you enter the patient information at the time of implant, but you can revise it at any time.
Note: The PATIENT INFORMATION screen should not be used in place of the patient’s medical chart. The PATIENT INFORMATION
screen is provided as an informational tool for the end user. The user is responsible for accurate input of patient information into the
software. Medtronic makes no representation as to the accuracy or completeness of the patient information that end users enter into
the PATIENT INFORMATION screen. MEDTRONIC SHALL NOT BE LIABLE FOR ANY DIRECT, INDIRECT, INCIDENTAL, OR
15
Page 16

CONSEQUENTIAL DAMAGES TO ANY THIRD PARTY WHICH RESULT FROM THE USE OF THE PATIENT INFORMATION
SUPPLIED BY END USERS TO THE SOFTWARE.
1. Tap > PATIENT INFORMATION.
2. On the PATIENT INFORMATION screen, tap each field, then enter or select the information.
Field Description
Patient Opens the Patient window, which allows you to enter the patient’s name.
Note: There is a limit of 30 characters.
ID Opens the ID window, which allows you to enter the patient ID.
Note: There is a limit of 15 characters.
Date of Birth Allows you to select the patient’s date of birth.
Serial Number Displays the serial number of the implantable device.
Lead 1… Opens the LEAD 1 window, which allows you to select the patient lead information.
If the lead information is not listed, tap MODIFY LIST and add the information.
Lead 2… Opens the LEAD 2 window, which allows you to select the patient lead information.
If the lead information is not listed, tap MODIFY LIST and add the information.
Lead 3… Opens the LEAD 3 window, which allows you to select the patient lead information.
If the lead information is not listed, tap MODIFY LIST and add the information.
Implant… Opens the IMPLANT window, which allows you to enter the implant date and lead measurements. Alter-
natively, you can export lead data from a concurrent analyzer session.
Note: During the device implant, consider making the measurements in a concurrent analyzer session. You
can export measurements directly to the IMPLANT window. Otherwise, select a value for each parameter.
History… Opens the HISTORY window, which allows you to select the patient’s clinical conditions.
EF, on Opens the Ejection Fraction window, which allows you to select the ejection fraction value. Also allows you
to select the measurement date.
Physician Opens the PHYSICIAN NAME/PHONE window, which allows you to select the physician’s name and phone
number from a list.
To add physician information to the list, tap MODIFY LIST and add the information.
Phone Opens the PHYSICIAN NAME/PHONE window, which allows you to select the physician’s name and phone
number from a list.
To add physician information to the list, tap MODIFY LIST and add the information.
Hospital Opens the HOSPITAL window, which allows you to select the hospital.
To add hospital information to the list, tap MODIFY LIST and add the information.
Last Update Displays the last date on which changes to patient information were programmed into the implantable device
memory.
Notes Opens the Notes window, which allows you to enter notes about the patient or other information.
Note: There is a limit of 80 characters.
Note: When the entries are too long to display in the fields, the implantable device app displays truncated versions of the entries.
For example, the Patient field displays a truncated version of the patient name if the name does not fit in the display field. The
Patient Information Report displays the full entry.
3. Tap PROGRAM.
4. To create the Patient Information Report, tap the PDF button.
11 Programming implantable device settings
11.1 Parameter symbols
The implantable device app can display symbols next to parameter values to convey their status or other information.
Table 8. Symbols that appear with parameter values
Symbol Name Description
Interlock The parameter value conflicts with the setting of another present or pending value. Select another
value or resolve the conflicting parameter value before programming the parameter.
Warning A warning message exists regarding that value. To view the message, tap the message symbol next
to the PROGRAM button or reselect that parameter.
16
Page 17
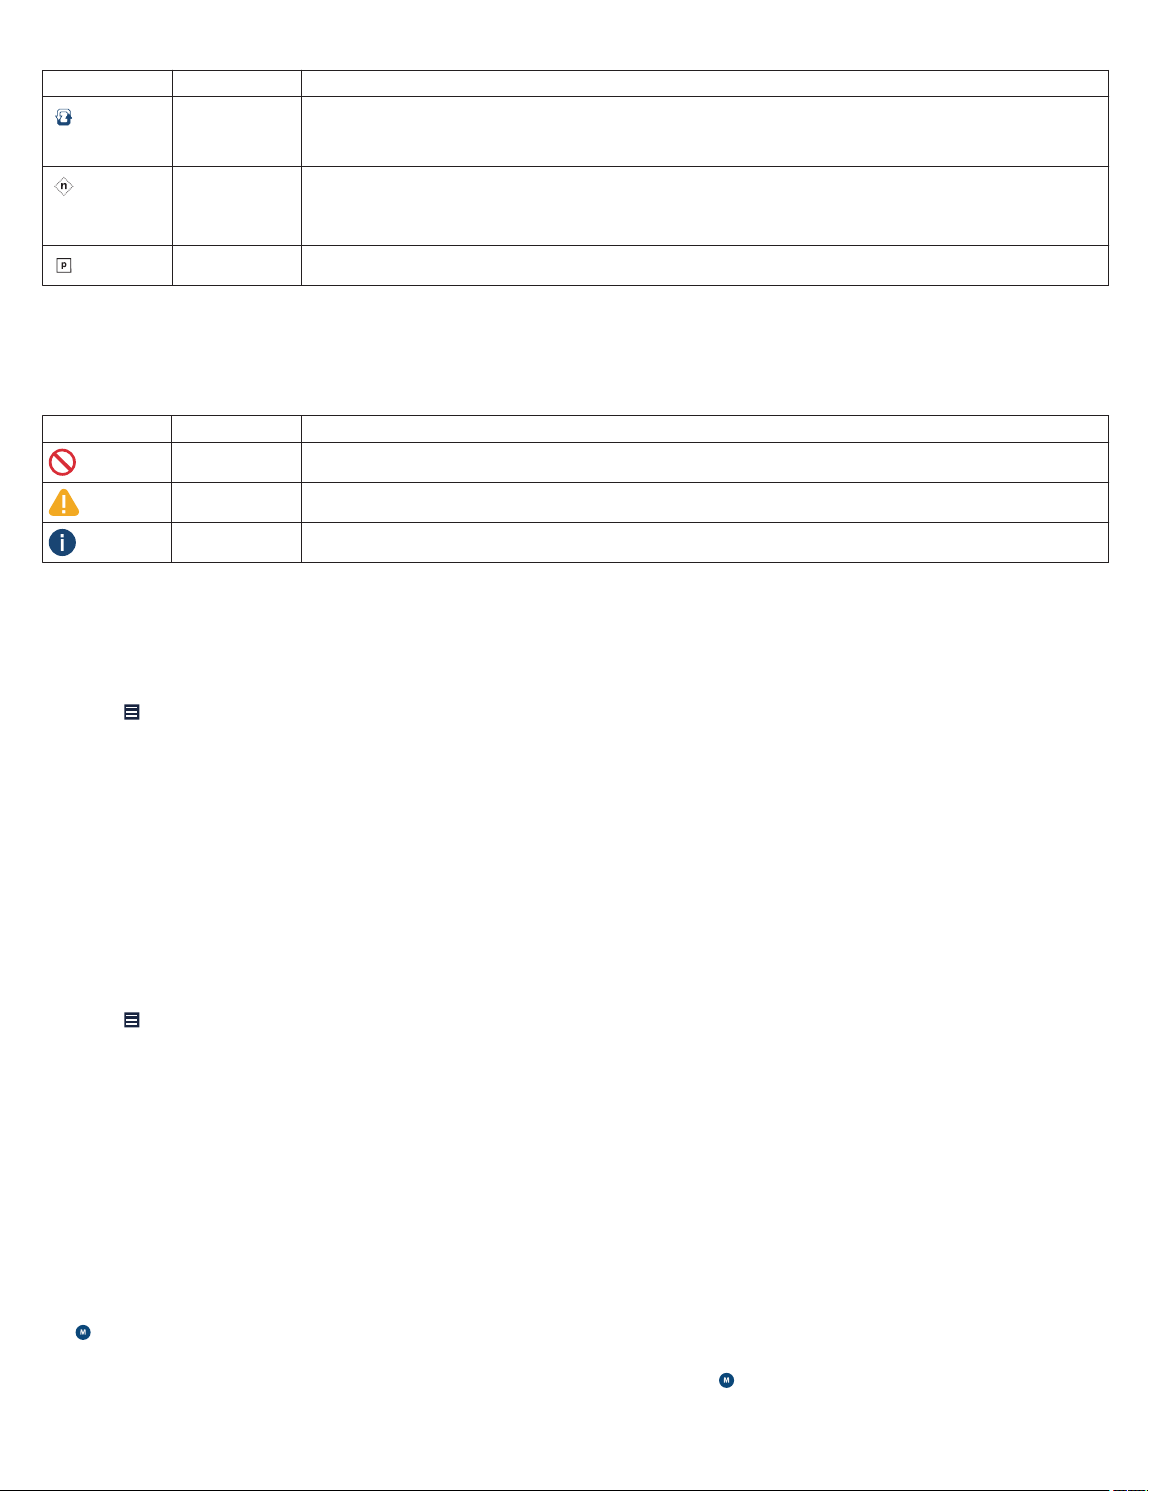
Table 8. Symbols that appear with parameter values (continued)
Symbol Name Description
Adaptive The programmed value can be changed automatically by the implantable device. The symbol does
not necessarily indicate that the parameter value has been adapted from a previously programmed
value, only that it is able to be adapted.
Nominal The value is the Medtronic nominal value.
Note: If the nominal value is also the programmed value, the Programmed symbol appears instead
of the Nominal symbol.
Programmed Indicates that the value is the programmed value.
The implantable device app displays message symbols next to the PROGRAM button. When you tap the message symbol, additional
parameter information appears.
If there are multiple messages about the pending parameter values, the symbol for the most significant message appears.
Table 9. Message symbols
Symbol Name Description
Interlock A parameter interlock exists. Programming is restricted until the interlock conflict is resolved.
Warning There is a warning associated with programming 1 or more of the pending parameter values.
Informational There is an informational message regarding 1 or more of the parameter values.
11.2 Program the parameters
To control the implantable device functions and data collection capabilities, program the parameters.
The parameters that you can view and program appear as active fields. Some active fields pertain to only 1 parameter, while other
fields provide access to groups of parameters. If a parameter cannot be programmed, no active field appears next to its name.
1. Tap > PARAMETERS.
2. Tap each field and change the value.
The implantable device app displays the new values with a dashed border. The dashed border signifies that the values are
pending.
3. Tap PROGRAM.
The pending values are programmed to the implantable device memory.
11.3 Create custom parameter sets
Create and save sets of parameter values for retrieval in either the current patient session or in subsequent patient sessions.
You can save and access a custom set of parameter values for a particular clinical situation. For example, you may want to save a set
of parameter values for an initial implant setting, for a specific disease state, or for situations in which you must repeatedly program
a particular set of parameters. The set of parameter values that you save can include both programmed and pending values.
1. Tap > PARAMETERS.
2. On the PARAMETERS screen, make the desired parameter selections.
3. Tap SAVE & GET… > ADD NEW.
4. Enter a name for the parameter set.
5. Tap OK > SAVE.
If a parameter set exists with that name, confirm that you want to replace the existing set with a new set or change the name of
the new parameter set.
11.4 Retrieve parameter sets
Parameter sets are collections of parameter values.
The implantable device app includes 3 types of parameter sets:
• Medtronic Nominals – Parameter values that Medtronic suggests for the implantable device. You cannot customize or delete
Medtronic Nominals.
• Initial Interrogation Values – Permanently programmed parameter values as determined by the first interrogation of the
implantable device during the patient session. You cannot customize or delete Initial Interrogation Values.
17
Page 18

• Custom – Sets of parameter values that you create for a particular clinical situation. For example, you may want to save a set of
parameter values for an initial implant setting, for a specific disease state, or for situations in which you must repeatedly program
a particular set of parameters.
1. Tap > PARAMETERS > SAVE & GET….
2. Tap the parameter set you want to retrieve, then tap SET PENDING.
3. On the PARAMETERS screen, tap PROGRAM.
The pending values are programmed to the implantable device memory.
11.5 Program data collection preferences
To control how the implantable device collects and transmits data, program the data collection preferences:
1. Tap > PARAMETERS > Data Collection Setup….
2. Configure the following options.
Note: Data collection is automatic and you cannot turn it off.
Option Description
LECG SOURCE Allows you to select the source for the Leadless ECG (LECG) waveform that
appears on the LECG channel.
LECG provides a far-field view of cardiac activity without connecting surface ECG
leads to the patient. The LECG waveform depicts the signal from 3 electrodes
attached to the outside of the device can. To select the best signal from the 3
vectors, choose A, B, or C.
The SOURCE parameter controls the signal that appears on the Live Rhythm
Monitor.
EGM 1 SOURCE
EGM 2 SOURCE
EGM 3 SOURCE
LECG RANGE
EGM 1 RANGE
EGM 2 RANGE
EGM 3 RANGE
Monitored Sources Allows you to select the 2 EGM channels on which to store episode records.
Pre-arrhythmia EGM Allows you to choose if you want to store the EGM data that the implantable device
V. Sensing Episodes… Allows you to select the thresholds that trigger the collection of ventricular sensing
Device Date/Time… Allows you to program the date and time of the implantable device to the date and
Holter Telemetry Duration Allows you to either enter the duration for Holter telemetry or to disable Holter
Allows you to select the source electrodes that the implantable device uses to
record EGM signals.
The SOURCE parameters control the signal that appears on the Live Rhythm
Monitor.
Note: The cardiac interval measurements of the implantable device are based on
the signals sensed through the programmed sensing polarity (not the stored diagnostic EGM). The EGM source selection does not affect bradycardia pacing or
tachyarrhythmia detection.
Allows you to select the range of the LECG and EGM signals. The lower the setting,
the higher the resolution.
When the signal is illegible or clipped, change the range selection.
The RANGE parameters control the signal that appears on the Live Rhythm Monitor.
collects before an episode begins.
Pre-arrhythmia EGM storage keeps the EGM circuitry enabled at all times, which
reduces implantable device longevity.
When you select On − 1 months or On − 3 months, the implantable device auto-
matically turns off pre-arrhythmia EGM storage when the time period expires.
episodes.
time of your tablet.
• Device Date/Time – Displays the date and time that the implantable device
currently uses.
• Tablet Date/Time – Displays the date and time that the tablet currently uses.
• SET TO TABLET TIME – Allows you to program the new date and time that the
implantable device will use based on the date and time of your tablet.
Note: The implantable device app expresses time in the 24-hour format or in the
12-hour format, depending on your tablet settings.
telemetry. When you enable Holter telemetry, the implanted device continuously
transmits EGM and marker data for the selected duration, regardless of the presence of the patient connector.
18
Page 19

Option Description
CLEAR DATA… Allows you to clear all stored data except trend data and lifetime counters.
Note: Cleared data is not recoverable.
AT/AF and OptiVol Settings… Allows you to select the thresholds for the following Quick Look observations:
• AT/AF Daily Burden
• Avg. V. Rate During AT/AF
• OptiVol Threshold
3. To program any pending changes, tap OK > PROGRAM.
11.6 View parameter changes
Review the list of parameter changes that you made during the patient session:
1. Tap > SESSION > CHANGES THIS SESSION.
2. Review the list of parameter changes.
3. To create a report, tap the PDF button.
12 Viewing and analyzing diagnostic data
12.1 View OptiVol events
View the logs of OptiVol events that are stored in the implanted device:
1. Tap
2. To create a report, tap the PDF button.
12.2 View clinical diagnostic data
12.2.1 About clinical diagnostic data
The implanted device collects and stores diagnostic data, which you can use to assess the patient’s clinical conditions and the
effectiveness of therapies.
> DATA > OptiVol EVENTS.
12.2.2 View arrhythmia episode data
View summary and detailed diagnostic data for arrhythmia episodes:
1. Tap
2. Optionally, tap the PDF button to create a report that includes data for all arrhythmia episodes.
3. On the ARRHYTHMIA EPISODES window, use the following options:
4. Tap the episode you want to view, then tap .
5. To change the display of the episode data, use the available options:
> DATA > ARRHYTHMIA EPISODES.
Note: The implantable device app is unable to display the data for an episode that is in progress. These episodes are labeled
(Episode in progress) and cannot be viewed in the episode records until the episode terminates and an interrogation is
performed. However, if flashback data is available for an episode in progress, you can view the flashback data.
• To filter the list by episode type, tap VT/VF, AT/AF, or Fast A&V.
• To filter the data by type, tap the View list, then select the data type.
• To display episodes that are longer than a specific amount of time, tap the box next to and choose the minimum episode
duration.
Option Description
FLASHBACK Displays a graph of atrial and ventricular intervals, including any stored flashback data,
that the implanted device captured. In the FLASHBACK view, use the available options:
• To switch the y-axis, tap Rate or Interval.
• To show or hide interval data, tap V-V or A-A.
• To select a portion of the data to view in PLOT format, tap and to position the
yellow box.
PLOT Displays a graph of cardiac events. In the PLOT view, use the available options:
• To switch the y-axis, tap Rate or Interval.
• To show or hide interval data, tap V-V or A-A.
• To select a portion of the data to view in EGM format, scroll horizontally to position the
yellow box.
19
Page 20

Option Description
EGM Displays the stored EGM data.
To choose an interval to display, tap the atrial interval list.
TEXT Displays a text summary of the episode.
6. To create a report that includes data for the episode that you are viewing, tap the PDF button.
Note: If the PDF button is disabled in the current tab, tap FLASHBACK, then tap the PDF button.
7. Optionally, complete the following actions:
• To view the previous or next episode in the list, tap or .
• To minimize the view of episode details, tap .
12.2.3 View ventricular sensing episode data
View ventricular sensing episodes to help you analyze periods of time when ventricular pacing is inhibited because of the patient’s
intrinsic ventricular activity:
1. Tap > DATA > VENTRICULAR SENSING EPISODES.
2. Optionally, tap the PDF button to create a report that includes data for all ventricular sensing episodes.
3. Tap the episode you want to view, then tap .
4. To change the display of the episode data, use the available options:
• To choose an interval to display, tap the atrial interval list.
• To view more of the episode data, scroll horizontally.
5. To create a report that includes data for the episode that you are viewing, tap the PDF button.
6. Optionally, complete the following actions:
• To view the previous or next episode in the list, tap or .
• To minimize the view of episode details, tap .
12.2.4 View rate drop response episode data
View and analyze rate drop episodes and the events that cause rate drop episodes:
1. Tap > DATA > RATE DROP RESPONSE EPISODES.
2. Optionally, tap the PDF button to create a report that includes data for all rate drop response episodes.
3. Tap the episode you want to view, then tap .
4. To change the display of the episode data, use the available options:
Option Description
PLOT Displays a graph of cardiac events. In the PLOT view, use the available options:
• To switch the y-axis, tap Interval or Rate.
• To show or hide interval data, tap A-A or V-V.
• To select a period for which to view markers, tap and to position the yellow box.
MARKERS Displays markers for the episode.
To choose an interval to display, tap the atrial interval list.
TEXT Displays the Rate Drop Response settings that were in effect at the start of the program-
ming session.
5. To create a report that includes data for the episode that you are viewing, tap the PDF button.
6. Optionally, complete the following actions:
• To view the previous or next episode in the list, tap or .
• To minimize the view of episode details, tap .
12.2.5 View interrogation flashback data
View a graph that shows atrial and ventricular intervals that occurred before the most recent interrogation. The interrogation flashback
data allows you to assess the patient’s heart rhythm and performance of other features, such as Rate Response.
1. Tap > DATA > INTERROGATION FLASHBACK.
2. Use the available options:
Option Description
FLASHBACK Displays a graph of atrial and ventricular intervals, including any stored flashback data,
that the implanted device captured. In the FLASHBACK view, use the available options:
20
Page 21

Option Description
• To switch the y-axis, tap Interval or Rate.
• To show or hide interval data, tap A-A or V-V.
• To select a portion of the data to view in PLOT format, tap and to position the
yellow box.
PLOT Displays a graph of cardiac events. In the PLOT view, use the available options:
• To switch the y-axis, tap Interval or Rate.
• To show or hide interval data, tap A-A or V-V.
• To view more of the data, scroll horizontally.
3. To generate a report, tap FLASHBACK, then tap the PDF button.
12.2.6 View Cardiac Compass trend data
To assess the effectiveness of implanted device therapies and antiarrhythmia drugs, view the data about the patient’s conditions:
1. Tap > DATA > Cardiac Compass TRENDS.
2. To create a report, tap the PDF button.
12.2.7 View rate histogram data
View the heart rate data that the implanted device records between patient sessions. Use the heart rate data to monitor the patient’s
condition and the effectiveness of therapies.
1. Tap > DATA > RATE HISTOGRAMS.
2. To create a report, tap the PDF button.
12.2.8 View counter data
View the counter data, which allows you to analyze information about VT/VF episodes, AT/AF episodes, and therapy occurrences:
1. Tap > DATA > COUNTERS.
2. Select one of the following data types:
• VT/VF EPISODES
• AT/AF EPISODES
• AT/AF RX
3. To create a report, tap the PDF button.
12.3 View device and lead diagnostic data
12.3.1 About device and lead diagnostic data
The implanted device automatically measures and records daily device and lead performance data.
12.3.2 View battery and lead measurement data
To assess the most recent measurements and trended measurements of implanted device and lead performance, view the battery
and lead measurement data.
Warning: Replace the implanted device immediately if the implantable device app displays an End of Service (EOS) indicator. The
implanted device may lose the ability to pace, sense, and deliver therapy adequately after the EOS indicator appears.
Note: If the implantable device app displays the Recommended Replacement Time (RRT) indicator, contact a Medtronic
representative and the patient to schedule a replacement procedure.
1. Tap
2. Select the type of data you want to view:
3. To create a report, tap the PDF button.
12.3.3 View lead impedance trend data
To analyze the automatic daily lead impedance measurements, view the lead impedance trend data:
> DATA > BATTERY AND LEAD MEASUREMENTS.
• Remaining Longevity / Battery Voltage
• Sensing Integrity Counter
• Atrial Lead Position Check
• Lead Impedance
• Sensing
21
Page 22

1. Tap > DATA > LEAD IMPEDANCE TRENDS.
2. Configure the display options:
• Select a measurement trend.
• If applicable, tap the polarity type you want to view.
3. To create a report, tap the PDF button.
The graph displays up to 15 daily measurements and up to 80 weekly summary measurements. Gaps in the graph occur when the
implanted device fails to complete automatic lead impedance measurements.
Note: Significant and sudden changes in lead impedance can indicate a problem with the lead.
12.3.4 View capture threshold trend data
To evaluate Capture Management operations and the effectiveness of the pacing output values, view and analyze the capture
threshold trend data:
1. Tap > DATA > CAPTURE THRESHOLD TRENDS.
2. Configure the display options:
• Select the chamber data you want to view.
• To view the last 15 days of threshold measurement data, tap LAST 15 DAYS DETAIL.
3. To create a report, tap the PDF button.
The graph displays up to 15 daily measurements and up to 80 weekly summary measurements. Gaps in the graph occur when the
implanted device fails to complete daily capture threshold measurement.
When either the Pulse Width or the Pace Polarity parameter has been reprogrammed, a line appears on the graph to show when
the reprogramming occurred.
The implanted device measures the capture threshold data only when the Capture Management parameter is configured as
Adaptive or Monitor.
Note: Significant and sudden changes in the pacing threshold can indicate a problem with the lead.
12.3.5 View P/R wave amplitude trend data
View and analyze the daily sensing amplitude measurements:
1. Tap > DATA > P/R WAVE AMPLITUDE TRENDS.
2. Select the amplitude measurement type that you want to view.
3. To create a report, tap the PDF button.
The graph displays up to 15 daily measurements and up to 80 weekly summary measurements. The daily measurements are the
median values of the amplitudes of 9 normal intrinsic sensed events. Gaps in the graph occur when the implanted device is unable
to collect 9 amplitude measurements on a given day.
Note: Significant and sudden changes in the sensing amplitude can indicate a problem with the lead.
13 Performing system tests
13.1 Configure the test preferences for the Live Rhythm Monitor
To view the EGM for the heart chamber you test, configure the test preferences for the Live Rhythm Monitor:
1. Tap > SESSION > PREFERENCES > TESTS.
2. Select one of the following options:
• To display the EGM for the heart chamber you test, tap Auto-arrange waveforms.
• To leave the waveform display unchanged during a test, tap Do not auto-arrange waveforms.
3. Tap OK.
13.2 Perform an Underlying Rhythm Test
To evaluate the patient’s intrinsic heart rhythm by temporarily inhibiting the pacing output of the implanted device, use the Underlying
Rhythm Test.
Caution: While the Underlying Rhythm Test is in progress, patients are not receiving pacing support because the implanted device
is temporarily programmed to a nonpacing mode. Pacing is inhibited as long as you press and hold the INHIBIT Press and Hold
button. Carefully consider the implications of performing this test on pacemaker-dependent patients.
22
Page 23

Notes:
• If telemetry between the implantable device app and the implanted device is paused or lost during an Underlying Rhythm Test,
the test stops and the implanted device parameters revert to permanently programmed values.
• During system tests, tachyarrhythmia detection is suspended.
1. Tap > TESTS > UNDERLYING RHYTHM.
2. Verify the permanent values for Mode and Lower Rate.
3. To help avoid sudden changes in ventricular rate, consider lowering the programmed lower rate:
a. Tap > PARAMETERS > Lower Rate.
b. Select an appropriate rate.
c. To program any pending changes, tap PROGRAM.
d. To return to the UNDERLYING RHYTHM screen, tap > TESTS > UNDERLYING RHYTHM.
4. Press and hold INHIBIT Press and Hold.
5. Observe the display of the heart’s intrinsic rhythm.
Note: Pacing is inhibited until you release INHIBIT Press and Hold.
6. Release INHIBIT Press and Hold.
7. If the Lower Rate value was changed before conducting the Underlying Rhythm Test, return to the PARAMETERS screen to
return the rate to its original value.
13.3 Perform a Sensing Test
To assess lead integrity and sensing performance, perform the Sensing Test, which measures P-wave and R-wave amplitudes.
The Sensing Test allows you to temporarily program pacing parameters to increase the likelihood that sensed events will occur.
Sensing amplitude measurements taken during a Sensing Test may include events that are atypical or a result of oversensing (for
example, PVCs or far-field R-waves). These events are excluded from the daily automatic sensing amplitude measurements that the
implanted device collects and reports in the sensing amplitude trends. Because of the difference in measurement operations, Sensing
Test results can differ from the measurements reported in the sensing amplitude trend data.
Caution: Use caution when selecting temporary settings for pacemaker-dependent patients. These patients may not receive
adequate pacing support while sensing amplitude measurements are being obtained.
Notes:
• The Sensing Test does not function when the device is operating in an asynchronous pacing mode, such as VOO. Program the
device to a pacing mode other than an asynchronous pacing mode before performing a Sensing Test.
• The Sensing Test does not function when polarity parameters are set to Configure. Program polarity parameter values manually
or allow implant detection to complete before performing a Sensing Test.
• During a Sensing Test, reduce the pacing rate gradually to minimize patient symptoms associated with abrupt changes in heart
rate.
• If telemetry between the implantable device app and the implanted device is paused or lost during a Sensing Test, the test stops
and the implanted device parameters revert to permanently programmed values.
• During system tests, tachyarrhythmia detection is suspended.
1. Tap > TESTS > SENSING.
2. Verify or change the TEST VALUE parameter values for Mode and AV Delay.
3. Tap START Measurement.
4. Observe the Live Rhythm Monitor for an intrinsic rhythm. If consistent pacing continues to occur, tap to decrease the Lower
Rate.
The implanted device measures amplitudes only for intrinsic events. The maximum amplitude value that the Sensing Test
measures is 20 mV. When the amplitude measures over 20 mV, the implantable device app displays the results as >20 mV. When
there are no intrinsic events and the pacing rate remains the same, the Sensing Test automatically stops.
When the Sensing Test successfully completes, it automatically stops. The implantable device app displays the measurements
and the pacing settings return to their programmed values. To stop the test manually before it completes, tap STOP and
Restore.
5. To compare the Sensing Test measurements with the automatic daily sensing amplitude measurements, tap P/R WAVE
AMPLITUDE TRENDS.
6. To create a report, tap the PDF button.
Note: Do not adjust the A. Sensitivity and RV Sensitivity values based on the results of the Sensing Test. For more information, refer
to the clinician manual for the implantable device.
23
Page 24

13.4 Perform a Pacing Threshold Test
13.4.1 Measure pacing thresholds
To determine the patient’s pacing thresholds, use the Pacing Threshold Test. Use the test results to help you select amplitude and
pulse width settings that ensure capture while minimizing output to maximize battery longevity.
Notes:
• The implanted device provides independently selected outputs for each pacing vector. You can measure these vectors separately
and apply individual safety margins to each threshold.
• If telemetry between the implantable device app and the implanted device is paused or lost during a Pacing Threshold Test, the
test stops and the implanted device parameters revert to permanently programmed values.
• During system tests, tachyarrhythmia detection is suspended.
1. Tap > TESTS > PACING THRESHOLD.
2. Verify or change the values:
• To change how the test operates, tap Test Type, select new values, then tap OK.
• To change the pacing parameters applied during the test, select new values in the TEST VALUE column.
• To change the sensing parameters applied during the test, tap Additional Settings…, select new values in the TEST
VALUE column, then tap OK.
Note: The programmable and default values depend on the programmed values for bradycardia pacing therapy.
3. Press and hold TEST Press and Hold, then observe the Live Rhythm Monitor for loss of capture.
4. When loss of capture occurs, release TEST Press and Hold.
5. On the results window, verify the detected pacing threshold for the loss of capture:
• To update the detected pacing threshold, tap the value in the THRESHOLD column.
• To view the test strip from the most recent pacing threshold test, tap the Test Strip icon.
6. Ensure that the amplitude and pulse width values provide an adequate safety margin above the pacing threshold.
7. To change the programmed pace polarity value, tap the pace polarity value in the PERMANENT column, select the desired
value, then tap PROGRAM.
8. To change the programmed amplitude or pulse width values, complete the following actions:
a. In the PERMANENT column, tap the value.
b. On the CAPTURE window, select the desired values, then tap OK.
c. Tap PROGRAM.
9. To view the ending value and permanent value for the ventricular pace blanking, atrial pace blanking, or PVARP parameters,
complete the following actions:
a. Tap Additional Settings….
b. To return to the results window, tap OK.
10. To view a test strip from the most recent pacing threshold test, complete the following actions:
a. Tap the Test Strip icon.
b. Close the window to return to the results window.
13.5 Perform a Lead Impedance Test
To test the integrity of the implanted lead system by measuring the impedance of the atrial and ventricular pacing electrodes, use the
Lead Impedance Test.
Notes:
• If telemetry between the implantable device app and the implanted device is paused or lost during a Lead Impedance Test, the
implanted device continues to measure impedance values. When the test completes, the implanted device parameters revert to
permanently programmed values.
• During system tests, tachyarrhythmia detection is suspended.
1. Tap
2. Tap START Measurement.
> TESTS > LEAD IMPEDANCE.
When the Lead Impedance Test completes, the implantable device app displays the measured impedance values for the tested
polarities.
To stop the test manually before it completes, tap STOP.
24
Page 25

3. Optionally, complete 1 or more of the following actions:
• To view the measurements for all lead polarities, tap ALL MEASURED POLARITIES.
• To compare the test results to daily automatic lead impedance measurements, tap LEAD IMPEDANCE TRENDS.
• To save the Lead Impedance Test Report, tap the PDF button.
13.6 Perform a CardioSync Optimization Test
To measure the patient’s intrinsic AV intervals and the waveform widths of the P-wave and the QRS complex, use the CardioSync
Optimization Test. Based on these measurements, the test provides optimized values for CRT parameters, including V. Pacing
configuration, V-V Pace Delay, Paced AV, and Sensed AV.
Test operation depends on the AdaptivCRT setting. If the AdaptivCRT parameter is programmed to an adaptive setting, the
CardioSync Optimization Test automatically programs the CRT parameters based on the test measurements. If the AdaptivCRT
parameter is programmed to Nonadaptive CRT, the values resulting from the CardioSync Optimization Test are set as pending
values.
Notes:
• The CardioSync Optimization Test is available if the permanently programmed pacing mode is DDD or DDDR.
• The Pacing Lower Rate must be faster than the Sensing Lower Rate. The default value for the Sensing Lower Rate is
40 bpm, and the default value for the Pacing Lower Rate is 80 bpm. These default values are suitable for most patients.
• If telemetry between the implantable device app and the implanted device is paused or lost during a CardioSync Optimization
Test, the implanted device continues to measure CRT values. When the test completes, the implanted device parameters revert
to permanently programmed values.
• During system tests, tachyarrhythmia detection is suspended.
1. Tap > TESTS > CardioSync.
Note: If the AdaptivCRT parameter is programmed to an adaptive setting, a message appears with a reminder that running the
test optimizes and programs AdaptivCRT parameters automatically. To dismiss this message, tap OK.
2. Verify or change the test values for Sensing Lower Rate and Pacing Lower Rate.
Notes:
• The Sensing Lower Rate value should be based on the patient’s intrinsic rate to allow atrial sensed events to occur while
considering the patient’s pacing needs.
• The Pacing Lower Rate value should be based on the patient’s intrinsic rate to cause atrial paced events to occur. This
adjustment may not be possible for intrinsic rates of 100 bpm or greater.
3. Tap START Test.
When the CardioSync Optimization Test is completed, the CardioSync OPTIMIZATION - RESULTS window appears
automatically.
4. If pending values appear in the OPTIMIZED column, select one of the following options:
• To program the pending optimized values into the implanted device, tap PROGRAM.
• To reset the pending values to their initial values, tap UNDO PENDING.
5. To view the test strip from the most recent pacing threshold test, tap the Test Strip icon.
6. To generate a report, tap the PDF button.
13.7 Perform a Magnet Test
To observe and document magnet mode operation while the implantable device is in a telemetry session, use the Magnet Test.
During magnet mode operation, the implantable device provides asynchronous pacing at a fixed rate. While the implantable device
is in a telemetry session, you cannot initiate magnet mode operation by placing a magnet over the device. The Magnet Test can
automatically record Live Rhythm Monitor strips showing magnet mode and non-magnet mode operation.
Notes:
• If telemetry between the implantable device app and the implanted device is paused or lost during a Magnet Test, the test stops
and the implanted device parameters revert to permanently programmed values.
• During system tests, tachyarrhythmia detection is suspended.
1. Tap > TESTS > MAGNET.
2. To automatically record a strip that shows non-magnet operation, select the Non-Magnet Strip checkbox.
3. To select a strip duration value for the automatically collected strips, tap Strip Durations and select a value.
4. Tap START Test.
Note: To stop the test manually before it completes, tap STOP Test.
25
Page 26

5. Tap the Magnet Strip icon or the Non-Magnet Strip icon to view the collected strip in the FROZEN STRIP window.
6. To create a report, tap the PDF button.
13.8 Perform EP Study tests to induce arrhythmias
13.8.1 About arrhythmia inductions
You can use electrophysiology study (EP Study) test functions to induce arrhythmias in order to evaluate the effectiveness of
tachyarrhythmia therapies.
The available arrhythmia induction methods are 50 Hz Burst, Fixed Burst, and Programmed Electrical Stimulation (PES).
Warning: Monitor the patient carefully when using an EP study function. Have an external defibrillator ready for use when inducing
any tachyarrhythmia. An induced tachyarrhythmia may degenerate to ventricular fibrillation.
Tachyarrhythmia detection is automatically suspended during all EP Study tests. If you manually suspend detection before the
induction, detection is not resumed automatically when the induction is delivered. All EP study inductions provide the option to resume
detection automatically after the induction is delivered.
The EP study functions use test values that do not change the programmed parameters of the implanted device. The test values take
effect when the induction or therapy begins. After the induction or therapy, the implanted device reverts to its programmed parameter
values for bradycardia pacing and tachyarrhythmia therapy.
13.8.2 Induce AT/AF with an atrial 50 Hz Burst
Use a 50 Hz Burst to induce AT/AF by delivering a rapid burst of AOO pacing pulses to the atrium.
You can also use an atrial 50 Hz Burst to treat AF episodes manually.
Warning: Monitor the patient carefully when using an EP study function. Have an external defibrillator ready for use when inducing
any tachyarrhythmia. An induced tachyarrhythmia may degenerate to ventricular fibrillation.
Note: If telemetry between the implantable device app and the implanted device is paused or lost during the test, the test stops and
the implanted device parameters revert to permanently programmed values.
1. Ensure that telemetry is established between the implanted device and the patient connector.
Note: Successful interrogation or programming confirms proper communication between the implanted device and the patient
connector.
2. Tap > TESTS > EP STUDY > 50 Hz Burst.
3. Set up the test using the following options:
• To maintain automatic detection and therapy during the test, select the Resume at BURST checkbox.
• To disable automatic detection and therapy in order to treat the induced episode with a manual therapy, clear the Resume
at BURST checkbox, then tap SUSPEND.
4. Verify or change the displayed test values.
Notes:
• To provide VOO Backup pacing during the pacing burst, tap VOO Backup… and set the VOO Backup pacing parameters.
• Regardless of the programmed V. Pacing parameter value, VOO Backup pacing is delivered to the right ventricle.
5. Press and hold 50 Hz BURST Press and Hold. As long as you hold 50 Hz BURST Press and Hold, the implanted device
continues delivering the induction (up to a maximum of 10 s). To end the induction, release the button.
Notes:
• To abort a therapy, tap ABORT.
• To resume detection after a manual therapy or after an induction that was delivered with the Resume at BURST checkbox
cleared, tap RESUME.
13.8.3 Induce AT or VT with Fixed Burst
Use Fixed Burst to induce AT or VT by delivering a set of asynchronous AOO or VOO pacing pulses.
Warning: Monitor the patient carefully when using an EP study function. Have an external defibrillator ready for use when inducing
any tachyarrhythmia. An induced tachyarrhythmia may degenerate to ventricular fibrillation.
Note: If telemetry between the implantable device app and the implanted device is paused or lost during the test, the test stops and
the implanted device parameters revert to permanently programmed values.
1. Ensure that telemetry is established between the implanted device and the patient connector.
Note: Successful interrogation or programming confirms proper communication between the implanted device and the patient
connector.
2. Tap > TESTS > EP STUDY > Fixed Burst.
26
Page 27

3. If applicable, select the chamber or chambers in which to perform the test.
4. Set up the test using the following options:
• To maintain automatic detection and therapy during the test, select the Resume at BURST checkbox.
• To disable automatic detection and therapy in order to treat the induced episode with a manual therapy, clear the Resume
at BURST checkbox, then tap SUSPEND.
5. Verify or change the displayed test values.
Notes:
• To provide VVI Backup pacing during an atrial Fixed Burst induction, tap VVI Backup… and set the VVI Backup pacing
parameters. If the test value for atrial Amplitude is greater than 6 V, crosstalk can inhibit VVI Backup pacing.
• Regardless of the programmed V. Pacing parameter value, VVI Backup pacing is delivered to the right ventricle.
6. Press and hold Fixed BURST Press and Hold. To end the induction, release the button.
Notes:
• To abort a therapy, tap ABORT.
• To resume detection after a manual therapy or after an induction that was delivered with the Resume at BURST checkbox
cleared, tap RESUME.
13.8.4 Induce AT or VT with PES
Use Programmed Electrical Stimulation (PES) to induce AT or VT by delivering a selectable number of pacing pulses and individually
selectable intervals. PES delivers a selectable number of pacing pulses at the S1S1 interval and then delivers up to 3 asynchronous
pacing pulses at S1S2, S2S3, and S3S4 intervals.
Warning: Monitor the patient carefully when using an EP study function. Have an external defibrillator ready for use when inducing
any tachyarrhythmia. An induced tachyarrhythmia may degenerate to ventricular fibrillation.
Note: If telemetry between the implantable device app and the implanted device is paused or lost during the test, the implanted device
continues the test. When the test completes, the implanted device parameters revert to permanently programmed values.
1. Ensure that telemetry is established between the implanted device and the patient connector.
Note: Successful interrogation or programming confirms proper communication between the implanted device and the patient
connector.
2. Tap > TESTS > EP STUDY > PES.
3. If applicable, select the chamber or chambers in which to perform the test.
4. Set up the test using the following options:
• To maintain automatic detection and therapy during the test, select the Resume at DELIVER checkbox.
• To disable automatic detection and therapy in order to treat the induced episode with a manual therapy, clear the Resume
at DELIVER checkbox, then tap SUSPEND.
5. Verify or change the displayed test values.
Notes:
• To provide VVI Backup pacing during an atrial PES induction, tap VVI Backup… and set the VVI Backup pacing
parameters. If the test value for atrial Amplitude is greater than 6 V, crosstalk can inhibit VVI Backup pacing.
• Regardless of the programmed V. Pacing parameter value, VVI Backup pacing is delivered to the right ventricle.
6. Tap DELIVER PES.
Notes:
• To abort a therapy, tap ABORT.
• To resume detection after a manual therapy or after an induction that was delivered with the Resume at DELIVER checkbox
cleared, tap RESUME.
13.9 Perform EP Study tests to deliver manual therapies
13.9.1 Perform manual therapies
You can use manual therapies to provide backup therapy during EP testing and to assess therapy effectiveness during follow-up
appointments.
The available manual therapies include Atrial Burst+, Atrial Ramp, Ventricular Ramp, Ventricular Burst, and Ventricular Ramp+ pacing
therapies.
Warning: Monitor the patient carefully when delivering a manual therapy. Have an external defibrillator nearby and ready for
immediate use. Potentially harmful tachyarrhythmias may occur during device testing.
27
Page 28

Notes:
• If the test value for atrial Amplitude is greater than 6 V, VVI Backup pacing during a manual atrial ATP therapy may be inhibited
by crosstalk.
• When a manual therapy is delivered, the device automatically aborts any induction or automatic therapy already in progress.
• If telemetry between the implantable device app and the implanted device is paused or lost during a manual therapy, the implanted
device continues the manual therapy. When the manual therapy completes, the implanted device parameters revert to
permanently programmed values.
• During system tests, tachyarrhythmia detection is suspended. Once a test is completed, detection remains suspended until you
tap RESUME.
The EP Study functions use test values that do not change the programmed parameters of the device. The test values take effect when
the induction or therapy begins. After the induction or therapy, the device reverts to its programmed parameter values for bradycardia
pacing and tachyarrhythmia therapy.
1. Ensure that telemetry is established between the implanted device and the patient connector.
Note: Successful interrogation or programming confirms proper communication between the implanted device and the patient
connector.
2. Tap > TESTS > EP STUDY.
3. Tap the desired manual therapy from the list of inductions and therapies.
4. If applicable, select the chamber in which to perform the test.
5. Verify or change the displayed test values.
6. Tap the appropriate button: DELIVER Ramp, DELIVER Burst, DELIVER Ramp+, or DELIVER Burst+.
Notes:
• To abort a therapy, tap ABORT.
• To resume detection after a manual therapy, tap RESUME.
13.9.2 Operation of manual therapies
In general, each manual therapy with a corresponding automatic therapy operates the same as its automatic counterpart.
Note: Manual ATP therapies deliver 1 sequence of the selected therapy.
Atrial Burst+ pacing therapy – Manual Atrial Burst+ pacing therapy delivers the selected number of initial atrial pulses, followed by
up to 2 additional pulses in AOO mode. All the initial atrial pulses are delivered at the same pacing interval, which is determined as
a percentage of the atrial tachycardia cycle length using the selected %AA Interval value. If the S1S2 option is selected, an additional
atrial pulse is delivered at an interval determined using the selected percentage. If the S2S3 Dec option is also selected, another atrial
pulse is delivered at an interval that is calculated by subtracting the selected decrement value from the previous interval.
Atrial Ramp pacing therapy – Manual Atrial Ramp pacing therapy delivers the selected number of pacing pulses to the atrium in
AOO mode. The pacing interval for the first pulse of the Ramp sequence is determined as a percentage of the atrial tachycardia cycle
length using the selected %AA Interval value. Each subsequent pulse in the sequence is delivered at progressively shorter intervals
by subtracting the selected interval decrement (Dec/Pulse) from each pulse.
Ventricular Ramp pacing therapy – Manual Ventricular Ramp pacing therapy delivers the selected number of pacing pulses in VVI
mode. The pacing interval for the first pulse of the Ramp sequence is determined as a percentage of the ventricular tachycardia cycle
length using the selected %RR Interval value. Each subsequent pulse in the sequence is delivered at progressively shorter intervals
by subtracting the selected interval decrement (Dec/Pulse) from each pulse.
Ventricular Burst pacing therapy – Manual Ventricular Burst pacing therapy delivers the selected number of pacing pulses in VOO
mode. The pacing interval for the Burst sequence is determined as a percentage of the ventricular tachycardia cycle length using the
selected %RR Interval value. The pulses within the sequence are delivered at the same pacing interval.
Ventricular Ramp+ pacing therapy – Manual Ventricular Ramp+ pacing therapy delivers the selected number of pacing pulses in
VOO mode. The pacing interval for the first pulse of the Ramp+ sequence is determined as a percentage of the ventricular tachycardia
cycle length using the selected R-S1(%RR) value. The second pulse is delivered at an interval determined using the selected
S1S2(%RR) percentage. Any remaining pulses in the sequence are delivered at the selected S2SN(%RR) percentage.
14 Using the SessionSync feature
14.1 View the SessionSync connection status
If your clinic uses a Paceart Optima system, the SessionSync feature enables you to transfer saved implantable device data and
reports to that system.
To view the SessionSync connection status, use the DATA SYNCHRONIZATION STATUS window.
28
Page 29

Notes:
• The SessionSync connection status is only visible if you configure the SessionSync feature. To configure the SessionSync
feature, refer to the device manager app help.
• The Paceart Optima system is only available in supported regions.
1. On the status bar, tap .
2. From DATA EXPORT STATUS, tap DETAILS….
3. On the DATA SYNCHRONIZATION STATUS window, view the SessionSync connection status:
• Available – The SessionSync feature is enabled and there is a connection between the device manager app and the
Paceart Optima system.
• Disconnected – The SessionSync feature is enabled, but the tablet is disconnected from the network.
• Not Available – The SessionSync feature is enabled, but the connection to the Paceart Optima system is unavailable.
The DATA SYNCHRONIZATION STATUS window also shows the following information.
Field Description
Clinic Name Name of the clinic that receives SessionSync transfers.
Gateway address IP address or hostname of the SessionSync gateway.
Transfers The implantable device data and reports that the SessionSync feature transfers to
the Paceart Optima system. The Transfers table displays the most recent transfer
at the top of the table.
• GENERATED – Date and time of the transfer
• RECEIVING CLINIC – Name of the clinic that receives the transfer
• STATUS – Status of the transfer
14.2 Send device data and reports to the Paceart Optima system
If your clinic uses a Paceart Optima system, the SessionSync feature enables you to transfer implanted device data and reports to that
system without ending the patient session:
1. Tap > SESSION > SessionSync > TRANSFER.
2. To close the message, tap OK.
14.3 End the patient session with the automatic SessionSync feature
If your clinic uses a Paceart Optima system, end the current session and use the automatic SessionSync feature to transfer
implantable device data and reports from the device manager to the Paceart Optima system:
1. Tap > END SESSION.
2. Ensure that the Automatic SessionSync checkbox is selected.
3. Tap END NOW > TRANSFER.
4. On the transfer message window, tap END NOW.
15 Using session tools
15.1 Connect to the base
Connect to the base before starting an analyzer session or to view ECG waveforms during a patient session:
1. Plug in the base to the AC power outlet (AC mains).
2. Verify that the base is disconnected from any previously connected device manager app.
3. To turn on the Bluetooth wireless technology in the base, press the grey button on the base.
When the base is available for a connection with the device manager app, the Bluetooth light on the base slowly flashes.
4. On the status bar, tap .
5. Near the base status indicator, tap SELECT.
6. Tap CONTINUE.
7. From the device manager app, follow the prompts to complete the base connection. For more information, refer to the device
manager app help.
For information on connecting the surgical cable or patient cable and ECG cable to the base, refer to the base technical manual, the
patient cable or surgical cable instructions for use (IFU), and the ECG cable IFU.
29
Page 30

15.2 Start or return to a concurrent analyzer session
To assess the correct placement and electrical performance of implanted leads, start or return to a concurrent analyzer session:
1. Verify that the base is on and connected to the implantable device app.
2. Tap , then tap one of the following:
• To start an analyzer session, tap LAUNCH ANALYZER.
• To return to a concurrent analyzer session, tap ANALYZER.
To return to the concurrent patient session from the analyzer, tap , then tap the name of the implantable device.
15.3 Save the implantable device data
Save the interrogated device data from a patient session to the SAVED REPORTS window. The save operation generates a PKG file
that includes the implantable device data (PDD file) and any reports that you generated during the session.
Implantable device data automatically saves when you end the patient session. However, implantable device data does not save when
the implantable device app closes from the tablet operating system. To avoid permanent loss of implantable device data, save the
implantable device data.
Note: During the save operation, the EMERGENCY button is available. However, if an error occurs during a save operation, there may
be a delay in initiating the EMERGENCY - VVI PACING window. Do not save implantable device data while performing a system test
or when it is possible that the Emergency function will be needed immediately. If the Emergency function is used during a save
operation, the implantable device app aborts the save operation.
1. Tap > INTERROGATE.
2. If the INTERROGATE HOW MUCH? window appears, tap All, then tap START.
Note: Selecting All provides more data for analysis of issues.
3. When the interrogation is complete, tap > SESSION > SAVE SESSION.
The implantable device data saves to the SAVED REPORTS window.
4. On the SESSION DATA SAVED window, tap OK.
15.4 About Read From File sessions
Use a Read From File session to view saved implantable device data, to save and export reports, and to display all programmed
parameter values.
To start a Read From File session, end the patient session and refer to the device manager app help.
Warning: A Read From File session is designed only for viewing saved implantable device data while no patient session is in progress.
You cannot program an implantable device or deliver emergency therapies from a Read From File session.
A Read From File session presents implantable device data in a slightly different way than what is seen during a patient session.
Because you are not in a live patient session, the Live Rhythm Monitor is replaced with the device model and the words Read From
File.
When you generate reports during a Read From File session, the retention of those reports is the same as the saved implantable
device data.
15.5 End the patient session
When you finish with the patient session, end the session.
Note: After 45 min of inactivity, the implantable device app displays a message that prompts you to extend or end the session. If you
do not respond to the message and there is 60 min of inactivity, the patient session ends automatically.
1. Tap
2. On the END SESSION? window, tap END NOW.
> END SESSION.
16 Working with reports and saved device data
16.1 Configure the report preferences
16.1.1 Configure the Initial Interrogation Report preferences
Enable the Initial Interrogation Report, then select the reports that you want to include in the Initial Interrogation Report:
1. Tap
2. Complete the following actions:
> SESSION > PREFERENCES > INITIAL REPORT.
a. Select the Automatically generate initial interrogation report after first interrogation checkbox.
30
Page 31

b. Select the reports to include in the Initial Interrogation Report.
Note: The Quick Look Report is always included in the Initial Interrogation Report.
c. Tap OK.
To generate an Initial Interrogation Report for a patient session that is in progress, end and restart the patient session.
16.1.2 Configure the Final Report preferences
Select the reports that you want to include in the Final Report:
1. Tap > SESSION > PREFERENCES > FINAL REPORT.
2. Complete the following actions:
a. Select the reports to include in the Final Report. If you are configuring Final Report preferences for the first time, select All
Settings in the PARAMETERS section.
Note: The Session Summary Report is always included in the Final Report.
b. Tap OK.
16.2 Generate reports
16.2.1 Generate a report using the PDF button
A PDF button appears on many windows and screens throughout the implantable device app. To generate a report from one of these
screens or windows, tap the PDF button.
16.2.2 Generate a final report
To view summaries of selected data at the end of a session, generate the Final Report.
Tap > SESSION > FINAL REPORT.
16.2.3 Generate a heart failure report
To view a summary of patient information and patient clinical trends related to heart failure, generate the Heart Failure Management
Report.
The Heart Failure Management Report provides information about the patient and the patient’s clinical status since the last follow-up
appointment. The report displays events that occurred during the reporting period and provides graphs that can help you to assess
OptiVol Fluid Trends and clinical trends related to heart failure.
Tap > SESSION > HEART FAILURE.
16.2.4 Generate a set of reports
To generate available reports, select a set of reports:
1. Tap > SESSION > AVAILABLE REPORTS.
2. Select the reports that you want to generate, then tap GENERATE REPORTS.
16.3 View or export saved reports and implantable device data
When you generate a report or save implantable device data during a session, the report or data is saved to the SAVED REPORTS
window. From the SAVED REPORTS window, you can view or export the reports and data. The export options depend on the email,
network, and printing apps or connections set up on your tablet.
1. Tap > SAVED REPORTS / DATA.
2. On the SAVED REPORTS window, view reports or export reports and device data:
• To view a report, tap VIEW next to the report.
• To export reports, select the reports, tap SEND TO…, then select the export option or location.
• To export device data and the reports associated with the device data, select the PKG file, tap SEND TO…, then select the
export option or location.
Notes:
• To select all files, tap the checkbox at the top of the list.
• When you select multiple reports to export, the reports export as a single PDF file.
Note: You are responsible for the management of patient and device data that you export from the SAVED REPORTS window.
Examples of patient and device data include printed paper reports, data transferred to a hospital network, and emailed attachments.
31
Page 32

Page 33

Page 34

Medtronic, Inc.
*M002757C001*
710 Medtronic Parkway
Minneapolis, MN 55432
USA
www.medtronic.com
+1 763 514 4000
Medtronic USA, Inc.
Toll-free in the USA (24-hour technical consultation for physicians and
medical professionals)
Bradycardia: +1 800 505 4636
Tachycardia: +1 800 723 4636
Technical manuals
www.medtronic.com/manuals
© 2021 Medtronic
M002757C001 A
2021-04-19
 Loading...