

Page 1

Medonic M-series
Page 2

1
Contents
PREFACE .................................................................................................................................................. 3
Introduction ................................................................................................................................... 3
SECTION 1: SAFETY INSTRUCTIONS ...................................................................................................... 5
Section Overview ........................................................................................................................... 5
1.1 Intended Use ............................................................................................................................ 5
1.2 Safety Instruction .................................................................................................................... 6
1.3 Biohazards ................................................................................................................................ 6
1.4 Emergency Procedure ............................................................................................................. 7
1.5 Warning Signs in Manual ....................................................................................................... 7
1.6 Signs on Equipment ................................................................................................................. 8
SECTION 2: INSTALLATION .................................................................................................................. 10
Section Overview ......................................................................................................................... 10
2.1 Unpacking / Operating Placement & Environment ........................................................... 10
2.2 Installation Checklist and Menu ......................................................................................... 12
2.3 Analyzer Cable, Interface, and Printer Connections ........................................................ 14
2.4 Reagent Installation.............................................................................................................. 15
2.5 Changing Reagents ................................................................................................................ 18
2.6 Power Supply ........................................................................................................................ 18
SECTION 3: GENERAL OVERVIEW ....................................................................................................... 20
Section Overview ......................................................................................................................... 20
3.1 General Instrument Overview .............................................................................................. 20
3.2 Menu Structure ...................................................................................................................... 21
3.3 System Flow ........................................................................................................................... 23
3.4 Sample Volume, Throughput, and Parameters .................................................................. 24
SECTION 4: INSTRUMENT SETUP ......................................................................................................... 25
Section Overview ......................................................................................................................... 25
4.1 Menu Selection ....................................................................................................................... 25
4.2 Initial Setup ............................................................................................................................ 26
4.3 Advanced Setup ..................................................................................................................... 27
4.4 Reagent Setup ........................................................................................................................ 31
4.5 User Interface ........................................................................................................................ 33
SECTION 5: SAMPLE ANALYSIS ............................................................................................................ 36
Section Overview ......................................................................................................................... 36
5.1 Preparations before Analysis ................................................................................................ 36
5.2 Startup Sequence ................................................................................................................... 37
5.3 Background Count ................................................................................................................ 39
5.4 Sample Identification ............................................................................................................ 39
5.5 Analyzing the Sample (Open Tube) ..................................................................................... 40
5.6 Analyzing the Sample (Pre-dilution procedure) ................................................................. 42
5.7 Analyzing the Sample (Micro Pipette Adapter, MPA)....................................................... 44
5.8 Analyzing the Sample (Cap Piercing Device) ...................................................................... 47
5.9 Analyzing the Sample (Autoloader) ..................................................................................... 48
5.10 Results................................................................................................................................... 52
SECTION 6: QUALITY CONTROL (QC) AND BLOOD CONTROL MEMORY ........................................ 54
Section Overview ......................................................................................................................... 54
6.1 Quality Control (QC) ............................................................................................................ 54
6.2 Levey-Jennings Plots ............................................................................................................. 56
6.3 Initialization and Use of Xb Function .................................................................................. 58
Page 3

2
SECTION 7: CALIBRATION .................................................................................................................... 59
Section Overview ......................................................................................................................... 59
7.1 Preparations before calibration ........................................................................................... 59
7.2 Calibration ............................................................................................................................. 60
SECTION 8: CLEANING, MAINTENANCE & TRANSPORT .................................................................... 64
Section Overview ......................................................................................................................... 64
8.1 Daily Cleaning ........................................................................................................................ 64
8.2 Monthly Cleaning .................................................................................................................. 65
8.3 Six (6) Month Cleaning ......................................................................................................... 66
8.4 Re-location of instrument (within the laboratory) ............................................................. 67
8.5 Short Term Shutdown (<12h) .............................................................................................. 67
8.6 Re-packaging and Long Term Shutdown (>12h) ............................................................... 68
8.7 Permanent Shut-Down and Storage .................................................................................... 69
8.8 Disposal Information ............................................................................................................. 69
SECTION 9: PARAMETER AND SYSTEM INFORMATION MESSAGES ................................................... 70
Section Overview ......................................................................................................................... 70
9.1 Out-of-Range and Information Message Indicators .......................................................... 70
9.2 System Information Messages .............................................................................................. 71
9.3 Parameter Limitations of Automated Blood Cell Counters .............................................. 73
SECTION 10: TECHNOLOGY ................................................................................................................. 77
Section Overview ......................................................................................................................... 77
10.1 Measuring Principles........................................................................................................... 77
10.2 Counting Time RBC & WBC ............................................................................................. 78
10.3 WBC Differentials ............................................................................................................... 79
10.4 Photometric Method – HGB Hemoglobin ......................................................................... 80
10.5 Parameter Definitions ......................................................................................................... 80
SECTION 11: SPECIFICATIONS ............................................................................................................. 82
Section Overview ......................................................................................................................... 82
11.1 General ................................................................................................................................. 82
11.2 Short List of Specifications ................................................................................................. 83
11.3 Parameter Ranges ............................................................................................................... 84
11.4 Reagents and Reagent Consumption ................................................................................. 85
SECTION 12: TROUBLESHOOTING ....................................................................................................... 86
Section Overview ......................................................................................................................... 86
12.1 Communication Issues ........................................................................................................ 86
12.2 General Information Displays ............................................................................................ 88
12.3 Warning Displays ................................................................................................................ 93
12.4 Aspiration Issues .................................................................................................................. 98
12.5 Troubleshooting Other Issues ............................................................................................ 99
INDEX ................................................................................................................................................. 100
APPENDIX A......................................................................................................................................... 101
APPENDIX B ......................................................................................................................................... 107
Page 4
3
Preface
Introduction
Instrument
description
Medonic M-Series 3-part hematology analyzer produced by Boule Medical for
human application.
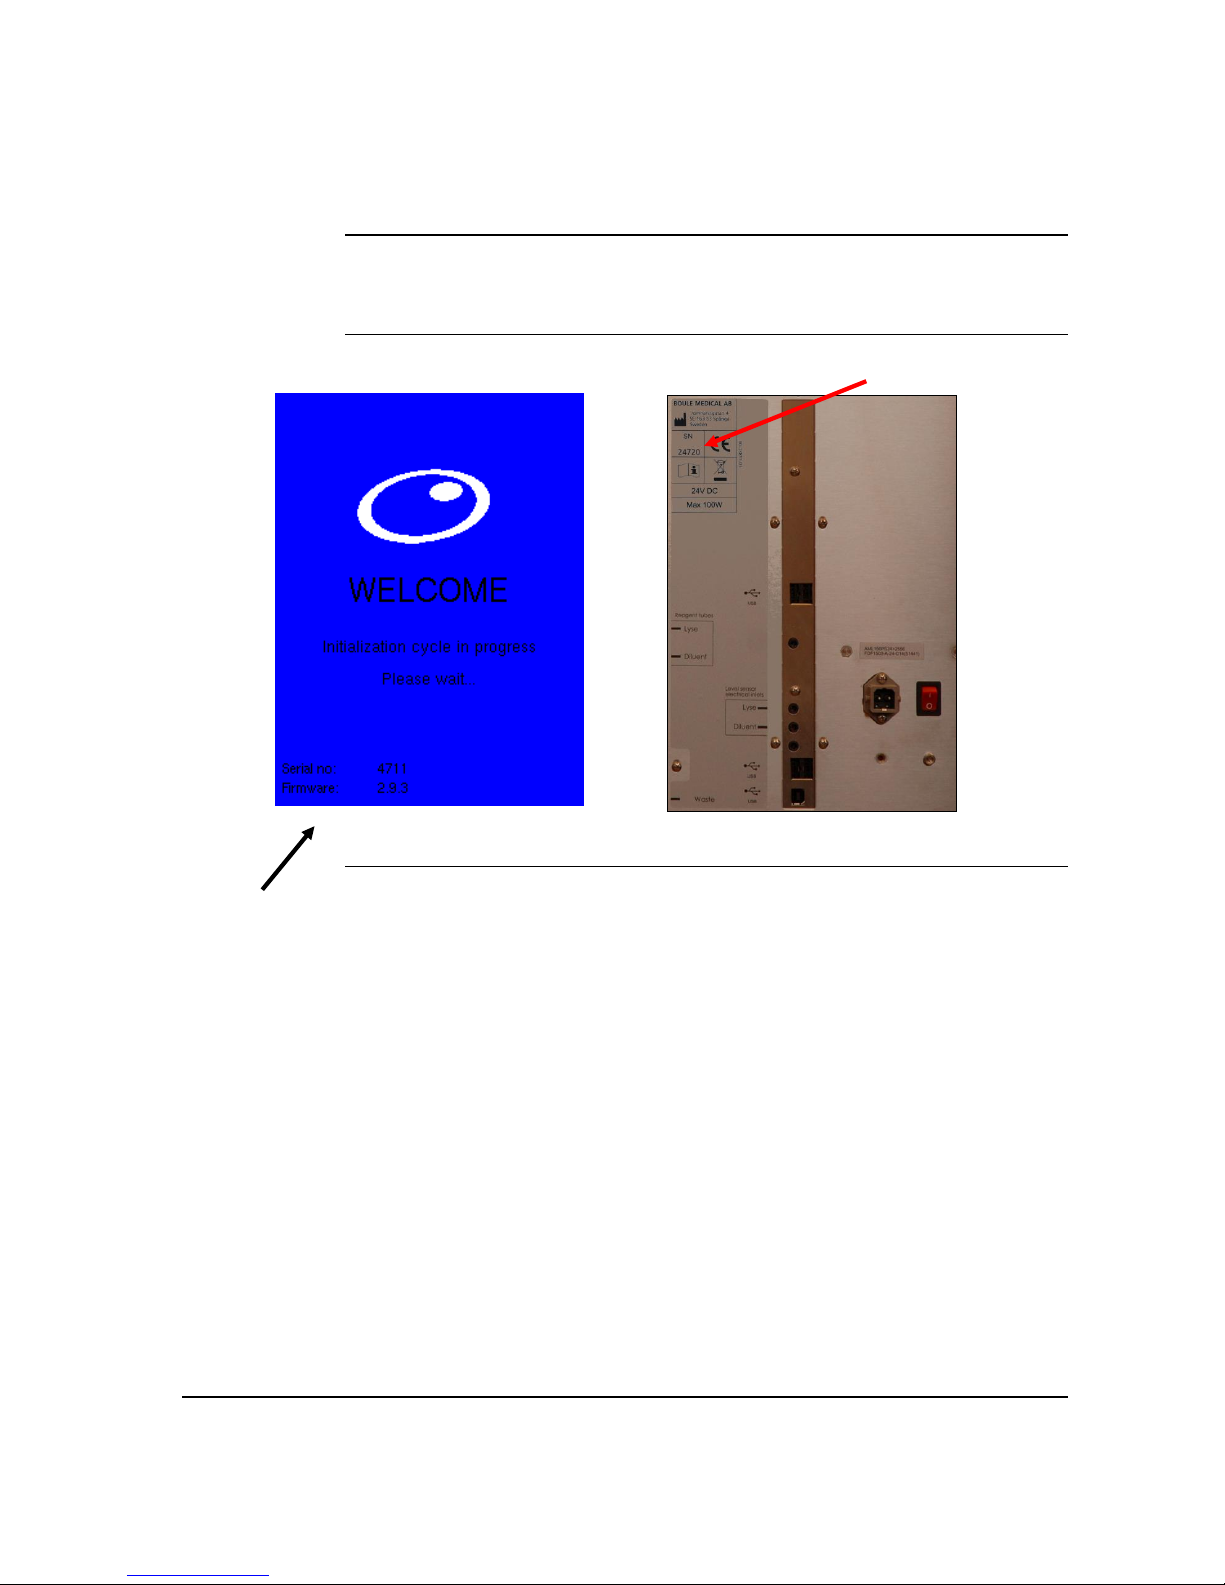
Serial number
Serial number is located on the rear of the instrument.
Figure 1.1
Figure 1.1 Figure 1.2
Software version
The software version is displayed when starting up the instrument.
Instrument
List of models
Product
code
Product name
1400073
M-series M16M US
1400074
M-series M16C-US
1400075
M-series M16S BD ABR US
Page 5

4
Additional
Documentation
Additional documentation is available from your authorized distributor.
Current additional documentation is listed below:
User Definable Settings
Operator requirements
The following operator requirements must be fulfilled before operating
the Medonic M-Series hematology system.
Basic skills in a laboratory environment.
Basic skills in hematology.
Awareness of IVD (EU)/FDA (US) requirements regarding laboratory
equipment.
The operator must read and understand this manual.
Optional accessories
and consumables
Accessories and consumable lists are available from your local
distributor.
Manufacturer’s details
Boule Medical AB
Domnarvsgatan 4
SE-16353 Spånga, Sweden
Website: www.medonic.se
Distributor details
Clinical Diagnostic Solutions
1800 NW 65th Ave
Plantation, FL 33313 USA
Toll Free: 1-800-453-3328
Direct: 1-954-791-1773
Fax:1-954-791-7118
Website: www.cdsolinc.com
International
standards and
regulations
SS-EN ISO 18113-3:2011
IVD 98/79/EG
SSEN 61010-2-101 (Low Voltage Directive 2006/95/EC)
EN 61326 (2006) (EMC 2004/108/EC)
2012/19/EU WEEE
Standards harmonized with FDA
Date of Issue
February 2016 Article no: 1504472
Software version
Firmware 2.9.4
Third-party Software
For information see Appendix B.
Page 6

5
Section 1: Safety Instructions
Section Overview
Introduction
This section describes the safety features and warnings associated with the
Medonic M-Series.
Contents
This section contains the following topics:
Topic
See Page
Intended Use
5
Safety Instructions
6
Biohazards
6
Emergency Procedures
7
Warning Signs in Manual
7
Signs on Equipment
9
1.1 Intended Use
Description
The Medonic M-Series is a fully automatic hematology analyzer intended for
in vitro diagnostic testing of human blood samples under laboratory
conditions.
Operator
Requirements
Operator must have basic laboratory skills and be aware of good laboratory
practice.
Warranty
limitations
Service must be performed by Boule Medical AB (hereafter referred to as
Boule), CDS or by service personnel authorized by Boule.
Use only original spare parts and Boule authorized reagents, controls,
calibrators and cleaners. (If these products are substituted it may void your
warranty)
Operators and laboratory supervisors are responsible that Boule products are
operated and maintained according to the procedures described in manuals,
control inserts and technical bulletins.
Warranty
limitations in
depth
Each Boule system is tested using recommended reagents, controls,
calibrators and cleaners. All performance claims are generated as part of this
complete system.
Boule products do NOT make diagnoses on patients. Boule intends its
diagnostic products (systems, software and hardware) to be used to collect
data reflecting the patient’s hematological status. This data, in conjunction
with other diagnostic information and the evaluation of the patient’s
condition, can be used by a trained clinician to establish a patient’s diagnosis
and to define clinical treatment.
Page 7
6
1.2 Safety Instruction
Description
Boule incorporates safety features within the instrument in order to protect the
operator from injury, the instrument from damage and the test results from
inaccuracies.
Restrictions
In order to insure the safety of the operator and instrument follow the
instruction below:
Do not use the instrument outdoors.
Do no modify the instrument.
Do not remove the cover. (Authorized personnel only)
Do not use the instrument for other purposes than described in this manual.
Do not spill blood or other fluids on the instrument in such a way that it can
leak through the instrument casing. (This might result in electrical
malfunction or personal injury)
Do not drop or place objects on the analyzer.
Do not use this device in close proximity to source of strong electromagnetic
radiation (e.g. unshielded international RF sources), as these can interfere
with the proper operation.
Do not use power supply other than supplied by your local distributor.
Important
Unauthorized modification of the instrument might result in erroneous
results or risk for electrical shock.
Spilling fluids into the instrument might cause electrical malfunction and/or
personal injury.
Handling of
reagents
If a reagent comes in contact with eyes, rinse with running water for several
minutes. If symptoms occur seek medical attention.
If the reagent comes into contact with skin, wash affected area with water.
If swallowed, rinse out mouth. If persistent symptoms occur seek medical
attention.
Refer to MSDS at www.cdsolinc.com for further details.
SDS Sheets are available for all reagents.
1.3 Biohazards
Description
As there are no assurances of the absence of HIV, Hepatitis B or C viruses or
other infectious agents in blood samples, controls, calibrators and waste these
products should be handled as potentially biohazardous.
Support
documentation
Protection of Laboratory Workers From Infectious Disease Transmitted by
occupationally acquired infections – 2nd Edition, Approved Guidelines
(2001) Document M29-T2 promulgated by the Clinical and Laboratory
Standards Institute, CLSI (NCCLS).
Follow local regulatory documentation.
Page 8
7
Handling of
biohazardous
material
Use universal precautions when handling samples and discarding waste.
Handle any exposure according to established laboratory protocol
regulations.
The instructions for analyzer decontamination and disposal can be found on
the Medonic home page, www.medonic.se under support.
1.4 Emergency Procedure
In case of
emergency
If there are any obvious signs of malfunction such as smoke or liquid leaking
out of the instrument proceed as follows:
Step
Action
1
Disconnect the main power supply immediately by pulling out the
cord from the main supply.
2
Contact your authorized distributor.
1.5 Warning Signs in Manual
Warning Signs
The following warning signs in the manual are used to identify possible
hazards and to call on the operator’s attention to this condition.
Sign
Function
Warning
Indicates operation procedures that could result
in personal injury if not correctly followed.
Caution
Indicates operation procedures that could result
in damage or destruction of equipment if not
strictly observed.
Important
Emphasizes operating procedures that must be
followed to avoid erroneous results.
Mandatory Action
Indicates that protective clothing, gloves or goggles must be used when performing described
procedures.
Page 9
8
1.6 Signs on Equipment
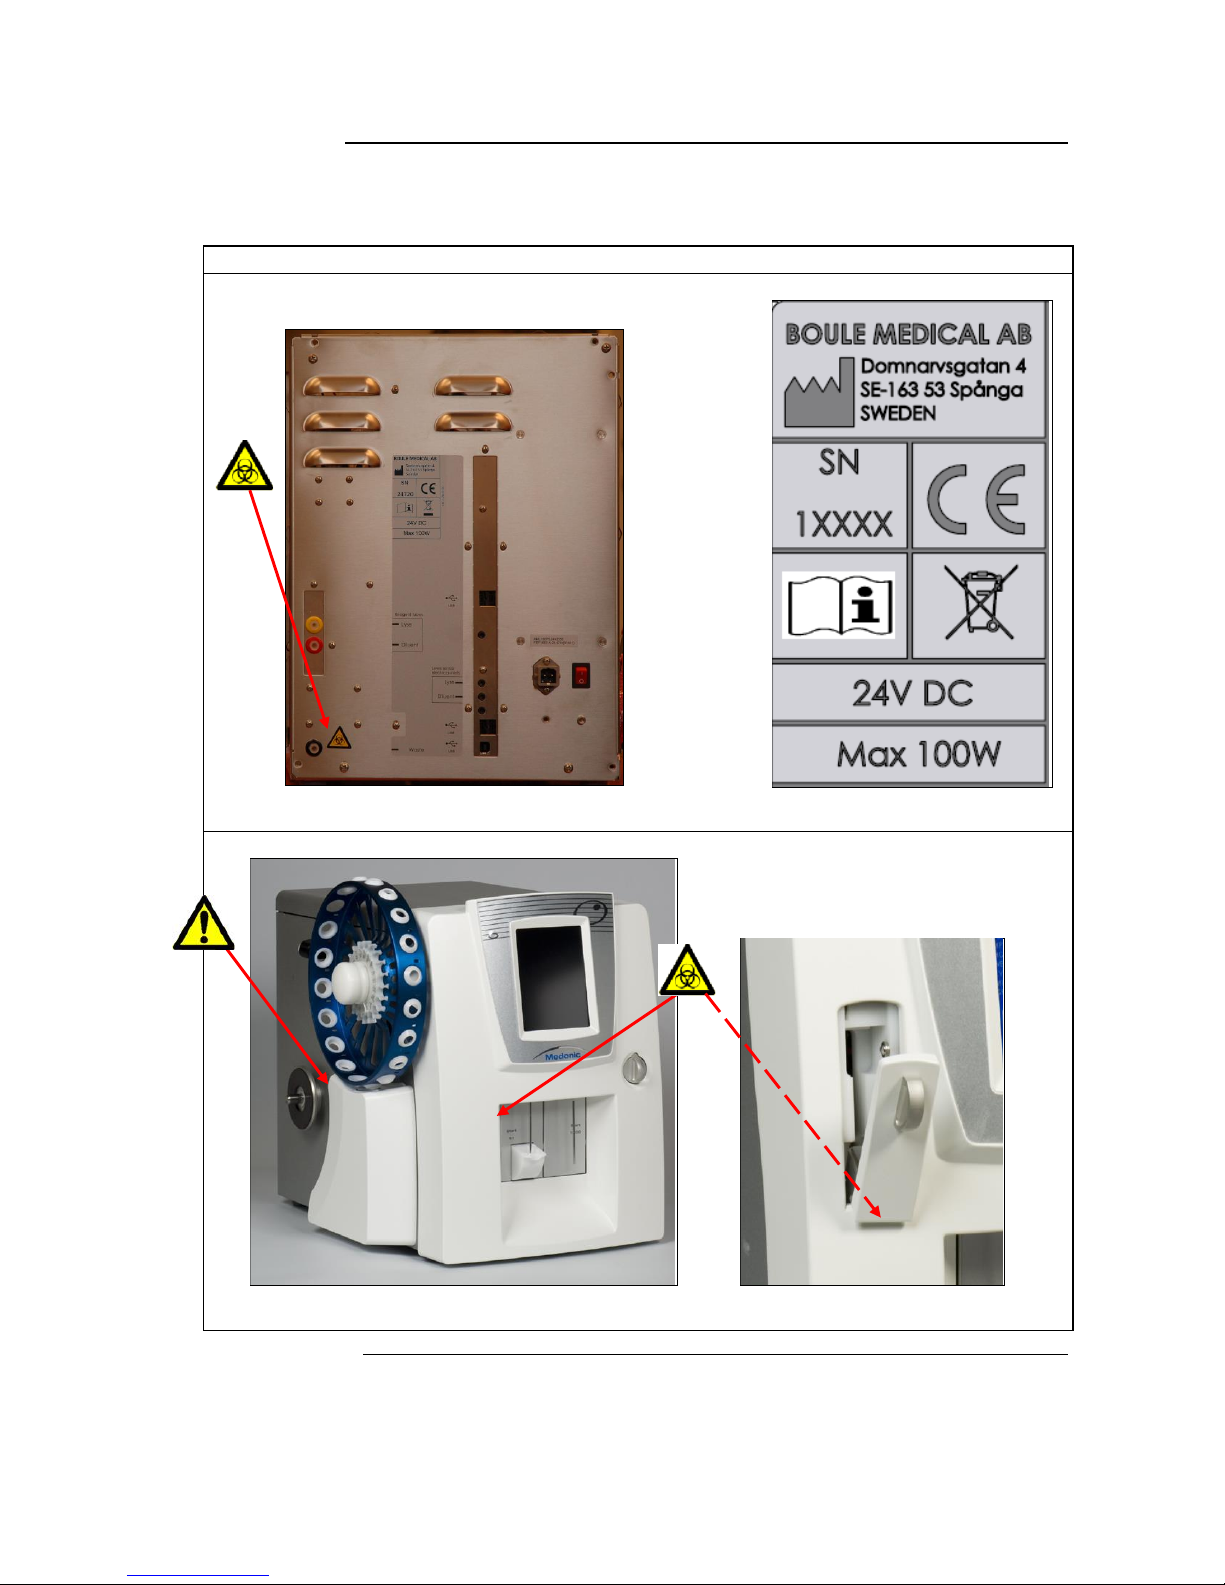
Description
Signs placed on the instrument define areas that need special attention or areas
that contain danger. See IVD Symbol Table on page 9.
Signs on equipment
Figure 1.3 Figure 1.4
Figure 1.5 Figure 1.6
Page 10
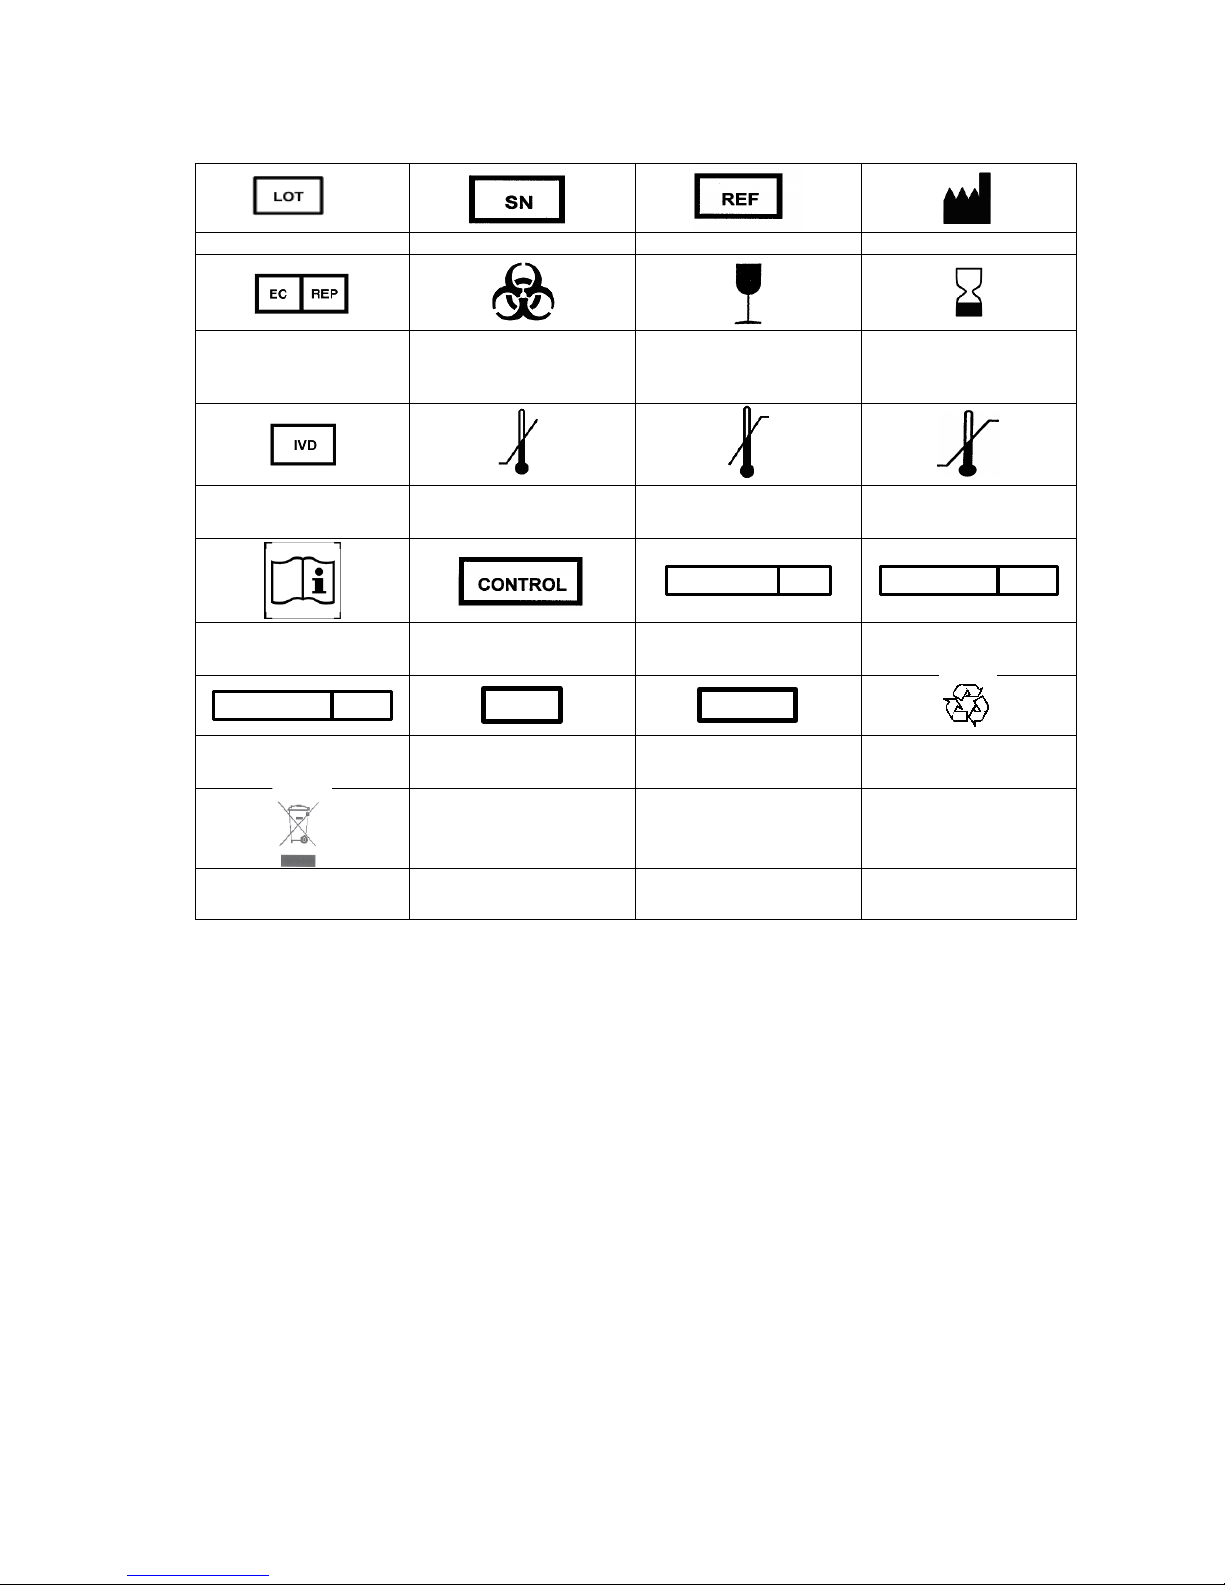
9
Batch code
Serial number
Catalogue number
Manufacturer
Authorised*
Representative in the
European Community
Biological Risks
Fragile, handle with
care
Use by
In vitro diagnostic
medical device
Lower limit of
temperature
Upper limit of
temperature
Temperature
limitation
CONTROL L 16
CONTROL N 16
Consult instructions
for use
Control
Low control, 16
parameters
Normal control, 16
parameters
CONTROL H 16
CAL
CONT
High control, 16
parameters
Calibrator
Content
Recycling
WEEE
Figure 1.7 IVD Symbol Table
Page 11

10
Section 2: Installation
Section Overview
Introduction
This section describes how to unpack and install the Medonic M-Series
instrument.
Contents
This section contains the following topics:
Topic
See Page
Unpacking / Operating Placement and Environment
10
Installation Checklist and Menu
12
Analyzer Cable, Interface, and Printer Connections
14
Reagent Installation
15
Changing Reagents
18
Power Supply
18
2.1 Unpacking / Operating Placement & Environment
Description
The instrument is packed in a specifically designed protective box.
Visual Checking
Check the box for physical damage. If damaged notify your carrier
immediately.
Included
Material
Instrument
User’s Manual
Quick Reference Guide
Waste tubing
Reagent Level Sensor and reagent caps for isotonic diluent (Diluent)
Reagent Level Sensor and reagent caps for hemolyzing reagent (Lyse)
Power adapter and cord
Installation form
Declaration of Conformity
Barcode reader
MPA kit
Optional
Material
Printer
Sample wheels and control tube adapter (Autoloader model only)
External Keyboard
Page 12
11
2.1 Unpacking / Operating Placement & Environment (continued)
Important
The following procedures must be followed exactly. Boule has no
responsibility in case of faulty or erroneous installation.
Installation/
Operating
Placement
The instrument should be placed in a laboratory environment according to the
guidelines below:
Place the instrument on a clean horizontal surface.
Avoid lifting the analyzer by the front cover.
Avoid exposure to sunlight.
Make sure the instrument has access to proper ventilation. The instrument
should have at least 2 inches (5 cm) of air above it.
Place the rear of the instrument so it has at least 4 inches (10 cm) of free
space behind it.
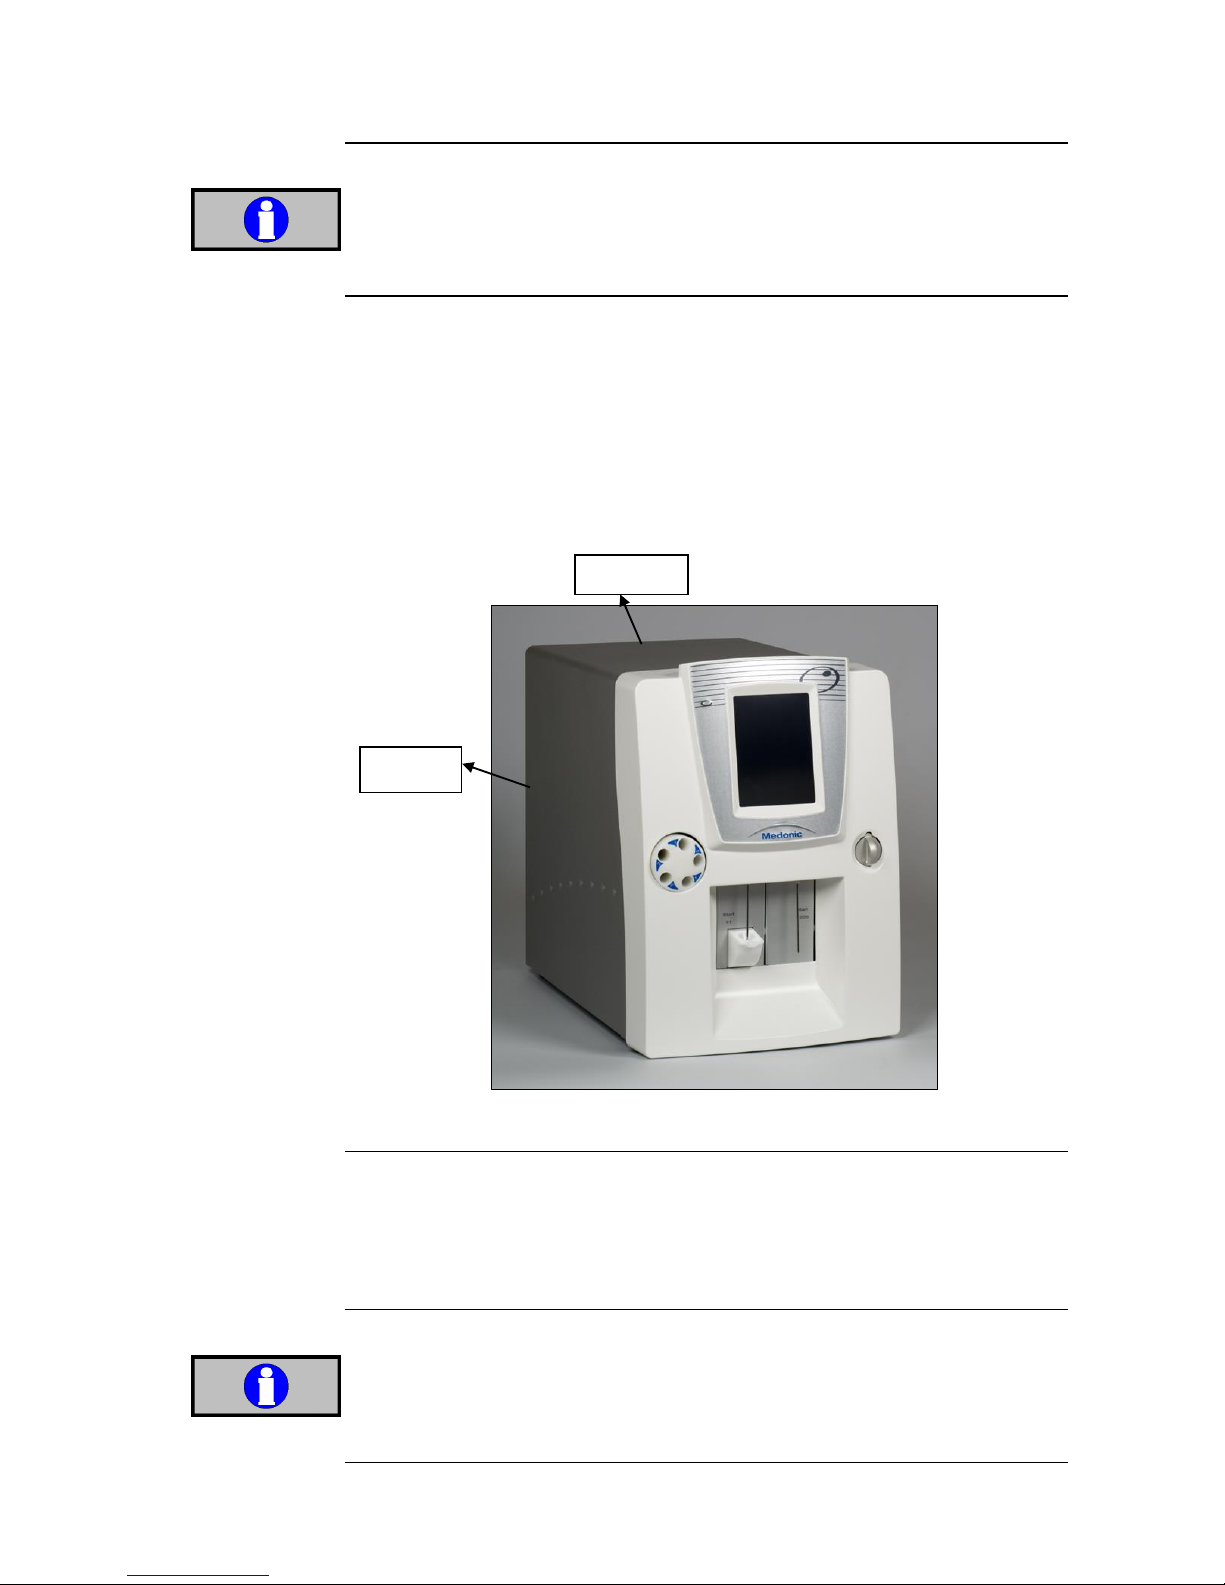
Figure 2.1
Installation/
Operating
Environment
Indoor Use
Temperature +64 to +90 ºF (+18 to +32 ºC)
Humidity < 80% Relative
Grounded main supply
Important
Operating the instrument in an environment over + 90°F (+32 °C) increases
service needs, as well as degradation of sample specimen.
4 inches
2 inches
Page 13
12
2.2 Installation Checklist and Menu
Description
Follow the quick Installation Checklist and Installation Menu step by step for
best installation results. For more detail on each step refer to Sections 2.3 – 2.6.
Installation Checklist
Complete Unpacking / Operating Placement and Environment instructions in Section 2.1.
Connect the power adapter to the back of the analyzer, but do not plug it into an electrical
socket.
Connect the printer. (If not using Distributor provided printer see Section 4.3.)
Connect the barcode reader to the back of the analyzer.
Connect the waste tubing to the analyzer and plumb to waste container or drain.
Connect the Diluent level sensor (red) and the electronic sensor to the analyzer.
Connect the Lyse reagent level sensor (yellow) and the electronic sensor to the analyzer.
Plug the power cord into the power adapter and the electrical socket to power up the analyzer.
After system initialization follow Installation Menu instructions below.
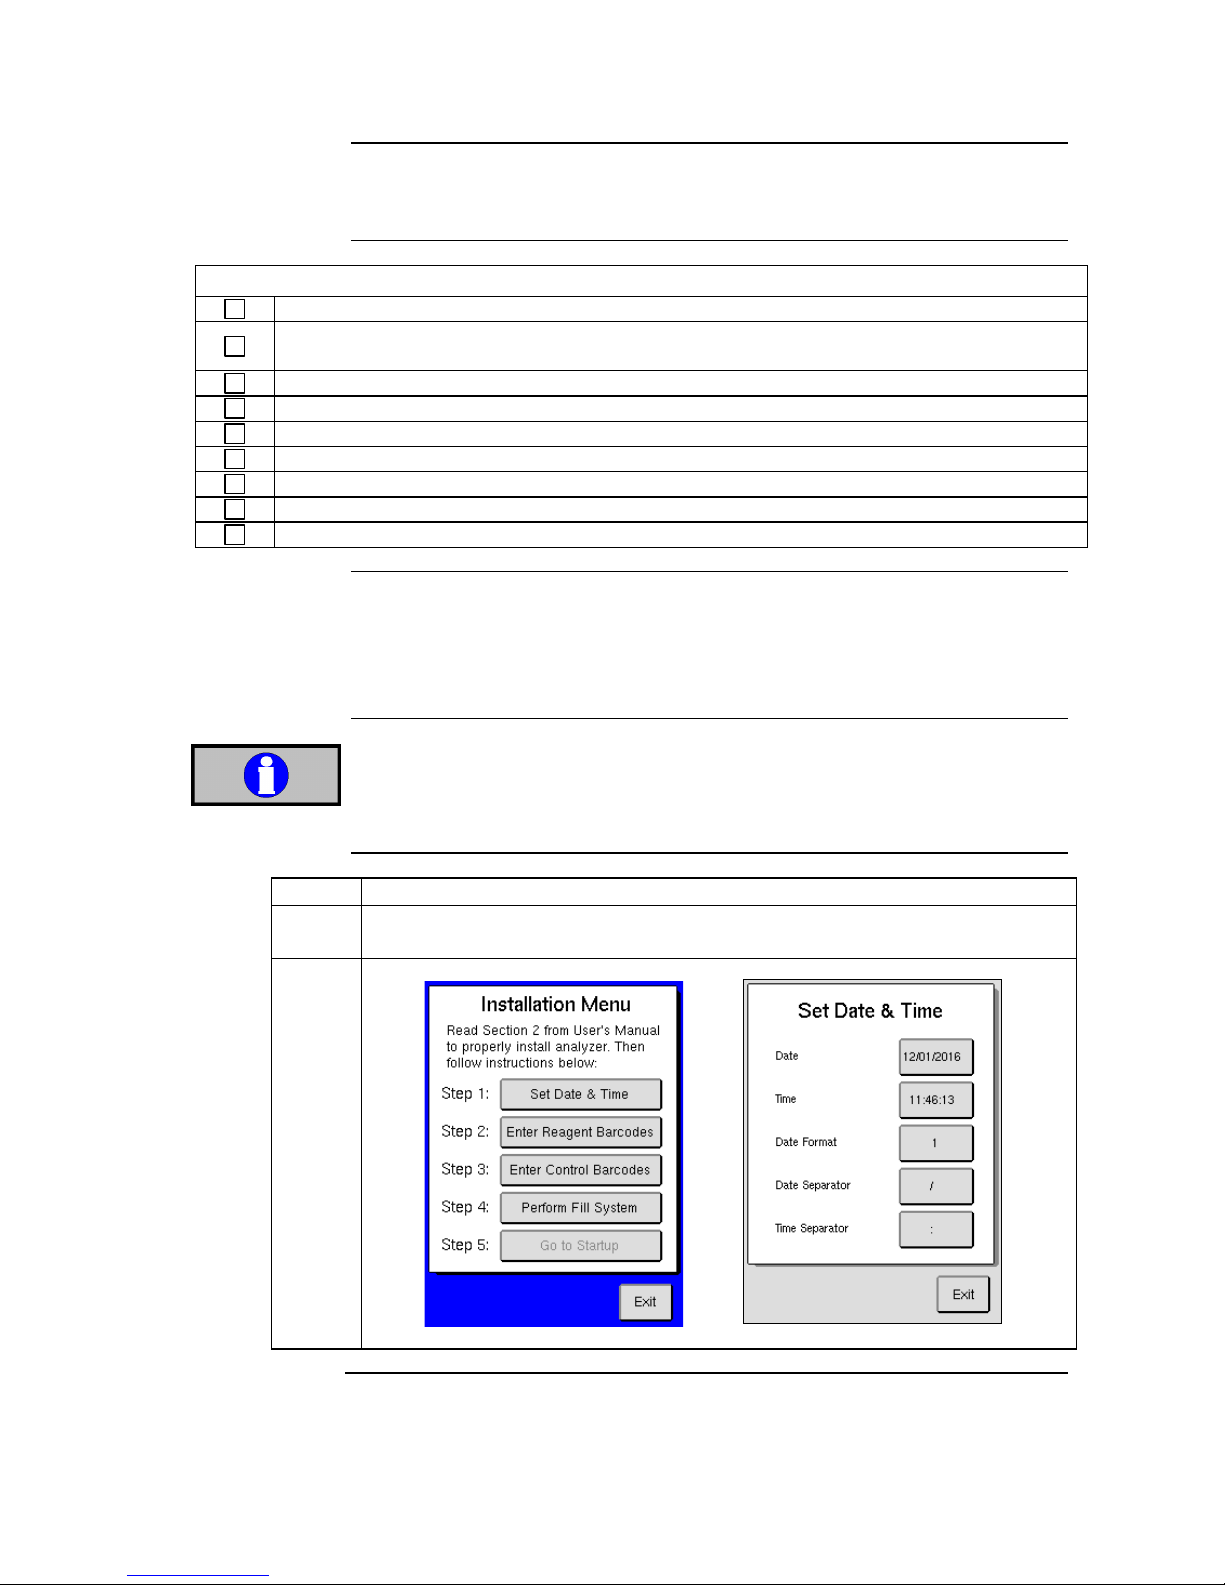
Installation Menu
The following Installation Menu instructions were created to make installation
as quick and easy as possible. After completing the following five steps (Step 5
is optional) on the Installation Menu, the system will be ready for the first
sample analysis.
Important
The following Installation Menu Steps must be followed in sequential order.
Step
Action
1
Press Step 1 [SET DATE & TIME], set date and time, and press [EXIT] to return
to Installation Menu.
Figure 2.2 Figure 2.3
Continued on next page
Page 14
13
2.2 Installation Checklist and Menu (continued)
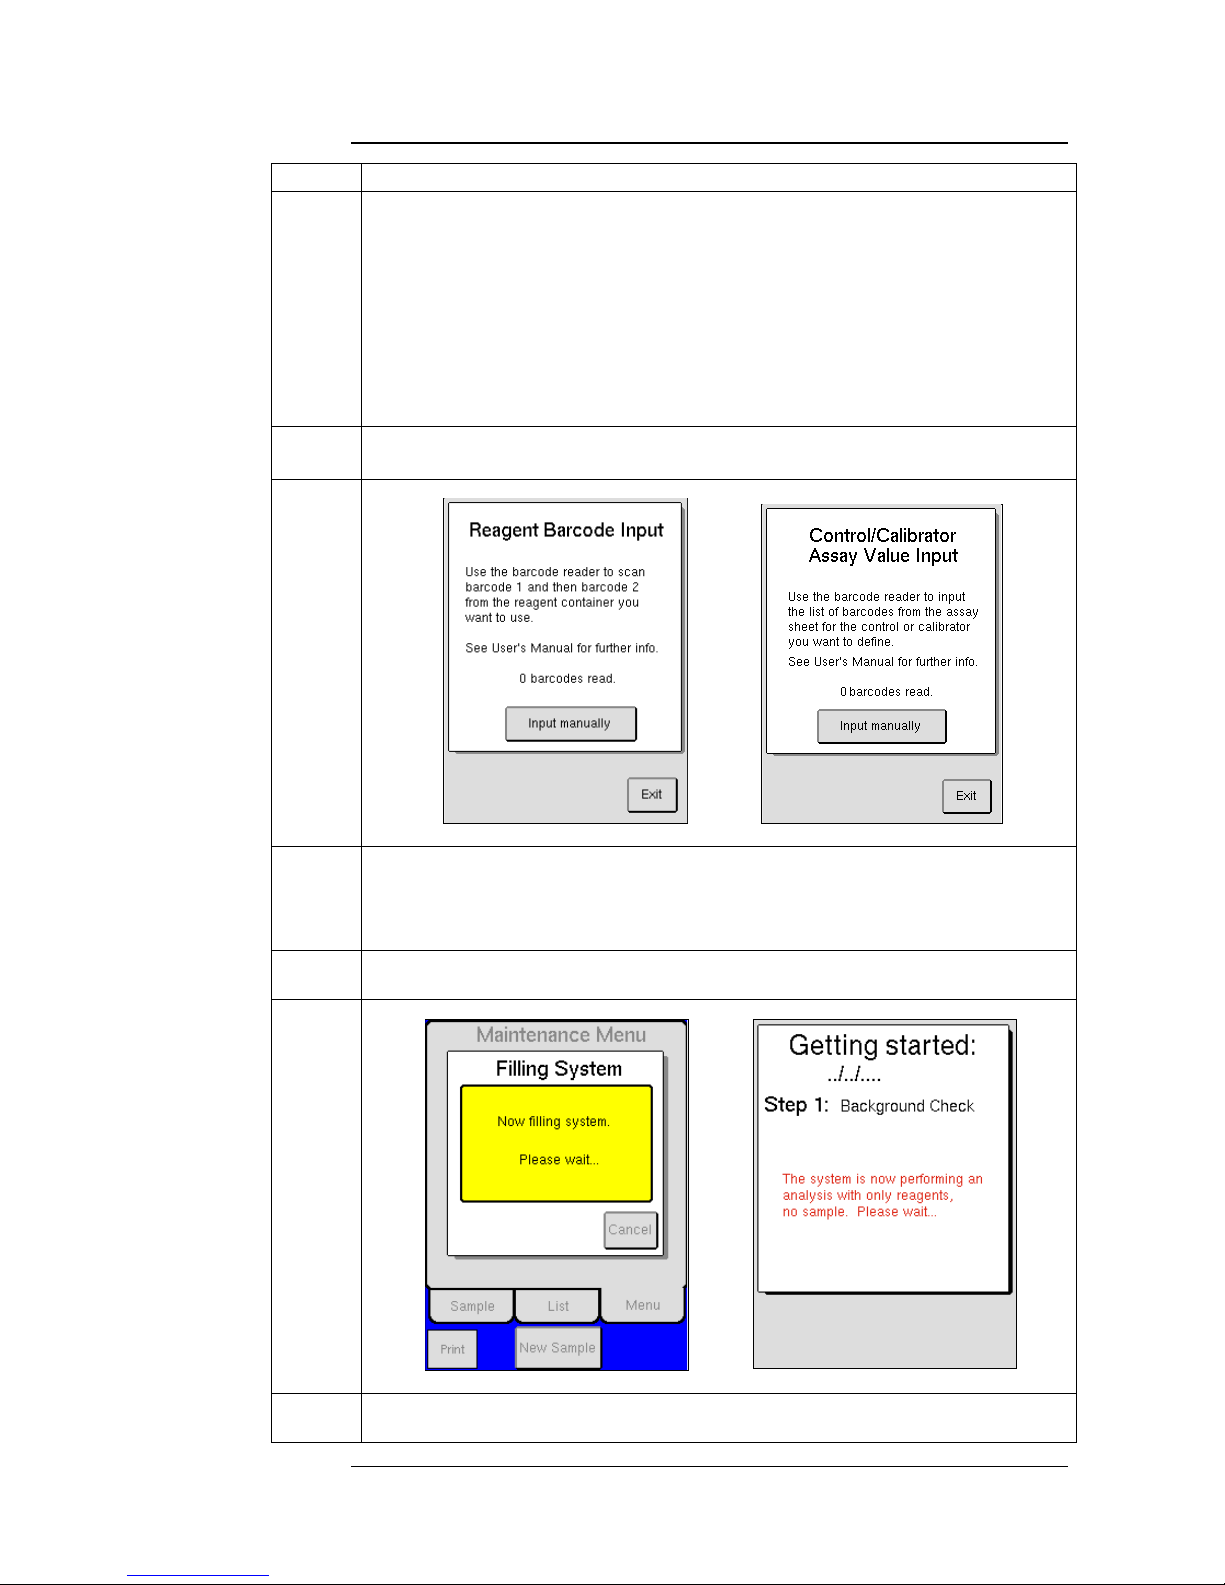
Step
Action
2
Press Step 2 [ENTER REAGENT BARCODES].
Scan barcode 1 and then barcode 2 on the Diluent container. (Press and hold
the ACTIVE or ON button each time a barcode is scanned.)
o If using a Combination pack, following instruction for scanning in
Diluent container.
If using single containers of Diluent and Lyse press [ENTER ANOTHER
BARCODE] and scan barcode 1 and then barcode 2 on the Lyse container.
Press [EXIT] to return to Reagent Barcode Input screen and then press
[EXIT] again to return to the Installation Menu.
Note
After reagents are scanned, then loosen reagent container caps, remove
factory seals, and place reagent level sensors in respective containers.
Figure 2.4 Figure 2.5
3
Press Step 3 [ENTER CONTROL BARCODES] to enter assay value ranges into the
system for the lot of Control being used.
Scan barcodes 1-9, in that order, for each control level.
Once accepted press [EXIT] to return to Installation Menu.
4
Press Step 4 [PERFORM FILL SYSTEM] to fill system with reagents. This cycle
will last for approximately 3 minutes.
Figure 2.6 Figure 2.7
Optional
Press Step 5 [GO TO STARTUP]. See Section 5.2 for details on guided startup
sequence.
Page 15
14
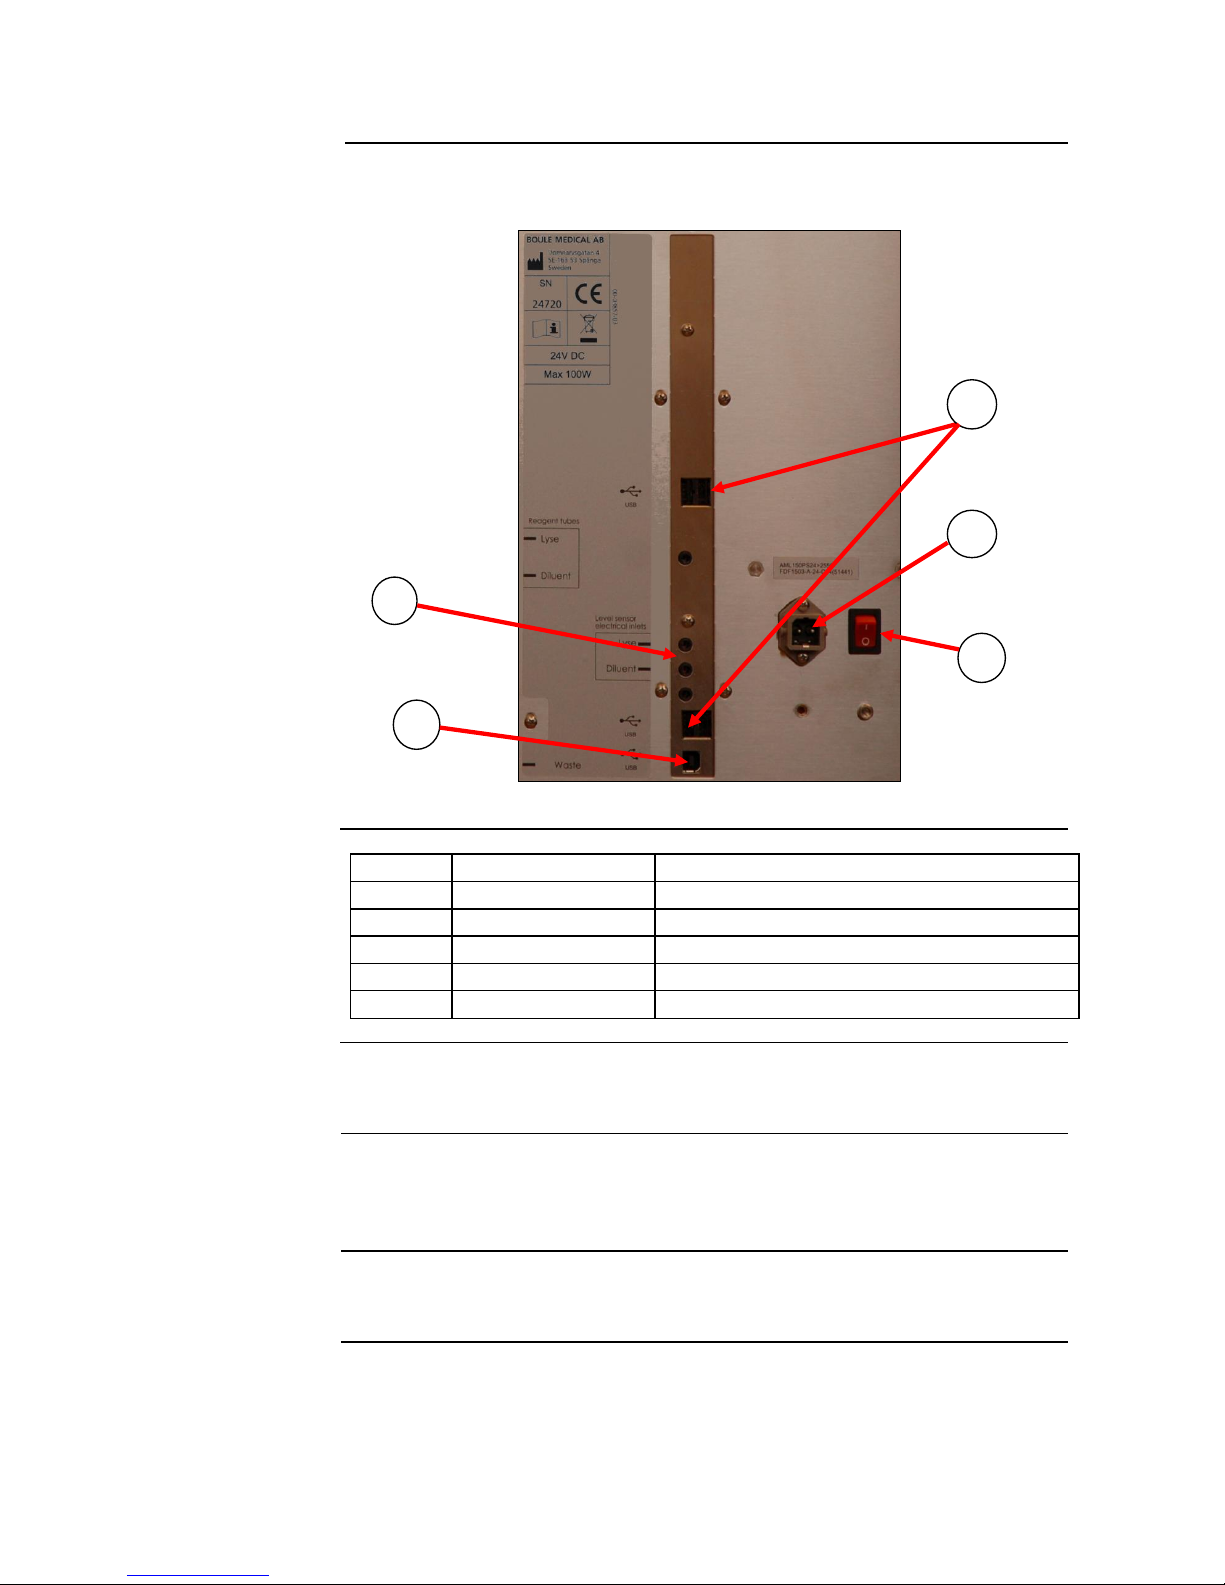
2.3 Analyzer Cable, Interface, and Printer Connections
Number
Part
Function
1
USB host ports
Connects analyzer to USB devices.
2
Electronic Sensors
Connects Reagent level sensors to analyzer.
3
Power Supply port
Connects Main power outlet to analyzer.
4
Power switch
Switches power On and Off.
5
USB Device Port
Connects analyzer to USB host
Printer
Connection
The printer is connected to the rear of the instrument with USB printer cable.
(Printer is not manufactured by Boule.) See Figure 2.8.
Supported
Printers
USB compatible (Supplied by CDS). Follow the instructions in the printer
user’s manual or quick guide to install. If using USB compatible printer other
than that provided by CDS see Section 4.3.
Compatible
Printers
HP-PCL compatible, IBM Proprinter compatible or supported USB printers.
If using one of these printers see Section 4.3 for setup instructions.
Description
All connections are located on the rear panel of the instrument. The
connections available are as stated below:
Figure 2.8
1
Page 16
15
2.4 Reagent Installation
Description
The reagents for the instrument are delivered in cube formed boxes with
plastic caps.
Supported
Reagents
Hemolyzing reagent and Isotonic Diluent, hereafter referred to as Lyse and
Diluent. (Specifically designed by Boule for the Medonic M-Series system.)
Location of
Reagent
This section describes placement of reagent containers.
It is recommended that both the Diluent and the Lyse reagents are placed at
the instrument level or below.
Caution
Placing the reagent containers above the instrument level could cause system
flow issue and is not recommended.
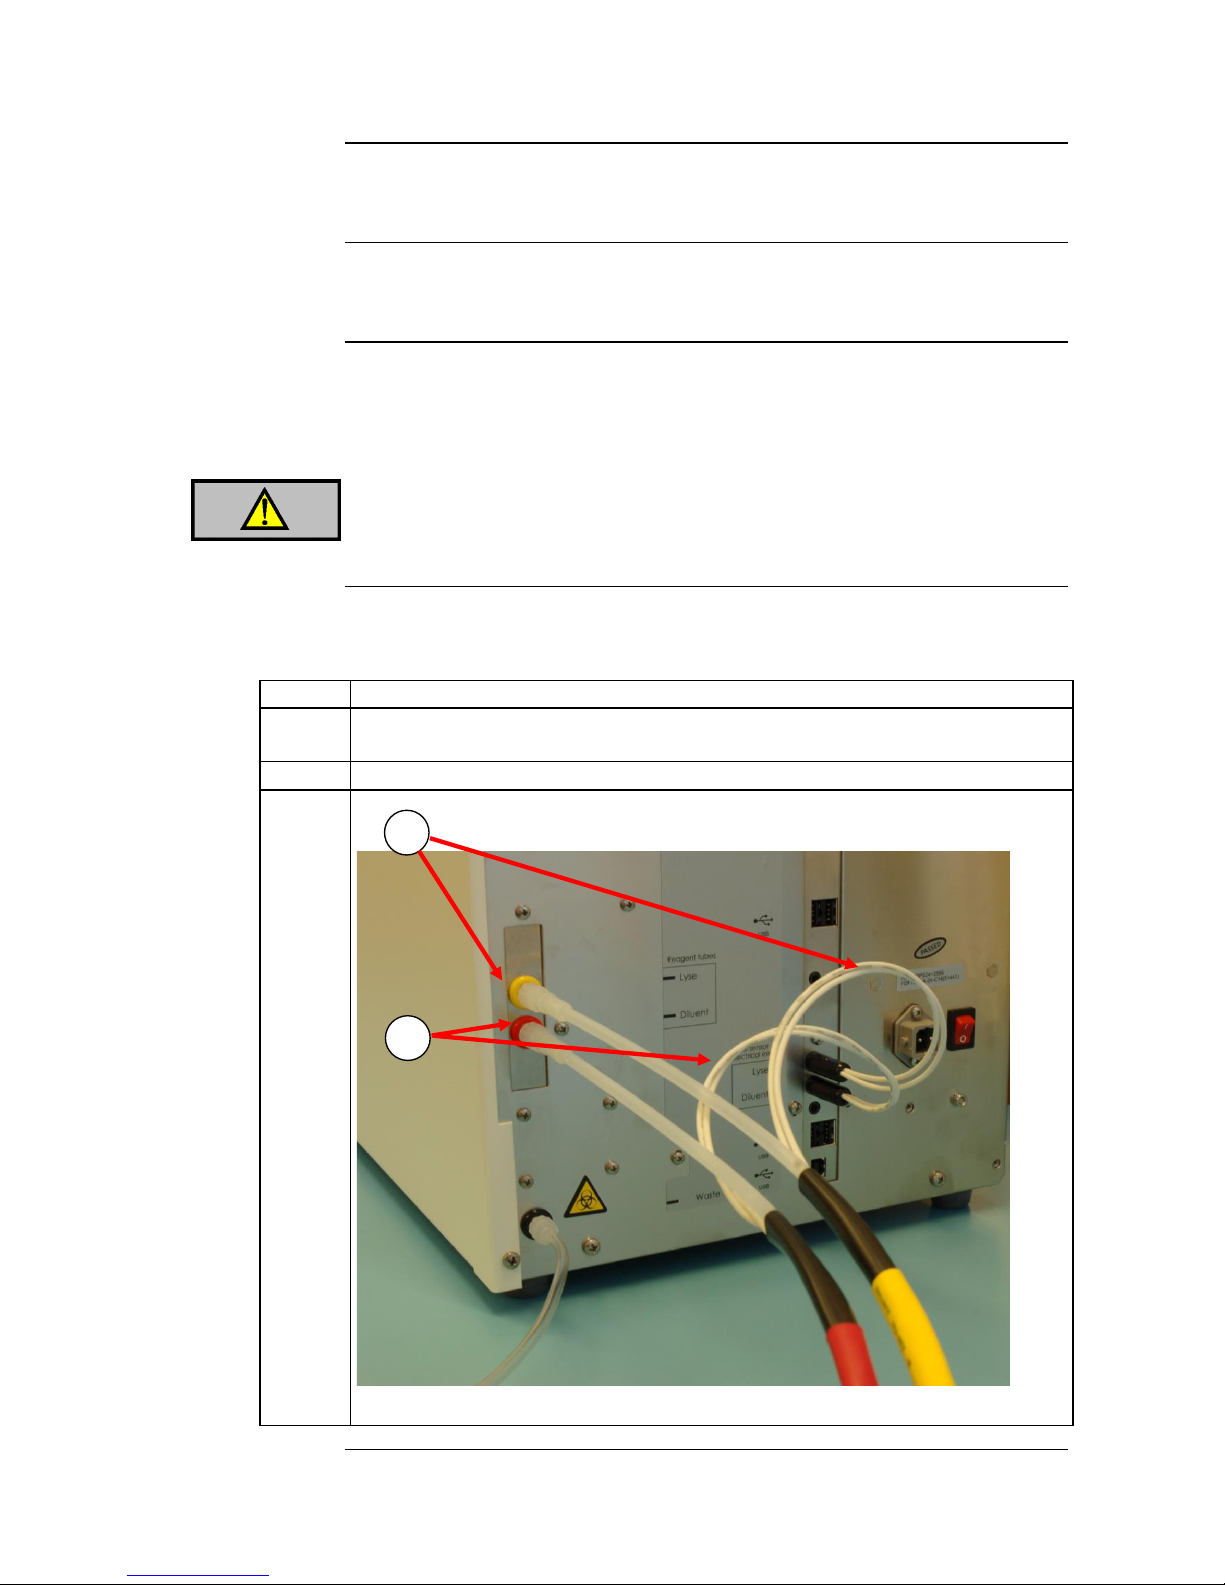
Connecting Reagent
Containers
This section describes how to connect the reagent containers for use.
Step
Connect
1
The Lyse reagent level sensor (yellow) and the electronic sensor to the
analyzer.
2
The Diluent level sensor (red) and the electronic sensor to the analyzer.
Figure 2.9
Continued on next page
Page 17
16
2.4 Reagent Installation (continued)
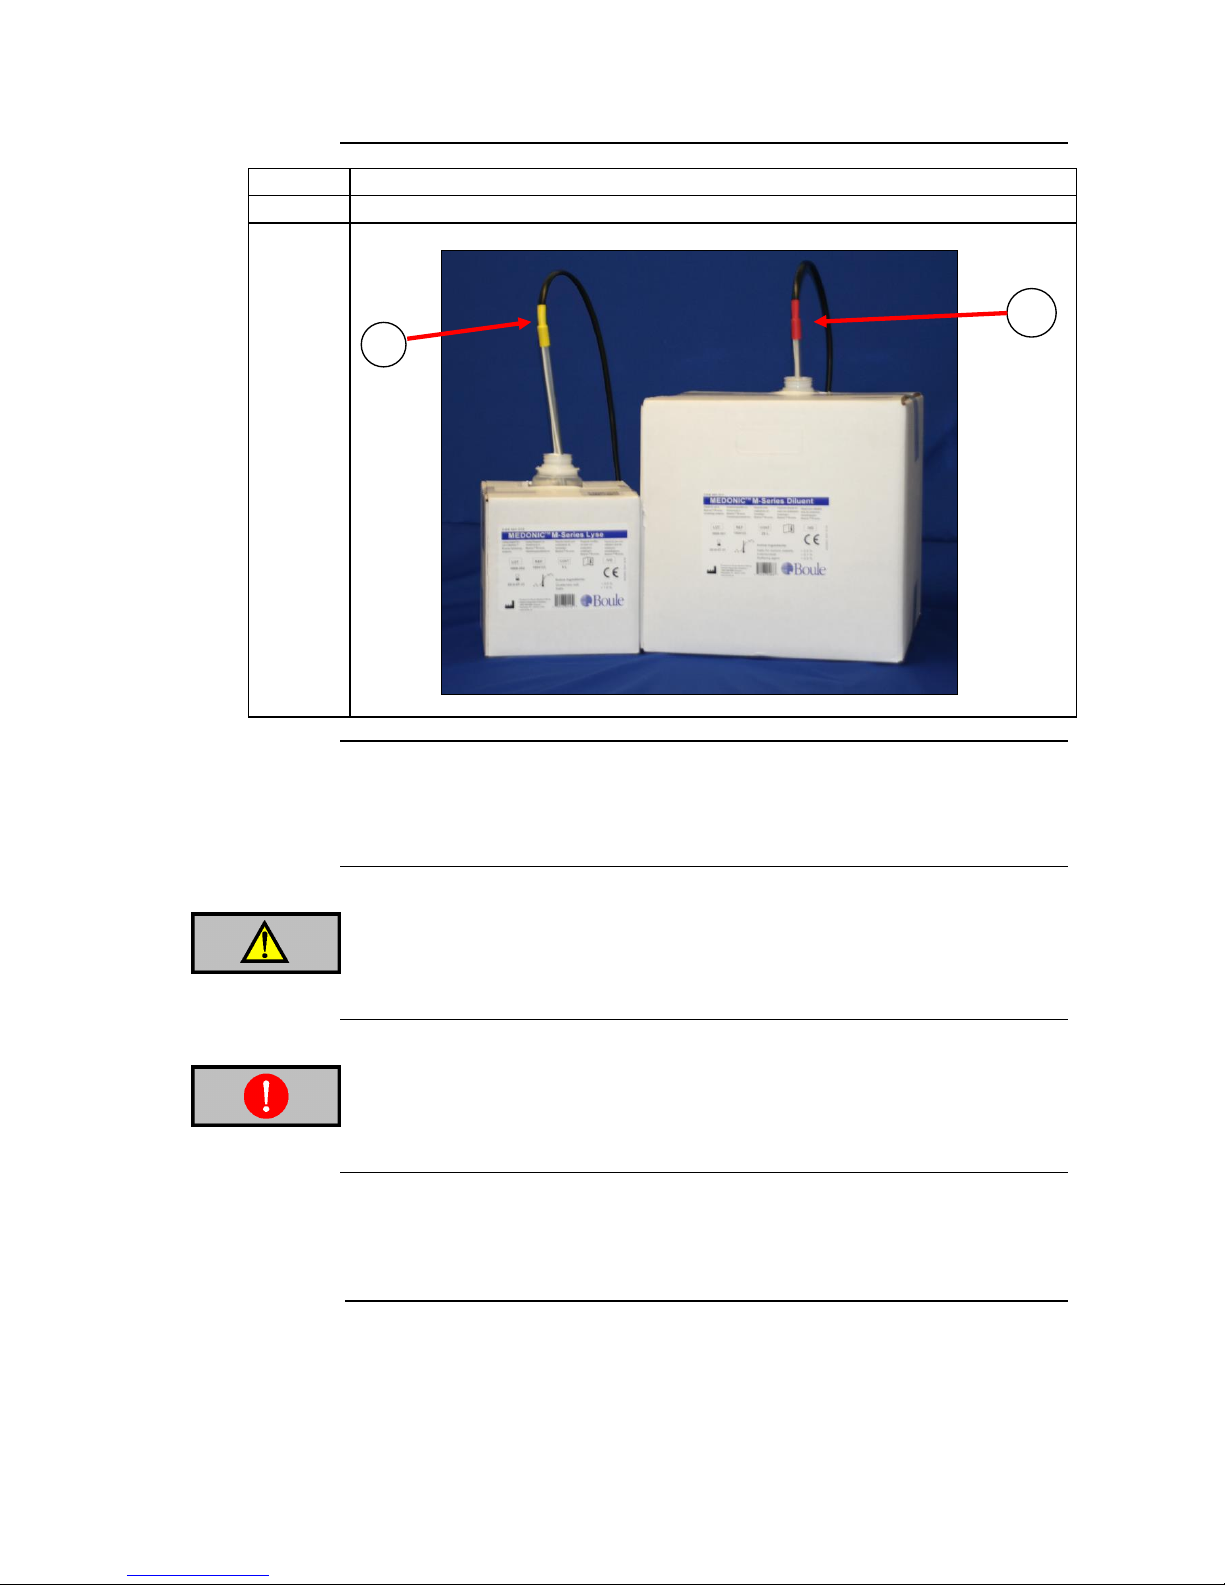
Step
Insert
3
The reagent level sensors into the corresponding reagent containers.
Figure 2.10
Waste
Connect the waste tubing to the analyzer. Place the other end of the waste
tubing directly into the drainage system or into a waste container, following
local regulations. See Section 8.8 for Disposal information.
Caution
The end of the waste tubing must be at a lower level than the instrument itself.
Not following this may lead to improper instrument functions and/or waste
liquid flowing backwards into the instrument.
Mandatory Action
Always use protective gloves when working with the waste container and the
waste tubing.
Fill System
For initial fill of analyzer, plug in analyzer and turn On/Off switch to ON.
Press [EXIT] button upon display of Fill prompt, and follow the instructions
below to fill analyzer.
Continued on next page
2
Page 18
17
2.4 Reagent Installation (continued)
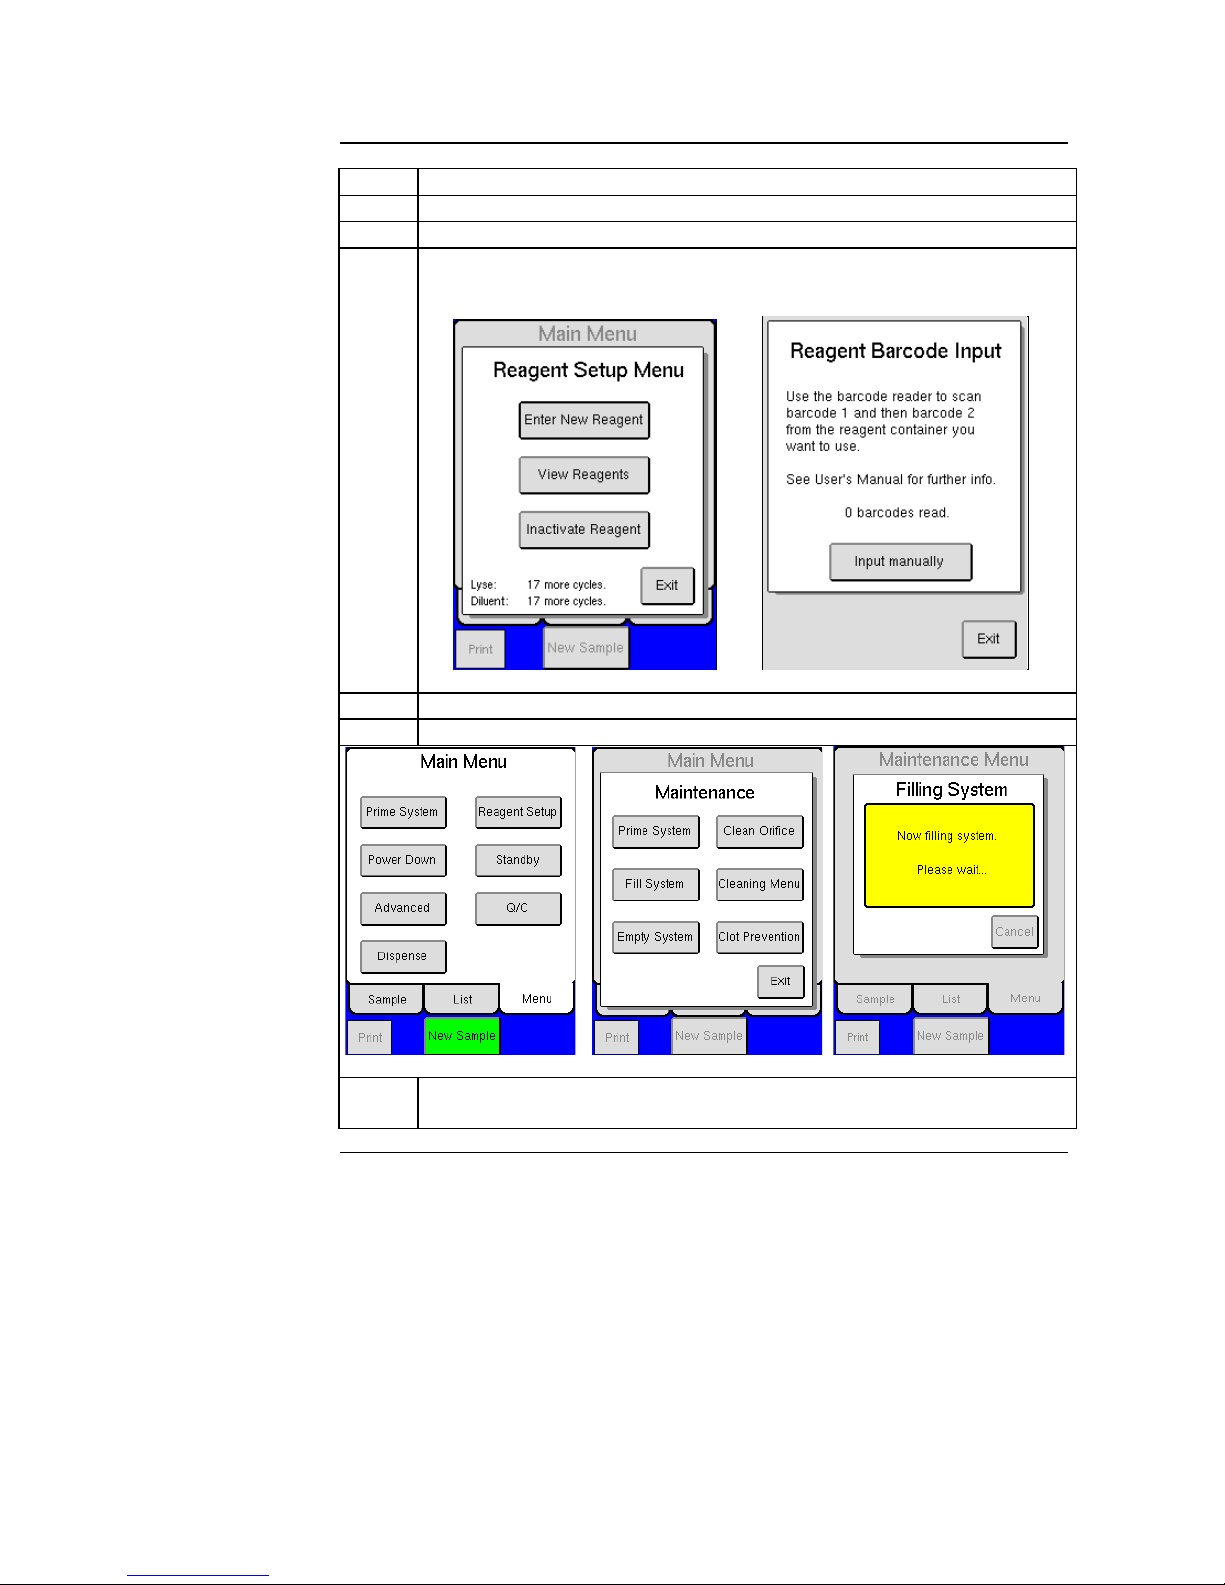
Step
Action
1
Select MENU tab.
2
Press [REAGENT SETUP] and then press [ENTER NEW REAGENTS].
3
Scan in barcodes on reagent containers, when all barcodes are entered a
screen will display that reagent barcodes have been accepted.
Figure 2.11 Figure 2.12
4
Return to MAIN Menu and press [ADVANCED].
5
Press [MAINTENANCE] and then [FILL SYSTEM].
Figure 2.13 Figure 2.14 Figure 2.15
6
The system is now filling up with reagents. This cycle will last for
approximately 3 minutes.
Print All
Settings
After initial setup, it is recommended to print all analyzer settings and keep for
personal records. Select [ADVANCED] from Main Menu, then [SETUP], and
then [PRINT ALL SETTINGS].
Factory
Calibration
All sample analysis modes (open tube, pre-dilute, MPA, cap piercer, sampling
device) are factory calibrated. However, calibration should always be checked
upon installation. See Section 7 for more details.
Page 19
18
2.5 Changing Reagents
Description
The interlocked reagent system displays indicator and warning messages to
alert the operator when reagents are running low and need to be changed.
When this occurs perform the following:
Step
Action
1
Select [MENU] to access the Main menu and then select [REAGENT SETUP].
2
Select [ENTER NEW REAGENT].
3
Scan Barcode 1 and then Barcode 2 on the reagent container. Press and hold the
ON button on the barcode reader each time a barcode is scanned.
4
When all barcodes are entered a screen will display that reagent barcodes have
been accepted.
5
Select [EXIT] to return to the Main menu.
6
Remove the cap and seal on the new reagent container.
7
Transfer the reagent level sensor from the used container to the new reagent
container.
Note
It is important when transferring the reagent level sensor that it is kept clean and
inserted into the correct reagent container.
8
The analyzer is now ready to resume operation or analyze samples. No priming
or fill cycle is necessary when putting on a new reagent container, if indicator
and warning messages are followed.
Important
A reagent alarm will display when at least one of the reagent containers is
running low, empty, or expired. Once alarm is displayed it will continue to
display after each sample run until the indicated container is changed.
2.6 Power Supply
Main supply
environment
The main power supply is located internally and designed to be operated
indoors. The power supply is safe for transient voltage as defined in
IEC 801-4.
Warning
Electrical shock hazard.
The instrument must only be connected to a grounded mains supply.
Violating this might result in injuries and/or erroneous parameter results.
Handling high
transient voltage
If high voltage transients are expected on the main supply, please follow the
recommendations below.
Important
When cycling the power switch from power on – power off – power on, it is
recommended to have a delay of 3 seconds after power off. If the power
switch is cycled back to power on too quickly, sensitive components in the
instrument electronics may get damaged.
Page 20
19
2.6 Power Supply
Warning
Electrical shock hazard.
Installation of external electrical equipment such as CVT must only be
carried out by authorized service engineers. Violating this might result in
injuries and/or loss of life and/or erroneous parameter results.
In case of
Symptom
Solution
High transient
voltage above
15%
-High background counts
on RBC, PLT or WBC.
-Defective instrument.
A CVT (magnetic stabilizer)
should be implemented to keep the
instrument from being damaged.
(If using an UPS, then it must have
surge protection.)
Guidelines
Guidelines are given in the Service Manual, “Installation auxiliary devices”
section. Contact your authorized distributor in such a case.
Power
interruptions
In case of an abrupt power loss there will be no damage done to the
instrument. Calibration constants and other parameters necessary for operation
are protected against main supply loss.
Before
connecting
In order to run the instrument, the frequency and main voltage needs to
correspond to user’s power outlet.
Locate the serial number plate on the rear of analyzer and check that the
main voltage and frequency corresponds to local main outlet.
If voltage and/or frequency does not correspond, then contact your
authorized distributor
Connecting
Power Adapter
Insert power adapter into the instrument’s main power inlet and connect it to
the main power supply. (This should only be performed after connecting the
reagent containers.)
Page 21
20
Section 3: General Overview
Section Overview
Introduction
This section contains general information about the instrument and optional
accessories.
Contents
This section contains the following topics:
Topic
See Page
General Instrument Overview
20
System Menu
21
System Flow
23
Sample Volume, Throughput, and Parameters
24
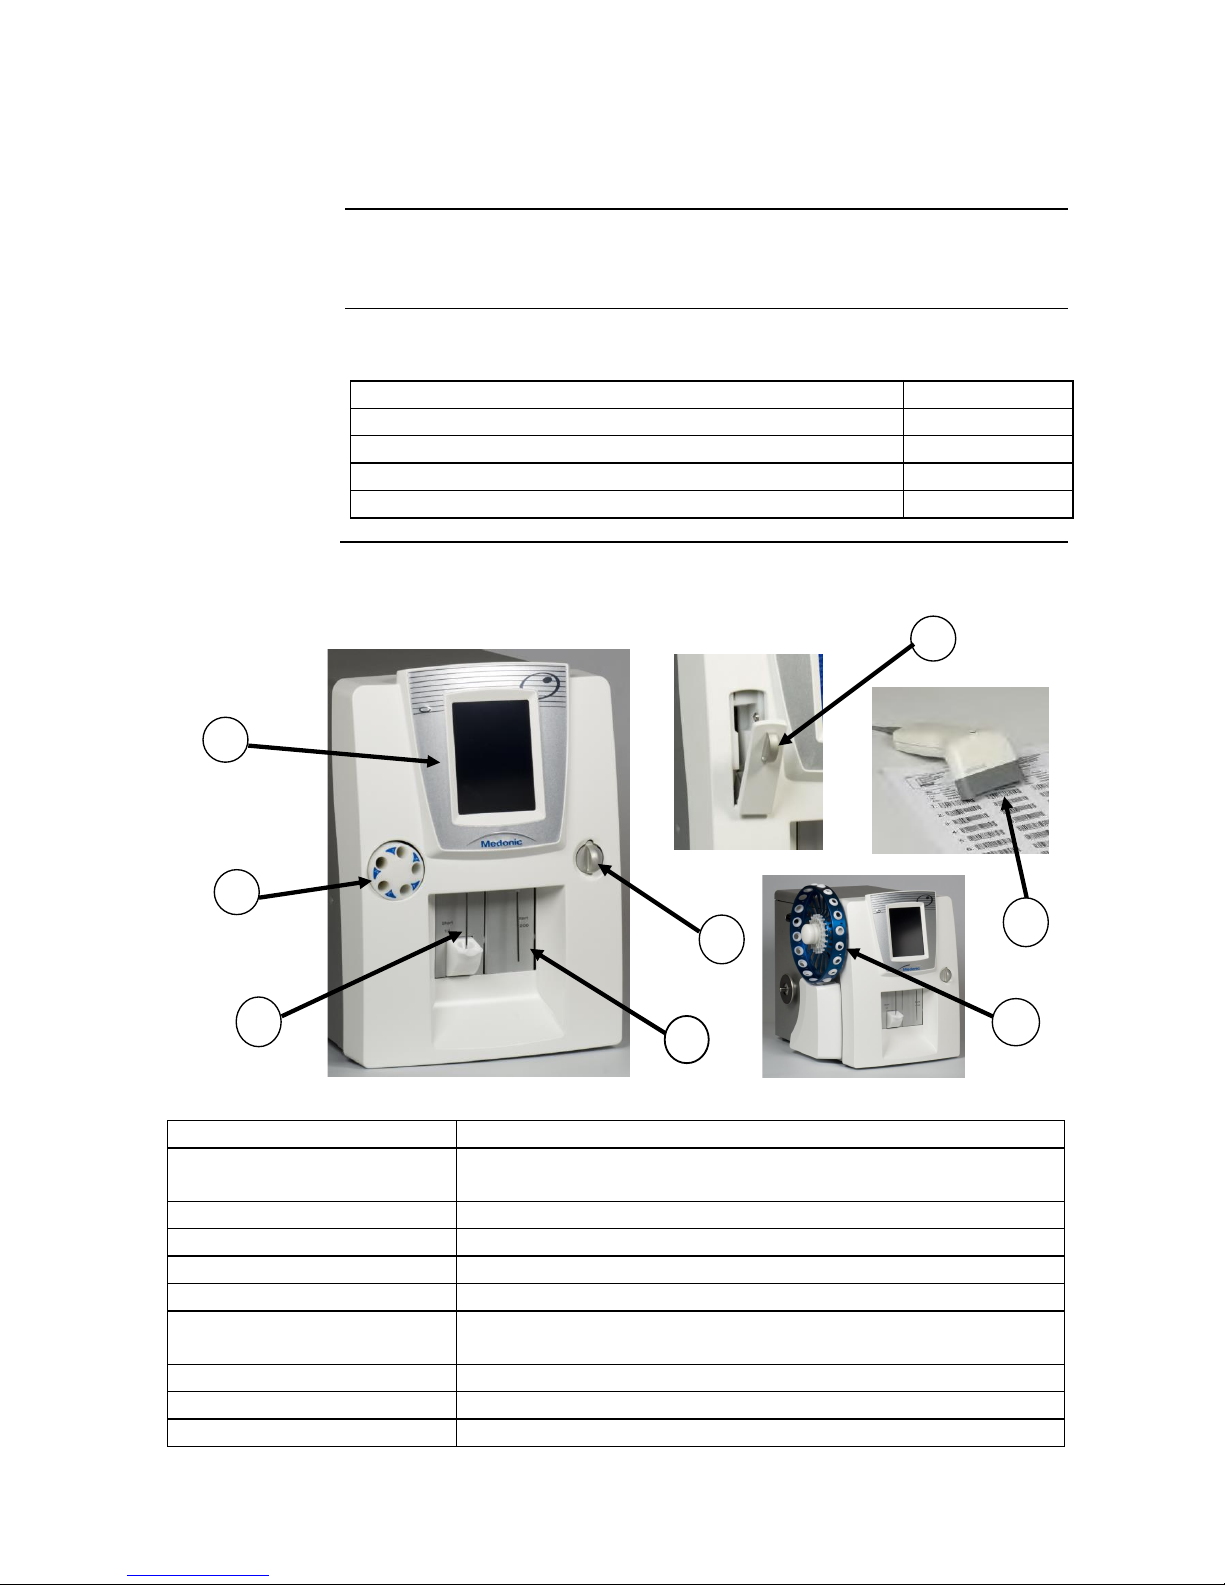
3.1 General Instrument Overview
Instrument
Overview
Figure 3.1
Part
Function
1. Display
TFT-LCD touch screen, monochrome or color, with incorporated
keyboard and numerical pad.
2. Whole Blood probe
Aspirates whole blood.
3. Pre-dilute probe/Dispenser
Aspirates pre-diluted samples and dispenses diluent.
4. MPA
Micro Pipette Adapter enables the user to analyze 20 µl of blood.
5. Printer (optional)
Prints sample results. (Not shown, model is user dependent)
6. Barcode reader
Barcode reader enables user to quickly enter patient, control, and
reagent pack identifications, and utilize the QC program.
7. Mixer (optional)
Uniformly mixes samples.
8. Sampling Device (optional)
Enables consecutive samples to be analyzed automatically.
9. Cap Piercer (optional)
Analyzes samples with decreased risk of blood contact.
6
2
4
Page 22
21
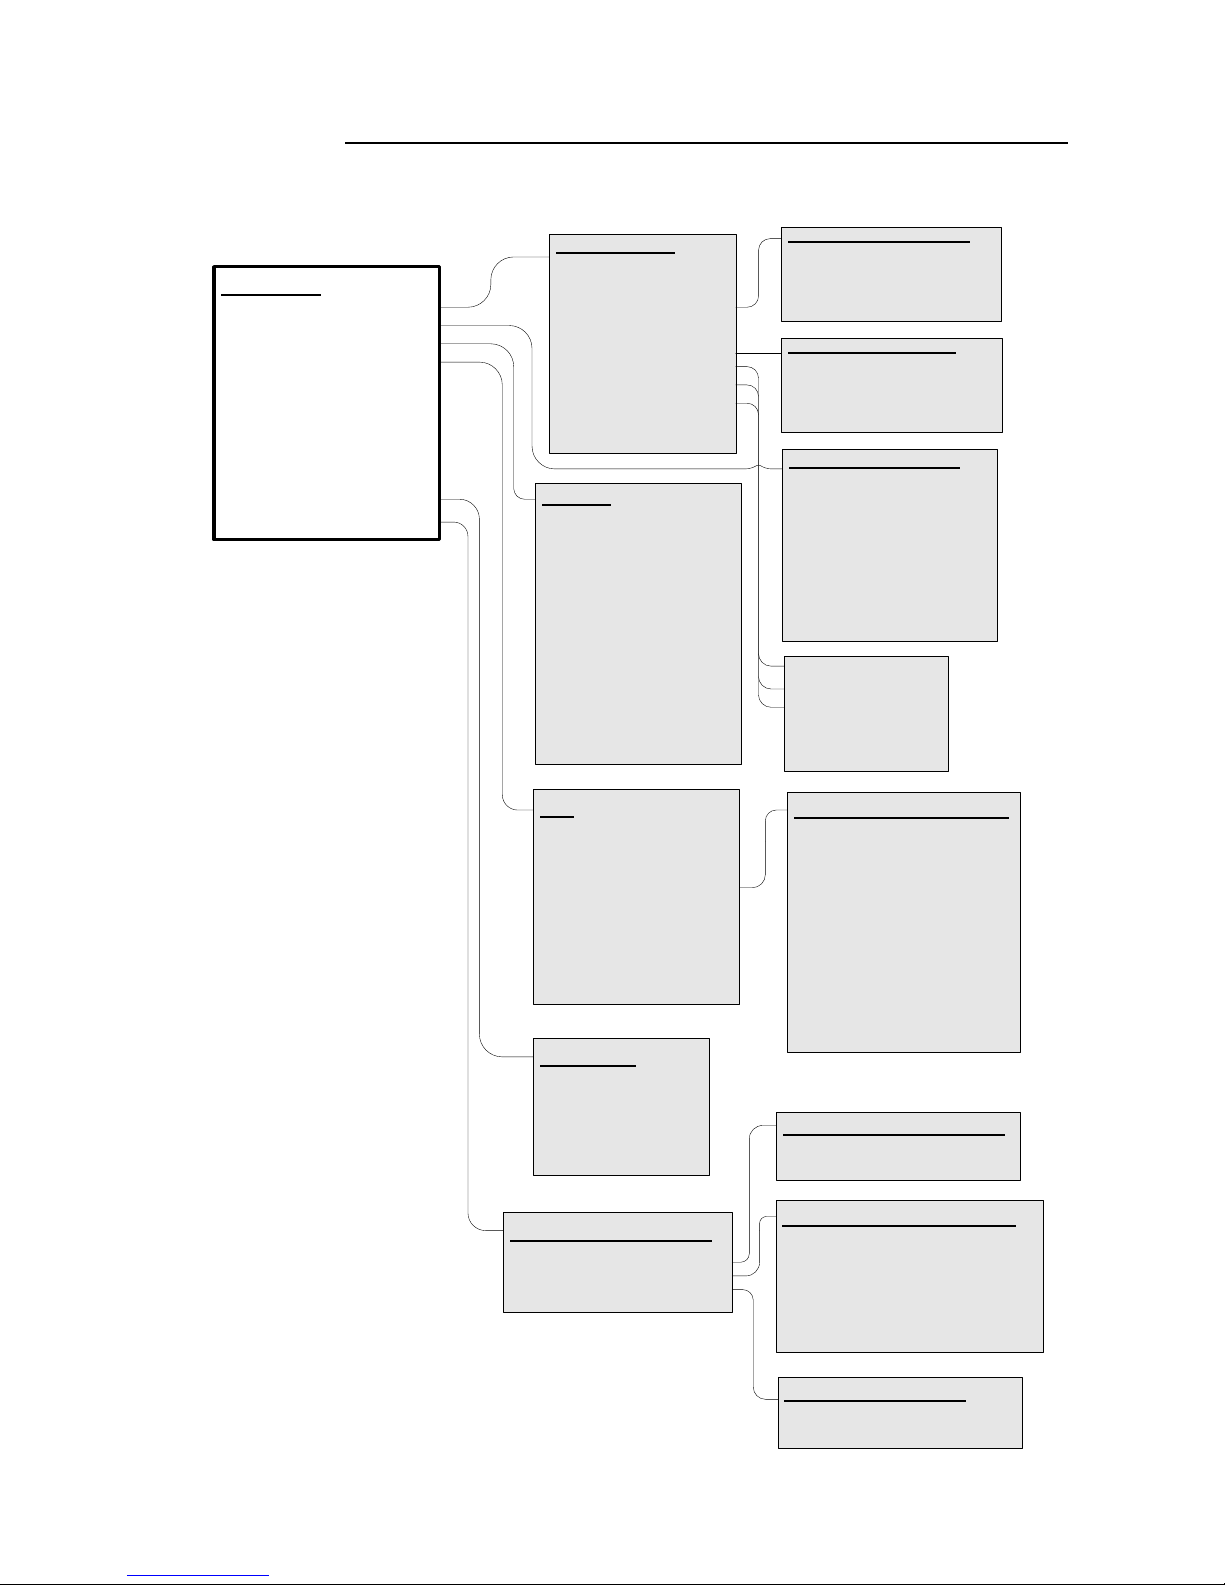
3.2 Menu Structure
Flowchart 3.1 Main Menu Structure
Main Menu
New Sample >
Sampling Device (optional) >
Sample >
List >
Menu >
Prime System ¤
Dispense ¤
Power Down ¤
Standby ¤
Advanced >
Q/C >
Reagent Setup >
Sample
New Sample >
Sampling Device (optional) >
[GRAPH WBC]
[GRAPH RBC]
[GRAPH PLT]
[PARAMETER RESULT]
!
Prev ¤
Next ¤
1(3) >
List >
Menu >
Print ¤
New Sample
ID_______
1,2,3..CE.. ¤
Set Profile >
Next Profile ¤
Prev Profile ¤
Run Con/Cal >
Operator ID >
A,B,C.. 1(4) >
ÅåÖö...1 (4) (optional) >
Ok ¤
Cancel <
Select Analysis Profile
11 possibilities of Analysis profiles
Next ¤
Prev ¤
Ok <
Run Con/Cal Sample
12 possibilities of Con/Cal Lots
Next ¤
Prev ¤
Cancel <
Sampling Device List
Pos St. SEQ ID
Input ID >
Start ¤
Extra Mix ¤
Pause ¤
Stop ¤
Continue ¤
Exit <
1/4 ABC
2/4 abc
3/4 123...!?/...CE
4/4 ÅåÖö… (optional)
Ok ¤
Cancel <
Reagent Setup Menu
Enter New Reagent >
View Reagents >
Inactivate Reagent >
Reagent Barcode Input
Input manually >
Exit <
View Reagent Statistics
Current Lyse/Diluent
Cycles Left
Lot No./Pack No.
Exp. Date
Open Date/Last Date
Print ¤
Exit <
Q/C Menu
View Con/Cal >
View Xb Stats >
Enter Con/Cal >
View Assays >
Exit <
Inactivate Reagent
Yes >
No <
List
New Sample >
Sampling Device (optional) >
Sample
Search >
[SEQ. x-y LISTED]
Previous ¤
Next ¤
1(6) (param. listed) >
Menu >
Select Sample Criteria
ID __________________
Seq (fr-to) ____________
Date (fr-to)____________
Profile
Today
Select All
Selected __/__
Exit <
Delete >
Send ¤
Print ¤
Stats >
Page 23
22
3.2 Menu Structure (continued)
Flowchart 3.2 Advanced Menu Structure
Advanced
Calibration >
Maintenance >
Service >
Setup >
Exit <
Calibration
Whole Blood >
Predilute >
Capillary Device >
Closed Tube Device >
Calibration Log >
Exit <
Setup Menu 1
Print Setup >
Serial Setup >
Print All Settings >
Send All Settings >
SEQ No. Setup >
Setup Menu 2 >
Analysis Profile >
Exit <
Service Menu
Serial no
Firmware
Clot Removal >
Noise test >
Configuration >
Pump & Valve >
Instrument Log >
Flush Shear Valve >
PTest >
Service Setup 2 >
Exit <
Service Menu 2
Serial no
Firmware
Blood Detector >
Level Detectors >
Beaker Detector >
Reagent Detector >
HGB >
Shear Valve >
Needle (if applicable) >
CVP (if applicable) >
Exit <
Setup Menu 2
Barcode Setup >
Memory Setup >
Blood Det. Setup >
Standby Setup >
Date/Time Setup >
Regional Setup >
Setup Menu 3 >
Exit <
Setup Menu 3
Color setup >
Mixer Setup >
Instrument ID >
PLT offset Setup >
High Alt. Setup >
Xb Range Setup >
Delay Predilute >
Exit <
Analysis Profile Setup
Activate
[X] >
Default >
Name >
Block parameters >
Normal Ranges >
WBC setup >
RBC/PLT Setup >
Misc. Setup >
Next / Prev ¤
Exit <
Maintenance
Prime System ¤
Clean Orifice ¤
Fill System ¤
Cleaning Menu >
Empty System ¤
Clot Prevention ¤
Exit <
Page 24
23
3.3 System Flow
Description
This section contains the system flow concerning standby and cleaning cycles.
Flowchart 3.3 System Flow
After 15 minutes*
Screen Saver
Mode**
After 2 hours*
Before 2 hours*
In Standby
Mode
Press anywhere on
screen to view screen
Press [EXIT]
Returns user to
last displayed page
Press anywhere on
screen to view screen
Press [EXIT] to exit
standby mode***
* This time amount is user adjustable.
** Possible to start directly if in View Sample,
List Sample, or Main Menu screens.
*** Default automatically runs background count.
If default is inactivated by user, background
count run recommended.
Page 25

24
3.4 Sample Volume, Throughput, and Parameters
Description
The Medonic M-Series is a fully automated cell counter reporting up to 16
parameters.
Sample volume
Autoloader: ≤ 300 µl
Cap Piercer: ≤ 250 µl
MPA: ≤ 20 µl
Open Tube: ≤ 110 µl
Throughput
Open Tube: ≥ 60 samples per hour.
Cap Piercer: ≥ 45 samples per hour.
Autoloader: ≥ 43 samples per hour.
16 Parameters
See list of parameters below:
Leukocyte parameters
WBC
Total White Blood Cell Count
LYM%
Lymphocytes percentage
LYM#
Lymphocytes (absolute)
MID%
Mid Cell Population percentage
MID#
Mid Cell Population (absolute)
GRAN%
Granulocytes percentage
GRAN#
Granulocytes (absolute)
Erythrocyte parameters
RBC
Total Red Blood Cell Count
HGB
Hemoglobin Concentration
HCT
Hematocrit
MCV
Mean Cell Volume of RBCs
MCH
Mean Cell Hemoglobin
MCHC
Mean Cell Hemoglobin Concentration
RDW%
Red Blood Cells distribution width percentage
Thrombocyte parameters
PLT
Total Platelet Count
MPV
Mean Platelet Volume
Page 26
25
Section 4: Instrument Setup
Section Overview
Introduction
This section covers the initial configuration needed to customize the
instrument settings.
Contents
This section contains the following topics:
Topic
See Page
Menu Selection
25
Initial Setup
26
Advanced Setup
27
Reagent Setup
31
User Interface
33
4.1 Menu Selection
Main Menu upon
initialization
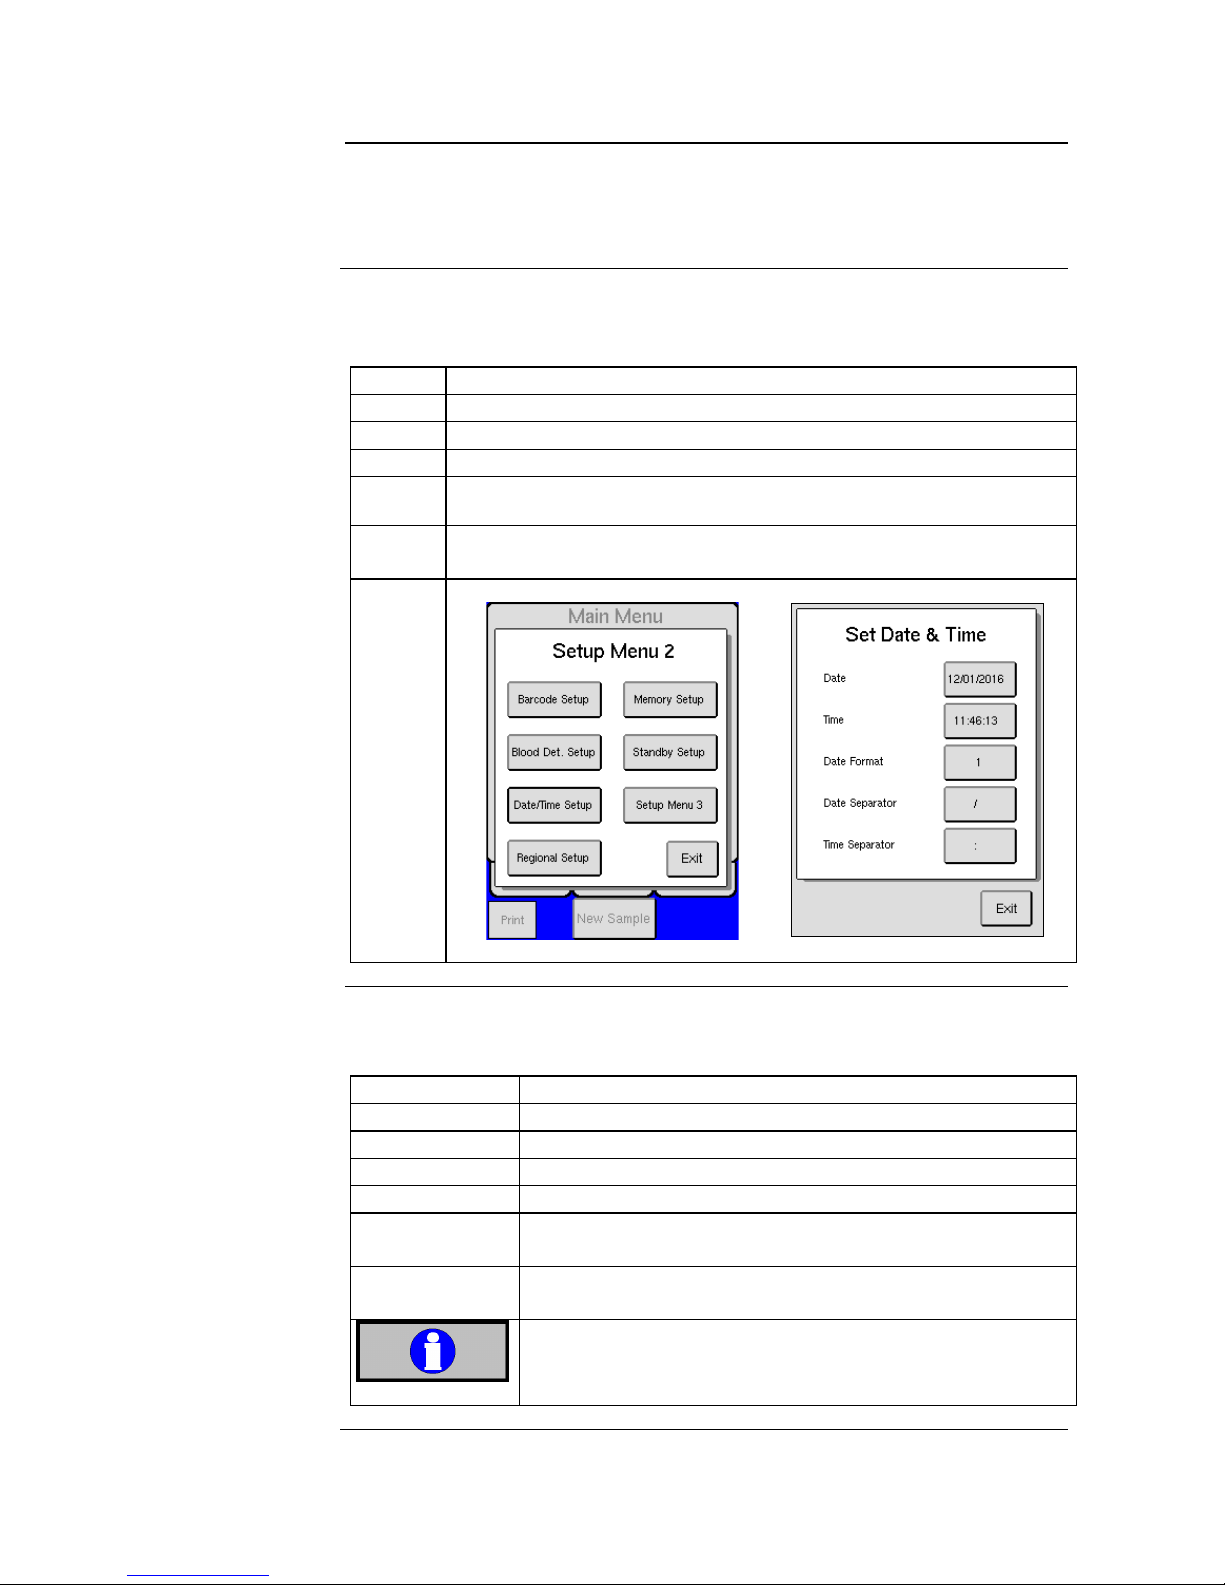
The List Menu will be displayed upon initialization.
From this main screen all other menus can be accessed for setup.
By selecting the MENU tab and then pressing [ADVANCED] the
Advanced Menus will be displayed.
List and System
Menu
Figure 4.1 Figure 4.2
Page 27
26
4.2 Initial Setup
Initial Setup
Initial setup of the instrument, except date and time, has been factory set to
default values for the average Boule users. However, other user definable
formats may be preferred, details are provided below.
Setting up
date/time
The date/time function is shown on all samples and printouts and should
always be setup correctly. To set date/time follow the instruction below:
Step
Action
1
Start by pressing [ADVANCED] from the MENU tab.
2
Press [SETUP], then press [SETUP MENU 2].
3
Press [DATE/TIME SETUP] to enter the set date/time menu.
4
Press [DATE FORMAT] to select date specific setting.
1 = DD/MM/YY; 2 = YY/MM/DD, 3 = YY/DD/MM, 4 = MM/DD/YY
5
Press on the item that you want to change and enter the changes on
the numerical pad. See Menus below.
Menus
Figure 4.3 Figure 4.4
Activate Mixer
(optional)
To activate mixer follow the instruction below:
Step
Action
1
Start by pressing [ADVANCED] from the MENU tab.
2
Press [SETUP] and then [SETUP MENU 2].
3
Press [SETUP MENU 3].
4
Press [MIXER].
5
If the mixer is not activated the button will have empty
brackets ( [ ] ). To activate press button and select [X].
Note
Upon sample aspiration mixer will discontinue rotation
until sample analysis is complete.
Important
It is recommended that whole blood samples are mixed for
10 – 15 minutes and then analyzed. Mixing for more than 4
hours may cause erroneous results.
Continued on next page
Page 28
27
4.2 Initial Setup (continued)
Setting up
language
Change of display language is performed by following the instructions below:
Step
Action
1
Start by pressing [ADVANCED] from the MENU tab.
2
Press [SETUP].
3
Press [SETUP MENU 2].
4
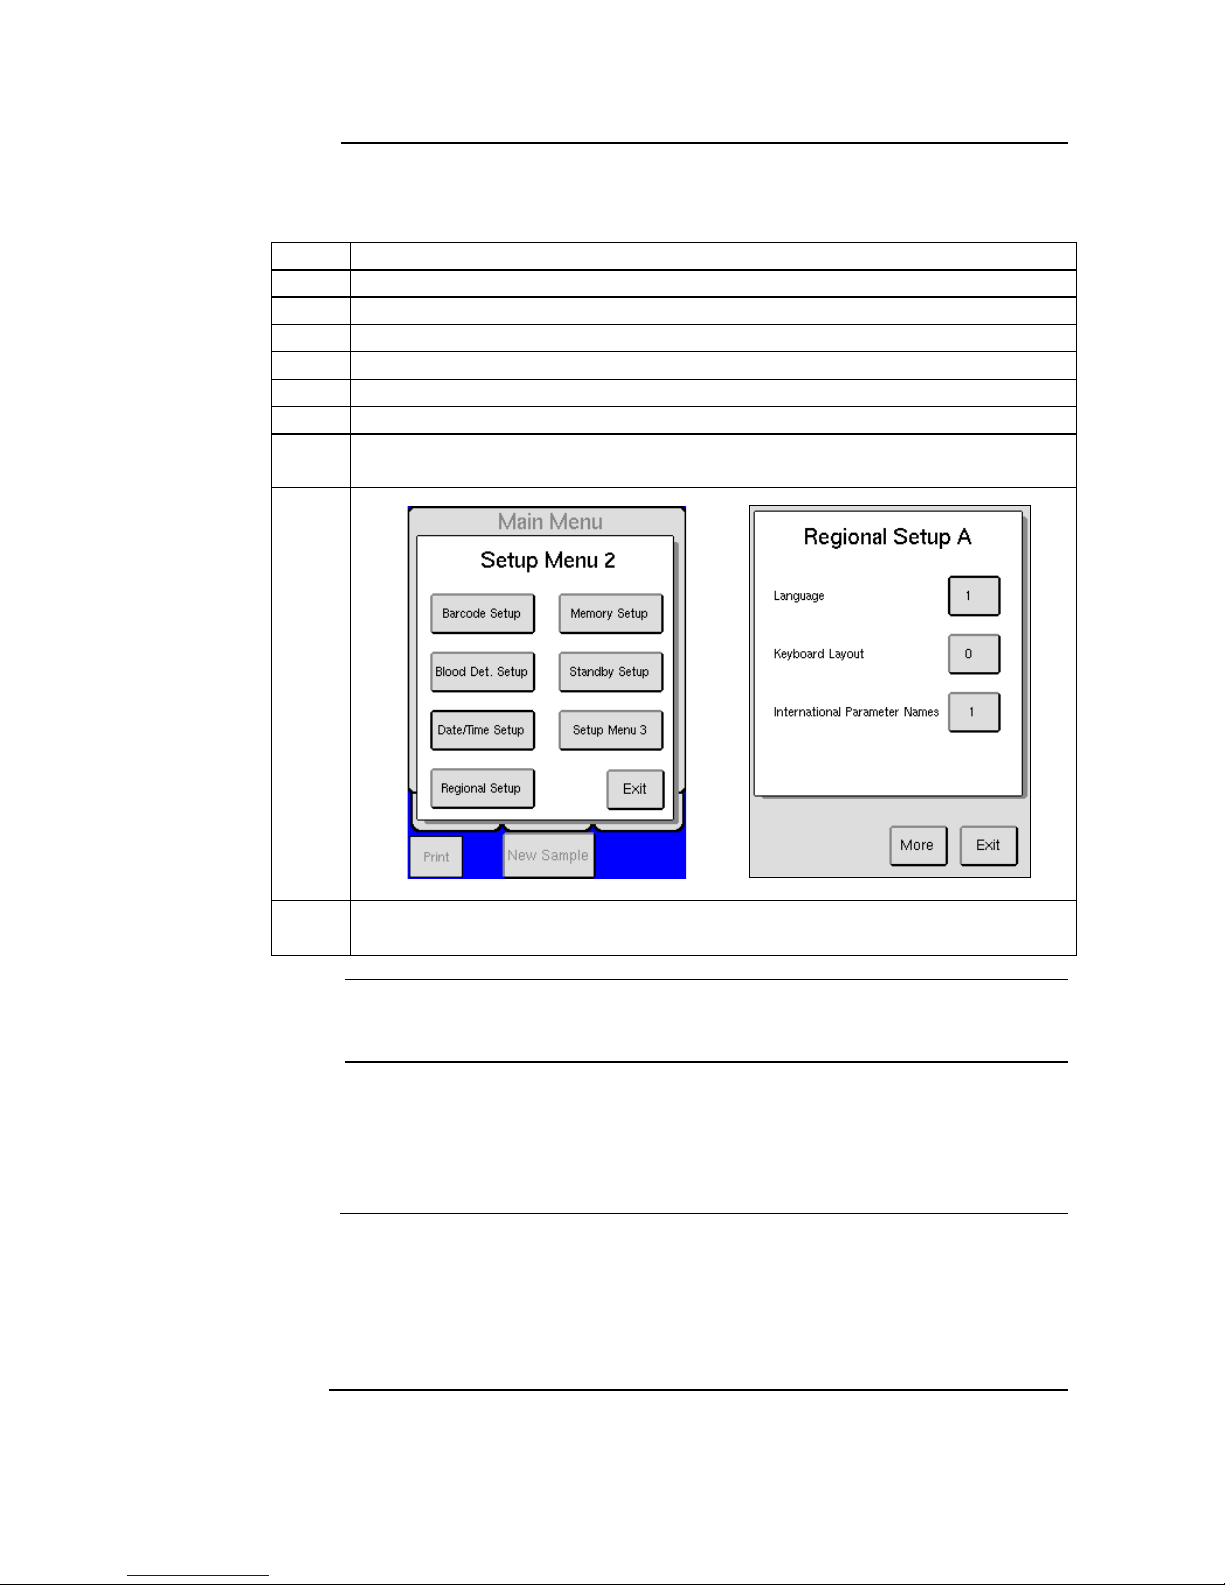
Press [REGIONAL SETUP], a list of local settings will be displayed.
5
Press [MORE] until language button is displayed.
6
Press [LANGUAGE] to enter language screen.
7
Choose the number that corresponds with the language desired and press [OK]
to save.
Menus
Figure 4.5 Figure 4.6
Note
If an option is not available, the number will not be accepted when operator
presses [OK].
4.3 Advanced Setup
Description
Initial advanced setup of the analyzer, has been factory set to default values.
However, other user definable formats may be preferred, details on how to
install and configure external components such as barcode readers, printers,
data communication, etc. are provided below.
Default Printer
The analyzer has been automatically set to the USB printer provided by CDS.
(Printer Type 4)
Contact local distributor for current list of available USB printers
If using USB printer other than that specified by distributor, the printer must
be HP PCL 5 or IBM proprinter compatible.
Continued on next page
Page 29
28
4.3 Advanced Setup (continued)
Select Printer
Type
Follow the instruction below for interfacing analyzer to different printer types.
(To connect printer see Section 2.3)
Step
Action
1
Start by pressing [ADVANCED] from the MENU tab.
2
Press [SETUP] and then [PRINT SETUP] to enter the Print Setup menu.
3
Press [MORE] to view Printer type. Printer types are as follows:
4 = USB printer
5 = Seiko DPU 411/12 and 414
6 = IBM proprinter / Epson compatible
7 = HP PCL 3 and 5 protocol compatible
4
To change printer type press [PRINTER TYPE], enter the correct number and
press [OK] to save.
Print modes
To select options for printing results.
Step
Action
1
Start by pressing [ADVANCED] from the MENU tab.
2
Press [SETUP].
3
Press [PRINT SETUP] to enter the printer setup menu.
4
To set Manual Print Mode function select from the following:
0 = None, 1 = Without Histograms, or 2 = With Histograms.
5
To select Auto Print Mode function select from the following:
0 = None, 1 = Without Histograms, or 2 = With Histograms.
Note
Extended printer format settings and user definable print layouts are also
available. Please contact local distributor for further detailed information on
how to setup user definable formats.
Serial Setup
To select options for sending results and data follow instruction below:
Step
Action
1
Start by pressing [ADVANCED] from the MENU tab.
2
Press [SETUP].
3
Press [SERIAL SETUP] to enter the serial setup menu.
4
To set Manual Send Mode function select from the following:
0 = None, 1 = Without Histograms, or 2 = With Histograms.
5
To select Auto Send Mode function select from the following:
0 = None, 1 = Without Histograms, or 2 = With Histograms.
6
HW handshake is automatically activated to check serial port connection. To
inactivate change [X] to ([ ]), and then [OK] to save.
7
Send with Ack. is automatically activated to send an acknowledgement
message with each sample being transmitted to computer. To inactivate change
[X] to ([ ]), and then [OK] to save.
8
Baud Rate sets the transfer speed on the serial port. The default is 1
(19200N81). To change to slower baud rate, select 2 (9600N81), and then [OK]
to save.
Continued on next page
Page 30
29
4.3 Advanced Setup (continued)
9
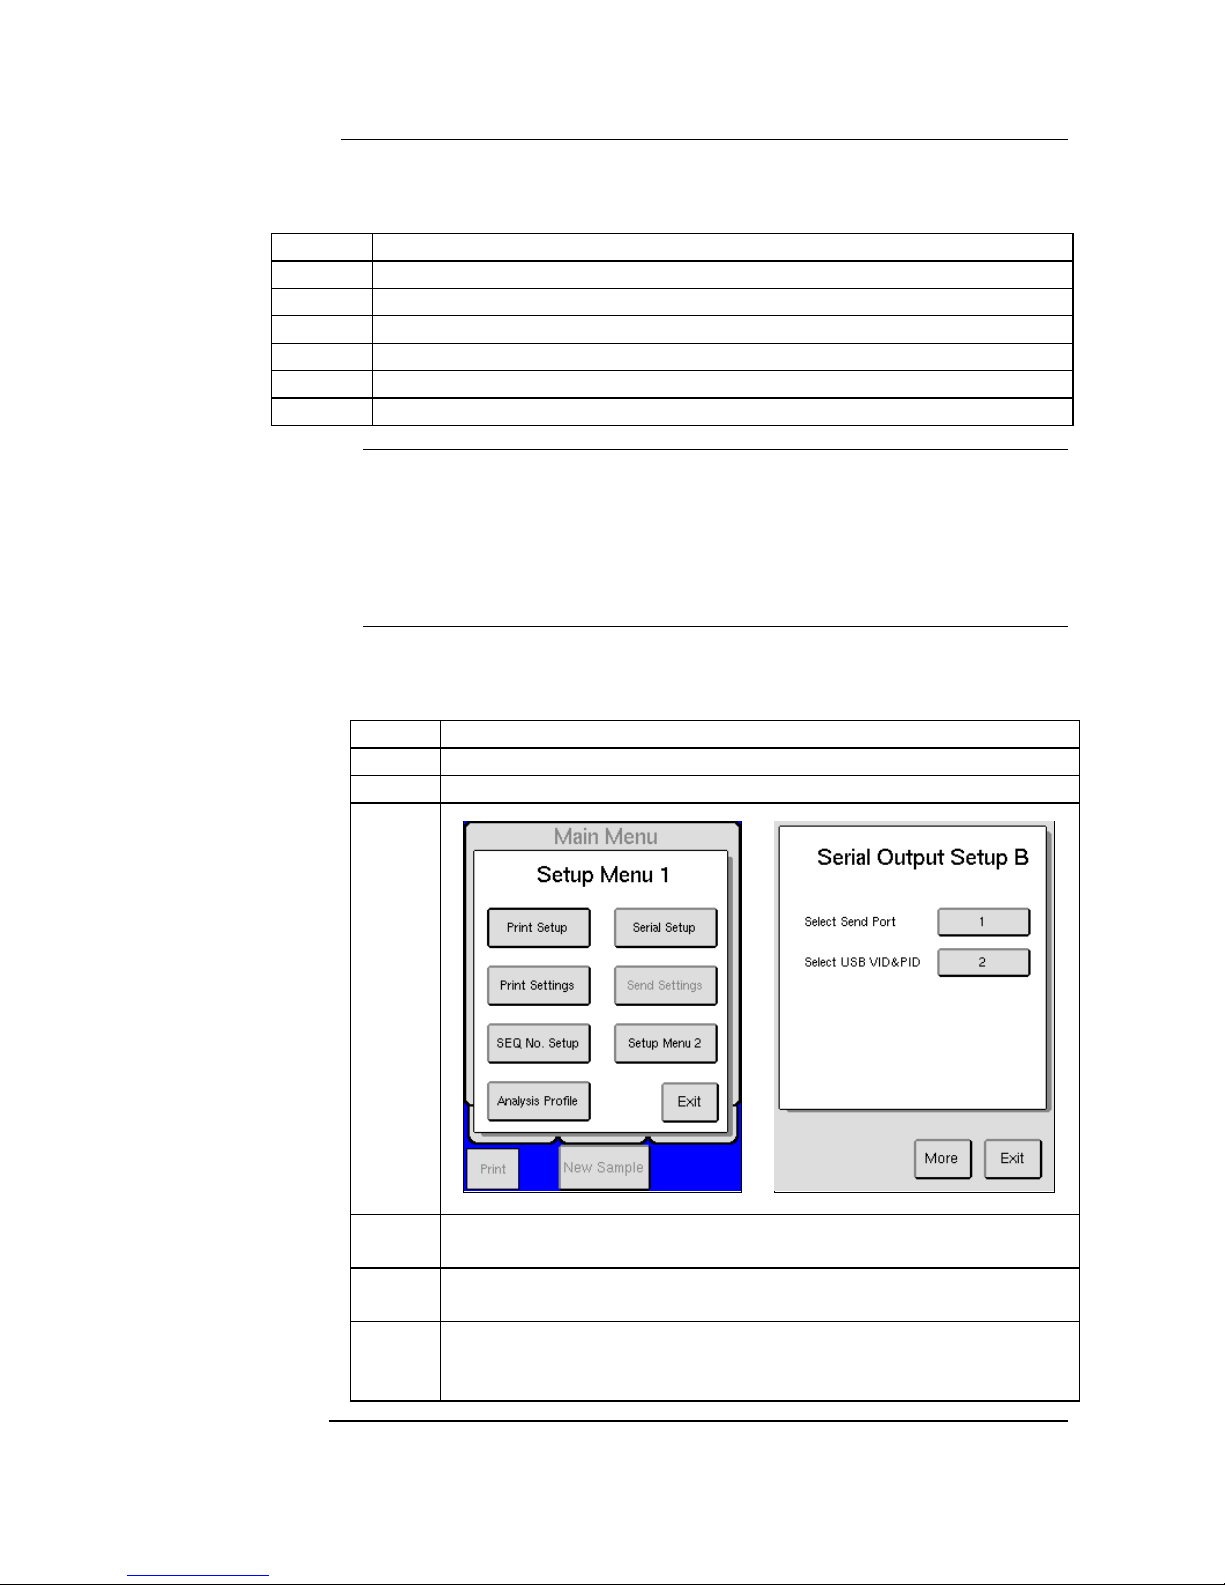
Select Serial port sets the output port for sample data, select from the following:
2 = USB device port, 3 = USB memory stick, or 4 = USB RS232 serial port
adapter
10
Select USB vendor and product ID sets the USB identity for the analyzer.
Select 2 (Boule USB Vendor ID) if your PC application supports the Boule
USB Vendor ID.
If not, select 1 (Gadget Serial USB Vendor ID).
If unsure, please check the documentation for your PC application, or contact
the company that developed it.
Barcode Setup
To setup the barcode reader follow the instructions below. (Note that the
default barcode setting is 9600N81). See barcode reader insert to determine
types of barcodes that can be scanned, if using barcodes for patient IDs.
Step
Action
1
Start by pressing [ADVANCED] from the MENU tab.
2
Press [SETUP].
3
Press [SETUP MENU 2].
4
Press [BARCODE SETUP] to enter the barcode setup menu.
External
For serial barcode readers, set Barcode Reader Type = 1. If not, set it = 0.
To use another USB barcode reader, other than the one delivered by Boule,
together with the instrument, perform the following:
Leave the barcode reader unconnected.
Press the button to the right of [Set USB barcode reader].
The display shows [Connect a USB barcode reader to enable it].
Connect the USB barcode reader to one of the USB host connectors.
The instrument returns to [Barcode Reader Setup].
Check that you can input barcodes with the barcode reader.
Note: If you want to go back to using the USB barcode reader delivered by
Boule together with the instrument, follow the procedure above. The
instrument can only handle one kind of USB barcode reader at a time.
Internal
An Internal barcode reader is also available on some models. To change the
factory default setup follow Steps 1-4 and choose the format that is
appropriate. (The Standard Setup is most common.)
0
No internal barcode reader
1
Standard Setup (I2of5 with checksum)
2
I2of5 without checksum
Note
If Internal Barcode Reader setting is changed to Setting 1 or 2 press
[INTERNAL BARCODE INITIALIZATION] to re-initialize the barcode
reader.
Continued on next page
Page 31
30
4.3 Advanced Setup (continued)
Keyboard Setup
(optional)
To setup the keyboard follow manufacturer instruction for setup and plug
into analyzer keyboard port. See Section 2.3 for details.
Step
Action
1
Start by pressing [ADVANCED] from the MENU tab.
2
Press [SETUP], then [SETUP MENU 2].
3
Press [REGIONAL SETUP], and then [MORE].
4
Press [KEYBOARD LAYOUT], and select keyboard type.
5
Press [EXIT] until Main Menu is reached.
6
Turn analyzer OFF, and then turn ON again for changes to take effect.
Data
Communication
The analyzer is equipped with three different outputs for connection to a
computer (network).
1. USB output with USB device port connector.
2. USB memory stick
3. USB RS232 serial port adapter
USB connection
To connect to a PC computer using a USB connector, simply plug in USB
connectors between analyzer and computer, and follow below instructions:
Step
Action
1
Start by pressing [ADVANCED] from the MENU tab.
2
Press [SETUP], then [SERIAL SETUP], and then [MORE].
Menus
Figure 4.7 Figure 4.8
3
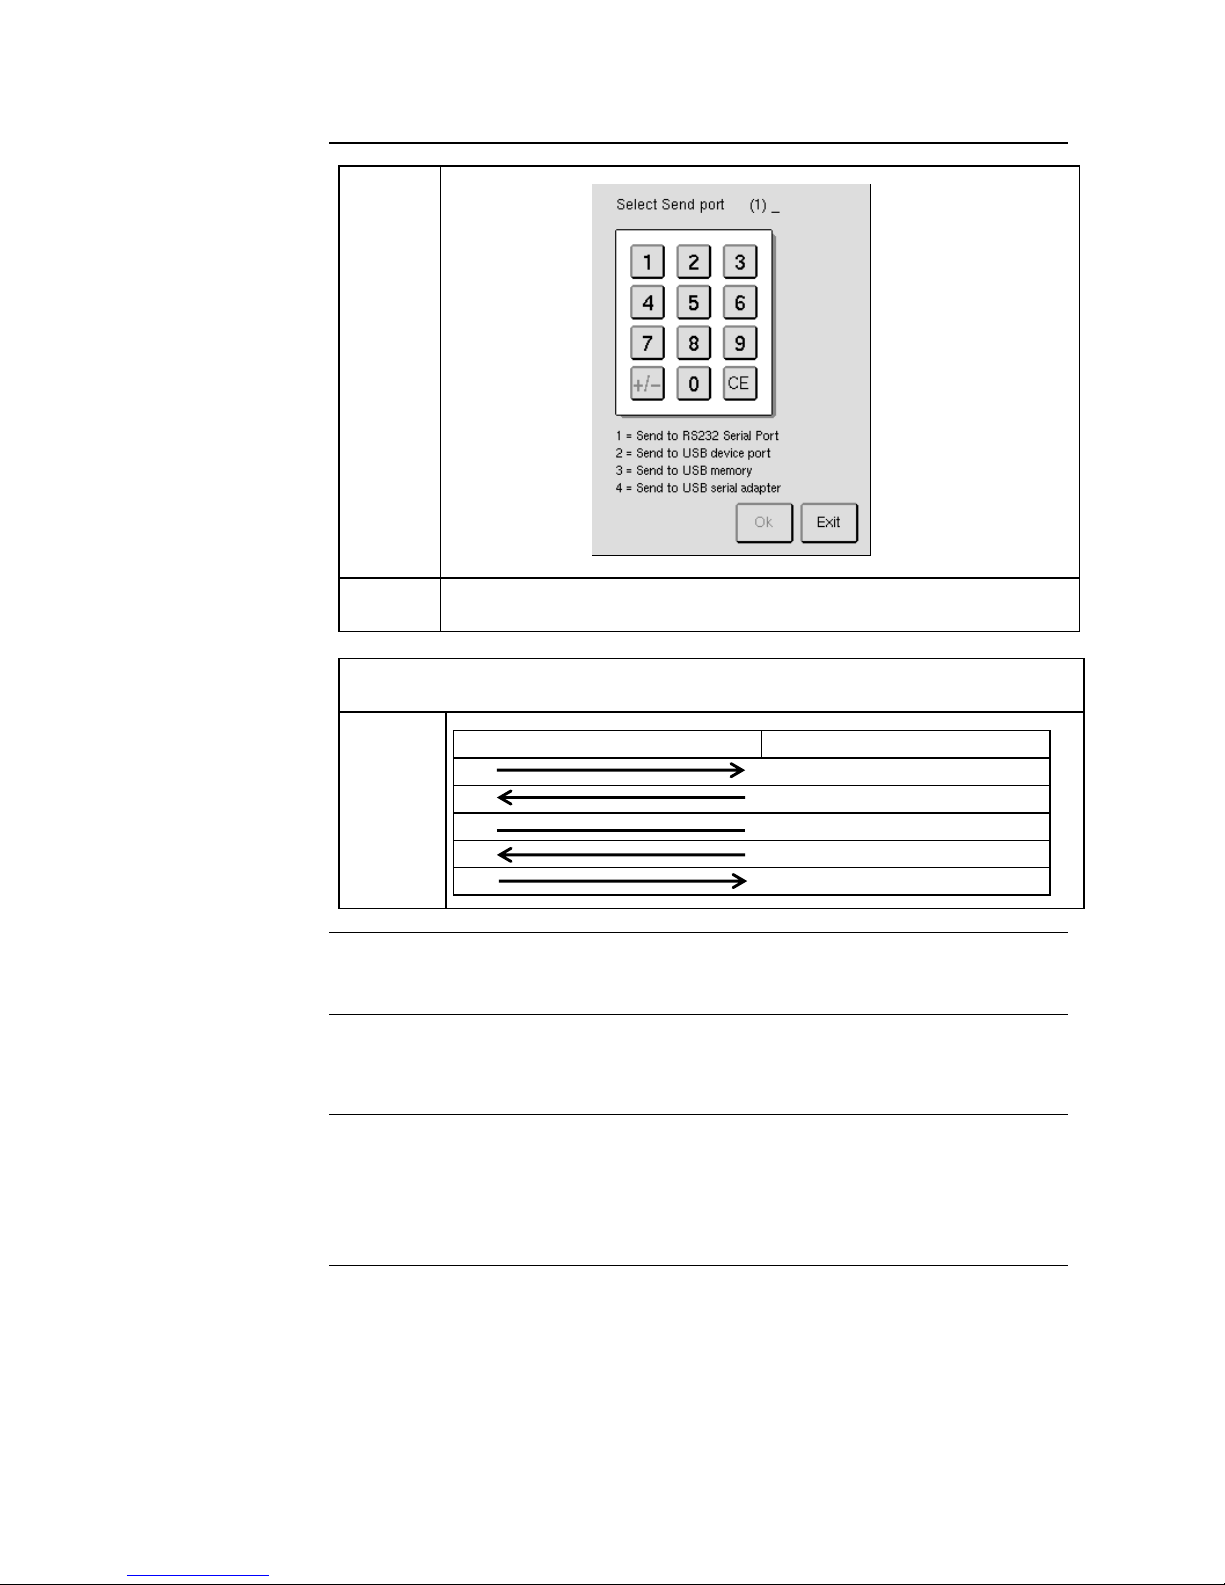
To activate the USB connection to a PC computer, press [SELECT
SEND PORT] button, then type in [ 2 ], and then [OK] to save.
4
To activate the USB connection to a memory stick, press [SELECT
SEND PORT] button, then type in [ 3 ], and then [OK] to save.
5
To activate the USB connection to the RS232 serial port adapter,
press [SELECT SEND PORT] button, then type in [ 4 ], and then
[OK] to save.
Continued on next page
Page 32
31
4.3 Advanced Setup (continued)
Menu
Figure 4.9
Note
For Select Send Port activation to function correctly user must have
a PC application that can receive and process reports.
To connect to a PC computer using a 9 pin RS232-USB converter see
instructions below:
Cable end converter (9pin)
Cable end pc (9pin)
2
3
3 2 5 5 7 8 8
7
4.4 Reagent Setup
Description
This section describes the functions of the reagent setup menu and how to
access reagent statistics.
Reagent Input
(Enter New
Reagents)
The Medonic M-Series System is interlocked with specified Boule reagents for
optimal performance. The reagent containers must be identified by the
instrument before analysis of samples can begin. To identify reagents scan in or
manually enter the barcodes on the reagent containers. See section 2.4.
Continued on next page
Page 33
32
4.4 Reagent Setup (continued)
View Reagent
Reagent statistics can be viewed in two ways:
Step
Action
1
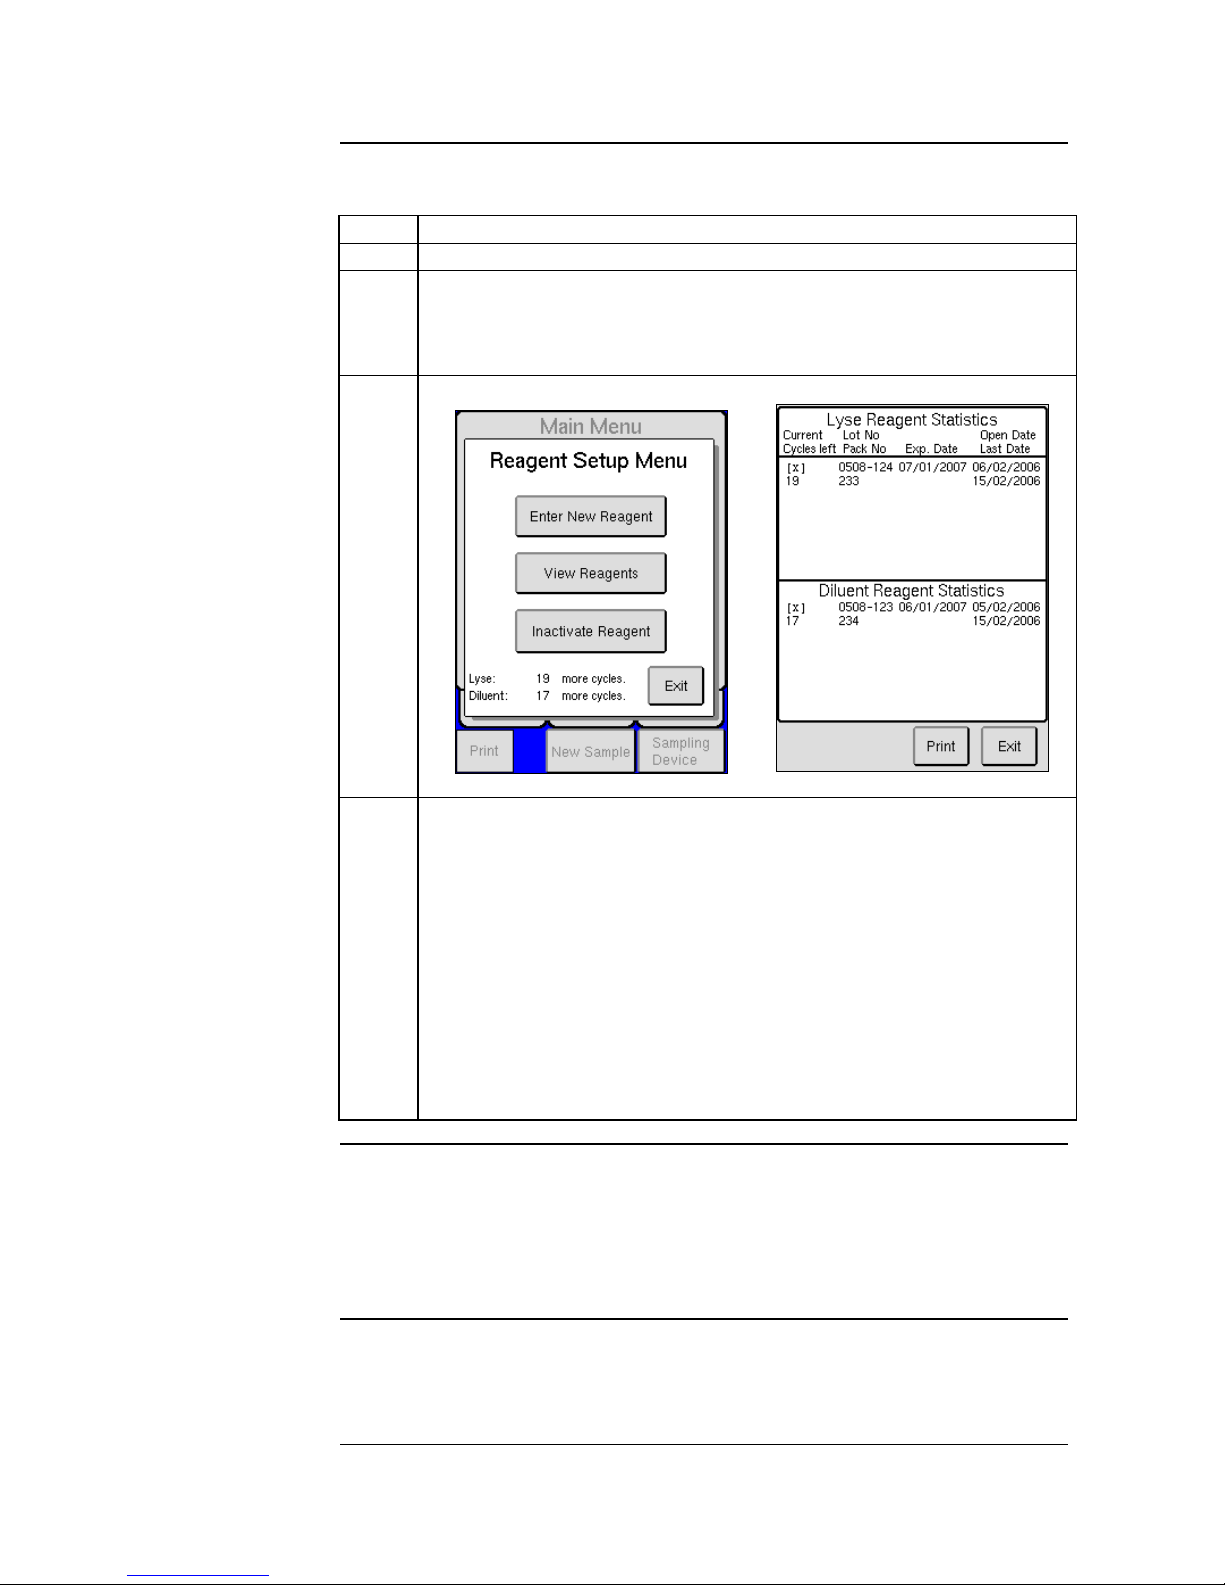
Start by pressing [REAGENT SETUP] from the MENU tab.
2
On the lower left-hand side of the Reagent Setup Menu, both the
remaining cycles for Diluent and Lyse are displayed. (It is important to
remember that cycles include analyses, wash cycles, background
counts, primes, exit standbys, etc.)
3
Figure 4.10 Figure 4.11
4
The second method of viewing reagent statistics is by pressing [VIEW
REAGENTS] from the Reagent Setup Menu. This screen is divided
into the last four Lyse Reagent Statistics and the last four Diluent
Reagent Statistics. For each, the operator can view the following:
[X] indicates which reagent is currently activated.
The number of cycles left for specific reagent container.
The Lot and Pack Numbers
The expiration date of the specific reagent container.
The Open Date, when the reagent container was first used on
the system.
The Last Date, when the last time that reagent container was
used to run a cycle.
Inactivate
Reagent
It is possible for the operator to inactivate the current reagent box by pressing
the [INACTIVATE REAGENT] button and then [YES]. Once deactivated the
operator must scan in or manually enter another reagent container before
analysis of samples can begin. (If reagent level is adequate, an inactive reagent can
be re-activated by simply scanning the barcode on the reagent bottle again.)
Reagent
Indicators
The interlocked reagent system displays indicator and warning messages to
alert the operator when reagents are running low and need to be changed. See
Section 12.2 and 12.3.
Page 34
33
4.5 User Interface
Description
This section describes the functions of available menus in the instrument that
have not been described in any other section of this manual.
Analysis Profile
It shall be possible for authorized operators to customize analysis profiles. See
following menu options:
Step
Action
1
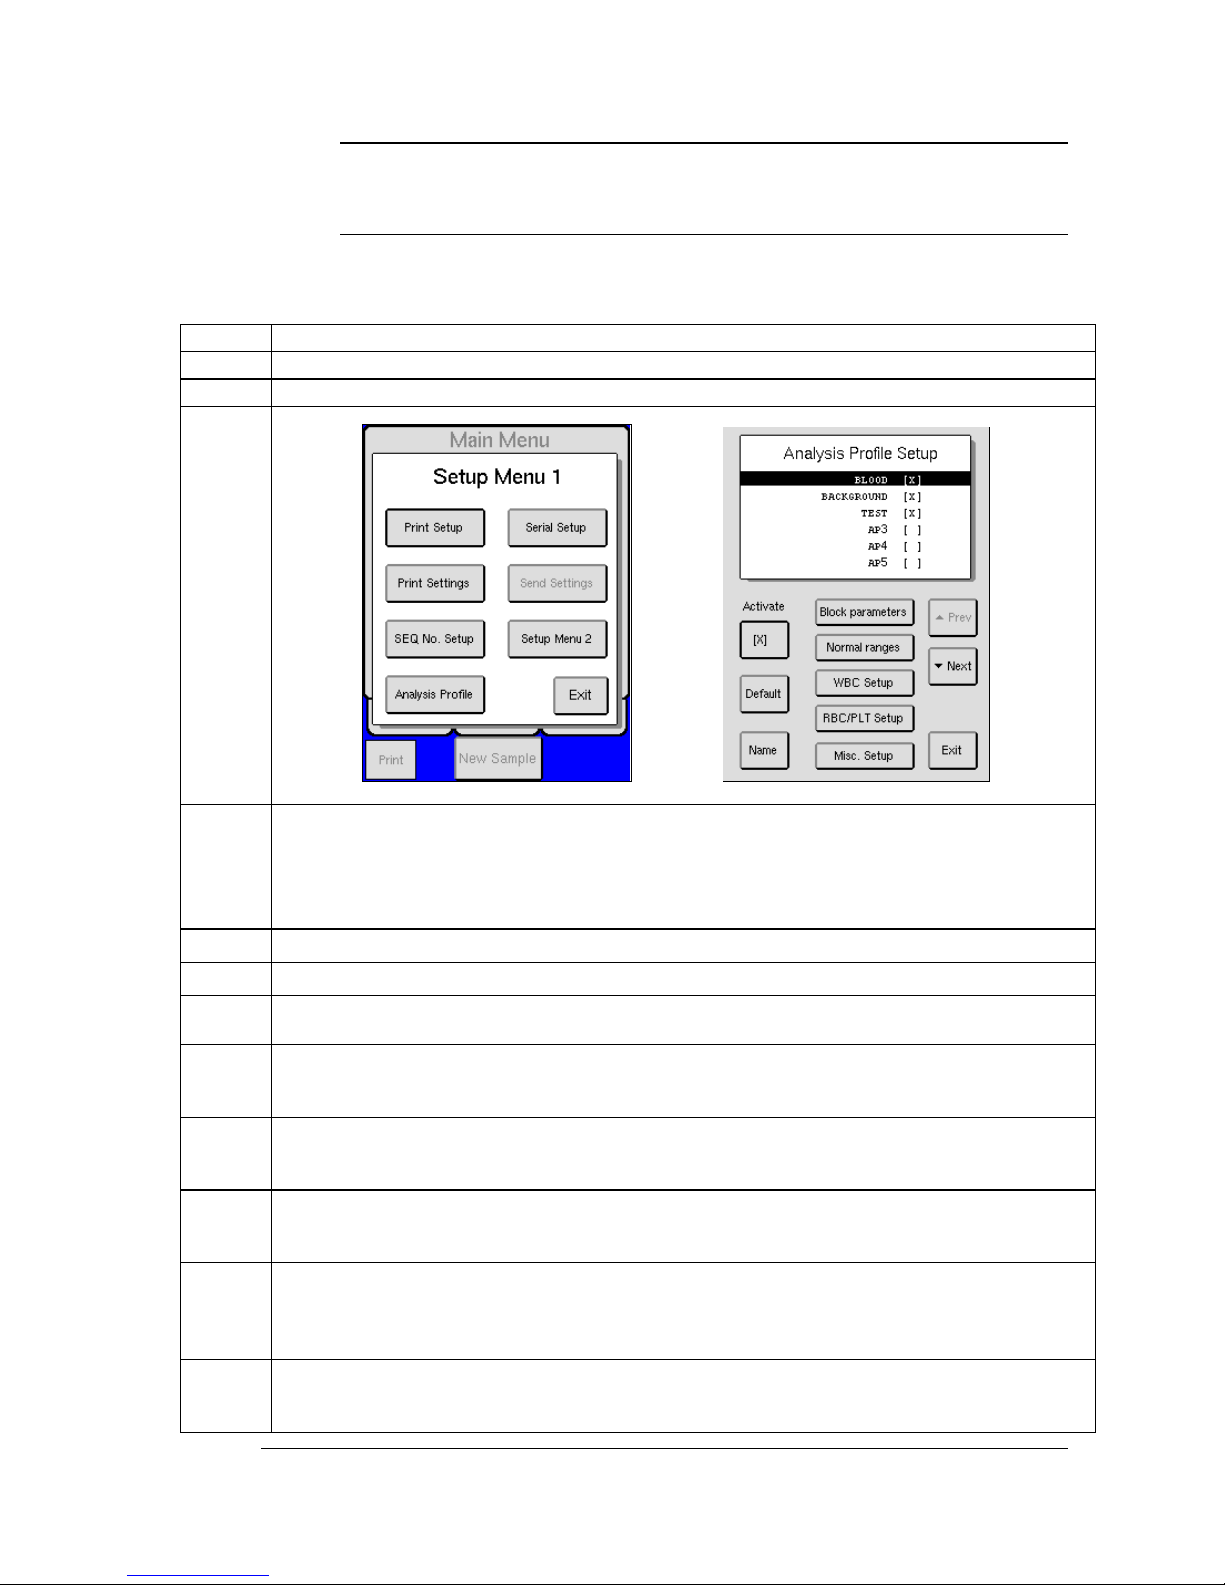
Start by pressing [ADVANCED] from the MENU tab.
2
Press [SETUP], then [ANALYSIS PROFILE] to enter the Analysis Profile Setup menu.
3
Figure 4.12 Figure 4.13
4
To set profile name press [NAME].
Press [PREV] or [NEXT] to choose an open profile on list. (e.g. AP8, AP9, etc.)
Press [NAME ON DISPLAY] to enter new profile name and press [OK] when complete.
Press [NAME ON PRINTOUT] to enter new profile name to be displayed on printout and
press [OK] when complete.
Note
Remember to [ACTIVATE] the new profile in order to view it as a selection for sample analysis.
5
To set new profile as default press [DEFAULT] and select [X].
6
To block certain parameters press [BLOCK PARAMETERS] to see list and then [MORE] to
view specific parameters. Press any parameter and select [X] to block parameter.
7
To change RBC/PLT discriminators press [RBC/PLT SETUP] to see list and then [MORE] to
view specific discriminators. Press specific discriminator button to change value and then [OK]
to save.
8
To change WBC discriminators press [WBC SETUP] to see list and then [MORE] to view
specific discriminators. Press specific discriminator button to change value and then [OK] to
save.
9
To change normal ranges press [NORMAL RANGES] to see list and then [MORE] to view
specific parameter range. Press specific parameter range button to change value and then [OK] to
save.
Note
Indicative normal ranges are provided in this instrument. It is recommended to establish local
reference ranges (normal ranges) for your laboratory. (See CLSI standard C28-A2 for guidance
on how to establish these ranges and examples of normal ranges in the reference documents listed
at the end of this section.)
10
New profiles are automatically included in Xb functions and Stats. To not include new profile in
Xb functions or Stats press [MISC SETUP] and change [X] to ([ ]), respectively to inactivate
default setting.
Continued on next page
Page 35
34
4.5 User Interface (continued)
11
To change background mode setting of the profile press [MISC. SETUP], choose
[BACKGROUND MODE PROFILE] button, choose [X] or [ ] to activate or
deactivate, and then [OK] to save. By enabling this setting, the current profile will
behave like the factory default BACKGROUND profile (i.e. disable AF flagging,
disable pathology messages, etc.).
12
To activate WBC Differential Fallback mode press [DIFFERENTIAL FALLBACK]
and select [X]. This mode allows the user to view values for WBC Differential
parameters when the WBC Differential Abnormalities flags are displayed. It is
important that System Information Messages are still followed, see Section 9.2.
Note
The operator will be prompted to enter a 4-digit Operator ID (Operator ID is
recommended for in-house records but not required) and Authorization Code
(REQUIRED) before a change or update to an analysis profile can be made. To
update or change analysis profiles input the Authorization Code [2576].
Sample Memory
The following procedures explain how to search for previous sample
analyses and statistics, and print, send, and delete samples.
Step
Action
1
To view previous analyses at a quick glance press [PREV] or [NEXT] buttons to
scroll through samples in either Sample or List menus.
2
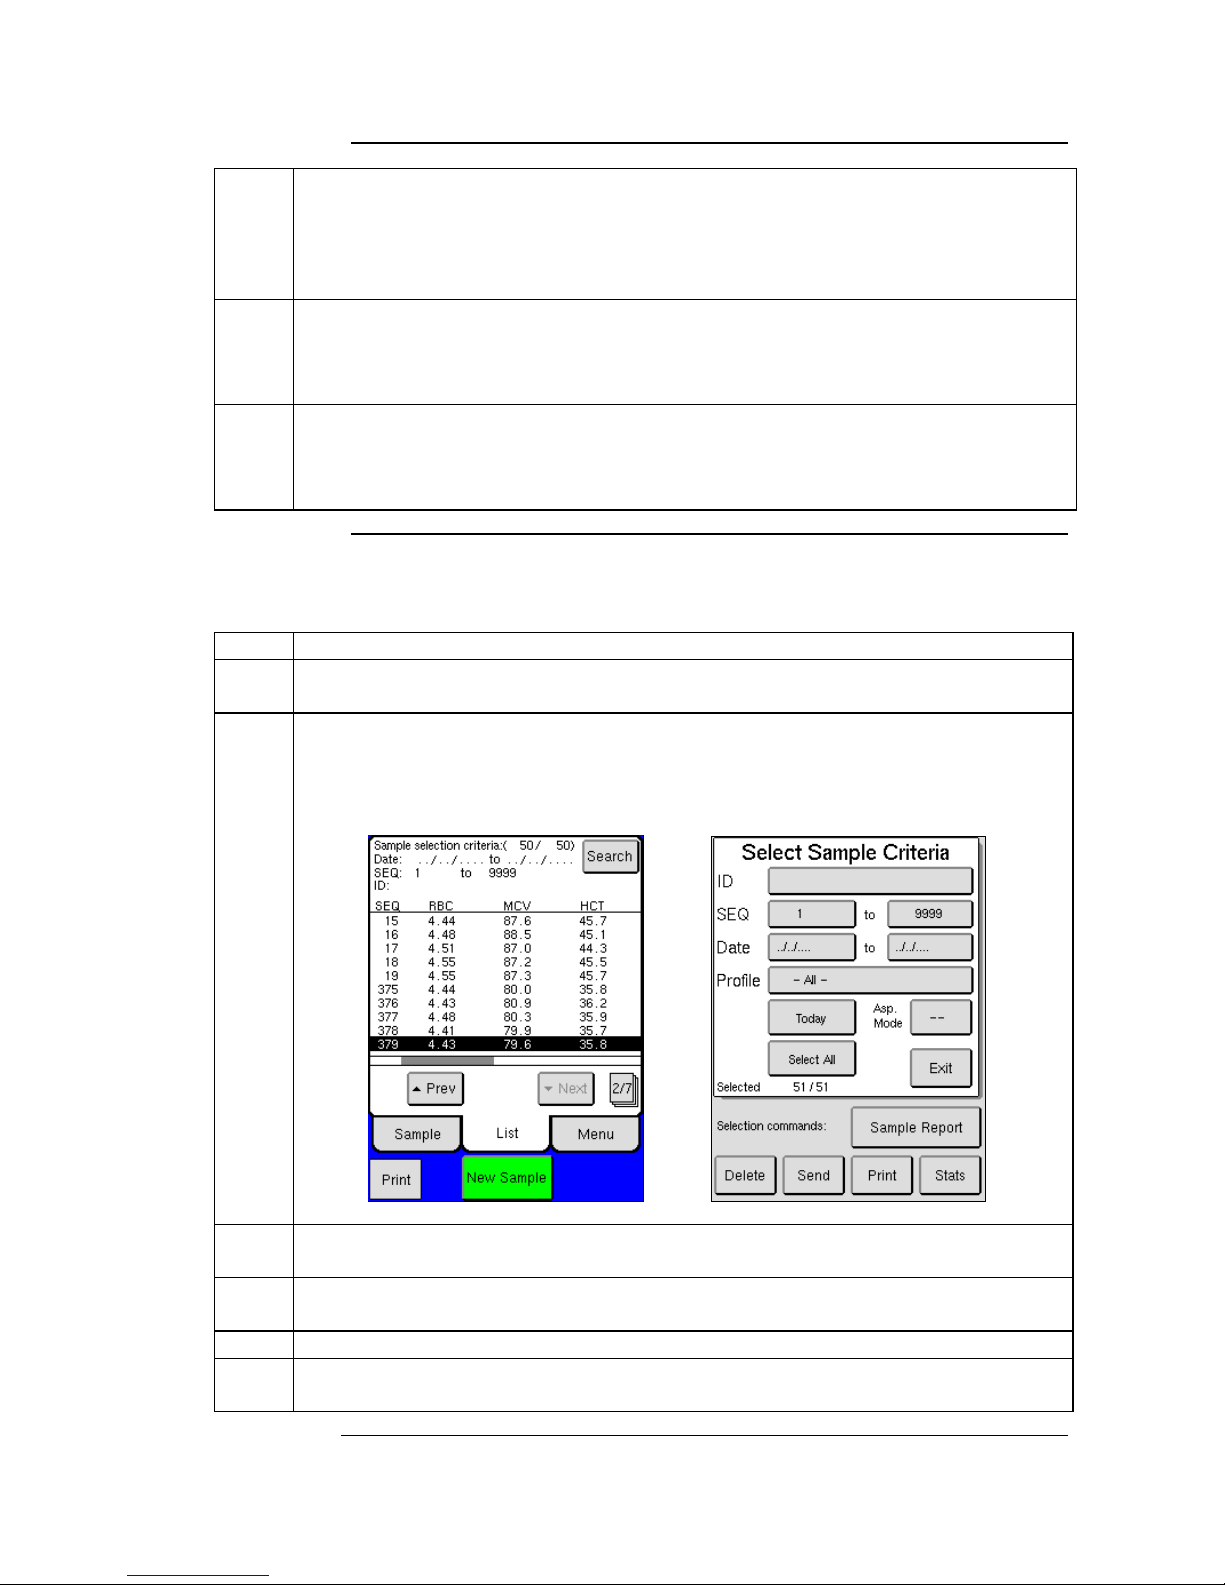
To view a specific sample or a group of samples press [SEARCH] in List Menu. In
this menu samples can be selected by Sample ID, SEQ, Date, and Sample profile.
Press corresponding button to select, and then [EXIT] to return to List menu and
view newly selected samples.
Figure 4.14 Figure 4.15
Note
To return to previous selection criteria either press [SEARCH], then [SELECT
ALL], and then [EXIT] or analyze a new sample.
3
To view Sample Statistics, select sample or group of samples to view, and press
[STATS] to enter the Statistical Results menu.
4
To print or send selected sample or sample statistics press [PRINT] or [SEND].
5
To delete selected sample or group of samples press [DELETE]. The instrument will
display a prompt to verify deletions, press [YES].
Continued on next page
Page 36
35
4.5 User Interface (continued)
6
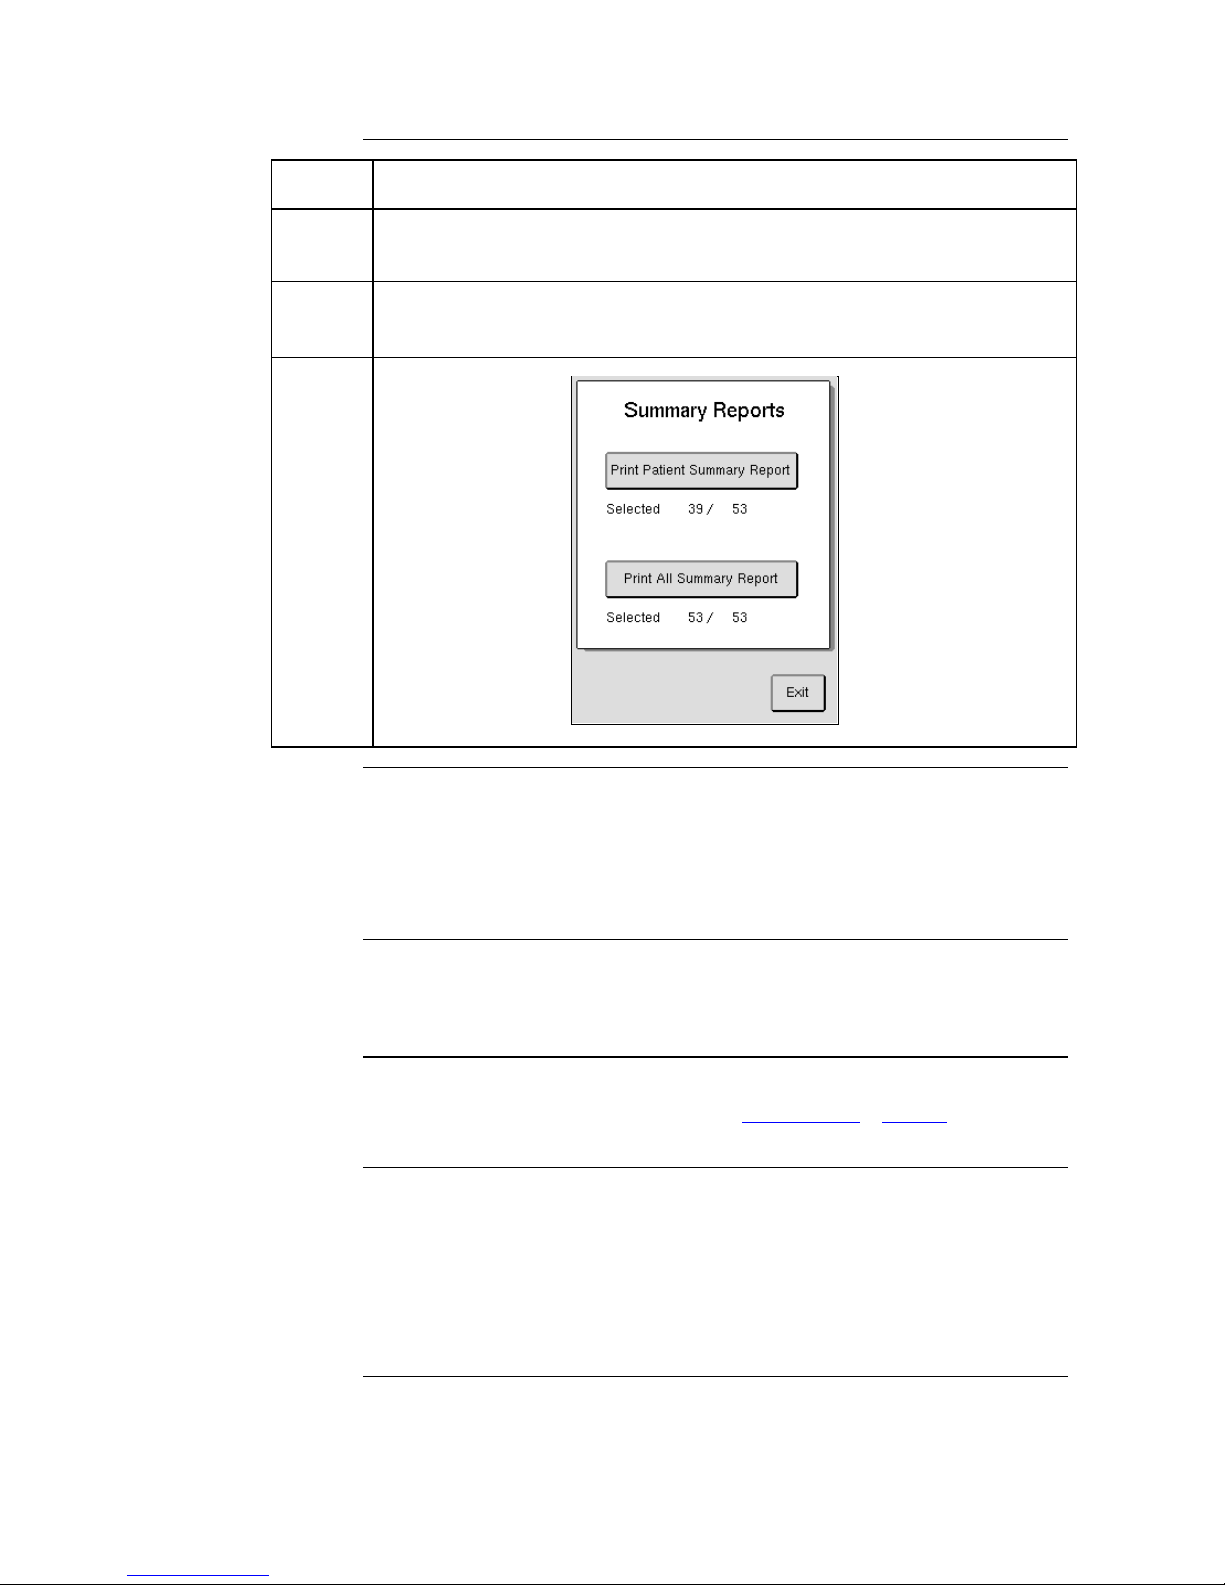
To print a summary report of every sample run press [SAMPLE REPORT] and
then [PRINT ALL SUMMARY REPORT].
7
To print a summary report of a selected group of samples, select desired criteria
(See #2 above), then press [SAMPLE REPORT] and then [PRINT PATIENT
SUMMARY REPORT].
Note
These summary reports will print on a horizontal sheet of paper.
To print summary reports you can only use HP PCL 3 and 5 protocol
compatible and USB printers.
Menu
Figure 4.16
All Settings
From Menu tab press [ADVANCED] and then [SETUP] to enter Setup Menu.
To print all instrument settings, verify instrument is connected to a printer
and press [PRINT ALL SETTINGS].
To send all instrument settings, verify instrument is connected to a
computer and press [SEND ALL SETTINGS].
Change Sequence
Number
From Menu tab press [ADVANCED] and then [SETUP] to enter Setup Menu.
To change sequence number press [SEQ NUMBER SETUP], press [NEXT
SEQ NUMBER], enter in new sequence number and press [OK] to save.
User Definable
Settings Document
More detailed Setup Menu descriptions can also be found in the User Definable
Settings document, which can be located at www.boule.se > Product Brands >
Medonic > Support > Downloads > Public > Documents.
Normal Range
References
1. Cheng C, Chan J, Cembrowski G, van Assendelft O. Complete Blood Count Reference
Interval Diagrams Derived from NHANES III: Stratification by Age, Sex, and Race
Laboratory Hematology 10:42-53
2. Nordin G, et al. A multicentre study of reference intervals for haemoglobin, basic blood
cell counts and erythrocyte indices in the adult population of the Nordic countries Scand J
Clin Lab Invest 2004; 64: 385-398
3. How to Define and Determine Reference Intervals in the Clinical Laboratory; Approved
Guideline – Second Edition. CLSI C28-A2
Page 37

36
Section 5: Sample Analysis
Section Overview
Introduction
This section covers the sample analysis routine, including how to analyze a
sample in the five different modes offered in the Medonic M-Series.
Contents
This section contains the following topics:
Topic
See Page
Preparations before Analysis
36
Startup Sequence
37
Background Count
39
Sample Identification
39
Analyzing the Sample (Open Tube)
40
Analyzing the Sample (Pre-dilution procedure)
42
Analyzing the Sample (Micro Pipette Adapter, MPA)
44
Analyzing the Sample (Cap Piercing Device)
47
Analyzing the Sample (Autoloader)
48
Results
52
5.1 Preparations before Analysis
Sample
collection
Human venous blood samples should be collected in an EDTA K3 or EDTA
K2 tube in sufficient quantity and be gently mixed immediately after
sampling in order to obtain accurate results. Please follow the
recommendation of the EDTA tube supplier.
Human capillary blood samples should be collected using only high
precision pipettes recommended by Boule.
Limitations
Samples drawn in an open tube or vacuum tube should be analyzed within
6 hours for most accurate results.
Samples drawn into micropipettes should be analyzed within 10 minutes
for most accurate results.
Anticoagulant
recommendation
EDTA K3 (Ethylene Diamine Tetracetic Acid, Tri-potassium) liquid and
EDTA K2 (Ethylene Diamine Tetracetic Acid, Di-potassium) spray-dried
solution. Recommended by ICSH and CLSI (NCCLS).
Handling of
venous blood
samples
Allowing the blood to equilibrate to the EDTA for 10-15 minutes after
sampling can improve differential results
The sample should be thoroughly and gently mixed before analysis.
Improperly mixed samples may cause erroneous results. Mixers are
acceptable for use.
BD and BD Microtainer registered trademarks are the property of Becton, Dickinson and Company
Page 38
37
5.1 Preparations before Analysis (continued)
Handling of
capillary blood
samples
The sample in the micropipette can be analyzed directly after collection and
for optimal results not longer than 10 minutes from collection.
For capillary samples collected in Microtainer tubes follow the “Handling of
venous blood samples” section above.
Important
The sample should be kept at room temperature. Excessive cold or heat could
cause erroneous results.
Warning
As there are no assurances of the absence of HIV, Hepatitis B or C viruses or
other infectious agents in blood samples, controls, calibrators and waste these
products should be handled as potentially biohazardous.
Refer to local regulations and established laboratory protocol for handling
biohazardous materials.
5.2 Startup Sequence
Startup
sequence
The following sequence guides the operator through the beginning of the day
startup routine for the analyzer. There are 2 simple steps to follow which takes
the user through a background and control analysis sequence with detailed
guidance at each step. This startup sequence is optional and can be bypassed if a
different startup routine is desired.
Important
The startup sequence must be activated to follow this procedure, alternatively
follow the manual background and quality control checks, see 5.3 and 6.1.
Step
Action
1
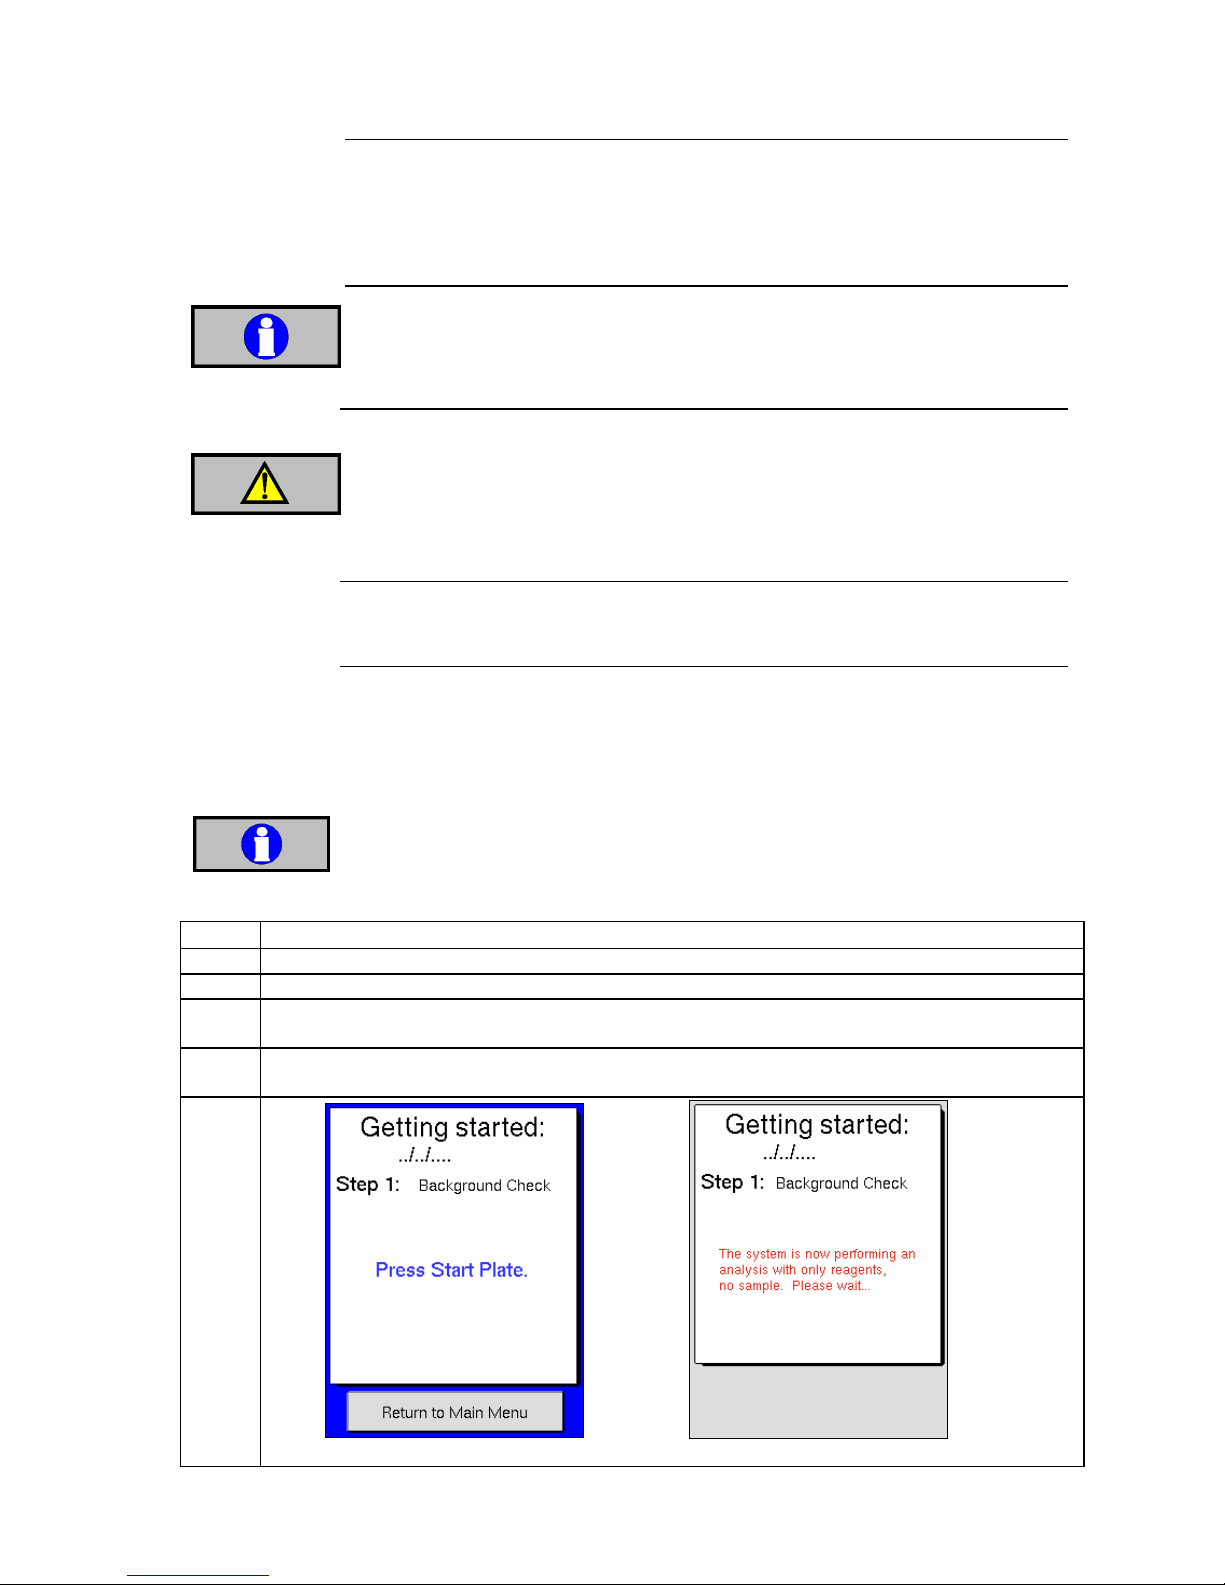
Touch display or switch on power to the analyzer.
2
Press [EXIT STANDBY] or [PWRUP] depending on how the analyzer was shutdown previously.
3
Enter operator ID and press [OK] or press [CANCEL] to exit Standby. The analyzer will now run
a “wake up” sequence.
4
When “wake up” cycle is complete, press start plate to begin the first step of the startup
sequence.
Figure 5.1 Figure 5.2
Page 39
38
5.2 Startup Sequence (continued)
Step
Action
5
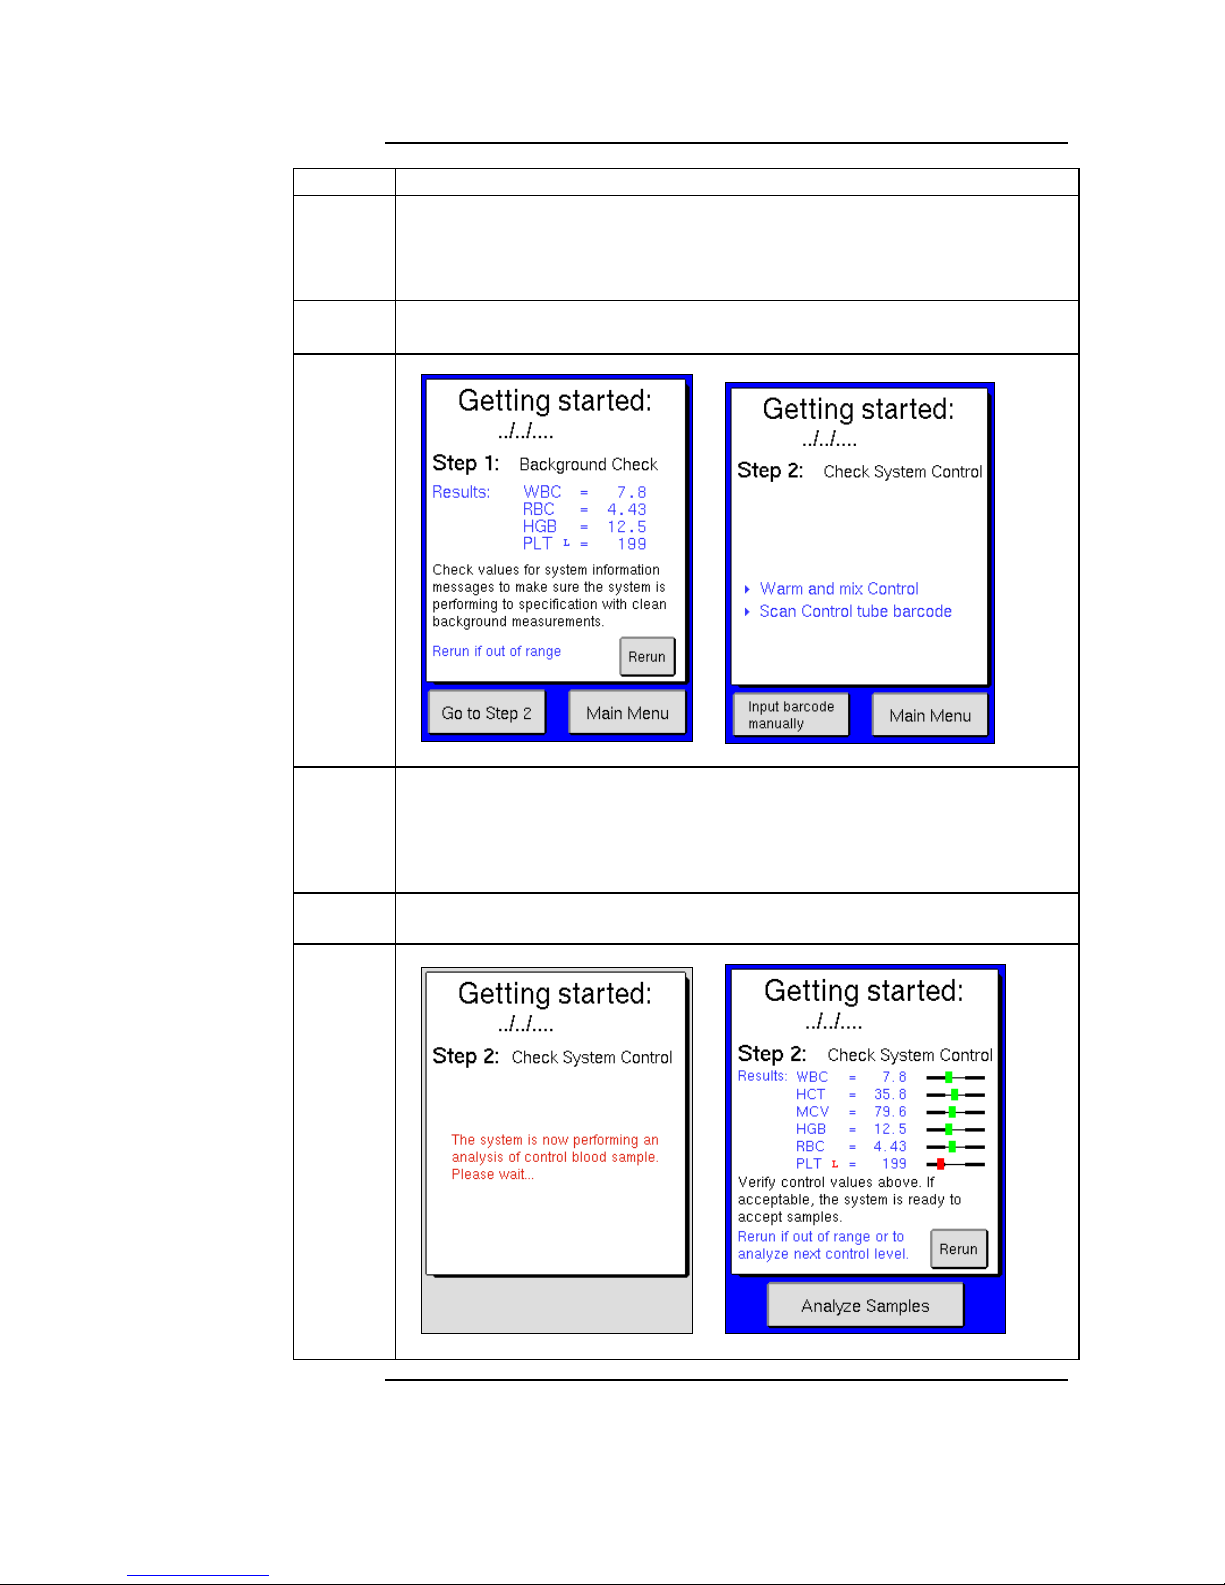
When complete the background count results are displayed. If the results
are acceptable (see table for accepted background values according to
section 5.3), scan in the barcode on control vial and follow directions on
the display to begin the second step of the startup sequence.
Note
If the background count results have a H (high) indicator press [RERUN]
and follow the screen instructions to analyze background count again.
Figure 5.3 Figure 5.4
6
When complete the control results are displayed. If control results are
acceptable, press [RERUN] to run next level of control. The startup sequence
is complete when all control results are acceptable. Press [ANALYZE
SAMPLES] to go to the main screen, and follow instructions in the
following sections to analyze samples.
Note
If control sample results have a H (high) or L (low) indicator press
[RERUN] to analyze control sample again.
Figure 5.5 Figure 5.6
Page 40
39
5.3 Background Count
Background
Check
The following sequence is performed to check that the background count is low
enough to run a sample. It is recommended to run a background check at the
beginning of each shift.
Step
Action
1
From the main screen press [NEW SAMPLE].
2
Press [NEXT PROFILE] or [PREV PROFILE] to scroll to Background.
3
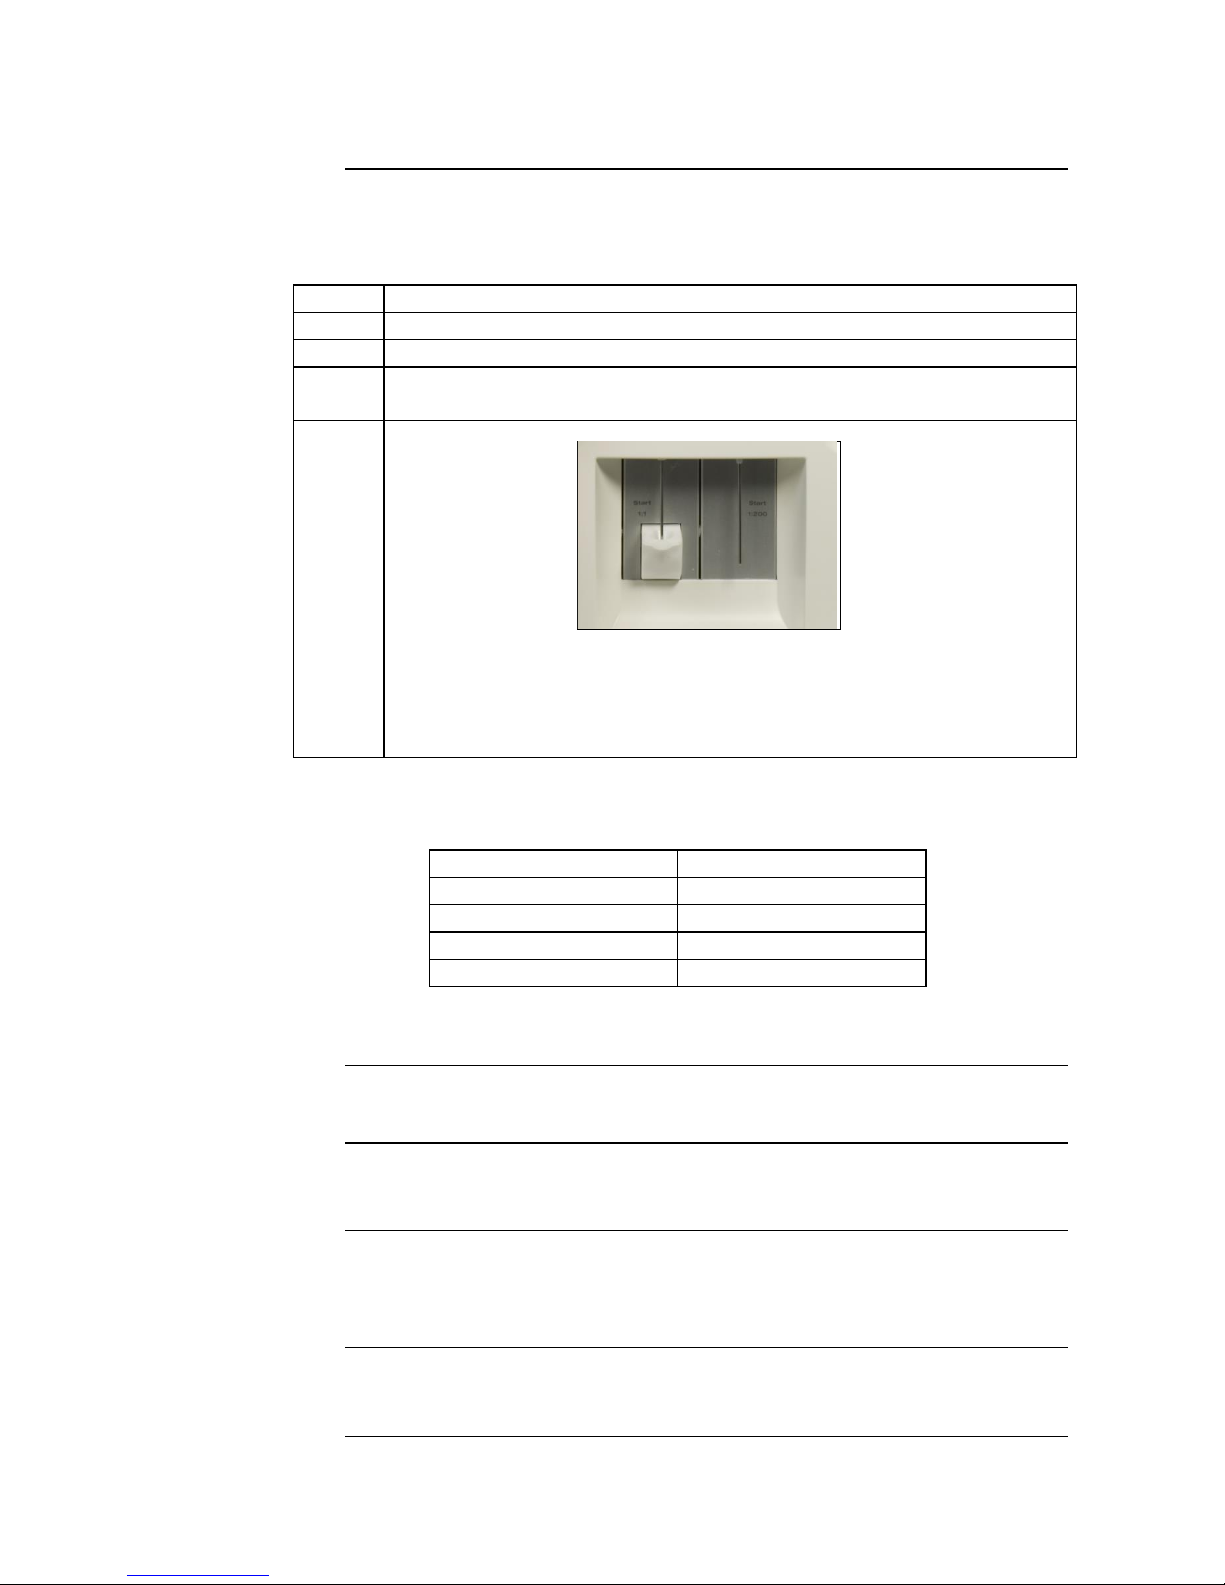
Press the whole blood start plate, which is located behind whole blood
aspiration probe. (See Figure 5.7 below)
Figure 5.7
The aspiration time is approximately 10 seconds. After ~ 10 seconds the
instrument will time out due to no detection of blood, and continue its cycle.
Accepted Background
values
The background count should not be higher than the figures shown
below, assuming that at least 2 “blanks” are run after a sample.
Parameters
Values accepted
RBC
≤ 0.01 (1012/ L)
WBC*
≤ 0.1 (109/ L)
HGB
≤ 0.2 (g/ dL)
PLT
≤ 10 (109/ L)
The micropipette inlets are acceptable at WBC 0.2 (109/L) due to potential preanalytical contributions.
5.4 Sample Identification
Description
This section describes the different methods of inputting Sample IDs
(Identification). There are two (2) ID Fields available.
ID Input
Methods
The ID can be entered with the following methods:
Manually (touch screen or external keyboard)
Barcode (Barcode entry is limited to ID 1 only)
Character Input
Limitations
A maximum of 16 Characters (alpha and numeric) are allowed in both ID 1
and ID 2 fields.
Page 41
40
5.4 Sample Identification (continued)
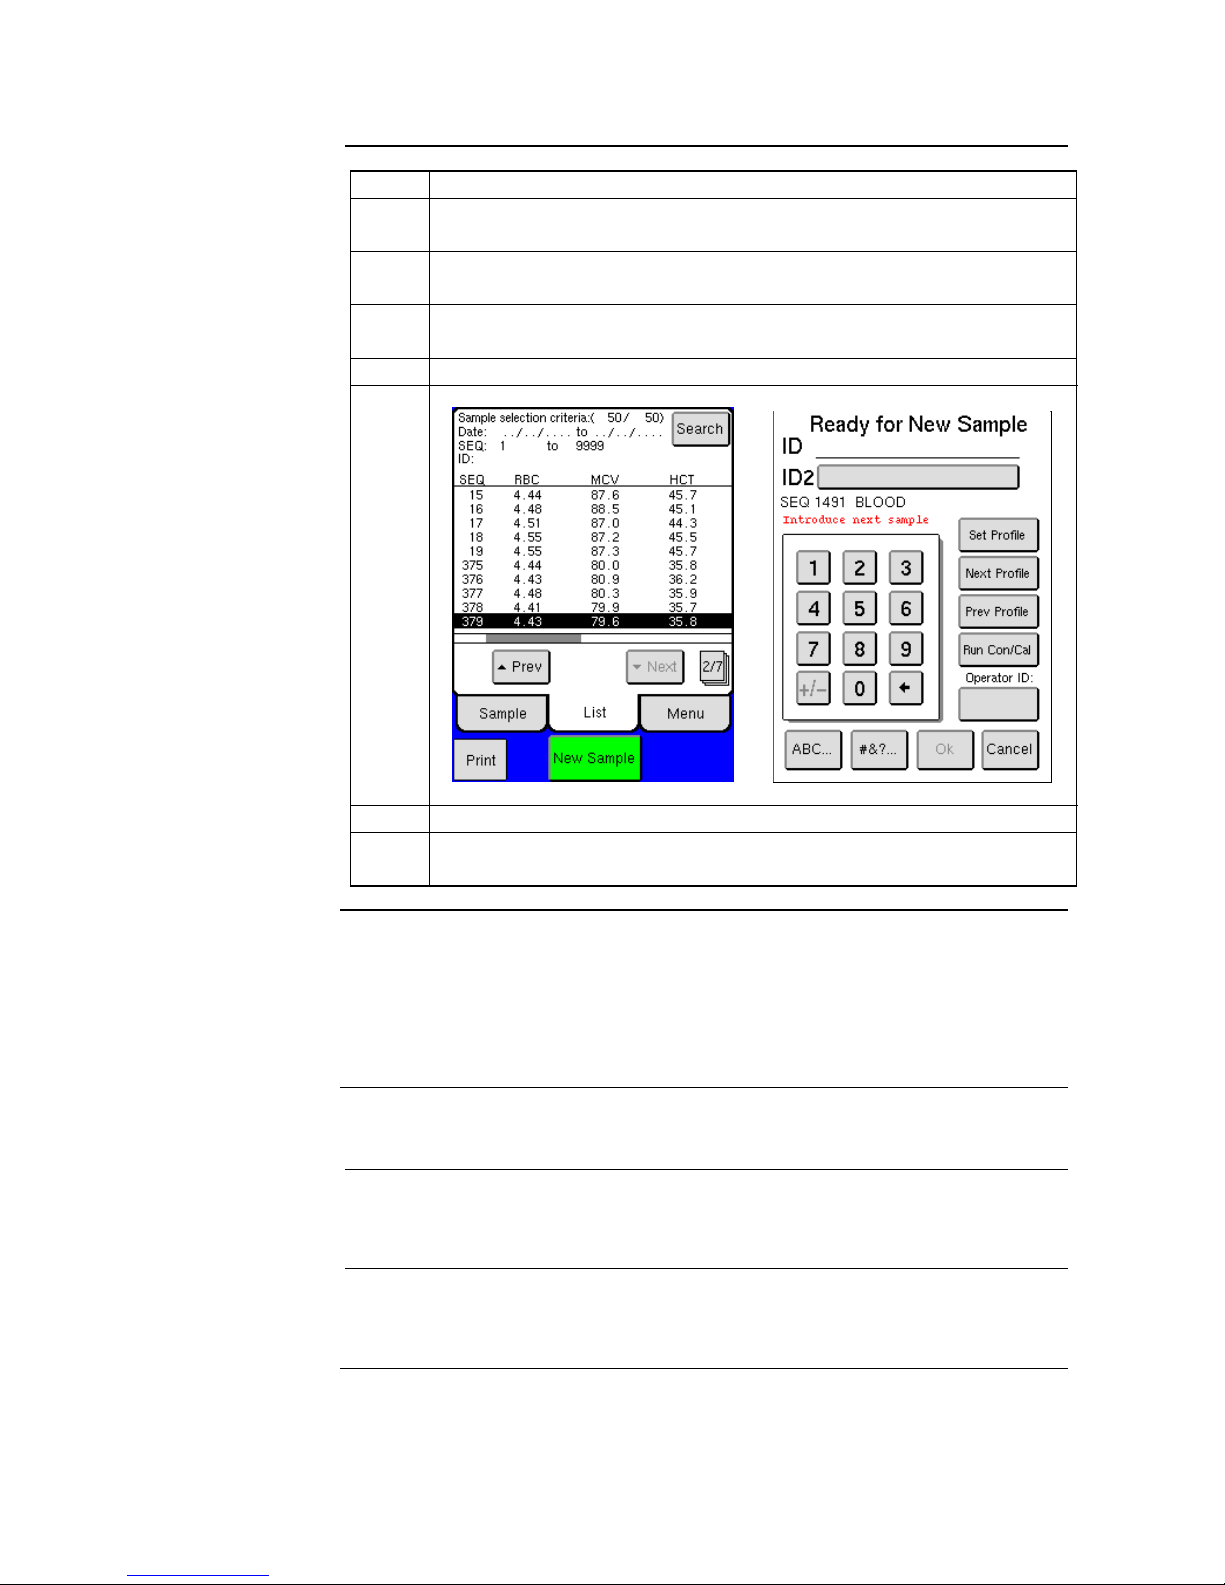
Step
Action
1
From the main screen press [NEW SAMPLE] or begin sample
aspiration, which automatically opens NEW SAMPLE menu.
2
Press numerical keys to enter sample ID or scan in the ID barcode
from the sample tube. Press sample ID2 if a second ID is needed.
3
Press [NEXT PROFILE] or [PREV PROFILE] to scroll to desired
profile.
4
Press [OK] to save profile and sample ID or begin sample aspiration.
Menu
Figure 5.8 Figure 5.9
5
Aspirate sample following selected procedures in sections 5.5 – 5.9.
Note
Sample ID entry and profile selection can be performed up to 30
seconds after sample aspiration.
Operator ID
The Operator ID is an optional feature which can be entered prior to analyzing
a sample or when exiting Standby Mode. To enter an Operator ID press the
specified button and enter up to a 4-digit numerical or alphabetic ID. The
Operator ID will stay the same until Operator ID button is pressed again and
changed, or when the analyzer goes into Standby Mode.
5.5 Analyzing the Sample (Open Tube)
Description
This section describes how to aspirate and analyze a sample with the “Open
Tube” procedure.
Starting
procedure
Refer to Section 5.1 for blood sample preparation and then follow the
procedure below:
Continued on next page
Page 42
41
5.5 Analyzing the Sample (Open Tube) (continued)
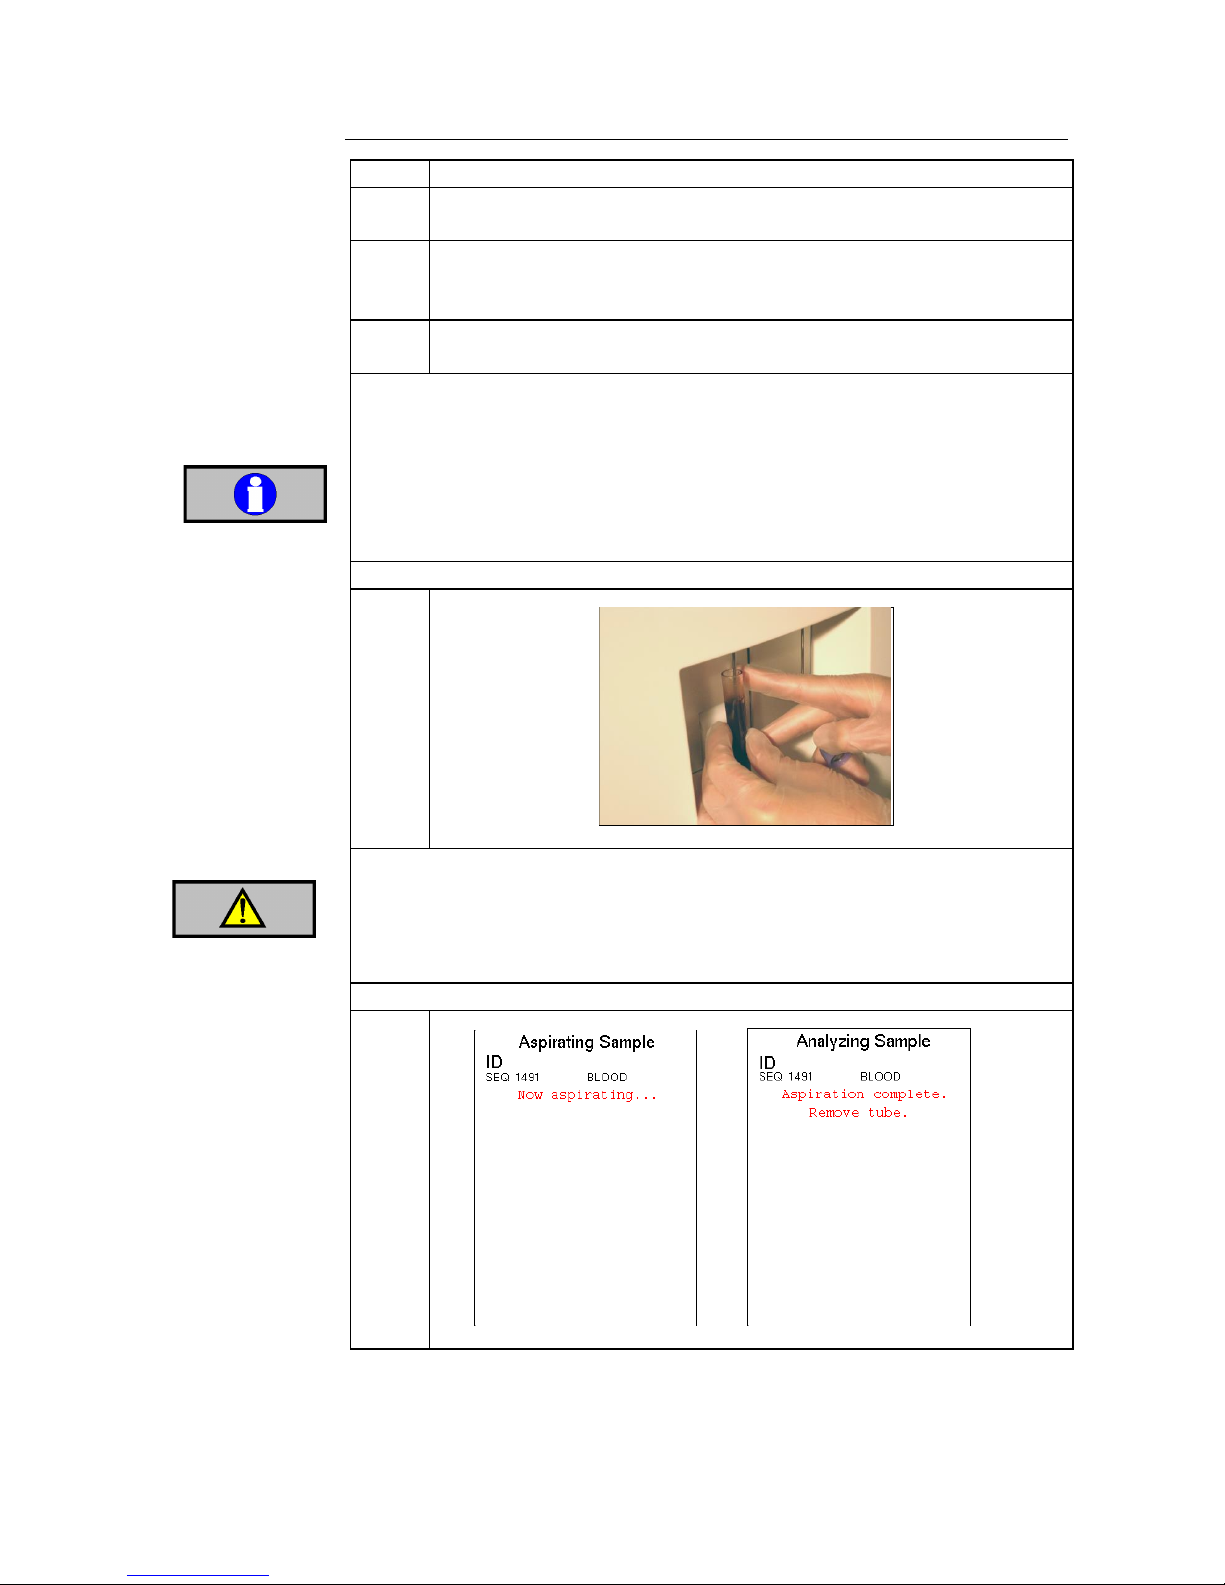
Step
Action
1
Choose List, Sample, or Main menu to begin sample analysis.
Analyzer must be in one of these operation modes to aspirate.
2
Aspirate the sample through the aspiration probe by gently inserting
aspiration probe into the sample tube, and then press the whole blood
start plate behind the left aspiration probe. (See Figure 5.10)
3
Follow the instruction on the menu when to remove the sample tube.
A beep should be heard indicating sample removal.
Wipe the aspiration probe with a clean, dry lint free absorbent cloth before
sample aspiration. Not following this technique may impact accuracy if
repeating the assay.
Not removing the sample tube, could result in incorrect washing sequence
of the aspiration probe.
Do not remove sample prior to instruction, incomplete aspiration could
occur, causing erroneous results.
Sample Aspiration
4
Figure 5.10
As there are no assurances of the absence of HIV, Hepatitis B or C viruses
or other infectious agents in blood samples, controls, and calibrators these
products should be handled as potentially biohazardous.
Refer to local regulations and established laboratory protocol for handling
biohazardous materials.
Sample Aspiration Display
5
Figure 5.11 Figure 5.12
Important
Warning
Page 43
42
5.5 Analyzing the Sample (Open Tube) (continued)
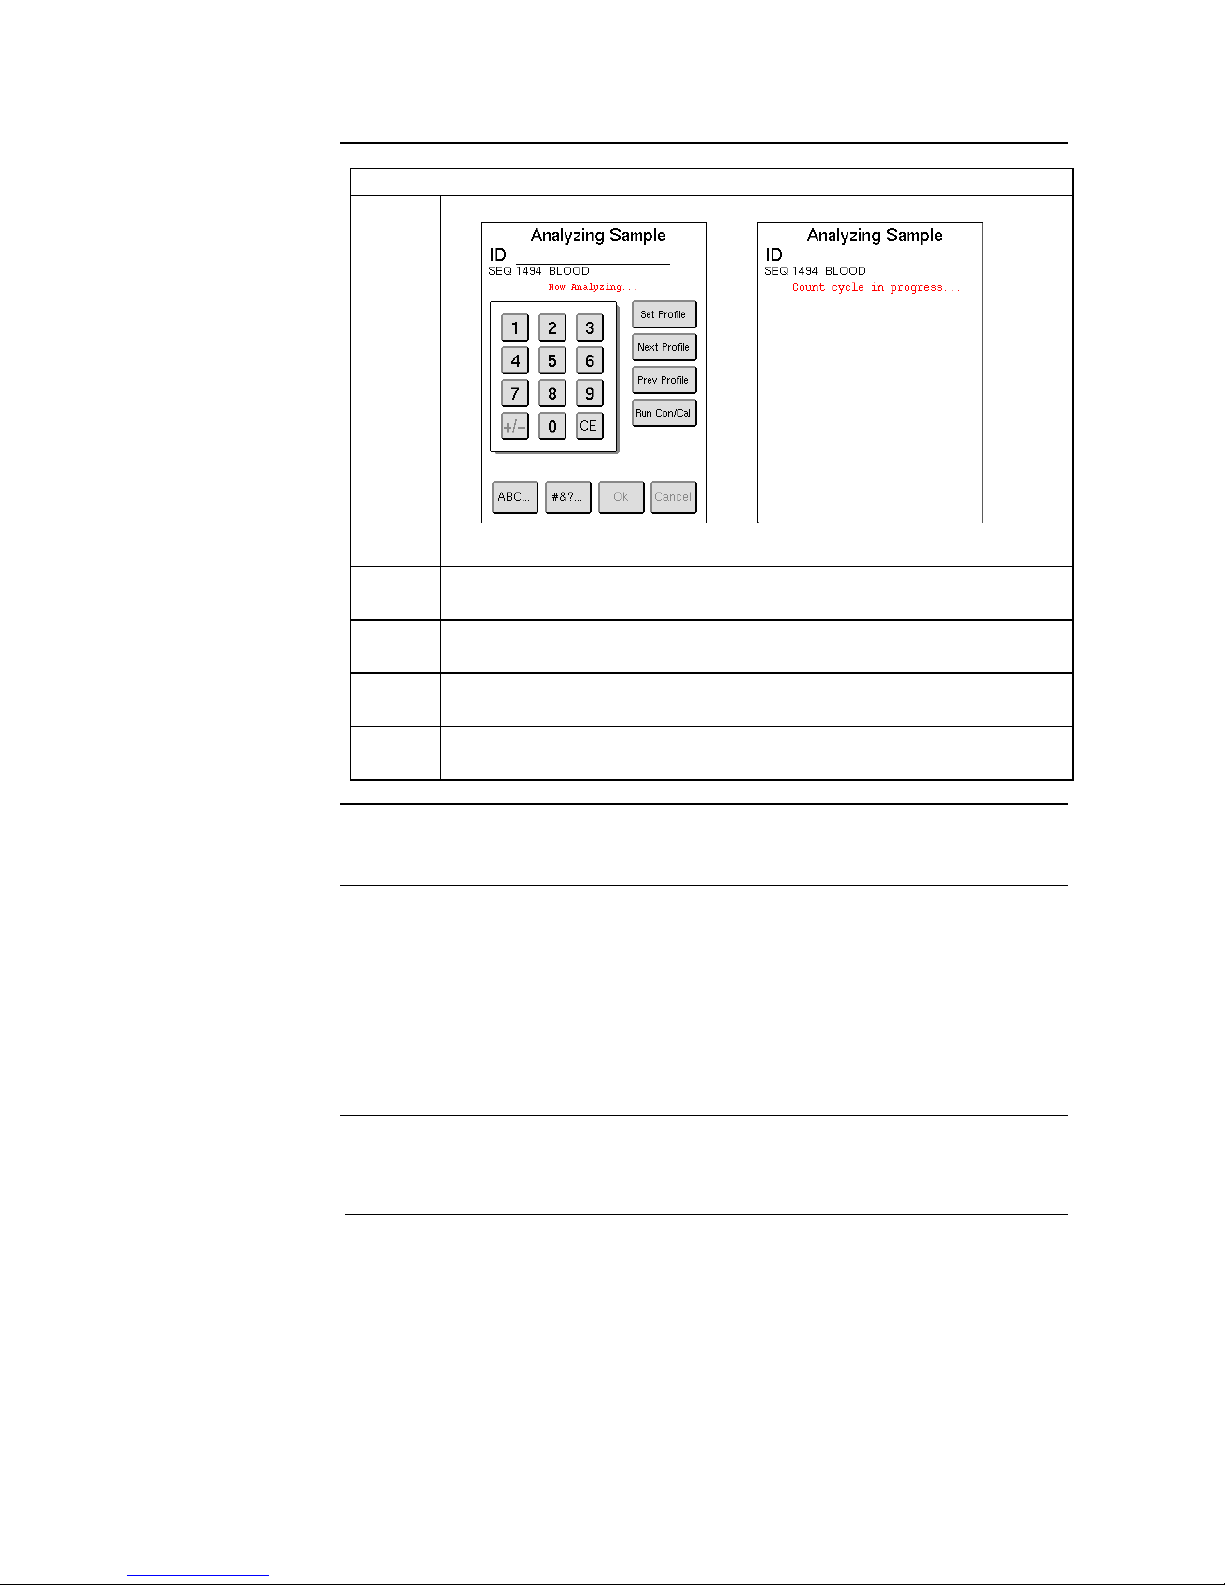
The instrument now switches to the sample analysis screen.
6
Figure 5.13 Figure 5.14
7
In first screen displayed above Sample ID and profile can still be
added.
8
Approximately 30 seconds after aspiration the display switches to
that in Figure 5.14 and no further ID entry is possible.
9
After 45 seconds results will be displayed on List or Sample menu.
For more information of results refer to Section 5.10.
10
When NEW SAMPLE button returns to green, operator can begin
analysis of next sample.
5.6 Analyzing the Sample (Pre-dilution procedure)
Description
This section describes how to analyze a pre-diluted sample through the “predilute” aspiration probe and how to use the dispense function. There are two
ways of pre-diluting a sample. The recommended pre-dilute method is using
the dispense function, which uses the factory calibrated dilution ratio of 1:225
(20 µl sample in 4.5 ml diluent). The second method is performing an external
pre-dilution using in-house dilution procedures, dilution ratios between 1:200
– 1:300, and re-calibrating system using selected dilution ratio.
Dilution Rates
and Ratios
Dilution Rates: 1:200 – 1:300
Recommended: 1:225 (20 µl sample in 4.5 ml diluent)
Continued on next page
Page 44
43
5.6 Analyzing the Sample (Pre-dilute procedure) (continued)
Time limitations
Pre-dilute procedures are generally less precise than open and closed tube
procedures and results may vary depending on local laboratory procedures and
conditions. Blood cells may shrink and/or swell during the time between mixing
in the beaker and the actual analysis, resulting in compromised values of MCV,
MPV and the distribution between lymphocytes/mid-cells/ granulocytes (with
indirect effect on calculated parameters, e.g. HCT). Thus, the time between
mixing and analysis should be minimized and under no circumstances exceed 60
minutes, since RBC, PLT, HGB and WBC may also be affected.
Externally Prediluted volumes
and preparation
Pre-dilute volumes 4.5ml – 5.0ml. The dilution ratio must always be the same
as the dilution it is calibrated to in order to avoid erroneous results; any dilution
variation in an externally diluted sample will affect the parameter test results.
Prepare pre-dilute sample according to internal documentation and time
limitations section above.
Important
In order to get accurate results always use the same dispenser for calibration and
sample analysis.
Dispense
Function
This feature is to be used as a precision dispenser for dilution of blood samples.
Dispense amount: 4.5 ml.
Dilution: 20 µl sample in 4.5 ml diluent (1:225)
Follow the instruction below:
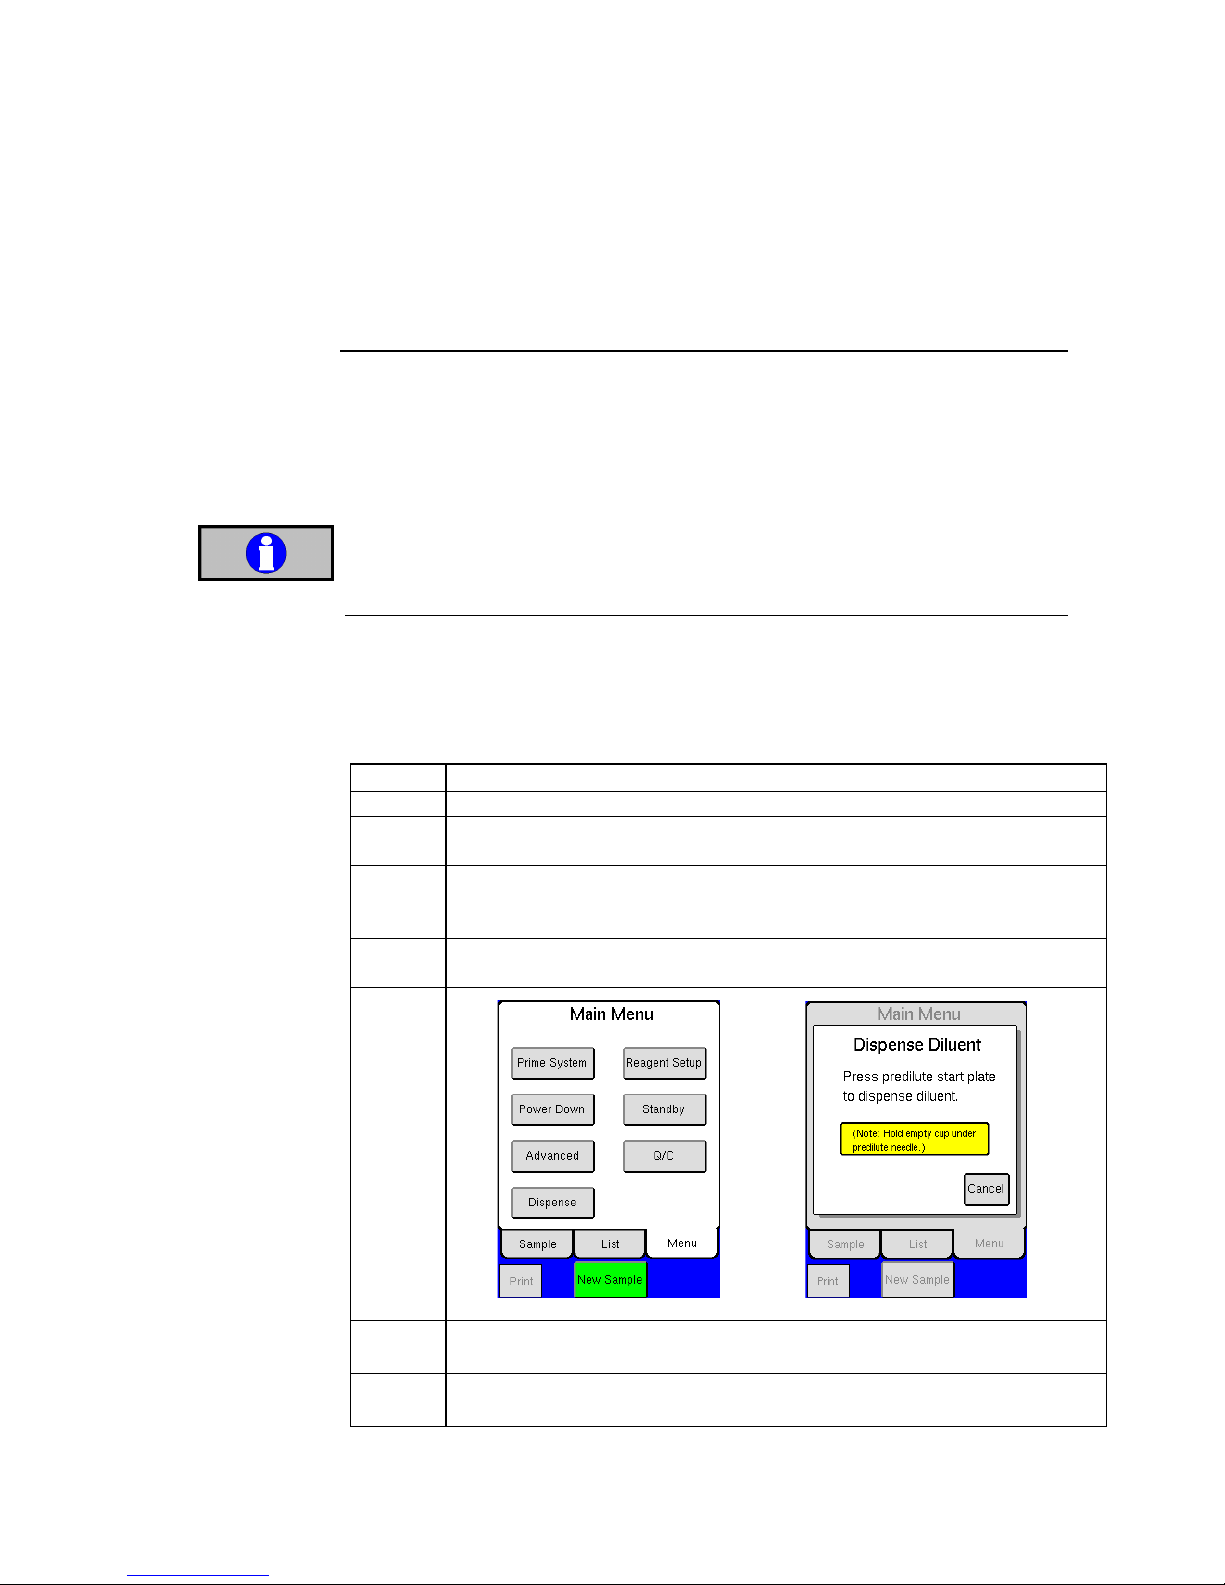
Step
Action
1
Press the [DISPENSE] button from the MENU tab.
2
Before pressing the pre-dilute start plate make sure that a waste beaker is
placed under the pre-dilute aspiration probe.
3
Press the pre-dilute start plate (right-side start plate), to enable dispense
mode. (The instrument will fill the waste beaker with a small amount of
diluent, this is to be discarded)
4
Fill the pre-dilute beaker by pressing the start plate again. If more than one
beaker is to be filled repeat this step.
Menus
Figure 5.15 Figure 5.16
5
Prepare pre-dilute sample according to internal documentation and
time limitations section above.
6
To re-enter analyze mode press [CANCEL] and follow instructions
below to analyze pre-dilute samples.
Page 45
44
5.6 Analyzing the Sample (Pre-dilute procedure) (continued)
Pre-dilute
procedure
Start by selecting pre-diluted sample beaker and follow the procedure below:
Step
Action
1
Choose List, Sample, or Main menu to begin sample analysis.
Analyzer must be in one of these operation modes to aspirate.
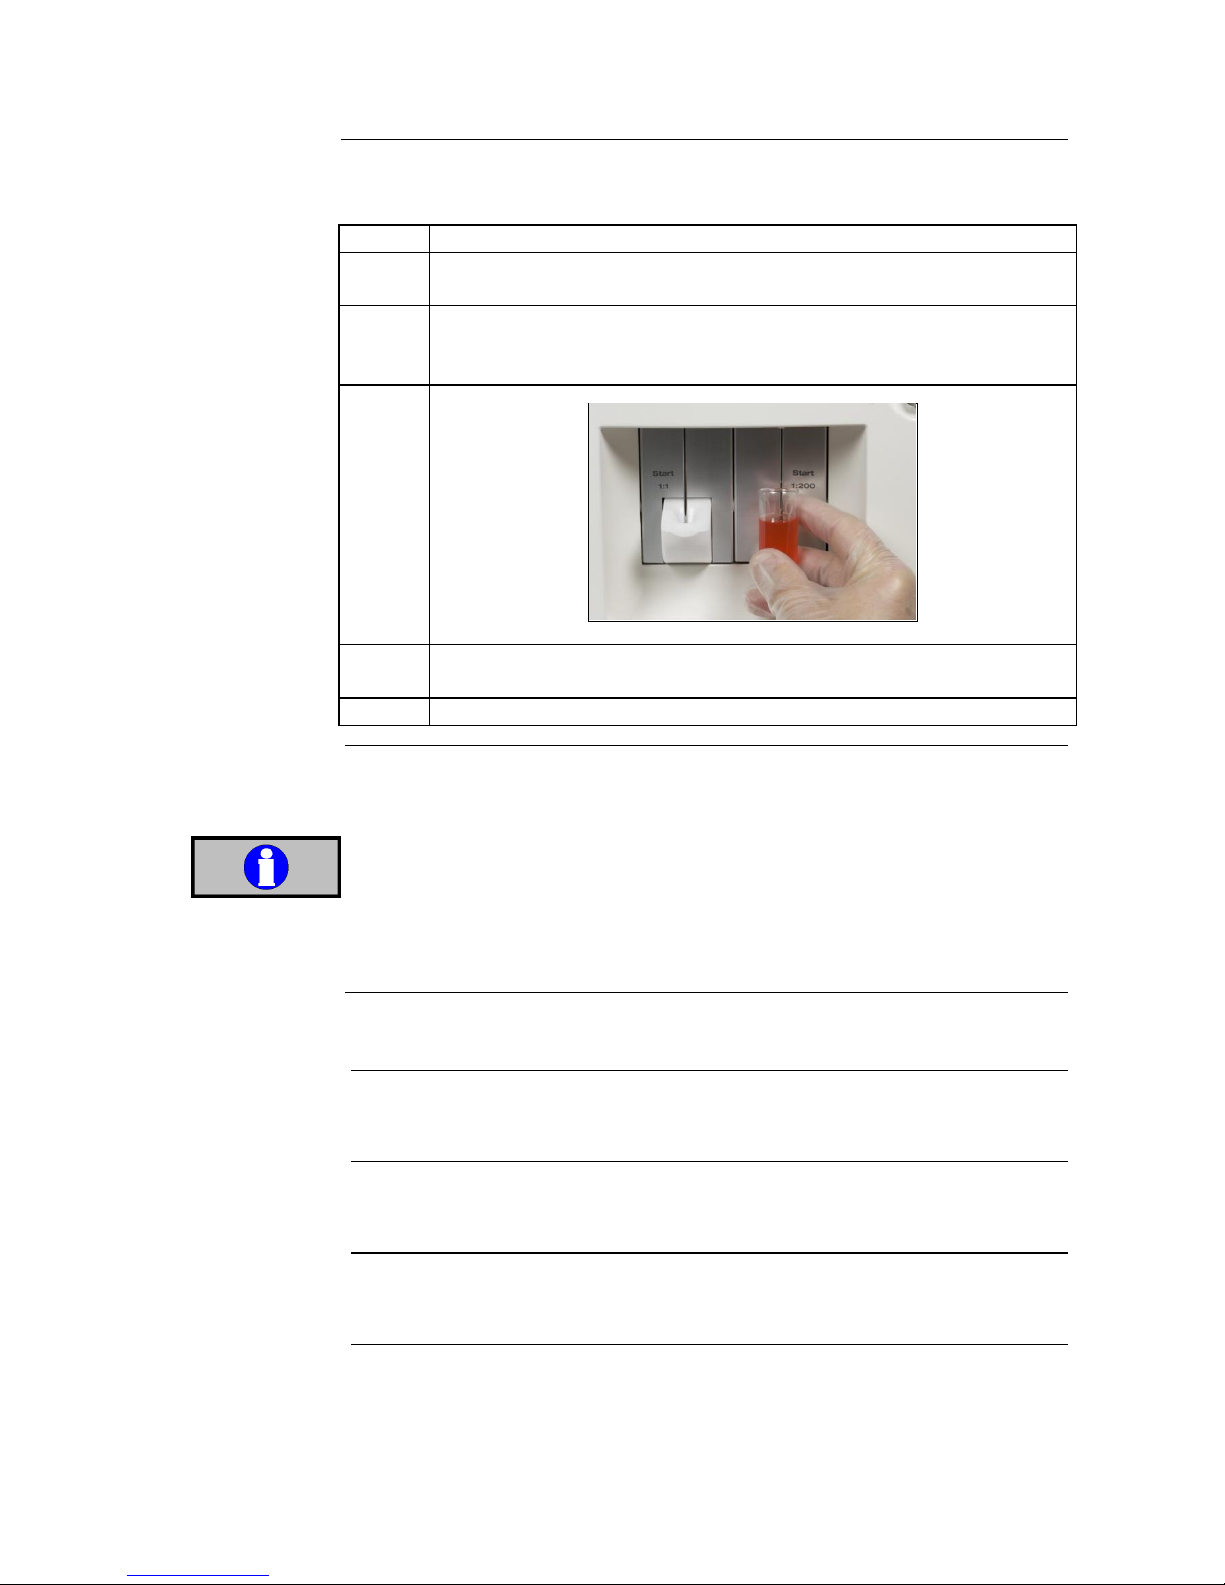
2
Aspirate the pre-diluted sample through the pre-dilute aspiration
probe by pressing and holding the pre-dilute start plate behind the
right-side aspiration probe until aspiration starts. (See Figure 5.11)
Figure 5.17
3
Follow the instruction on the menu when to remove the sample tube.
A beep should be heard indicating sample removal.
4
Refer to Section 5.5 Steps 5 - 10 for remainder of analysis sequence.
Important
Do not analyze a whole blood sample in the pre-dilute mode, this will cause
erroneous results. If this happens following the instructions below, as soon as
possible, to return analyzer to normal operation status:
1. Use dispense mode to dispense diluent into waste beaker until diluent has
no traces of blood left. Then dispense two more times and discard waste.
2. Next, dispense clean diluent into beaker and run diluent in pre-dilute mode.
3. Check background results. If results pass, instrument is now ready to use. If
results do not pass, repeat step 2 until background results pass.
5.7 Analyzing the Sample (Micro Pipette Adapter, MPA)
Description
This section describes how to analyze whole blood samples with the use of
the Micro Pipette Adapter (MPA).
Micropipettes
ONLY Boule supplied high precision EDTA micropipettes should be used
when running MPA.
Lancets
Recommendation
Recommended to use BD Microtainer® Contact-Activated Lancet, medium
to high flow, 1.5 - 2.0 mm x 1.5 mm or equivalent.
Continued on next page
BD and BD Microtainer registered trademarks are the property of Becton, Dickinson and Company
Page 46
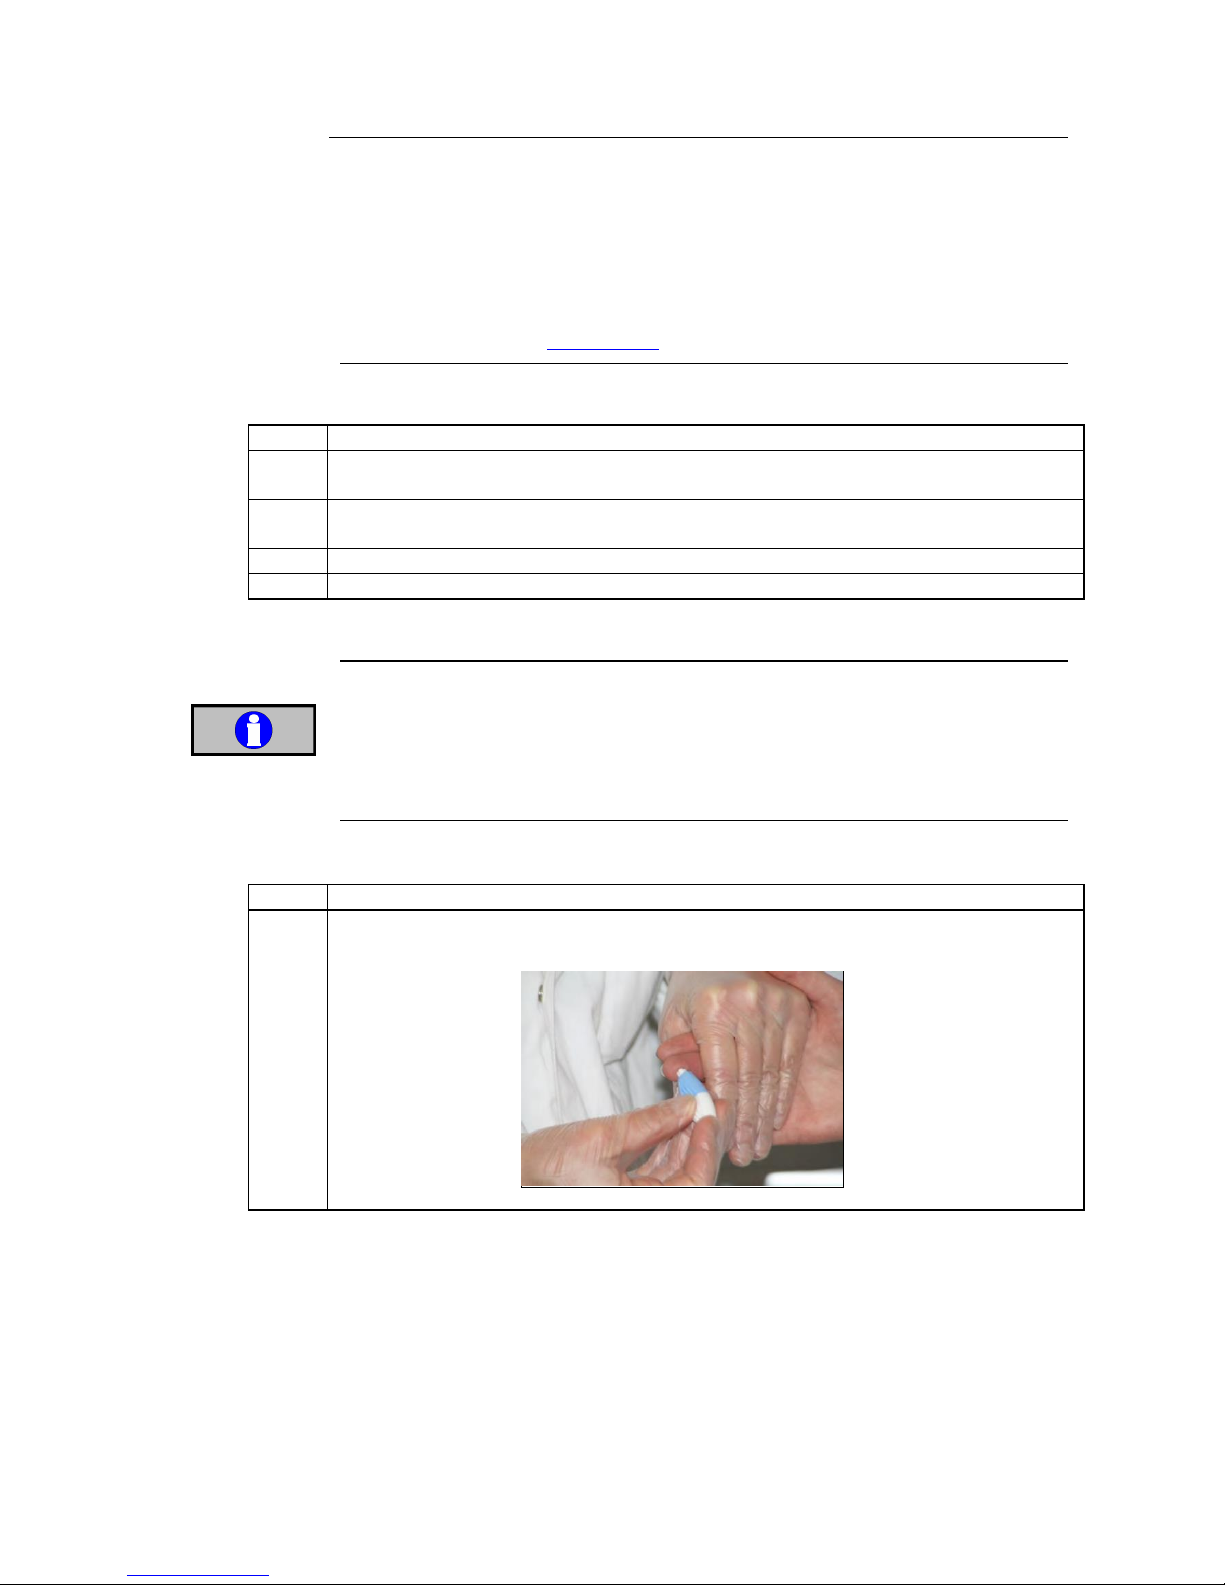
45
5.7 Analyzing the Sample (Micro Pipette Adapter, MPA) (continued)
Collection
methodology
Samples can be analyzed using the MPA from both venous and capillary blood
specimens.
For venous collection, see Section 5.1 and steps at the end of this section for details
of sample handling and preparation.
For capillary collection, follow steps below and the procedure for optimal collection
of capillary blood specimens given in the CSLI standard H04-A6 "Procedures and
devices for the collection of diagnostic capillary blood specimens". (For latest edition
of this standard go to www.clsi.org.)
Starting procedure
Follow the procedure below to operate MPA:
Step
Action
1
Choose List, Sample, or Main menu to begin sample analysis. Analyzer must be in one of
these operation modes to aspirate.
2
Pull out the MPA adapter. (The instrument will give an instruction to put back the MPA
adapter to start).
3
Remove the previous sample micropipette. (If applicable)
4
Place the adapter on the table.
Puncture site preparation for capillary blood collection
Refer to laboratory protocol.
Important
Due to PLT adhesion to tissue and capillary walls and imprecision in preparation and
blood draw procedures, discrepancies between capillary and venous blood values
may occur on the following parameters:
o PLT may be lower in capillary blood by 5-10%
o WBC may be slightly elevated if PLT clumping occurs
Drawing blood and sample preparation:
Step
Action
8
Follow lancet packaging insert for instructions on proper use. Puncture middle or ring
finger, using the lancet.
Figure 5.18
Page 47
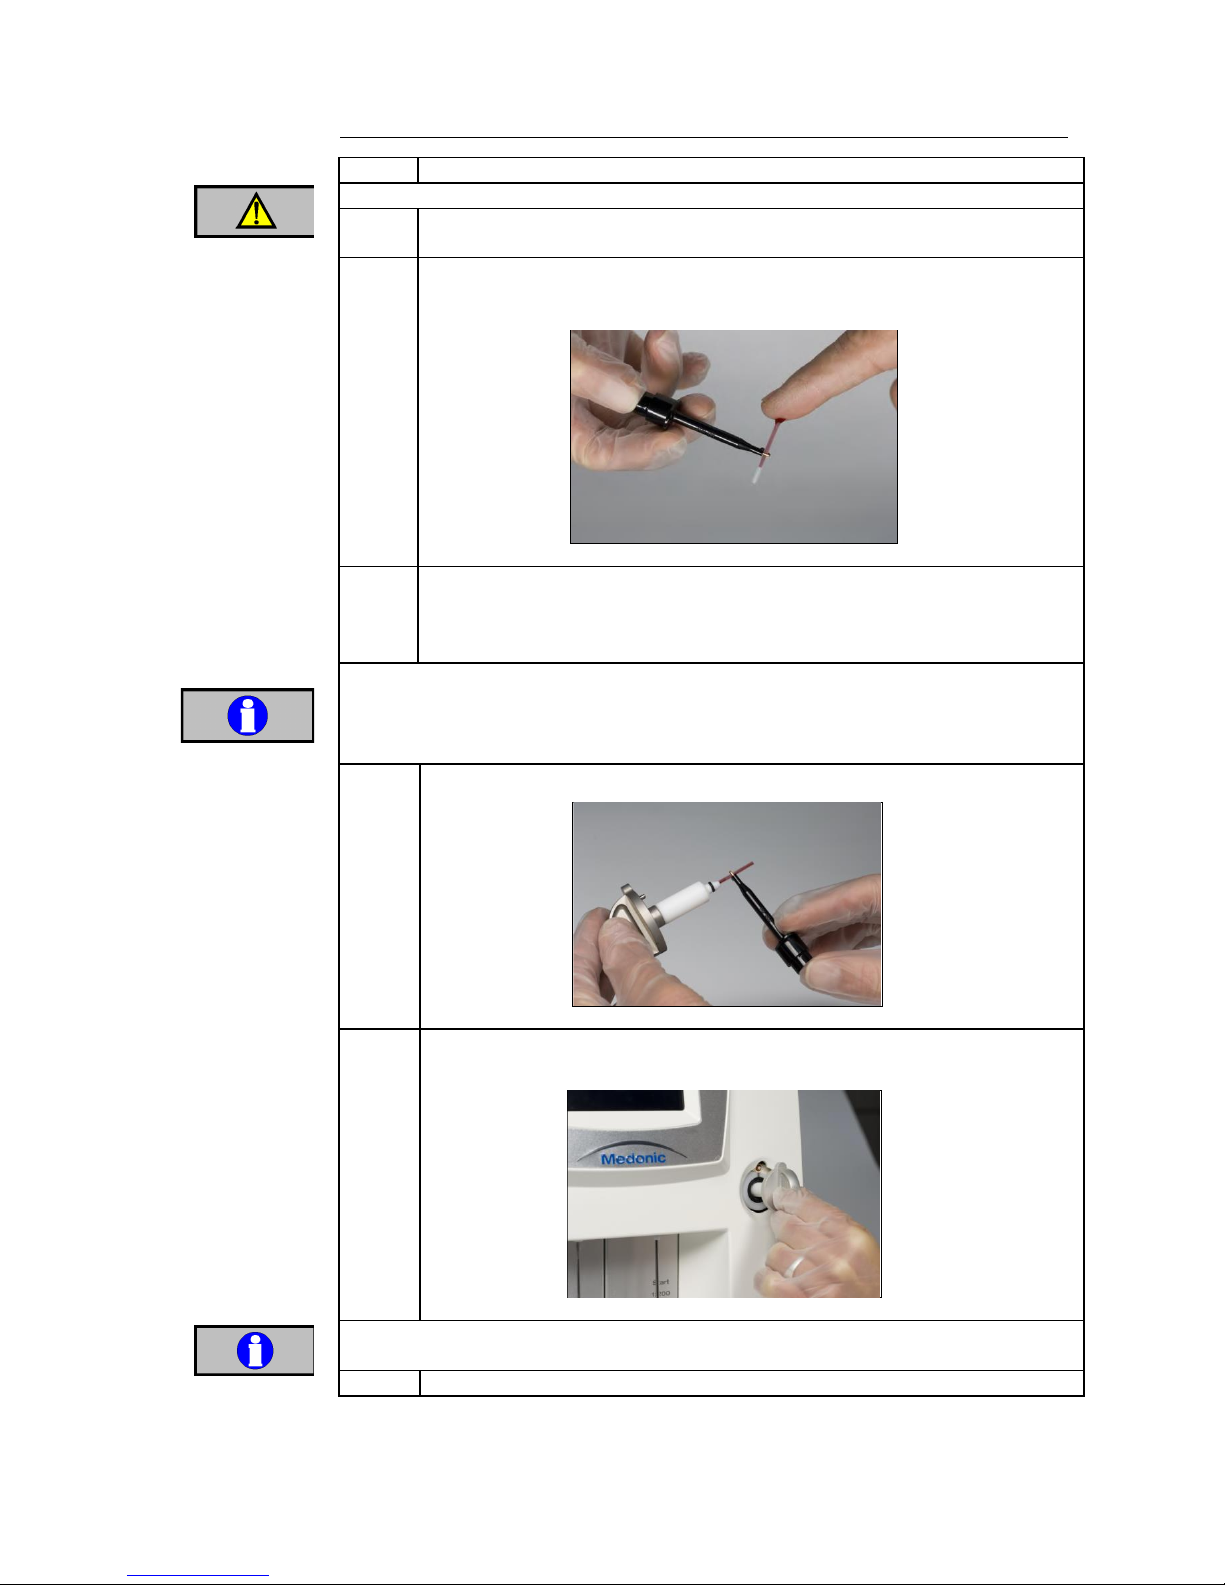
46
5.7 Analyzing the Sample (Micro Pipette Adapter, MPA) (continued)
Step
Action
Always use gloves when in contact with potentially biohazardous materials.
9
After puncture, wipe away the first drop of blood with a clean tissue or gauze
pad. (First drop of blood often contains excess tissue fluid.)
10
When second drop forms, aspirate the sample as shown below, being careful
to only allow the tip of the micropipette to touch the drop of blood (not the
finger directly).
Figure 5.19
Note
By holding puncture site downwards and applying gentle, intermittent
pressure above the site, the blood flow will be enhanced. Do not use scooping
motion or strong repetitive pressure, “milking”, to the site. (This can cause
hemolysis or contaminate sample with excess tissue fluid.)
Fill the micropipette completely with fresh whole blood and wipe off excessive
blood on the outside surface.
Be careful not to wick blood from open ends of the micropipette.
Ignoring these instructions might cause incorrect and non-reproducible results.
11
Insert the micropipette into the MPA device as shown below:
Figure 5.20
12
Insert the MPA into its holder and the instrument will automatically start the
analyzing sequence.
Figure 5.21
Do not remove MPA during sample aspiration or analysis. Removal prior to
completion of analysis may cause erroneous results.
13
Refer to Section 5.5 Steps 6 - 10 for remainder of analysis sequence.
Important
Important
Warning
Page 48
47
5.7 Analyzing the Sample (Micro Pipette Adapter, MPA) (continued)
Venous collection sample preparation
Step
Action
1
Follow sample preparation in Section 5.1.
2
Use the micropipette holder to grasp a micropipette. (Holding the
micropipette towards one end or the other, instead of in the middle, is best
for filling and insertion.)
3
Tilt sample vial at a 45 degree angle until blood is near the lip of the vial,
but does not overflow.
4
Place one end of micropipette in blood column and aspirate blood until
entire micropipette if filled. (This filling process uses capillary action.)
5
Remove micropipette from vial and wipe off excessive blood on the
outside surface being careful not to wick blood from open ends of the
micropipette.
6
Follow steps 11 – 13 above to analyze sample.
5.8 Analyzing the Sample (Cap Piercing Device)
Description
This section describes how to analyze whole blood samples using the Cap
Piercing Device.
Sample tube
description
Most standard 5.0 ml tubes, with a maximum length of 82 mm, can be
used in the cap piercing device. The minimum volume in the closed tube
should be approximately 1 ml.
Caution
The Cap Piercer can be damaged if incorrect sized tube is used.
Starting procedure
Follow the procedure below to operate the Cap Piercing Device.
Step
Action
1
Choose List, Sample, or Main menu to begin sample analysis. Analyzer
must be in one of these operation modes to aspirate.
2
Open door to cap piercer and insert vacuum tube upside down, pressing
the tube in place, aligning with lower support.
Continued on next page
Page 49
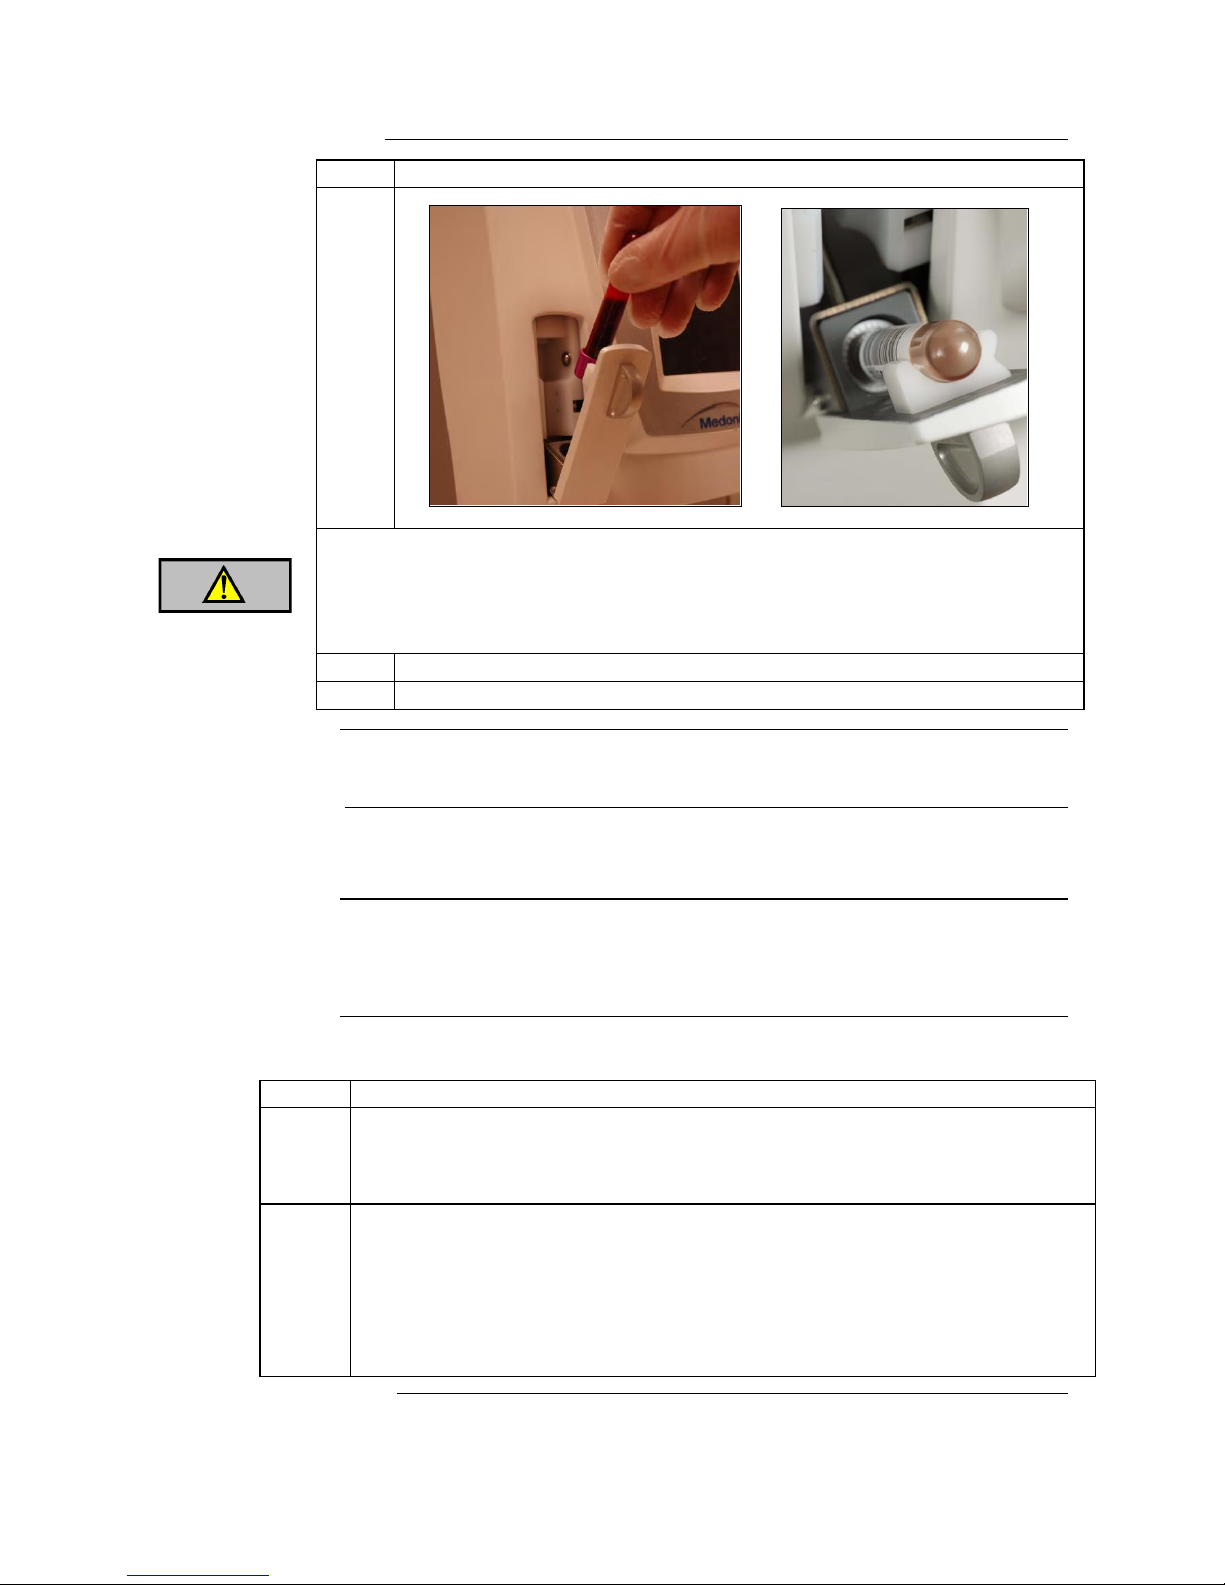
48
5.8 Analyzing the Sample (Cap Piercing Device) (continued)
Step
Action
3
Figure 5.22 Figure 5.23
Always use gloves when in contact with potentially biohazardous materials.
Caution should be applied when handling the cap piercer. Handling and operation by
unauthorized personnel may result in injury.
Insert the sample tube with lid facing downwards. Ignoring this instruction may
damage the aspiration probe.
4
Close the door to the cap piercer to begin sample analysis.
5
Refer to Section 5.5 Steps 6 - 10 for remainder of analysis sequence.
5.9 Analyzing the Sample (Autoloader)
Description
This section describes how to analyze whole blood samples using the
Autoloader (Sampling Device).
Sample tube
description
Only standard 4.0 to 5.0 ml tubes can be used in the Sampling Device. A
sample wheel adapted for Sarstedt tubes is available as an option. The
minimum volume in the closed tube should be approximately 1 ml.
Selecting Sample ID
There are several ways to select the samples.
Step
Action
1
The Sampling Device has a mounted internal barcode reader. If a barcode is used for
the ID number, the operator can simply place the tube in sample wheel and the ID
number will be read automatically. It is very important to line up barcode on tube with
barcode reader.
2
Another option is to manually enter in ID numbers, using the external barcode reader or
the touch screen keyboard.
To manually enter ID number press [SAMPLING DEVICE] and then [INPUT ID].
Then either scan in ID number with external barcode reader or press [INPUT ID],
type in desired ID number, and then press [OK] to accept.
After ID number is entered the next position for entry will automatically be
highlighted.
Continued on next page
Warning
Page 50
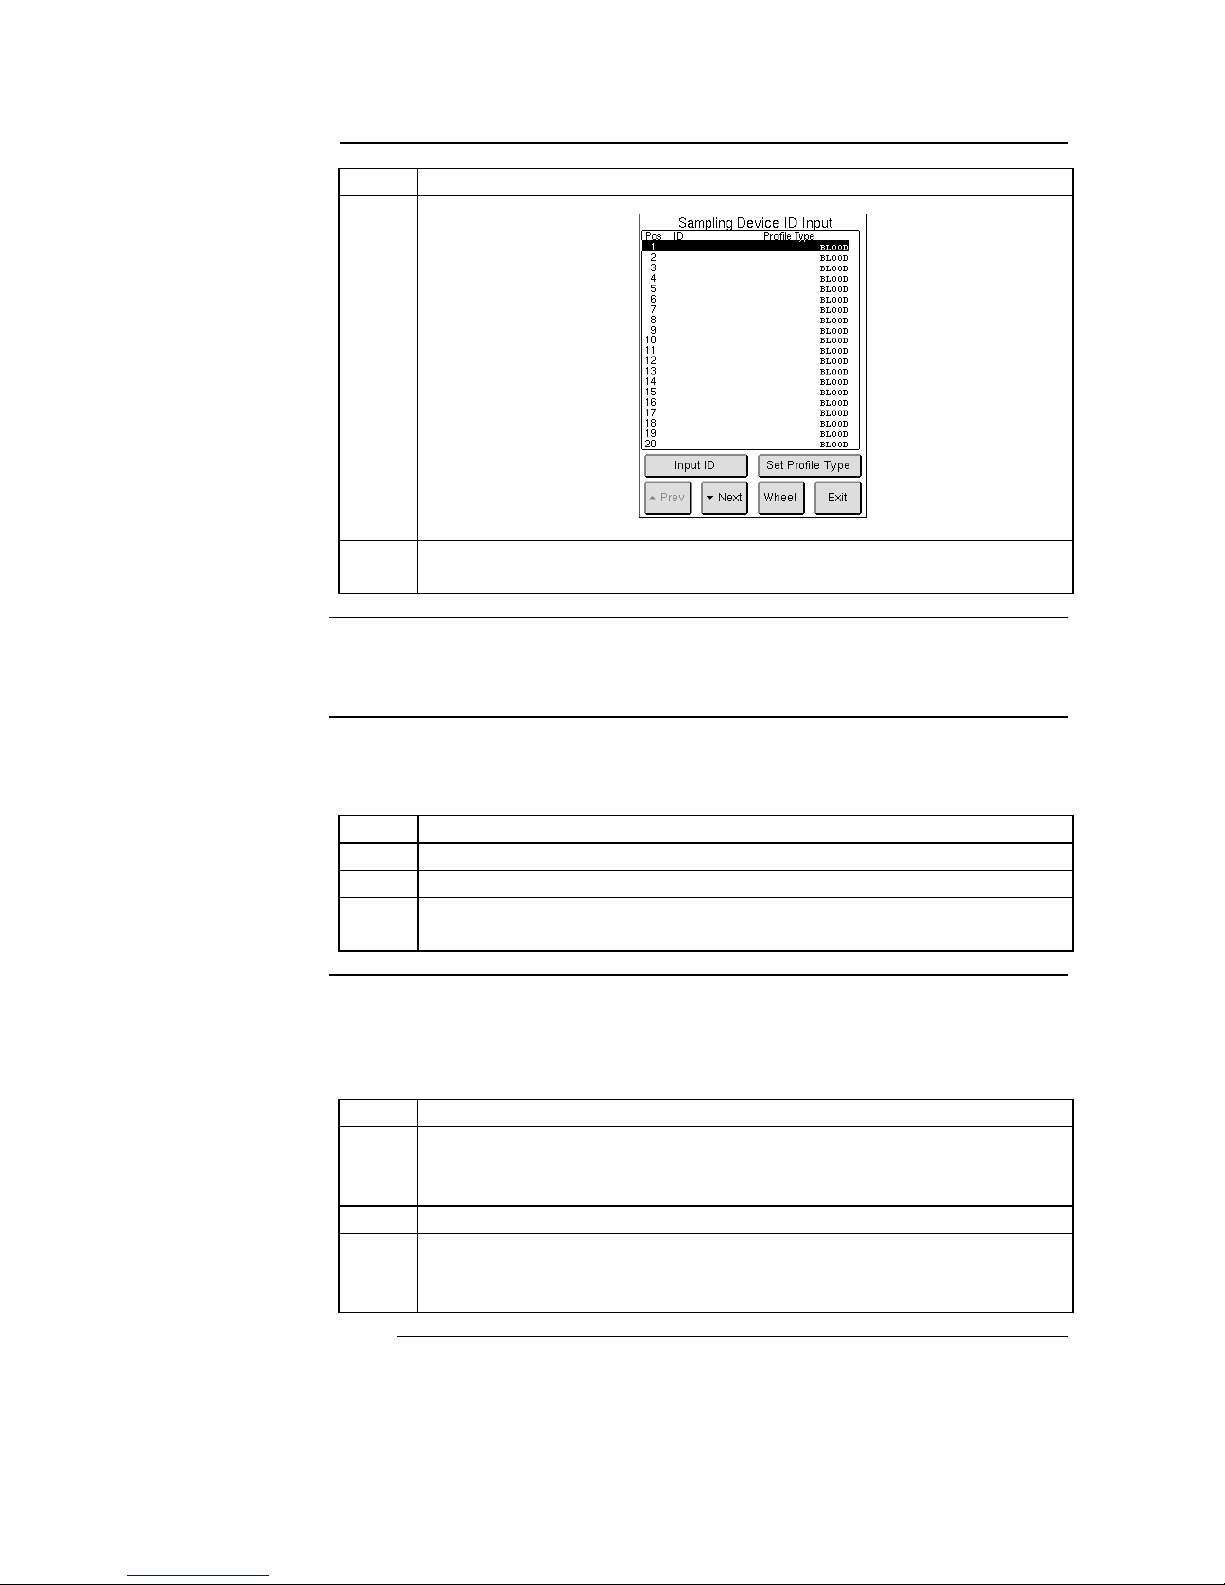
49
5.9 Analyzing the Sample (Autoloader) (continued)
Step
Action
Menu
Figure 5.24
3
Samples can also be analyzed without identification, but then only the
sequence numbers will be present on the worklist.
Selecting
Profile Type
To select a different profile type for a sample press [SET PROFILE TYPE] in
Sampling Device ID Input display, select desired profile, and then press [OK].
Editing Sample
ID Number
Changing a sample ID number or position must be performed prior to pressing
[START] on Sampling Device List display.
Step
Action
1
Press [SAMPLING DEVICE] and then [INPUT ID].
2
Press [NEXT] or [PREVIOUS] to scroll to corresponding ID number.
3
Manually enter in new ID number, using the external barcode reader
or the touch screen keyboard.
Wheel
Selection
When numerous samples are being analyzed an additional wheel may be
needed. Additional wheel entry can begin before or after previous wheel has
begun analysis.
Step
Action
1
Press [WHEEL], on Sampling Device ID Input display, until position
numbers on display match the position numbers on the wheel the
operator is currently loading with new samples.
2
Follow steps 1-3 on Selecting Sample ID.
3
Wait for previous wheel to finish before placing new wheel on front
position of analyzer. Previous wheel is finished when [SAMPLING
DEVICE] button is highlighted green.
Continued on next page
Page 51

50
5.9 Analyzing the Sample (Autoloader) (continued)
Emergency
Sample Analysis
Emergency (STAT) samples can be analyzed after the Sampling Device has
been started or during Sampling Device ID entry. There are several ways to
analyze an emergency sample.
Step
Action
1
Emergency sample can be analyzed through OT, pre-dilute, or MPA mode.
Press [PAUSE], wait for [NEW SAMPLE] button to highlight green, and
then analyze sample in preferred mode.
There may be a slight delay after pressing [PAUSE] button before
emergency sample can be analyzed. This is because analyzer will
complete the counting cycle of the last sample run on sample wheel
before continuing with emergency sample analysis.
When emergency sample is complete, press [CONTINUE] to restart
sampling in next position on the wheel.
2
Emergency sample can also be analyzed using the sample wheel.
Press [STOP], unlock sample wheel and place emergency sample in
Position 1 or 21.
If a sample is already occupying Position 1 or 21 and has already been
analyzed, remove sample and place emergency sample in its place.
If emergency sample has a barcode for ID number, align barcode
correctly, lock sample wheel and press [CONTINUE].
See Editing Sample ID number is manual entry of sample is desired, and
lock sample wheel and press [CONTINUE].
Analyzer will automatically analyze emergency sample and then
continue sampling where it left off prior to pressing [STOP] button.
Note
DO NOT press [START] after sampling device has been paused or stopped
unless operator wants to rerun all samples on wheel.
Control Sample
Analysis
If analyzing samples using the Autoloader mode it is recommended to also
run daily control samples using the sample wheel.
Step
Action
1
Follow instruction in Section 6 for control handling and assay sheet input.
2
Firmly press capped end of control sample into control tube adapter.
3
Load the control sample by placing the adapter towards the outer edge of the
sample wheel and fitting it into Position 1 for all tubes except Sarstedt. Place
Sarstedt control sample in Position 40.
Position control tube barcode facing TOWARDS analyzer and centered
in slot.
If using all three levels of control, add adapters to all levels of controls
and fit them into Positions 1, 2, and 3.
4
Following instruction below for Starting Sampling Device.
Continued on next page
Page 52
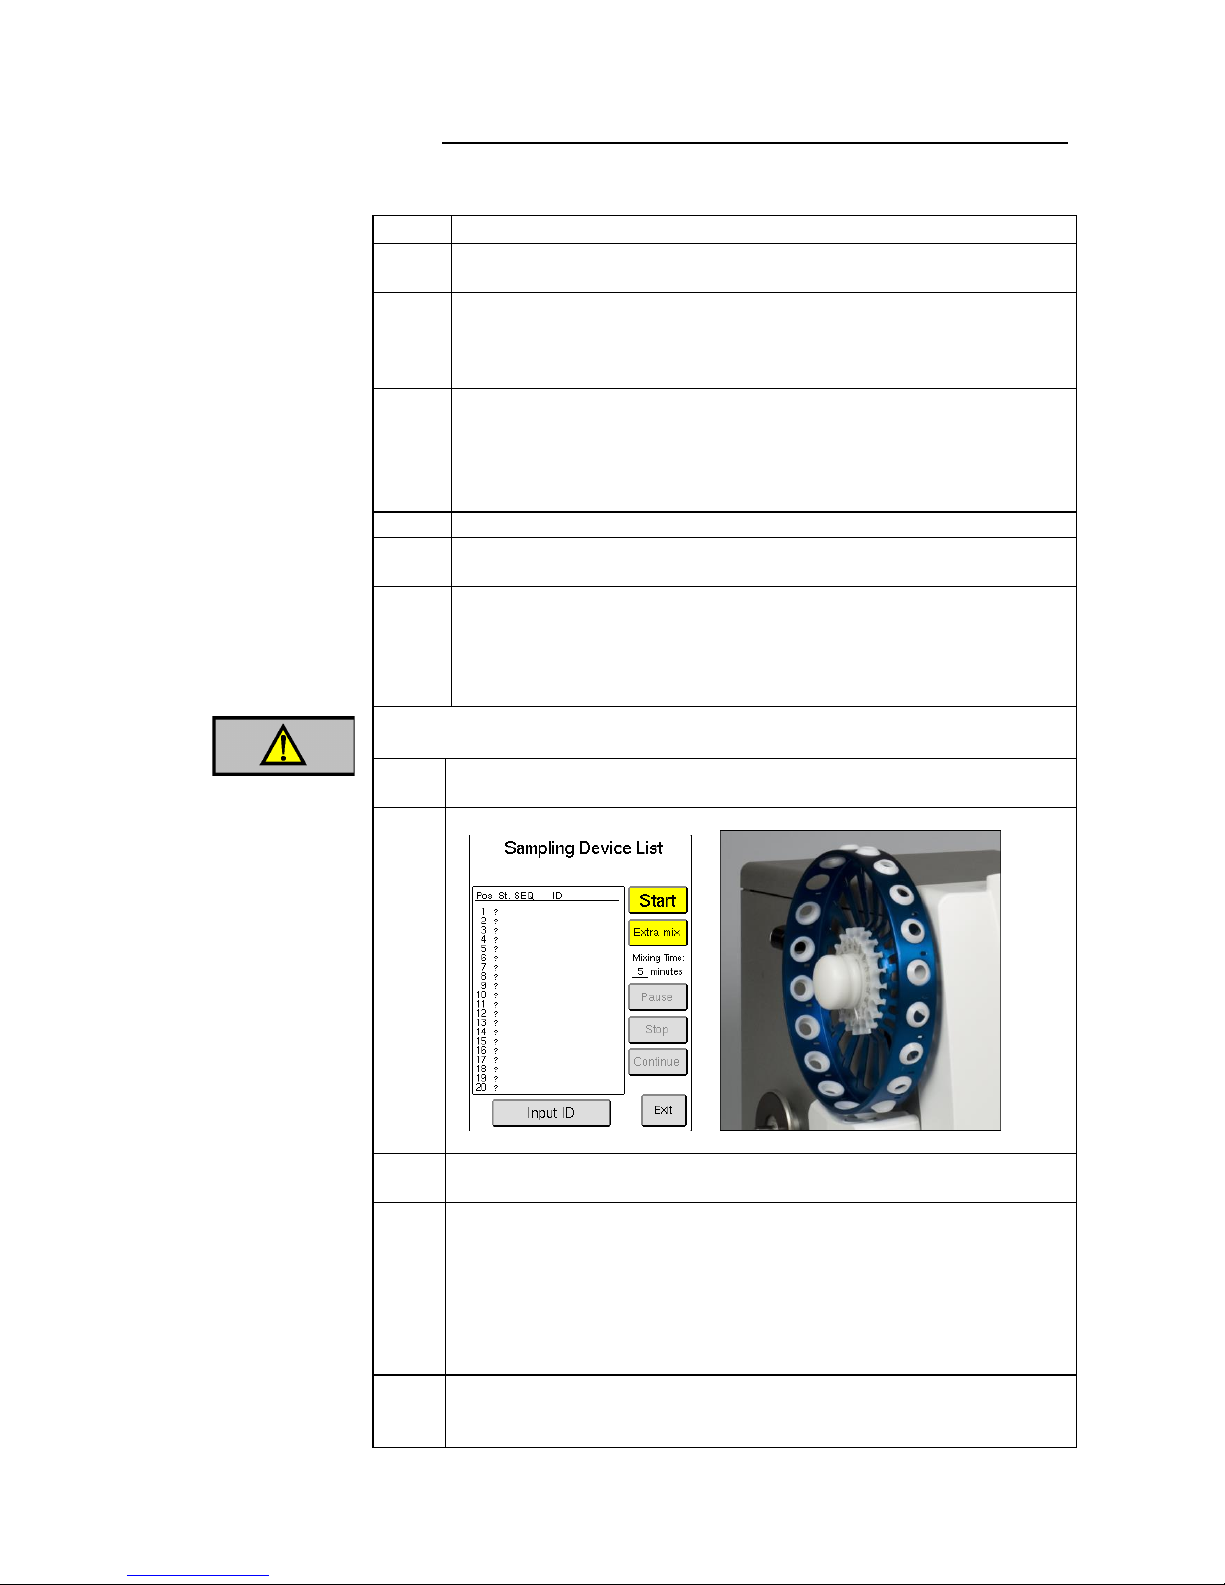
51
5.9 Analyzing the Sample (Autoloader) (continued)
Starting Sampling Device
Follow the procedure below to operate the Sampling Device.
Step
Action
1
Unlock the center piece by turning it counterclockwise and lightly pulling
it away from analyzer.
2
Load the vacuum tube samples by placing the capped end towards outer
edge of sample wheel and fitting it into designated slot. (The first
positions of sample wheel (example: Position 1 and 21) are
recommended to be left open for emergency samples.)
Note
It is important that tubes are positioned correctly.
Position tubes with barcodes facing TOWARDS analyzer and
centered in slot.
Position tubes without barcodes so that label on tube is facing
AWAY from analyzer.
3
Lock in samples by turning center piece clockwise.
4
Press [SAMPLING DEVICE] button from the List, Sample, or Main
menu.
5
Press [START] to immediately begin analysis or press [EXTRA MIX] if
extra mixing of samples is needed. Default mix setting = 10 minutes.
(Extra mixing can be set from 1 to 15 minutes in Setup Menu 3 by
choosing [MIXER SETUP] and then [SET MIXING TIME
(SAMPLER)].
Do not touch sample wheels or samples during operation.
Handling and operation by unauthorized personnel may result in injury.
6
Sampling Device begins analysis with the sample tube placed in the
lowest position number.
Figure 5.25 Figure 5.26
7
Sample Status (St.), SEQ, and ID number will appear in Sampling Device
List as they are analyzed.
8
Sample Status has three columns:
Column 1 is sample tube detection: (+) = Detected, (-) = Not detected,
(?) = Not yet determined.
Column 2 is first analysis: (+) = Complete, (-) = Aspiration Failure,
(!) = System Information Message, (0) = No Sample in tube.
Column 3 is Re-analysis: same as Column 2 except re-analysis is not
repeated.
9
Press [EXIT] to view sample results. [NEXT] button will highlight when
the next sample being run is complete. For more information of results
refer to Section 5.10.
Warning
Page 53
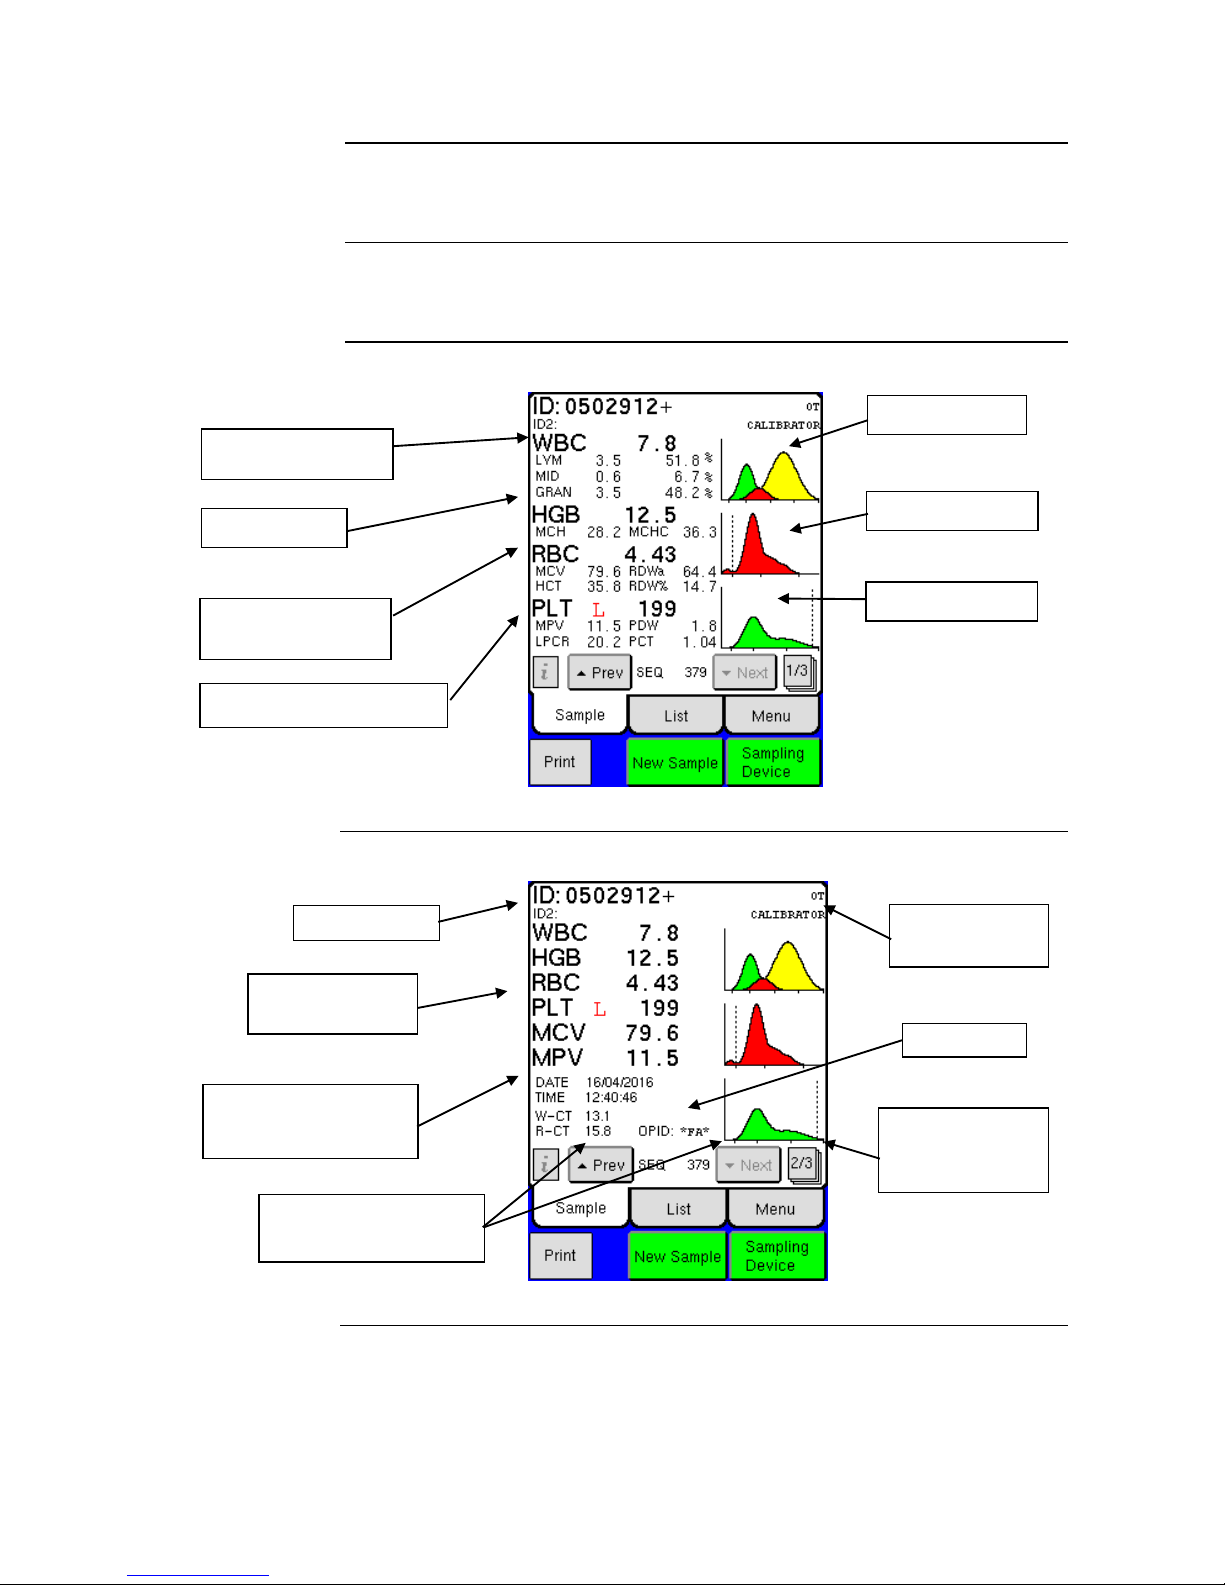
52
5.10 Results
Description
This section describes the information that can be obtained from the sample
analysis results.
After sample
analyze
After a sample has been analyzed the result information can be viewed in the
following three screen displays:
Sample View 1
Figure 5.27
Sample View 2
Figure 5.28
Continued on next page
Press on to view
different views of
same sample.
Use these buttons to scroll to
previous or next samples.
Analysis mode and
analysis profile
Displays date and time of
sample analysis, and WBC
and RBC counting times.
Sample IDs
Primary Diagnostic
Parameters
WBC histogram
RBC histogram
PLT histogram
Total WBC count and
differential values
HGB parameters
Total RBC count and
RBC parameters
PLT count and PLT parameters
Operator ID
Page 54
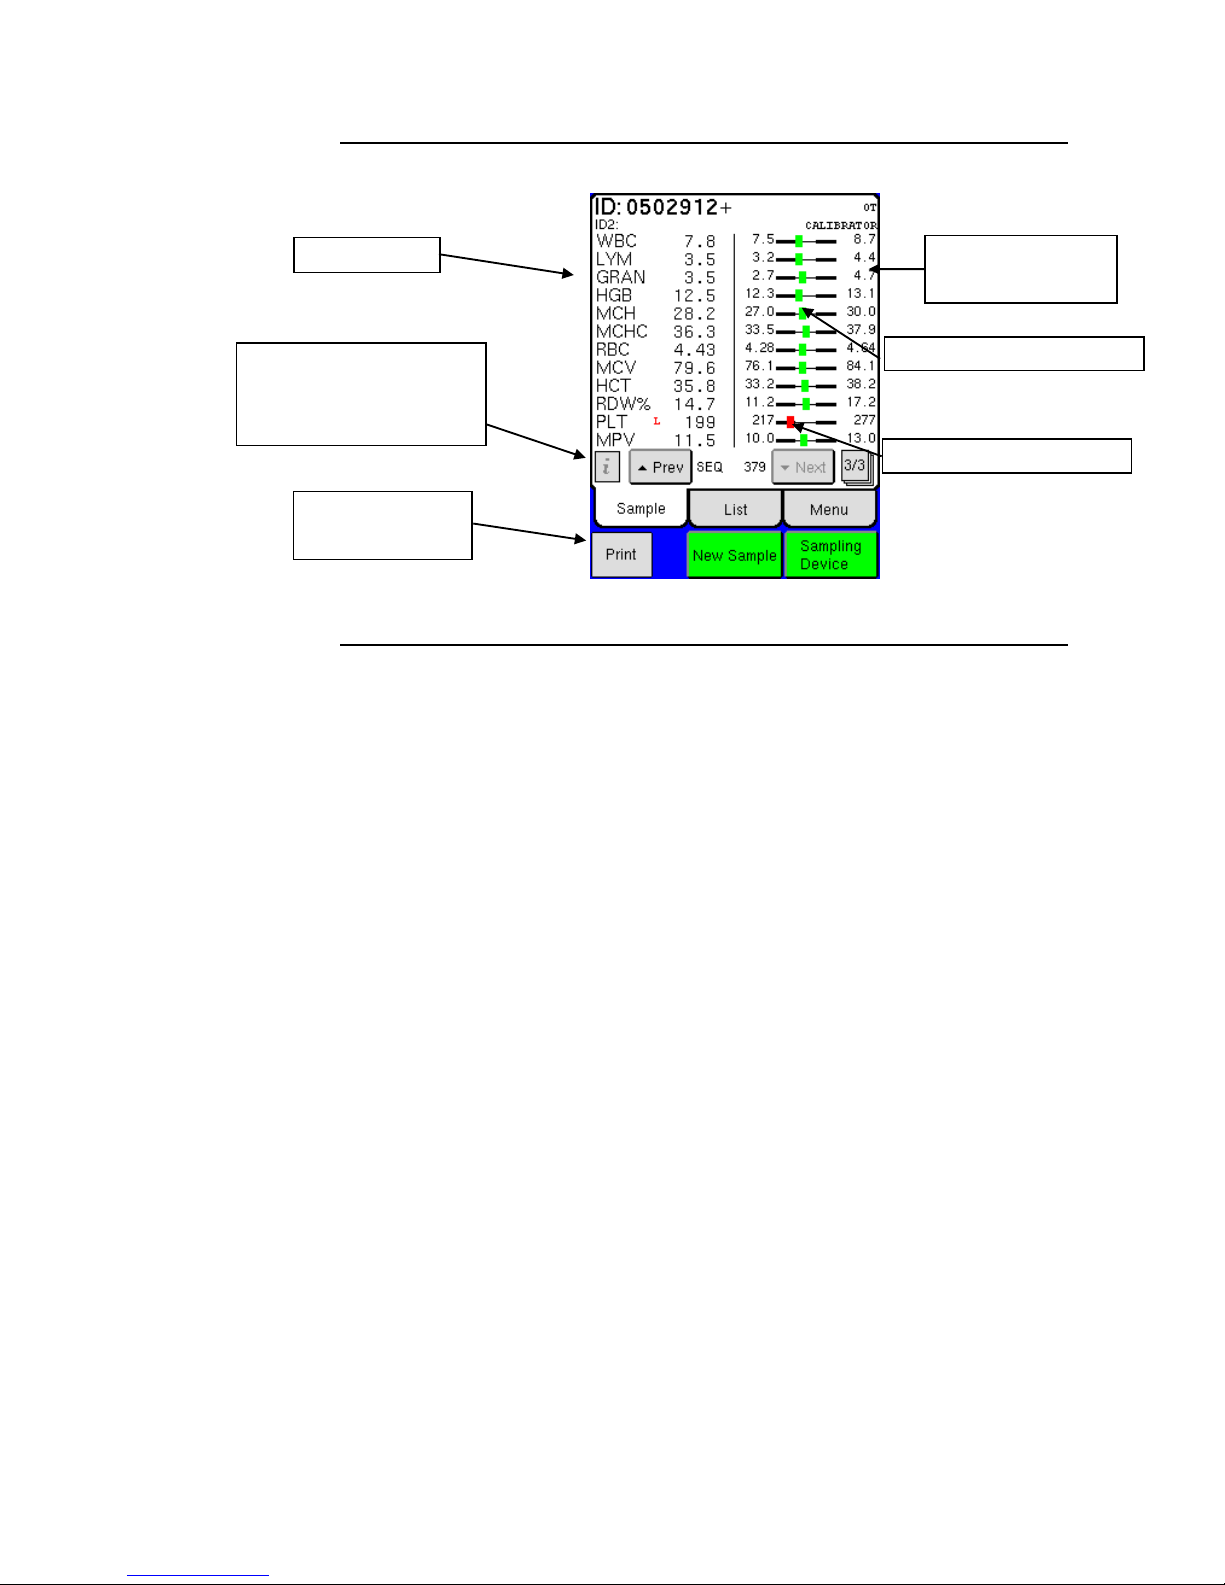
53
5.10 Results (continued)
Sample View 3
Figure 5.29
Sample results
Press to print current
sample analysis.
Normal Range display
with sample results.
Green bar = Results within Range
Red bar = Results Out-of-Range
Information Indicator – When
highlighted user can press
button to display system
information messages.
Page 55
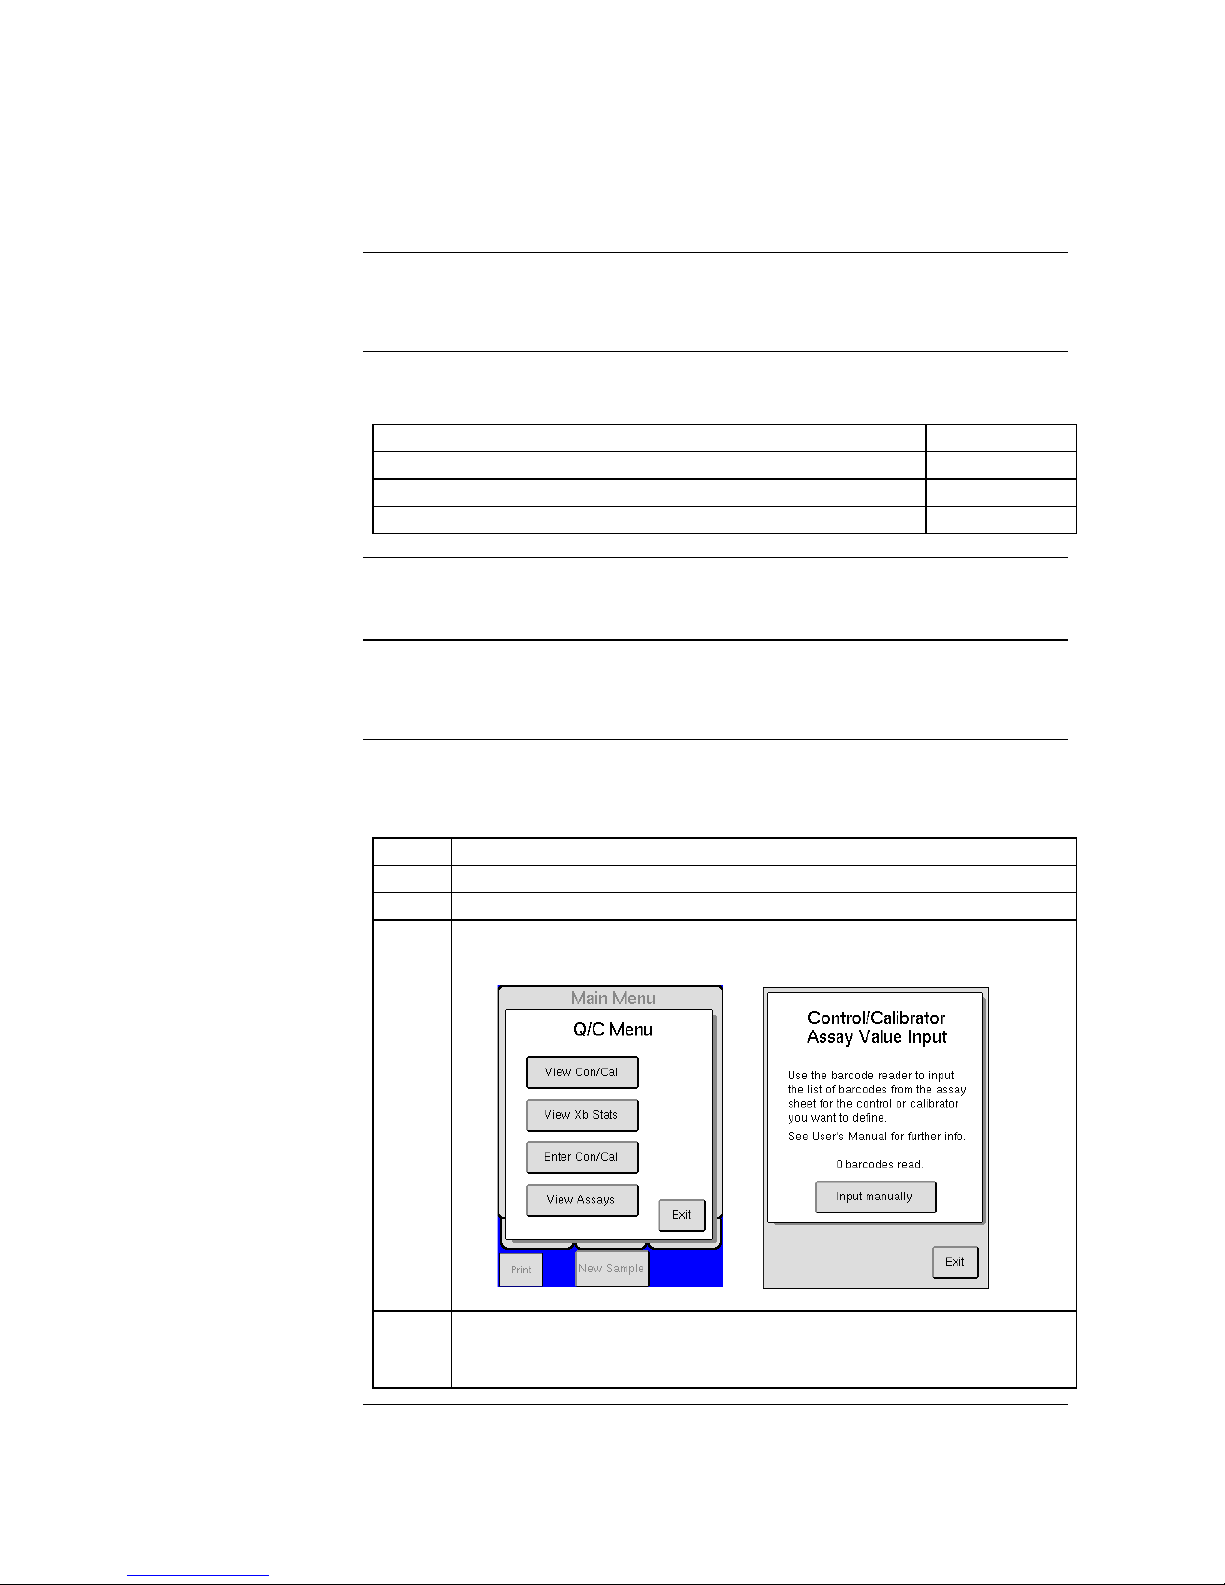
54
Section 6: Quality Control (QC) and Blood
Control Memory
Section Overview
Introduction
The Medonic M-Series is equipped with a QC memory capable of
displaying and printing Xb and Levey Jennings plots.
Contents
This section contains the following topics:
Topic
See Page
Quality Control (QC)
54
Levey-Jennings Plots
57
Initialization and Use of Xb Function
58
6.1 Quality Control (QC)
Introduction
This section describes the procedures to be performed for running control
samples.
QC Menu and
Assay Value Input
Follow the instruction below to access the QC menu and to input
Control/Calibrator Assay Values from the Assay sheet.
Step
Action
1
Enter the QC menu by pressing [QC] from the menu tab.
2
Press [ENTER CON/CAL].
3
Refer to the Assay sheet for instructions on how to input Assay Values.
(These pages are delivered with authorized Boule controls).
Figure 6.1 Figure 6.2
Note
12 different Assay Lots from Boule can be stored simultaneously.
When entering a new Assay Lot, the previously scanned Assay Lot will
be removed in a chronological order starting with the first entered Lot.
Continued on next page
Page 56
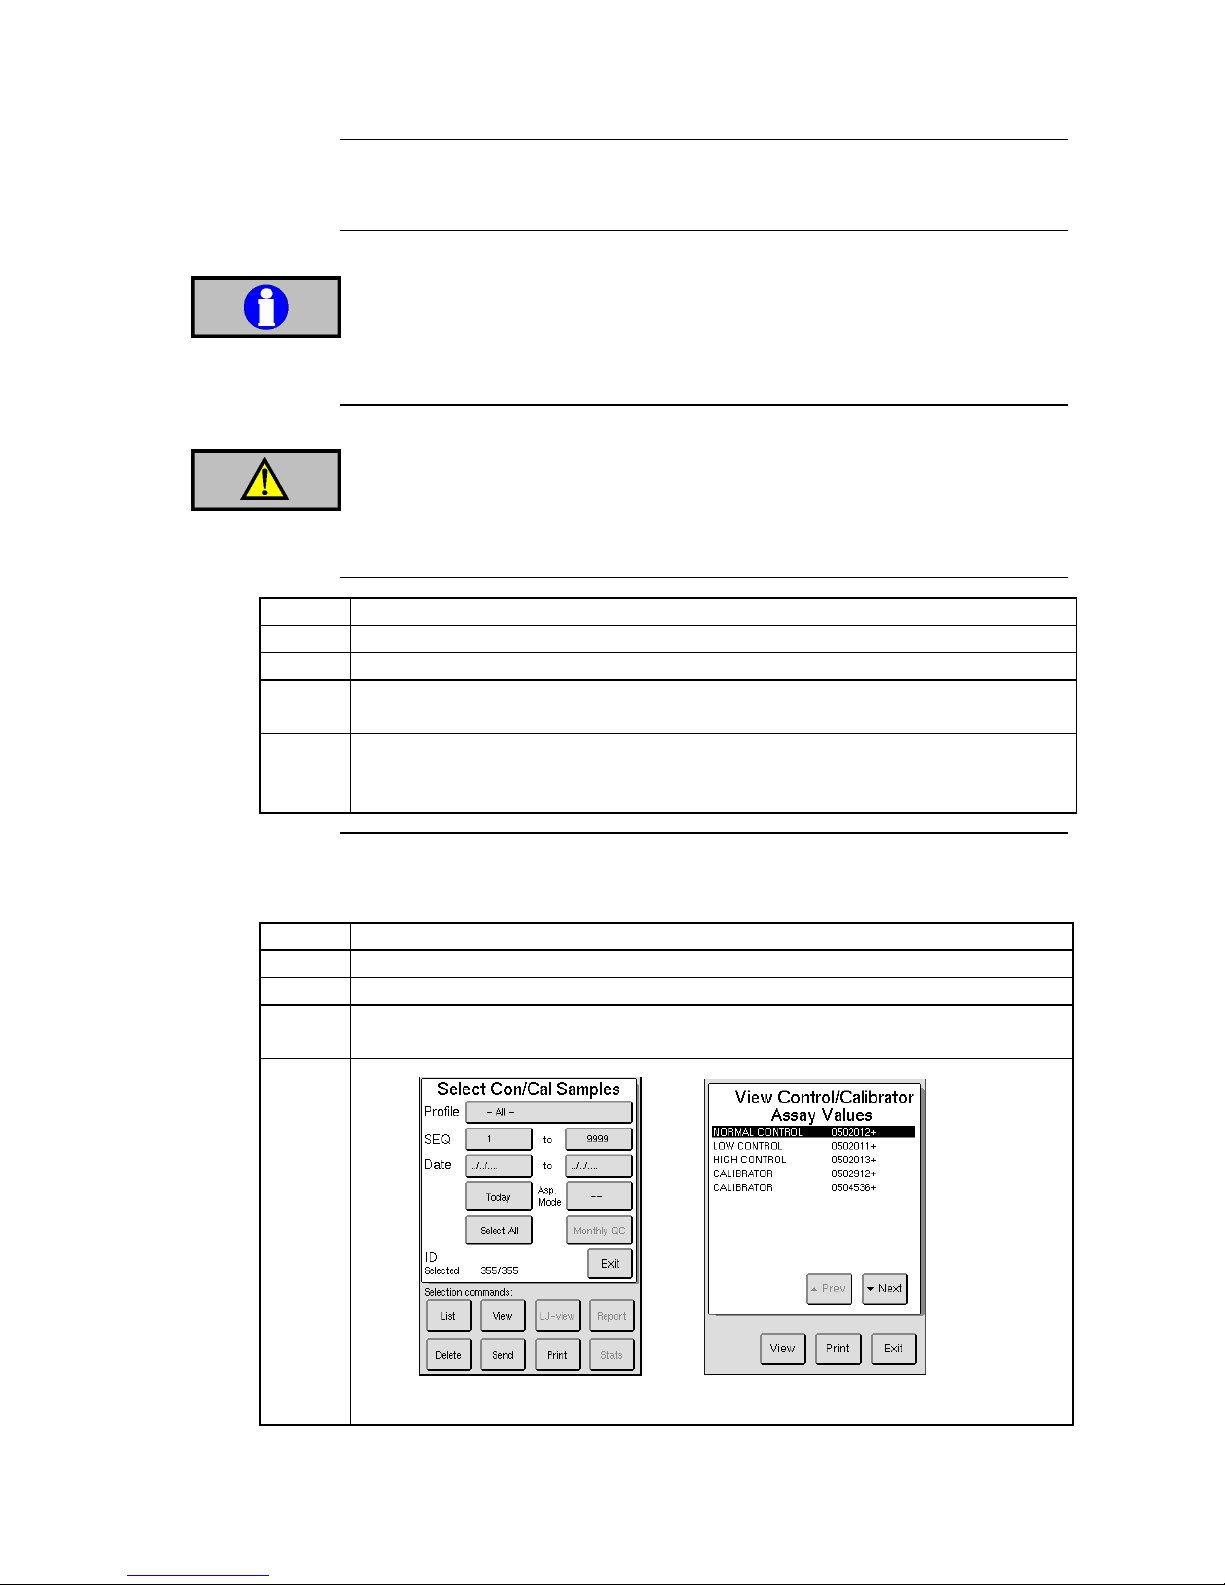
55
6.1 Quality Control (QC) (continued)
Control Analysis
It is recommended that the performance of the Medonic M-Series system is
checked daily with certified blood controls authorized by Boule.
Important
Handle and prepare controls in accordance to control package insert.
Never use an open vial longer than recommended by the manufacturer or
subject any vial to excessive heat or agitation.
Wipe the aspiration probe with a clean, dry lint free absorbent cloth before
each control run. Not following this technique will impact control accuracy.
Warning
As there are no assurances of the absence of HIV, Hepatitis B or C viruses
or other infectious agents in blood samples, controls, and calibrators these
products should be handled as potentially biohazardous.
Refer to local regulations and established laboratory protocol for handling
biohazardous materials.
Step
Action
1
Follow directions on Assay Sheet to scan in assay values.
2
Choose either List, Sample, or Main Menu to begin control analysis.
3
Using installed barcode reader, scan the Control ID from the blood control vial
label or manually enter in barcode.
4
Aspirate the blood control and wait for the results. The Medonic M-Series will
identify this ID and match the results with the previously defined control assay
values.
Search Function
Each blood control type can be found by control lot number, level, date or
sequence number.
Step
Action
1
Enter the QC menu and press [VIEW CON/CAL].
2
Input the search criteria to be used.
3
Pressing on the SEQ bar will display Figure 6.4, in which one particular lot or
level can be selected.
Menus
Figure 6.3 Figure 6.4
Page 57
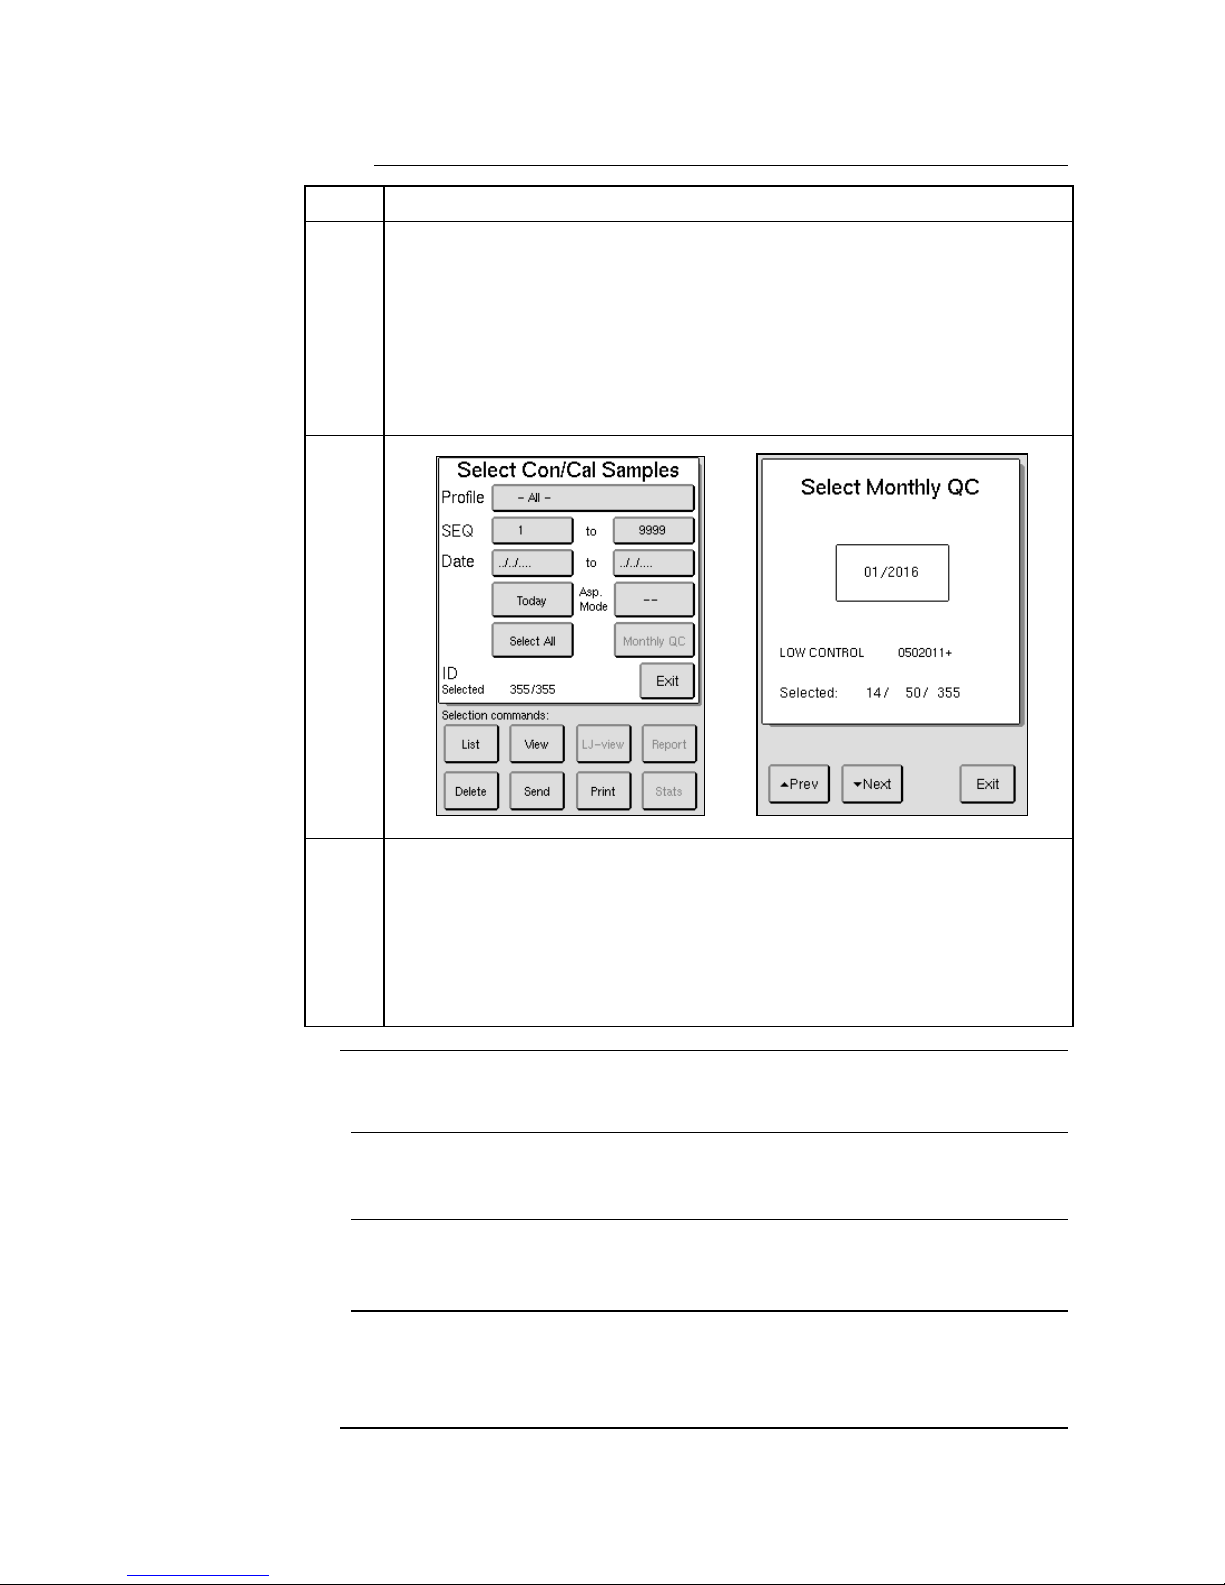
56
6.1 Quality Control (QC) (continued)
4
Press the [SAMPLE] or [LIST] buttons to display the selected samples.
5
Once samples are displayed they can also be printed out in a Monthly QC
summary report.
After the control lot (profile) has been selected the Monthly QC button
will become active.
Press [MONTHLY QC] button, use the [PREV] and [NEXT] buttons
to scroll to desired month, and press [EXIT].
The Monthly QC button will turn green when lot and month have been
chosen. Press [REPORT] button to print out report.
Menus
Figure 6.5 Figure 6.6
6
To exclude a sample from the Monthly QC or LJ Diagram summary
reports perform the following steps prior to Step 5 above:
Scroll to the control sample to be excluded using the [PREV] and
[NEXT] buttons in the Con/Cal Sample or List tabs.
Then press [EXCLUDE/INCLUDE] button. An “X” will be placed
next to excluded sample.
To include the sample press the [EXCLUDE/INCLUDE] button again.
6.2 Levey-Jennings Plots
Procedure
instruction
This section describes selecting, viewing, and printing Levey-Jennings Plots.
L-J Plots
Levey-Jennings (L-J) plots are used to monitor the long term stability of the
instrument using Boule blood controls.
Controls
To be able to use L-J plots, the Control/Calibrator Assay Values for the
controls must be scanned with the installed barcode reader or manually
entered in. Follow direction on Assay Sheet to scan in assay values.
Continued on next page
Page 58
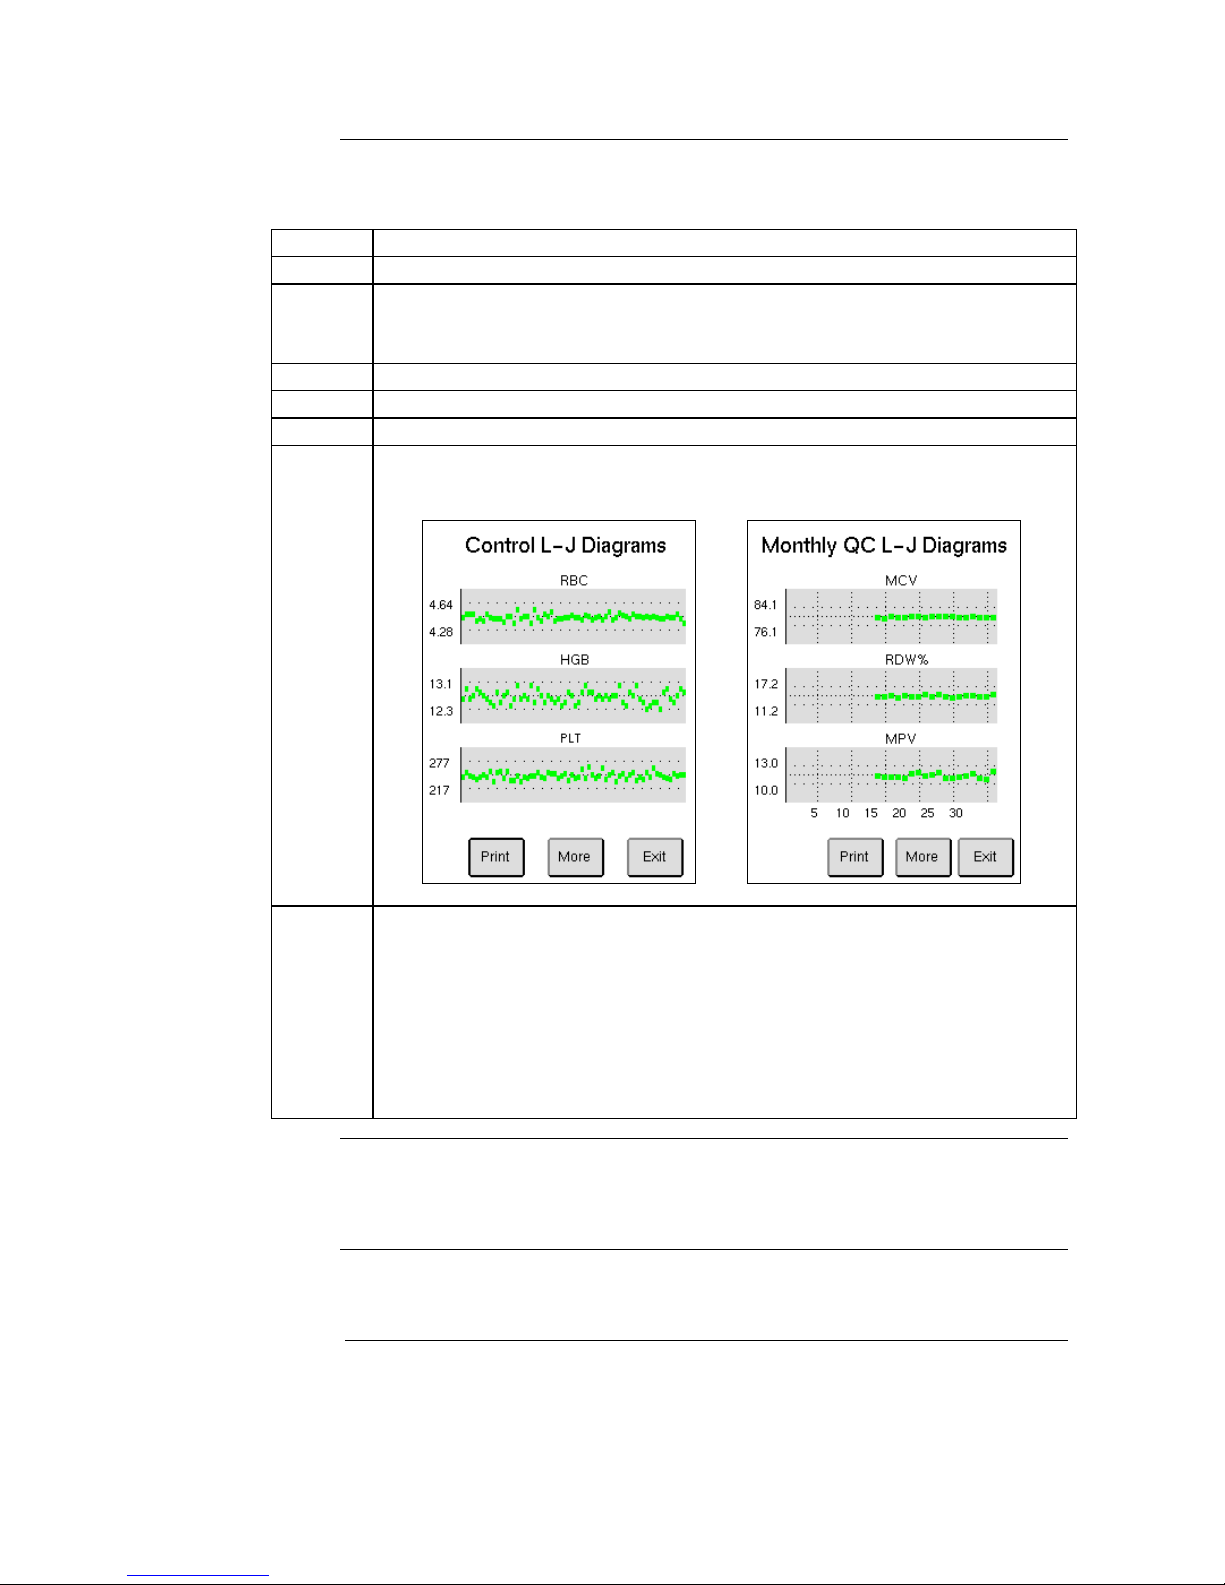
57
6.2 Levey-Jennings Plots (continued)
Displaying and
printing L-J Plots
To display and print the L-J plots, follow the instructions below:
Step
Action
1
Enter the QC menu and press [VIEW CON/CAL].
2
Scan the barcode label on the blood control tube, with the barcode reader,
select control from Select Con/Cal Sample Menu, or manually enter in
value.
3
Press [L-J VIEW] to display the Levey - Jennings plots.
4
Scroll through parameters by choosing [MORE].
5
Print diagrams by choosing [PRINT].
L-J plot
Diagrams
Image 6.7 below is constructed from several samples and will not be shown
as below until a sufficient amount of samples have been analyzed.
Figure 6.7 Figure 6.8
6
A Monthly QC L-J Diagram report can also be viewed and printed:
Follow Steps 5 -6 in Section 6.1 to select control lot and month.
Press [L-J VIEW] to view the monthly diagrams. The Monthly L-J
diagrams will differ from the normal L-J plots as the x-axis uses the
expected range for its out-of-bounds criteria and on the y-axis the points
can be visibly traced to which day of the month it was analyzed on.
To print the diagrams on the displayed page, press [PRINT] or to print all
diagrams, scroll to the last display page without plots and press [PRINT].
Parameters
displayed on
L-J Plots
The L-J plots are displayed for all parameters defined in the Assay Sheet
except the WBC differential parameter “MID”.
Note
If a control shows a system information indicator, the parameter values of such
a control will not be included in the L-J plots.
Page 59
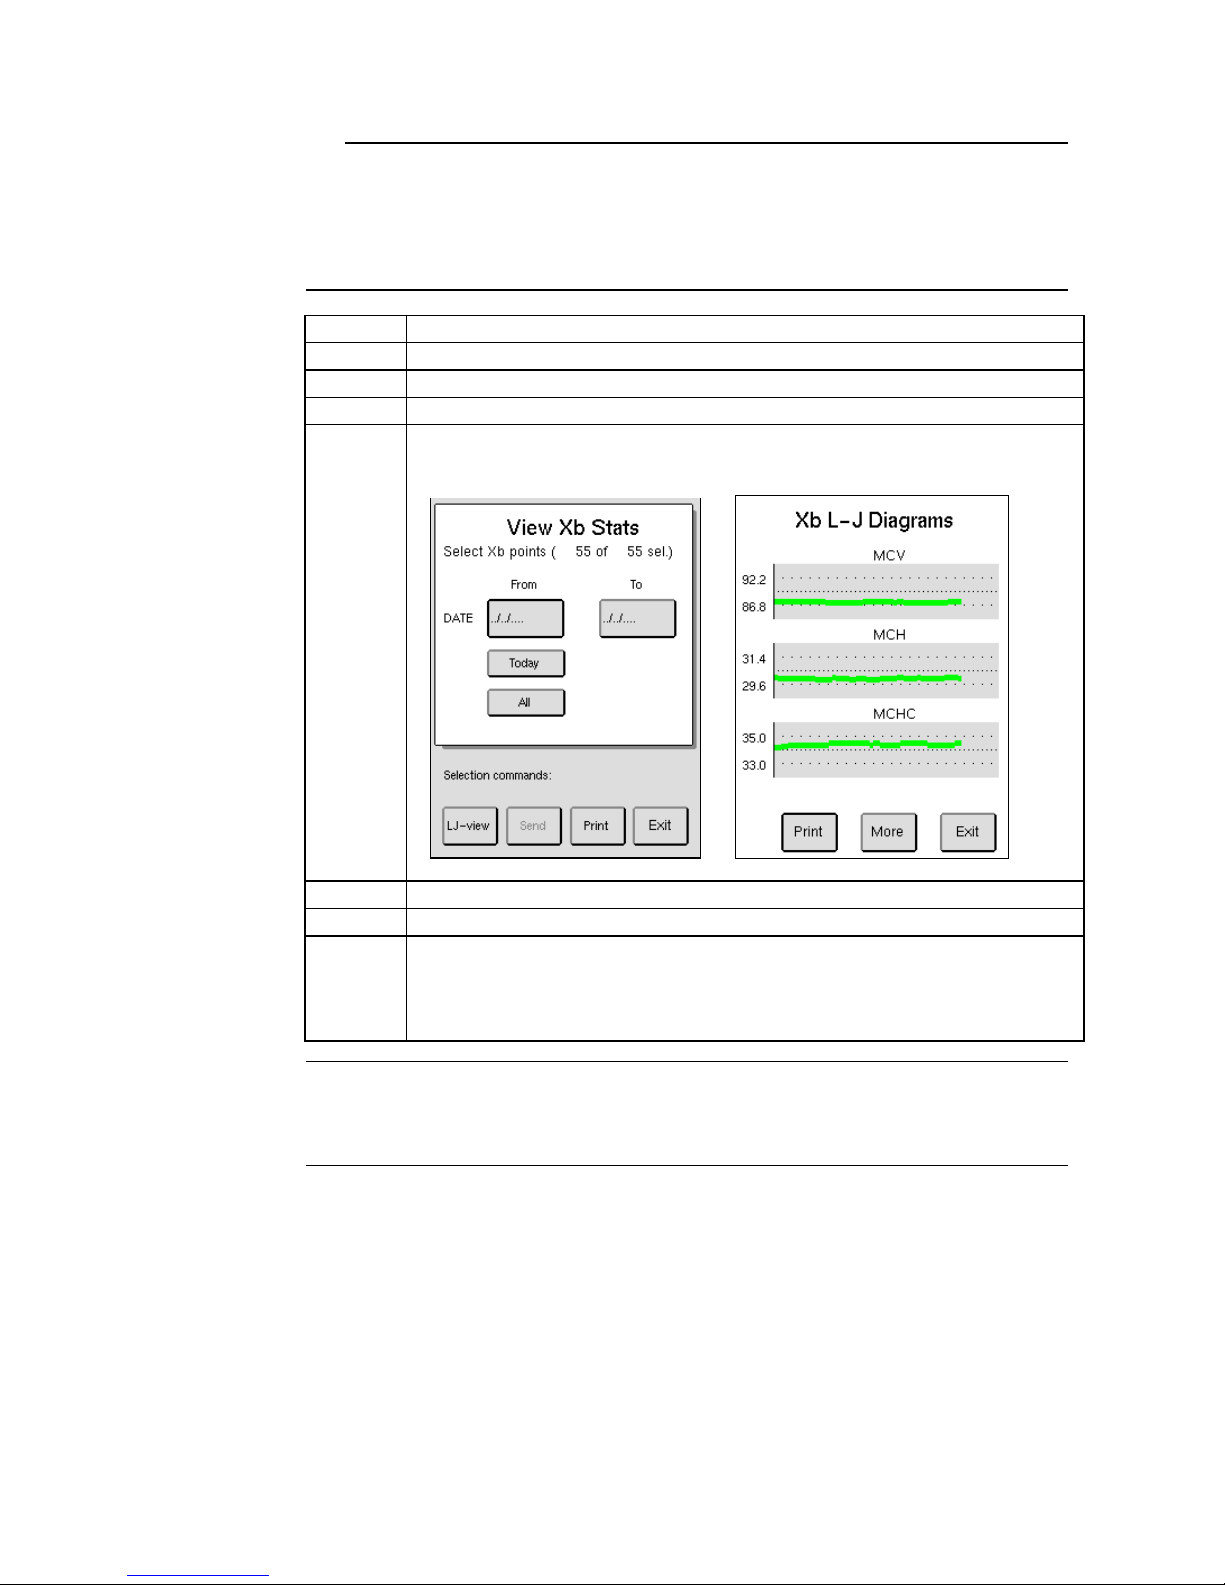
58
6.3 Initialization and Use of Xb Function
Description
The Xb function in the Medonic M-Series follows strictly the Bull algorithm
for the parameters MCV, MCH and MCHC. These parameters should not drift
as a function of time within a large patient population. The recommended range
setting is ± 3% from the expected mean value of these parameters.
Step
Action
1
Enter the QC menu and press [VIEW Xb STATS].
2
Select Xb points by Date or by default all sample data is selected.
3
Press [LJ VIEW] to display Xb L – J diagrams.
Xb L-J
Diagrams
The image below is constructed from several samples and will not be
shown as below until a sufficient amount of samples have been analyzed.
Figure 6.9 Figure 6.10
4
Select [MORE] to view selected conditions and matched ranges.
5
Print diagrams by choosing [PRINT].
6
To change ranges on Xb Diagrams go to Setup Menu 3 and press [XB
RANGE SETUP]. Here operator can change low and high ranges on the
three parameters. To update or change Xb range setup input the
Authorization Code [2576].
Reference
Bull BS, Hay KL. The blood count, its quality control and related methods: X-bar calibration and
control of the multichannel hematology analysers. In: Clangoring I. editor. Laboratory
Hematology: An account of Laboratory Techniques. Edinburgh.
Page 60
59
Section 7: Calibration
Section Overview
Introduction
This section describes the step-by-step procedure for calibration of the
Medonic M-Series. The instrument has been calibrated by Boule prior to
shipment. Good laboratory practice, however, requires regular checks and
calibration of the measured parameters. It is recommended to calibrate the
instrument every 6 months.
Contents
This section contains the following topics:
Topic
See Page
Preparations before calibration
59
Calibration
60
7.1 Preparations before calibration
Before
Calibration
It is recommended that the performance of the Medonic M-Series system is
checked daily with certified controls authorized by Boule.
Analyze control blood once in the open tube mode and compare results with
the assigned values prior to calibration.
Before recalibration of the instrument check that calibrator and reagents are
not outdated and exclude instrument failure.
Verify that instrument maintenance/cleaning is current. (See Sections 8.1 –
8.3)
Prior to calibration print Calibration Log. Select [ADVANCED] from Main
Menu, then [CALIBRATION], then [CALIBRATION LOG], and then
[PRINT].
Important
The user should be thoroughly familiar with the analyzer system and the
calibration procedure before performing calibration.
Refer to the Calibrator Product Insert for complete instructions for handling
and use of blood calibration materials.
Never use an open vial longer than recommended by the manufacturer or
subject any vial to excessive heat or agitation.
Wipe the aspiration probe with a clean, dry lint free absorbent cloth before
each calibrator run. Not following this technique will impact control
accuracy.
Warning
As there are no assurances of the absence of HIV, Hepatitis B or C viruses
or other infectious agents in blood samples, controls, and calibrators these
products should be handled as potentially biohazardous.
Refer to local regulations and established laboratory protocol for handling
biohazardous materials.
Page 61
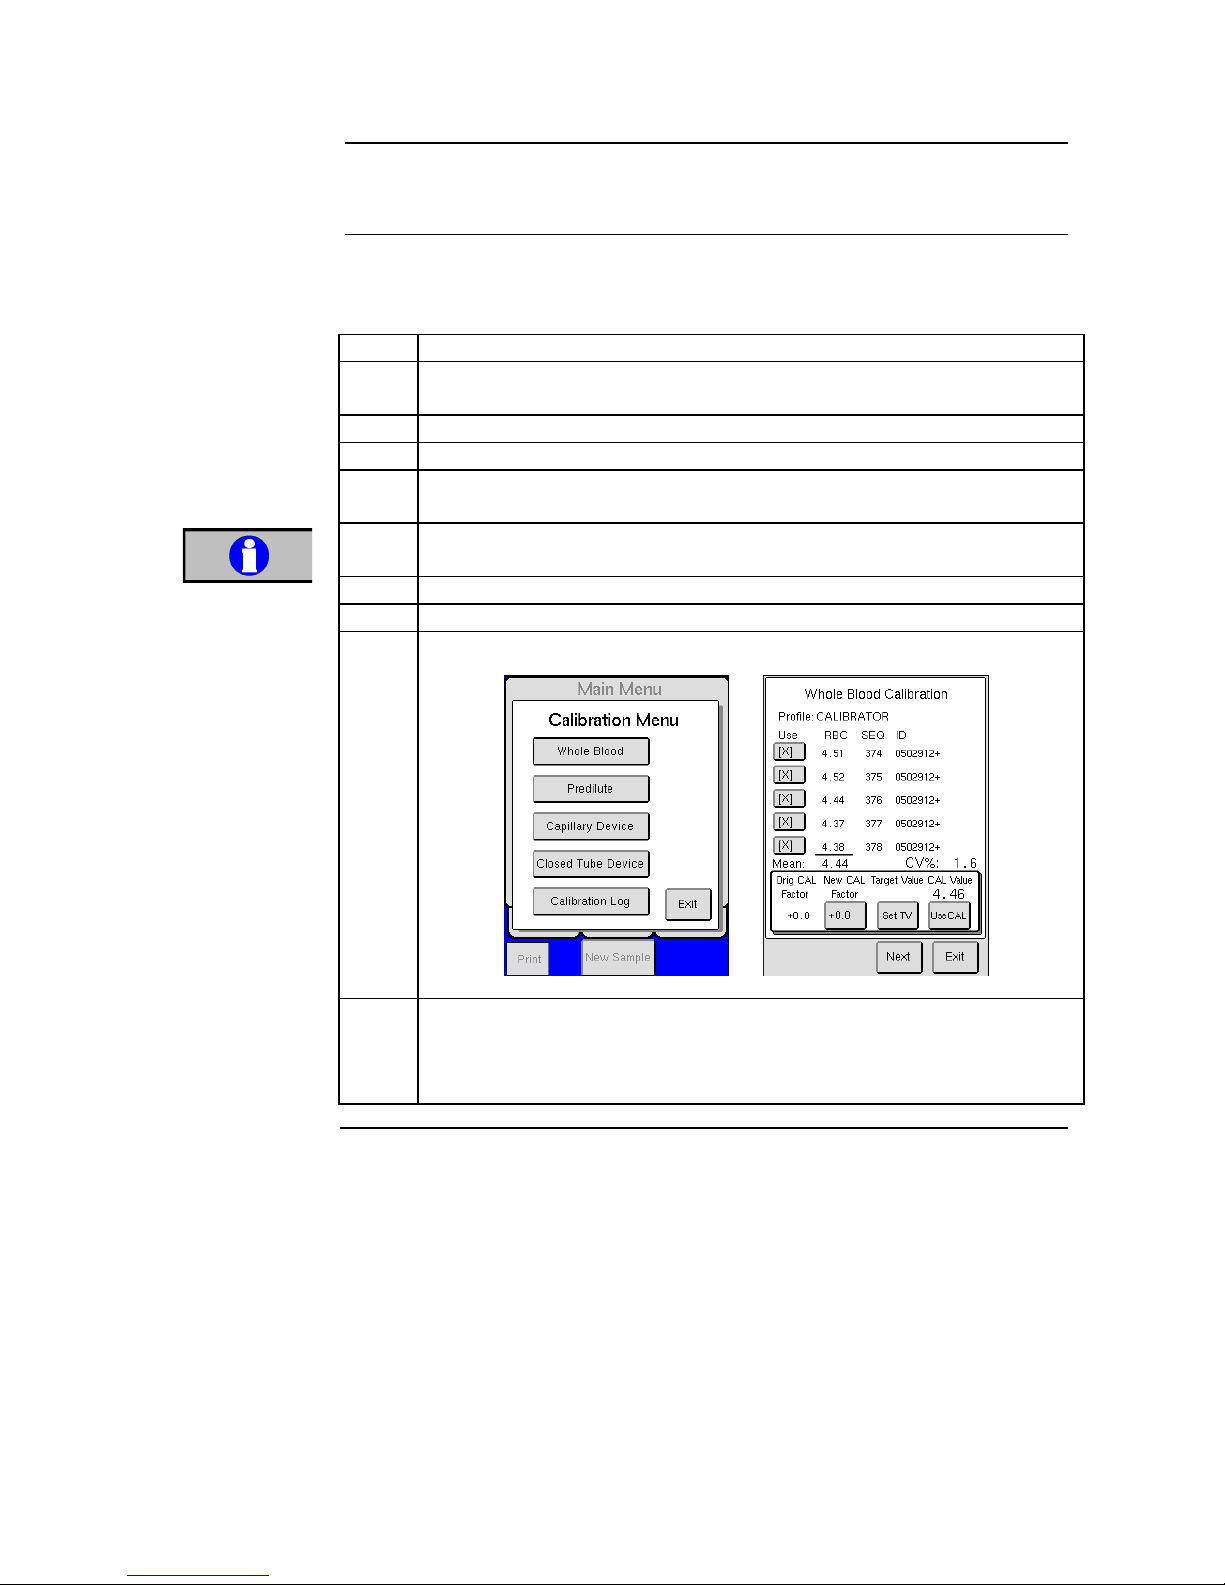
60
7.2 Calibration
Input Calibrator
Assay Values
Follow the instruction in Section 6.1 Quality Control to access the QC menu
and to input Control/Calibrator Assay Values from the Assay sheet.
Whole Blood
Calibration
The following instructions calibrate Open Tube, Cap Piercer, and Sampling
Device modes. Follow the instructions below to calibrate:
Step
Action
1
Prior to calibration, prime instrument by aspirating 2 fresh blood
samples. Disregard results.
2
Follow directions on Assay Sheet to scan in calibrator assay values.
3
Choose either List, Sample, or Main menu to begin calibrator analysis.
4
Using installed barcode reader, scan the Calibrator ID from the
calibrator vial label.
5
To perform calibration, it is recommended that five calibration analyses
be performed in consecutive order through the open tube mode.
Note
DO NOT use Cap Piercer or Autoloader mode to aspirate calibrator.
6
When analyses are complete press [ADVANCED] from the MENU tab.
7
Press [CALIBRATION] and then choose [WHOLE BLOOD].
Figure 7.1 Figure 7.2
Note
Calibration analysis must be last analysis performed on instrument for
parameter values to be shown in calibration menus. (e.g. no values will
show if in the middle of calibration a patient sample analysis was
performed)
Continued on next page
Important
Page 62
61
7.2 Calibration (continued)
8
Scroll through parameter screens by using the [NEXT] button and
verify that the CVs for the following parameters are within the stated
limits:
Parameter
OT/CT CV%
MPA/PD CV%
RBC
< 2.2
< 3.2
MCV
< 1.8
< 1.8
PLT
< 5.8
< 6.2
HGB
< 1.8
< 2.9
WBC
< 4.2
< 4.8
MPV
< 4.0
< 4.0
*CV limits are wider on the MPA/Pre-dilute calibration due to differences
in pipetting and blood collection techniques at the operator level.
9
If CV values are not within range operator will be unable to perform
calibration. (Analyses with system information indicators will
automatically inactivate that analysis from the CV calculation and
depending on flag may not be stored on list at all.) If a known sample
handling error or erroneous result is present, then sample can be
inactivated by pressing button to the left of that particular analysis
and changing to empty brackets [ ].
10
If all parameters have acceptable CVs proceed to next step, if not
rerun calibration following steps above.
11
The new calibration factor can be entered in three ways.
The recommended method is to select the [USE CAL] button
which will automatically calculated the new calibration factor
using target range from assay values.
The second method, if no calibrator is available, is to perform
Steps 4-9 using a sample with target values from an assay sheet or
determining target values using a reference analyzer or a
microscope method with an in-house sample. The target values
can be entered selecting the [SET TARGET VALUE] button and
manually entering in the values.
The third method is to manually calculate and enter in calibration
factor. This method should only be used with instruction from
local distributor or authorized service technician.
12
In the first and second methods the calibration factor is automatically
calculated once either the [USE CAL] button is pressed or target
value is entered.
13
Once calibration factor has been entered using one of the methods
above, operator will be prompted to enter a 4-digit Operator ID
(Operator ID is recommended for in-house records of calibration
operator but not required) and an Authorization Code (REQUIRED)
before the new value can be changed or updated.
Note
Authorization Code prompt is displayed only once per calibration
sequence when [USE CAL], [TARGET VALUE], or [NEW CAL
FACTOR] buttons are pressed.
Continued on next page
Page 63
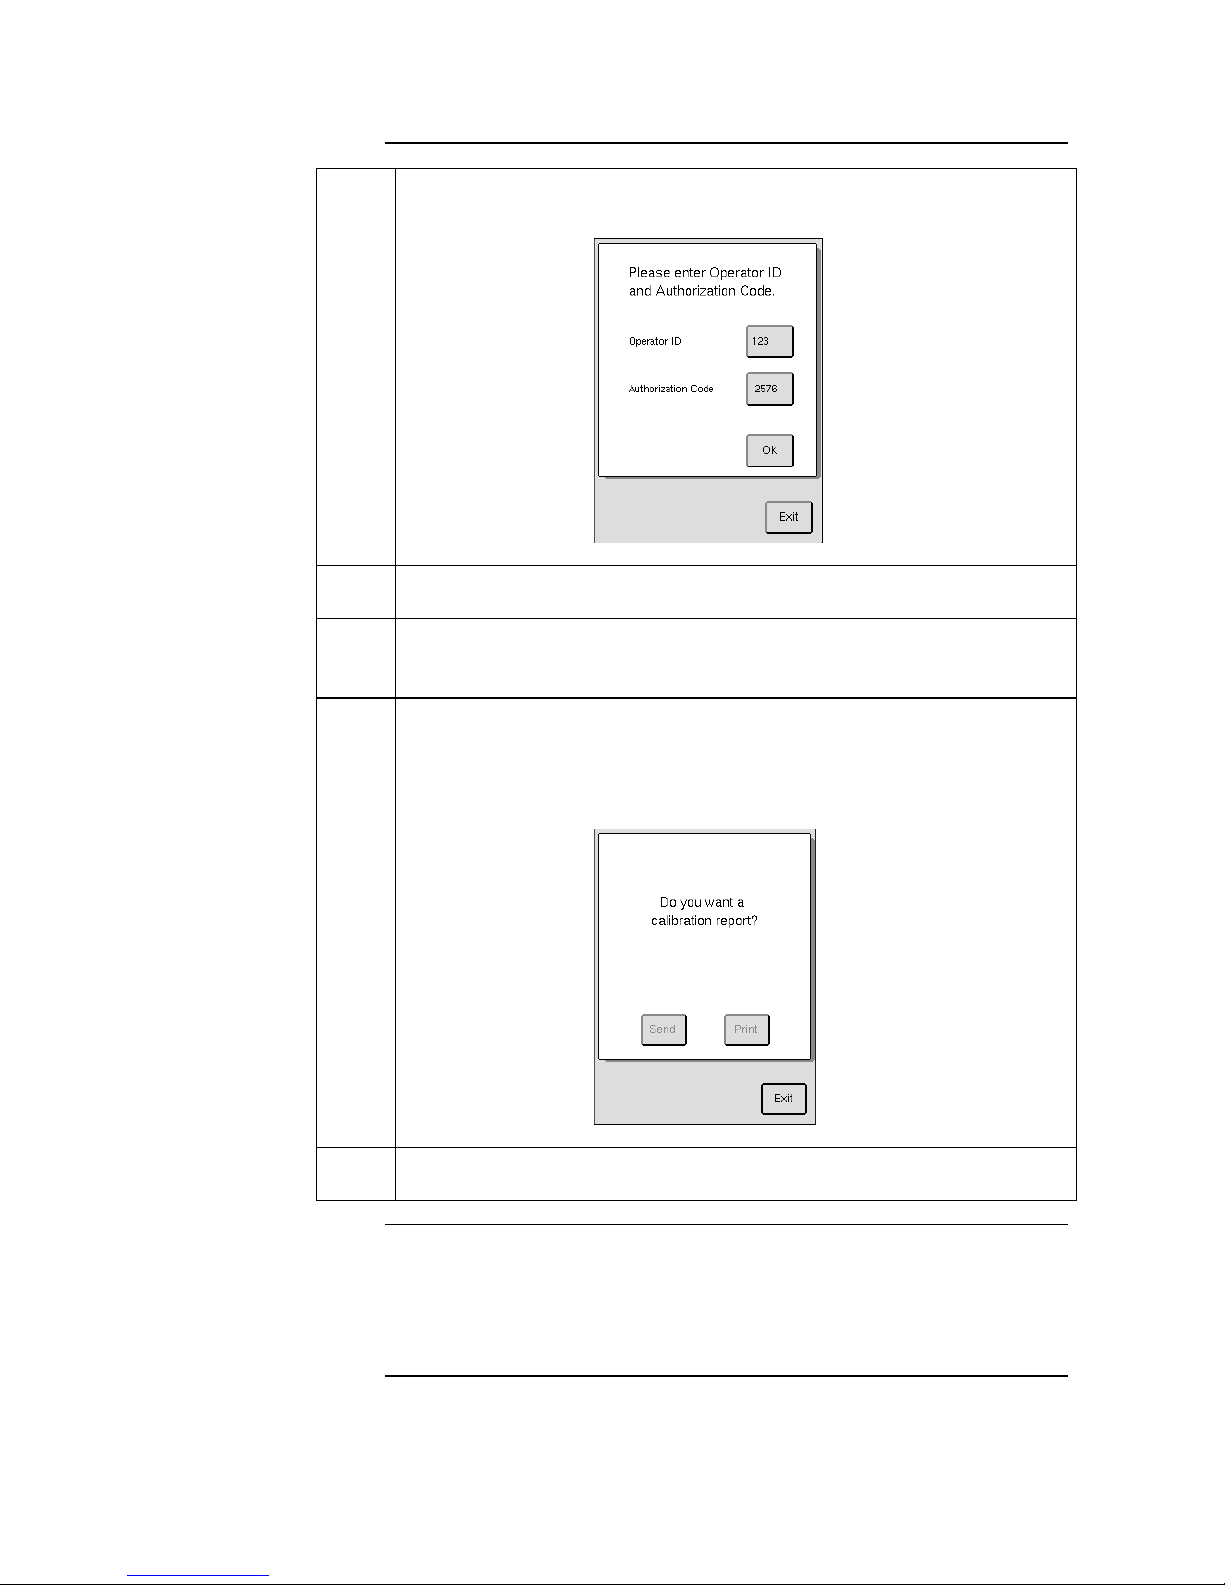
62
7.2 Calibration (continued)
14
Authorized operator can update or change calibration factor by inputting
the Authorization Code [2576].
Figure 7.3
15
Perform steps 9-12 for RBC, MCV, PLT, HGB, WBC, and MPV
parameters. To move to the next parameter press [NEXT].
16
It is recommended to not change preset calibration factors for RDW%. If
necessary, please contact local distributor or Boule service technician for
procedure.
17
Once parameters are calibrated, press [EXIT] and a screen will be
displayed asking operator if a calibration report is wanted, [SEND],
[PRINT], or [EXIT] can be selected. It is recommended that calibration
reports be printed and archived in case it may be needed for future
reference.
Figure 7.4
18
It is recommended to run controls after calibration to verify that all
parameters have been calibrated correctly. See section 6.1 to perform QC.
Capillary Device
Calibration
To calibrate MPA follow Steps 1-17 above except select
[CALIBRATION] and then choose [CAPILLARY DEVICE] instead of
Whole Blood calibration in Step 6 and use MPA mode for analysis. (See
Section 5.7 for details on capillary device sample analysis.)
Page 64

63
7.2 Calibration (continued)
Pre-dilute Calibration
To calibrate pre-dilute follow Steps 1-17 above except select
[CALIBRATION] and then choose [PREDILUTE] instead of Whole
Blood calibration in Step 6 and use pre-dilute mode for analysis. (See
Section 5.6 for details on pre-dilute sample analysis.)
Closed tube Device
Calibration
The closed tube device is calibrated with the calibration of the Open Tube
inlet. However, if the same systematic differences are seen on RBC, HGB,
WBC, and PLT when analyzing blood in the closed tube device compared
to the open tube, a calibration factor can be calculated. This method
should only be used with instruction from local distributor or authorized
service technician.
Note
DO NOT use Cap Piercer mode to aspirate calibrator.
Page 65
64
Section 8: Cleaning, Maintenance & Transport
Section Overview
Introduction
This section contains information that is crucial for maintaining, transporting
and storing the Medonic M-Series.
Contents
This section contains the following topics.
Topic
See Page
Daily Cleaning
64
Monthly Cleaning
65
Six (6) Month Cleaning
66
Re-location of instrument (within the laboratory)
67
Short Term Shutdown (<12h)
67
Re-packaging and Long Term Transport
68
Permanent Shut-Down and Storage
69
Disposal Information
69
8.1 Daily Cleaning
Description
The majority of the instruments cleaning procedures are automated to keep the
user maintenance to an absolute minimum.
Warning
Always use gloves when in contact with potentially biohazardous materials or
parts of the instrument that might be contaminated with blood.
Cleaning
Procedure
The Daily Cleaning takes only a few minutes, the instructions are as follows:
Step
Action
1
Clean the aspiration and pre-dilute probes using an alcohol wipe.
2
Remove possible traces of salt crystals or blood at the top of the
aspiration and pre-dilute probes, probe rinse cup, and around top of
sampling device probe inlet (if applicable) using a paper tissue with
a disinfecting solution.
Page 66
65
8.2 Monthly Cleaning
Description
This section describes the cleaning procedure to be used to secure the correct
function of the instrument on a monthly basis.
Cleaning
procedure
The Monthly Cleaning procedure takes approximately 10 minutes, instructions
are as follows:
Step
Action
1
Clean the aspiration probes using an alcohol wipe.
2
Fill a cup with 10 ml 2% hypochlorite (Bottle # 2 from Boule Cleaning Kit) and one
cup with 18 ml diluent. (Recommend use of dispense function for obtaining diluent,
see Section 5.5: Dispense Function.)
3
Aspirate the hypochlorite as a pre-dilute sample.
4
Run 2 blank samples by aspirating diluent as a pre-diluted sample.
5
Perform a background check, in pre-dilute mode, to verify all values are within range.
See Section 5.3 for more details.
Clot Prevention
This process will decrease the risk of debris material building up in the
instrument system. This should be performed at least once a month or every
1000 samples. This procedure will take 15 minutes to complete.
Important
Once this procedure is started the operator will be unable to abort the cycle
until it is completed.
Prematurely aborted the cycle could cause erroneous patient results if system
is not cleaned properly.
Step
Action
1
Fill a small container with 5 ml of Enzymatic Cleaner (Bottle #1 from Boule
Cleaning Kit).
Note
If system has the optional Cap Piercer or Sampling Device, fill a CLEAN standard
4.0 – 5.0 ml tube half full with Enzymatic Cleaner.
2
From Main Menu press [ADVANCED], then [MAINTENANCE] and then press
[CLOT PREVENTION].
3
For Cap Piercer: Place filled cleaner tube into cap piercer, same as a normal
sample analysis, close the door, and go to Step 4.
For Sampling Device: Place filled cleaner tube into Position 1 on wheel, lock
wheel into place, and go to Step 4.
4
Hold the container (with cleaner) under the OT probe, submerged in cleaner, press
[OK] to confirm. Do not remove container (with cleaner) for at least 5 seconds after
aspiration has stopped. (This is important as Cap Piercer and Sampling Devices will
take a few extra seconds to perform aspiration before the OT begins to aspirate.)
5
The system will then perform the cleaning process for all analysis modes
simultaneously, and upon completion instrument is ready for next analysis.
6
Perform a background check to verify all values are within range. See Section 5.3 for
more details.
LCD Display
When necessary, gently clean the display with a soft cloth, slightly moistened
with water and a mild soap. Dry carefully.
Page 67
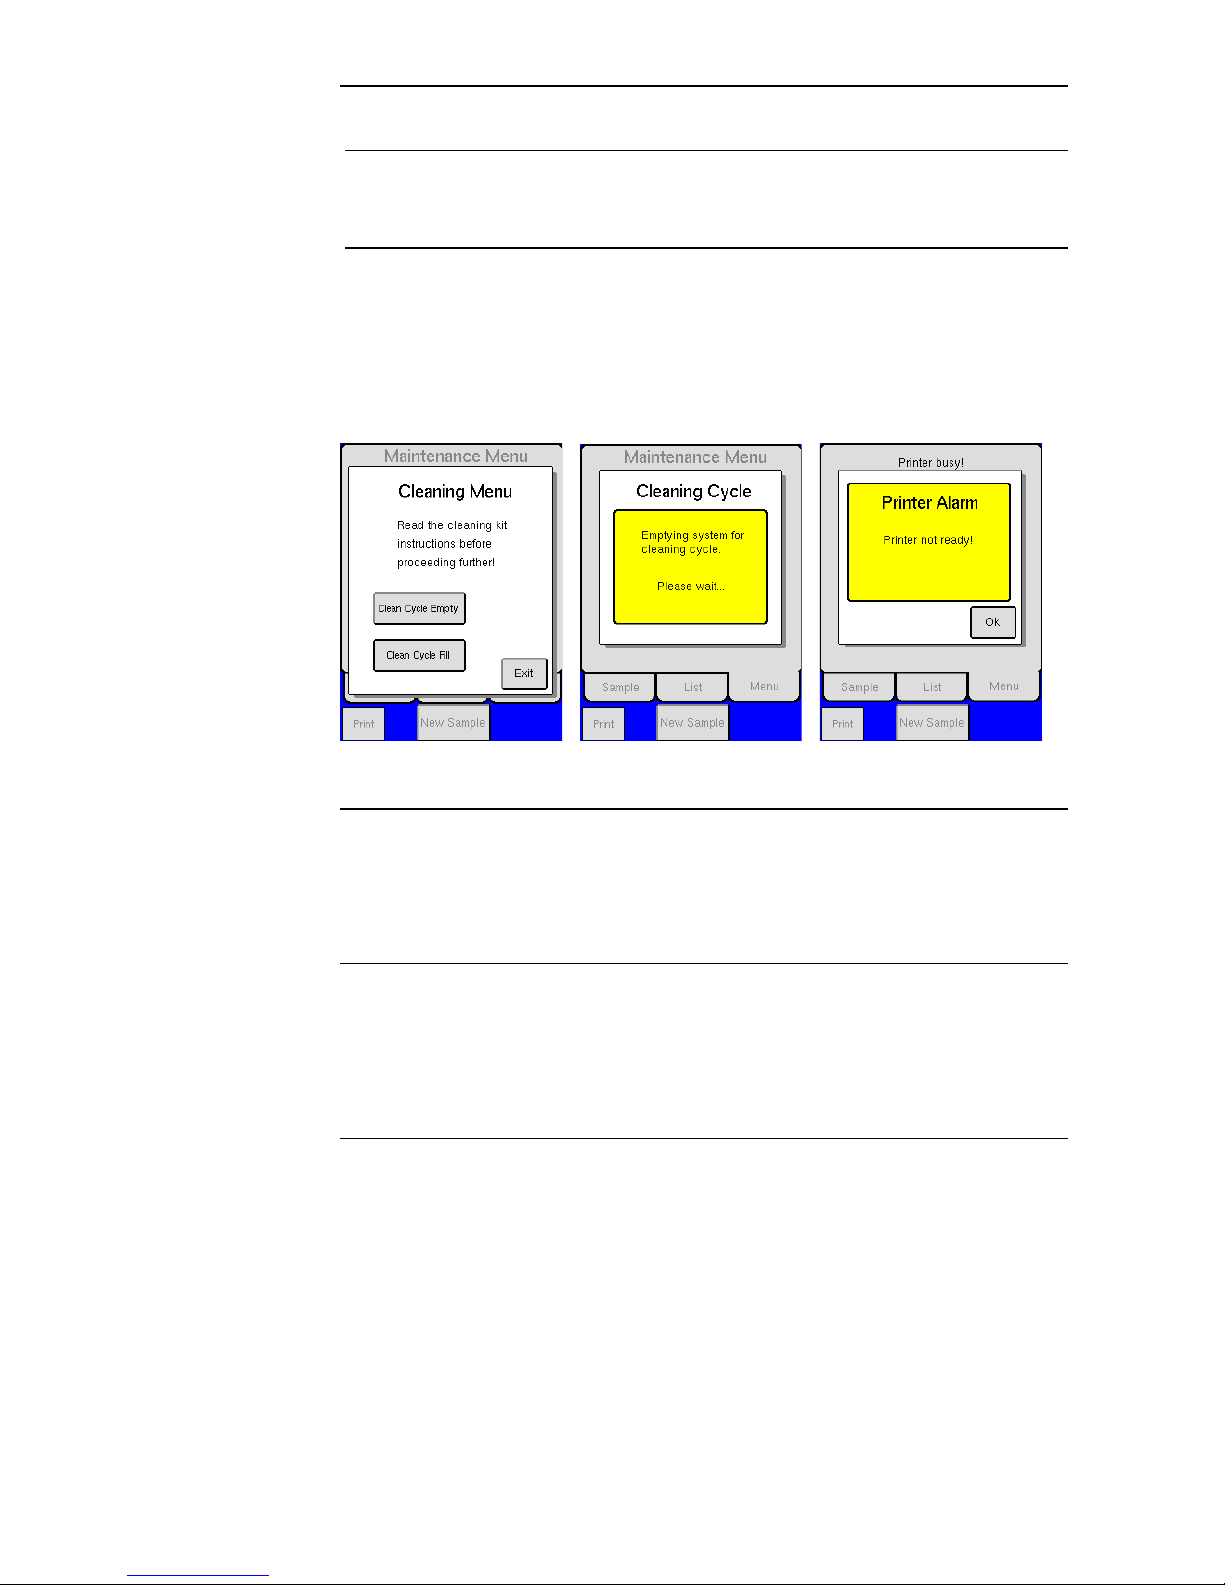
66
8.3 Six (6) Month Cleaning
Description
To increase the life of internal tubing in the instrument, the following cleaning
procedure is strongly recommended.
Cleaning
Procedure
Press [ADVANCED] from Main menu, then press [MAINTENANCE], and
then press [CLEANING MENU] to enter the Cleaning Menu.
Follow the instruction for the Boule Cleaning kit to clean the instrument.
(Instructions for use are supplied with the Boule Cleaning kit solutions).
The Six Month Cleaning procedure takes approximately one hour and 15
minutes to complete.
Figure 8.1 Figure 8.2 Figure 8.3
Boule Cleaning
Kit
The Boule Cleaning Kit contains the following items:
Enzymatic cleaner (Bottle #1)
Hypochlorite (2%) (Bottle #2)
Detergent cleaner (Bottle #3)
Cleaning
Interval
Depending on daily sample analyses, it is recommended that the following
cleaning intervals be followed:
Less than 50 samples/day = every six months
More than 50 samples/day = every three months
100 – 200 samples/day = every month
Page 68

67
8.4 Re-location of instrument (within the laboratory)
Description
This section describes the procedure performed to move the instrument over
very short distances. (From table to table).
Before the relocation
If the analyzer is in “standby” mode do not unplug analyzer. Make sure that the
analyzer is in Sample or List menu before turning off.
Step
Action
1
Do not detach the reagent level sensors or waste tubing, place the sensors on top of
the instrument when moving. (Avoid reagent level sensor contact.)
2
Remove the waste tubing from waste container or drain, but do not detach tube from
analyzer.
3
Disconnect all electrical connections.
Re-location
Make sure that the instrument is lifted from beneath to avoid unnecessary
stress on the front cover.
After re-location
Step
Action
1
Place the waste tubing in waste container or drain.
2
Reconnect the electrical connections.
3
Insert the level sensors back into the reagent containers.
4
Power on unit.
5
Perform Prime.
6
Verify Background.
7
It is recommended that the performance of the Medonic M-series system is checked
with certified blood controls authorized by Boule.
8.5 Short Term Shutdown (<12h)
Description
This section describes the procedure when transporting or shutting down the
instrument for a shorter period of time (< 12 hours).
Empty System
Step
Action
1
Remove the reagent level sensors from the reagent containers.
2
Press [ADVANCED] button on MENU tab.
3
Press [MAINTENANCE] and then [EMPTY SYSTEM].
4
When empty procedure is complete, the following statement will appear on screen:
‘System is empty and ready for fill or power off.’
5
Switch off power and then unplug analyzer.
Before the relocation
After instrument is powered off, detach reagent level sensors, waste tubing, all
electrical connections, and sample wheels (if applicable). Package all
components carefully for transport.
Page 69
68
8.5 Short Term Shutdown (<12h) (continued)
Guidelines for
transport
The instrument should be transported in temperature conditions between 5
to 32 ºC (41 to 90 ºF)
Humidity should be less than 80%.
8.6 Re-packaging and Long Term Shutdown (>12h)
Description
This section describes the procedure when transporting or shutting down the
instrument for a longer period of time (>12 hours).
Important
It is very important to follow the below instructions for preparing the
analyzer for long term transport or re-packaging, to avoid erroneous results
upon re-installation.
The main difference between Section 8.5 and 8.6 is the importance of
cleaning the instrument with the Boule cleaning kit and distilled water, prior
to re-packaging to avoid contaminates.
Long term Shut-Down
Step
Action
1
Select [EMPTY SYSTEM] from MAINTENANCE Menu. See Section 8.5
“Short Term Shutdown” for emptying instructions.
2
Remove the reagent sensors from the reagent containers and follow the
instructions for the Boule cleaning kit. (Instruction is supplied with the Boule
cleaning kit solutions).
3
After completing the cleaning of the instrument, insert the reagent level sensors
into distilled water. Select [CLEAN CYCLE FILL] from CLEANING Menu.
4
When the instrument has been filled with distilled water select [CLEAN
CYCLE EMPTY] from CLEANING Menu.
5
When system is emptied, disconnect the main supply cable and other
connections such as reagent sensors and waste tubing.
6
If transporting instrument, pack securely using the original shipping container.
7
Mark the container with DELICATE INSTRUMENT, FRAGILE and THIS
SIDE UP.
8
Follow Guidelines for transport below.
Guidelines for
transport
The instrument in its export package should fulfill the following transport/storage
conditions:
Does not exceed – 40°F (– 40°C) for ≥ 24 hours.
Does not exceed a Dry heat of + 158 °F (70°C) for ≥ 24 hours.
Dramatic change of temperature between – 40°F (– 40°C) and + 86°F (30°C).
Does not exceed a Damp heat steady state of 90% RH and + 104°F (40°C)
during 48 hours.
Does not exceed a Damp heat cyclic of 90-100% RH and +77°/+104°F
(+25°/+40°C) 12+12 hours.
Page 70
69
8.7 Permanent Shut-Down and Storage
Permanent ShutDown and Storing
See Section 8.6 Long Term Transportation.
8.8 Disposal Information
Description
Customers are advised to be knowledgeable of applicable local, state and
federal requirements, and the content of effluent streams, before disposing of
waste in public sewer systems or recycling decontaminated equipment.
Disposal
Materials
Used reagents
Reagents mixed with potentially biohazardous material
Instrument and instrument components
Controls and calibration material
Manufacturer
Guidelines for
waste products
Place the instrument close to a waste container or drain suitable for disposal
of used reagents.
Check that the drainage is suitable for disposal of chemical and biological
waste.
Check that the waste tubing is securely fastened in the drain.
Mandatory Action
Always use protective gloves when working with the waste container, waste
tubing and when in contact with potentially biohazardous materials.
Instrument decontamination and disposal
The European Directive 2002/96/EC on Waste Electric and Electronic
Equipment (WEEE) aims to minimize the impact on the environment by
prevention of waste. The Medonic M-Series hematology analyzer has been
labeled with the WEEE symbol (as given in the margin) and there is a
procedure to allow waste collection and recycling of the equipment at the end
of it’s life cycle.
Important
The instructions for decontamination can be found on the Medonic home
page www.medonic.se under User Support.
If there are any question on how to follow this procedure, contact your
local distributor for more information.
Warning
The analyzer should be considered as infected and the end user must follow a
decontamination procedure before it is safe to hand over to a recycler.
Page 71

70
Section 9: Parameter and System Information
Messages
Section Overview
Introduction
The Medonic M-Series has several parameter and system information
messages related to the measured parameters and the instrument. These
messages alert the operator of possible pathologic samples and parameter
value and instrument errors.
Contents
This section contains the following topics:
Topic
See Page
Out-of-Range and Information Message Indicators
70
System Information Messages
71
Parameter Limitations of Blood Cell Counters
73
9.1 Out-of-Range and Information Message Indicators
Description
The instrument has several out-of-range, parameter, system information
messages related to the measured parameters and the instrument. The messages
are shown on the display and printouts.
Out-of-Range
Indicators
A parameter that is outside the “Normal Range”, refer to Section 4.5 for
User Interface setup, is either marked with “H” or “L” on the printout and
display to indicate if the value is higher or lower than the pre-set “Normal
Range” values.
#### indicates an out of displayed range parameter, the count is too high or
too low to measure. If it is expected that the parameter is too high, the
sample can be diluted and rerun, and then the dilution factor can be
multiplied with the result to calculate the correct value.
A parameter that is out of the “Linear range”, refer to Section 11.3 “Linear-
Regression and Linear range” is either marked with BL or AL on the
printout and displayed to indicate if the value is higher or lower than the
linear range.
Description of
System
Information
Indicators
For System Information Messages, the touch screen’s i-button becomes active
when a message is present. The user has the preference to access this
information detail by either touching the i-button on the touch screen or
reviewing the printout. System Information Messages are outlined in detail
below.
Abnormalities
Follow your laboratory’s protocol for verification on all samples with anomalies
and /or abnormal distributions signaled by the instrument. Pathological cells
may vary in their stability towards lysing of their cytoplasmic membranes
Page 72
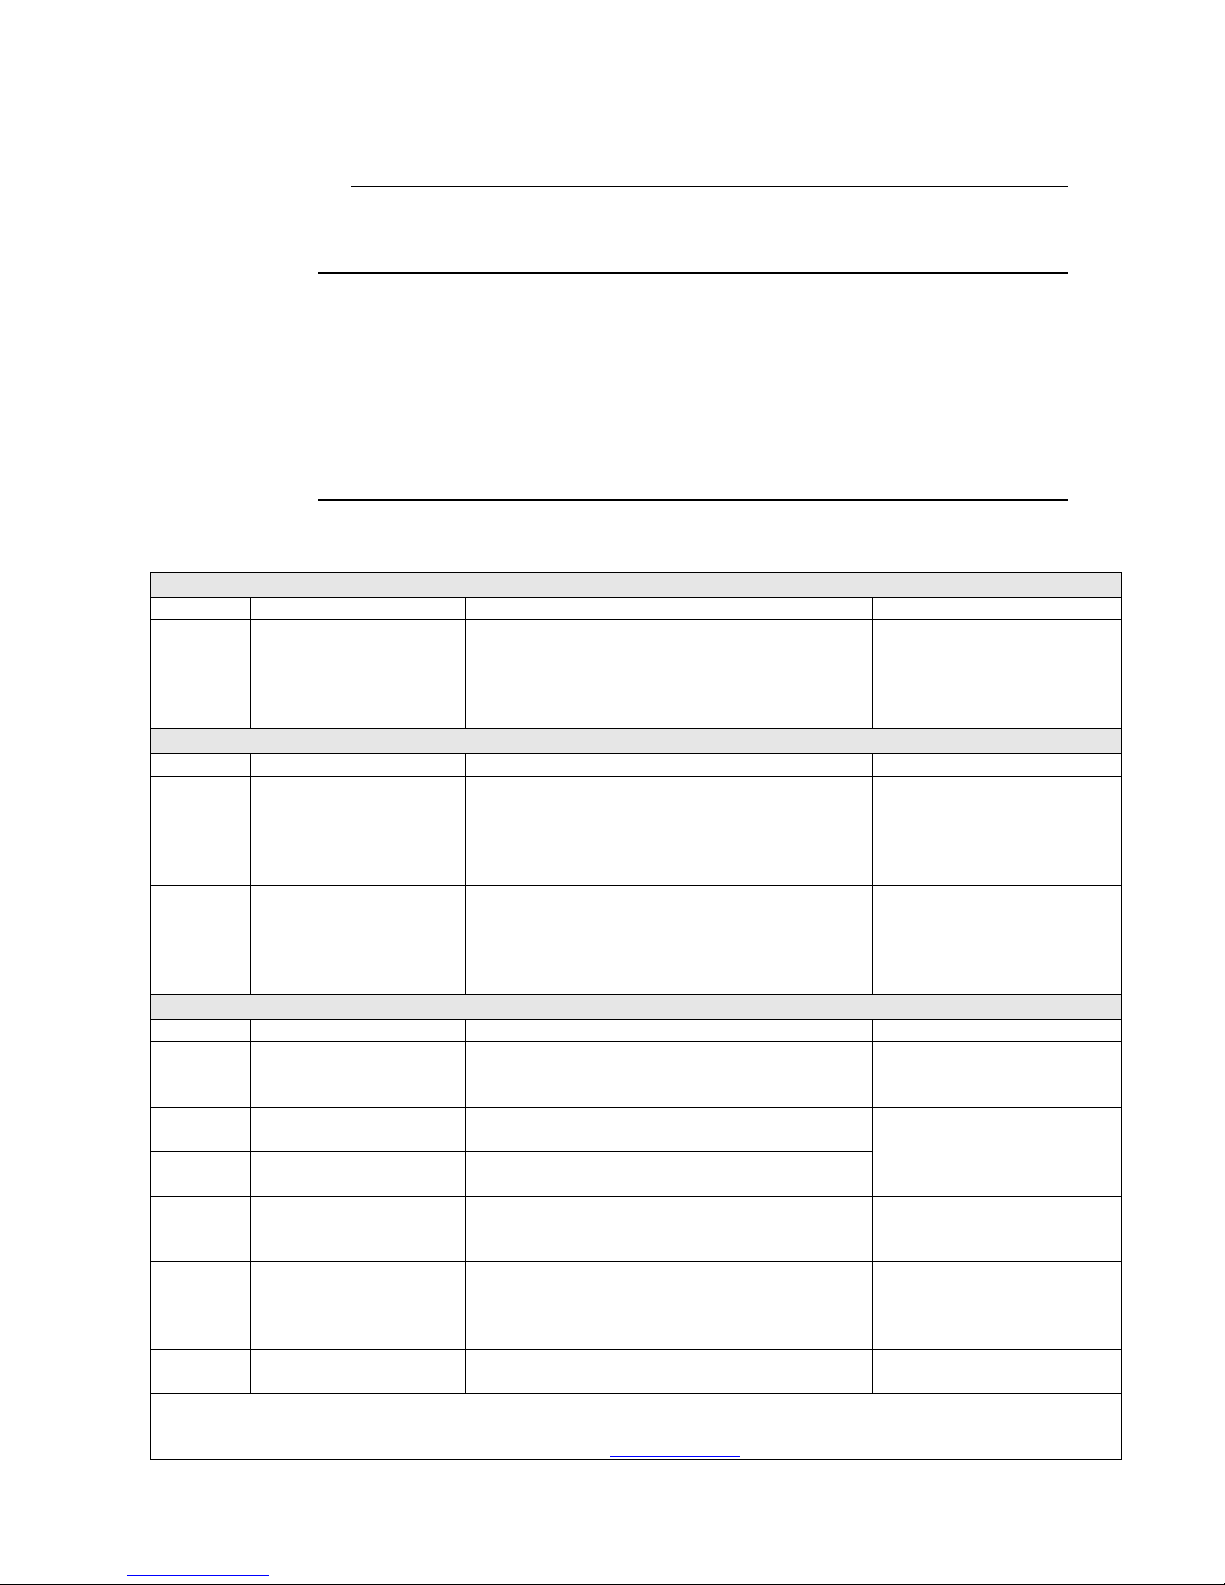
71
compared to normal cells, which may cause aberrations in the automated
analysis. This also applies to the presence of normal non-pathological cells that
have been subjected to chemotherapy or other treatments.
9.2 System Information Messages
Description
The system software monitors a number of analytical and system functions and
will display information that indicates the possible attention of the operator. This
information will alert the operator to check the system or sample or institute
selected troubleshooting procedures. This information is presented on the touch
screen as a code next to one or more parameters. Additional detail and
recommendations may be accessed by either pressing the i-button on the touch
screen or reviewing the printed report.
System Information Messages
Aspiration Indicators (Sample Probe)
Indicator
Message
Description
Action
AF
Aspiration failed, check
sample
Possible reasons for AF flag include a short
sample, clogging or air bubbles in sample tube.
Note: This flag is also displayed when running a
background count (blank) without selecting the
background analysis profile.
Check profile type is correct
and then re-analyze sample.
Distribution Indicators (RBC, PLT, WBC)
Indicator
Message
Description
Action
DE
Small particle
interference; re-analyze
The size distribution of the cell pulses departs from
the expected one. Possible reasons might be
pathological blood sample (e.g. nRBCs), PLT
clumps, air bubbles, electrical disturbances,
incomplete lysing or incorrect gain setting.
Re-analyze sample.
FD
RBC/PLT: Irregular
Distribution, re-analyze
It was not possible to find the correct position for
the floating RBC/PLT distribution curve. This flag
often occurs on low PLT counts. The FD flag
should only be reported if the corresponding
parameter (PLT) value is high enough.
Re-analyze sample.
HGB Indicators (HGB)
Indicator
Message
Description
Action
HF
HGB Measuring Problem
– run prime cycle
The instrument detected a problem during the
filling of liquid in WBC counting chamber during
HGB blank.
Run a “Prime cycle”, before
re-analyzing the sample.
HH
HGB Measuring Problem
– run prime cycle
The HGB blank or sample readings reported a too
high light level.
Run a “Prime cycle”, before
re-analyzing the sample.
HL
HGB Measuring Problem
– run prime cycle
The HGB blank or sample readings reported a light
level that was too low.
HN
HGB Measuring Problem
– wait one minute then
re-analyze
The HGB sample reading reported more light than
the blank reading. This gives a negative HGB
value.
Wait one minute, and then reanalyze sample.
HO
HGB Measuring Problem
– restart system
The HGB dark (offset) reading reported a light
level that was too high or too low.
Switch off the analyzer and
switch it back on after 3
seconds, and then re-analyze
sample.
HS
HGB Measuring Problem
– run prime cycle
Individual HGB readings vary too much.
Run a “Prime cycle”, before
re-analyzing the sample.
Note: If various HF, HH, HL, or HN Indicators repeatedly appear check High Altitude Compensation, mode may need to be
changed to Moderate or Maximum compensation in higher elevations. A more detailed description can also be found in the
User Definable Settings document, which can be located at www.medonic.se > Support > Downloads > Public > Documents.
Page 73
72
Out-of-linear range indicators (WBC, HGB, RBC, PLT)
AL
AL – Result is above
linearity
The result is above linear range.
The sample can be diluted
and rerun, and then the
dilution factor can be
multiplied with the result to
calculate the correct value.
BL
BL – Result is below
linearity
The result is below linear range.
Re-analyze sample.
Measuring Chamber Indicators (RBC, PLT, WBC)
Indicator
Message
Description
Action
OR
Measurement warning –
re-analyze
The cell pulses arrived faster than the analyzer
could process them. Possible reasons might be air
bubbles, electrical disturbances or incomplete
lysing.
Note: Filtered away cell pulses might raise the OR
flag, so it might not be possible to see them in the
histograms or the result parameters. This is a hard
limit determined by the software.
Re-analyze sample
SE
Measurement Statistics
Warning; re-analyze
The rate of cell pulses per time unit varies too
much. Possible reasons might be clogging, air
bubbles, electrical disturbances or difficult to lyse
cells.
Note: Filtered away cells might raise the SE flag,
so it might not be possible to see them in the
histograms or the result parameters.
Re-analyze sample
Mixing Beaker Indicators (RBC, PLT, WBC)
Indicator
Message
Description
Action
TE
Liquid System Problem –
run prime cycle
The analyzer detected an abnormality during the
emptying of the first dilution from the mixing
beaker. Reasons for flagging might be timeout, or
too short of a transfer time.
Run a “Prime cycle”, before
re-analyzing the sample.
Reagent and Control Indicators (RBC, PLT, WBC, LYM/MID/GRAN)
Indicator
Message
Description
Action
EC
Expired control
A control blood was used past its expiry date.
Use a fresh blood control
ER
Expired Reagent
The reagent was used past its expiry date. Change
to a non-expired lot of reagent.
Use a new lot of reagents
NR
Not enough reagent left,
check reagent levels
The analyzer’s capacity counter has gone below
zero and no reagent is detected. Reason for no
reagent may include empty reagent container or
reagent level sensor not inserted correctly into
reagent container.
Check reagent levels
Reagent Pipette Indicators (RBC, PLT, WBC)
Indicator
Message
Description
Action
DF
Diluent system problem
– run prime cycle
The instrument detected an abnormality during one
of the fill cycles of the diluent pipette. Reasons for
flagging might be timeout, short time or bubbles at
the upper detector.
Verify instrument is filled,
run a “Prime cycle” and then
re-analyze sample.
DP
Diluent system problem
– run prime cycle
The instrument detected an abnormality during one
of the empty cycles of the diluent pipette. Reasons
for flagging might be timeout, short time or liquid
not detected at the lower detector.
LF
Lyse system problem –
run prime cycle
The instrument detected an abnormality during the
fill cycle of the lyse pipette. Reasons for flagging
might be timeout, short time or bubbles at the
upper detector.
LP
Lyse system problem –
run prime cycle
The instrument detected an abnormality during the
empty cycle of the lyse pipette. Reasons for
flagging might be timeout, short time or liquid not
detected at the lower detector.
Reagent Pipette Indicators (RBC, PLT, WBC)
Indicator
Message
Description
Action
Page 74
73
ST
Air bubbles – run prime
cycle
The time for the liquid meniscus to pass from the
lower to the upper detector is unreasonably short.
Run a “Prime cycle”, before
re-analyzing the sample.
TB
Air bubbles – run prime
cycle
Air bubbles were detected by the start detector in
the measuring tubes.
TL
Possible orifice blockage:
Run prime cycle and then
re-analyze
The liquid meniscus in the measuring tube never
passed the lower detector.
TU
Possible orifice blockage:
Run prime cycle and then
re-analyze
The liquid meniscus in the measuring tube passed
the lower detector but never passed the upper one.
WBC Differential Abnormalities (LYM, MID, GRAN)
Indicator
Message
Description
Action
BD
WBC DIFF: High
interference between
populations.
The calculated populations for LYM, MID, GRAN
overlap too much. Often in pathological samples
with granulocytosis or lymphocytosis a blood
smear is recommended.
Blood sample too old or
pathological sample. Follow
laboratory’s protocol for
verification of results.
NM
WBC DIFF: No WBC
population found; slide
review advised.
There was no mode in the WBC distribution
between the LYM-L and GRAN-H settings.
OM
WBC DIFF: Only one
WBC population found;
slide review advised.
There was only one mode in the WBC distribution
between the LYM-L and GRAN-H settings. Often
in pathological samples with granulocytosis or
lymphocytosis a blood smear is recommended.
TM
WBC DIFF: Too many
WBC population found;
slide review advised.
There were more than two modes in the WBC
distribution between the LYM-L and GRAN-H
settings.
9.3 Parameter Limitations of Automated Blood Cell Counters
Description
This section describes the different factors that may interfere with HCT, HGB, MCV,
MPV, PLT, RBC, RDW, WBC and WBC differential determination.
HGB Limitations
Turbidity, in the blood sample, due to any number of physiological and/or therapeutic factors may produce falsely
elevated HGB results. The instrument however, is compensated throughout the linear range of the instrument.
Limitation
Description
Unlysed Red
Blood Cells
Increased turbidity may be seen in cases where the red blood cells are resistant to lysing.
This condition will cause a falsely elevated HGB result but can be detected by monitoring
the MCHC.
Leukocytosis
Extremely elevated WBC may produce falsely elevated HGB results due to turbidity. In case
of extreme WBC counts, the following is recommended: The diluted sample should be
centrifuged and the supernatant fluid checked on a spectrophotometer for turbidity.
Lipemia,
hyperproteinemia
and
hyperbilirubinemia
Elevated lipids in the blood sample will give the plasma a “milky” appearance which may
disturb the spectrophotometric measurement of HGB. Similar problems may occur with
hyperproteinemia (high protein concentration) and hyperbilirubinemia (high bilirubin
concentration). Accurate HGB determination can be achieved by using reference methods
and a plasma blank.
Fetal blood
The mixing of fetal and maternal bloods may produce a falsely elevated HGB value.
Continued on next page
Page 75
74
9.3 Parameter Limitations (continued)
MCV / HCT Limitations
As HCT is the product of MCV x RBC, any erroneous result in MCV and/or RBC will produce an equal error in
the HCT parameter.
Limitation
Description
Red Blood Cell
Agglutination
Agglutination of RBC may produce an erroneous MCV value and therefore a false HCT.
WBC
An excessive number of WBCs might cause interference within the RBC population and
therefore a false MCV value.
Thrombocytosis
(elevated PLT)
Excessive numbers of PLT, in most cases, do not interfere with the MCV parameter due
to the use of the floating discriminator technology in the instrument.
PLT Limitations
Measurement of low PLT levels may be influenced by circulating RBCs, which may cause falsely high results.
Measurement of high PLT levels is influenced by coincidence factors (e.g. counting of two cells as one) which
may produce falsely low results. The instrument is compensated for these effects by separate algorithms to
produce linearity ranges according to the specifications
Limitation
Description
Microcytosis (small
RBC, low MCV)
Very small RBCs might falsely elevate a PLT count and affect the MPV. This effect is
minimized in the instrument due to the use of a floating threshold (discriminator). By
observing the PLT and RBC histograms, this effect is seen as an overlapping PLT/RBC
area.
Agglutinated RBCs
Agglutinated RBCs might trap platelets and may give an erroneous low PLT count and
affect the MPV. The presence of agglutinated RBCs is detected by monitoring the
MCHC parameter and by careful examination of the stained blood film.
Giant platelets in
excessive numbers
This may cause a low PLT count since they might fall within the RBC threshold range.
Chemotherapy
Cytotoxic and immunosuppressive drugs may increase the fragility of these cells, which
may cause low PLT counts. Reference (manual) methods may be necessary to obtain an
accurate platelet count.
Hemolysis
Hemolyzed specimens contain red cell stroma, which may elevate platelet counts.
A.C.D. blood
Blood anti coagulated with Acid Citrate Dextrose may contain platelet aggregates,
which could depress the platelet count.
RBC inclusions
Erythrocyte inclusions may also produce a spuriously increased platelet count. (e.g.
Howell-Jolly bodies, siderotic and basophilic granules)
Platelet agglutination
Clumped platelets due to poor collection techniques or platelet satellitosis caused by
EDTA activation of immunoglobulins may cause a decreased platelet count and/or an
elevated WBC count. The specimen should be recollected in sodium citrate
anticoagulant and re analyzed for only the platelet count. The final PLT result must be
corrected for the sodium citrate dilution effect.
MPV Limitations
Limitation
Description
Giant platelets
Large platelets counted as RBCs will fall outside the PLT range and therefore lower the
MPV.
Small erythrocytes
Very small RBCs might fall into the PLT region and might be counted as PLTs and
therefore influence the MPV parameter.
Agglutinated
erythrocytes
This may trap platelets and therefore affect the MPV parameter. Note that agglutinated
erythrocytes may be detected by carefully examine the MCHC parameter and/or the
stained blood film.
Chemotherapy
May also effect the size of the PLTs.
EDTA
Note that all samples collected in EDTA will not maintain a stable MPV. The PLTs will
swell as a function of time and temperature.
Continued on next page
Page 76
75
9.3 Parameter Limitations (continued)
RBC Limitations
The red blood cell dilution contains all the cellular elements of the blood: RBC, WBC, and PLT. Platelets are
not counted since the size falls below the discriminator threshold. Leukocytes are included in the RBC
count, but since the ratio of RBCs to WBCs is approximately 1000:1, the introduced WBC count is almost
negligible. Exceptions are noted below.
Measurement of high RBC levels is influenced by coincidence factors (e.g. counting of two cells as one)
which may produce falsely low results. The instrument is compensated for this effect by an algorithm to
produce a linearity range according to the specifications
Limitation
Description
Leukocytosis with
concurrent anemia
In samples where the WBC is very high and at the same time the RBC is low, the
WBC may cause a false increase in the RBC count. The WBC is always included
in the RBC count, but the contribution is not significant under normal
circumstances. The RBC count may be corrected by simply subtracting the WBC
from RBC.
Agglutinated Red Blood
Cells
This might cause a falsely decreased RBC count. Blood samples containing the
agglutinated red blood cells may be identified by observing abnormal MCH and
MCHC values, as well as by examination of the stained blood film.
Cold Agglutinins
IgM immunoglobulins which are elevated in cold agglutinin disease may lower
RBC and PLT counts and increase the MCV.
RDW Limitations
The red cell distribution width is a function of the RBC count and derived from the RBC histogram. In most
cases, any error introduced in the MCV may also cause the RDW to be erroneous.
Limitation
Description
Blood transfusions
Blood transfusions may raise the RDW significantly due to the presence of bimodal populations.
WBC Limitations
Measurement of high WBC levels is influenced by coincidence factors (e.g. counting of two cells as one)
which may produce falsely low results. The instrument is compensated for this effect by an algorithm to
produce a linearity range according to the specifications.
Limitation
Description
Leukocytosis
WBC in concentrations that exceeds the linearity limits of the system will require
dilution of the blood sample. Re-assaying the diluted sample will help to obtain
the correct assay value.
Nucleated Red Blood
Cells, NRBC
Immature, nucleated red blood cells are large and not lysed like mature RBCs,
thus they will be classified as a WBC and may cause falsely elevated WBC and
lymphocyte results. If the number of the NRBC is sufficient to activate the DE
alarm, such interference will be detected. An overview of a stained blood film
can reveal the presence of NRBCs.
Unlysed Red Blood
Cells
In particularly rare instances, the RBC in the blood sample may not completely
lyse like expected. These non-lysed cells may be detected on the WBC histogram
with a DE alarm, or as an elevated baseline on the side of the lymphocyte
population. Non-lysed RBCs will cause a falsely elevated WBC and lymphocyte
count. (See also NRBC above)
Hemolysis
Hemolyzed specimen contains red cell debris, which may falsely elevate the
WBC and/or PLT count. Hemolysis can be detected by looking at the color of the
plasma in an EDTA-sample that has been allowed to sediment.
Leukemias
This disease state may result in a spurious low WBC count, if the leukocytes are
more fragile than normal and becomes destroyed in the sample. The cell
fragments will also interfere with the WBC differential parameters (LYM, GRAN
and MID). A falsely low WBC count may also be seen in patients with
lymphocytic leukemias due to the presence of abnormally small lymphocytes,
which may not be counted by the instrument.
Page 77
76
Chemotherapy
Cytotoxic and immunosuppressive drugs may increase the fragility of the leukocytes, which may cause falsely low WBC counts.
Cryoglobulins
Increased levels of cryoglobin may cause elevated levels of WBC, RBC or PLT
counts as well as HGB. Cryoglobulins may be associated with myeloma,
carcinoma, leukemias, macroglobulinemia, lymphoproliferative disorders,
metastatic tumors, autoimmune disorders, infections, idiopathic disease,
aneurism, pregnancy, thromboembolic phenomena, diabetes, etc. The specimen
can be warmed up to 37°C and re-analyzed immediately or a manual WBC, RBC
or PLT count can be performed.
Multiple myeloma
The precipitation of proteins in multiple myeloma patients may give falsely
elevated WBC counts.
Large lymphocytes,
atypical lymphocytes,
blasts, and basophils in
excessive numbers
The presence of large or atypical lymphocytes, blasts, or an excessive number of
basophils may interfere with the MID cell area which otherwise consists mainly
of monocytes.
Metamyelocytes,
myelocytes,
promyelocytes, blasts
and plasma cells in
excessive numbers
The presence of excessive numbers of metamyelocytes, myelocytes,
promyelocytes, blasts and plasma cells may interfere with an accurate
granulocyte count.
Lymphocyte count
interference
The lymphocyte count is derived from the WBC count. The presence of
nucleated red cells (NRBC), certain parasites and erythrocytes that are
resistant to lysis may interfere with lymphocyte count.
Page 78

77
Section 10: Technology
Section Overview
Introduction
This section describes the different methods and principles of measurement
and calculations.
Contents
This section contains the following topics:
Topic
See Page
Measuring Principles
77
Counting Time RBC & WBC
78
WBC Differentials
79
Photometric Method – HGB Hemoglobin
80
Parameter Definitions
80
10.1 Measuring Principles
Description
This section describes the measuring principles of the Medonic M-Series.
General
Measuring
Principles
The measuring principles of the Medonic M-Series are based on impedance
and spectrophotometry principles.
Whole Blood
Dilution
The number of cells for determining RBC and WBC values are counted from a
suspension of 1:40,000 for the RBC and 1:400 for the WBC dilution ratio of
whole blood.
Theoretical
Principles
(RBC Example)
If a sample contains 5 million red blood cells per µl, a dilution of 1:40 000
will give a final concentration of 5 million divided by 40,000 = 125 cells per
µl. Each µl containing 125 cells, drawn through the aperture, will generate 125
pulses.
Continued on next page
Page 79
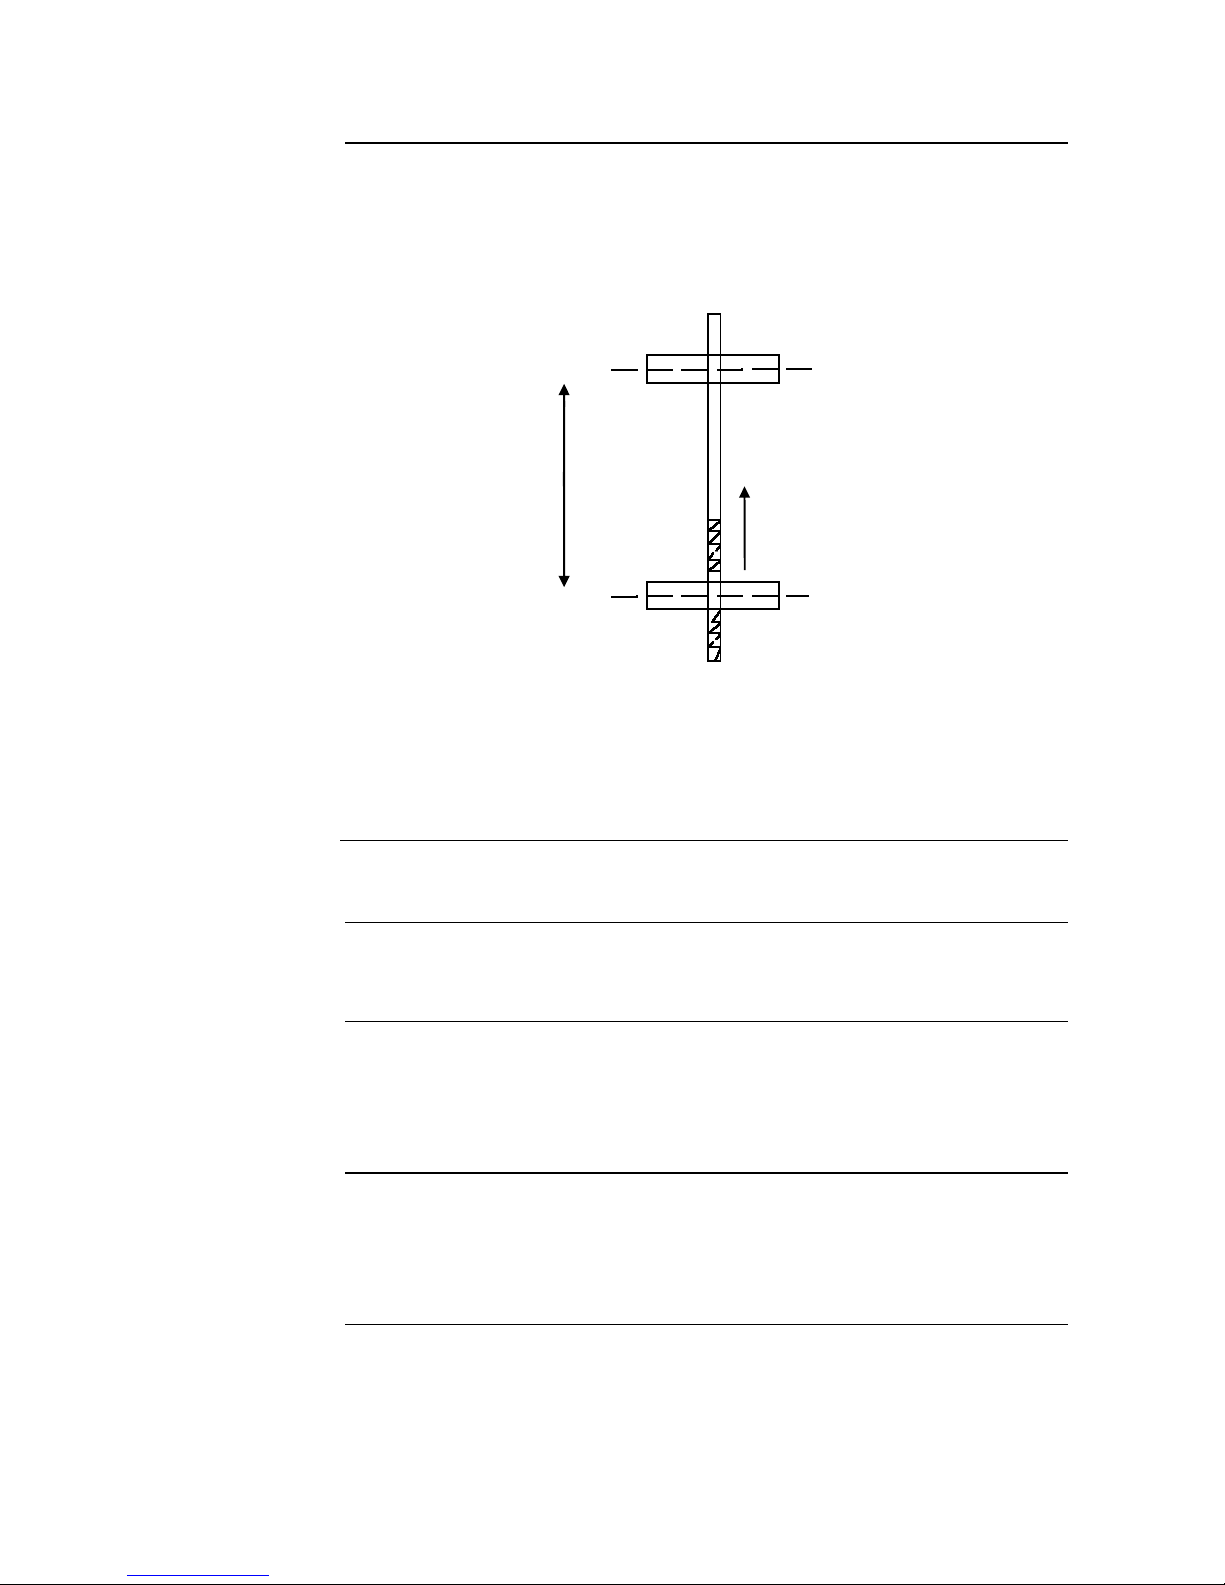
78
10.1 Measuring Principles (continued)
Measured
Volumes
(Example)
The measured volume drawn through the aperture is 270 µl (Manufacturer
calibrated). Based on the assumption made above, the system will count
270*125 = 33,750 pulses, which is equivalent to 5.0x10⁶ cells/µl in the
concentrated blood.
Figure 10.1
Theoretical
Principles
(WBC Example)
The calculation principle for white blood cells is the same but with a
difference in dilution ratio and cell quantity. An example of this could be as
follows: 5,000 cells/ µl diluted 1:400 =12.5.
10.2 Counting Time RBC & WBC
Description
The counting time is defined as being the time needed for the sample to fill the
metering unit from the start to the stop detector.
Counting Time
Limits
The normal counting time limits for the RBC and WBC metering units are
between 13 – 18 seconds and 10 – 13 seconds respectively. If the counting
time is below or exceeds the above mentioned limits, the flag ST, TL or TU
will be displayed.
Note
The ´counting time´ is not related to the actual result. Atmospheric pressure
variations, protein built up within the orifice (aperture) and other secondary
effects that might cause pressure changes will NOT affect the counted
parameters RBC, PLT and WBC.
Start sensor
Stop sensor
Flow
Measured
Volume
Page 80
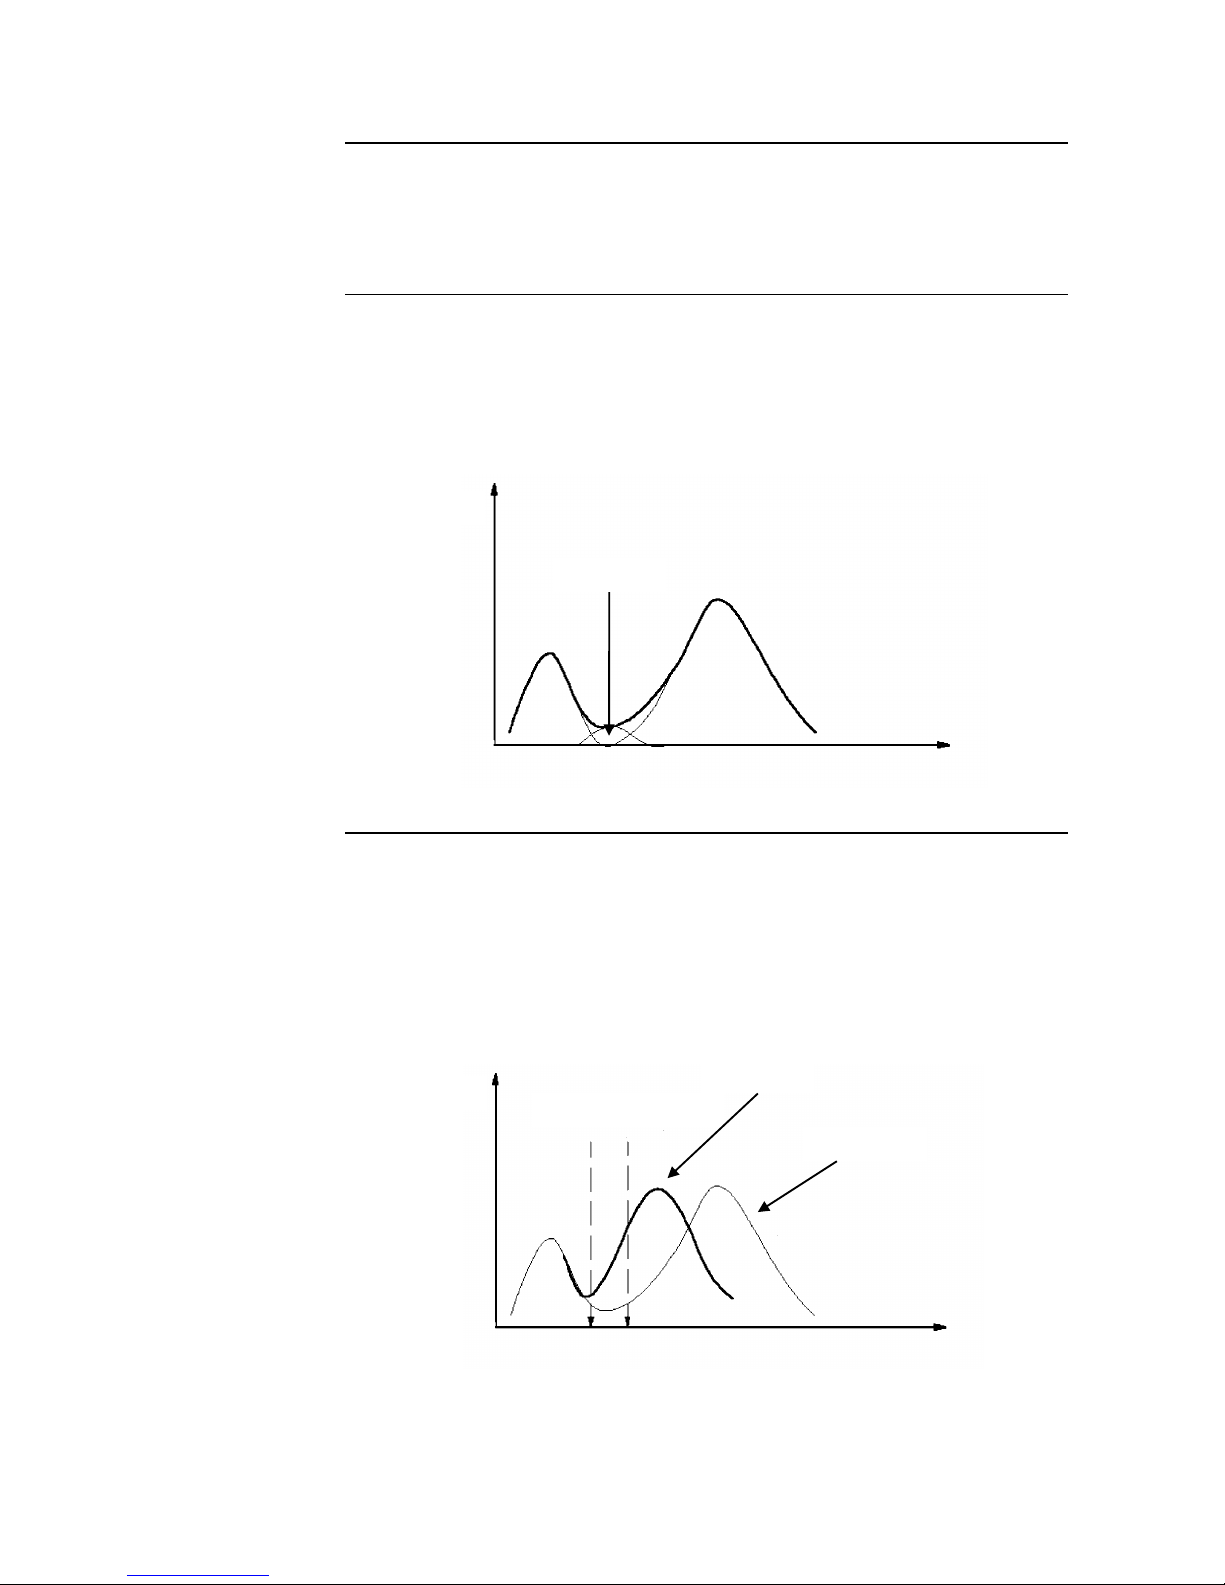
79
10.3 WBC Differentials
Description
The Medonic M-Series uses a floating discriminator technology which
performs a mathematical calculation to estimate the best separation between 3
populations of white blood cells (lymphocytes, granulocytes and mid cell
fractions).
Floating
Discriminator
technology in
general
After the analyzing process, the instrument finds two main modes
(Granulocyte Peak and Lymphocyte Peak) within the total distribution. By
extrapolating the two main population peaks value a third population can be
mathematically calculated. This third population is classified as MID cell area,
which mainly consists of monocytes. See Figure 10.2 below:
Figure 10.2
Differences in
technologies
Some 3-part diff. technologies use a fixed discriminator analogue to separate
the 3 populations. However, as shown in the figure below, as a sample begins
to age, it can clearly be seen that the Granulocyte population is shifting
towards the Lymphocyte population. As the Granulocyte curve moves, the
accuracy of the results will decrease. Whereas, the floating discriminator
system is not dependent on the actual position of the two main populations
and thus overcomes this problem, and provides more accurate results.
Figure 10.3
LYMF
n
GRAN
MID cells
Volume (fl)
n
Fixed discriminators
4 hours old
Fresh” blood
GRAN
Volume (fl)
LYM
Page 81
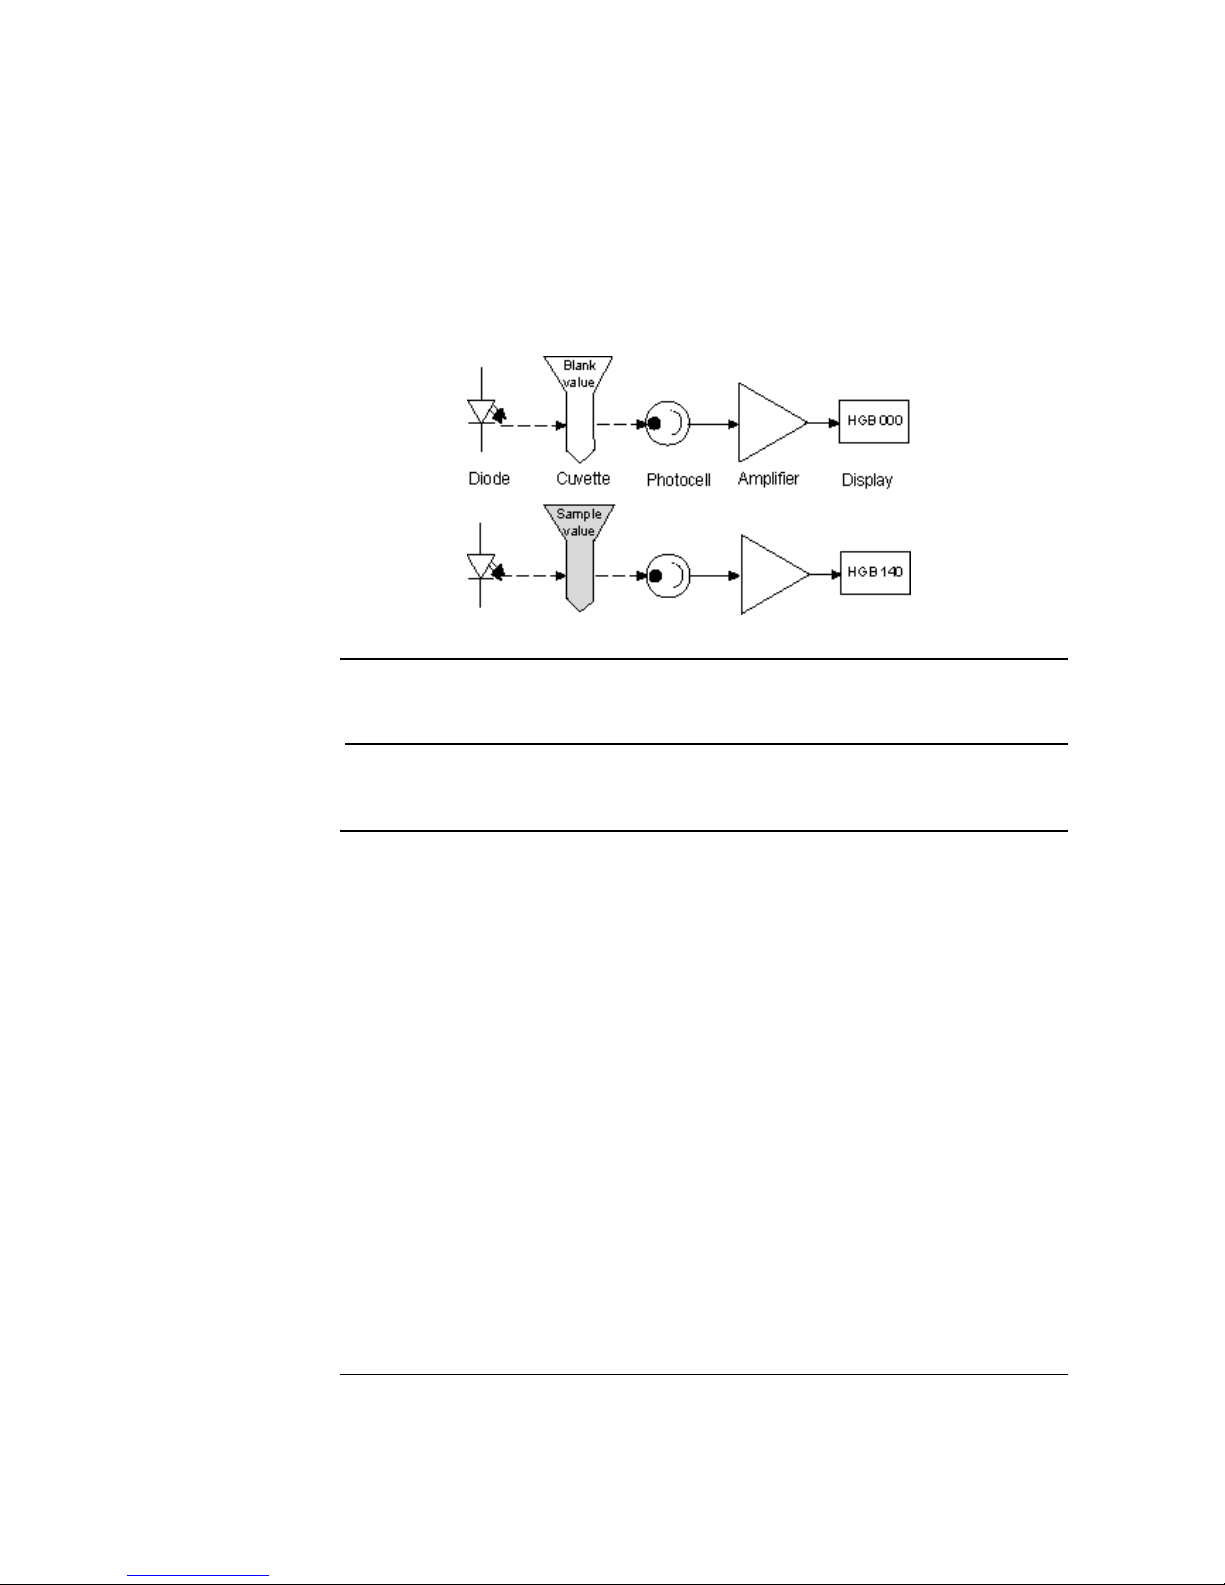
80
10.4 Photometric Method – HGB Hemoglobin
HGB
(Hemoglobin
Concentration)
The hemoglobin is determined from the same dilution as the WBC. For each
sample a blank is measured as a reference, this means that any drift in reagent-,
cuvette-absorption, or diode is eliminated. The photometer system consists of a
photodiode, a cuvette with a length of 15 mm and a filter at a wavelength of 535
nm (bandwidth 20 nm). The HGB readings are slightly corrected for turbidity in
case of extreme WBC counts. The diode is switched off if the instrument is in
standby mode, giving it an extended lifetime.
Figure 10.4
10.5 Parameter Definitions
Description
This section describes the parameter definitions that have not been defined yet in
other sections.
MCV ( Mean
Cell Volume
RBCs)
The MCV parameter is derived from the RBC distribution curve. As the
distribution curve has a maximum volume range of 250fl, the maximum channel
also contains clumps of cells that are larger than this volume. Therefore this
channel is excluded from the MCV calculation. The MCV is calculated from the
volume position of the discriminator to 249 fl. Be aware that the discriminator
might be 'floating' or fixed by the user in the 'Discriminator set-up program'
In general, RBC counts that are lower than 0.60 (displayed value) do not give a
MCV/HCT value due to low statistical significance.
If the MCV is calibrated by using the 'calibration' procedure, in the user manual,
the whole curve is recalculated and moved in a correct way that reflects the new
calibration setting. The printed curve will therefore always be correct in respect to
the actual MCV value.
RDW (Red Cell
Distribution
Width)
The RDW parameter is calculated from the RBC distribution curve. The CV of the
curve is calculated. However, the CV is only calculated on a portion of the curve.
This avoids that other populations might interfere. The RDW value is therefore only
measured on a portion of the RBC size distribution curve. I.e. not all particles are
included in the RDW calculation. The RDW parameter is only valid if the MCV value
is not zero.
HCT
(Hematocrit)
The HCT is defined as being the packed volume of red cells in whole blood and is
calculated through MCV * RBC. If no MCV is derived from a sample due to too low
a number of RBC cells, no HCT is calculated.
Page 82

81
10.5 Parameter Definitions (continued)
PLT (Platelets)
Platelets are defined (for the purpose of discrimination) as cells in a range from
2.5fl to the discriminator level that is either set on a fixed volume or 'floating' and
determined by the software on each sample. The setting of the upper discriminator
is done in the setup menu.
The platelets are determined from the same dilution as the RBC, in fact, the system
is counting just 'cells' during the RBC/PLT counting process. The determination of
which cell is a PLT or RBC is done at the end of the counting procedure and fully
determined by the setting of the user defined discriminator behavior (‘floating’ or
fixed)
Example: Let us suppose that a sample contains 200,000 platelets/µl in whole
blood. After a dilution of 1:40,000 the sample contains 200,000 divided by 40,000
= 5 cells/µl. So, each µl drawn through the aperture gives 5 pulses. As the counting
volume (the volume of the metering glass tube) is 270 µl, the total number of cells
that are analyzed will be 5*270=1350 cells.
In other words, the total number passing through the orifice when determining the
PLT is the value shown on the display screen without decimals multiplied by the
division factor 6.75.
The reproducibility is directly dependent on the total number of cells entering the
orifice.
Measuring PLT from the same dilution as RBC, the CV will be less than 3.5% for
most of the samples within normal range. A 'mean' CV of about 3.2 % is expected
for well-treated fresh EDTA whole blood samples within the range of 250-350
10e3/uL.
As the system uses an orifice size of 80 µm diameter, coincidence losses will take
place with extreme sample RBC/PLT counts. The system has a well-balanced
mathematical correction algorithm for these effects within the software.
Please note that if a floating discriminator is used and no well-defined minimum is
found between the RBC and PLTs the reproducibility of mainly the PLT is
affected. To check the reproducibility of the low PLTs, it might be wise to put the
analyzer in a fixed discriminator mode to exclude any error introduced by a not
well-defined RBC-PLT population.
MPV (Mean
Platelet Volume)
The mean cell volume of the platelets is determined from the PLT size distribution
curve.
The MPV is defined as being the mean value of the PLT size distribution curve
from the lower discriminator (2.5 fl) to the position of the upper discriminator
which can be programmed as 'floating' or fixed.
MPV is not displayed in case of extreme low PLT counts due to high statistical
inaccuracy of such a population.
MCH (Mean Cell
Hemoglobin)
The MCH is a calculated value and is defined as HGB/RBC giving the mean HGB
concentration in the red cells.
MCHC (Mean
Cell Hemoglobin
Concentration)
The MCHC is a calculated value and is defined as HGB/HCT.
The MCHC is calculated from 3 measured parameters and therefore an excellent
instrument stability check. MCHC=HGB/HCT=HGB/(MCVxRBC).
In general it could be stated that if a daily mean value is found outside the range
32-36 g/dl, the instrument has been incorrectly calibrated. The daily mean value of
the MCHC parameter should always be 34.5 +/- 1.5 g/dl.
Page 83

82
Section 11: Specifications
Section Overview
Introduction
This section describes the specifications for the Medonic M-Series and its
parameters.
Contents
This section contains the following topics:
Topic
See Page
General
82
Short List of Specifications
83
Parameter Ranges
84
Reagent and Reagent Consumption
85
11.1 General
Description
This section describes the Medonic M-Series and its parts in general.
User
Environment
The operator works with a menu from which the desired program is chosen,
e.g. discriminator settings.
Reagents
Two external reagent reservoirs are used:
Isotonic diluent (Diluent)
Hemolyzing reagent (Lyse)
Technology
The Medonic M-Series is a fully automatic hematology analyzer designed to
measure up to 16 parameters using whole blood from an open inlet, closed
tubes, 20µl micropipettes or pre-diluted blood.
3-Part WBC
The instrument performs a 3-part WBC differential by means of a cyanide free
hemolyzing reagent.
Protected
Sample Memory
A sample memory is available and protected against main power failures. The
sample memory also contains a search function with selective printing and QC
Options.
Page 84

83
11.2 Short List of Specifications
Specifications (Short)
Measuring principle, RBC, WBC, PLT
Impedance
Measuring principle HGB
Photometer, Cyanide free method 535nm ±5nm
Programmable WBC Discriminator
Yes
Sampling system
Closed shear valve
Parameters reported
RBC, MCV, HCT, PLT, MPV, HGB, MCH, MCHC,
WBC, RDW%, LYM abs, MID abs, GRAN abs, LYM%,
MID%, GRAN%
Size distributions printed for
RBC, PLT and WBC diff.
Aspirated blood volume (Open Tube)
< 110 µl
Aspirated blood volume (Cap Piercer)
< 250 µl
Aspirated blood volume (Autoloader)
< 300 µl
Blood volume Micro Pipette Adapter (MPA)
20 µl
Pre-diluted mode
1:200 to 1:300 using min. 20 µl
e.g. 20 µl to 4.5 ml diluent (1:225)
TFT-LCD Display
Graphical color touch screen, 240 columns x 320 rows
Keyboard
Virtual incorporated keyboard (External keyboard option)
Number of Samples per hour (Open Tube)
> 60 samples
Number of Samples per hour (Cap Piercer)
> 45 samples
Number of Samples per hour (Autoloader)
> 43 samples
Sample display time (Open Tube)
< 50 seconds
Printer
External, Seiko DPU 411/12 and 414, IBM proprinter /
Epson compatible, HP PCL 3 and 5 protocol compatible,
USB printer
Control sample memory capacity
> 1000 control samples
Sample memory capacity
> 1000 samples
QC capabilities
Mean, SD, CV, Levey-Jennings plots and X-B with
>10,000 samples history
HGB correction on high WBC counts
Yes
Warning flags on parameter abnormalities
Yes
Floating discriminator RBC/PLT
Yes (position printed)
Mathematical 3-part diff. WBC calculation
Yes
Automatic HGB blank on each sample
Yes
Carry over
< 1 %
Barcode reader input
Yes
Serial output
Yes (Conformed to standard EN 60950)
Main Voltage
100 – 240 V AC
External Power Adapter 24 V DC
Mains voltage tolerances
±15 %
Power consumption
Max 100VA
Power consumption (stand-by)
Max 20VA
Frequency
50 / 60 HZ
Built-in test / adjustment programs
Yes
Temperature
64 - 90°F (18 - 32°C)
Humidity (noncondensing)
Up to 80%
Dimensions (Basic/Standard/Closed Tube)
HxWxD = 16 x 11.5 x 18 inches (410 x 290 x 460 mm)
Dimensions (Autoloader)
HxWxD = 17 x 13 x 18 inches (430 x 330 x 460 mm)
Instrument weight (Basic/Standard/Closed Tube)
≤ 40 lbs (18 kg)
Instrument weight (Autoloader)
≤ 48.5 lbs (22 kg)
Diluent Consumption
Approximately 22 ml per analysis cycle.
Lyse Consumption
Approximately 4.5 ml per analysis cycle.
Page 85
84
11.3 Parameter Ranges
Linearity-Regression
and Linear Range
Linearity measured according to Boule I-1040 Section 8, based on Standard
EP6-A.
Parameter
Linearity-Regression (R2)
Linearity ±1%
WBC
≥ 0.99
0.5 – 80.0 x 10⁹/L
RBC
≥ 0.99
0.5 – 7.00 x 10¹²/L
PLT
≥ 0.99
30 – 1800 x 109/L
HGB
≥ 0.99
2.0 – 23.0 g/dL
Displayed Range
Total range where results are reported, also outside of linearity range.
Parameter
Displayed range
WBC
0.0 - 119.9 x10⁹/L
RBC
0.00 – 14.00 x10¹²/L
MCV
15.0 – 250.0 fL
PLT
0 - 1999 x109/L
HGB
0.0 – 35.0 g/dL
Correlation
Correlation was performed, using an Advia 120 and Medonic CA620 as
references. Data derived from 965 normal and abnormal fresh blood samples.
Parameter
Correlation Coefficients (R2), Advia/Medonic
WBC
≥ 0.98/ 0.98
RBC
≥ 0.97/ 0.98
MCV
≥ 0.98/ 0.99
PLT
≥ 0.98/ 0.99
HGB
≥ 1.00/ 1.00
Reproducibility
Measured as an average of 10 measurements each on 9 different vein K2EDTA collected normal samples, on 3 instruments, in OT, MPA, Cap Piercer,
and Autoloader modes.
Parameter
OT CV (%)
MPA CV (%)
WBC
7.0 x10⁹/L
1.8
2.5
RBC
4.59 x10¹²/L
0.9
1.5
MCV
86.8 fL
0.5
0.5
PLT
239 x109/L
3.0
3.0
HGB
14.3 g/dL
0.8
1.3
Total System Precision
These values are reported from the specification for this system.
Parameter
Mode to Mode Comparison,
maximum difference OT to
Cap Piercer/Autoloader (%)
Repeatability n=10, single
series (%)
RBC
2.5
1.8
MCV
2
1.5
HGB
2
1.5
PLT
7
4.8
WBC
5
3.5
Page 86
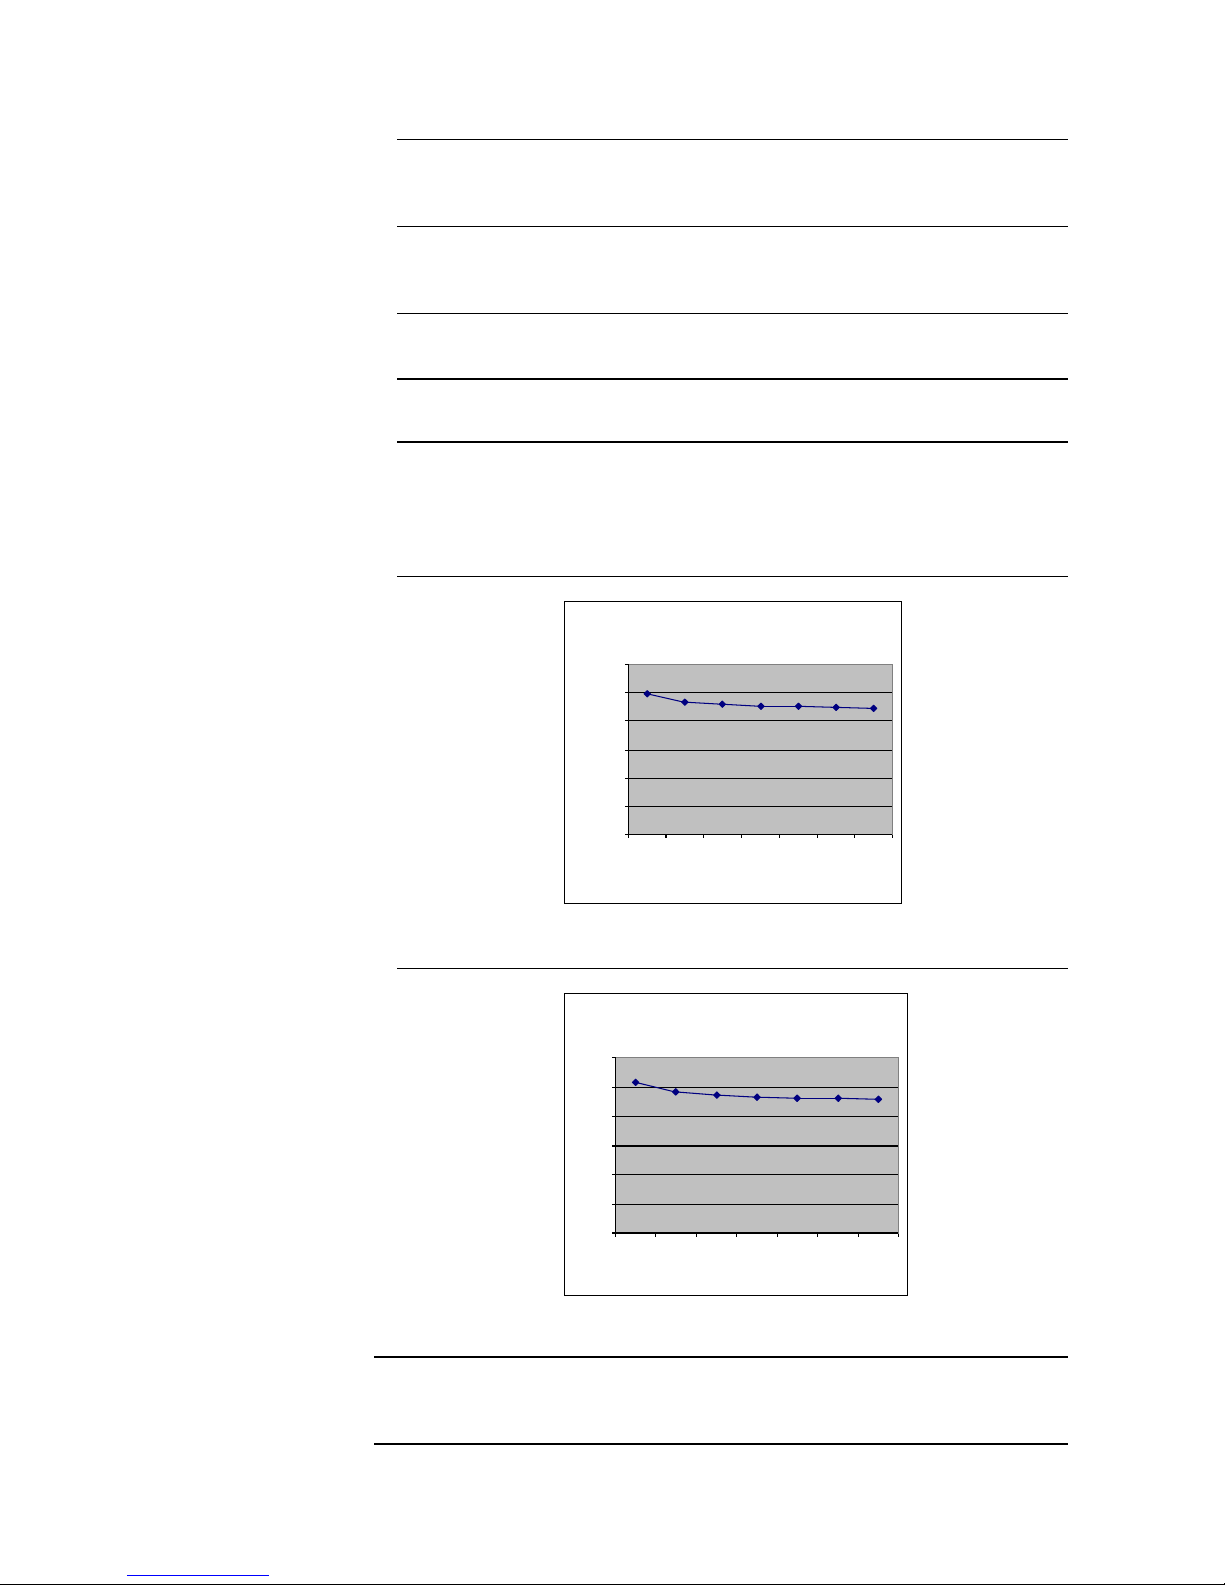
85
11.4 Reagents and Reagent Consumption
Description
This section describes the reagent consumption for the Medonic M-Series
depending on a sample per day calculation.
Supported Reagents
Use only Boule authorized reagents. Erroneous results and damage may occur
if other reagents are used.
Diluent Consumption
Approximately 22 ml per analysis cycle
Lyse Consumption
Approximately 4.5 ml per analysis cycle.
Consumption
Calculation
The consumption can be approximately calculated depending on the number of
samples per day as shown on the graphs below. The figures, presented in the
graphs, assume one exit standby and one wash per day. The consumption
relation between the Diluent and Lyse is 5:1, based on 50 samples per day.
Diluent Consumption
Figure 11.1
Lyse Consumption
Figure 11.2
Additional
Information
For additional information regarding the consumption of cleaning solutions please
refer to the Boule Cleaning Kit instruction. (Supplied with the Boule Cleaning Kit).
Diluent Consumption
0
5
10
15
20
25
30
25 50 75 100 125 150 200
Samples/day
ml/sample
Lyse Consumption
0
1
2
3
4
5
6
25 50 75 100 125 150 200
Samples/day
ml/sample
Page 87
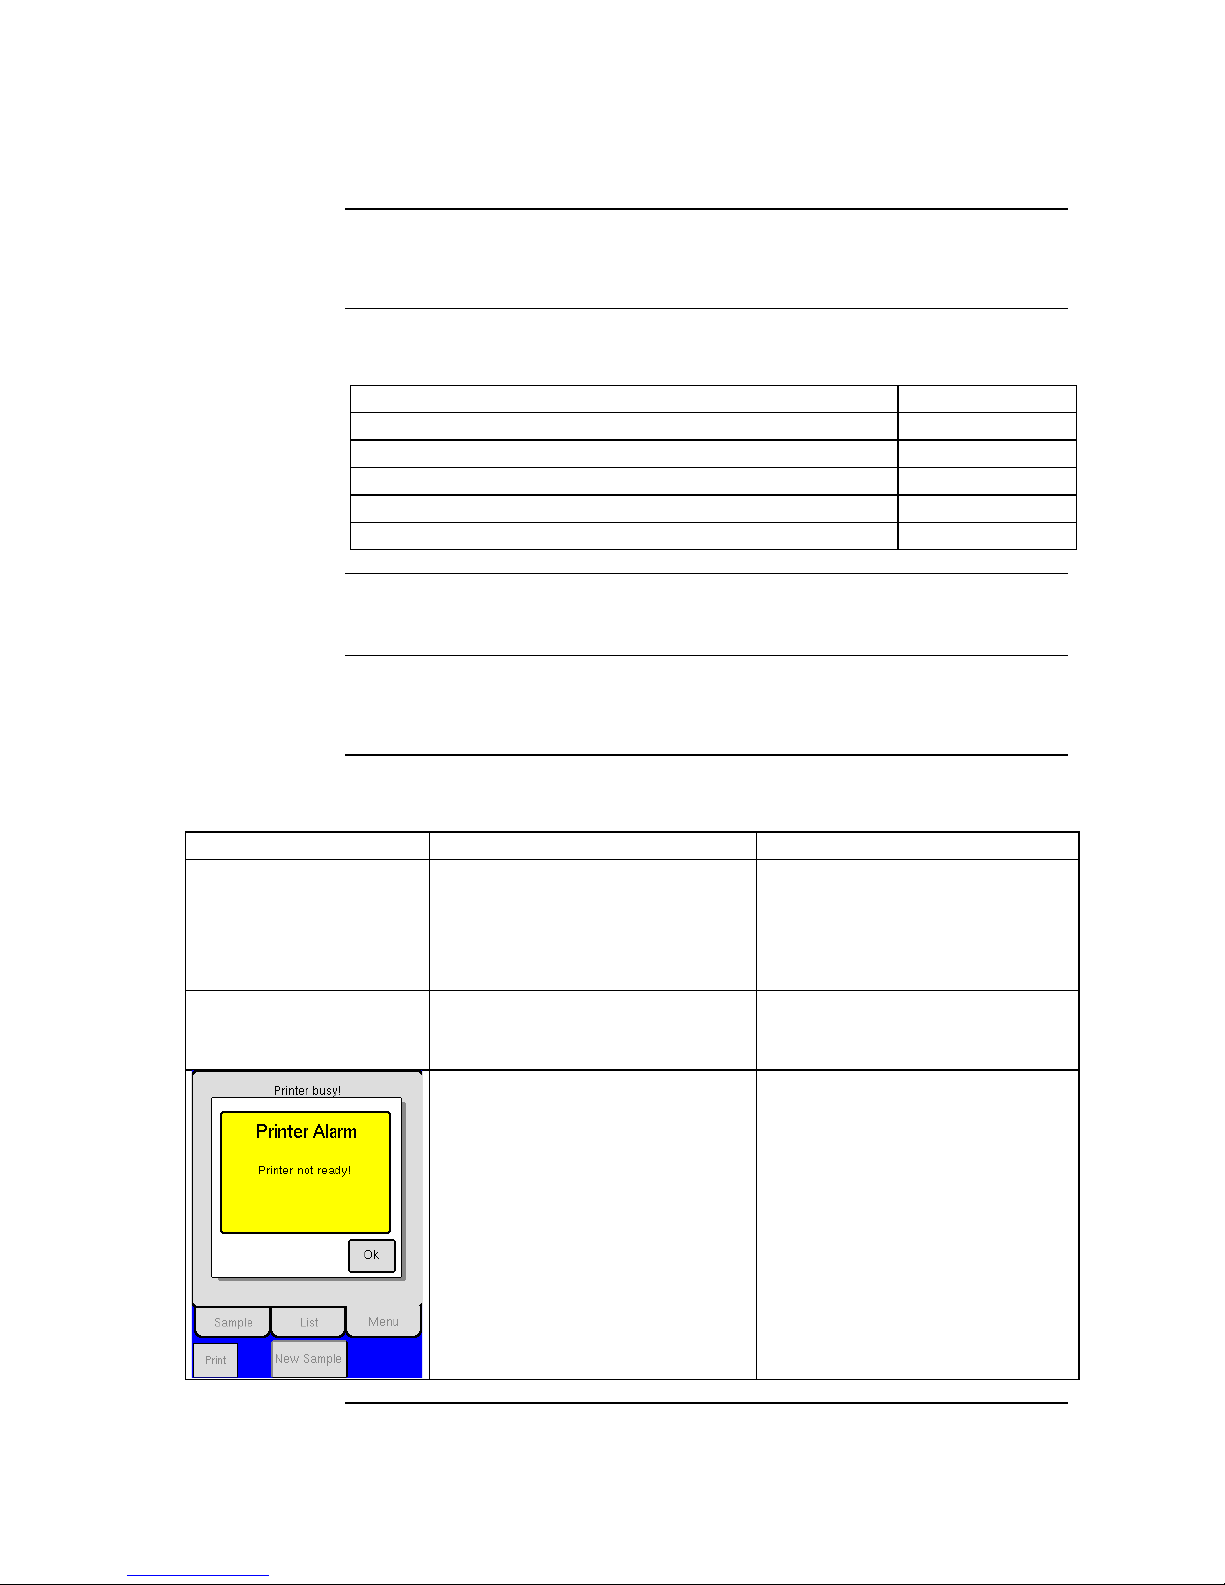
86
Section 12: Troubleshooting
Section Overview
Introduction
This section contains information needed to troubleshoot the Medonic
M-Series instrument.
Contents
This Section contains the following topics:
Topic
See Page
Communication Issues
86
General Information Displays
88
Warning Displays
93
Aspiration Issues
98
Troubleshooting Other Issues
99
12.1 Communication Issues
Description
This section contains information regarding errors associated with printers,
barcode readers and serial data communication.
Printer Issues
See Section 4.3 Printer Modes for further detail.
If
Then
Possible cause
The printout has unusual
layout or strange
characters.
1. Verify that printer type
matches the printer being used.
2. Verify that the correct paper
format has been selected for
the printer paper.
1. New printer was connected but
not matched with analyzer
setup.
2. Printer may need maintenance
or to be reset.
Results are not printing
out after sample or
control analysis.
1. Verify that Auto Print Mode is
NOT set to ‘0’.
1. Auto Print Mode was turned
off and not reset.
1. Printer Alarm message is
displayed.
2. Printer is not ready to print,
wait unit printer has finished
with previous printout.
3. Verify that printer is connected
the instrument.
4. Verify that the setup of the
instrument is correct for the
printer in use.
1. The printer is not connected to
the instrument or the printer
setup is incorrect.
2. The printer has not completed
last printout.
Continued on next page
Page 88
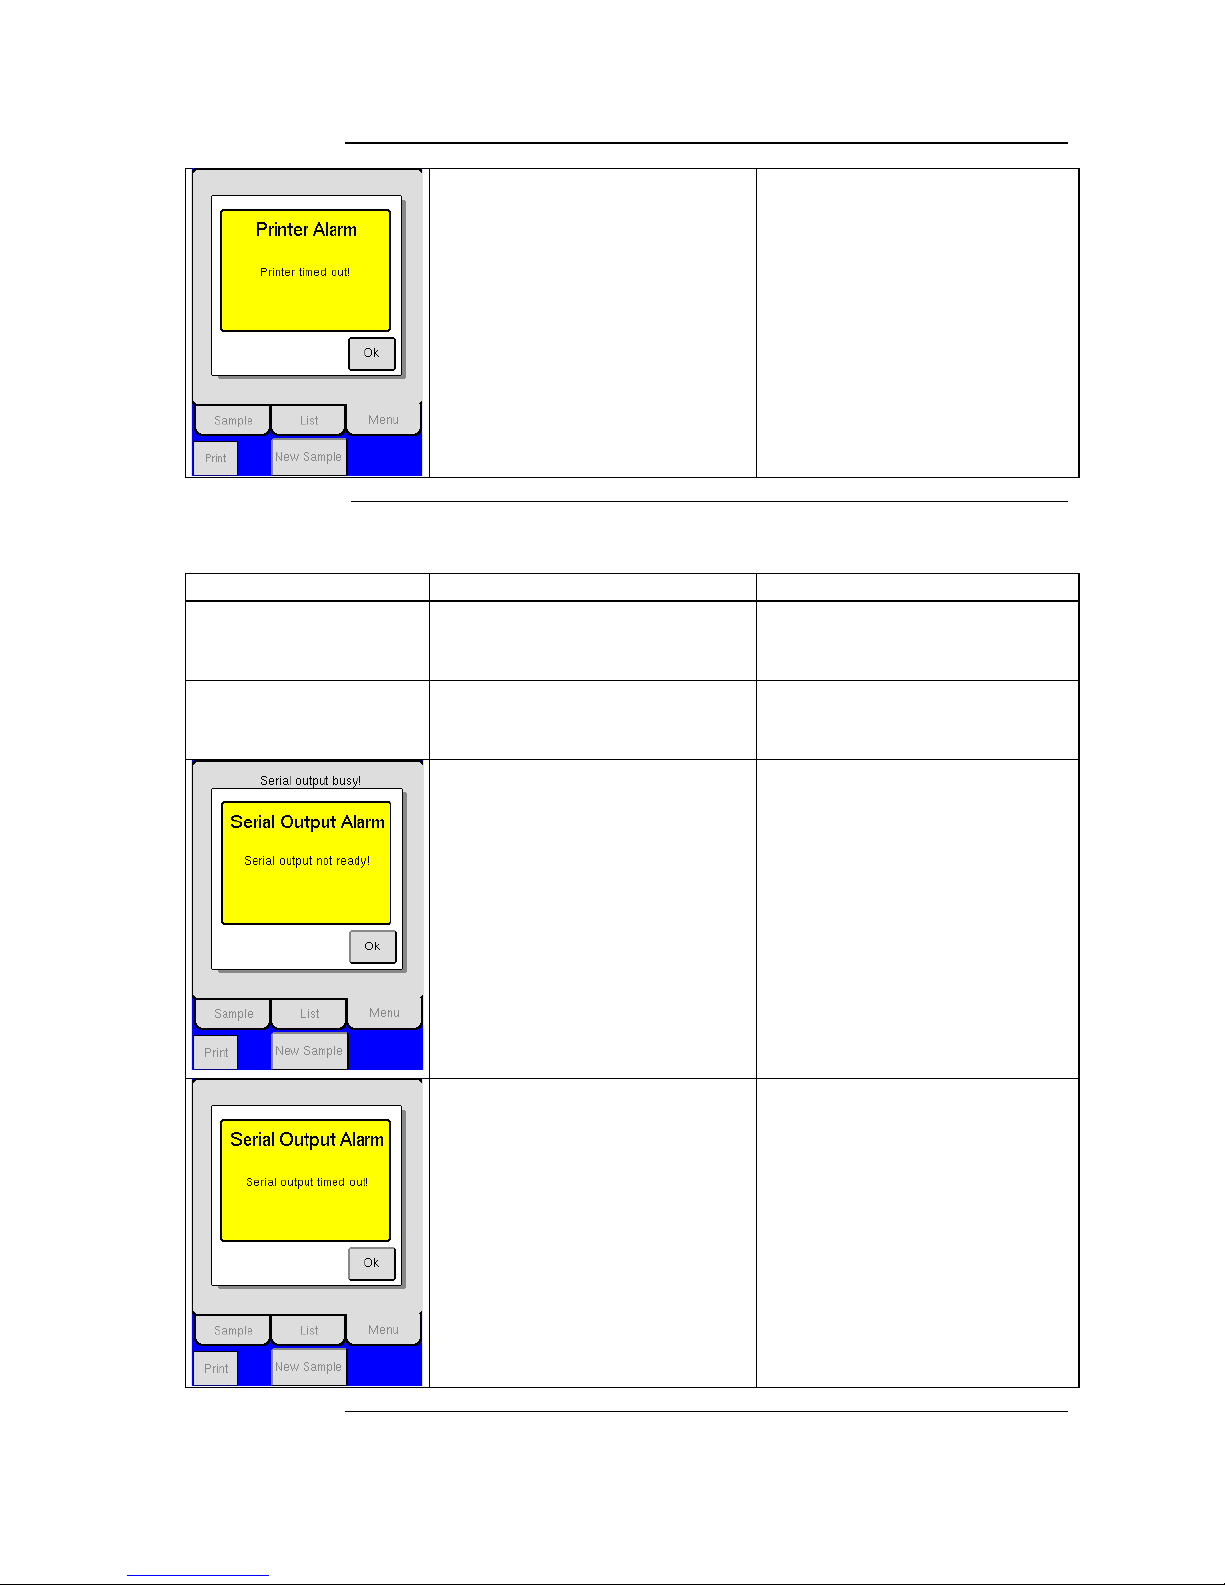
87
12.1 Communication Issues (continued)
1. The Printer is connected to the
instrument and on, but not
activated.
2. Verify that printer is not in
standby or offline.
3. Verify that printer is set to
print and not serial port only
setup.
1. The printer has timed out.
2. Printer paper may need to be
refilled.
3. Incorrect setup for information
transmission.
Serial Data Issues
See Section 4.3 Data Communication for further detail.
If
Then
Possible cause
The data sent does not
seem correct
1. Make sure that the correct HW
handshake and Auto Send
Mode has been selected.
1. Serial setup in analyzer is
incorrect.
Results are not being
sent to computer after
sample analysis
1. Verify that Auto Send Mode is
NOT set to ‘0’.
1. Auto Print Mode was turned
off and not reset.
1. Serial Output in not ready to
transmit.
2. Wait until previous sample has
finished transmitting.
3. Then resend selected sample.
1. The analyzer has not
completed transmission of last
sample.
1. Make sure that the HW
handshake has been selected.
2. Verify that analyzer is
connected to computer.
3. Verify that computer is turned
on.
4. Verify that analyzer is set to
serial output and not print
mode only.
1. The serial output has timed
out.
2. The computer is not
connected to the instrument or
the serial output setup is
incorrect.
Continued on next page
Page 89
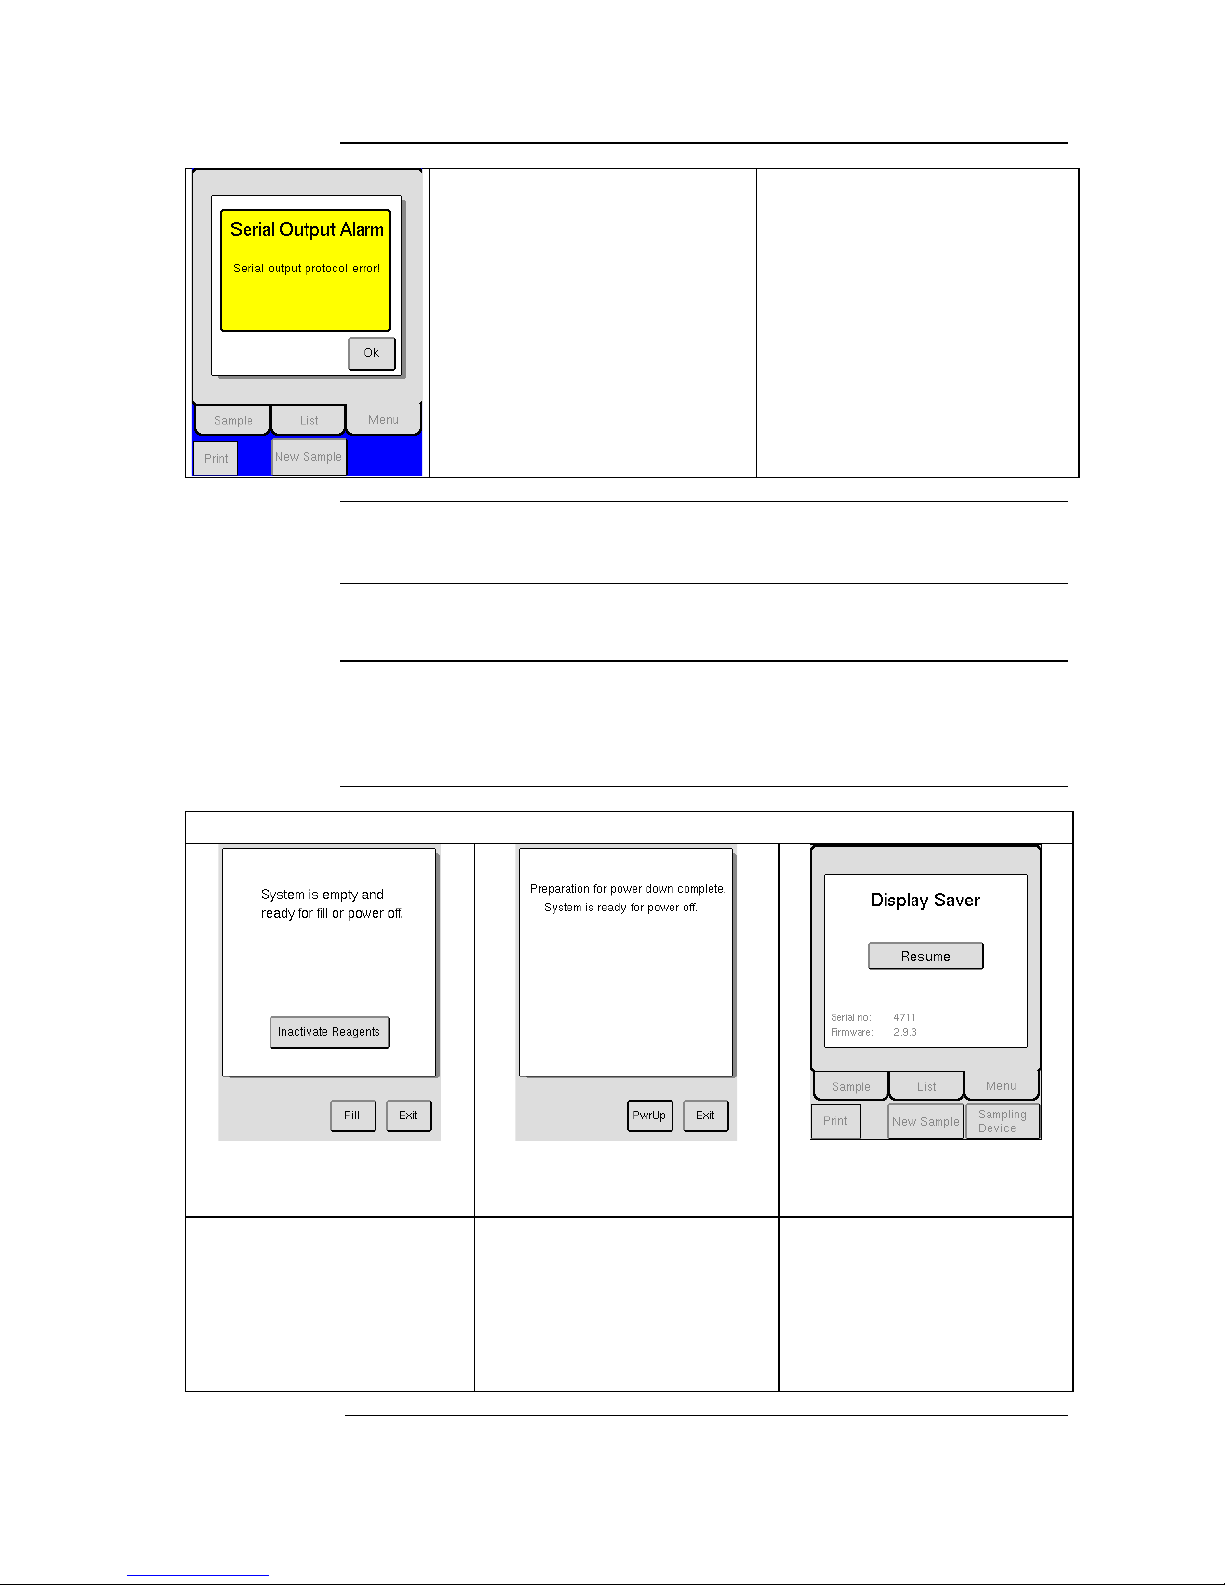
88
12.1 Communication Issues (continued)
1. Make sure that the Send with
Ack. has been selected.
2. Verify that computer is turned
on and connected to the
analyzer.
3. Verify that computer’s
receiving program is active.
1. Serial output Ack. problem.
12.2 General Information Displays
Description
This section contains information regarding general information displays.
General
Information
Displays
General information displays are informative screen displays that appear after
a function has been completed. Instruction is then displayed for the operator
on next step or function to be performed.
Standby, Power Down, and Power Up Informational Displays
The system is empty from all liquid
and prepared to be filled with other
liquid or be stored away. Press
[FILL] if you want to refill system
or [EXIT] if you want to return to
instrument menu. No analyze can be
performed before the instrument is
refilled with reagents.
The system is filled with liquid and is
prepared for power off. Press [PWR
UP] if you want to return the system
to active status or [EXIT] if you want
to return to instrument menu. It is
recommended to use [ENTER
STANDBY] and that power is left on,
instead of using this feature.
The system has not been used during
the preset display saver time. Press
[RESUME] to activate the
instrument. Once activated, the
instrument is ready to perform an
analysis.
Continued on next page
Page 90
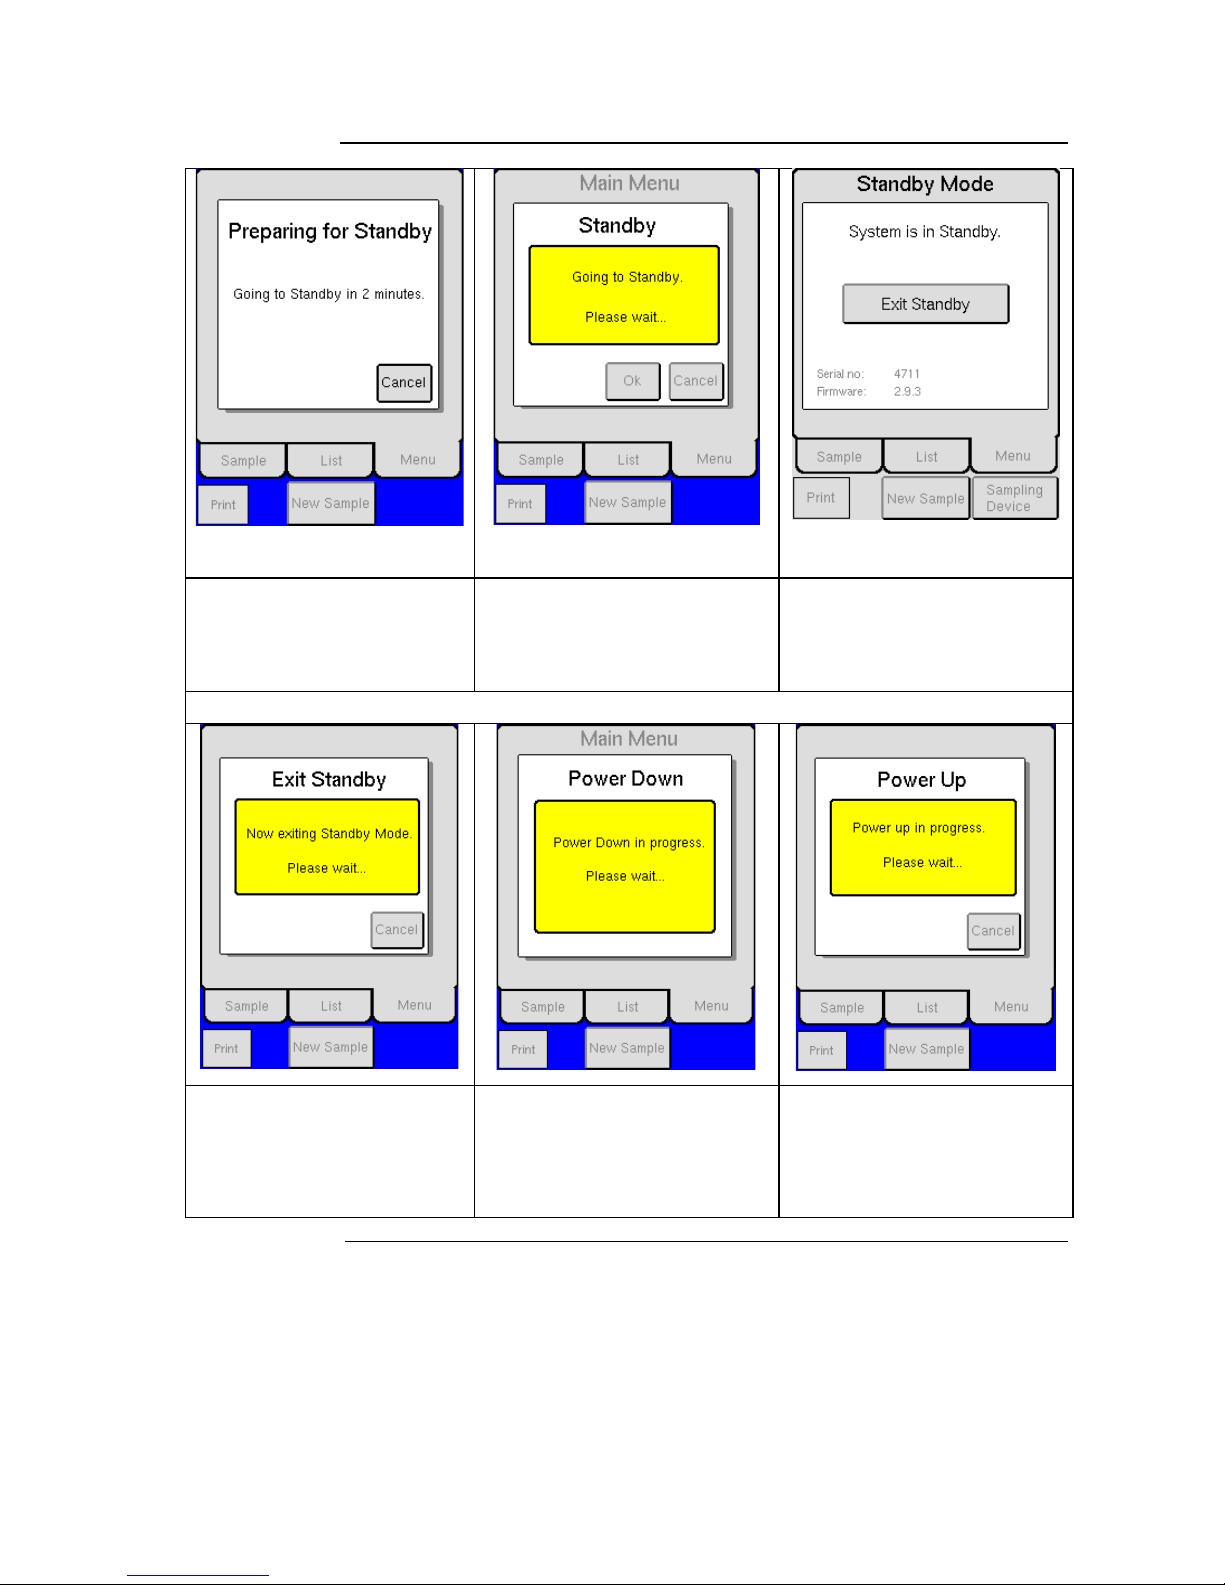
89
12.2 General Information Displays (continued)
Instrument will enter Standby mode
in 2 minutes. Press [CANCEL] to
return to instrument menu.
The instrument is in the process of
going into Standby. Please wait.
The system is in Standby. Press
[EXIT STANDBY] to activate the
instrument. Once activated, the
instrument is ready to perform an
analysis.
Standby, Power Down, and Power Up Informational Displays
The system is preparing the
instrument for analysis mode. If the
background check is activated,
background result will be displayed.
Once activated, the instrument is
ready to perform an analysis.
The instrument is in process of
powering down. Please wait.
The instrument is in process of
powering up. Please wait.
Continued on next page
Page 91
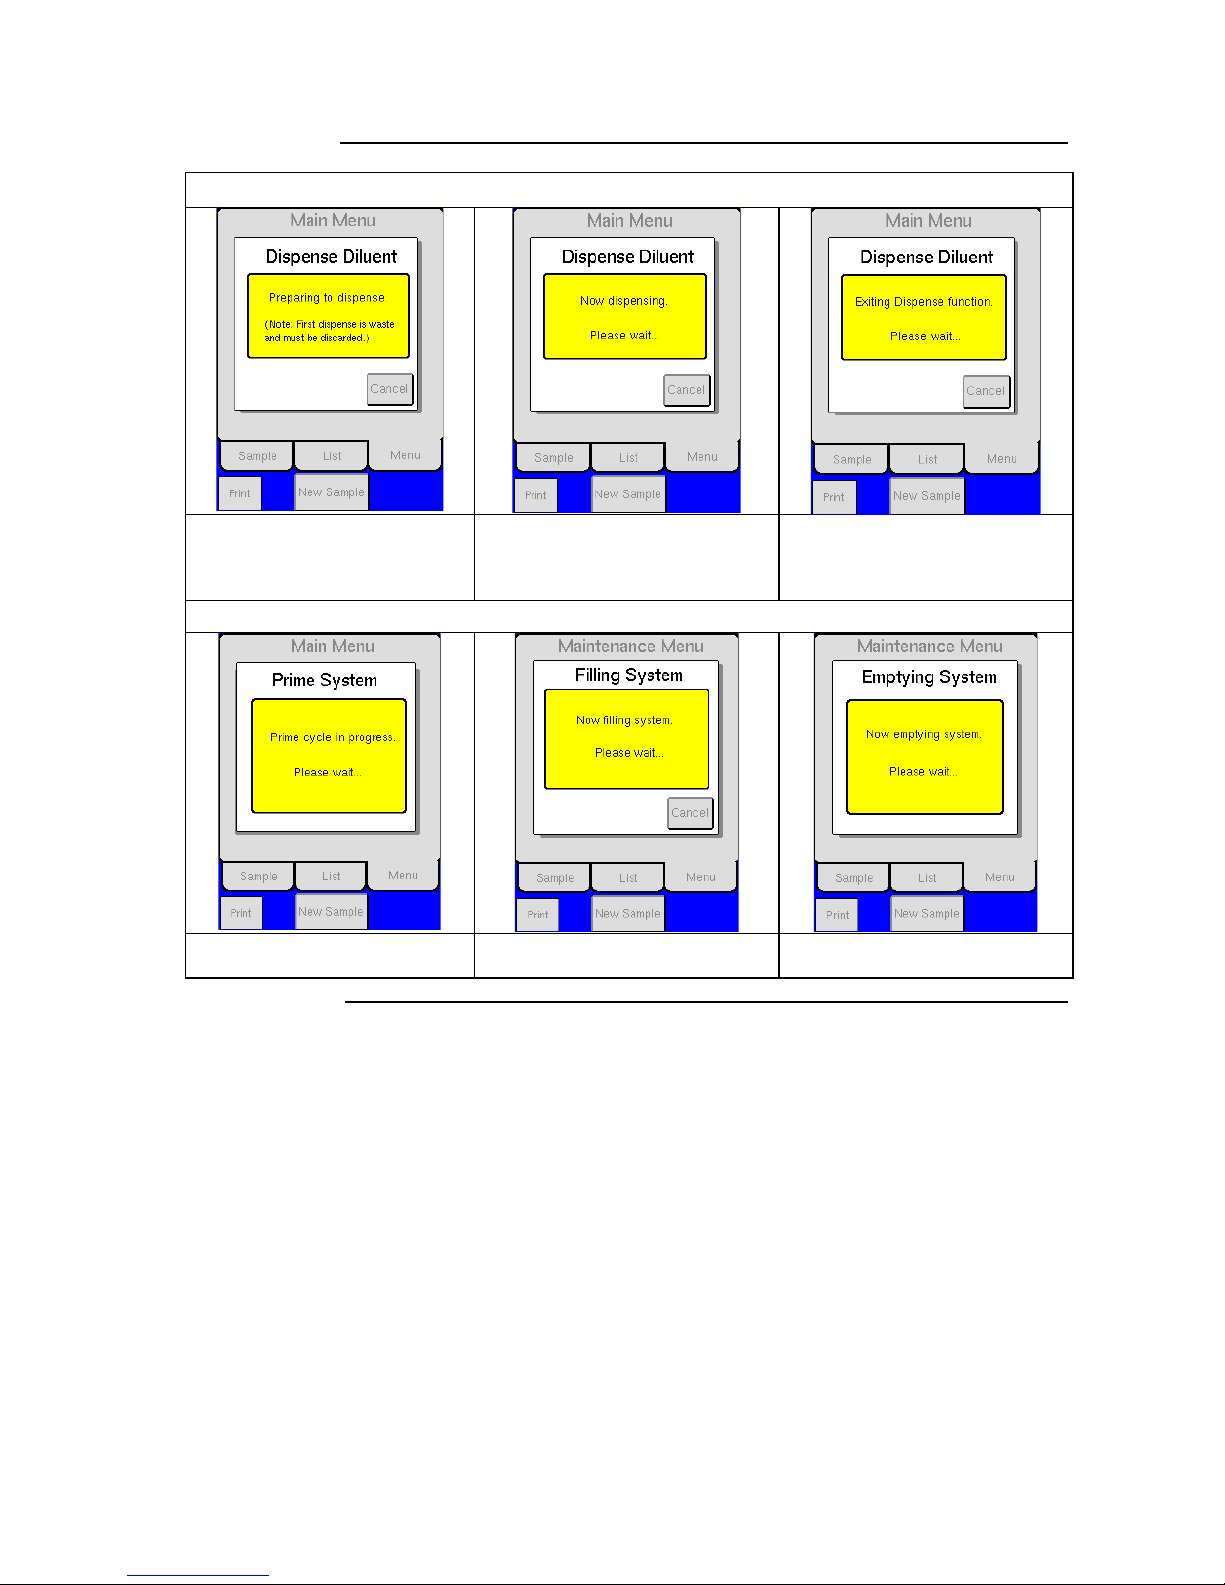
90
12.2 General Information Displays (continued)
Diluent Dispense Informational Displays
The instrument is preparing to
dispense diluent. Dispose of first
dispense for best results.
The instrument is now dispensing 4.5
ml of diluent. Please wait.
The instrument is exiting dispense
function. Please wait.
Cycle In Progress Informational Display
The instrument is priming the
system. Please wait.
The instrument is filling the system.
Please wait.
The instrument is emptying the
system. Please wait.
Continued on next page
Page 92
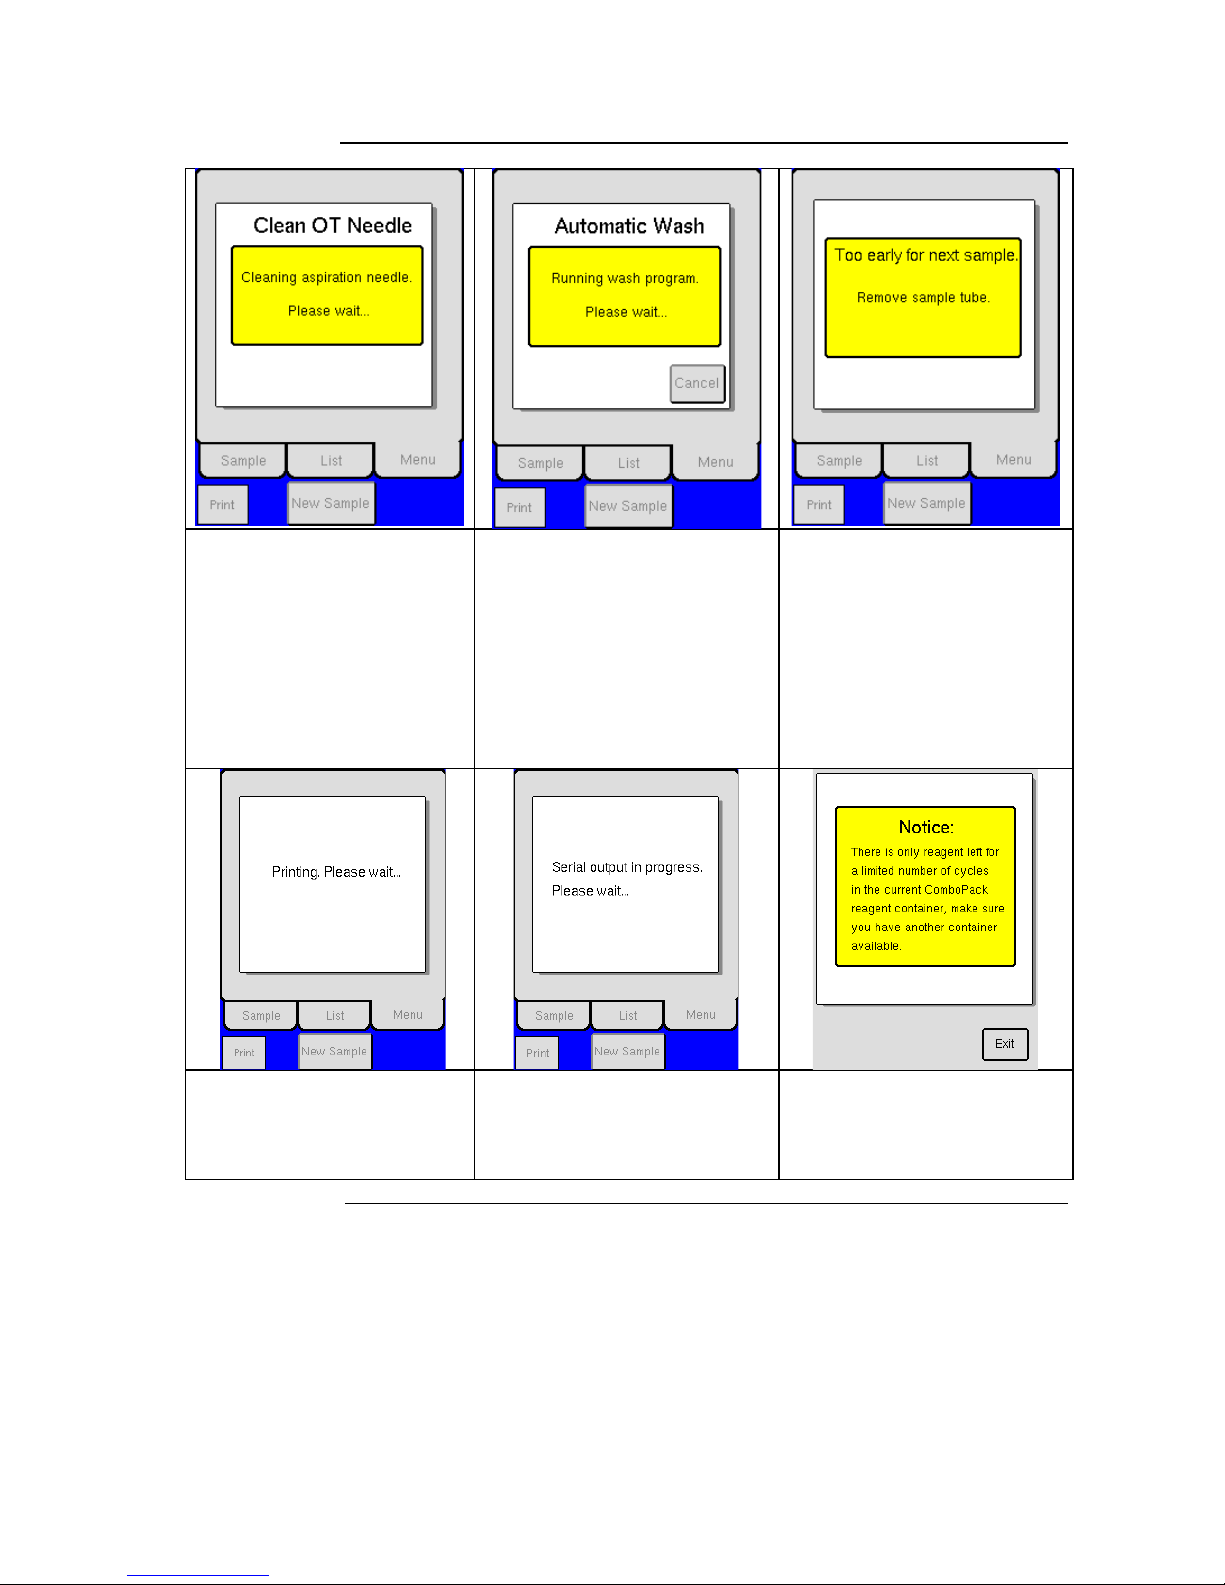
91
12.2 General Information Displays (continued)
The instrument is cleaning the Open
Tube probe (needle). Please wait.
Every twelve hour the instrument
performs a wash of the system.
During wash cycle the instrument can
not be used for performing an
analysis.
The system has finished the count of
cells and displays the results. The
analysis cycle in not yet completed,
as the system still needs to perform
wash cycle for an accurate next
sample result. Please wait until the
[NEW SAMPLE] button is
activated. If probe was submerged in
next sample by mistake, perform a
background count before continuing
with the next analysis.
The printer is in the process of
printing. Please wait.
The analyzer is in the process of
transmitting serial output data. Please
wait.
Instrument displays this notice to
inform operator that ComboPack
reagents will soon need to be
changed. (See Section 2.5 for more
detail.)
Continued on next page
Page 93
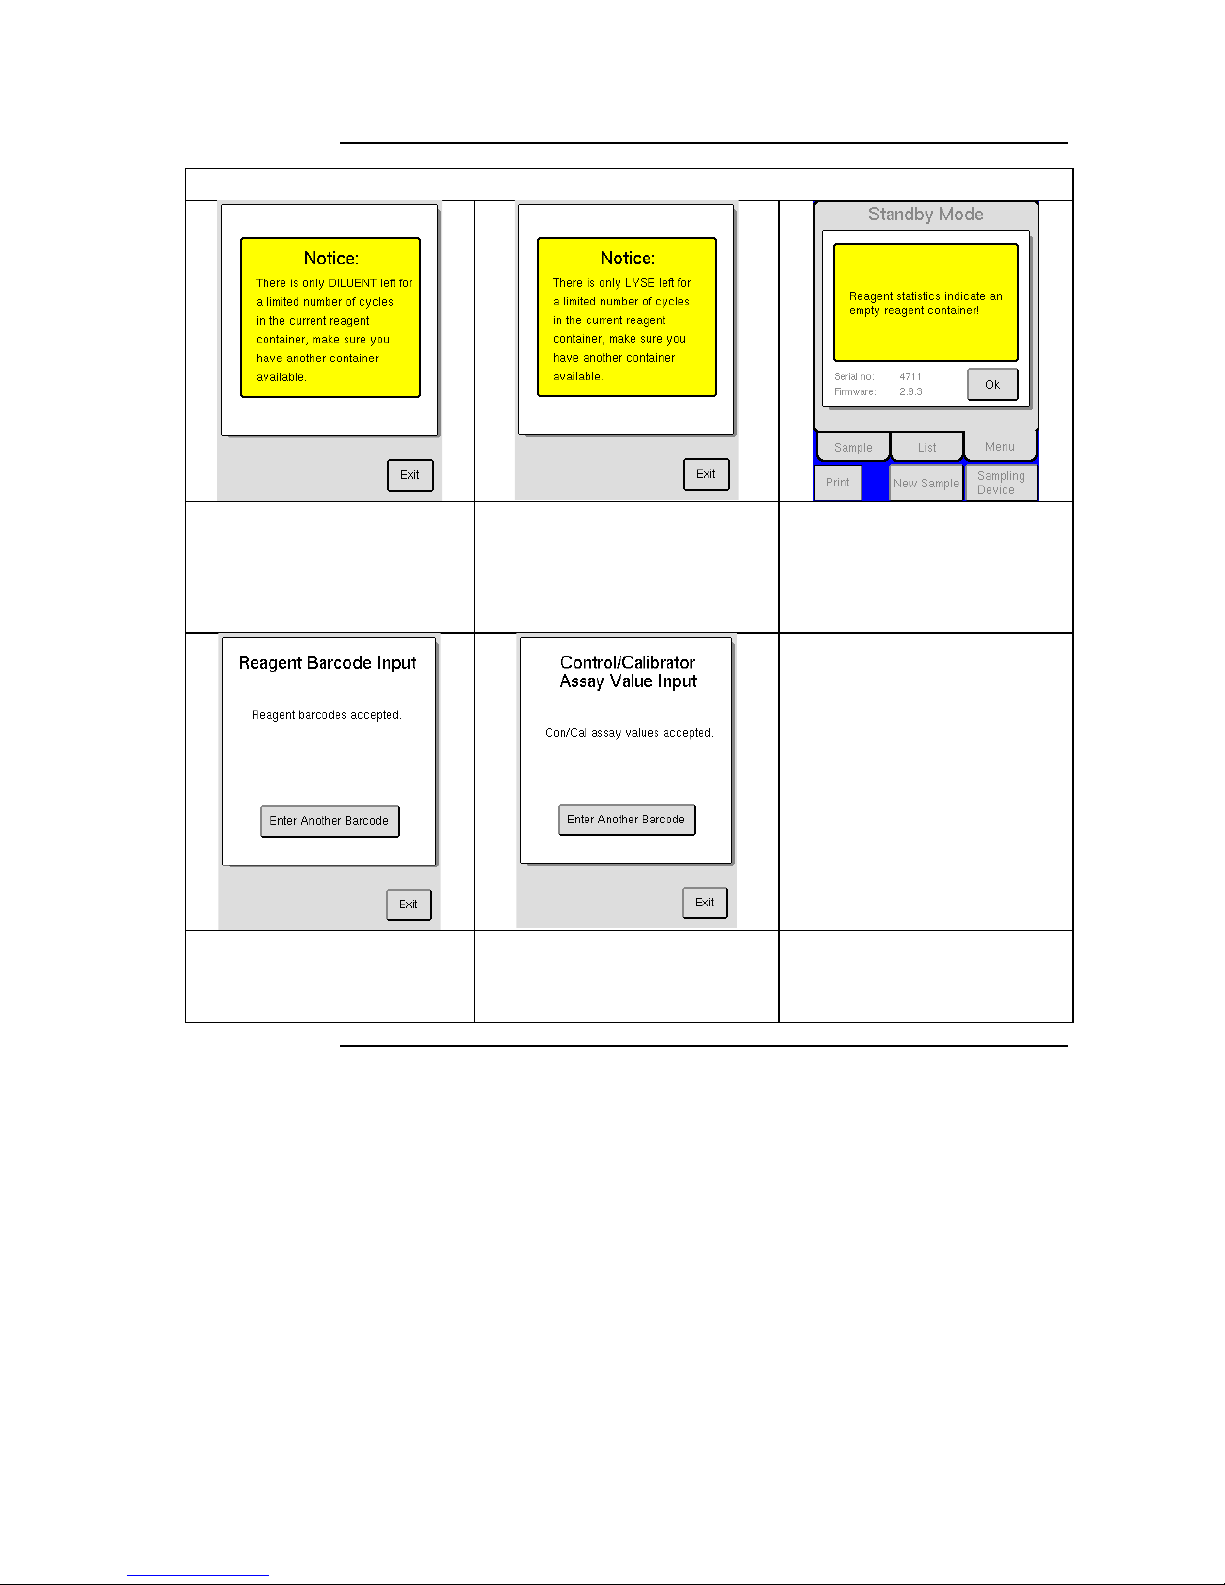
92
12.2 General Information Displays (continued)
Reagent and Control Informational Displays
Instrument displays this notice to
inform operator that Diluent reagent
will soon need to be changed. (See
Section 2.5 for more detail.)
Instrument displays this notice to
inform operator that Lyse reagent will
soon need to be changed. (See Section
2.5 for more detail.)
Instrument displays this notice when
reagent container or containers need
to be changed. Not changing
reagents at this time could cause
erroneous results or possible damage
the instrument.
The reagent barcodes were scanned
in correctly using the barcode reader
and the instrument has accepted the
values.
The Assay Values were scanned in
correctly using the barcode reader and
the instrument has accepted the
values.
Page 94
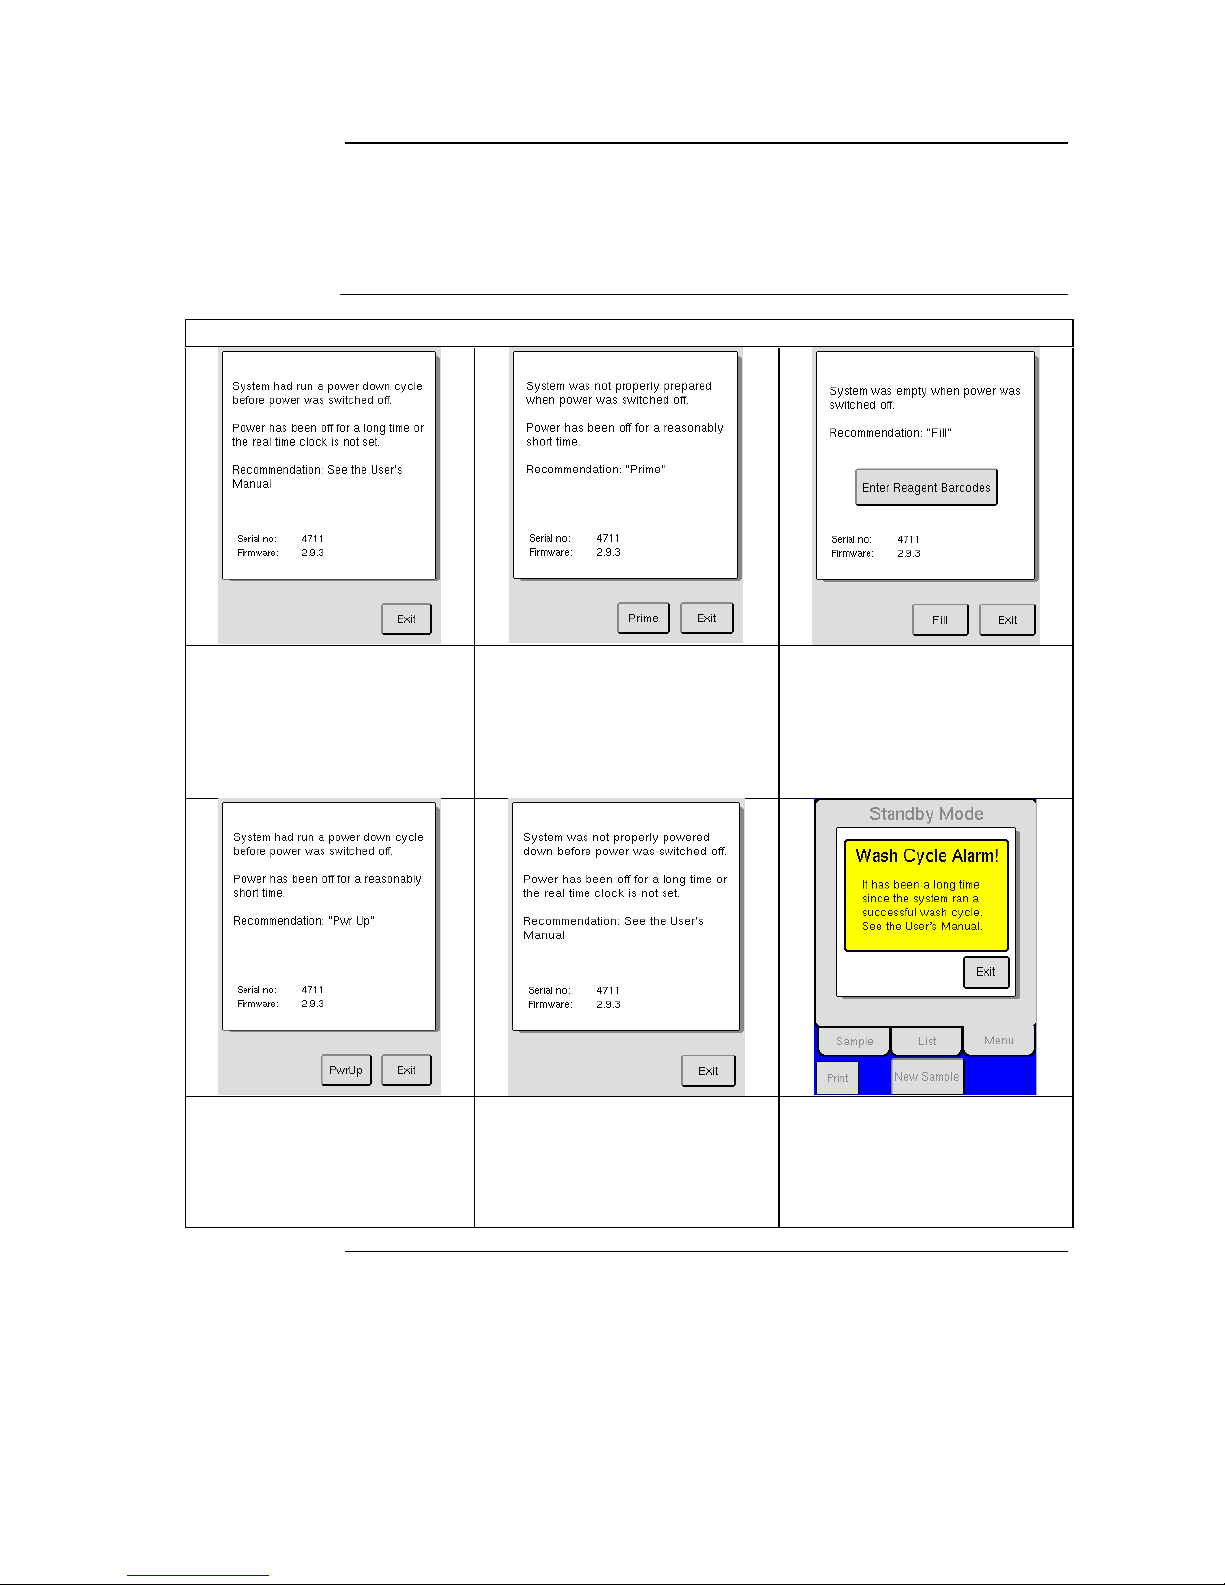
93
12.3 Warning Displays
Warning
Displays
Warning displays appear after a function has been performed incorrectly or to
inform the operator that further action is needed to complete the desired task.
The warning display describes the situation and instructs the operator on next
step or function to resolve issue.
System Power Down Warning Displays
The system has been switched off
for a long time period. The
instrument has been powered down
with all valves open and filled with
liquid. Empty and refill the system
with reagents, and perform a
background count.
The system was switched off
incorrectly. Perform a prime to
prepare the system for analysis. Check
method for correct instrument power
down procedure.
The system was manually switched
off with system emptied of reagents.
Fill the instrument with reagents to
prepare for analysis or exit if only a
search of instrument menus is
needed.
The instrument has been switched
off with power down function
before power was switched off.
Perform a power up to prepare the
reagent system for analysis.
The system was powered down with
liquid in system and has been unused
for long period of time. Perform the
cleaning procedure according to
cleaning kit instruction. Perform a
background check.
The regular 12 hour wash has failed.
Make sure that reagent containers
are filled and the detectors are
inserted correctly.
Continued on next page
Page 95
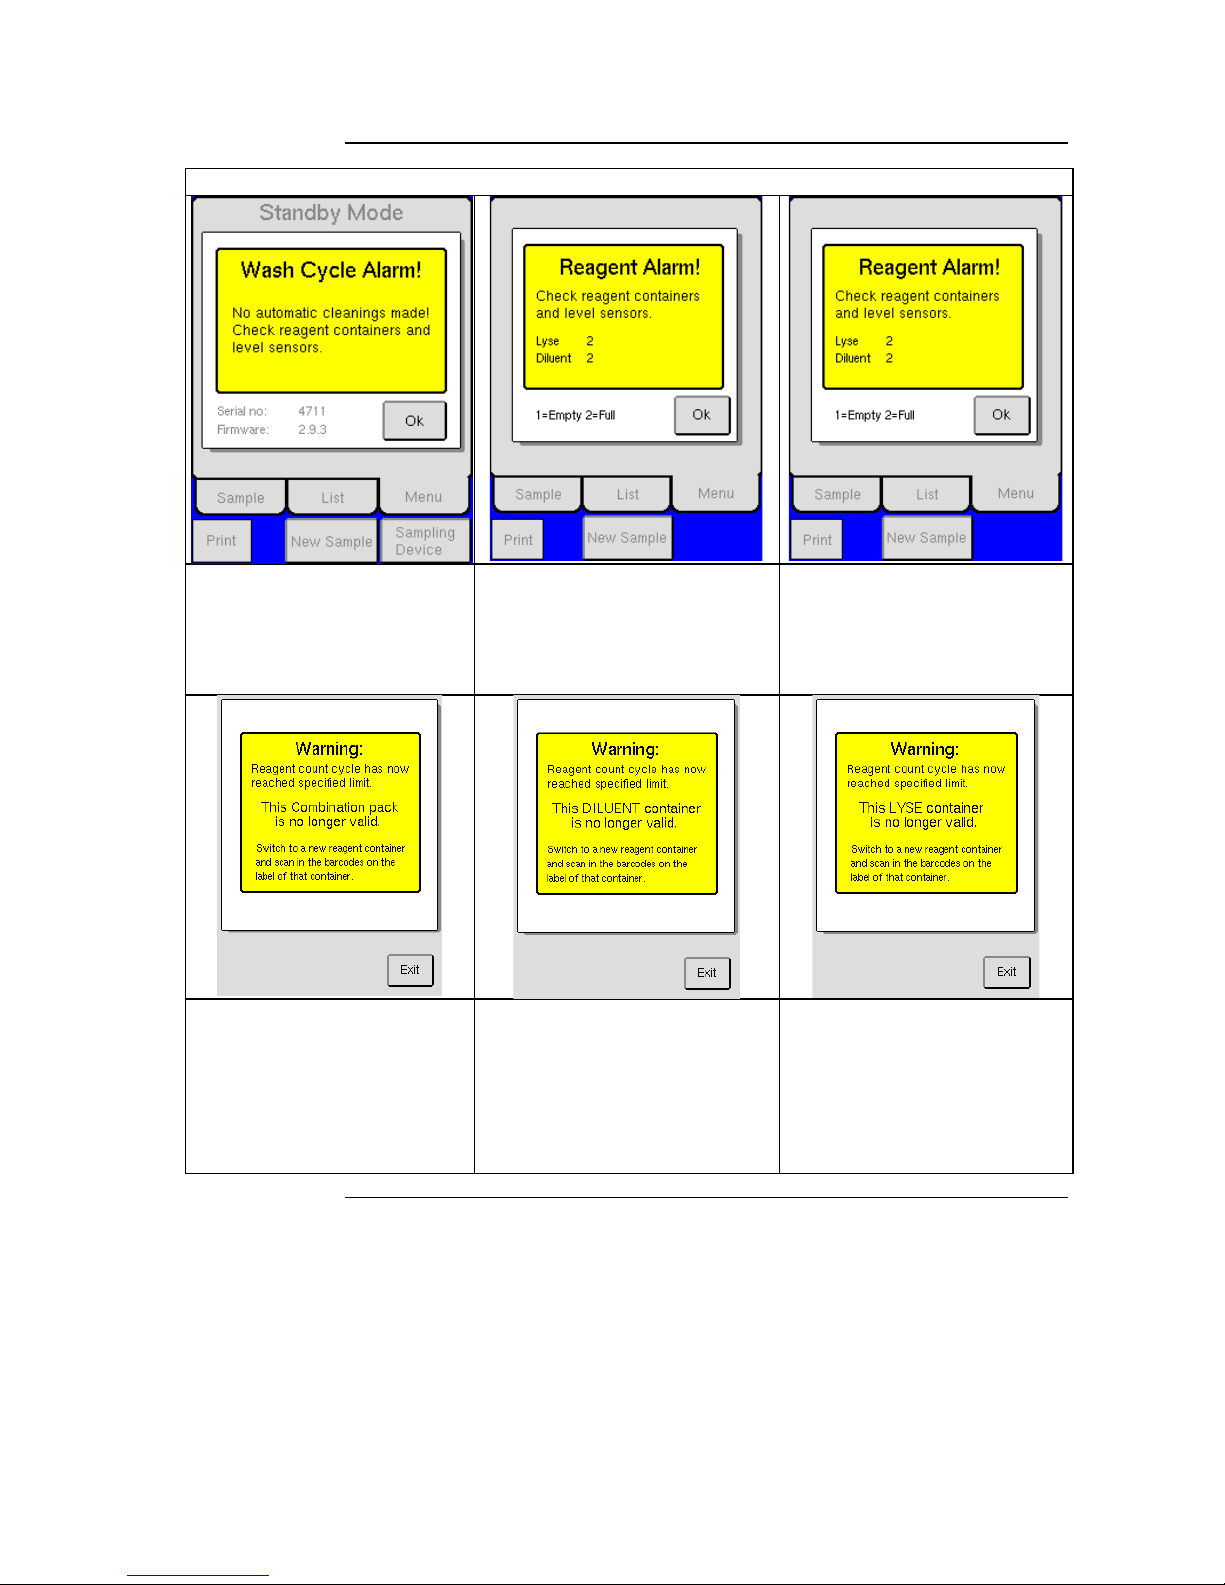
94
12.3 Warning Displays (continued)
Reagent Warning Displays
The regular 12 hour wash has not
been performed. Check if reagent
containers are empty and if the
reagent detectors are in contact with
reagent.
The reagent container or containers
are empty. Check if the containers are
empty and if level sensors and reagent
contact plugs are inserted correctly.
This message is displayed if reagent
container or containers are empty
when coming out of Standby. Check
if the containers are empty and if
level sensors and reagent contact
plugs are inserted correctly.
ComboPack container needs to be
changed. Not changing reagents at
this time could cause erroneous
results or possible damage the
instrument. Connect new reagent
container and scan in barcode on
container. (See Section 2.5 for more
detail.)
Diluent container need to be changed.
Not changing reagents at this time
could cause erroneous results or
possible damage the instrument.
Connect new reagent container and
scan in barcode on container. (See
Section 2.5 for more detail.)
Lyse container needs to be changed.
Not changing reagents at this time
could cause erroneous results or
possible damage the instrument.
Connect new reagent container and
scan in barcode on container. (See
Section 2.5 for more detail.)
Continued on next page
Page 96
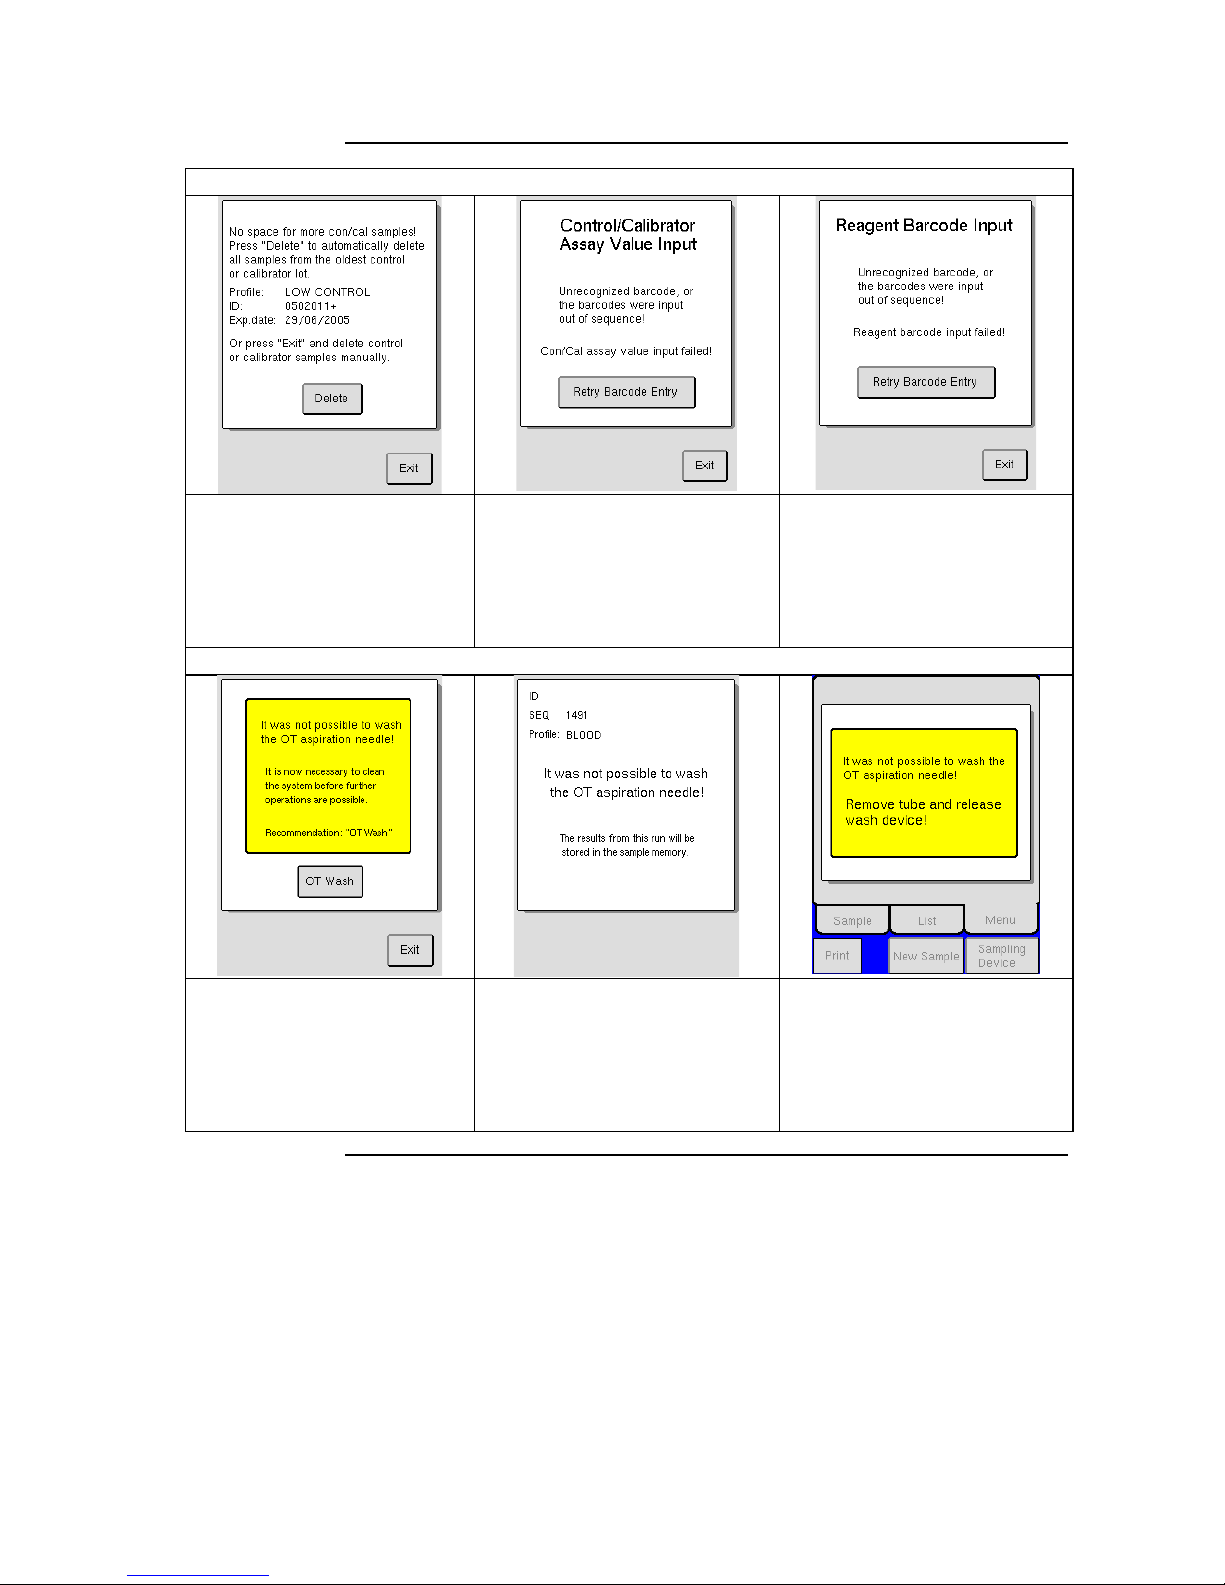
95
12.3 Warning Displays (continued)
Barcode Warning Displays
No more space is available to scan
in new assay values. Follow the
recommendation or manually delete
all the controls with same ID, to
free space for scanning the new
Control lot. (See Section 6.1 for
more detail.)
Assay Value Input failed. The Assay
sheet or order of scanning in the
barcodes may have been incorrect.
Verify that setups on the instrument
match the required setup for the
barcode reader. (See Section 4.3 and
6.1 for more detail.)
Reagent barcode scanning failed.
Barcode printing or order of
scanning in the barcodes may have
been incorrect. Verify that setups on
the instrument match the required
setup for the barcode reader. (See
Section 4.3 and 4.4 for more detail.)
Open Tube Warning Displays
The instrument was unable to wash
the Open Tube probe (needle).
Verify that tube is removed and
wash device is in correct position,
then perform OT Wash.
The instrument was unable to wash
the Open Tube probe (needle). Verify
that tube is removed and wash device
is in correct position. It is
recommended that background count
is performed before next sample
analysis.
The instrument is unable to wash the
Open Tube probe (needle). Verify
that tube is removed and wash
device is in correct position. It is
recommended that background count
is performed before next sample
analysis.
Continued on next page
Page 97
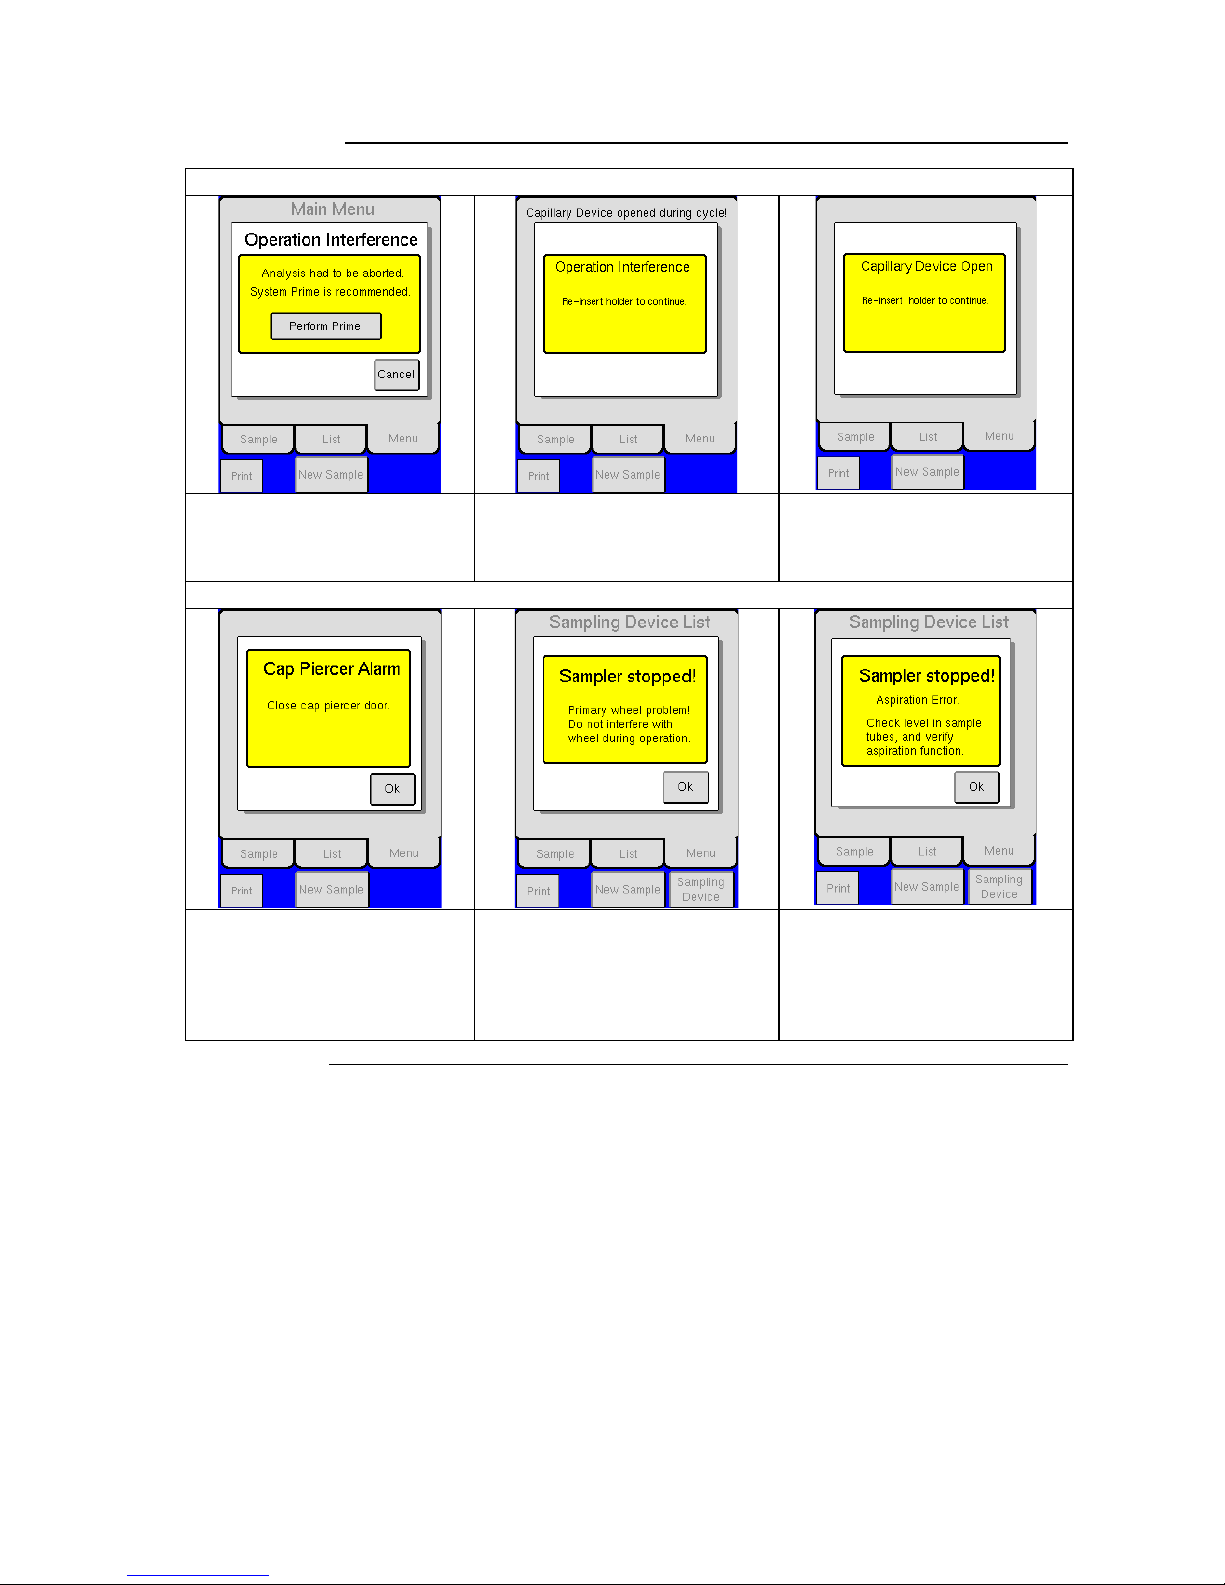
96
12.3 Warning Displays (continued)
Capillary Device Warning Displays
The MPA was opened during an
inappropriate time. It is
recommended to perform a prime
cycle before next analysis.
The MPA was opened during a cycle
or analysis. Re-insert holder, and
follow suggested recommendation.
The MPA holder was opened during
an inappropriate menu. The MPA
holder should only be opened in
List, Sample or Main menu.
Cap Piercer and Autoloader Warning Displays
The Cap Piercer door was opened
before the CAP door lock had been
activated. Close the Cap Piercer
door to continue with the analysis.
The aspiration wheel has been
interfered with during mixing. Press
[OK] to return to the sample menu. To
proceed with the analyses press
[CONTINUE] in Sampling Device
List Menu.
Three aspirations have been
attempted. All have failed. Verify
that sample tubes contain at least 1
ml of blood. (See Section 5.9 for
more detail.)
Continued on next page
Page 98
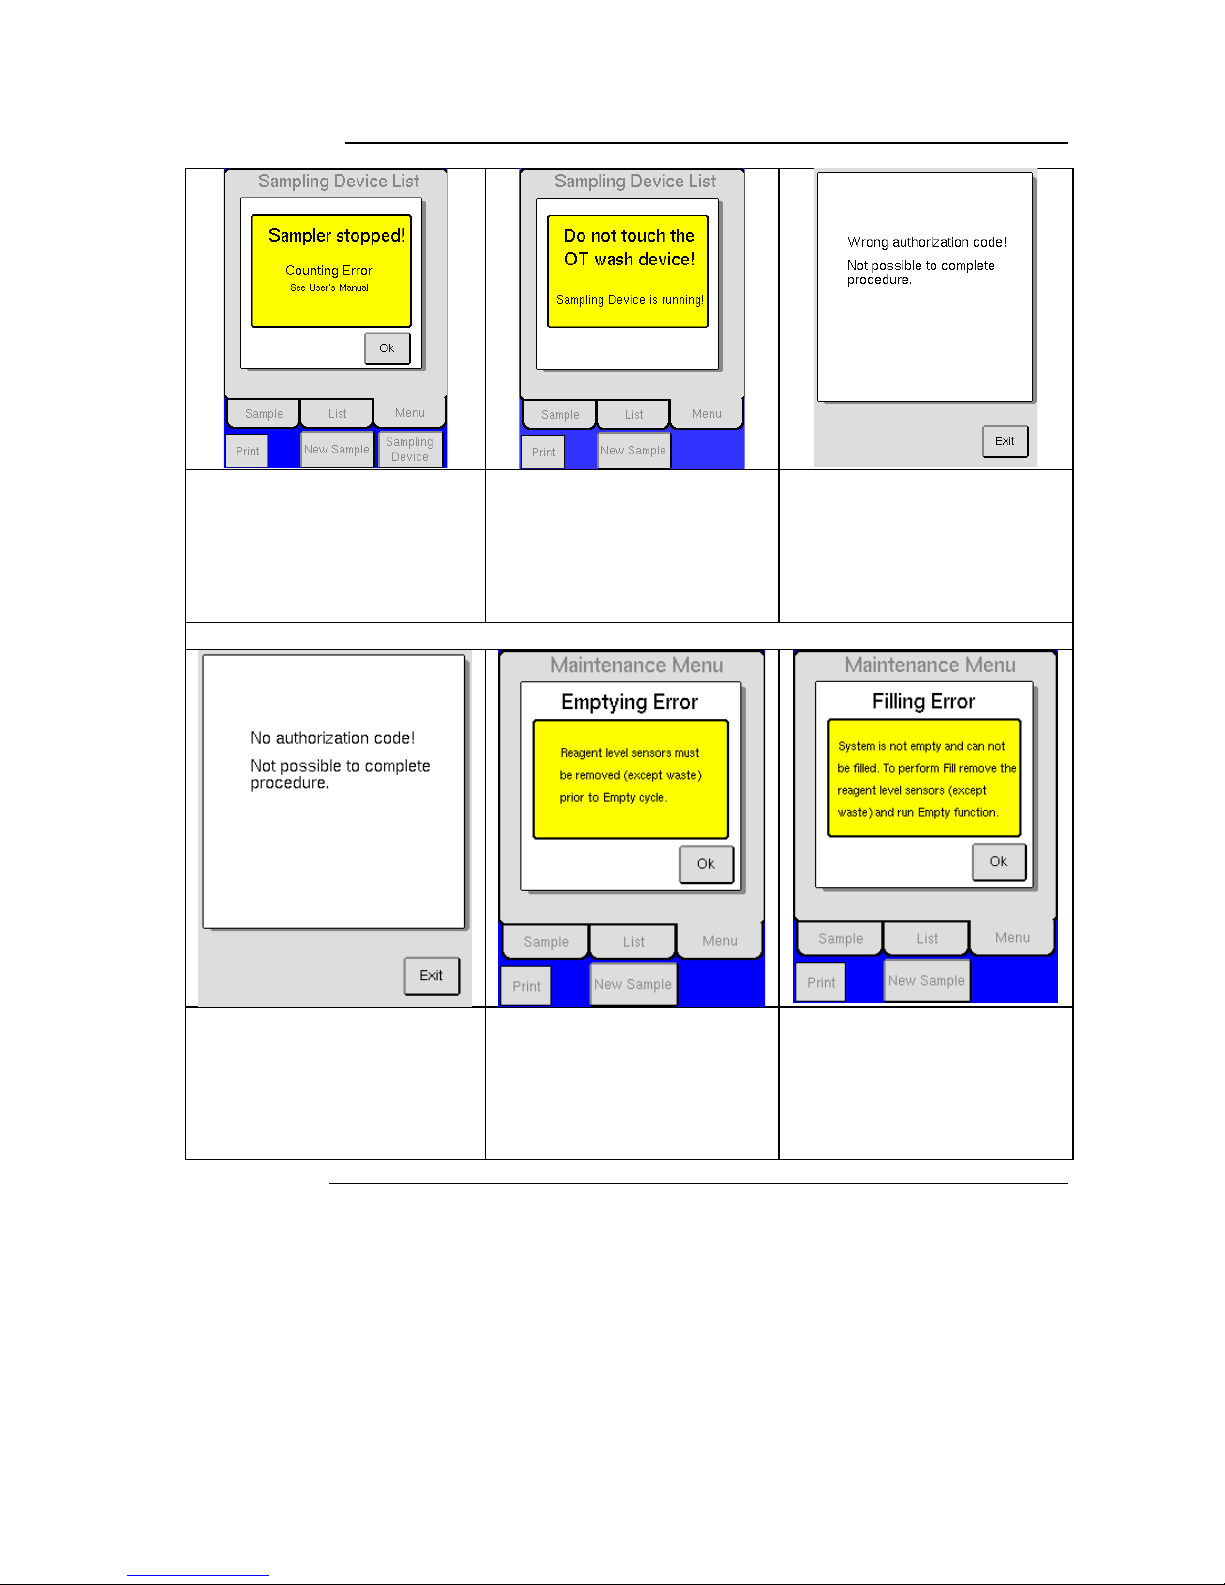
97
12.3 Warning Displays (continued)
A counting error has been detected in
Sampling Device mode. Verify that
tubes are in correct position and
order. (See Section 5.9 for more
detail.)
OT wash device was touched while
sampling device was running. See
Section 5.9 if emergency sample
analysis is needed.
Incorrect authorization code was
entered. See calibration section in
User’s Manual for entry of correct
authorization code for calibration, or
contact local distributor or
authorized service technician for
service related authorization codes.
Authorization Code and Installation Warning Displays
No authorization code was entered.
See calibration section in User’s
Manual for entry of correct
authorization code for calibration, or
contact local distributor or authorized
service technician for service related
authorization codes.
Reagent level sensors must be
removed from the reagent containers
when emptying the system. Verify
that both level sensors have been
removed.
Instrument has detected liquid in the
system. The empty cycle must be
run prior to a fill cycle. Run the
Empty function to remove any extra
liquid remaining in the system then
fill the instrument with reagents.
Continued on next page
Page 99
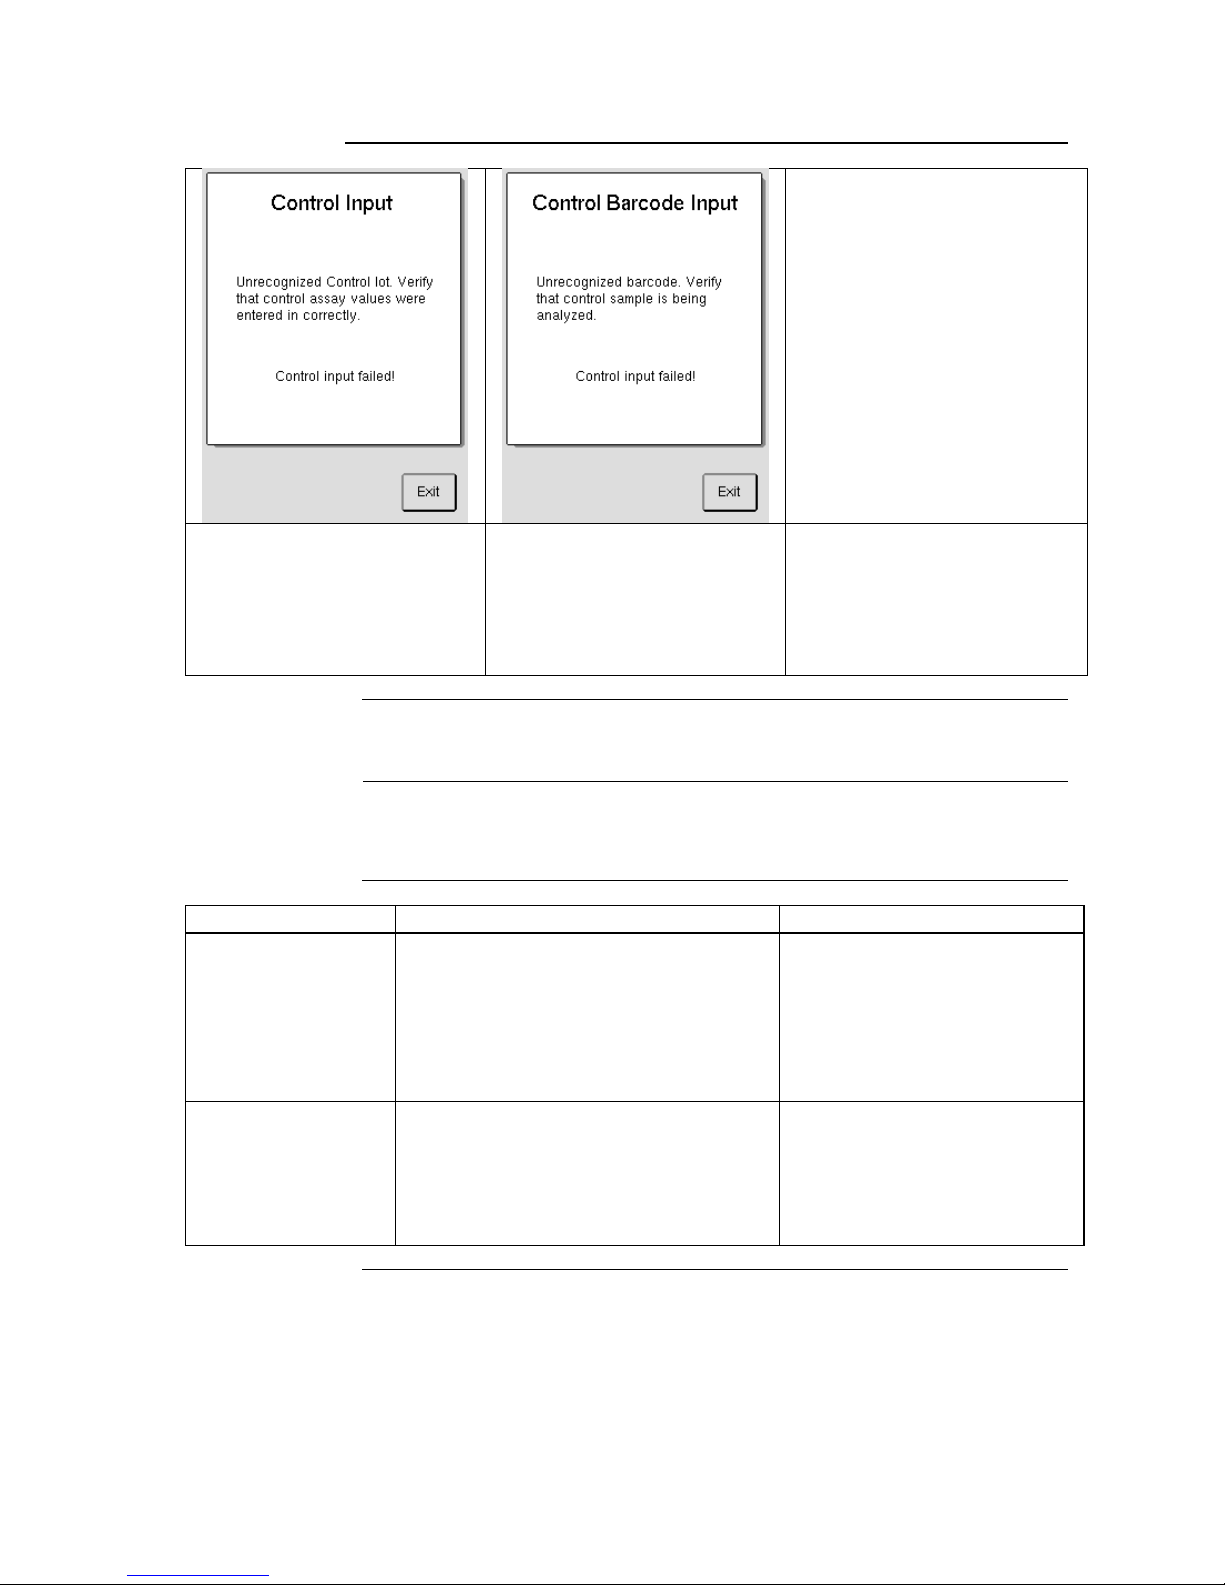
98
12.3 Warning Displays (continued)
Assay Value Input failed. The Assay
sheet or order of scanning in the
barcodes may have been incorrect.
Verify that setups on the instrument
match the required setup for the
barcode reader. (See Section 4.3
and 6.1 for more detail.)
The barcode scanned in is not
recognized as a control sample in the
system. Verify that control sample is
being scanned in. (See Section 6.1
for more detail.)
12.4 Aspiration Issues
Description
This section contains information regarding errors associated with aspiration
and the aspiration probe.
If
Then
Possible cause
No aspiration of
sample is taking place.
1. Verify that there are no leaks and tubing
is connected properly and not kinked.
2. Perform valve check in Service Menu.
3. Perform clot prevention. See Section 8.2.
4. If clot prevention cycle does not work
contact technical service representative
for Manual Clot Removal procedure.
1. Blockage of tubing or leak
causes sample to not be pulled
correctly through shear valve.
2. Valve malfunction.
3. Clot in sample caused by
incorrect sample handling or
pathologic sample.
No cleaning of
aspiration probe
1. Suggest cleaning upper area of aspiration
probe.
2. Verify that there are no leaks and tubing
is connected properly and not kinked
1. Sample tube is touching the
upper part of the aspiration
probe when analyzing.
2. Diluent is not flowing correctly
through tubing to aspiration
probe.
Page 100

99
12.5 Troubleshooting Other Issues
Description
See Troubleshooting Flowchart in Appendix A for other possible issues that
may arise. Areas on Flowcharts highlighted in dark grey should only be
performed by service technician or authorized personnel.
Indication Error
Codes
Indications error codes are specific instrument situations that in most cases
need the attention of the operator or might need service action.
The three number indications usually occur after the two number
indications. For example, an indication 302 will be displayed due to
interference with an OT analysis. It states that the OT cycle was
aborted.
The first indication display is the most important as it describes the
issue and how to solve the problem. The three digit indication after a
two digit one is added information for the user.
In most cases, the instrument is stopped and the operator has to confirm
with [OK] to continue. Once [OK] is pressed and instrument returns to
display menus, user should repeat previous actions again (e.g. re-
analyze sample, printing results, etc.)
If indication error appears again or a three digit indication was
displayed as the first indication message, contact local distributor or
authorized service technician.
Indication Series
Description
1 - 19
Indication series for auxiliary errors like battery faults or similar.
20 - 29
Indication series for ‘Liquid’ errors.
30 - 39
Indication series for Communication errors between the PCBs (CAN
bus).
40 - 49
Indication series for Printer and serial output errors.
50 - 59
Indication series for General Memory errors.
60 - 69
Indication series for EEPROM/HPC (High Performance Controller)
errors.
70 - 79
Indication series for Shear Valve problems.
80 - 89
Indication series for Cap Piercer errors (Closed Tube Adaptor).
90 - 99
Indication series for Sampling device errors.
100-255
Indication series for internal hardware and software problems, and
messages during subboard firmware upgrades.
300 -399
Indication series for cycle aborted indication numbers.
 Loading...