

Page 1

Software Help
Document Revision 5
USB-5100 Series
USB Data Loggers for Windows® and Mac®
February 2015
© Copyright 2015
Page 2
Your new Measurement Computing product comes with a fantastic extra —
Management committed to your satisfaction!
Thank you for choosing a Measurement Computing product—and congratulations! You own the finest, and you can now enjoy
the protection of the most comprehensive warranties and unmatched phone tech support. It’s the embodiment of our mission:
To provide data acquisition hardware and software that does save time and save money.
Simple installations minimize the time between setting up your system and actually making measurement s . We offer quick and
simple access to outstanding live FREE technical support to help integrate MCC products into a DAQ system.
Limited Warranty: Refer to www.mccdaq.com/legal.aspx for information about the limited warranty.
30 Day Money-Back Guarantee: Any Measurement Computing Corporation product may be returned within 30 days of
purchase for a full refund of the price paid for the product being returned. If you are not satisfied, or chose the wrong product by
mistake, you do not have to keep it.
These warranties are in lieu of all other warranties, expressed or implied, including any implied warranty of merchantability or
fitness for a particular application. The remedies provided herein are the buyer’s sole and exclusive remedies. Neither
Measurement Computing Corporation, nor its employees shall be liable for any direct or indirect, special, incidental or
consequential damage arising from the use of its products, even if Measurement Computing Corporation has been notified in
advance of the possibility of such damages.
Trademark and Copyr ight Info rmation
Measurement Computing Corporation, InstaCal, Universal Library, and the Measurement Computing logo are either trademarks
or registered trademarks of Measurement Computing Corporation. Refer to the Copyrights & Trademarks section on
mccdaq.com/legal for more information about Measurement Computing trademarks. Other product and company names
mentioned herein ar e trademarks or trade names of thei r respective companies.
© 2015 Measurement Computing Corporation. All rights reserved. No part of this publication may be reproduced, stored in a
retrieval system, or tr ansmitted, in any form by any means , electronic, mechanical, by photocopying, recording, or otherwise
without the prior written permission of Measurement Computing Corporation.
Notice
Measurement Computing Corporation does not authorize any Measurement Computing Corporation product for use
in life support systems and/or d evice s without prior written consent from Measurement Computing Corpo ration.
Life support devices/systems are devices or systems that, a) are intended for surgical implantation into the body, or
b) support or sustain life and whose failure to perform can be reasonably expected to result in injury. Measurement
Computing Corporation products are not designed with the components required, and are not subject to the testing
required to ensure a level of reliability suitable for the treatment and diagnosis of people.
SM USB-5100
Page 3

Table of Contents
About this Help Document ................................................................................................................... 6
What you will lear n from this help docu ment .................................................................................................... 6
Conventio ns in this user's guide ......................................................................................................................... 6
Where to find more information ......................................................................................................................... 6
Chapter 1
Introducing USB-5100 Series ............................................................................................................... 7
Getting Started .................................................................................................................................................... 7
Installing USB-5100 Series Software ................................................................................................................. 7
Installing USB-5100 Serie s Sof tw a r e ............................................................................................................................... 7
Checking for Software Upd ates ........................................................................................................................................ 7
A Tour of the U SB-5100 Series Software Interface ........................................................................................... 8
The Points Table ............................................................................................................................................................... 8
The Details Pane ............................................................................................................................................................... 9
The Plot ............................................................................................................................................................................10
Chapter 2
Working with USB-5100 Series Data Loggers .................................................................................. 11
Connecting Devices .......................................................................................................................................... 11
Connecting a USB logger ................................................................................................................................................11
Disconnecting a Device ...................................................................................................................................................11
Connecting Multip le Devices ...........................................................................................................................................11
Launching Devices ........................................................................................................................................... 12
Launch Logger Dialog Box .............................................................................................................................. 12
Launch Options for USB-5100 Series Data Loggers ........................................................................................ 13
Logger Information ..........................................................................................................................................................13
Sensors .............................................................................................................................................................................13
Deployment......................................................................................................................................................................14
Options.............................................................................................................................................................................15
Using Launch Utilities ...................................................................................................................................... 15
Configuring a Filt er Series at Launch ..............................................................................................................................15
Configuring a Data Assistant (Scaling) ............................................................................................................................16
Configure Alarms ............................................................................................................................................................18
Statistics: Maximum, Minimum, Average, and Standard Deviation ................................................................ 20
Filtered Series vs. Statistics Lo ggi ng ................................................................................................................ 21
Burst Logging ................................................................................................................................................... 22
Checking the Device Status .............................................................................................................................. 24
The Status Dialog Box ...................................................................................................................................... 25
Device Identification ........................................................................................................................................................25
Device Details ..................................................................................................................................................................25
Current Readings .............................................................................................................................................................25
Stopping a Device ............................................................................................................................................. 26
Chapter 3
Reading Out, Plotting, and Analyzi n g Data ...................................................................................... 27
Reading Out Data ............................................................................................................................................. 27
Plotting Data ..................................................................................................................................................... 28
Opening Files .................................................................................................................................................... 30
Working with Plots ........................................................................................................................................... 30
Actions .............................................................................................................................................................. 31
Menus ............................................................................................................................................................... 31
Using the Arrow Tool ....................................................................................................................................... 32
3
Page 4

Using the Crosshair Tool .................................................................................................................................. 32
Zooming, P anning, and Smart Scaling Plots .................................................................................................... 33
Zooming ...........................................................................................................................................................................33
Panning ............................................................................................................................................................................33
Smart Scaling ...................................................................................................................................................................33
Copying the Plot ............................................................................................................................................... 34
Closing a Pl ot ................................................................................................................................................... 34
Printing Plot Elements ...................................................................................................................................... 34
Printing a Graph ...............................................................................................................................................................34
Printing Points and Details ...............................................................................................................................................34
Chapter 4
Modifying a Plot .................................................................................................................................. 35
Setting Properties for Plo t E lements ................................................................................................................. 35
Setting Axis Properties ....................................................................................................................................................36
Setting Series Properties ................................................................................................................................... 37
Setting Legend Properties ................................................................................................................................. 38
Setting Title Properties ..................................................................................................................................... 39
Setting View Properties .................................................................................................................................... 39
Adding a Graph Label ...................................................................................................................................... 40
Moving a Series from Front to Back on the Plot .............................................................................................. 41
Filtering a Series ............................................................................................................................................... 41
Removing a Se ries from a Plot ......................................................................................................................... 42
Copying a Series to Another Plot ..................................................................................................................... 42
Overlaying Series .............................................................................................................................................................42
Merging Files .................................................................................................................................................... 43
Converting Units............................................................................................................................................... 44
Undoing and Redoing Plot Changes ................................................................................................................. 44
Saving Project Files .......................................................................................................................................... 45
Using the Linear Data Assistant (USB-5106 Only) .......................................................................................... 45
Default Settings................................................................................................................................................................45
Hiding Assistants .............................................................................................................................................................45
Updating the Linear Scal ing Assistant .............................................................................................................................45
License Agreement ..........................................................................................................................................................45
Linear Scaling Assistant ................................................................................................................................... 45
Using the Linear Scaling Assistant ..................................................................................................................................46
Exporting Da ta .................................................................................................................................................. 47
Exporting Table Data ........................................................................................................................................ 47
Exporting Details .............................................................................................................................................. 48
Formatting the Date/Time Column in Excel ..................................................................................................... 48
Chapter 5
Hardware Reference ........................................................................................................................... 49
Updating U S B-5100 Series Logger Firmware .................................................................................................. 49
Determining the installed firmware version: ....................................................................................................................49
Updating the firmware .....................................................................................................................................................49
Fixing a Read Header Failed Error ................................................................................................................... 50
Chapter 6
Preferences .......................................................................................................................................... 51
Setting Preferences ........................................................................................................................................... 51
General Preferences .......................................................................................................................................... 51
4
Page 5

Export Settings .................................................................................................................................................................51
Selecting Devices .............................................................................................................................................................51
File Associations ..............................................................................................................................................................52
Startup ..............................................................................................................................................................................52
Data Encoding .................................................................................................................................................................52
Export Settings ................................................................................................................................................. 52
Communications Preferences ........................................................................................................................... 53
Other Options ...................................................................................................................................................................53
Plotting Preferences .........................................................................................................................................................54
Fonts ................................................................................................................................................................................54
Layout ..............................................................................................................................................................................54
Points Table & Details Pane ............................................................................................................................................54
Gridlines ..........................................................................................................................................................................54
Plot Setup .........................................................................................................................................................................54
Other Options ...................................................................................................................................................................55
Undo & Redo ...................................................................................................................................................................55
Display Preferences .......................................................................................................................................... 55
Default Units ....................................................................................................................................................................55
Date/Time ........................................................................................................................................................................55
Series ...............................................................................................................................................................................56
Warnings Preferences ....................................................................................................................................... 56
General .............................................................................................................................................................................57
Warnings Before the Launch Screen ................................................................................................................................57
Warning After the Launch Screen ....................................................................................................................................57
Restoring Default Preferences .......................................................................................................................... 58
Menus ............................................................................................................................................................... 58
The USB-5100 Series Menu ............................................................................................................................................58
The File Menu ..................................................................................................................................................................59
The Device Menu .............................................................................................................................................................59
The Edit Menu .................................................................................................................................................................60
The View Menu ...............................................................................................................................................................61
The Window Menu ..........................................................................................................................................................61
The Help Menu ................................................................................................................................................................61
The Toolbar ...................................................................................................................................................... 62
Setting the Language/Format on Your Computer ............................................................................................. 63
On Windows 7 and Windows 8 .......................................................................................................................................63
On Windows XP ..............................................................................................................................................................63
On Macintosh OS X .........................................................................................................................................................63
5
Page 6
About this Help Document
What you will learn from this help docume nt
This help document describes the Measurement Computing USB-5100 Series.
Conventions in this user's guide
Note
Text presented in a box signifies ad ditional information related to the subject matter.
bold text Bold text is used for the names of objects on a screen, such as buttons, text boxes, and check boxes.
italic text Italic text is used for the names of manuals and help topic titles, an d t o emphasize a word or phrase.
Where to find more informati on
Additional information about USB-5100 Series is available on our website at www.mccdaq.com. You can also
contact Measurement Computing Corporation with specific questions.
Knowledgebase:
Tech support form:
Email:
Phone: 508-946-5100 and follow the instructions for reaching Tech Support
techsupport@mccdaq.com
kb.mccdaq.com
www.mccdaq.com/support/support_form.aspx
6
Page 7

Chapter 1
Introducing USB-5100 Series
USB-5100 Series is used for launc hing, reading out, and plotting dat a from USB-5100 Series data loggers.
Launch and read out USB-5100 Series data loggers
Check the logger status and current readings
Plot, filter, and export data
Save changes to graphs in a project file
Getting Started
Follow the instructions in the USB-5100 Series Getting Started to install the software, connect your logger,
launch, and readout data. You can expect to be comfortable with software fundamentals w i thin a few minutes.
For an introduction to the software interface, see
A Tour of the USB-5100 Series Interface.
Installing USB-5100 Serie s Software
You can download and install USB-5100 Series software from the MCC website.
Note: You must be an administra tor to install USB-5100 Series software.
If you have additional questions, please contact MCC Technical Support.
Installing USB-5100 Series Software
Refer to the ReadMe.rtf file installed with the software for detailed information about the s ystem
requirements needed to run USB-5100 Series.
Installing on Windows
You must be an administrator to install USB-5100 Series.
1. Download t he USB-5100 Series for Windows from
The Java™ R untime Environment is required. If the correct Java Runtime Environment version is not
already installed on your computer, the setup program asks if you want to install it. Click
the prompts. After the Java Runtime E nvironment is installed, the software installation continues.
2. Run the
3. Launch the software by double-clicking the USB-5100 Series icon .
The software is installed by default to \Measurement Computing\USB-5100 Series.
Installing on Macintosh
USB-5100 Series_Setup.exe installer file and follow the onscreen instructions.
www.mccdaq.com/Software.
Yes and follow
1. Download t he USB-5100 Series for Mac OS X from
2. Open the
onscreen ins tructions.
3. Click
your logger until you have restarted.
4. After restarting, launch the software by double-clicking the USB-5100 Series icon in the computer
Applications folder.
USB-5100 Series_Installer.dmg file, run the USB-5100 Series.pkg package file, and follow the
Restart when you reach the final screen of the installation program. The software does not recognize
www.mccdaq.com/Software.
Checking for Software Updates
Periodically check for updates to USB-5100 Series at www.mccdaq.com/Software.
7
Page 8
USB-5100 Series Software Help Introducing USB-5100 Series
2
Details pane
A Tour of the USB-5100 Series Software Interface
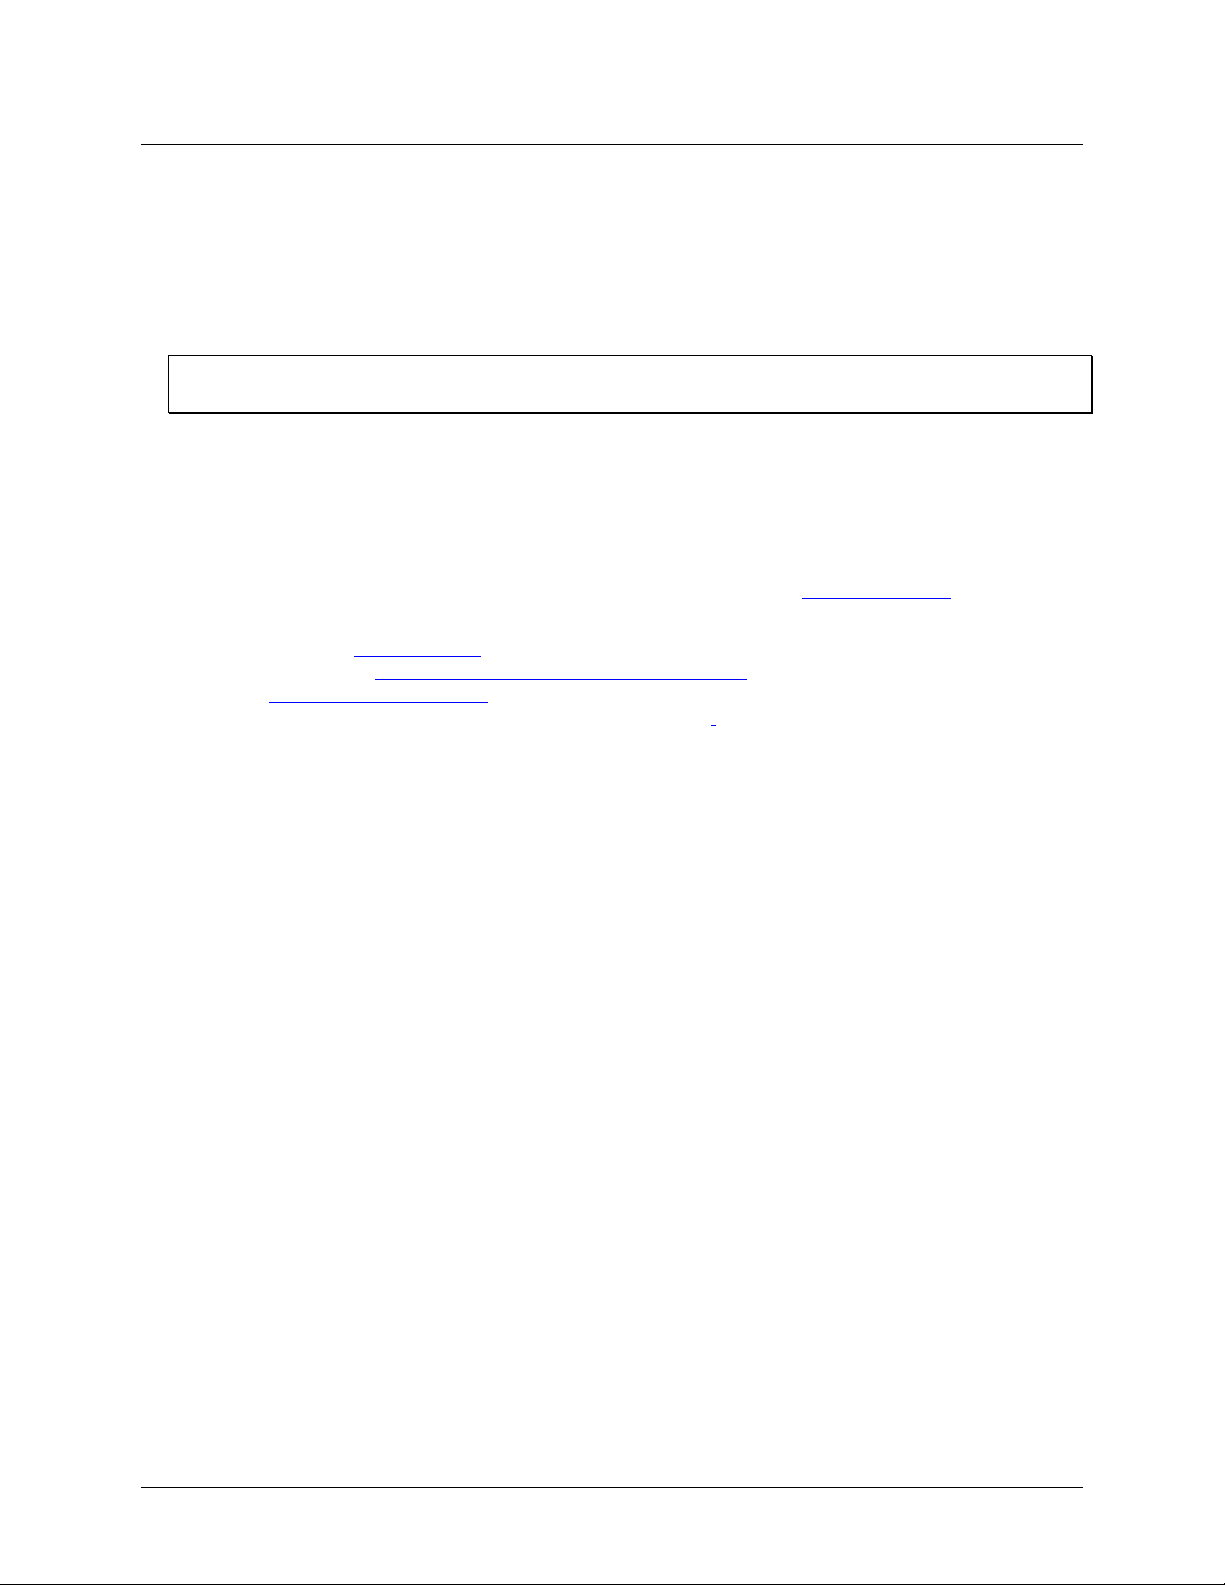
This is the ma in USB-5100 Series window. Use the menu bar or tool bar to access all the features within the
software. The status bar at the bottom of the window shows the current view in place (as selected from the
Window menu) as well as the device currently selected or connected.
1 Points table 3 Plot
Figure 1. Main USB-5100 Series Window
This example shows a file that has been opened and plotted. There are three components to a plotted data file:
the Points Table, the Details Pane, and the Plot.
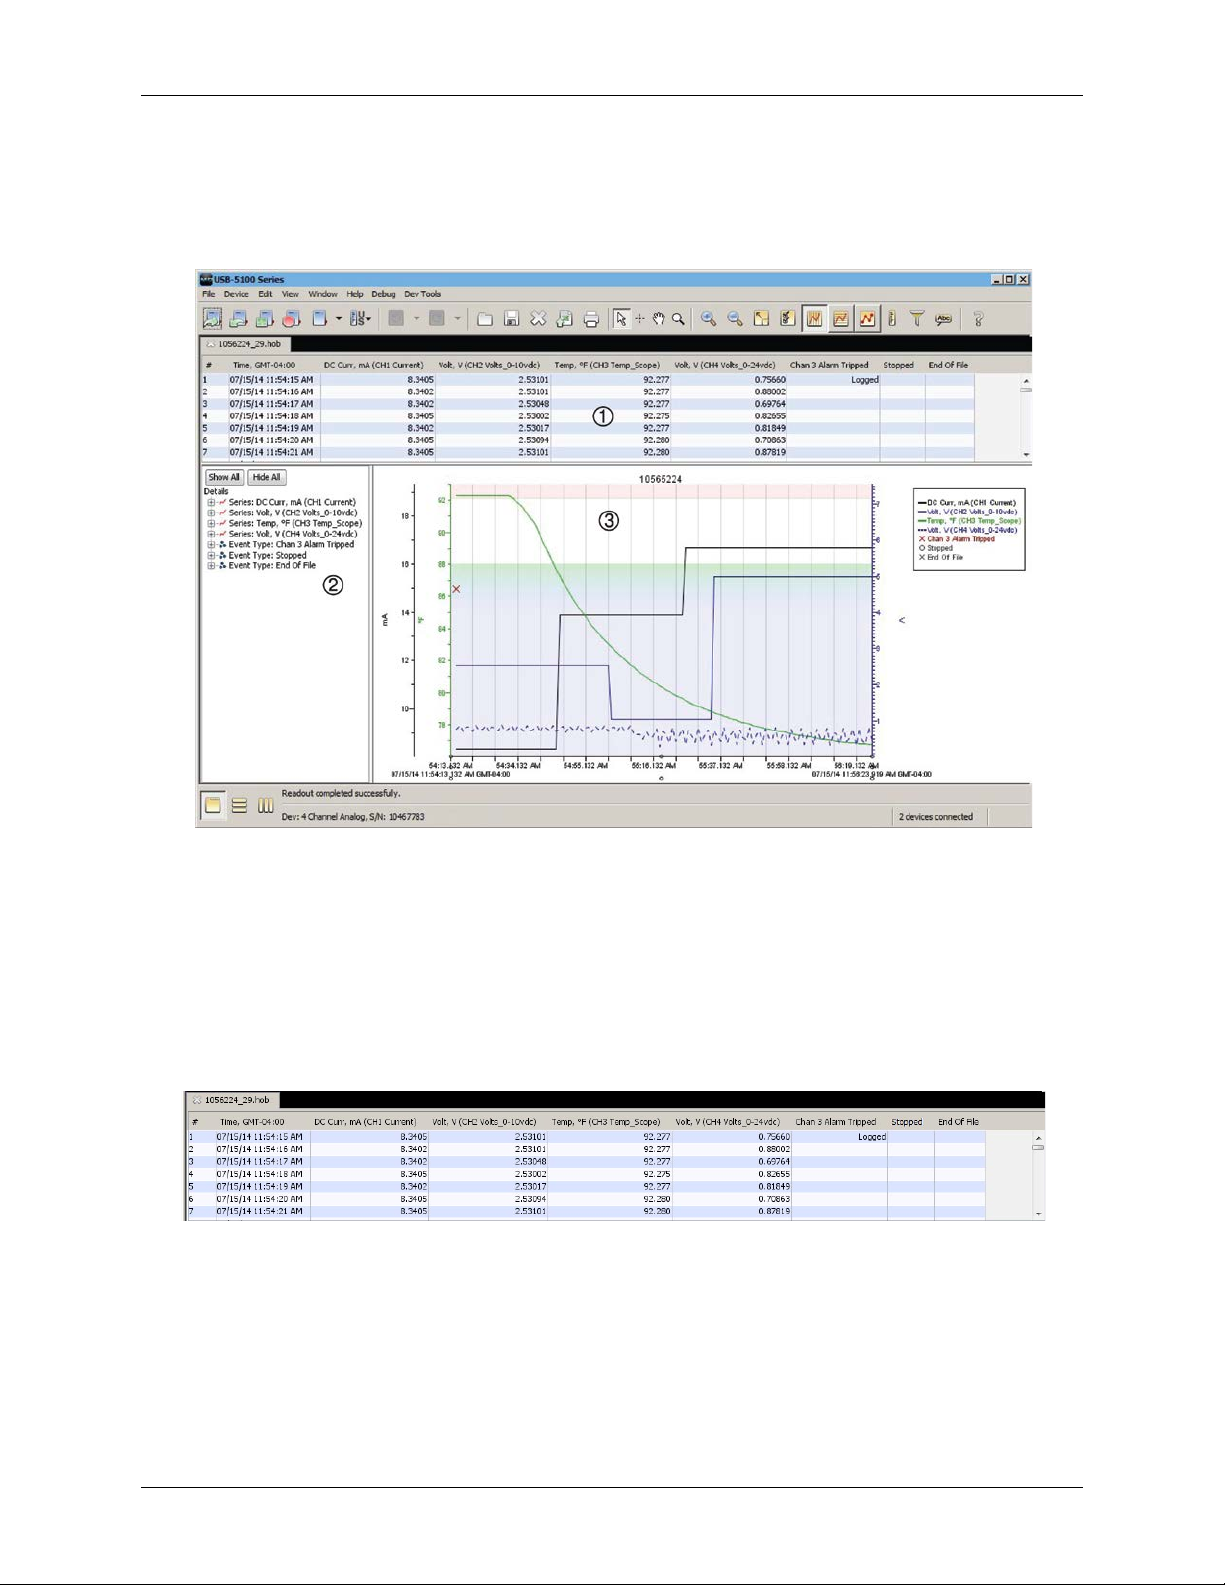
The Points Table
The Points Table lists data po ints (values) and logged events displayed in the plot. The Points Table is linked to
the graph – only the data for the series and events on the plot are listed in the Points Table.
Figure 2. Points Table
The data points are listed chronologically. Each point or event is listed in a single row and each series or event
type is displayed in a column. You can resize the columns by clicking and dragging the dividers between the
column headers.
8
Page 9
USB-5100 Series Software Help Introducing USB-5100 Series
Deployment information, such as the launch description, deployment number, start time and time zone,
logging interval, and battery voltage at launch.
Series statistics, such as the total number of sensor samples and events, time of the first and last sample, and
To navigate the Points Table:
Use the arrow keys or scroll bars to move up, down, left, and right in the Points Table.
Click the crosshair tool in the plot to select the corresponding point in the Points Table.
Click a value or event cell in the Points Table to display the crosshair on the graph at the time
corresponding to that cell.
To resize the pane, drag the divider between the Points Table and the plot.
To hide the Points Table, clear the
View»Points Table checkbox option.
To hide the Points Table by default when you plot data, complete the follo wing steps:
1. Select
2. Clear the
File»Preferences»Plotting»Layout.
Show the points table when plotting data checkbox.
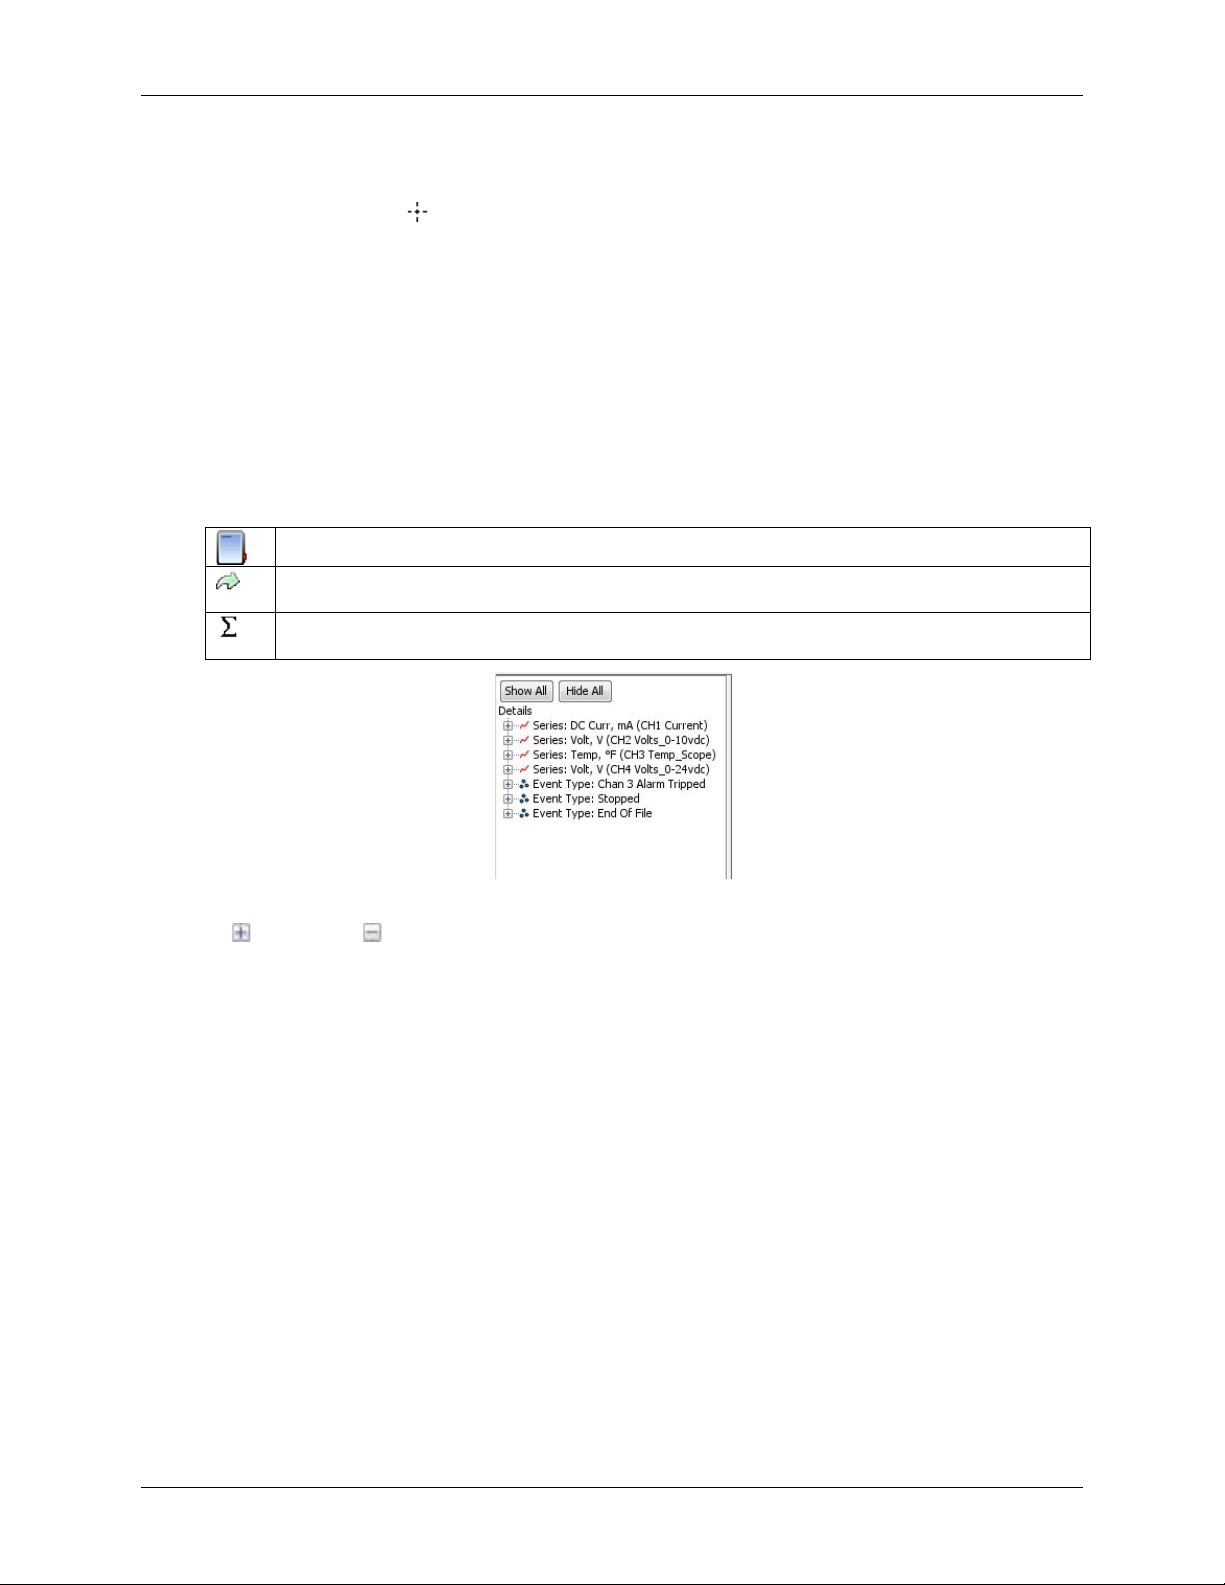
The Details Pane
The Details Pane shows information for each series and event displayed in the plot including:
Information about the devices, such as model and serial numbers.
the maximum, minimum, average, and standard deviation for each sensor series in the plot,
Figure 3. Details Pane
Click to expand or to collapse an entry in the Details Pane. Click Show All/Hide All to expand or collapse
the entire details tree.
Click a series node in the details tree to select the corresponding series on the graph and corresponding column
in the Point s Table.
To resize the pane, drag the divider between the Details pane and the graph.
To hide the Details Pane, clear the
View»Details Pane checkbox option.
To hide the Points tab le by default when you plot data, comple te the following steps:
1. Select
2. Clear the
File»Preferences»Plotting»Layout.
Show the details table when plotting data checkbox.
9
Page 10
USB-5100 Series Software Help Introducing USB-5100 Series
The Plot
The plot displays the data series and events in a graph. The plot has a time axis (x-axis) and a value axis (y-axis)
for each series selected in the Plot Setup dialog box. The title is displayed at the top of the plot by default. The
title text comes from the Description field in the Plot Setup dialog box.
The legend lists the ke ys ( line colors and marker types) for each series, and is displayed to the right of the plot
by default. If the crosshair tool is in use, it also lists the date, time and point values currently selected by the
crosshair.
Figure 4. Plot Display
To hide the title, clear the View»Title checkbox.
To hide the legend, clear the
View»Legend checkbox.
Double-click a plot element (series, axis, title, or legend) to change its properties, or right-click the plo t a nd
select the item from the context menu.
For more information about working with the plot, see
Reading Out, Plottin g, and Analyzing Data
.
10
Page 11
Chapter 2
Working with USB-5100 Series Data Loggers
Working with USB-5100 Series data loggers involves the following basic steps:
1. Connect the logger to the computer for the initial setup and launch.
2. Configure the options for the logger deployment and then launch the logger.
3. Check the status of the logger and any existing readings while it is still connected to the co mputer . This
helps verify that the launch is configured as expected.
4. After deploying the logger, read out all recorded data and save it to a file.
5. After reading out the logger and saving the data, select and define the data series to plot in a graph. Data
Assistants may be available for ce rtain loggers to automatically scale data whe n plotting.
6. Analyze the data and customize the plot using the tools for exporting, filtering, merging files, and more.
7. Save changes to the axis, series, plot, a nd le gend properties as well as any filtering or merging to a project
.hproj).
file (
Connecting Devices
Connect a USB-5100 Series data logger to the computer with the USB cable that shipped with the device.
Once a device is properly connected to the computer as described below, the device name is listed in the status
bar at the bottom of the main USB-5100 Series window.
Note (Windows only)
If the device has never been connected to this computer before, it may take some time for the computer to detect
the new device and report that it has connected successfully. One or more messages display, indicating that new
hardware has been found. You may also hear a chime.
Your computer may prompt you to reboot before you can use the device. It is not necessary to reboot.
Connecting a USB logger
To connect a logger to a computer using a USB cable, complete the following steps:
1. Launch the USB-5100 Series software.
2. Plug the large end of the USB interface cable into a USB port on the computer.
3. Plug the small end of the USB interface cable into the port on the device.
Disconnecting a Dev ice
To disconne ct the logger, unplug the USB cable.
Connecting Multiple Devices
If your computer has multiple USB ports, you can connect multiple loggers and work with them one at a time.
When multiple loggers are connected, the Select Device dialog box opens every time you select
Readout, Stop, or Status from the Device menu. Click the button ne xt to a device to select it, then click OK.
The selected action then proceeds. The status bar lists the number of devices connected.
To display the Select Device dialog box at any time, click the
Device»Select Device. Check the serial number (S/N) on your devices to make sure that it matches the one
selected in this dialog box.
Select Device icon on the toolbar, or select
Launch,
11
Page 12
USB-5100 Series Software Help Working with USB-5100 Series Data Loggers
Launching Devices
To set up a logger to record data, you must configure several options and launch the logger.
To launch a l ogger, complete the following steps:
1. Connect the logger to the computer.
2. Click the
3. Different messages may display depending on the state of the logger. Answer each of the prompts
accordingly.
Note
A warnin g displays if the logger has already been launched. Click Yes to continue or click No to cancel.
A warning displays if the logger has recorded data since its last readout. Click Yes to proceed to the Launch
Logger window, or click No to cancel the launch and read out the data first. Because loggers are tested before
shipping, there may be data in your log ger the first time you launch it. In this case, it is not necessary to read out
the logger. Click Yes to proceed.
4. Select the options for the launch in t he Launch Logge r dialog box.
5. Click
depending o n when you chose logging to begin. The software d isplays the progress of the launch and warns
you not to unplug the logger while it is being configured.
Once the logger begins logging, it continues logging until the memory i s f u ll (if configured for this condition),
the logger is stopped, or the battery runs out.
Launch icon on the toolbar, or select Device»Launch.
Start when you finish configuring launch settings. Note that the caption on the Start b utton changes
Launch Logger Dialog Box
Use the Launch Logger dialog box to set up your logger to record data. The Launch Logger dialog box is
divided into the following three p a nes:
Logger Information: The name of the logger currently selected displays at the top of this pane, a lo ng wit h
the serial number, deployment number, and current battery level.
Use the Description field to enter a name (up to 40-characters) for the logger deployment. The description
is used as the default file name when you read out the logger and save the data. It is also the default title on
the plot. For new loggers, the description defaults to the logger serial n umber.
Status in this pane to see the current status of the logger and the settings used on the previous launch.
Click
Sensors: This pane displays a list of the sensors available for the logger. Choose the sensors, or channels,
that you want to log in this deployment, select any external sensors you may be using, and type labels for
sensors as needed. Labels may not be applied to some calculated or derived channels, such as filtered
series. This pane also disp lays any utilities available for your logger, such as Alarms, Scaling, and Filters.
Deployment: Use this pane to configure the logging interval and when the logger begins recording data.
Loggers ca n be configure d to start logging immediatel y, on a specific date/time, at an interval, or by
pushing the button.
This pane also displays the loggin g d ura tion, which is the approximate time it takes to fill the logger
memory based on the logging interval, sensors, and other configured options. You can also set a sampling
interval, a stop logging condition, and turn on/o ff the LCD.
When you are done configuring the launch options, click (
of the dialog box to send the settings to the logger. That the button text varies depending on the configured Start
Logging mode.
Button/Delayed) Start in the lower ri ght-hand corner
12
Page 13
USB-5100 Series Software Help Working with USB-5100 Series Data Loggers
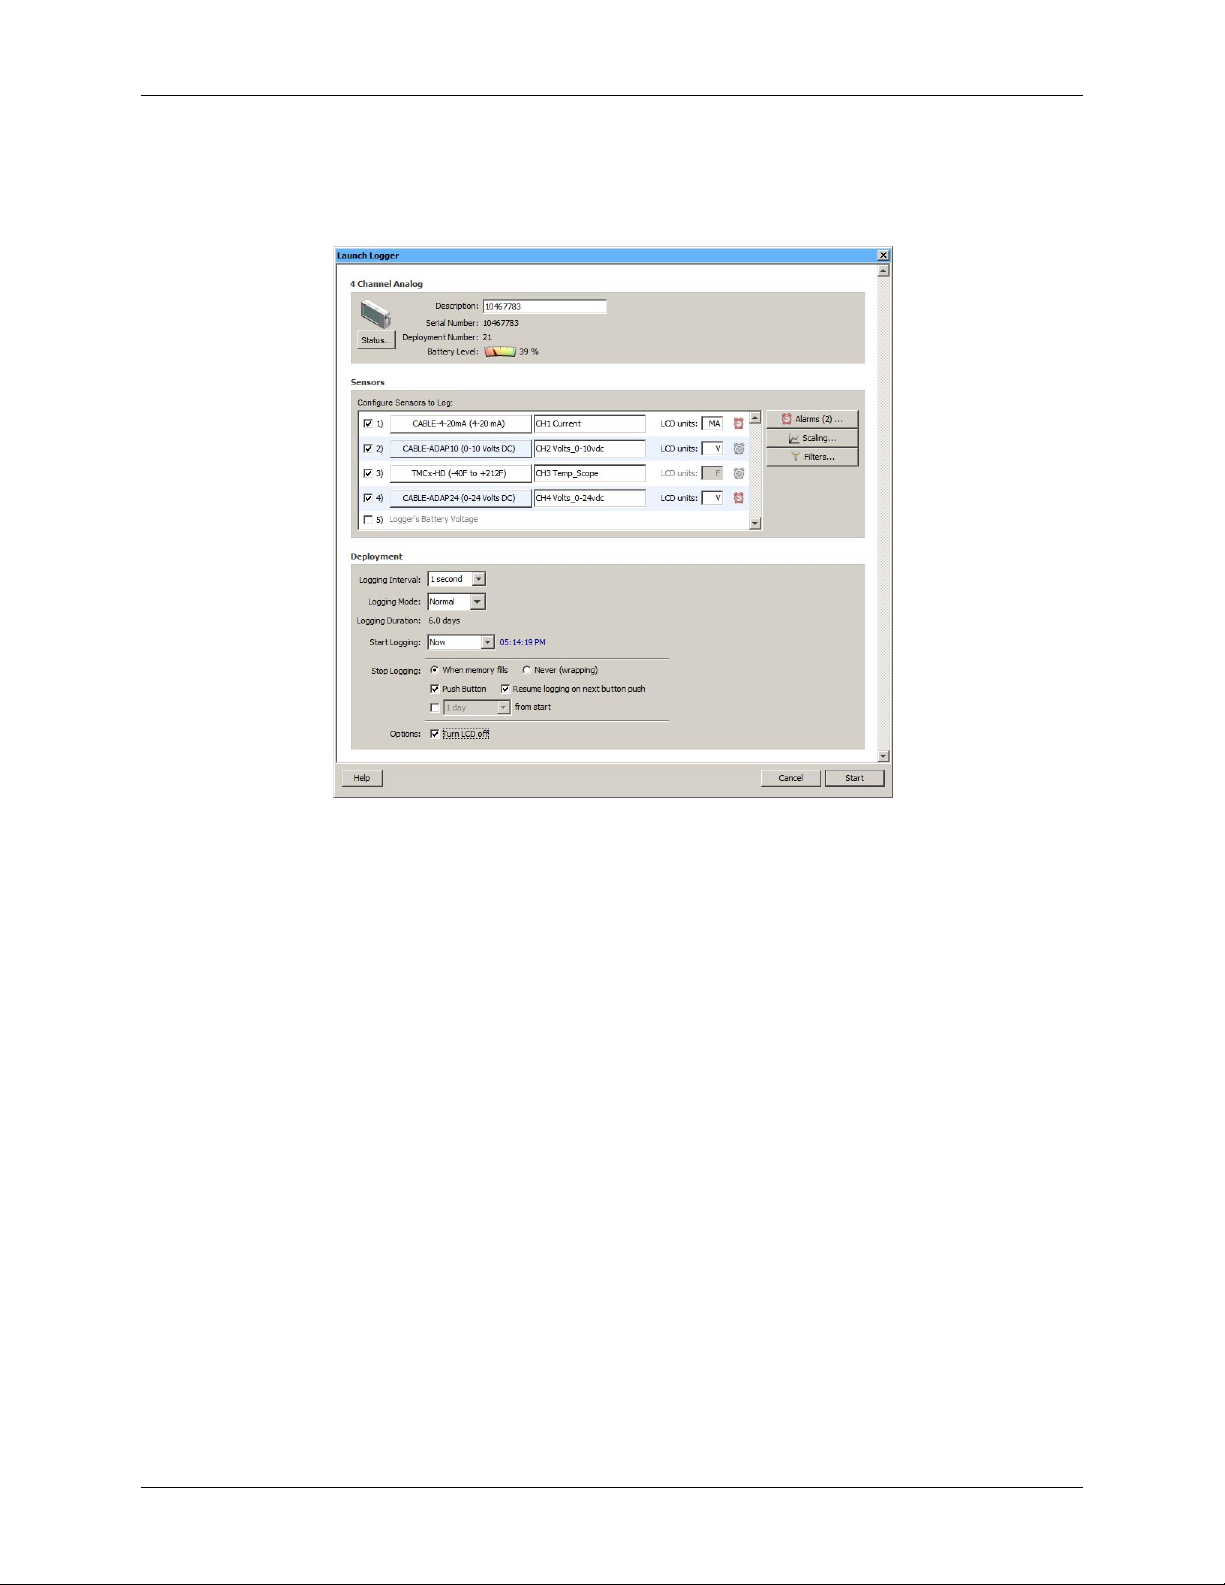
Launch Options for USB-5100 Series Data Loggers
Select Device»Launch to display the Launch Logger dialog box. The following launch options are available for
USB-5100 Series data loggers.
Figure 5. Launch Logger Dialog Box
Logger Information
Description: Enter a description (up to 40 characters) for the launch. This description is used as the default
file name when you read out and save the data recorded by the logger. It is also the default title of the plot.
Serial Number: Displays the serial number of the logger
Deployment Number: Displays the number of times (including this time) that the logger has been
launched.
Battery Level: Displays the current battery level in the logger.
Status button: Click Status to display the lo gger settings from the previous launch.
Sensors
The Sensors list displays all sensors available to reco r d data. Choose the sensors (channels) that you want to log
in this deployment, and select the appropriate sensor type from the listbox. Enter a label for the sensor as
needed.
To change temperature units, select
US (°F) units.
or
If you are launching an analog sensor, you can also enter a custom unit (up to three characters) to display on the
LCD screen.
Although it is useful to see the connected sensors/devices when setting up the launch, it is not r e quired that
you physically connect them while selecting sensor type options. You can set up the launch for a delayed or
push button start, then connect the sensors/devices later, before logging begins.
Important: Sensors that are connected after logging begins may not log accurate data.
File»Preferences»Display»Default Unit System and select either SI (°C)
13
Page 14

USB-5100 Series Software Help Working with USB-5100 Series Data Loggers
Click the Alarms button to set an alarm for this logger. Note that the Logging Mode must be set to Normal
or Statistics to configure an alarm. For thermocouple loggers, alarms can only be configured on
thermocouple channels; they are not available on the internal 10 K thermistor (temperature) channel.
Click the
Filters button to create additional filtered ser ies for any of the configured channels. The filtered
series is automatically calculated when you read out the logger and plot the data.
You can record the logger battery voltage at each samp le time; this is the last channel in the sensors list.
Like the other data channels, loggi ng the internal battery channel consumes some of the logger memory.
Unless you suspect abnormal battery performance, you do not need to log the battery voltage. You can also
hide the battery channel with Series preferences (
File»Preferences»Display»Series).
Although it i s po ssible to set up more than one scaling value for each sensor, only the first scaling value for
that sensor will be used.
Labels do not apply to all calculated or derived channels, such as filtered series channels.
Deployment
Logging Interval: Select how often the logger records data. You can choose either one of the preset
logging intervals or specify a custom logging interval. The minimum logging interval is one s econd and t he
maximum interval is a
interval, the more quickly memory fills and battery power is consu med .
Logging Mode: Select Normal, Burst Logging, or Statistics logging mode.
Normal: Configures the logger to collect data at the selected logging interval.
o
Burst Logging: Configures the logger to use a different logging interval when specific conditions are
o
met. Burst logging is not available for the internal temperature channel (if available).
The Burst Logging interval must be less than the Logging Interval.
Statistics: Configures the logger to calculate maximum, minimum, average, and standard deviation
o
during logging for all enabled sensors except battery voltage. The more statistics you record, the
shorter the logger duration and the more memory is required. Once you launch the logger, the selected
statistics are displayed on the logger LCD. Statistics logging is not available for the internal
temperature channel.
If you select Burst or Statistics logging, an Edit button displays next to Logging Mode in the Launch
Logger dialog box. Click this button to make additional changes as necessary.
If you select Normal or Statistics logging, you can click
Filters to create additional filtered series for any of the channels you configured. The filtered series is
Click
automatically calculated when you read out the logger and plot the data.
You can record the logger battery voltage for each sample. Lo gging the internal battery channel consumes
logger memory. Unless you suspect abnormal battery performance, you do not need to log the battery
voltage. The logger records a bad battery event even if it is not logging the battery channel. You can also
hide the battery channel with Series preferences (select
Logging Duration: Calculates the approximate time it takes to fill the logger memory based on the logging
interval, logging mode, and sensors currently selected. This is an estimate only – battery life and other
factors also affect the duration.
Start Logging: Select one of the following options to launch the logger:
Now: Logging begins as soon as you click Start in the Launch Logger dialog box.
o
At Interval: Logging begins at an exact interval (for example 9:00:00 rather than 8:47:00 when you
o
choose a one-hour logging interval). The exact st art time depends on the logging inte rval you choose.
On Date/Time: Logging begin at a date and time you enter, up to approximately six months from the
o
present. The LCD screen counts down to that start date/time and then log gin g be gins.
Push Button: Logging starts when you press the Start/Stop button on the logger and hold it down for
o
at least three seconds. The LCD screen on the logger displays
Stop Logging: Select one of the following options to stop the logger:
When memory fills: The logger stops recording data once the memory is full.
o
Never (wrapping): The logger records data continuously until either the logger batte ry runs out or you
o
stop it. When the logger memory is full, the newest data overwrites the oldest data. A wrap indicator
icon displays on the logger LCD screen.
Custom interval of 18 hours, 12 minutes, and 15 seconds. The shorter the logging
Alarms to set an alarm for the logger.
File»Preferences»Display»Series).
Start until you press the button.
14
Page 15

USB-5100 Series Software Help Working with USB-5100 Series Data Loggers
o Push button: The logger stops recording data whe n you press the Start/Stop button on t he logger for
three seconds. The LCD screen on the logger displays
Resume logging on next button push: Only a va ila b le whe n Push button is selected as a Stop
o
Logging
option. You can resume a stopped logger when the next logging interval is reached by
Stop when this option has been selected.
pressing the Start/Stop button for thre e sec onds.
For example, you launch the logger and it s tarts logging immedia tely at 9:45:00 am with a logging
interval of 1 hour. You press the Star t/Stop logging button once at 10:15:00 am to stop logging. You
press the Start/Stop loggi ng button once again at 11:20:00 am to start logging. The logger does log
another sample until 11:45:00 a m, which is the next sampling interval based on the 1-hour logging
interval. Y ou can then continue to start and stop logging as often as you'd like during this same
deployment. Any gaps between when you stopped and restarted logging during this deployment are
reflected on the plotted data when you read out the logger. Once you relaunch the logger with the
software, a new deployment and data file is created. The data from the previous deployment is not
carried over to the new one.
Specific stop date: Select the date you want the logger to stop recording data. Choose either a preset
o
time or set your own custom date and time.
If you select a specific stop date and also have the logger configured to resume logging on the next
button push, then the logger stops logging at the date you select regardless of how many times you stop
and restart the logger with the Start/Stop button.
Options
Turn LCD off: Configure the logger to operate in stealth mode with the L C D screen turned off. You can
override this temporarily by pressing the Start/Stop button on the logger to turn the LCD on for 10 minutes.
Important: After you choose the launch settings in this dialog box and click Start, the settings are then loa ded
into the logger. The LCD screen on the logger does display
logger fro m t he USB cable before this process is finished,
Err at any point during launch configuration, chec k the USB connection between the computer and the logger,
LOAD during this process. If you disconnect the
Err displays on the LCD screen instead. If you see
reopen the Launch Logger dialog box and click Start again.
Using Launch Utilities
The Launch Logger dialog box includes the followin g utilities for setting up customized data series, configuring
alarms, and setting advanced logger options:
Filters
Alarms
Statistics: Maximum, Minimum, Average, and Standard Deviation
Filtered Series vs. Statistics Lo gging
Burst Logging
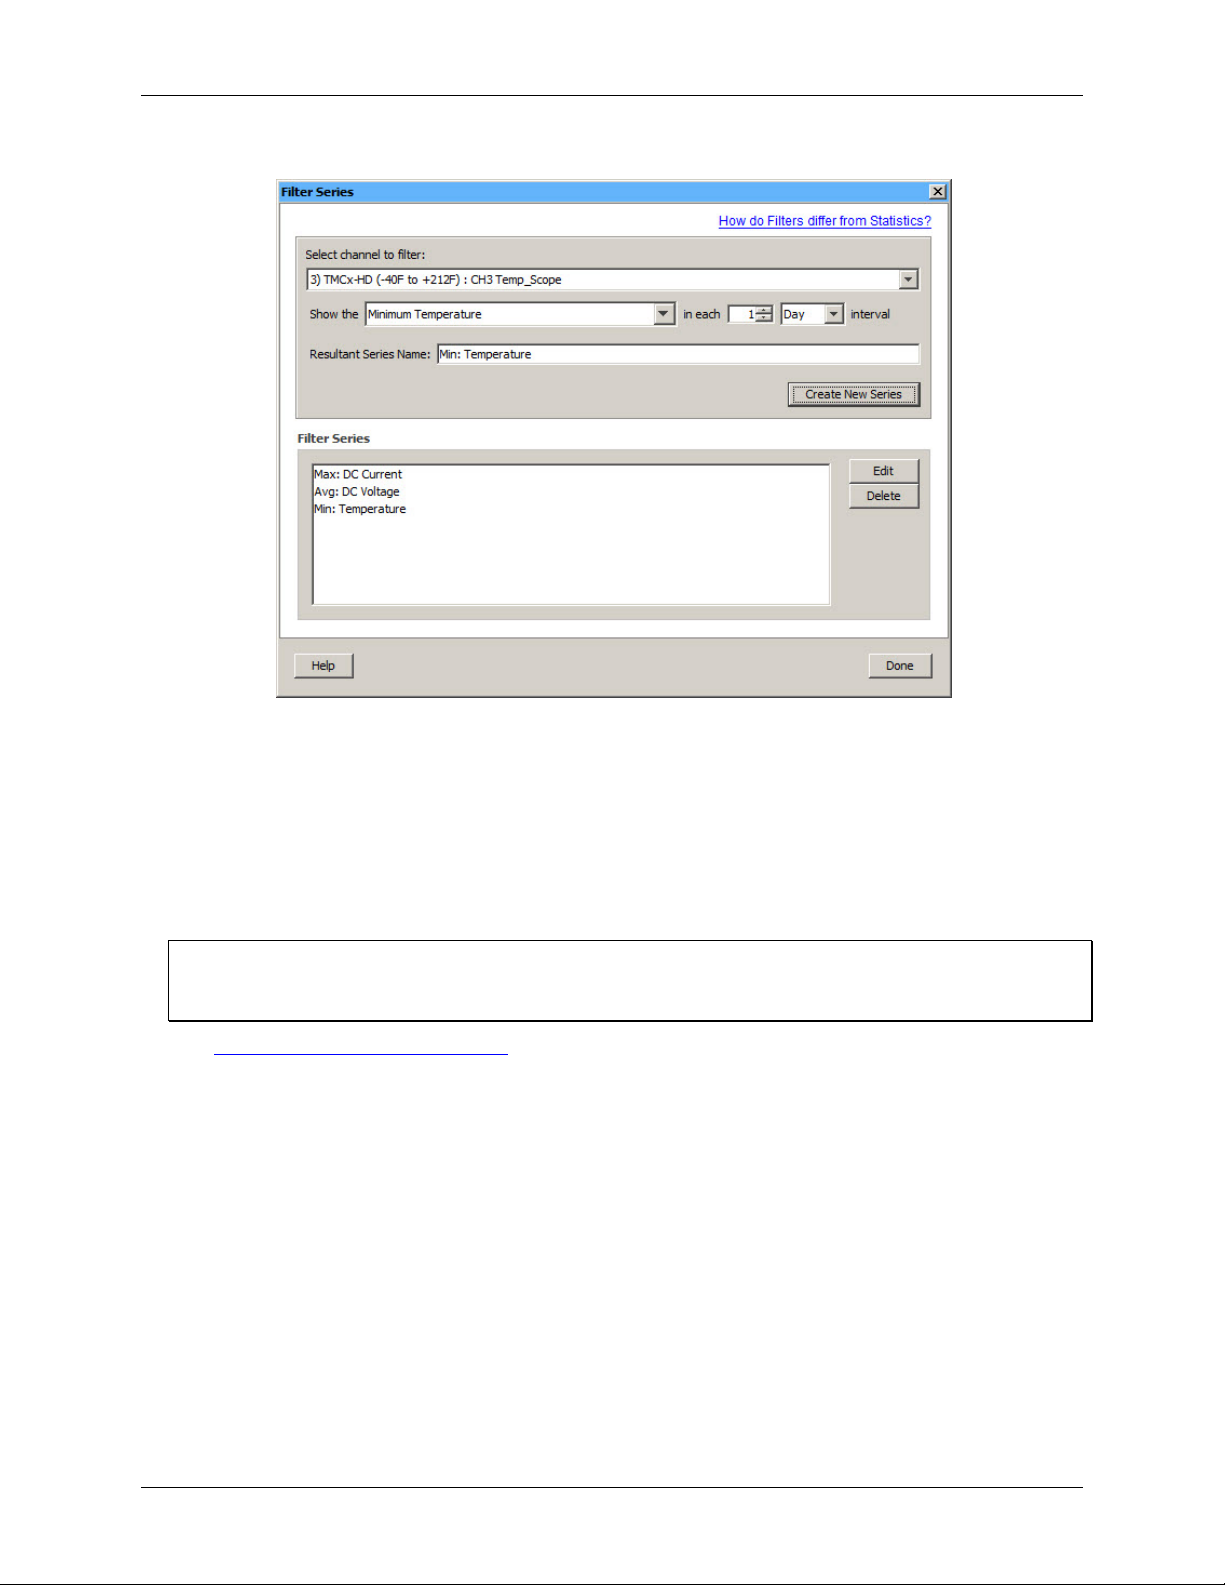
Configuring a Filter Series at Launch
As part of the launch setup, you can create a filtered series that automatically calculates additional values, such
as maximum, minimum, average, or total, for a set interval upon readout of the logger. The filtered series is
saved as an additional series in the data file so it is always available when plotting your d ata. This save s you the
time of manually filtering data for each series after readout using the regular USB-5100 Series filter tool,
although this tool is still available should you need to further filter data later.
Complete the following steps to set up a filtered series at launch:
1. Enable one or more channels and enter a name and LCD units for the channels.
2. Select the type of filter and the interval to use.
3. Edit the
Resultant Series Name as needed and click Create New Series.
The newly created series is added to the Filtered Series list as shown below.
To make a change to a filtered series, either double-click the series name or select the series name and click
Edit.
15
Page 16
USB-5100 Series Software Help Working with USB-5100 Series Data Loggers
To delete a filtered series, select the series name and click Delete.
Figure 6. Filter Series Dialog Box
4. Repeat steps 1 through 3 to create additional filtered series.
You can create filtered series for all channels and multiple filtered series on a single c han nel (for example,
you can show the maximum, minimum, and average temperature for a single temperature channel).
5. Click
Done when finished. The number of filtered series that you created is displayed on the Filter button
in the Logger Launch dialog box.
After you launch the logger and read it out, the filtered series is auto matica lly listed in the
Plot Setup dialog,
from which you can select the series you wish to plot.
Note
If you change the GMT offset for the f ilte red series, the data points do not reflect that change. They do continue
to be filtered based on times within the or iginal GMT offset at launch.
See Filtered Series vs. Statisti c s Logging for more information.
Configuring a Data Assistant (Scaling)
When you ru n a Data Assistant from the Launch Logger dialog box, you can create a derived series, which is an
additional data series automatically calculated each time you read out the logger. The Data Assistants dialog
box lists only those assistants available for the currently selected sensor and logger at launch time. There may
be other Data Assistants available for use after reading out the logger.
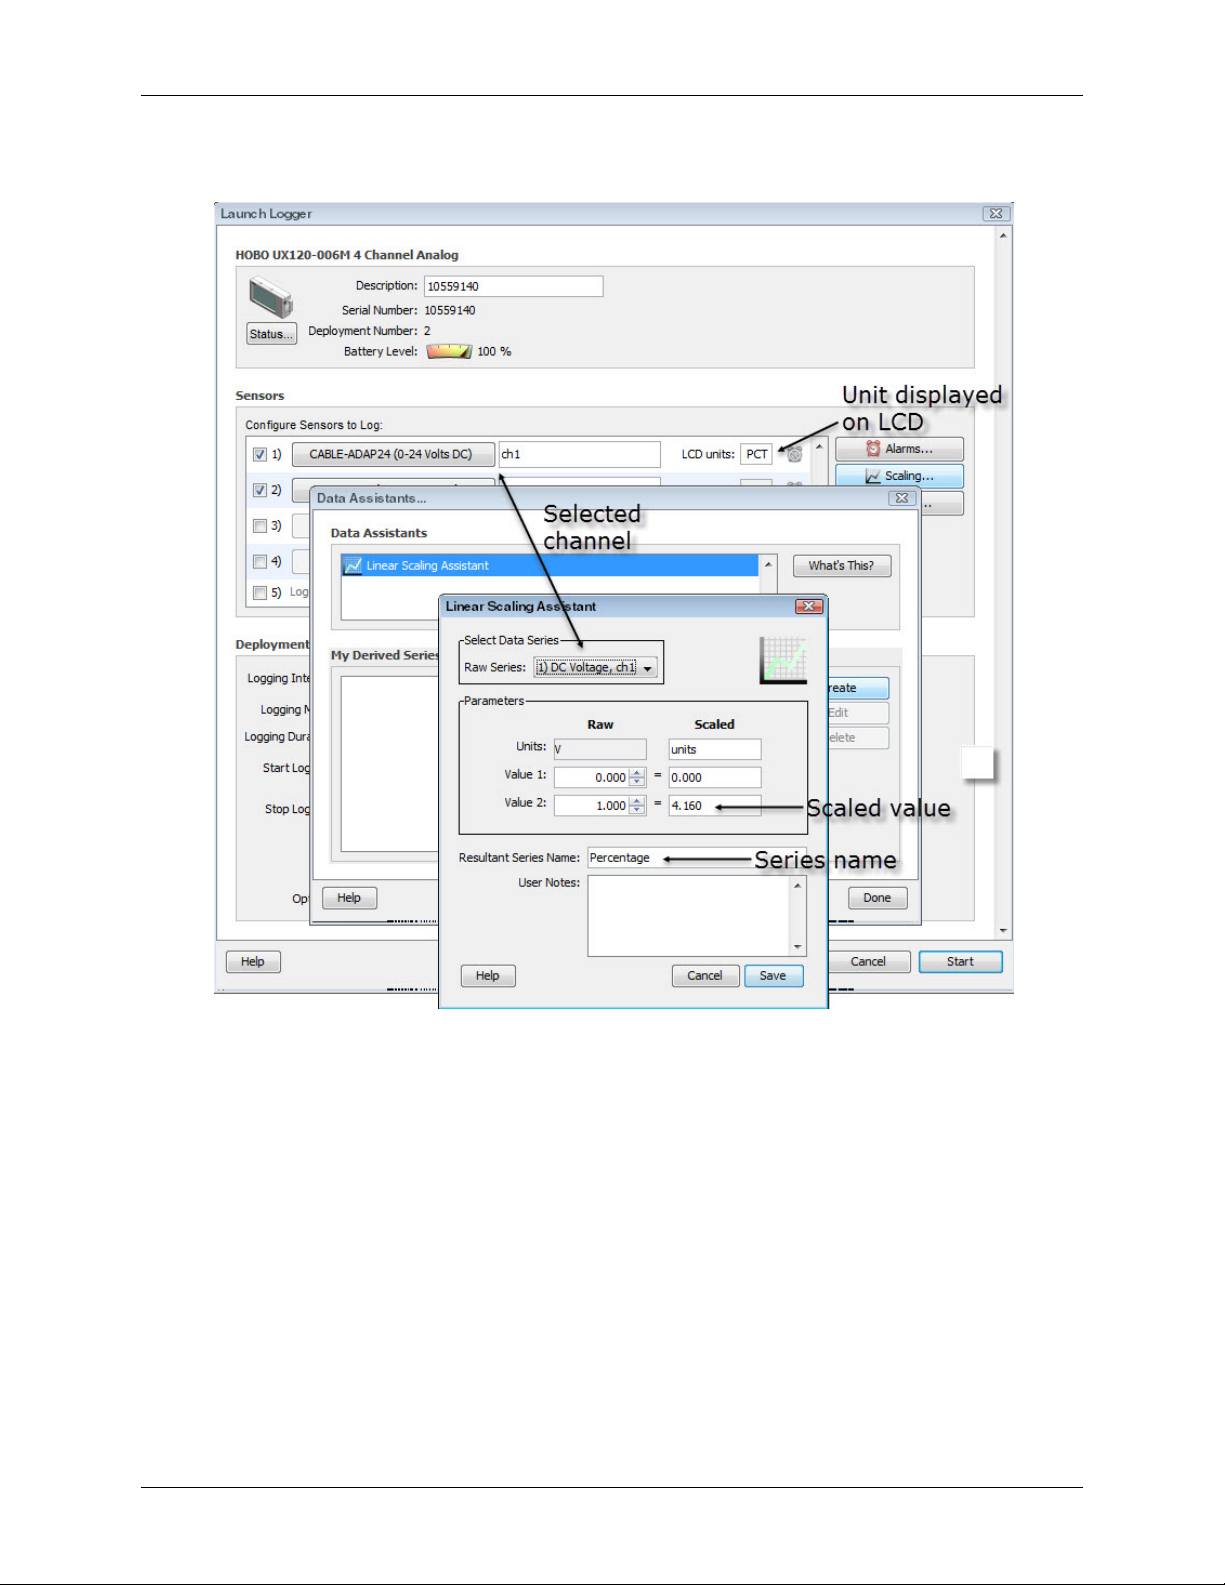
Complete the following steps to set up a derived series using the Linear Scaling Assistant:
1. Enable one or more channels and enter a name and
2. Click
3. Select
Scaling to open the Data Assistants dialog box.
Linear Scaling Assistant and click Create.
4. Select the scaling parameters to apply to the selected series and click
My Derived Series list.
Note: Although it is possible to set up more than one s caling value for each sensor on the USB-5106, only
the first scaling value for that sensor is used.
The example below shows a scaled series named Percentage set up for the first volta ge channel (ch1).
LCD units for the channels.
Save. The new series is added to the
16
Page 17
USB-5100 Series Software Help Working with USB-5100 Series Data Loggers
Since channel 1 is using a 24-volt sensor, to set up the series to show a percentage, set the scaled value to
equal 100 ÷voltage = 100 ÷24 = 4.16.
Figure 7. Linear Scaling Assistant Example
5. Create additional scaled series as needed.
To change a derived series, either double-click the derived series name or select it and then click
To delete a derived series, select the series and then click
6. After you finish creating, editing, or deleting one or more derived series, click
The total number of derived series created appears on
Scaling button in the Launch Logger dialog box. Derived
Delete.
Done.
series are also listed in the Status dialog box.
After you launch the logger and read it out, the derived series is automatically listed in the Plot Setup dialog,
from which you can select the series you want to plot.
17
Edit.
Page 18
USB-5100 Series Software Help Working with USB-5100 Series Data Loggers
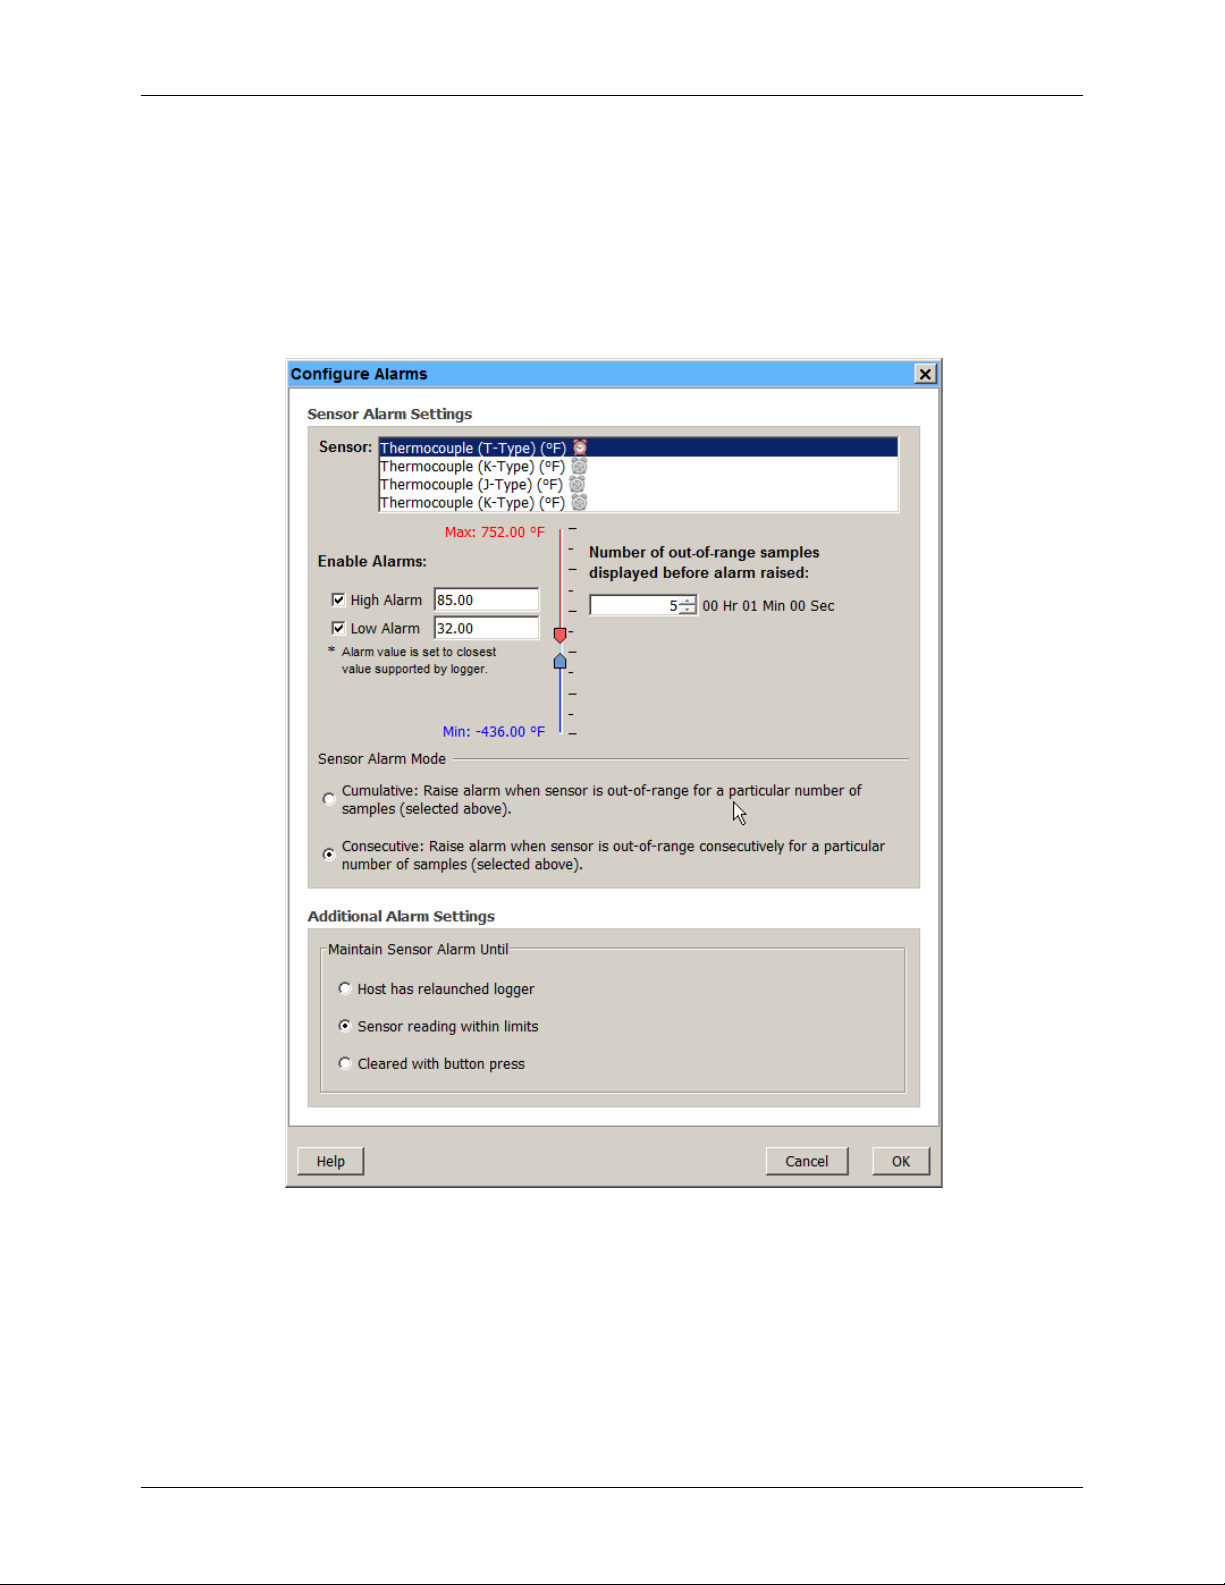
Configure Alarms
To set an alarm to trip when a sensor reading rises above or falls below a specified value, complete the
following steps:
1. Click
2. In the Alarms dialog box, select the sensor that you want to have an alarm.
Alarms in the Launch Logger dialog box.
If the Alarms button is disabled, make sure the Lo gging Mode is set to N ormal or Statistics. Alarms are not
available for USB-5100 Series loggers when the Logging Mode is set to Burst.
Figure 8. Filter Series Dialog Box
18
Page 19
USB-5100 Series Software Help Working with USB-5100 Series Data Loggers
o Select the High Alarm checkbox to trip an alarm when the sensor reading rises above the high alarm
value. Enter the reading next to the High Alarm checkbox or drag the red upper slid er. In this example,
the alarm trips when the temperature rises above 85
o Select the
Low Alarm checkbox to trip an alarm when the sensor reading falls below the low alarm
°F.
value. Enter in the read ing next to the Low Alarm checkbox or drag the blue lower slide r. In this
example, the alarm trips when the temperature falls below 32
Note: The actual values for the high and low alarm limits are set to the closest value supported by the
logger. For example, the closest value to 85
°F and the closest value to 32 °F is 32.043 °F. In addition, alarms can trip or clear when the
84.990
°F that the USB-5100 Series logger can record is
sensor readi ng is within the l ogger specifications of 0.02
°F.
°C resolution. This mean s the value that
triggers the alarm may differ slightly than the value entered. For example, if the High Alarm is set to
°F, the alarm can trip when the sensor reading is 75.994 °F (which is within the 0.02 °C
75.999
resolution).
3. Enter the
each alarm. For example, we've set this number to
below 32
Number of out-of-range samples displayed which is the number of samples needed to trigger
5. This mea ns that five sensor readings above 85 °F or
°F are required before the alarm trips. The time indicates how long it wo uld ta ke for the alarm to
trip based on the number of samples you entered and the LCD refresh rate. In the example above, it would
take 1 minute for the alarm to trip (only if Consecutive is selected as described in the next step).
4. Select either the
Cumulative: The alarm trips after the set number of samples are outside the limits (the high or low
o
Cumulative or Consecutive option for the Sensor Alarm Mode.
samples do not need to be consecutive).
Consecutive: The alarm trips after a specific number of samples (based on the Number of out-of-
o
range samples displayed setting) outside the limits are logged in a r ow.
5. Choose how long the logger should maintain the sensor alarm once it has tripped.
Host has relaunched logger: Alarm remains visible on the LCD u nt il the next time you launch the
o
logger.
Sensor reading within limits: Alarm clears once the sensor reading returns to the normal range
o
between the high and low alarm limits.
Cleared with button press: Alarm remains on and visible on the LCD until you press the Alarm
o
button on the logger.
6. Click
OK to save the alarm settings and return to the Launch Logger dialog box.
Once the logger is launched, alarms trip as determined by these settings. Logger alarms display on the LCD
screen .
Important
Alarm limits are only checked when the LCD screen refreshes every 15 seconds. Therefore, if you set the
logging interval to less than 15 seconds and the sensor reading falls outside the ala rms limits, the alarm is not
tripped until the next refresh cycle.
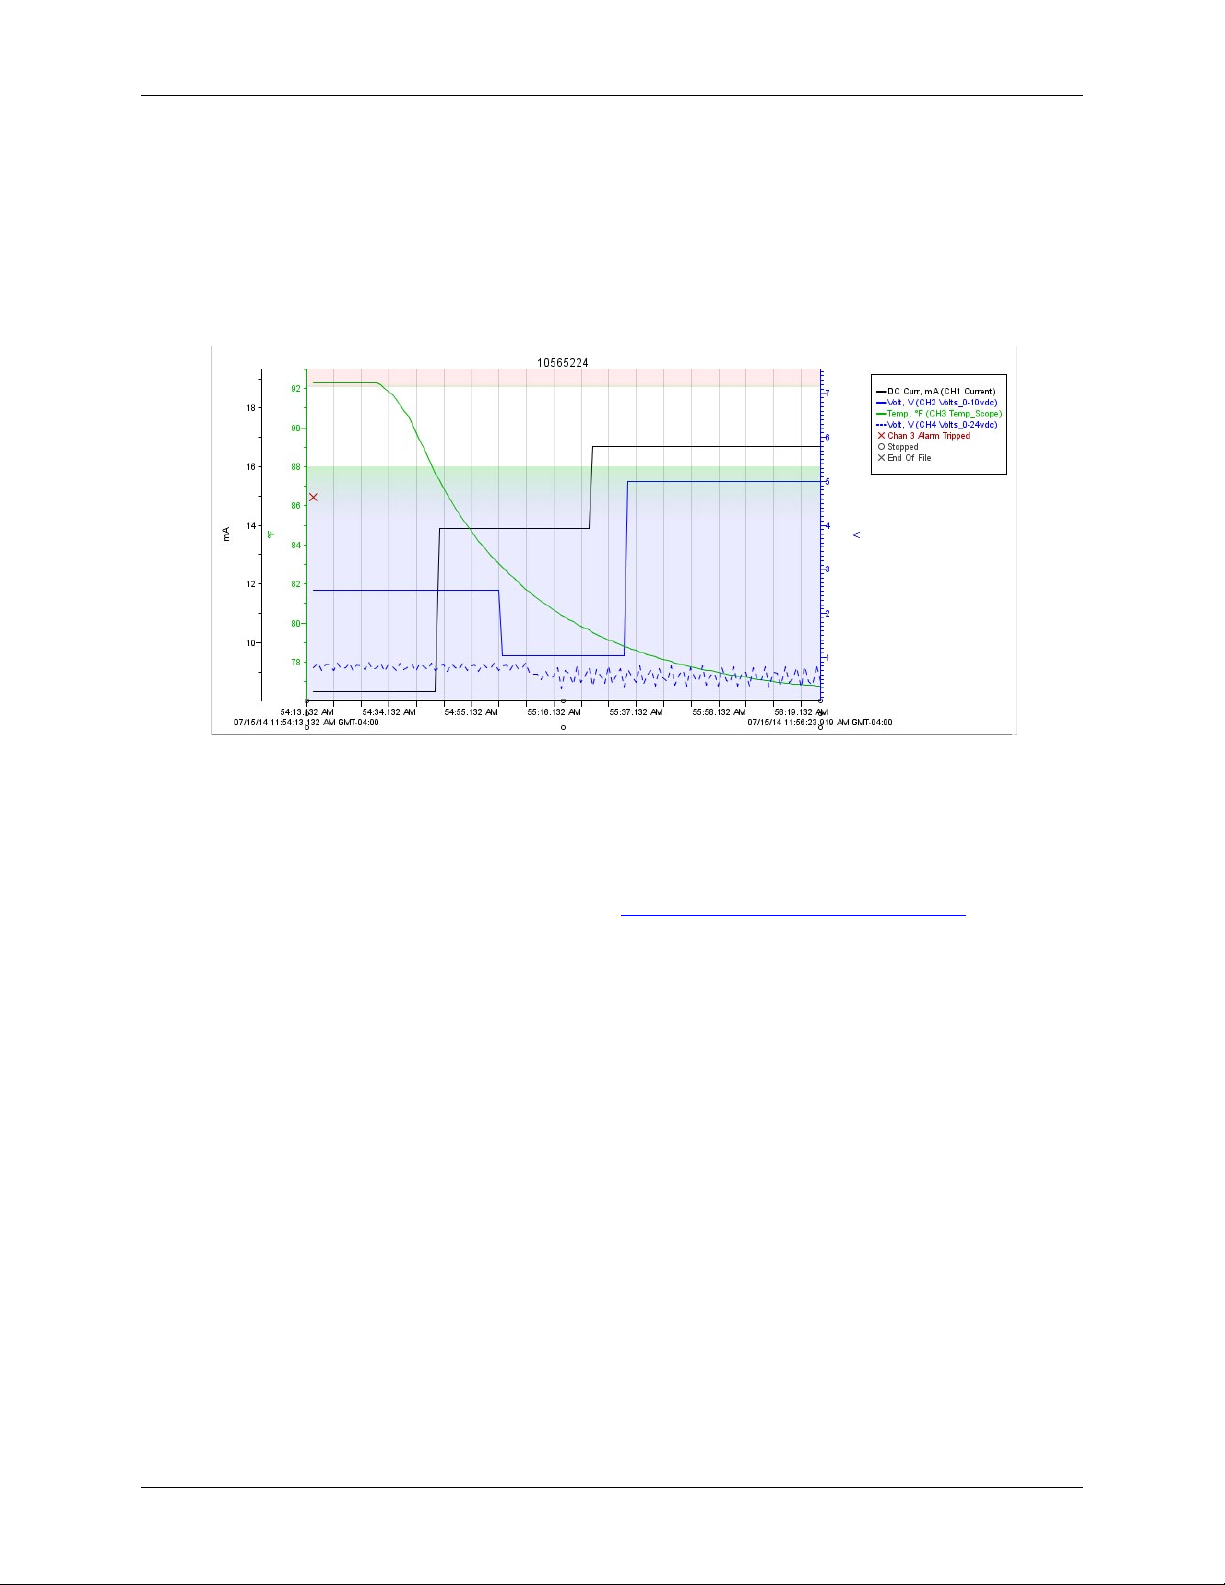
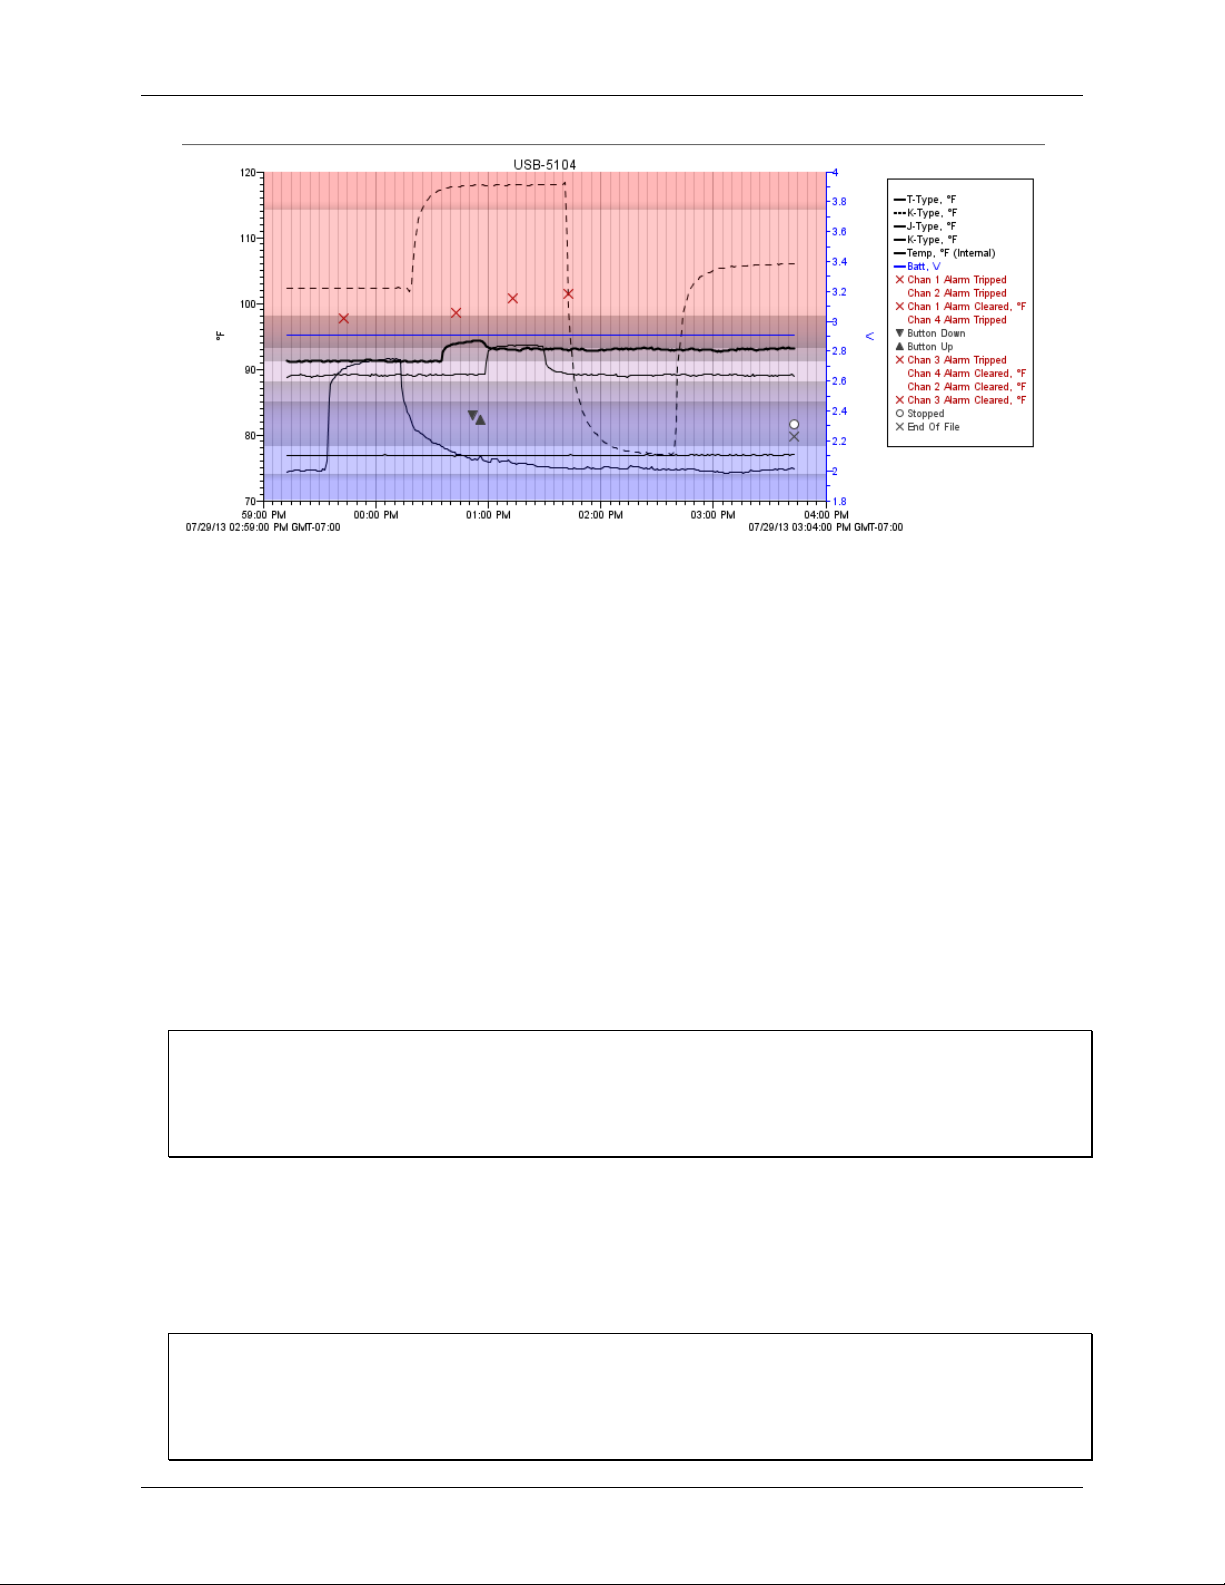
When you read out the logger, high and low alar m l evels are displayed on the plo t. In the example below, the
temperature rose above 85
°F so those readings are in the red, or high alarm, portion of the plot. The
temperature never fell below the low alarm limit, which is the blue portion at the bottom of the plot. USB-5100
Series loggers also display alarm events showing when the alarm tripped (and cleared if applicable). In this
example, there are
temperature alarm tripped and cleared. The
Chan 1 Alarm Tripped and Chan 1 Alarm Cleared events showing when the
Chan 1 Alarm Cleared event conta ins the value that was
furthest out of range for the sensor before the alarm cleared (see the Points table for the actual value).
19
Page 20
USB-5100 Series Software Help Working with USB-5100 Series Data Loggers
Figure 9. Alarms on a Plot
Statistics: Maximum, Minimum, Average, and Standard Deviation
You can configure USB-5100 Series loggers to calculate maximum, minimum, average, and standard deviation
statistics for all enabled sensors during logging at each logging interval based on samples taken at a rate you
specify. This results in up to four additional series per sensor that record the following information at each
logging interval:
The maximu m, or highest, sampled va lue,
The minimum, or lowest, s ampled va lue,
An average of all sampled values, and
The standard deviation from the average for all sampled values.
For example, with the logging interval set to five minutes, the sampling interval is s et to 30 seconds, and
maximum, minimum, average, and standard deviation all enabled, once logging begins, t he logger measures and
records the actual thermocouple values every five minu te s. In addition, the logger takes a temperature sample
every 30 seconds and temporarily stores them in memory. The logger then calculates the max i mu m, minimum,
average, and standard deviation using the samples gathered over the previous five-minute period and logs the
resulting va lue(s). When reading out the logger, this results in five data series: one sensor s eries (with
temperature logged every five minutes) plus four maximum, minimum, average, and standard deviation series.
Notes
Statistics are not available for logging if Normal or Burst has been chosen as the Logging Mode in the Launch
Logger dialog box.
Statistics are only available on thermocouple channels and not on the internal temperature channel.
To configure statistics, co mple te the following steps
1. Select
2. Select the
Statistics from the Logging Mode drop-down menu in the Launch Logger dialog box.
If Statistics has already been configured, click
Maximum, Minimum, Average, and Standard Deviation checkboxes for each of the statistics
Edit.
you want to calculate during logging. Note that Average is automatically selected when selecting Standard
Deviation.
Important
Statistics apply to all enabled sensors; every selected statistic is calculated for all sensors (except battery
voltage). For example, if thermocouples have been selected in the Launch Logger dialog box and you select
Average, then the average is calculated for temperature. The more statistics you record, the shorter the logger
duration and the more memory is required.
20
Page 21

USB-5100 Series Software Help Working with USB-5100 Series Data Loggers
3. Configure the sampling interval, which must be less than and a factor of the logging interval. Choose either
a preset sampling interval or select
Custom and enter your own sampling interval. Keep in mind that the
more frequent the sampling rate, the greater the impact on battery life.
Figure 10. Statistics Dialog Box
4. Click OK when done. This returns you to t he Launch Logger dialog box. Click Edit next to Logging Mode
Launch Logger dialog box to make additional changes.
in the
Once logging begins, press the
Alarm/Stats button on the l ogger for one second to cycle through the current
maximum, minimum, average, and standard deviation data (as applicable) on the LCD screen (it is not available
in the software Status dialog box). You can plot the statistics series once you read out the logger.
Filtered Series vs. Statistics Logging
USB-5100 Series loggers support filtered serie s and statistics logging, both of which in volve calculating
maximum, minimum, and average values that you can plot after the logger is read out. Both are accessed from
the Launch Logger dialog box; for filtered series, c lick
Logging Mode. However, there are some key differences between the two features. Basically, statistics log gin g
is performed at the sampling interval of the logger, while filters include data accumulated from a series of
logged data points.
The following table compares filtered series to statistics logging so that yo u can choose the best solution for
your deployment.
Note: There is also another filtering option available after you read out the logger, which is available from the
Filter button on the toolbar. This allo ws you to create filtered series based on the data in the plotted data file.
For more information about filtering after reading out a logger, see
Filters and for statistics logging, selec t Statistics as the
Filtering a Series.
21
Page 22

USB-5100 Series Software Help Working with USB-5100 Series Data Loggers
Can I view the data on the
available)?
Yes, you can press the Alarm/Stats
each of the enabled st atistics.
What kind of data can be
calculated with this feature?
Maximum, minimum, and average; standard
deviation is not available.
Maximum, minimum, average, and
standard devia t ion .
Data is calculated at each logging
minutes).
Can I select different intervals
for each calculated series?
Yes, you can select a different interval for
each filter you set up.
No, the logging and sampling intervals
apply to all selected statistics.
Sensor data is record ed at every logging
is recorded.
Filtered Series Statistics Logging
logger's LCD screen (if
How often can data be
calculated?
How is the data recorded?
No, filtered series are only available after the
logger is read out.
By day, hour, minute, or second using
samples taken at the logging interval. The
filter interval should be greater than the
logging interval. It is also recommended that
it is a multiple of the logging interval so that
every filter interval has an equal number of
samples.
interval and filtered data points are calculated
at the rate you specified (for example, the
average temperature is calculated every hour).
This requires more memory as every sample
button on the logger to cycle through
interval using samples taken at the
sampling interval. The sampling
interval must be less than and a factor
of the logging interval (i.e., if the
logging interval is set to 10 minutes,
statistics cannot be cal culated every
hour; the sampling interval would have
to be less than and a factor of 10
The logger takes a sample at e very
sampling interval, but only records
statistics data at the logging interval.
This requires less memory as every
sample is not recorded.
Burst Logging
Burst logging is a logging mode that allows you to set up more frequent logging when a specified condition is
met. For example, let's say the logger is recording data at a five-minute logging interval and burst logging is
configured log every 10 seconds when the temperature goes above 85 °F (the high level) or falls below 32 °F
(the low level). This means the logger r e c ords data every five minutes as long as the temperature remains
between 85 °F and 32 °F. Once the temperature reaches 90 °F, for example, the logger does switch to the faster
logging rate and record data every 10 seconds until the temperature falls back below the high level (or 85 °F in
this case). At that time, logging then resumes every five minutes at the normal logging interval. Si milar ly, if the
temperature falls to 30 °F, fo r example, then the logge r would switch to burst logging mode again and record
data every 10 seconds. Once the temperature rises back to 32 °F, the logger does then return to normal mode,
logging every five minutes.
Notes
Burst logging is not available if alarms have been enabled for the logger.
The actual values for the burst logging levels are set to the closest value supported by the logger. For example,
the closest value to 85 °F that the logger can record is 84.990 °F and the closest value to 32 °F is 32.043 °F.
Burst logging mode can begin or end when the sensor reading is within the logger specifications of 0.02 °C
resolution. This means the value that triggers burst logging may diffe r slightly than the value entered. For
example, if the High Level for a temperature alarm is set to 75.999 °F, burst logging can start when the sensor
reading is 75.994 °F (which is within the 0.02 °C resolution).
Once the high or low condition clears, the logging interval time is calculated using the last recorded data point
in burst logging mode, not the last data point recorded in normal mode. For example, let's assume the logger
has a 10-minute logging interval and logged a da ta point at 9:05. Then, the high level was surpassed and b urst
logging began at 9:06. Burst loggi ng then continued until 9:12, when t he sensor reading fell back below the
high level. Now back in normal mode, the next logging inter val is 10 minutes from the last burst logging point,
or 9:22 in this case. If burst logging had not occurr ed, the next data point would have been at 9:15.
A New Interva l event displays on the plot (if you select events for plotting in the Plot Setup dialog box) each
time the logger enters or exits burst logging mode.
On thermocouple loggers, burst logging is only available on thermoco uple channels and not on the internal
temperature channel.
22
Page 23

USB-5100 Series Software Help Working with USB-5100 Series Data Loggers
To set up burst logging, complete the following steps:
1. Select
2. If Burst logging has already been configured, click
Burst logging from the Logging Mode drop-do wn menu in the Launch Logger dialog box.
Edit.
3. Select the sensor you want to configure for burst logging.
4. Select the
High Level checkbox if you want to set up a condition in which burst logging occurs when the
sensor reading rises above the hig h l evel value. Dr ag the red upper slider.
5. Select the
Low Level checkbox if you want to set up a conditi on in which b urst loggin g occurs when the
sensor reading falls below the low level value. Type in the value or drag the blue lower slider.
In this example, both the high and low levels were s elected. You may choose only one if you wish.
Figure 11. Burst Logging Dialog Box
6. Configure the burst logging interval, which must b e le ss than the logging interval. Select either a preset
burst logging interval or select
Custom and enter your own interval . Keep in mi nd that the mor e frequent
the burst logging rate, the greater the impact on battery life and the shorter the logging durat ion.
7. Click
OK when done to return to the Launch Logger dialog box. Click Edit next to Logging Mode in the
Launch Logger dialog box to make additional changes.
Once the logger is launched, the high and low burs t logging levels are only checked when the logger
LCD screen refreshes once every 15 seconds. Therefore, if you set the logging interval to less than 15 seconds
and the senso r reading falls outside the levels, the burst logging does not log u nt il the next 15-second refresh
cycle.
Important
If high and/or low levels have been configured for more than one sensor, then burst logging begins when any
high or lo w co ndition goes out of range. Burst lo gging does not end until all conditions on all sensors are back
within normal range.
23
Page 24

USB-5100 Series Software Help Working with USB-5100 Series Data Loggers
Checking the Device Status
The Status dialog box displays real-time information about the attached logger, including the current state of the
logger, logging start time, current readings, a nd memory used. You can c heck whether a logger is wai ti ng fo r
logging to begin, actively logging (unless it i s logging at a fast logging interval), or stopped.
To check the status of a logger, complete the following steps:
1. Connect the logger to the computer.
2. Click the Status icon on the toolbar, or select
Note
You can also check the status by clicking Status in the Launch Logger dialog box, but this shows details from
the previous launch.
This is an example of the St atus dialog box. The information displayed varies depending on the logger that is
connected. See Status dialog box for more information.
Device»Status.
Figure 12. Status Dialog Box
Important
Battery power drains more rapidly while checking s tatus. Keep this in mind when freque ntly checking status
during a deployment. You can significantly reduce the demand on the battery by adjusting the Screen Refresh
Interval to five seconds or higher (not available on all loggers).
24
Page 25

USB-5100 Series Software Help Working with USB-5100 Series Data Loggers
The Status Dialog Box
The Status dialog box displays the current status of t he logger. If you clicked Status from the Launch Logger
dialog box, then details from the previous launch is displayed. T he Status dialog box is divided into three
Device Identification, Device Details, and Current Readings.
panes:
Device Identification
The Device Identification pane shows the logger selected for status. It lists the device name and model number,
descripti on entered when the logger was last lau nched (which is also used as the default file name and title in
the plot), serial number, and firmware number.
Device Details
The Device Details pane shows deta ile d information about the logger deployment including the following
items. Note that not all of these items are displayed for every logger model.
Battery Level/Battery State: This is the condition of the battery. Consul t the logger documentation for
specifics on battery capacity.
Memory Used: This is the percentage of logger memory use d so far in the deployment. Consult the logger
documentation for specifics on memory capacity. Note that if the battery died during logging, the Memory
Used is 100% even if only a small amount of the memory was used.
Stops Logging: This displays the date/time or the condition under which the logger stops logging.
Last Launched: This is the date and time, including the offset to Greenwich Mean Time (GMT), when the
logger was last launched. This is not necessarily the time when the first sample wa s r e c orded; it is the time
all the launch settings were load e d in the logger.
Delayed Start: If the logger has been launched, but is waiting to start on a pa rticular date/time or at the
next interval, the scheduled start time is shown here in local time.
Deployment Number: The number of times the logger has been launched, including the most recent
launch.
Logging Interval: The rate at which the logger was set up to rec ord data. If multiple logging intervals are
available, the interval currently in use (if t he logger is logging) is shown in bold.
Sampling Interval: The rate at which sensors are sampling data in between the logging interval.
Current Status: Message that describes the state of the logger. Messages include:
Awaiting Button: The logger has been launched with a push button start (if available). Press and hold
o
down the button on the logger for three seconds to begin loggi ng.
Awaiting Delayed Start: The logger begins recording data at a specific time because the logger was
o
configured to start on a specific date/time or at the next interval.
Launched, Logging: The logger has been launched is actively recording data.
o
Logger Is Full: The logger has reached its memory capacity and is no longer recording data.
o
Logger Is Stopped: The logger is not logging, is not full, and is not awaiting a start.
o
Current Readings
The Current Readings pane lists the latest measurement for each data series. To change the order of series
displayed in the Status dialog box, select
You can also set the Screen Refresh Interval for s ome loggers. This is the frequency at wh ich the current
readings are updated (up to 3,600 seconds - one hour). A higher number results in le ss drain on the logger
battery.
Notes
Readings are displayed for all available sensors, even if they are not being logged. Sensors not being logged are
dimmed.
If a logger has channels for external sensors, a description and reading is given for the external channels even if
no sensors are plugged in.
Sensor labels (if applicable) are displayed following the sensor name.
Battery voltage is displayed for some loggers.
File»Preferences and select Display and then Series.
25
Page 26

USB-5100 Series Software Help Working with USB-5100 Series Data Loggers
Stopping a Device
A logger automatically stops recording data when the memo ry is full (unless it has been configured to never
stop logging) or when the battery runs down. Depending on the launch settings selec ted, you ca n also press the
Start/Stop Logging button to stop logging on certain logger models. In addition, you can use software to stop
the logger manually at any time.
To stop a logger, complete the following steps:
1. Connect the logger to the computer.
2. Click the Stop icon on the toolbar, or select Stop from the Device menu.
After the logger has been stopped , the data remains in the lo gger until the next launch. Be sure to read out the
logger before setting up the next launch.
26
Page 27

Chapter 3
Reading Out, Plotting, and Analyzing Data
After a logger has recorde d data, you can then do the following:
Read out the data from the logger
Plot the data
Modify the plot if desired
Export the data
Reading Out Data
To retrieve data recorded by a logger, you must read out the logger. Reading out the logger copies data from the
logger to your computer , allowing you to save the data and plot it. During readout, the l ogger continues to
record data unless you have stopp e d it or it is full.
To read out a logger to the computer, complete the following steps:
1. Connect the logger to the computer.
2. Click the Readout icon on the toolbar or select
whether to stop the logger. Click either
3. A progress bar displays while the data is being read out. Once the readout is complete, choose a location
and/or a new filename or accept the default location and name to save the data. The default location is:
C:\Documents and Settings\<user>\My Documents\USB-5100 Series (for Windows XP)
o
o
C:\Users\<user>\Documents\USB-5100 Series (for Windows 7 or Windows 8)
If you save the file to a different folder, that folder is the new default save location for future readouts.
4. Click
5. After saving the data, select the sensors and/or events you wish to display in a graph and click
Notes
Once a logger is read out, the data remain in the logger memory until the next time the logger is launched.
Logger memory is therefore never empty.
You can read out some USB-5100 Series loggers when the batteries are low if the logger can be powered by a
USB cable. In this case, a warning appears before the readout begins indic ating the ba t tery is very low and that
you may experience communications problems. Once the readout is complete, be sure to replace the batteries as
suggested.
Save. Most da ta files have a .hob extension.
Plotting Data
for more information about the options available when plotting.
Don't Stop or Stop.
Device»Readout. If the logger is still logging, confirm
Plot. See
27
Page 28

USB-5100 Series Software Help Reading Out, Plotting, and Analyzing Data
Plotting Data
After you read out a logger or open a saved file, you can plot the data with the Plot Setup dialog box like the
following example.
Figure 13. Plot Setup Dialog Box
To plot the data, complete the following steps:
1. Use the existing description or type a new one. The default desc ription matches the one us ed when
launching t he logger and is used for the plot title.
2. Select the series to view on the plo t. Click
All or None to select or deselect all series, or click the
checkboxes to select or deselect individual series. Series types can include:
o Logged data series, which is a series containing the sensor measurements, state changes, or statistics
recorded by the logger.
o Derived series, which is a series calculated based on one or more logged data series. This could be a
filtered series i f you configured filters in the Launch Logger dialog box.
o Battery voltage, which lists the logger battery voltage recor ded at each logging interval.
3. Change the default units for selec te d series if desired. You can also change the units for a series after it is
plotted.
4. Select the internal logger even ts to view on the plot. Click
All or None to select or deselect all events, or
click the checkboxes to select or deselect individual events. Internal logger events are individuall y logged
occurrences that can be recorded at any time during deployment, regardless of the logging interval. These
28
Page 29

USB-5100 Series Software Help Reading Out, Plotting, and Analyzing Data
events can include started or stopped logging, low battery, or an alarm trip. Refer to the logger manual for a
complete list of internal events if app lica ble.
5. Adjust the time zone offset, if necessary. By default, data is shown in the offset used to launch the logger
with USB-5100 Series . To select a different offset, enter the hours offset from GMT (UTC) in decimal
form. You may find this useful if you logged in multiple time zones, or if you took the logger to a different
time zone aft er launching it.
6. Click
Plot to generate a plot. The plot is drawn and includes a title, a ti me axis (x-axis), one or more value
axes (y-axis), and a legend. The data for each series are listed in a points table above the plot. Details about
each series, such as the type of logger and deployment information are listed in the Details pane to the left
of the plot. You can sho w or hide these elements us ing the
View menu. To organize several plots, use the
Window menu to switch between Tabbed View, Tile Horizontally, or Tile Vertically.
Figure 14. Plotted Data
Notes
To change the order of series displayed in the Plot Setup dialog box, select File»Preferences»Display»Series.
To change the series and events that are selected by default in the Plot Setup dialog box, select
File»Preferences»Plotting»Plot Setup.
Started and Stopped internal events can occur multiple times in a single deployment (as configured in the
Launch Logger dialog box). Multiple stopped and started events in a single file are not only displayed on the
plot if selected in the Plot Setup dialog box, but the resulting gap that occurs in the data is also represented in
the series. In this example, the logger was stopped at 1:19 and then started again at 2:35; both events are on the
plot. The temperature series shows a break between those two times. That represents the gap between when
logging was stopped and when it resumed, both using the button on the logger.
29
Page 30

USB-5100 Series Software Help Reading Out, Plotting, and Analyzing Data
1
Arrow tool
3
Hand Drag tool
2
Crosshair tool
4
Zoom tool
Figure 15. Gaps Between Started/Stopped Events
Opening Files
To open a USB-5100 Series data file(.hob), complete the following steps:
1. Click the Open icon on the toolbar or select
2. Select one or more files and click
Open.
File»Open Datafile.
3. Select the series and/or events you wish to view in the plot and click
open, you are prompted with a Plot Setup dialog box for each file (unless you have set the preference to
automatically plot data as described in General Preferences).
To open a USB-5100 Series project file
1. Select
File»Open Project.
2. Select a project file and click
Recently opened files are listed in the File menu. Select
empty the recent file list, select
File»Recent Files»Clear Recent Files.
(.hproj), complete the following steps:
Open.
File»Recent Files and then choose the file to open. To
Working with Plots
There are four tools available on the toolbar for viewing the plot a nd isolating data.
Plot. If you selected multiple files to
Figure 16. Plot and Data Tools
30
Page 31

USB-5100 Series Software Help Reading Out, Plotting, and Analyzing Data
1
Zoom In button
6
Toggle all horizontal gridlines on/off button
3
Show Graph at Full Scale
8
Convert units for all series button
4
Graph Properties button
9
Filter Series button
5
Toggle all vertical gridlines on/off button
10
Add Graph Label button
Use the Arrow tool to point to and selec t items on the graph to edit their pro perties (through a right-click
menu).
Use the Crosshair tool to zero in on a specific date and time in the plot and any data points associated with
that date and time. Click the Crosshair icon and then place your cursor anywhere on the plot to draw a red
vertical line at a particular point.
Use the Hand Drag tool to move differ ent areas of the graph into view (panning) or to adjust the position of
one series so it can be viewed more easily. This is particularly useful when you are zoomed into the graph
and want to se e another section of the graph without zooming out and then zo oming back in on the new
location.
Use the Zoom tool to focus on one area of the graph, allowing you to see more detail.
Actions
Use the Actions buttons on the toolbar to perform a number of actions on a plot or a series.
2 Zoom Out button 7 Toggl e poi nt m ark ers on/off button
Figure 17. Actions Buttons
Click the Zoom In/Zoom Out buttons to keep the plot centered as you zoom.
Click the Show Graph at Full Scale button to return to the original, full-scale version of the plot whe n the
data file was first opened.
Click the Graph Properties button to open the
View Properties dialog box the plot element that is currently
selected, such as axis, series, legend, or title.
Click the Gridline buttons to toggle all horizontal or vertical gridlines on and off. You can also toggle
gridlines on and off for each axis individually. Using the arrow tool, double-click an axis to get the
Properties dialog box. Select or clear the Show Gridlines checkbox to toggle the gridli nes for that axis.
Click the Point Markers button to toggle the point markers for all serie s o n and off. To show or hide
markers for an individ ual series, right-click the series to open the
clear the
Click the Convert Units button to open the
Mark Points checkbox to toggle the markers for that series.
Convert Plot dialog box, which allows you to convert the u nits
Series Properties dialog box. Select or
on certain series on the plot to other units (for example, from degrees Fahrenheit to degrees Celsius).
Click the Filter Series button to open the
Click the Add Graph Label button to open the
Filter Series dialog box and add a statistical ser ie s to the plot.
Graph Label Properties dialog box.
Menus
Use the Edit and View menus to access various controls when working with a plot. You can also right-click an
element in the plot to access many of the same options available from the
properties dialog boxes.
Edit and View menu and to open
Axis
31
Page 32

USB-5100 Series Software Help Reading Out, Plotting, and Analyzing Data
Using the Arrow Tool
Use the Arrow tool to select items on the plot. Click the Arrow icon on the toolbar or press <A> to select the
arrow tool.
If you are using another tool and do not want to switch tools, press <N> on your keyboard to select each graph
item (includ ing hidden items, such as value axes for states or events) in s equence.
The selected item (if visible) is shaded or boxed. You can then right-click the selected item, double-click it, or
press <Enter> to open the Properties dialog box for that item.
To deselect, click an area within the axes that does not have series data. Select
<D>.
View»Select None or press
Using the Crosshair Tool
Use the crosshair tool to zero in on a specific date and time in the plot and any data points associated with that
date and time. To use the crosshair, complete the following steps:
1. Click the Crosshair icon on the toolbar or press <C>.
7. Click a point on the graph to mark it.
8. Click anot her point to move the marker.
When you click on a graph, the nearest data point is selected. When series are very close together and the
location you click is between two po ints, it is possible that the nearest point is not on the series you clicked.
You can also mark the po i nt on the graph by clicking the corresponding cell in the Point s table. If you are
zoomed in and click a point in the Po ints tab le that is outside the zoom area, the plot scrolls to that area of the
graph.
To prevent s crolling in this situation, complete the follo wing steps:
1. Select
2. Clear the
The plot changes in several ways when the crosshair is in use. The Points table shifts to the row that contains
the data point. Where the crosshair intersects a data point, a square surrounds the data point. The intersection
points are also marked by small color-coded arrows on the left and right value axes.
If the legend is displayed next to the graph, the point values for each series are updated to reflect the crosshair
location. Values are listed in the legend differently depending on whether the data is a logged sample, state, or
event:
File»Preferences»Plotting»Points Table & Details Pane.
When selected value in table is out of plot range, drag series to that value checkbox.
Values that are not in parentheses are actual data points logged at the time selected by the crosshair.
Values in parentheses are estimated because there were no exact values for the series at the time selected by
the crosshair. Zoom in or move the crosshair to see actual values.
A value of
events. If the time selection falls within an eve nt series, but does not contain an eve nt, parentheses surround
the
A value of
The legend must expand in height to l ist the point values. If the application window is too small to
accommodate the expanded height, the values does not be ad ded to the legend. You can still refer to the Po ints
table to find the values of the selected points.
To remove the crosshair from the grap h, right-click the plot and select
menu or select
… indicates that there is no series data during the time selected. This is seen most frequently for
… value.
logged indicates an internal logger event happened at the selected time.
Remove Crosshair from the context
View»Remove Crosshair.
32
Page 33

USB-5100 Series Software Help Reading Out, Plotting, and Analyzing Data
Zooming, Panning, and Smart Scaling Plots
You can adjust the viewing area of the plot by zooming, panning, and smart scaling.
Zooming
There are two ways to zoom: either by using the zoom tool (or pressing <Z>) or by selecting Zoom In
or Zoom Out from the toolbar or the View menu. Use the zoom tool to zoom anywhere on the plot that you
select, clicking the right-mouse button to zoom in or out. Use the Zoom In/Zoom Out icons to keep the plot
centered as you zoom.
When zoomi ng:
Right-click to toggle between zoom in and zoom out.
Check the symbol inside the zoom tool to determine the direction you are zooming. A plus sign (+) or
arrows poi nt ing outward does zoom in, whil e a minus sign (-) or arrows pointing in does zoom out.
Click an area on the graph inside the axes to zoom one level (a factor of two). Continue clicking to zoom
multiple levels.
Hold down the left mouse button in one location to zoom continuously. Release the mouse button to stop
zooming.
Hold down the l eft mouse button while drawing a re ctangle ar ound the area you wish to z oom in on, then
click inside the rectangle. The area inside the rectangle expands to fill the whole graph.
To constrain the zoom to horizontal or vertical zooming, place the cursor over t he axis you want to zoom
and click the mouse button. Hold the mouse button down to continue to zoom. Or, press <X> while
zooming to restrict motion horizontally and press <Y> while zooming to restric t motion vertically.
If you are currently working with the crosshai r, arrow, o r hand tool, you can click the Zoom In/Out icons
on the toolbar to quickly zoom into and out of the middle of the display without changing tools.
Zooming does not work on an axis t hat is locked. To unlock an axis, double-click the axis with the arrow
tool and clear the
Lock Axis Scaling and Tick Marks checkbox in the Axis Properties dialog box.
Panning
Use the hand drag tool or press <H> to pan the gra ph. Panning is especially useful when you are zoomed
into a detailed plot and want to focus on a different area without zooming out. Click-and hold within the graph
to pan a different section of the graph into view. The graph follows the movement of the mouse, and the axes
are continuously updated in response to the movement. To stop draggi ng, release t he left mouse button.
To limit dragging to horizontal or vertical panning:
place the cur s or over the axis you want to drag, hold down the mouse button, and drag in the direction you
want the plot to move, or
press <X> while draggi ng to restrict motion horizontally, and press <Y> while dragging to restrict motion
vertically.
Use the hand drag tool to move different areas of the graph into view or adjust the position of one series so it
can be viewed more easily. This is particularly useful when you are zoomed into the graph and want to see
another section of the gr aph without zooming out and then z ooming back in on the new location.
Panning does not wo rk on an axis that is locked. To unlock an axis, double-click the axis with the arrow tool
and clear the
Lock Axis Scaling and Tick Marks checkbox in the Axis Properties dialog box.
Smart Scaling
When you first display a graph, the numerical bounds of the axes are on tick marks. After you have panned or
zoomed, this may no longer be the case. Use smart scaling to correct that. With the hand drag, arrow, or
crosshair tool, right-clic k anywhere o n the graph and select
automatically adjusts the axes to end on tick marks.
SmartScale Graph from the context menu. This
To return to the original plot view, click Show Graph at Full Scale from the toolbar or select
Full Scale
.
33
View»View
Page 34

USB-5100 Series Software Help Reading Out, Plotting, and Analyzing Data
Copying the Plot
To copy the plot as a bitmap for pasting into other programs and documents, complete the following steps:
1. Select
2. Go to the other application and paste the plot.
Edit»Copy Graph to Clipboard.
Closing a Plot
To close a single plot, click the on the tab or toolbar, or select File»Close.
On Macintosh, click the red button in the upper -left corner of the internal frame containing the plot when in
Tabbed View. To close all open plots, select
Important
Any changes you made to the plot are not saved when you close t he data file. You must save the plot as a
project file to preserve the changes. Either select File»Save Project before closing the plot or close the file and
click Save when prompted. If you only want to save an image of the plot, you can paste a bitmap of the graph
into another progra m and save it there.
If you do not want USB-5100 Series to prompt you to save the plot as a project file when you close it, complete
the following steps:
1. Select
2. Clear the
File»Preferences»Warnings»General.
Prompt me if there is any remaining unsaved data when closing plot or application
checkbox.
File»Close All.
Printing Plot Elements
Printing a Graph
To set up the page for printing the graph, complete the following steps:
1. Select
2. Change the paper type, orientation, and margins as necessary and click
3. Select
4. Zoom as necessary.
5. Click the Print icon to print directly from
To print the graph, complete the following steps:
1. Select
2. Select the appropriate printer and click
File»Page Setup.
OK.
File»Print Preview.
Print Preview, or click Close to e xit the preview dialog box
without pr inting.
File»Print or click the Print icon on the toolbar.
OK.
Printing Points and Details
You can print all the data in the Points or Details panes. Select File»Print Points (available only with Java 1.5
or higher) or
If you highlight a selection of points with your mouse before selecting
print only the selected points.
File»Print Details.
Print Points, you are given the option to
34
Page 35

Chapter 4
Modifying a Plot
Once data is plotted, you can perform the following operations to further refine the plo t :
Setting Properties for Plo t Elements
Adding a Graph Label
Moving a Series from Front to Back on a Plot
Filtering a Series
Removing a Se ries from t he Plot
Copying a Series to Another Plot
Merging Files
Converting Units
Undoing or Redoing Plo t Changes
Saving Project Files
Setting Properties for Plot Elements
You can set the properties for all the plot elements, including the axes, series, title, and legend. You can access
the properties dialog box for a plot element by selecting the Arrow tool and then right-clicking that element. Or,
right-click anywhere on the plot and select
particular item.
Other Graph Items from the context menu and then select a
Setting Axis Properties
Setting Series Properties
Setting Legend Properties
Setting Title Properties
Setting View Properties
Select
File»Preferences»Plotting to modify the following plotting preferences that control the global
properties for all plots:
Show or hide the Points table by defaul t
Show or hide the Details pane by default
Include the sensor label in the Points table and Details pane by default
Customize series lines for specific measurement types
Configure defa ult minimum and maximum values for specific series types on the Value Axis
Enable auto-scrolling to keep marked points in view while zooming
Automatically select all data series and/or events
Automatically label the time axis
Mark all points in a plot by default
Include the sensor label in the legend
Control whether horizontal and /or vertical gridlines are displa yed automatically
Select the font style and point size used in plots
Enable or disable the undo/redo feature
You can also use the Display preferences to set the default unit types and date/time format.
35
Page 36

USB-5100 Series Software Help Modifying a Plot
Setting Axis Properties
You can change the appearance of the time axis (x axis) and the value axis (y axis) on the plot. You can
customize the axis name, change the location, bounds, tick marks, color, and more.
To change the axis prop erties, complete the following steps:
1. Double-click the axis in the plot with the arrow tool, o r select the axis and click the Properties icon to
open the
Axis Properties dialog box.
Figure 18. Axis Properties Dialog Box
2. In the Name field, enter up to a 40-character name for the axis. The default name for a value axis is the unit
type (for example, °
does not have a default name. To add
File»Preferences»Plotting»Other Options and select the Label the time axis checkbox.
F is the name for a temperature axis and % is the name for an RH axis). The time a xis
Time as the default name for this axis, select
3. Change the location of the axis. The value axis can be located on the left or right while the time axis can be
located at the top or bottom
4. By default, tick marks are auto-calculated. Numbers or values are listed next to major tick marks and minor
tick marks are not numbered. To change the default tick marks, select
Custom Tick Marks and then choose
the values for Major and Minor tick marks as desired.
5. Change the default bounds used on each axis. For the time axis, select the dates and times you want the axis
to display. For the value axis, type the minimu m and maximum value you want the axis to display.
6. You can also modify the appearance of the axis with thes e options:
Show Gridlines: This toggles whether gridlines are displayed in the background. Gridlines are shown
o
by default for the time axis, but not for the value axis.
Hide Axis: This controls whether the axis is displayed or temporarily hidden.
o
Lock Axis Scaling and Tick Marks: This controls whether the axis and associated tick marks remain
o
in their or i ginal position when zooming or navi gating with t he hand tool. Locking the axis and tick
marks helps to avoid inadvertently zooming or navigating to an area on the graph without data.
Color: Black is the default color for the time axis. The color of the value axis matches the series color
o
by default. You can change the color for either axis as desired.
7. Click
Apply to update the plot and keep the Axis Properties dialog box open. Click Done to update the plot
and close the dialog box.
36
Page 37

USB-5100 Series Software Help Modifying a Plot
Setting Series Properties
A series is the group of data points yo u selecte d to display in the plot. You can change the appearance of a
series on the plot including the line style, point marker, alarm values, associated axes, and color.
To change series properties, complete the following steps:
1. Double-click the series you wish to modify or select the series and click the Properties icon to open
Series Properties dialog box.
the
Figure 19. Series Properties Dialog Box
2. Change the default description. Type up to a 40-character name for the series. The series name is updated
in the legend, series pane, and details pane to the new name you entered.
3. Change the default units. Enter a different unit type as needed. The unit type is updated in the legend, series
pane, and details pane to the new unit type. Note that if you subsequently convert the units while viewing
the plot, your custom unit type is no longer be displayed. For example, if you change the unit type for a
temperature series from °F to a custom degrees unit. Then, while viewing the plot, you decide to convert
the data points to Celsius. The unit type for the temperature series automatically changes to °C instead of
the custom degrees unit that you had entered.
4. Adjust the appearance of the lines with the following options:
Connect Points: This controls whether the plotted data points in the series are connected with a line.
o
Style: This changes the appearance of the line used to connect the points in a series.
o
Width: This changes the width of the line used t o connect the points in a series.
o
Connect as Steps: This controls whether the lines between the points in a series are connected as a
o
curve or a step. When this checkbox is selected, the line drawn between points keeps the value of the
previous point until the next point i n the series. Connecting as steps is useful when plotting state or
event series.
5. Configure
High Alarm and/or Low Alarm thresholds: Enabling alar ms does s how lines on the plot for t he
series to indicate a visual thresho ld over or under which data may be falli ng (for example, if you want to
quickly see how many points fall below 32 degrees). Alarms are available for sensor measurement series
only, not for state or event series. Select the
where you want the maximum (red) alarm line to appear. Select the
High Alarm checkbox and type a value relative to the series
Low Alarm checkbox and type a value
relative to the series where you want the minimum (blue) alarm line to appear.
37
Page 38

USB-5100 Series Software Help Modifying a Plot
6. Select the Mark Points checkbox to add a marker for each data point in the series. To avoid cluttering the
plot, this option is only enabled by default for series with event data or that have only one data point. If you
enable Mark Points, you can change the shape of the marker and the point size.
7. You can also modify the following:
Time Axis: This allows you to create an additional time axis for this series. This is useful for
o
comparing data from two different time periods.
Value Axis: This changes the axis being use d for the series. Choose one of the axes already in view or
o
select New Value Axis from the dropdown list to create your own.
Color: This changes the color used for the series.
o
8. Click
Apply to update the plot and keep the Series Properties dialog box open. Click Done to update the
plot and close the dialog box.
Setting Legend Properti e s
To change the Legend properties, co mplete the following steps:
1. Double-click the Legend or right-click the p lot with the arrow tool and select
Properties from the context menu.
2. In the
Legend Properties dialog box, type a name for the Legend if desired.
Figure 20. Legend Properties Dialog Box
3. Select the location to either the left or right of the plo t.
4. Select the
Show Border checkbox to have a box around the legend . Clear this if you do not want the box
around the legend.
5. Click
Apply to update the plot and keep the Legend Properties dialog box open. Click Done to update the
plot and close the dialog box.
Other Graph Items»Legend
38
Page 39

USB-5100 Series Software Help Modifying a Plot
Setting Title Properties
To change the Title properties, complete the following steps:
1. Double-click the plot title or right-click the plot with the ar row tool and select
Properties.
2. In the
Title Properties dialog box, change the default name if desired. The name originated from the Plot
dialog box.
Setup
Figure 21. Title Properties Dialog Box
3. Select the location of the title to either the top or bottom of the plot.
4. Adjust the font, point size, and style.
5. Click
Apply to update the plot and keep the Title Prop erties dialog box open. Click Done to update the plot
and close the dialog box.
Setting View Properties
To change the View properties for the plot, complete the following steps:
Other Graph Items»Title
1. Right-click the plot a nd sele c t
2. In the
View Properties dialog box, select the Show Legend checkbox if you want the Legend to be
View Properties.
displayed on the plot. Clear this checkbox if you do not want to see the Legend on the plot.
Figure 22. View Properties Dialog Box
3. Select the Show Title checkbox if you want a title to be displayed on the plot. Clear this checkbox if you do
not want to see a title.
4. Select the
Show Border checkbox if you want a border to be drawn around the plot. Clear this checkbox if
you do not want a border around the plot.
5. Click
Apply to update the plot and keep the View Properties dialog box open. Click Done to update the
plot and close the dialog box.
39
Page 40

USB-5100 Series Software Help Modifying a Plot
Adding a Graph Label
To add a graph label, complete the following steps:
1. Right-click the graph on a data point and select
Graph Label Properties dialog box. Or, select Edit»Add Graph Label. To change an existing lab el,
Add Graph Label from the context menu to open the
double-click the label or select the label and click the Properties icon on the toolbar.
Figure 23. Graph Label Properties Dialog Box
2. Type up to a 24-character name for the label.
3. Select the
series to attach it to from the drop-down list. Select the
Attach to Series checkbox to attach the label to a point on the s eries. Choose the na me of the
Include Data Value in Label checkbox to display
the value of the point in the label. Select the compass point to described the preferred location of the label
relative to the labeled point.
Important: This indicates the preferred location of the label (space permitting) with respect to the data
4.
point it references. This is only available when the label is attached to a series.
5. Adjust the appearance of the label with these options:
Draw Label Over Colored Background: Select this checkbox if you want the label to appear in a b ox
o
with a colored background.
Label Color Background: If you chose to give the label a colored background, click this button to
o
select a background color.
Label Color Text: Click this button to select a color for the label text.
o
o % Transparency. Adjust the label's transparency, which refers to the ability to see the graph through
the label. At 0%, the label is opaque and you cannot see the graph through it. At 100%, the label is
invisible and only the graph can be seen.
Font: Select a font for the label text.
o
Font Size: Select a font size for the label text.
o
40
Page 41

USB-5100 Series Software Help Modifying a Plot
6. Click Apply to update the plot and keep the Graph Label Properties dialog box open. Click Done to
update the plot and close the dialog box.
Use the hand drag tool to drag the label to another location if necessary. If the label is attached to a series,
you can drag the label to attach it to any other point on the graph. (The hand tool must be close enough to a
point to attach the label.) Labels that are attached to a point does move with that point during zooming and
panning. Free-floating labels do no t move during zooming and panning.
To delete a label from the graph, select the label you want to remove and press <Delete>, or right-click the label
and choose
Remove from the c ont ext me nu.
Moving a Series from Front to Back on the Plot
You can shuffle the order of series by moving a series to the front or back on the plot. This is helpful if one
series is hidden behind another. It also changes the order of series in the Details pane, Points table, and the
legend.
To change the order of the series, complete the following steps:
1. Select the arrow tool .
2. Select the series you wish to move.
3. Right-click and select either Bring Series to Front or Send Series to Back.
Filtering a Series
You can filter data from existing ser ie s in the plot to create a new statistical series showing calculated data such
as average, minimum, and maximum values over a specified period of time. This filter applies to existing data
files only; there is an additional filter tool available when launching most loggers.
To filter a series in a plot, complete the following steps:
1. Select the series with the arrow tool , right-click on it and sele ct
from the
2. Select the statistic to use for the filter and the interval. The options available vary depending on the series
type. In the example below,
3. Enter a Resultant Series Name or use the default name entered based on the filter type.
4. Click
apply a filter, the graph rescales to accommodate all the displayed data.
Edit»Filter Series.
Maximum Temp in each day is selected.
Figure 24. Filter Series D ial og B ox
OK. The new series is added to the graph, the Details pane, and the Points table. Note that when you
Filter Series. from the context menu,
41
Page 42

USB-5100 Series Software Help Modifying a Plot
Removing a Series from a P lot
You can remove sensor, state, and event data series from the plot. This is helpful if the data file contains
multiple series and you cannot easily view them all together.
To remove a series from a plot, complete the following steps:
1. Select the arrow tool from the toolbar.
2. Click the series you wish to remove and press <Delete>, or right-click the series and select
Remove.
3. A warning appears, indicating that the only way to add the series back to the plot is to reopen the plot.
Yes.
Click
The series is removed from the graph, the Details pane, and the Points table.
Copying a Series to Another Pl ot
To copy a series from one plot to another, complete the following steps:
1. .Open the source plot (the plot that inc lud e s the series you want to copy) and the destination plot (the plot
where you want to paste the series).
2. In the source plot, choose the arrow tool and select the series you want to copy. Select
or right-click the series and select
Copy Series. from the context menu. Or, press <Ctr l -C> on Windows or
<Command-C> on Macintosh.
3. Switch to the destination plot. Fr om Select
and select
Paste Series. from the context menu. Or, press <Ctrl-V> on Windows or <Command-V> on
Edit»Paste Series or right-click the plo t with the arrow tool
Macintosh.
Edit»Copy Series
The new series is added to the graph, the Details pane, and the Points pane.
Overlaying Series
If the series you want to copy to the plot was logged at a different time, you need to make some adjustments to
the plot in order to view the series together.
1. Display the source plot(s) and the d e stination plot.
2. On the destination plot, choose the arrow tool
3. Double-click the time axis to open the
4. In the
Axis Properties dialog box, time a unique name in the Name field and click Done.
5. Copy a series from a source plot (right-click the series and select
6. Paste the series into the destination p lot (select
7. Double-click the new time axis for the pasted series to open the
8. Type a uniq ue name in the
Name field, different than the name used in step 4, and click Done.
Axis Properties dialog box.
Copy Series).
Edit»Paste Series).
Axis Properties dialog box.
9. Repeat steps 5 through 8 for each series you want to paste.
10. Identify the periods of interest in each series you want to combine and note the times for each. Also,
determine which period is the longe s t ; this shoul d be the length of time shown on each axis.
11. Double-click a time axis and adjust its Min and Max bounds. The new bounds should include the period of
interest for the series, and be the same length as the longest period identified in the original time axis in the
destination plot. Repeat for each time axis.
12. Use the hand drag tool on each time axis to adjust the series horizontally as needed.
42
Page 43

USB-5100 Series Software Help Modifying a Plot
Merging Files
This feature allows you to combine mu ltiple data files into o ne file. Note that only series of the same type and
name can be merged and there cannot be an overlap in the time in the series.
1. Open the first file (oldest).
2. Select
3. Select the data files you want to merge and click
4. Select the series to plot. All series available in the selected data files are listed in the
File»Merge Datafile(s).
Open.
section. Select the checkbox to add or remove series as necessary, or select the
section to select all series or no series accordingly.
Select Series to Plot
All or None buttons in tha t
Figure 25. Merge Series Setup Dialog Box
5. All matching series available in the selected series are populated with the corresponding series listed in the
Merge With column. Each new series can only be merged with the series of the same measurement type
and units. If no matching series is available in the plot, the
series. If a matching series is found , you can still append the series wit hout mergin g by choosin g
from the corresponding drop-down list in the
Merge With column. The series is appended to the plot
Merge With column displays No Series for that
No Series
without being merged with any serie s .
6. Select any internal logger events to plot, if applicable. Click the checkbox to add or remove each event as
necessary, or click
7. Click
Plot to merge the selected series with their matching series. Save the new plot as a project file if
All or None in that section to select all events or no events accordingly.
desired.
There may b e gaps between the last sample in an older series and the first sample in the next.
After the series have been merged, the
Details Pane is regenerated and the Series Statistics are recalculated.
The Points Table is regenerated and does show samples of both series in one column. The new logger
information is added to the Details Pane, showing the specific information about the different loggers that
collected the data samples.
43
Page 44

USB-5100 Series Software Help Modifying a Plot
Converting Units
Plots display data points in either SI o r US units as defined within the Preferences (File»Display»Default Unit
System). You can switch between SI (°C) and US (°F) units on a single series or an entire plot without
changing the overall system preferences.
To change the units for a single seri es, right-click the series with the arrow tool and select Convert Series Units
and then sele ct the unit you want to use.
To change the units for multiple seri es within the plot, click the Units icon on the toolbar or sele c t
Edit»Convert Units.
If a series can be configured with multiple unit s , there is a drop-down list in the u nits field as in the example
below. Select the desired units from the drop-down list for all the series you wish to c hange and then click
Convert. This changes the units displayed on the axis, in the legend , in the Details pane, a nd in the Poi nts table.
Figure 26. Convert Plot Dialog Box
1. For each series that supports unit options, select the desired units from the drop-down list.
2. Click
Convert.
This change s the units displayed on the axis, in the legend, in the Detai ls pane, and in the Poi nts table.
Undoing and Redoing Plot Changes
You can undo and redo changes made to the plot display, including zooming, panning, crosshair placement,
graph and ax is properties modifications, and more.
To undo the most recent change, click the Undo Act ion icon on the toolbar or select
To redo the most recent c hange that had previously been und one, click the Redo Action icon on the toolbar
or select
When using the
following example, the most recent change that can be undone is to
Edit»Redo Action.
Edit menu for Undo or Redo, the most recent change is listed with the menu choice. In the
Zoom Out.
USB-5100 Series keeps track of the changes that you make within each plot dialog box and temporarily stores
them as undoable actions. To see a complete list of all the actions that can be undone or redone, click the down
arrow to the right of either icon on the toolbar.
The number of undoable actions stored is set within the plot preferences. You can configure USB-5100 Series
to either store a specific number of undoable actions or an unlimited number. In addition, you can e nable or
disable the feature altogether. Note that storing an unlimited number of actions can impact software
performance on slower computers.
Edit»Undo Action.
44
Page 45

USB-5100 Series Software Help Modifying a Plot
Saving Project Files
A project file (.hproj) is a plot that you have cu stomized using the various features and tools of USB-5100
Series. When you open a project file, the plot appears as it did when you saved the project file and contains all
of the same data.
To save your current data with a customized view of the plot, click the Save icon on the toolbar, or choose
Save Project from the File menu. To open an existing project file, choose Open Project from the File menu.
Using the Linear Data Assistant (USB-5106 Only)
You can run the Linear Scaling Assistant (LSA) from the Launch Logger dialog box to create additional data
series that are automatically available each time you read out the logger and open the resulting data file. The
LSA converts a data series from a compatible sensor to some other measurement. Yo u enter two raw values a nd
their corresponding measurement values. The conversion must be based on a linear relationship. Nonlinear
scaling is not available.
To use the LSA, click
dialog box.
Scaling in the Launch Logger dialog box, and then click Create in the Data Assistants
Default Settings
The parameters last entered into the LSA are retained the next time the L S A runs, unless it is being used to edit
an existing series. If you run the LSA from the Plot Setup dialog box and then later you run it from the Launch
Logger dialog box, the default values are the values you entered in the Plot Setup dialog box.
Hiding Assistants
To hide or show the LSA in the Plot Setup dialog box, click Manage. Thi s opens the Preferences dialog box to
allow you to change thes e settings.
Updating the Linear Scaling Assistant
The LS A is installed automatically. There may also be times when a new LSA is available between software
releases and needs to be installed manually. To do this, complete the following steps:
1. Check
2. Right-click on the USB-5100 Series software icon and select
3. Enter the Administrator name and password as prompted
4. Select
5. Click
www.mccdaq.com/Software for an updated LSA file. If an upda te d file is available, download it.
Run as Administrator.
Readout Device and then select a device that supports the LSA.
Load in the Plot Setup dialog box and select the .jar file to update the LSA.
License Agreement
This software is furnished in accordance with a separate license agreement included with the software, and
subject to any restrictions set fo r th there in. Fo r more information about MC C licensing terms and policies, visit
www.mccdaq.com/legal.
Linear Scaling Assistant
The Linear Scaling Assistant converts a data series from a compatible sensor to some other measurement when
you enter two raw values and their correspond ing measurement values. The conversi on must be based on a
linear relationship. Nonlinear sca ling is not supported.
Supported Sensors
The Linear Scaling Assistant can be applied only to logged data from the following sensors:
CABLE-4-20-mA Input Cable
CABLE-ADAPx
45
Page 46

USB-5100 Series Software Help Modifying a Plot
Using the Linear Scaling Assistant
To use the Linear Scaling Assistant, complete the followi ng steps:
At launch time: Using a logger with a sensor that supports scaling at launch ti me, c lick the Launch icon on
1.
the toolbar. Click the Scaling but ton. Double-click the assistant name or select the assistant and click
Create.
At plot setup: Read out a logger or open a file that supports linear scaling. Select the Linear Scaling
Assistant and click Process.
2. In the Linear Scaling Assistant dialog box, choose the data series to convert from the
Raw Series list.
Figure 27. Linear Scaling Assistant Dialog Box
3. In the Scaled column of the Parameters panel, type the units name for the scaled series and enter the scaled
values in the Scaled column to correspond with the numbers in the Raw column. (The de fault values in the
Raw column are based on the high and low values supported by the sensor, but you may use different
values, as long as those values fall within the sensor's range.) These numbers establish a linear relationship
between raw and scaled values.
4. In the
5. Type any
6. Click
Resultant Series Name field, keep the default name or type a new one.
User Notes concerning the series you are creating (optional).
Create New Series.
If you ran the assistant from the Lau nch Logger di alog box, the Scaling button displays the number of
newly created series.
If using this assistant while plotting, the new series is listed and selected in the Plot Setup dialog. Click the
Plot button to display the series.
The scaled series appears in the plot immedia tely or when you read out the logger if configuring this at
launch time. The settings for the scaled series are listed in the Details pane of the plot.
Figure 28. Scaled Series in Details Pane
46
Page 47

USB-5100 Series Software Help Modifying a Plot
After the plot is displayed, you can apply minimum, maximum, and average filters to the scaled series as you
would for any sensor data series.
Exporting Data
While USB-5100 Series offers many tools for analyzing data, there may be instances where you need to export
data for use in other software. Refer to the following for exporting data and other related topics:
Exporting Table Data
Exporting Details
Copying Points Data into Another Application
Formatting the Date/Time Column in Excel
Exporting Table Data
You can export the data shown in the points table to a Microsoft Excel file or to a text file (.csv or .txt) for
importing into other applicatio ns.
To export data, complete the following steps:
1. From USB-5100 Series files: Open a data or project file. Make sure the points table includes the series you
want to export. This might include series pasted from other data files or series derived through filters .
Make any changes as necessary.
2. Select
3. To change the export settings, click the Preferences button . Make any changes to the settings and then
Note
Changes to the Use export ordering rules preference are not automatically displayed in the Export dialog box;
they does take effect the next time you open the Export dialog box.
4. Select the series you wish to include in the exported file. Use the All and None buttons or the checkboxes
Note
Only the series that are listed in the po ints table in a plotted data file are available to export from this dialog
box. To make additional series appear in this dialog box, click Cancel and go back to step 1.
5. The data is exported in the order displayed in the Export dialog box. To change this sort order, click a
File»Export Table Data or click the Export icon on the toolbar.
Figure 29. Export Dialog Box
OK in the Preferences dialog box to return to the Export dialog box.
click
in the Select column to make your changes.
column header in the Export dialog box. You can sort the
both ascending and descending order. Or, click a row to drag that series to a different position in the list.
Measurement, Units, S/N, and Label col umns in
47
Page 48

USB-5100 Series Software Help Modifying a Plot
To return to the original sort orde r, click the Restore Order button . Note that if you have the export
preferences set to
Use export ordering rules, then the series is listed in the order defined in that preference
when you click the Restore Order button. If the data file contains series with measurement types that are
not defined in the export ordering rules preference, then those series are listed after the defined series.
6. Click
7. Click
Export and then select where you want to save the file.
Save. You can now open the exported file in Excel or another software application.
Exporting Details
You can export the information in the Details pane to a text file, which can be opened in any text editor or
imported into numerous applications, such as Microsoft Word or Excel.
To export details, complete the following steps:
1. Make sure the Details pane includes the series you want to export. This might include series pasted from
other data files or se ries derived through filters
2. Select
File»Export Details.
3. Accept the default file name, or type a new name.
4. Click
Save.
Formatting the Date/Time Column in Excel
In Excel, dates and times for each data point may initially appear as ####### and times may not have seconds
listed.
To display the full date and time with seconds in Excel, complete the followi ng ste ps:
1. Adjust the time column width so you can see the whole date and time.
2. Select the time column from row 3 down.
3. Select
4. Select the
5. Add
6. Click
To export the date and time in separate columns, go to
Date and time format: Separate into two columns option.
Format»Cells.
Custom category and then select m/d/yyyy h:mm as the type.
:ss (or :ss.000 if you used a fast logging i nt erval) to t he end of the string in the Type field:
m/d/yyyy h:mm:ss (normal logging interval)
m/d/yyyy h:mm:ss.000 (fast logging interval)
OK. The seconds should be listed automatically.
Preferences»General»Export Settings and enable the
48
Page 49

Chapter 5
Hardware Reference
Refer to the following topics for more information on using USB-5100 Series with specific devices:
Updating USB-5100 Series Logger Firmware
Fixing a
Updating USB-5100 Series Logger Firmware
All data on the device is erased when you update the firmware. To avoid loss of data, be sure to read out any
data on the USB-5100 Series logger before updating the firmware.
Determining the installed firmware version:
Complete the following steps to d etermine the firmware version currentl y installed on a USB-5100 Series
logger:
1. Connect the logger to a computer and run the USB-5100 Series.
7. Select
8. Click
Read Header Failed Error
Device»Status to open the Status dialog box.
Yes if the Logger's Power Reset dialog box opens.
The currently installed firmware version is displayed in the
Figure 30. Device Identification Area Showing Firmware Version
Device Identification area of the dialog box.
Updating the firmware
Complete the following steps to update the firmware on a USB-5100 Series logger:
1. Download t he firmware file (
2. Connect the USB-5100 Series logger to your computer.
3. Select
4. Navigate to the desktop, select the firmware file, and then click
5. Click
6. Click
7. Click
8. Click
Help»Update Device Firmware»Update USB-5100 Ser ies Firm ware , and click Yes in the Update
USB-5100 Series Firmware dialog box.
Continue in the Update USB-5100 Series Firmware dialog box.
Yes when prompted to upgrade the firmware on the device.
Firmware Update Complete dialog box displays after the firmware is installed.
A
Yes to open the Launch Logger dialog box, or No to close the Firmware Update Complete dialog
box.
You must launch the USB-5100 Series logger before it can be used again.
Yes in the Logger's Power Reset dialog box each time this dialog box displays until the logger is
relaunched.
.hex) from www.mccdaq.com/firmware and copy it to the desktop.
Select.
49
Page 50

USB-5100 Series Software Help Hardware Reference
Fixing a Read Header Fail e d Error
Occasionally, when trying to launch, check status, or read out a USB-5100 Series logger, you may receive a
Read Header Failed error. This error occurs when a device header cannot be read, usually because of a
communication error or corrupted header.
Complete the following steps to fix this error:
1. Select
2. When the readout is complete, save the data to a
If you receive a
Device»Utilites»Force Offload USB Logger.
Logger Readout window displays with the progress bar, the data is being read out from the device.
If the
.hob file.
Read Header Failed message again, the header has probably become corrupted. You can
restore the header by launching the logger. This resets the device launch options to factory defaults. However, it
also causes any logged data or offloaded data from a shuttle to be lost.
If you receive a
Read Header Failed message and are unable to read out data from the logger, please contact
Measurement Computing Corp oration to attempt to retrieve the logged d a ta.
Knowledgebase:
Tech support form:
Email:
techsupport@mccdaq.com
kb.mccdaq.com
www.mccdaq.com/support/support_form.aspx
Phone: 508-946-5100 and follow the instructions for reaching Tech Support
50
Page 51

Chapter 6
Preferences
Setting Preferences
Menus
The Toolbar
Setting the Language Format on Yo ur Computer
Setting Preferences
You can change the default behavior of USB-5100 Series in the categories listed below. Preference settings are
unique for each user login on your computer. The following categories are available:
General: Configure prefere nces for Export Settings, Selecting Devices, File Associations, Startup,
and Data Encoding.
Communications. Configure preferences for Device Types , Serial Ports, Device Speeds, and Other
Options.
Plotting: Configure pr eferences for Fonts, Lines, Value Axis, Layout, Points Table and Details Pane,
Gridlines, Plot Setup, Other Options, Undo & Redo.
Display: Configure preferences for Default Unit System, Date/Time, and Series.
Warnings. Configure preferences for various warning types.
To restore default preferences, refer to Restoring Default Preferences
.
General Preferences
Use the General category within Preferences to control a variety of software behavior, i ncluding launching,
reading out, opening files, exporting, selecting device s , and more.
To change these settings, complete the following steps:
1. Select
2. Select
3. Adjust any of the settings described below and then click
Export Settings
See Export Settings for information about the preferences in this subcategory.
Selecting Devices
This preference controls when the Select Device dialog box is displayed. If you select Show Select Device
window if two or more devices are found, even if one is already selected, then the Select Device dialog
box does display any time more than one device is connected to the computer. This allows you to choose the
device you want to work with any time you select
Device»Stop. If you select Only show Select Device window if a device has not been selected, then the
Select Device dialog box does only display the first time you select Launch, Readout, Status, or Stop.
That device remains selected until you change it with the Select Device icon on the toolbar.
File»Preferences (Windows) or USB-5100 Series Software» Preferences (Macintosh).
General and then click the subcategory you want to change.
OK.
Device»Launch, Device»Readout, Device»Status, or
51
Page 52

USB-5100 Series Software Help Preferences
File Associations
Use this preference to control the association of USB-5100 Series file types on Windows.
Note
You must have administrator privileges on the computer to change file type associations. To temporarily run
USB-5100 Series as an Administrator, right-click the USB-5100 Series icon and select Run as Administrator.
Enter the Administrator name and password as prompted.
By default, files with the extensio ns of .hob, .hsec, and .hproj are automatically associated with USB-5100
Series. This means that these files are identified by a USB-5100 Series icon and can be opened by doubleclicking them. Click
Map or UnMap to change the file type associations.
Startup
Show splash screen on startup checkbox: This preference controls whether the USB-5100 Series splash
screen displays every time you open the software.
Data Encoding
Data encoding controls how special characters are displayed in files that are exported from USB-5100 Series.
The default is to use UTF-8, a common character encoding protocol for software. Select
characters are not displaying correctly in expor te d files in Windows.
Windows default if
Export Settings
Use the Export Settings preferences to customize how data is formatted when you export the table data from a
plotted data file, to set up automatic export upon readout, to include plot details in an exported file, and to set
export or dering rules.
To access these settings, complete the following steps:
1. Select
2. Select
3. Change any settings describe d below and then click
File»Preferences (Windows) or USB-5100 Series Software»Preferences (Macintosh).
General»Export Settings.
OK.
Export file type: Select how you want exported d a ta to be saved: either to a text file (.csv or .txt) or a
Microsoft Excel file (
Export table data column separator: This setting controls the column separato r fo r e xp orted text files. (If
.xls).
you selected Excel for the expo rt file type, then this option is disabled. ) Se le c t Comma, Tab, or Semicolon.
When Comma is selected as the column separator, the data is saved to a
Excel. When Tab or Semicolon is selected, the data is saved to a
Include line number column: By default, exported files includ e line numbers. Clear this checkbox if you
.csv file that can be imported into
.txt file.
do not want line numbers in the file.
Include plot title in header: Clear this checkbox if you do not want the plot title included in the header of
the exported file.
Always show fractional seconds: Select this checkbox to show fractional seconds in the time -stamped
data points.
Separate date and time into two columns: By default, the date and time of a logged data point is
exported as a single column to facilitate graphing in spreadsheet programs. Select this checkbox to split the
date and time into two columns.
No quotes or commas in headings, properties in parenthesis: Select this checkbox if you do not want
quotations marks and commas in the exported file's column headers. Sensor properties, or units, (such as °F
or RH) are listed in parenthesis instead of quotation marks when this setting is enabled.
Include logger serial number: When this set ting is enabl ed, the logger's serial number is listed in each
column header in the exported file. This is useful if you are exporting data series that were copied and
pasted from plots that original ly came from different loggers.
Include sensor serial number, or label if available: When this setting is enabled, each sensor serial
number or label (if available) is listed in each column header in the exported file. This is especially useful
when exporting data from multiple sensors recording the same measurement type (for example, three
temperature sensors).
52
Page 53

USB-5100 Series Software Help Preferences
Note
If No quotes or commas in headings, properties in parenthesis is selected, the label (if available) is added
to the column header instead of the sensor serial number.
Date format: Select the format in which you want the da te to be shown (Month, Day, Year; Day, Month,
Year; or Year, Month, Day).
Date separator: Select either a slash ( / ) or a dash ( - ) to separate the months, day, and year in the date
format.
Time format: Select whether to show the time in a 12-hour or 24-hour format.
Positive number format: Select the format in which positive numb e r s a r e displayed (for example:
1,234.56; 1 234,56; 1.234,56; or 1. 234 56).
Negative number format: Select the format in which negative numbers are displayed (for example: -123,
123-, or (123).
Automatically export table data upon reading out a logger: Select this checkbox if you want USB-5100
Series to automatically create an export file each time you read out a logger (note that you must save and
plot the data before the exported file is created). When this setting is enabled, the defa ult o ption is to export
the data to a single file (as controlle d by
Bypass export dialog and save as single file). This results in a n
exported file saved in the same directory as the data file offloaded from the logger. Both files does also
have the same prefix. If you do not want to save it to the default directory or use the default name, then
Show export dialog instead to select your own directory or name.
select
Include plot details in exported file: When this setting is enabled, the information that appears to the left
of the plot in the Details pane (series information, the type of logger, deployment information, and so on) is
included in the exported file along with the sensor data. This option only applies to text (
.txt or .csv) file
type exports, not Excel®. It also requires that the file is saved and p lotted before exporting. Finally, select
a tab or semicolon for the
Export table data column separator when using this op t ion. If you choose a
comma separator, then details may span multiple cells.
Use export ordering rules: Select this option to define the ord e r that series are listed in the Export dialog
box by default. Select the measurement type from the drop-down list and then click Add to add it to the
ordering r ules list. In this example, we have set the order to temperature, RH, rain, wind speed, and then
wind direc t ion. This means the
Export dialog box does always show any temper ature, RH, rain, wind
speed, and then wind direction se r ie s first in the list, in that order, fo llowed by any series that were not
defined in the rules. (You can override this order as needed in the Export dialog box by clicking the column
header or dragging a ro w.) To delet e an item fro m the ordering rules, click the measur ement type and then
click Remove. To change the order of items, drag them up or down.
Communications Preferences
Use the Communications category within Preferences to set the default device type, device speed, and status
dialog box operation.
To change the s e settings, c omplete the following steps:
1. Select
2. Select
3. Adjust any of the settings described below and then click
Other Options
Select Close the status window on logger disconnect or communication error if you want the Status dialog
box to close automatically (on the next refresh) if it is open when you remove the interface cable, base station,
or coupler from the logger, or if communication is interrupted for another reason. Clear this opti on if you want
to leave it open. Note that if the
close automatically even if this op tion is not selected.
File»Preferences (Windows) or USB-5100 Series Software»Preferences (Macintosh).
Communications and then click the subcategory you want to change.
OK.
USB logger readout: Select Fast readout enabled to read out a USB logger quickly. Disable this option
only if you are having communication problems with the logger. Communication between the computer
and the logger is slower when this option is disabled.
Status dialog box was opened from the Launch Logger dialog box, it does
53
Page 54

USB-5100 Series Software Help Preferences
Plotting Preferences
Use the Plotting Preferences to control fonts, series lines, Y-axis, and several other plot elements.
To change these settings, complete the following steps:
1. Select
2. Select
3. Adjust any of the settings described below and then click
File»Preferences (Windows) or USB-5100 Series Software»Preferences (Macintosh).
Plotting and then click the subcategory you wish to change.
OK.
Note
To apply certain preferences to a single series, double-click the series to open the Series Properties dialog box.
Fonts
Use the Fonts preferences to control the font size. Note that the plot title font is two p oints larger than the
selected font size.
Layout
Show the details pane when plotting data: Select this preference to automatically display the details pane
with the plot.
Show the points table when plotting data: Select this preference to automatically display the points table
with the plot.
Points Table & Details Pane
Use sensor Label (if available) in points table and details pane: Select this preference to display the
sensor label (if available) as added in the
the points table and in the details pane. This is especially useful if there are multiple sensors of the same
measurement type in the s ame file.
When selected value in table is out of plot range, drag series to that value: Normally, if the plot is
zoomed in and you select a point in the Points table that is outside the zoom area, the plot does scroll so the
marked point is in view, while re ta inin g your zoom factor. Clear this box if yo u d o not want to scroll to
points outs ide of the current view.
Launch Logger dialog box with corresponding column header in
Gridlines
Enable horizontal gridlines when plotting data: By default, horizontal gridlines are not displayed when
you open a plot. Enable this optio n if yo u always want a new plot to display gridlines for all value axes.
Enable vertical gridlines when plotting data: By default, vertical gridlines are always displayed when
you open a pl ot. Clear this checkbox i f you never want a new plot to displa y gri dlines for the time axis .
Plot Setup
Automatically select all data series for plotting: By default, some series are not selected for display in
Plot Setup dialog box. Select this checkbox if you want every series to be selected automatically in the
the
Plot Setup dialog box.
Automatically select internal events for plotting (e.g. Button Up/Down, Host Connected, EOF): By
default, all internal events are selected for display in the Plot Setup dialog box. Clear this checkbox if you
do not want these events to be selected automatically in the Plot Setup dialog box.
Automatically select pre-defined Data Assistants or Filtered series for plotting instead of the source
series:
This checkbox contro ls whether any filtered series configured in the Launch Logger dialog box is
automatically selected in the
selected automatically in the
Data assistants are not supported by USB-5100 Series data loggers.
When Light and Occupancy are enabled as State on the same logger, derive four possible
Light/Occupancy state channels: This preference is not supported by USB-5100 Series data loggers and
has no effect on logger operation.
Plot Setup dialog box. Clear this checkbox if you do not want filtered series
Plot Setup dialog box or generated when plotting data.
54
Page 55

USB-5100 Series Software Help Preferences
Other Options
Mark all points when plotting data: This preference controls whether each data point is marked on the
series. Point markers are not displayed by default (except for events and for a series with only one data
point) to avoid cluttering the plot. Enable this option if you want all point s to be marked on every series
whenever you display a plot. Keep in mind, however, that marking all points on a large plot takes longer
and consumes more system memory.
Label the time axis: Select this option if you want the default label Time to be displayed with the time axis
(X-axis).
Use sensor labels (if available) in legend: Select this option if you want any available sensor labels as
added in the Launch Logger dialog box to appear in the legend with the series name.
Undo & Redo
This preference controls whether you can undo and redo the changes you make to plots.
When the
within USB-5100 Series.
If you select
plots that you can undo. For example, if you choose to store 25 undoable actions, then you can undo the last
25 changes that you made to the plots, but not the 26th. You can co nfigure the software to store from
1 to 50 undoable actions (chan ges to the p lot) with this setting.
If you select
plots that you can undo. Note that storing an unlimited number of actions can i mp a c t software performance
on slower computers.
Undo & Redo preference is enabled, you can specify how many changes to plots are stored
Number of stored undoable actions, then there is a limit to the number of changes to the
Enable unlimited undoable actions, then there is no li mit to the number of changes to the
Display Preferences
Use the Display category within Preferences to control the default units, date/time format, and series options
displayed in plots.
To change the s e settings, c omplete the following steps:
1. Select
2. Select
3. Adjust any of the settings described below and then click
Default Units
This preference controls the units used throughout USB-5100 Series: either US or SI (Metric). This does change
the units shown on the a xi s , legend, p oints, and details the next time yo u d isp lay a plot. This does also change
the current readings the next time you open the Status dialog box.
File»Preferences (Windows) or USB-5100 Series Software»Preferences (Macintosh).
Display and then click the subcategory you want to change.
OK.
Date/Time
These settings control how the date and time appears in USB-5100 Series. Changes you make are s hown in the
date and time sample. Any plots that may be open when you make changes to the date and time display does
require the plots to be redrawn, which may take several seconds. As noted in the preferences, date and time
formatting beyond what is specified in these settings are determined by the computer operating system.
Note
When you export a file, the date and time are exported as determined by the Export Settings in Preferences
(except for year format, which is only controlled by these Date/Time settings in the Display category. If you
open the file in Excel, the dates and times may be automatically reformatted to Excel's default date and time
format, which yo u ma y customize within Excel.
Date format: This controls how the date is displayed: Month, Day, Year; Day, Month, Year; or Year,
Month, Day.
Date separator: This controls what character is displayed between the month, day, and year: a slash (/) or a
dash (-).
Year format: This controls whether the year is listed as two of four digits.
55
Page 56

USB-5100 Series Software Help Preferences
Time format: This controls whether the time is shown in 12- or 24-hour for mat.
Use locale for all: Click this button to use the default settings for the current locale as configured in the
operating system.
Series
Use the Series preferences to customize how data series are sorted in the Status and Plot Setup dialog boxes and
to set battery series options.
Select a sort order: Choose one of the following four ways to sort t he series disp l ayed in the S tatus and
Plot Setup dialog boxes:
Logger's default: Series are sorted the same way they were listed in the Launch Logger dialog box.
o
Enabled: All series selected, or enabled, for logging are displayed at the top of the list.
o
Label: Series are sorted by their label name, if available. Labels can be sorted in ascending or
o
descending order (alphabetically or numerically depending on the label entered).
Measurement: Series are sorted by measurement type alphabetically in ascending or descending order.
o
Display derived series below their source series: A derived series is one that is calculated rather than
recorded by a sensor. Some loggers can create data files that not only have logged sensor data, but also
additional derived series automatically calculated in relevant units. One example is a logger with a
temperature sensor. The logger records a data series for temperature and calculates the minimum,
maximum, and averages for the series (the derived series) based on filtering. Select this option if you want
any derived series to be displayed immediately following its source series in the
dialog boxes. By default, this option is disabled, which means all derived series are displayed at the bottom
of the data series list.
Show the option to log battery: This setting controls whether you have the option to enable or disable the
battery series in the Launch Logger dialog box when applicable. You can configure some loggers to record
the battery voltage at every logging interval. When this option is selected, you can choose whether to
record the battery voltage at launch time. If this setting is not selected, then you cannot record the battery
voltage and it does not be shown in the Launch Logger dialog box. This setting is enabled by default.
Display logger's battery series in the last position: This setting controls whether the optional battery
series is displayed at the bottom of the d a ta series list in the Launch Log ger, Status, and Plot Setup dialog
boxes regardless of any other series settings. If this setting is not enabled, the position of th e battery series
in the data series list does vary based on other preferences. This setting is enabled by default.
Status and Plot Setup
Warnings Preferences
Use the Warnings Preferences to disable warning messages that you do not want to display. Before you do so,
however, keep in mind that the warnings are intended to help prevent mistakes and inadvertent data loss.
Review each warning carefully before disabling it. To re-enable a warning, re-select the check box.
To disable all of the war nings in a group, click
To enable all of the warnings in a group, click
You access the Warnings Preferences by going to
To change the s e settings, c omplete the following steps:
1. Select
4. Select
File»Preferences (Windows) or USB-5100 Series Software»Preferences (Macintosh).
Warnings and then clic k t he subcate gory you wish to change.
5. Adjust any of the settings descr ibed below. To disable all the warnings in a group, click the
button for that group. To enable all t he warnings in a group, click the
OK in the Preferences dialog box to save changes.
Select None for that group.
Select All for that group.
File»Preferences»Warnings.
Select None
Select All button for that gr oup. Click
56
Page 57

USB-5100 Series Software Help Preferences
General
There is any remaining unsaved data when closing a plot or application: This warning reminds you
when you made changes to a plot, but haven't saved the changes to a project file.
The project file being opened was created with a different version of USB-5100 Series: This message
warns you if you are opening a project file that was saved in different version of USB-5100 Series than you
are currently using. In some instances, there may be differences in software versions that could affect the
project file.
Warnings Before the Launch Screen
These preferences control warnings that appear when the logger is connected to the computer and you select
Launch fro m the Device me nu or the Launch icon from the toolbar. If enabled, these warnings display before
the Launch Logger dialog box is opened.
The logger is waiting for a delayed start: This warning indicates that the logger has already been
configured to start logging on a spe cific date and time; logging has not begun.
The logger is waiting for a triggered start: This warning indicates that the logger has already been
configured to launch with a push button or triggered start, but logging has not begun.
The logger needs to be readout: This warning indicates the data on theUSB-5100 Series logger has not
been read out yet.
Warnings not supported by USB-5100 Series data loggers
The logger is currently logging (Station loggers only) warning checkboxes is available, but is not supported
by USB-5100 Series data loggers. Selecting and clearing this checkbox has no effect on software operation.
Warning After the Launch Screen
These preferences control warnings that appear after you click the Start button in the Launch Logger dialog
box.
The specified delay time is in the past: This warning indicates that you have selected a start date or time
for loggin g t hat is in the p ast instead of the future .
The Battery channel is enabled but will not log data without other sensors attached. This warning
indicates that you have only selected the battery channel in the Launch Logger dialog box and no other
sensors.
Warnings not supported by USB-5100 Series data loggers
The following warning checkboxes are available, but are not supported by USB-5100 Series data loggers.
Selecting and clearing these checkboxes has no effect on software operation.
• The specified delay time is past the sensor cap expiration
• The logging duration could extend past the sensor cap expiration
• The logging interval specified is too small for the TRMS module.
• The Battery channel is disabled but recommended when using excitation power.
• The logger's battery power is too low to provide excitation to external sensors.
• The header size of an optic logger may cause problems with older shuttle firmware.
57
Page 58

USB-5100 Series Software Help Preferences
USB-5100 Series (on Macintosh)
Edit
View
Help
Restoring Default Preferences
To return all preferences to their original settings in both the Preferences and custom-defined Launch Logger
dialog box settings (% or Time, Logging Interval), complete the following steps:
1. Select
2. Click
File»Preferences (Windows) or USB-5100 Series Software»Preferences (Macintosh).
Restore Defaults.
A message appears asking if you are sure you want to restore all preferences to their default values.
3. Click
Yes to restore the default preferences.
In addition to the options configured in the
affected:
Data File Folder Locations: When you restore the preference defaults, the default folder locations for
o
data files, text files, and project files is reset to :
Windows XP:
C:\Documents and Settings\<user>\My Documents\USB-5100 Series
Win dows XP )
Windows 7 and 8:
C:\Users\<user>\Documents\USB-5100 Series
Macintosh OS X: Users/<user>/Library/Application Support/USB-5100 Series
Custom-defined Launch Logger dialog box menus: Any custom-defined Launch Logger dialog box
settings, such as State Description, % or Time, Logging Interval, are cleared.
Menus
The following menus are available in USB-5100 Series:
File
Device
Preferences dialog box, the following settings are also
Tools
Window
The USB-5100 Series Menu
The USB-5100 Series menu is available on Macintosh only. Some of the menu options available from the File
menu in Windows are displayed here instead on Macintosh.
The USB-5100 Series menu options are:
About USB-5100 Series: Select this option to open a compatible data file. See Ope ni ng Files for more
information.
Preferences: Select this option to open the Preferences dialog box where you can change the default
settings in USB-5100 Series. See Setting Preferences for more information.
Services: This is a Macintosh operating system menu option.
Hide USB-5100 Series: This option hides USB-5100 Series from view.
Hide Others: This option hides all currently open programs except for USB-5100 Series from view.
Show All: This option displays all currently open programs.
Quit: Select this option to close USB-5100 Series.
58
Page 59

USB-5100 Series Software Help Preferences
The File Menu
From the File Menu, you can open and close data files and projects, export data, and print plot elements.
The File menu options are:
Open Data file(s): Select this option to open a compatible data file. See Opening Files for more
information.
Merge Data file(s): Select this option to add a da ta file t o the end of ano ther data file. See Merging Data
files for more information.
Open Project: Select this option to open a USB-5100 Series project. See Opening Files for more
information.
Recent Files: Select this option to quickly access the last 10 files you opened.
Close: Select this option to close the active file or project.
Close All: Select this option to close all open files and projects.
Save Data file: Select this option to save the active data file.
Save Project: Select this option to save the active project.
Export Details: Select this option to export the information in the Details Pane into a text file that can be
opened in any text editor or imported into many other types of programs (word processors, spreadsheets,
etc.). See Exporting Details for more information.
Export Table Data: Select this option to export the points shown in the Points tab le to a text file (.csv or
.txt) or Microsoft Excel (.xls) file. See Exporting Table Data for more information.
Page Setup: Select this option to set up the paper size , mar gin s, a nd orientation for printing a plot.
Print Preview: Select this option to preview the page fo r printing a plot.
Print: Select this option to print a plot.
Print Details: Select this option to print the Details Pane.
Print Points: Select this option to print the Points Table.
Preferences: Select this option to open the Preferences dialog box where you can change the de fault
settings in USB-5100 Series. See Setting Preferences for more information. Note that Preferences is
available from the USB-5100 Series menu on Macintosh.
Quit: Select this option to close USB-5100 Series. Note that this is available from the USB-5100 Series
menu on Macintosh.
The Device Menu
Use the Device menu to launch, read out, and stop loggers.
The Device menu options are:
Launch: Select this option to open the Launch Logger dialog box where you can set launch settings and
start the logger.
Readout: Select this option to offload, or read out, data from the l ogger to your computer, allowing you to
save the data in a data file and view the plot in USB-5100 Series.
Status: Select this option to view the curre nt status of the l ogger, inc luding curr ent readings (for some
sensors), remaining battery, and logger memory.
Stop: Select this option to stop a de vice.
Select Device: Use this option to select a device currently connected to the computer.
Utilities: Use the Utilities submenus to select one of the three Force Offload options only if you are having
problems reading out your device or as directed from MCC Technical Support. You can also select the
Reset USB-5100 Series Logger option as directed by MCC Technical Support.
59
Page 60

USB-5100 Series Software Help Preferences
The Edit Menu
Use the Edit menu to modify the plot, including filtering series, removing series, setting properties, and
converting u nit s.
The Edit menu options are:
Filter Series: Select this option to create a new series based on statistical analysis of an existing series over
specified periods of time. See
Copy Series: Select this option to copy a series and then paste it into another plot. Se e Copying a Series to
Filtering a Series for more information.
another Plot for more information.
Paste Series: Select this option to paste a series into another plot. See Copying a Series to another Plot for
more information.
Add Graph Label: Select this option to open the Graph Label Properties dialog box to add labels to a plot
that identify specific points or call attention to a region of the graph. See Adding Labels to a Graph for
more information.
Remove Series: Select this option to remove series from a plot after you have selected it in the graph or
the Details pane. If you remove a series, it can only be recovered by reopening the original data file or a
saved project file that contains the series.
Graph Properties: Select this option to open the Series Properties dialog box. See Setting Series Properties
for more information.
Convert Units: Select this option to ac c e ss the Convert Plot dialog box, which allo ws you to convert some
or all of the series on the currently focused plot to other units (for example, from degrees Fahrenheit to
degrees Celsius). Note that changing the units does result in the entire plot being redrawn. See Converting
Units for more information.
Undo Action: Select this option to undo the last change made to the c urrent plot. The most recent change is
listed after the Undo Action menu cho ice. See
Redo Action: Select this option to redo the last change that was previously undone. See Undoing and
Undoing and Redoing Plot Changes for more information.
Redoing Plot Changes for more information.
Copy Graph to Clipboard: Select this option to copy the graph to the clipboard to paste it into another
application.
60
Page 61

USB-5100 Series Software Help Preferences
The View Menu
Use the View menu to change the appearance of the plot, including zoomi ng, showing or hiding co mponents,
marking points, and set t ing gridl i nes.
The View menu options are:
Zoom In: Select this option to zoom in on the plot.
Zoom Out: Select this option to zoom out on the plot.
View Full Scale: Select this option to view the plot in full scale.
Details Pane: Select this option to show or hide the Details Pane.
Points Table: Select this option to show or hide the Points Table.
Show Title: Select this option to show or hid e the title of the plot.
Show Legend: Select this option to show or hide the plot legend.
Mark All Points: Select this option to mark all points on the plot.
Vertical Gridlines: Select this option to show or hide vertical gridlines o n the plot.
Horizontal Gridlines: Select this option to show or hide horizontal gridlines on the plot.
Select None: Select this option to deselect all elements in the plot.
Remove Crosshair: Select this option to remove crosshairs from the graph.
Bring Series To Front: Select this option to bring a series to the front on the plot on top of a ll other series.
Send Series To Back: Select this option to send a series to the back of the plot behind all other series.
The Window Menu
Use the Window menu to organize several plots.
The Window menu options are:
Tabbed View: With this option, plots are layered as tabs so you can see the file name of each open plot (or
Untitled* for an unsaved data file). You can also get to this view b y clicking the Tabs icon in the lower
left of the window.
Tile Horizontally: Select this option to arrange up to five plots horizontally. If six or more plots are open,
they are tiled as a grid. You can also get to this view by clicking the Horizontal Tile icon in the lower left
of the window.
Tile Vertically: Select this option to arrange up to five plots vertic a lly. If six or more plots are ope n, they
are tiled as a grid. You can also get to this view by clicking the Vertical Tile ic on in the lower left of the
window.
Tip: You can open the same data file multiple times to create different vie ws of the graph, then use the Tile
commands on the Window menu (or resize and move the windows manually) to see all of them at once. This is
helpful if you want to zoom in on several different areas and view them side-by-side, see the detail of a small
area while the full graph is still in view, or view each series in a different wi ndow.
The Help Menu
Use the Help menu to get more information about USB-5100 Series software, upgrade the software and certain
devices, and request help from MCC Technical Support.
The Help menu options are:
USB-5100 Series Help: Select this option to open the help system, displaying the full table of contents.
Update Device Firmware»Update USB-5100 Series Firmware: Select these options to check if there are
firmware updates available for your USB-5100 Series device.
About USB-5100 Series: Select this option to see which version of USB-5100 Series you are using in
Windows. This option is available from the USB-5100 Series menu on Macintosh.
61
Page 62

USB-5100 Series Software Help Preferences
Set Default
Units
Change the default unit type between US and SI. Any changes you make does take effect with
the next plotted file
.hproj
Opens the Export Options dialog box, from which you can configure settings for exporting a
.csv
.txt
Launches the Arrow Tool, which you can use to point to and select items on the graph to edit
Launches the Crosshair Tool, which you can use to display values for points on the graph and
Launches the Zoom Tool, which you can use to adjust the scaling of an axis or the entire
Show Graph at
Full Scale
Graph
Properties
Opens the propert ie s dialog box for the element currently selected (such as series, legend,
axis).
Vertical
Gridlines
Horizontal
Gridlines
Opens the Convert Units dialog box, which allows you to convert some or all of the series on
Celsius).
You can create a new series based on statistical analysis of an existing series over specified
periods of time.
Add Graph
Label
Opens the Graph Labels Properties dialog, which allows you to add a label to the plot or to a
specific series, and change the appearance of that label.
The Toolbar
The toolbar is located at the top of the main USB-5100 Series window and allows point-and-click access to the
most frequently used functions. Pause the pointer over each icon on the toolbar for a description of each tool.
Icon Name Description
Launch Opens the Launch Logger dialog box.
Readout Opens the Readout dialog box.
Status Opens the Status dialog box, which displays the logger st ate and current readin gs.
Stop Stops a logging logger.
Select Device Opens the select Device dialog box which displays available devi ces.
Undo Action Undoes the most recent change made to the plot.
Redo Action Redoes the most recent change that was undone to the plot.
Open Launches the Open dialog box, from which you can open USB-5100 Series files.
Save
Opens the Save dialog box, from which you can save the plot as a project (
) file.
Close Closes the currently focused plot.
Export
Print Prints the graph as it appears on your screen.
Arrow
Crosshair
Hand Drag Launches the Hand Drag Tool, which you can use to scroll an axis or the entire graph.
Zoom
Zoom In Launches the Zoom In Tool, which allows you to zoom in on a smaller area of the graph.
Zoom Out Launches the Zoom Out Tool, which allows you to zoom out to a larger area of the graph.
Mark Points Toggles point markers on or off.
text file of the data (in
their properties.
cross-references them to cells in the Points pane.
graph.
Resets the scale of a graph to accommodate all of the displayed data.
Toggles vertical gridlines on or off.
Toggles horizontal gridlines on or off.
or
format) for use in spreadsheet and other applications.
Convert Units
Filter Series
Help Opens the Help.
the currently focused plot to other units (for example, from degrees Fahrenheit to degrees
62
Page 63

USB-5100 Series Software Help Preferences
Setting the Language/Forma t on Your Com put e r
The USB-5100 Series user inter face has been t ranslated from English into four languages, which are supported
by four specific formats. These languages and formats are: French (France), Spanish (Spain), Portuguese
(Portugal), and German (Germany). To change the language displayed in the USB-5100 Series user interface,
you must change the language/format settings on your computer as described below.
Note
The suppo rted language s only work with the specific format or country listed abo ve. For exampl e, Portuguese is
supported in the Portugal for mat o nly and not with Brazil.
The USB-5100 Series Help and all related documentation are availabl e in English only.
On Windows 7 and Windows 8
1. Close the USB-5100 Series software.
2. Open the Control Panel and select
3. Under the
4. Reopen the USB-5100 Series software.
Formats tab, select the desired language/format and click OK to save the changes.
On Windows XP
1. Close the USB-5100 Series software.
2. Open the Control Panel and double-click the
3. Under the
4. Reopen the USB-5100 Series software.
Regional Options tab, select the desired language/format and click OK to save the changes.
Region and Language.
Regional and Language Options.
On Macintosh OS X
1. Close the USB-5100 Series software.
2. Open System Preferences and access the
3. Under the Language tab, drag the desired language to the top of the list. If the desired language does not
appear in the list, click
4. Under the
Example: For Spanish (Spain), Spanish must b e first in the Language list, and Spain must be selected under
the Region drop-down men u.
5. Reopen the USB-5100 Series software.
Formats tab, ensure the correct Region is selected in the drop-down menu.
Edit List button to add the language.
Language & Text Preferences.
63
Page 64

Measurement Computing Corporation
10 Commerce Way
Suite 1008
Norton, Massachusetts 02766
(508) 946-5100
Fax: (508) 946-9500
E-mail:
info@mccdaq.com
www.mccdaq.com
 Loading...