

Page 1

Personal Daq User’s Manual
USB Data Acquisition Modules
Personal Daq/54
Personal Daq/55
Personal Daq/56
PDQ1
PDQ2
IOtech, Inc.
25971 Cannon Road
Cleveland, OH 44146-1833
Phone: (440) 439-4091
Fax: (440) 439-4093
e-mail (Product Information):
e-mail (Technical Support): productsupport@iotech.com
Internet: http://www.iotech.com
sales@iotech.com
Personal Daq
User’s Manual
p/n 491-0901, rev 6.0
© 1998 … 2005 by IOtech, Inc. 878695 Printed in the United States of America
Page 2

ii
Page 3
Warranty Information
Your IOtech warranty is as stated on the product warranty card. You may contact IOtech by phone,
fax machine, or e-mail in regard to warranty-related issues.
Phone: (440) 439-4091, fax: (440) 439-4093, e-mail: sales@iotech.com
Limitation of Liability
IOtech, Inc. cannot be held liable for any damages resulting from the use or misuse of this product.
Copyright, Trademark, and Licensing Notice
All IOtech documentation, software, and hardware are copyright with all rights reserved. No part of this product may be
copied, reproduced or transmitted by any mechanical, photographic, electronic, or other method without IOtech’s prior
written consent. IOtech product names are trademarked; other product names, as applicable, are trademarks of their
respective holders. All supplied IOtech software (including miscellaneous support files, drivers, and sample programs)
may only be used on one installation. You may make archival backup copies.
CE Notice
Many IOtech products carry the CE marker indicating they comply with the safety and emissions standards of the
European Community. As applicable, we ship these products with a Declaration of Conformity stating which
specifications and operating conditions apply.
Warnings, Cautions, Notes, and Tips
Refer all service to qualified personnel. This caution symbol warns of possible personal injury or equipment damage
under noted conditions. Follow all safety standards of professional practice and the recommendations in this manual.
Using this equipment in ways other than described in this manual can present serious safety hazards or cause equipment
damage.
This warning symbol is used in this manual or on the equipment to warn of possible injury or death from electrical
shock under noted conditions.
This ESD caution symbol urges proper handling of equipment or components sensitive to damage from electrostatic
discharge. Proper handling guidelines include the use of grounded anti-static mats and wrist straps, ESD-protective
bags and cartons, and related procedures.
This symbol indicates the message is important, but is not of a Warning or Caution category. These notes can be of
great benefit to the user, and should be read.
In this manual, the book symbol always precedes the words “Reference Note.” This type of note identifies the location
of additional information that may prove helpful. References may be made to other chapters or other documentation.
Tips provide advice that may save time during a procedure, or help to clarify an issue. Tips may include additional
reference.
Specifications and Calibration
Specifications are subject to change without notice. Significant changes will be addressed in an addendum or revision to
the manual. As applicable, IOtech calibrates its hardware to published specifications. Periodic hardware calibration is
not covered under the warranty and must be performed by qualified personnel as specified in this manual. Improper
calibration procedures may void the warranty.
Quality Notice
IOtech has been an ISO 9001 registered firm since 1996. Prior to shipment, we thoroughly test our products and
review our documentation to assure the highest quality in all aspects. In a spirit of continuous improvement,
IOtech welcomes your suggestions.
iii
Page 4
Your order was carefully inspected prior to shipment. When you receive your system, carefully
unpack all items from the shipping carton and check for physical signs of damage that may have
occurred during shipment. Promptly report any damage to the shipping agent and your sales
representative. Retain all shipping materials in case the unit needs returned to th e factory.
CAUTION
Using this equipment in ways other than described in this manual can cause
personal injury or equipment damage. Before setting up and using your
equipment, you should read all documentation that covers your system.
Pay special attention to Warnings and Cautions.
Note:
PDF
491-0901
During software installation, Adobe
®
PDF versions of user manuals will
automatically install onto your hard drive as a part of product support. The default
location is in the Programs group, which can be accessed from the Windows
Desktop. Initial navigation is as follows:
Start [Desktop “Start” pull-down menu]
⇒ Programs
⇒ IOtech PDaqView Software
You can also access the PDF documents directly from the data acquisition CD by
using the <View PDFs> button located on the opening screen.
Refer to the PDF documentation for details regarding both hardware and software.
®
A copy of the Adobe Acrobat Reader
is included on your CD. The Reader
provides
a means of reading and printing the PDF documents. Note that hardcopy versions of
the manuals can be ordered from the factory.
PersonalDaq_UsersManual.pdf
Contains the Personal Daq hardware-related and software-related chapters, as well
as a link to the following .pdf file. This pdf file, plus the follo wing constitute a
complete set of documentation for the Personal Daq Devices.
PostAcquisition Analysis.pdf
This pdf consists of two documents. The first discusses eZ-PostView, a post data
acquisition analysis program. The application is included free as a part of product
PDF
1086-0926
1086-0922
support. The second includes information regarding eZ-FrequencyView and
eZ-TimeView. These two applications have more features than does eZ-PostView
and are available for purchase. They can; however, be used freely during a 30-day
trial period.
iv
Page 5

About This Manual
Chapter 1: Personal Daq
⎯
Unit Startup provides information to get your Personal Daq system up and running.
The chapter includes installation steps, basic concepts regarding the Personal DaqView software program, and
steps for acquiring data.
Chapter 2: General Information & Specifications gives a general description of Personal Daq and related
hardware including PDQ expansion modules. Basic operational concepts and product specifications are
included.
Chapter 3: Hardware Setup provides detailed information regarding Personal Daq and includes information
regarding direct connection to PC USB, connection to a USB-powered hub, and connection to a self-powered
USB hub. The chapter also includes instruction for connecting a PDQ expansion module and input signal lines.
Chapter 4: Personal DaqView explains the ready-to-use Personal DaqView software that comes with every
Personal Daq. Topics include detailed explanations of the program’s pull-down menus, toolbar icons, and
keypad control options.
Personal DaqViewXL,
data acquisition capabilities from within Microsoft Excel
p/n 491-0905. Personal DaqViewXL is an add-in software application that provides setup and
TM
. The add-in is an option that is available for
purchase.
Chapter 5: Signal Management discusses signal modes, system noise, and includes a brief discussion of channel
control and expansion.
Chapter 6: Calibration explains how to perform periodic calibrations using the Windows-based program, UserCal.
Chapter 7: Troubleshooting and Customer Assistance
Appendices
Appendix A: API Custom Program Models explains the program models supplied on the release disk.
Appendix B: API Commands describes the entire command set for Personal Daq. Syntax, parameters,
interpretation, and error codes are explained. Sections on the individual commands include their parameters,
types, typical use and related information.
Appendix C: N/A, removed from manual.
Appendix D: Custom Labels provides blank labels and a Personal Daq channel layout reference. The appendix
also pertains to the
It provides blank labels in a table format that you can write in, edit, and print out from your PC.
pDaq_CustomLabels.doc. The file is located in the target directory: \\Program Files\pDaqView.
Personal Daq User’s Manual 887695 v
Page 6

vi 887695 Personal Daq User’s Manual
Page 7

Table of Contents
1 - Personal Daq ⎯ Unit Startup
Overview ……1-1
Inspect Your System ……1-1
Install Software ……1-2
Install Hardware ……1-2
Mount Personal Daq Modules to DIN Rail
(option) ……1-2
Connect PDQ Module (option) ……1-4
Connect Personal Daq to Host PC ……1-5
Connect Channel Signal Inputs ……1-6
Start Personal DaqView ……1-7
Configure System ……1-8
Channel Configuration ……1-9
Acquisition Configuration ……1-9
Data Destination Configuration ……1-10
Collect Data ……1-10
Quick Start for Personal DaqView …… 1-11
2 - General Information
General Description ……2-1
Channel Capacities ……2-1
Features ……2-2
Theory of Operation ……2-3
Universal Serial Bus (USB) ……2-3
Power Line Rejection ……2-3
Optical Isolation …… 2-4
A/D Conversion ……2-4
Input Ranges ……2-4
Analog Input Configuration ……2-4
Measurement Duration, Sample Rate, and
Resolution ……2-5
Automatic Calibration …… 2-6
Thermocouple Measurements ……2-6
Frequency Measurements ……2-7
Digital I/O ……2-7
Personal Daq Specifications ……2-8
Analog Specifications ……2-9
Frequency Specifications ……2-11
Digital I/O Specifications……2-11
General Specifications ……2-11
Optional Accessories …… 2-11
Channel Connection Layouts ……2-12
Calibration ……2-14
3 - Hardware Setup
Personal Daq, System Components … 3-2
Personal Daq …… 3-2
PDQ Expansion Modules …… 3-2
USB Hubs and Power Adapters …… 3-2
Connecting Your Personal Daq Acquisition
System …… 3-3
Connecting a PDQ Expansion Module to a
Personal Daq …… 3-3
Connecting Various Hardware Setups …… 3-3
4 - Personal DaqView
Overview …… 4-2
Standard, Plus, and XL Version Software
…… 4-2
Main Control Window …… 4-3
Toolbar Buttons …… 4-3
Pull-Down Menus …… 4-3
Channel Configuration Window …… 4-6
Channel Configuration Window Toolbar … 4-6
Channel Configuration Window Pull-down
Menus …… 4-6
Common Spreadsheet Columns …… 4-7
Analog Input Spreadsheet …… 4-10
Frequency/Pulse Input Spreadsheet …… 4-12
Digital Input/Output Spreadsheet …… 4-14
Configure Acquisition Dialog Box …… 4-15
Configure Data Destination & File Converter
Preferences …… 4-18
Sequential Destinations (Auto Rearm) …4-19
Bar Graph, Analog, & Digital Meters …4-20
Meter Toolbars …… 4-20
Meter Pull-Down Menus …… 4-21
Meters Configuration Menu …… 4-21
Configuring a Meter …… 4-22
Bar Graph Meters …… 4-24
Analog Meters …… 4-25
Digital Meters …… 4-26
Chart Display …… 4-27
A Note Regarding Standard, Plus, and XL
Version Software …… 4-27
Groups, Charts, & Channels …… 4-27
Chart Display Window …… 4-27
Pull-Down Menus …… 4-28
Toolbar Items …… 4-29
Chart and Channel Information
Regions …… 4-30
Accessing the Display Configuration Setup Box
…… 4-31
Editing a Chart Display Configuration …..4-32
Manually Configuring a Chart Display …. 4-34
Chart Setup Wizard …… 4-37
Introduction …… 4-37
Automatic Display Setup using the Chart Setup
Wizard …… 4-38
Bypassing Automatic Chart Setup …… 4-39
Personal DaqViewXL, p/n 491-0905
Personal Daq User’s Manual 887695 vii
Page 8

5 – Signal Management
Overview ……5-1
Channel Control and Expansion ……5-3
Signal Acquisition ……5-3
Measurement Duration, Sample Rate, and
Resolution ……5-3
Under Sampling and Aliasing …… 5-3
Triggering ……5-5
Input Isolation ……5-5
Signal Modes ……5-6
System Noise ……5-7
Averaging ……5-7
Analog Filtering ……5-7
Input and Source Impedance ……5-7
Crosstalk ……5-7
6 - Calibration
Introduction ……6-1
Required Equipment ……6-2
Calibration Procedure ……6-2
7 – Troubleshooting & Customer Assistance
Radio Frequency Interference …… 7-1
Electrostatic Discharge (ESD) …… 7-1
Troubleshooting …… 7-2
Customer Assistance …… 7-5
Appendices
A – API Custom Program Models
B – API Commands
N/A, removed from manual.
C –
D – Custom Labels
viii 887695 Personal Daq User’s Manual
Page 9

Unit Startup 1
Overview
Overview ……1-1
Inspect Your System ……1-1
Install Software ……1-2
Install Hardware ……1-2
Mount Personal Daq Modules to DIN Rail
(option) ……1-2
Connect PDQ Module (option) ……1-4
Connect Personal Daq to Host PC …1-5
Connect Channel Signal Inputs ……1-6
Configure System ……1-8
Channel Configuration ……1-9
Acquisition Configuration ……1-9
Data Destination Configuration ……1-10
Collect Data ……1-10
Quick Start for Personal DaqView …… 1-11
Start Personal DaqView ……1-7
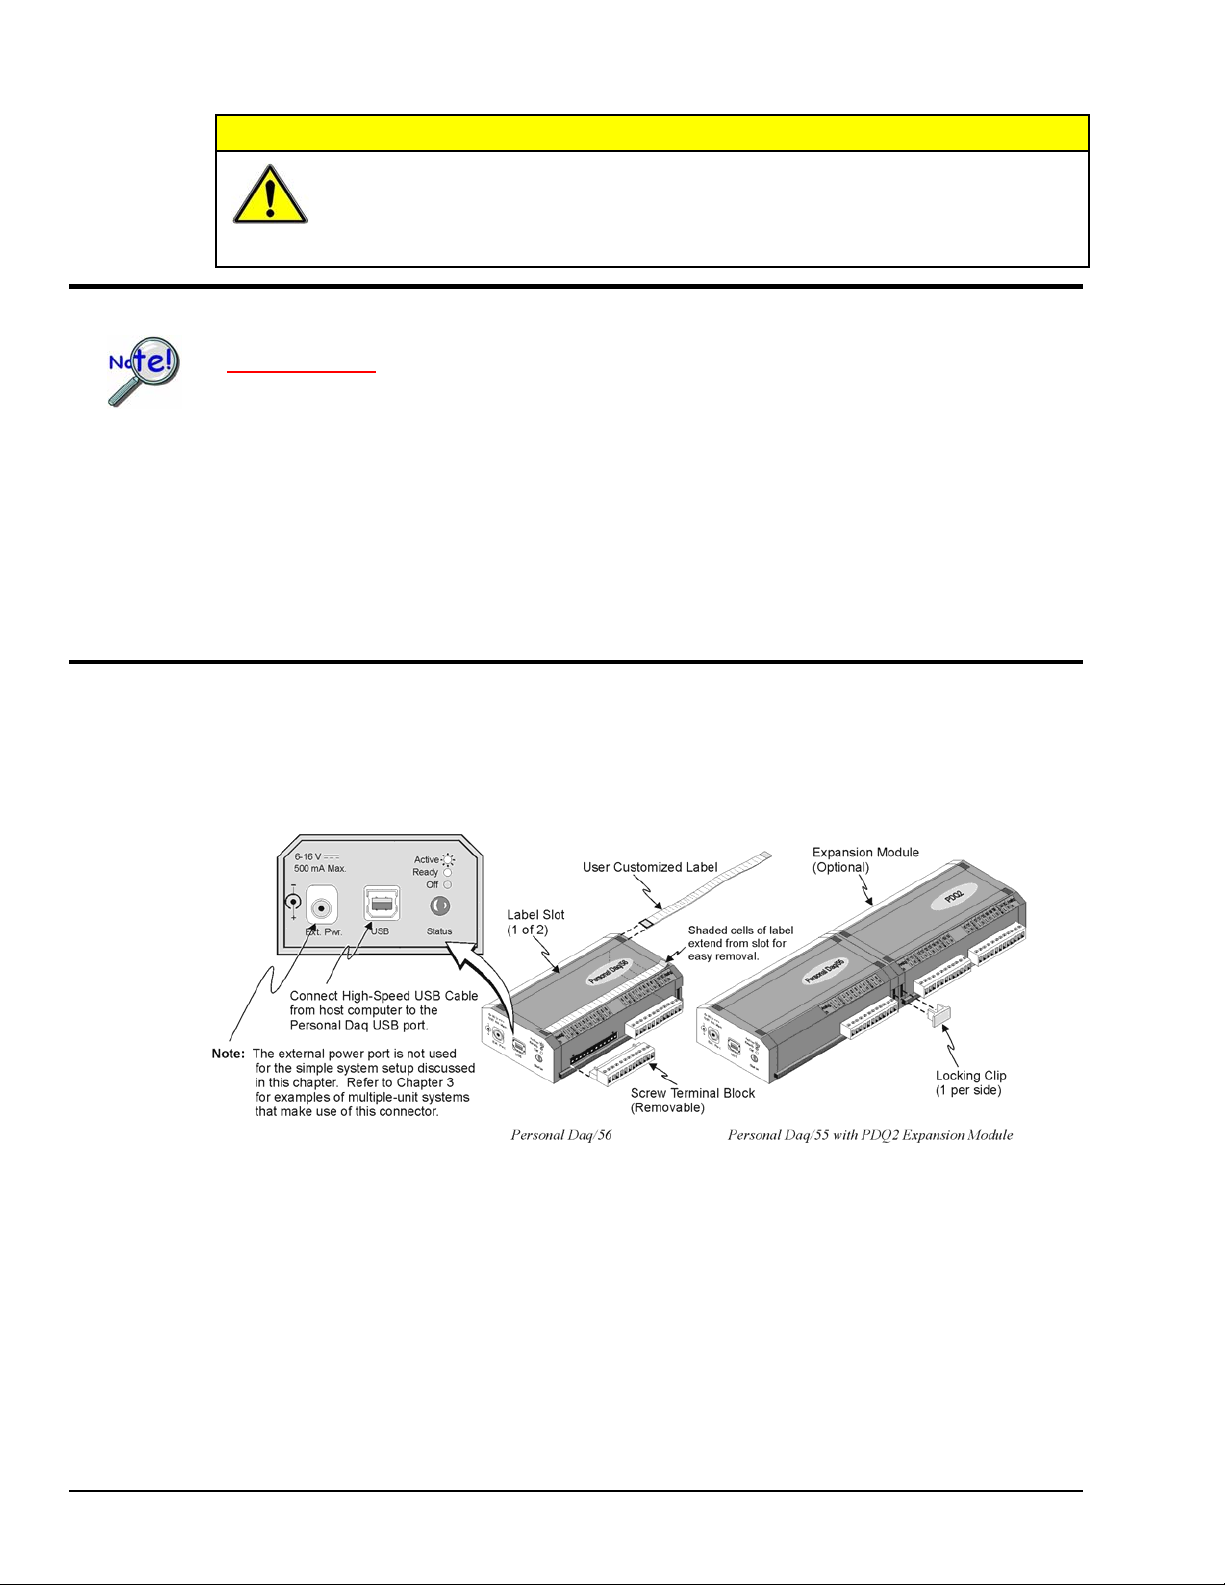
Note: If you used the Personal Daq Quick Start document (491-0940) to startup your unit, you may
choose to skip this chapter.
Note: Chapter 3, Hardware Setup, contains detailed information pertaining to hardware issues.
This chapter provides the steps to connect, power up, and run a simple Personal Daq system consisting of
one Personal Daq Unit and one PDQ module. Chapter 3 discusses setting up more involved Personal Daq
systems.
The basic Startup Steps are:
1. Inspect Your System
2. Install Software
3. Install Hardware
a. Mount Personal Daq Modules to DIN Rail (option)
b. Connect PDQ Module (option)
c. Connect Personal Daq System to your computer
d. Connect Channel Inputs
4. Start Personal DaqView, Configure System, and Collect Data
Inspect Your System
If you have not already done so, check your package contents for damage that may have occurred during
shipment. Immediately report any damage to the shipping agent and your sales representative. Retain all
shipping materials in case the unit must be returned to the factory.
Personal Daq shipments typically contain combinations of the following items, depending on the order.
Your order may include additional items.
Item Description
Personal Daq Personal Daq/54, /55, or /56 USB Data Acquisition System
1022-0601 Universal Installation CD. The CD includes several program install options.
491-0940 Personal Daq Quick Start Sheet
CA-179-x Optional USB Cable, x = meter length., i.e., CA-179-1 (1 meter)
PDQ1 or PDQ2 Optional expansion modules [cannot be used with Personal Daq/54]
PDQ10 Optional PDQ10 DIN-Rail Mounting Kit
Reference Note:
You can refer to our latest catalog for a list of accessories available for Personal Daq.
Personal Daq User’s Manual
Note that the CD includes user manuals.
CA-179-3 (3 meter), or CA-179-5 (5 meter)
878395 1-1
Page 10
CAUTION
When using Personal Daq modules to acquire data, computer energy save modes can
cause false data readings. Prior to using Personal Daq modules, ensure your
computer’s energy save mode is disabled. If needed, consult your PC user’s manual to
disable energy save (power suspension) modes.
Install Software
IMPORTANT: Software must be installed before installing hardware.
1. Remove previous version Daq drivers, if present. You can do this through Microsoft’s Add/Remove
Programs feature.
2. Place the Data Acquisition CD into the CD-ROM drive. Wait for PC to auto-run the CD. This may
take a few moments, depending on your PC. If the CD does not auto-run, use the Desktop’s
Start/Run/Browse feature.
3. After the intro-screen appears, follow the screen prompts.
Upon completing the software installation, continue with step 2, Install Hardware.
Install Hardware
Depending on your order, your Personal Daq unit may not require all the steps under this heading; for
example: if you did not order a PDQ expansion module you would not connect one. If a step does not
apply to your unit, simply go on to the next one.
Note 1: Label slots are included on Personal Daq/55 and /56. The slots are not included on
Note 2: An expansion module (PDQ1 or PDQ2) can be added to Personal Daq/55 and /56 units.
Note 1 Note 2
Personal Daq/54.
Although an expansion module can physically connect to a Personal Daq/54, it will not
function with the unit. Personal Daq/54 does not include expansion functionality. For /54 devices,
the 25-pin port is used only for calibration as discussed in chapter 6.
1-2 Unit Startup
878395 Personal Daq User’s Manual
Page 11

Mount Personal Daq Modules to DIN Rail (Option)
The optional PDQ10 DIN Rail Mounting Kit contains a base (BR-24), two feet (FE-8), and an installation
guide. The information found in the guide has been repeated here for user convenience.
1) Mount Personal Daq Module to Base (BR-24)
Note: If your Personal Daq system makes use of an expansion module you will
need a second DIN-rail kit for mounting the expansion module.
1. Remove terminal blocks from Personal Daq Module.
2. Snap Personal Daq’s mount edges into grooves of base (BR-24).
3. Re-install Personal Daq’s terminal blocks.
Inserting Personal Daq’s Mount Edges into Grooves of Base (BR-24)
2) Attach Feet (FE-8) to Base (BR-24)
1. Slide first foot (FE-8) onto base (BR-24). Note the orientation of the Quick Release (see following
figure).
2. Keeping the same Quick Release orientation, i.e., both “up” or both “down” as per your preference,
slide second foot onto base.
3. Position feet near edge of base. This will provide for best support of unit to DIN rail.
Personal Daq User’s Manual
Attaching Feet (FE-8) to Base (BR-24)
878395 Unit Startup 1-3
Page 12
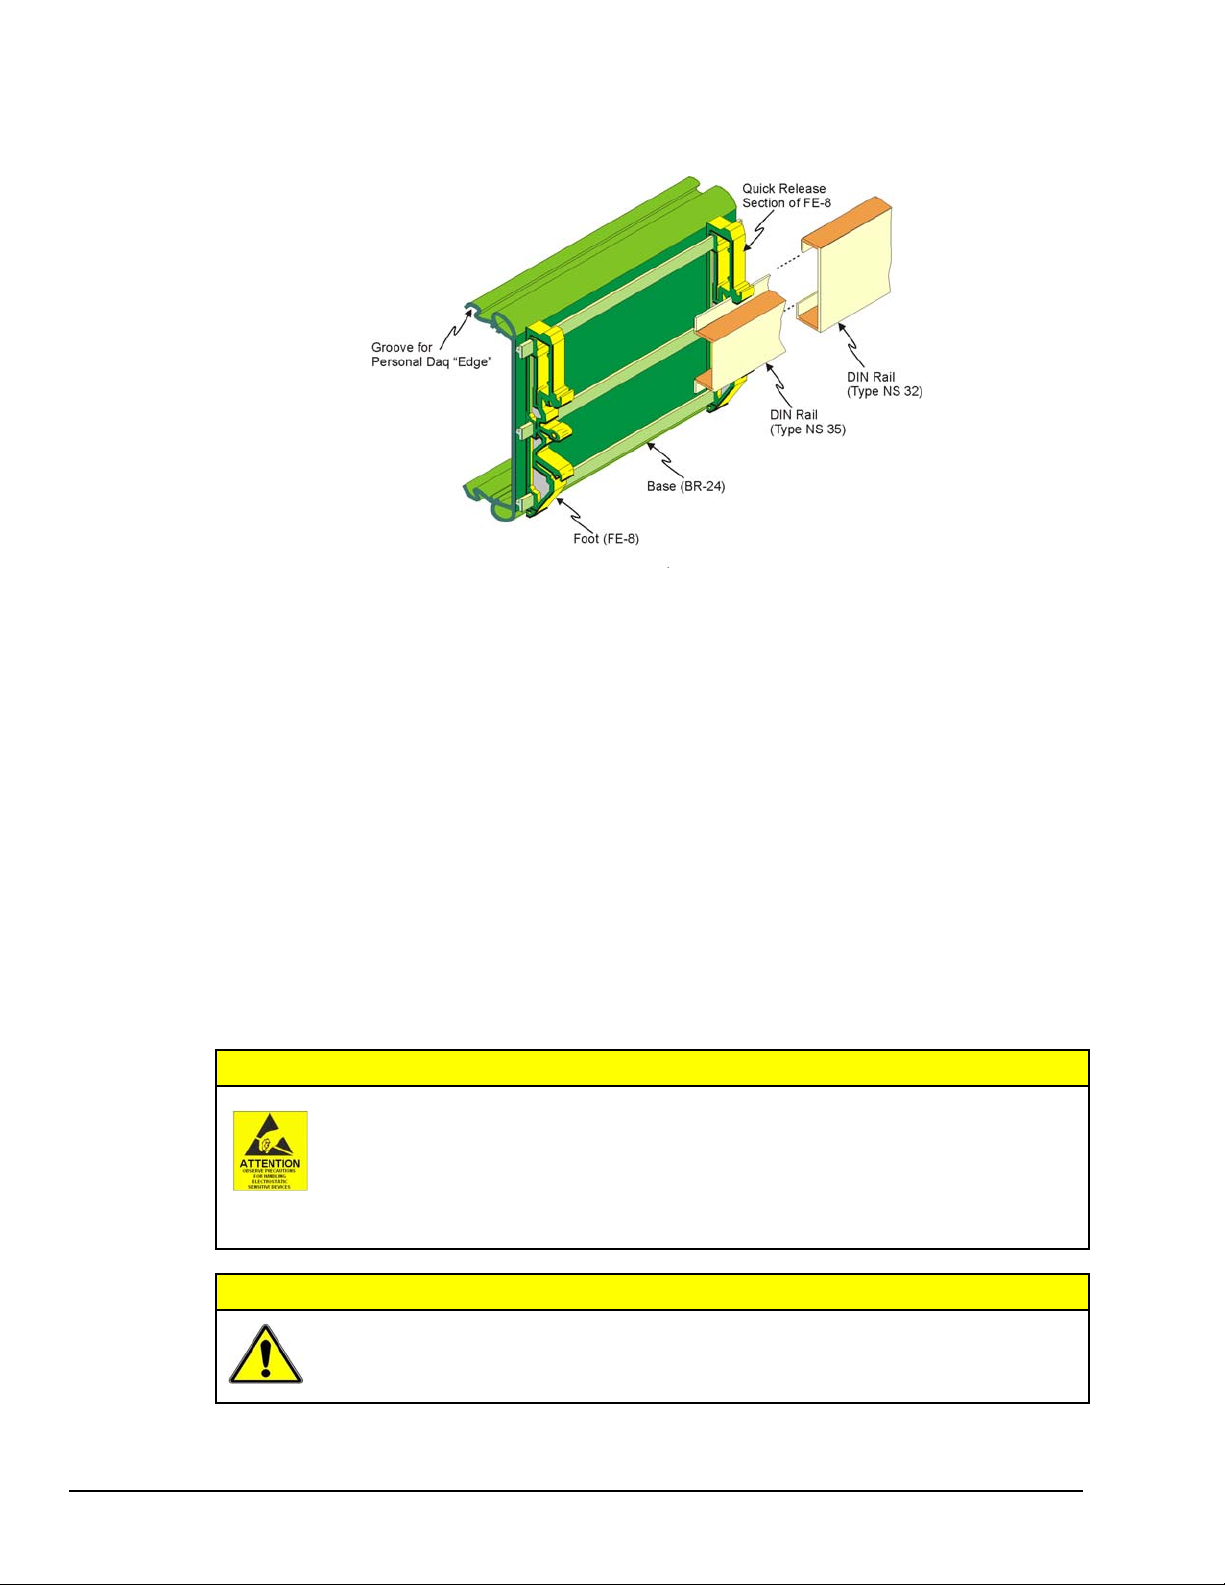
3) Attach Assembly to DIN Rail (Types NS 35, or NS 32)
Installing Base/Foot Assembly to a DIN Rail Mount
The following steps are based on the orientation illustrated above. Note that feet (FE-8) contain rail catches for
both NS 35 and NS 32 type DIN rails. In each case a different set of rail catches is used.
1. Place the applicable lower rail catch of the feet onto the lower lip of the DIN rail.
2. Push the entire base/foot assembly toward the DIN rail. The assembly will snap into position.
Removing Units from a Type NS 35 DIN Rail
1. Push on both Quick Release sections of the FE-8 feet at the same time.
2. Lightly pull the base/foot assembly away from the DIN rail.
Removing Units from a Type NS 32 DIN Rail
1. Push up on the base/foot assembly.
2. Lightly pull the base/foot assembly away from the DIN rail.
Connect PDQ Module (option)
The discharge of static electricity can damage some electronic components.
Semiconductor devices are especially susceptible to ESD damage. You should always
handle components carefully, and you should never touch connector pins or circuit
components unless you are following ESD guidelines in an appropriate ESD controlled
area. Such guidelines include the use of properly grounded mats and wrist straps,
ESD bags and cartons, and related procedures.
CAUTION
1-4 Unit Startup
CAUTION
Never connect an expansion module to (or remove it from) a Personal Daq main unit
while the main unit is connected to a power source. Such action may result in
EEPROM errors and loss of calibration data.
878395 Personal Daq User’s Manual
Page 13
CAUTION
If you are going to install a PDQ expansion module:
1. Ensure that no power cable or USB cable is connected to the main unit
2. Plug the expansion module into the DB25 connector-end of the Personal Daq main unit
3. Lock the modules together with two locking clips (provided). Refer to the previous figure.
Never remove a USB cable from an active Personal Daq device while an acquisition is
in progress. An active device is any device that is currently open and has channels
configured for scanned input. Such disconnection may require you to exit and then
re-launch Personal DaqView, after the USB cable has been connected.
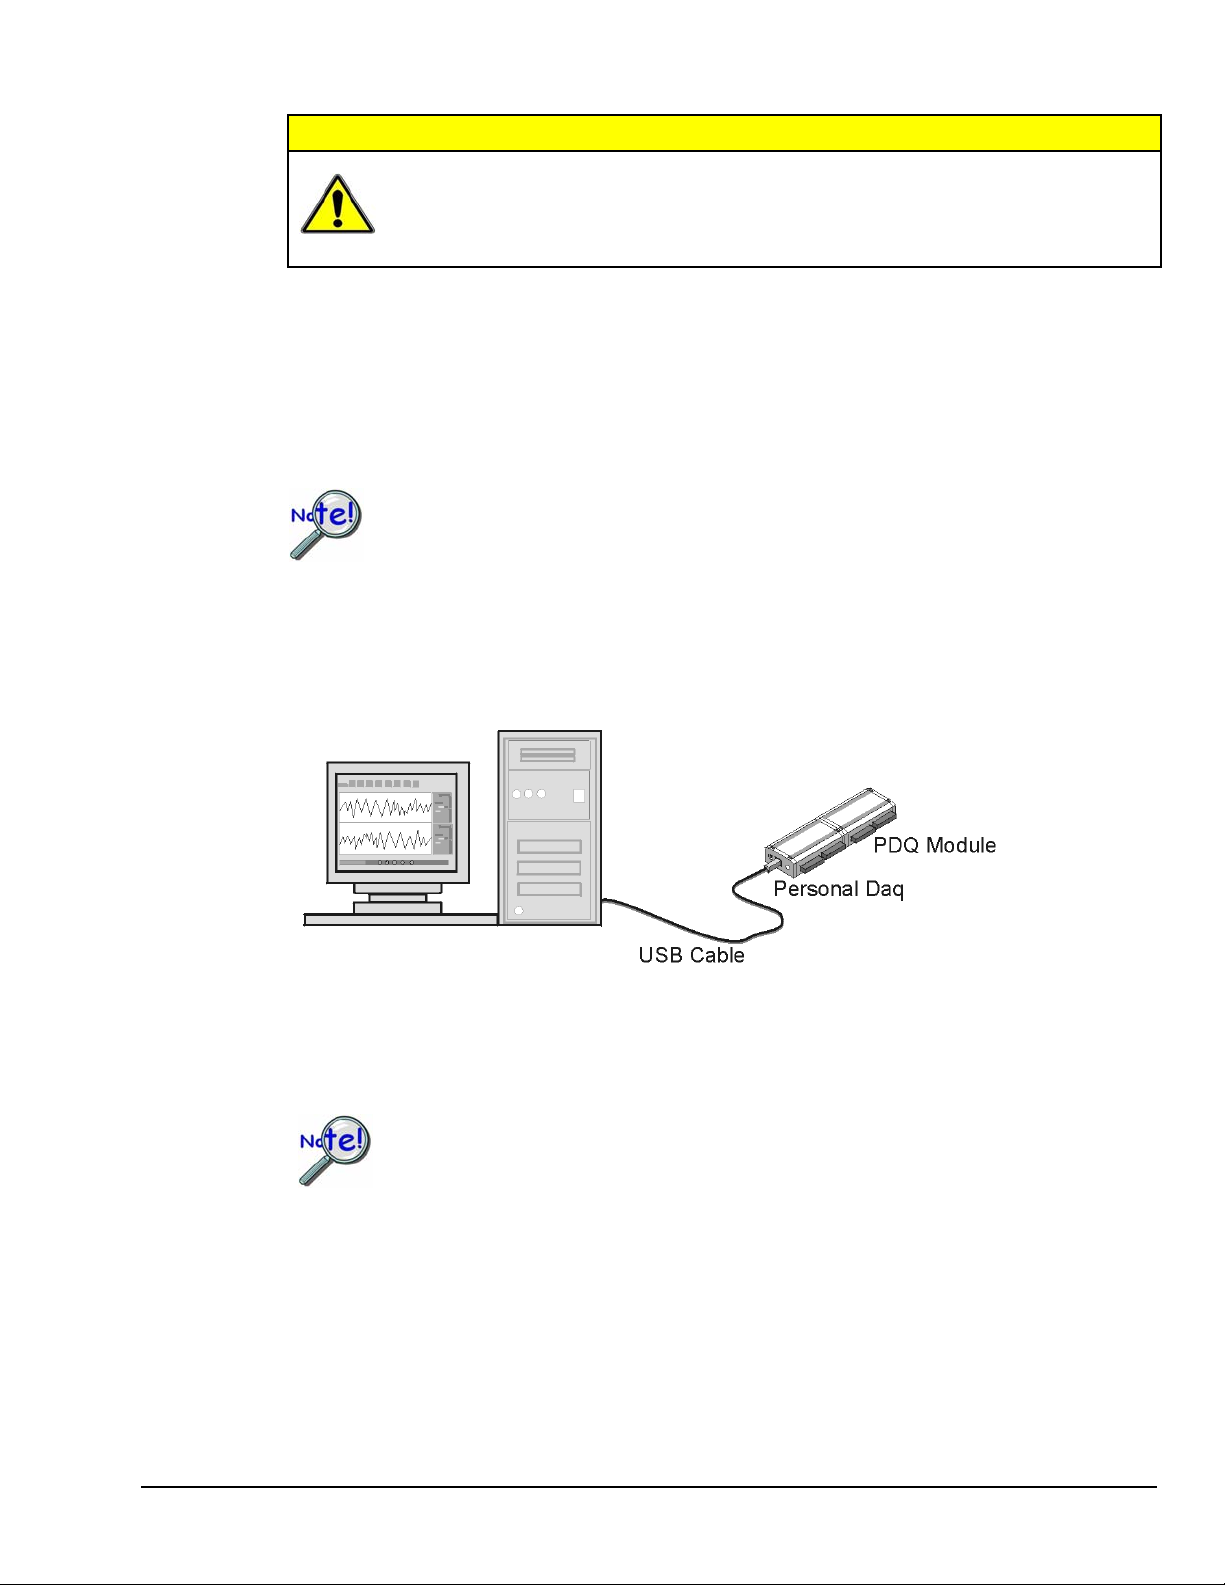
Connect Personal Daq to Host PC
When using a power adapter with your Personal Daq system, be sure to supply power
(from the adapter to the Personal Daq) before connecting the USB cable. This allows
Personal Daq to inform the host computer (upon connection of the USB cable) that the
unit requires minimal power from the computer.
Use an approved high-speed USB cable to connect the Personal Daq system to one of the host computer’s
USB ports. There is no need for an additional power source in this setup since the power pins (of the PC’s
USB connection) supply 500 mA at 4 to 5.25 V. Additional setup examples are described in Chapter 3,
some of which involve USB hubs and/or power adapters.
Personal Daq User’s Manual
Connection of a Simple Personal Daq System to a Computer USB Port
Certain notebook computers require the use of a power adapter with your Personal Daq.
878395 Unit Startup 1-5
Page 14
Connect Channel Signal Inputs
CAUTION
The discharge of static electricity can damage some electronic components.
Semiconductor devices are especially susceptible to ESD damage. You should
always handle components carefully, and you should never touch connector pins
or circuit components unless you are following ESD guidelines in an appropriate
ESD controlled area. Such guidelines include the use of properly grounded mats
and wrist straps, ESD bags and cartons, and related procedures.
Use Personal Daq’s screw terminals to connect channel inputs to your Personal Daq system. Note that the
terminal blocks are detachable for ease in making connections. The main module (Personal Daq/54,
Personal Daq/55, and Personal Daq/56) and optional PDQ expansion modules (PDQ1 and PDQ2) have
labels which clearly identify each input type and channel number. Each Analog Input channel can be
configured for single-ended or differential volts, or for differential thermocouple inputs. The non-analog
channels are designated as Frequency/Pulse Input (F) and Digital I/O (D).
Note: Personal Daq/54 does not accept frequency/pulse input or digital I/O.
Note: Personal Daq/54 does not support expansion modules.
Reference Note:
Connections for single-ended and differential modes are depicted in the figure on page 1-8.
Reference Note:
Specifications are provided in Chapter 2.
1-6 Unit Startup
878395 Personal Daq User’s Manual
Page 15
Connecting Thermocouple Wires
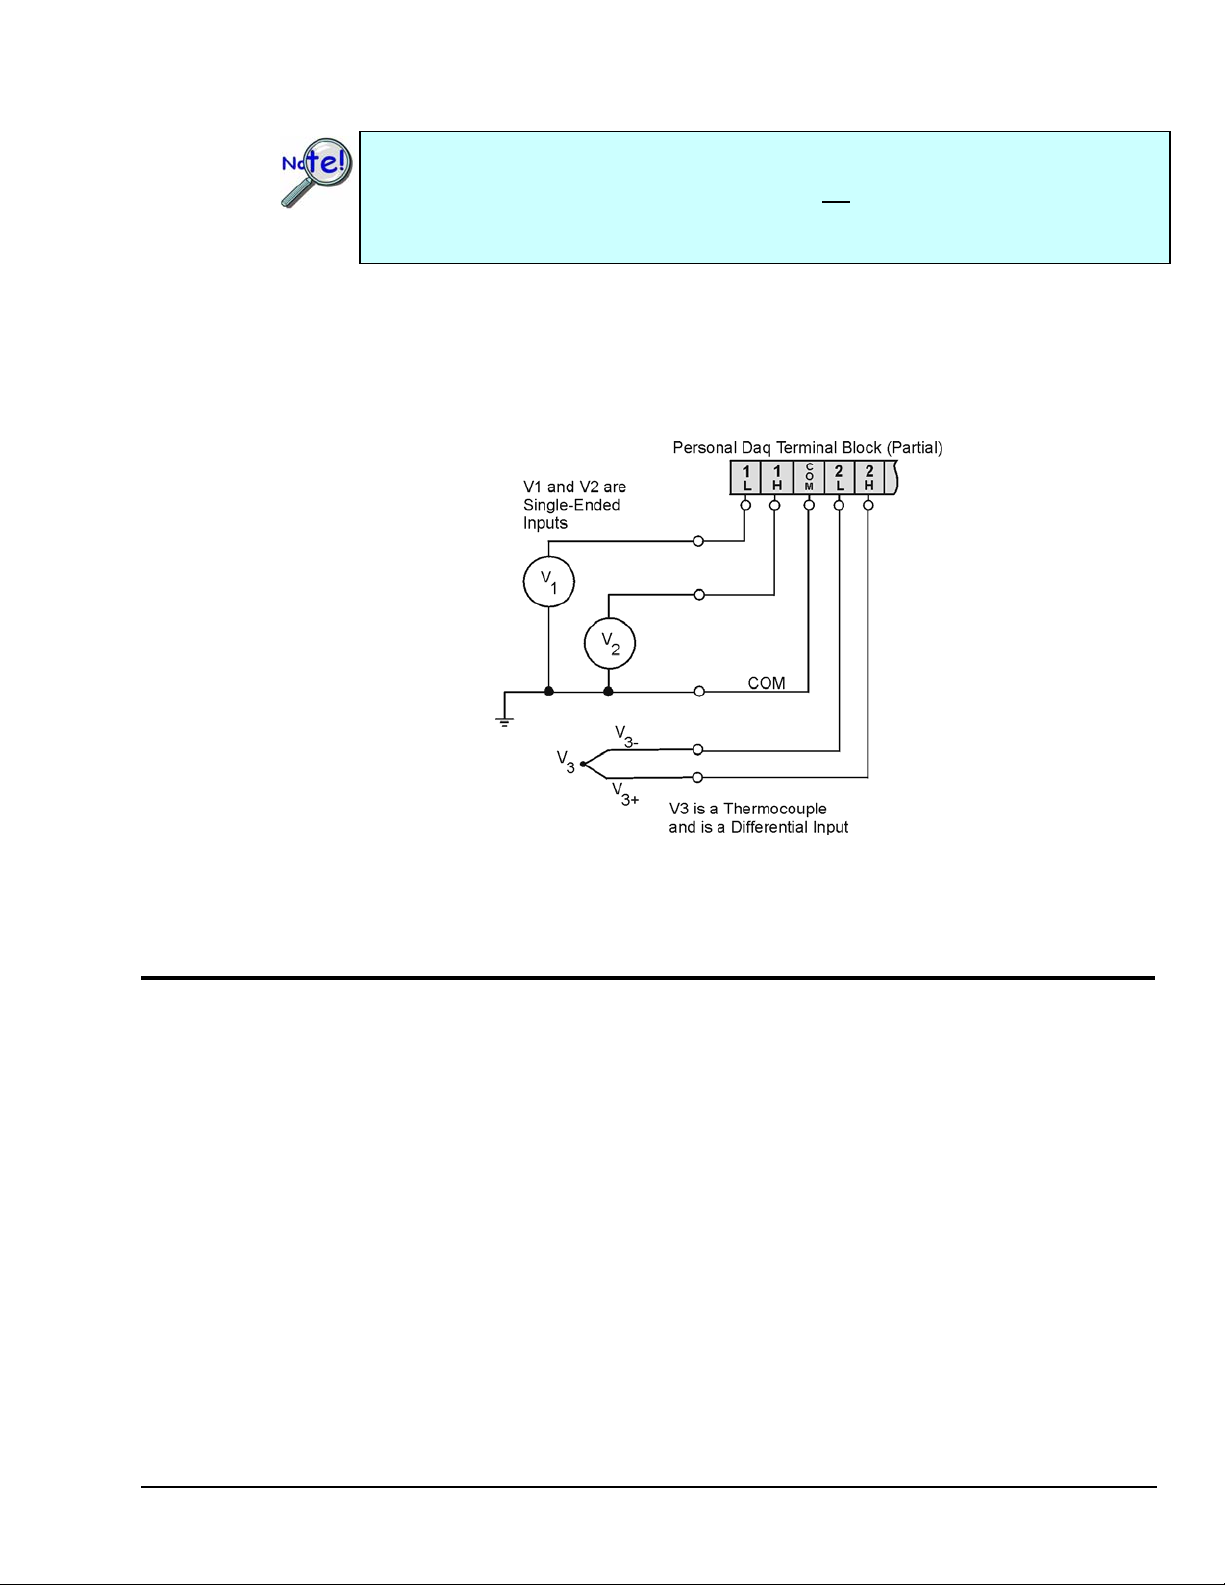
Thermocouple wires are to be connected in differential mode only.
In Personal Daq applications, thermocouples should not be connected single-ended. Doing
so can result in noise and false readings. This is especially true when acquiring other highamplitude signals in conjunction with thermocouple signals that are connected single-ended.
Differential connection is made as follows:
(a) the red wire connects to the channel’s Low (L) connector.
(b) the second [color-coded] wire connects to the channel’s High (H) connector.
The section entitled Signal Modes, in chapter 5, contains additional information.
Single-Ended and Differential Connections to Analog Input Channels
Start Personal DaqView
From Windows, open Personal DaqView by double clicking on the Personal DaqView icon, or by using
the Windows Desktop Start Icon to access the Personal DaqView program. You will find Personal
DaqView listed in the desktop’s Program group.
By default, the Personal Daq files will install in C:/Program/Applications. However, you may have
chosen a different install setup when prompted during the installation process.
Once the program is executed, the software identifies your Personal Daq device and brings up the Main
Control Window. This window is discussed briefly in the following text, and in more detail in Chapter 4.
Personal Daq User’s Manual
878395 Unit Startup 1-7
Page 16
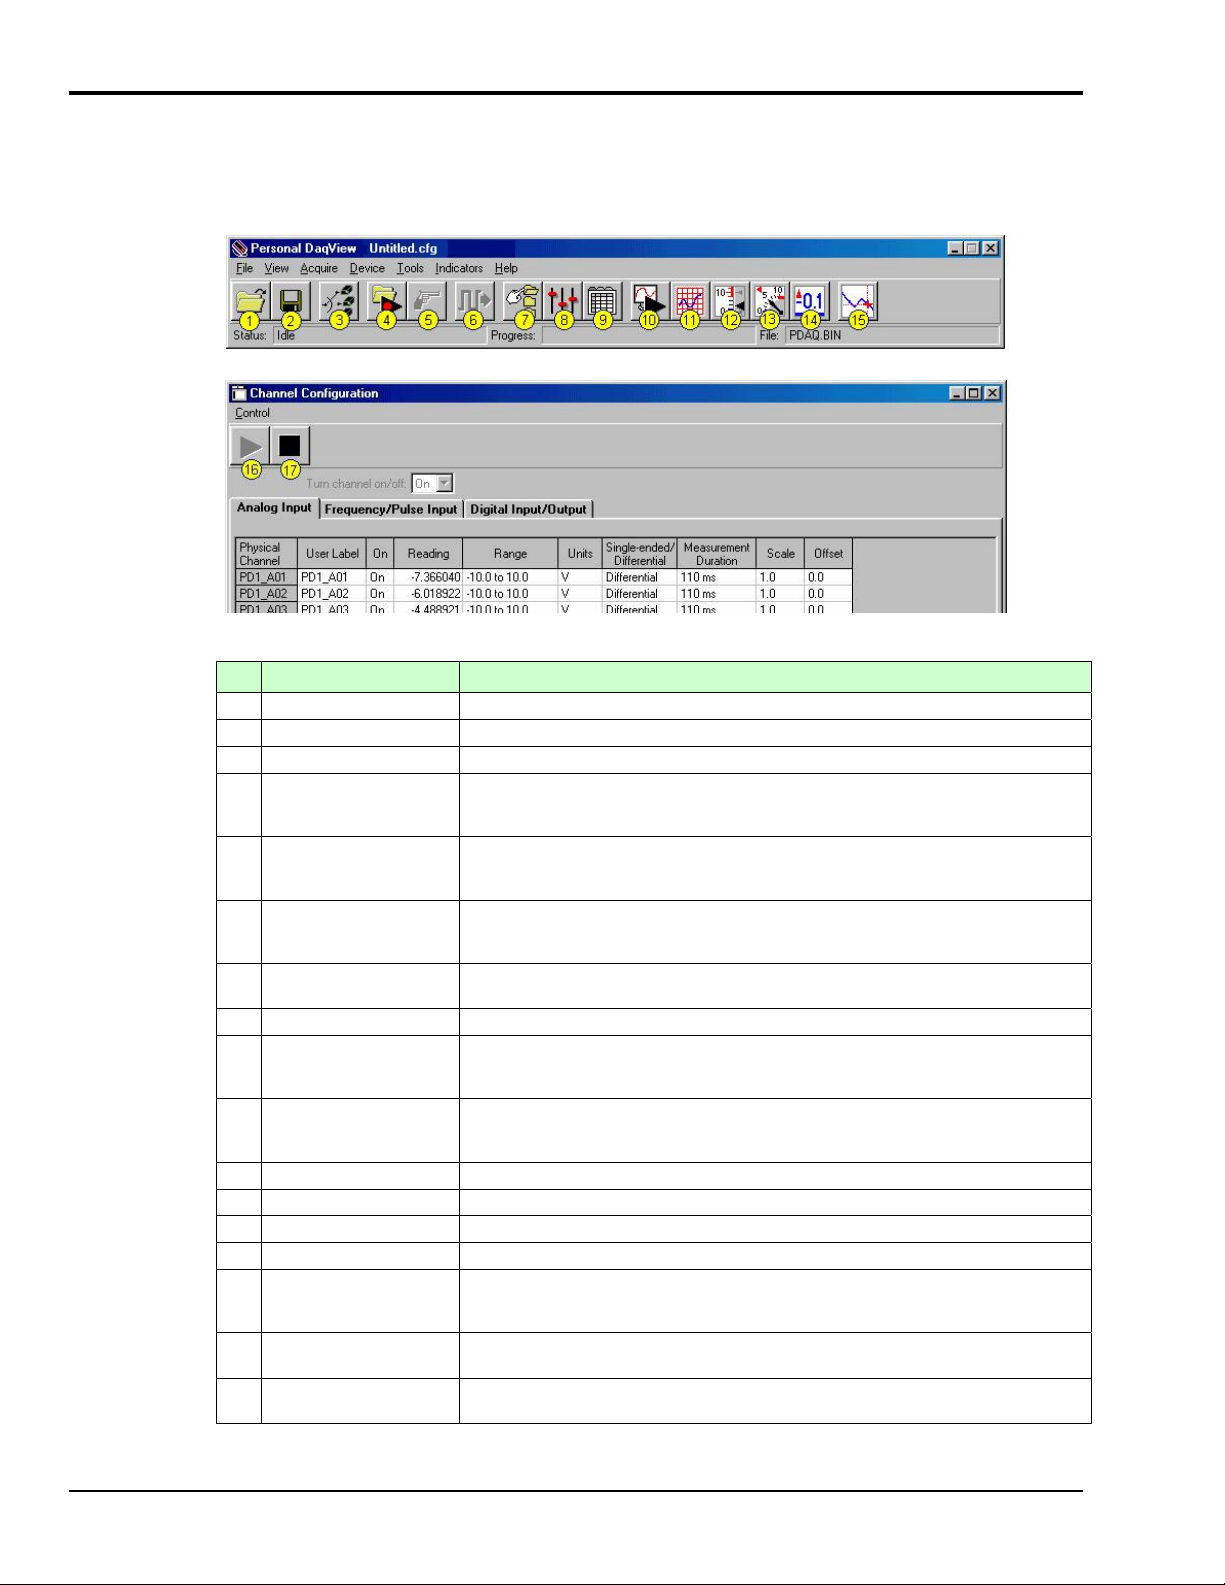
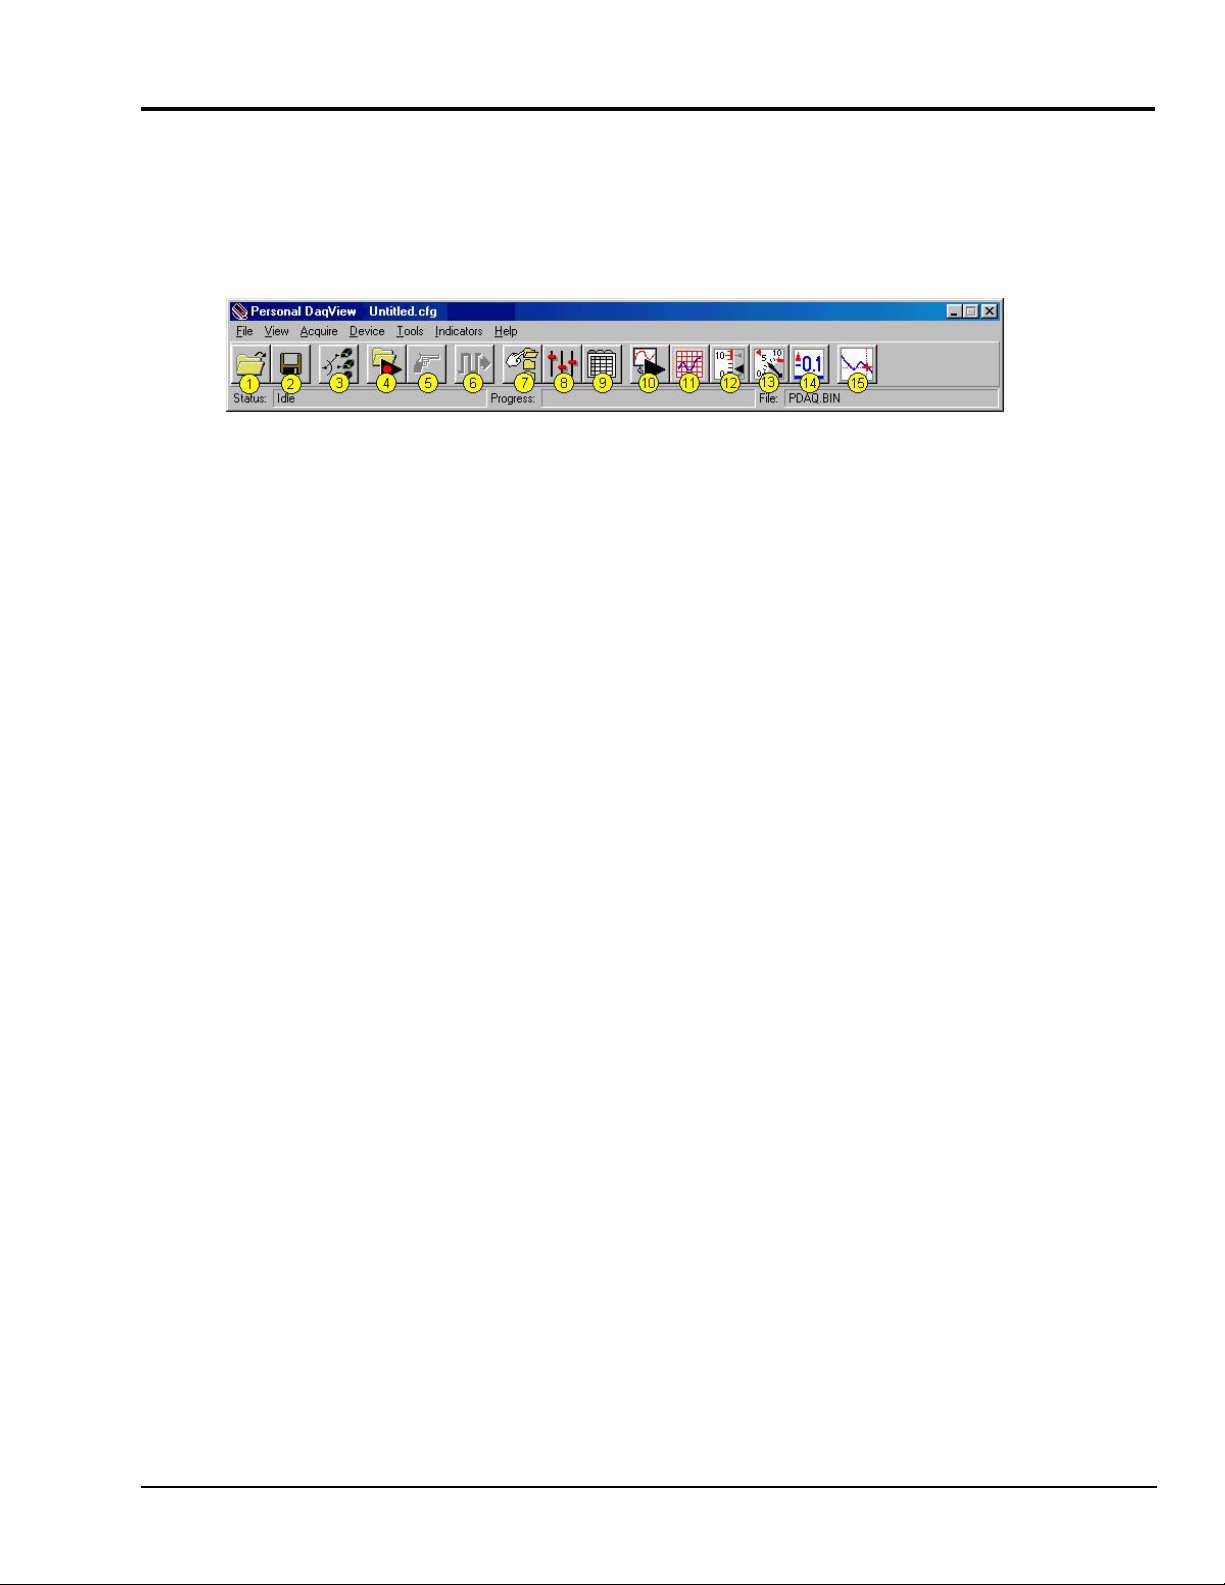
Configure System
This step pertains to configuration of channels and acquisition parameters through Personal DaqView
software. To configure a set of parameters, use the appropriate toolbar button (or the View pull-down
menu) to open the applicable window. Clicking on the Configure Channel Settings button (9) brings up
the Channel Configuration Window.
Main Control Window
Channel Configuration Window, with Analog Input Spreadsheet Selected
Button Function
1 Open Configuration File Opens a selected configuration file.
2 Save Configuration File Saves the current configuration file to disk.
3 Select Active Device Provides a means of selecting active devices from the Personal Daq system.
4 Arm Trigger for Disk
Recording
5 Manual Trigger Used to trigger the device when the mode of trigger is set to “Manual.” Note that the
6 Update Digital Outputs Updates digital outputs for all digital channels that are selected to “output state.” also
7 Configure Data
Destination
8 Configure Acquisition Accesses the Configure Acquisition window.
9 Configure Channel
Settings
10 Update All Indicators Starts all on-screen indicators with a display of up-to-date data. Has no affect on the
11 Display Scrolling Charts Displays data graphically in a scrolling chart.
12 Display Bar Meters Displays data in a bar graph format.
13 Display Analog Meters Displays data displayed in a dial-gage format.
14 Display Digital Meters Displays data in a digital meter format.
15 View Data Launches an independent post-data acquisition program such as eZ-PostView.
16 Enable Readings
Column
17 Disable Readings
Column
Arms the trigger and stores acquisition data to a designated disk file. If Auto Rearm is
selected, clicking this button puts Auto rearm in effect. This button, is also used to
disarm the data acquisition.
Manual Trigger button can not be clicked until after the trigger is armed, for example,
by first clickng button 4.
see Digital Input/Output Spreadsheet, in Chapter 4).
Does not apply to Personal Daq/54.
Accesses the Configure Data Destination window. Note that this window provides a
means of selecting sequential destinations through an auto rearm feature.
Brings up the Channel Configuration window. From this window you can configure
channels for Analog Input, Frequency/Pulse Input, and Digital Input/Output channels,
depending on which tab is selected.
recording of data to disk. Auto Rearm, even if selected, will not occur when using this
control. This button is also used to pause all indicators.
Refer to the Post Acquisition Analysis PDF (included on your CD) for detailed
information.
Activates the Channel Configuration Window’s reading column. Does not affect the
recording of data to disk.
Stops the Channel Configuration Window’s reading column. Does not affect the
recording of data to disk.
1-8 Unit Startup
878395 Personal Daq User’s Manual
Page 17
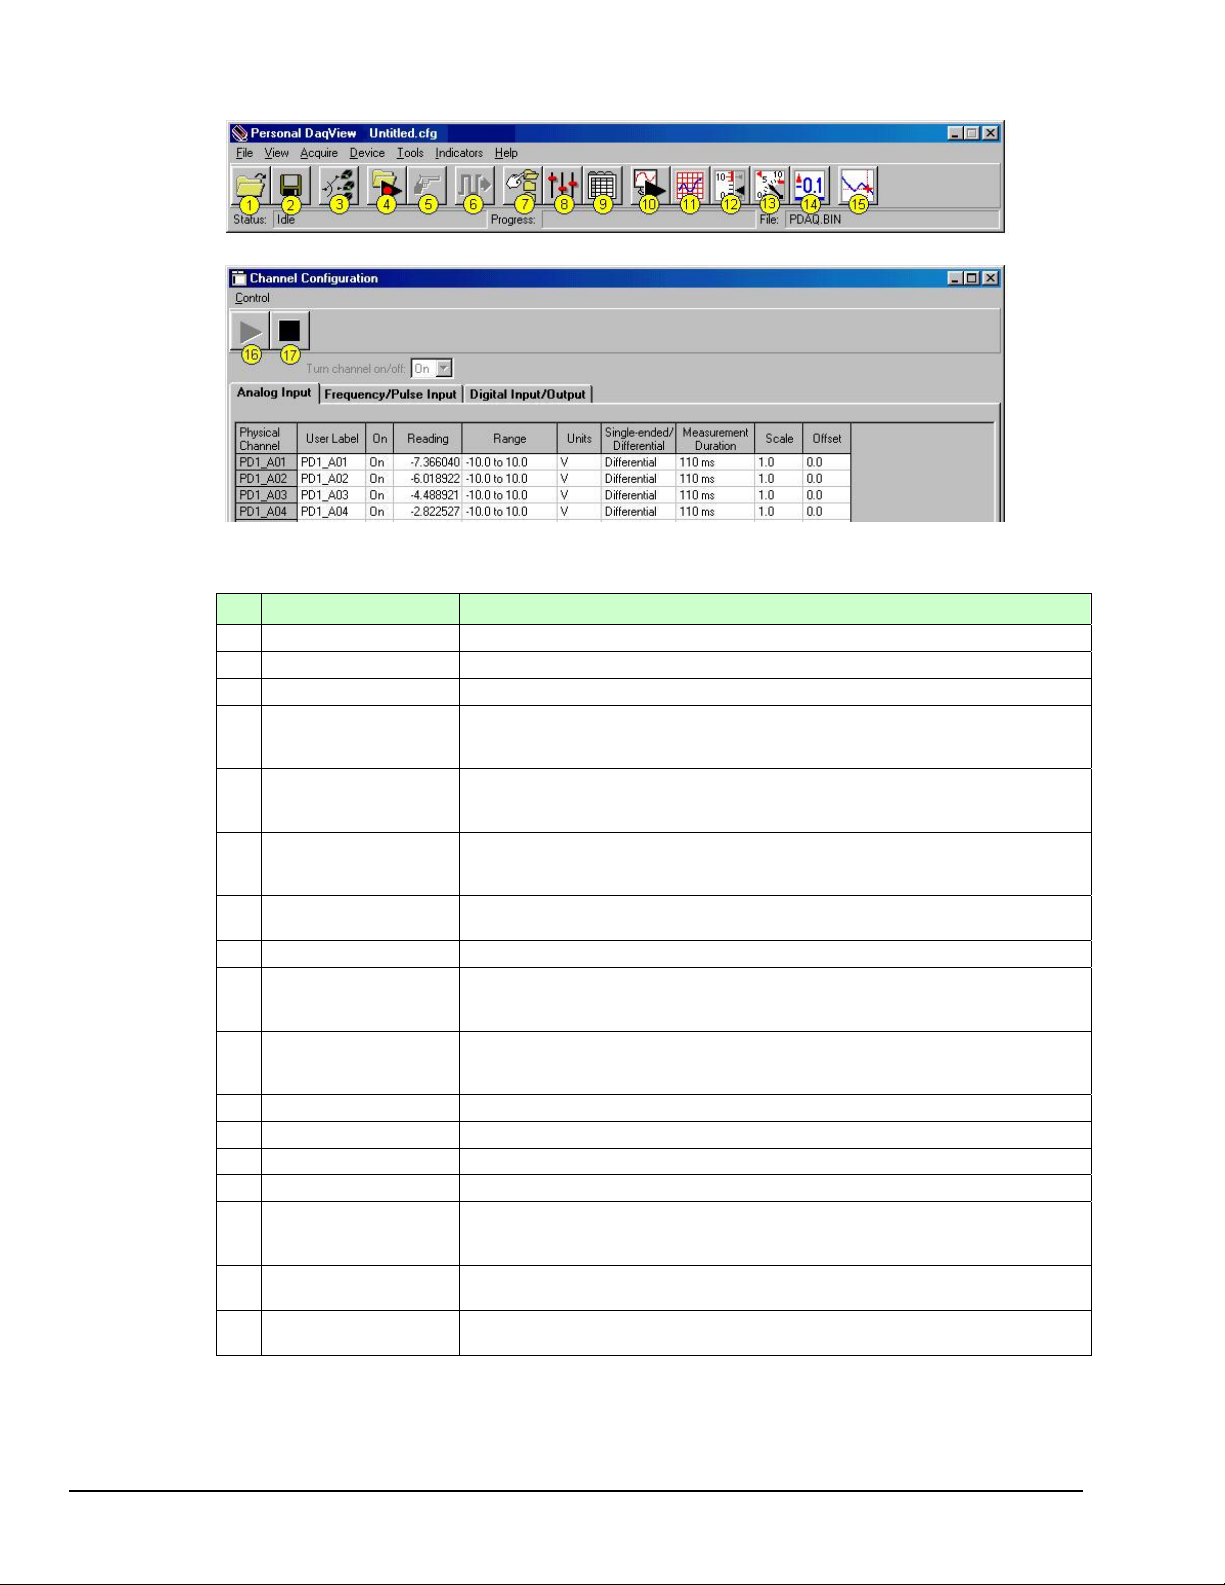
Channel Configuration
The Channel Configuration Window first opens with the Analog Input screen selected. You can change
from one configuration screen to another by selecting the appropriate tab. More information regarding
Personal DaqView appears in Chapter 4 of this manual. You can configure channels from the three
configuration screens as indicated in the following table.
Channel Type User Configurable Parameters
Analog Input
Frequency/Pulse Input
Digital Input/Output
Note: With the mouse cursor positioned in the desired spreadsheet cell, you can:
“Single-click” with the left mouse button to open an associated pull-down list for the applicable cell, from which a
selection can be made. This pull-down list appears just below the toolbar.
“Double-click” with the left mouse button to cycle through listed selections or write-enable a cell, as applicable. If
the cell has a given parameter list (such as those in the On, Range, and Measurement Duration columns) the
parameter will change with each double-click, allowing you to cycle through all possible selections. Note that
these selections are repetitive; in other words, you will eventually advance to the same selection you started
with. “Type-in” cells (such as User Label, Scale, and Offset) can be selected on double-click for easy editing.
“Single-click” left, then “single-click” right to write-enable a cell. Completing this action with the mouse buttons
(while having the cursor on a cell such as Scale or Offset) allows you to use you PC’s keypad to type the
desired value into the field.
“Single-click” left, “single-click” right, then “single-click” left again to open an associated pull-down list for the
applicable cell, from which a selection can be made. This pull-down list appears in the selected cell’s row.
User Label, On, Range, Units, Single-Ended/Differential, Measurement Duration, Scale,
Offset
User Label, On, Type, Units, Edge, Debounce, Min. Value, Max. Value, Resolution
(Settling Time), Scale, Offset. Frequency/Pulse Input does not apply to Personal Daq/54.
User Label, On, Input/Output, Output State, Power-Up State.
Digital I/O does not apply to Personal Daq/54.
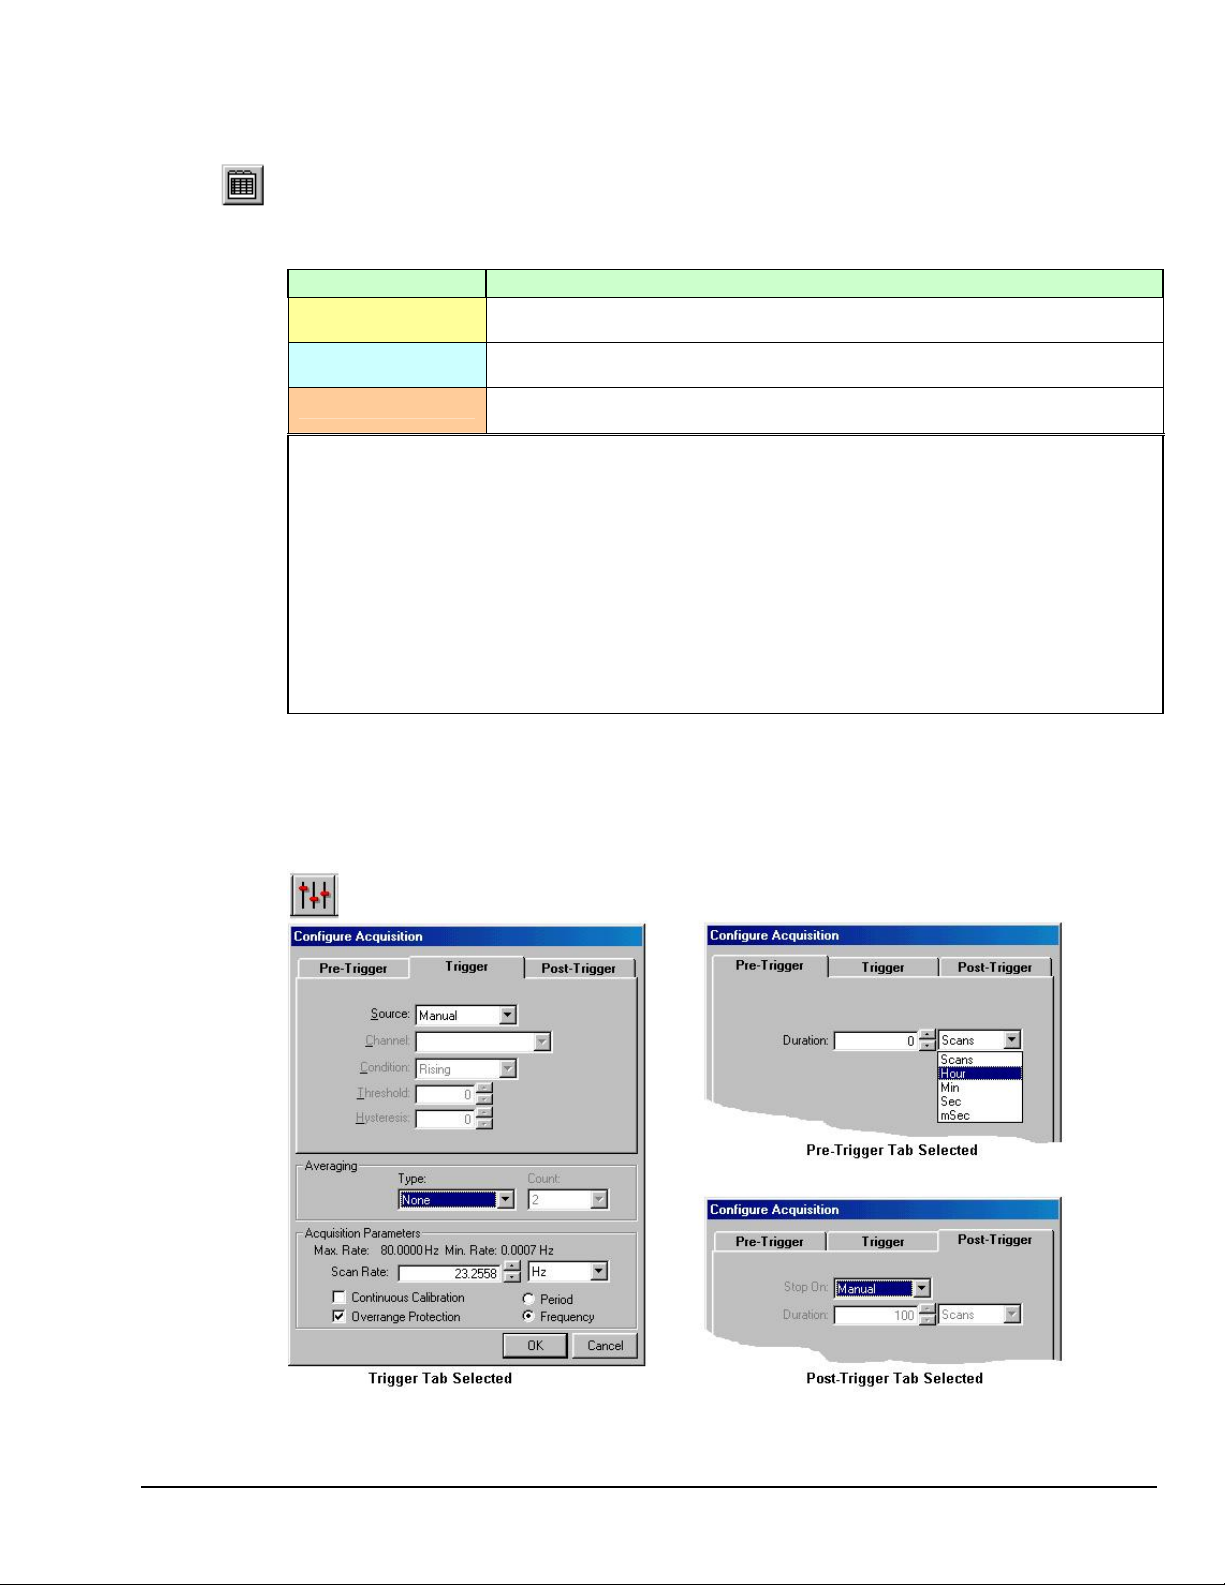
Acquisition Configuration
To configure acquisition parameters, activate the Configure Acquisition Window by using toolbar
button (8).
Personal Daq User’s Manual
Configure Acquisition Window
878395 Unit Startup 1-9
Page 18
The Configure Acquisition Window has the following default settings.
Pre-Trigger: No duration set, i.e., a duration of 0 scans
Trigger: Immediate
Post Trigger: Manual stop
Averaging: None
Acquisition Parameters:
Set for Maximum scan rate
Frequency: selected
Period: not-selected
Continuous Calibration: not-selected
Overrange Protection: selected
You can change the acquisition setup as desired. Explanations of setup options are discussed in Chapter 4.
Functions that can be obtained with Main Control Window toolbar buttons can also be obtained through
pull-down menus (discussed subsequently). See Chapter 4 for details.
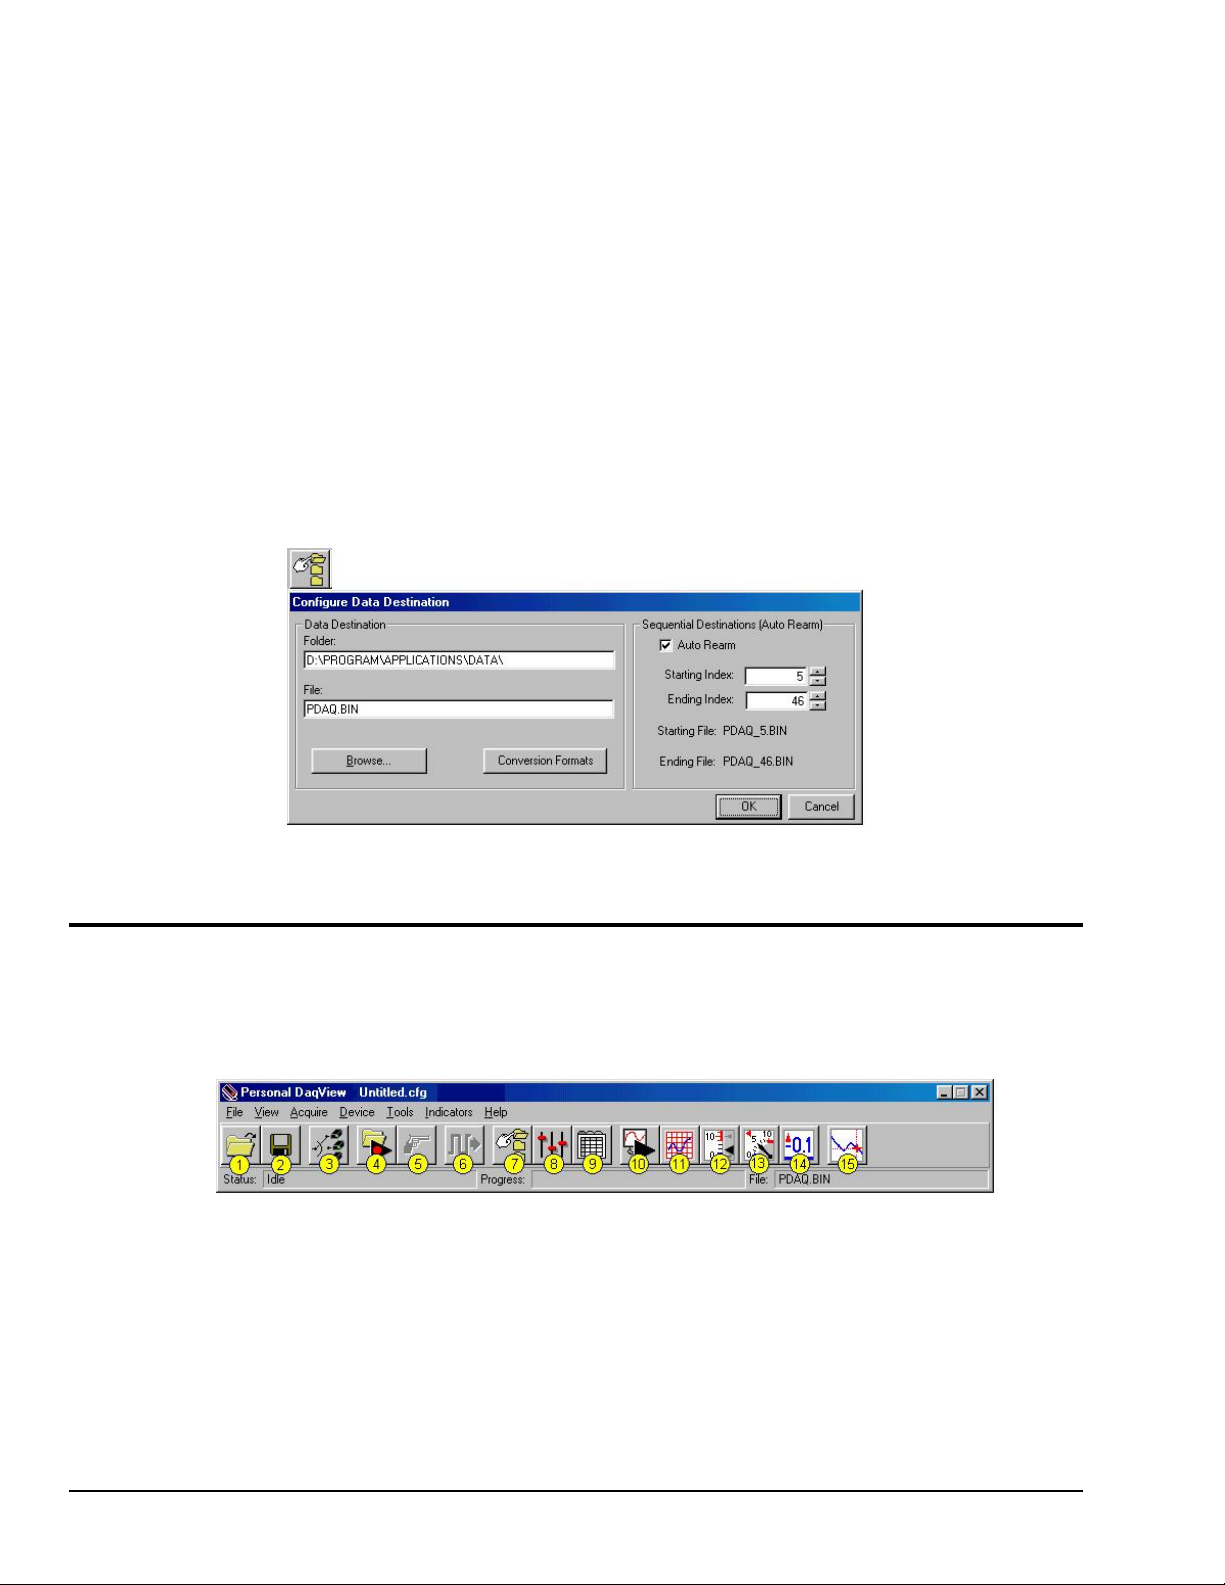
Data Destination Configuration
The Data Destination window can be accessed by using button (7). From the Data Destination window
you can assign a filename and folder location for the acquisition data. More detailed information is
provided in Chapter 4.
Collect Data
Click the Enable Readings Column button (16) [see page 1-8], or the Update All Indicators button (10)
[see following figure] to start the acquisition. The data acquisition begins and the readings column
becomes active. However, data is not recorded to disk. Clicking the Arm Trigger for Disk Recording
button (4) will send the data to disk.
Click one of the toolbar’s display icon buttons (11, 12, 13, or 14) to see your data in the form of a chart or
meter. Display options are as follows: (11) is scrolling charts, (12) is bar graph meters, (13) is analog
meters, and (14) is digital meters. Note that you can view all display types, or a combination of them, at
the same time.
Note 1: For scrolling charts, a Chart Setup Wizard is used to set up the desired chart display. Channels
Note 2: Chapter 4 is dev oted entirely to the Personal DaqView program and its Chart Setup Wizard
Data Destination Window
not set up in the display can still be enabled and read on the channel configuration window.
feature.
1-10 Unit Startup
878395 Personal Daq User’s Manual
Page 19
Quick Start for Personal DaqView
Once your Personal Daq system has been properly connected to the PC and to the desired input signals, the
following steps may be used to start Personal DaqView and begin collecting data. For this “Quick Start” approach
to collecting data we will be making use of the program’s default settings.
Note that acquisition settings can be changed from the Configure Acquisition Window. This window is accessed via
button (8). Refer to the following figure for location.
When you first open Personal DaqView the Main Control and Channel Configuration Windows appear. These are
portrayed on the following page. The Channel Configuration Window appears with the Analog Input spreadsheet
opened, and with channel PD1_A01 turned “On.” Tabs on the window (see following figure) allow for a quick
transition from one spreadsheet to another.
1. From Windows, open Personal DaqView by double-clicking on the Personal DaqView icon, or by using the
Windows Desktop Start Icon to access the Personal DaqView program.
Once the program is executed, the software identifies your Personal Daq device and brings up the Main Control
Window and Channel Configuration Window (with the Analog Input Spreadsheet Selected).
Note: If the Channel Configuration Window is not visible, click button (9).
2. Select the tab for the desired spreadsheet. Analog Input is the default. Note that the Frequency/Pulse Input
and Digital Input/Output tabs do not apply to Personal Daq/54.
3. Ensure the desired channels are enabled. Double-click in a channel’s On/Off cell to enable or disable a
channel, as applicable.
4. If you want to record data to disk, click on button (4) Arm Trigger for Disk Recording. The data acquisition
begins and data is stored to a disk file as indicated in the Data Destination Window. Note that the default
destination, including the default file name of
C:\PROGRAM FILES\PDAQVIEW\PDAQ.BIN. You can, of course, specify a different location.
PDAQ.BIN, is as follows:
5. To see real time readings on the Channel Configuration Window, click on button (10) Update All Indicators
or button (16) Enable Readings Column. The location of button (16) is indicated on page 1-8.
6. If you want to read data, but not record to disk, click on button (10) or (16), but not button (4). In addition to
the Channel Configuration Windows reading column, you can click on one or more display icon buttons (11,
12, 13, or 14) to see your data in the form of a chart or meter. You can view all display types, or a combination
of them, at the same time.
Display options, listed as button number followed by display type, are:
o (11) scrolling charts
o (12) bar graph meters
o (13) analog meters
o (14) digital meters
Personal Daq User’s Manual
878395 Unit Startup 1-11
Page 20
Main Control Window
Channel Configuration Window, with Analog Input Spreadsheet Selected
Button Function
1 Open Configuration File Opens a selected configuration file.
2 Save Configuration File Saves the current configuration file to disk.
3 Select Active Device Provides a means of selecting active devices from the Personal Daq system.
4 Arm Trigger for Disk
Recording
5 Manual Trigger Used to trigger the device when the mode of trigger is set to “Manual.” Note that the
6 Update Digital Outputs Updates digital outputs for all digital channels that are selected to “output state.” also
7 Configure Data
Destination
8 Configure Acquisition Accesses the Configure Acquisition window.
9 Configure Channel
Settings
10 Update All Indicators Starts all on-screen indicators with a display of up-to-date data. Has no affect on the
11 Display Scrolling Charts Displays data graphically in a scrolling chart.
12 Display Bar Meters Displays data in a bar graph format.
13 Display Analog Meters Displays data displayed in a dial-gage format.
14 Display Digital Meters Displays data in a digital meter format.
15 View Data Launches an independent post-data acquisition program, such as eZ-PostView.
16 Enable Readings
Column
17 Disable Readings
Column
Arms the trigger and stores acquisition data to a designated disk file. If Auto Rearm is
selected, clicking this button puts Auto rearm in effect. This button, is also used to
disarm the data acquisition.
Manual Trigger button can not be clicked until after the trigger is armed, for example,
by first clicking button 4.
see Digital Input/Output Spreadsheet, in Chapter 4). Digital I/O does not apply to
Personal Daq/54.
Accesses the Configure Data Destination window. Note that this window provides a
means of selecting sequential destinations through an auto rearm feature.
Brings up the Channel Configuration window. From this window you can configure
channels for Analog Input, Frequency/Pulse Input, and Digital Input/Output channels,
depending on which tab is selected.
recording of data to disk. Auto Rearm, even if selected, will not occur when using this
control. This button is also used to pause all indicators.
Refer to the PostAcquisition Analysis PDF (included on your CD) for detailed
information.
Activates the Channel Configuration Window’s reading column. Does not affect the
recording of data to disk.
Stops the Channel Configuration Window’s reading column. Does not affect the
recording of data to disk.
1-12 Unit Startup
If needed, refer to Chapter 4, Personal DaqView, for more detailed information.
878395 Personal Daq User’s Manual
Page 21
V
V
V
General Information & Specifications 2
General Description ……2-1
Channel Capacities ……2-1
Features ……2-2
Theory of Operation ……2-3
Universal Serial Bus (USB) ……2-3
Power Line Rejection ……2-3
Optical Isolation …… 2-4
A/D Conversion ……2-4
Input Ranges ……2-4
Analog Input Configuration ……2-5
Measurement Duration, Sample Rate, and
Resolution ……2-5
Automatic Calibration …… 2-7
Thermocouple Measurements ……2-7
Frequency Measurements ……2-8
Digital I/O ……2-8
General Description
Personal Daqs are compact data acquisition devices that make use of the Universal Serial Bus (USB).
They can be located up to 5 meters (16.4 feet) from the host PC, allowing the unit to reside close to the
point of measurement. This reduces noise and improves reading accuracy. USB provides both high-speed
communication and power to the Personal Daq, allowing for a single cable connection to the PC. No
additional power supplies are required, except in special setups of multiple units, or when connected to
certain notebook PCs.
Note: Advanced setups, using several Personal Daq units, are possible. These setups require USB hubs
(self-powered or USB-powered). In addition, depending on the setup, certain Personal Daqs in the
system may require connection to a power adapter as indicated in Chapter 3, Hardware Setup.
Personal Daq Specifications ……2-9
Analog Specifications ……2-10
Input Voltage Ranges ……2-10
Voltage Specifications ……2-10
Temperature Specifications …2-11
Thermocouple Accuracy ……2-11
Frequency Specifications ……2-12
Digital I/O Specifications……2-12
General Specifications ……2-12
Optional Accessories …… 2-12
Channel Connection Layouts ……2-13
Calibration ……2-15
Note: Certain notebook PCs require the use of a power adapter with the Personal Daq. Chapter 3
contains more information regarding power adapters.
Personal Daq/55 and /56 allow for system expansion by snapping a PDQ expansion module onto the unit.
Chapter 3, Hardware Setup, contains detailed information regarding various setup options.
Although Personal Daq/54 has a 25-pin connector, it does not accept expansion modules. The
connector, in the case of Personal Daq/54, is used only for calibration as discussed in chapter 6.
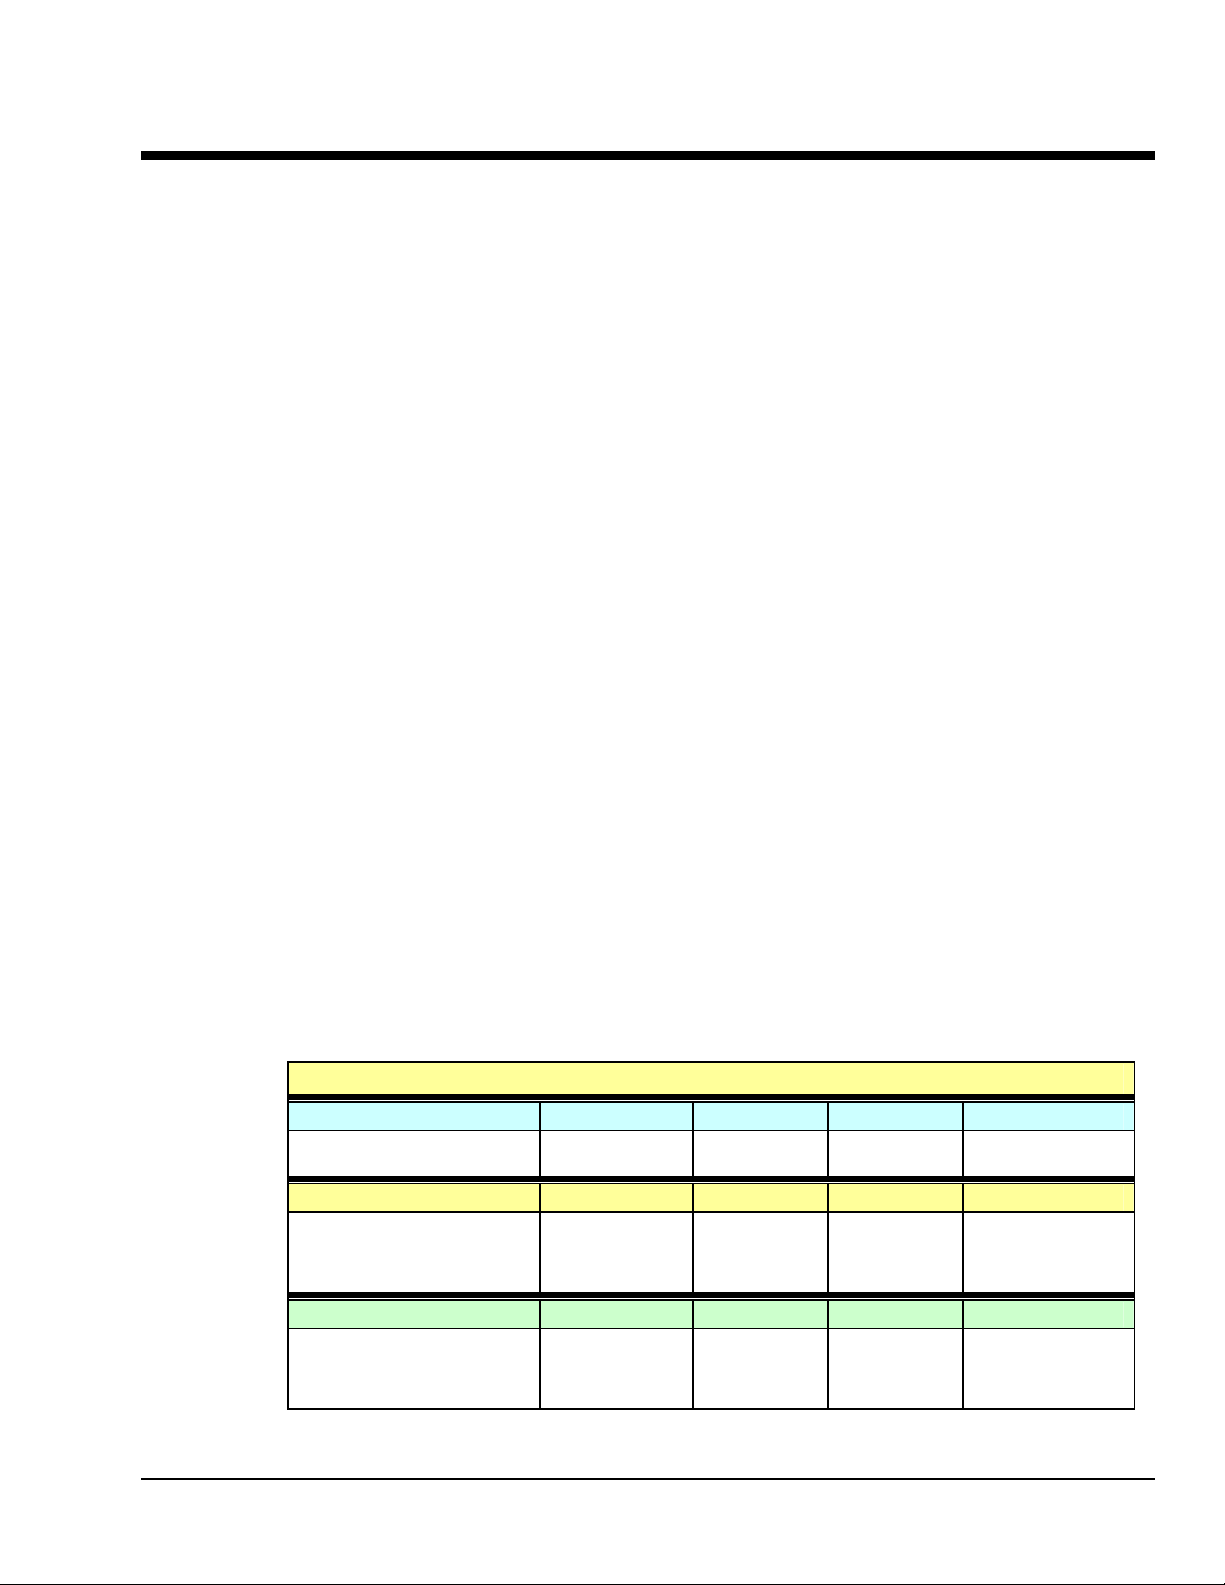
Channel Capacities
The following table highlights the differences between modules and provides a means for calculating the
total channel capacity of a Personal Daq system.
Personal Daq/54
Personal Daq/54
No Expansion ----
---Personal Daq/55 Systems
Personal Daq/55 5 DE, or 10 SE 5 DE 8 2
Personal Daq/55 with PDQ1 15 DE, or 30 SE 15 DE 24 2
Personal Daq/55 with PDQ2 25 DE, or 50 SE 25 DE 8 2
Personal Daq/56 Systems
Personal Daq/56 10 DE, or 20 SE 10 DE 16 4
Personal Daq/56 with PDQ1 20 DE, or 40 SE 20 DE 32 4
Personal Daq/56 with PDQ2 30 DE, or 60 SE 30 DE 16 4
DE = Differential Mode, SE = Single-Ended Mode
Channel Capacities for Various Personal Daq Setups
olts Inputs TC Inputs Digital I/O Freq/Pulse Inputs
5 DE, or 10 SE 5 DE
olts Inputs TC Inputs Digital I/O Freq/Pulse Inputs
olts Inputs TC Inputs Digital I/O Freq/Pulse Inputs
---- N/A ---- ---- N/A ----
Personal Daq User’s Manual 878695 General Information & Specifications 2-1
Page 22
Note: With the use of USB hubs up to 100 Personal Daq units can be attached to one PC. With 100
Personal Daq/56 modules (each with a PDQ2 expansion module) a total channel capability of
8,000 channels can be obtained. An example of capacity calculation follows.
Calculating System Channel Capacity, An Example
Assume a Personal Daq system is comprised of the following:
• one Personal Daq/56 unit
• one PDQ2 expansion module
Using the table on page 2-1 (looking in the bottom row) we see that a Personal Daq/56 with PDQ2 can accept the
following types of channel connections:
• 60 single-ended (or 30 differential mode) for volts inputs
• 30 differential mode for thermocouple inputs
• 16 Digital I/O
• 4 Frequency/Pulse inputs
The maximum channel capacity in this set up is 80 channels. With the use of differential mode
(instead of single-ended) the maximum channel capacity is 50 channels.
In Personal Daq applications, thermocouples should not be connected single-ended. Doing
so can result in noise and false readings. This is especially true when acquiring other highamplitude signals in conjunction with thermocouple signals that are connected single-ended.
Features
The Personal Daq system includes the following features:
• USB connection to the PC means no batteries or other power sources required (see notes)
• signal input connections via removable screw-terminals
• high-resolution 22-bit A/D converter
• internal cold-junction compensator for direct thermocouple measurements
• 500 VDC isolation for PC protection
• low noise thermocouple and voltage measurements
• full-scale voltage inputs from –10 VDC to +20 VDC
• frequency/pulse measurements from DC to 1 Mhz (Does not apply to Personal Daq/54)
• digital I/O with current sink capability for direct drive applications
• with addition of PDQ expansion module, up to 80 channels of analog and digital I/O are available
for one Personal Daq/PDQ combined unit (Does not apply to Personal Daq/54)
• up to 100 Personal Daq/PDQ (combined units) can be connected to one PC by the use of USB hubs;
providing a total channel capacity of 8,000 channels
• digital calibration eliminates the need for potentiometers and user adjustments
• Personal DaqView and driver software
• external power input jack for use with notebook PCs and various setups (discussed in Chapter 3)
Note 1: Certain system configurations make use of USB hubs and power adapters, as discussed in
Chapter 3.
Note 2: Some notebook PCs require that a power adapter be used with your Personal Daq.
Chapter 3 contains more information regarding power adapters.
2-2 General Information & Specifications
878595 Personal Daq User’s Manual
Page 23
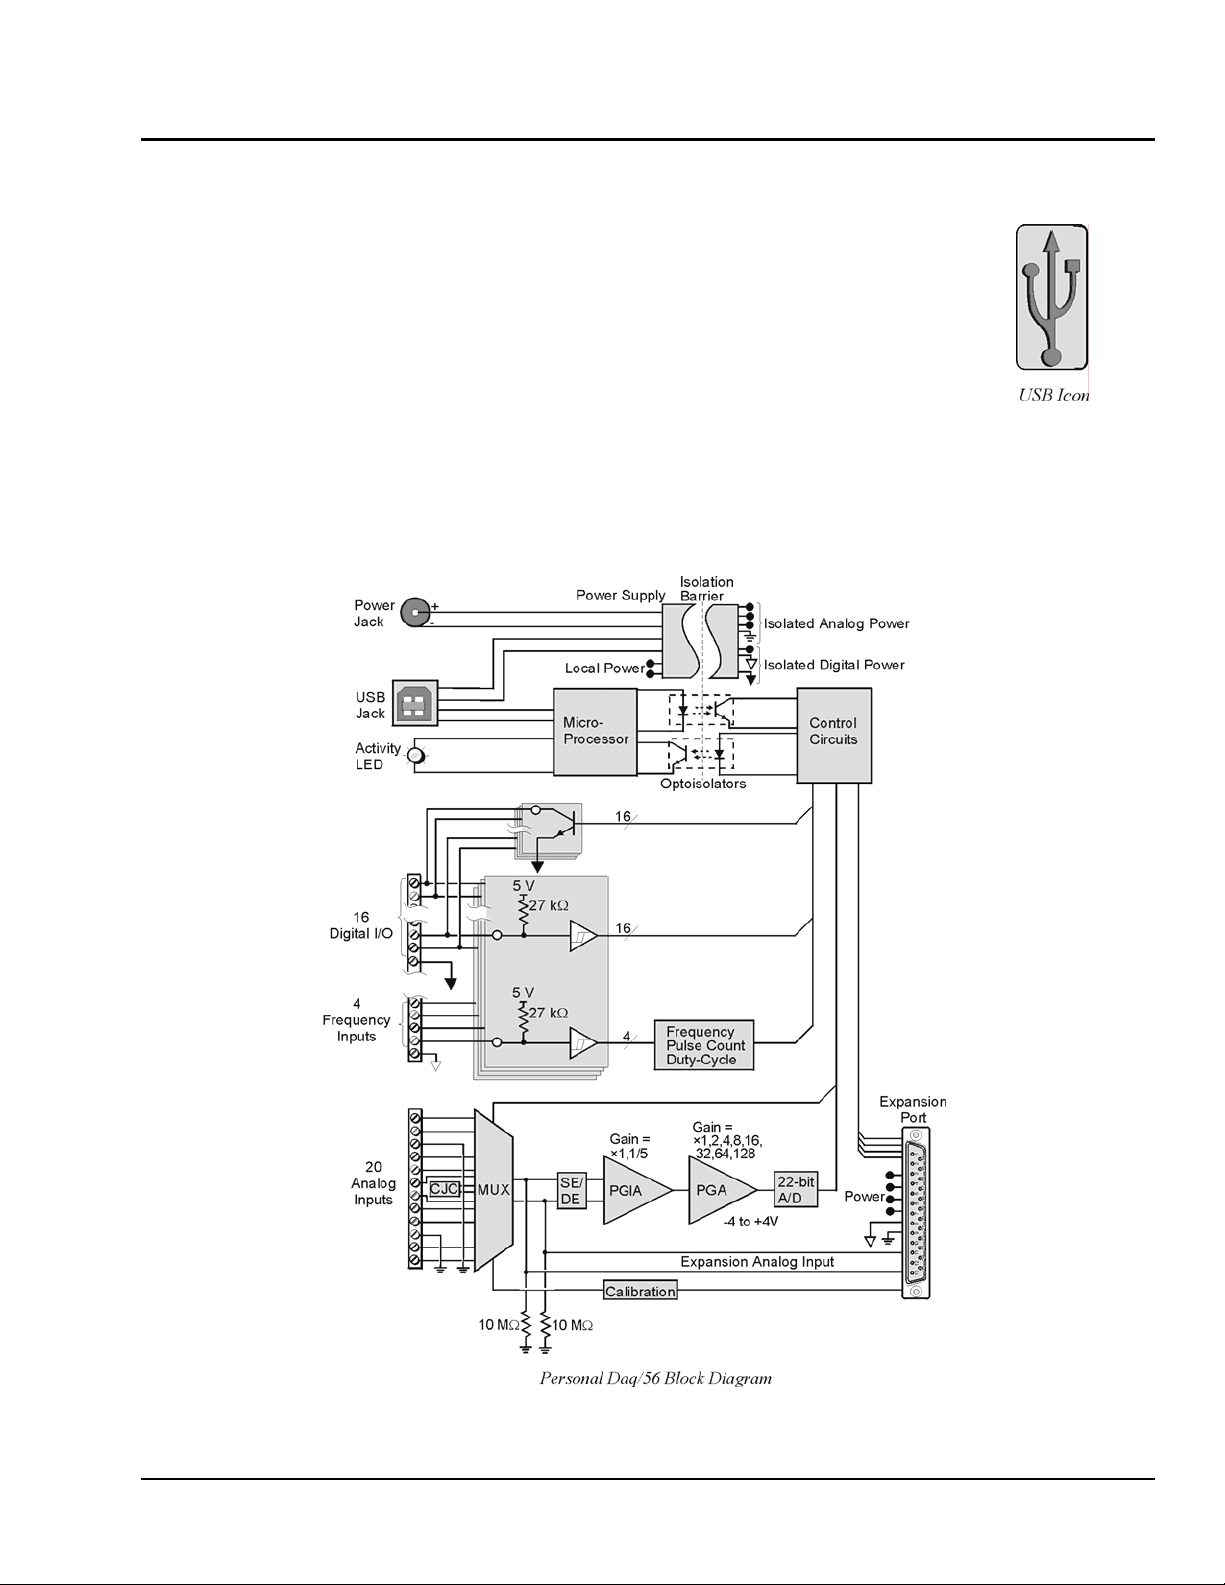
Theory of Operation
Universal Serial Bus (USB)
The Universal Serial Bus is ideal for data acquisition applications. Since USB ports
(located on the PC) provide power, only one cable is needed to link an acquisition
device to the PC. In addition, USB’s high-speed data transfer (from the data acquisition
device to the PC) allows for real-time display of acquired data while eliminating the
need for additional memory in the acquisition device. USB supports transfer rates up to
12 Mbytes/sec and supports real-time data transfer. Standard USB connectors can be
identified by a USB icon.
Power Line Rejection
Personal Daq can take readings while making use of 50/60Hz line cycle rejection (120 dB). While in the
line cycle rejection mode, the maximum sample rate is as follows:
• 50 Hz rejection: 7.7 samples/sec
• 60 Hz rejection: 9.2 samples/sec
Personal Daq User’s Manual
878595 General Information & Specifications 2-3
Page 24

Optical Isolation
The Personal Daq is optically isolated from its host PC by up to 500 VDC. This means that an inadvertent
application of such voltage to Personal Daq will no t affect th e PC. In addition to optical isolation, Personal
Daq maintains all sensitive acquisition-related circuitry external to the PC. This physical isolation of
circuitry from the PC results in less noise and more accurate measurements.
A/D Conversion
Personal Daq uses a sigma-delta analog/digital converter to provide high resolution and sensitivity. When
scanning multiple input channels, resolution and speed can be selected from 22 bits at 1.6 samples/sec, to
15 bits at 80 samples/sec (not including cold-junction compensation).
You can select resolution and speed on a per-channel basis, allowing you to match parameters to individual
channel requirements. For example, you could select 21 bit resolution to detect small temperature changes
on one channel, and select 15 bit resolution to measure battery voltage on a second channel. Although
each channel can have a different resolution and measurement period, all channels are scanned at the same
rate to ensure sampling interval integrity. Examples of scan sequences, with various channel resolution s
and calibration arrangements, appear in the figure on page 2-7.
Input Ranges
You can individually select the input range for each channel. For example, one channel could be used for
volts and another for temperature. Personal DaqView automatically assigns the appropriate units
depending on two factors:
• the selected range and
• measurement unit preferences
Measurement unit preferences can be modified from Personal DaqView’s Preferences Dialog Box located
in the View pull-down menu of the Main Control Window. Chapter 4 provides more detailed information.
Note: The maximum voltage input range (full scale) is –10 to +20 VDC. The lowest programmable
voltage input range is -31 to +31 mV. A complete list of Personal Daq’s programmable ranges
appears on page 2-8.
Each analog input channel has the following user-specified measurement parameters:
• signal type: volts, or thermocouple type J, K, T, E, R, S, B, or N
• full scale voltage: from -10 to + 20 VDC; with programmable ranges as indicated on page 2-8.
• resolution/sample period: from 22 bit RMS at 1.6 samples/sec, to 15 bit RMS at 80 samples/sec
(note that these rates were obtained with a 10-channel scan, continuous self-calibration disabled,
and are for measurements with no CJC [cold junction compensation])
2-4 General Information & Specifications
878595 Personal Daq User’s Manual
Page 25

Analog Input Configuration
Personal Daq/54 and Personal Daq/55 each include 10 analog signal inputs which may be used as 10
single-ended inputs, 5 differential inputs, or as a combination of single-ended and differential inputs with
up to 10 connections. Personal Daq/56 includes 20 analog signal inputs which may be used as 20 single-
ended inputs, 10 differential inputs, or as a combination of single-ended and differential inputs with up to
20 connections.
Single-ended inputs are used with signals that share the same common low (COM), such as multiple
batteries which have their negative sides connected in common. Differential inputs are required when
signals do not share the same common low, such as in the typical use of thermocouples. A simple
example showing two single-ended inputs (V1 and V2) and a differential input (V3) follows.
In Personal Daq applications, thermocouples should not be connected single-ended. Doing
so can result in noise and false readings. This is especially true when acquiring other highamplitude signals in conjunction with thermocouple signals that are connected single-ended.
Single-Ended and Differential Connections to Analog Input Channels
For Personal Daq/55 and Personal Daq/56, the number of analog input channels can be expanded with
use of a PDQ expansion module. There are two types of PDQ expansion modules, either type can be
snapped on to a Personal Daq unit; however, each Personal Daq can support only one expansion module.
PDQ1 modules add 20 single-ended (or 10 differential) inputs to the Personal Daq/55 or /56.
PDQ2 modules add 40 single-ended (or 20 differential) inputs to the Personal Daq/55 or /56.
Measurement Duration, Sample Rate, and Resolution
In relation to sampling analog input, the terms measurement duration, sample rate, and resolution have the
following meanings:
Measurement duration (per channel) – the amount of time used for sampling a channel’s input signal.
You can independently set the measurement duration for each channel. The measurement durations for
Personal Daq’s analog channels range from very slow (610 milliseconds for one sample) to very fast
(12.5 milliseconds for one sample).
Sample rate – Samples per second. The sample rate is the number of samples that take place per second.
With the very slow measurement duration of 610 milliseconds, there will only be 1.6 samples per second.
With the very fast measurement duration of 12.5 milliseconds, there will be 80 samples per second.
Resolution (Bit RMS) – The number of reliable data bits that exist for a signal’s measurement. The greater
the resolution, the more detailed the reading, for example, with increased resolution a reading of 5.12 V
could become 5.11896 V. Personal Daq actually provides for 24 bits of data information; however, the
accuracy of the least significant bits becomes less as the measurement duration speeds up.
Personal Daq User’s Manual
878595 General Information & Specifications 2-5
Page 26

At a measurement duration of 610 milliseconds, the last two bits are considered unreliable, resulting in a
resolution of 22 bits. At a very fast measurement duration (12.5 milliseconds), the nine most least
significant bits are unreliable, resulting in 15 bit accuracy.
Speed vs. Resolution
Speed Designation
Measurement
Duration
(per channel)
Very Slow, 50 / 60 Hz rejection 610 ms 1.6 / sec 22
Slow, 50 Hz rejection 370 ms 2.7 / sec 22
Slow, 60 Hz rejection 310 ms 3.2 / sec 22
Medium, 50 Hz rejection 130 ms 7.7 / sec 21
Medium, 60 Hz rejection 110 ms 9.2 / sec 21
Medium 40 ms 25 / sec 19
Fast 20 ms 48 / sec 17
Very Fast 12.5 ms 80 / sec 15
Notes:
1. Each channel can have independent measurement duration and resolution.
2. The sample rates and resolutions shown were obtained with a 10-channel scan and with
continuous self-calibration disabled.
3. Duration does not include the use of CJC measurements.
1
Maximum
Sample Rate
(Samples/sec)
2
Resolution
(Bits RMS)
(-4 V to +4 V range)
2
Note: When measuring variable input signals (as opposed to relatively steady input signals), the variable
signals will require more samples/sec to obtain a realistic signal representation. Available sample
rates range from 1.6 samples per second up to 80 samples per second as indicated in the preceding
table.
2-6 General Information & Specifications
878595 Personal Daq User’s Manual
Page 27
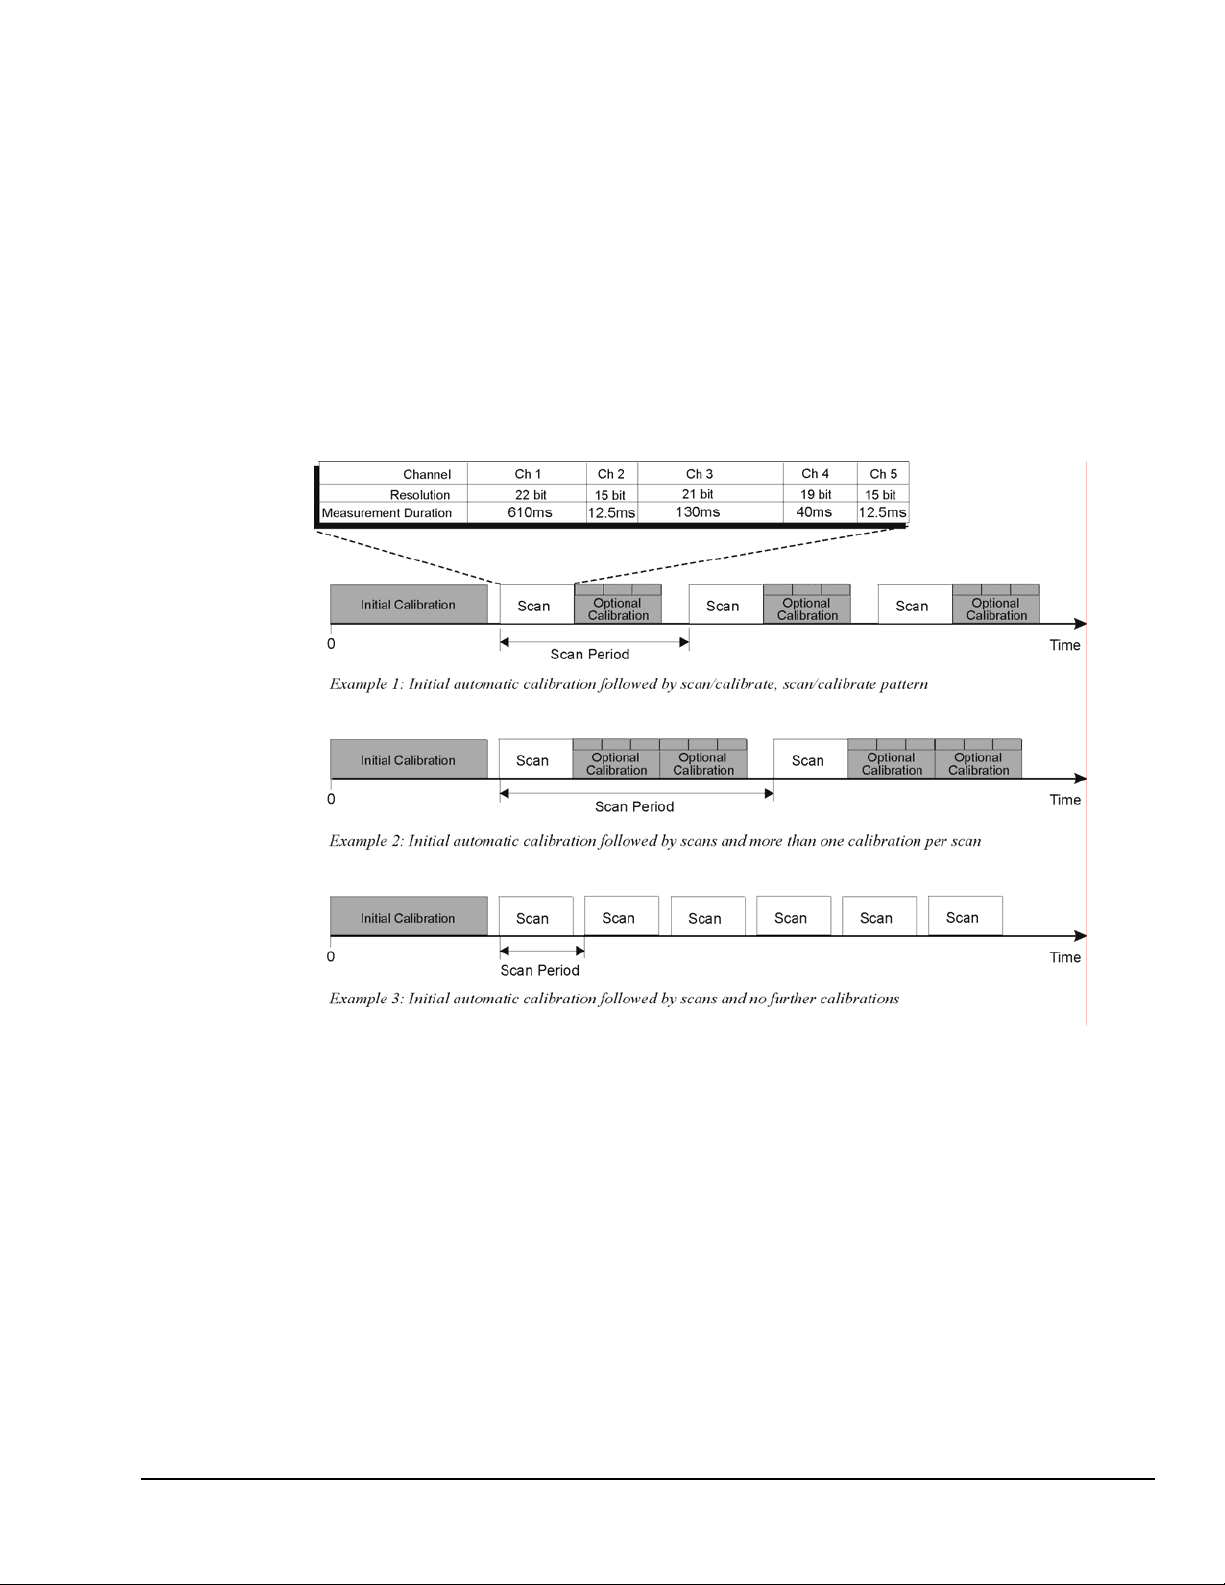
Automatic Calibration
The Personal Daq module contains a built-in source for performing automatic self-calibrations. These
calibrations can be performed between scans periodically throughout the measurement process, as
indicated in the following figure. Such calibration ensures accurate measurements, even in environments
that experience significant temperature fluctuations.
With exception of an automatic initial calibration, Personal Daq’s self calibrations are optional, and may
be discontinued (automatically) if the maximum sampling rate is used. This is because the time between
scans can become too short to permit calibration. In this instance, the PC can initiate calibratio n
immediately prior to the measurement process (see example 3 in the following figure).
Note: The continuous calibration feature is selected (or deselected) from the Configure Acquisition dialog
box. See Chapter 4 for more information.
Thermocouple Measurements
Personal Daq provides effortless thermocouple (TC) measurements. The unit includes built-in coldjunction compensation (CJC), which is automatically invoked when you select TC measurements. The
Personal Daq automatically converts acquired voltage readings into compensated-linearized temperature
readings. A Personal Daq system can make thermocouple and volts measurements concurrently.
Personal Daq User’s Manual
Three Examples of Calibration/Scan Arrangements
878595 General Information & Specifications 2-7
Page 28
Frequency Measurements (Not applicable to Personal Daq/54)
Each frequency/pulse input channel can measure from DC to 1 MHz, offering pulse count (totalize),
frequency, and duty cycle type readings. The input voltage range is -15 to +15 VDC absolute maximum.
TTL sense levels, Schmitt-trigger inputs <1.3 V (low), >3.8 V (high).
Note that each frequency channel can measure pulses that are due to closures of a contact between the
input terminal and the Lo terminal. This is because an internal pull-up resistor places the input at +5V
when the contact is open and allows the input to go to 0V when the contact is closed.
Frequency and pulse measurements can be scanned along with analog input measurements with resolution
up to 7 digits.
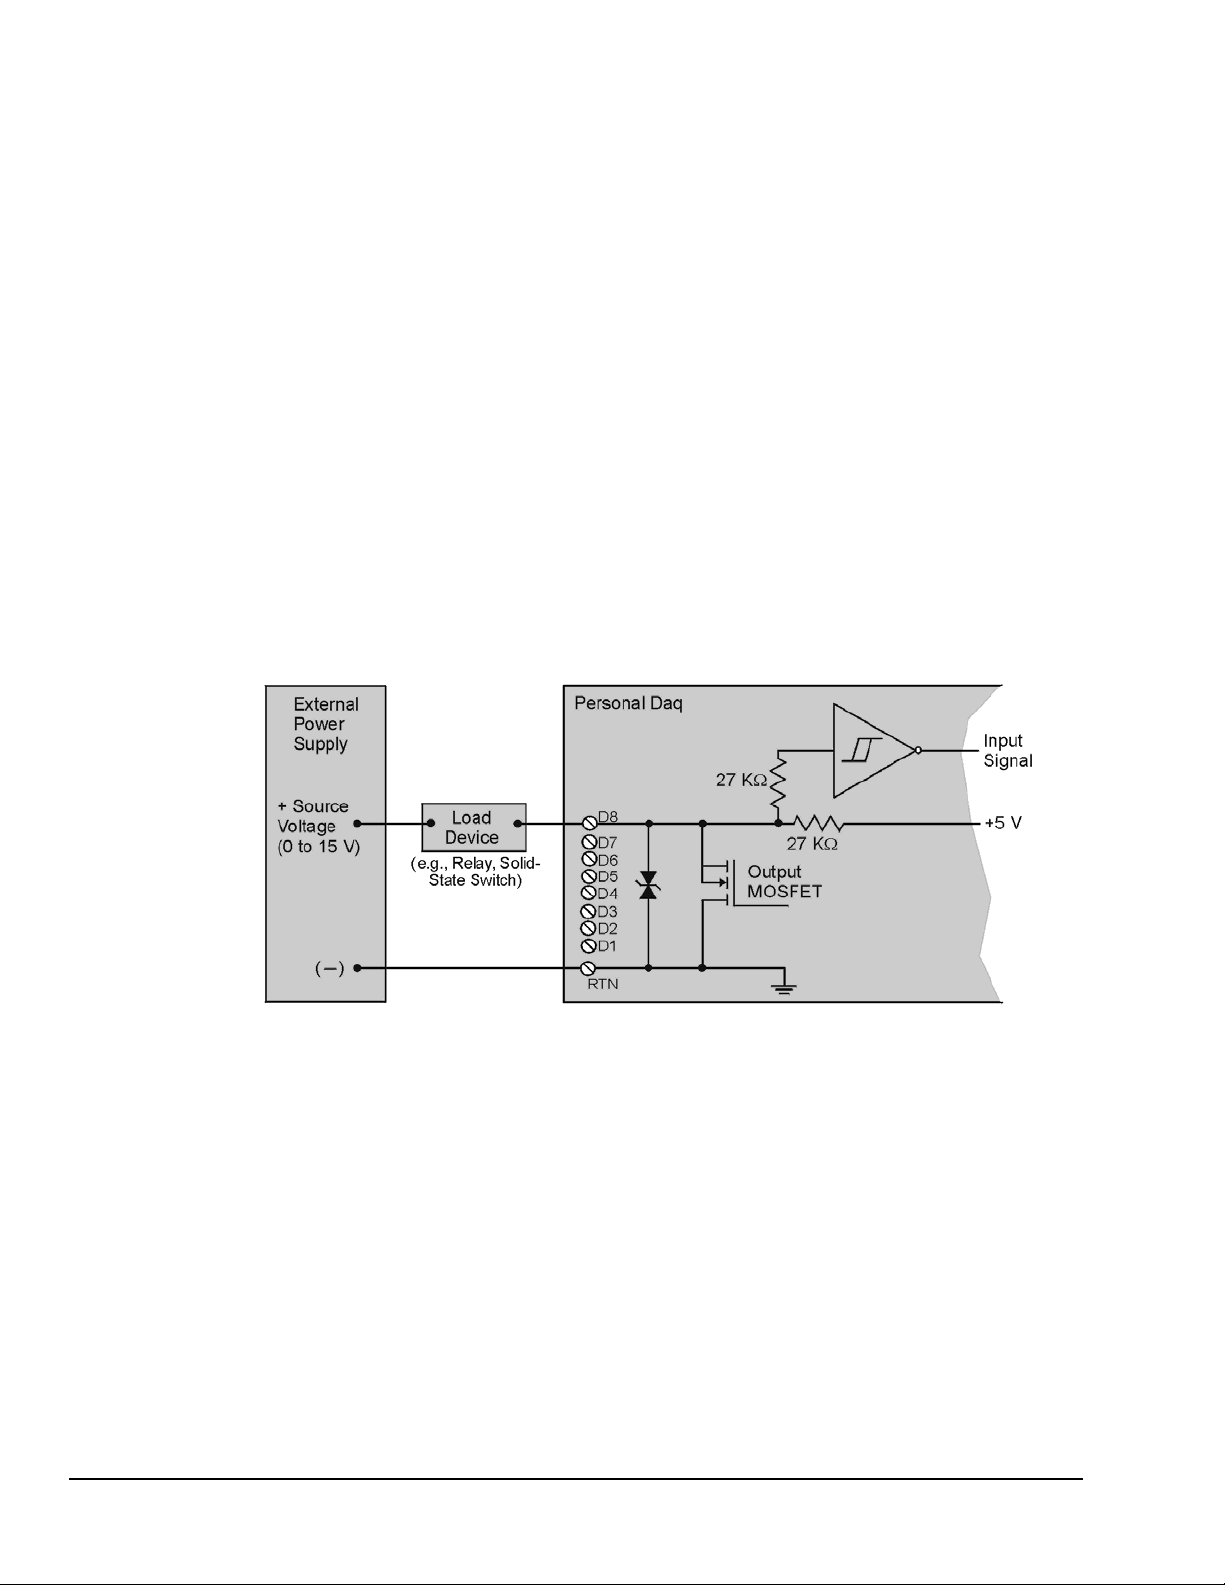
Digital I/O (Not applicable to Personal Daq/54)
You can program each digital I/O line individually as input or output. Digital input lines can be read as
part of the analog scan sequence and can be scanned over 100 times per second. Digital output lines can be
updated at any time prior to, or during an acquisition sequence; or can be automatically updated.
Digital input voltage ranges from 0 to +15 VDC are permitted, with thresholds of: <1.3V (low) and
>3.8V (high). In the output mode each output is an open-collector, with each bank of eight outputs
capable of sinking up to 150 mA for direct drive applications. External pull-up voltages can be up to +15
VDC (Over-voltage is rated at +20 VDC for up to 1 minute). Refer to the following figure for information
regarding Digital I/O connection.
Note: The figure represents connections for one channel (D8). The other seven
channels (D1 … D7) are connected in the same manner.
Note: The maximum load current is 150 mA per 8-channel bank, or
if all eight channels are used, 18 mA (max) per channel.
2-8 General Information & Specifications
Personal Daq, Digital Output Connections
878595 Personal Daq User’s Manual
Page 29
V
V
V
Personal Daq Specifications
Specifications are subject to change without notice.
CAUTION
If equipment is used in any manner not specified in this manual, or if specification
limits are exceeded, the function of the equipment, as well as the protection provided
by it, may be impaired.
Channel Capacities for Various Personal Daq Setups
Personal Daq/54
Personal Daq/54
No Expansion ----
---Personal Daq/55 Systems
Personal Daq/55 5 DE, or 10 SE 5 DE 8 2
Personal Daq/55 with PDQ1 15 DE, or 30 SE 15 DE 24 2
Personal Daq/55 with PDQ2 25 DE, or 50 SE 25 DE 8 2
Personal Daq/56 Systems
Personal Daq/56 10 DE, or 20 SE 10 DE 16 4
Personal Daq/56 with PDQ1 20 DE, or 40 SE 20 DE 32 4
Personal Daq/56 with PDQ2 30 DE, or 60 SE 30 DE 16 4
DE = Differential Mode, SE = Single-Ended Mode
Speed Designation Measurement
olts Inputs TC Inputs Digital I/O Freq/Pulse Inputs
5 DE, or 10 SE 5 DE
olts Inputs TC Inputs Digital I/O Freq/Pulse Inputs
olts Inputs TC Inputs Digital I/O Freq/Pulse Inputs
Speed vs. Resolution
Duration
(per channel)
1
Maximum
Sample Rate
(Samples/sec)
2
---- N/A ---- ---- N/A ----
Resolution
(Bits RMS)
(-4 V to +4 V range)
2
Very Slow, 50 / 60 Hz rejection 610 ms 1.6 / sec 22
Slow, 50 Hz rejection 370 ms 2.7 / sec 22
Slow, 60 Hz rejection 310 ms 3.2 / sec 22
Medium, 50 Hz rejection 130 ms 7.7 / sec 21
Medium, 60 Hz rejection 110 ms 9.2 / sec 21
Medium 40 ms 25 / sec 19
Fast 20 ms 48 / sec 17
Very Fast 12.5 ms 80/ sec 15
Notes:
Personal Daq User’s Manual
1. Each channel can have independent measurement duration and resolution.
2. The sample rates and resolutions shown were obtained with a 10-channel
scan and with continuous self-calibration disabled.
3. Duration does not include the use of CJC measurements.
878595 General Information & Specifications 2-9
Page 30

Analog Specifications
Each channel can be individually configured for single ended or differential; volts or thermocouple inputs.
Personal Daq/54: configurable for 10 single-ended, 5 differential; volts or TC channels
Personal Daq/54 does not accept expansion modules.
Personal Daq/55: configurable for 10 single-ended, 5 differential; volts or TC channels
Personal Daq/56: configurable for 20 single-ended, 10 differential; volts or TC channels
PDQ1 Expansion Module: configurable for 20 single-ended, 10 differential; volts or TC channels
PDQ2 Expansion Module: configurable for 40 single-ended, 20 differential; volts or TC channels
Input Voltage Range Relative to Analog Common (COM): -10 to +20 VDC
Input Voltage Ranges
Programmable Voltage Ranges
-10 V to +20 V (Single-ended only) 120 120 120 120 270 1600
-20 V to +20 V (Differential only) 120 120 120 120 270 1600
-10 V to +10 V 35 35 35 75 190 740
-5 V to +5 V 7 7 10 60 95 370
-4 V to +4 V 4 4 5 20 60 340
-2.5 V to +2.5 V 4 5 8 55 75 200
-2 V to +2 V 4 4 4 15 30 150
-1.25 V to +1.25 V 2 2 3 9 20 110
-1 V to +1 V 2 2 3 15 20 75
-625 mV to +625 mV 3.5 3.5 4.5 10 15 50
-500 mV to +500 mV 1 1.5 2 15 15 40
-312 mV to +312 mV 3 3 4 8 10 30
-250 mV to +250 mV 1 1 2 8 8 25
-156 mV to +156 mV 2.5 4 4 8 8 20
-125 mV to +125 mV 1 1 1.5 7 7 20
-62 mV to +62 mV 1 1 1.5 6 5 9
-31 mV to +31 mV 1 1 1.5 6 5 7
*Note: Noise measured with continuous self-calibration disabled.
Very
Slow
RMS Noise (µV) typical*
Slow
Medium
50, 60 Hz
Rejection
Medium Fast Very
Fast
Voltage Specifications (one year, 15 to 35°C)
Accuracy:
Personal Daq/54: 0.015% of reading + .004% of range (exclusive of noise)
Personal Daq/55: 0.01% of reading + .002% of range (exclusive of noise)
Personal Daq/56: 0.01% of reading + .002% of range (exclusive of noise)
Input Offset Voltage:
Personal Daq/54: <30µV (differential or single-ended)
Personal Daq/54: <20µV (differential or single-ended)
Personal Daq/54: <20µV (differential or single-ended)
Peak-to-Peak Noise: 6 x RMS Noise
Temperature Coefficient: (5 ppm + 1 µV)/°C
Input Resistance: 10MΩ (single ended); 20MΩ (differential); ±5%
Bias Current: <1 nA (0 to 35°C)
DC Common Mode Gain Error: <100 ppm typical; <2 ppm/°C common mode gain drift typical
AC Common Mode Rejection: >120 dB @ 50 Hz (610 ms, 370 ms, 130 ms measurement durations);
AC Normal Mode Rejection: >80 dB @ 50 Hz (610 ms, 370 ms, 130 ms measurement durations);
Channel-to-Channel Cross Talk: < -110 dB (DC to 100 Hz; up to 10 kΩ source resistance)
Over-Voltage Protection: ±45 V relative to analog common
2-10 General Information & Specifications
>120 dB @ 60 Hz (610 ms, 310 ms, 110 ms measurement durations)
>80 dB @ 60 Hz (610 ms, 310 ms, 110 ms measurement durations)
878595 Personal Daq User’s Manual
Page 31

Temperature Specifications (one year, 15 to 35°C)
Note: All temperature specifications assume unit is held in relatively still air environment.
Thermocouple Types: J, K, T, E, R, S, B, N
Cold-Junction Compensation Accuracy:
Personal Daq/54: ±0.7°C
Personal Daq/55: ±0.5°C
Personal Daq/56: ±0.5°C
Thermocouple Accuracy
In Personal Daq applications, thermocouples should not be connected
single-ended. Doing so can result in noise and false readings. This is
especially true when acquiring other high-amplitude signals in conjunction
with thermocouple signals that are connected single-ended.
Thermocouple Accuracy (°C) for Personal Daq/54, /55, and /56 *
TC Type Temp.
J
K
T
E
R
S
B
N
*Note: Thermocouple accuracy excludes cold junction compensation error.
(°C)
-100 0.4 0.4 0.6 1.3 1.3 3.8
0 0.3 0.3 0.4 1.1 1.1 3
700 0.3 0.3 0.4 0.9 0.9 2.5
-100 0.5 0.5 0.7 1.8 1.8 5
0 0.4 0.4 0.6 1.4 1.4 3.9
600 0.4 0.4 0.6 1.3 1.3 3.7
-50 0.4 0.4 0.7 1.6 1.6 4.5
0 0.4 0.4 0.6 1.4 1.4 4
200 0.3 0.3 0.4 1 1 2.9
-100 0.3 0.3 0.5 1.2 1.2 3.4
0 0.3 0.3 0.4 0.9 0.9 2.6
500 0.2 0.2 0.3 0.7 0.7 1.9
400 1.5 1.5 2 5.2 5.2 14.8
700 1.3 1.3 2 4.6 4.6 13.1
1400 1.2 1.2 1.7 3.9 3.9 11
400 1.6 1.6 2 5.6 5.6 16
700 1.5 1.5 2 5.2 5.2 14.7
1400 1.3 1.3 2 4.6 4.6 12.8
700 2.2 2.2 3.3 7.9 7.9 13.7
1400 1.4 1.4 2 4.8 4.8 13.7
-100 0.7 0.7 1 2.6 2.6 7.3
0 0.6 0.6 0.8 2 2 5.9
700 0.4 0.4 0.6 1.4 1.4 4
Very
Slow
Slow Medium
50, 60 Hz
Rejection
Medium Fast Very Fast
Personal Daq User’s Manual
878595 General Information & Specifications 2-11
Page 32

Frequency Specifications, one year 0 to 50°C (Not applicable to Personal Daq/54)
Operating Modes: Pulse count (totalize), frequency, and duty cycle
Frequency Response: DC to 1 MHz
Accuracy: 100 ppm; 1 ppm/°C
Resolution: Up to 7 digits, user selectable.
Input Voltage Range: -15 to +15 VDC Absolute Maximum, TTL sense levels
Pull-up Resistor: 27 KΩ to +5 V for switch or relay sensing
Debouncing: None, 0.8, 3.2, or 13 milliseconds (software selectable)
Totalize: Up to 2
Schmitt-trigger inputs, <1.3 V (low), >3.8 V (high)
32
counts/scan
Digital I/O Specifications (Not applicable to Personal Daq/54)
Configuration: Each I/O line is individually selectable as input or output. Each I/O line includes an open-collector driver
Over-Voltage: +20 VDC for up to 1 minute
Output Characteristics:
Input Characteristics:
with a 27 KΩ pull-up resistor to +5 V for output, and a Schmitt-trigger input buffer.
Voltage Range: 0 to +5VDC with no external pull up resistor; 0 to +15VDC with external pull up
Maximum Sink Current: 150 mA/output continuous, 500 mA output peak (<100 µs),
150 mA total continuous (per bank of 8 outputs)
Output Resistance: 10 Ω max
Output Updates: Outputs may be changed via program control
Voltage Range: 0 to +15VDC
Thresholds: <1.3 V (low), > 3.8 V (high)
General Specifications
Warm-up: 1 hour to rated specifications
Environment:
Operating: 0-50°C, 0-95% RH (non-condensing)
Storage: -20 to 70°C
Isolation: 500 VDC from PC common
USB Power Source: PC USB port or self-powered USB hub; 500 mA maximum
External Power Source: Required when used with a bus-powered hub; +6 to +16 VDC, 500 mA
Option Notes: (1) the TR-2 External Power Supply is a 120 VAC to +9 VDC adapter;
Vibration: MIL Std 810E
Dimensions: 92 x 182 x 45 mm (3.6 x 7.1 x 1.8 inches)
Weight: Personal Daq/55: 300g (10.5 oz )
Personal Daq/54: 300g (10.5 oz )
Personal Daq/56: 360g (12.5 oz)
PDQ1: 300g (10.5 oz )
PDQ2: 300g (10.5 oz )
Optional Accessories
PDQ10 – DIN-Rail Mounting
PDQ11 – 4 powered USB Hub with cable
PDQ12 – USB extender cable, 5 meters
PDQ13 – PCI to dual USB card
TR-2 − External Power Supply, 120 VAC to +9 VDC adapter
TR-2E − External Power Supply, 230 VAC to +9 VDC adapter
CN-153-12 − Terminal Block
USB Cables: CA-179-3 (3 meter)
CA-179-5 (5 meter)
(2) the TR-2E External Power Supply is a 230 VAC to +9 VDC adapter
2-12 General Information & Specifications
878595 Personal Daq User’s Manual
Page 33

Channel Connection Layouts
The following indicate channel connection layouts for Personal Daq/54, /55, and /56. Connection layouts
for expansion modules (PDQ1 and PDQ2) follow shortly. Personal Daq/54 provides no functionality
for expansion modules.
Analog In Single-ended inputs are used with analog signals that share the same common low, such as
multiple batteries which have their negative sides connected in common. Differential inputs are required
when signals do not share the same common low, such as in the typical use of thermocouples. Note that
the analog low common references are -10 to +20 Volts. Analog low commons (COM) are located on the
same terminal blocks as are the analog channel connections, and should not be confused with the frequency
lows (Lo) discussed later.
Personal Daq User’s Manual
878595 General Information & Specifications 2-13
Page 34

In Personal Daq applications, thermocouples should not be connected single-ended. Doing
so can result in noise and false readings. This is especially true when acquiring other highamplitude signals in conjunction with thermocouple signals that are connected single-ended.
Personal Daq units include built-in cold-junction compensation (CJC), which is automatically invoked
when you select TC measurements. The Personal Daq automatically converts acquired voltage readings
into compensated-linearized temperature readings. A Personal Daq system can make thermocouple and
volts measurements concurrently.
Frequency/pulse These input channels can measure from DC to 1MHz. Readings can be in pulse count
(totalize), frequency, or duty cycle. Input voltage range is –15 to +15VDC, with the logic threshold at
<1.3V (low) and >3.8V (high). Frequency and pulse measurements can be scanned along with analog
input measurements with resolution up to 7 digits. Frequency low connections (Lo) are not to be confused
with the analog commons (COM). Frequency Los are located next to F1 and F3 channel connections. The
connection points labeled “Lo” serve as a common reference for frequency inputs. Frequency/pulse
channels do not apply to Personal Daq/54.
Digital I/O You can program each digital I/O line individually as input or output. The digital I/O lines
do not make use of the Lo or COM connections. Digital output lines do make use of special digital return
lines designated by the letters RTN. Digital I/O channels do not apply to Personal Daq/54.
Digital input lines can be read as part of the analog scan sequence and can be scanned over
100 times per second. Digital input voltage may range from 0 to +15V, with the logic threshold at
<1.3V (low) and >3.8V (high). Digital values outside of the 0 to +15V range are not permitted.
Digital output lines can be updated at any time prior to, or during an acquisition sequence; or can
be automatically updated over 100 times per second. Digital outputs share a common return
(RTN). In the output mode each output is an open-collector capable of sinking up to 150mA for
direct drive applications, and capable of pull-up voltages up to +15 VDC. Note that over-voltage
is rated at +20 VDC for up to 1 minute.
2-14 General Information & Specifications
878595 Personal Daq User’s Manual
Page 35

Note: The digital output can be written to since the digital output lin es are latched.
Calibration
Calibration must be completed periodically to ensure your data acquisition device remains accurate. You can use
UserCal (a Windows-based program) to provide step-by-step instructions. Chapter 6 contains detailed information
regarding calibration.
Note: Appendix D contains blank user custom labels and information regarding
(located in the installation target directory of
\\Program Files\pDaqView). User custom labels allow
pDaq_CustomLabels.doc
you to identify Personal Daq channels by user-specific nomenclature, in addition to the
pre-existing channel labels (indicated on this and the preceding page).
Note: Calibration constants are calculated and stored in the Personal Daq unit’s serial EEPROM.
Note: The typical calibration period for Personal Daq is once every year.
Personal Daq User’s Manual
878595 General Information & Specifications 2-15
Page 36

This page is intentionally blank.
2-16 General Information & Specifications
878595 Personal Daq User’s Manual
Page 37

Hardware Setup 3
Personal Daq, System Components ……3-2
Personal Daq …… 3-2
PDQ Expansion Modules …… 3-2
USB Hubs and Power Adapters …… 3-3
Connecting Your Personal Daq Acquisition System …… 3-4
Connecting a PDQ Expansion Module to a Personal Daq …… 3-4
Connecting Various Hardware Setups …… 3-4
Example 1: Direct Connection to Computer USB Port(s) …… 3-4
Example 2: Connection to USB-Powered Hub …… 3-5
Example 3: Connections to Self-Powered and USB-Powered Hubs …… 3-5
CAUTION
The discharge of static electricity can damage some electronic components.
Semiconductor devices are especially susceptible to ESD damage. You should always
handle components carefully, and you should never touch connector pins or circuit
components unless you are following ESD guidelines in an appropriate ESD controlled
area. Such guidelines include the use of properly grounded mats and wrist straps,
ESD bags and cartons, and related procedures.
Never connect an expansion module to (or remove it from) a Personal Daq main unit
while the main unit is connected to a power source. Such action may result in
EEPROM errors and loss of calibration data.
Never remove a USB cable from an active Personal Daq device while an acquisition is
in progress. An active device is any device that is currently open and has channels
configured for scanned input. Such disconnection may require you to exit and then
re-launch Personal DaqView, after the USB cable has been connected.
CAUTION
CAUTION
CAUTION
When using Personal Daq modules to acquire data, computer energy save modes can
cause false data readings. Prior to using Personal Daq modules, ensure your
computer’s energy save mode is disabled. If needed, consult your PC user’s manual to
disable energy save (power suspension) modes.
When using a power adapter with your Personal Daq system, be sure to supply power
(from the adapter to the Personal Daq) before connecting the USB cable. This allows
Personal Daq to inform the host computer (upon connection of the USB cable) that the
unit requires minimal power from the computer.
Note: This chapter pertains to hardware aspects of the Personal Daq, including the PDQ expansion
modules and two basic types of USB hubs (self-powered and USB-powered). Product
specifications are contained in the previous chapter.
Personal Daq User’s Manual 878695 Hardware Setup 3-1
Page 38

Personal Daq, System Components
Personal Daq
The following illustration points out key physical features of the Perso nal Daq. Aside from labeling and
the number of terminal blocks, Personal Daq/54, /55, and /56 look very much alike. Upon closer
examination you can see differences.
Both the /55 and /56 contain a DB25 expansion port for mating with a PDQ expansion module. Slots on
the main units and expansion modules provide a means of attaching units securely with locking clips.
Personal Daq/54 also has a DB25 port. However, in the case of the Daq/54 the port is used only for
calibration as discussed in chapter 6. Personal Daq/54 contains no functionality in regard to expansion
modules. Also note that Personal Daq/54 has no terminal block for Digital I/O and no Frequency/pulse
input terminals.
A customized label can be inserted in slots above the terminal connectors. The labels are especially useful
in acquisition systems that consist of several Personal Daqs and PDQ expansion modules. Appendix D
contains blank labels.
Note 1 Note 2
Note 1: Label slots are included on Personal Daq/55 and /56. The slots are not included on
Personal Daq/54.
Note 2: An expansion module (PDQ1 or PDQ2) can be added to Personal Daq/55 and /56 units.
Although an expansion module can physically connect to a Personal Daq/54, it will not
function with the unit. Personal Daq/54 does not include expansion functionality. For /54
devices, the 25-pin port is used only for calibration as discussed in chapter 6.
Note 3: “Active” [LED blinking] means that an acquisition is in progress. “Ready” [LED on solid] means
that the unit has power, has USB communications established, and is ready to acquire data.
PDQ Expansion Modules
You can connect either of two PDQ expansion modules (PDQ1 or PDQ2) to the Personal/55 and
Personal/56 units. Module specifications are listed in the preceding chapter.
With exception of the end-faces, the PDQ modules have the same physical appearance as Personal Daq/56.
The above figure includes an illustration of a PDQ2 module connected to a Personal Daq/55. Two locking
clips are used to hold the units together. The clips ensure a good connection is maintained.
Personal Daq/54 does not accept expansion modules.
3-2 Hardware Setup
(Does not apply to Personal Daq/54)
878695 Personal Daq User’s Manual
Page 39

USB Hubs and Power Adapters
With the use of USB hubs you can connect up to 100 Personal Daq units to one PC. USB hubs can be of
the self-powered type, or of the USB-powered type. Both types of hubs are available from a variety of
vendors; however, if you encounter any difficulty in obtaining a USB hub, please contact your service
representative.
Power Adapters − Power adapters, also referred to as auxiliary power packs, are required for some self-
powered hubs, and for Personal Daq modules that are powered from USB-powered hubs. In addition,
Personal Daq units will require the use of a power adapter when used with certain laptops.
When using a power adapter with your Personal Daq system, be sure to supply power
(from the adapter to the Personal Daq) before connecting the USB cable. This allows
Personal Daq to inform the host computer (upon connection of the USB cable) that the
unit requires minimal power from the computer.
Power adapters for use with Personal Daq have a current limit of 500 mA (min.) and a voltage range of
+6 to +16 Volts DC. These specifications are provided on the end-face of the Personal Daq.
If the computer does not recognize the Personal Daq unit, make sure the computer’s USB port is properly
enabled and is in good working order. If the computer still fails to recognize the Personal Daq, the use of a
power pack may be required. In United States use a TR-2 power pack, or equivalent. In Europe use a
TR-2E power pack, or equivalent. Both the TR-2 and the TR-2E provide 500 mA min, +6 to +16 VDC.
The use of certain notebook computers may require the use of a power adapter with
your Personal Daq.
USB-powered Hubs − These hubs draw all power from the host USB connector’s power pins. The power
is used for hub internal functions and for the hub’s ports. Each port of a USB-powered hub must be
capable of supplying at least 100 mA.
Self-powered Hubs − These hubs draw power from a source other than the host USB connector, with
exception that they may draw up to 100 mA from their upstream connection for hub internal functions.
The external power is used for hub internal functions and for the hub’s ports. Each port of a self-powered
hub must be capable of supplying 500 mA.
Personal Daq User’s Manual
878695 Hardware Setup 3-3
Page 40

Connecting Your Personal Daq Acquisition System
Review the CAUTIONS and notes (presented on page 3-1) prior to connecting or
disconnecting components.
Connecting a PDQ Expansion Module to a Personal Daq/55 or /56
To connect a PDQ expansion module to a Personal Daq/55 or /56 unit:
1. Review the CAUTIONS and notes presented on page 3-1.
2. Ensure the Personal Daq main unit is not connected to a USB port.
3. Ensure the Personal Daq main unit is not connected to a power adapter.
4. Plug the expansion module into the DB25 connector on the Personal Daq main unit.
5. Lock the two modules together using two locking clips (see figure, page 3-2).
6. Connect the Personal Daq main unit to power according to your system setup (3 examples
follow).
When using a power adapter with your Personal Daq system, be sure to supply power
(from the adapter to the Personal Daq) before connecting the USB cable. This allows
Personal Daq to inform the host computer (upon connection of the USB cable) that the
unit requires minimal power from the computer.
Connecting Various Hardware Setups
Personal Daq data acquisition systems range from simple to complex. One example of a simple system is
that of one Personal Daq/54 connected to a PC’s USB connector. A much more complex system is one
that contains 100 Personal Daq/56 units, 100 PDQ expansion modules, and a combination of USB-powered
and self-powered hubs. Despite the wide range of possibilities in between, use of the following examples
should enable you to properly connect your system.
Note: In the examples that follow, the USB hubs have four external ports (downstream ports). The
USB hubs used in your system may have more. Connections can be adjusted accordingly.
When using a power adapter with your Personal Daq system, be sure to supply power
(from the adapter to the Personal Daq) before connecting the USB cable. This allows
Personal Daq to inform the host computer (upon connection of the USB cable) that the
unit requires minimal power from the computer.
3-4 Hardware Setup
878695 Personal Daq User’s Manual
Page 41

Example 1: Direct Connection to Computer USB Port(s)
In example 1 two Personal Daqs (and optional PDQ modules) are connected by cable to each of the
computer’s USB ports. The number of USB connectors may vary from PC to PC. When you connect
Personal Daq units directly to a USB connector in this manner, no additional power source is required
since the computer’s USB connector power pins supply the Personal Daq and associated PDQ expansion
module with adequate power (500 mA at 4 to 5.25 V).
The use of certain notebook computers may require the use of a power adapter with
your Personal Daq.
Example 2: Connection to USB-Powered Hub
In example 2, four Personal Daqs (and optional PDQ modules) are connected by cable to individual ports
of a single USB-powered hub. Since the hub receives all its power from the computer’s USB, the hub
cannot supply adequate power to the Personal Daq units. Because of this aspect of insufficient power, each
Personal Daq is connected to its own power adapter.
Note: The power adapters used must be capable of supplying at least 500 mA and have a voltage rating
of +6 to +16 VDC.
*Note: USB port locations vary from PC to PC.
Personal Daq User’s Manual
When using a power adapter with your Personal Daq system, be sure to supply power
(from the adapter to the Personal Daq) before connecting the USB cable. This allows
Personal Daq to inform the host computer (upon connection of the USB cable) that the
unit requires minimal power from the computer.
878695 Hardware Setup 3-5
Page 42

Example 3: Connections to Self-Powered and USB-Powered Hubs
Example 3 illustrates a system that makes use of six Personal Daq units and two different style USB hubs.
Three Personal Daqs (and optional PDQ modules) are connected by cable to individual ports of a self-
powered USB hub. In addition, the self-powered hub is connected to a downstream USB-powered hub,
which is also connected to three Personal Daq units (and optional PDQ modules).
Notice that the Personal Daqs connected to the self-powered hub have no adapters connected to them. This
is because the hub receives external power (in addition to the PC supplied USB power), which is capable
of supporting the downstream devices connected directly to it. In comparison, the three Personal Daqs
connected to the USB-powered hub each require their own power adapter. As in example 2, the power
adapters used must be capable of supplying at least 500 mA and have a voltage rating of +6 to +16 VDC.
*Note: USB port locations vary from PC to PC.
3-6 Hardware Setup
878695 Personal Daq User’s Manual
Page 43

Personal DaqView 4
Overview …… 4-2
Standard, Plus, and XL Version Software …… 4-2
Main Control Window …… 4-3
Toolbar Buttons …… 4-3
Pull-Down Menus …… 4-3
Channel Configuration Window …… 4-6
Channel Configuration Window Toolbar …… 4-6
Channel Configuration Window Pull-down Menus …… 4-6
Common Spreadsheet Columns …… 4-7
Analog Input Spreadsheet …… 4-10
Frequency/Pulse Input Spreadsheet …… 4-12
Digital Input/Output Spreadsheet …… 4-14
Configure Acquisition Dialog Box …… 4-15
Configure Data Destination and File Converter Preferences …… 4-18
Sequential Destinations (Auto Rearm) …… 4-19
Bar Graph, Analog, and Digital Meters …… 4-20
Meter Toolbars …… 4-20
Meter Pull-Down Menus …… 4-21
Meters Configuration Menu …… 4-21
Configuring a Meter …… 4-22
Bar Graph Meters …… 4-24
Analog Meters …… 4-25
Digital Meters …… 4-26
Chart Display …… 4-27
A Note Regarding Standard, Plus, and XL Version Software ……4-27
Groups, Charts, & Channels …… 4-27
Chart Display Window …… 4-27
Pull-Down Menus …… 4-28
Toolbar Items …… 4-29
Chart and Channel Information Regions …… 4-30
Accessing the Display Configuration Setup Box …… 4-31
Editing a Chart Display Configuration …..4-32
Manually Configuring a Chart Display …. 4-34
Chart Setup Wizard …… 4-37
Introduction …… 4-37
Automatic Display Setup using the Chart Setup Wizard …… 4-38
Bypassing Automatic Chart Setup …… 4-39
Reference Note: This chapter serves as a reference for Personal DaqView, Personal DaqView Plus, and the
Chart Setup Wizard feature. For very first time start-up refer to Chapter 1 or the Personal Daq Quick Start
document (p/n 491-0940). Chapter 1 and the Quick Start contain information for connecting hardware,
loading software, and acquiring data quickly.
Reference Note: Personal DaqViewXL is optional software that allows Personal DaqView and
Personal DaqView Plus to execute functions from within Microsoft Excel
“Add-In” program, please refer to the Personal DaqViewXL User’s Guide, part number 491-0905.
TM
. If you will be loading this Excel
Personal Daq User’s Manual 989394 Personal DaqView 4-1
Page 44

Overview
This chapter serves as a reference for Personal DaqView, Personal DaqView Plus, and the Chart Setup
Wizard feature. For very first time start-up refer to Chapter 1 or the Personal Daq Quick Start document
(p/n 491-0940). Chapter 1 and the Quick Start contain information for connecting hardware, loading
software, and acquiring data quickly. As previously noted, users of Personal DaqViewXL should refer to
the following document: Personal DaqViewXL User’s Guide, part number 491-0905.
Personal DaqView is a graphic Microsoft Windows-based program that can be used for various data
acquisition applications. The program was designed for ease-of-use with no need for programming or
expertise in configuration.
Personal DaqView allows you to perform the following tasks.
• Set up Analog Input Channels for acquiring various voltages or temperature
• Set up Frequency/Pulse Input Channels to measure various frequency-related parameters, e.g.,
pulse rate, total pulses, pulses per scan, percentage high, percentage low
• Set up Digital I/O Channels for input or output
• Save acquired data to disk
• Transfer data to spreadsheets, data bases, and PostView
• View real-time data values in screen columns, scrolling charts, bar graph, analog, or digital meters
Standard, Plus, and XL Version Software
This chapter was written to include instructions regarding Personal DaqView Plus. Users of the standard
software package should be able to use this material without difficulty. The most noticeable difference in
software pertains to charts, as discussed in the next paragraph. Aside from the chart-related differences,
the “Plus” version has built-in support for up to 100 Personal Daq devices attached to one PC (see
following note).
Note: Driver support for multiple devices is included with every Personal Daq. For this reason,
Personal DaqViewPlus is not required for multiple device applications inwhich the user writes his
own program.
While the standard version of Personal DaqView is limited to one group, and to one channel per chart;
Personal DaqView Plus permits the use of multiple groups with up to four overlapping channels per chart.
In addition, Personal DaqView Plus allows you to make changes via a Chart Properties dialog box. The
Chart Properties box is discussed on page 4-28.
Another distinction of the “Plus” version can be seen when using the Chart Setup Wizard feature. The
“Plus” version can make use of Simple, Moderate or Advanced automatic chart creation functions of the
wizard; however, the standard version is resricted to use of Simple mode. Discusssion of the Chart Setup
Wizard begins on page 4-37. If you do not have Personal Daq View Plus, but are interested in its
expanded features, please contact your service representative for detailed information. Note that Personal
DaqView Plus can only be activated by use of an authorized registration number.
Personal DaqView XL and Personal DaqView Plus XL function very much like their respective base
(Personal DaqView) programs, with exception that the XL version programs are “add-ins” to
Microsoft Excel
make use of Excel’s associated macros. Users of the XL version software (for Personal DaqView) should
refer to the document, Personal DaqViewXL User’s Guide, part number 491-0905. If you do not have XL
version Personal DaqView software, but are interested in obtaining it, please contact your service
representative.
TM
and run from within the Excel environment. The XL version software allows you to
4-2 Personal DaqView
989394 Personal Daq User’s Manual
Page 45

Main Control Window
When you first open Personal DaqView the Main Control and Channel Configuration Windows appear.
Note that this section pertains to the Main Control Window only; discussion of the Channel Configuration
Window begins on page 4-6.
The Main Control Window contains several pull-down menus, a toolbar composed of icon buttons, and
information boxes for status, progress [number of scans], and file identification. Functions that can be
obtained through the toolbar can also be obtained through the pull-down menus.
Toolbar Buttons
Main Control Window
Button Function
1 Open Configuration File Opens a selected configuration file.
2 Save Configuration File Saves the current configuration file to disk.
3 Select Active Device Provides a list of available devices, their serial number, and device type. A
4 Arm Trigger for Disk
Recording
5 Manual Trigger Used to trigger the device when the mode of trigger is set to “Manual.” Note that the
6 Update Digital Outputs Updates digital outputs for all digital channels that are selected to “Output State.” See
7 Configure Data
Destination
8 Configure Acquisition Accesses the Configure Acquisition window (page 4-15).
9 Configure Channel
Settings
checkmark appears next to the selected device. Use the mouse to select (or
deselect) a device. “Device” in this context can include an expansion module, for
example: a Personal Daq/55 with an attached PDQ1 would be one device.
Arms the trigger and stores acquisition data to a designated disk file. If Auto Rearm is
selected, clicking this button puts Auto rearm in effect. This button, is also used to
disarm the data acquisition.
Manual Trigger button can not be depressed until after the trigger is armed, for
example, by first pressing button 4.
Digital Input/Output Spreadsheet, page 4-14.
Digital I/O does not apply to Personal Daq/54.
Accesses the Configure Data Destination window (page 4-16). Note that this window
provides a means of selecting sequential destinations through an auto rearm feature.
Brings up the Channel Configuration window. From this window you can configure
channels for Analog Input (page 4-8), Frequency/Pulse Input (page 4-12), and Digital
Input/Output channels (page 4-14), depending on which tab is selected.
10 Update All Indicators Starts all on-screen indicators with a display of up-to-date data. Has no affect on the
11 Display Scrolling Charts Displays data graphically in a scrolling chart. Discussion of Chart Display begins on
12 Display Bar Meters Displays data in a bar graph format. Discussed on page 4-24.
13 Display Analog Meters Displays data displayed in a dial-gage format. Discussed on page 4-25.
14 Display Digital Meters Displays data in a digital meter format. Discussed on page 4-26.
15 View Data Launches an independent post-data acquisition program such as eZ-PostView.
recording of data to disk. Auto Rearm, even if selected, will not occur when using this
control. This button is also used to pause all indicators.
page 4-27.
Refer to the Post Acquisition Analysis PDF (included on your CD) for detailed
information.
Personal Daq User’s Manual 989394 Personal DaqView 4-3
Page 46

Pull-Down Menus
Aside from using the toolbar buttons to perform various program functions, you can select functions from
pull-down lists as indicated by the following table.
Pull-Down Menu Function
File
New (Ctrl+N) Provides a means to create a new file.
Open (Ctrl+O) Provides a means to open an existing file.
Save (Ctrl+S) Saves the current file under its present filename.
Save As … Copies the current file and saves it under a different filename.
Authorization (Ctrl + U)
Authorization Dialog Box
The File Pull-Down menu includes an Authorization dialog box. If you have
Exit (Ctrl+Q) Exits the program.
pDaqViewXL or pDaqView Plus, you must enter an appropriate authorization code to
enable the applicable feature. If you do not have an authorization code you can obtain
one from your service representative, or can enable both features for a 30-day trial
period. It is possible for a code to authorize one or both features, depending on how the
options were ordered.
View
Active Devices … Provides a list of available devices, their serial number, and device type. A checkmark
Acquisition
Configuration…
Channel Configuration Opens the channel configuration window (if closed) with the Analog Input channels
Data Destination
Configuration …
Preferences …
(Preferences are
discussed in more detail
on the following page)
appears next to the selected device. Use the mouse to select (or deselect) a device.
“Device” in this context can include an expansion module, for example: a Personal
Daq/55 with an attached PDQ1 would be one device. Only one device can be active at
a time.
Brings up the Configure Acquisition window.
spreadsheet selected.
Brings up the Data Destination dialog box for assigning the destination folder, and
filename. Also provides the option to select sequential destinations (Auto Rearm).
Opens a dialog box containing two tabs, with the following uses:
tab: Provides a means to select various preference options regarding opening,
General
exiting, and saving files.
Measurements
temperature, and frequency.
tab: Provides a means of setting default measurement units for voltage,
4-4 Personal DaqView
Preferences Dialog Boxes
989394 Personal Daq User’s Manual
Page 47

You can set preferences for Personal DaqView through the Preferences dialog box found under the View
pull-down menu of the Main Control Window.
General − Allows you to select “untitled” or “pDaq” configurations for the default filename used by
Personal Daq. Note that Personal DaqView automatically loads the last saved configuration file. The
second part of the General screen pertains to configuration file settings.
Measurement Units
Window’s spreadsheet. Note that scale and offset automatically reset to a pre-designated default according
to the unit selected.
Note: Changing the measurement unit defaults does not immediately affect the Channel Configuration
Window’s spreadsheet columns. For example: If you set your voltage default to µV, but the
channels are set with V units, they will retain the V units. However, changing these channels to
temperature, then back to voltage would result in the default units (µV) and the associated scale &
offset. The new default units are also applied to all channels when a new configuration file is
created.
Acquire
Arm Arms the trigger and stores acquisition data to a designated disk file. If Auto Rearm is
Disarm Disarms and stops the data acquisition.
Manual Trigger Used to trigger the device when the mode of trigger is set to “Manual.” Note that the
Device
Update Digital Outputs Updates digital output channels, regardless of whether their output state is closed or
Save Power-up Settings
− Allows you to set the desired default units for the Channel Configuration
selected, activating this funtion will put Auto rearm into effect.
Manual Trigger can not be activated until after the trigger has been armed.
opened (see page 4-14).
Saves power-up state settings of Personal Daq’s internal switches (see page 4-14).
Tools
Convert Binary Data …
View Data
Indicators
Start All Indicators Starts all on-screen indicators with a display of up-to-date data. Has no affect on the
Stop All Indicators Stops all indicators. Has no affect on the recording of data to disk.
Analog Meters Brings up the analog dial-type meters.
Bar Graph Meters Brings up the bar graph type meters.
Chart Display Brings up the scrolling chart.
Digital Meters Brings up the digital style meters.
The Convert Binary Data menu option allows you to convert raw binary data (*.bin files)
into other formats that you may find more useful. You must first select an existing binary
file to be converted. The filename can be typed in or selected by the Browse button that
leads to a folder/file search window. After a file is selected (or multiple files), you can
toggle check-boxes on/off for each format type. When ready to begin the conversion,
select the Convert button and set up the destination folder/filename.
Data collected can be uploaded to your PC’s hard disk in any or all of several data
formats for post-acquisition analysis. Some of the available file formats include Snap
Master, DADiSP, Matlab, and ASCII (Excel) which is compatible with most software for
analysis.
Launches an independent post-data acquisition program such as eZ-PostView.
Refer to the Post Acquisition Analysis PDF (included on your CD) for detailed
information.
recording of data to disk. Auto Rearm, even if selected, will not occur when using this
control.
Personal Daq User’s Manual 989394 Personal DaqView 4-5
Page 48

Help
Contents and Index Accesses the program’s Help file. Contents include:
About Personal DaqView Provides the program’s software version number.
Introduction
Setting Up Personal DaqView
Taking an Acquisition
Viewing Your Data
Frequently Asked Questions
Troubleshooting
Channel Configuration Window
You can bring up the Channel Configuration Window by using the Configure Channel Settings button (9)
on the Main Control Window toolbar, or by selecting Channel Configuration from the Main Control
Window’s View pull-down menu.
The Channel Configuration Window contains a Control pull-down menu and a 2-button toolbar. The
window displays any one of three tabbed spreadsheets for selecting the type of channel to be configured.
The tabs are labeled Analog Input, Frequency/Pulse Input, and Digital Input/Output.
Channel Configuration Window, Selected for Analog Input Spreadsheet
Channel Configuration Window Toolbar
The Channel Configuration Window consists of two buttons (items 16 and 17) as identified by the previous
figure and the following table.
Button Function
16 Enable Readings
Column
17 Disable Readings
Column
Activates the Channel Configuration Window’s reading column. Does not affect the
recording of data to disk.
Stops the Channel Configuration Window’s reading column. Does not affect the
recording of data to disk.
Channel Configuration Window Pull-down Menu
The channel configuration window contains one pull-down menu labeled, Control. This menu provides a
means of enabling and disabling the readings column, as do toolbar items (16 and 17).
4-6 Personal DaqView
989394 Personal Daq User’s Manual
Page 49

Common Spreadsheet Columns
The Channel Configuration Window, regardless of which tab is active, consists of a spreadsheet designed
for the acquisition of a specific type of data (i.e., analog, frequency, digital). Depending on the column,
you can make changes to the information contained in a cell by placing the mouse cursor in the cell and
then using the applicable mouse-button methods as follows:
• “Single-click” with the left mouse button to open an associated pull-down list for the applicable cell, from
which a selection can be made. This pull-down list appears just below the toolbar.
• “Double-click” with the left mouse button to cycle through listed selections or write-enable a cell, as
applicable. If the cell has a given parameter list (such as those in the On, Range, and Measurement Duration
columns) the parameter will change with each double-click, allowing you to cycle through all possible
selections. Note that these selections are repetitive; in other words, you will eventually advance to the same
selection you started with. “Type-in” cells (such as User Label, Scale, and Offset) can be selected on doubleclick for easy editing.
• “Single-click” left, then “Single-click” right to write-enable a cell. Completing this action with the mouse
buttons (while having the cursor on a cell such as Scale or Offset) allows you to use you PC’s keypad to type
the desired value into the field.
• “Single-click” left, “single-click” right, then “single-click” left again to open an associated pull-down list
for the applicable cell, from which a selection can be made. This pull-down list appears in the selected cell’s
row.
Note: Although each type of channel configuration spreadsheet (analog, frequency, and digital) is
discussed separately, the common columns are presented in this section to avoid redundancy.
Note: You can use your PC’s keypad arrow keys to select new “active cells” in the spreadsheet.
Physical Channel ⎯ automatically identifies the Personal Daq device and channel. The user cannot
change the "Physical Channel" nomenclature. A few examples are:
PD1_A01 - Personal Daq unit 1, Analog Input channel 1 --- a differential channel
PD1_A02L - Personal Daq unit 1, Analog Input channel 2, Low --- a single-ended channel, low end
PD1_A02H - Personal Daq unit 1, Analog Input channel 2, High --- a single-ended channel, high end
PD2_F1 - Personal Daq unit 2, Frequency/pulse channel 1
PD1_D05 - Personal Daq unit 1, Digital channel 5
User Label ⎯ provides a means of identifying the channel by a user-defined descriptive name. If no
name is specified, the program uses the physical channel name as a default. The user label appears in the
trigger and chart selection lists, discussed later in this manual. You can chang e the user label to any
alphanumeric designation, providing each label is unique (channel-specific).
On ⎯ allows you to enable a channel for data collection. When a cell or block of cells in this column is
selected, a selection box will appear that allows “On” to enable or “Off” to disable the channel. Doubleclicking a cell in this column toggles the channel’s enable status.
Reading ⎯ displays scanning device input readings. The column is activated when the acquisition device
is triggered. The column’s values are real-time channel values from the instrument and cannot be altered
by the user. This column will update the readings as fast as the computer will allow.
Note: If you re-size the readings column such that it becomes too narrow for all digits to be displayed,
you may misinterpret the reading. For example, since the left-most digits will be lost from view
first, a reading of 8.388118 V could look like 8118 V (with the most significant didgits of 3.38
no longer visible).
Scale & Offset ⎯ The scale/offset feature applies to Analog Input and Frequency/Pulse Input
spreadsheets. This feature allows you to alter the default linear (mx + b) transfer function. These types of
alterations can be useful in special applications. An example follows shortly.
To change scale or offset values from default: use the mouse to select the spreadsheet cell (of the
applicable channel’s scale or offset), type in the desired value, and hit the enter key of your keypad. Note
that the scale is the linear relation to the input, sometimes referred to as m. Offset is plus or minus from
zero, the "b" of the mx + b linear equation.
Note: The reading and range columns will change automatically according to the new scale/offset values.
The following examples illustrate possible uses of the scale/offset feature.
Personal Daq User’s Manual 989394 Personal DaqView 4-7
Page 50

Engineering Units Conversion Using mx + b
Most of our data acquisition products allow the user to convert a raw signal input (for example, one that is
in volts) to a value that is in engineering units (for example, pressure in psi). The products accomplish this
by allowing the user to enter scale and offset numbers for each input channel, using the software associated
with the product. Then the software uses these numbers to convert the raw signals into engineering units
using the following “mx + b” equation:
Engineering Units = m(Raw Signal) + b (1)
The user must, however, determine the proper values of scale (m) and offset (b) for the application in
question. To do the calculation, the user needs to identify two known values: (1) the raw signal values, and
(2) the engineering units that correspond to the raw signal values. After this, the scale and offset
parameters can be calculated by solving two equations for the two unknowns. This method is made clear
by the following example.
Example 1
An engineer has a pressure transducer that produces a voltage output of 10.5 volts when the measured
pressure is 3200 psi. The same transducer produces an output of 0.5 volt when the pressure is 0 psi.
Knowing these facts, m and b are calculated as follows.
:
A - Write a pair of equations, representing the two known points:
3200 = m(10.5) + b (2)
0 = m(0.5) + b (3)
B - Solve for m by first subtracting each element in equation (3) from equation (2):
3200 - 0 = m(10.5 – 0.5) + (b - b) (4)
Simplifying gives you: 3200 = m(10) (5)
This means: m = 320 (6)
C - Substitute the value for m into equation (3) to determine the value for b:
0 = 320 (0.5) + b (7)
So: b = - 160 (8)
Now it is possible to rewrite the general equation (1) using the specific values for m and b that we just
determined:
Engineering Units = 320(Raw Signal) - 160 (9)
The user can then enter the values of m and b into the appr opriate location using the facilities provided by
compatible data acquisition software, for example: WaveView, DaqView, Personal DaqView, LogView,
and TempView. The software uses equation (9) to calculate signal values in engineering units from that
point on.
4-8 Personal DaqView
989394 Personal Daq User’s Manual
Page 51

Example 2:
A Personal Daq user knows that a linear relationship exists between the voltage output at "Point A" and the
voltage output at "Point B" in a certain electrical device. The linear relationship is constant. The user
wants to monitor the voltage at "Point B," however; it is inconvenient to connect signal lines in that section
of the apparatus.
The user realizes he can take the reading at "Point A" and use the mx + b equation to solve for
"Point B." In this example, B
= 1.2x + 0.75 Volts, where B
Volts
is the voltage at "Point B" and
volts
x is the voltage at "Point A."
After his acquisition was configured, the user performed the following steps to allow
Personal DaqView to calculate and display B
1. Left-clicked/right-clicked on the units cell for PD1_A01, typed in
Volts
.
B:Volts, and hit the
keyboard’s Enter key.
2. Left-clicked/right-clicked on the Scale cell for PD1_A01, typed
1.2 for the Scale, and hit
the keyboard's Enter key.
3. Left-clicked/right-clicked on the Offset cell for PD1_A01, typed
0.75 for the Offset, and
hit the keyboard's Enter key.
4. Used channel PD1_A01 to acquire voltage readings which represented the voltage at
"Point B" (B:Volts).
5. Selected the Digital Meters button (14) on the Main Control Window’s toolbar and
configured the meter to display readings for PD1_A01 (B:Volts) and PD1_A02.
6. Clicked the Update All Indicators button (10) on the Main Control Window’s toolbar and
monitored the readings.
PD1_A01 B:Volts Readings resulting from use of the Scale/Offset Feature.
In this example B:Volts is being displayed on the Analog Input Spreadsheet and in a Digital Meter.
Personal Daq User’s Manual 989394 Personal DaqView 4-9
Page 52

Analog Input Spreadsheet
The Analog Input spreadsheet allows you to configure analog input channels. Each row shows a single
channel and its configuration. The following text provides more detail regarding the channel configuration
parameters for Analog Input.
Note that columns labeled Physical Channel, User Label, On/Off, Reading, Scale, and Offset are discussed
in the immediately preceding section, Common Spreadsheet Columns.
Channel Configuration Window, Selected for Analog Input Spreadsheet
Range ⎯ Displays the range and provides access to a pull-down list of available voltage ranges, as well
as a list of available thermocouple types. In addition to voltage, analog input can be selected for
thermocouple types J, K, T, E, R, S, B, and N. Note that the range and units columns are interrelated. For
example, selecting a thermocouple from the range list will automatically bring up the default unit indicated
in Preferences, Measurement Units in the View pull-down menu.
Units ⎯ Displays units and allows the user to key-in different units when the cell is selected. Units may
be V, mV, uV, or created special by the user (as in the B:volts example, page 4-9). In addition, when a
thermocouple type is selected from the range pull-down list, units of °C, °F, °K, or °R are possible. (Also
see Scale & Offset, page 4-7).
Single-ended/Differential ⎯ Identifies the channel mode as single-ended or differential and is used to
change the mode configuration. When changing from differential to single-ended mode, a new channel
row is added, as well as a new default label. For example: Changing the mode of channel PD_1A01
(Personal Daq Unit 1, Analog Channel 01) from differential to single-ended results in two channels with
default Physical Channel labels and User Labels of PD_1A01L and PD_1A01H.
Single-ended inputs are typically used with signals that share the same common low (COM) such as
multiple batteries which have their negative sides connected in common. For Personal Daq applications,
the single-ended mode is not to be used for thermocouples.
Differential inputs are required when signals do not share the same common low, such as in the typical use
of thermocouples. A simple example showing two single-ended inputs (V1 and V2) and a differential
input (V3) follows.
Note that V1, V2 and V3 (from the following figure), correspond with the first three channels on the
previous screen shot. In the screen capture, V1 and V2 are shown to have “V” for units and are singleended. V3 a thermocouple with units of °C and is shown to be Differential.
4-10 Personal DaqView
989394 Personal Daq User’s Manual
Page 53

Single-Ended and Differential Connections to Analog Inputs
In Personal Daq applications, thermocouples should not be connected single-ended. Doing
so can result in noise and false readings. This is especially true when acquiring other highamplitude signals in conjunction with thermocouple signals that are connected single-ended.
Measurement Duration Column
signal. The measurement durations range from very slow (610 milliseconds/sample) to very fast
(12.5 milliseconds/sample). Some related terms are defined as follows:
Sample rate – Samples per second. The sample rate is the number of samples that take place per second.
With a slow measurement duration of 610 milliseconds, there will only be 1.6 samples per second. With a
very fast measurement duration of 12.5 milliseconds, there will be 80 samples per second.
Resolution (Bit RMS) – The number of reliable data bits that exist for a signal’s measurement. The greater
the resolution, the more detailed the reading, for example, with increased resolution a reading of 5.12 V
could become 5.11896 V. Personal Daq actually provides for 24 bits of data information; however, the
accuracy of the least significant bits becomes less as the measurement duration speeds up. At a
measurement duration of 610 milliseconds, the last two bits are considered unreliable, resulting in a
resolution of 22 bits. At a very fast measurement duration (12.5 milliseconds), the nine least significant
bits are unreliable, resulting in 15 bit accuracy.
⎯ Indicates the amount of time used for sampling a channel’s input
Speed vs. Resolution1
Speed Designation Measurement
Duration
(Scan Period)
Very Slow, 50 / 60 Hz rejection 610 ms 1.6 / sec 22
Slow, 50 Hz rejection 370 ms 2.7 / sec 22
Slow, 60 Hz rejection 310 ms 3.2 / sec 22
Medium, 50 Hz rejection 130 ms 7.7 / sec 21
Medium, 60 Hz rejection 110 ms 9.2 / sec 21
Medium 40 ms 25 / sec 19
Fast 20 ms 48 / sec 17
Very Fast 12.5 ms 80 / sec 15
Notes:
Personal Daq User’s Manual 989394 Personal DaqView 4-11
1. Each channel can have independent measurement speed and resolution.
2. The sample rates shown were obtained with continuous self-calibration disabled.
The table values do not include the use of CJC measurements.
Maximum
Sample Rate
(Samples/sec)
2
Resolution
(Bits RMS)
(-4 V to +4 V range)
Page 54

When you select the measurement duration you also determine the maximum sample rate and resolution
for the applicable channel. For Personal Daq’s analog input applications, sample rates range from 1.6
samples/sec up to 80 samples/sec and corresponding resolution ranges from 22 to 15 bits.
The following table provides general advice regarding the selection of measurement duration.
Analog Input Signal
Variability
Steady, or gradual
change
Highly variable
(unsteady)
Measurement
Duration
long low high
short high low
Sample
Rate
Resolution
Frequency/Pulse Input Spreadsheet [Does not apply to Personal Daq/54]
The Frequency/Pulse Input spreadsheet allows you to configure the related channels. Each row shows a
single channel and its configuration. Additional information regarding frequency measurement is included
in the Help file.
Channel Configuration Window, Selected for Frequency/Pulse Input Spreadsheet
The following text provides more detail regarding the frequency/pulse channel configuration parameters.
Note that columns labeled Physical Channel, User Label, On/Off, Reading, Scale, and Offset are discussed
in the section, Common Spreadsheet Columns.
Type ⎯ A block of cells in this column can be selected for convenience of single type selection, where
type can be Frequency, Totalize, Pulses per Scan, or Duty Cycle (% High or % Low). The selected type
determines the default units.
Units ⎯ Frequency type units can be Hz or kHz. Totalize and Pulses per Scan type units are Pulses; and
Duty Cycle
Main Control Windows’s View pull-down menu.
(% High and % Low) type units are %. Default units are set in the Preferences section of the
Edge ⎯ Readings for Frequency, Totalize, and Pulses per Scan are based on successive rising [or falling]
edges of the input signal, and on the time lapse between these signal edges (see Debounce). Each
channel’s edge selection is independent of the others, i.e.; you can have some channels selected for rising
edge while others are selected for falling edge.
Note: Depending on the application, one edge type (rising or falling) may be electronically cleaner
than the other.
Note: As indicated in the following text and figure, some edges are insignificant and can be ignored.
4-12 Personal DaqView
989394 Personal Daq User’s Manual
Page 55

Debounce ⎯ Debouncing is a process of ignoring signals which are considered as too short in duration to
be real events. Personal Daq's debounce circuit ignores two types of edge signal events: 1) rising edges
that are not preceded by a sustained low signal, and 2) falling edges that are not preceded by a sustained
high signal. The interval can be independently set for each channel to a value of 0, 0.8, 3.2, or 13 ms. You
can select 0 ms to disable debouncing for clean high-frequency signals. Note that long debounce times will
limit high-frequency response. For example, a 13 ms debounce will limit frequency to about 50 Hz.
The following figure shows the effect of 13 ms debouncing on a noisy signal. To be counted, a rising edge
must be preceded by a sustained low signal for at least 13 ms without any other edges [a falling edge must
be preceded by a sustained high signal for at least 13 ms without any other edges]. (See following figure).
Sustained Lows and Rising Edges… "Bouncy" Input compared with Debounced Output
In the this example of “bouncy” input, edge was selected for rising and debounce was selected for 13 ms.
Rising edges a and f are counted because they are preceded by low signal levels sustained for at least 13
ms (the debounce time). All other rising edges (b, c, d, and e) are ignored.
Min Value ⎯ For Frequency, Pulses/scan, and Totalize, defines the minimum range value (lower range
limit) for the charted signal. The value is applicable to charts in Personal DaqView and PostView.
Max Value ⎯ For Frequency, Pulses/scan, and Totalize, defines the maximum range value (upper range
limit) for the charted signal. The value is applicable to charts in Personal DaqView and PostView.
Resolution and Settling Time
Frequency measurements on the Personal Daq are achieved by querying the unit for a current time and
pulse count on a repetitive basis. Aside from edge and debounce settings, two values are used to set up
frequency input; Maximum Frequency (
values have units of Hertz.
The Acquisition Period (AcqPeriod) is calculated from these values. AcqPeriod is the minimum length of
time needed to get a reading at the desired resolution.
However, if the requested scan period for the entire scan (of which the frequency channels are a part) is
longer than the calculated AcqPeriod, then the scan period becomes the acquisition period.
To put bounding limits on values so measurements can be done in a timely fashion, the
10 seconds. This means: Fmax / Mreso <25,000,000.
<
Frequency measurement on the Personal Daq is only done when collecting scans. Values are updated on
every scan even if the
count is read from the Personal Daq.
AcqPeriod (in seconds) = Fmax * (0.0000004 / Mreso)
Fmax) and Measurement Resolution (Mreso). Both of these
AcqPeriod must be
AcqPeriod has not been reached. During each scan a current pulse count and timer
Personal Daq User’s Manual 989394 Personal DaqView 4-13
Page 56

The frequency is calculated as follows:
1) An estimated frequency (
• If there were no pulses read;
Fest) is calculated as follows:
Fest = Flast (the last frequency reported) or, Fest = 1 / current time
(whichever is smaller)
• If there were pulses counted then; Fest = counted pulses / current time
2) The actual reported frequency (Frep) is calculated as follows:
• If current time <AcqPeriod then;
Frep = [ [ Flast * (AcqPeriod - current time) ] + (Fest * current time) ] / [ AcqPeriod ]
• Otherwise; Frep = Fest
Note: Current Time is the elapsed time from the start of a frequency measurement and is reset each time
AcqPeriod is reached.
the
Digital Input/Output Spreadsheet [Does not apply to Personal Daq/54]
The Digital Input/Output spreadsheet allows you to configure and monitor the related digital channels.
Each row shows a single channel and its configuration.
Channel Configuration Window, Selected for Digital Input/Output Spreadsheet
The following text provides more detail regarding the Digital Input/Output channel configuration
parameters. Note that columns labeled Physical Channel, User Label, On, and Reading are discussed in the
section, Common Spreadsheet Columns (page 4-7). The Scale and Offset feature does not apply to digital
channels.
Input/Output Column ⎯ This column identifies the digital channel mode as input or output, and is
used to select the desired mode.
Output State Column ⎯ When the output mode is selected, Personal Daq's physical internal switch
closes to ground. This 0 (Closed) switch position is the output state’s default setting. 0 (Closed) is
typically used for digital output logic applications, where logic output is low (0). In this state, digital
output is closed to ground.
When the digital output will be used to switch an external load, such as a relay, the output may be up to
+5V (hi) and Personal Daq’s internal switch should be set to 1 (Open). In this use of the digital output, the
circuit is not closed to ground.
Note that since the reading column is for input values, the applicable reading cell is shaded-out when
"output state" is selected.
4-14 Personal DaqView
989394 Personal Daq User’s Manual
Page 57

When an active (On) channel is selected to “Output State” the Update Digital Outputs button (on the
Main Control Window) becomes active. This button is used to update the digital output channels,
regardless of whether their output state is closed (0) or open (1).
Note: The update of changed output settings will not actually take place until the Update Digital Outputs
button is pressed. After selecting the digital output channels to the desired state (open or closed),
click on the Update Digital Outputs button to actually set the indicated output states.
Power-Up State Column ⎯ This column allows you to set Personal Daq’s physical internal switches to
be open or closed during power-up, on a per channel basis. After setting the state you can save them
internal to the device by opening the Main Control Window’s Device pull-down menu and selecting “Save
power-up settings.” When the device is unplugged or losses power, its internal switches will reset to the
“saved” power-up settings.
Note: Saved power-up settings are internal to the Personal Daq device and are not retained by the
Personal DaqView software. If a device is removed from the PC and a different one is attached,
the new device will have its own power-up settings (default or pre-saved), but will not likely have
the same settings as the device which was just removed.
For enabled channels, Personal Daq’s digital I/O output state settings will change from their power-up
state designations after the device has been powered up. The changes take place as follows:
• For en abled digital Input channels
needed, to match the configuration set in the software.
• For en abled digital Output channels
indicated output state (displayed in the Output State column). When you change an output state you
must click on the Update Digital Outputs button before the output state actually changes.
Configure Acquisition Dialog Box
Note: Parameters can not be altered while the acquisition is in progress.
The information entered in the Configure Acquisition dialog box is used by the Arm Acquisition command
to set up the acquisition of data to disk. When the trigger is satisfied, the scans are collected at the selected
scan frequency and stored to disk in the designated file, as indicated in the Data Destination window. Data
Destination is discussed on page 4-18.
You can access the Configure Acquisition dialog box by using the Configure Acquisition button (icon with
the image of three slide-bars). This button is located on the toolbar the Main Control Window.
The Configure Acquisition dialog box contains three tabs: Pre-Trigger, Trigger, and Post-Trigger. When
first opened, the dialog box defaults to the Trigger tab selection. In addition to the trigger-related aspect,
the dialog box contains two other sections. These are labeled “Averaging” and “Acquisition Parameters.”
- starting an acquisition will change the digital input channel, if
- clicking on the Update Digital Outputs button will sets the
Personal Daq User’s Manual 989394 Personal DaqView 4-15
Page 58

i
gg
The Trigger Section
The following figure depicts the parts that make up an acquisition. Together, the pre-trigger and
post-trigger make up a trigger block.
Pre-trigger Post-trigger time
By duration or number of scans by duration, number of scans,
or manual stop
Trigger Stop Event
Tr
er Block
Averaging
Configure Acquisition
As can be seen in the previous figure, it is relatively simple to configure an acquisition. Tabs allow you to
select each of the three trigger aspects (Trigger, Pre-Trigger, and Post-Trigger) for configuration.
The “Averaging” section of the dialog box is used to enable a block averaging mode and to select the size
of the scan block. Block averaging is enabled by using the Type list box (available selections are None or
Block Averaging). Averaging is available in scan blocks of 2, 4, 8, 16, and 32. The block number is
chosen from the Count pull-down list. When enabled, the selected block averaging is applied to each of
the scan group’s analog input channels. Note that programmers can enable averaging via the
daqAdcSetFilter function with filterType set to DaftSWAvg. For additional information you can refer
daqAdcSetFilter in Appendix B.
to
4-16 Personal DaqView
989394 Personal Daq User’s Manual
Page 59

Acquisition Parameters
The lower section of the Configure Acquisition box is used for adjusting the scan rate, as well as enabling
or disabling Continuous Calibration and Overrange Protection modes. Each of these categories is
discussed below.
Scan Rate, Period, and Frequency
The lower region of the dialog box displays the maximum scan rate and the actual scan rate. This section
of the dialog box allows you to set the scan timing, i.e., the rate at which Personal DaqView takes readings.
It can be set to a frequency (number of scans per second) or period (the time length of one scan) value.
The maximum scan rate depends on the channel configuration and is displayed in the configure acquisition
window. It is determined by the number of enabled channels and their measurement duration.
To get the highest scan rate possible:
These steps can be performed from the Channel Configuration Window (when selected for Analog Input
Spreadsheet). Setting the highest possible scan rate inversly affects the resolution of your analog channel
readings. When setting the scan rate, it is important to be aware of various issues that arise with a lo w scan
rate. Among these are under sampling and aliasing.
Note: The scan period can only change by increments of 1 msec. If you enter an invalid value,
Personal DaqView will automatically convert your entry to the nearest acceptable value.
Note: Aliasing errors can result from having a scan rate that is too low (under sampling).
• turn off all unused channels
• set the measurement duration to its lowest setting on all analog channels
Continuous Calibration
The continuous calibration option is useful in applications that make use of very long acquisitions periods.
When the continuous calibration box is checked (9), Personal DaqView continuously calibrates the unit
while the acquisition is in progress. Although this provides greater reading accuracy, it can result in a
lowering of the maximum scan rate. For this reason the continuous calibration option has a default setting
of disabled (unchecked).
Overrange Protection
By default, the overrange protection option is enabled. This is because certain ranges are slow to recover
from overload conditions. It should be noted that the slow recovery does not indicate any problem with the
unit; however, if there is such an overload on a channel, erroneous read ings on other channels may occur.
If your application presents the possibility of a channel overload, then you should keep the overrange
protection function enabled (9). If using a custom application, use the
option-type setting with the
daqSetOption).
daqSetOption API (see Appendix B for additional information regarding
DcotpDaqOverrangeProtect
Personal Daq User’s Manual 989394 Personal DaqView 4-17
Page 60

Configure Data Destination and File Converter Preferences
Conversion of eZ-PostView, eZ-TimeView, or eZ-FrequencyView files is automatic. The file
converter can be used to convert other data formats.
Note that PostView is not related to eZ-PostView.
The Configure Data Destination dialog box can be accessed from the View pull-down menu, or by using
the Configure Data Destination toolbar button (depicted in the upper left-hand corner of the following
figure). The button is located in the toolbar of the Main Control Window.
Configure Data Destination
File Converter Preferences
(Accessed via the <Conversion Formats> button)
A breakdown of the dialog box follows.
− The “Folder” text box determines the file’s destination folder.
Folder
File
− The “File” text box identifies the file by name and raw binary extension (.BIN). Note that these
filenames must have a raw binary (.BIN) extension. If you omit the extension, Personal DaqView will add
it to the filename.
Browse
Conversion Formats
− Used to browse existing folders and filenames.
– This button is used to access the File Converter Preferences dialog box. This box
provides a means of saving files in a variety of formats, including, but not limited to: DIAdem (.R32),
ASCII (.TXT), DADiSP (.DAT), DASYLab (.DDF), and PostView Binary (.IOT) formats. The File
Converter also allows you to add timestamps to the ASCII Text files.
4-18 Personal DaqView
Note: If you plan to use PostView, it is important that PostView Binary and/or ASCII is selected.
Note: Parameters can not be altered while the acquisition is in progress.
Note: The file’s data format is selected in the View pull-down menu (of the Main Control Window),
under Preferences, Data Convert. DIAdem (.R32) is selected by default. If you want to use
PostView to view your data Ensure ASCII (.TXT) or PostView Binary (.IOT) is selected.
989394 Personal Daq User’s Manual
Page 61

You can select Convert Binary Data from the Tools pull-down menu to bring up the following dialog box.
This allows you to select a file for conversion. The Formats button accesses the File Converter
Preferences Dialog Box.
The Select Files to Convert Dialog Box
[Accessed from the Tools Pull-down Menu]
Sequential Destinations (Auto Rearm)
The right-hand portion of the Configure Data Destination dialog box is used to activate a Sequential
Destinations (Auto Rearm) feature. This feature allows for a large number of acquisitions to take place
automatically, with each using the same configuration settings. With this feature, as soon as a trigger block
is terminated the acquisition system immediately re-arms and waits for the trigger to be satisfied.
To use Auto Rearm:
1. Set your file conversion preferences.
2. Verify that the Acquisition is configured as desired.
3. Ensure Post-trigger is set to stop on a duration.
4. Check the Auto Rearm box [located on the right-hand side of
the Configure Data Destination box].
5. Enter the starting and ending index values for the files.
6. Select OK.
7. Start recording data to disk.
When the acquisition is complete, automatic rearm will occur and
the next sequential file will be recorded to disk. The acquisitions
will stop once all files (from the starting to ending index,
inclusive) have been recorded.
Setting Auto Rearm
Why use Auto Rearm?
Auto Rearm is a convenient way to monitor and analyze specific types of trigger events. For example, you
could set PD1_A01 going above 30°C as a trigger, set a post-trigger duration of one hour, and then use
Auto Rearm to have an additional 99 acquisitions with this same trigger criteria (PD1_A01 > 30°C and
post-trigger of one-hour). Each of the data acquisitions will occur automatically with no need to recreate
the acquisition setup or restart the acquisition.
Disabling Auto Rearm
To disable Auto Rearm simply deselect the feature. Note that deselected is the default setting of the
Auto Rearm function.
Personal Daq User’s Manual 989394 Personal DaqView 4-19
Page 62

Bar Graph, Analog, and Digital Meters
This section pertains to channel data display screens (windows, or dialog boxes) which are often referred to
as DaqMeters. In Personal DaqView, the meters are accessed from the Main Control Window’s toolbar or
Main Control Window’s Indicators pull-down menu.
It is important to realize that for each type of meter discussed, the meter channels selected are independent
of the group chart assignments, and of the assignments for the other meters.
Note that when using meters, placing the mouse pointer over an item and then hitting Ctrl+F1 (on th e
keyboard) will cause a help statement to appear for that item, if such a statement is available.
Meter Toolbars
The toolbars for the three meter-types are identical, with exception that the Digital Meters toolbar does not
have a Reset Peak Hold button (item C in the following figure).
Meters Toolbar Buttons
Item Label Function
A
B
C
D
E
F
G
Start Activates the meter. Does not affect the recording of data to disk.
Stop Stops the meter. Does not affect the recording of data to disk.
Reset Peak Hold Resets the floating markers, which indicate high and low reading peaks. Upon
Stay on Top Locks or unlocks the meter’s position. When locked, the meter will appear on top
Print Sends the meter display image to connected printer.
Rows x Columns Opens a small menu with “row x column” arrangement options. Example: When
Select the number of
Meters to display
reset, the markers will instantly adjust to indicate the highest and lowest values
reached since the time of the reset.
This feature does not apply to the Digital Meters.
of other windows and will retain the "on top" relationship.
the number of meters is 6 the grid options will be: 6
the first number being the number of rows. If you then select 3
rows of meters with 2 meters per row.
Specifies the number of meters to appear on the screen.
A maximum number of 32 meters can be selected.
x1, 3x2, 2x3, and 2x4 with
x2 you will have 3
4-20 Personal DaqView
989394 Personal Daq User’s Manual
Page 63

Meter Pull-Down Menus
The meter windows each have Control and View pull-down menus, as indicated by the following figure.
The functions of these menus can also be implemented by using the meter toolbar buttons.
Meter Pull-Down Menu Options
Meters Configuration Menu
A meters configuration menu (lower left corner of following figure) will appear when you place the mouse
pointer over a meter and click the right-hand mouse button. The menu allows you to access various dialog
boxes for changing parameters for an individual meter, or simultaneously for a group of meters. The steps
for configuring a meter are detailed below.
Note: The Show Peak Hold Indicator / Reset Peak Hold Indicator selections are not an option for Digital
Meters and do not appear on the configuration window for digital meters.
Note: When the Misc., Scale, or Limits dialog box is active, clicking on the "More>>" button causes a
meters extension area to be displayed. This allows you to extend the assigned meter characteristics
to additional meters of the same type. An example of the meters extension box is shown in the
upper right corner of the following figure.
Meter Configuration Menu and Related Dialog Boxes
Personal Daq User’s Manual 989394 Personal DaqView 4-21
Page 64

Configuring a Meter
1. Bring up the desired meter group (Bar Graph, Analog, or Digital).
2. Place the mouse cursor over the meter, which you desire to reconfigure.
3. Click on the right mouse button. A Meters Configuration Menu, similar to that in the above previous
figure, will appear.
Note: The Show Peak Hold Indicator / Reset Peak Hold Indicator selections are not an option for Digital
Meters and do not appear on the configuration window for digital meters.
4. Select the desired option from the meter configuration menu.
5. If a dialog box is required, for example, to change a limit, simply enter in the new value in the appropriate
parameter box and press “Apply” or “OK.” Pressing “Apply” implements your changes, but keeps the
dialog box open, allowing you to make additional changes. Pressing “OK” implements your changes and
closes the dialog box.
Note: If you desire to give two or more meters the same attributes you can click on the "More>>" button
to activate the meters extension box, then highlight the meters for which you want the attributes to
apply. This feature only applies to meters that are of the same type; for example, meter attributes
of a Bar Graph Meter will not carry over to attributes of an Analog or Digital Meter.
The preceding figure and following table serve as a quick reference to meters configuration.
Configure Meter Settings, Function Descriptions
Function Description
1 Select Channel
2 Set Scale
3 Show Peak
Hold Indicators
Reset Peak
Hold
4 Show Trend
Indicator
5 Set Limits
Show Limits
6 Properties
7 More>> The More>> button brings up a meters extension box. This allows you to select
Select a new channel for display. The selected channel will replace the one
currently seen in the meter. Note that double-clicking the left mouse button in the
meter region will also bring up a dialog box, which allows you to select a new
channel.
Set the high and low points of the scale, as well as define the decimal place format.
See following figure.
Places high and low uni-directional floating markers on the scale to indicate the
highest and lowest values reached up to the present time. This feature does not
apply to the Digital Meters selection. (See following figure).
Resets the floating markers. Upon reset, the markers will instantly adjust to indicate
the highest and lowest values reached since the time of the reset. This feature
does not apply to the Digital Meters selection. (See following figure).
Displays a pointer to indicate the direction of the trend. Note that during rapid meter
fluctuations the increase and decrease pointers will appear to blink simultaneously.
(See following figure).
Provides a way of establishing high and low limit set points.
Displays limits by adding color (red for high, blue for low) to the scale regions, which
equal and exceed the set limit values. For Digital Meters: reaching or exceeding the
high limit is indicated by red numbers and an upper red bar; reaching or exceeding
the low limit (in the negative direction) is indicated by blue numbers and a lower blue
bar. In addition, for Bar Graphs the indicator tip turns red for high limits and blue for
low limit conditions. For Analog Meters the dial arm’s pivot point displays red or blue
to indicate high or low limit (respectively).
Allows setting and showing limits, as well as opening the Scale dialog box.
several channels for which you want to assign the same meter attributes. Without
this feature each meter would have to be adjusted individually. This feature only
applies to meters that are of the same type; e.g., meter attributes of a Bar Graph
Meter will not carry over to attributes of an Analog or Digital Meter.
4-22 Personal DaqView
989394 Personal Daq User’s Manual
Page 65

Configure Meter Settings, Function Descriptions
Note 1: Bar Graph Meter with
indicator rising in the high limit.
Meter tip is red to indicate “value is
above high limit.”
Note 2: Analog Meter with
indicator rising in the high limit.
Pivot point of dial arm is red to
indicate “value is above high limit.”
Note 3: Digital Meter with rising
value in the high limit. The digital
readout is red (and has a red line
above it) to indicate “value is
above high limit.”
Each of the meters (shown in the
figure) shows a trend indicator
pointing in the increase direction.
The Bar Graph and Analog Meters
also show low and high peak hold
indicators (at the 0 and 100
marks).
Three Meters with High and Low Limits Set
Be aware that the acquisition of data-to-disk has a higher priority then the updating of Charts, Meters, and
the Reading column. Therefore, data is displayed as soon as the acquisition task is satisfied. As the scan
rate is increased, the acquisition-to-disk task will take up more processor (CPU) time and the displaying of
data will be updated as time allows. If you select a linear conversion (using the scale & offset feature) you
should expect a further impact on real time display performance. Scale & offset conversion is discussed
on page 4-7.
Personal Daq User’s Manual 989394 Personal DaqView 4-23
Page 66

Bar Graph Meters
Selecting the Bar Graph Meters (from toolbar button or Indicators pull-down menu) brings up the Bar
Graph window. This window displays several channels in bar graph format. To activate the display, select
the Start button from this window’s toolbar. At least one meter must be assigned to an active (On)
channel. You can select to view up to 32 meters at a given time.
Bargraph Meters, Shown with 2 Meters Selected for Viewing
Note 1: Double-clicking the left mouse button in a meter scale area brings up a channel selection pop-up
menu (item H). A single click with the right mouse button in this same area brings up a configuration popup menu (item I). Both of these pop-up menus were discussed in the section, Meters Configuration Menu,
page 4-21.
The items in the above figure as follows:
A- Start
B- Stop
C- Reset Peak Hold Indicators
D- Stay on Top
E- Print
F- Rows x Columns
G- Select the number of Meters to be displayed
H- Channel Selection box (Activated by double-clicking left mouse button in a meter's scale area)
I- Configuration Pop-Up Menu (Activated with a single click of the right mouse button in a meter's
scale area)
Configuration Note: …. for Bar Graph Meters
Configure the Bar Graph meter settings by first clicking the right mouse button anywhere within the
meter display area. A pop-up menu will appear allowing you to reconfigure the meter in regard to
scale, limits, channel selection, adding peak hold indicators, etc. Refer to Meters Configuration
Menu (page 4-21) for more detail.
4-24 Personal DaqView
989394 Personal Daq User’s Manual
Page 67

Analog Meters
Selecting the Analog Meters (from toolbar button or Indicators pull-down menu) brings up the Analog
Meters window. This window displays several channels in a dial/gage format. To activate the display,
select the Start button from the toolbar. At least one meter must be assigned to an active (On) channel.
You can select to view up to 32 meters at a given time.
Analog Meters, Shown with 4 Meters Selected for Viewing
Double-clicking the left mouse button in a meters scale area brings up a channel selection pop-up menu
(see Bar Graph Meters, item H). A single-click with the right mouse button in this same area brings up a
configuration pop-up menu (see Bar Graph Meters, item I). Both of these pop-up menus are discussed in
the section, Meters Configuration Menu, page 4-21.
Note that Meter #1 (for PD1_A01 in the above figure) shows the following:
• Visible low limit region (<
32°C) and visible high limit region (> 75°C)
• Peak indicators (at 0.00 and 100.00°C)
• Trend indicator, increasing signal
The items in the above figure as follows:
A- Start
B- Stop
C- Reset Peak Hold Indicators
D- Stay on Top
E- Print
F- Rows x Columns
G- Select the number of Meters to be displayed
Note: You can activate a Channel Selection box by double-clicking left mouse button in a meter's scale
area. You can activate a Configuration Pop-Up Menu with a single click of the right mouse
button in a meter's scale area. Both of these pop-up menus are discussed in the section, Meters
Configuration Menu, page 4-21.
Configuration Note: …. for Analog Meters
Configure the Analog Meters settings by first clicking the right mouse button anywhere within the
meter display area. A pop-up menu will appear allowing you to reconfigure the meter in regard to
scale, limits, channel selection, adding peak hold indicators, etc. Refer to Meters Configuration
Menu (page 4-21) for more detail.
Personal Daq User’s Manual 989394 Personal DaqView 4-25
Page 68

Digital Meters
Selecting the Digital Meters (from toolbar button or Indicators pull-down menu) brings up the Digital
Meters window to display several channels in numeric format. To activate the display, select the Start
button from the toolbar. At least one meter must be assigned to an active (On) channel. You can select to
view up to 32 meters at a given time.
Digital Meters, Shown with 5 Meters Selected for Viewing
Note: Due to transducer and transient noises, the accuracy of voltage readings is ± 0.02%. Temperature
accuracy varies, depending on thermocouple type; with type J having ± 0.5°C for a range of
-100°C to +760°C. For your application, please refer to the proper specifications, including
thermocouple type, when applicable.
Double-clicking the left mouse button in a meters scale area brings up a channel selection pop-up menu
(see Bar Graph Meters, item H). A single-click with the right mouse button in this same area brings up a
configuration pop-up menu (see Bar Graph Meters, item I). Both of these pop-up menus are discussed in
the section, Meters Configuration Menu, page 4-21.
Note that Meter #1 (for PD1_A01 in the above figure) is displaying a trend indicator (in the increase
direction) and also shows that the reading (91.45) is in high limit region. The number 91.45 is red and
contains a red bar over it.
The items in the above figure as follows:
A- Start
B- Stop
C- n/a
D- Stay on Top
E- Print
F- Rows x Columns
G- Select the number of Meters to be displayed
Note: You can activate a Channel Selection box by double-clicking left mouse button in a meter's scale
area. You can activate a Configuration Pop-Up Menu with a single click of the right mouse
button in a meter's scale area. Both of these pop-up menus are discussed in the section, Meters
Configuration Menu, page 4-21.
Configuration Note: …. For Digital Meters
4-26 Personal DaqView
Configure the Digital Meters settings by first clicking the right mouse button anywhere within the
digital meter display area. A pop-up menu will appear allowing you to reconfigure the meter in
regard to scale, limits, channel selection, etc. Refer to the Configure Meter Settings (page 4-21 ) for
more detail.
989394 Personal Daq User’s Manual
Page 69

Chart Display
Reference Note: For your very first chart display setup, or when the configuration file
has been deleted, refer to the Chart Setup Wizard section beginning on page 4-37.
A Note Regarding Standard, Plus and XL Software Versions
Personal DaqView Plus permits the use of multiple groups with up to four overlapping channels per chart.
The standard version of Personal DaqView is limited to one group, and to one channel per chart. Another
distinction of the “Plus” version can be seen when using the Chart Setup Wizard feature. The “Plus”
version can make use of Simple, Moderate or Advanced automatic chart creation functions of the wizard;
however, the standard version is resricted to use of Simple mode. Discusssion of the Chart Setup Wizard
begins on page 4-37. If you do not have Personal Daq View Plus, but are interested in its expanded
features, please contact your service representative for detailed information. Note that Personal DaqView
Plus can only be activated by use of an authorized registration number.
Personal DaqView XL and Personal DaqView Plus XL function very much like their respective base
(Personal DaqView) programs, with exception that the XL version programs are “add-ins” to
Microsoft Excel
make use of Excel’s associated macros. Users of the XL version software (for Personal DaqView) should
refer to the document, Personal DaqViewXL User’s Guide, part number 491-0905. If you do not have the
XL version Personal DaqView software, but are interested in obtaining it, please contact your service
representative.
TM
and run from within the Excel environment. The XL version software allows you to
Groups, Charts, & Channels
Before continuing with this section, it is important that you
understand the chart display structure in terms of groups, charts
and channels.
refers to a group of charts. Note that Personal DaqView
Group
Plus allows up to 64 groups, depending on the capabilities of
your PC, but can only display one group at a time.
refers to display area, which reflects real-time channel
Chart
data values for a selected channel and can be scrolled at various
rates. You can assign up to 16 charts per group. The standard
version of Personal DaqView is limited to displaying one
channel per chart. Personal DaqView Plus can display up to
four overlapping channels per chart.
Channel
refers to a signal channel. Channels will be displayed
in units of °C, °F, °K, °R, mV, V, Hz, or kHz, depending on the
configuration.
When starting the program with no configuration file present,
Personal DaqView creates a display configuration of one group,
one chart, and one channel (the first active channel found). You
can change your chart display configuration through use of a
dialog box or Chart Setup Wizard. See pages 4-31 and 4-37
respectively.
Chart Display Window
The Chart Display Window allows you to view scrolling charts for selected channels in real time. You can
access this window by selecting the Display Scrolling Charts button (located in the toolbar of the Main
Control Window). The Chart Display window contains four Pull-down menus, a toolbar, chart region, and
channel information region.
Personal Daq User’s Manual 989394 Personal DaqView 4-27
Page 70

Personal DaqView’s Chart Display Window
Note: A discussion of the numbered buttons and regions begins on page 4-29.
Pull-Down Menus
Pull-Down Menu Function
Chart
Wizard (Ctrl+W) Opens Chart Setup Wizard for manual or automatic configuration of the chart display. Detailed
Setup (Ctrl+D) Accesses the Display Configuration Setup dialog box for normal editing of the current chart
Next Group
(Ctrl+G)
Faster (Ctrl+Z) Increases the chart scroll rate, as does the toolbar’s rabbit button.
Slower (Ctrl+X) Decreases the chart scroll rate, as does the toolbar’s turtle button.
Zoom When more than one chart is displayed, this feature allows you to zoom in on one of the
Properties
Properties Box
discussion of the Chart Setup Wizard begins on page 4-37.
display configuration. See page 4-31, Set Up Charts.
Selects the next available chart group.
charts, such that only the selected chart is displayed. From this “zoomed state” you can use
the feature to return the display to normal (Un-zoom), or to select another available chart.
Note: The Properties box is enabled in PersonalDaq’s Plus and Trial
versions only.
Grids – Turns grid lines on or off for the indicated chart.
Timestamp – Allows selection of absolute or relative timestamps; and
provides a means of turning off the timestamp.
Scroll Rate - Sometimes referred to as “chart speed.” Selects the indicated
chart’s scroll rate in “time per division.” Scroll rate can be as fast as 0.1
sec/div and as slow as 1 hour/div, with several other rates to choose
from. The rabbit and turtle buttons, and Faster (Ctrl+Z) and Slower
(Ctrl+X) commands also affect scroll rate.
Note: The rate indicated in area 18 of the Chart Display figure
[above] is the “global” scroll rate. It is not necessarily the same as
the scroll rate set in the chart’s Properties box.
Limit Lines – Allows limit lines (marking the upper and lower limits of the
chart) to be displayed as solid or dotted lines; and provides a means of
turning the limit lines off.
Acquire
4-28 Personal DaqView
Close Exits the Chart pull-down menu.
Start Charts
Display
Stop Charts
Display
Starts the scrolling chart display. Does not affect the recording of data to disk.
Stops the scrolling chart display. Does not affect the recording of data to disk.
989394 Personal Daq User’s Manual
Page 71

Note: Many of the menu functions can be achieved by using the appropriate toolbar buttons. These
Toolbar Items
View
Grid Limit Lines Used to show or hide the grid limit lines.
Grid Lines Used to show or hide the grid lines.
Timestamp
Absolute (Ctrl+F4) Selects absolute time for the timestamp.
Relative (Ctrl+F5) Selects relative time for the timestamp
Off (Ctrl+F6) Turns the timestamp off.
buttons are discussed in the following text.
Button Function
1 Group Select
2 Start Charts
3
4 5 Scroll Faster
6 Setup Charts Accesses a Display Configuration Setup dialog box. See page 4-31 for detailed
7 Chart Setup Wizard Opens Chart Setup Wizard for manual or automatic configuration of the chart display.
8 Print Chart Display Sends the displayed chart to the printer.
Display
Stop Charts
Display
Scroll Slower
Indicates the current chart group. Clicking on the down arrow (W) reveals other available
groups. To select a different chart group, simply pull down the group list and select the
desired group. The group list can be obtained by any of the control options: a) clicking
the down arrow (W), b) using Ctrl + G on the keyboard, c) using the keyboard up or down
arrow key, d) using the page up or page down key. If using a control option other than
“a,” you may need to select the group select box by repeatable pressing the keyboard’s
Tab key until the group select box is selected. When this happens, the name of the
currently selected group appears in white on a dark background.
Starts the scrolling chart display. Does not affect the recording of data to disk.
Stops the scrolling chart display. Does not affect the recording of data to disk.
Buttons 4 and 5 provide a means of changing the chart’s scroll rate (chart speed). These
two buttons do not affect the scan rates of the acquisition device. The “global” scroll rate
(chart speed) is indicated in the lower right-hand corner of the Chart Display Window as
time/div. Possible chart speeds are indicated in the table below.
Note: The “global” scroll rate is not necessarilly the same as the chart’s “actual”
scroll rate (as set in the chart’s Properties dialog box). The Properties box
is accessed through the Chart pull-down menu. The table on page 4-28
includes a screen capture.
Available Chart Speeds (Scroll Rates)
0.1 sec/div 1 sec/div 10 sec/div 2 min/div 30 min/div
0.2 sec/div 2 sec/div 30 sec/div 5 min/div 1 hr/div
0.5 sec/div 5 sec/div 1 min/div 10 min/div
information.
Detailed discussion of the Chart Setup Wizard begins on page 4-37.
Personal Daq User’s Manual 989394 Personal DaqView 4-29
Page 72

Chart and Channel Information Regions
Channels can return values in engineering units of °C, °F, °K, °R, mV, V, Hz, kHz, or user defined units.
With exception of user defined units, engineering units depend on the configuration, for example, whether
a voltage type or temperature type sensor is being used. The Channel Information Region is located on the
right-hand side of Personal DaqView’s Chart Display Window. The values displayed in this region are the
real-time values of the selected channel.
By clicking on the up or down arrows (
of a maximum of 4 channels that were assigned to that chart. This allows you to observe the chart-related
information for that specific channel. You can also select a new channel for the information region by
placing the cursor in (or tabbing over to) the “Center” or “Units/Div” fields and then pressing PageUp or
PageDown. This is particularly useful when your Chart Display Window has been re-sized such that the
channel selection boxes are not visible.
The following list identifies areas of the channel information region.
V, or W) by the channel selection box (item 10), you can select one
Channel Information Region
Item Description
9 Chart Maximum Scale
Value (Grid Limit Line)
10 Channel Selection Used to select the channel (of chart group's available channels) for which the
11 Present Value The real-time value of the selected channel.
12 Center Used to display (and change) the value of the selected channel’s chart centerline.
13 Units/Division (Provides
the vertical increment of
one grid box)
14 Chart Minimum Scale
Value (Grid Limit Line)
The value at the upper grid limit line. This is the value at the high end of the scale.
information will be displayed. Displays the label of the channel for which information
is being displayed.
Changing the value of center results in an automatic change of the chart’s high and
low end values (items 9 and 14, and possibly an automatic change of the units/div
(item 13). Aside from using the center spinner controls to change center, you can
change the center value by placing the mouse cursor in (or tabbing over to) the field
and then either typing in the desired value, or using the PC keyboard up and down
arrow control keys.
The units in units/div can be °C, °F, °K, °R, µV, mV, V, kHz, or Hz. The division
referenced is one vertical grid. In the example above for PD1_A02, each vertical
grid increment represents 4.876 V per division. Changing the units/division spinner
controls (V/W) will result in an automatic adjustment of the max scale and min scale
values (items 9 and 14). Aside from using the units/div triangular controls to change
the value, you can change units/div by placing the mouse cursor in (or tabbing over
to) the field and then either typing in the desired value, or using the PC keyboard
arrow control keys.
The value at the lower grid limit line. This is the value at the low end of the scale.
4-30 Personal DaqView
989394 Personal Daq User’s Manual
Page 73

15 Multiply (x2), and
16 Divide (÷2)
17 Scrolling Time
18 Global Scroll Rate The “global” scroll rate consists of a “time per division” value which can be changed
The Multiply(x2) push-button increases the size of the selected channel’s chart by a
factor of 2, while automatically adjusting the chart’s high and low values. Aside from
“clicking” on the Multiply/Divide controls, you can use your keyboard spacebar to
control this feature once the button (15 or 16) is selected. Selection may be with
mouse, or by tabbing over to the control.
Making changes to a channel’s chart parameters does not affect the parameters of
the other channels, with the following exception: Holding the keyboard’s control key
down while adjusting either spinner (V/W) for center (item 12), or spinner for
units/div (item 13) causes the parameter change to apply to all channels for the chart
(not just the currently selected channel display). This feature applies to the spinners
and keyboard up and down arrow keys, but not to the text input.
Scrolling Time is turned On or Off from the Timestamp pull-down menu. Time
Stamp can be “absolute” (real time) or “relative.” Absolute time is based on your
computer clock, whereas relative time starts at 00:00:00 hours/minutes/seconds, and
then continues timing in increments relative to the Scroll Rate. The chart’s scroll rate
can be set in the chart’s Properties box, accessed through the Chart pull-down
menu. Also see Properties in the table on page 4-28.
using the “faster” (rabbit) button or “slower” (turtle) button. Available Scroll Rates are
from 0.1 sec/div to 1 hour/div, as indicated in the table on page 4-29.
The “global” scroll rate is not necessarilly the same as the chart’s “actual” scroll rate
(as set in the chart’s Properties dialog box). The Properties box is accessed through
the Chart pull-down menu.
Accessing the Display Configuration Setup Box
The Set Up Charts button accesses a Display Configuration Setup dialog box. This box will also be
displayed if: a) you select Create Charts Manually during use of the Wizard Chart Setup program, b) you
select Setup from the Chart pull-down menu, c) you right-click on the chart region in Personal DaqView’s
Chart Display Window.
Note: If multiple chart groups are present in the display configuration, the current group will be selected
in the display configuration tree.
When you first click on the Set Up Charts button, a Display Configuration Setup box appears. A display
region shows the configured structure of the groups, charts, and channels. From this box you can select the
number of charts to be assigned to a specific group. With the use of the mouse cursor you can also select a
chart or channel for additional editing. In addition to the text presented in the following sub-sections:
Normal Edit and Manually Creating a Display, you can refer to the Chart Setup Wizard section,
beginning on page 4-37.
Reference Note: For your very first chart display setup, or when the configuration file has been
deleted, refer to the Chart Setup Wizard section beginning on page 4-37.
The method you use to access the Display Configuration Setup window makes a difference. When you use
the toolbar button or the pull-down menu’s Setup selection, the Display Configuration Setup window
appears with the current chart display configuration intact. With this type of access you would simply edit
your existing chart display. Channel configurations do not change, with exception that newly displayed
channels will be enabled.
When you access the Display Configuration Setup from the Chart Setup Wizard, the Display Configuration
Setup window appears with no existing display. This allows for a “clean slate” approach to creating a chart
display, as opposed to an “editing” approach. Channel configurations do not change, with exception that
newly displayed channels will be enabled.
Personal Daq User’s Manual 989394 Personal DaqView 4-31
Page 74

Editing a Chart Display Configuration
Display Configuration Setup Dialog Box with an Existing Config uration
To explain editing a configuration, we make use of an example in which assumes you want to edit Chart 1.
In the following figure, Chart 1 was highlighted by clicking on it with the cursor. The Display
Configuration Setup box then changed, allowing you to see specific channel types (such as volts only) or to
“Show all Types,” as in the example.
From this setup box you can add or delete charts and channels. You can:
use the Shift or Ctrl key in conjunction with the cursor to select several channels for addition or deletion
•
•
double-click on an available channel to add it to the selected channels
•
double-click on a selected channel to remove it from the selected channels list
Note: When a chart contains overlapping channels with identical points of measurement, the channels that
are listed lower in the display will obscure the channels that are listed higher. In other words, the
charted points of newer channels will obscure points of equal value on the older channels.
Another variation of the Display Configuration Setup box appears when you highlight a channel. In the
following figure, channel PD1_AO1 (of Chart 1, Group 1) was selected, resulting in a new screen image.
From this screen you can edit the channel setup.
4-32 Personal DaqView
Adding Channels to Group 2, Chart 2
989394 Personal Daq User’s Manual
Page 75

Changing the Configuration of Channel PD1_A01
Personal DaqView data channels can operate in one of two modes: Units Full Scale or, Units/Div. The
mode is selected by radio button.
Units Full Scale
. When Units Full Scale is selected, as depicted in the above figure, you can alter Y Max
and Y Min. These are the upper and lower limits of the Channel as they will appear on the chart when the
channel is selected. When you change either parameter, Y Center and Units/Division are automatically
adjusted. You can not directly adjust Y Center or Units/Division while “Units Full Scale” is selected. You
can change Y Max and Y Min by using the up and down arrows, or by highlighting the existing value,
typing in the new value, the pressing “Enter” on your PC keyboard.
Note: If the window size is changed, a chart operating in the Units Full Scale mode will maintain its
full scale setting across the chart.
Units/Div
. When Units/Div. is selected you can alter Y Center and Units/Div. Y Center is the centerline
value of the chart when the channel is selected. Units/Div. is the vertical value of on chart grid increment.
When you change Y Center or Units/Div. Y Max and Y Min are automatically adjusted. You can not
directly adjust Y Max or Y Min while “Units/Div.” Is selected. You can change Y Center and Units/Div.
by using the up and down arrows, or by highlighting the existing value, typing in the new value, the
pressing “Enter” on your PC keyboard.
Note: If the window size is changed, a chart operating in the Units/Div. Mode will maintain its
units per division scale setting across the chart.
The channels in the display setup you create will be automatically enabled and will ap pear in chart form on
Personal DaqView’s Chart Display Window. The Channels will overlap on their assigned Chart and will
be visible when the applicable Group is selected. Note that only one group of charts can be viewed at a
time.
It is important to understand that other channels (those not in the display setup) maintain their existing
configuration status. They are not affected by the edit of the configuration display.
You can enable additional channels from the Channel configuration window. Enabling additional channels
allows you to acquire more data; however, it will not change your display o n Personal DaqView’s Chart
Display Window. In other words, you can also acquire data from channels, which you do not monitor.
Personal Daq User’s Manual 989394 Personal DaqView 4-33
Page 76

Manually Configuring a Chart Display
If you plan to have a chart setup which is not weighted evenly, i.e., different numbers of channels per chart
and different numbers of charts per group, you may want to manually setup your chart display from
scratch, that is, without beginning from a pre-existing display configuration. This method is arrived at
from the Chart Setup Wizard window by clicking on the Manual Chart Setup, Create Charts button. When
this button is clicked, the program exits the Chart Setup Wizard and enters the manual method of Display
Configuration Setup. Although this method is referred to as “manual,” it still contains some automatic
elements, such as Automatically Add Groups to the Setup.
Note: Even if an unevenly distributed chart display is desired, you can always edit a pre-existing chart
setup, or create a new setup by one of the Chart Setup Wizard’s automatic methods, and then edit
the setup.
To manually setup your chart display using the clean slate approach (as opposed to editing an existing
display) perform the following steps.
1. Select the Chart Setup Wizard from the Charts pull-down menu of Personal DaqView’s Chart
Display Window. The Wizard setup window appears (see following figure).
2. Click on the Manual Chart Setup, Create Charts button. The Display Configuration Setup box
appears. Since the previous display configuration was reset, no groups or charts are seen in the
display area on the left side of the screen.
3. As seen in the previous figure for the “Clean Slate” approach, you have two options at this point.
(3a) Automatically add groups to the setup
(3b) Manually add groups to the setup. Type in the name of the chart group; then click on the
4-34 Personal DaqView
Display Configuration Setup, A “Clean Slate” Approach
Perform (3a) or (3b) as appropriate. Option (3a) is typically used.
. Enter the number of groups and charts desired by using
the cursor and typing in the value, or by using the pull-down arrows (W) and making the
appropriate selections; then click on the Create Groups button.
Add Display Group button.
The Display Configuration Setup screen changes to show chart groups, and the number of charts
for the selected (black highlighted) chart group. From this screen you can change the number of
charts in a group, as well as change the group name.
989394 Personal Daq User’s Manual
Page 77

Adding one Chart to Group 1
4. Change the number of charts per group if desired.
5. Change the group name if desired.
6. Click on a group to see the chart(s) assigned to the group. In the above example there is one group
with one chart.
7. Click on a chart to assign channels to the chart. A screen similar to the following will appear.
Assigning Channels to Group 1, Chart 1
8. Choose channels for the selected chart. You can select up to 4 overlapping channels per chart. Add or
delete channels as follows:
• Highlight an available channel using the cursor and left-hand mouse button; then click
the Add button. Repeat for each channel to be added.
• Double-click on a channel in the available channels list to add the channel to the display.
• Double-click on a channel in the selected channels list to remove the channel from the
display.
• Hold down the keyboard’s Shift Key and use the left-hand mouse button to select a block
of consecutive available channels (up to 4); then click the Add button. Example:
PD1_A03, PD1_A04, PD1_A05, PD1_A06.
• Hold down the keyboard’s Ctrl button and use the left-hand mouse button to select up to
4 available channels (these can be non-consecutive); then click the Add button.
Example: PD1_A01, PD1_A03, PD1_A05, PD1_A07.
Note: You can also remove channels in a similar manner by highlighting a channel(s) in the Selected
Channels box, and then clicking on the Remove button.
Personal Daq User’s Manual 989394 Personal DaqView 4-35
Page 78

Note: When a chart contains overlapping channels and the channels share values such that their
traces reside on top of each other, then the channels that are listed lower in the display
list (the most recently added channels) will obscure the channels higher in the list (those which
were added first).
9. In the display area (on the left-hand side of the screen) click on a channel to check the channel’s
configuration and to re-configure the channel, if desired. The Display Configuration Setup Window
will appear similar to that in the following figure.
Note: Changing the display configuration does not change the existing channel configuration setup. It
only changes how the chart groups, charts, and channels will be displayed.
The following figure shows two “radio buttons” on the screen. These buttons allow you to select the
method of adjusting the display mode. From this screen you need to choose Units Full Scale or
Units/Div.
Adjusting Channel Setup for Channel 1
Remember, you can enable additional channels from the Channel configuration window. Enabling
additional channels allows you to acquire more data; however, it will no t ch ange your chart display on
Personal DaqView’s Chart Display Window. In other words, you can acquire data from channels, which
you do not monitor.
4-36 Personal DaqView
989394 Personal Daq User’s Manual
Page 79

Chart Setup Wizard
Introduction
Chart Setup Wizard is a feature used by many programs, including Personal DaqView, and PostView. The
feature allows you to set up your initial chart display configuration using an automated method, or
manually create a new display configuration. The following points are important in regard to the Chart
Setup Wizard.
• You can edit the chart display by accessing the Display Configuration Setup dialog box from the
Chart pull-down menu or by clicking of the Chart Setup button in the Chart Display Window
toolbar. This method does not use the Chart Setup Wizard and does not reset your chart display
configuration setup.
• Activating the Chart Setup Wizard will reset your chart Display Configuration Setup.
• Activating the Chart Setup Wizard will not reset your Channel configuration.
The Chart Setup Wizard window will appear when you attempt to run Personal DaqView charts for the
very first time, as well as when a configuration file does not exist and you attempt to run charts. When a
configuration file already exists, you can easily access the Chart Setup Wizard by selecting Wizard in the
Chart pull-down menu, or by clicking on the Chart Setup Wizard button (located in the Chart Display
Window’s toolbar). It is important to realize that running the Chart Setup Wizard will result in a reset of
your display setup; it will not, however, change your ch annel configuration (with the exception of new
display channels now enabled).
The chart setup determines how your Personal DaqView Chart Display Window will appear in regard to
the following:
• number of chart groups available for viewing
• number of charts shown for each selected group
• the number of overlapping channels in each chart (not to exceed 4)
You can choose to manually create a configuration, or have one created automatically. The automatic
setup method offers three choices: S
Note: You can use Chart Setup Wizard to quickly set up a large number of charts. You can then fine-
tune the layout manually via the Manual Chart Setup feature.
A Manual Chart Setup, Create Charts button allows you to bypass the Chart Setup Wizard and enter a
manual mode. This option makes use of Personal DaqView’s Display Configuration feature (discussion on
manually creating a chart display begins on page 4-34). Manual Chart Setup allows you to vary the number
of assigned channels per chart, as well as vary the number of charts per group.
Note: The standard version of Personal DaqView has a Chart Setup Wizard that, in regard to
Automatic Chart Creation, is restricted to the Simple mode.
imple, Moderate, and Advanced.
Personal Daq User’s Manual 989394 Personal DaqView 4-37
Page 80

Chart Setup Wizard, Simple Mode
Chart Setup Wizard, Automatic Setup Options
Setup
Type
Simple
Moderate
Advanced
Group Setup
(for Chart Groups)
1 group only Up to 16 charts 1 channel per chart
1 group only Up to 16 charts Up to 4 overlapping channels per chart
Up to 64 groups Up to 16 charts per group Up to 4 overlapping channels per chart
Chart Setup Channel Setup
Note: The Manual Chart Setup, Create Charts button (above figure) allows you to exit the
Chart Setup Wizard and manually create your chart display without use of the automatic
functions available in Chart Setup Wizard.
Note: Moderate and Advanced modes are only available for use with Personal DaqView Plus.
Automatic Display Setup using the Chart Setup Wizard
The previous figure shows the Simple mode dialog box for Automatic Chart Creation. The following
figures show the Moderate and Advanced mode dialog boxes. These two modes do not apply to the
standard version of Personal DaqView.
It is a simple task to create chart display configurations using the automatic method. The following steps
apply to this feature of Chart Setup Wizard.
4-38 Personal DaqView
Dialog Boxes for Moderate and Advanced Modes of Automatic Chart Creation
1. Select Wizard from the Chart pull-down menu of Personal DaqView’s Chart Display Window.
The Wizard setup window appears.
2. Select the desired mode tab (Simple, Moderate, or Advanced).
989394 Personal Daq User’s Manual
Page 81

3. Use the pull-down arrows (W), or use the cursor and type in a new value to make selections for
the number of groups, charts, and channels as applicable.
4. If you desire to start with a channel other than the default channel (first available channel), use the
pull-down arrow and select the desired starting channel number.
5. When your setup is complete, click on the Automatic Chart Creation, Create Charts button. A
percentage of completion bar will appear, followed by the Channel Setup box.
6. Make appropriate configuration changes, if any are desired, including enabling additional
channels; then click on the OK button. After clicking OK, the Chart Display Window appears and
you can begin running charts. Note that the Channel Setup section of this chapter contains related
information.
The channels in the setup you create will be automatically enabled and will appear in chart form on
Personal DaqView’s Chart Display Window. The Channels will overlap on their assigned Chart and will
be visible when the applicable Group is selected. Note that only one group of charts can be viewed at a
time.
As mentioned earlier, you can enable additional channels from the Channel configuration window.
Enabling additional channels allows you to acqu ire more data to disk; however, it will not change your
display on Personal DaqView’s Chart Display Window. In other words, you can acquire data from
channels, which you do not monitor.
Bypassing Automatic Chart Setup
You can bypass Chart Setup Wizard by clicking on the Manual Chart Setup, Create Charts button in Chart
Setup Wizard’s Chart Display Window. After selecting this option you will be using the Display
Configuration Setup dialog boxes to create a display from scratch, i.e., using a “clean slate” approach.
This is method is detailed with an example, in the section Manually Creating a Display, beginning on page
4-34.
Personal Daq User’s Manual 989394 Personal DaqView 4-39
Page 82

4-40 Personal DaqView
989394 Personal Daq User’s Manual
Page 83

TM
Personal DaqViewXL User’s Guide
OverView …… 1
System Requirements …… 2
Installation …… 2
First Time Use …… 2
Configuration Reference …… 5
Toolbar Buttons …… 5
Tools Pull-Down Menu ……5
Channel Configuration Window …… 7
When using Personal Daq modules to acquire data, computer energy save modes can cause false data
readings. Prior to using Personal Daq modules, ensure your computer’s energy save mode is disabled.
If needed, consult your computer’s user manual to disable energy save (power suspension) modes.
Overview
Personal DaqViewXL is a software component add-in that installs into Microsoft Excel™ and provides
complete setup and data acquisition within Excel under Windows 98/Me/2000 and /XP. Acquired data is
immediately placed in an active spreadsheet, analyzed and graphically displayed. Personal DaqViewXL
provides:
Auto-Load Function ……8
Disabling Auto-Load …… 8
Enabling Auto-Load …… 8
Performance of Personal DaqViewXL ……8
Configuring an Acquisition ……9
Real-Time Charting ……11
Data Header ……12
Hints and Tips …… 13
• data acquisition and analysis
• report printouts of data text and graphics
• strip-chart graphics for real-time data display
• conversion of data to engineering units
• data editing
• formula creation
After Personal DaqViewXL has been installed, you can configure your data acquisition system easily by
accessing the desired window from the program’s toolbar, i.e., with use of the Configure Devices,
Configure Channels, or Configure Acquisition buttons. Each column in the channel-configuration
window corresponds to a specific parameter in the data acquisition system. Note that the channels can be
configured individually.
In regard to creating data reports, you can embed Excel “spreadsheet objects” directly into a word
processing program, add text, and print the end result. To revise the report’s text, just edit the document as
needed. To update the spreadsheet, double-click on the embedded “spreadsheet object” to access
Personal DaqViewXL; then create and embed a new “spreadsheet object.”
Personal DaqView XL supports all models of the Personal Daq family, including expansion modules and
provides the engineering unit output required for each configured channel on an individual basis. For
example, data for a voltage channel can be returned in volts, while data from a thermocouple is being
returned in degrees.
You can use Personal DaqViewXL’s “scale and offset” feature to automatically convert channel data to
custom units and then have the scale and offset applied to the data prior to its appearing in the spreadsheet.
The scale and offset feature is especially handy for transducers such as strain gages because it converts the
return voltage value to units such as pounds or units of pressure.
Personal DaqViewXL User’s Guide 918596 491-0905, rev 3.0
Page 84

System Requirements
For successful operation of Personal DaqViewXL with your Personal Daq system, your computer should
conform to the following as a minimum:
• PC system with Pentium® processor
• USB port
• Microsoft Excel, version 8
• Microsoft Windows 98SE (S econd Edition), Windows/Me/2000 or /XP
• 16 Mbytes of RAM (32 Mbytes recommended)
• Energy Save modes disabled (see the Caution on page 1)
Installation
You will need to use an Authorization Code the first time you launch Personal DaqViewXL. The code is
provided when the application is purchased.
Note 1: The following steps assume that Personal DaqView has already been installed.
Note 2: If you are replacing Personal DaqViewXL with a newer version, you should remove the older
version prior to installing the new application.
To install the Personal DaqViewXL application:
1. Run Personal DaqView.
2. Select Authorization from the File pull-down menu. An Authorization dialog box will appear.
3. Type in the code, as it appears on your Authorization Sheet.
4. Click the <Apply Code> button.
First Time Use
Personal DaqViewXL is an Excel “add-in” that must be loaded into the Excel environment before it can be
used. Perform the following steps to load Personal DaqViewXL into Excel:
1. Start Excel (refer to Microsoft documentation as needed).
2. Select the “Tools” menu and click on “Add-Ins.” This will open the “Add-Ins” dialog box, as
shown below.
Excel’s “Add-Ins” Dialog Box
2 491-0905, rev 3.0 918596 Personal DaqViewXL User’s Guide
Page 85

3. Click the “Browse” button and locate the file
pDaqView.xla. This file is located in the install
directory specified by the setup program. Click OK.
Browse Option Dialog Box
4. Select Personal DaqViewXL from the “Add-Ins Available” list. Make sure there is a check next to
Personal DaqViewXL, and then click OK.
Add-Ins Dialog Box with Personal DaqViewXL Selected
5. Excel loads the “add-in,” creating a Personal DaqViewXL item in the Tools pull-down menu and a
toolbar.
(1) Configure Devices
(2) Configure Channels
(3) Configure Acquisition
(4) Go!
(5) Manual Trigger
(6) Chart Display
(7) Bar Graph Meters
(8) Analog Meters
(9) Digital Meters
(10) Use Data Destination
(11) Set Data Destination Cell
(12) Use Data Header
Personal DaqViewXL Menu Options
Personal DaqViewXL Toolbar Options
Personal DaqViewXL User’s Guide 918596 491-0905, rev 3.0 3
Page 86

After Personal DaqViewXL is installed in this manner, it will automatically load whenever you run Excel.
6. If you want to start Personal DaqView when Personal DaqViewXL is used for the first time:
a) Click the Personal DaqViewXL selection (located in Excel’s Tools pull-down menu).
b) Choose “Options…” (the Options Dialog Box appears).
c) Select “Start the first time I use Personal DaqViewXL.”
d) Click “OK.”
Personal DaqViewXL Start-up Options Dialog Box
7. If you want to start Personal DaqView as soon as Excel is opened:
a) Click the Personal DaqViewXL selection (located in Excel’s Tools pull-down menu).
b) Choose “Options…” (the Options Dialog Box appears).
c) Select “Start as soon as I open Excel.”
d) Click “OK.”
Note: After you have launched Excel and Personal DaqViewXL has been activated, the following dialog
box appears if Personal DaqView is not running. If this is the case, click “Yes” to start Personal
DaqViewXL.
Personal DaqView Startup Confirmation
The following figure shows a partial screen capture of a Microsoft Excel spreadsheet. In the figure, the
Personal DaqViewXL item has been selected from the Tools pull-down menu. Personal DaqViewXL’s
toolbar can also be seen in the figure.
Microsoft Excel Spreadsheet showing Personal DaqViewXL Menu Options
4 491-0905, rev 3.0 918596 Personal DaqViewXL User’s Guide
Page 87

Configuration Reference
The following information is intended to serve as a quick reference regarding channel configuration. You
should refer to the user’s manual for more detailed information regarding Personal DaqView, as needed.
Toolbar Buttons
Note: The functions that can be obtained through the toolbar can also be obtained through the pull-down
menus.
Button Function
1 Configure Devices Opens the Select Active Devices window.
2 Configure Channels Opens the Channel Configuration Spreadsheet. If the window is already open,
3 Configure Acquisition Opens the Configure Acquisition Dialog. Various acquisition parameters can be set
4 Go! Starts an acquisition and inserts the data into the current spreadsheet destination
5 Manual Trigger Manually triggers the acquisition when applicable.
6 Chart Display Opens the Chart Display, where data is displayed in graphical in a chart format. If
7 Bar Graph Meters Display Opens the Bar Graph Meters, where data is displayed in a bar graph format. If Bar
8 Analog Meters Display Opens the Analog Meters Display, where data is displayed in an analog meter
9 Digital Meters Display Opens the Digital Meters Display, where data is displayed in a digital meter format.
10 Use Data Destination Turns the Use Data Destination feature on or off.
11 Set Data Destination Cell Sets the data destination cell to the “active” cell in the current workbook.
12 Use Data Header Turns the Use Data Header feature on or off.
Personal DaqViewXL Toolbar
pressing this button gives the window focus.
from this dialog.
cell. Pressing the button again stops the acquisition.
Chart Display is already open, pressing this button gives the window focus.
Graph Meters is already open, pressing this button gives the window focus.
format. If Analog Meters Display is already open, pressing this button gives the
window focus.
If Digital Meters is already open, pressing this button gives the window focus.
Tools Pull-Down Menu
When the Personal DaqViewXL add-in is loaded, a Personal DaqViewXL menu is added to Excel’s
Tools pull-down menu. You can use the menu items to perform all actions that are available from
Personal DaqViewXL’s toolbar. Note that some of the pull-down items have no toolbar equivalent.
Menu Item Function
1 New Configuration Provides a means of creating a new configuration from default settings.
2 Open Configuration… Provides a means of opening an existing configuration file. This feature may be
3 Save Configuration Saves the configuration file under its existing filename. Note that you can open
4 Save Configuration As… Copies the current file for saving under a different filename.
5 Configure Devices… Opens the Select Active Devices window.
6 Configure Channels Opens the Channel Configuration Spreadsheet. If the window is already open,
7 Configure Acquisition… Opens the Configure Acquisition Dialog. Various acquisition parameters can be set
8 Go! Starts an acquisition and inserts the data into the current spreadsheet destination
9 Manual Trigger Manually triggers the acquisition when applicable.
Personal DaqViewXL User’s Guide 918596 491-0905, rev 3.0 5
used to open configuration files created by the Personal DaqView application.
Personal DaqViewXL files from the Personal DaqView application.
pressing this button gives the window focus.
from this dialog.
cell. Selecting the item again stops the acquisition.
Page 88

10 Update Digital Outputs Updates the digital output channels. This item is only enabled when the digital
11 Save Power-up Settings Saves the current power-up settings for all devices in the configuration. The
12 Chart Display Opens the Chart Display, where data is displayed in graphical in a chart format. If
13 Bar Graph Meters Display Opens the Bar Graph Meters, where data is displayed in a bar graph format. If Bar
14 Analog Meters Display Opens the Analog Meters Display, where data is displayed in an analog meter
15 Digital Meters Display Opens the Digital Meters Display, where data is displayed in a digital meter format.
16 Use Data Destination Turns the Use Data Destination feature on or off.
17 Set Data Destination Cell Sets the data destination cell to the “active” cell in the current workbook.
18 Use Data Header Turns the Use Data Header feature on or off.
19 Options… Opens Personal DaqViewXL’s Options Dialog.
20 Preferences… Opens Personal DaqViewXL’s Preferences Dialog. From this dialog box you can
output channels are not updated and the acquisition state is idle.
power-up settings take effect when the device is first plugged into an active USB
port.
Chart Display is already open, selecting this item gives the window focus.
Graph Meters is already open, selecting this item gives the window focus.
format. If Analog Meters Display is already open, selecting this item gives the
window focus.
If Digital Meters is already open, selecting this item gives the window focus.
use the General and Measurement Units dialog boxes as described below.
Preferences Screen Captures (Condensed Images)
21 About… Provides version information for the active Personal DaqViewXL add-in and the
22 Help… Launches the Personal DaqViewXL section of the Personal DaqView help file.
Personal DaqView application.
General − Allows you to select “untitled” or “pDaq”
configurations for the default filename used by
Personal Daq. Note that Personal DaqView automatically
loads the last saved configuration file. The lower portion of
the General screen pertains to configuration file settings.
Measurement Units − Allows you to set the desired default
units for the Channel Configuration Window’s spreadsheet.
Note that scale and offset automatically reset to a predesignated default according to the unit selected.
Changing the measurement unit defaults does not
immediately affect the Channel Configuration Window’s
spreadsheet columns. For example: If you set your voltage
default to µV, but the channels are set with V units, they will
retain the V units. However, changing these channels to
temperature, then back to voltage would result in the default
units (µV) and the associated scale & offset. The new
default units are also applied to all channels when a new
configuration file is created.
6 491-0905, rev 3.0 918596 Personal DaqViewXL User’s Guide
Page 89

Channel Configuration Window
You can bring up the Channel Configuration Window by using the Configure Channel Settings button (9)
on the Main Control Window toolbar, or by selecting Configure Channels from the Personal DaqViewXL
pull-down menu.
The Channel Configuration Window contains a Control pull-down menu and a 2-button toolbar. The
window displays any one of three tabbed spreadsheets for selecting the type of channel to be configured.
The tabs are labeled Analog Input, Frequency/Pulse Input, and Digital Input/Output.
Channel Configuration Window, Selected for Analog Input Spreadsheet
Toolbar
The Channel Configuration Window consists of two buttons (items 16 and 17) as identified by the previous
figure and the following table.
Button Function
16 Enable Readings
Column
17 Disable Readings
Column
Activates the Channel Configuration Window’s reading column. Does not affect the
recording of data to the destination spreadsheet.
Stops the Channel Configuration Window’s reading column. Does not affect the
recording of data to the destination spreadsheet.
Channel Configuration Window Pull-down Menu
The channel configuration window contains one pull-down menu labeled, Control. This menu provides a
means of enabling and disabling the readings column, as do toolbar items (16 and 17).
Personal DaqViewXL User’s Guide 918596 491-0905, rev 3.0 7
Page 90

Auto-Load Function
Excel’s “Add-Ins” dialog box has a check-box for enabling (9) or disabling an automatic loading of
Personal DaqViewXL each time you run Excel. To enable or disable the auto-load feature, refer to the
following two paragraphs as needed.
Disabling Auto-Load
If you want to avoid an automatic loading of Personal DaqViewXL each time you run Excel, perform the
following steps:
1. Start Excel.
2. Select the “Tools” menu and click on “Add-Ins.” The “Add-Ins” dialog box opens.
3. Locate the Personal DaqViewXL line in the “Add-Ins Available” list box and click on it. This should
remove the checkmark next to the item.
4. Click “OK.”
Personal DaqViewXL will no longer auto-load with Excel. See the following paragraph for simple steps on
enabling the Personal DaqViewXL auto-load feature.
Enabling Auto-Load
If you want Personal DaqViewXL to automatically load each time you run Excel , perform the following
steps:
1. Start Excel.
2. Select the “Tools” menu and click on “Add-Ins.” The “Add-Ins” dialog box opens.
3. Locate the Personal DaqViewXL line in the “Add-Ins Available” list box and click on it. This should
insert a checkmark (9) next to the item.
4. Click “OK.”
Personal DaqViewXL will now auto-load with Excel. See the previous paragraph for simple steps on
disabling the Personal DaqViewXL auto-load feature.
Performance of Personal DaqViewXL
Personal DaqViewXL performs in much the same manner as the standard Personal DaqView, with the
noted difference that the XL version can use Excel macros. The following sections provide basic
information for using Personal DaqViewXL to organize and analyze data. An understanding of these
basics will let you explore each of Personal DaqViewXL’s many features.
Note: The Hints and Tips section contains suggestions for improving your productivity with
Personal DaqViewXL. If you are not proficient with Excel, please refer to your Excel
documentation as needed. The more you know about Excel, the better your understanding
and use of Personal DaqViewXL will be.
8 491-0905, rev 3.0 918596 Personal DaqViewXL User’s Guide
Page 91

Personal DaqViewXL Spreadsheet with Toolbar and Displays
Personal DaqViewXL Toolbar
(1) Configure Devices
(2) Configure Channels
(3) Configure Acquisition
(4) Go!
(5) Manual Trigger
(6) Chart Display
(7) Bar Graph Meters
(8) Analog Meters
(9) Digital Meters
(10) Use Data Destination
(11) Set Data Destination Cell
(12) Use Data Header
Personal DaqViewXL User’s Guide 918596 491-0905, rev 3.0 9
Page 92

Configuring an Acquisition
To set up your configuration, once Personal DaqViewXL has been installed; complete the following steps:
1. Enter Excel.
Personal DaqView Channel Configuration Screen within Excel
2. Configure acquisition settings using the Configure Devices, Configure Channels, and
Configure Acquisition toolbar buttons or tool pull-down menu selections.
These steps launch Personal DaqView’s configuration screens. Note that the Personal DaqView
configuration information, found in the Personal Daq User’s Manual, still applies to Personal DaqViewXL.
Also see the section in this user’s guide, Configuration Reference, beginning on page 5.
10 491-0905, rev 3.0 918596 Personal DaqViewXL User’s Guide
Page 93

Real-Time Charting
Personal DaqViewXL provides a real-time strip-chart window (as in Personal DaqView) for graphical
presentation of data. You can select up to 16 channels of data, with one channel assigned to each graph.
The strip-chart representation is continuous while data is being collected. All 16 charts are synchronized
and have an adjustable scrolling speed that can be set independent of the sampling rate. Selecting the
Charts icon in the Personal DaqViewXL toolbar will activate the following window. The chart selection
must be made prior to initiating an acquisition (selecting the Go! icon).
Personal DaqViewXL Real-Time Charting
Personal DaqViewXL User’s Guide 918596 491-0905, rev 3.0 11
Page 94

Data Header
Personal DaqViewXL’s optional data header supplies the global acquisition parameters and the
configuration of each channel and places this information directly in the spreadsheet along with acquired
data. Examples of frequently used header information include: channel gain, thermocouple type, units, and
channel label. To activate Data Headers select the Use Data Headers icon in the Personal DaqViewXL
toolbar.
Personal DaqViewXL Data Header
12 491-0905, rev 3.0 918596 Personal DaqViewXL User’s Guide
Page 95

Hints and Tips
• If Personal DaqView is running as a stand-alone application when you start to use Personal DaqViewXL,
Personal DaqView will switch to a special “server mode.” This “server mode” supports transactions with
“client” applications such as Excel. Note that you must close Excel prior to using Personal DaqView again
as a stand-alone application.
• W h en you acquire data into a worksheet, some of the data may be displayed as a string of pound characters
(######). Excel will use these characters when a column is not wide enough to display all the digits of a
given number. Sufficient widening of the column will eliminate the symbols. You can widen columns
using the “Format, Column, Auto Fit Selection” menu command. Clicking on this menu-item
automatically adjusts column widths to accommodate the data.
• Personal DaqViewXL does not have to be used as an Excel “Add-In;” it can also be loaded as a workbook.
To do so, open
menu items will be added to Excel.
• W h en loading the Personal DaqViewXL add-in manually, Excel does not automatically create a blank
workbook. To create a workbook, access the File, New menu ite m (after Excel loads with Personal
DaqViewXL).
Note: When you load Personal DaqViewXL as a workbook, it will not automatically load the next time
pDaqView.xla using the File Open dialog box. The Personal DaqViewXL toolbar and
you run Excel. However, it will appear in the recently used list at the bottom of the File menu,
making it easy to load the next time you run Excel.
• You can arm an acquisition from an Excel macro as shown in the following VBA code example:
Sub GoMacro()
Dim cbpMenu As CommandBarPopup
Dim cbButton As CommandBarButton
'Get the Personal DaqViewXL menu object.
Set cbpMenu = CommandBars("Tools").Controls("Personal DaqViewXL")
'Get the "Go!" command button object.
Set cbButton = cbpMenu.Controls(8)
'Execute the button's command if the button is enabled.
If cbButton.Enabled Then cbButton.Execute
End Sub
This is equivalent to clicking "Go!" on the Personal DaqViewXL menu or toolbar. Any of the other
commands on the Personal DaqViewXL menu may be executed in a similar manner.
• If Personal DaqView cannot connect to your hardware on start-up, it will automatically switch to the
Simulated Instrument mode when loaded from Personal DaqViewXL.
Personal DaqViewXL User’s Guide 918596 491-0905, rev 3.0 13
Page 96

14 491-0905, rev 3.0 918596 Personal DaqViewXL User’s Guide
Page 97

Signal Management 5
Overview
Overview ……5-1
Channel Control and Expansion ……5-3
Signal Acquisition ……5-4
Measurement Duration, Sample Rate, and
Resolution ……5-4
System Noise ……5-7
Averaging ……5-7
Analog Filtering ……5-8
Input and Source Impedance ……5-8
Crosstalk ……5-8
Under Sampling and Aliasing …… 5-4
Triggering ……5-5
Input Isolation ……5-6
Signal Modes ……5-6
This chapter pertains to signal management, the use of different types of signals, and how to reduce
common noise problems. The final portion of the chapter contains basic troubleshooting tips.
This table defines data acquisition terms, as used in this manual.
Data Acquisition Terms and Meanings
Acquisition A collection of scans acquired at a specified rate.
Aliasing A type of error that results from having a scan rate set too low for a given variable
Analog A signal of varying voltage or current that communicates data. Typical analog
Analog-to-Digital
Converter (ADC)
API Application Program Interface. The interface program within the Personal Daq
Buffer Buffer refers to a circuit or device that allows a signal to pass through it, while
Buffer Amplifier An amplifier used primarily to match two different impedance points, and isolate one
Channel In reference to Personal Daq, channel simply refers to a single input, or output entity.
Common mode
voltage
Crosstalk An undesired transfer of signals between systems or system components. Crosstalk
Digital A digital signal is one of discrete value, in contrast to a varying signal. Digital data is
Digital-to-Analog
Converter (DAC)
input signal. Depending of the amount of aliasing, a sign wave may appear
jagged, flat, or as a sign wave at a different frequency.
signals have the form of sine waves.
A circuit or device that converts analog values into digital values, such as binary bits,
for use in digital computer processing.
system’s driver that includes function calls specific to Personal Daq hardware and
can be used with user-written programs (several languages supported).
providing isolation, or another function, without altering the signal. Buffer usually
refers one of the following:
(a) A device or circuit, which allows for the temporary storage of data during data
transfers. Such storage is often necessary to compensate for differences in
data flow rates. A FIFO (First In - First Out) buffer is one in which the data that
is stored first, is also the first data to leave the buffer.
(b) A follower stage, which is used to drive a certain number of gates without
overloading the proceeding, stage.
(c) An amplifier which accepts high source impedance input and results in low
source impedance output (effectively, an impedance buffer).
(d) Buffer Amplifier (see Buffer Amplifier).
stage from a succeeding stage in order to prevent an undesirable interaction
between the two stages. (Also see Buffer).
In a broader sense, an input channel is a signal path between the transducer at the
point of measurement and the data acquisition system. A channel can go through
various stages (buffers, multiplexers, or signal conditioning amplifiers and filters).
Input channels are periodically sampled for readings.
An output channel from a device can be digital or analog. Outputs can vary in a
programmed way in response to an input channel signal.
Common mode voltage refers to a voltage magnitude (referenced to a common
point) that is shared by 2 or more signals. Example: Signal 1 is +5VDC
referenced to common. Signal 2 is +6VDC referenced to common. The common
mode voltage for the two signals is ((5 + 6) ÷2), or +5.5 VDC
Common mode pertains to signals that are identical in amplitude and duration; and
can be used in reference to signal components.
causes signal interference, more commonly referred to as noise.
represented by combinations of binary digits (0s and 1s).
A circuit or device that converts digital values (binary bits), into analog signals.
Personal Daq User’s Manual 928196 Signal Management 5-1
Page 98

Data Acquisition Terms and Meanings
Differential mode
voltage
ESD Electrostatic discharge (ESD) is the transfer of an electrostatic charge between
Excitation Some transducers [e.g. strain gages, thermistors, and resistance temperature
Gain The degree to which an input signal is amplified (or attenuated) to allow greater
Isolation The arrangement or operation of a circuit so that signals from another circuit or
Linearization Some transducers produce a voltage in linear proportion to the condition measured.
Multiplexer (MUX) A device that collects signals from several input channels and outputs them on a
Sample (reading) The value of a signal on a channel at an instant in time. When triggered, the ADC
Scan The channels that are selected for sampling.
Single-ended mode The single-ended mode measures a voltage between a signal line and a common
Trigger An event to start a scan or mark an instant during an acquisition. The event can be
TTL Transistor-Transistor Logic (TTL) is a circuit in which a multiple-emitter transistor has
Differential mode voltage refers to a voltage difference between two signals
referenced to a common point. Example: Signal 1 is +5VDC referenced to
common. Signal 2 is +6VDC referenced to common. If the +5VDC is used as the
reference, then the differential voltage is (6 - 5), or +1VDC. If the +6VDC is used
as the reference, then the differential voltage is (5 - 6), or –1VDC. ).
The differential mode measures a voltage between 2 signal lines for a single
channel. (Also see single-ended mode).
bodies having different electrostatic potentials. This transfer occurs during direct
contact of the bodies, or when induced by an electrostatic field. ESD energy can
damage an integrated circuit (IC); so safe handling is required.
detectors (RTDs)] require a known voltage or current. Typically, the variation of
this signal through the transducer corresponds to the condition measured.
accuracy and resolution. Gain can be expressed as ×n or ±dB.
device do not affect the isolated circuit.
In reference to Personal Daq, isolation usually refers to a separation of the direct link
between the signal source and the analog-to-digital converter (ADC), as well as
the 500V isolation form the PC. Isolation is necessary when measuring high
common-mode voltage.
Other transducers (e.g., thermocouples) have a nonlinear response. To convert
nonlinear signals into accurate readings requires software to calibrate several
points in the range used and then interpolate values between these points.
single channel.
reads the channel and converts the sampled value into a designated bit value.
reference that may be shared with other channels. (Also see differential mode).
defined in various ways; e.g., a TTL signal, a specified voltage level in a monitored
channel, a button manually or mechanically engaged, a software command, etc.
Some applications may use pre- and post-triggers to gather data around an instant
or based on signal counts.
replaced the multiple diode cluster (of the diode-transistor logic circuit); typically
used to communicate logic signals at 5 V.
5-2 Signal Management 878695 Personal Daq User’s Manual
Page 99

Channel Control and Expansion
V
V
V
In a Personal Daq system, the quantities and types of Personal Daqs used, as well as the types and
quantities of PDQ expansion cards used, determines the system’s channel capacity. Up to 100 Personal
Daqs can be used with one host PC.
Total channel capacity of a Personal Daq system can be calculated from the following tables:
Channel Capacities for Various Personal Daq Setups
Personal Daq/54
Personal Daq/54
No Expansion ----
---Personal Daq/55 Systems
Personal Daq/55 5 DE, or 10 SE 5 DE 8 2
Personal Daq/55 with PDQ1 15 DE, or 30 SE 15 DE 24 2
Personal Daq/55 with PDQ2 25 DE, or 50 SE 25 DE 8 2
Personal Daq/56 Systems
Personal Daq/56 10 DE, or 20 SE 10 DE 16 4
Personal Daq/56 with PDQ1 20 DE, or 40 SE 20 DE 32 4
Personal Daq/56 with PDQ2 30 DE, or 60 SE 30 DE 16 4
DE = Differential Mode, SE = Single-Ended Mode
olts Inputs TC Inputs Digital I/O Freq/Pulse Inputs
5 DE, or 10 SE 5 DE
olts Inputs TC Inputs Digital I/O Freq/Pulse Inputs
olts Inputs TC Inputs Digital I/O Freq/Pulse Inputs
---- N/A ---- ---- N/A ----
Personal Daq User’s Manual 878695 Signal Management 5-3
Page 100

Signal Acquisition
Measurement Duration, Sample Rate, and Resolution
Measurement Duration (per channel) ⎯ the amount of time used for sampling a channel’s input signal.
For Personal Daq, the measurement durations range from very slow (610 milliseconds/sample) to very fast
(12.5 milliseconds/sample).
Sample rate – Samples per second. The sample rate is the number of samples that take place per second.
With a slow measurement duration of 610 milliseconds, there will only be 1.6 samples per second. With a
very fast measurement duration of 12.5 milliseconds, there will be 80 samples per second.
Resolution (Bits RMS) – The number of reliable data bits that exist for a signal’s measurement. The
greater the resolution, the more detailed the reading, for example, with increased resolution a reading of
5.12 V could become 5.11896 V. Personal Daq actually provides for 24 bits of data information; however,
the accuracy of the least significant bits becomes less as the measurement duration speeds up. At a
measurement duration of 610 milliseconds, the last two bits are considered unreliable, resulting in a
resolution of 22 bits. At a very fast measurement duration (12.5 milliseconds), the nine most least
significant bits are unreliable, resulting in 15 bit accuracy.
Speed vs. Resolution
Speed Designation Measurement
Duration
(per channel)
1
Maximum
Sample Rate
(Samples/sec)
2
Resolution
(Bits RMS)
(-4 V to +4 V range)
2
Very Slow, 50 / 60 Hz rejection 610 ms 1.6 / sec 22
Slow, 50 Hz rejection 370 ms 2.7 / sec 22
Slow, 60 Hz rejection 310 ms 3.2 / sec 22
Medium, 50 Hz rejection 130 ms 7.7 / sec 21
Medium, 60 Hz rejection 110 ms 9.2 / sec 21
Medium 40 ms 25 / sec 19
Fast 20 ms 48 / sec 17
Very Fast 12.5ms 80 / sec 15
Notes:
1. Each channel can have independent measurement duration and resolution.
2. The sample rates shown were obtained with a 10-channel scan and with
continuous self-calibration disabled.
3. Duration does not include the use of CJC measurements.
When you select the measurement duration you also determine the sample rate and resolution for the
applicable channel. For Personal Daq’s analog input applications, sample rates range from 1.6 samples/sec
up to 80 samples/sec and corresponding resolution ranges from 22 to 15 bits.
Under Sampling and Aliasing
When you select the measurement duration you also determine the sample rate and resolution for the
applicable channel. As shown in the previous table, sample rates range from 1.6 samples/sec up to
80 samples/sec and corresponding resolution ranges from 22 to 15 bit (for Personal Daq’s analog input
applications).
When measuring highly variable input signals (as opposed to relatively steady input signals), the variable
signals will require more samples/sec to obtain a realistic signal representation. When too few samples are
taken, the term under sampling is often used. Under sampling tends to lower the signal’s graphed
amplitude. This is also known as aliasing. In such cases, the inadequate number of samples results in a
“flattening” of the signal. Gross under sampling can even result in a relatively flat line, even though the
actual signal is a waveform.
For best results the sample rate (scan rate) should be at least 10 times the measurement frequency. If
possible it is recommended that you set the scan rate to 20 times the frequency of the input signal.
5-4 Signal Management 878695 Personal Daq User’s Manual
 Loading...