

Page 1
eZ-TOMAS Machine Vibration Monitoring
Total
Online
Monitoring and
Analysis
Software
User’s Manual
Requires one of the following
Operating Systems:
Windows 2000
Windows XP
Windows NT4*
*Service Pack 5 or greater for NT4
IOtech, Inc.
25971 Cannon Road
Cleveland, OH 44146-1833
Phone: (440) 439-4091
Fax: (440) 439-4093
E-mail (sales): sales@iotech.com
E-mail (post-sales): productsupport@iotech.com
Internet: www.iotech.com
eZ-TOMAS
Total Online Monitoring
and Analysis Software
p/n
1086-0923 rev 11.0
© 2001 . . . 2005 by IOtech, Inc 947394 Printed in the United States of America
Page 2

NOTE: In eZ-TOMAS version 5.2, Spectral Band types are designated as “A” through “J”
instead of “1” through “10” (as shown in related screen shots throughout this
document). Functionality of the band types has not been changed.
947394
Page 3

Table of Contents
1 – Introduction
7 – Plot Examples
What is eZ-TOMAS …… 1-1
Tips for Using eZ-TOMAS …… 1-1
Starting eZ-TOMAS …… 1-2
Connecting Signals …… 1-2
The Order of Operation …… 1-3
A Look at the Gauge Window
& Control Pull-down Menu …… 1-4
2 – Monitoring a Machine
Creating a Project …… 2-1
Configuring the Project …… 2-5
Starting an Acquisition …… 2-6
Viewing Spectral Bands …… 2-6
Plotting Data …… 2-6
Viewing Reports …… 2-9
3 – File Menu [In Gauge Window]
New (Clone) Project …… 3-1
Initialize Project …… 3-1
Open Project …… 3-2
Save As …… 3-2
Erase History File …… 3-3
Erase Alarm Log …… 3-4
Print …… 3-4
Exit …… 3-4
4 – Edit Menu [In Gauge Window]
Setup …… 4-1
Tachometer Notes …… 4-6
Limits …… 4-11
Digital I/O …… 4-17
Display Preferences …… 4-19
Copy Window …… 4-20
Load [or Remove] Graphic Picture …… 4-20
Reset Peak Hold Values …… 4-20
5 – Display Menu . . . Plots
Time …… 7-2
Spectrum …… 7-3
Orbit …… 7-4
Waterfall …… 7-5
Bode …… 7-6
Polar …… 7-7
Strip Chart …… 7-8
Shaft Centerline …… 7-9
8 – Display Menu . . . Reports
Statistical Report …… 8-1
Alarm Log Report …… 8-4
Snapshot Log ……. 8-5
Generate Report using Microsoft Excel 8-6
Configuration Setup
[.txt File] …… 8-15
9 – Network Menu
vv
[In Gauge Window]
10 – Security Menu [In Gauge Window]
Appendix A – Using Function Keys
Introduction …… 5-1
Saving and Recalling Plot Setups …… 5-3
Changing Display Ranges & Scales …… 5-4
“Real Time” Plot Controls …… 5-5
“History Data” Plot Controls …… 5-5
Channels …… 5-7
Filtering Data …… 5-8
6 – Toolbar Buttons
eZ-TOMAS 937694 iii
Page 4

iv 937694 eZ-TOMAS
Page 5
Introduction 1
What is eZ-TOMAS ? …… 1-1
Tips for Using eZ-TOMAS …… 1-1
Starting eZ-TOMAS …… 1-2
Connecting Signals …… 1-2
The Order of Operation …… 1-3
A Look at the Guage Window & Control Pull-down Menu…… 1-4
In regard to data acquisition systems, the following terminology is used t hroughout this
manual:
Reference Note:
The information provided in this manual applies to ZonicBook, Medallion, and WaveBook
systems with exceptions as noted. Refer to your system’s specific hardware documentation
in regard to hardware setup.
ZonicBook refers to a ZonicBook/618E.
Medallion refers to any of the three ZonicBook-Medallion models.
WaveBook refers to WaveBooks in general, except when a specific model is
specified.
What is eZ-TOMAS?
eZ-TOMAS (Total Online Monitoring and Analysis Software) is designed to collect vibration and process
data from rotating machinery. eZ-TOMAS can simultaneously monitor, acquire, store, and display data
from Medallion, ZonicBook, and WaveBook systems.
The signals to be acquired are typically associated with a specific machine train. The analog inputs can be
any combination of Proximity, Velocity, Accelerometer, Tach, or DC proportional voltage signal. Up to
three tachometer signals are supported.
Tips for Using eZ-TOMAS
The following suggestions should make your use of eZ-TOMAS more efficient.
1.
For Medallion only: Make sure your Medallion’s Dip Switches are configured correctly.
Typically: Single Ended, AC coupled, and ICP ON.
2.
For Medallion and WaveBook: Use a standard channel location convention.
Typically: A single Tach is used at channel 8.
For ZonicBook: Tachometers are typically connected to tach-designated input channels.
3.
eZ-TOMAS 987294 Introduction 1-1
Page 6
Starting eZ-TOMAS
To run eZ-TOMAS, double-click the eZ-TOMAS icon or use your Windows d esktop
Start button to navigate to the program file.
The first time you start eZ-TOMAS you will be prompted for your name, your
company name, and a password. This password is the software key that will activate
eZ-TOMAS for every day operations.
If you are loading your software from a CD the password accompan ies the CD. If you downloaded your
software from the website, your password will be e-mailed to you within one business day.
You will next be prompted to set up your project’s security password. When you click the <Save> button
the Password Confirm window opens. Retype your security password and click the <Confirm> button.
After your password is accepted, you are returned to the Main window.
Connecting Signals
Registration Form
Medallion Users
Connect the analog signals to the Medallion’s BNC inputs. Typically, proximity and DC proportional
signals should be DC coupled; and Accelerometer, Velocity, and Tach signals should be AC coupled.
Prox: SE(single ended) DC Coupled ICP off
Accel/Vel: SE AC Coupled ICP on
Tach: SE AC Coupled ICP off
Note that these settings are made via Medallion’s DIP switch.
Reference Note:
If necessary, refer to the Medallion user manual (p/n 1086-0901) for information regarding
the following:
• Software Installation
• System Requirements
• Hardware Setup
• Driver Installation
WaveBook and ZonicBook Users
Connect the analog signals to the analog input BNC connectors. WaveBooks, ZonicBooks and the WBK14
and WBK18 dynamic modules require no physical hardware configuration. All hardware configuration is
accomplished through software.
Reference Note:
Information regarding the following products is provided in documentation as follows:
WBK14 and WBK18 - WBK Options Manual (p/n 489-090 2).
WaveBook - WaveBook User’s Manual (p/n 489-0901).
ZonicBook/618E - ZonicBook/618E User’s Manual (p/n 1106-0901).
PDF versions of the documents are included on your data acquisition CD.
1-2 Introduction 987294 eZ-TOMAS
Page 7
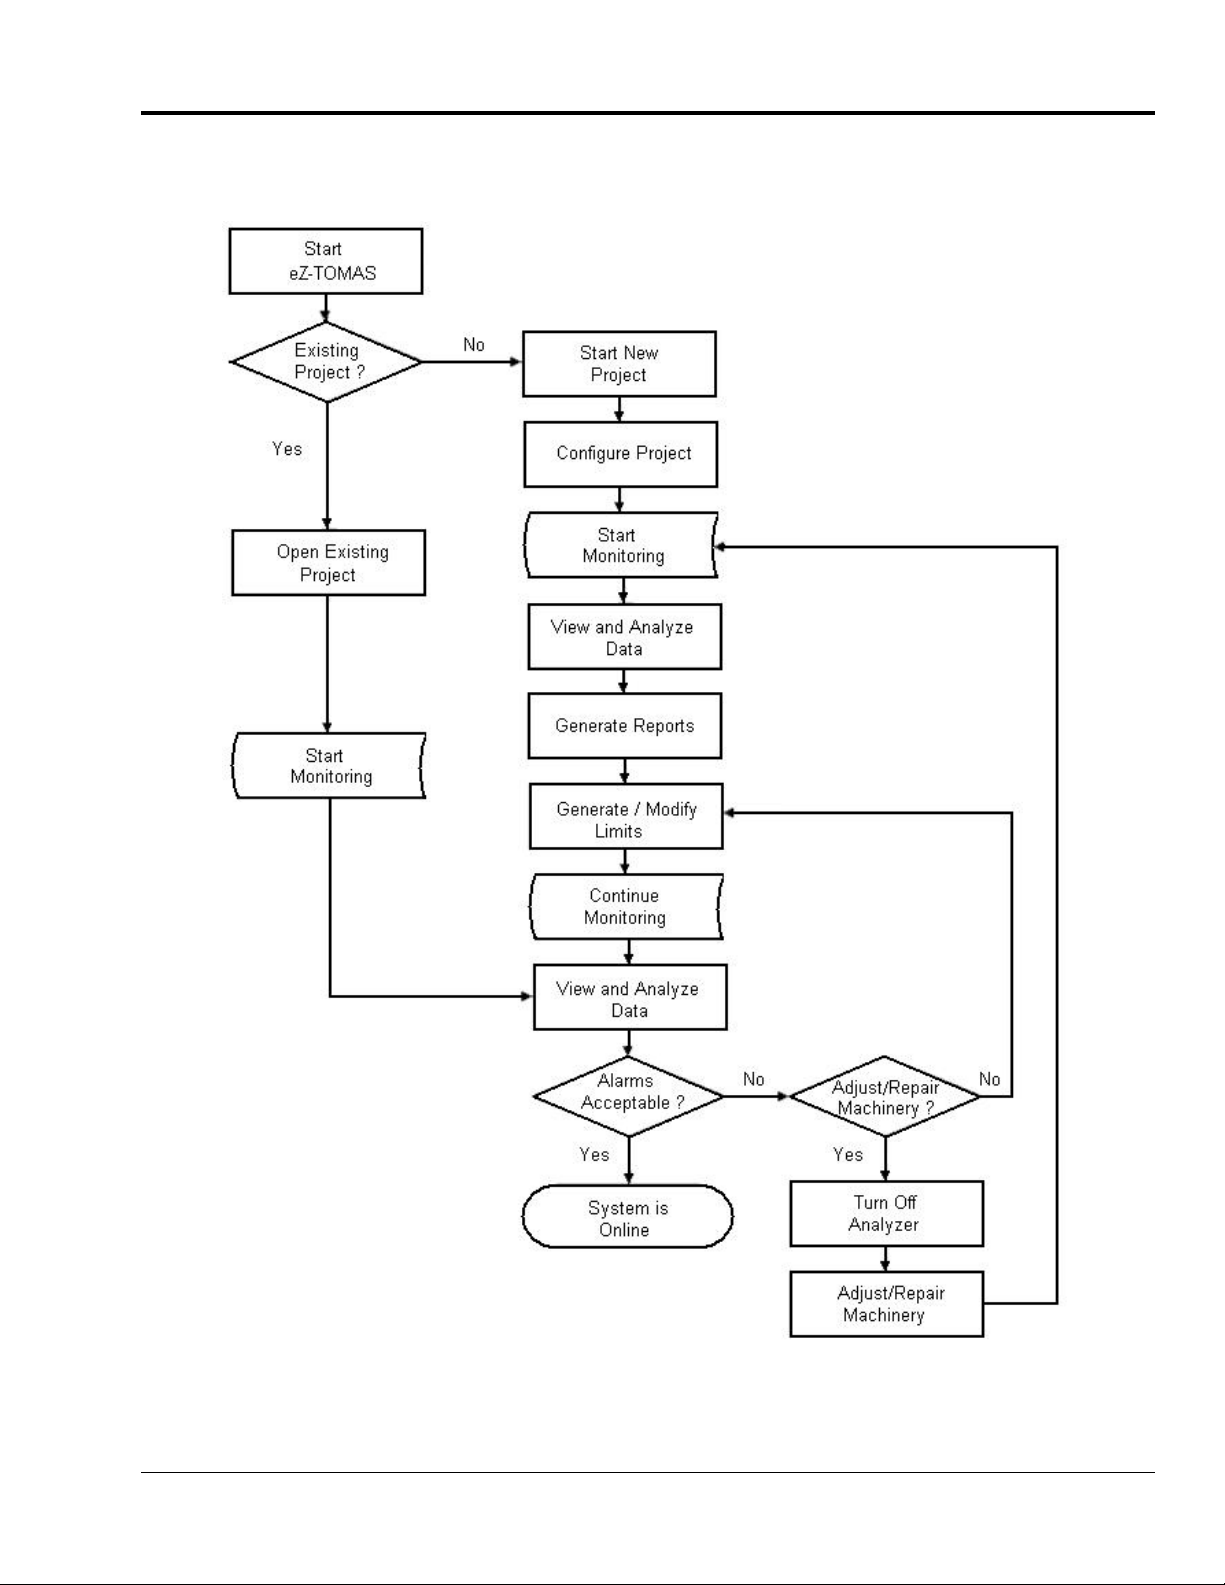
The Order of Operation
eZ-TOMAS 987294 Introduction 1-3
Page 8
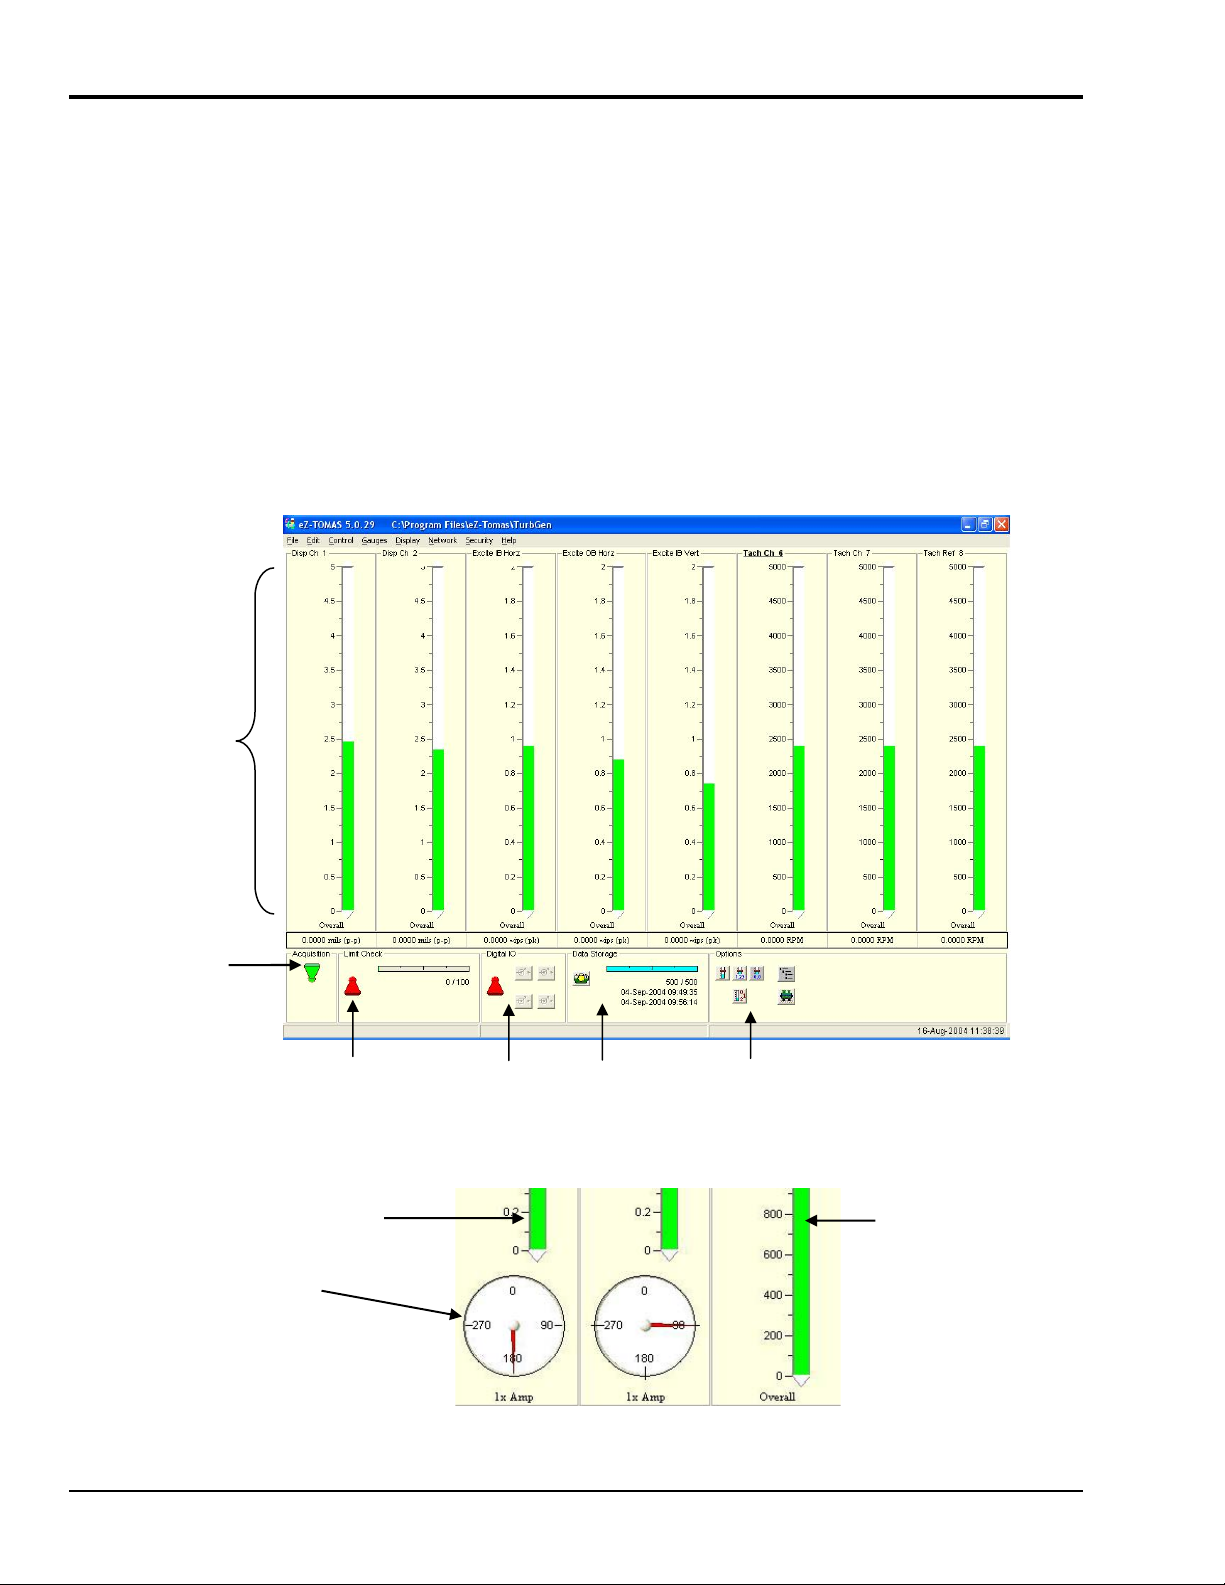
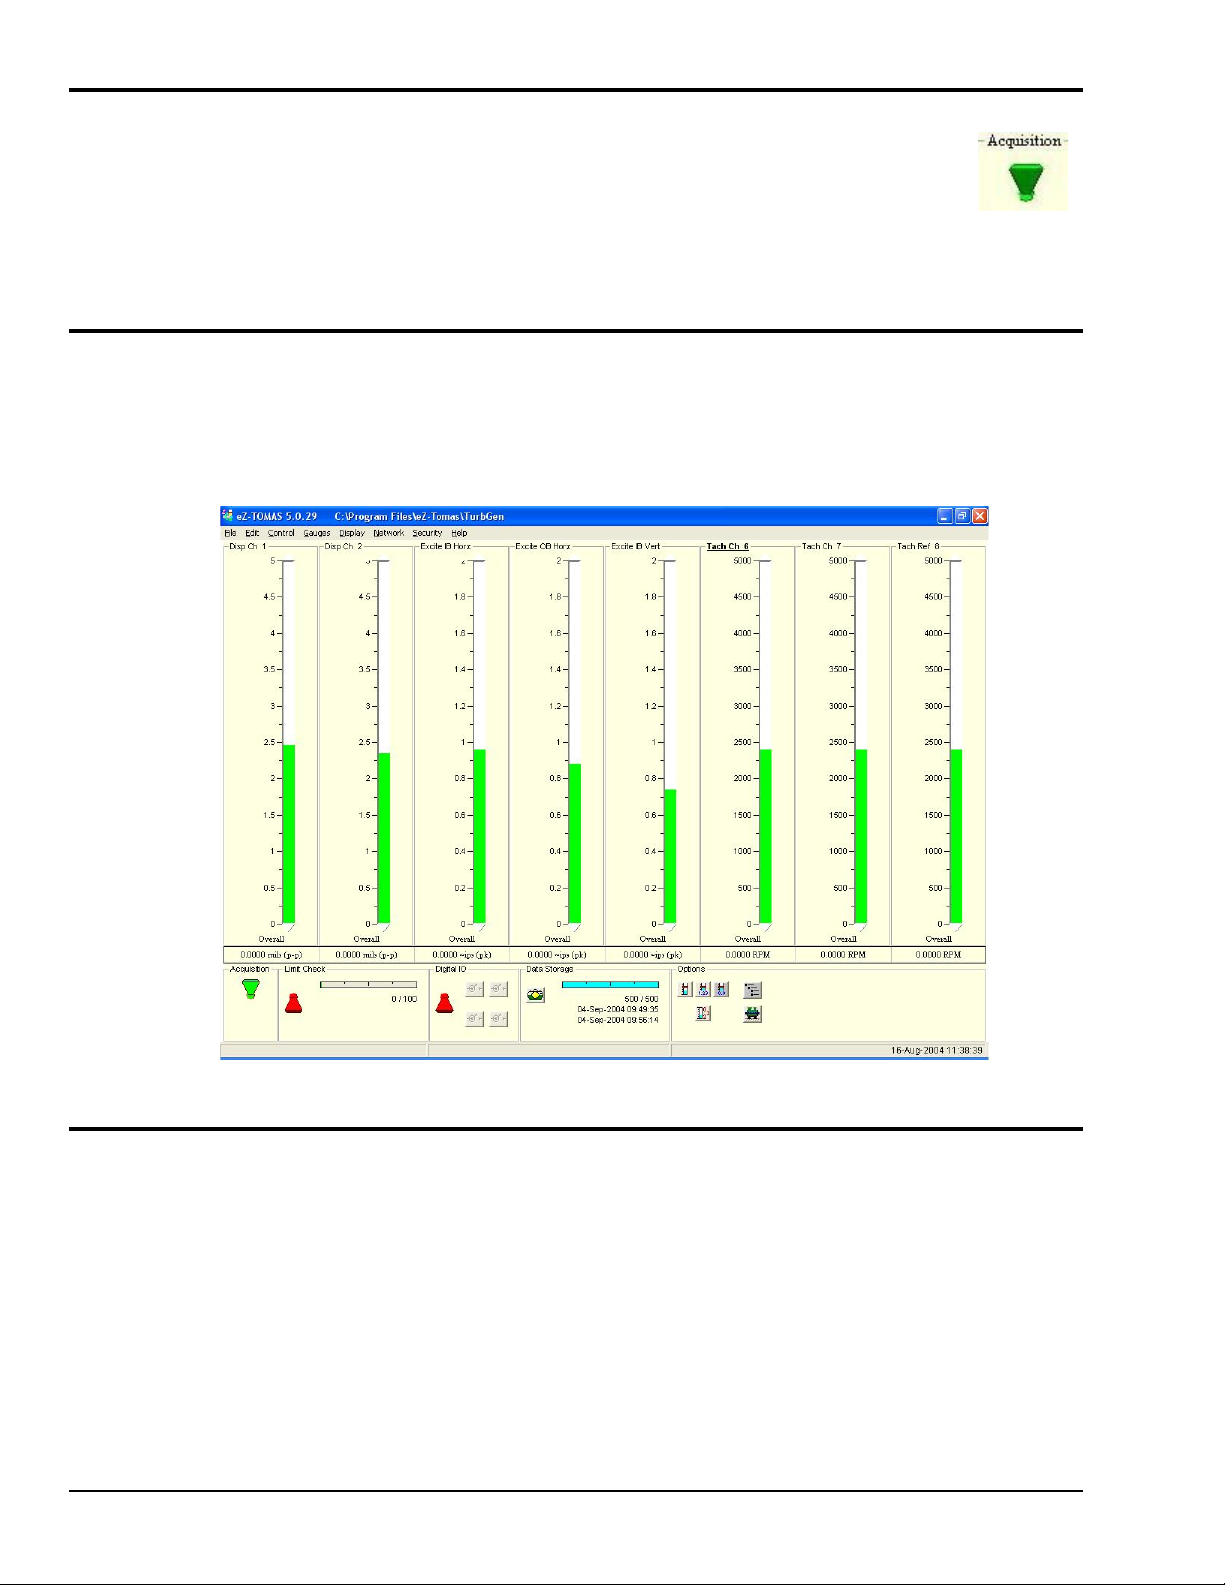
A Look at the Gauge Window & Control Pull-down Menu
The Gauge Display Window is used to show real-time values and measurement status. Gauge Display is
not used for historical data analysis. A Data Display Window, discussed elsewhere, is used to analyze realtime and historical data.
The Gauge Display Window’s Control pull-down menu repeats the functions of the Gauge window’s lower
panels. For example, menu selections can be used in place of several Option panel buttons, as well as the
toggle switches and snapshot button. The menu provides a means of displaying high and low peak values,
gauge values, a machine image, and a list of eZ-TOMAS projects. The menu and its functions are depicted
on the Gauge window figure on the following page.
The main window of the GUI (graphical user interface) includes a set of virtual gauges, which use one of
10 spectral bands, discussed shortly. There will always be a vertical gauge associated with each input
channel. When the 1x Amp/Phase selection is made, spectral bands for “1x Amplitude” and “1x Phase” are
simultaneously displayed, with the later being in a circular phase gauge (see second figure).
In addition to spectral band gauge displays, eZ-TOMAS can interactively display data in a variety of other
formats, including: Orbit, Polar, Time, Bode, Cascade/Waterfall, Strip Chart, and Shaft Centerline.
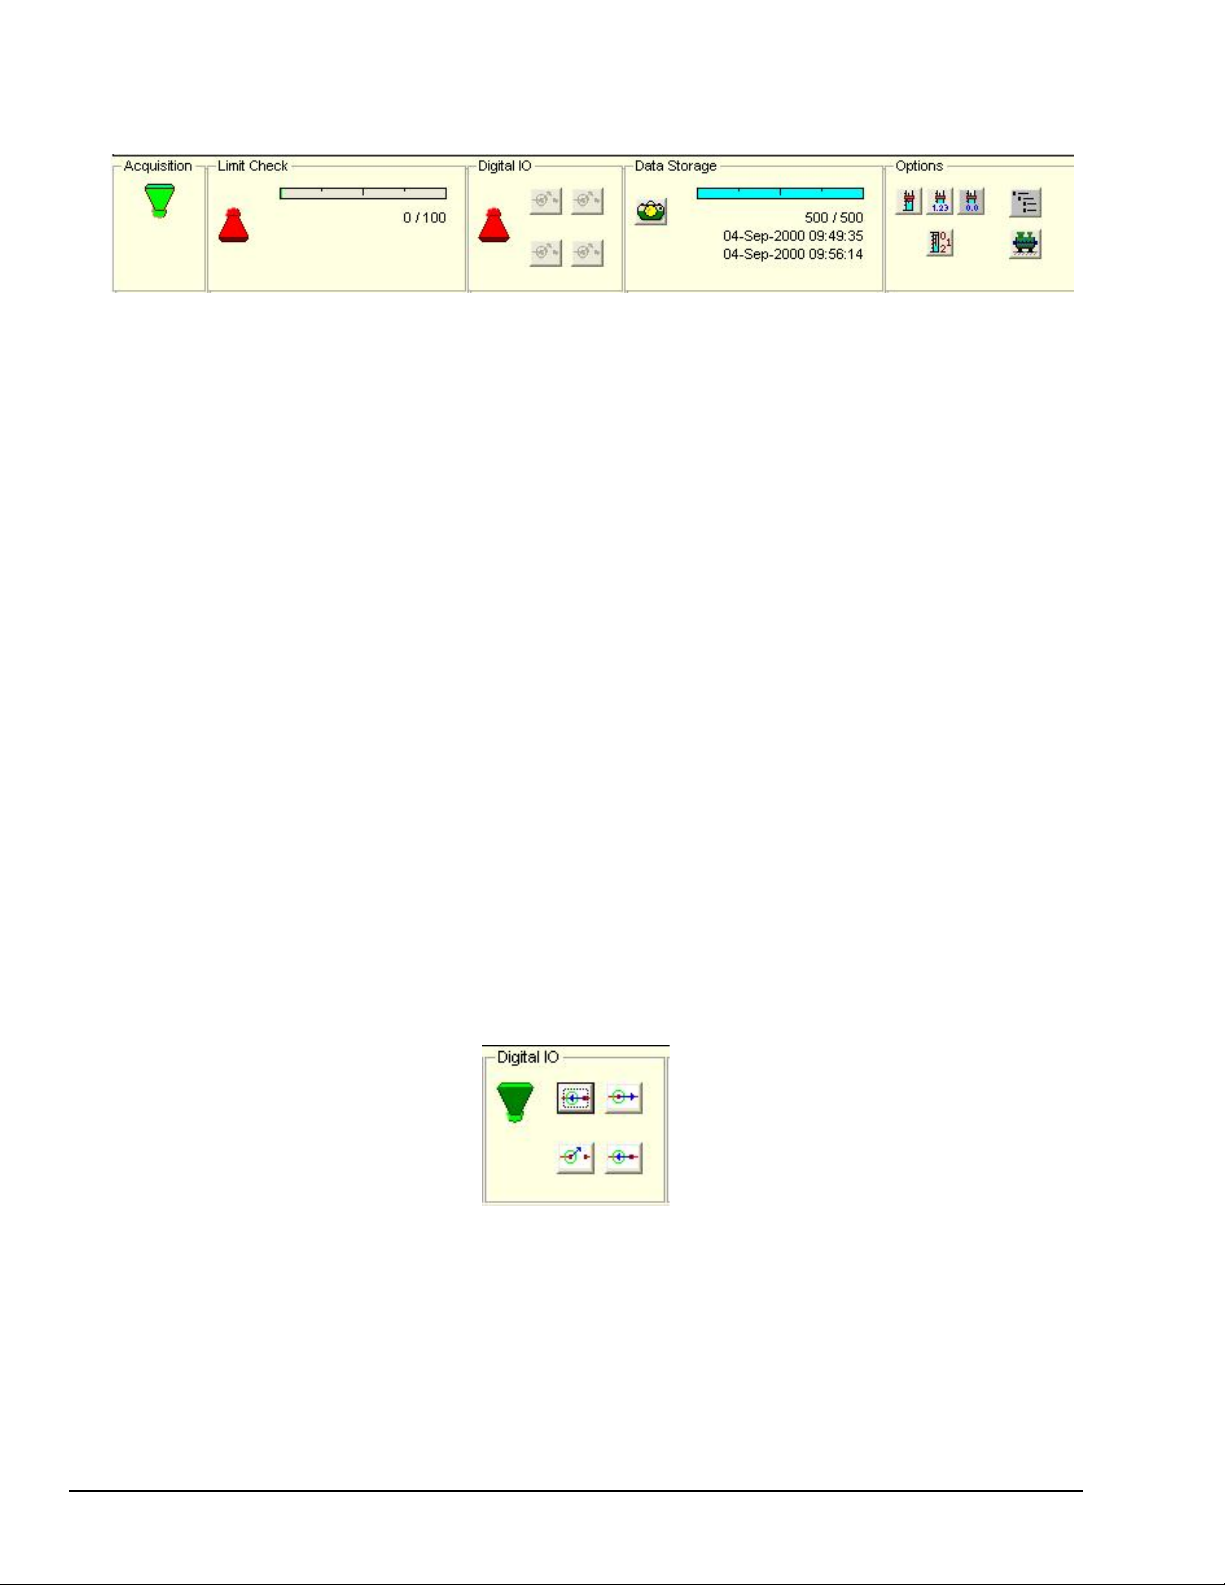
Instrument
(Gauge) Panel
Acquisition
Panel
Limit Check Digital I/O Data Storage Options
Gauge Window, “Overall” Spectrum Selected
Vertical Gauge for
1x Amp
Circular Phase
Gauge
Vertical Gauge
Tach Ref (RPM)
Shown for reference.
Vertical Gauges (partial) and Circular Phase Gauges
1-4 Introduction 987294 eZ-TOMAS
Page 9
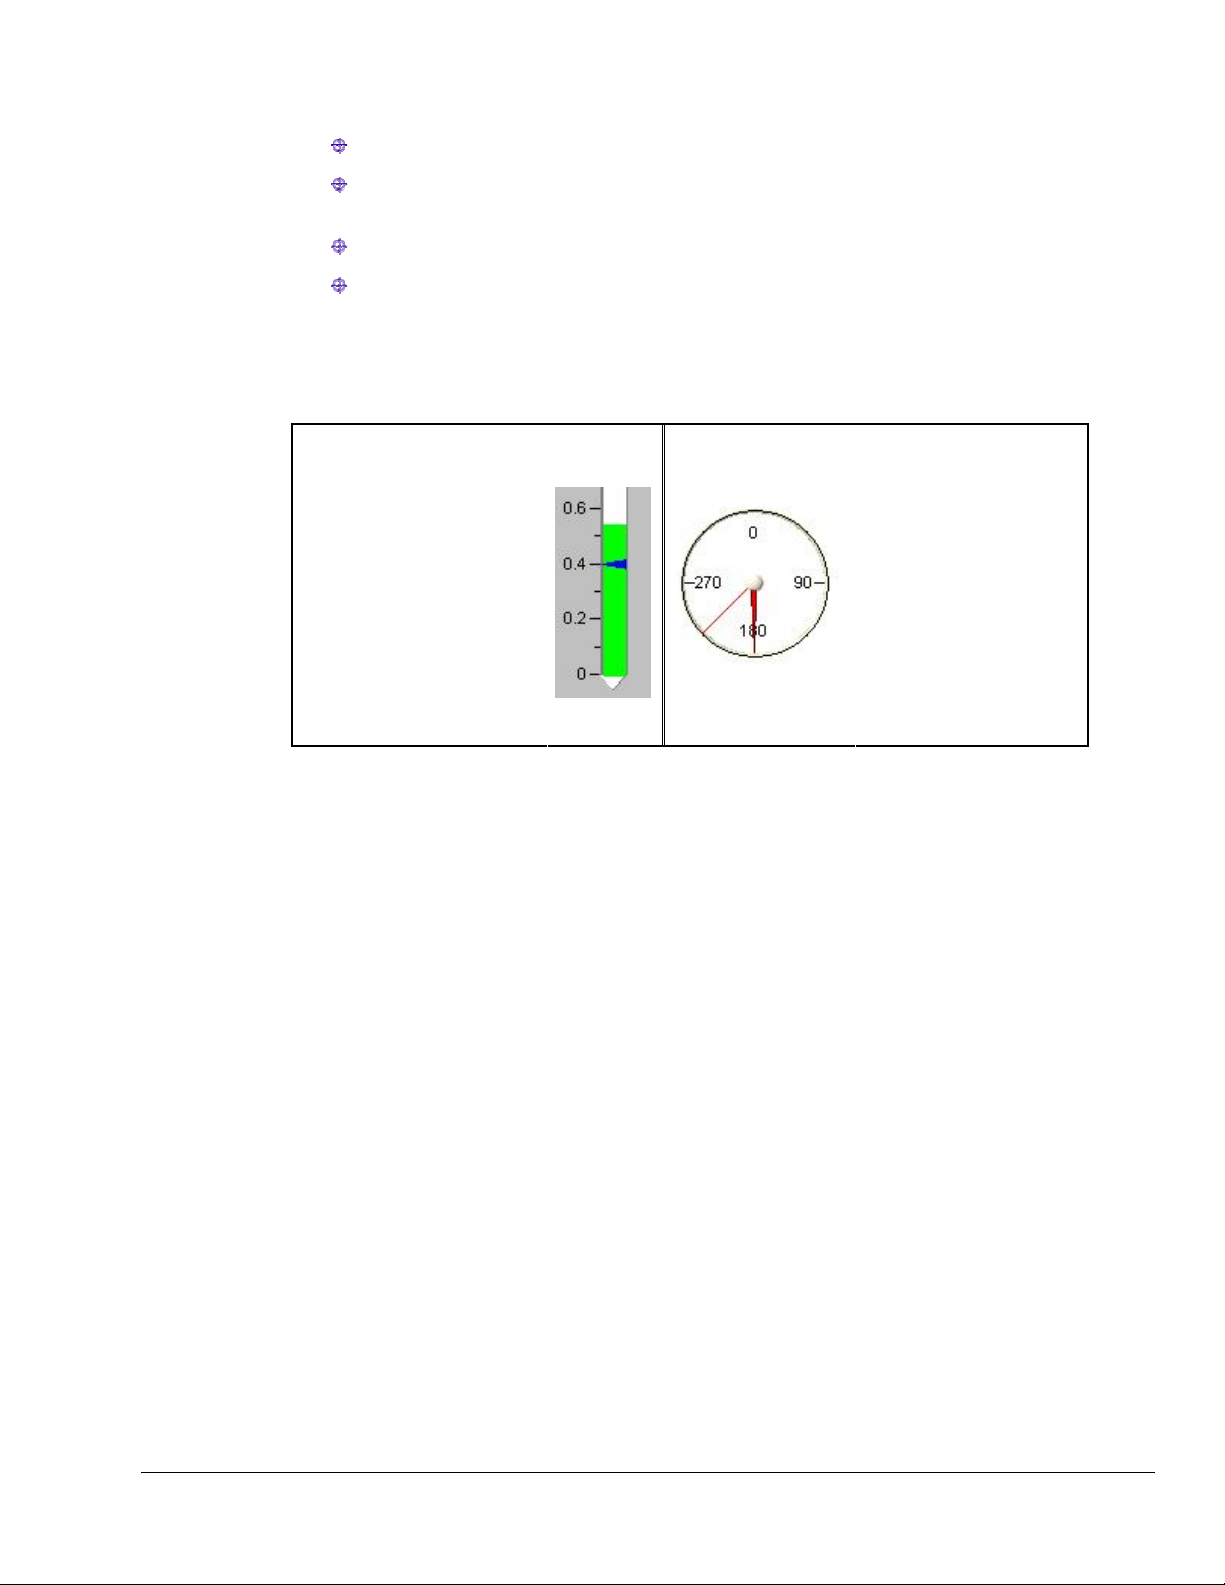
You can “mouse-clicks” on the gauges to:
Bring up the Limit Configuration Window.
Bring up the Input Channels Tab (on the Setup Configuration Window). This cannot be done
from circular phase gauges.
Drag limit-pointers on vertical gauges to new positions, thus setting new limit values.
Drag limit-lines on circular phase gauges to new positions, thus setting new values for the phase
angle limits.
Although the configuration windows and limits are discussed later, an explanation of how to access them
from the gauges directly follows.
Vertical Gauges Circular Phase Gauges
“Right-Click” on an active
limit-pointer to bring up the
Limit Configuration Window.
“Right-Click” elsewhere in a
vertical gauge to bring up the
Input Channels Tab [on the
Setup Configuration
Window].
“Left-Click and Hold” on a
limit-pointer to drag it to a
new position, thus setting a
new limit value.
“Right-Click” within the
confines of a circular
phase gauge to bring up
the Limit Configuration
Window.
“Left-Click and Hold” on a
limit-line to drag it to a
new position, i.e., a new
limit angle.
eZ-TOMAS 987294 Introduction 1-5
Page 10
The data acquired by eZ-TOMAS and the supporting configuration information are stored in user-defined
files. This allows a single eZ-TOMAS system to be used with several different machines. The acquired
data is stored according to user-defined event changes, e.g., time, overall, and rotating speed.
Acquisition, instrumentation, and storage configuration parameters are also definable. These parameters
are stored over time. Configuration changes do not invalidate previously acquired data.
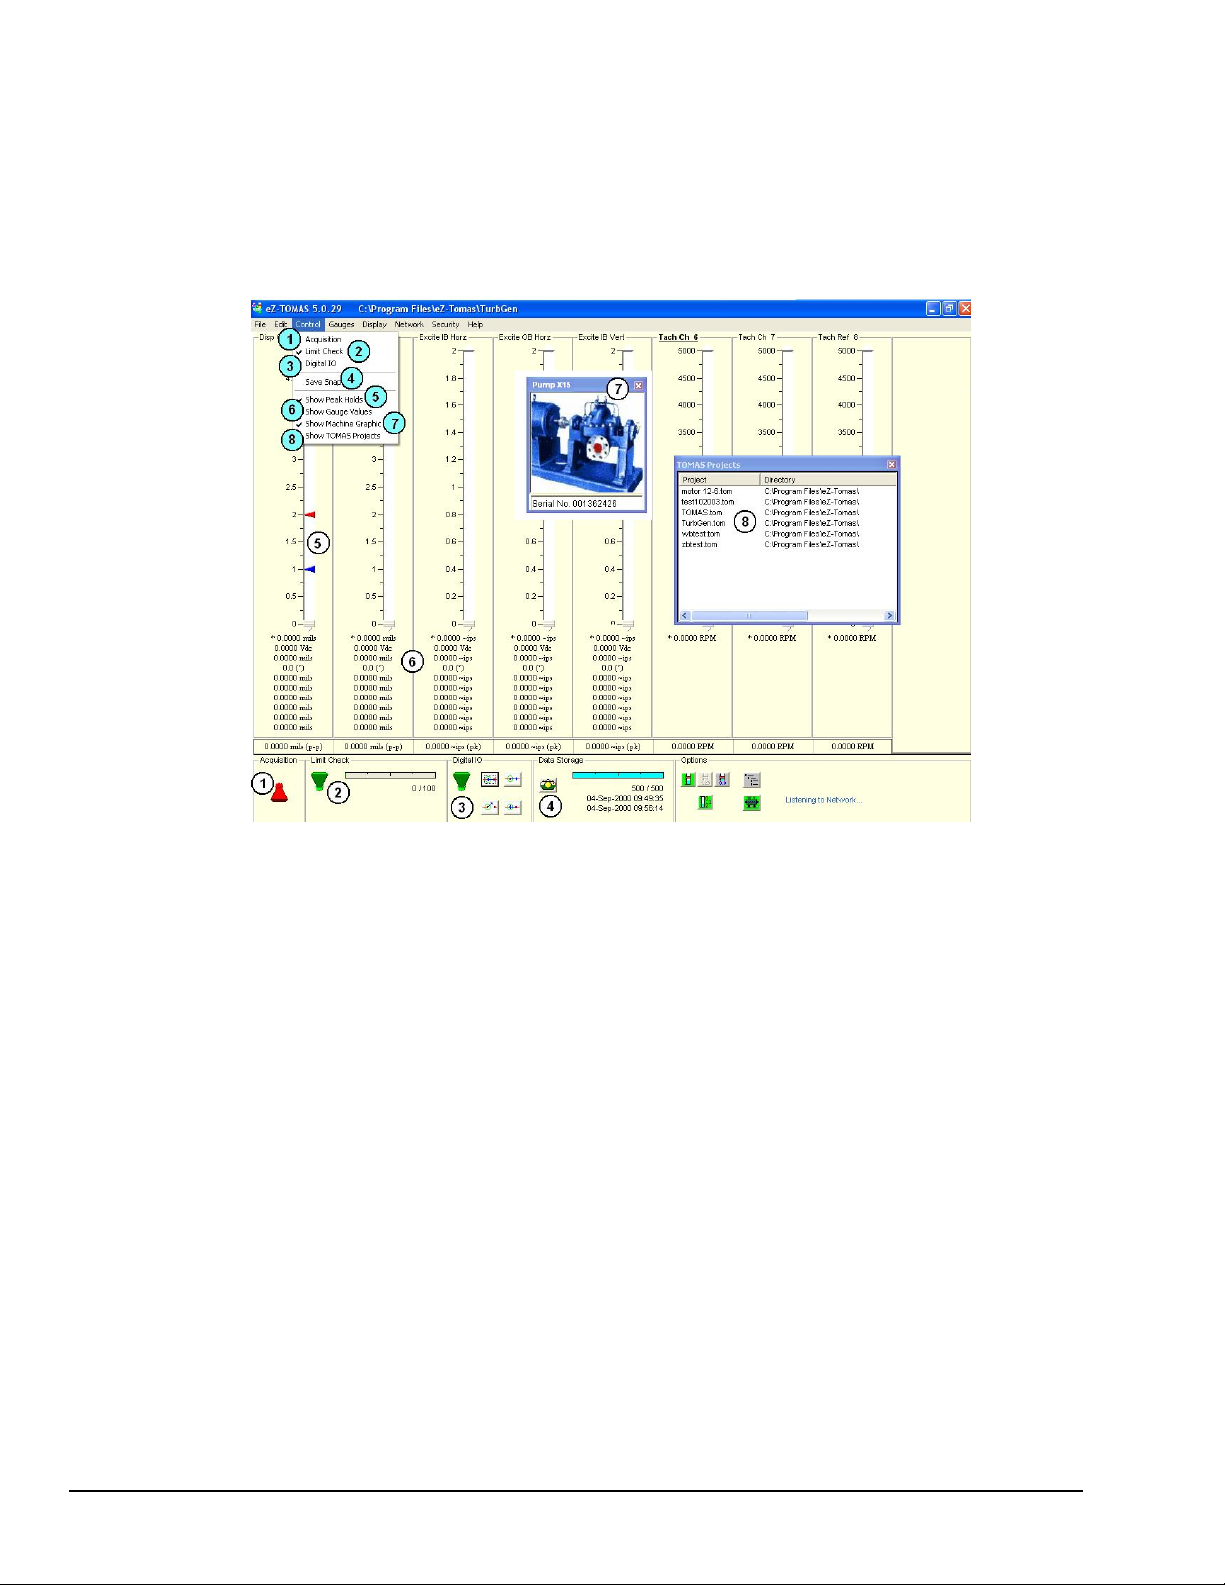
Functions of the Control Pull-Down Menu
The straight-forward functions of Control Pull-down menu are depicted in the above figure. The shaded
numbers in the menu relate to the corresponding non-shaded numbers. The functions, which are selfdescriptive by name, are as follows:
1) Acquisition – can be use to turn the acquisition on or off, just as can the acquisition toggle switch.
2) Limit Check – can be used in the same manner as the Limit Check toggle switch.
3) Digital I/O – can be used to turn Digital I/O on or off. Same functionality as the Digital I/O
toggle switch.
4) Save Snapshot – A data storage trigger that can be used instead of the “camera” button. The
duration of the data collection is set in the Storage Tab of the Setup Configuration window
[accessed via the Edit pull-down menu].
5) Show Peak Holds – Used to display [or hide] high and low peak markers.
6) Show Gauge Values – Used to display [or hide] gauge values.
7) Show Machine Graphic – Used to show or hide a graphic. The image can be positioned
anywhere on the screen.
8) Show TOMAS Projects – Accesses a list of projects and their associated directory locations.
1-6 Introduction 987294 eZ-TOMAS
Page 11
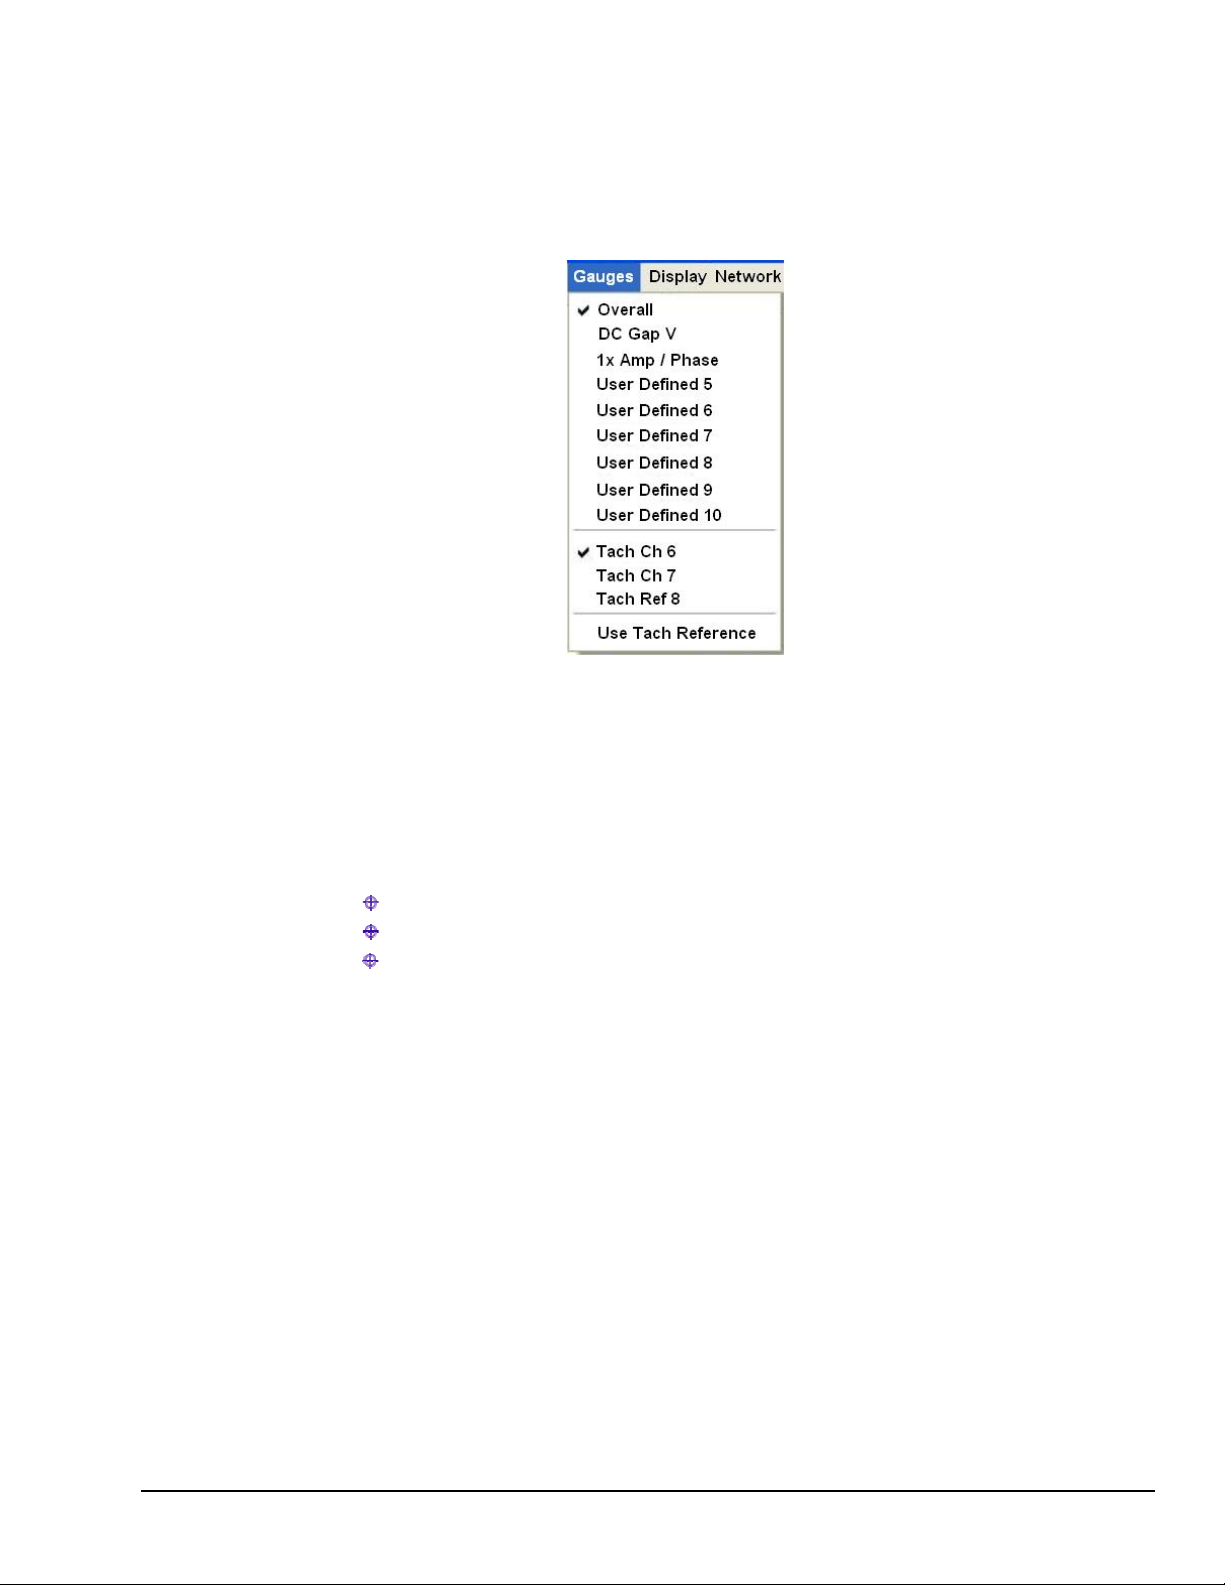
The Spectral Bands and Tachs
Most of the Gauge window is occupied by gauges which display values for spectral bands and tachometers.
Selection of the band types and the tachs can be made from the “Gauges” pull-down menu.
Gauges Pull-down Menu
To select a spectral band with the mouse, open the Gauge pull-down menu, then place the mouse cursor
over the selection and click on it. In the preceding figure, Overall has been selected. Note that the Overall
value is a time domain overall value.
The Overall, DC Gap Voltage, 1x Amp, and 1x Phase spectral bands cannot be modified. In regard to
probe values:
Displacement probe measurements are displayed as peak-to-peak values.
Velocity probe measurements are displayed as zero-to-peak values.
Accelerometer probe measurements are displayed as zero-to-rms values
You can define the parameters of User Defined bands 5 through 10 in the Setup Configuration window.
To define a parameter:
1. Open the Edit pull-down menu.
2. Select Setup.
3. From the Setup Configuration window select the Spectral Bands tab.
4. Set the parameters of the User Defined bands.
eZ-TOMAS 889895 Introduction 1-7
Page 12
Gauge Window – The Lower Panels
Acquisition Panel
The Acquisition Panel contains one toggle switch, which determines the ON/OFF status of data acquisition.
Click this toggle switch to turn data acquisition ON (Up/Green), or OFF (Down/Red).
Limit Check Panel
The Limit Check panel contains a toggle switch and an alarm log progress bar. The Limit Check toggle
switch determines the ON/OFF status of the Limit Checking feature. Click this toggle switch to turn limit
checking ON (Up/Green), or OFF (Down/ R e d) .
The Alarm Log Progress Bar graphically indicates how full the Alarm File is.
Double-clicking on the bar, or on its associated text, opens the Alarm Log. The log can also be accessed
from the Reports pull-down menu. The most recent alarm event will appear below the bar.
Gauge Window, Lower Panels
Digital I/O Panel
The Digital I/O Panel contains an ON/OFF toggle switch and four push buttons. The push button icons
indicate the current status of the digital I/O. Each time you start eZ-TOMAS, the switches will be turned
off and appear gray. The Digital I/O toggle switch must be turned “ON” to enable digital I/O functionality.
If the DIO toggle switch is turned on, Digital I/O relay switches will activate [or deactivate] depending on
the configuration set in the Digital I/O Configuration window (detailed in chapter 4). The window is
accessible via the Edit pull-menu.
During an acquisition you can manually activate each of the four switches by clicking on the associated
button.
Note that in the following figure, the Digital I/O push buttons are as follows.
Top two: Digital Input, Digital Output [Normally Closed]
Bottom two: Digital Output [Normally Opened], Digital Input.
Digital I/O Panel
The four Digital I/O button icons agree with the setup in the Digital I/O Configuration window.
1-8 Introduction 889895 eZ-TOMAS
Page 13
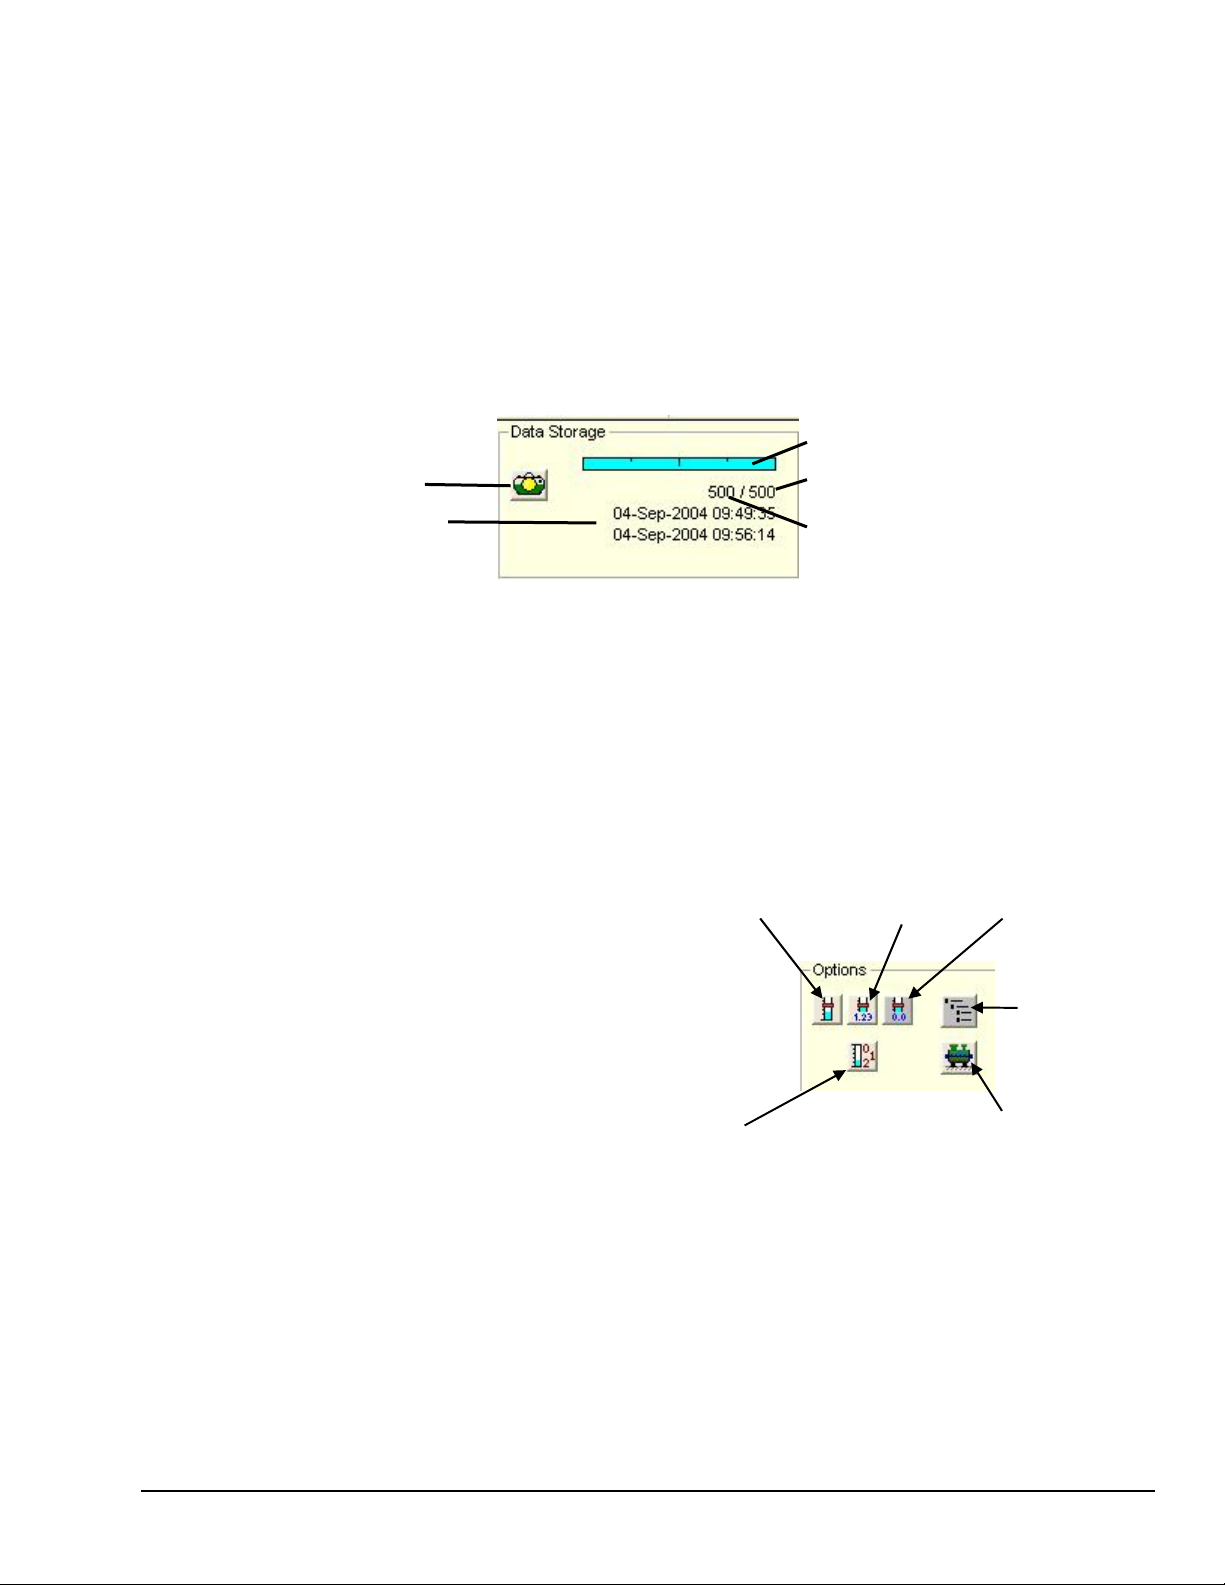
Data Storage Panel
The Data Storage Panel is easily recognized by its Snapshot [camera] button and the bar for Current Data
Record / History File Size.
The bar graphically indicates how full the FIFO file is. Two numbers, separated by a slash, reside just
below the progress bar. In the example this is 500 / 500. The first number is the current data record
number; the second is the number of records that can be stored in the FIFO file, also referred to as the
History File Size. In this case the data file is full.
Clicking the <Snap Shot> (camera) button will save “N” seconds of data to the history file; where “N” is
defined in the Storage Tab [in the Configuration Panel]. The data storage panel includes the Historical Data
File Date Range.
Note that you can open the Plot Window from this panel by double-clicking on the capacity bar, the record
numbers, or the date text.
FIFO Records Capacity Bar
Snapshot
Data File’s
Date/Time Range
Number of Records that can be stored
(History File Size)
Number of Records currently stored
Data Storage Panel
Note: The <Snap Shot> button initiates multiple continuous snapshots for “N” seconds of time data. The
time (in seconds) “N” is defined in the Storage Tab of the Setup Configuration Window.
Options Panel
The Options Panel provides a means of
easily displaying the following:
• peak hold gauge pointers
• peak values
• all real time values
(all gauge values)
• a list of eZ-TOMAS projects and
their associated directory
• a graphic to represent the machine
• a graphic to indicate network
trafficking (see second figure)
Display Peak Hold
Gauge Pointers
Display All
Gauge Values
Show Peak
Hold Values
Reset Peak Hold
Gauge Values
Display list of
TOMAS
projects
Display Machine
Graphic Picture
eZ-TOMAS 889895 Introduction 1-9
Page 14
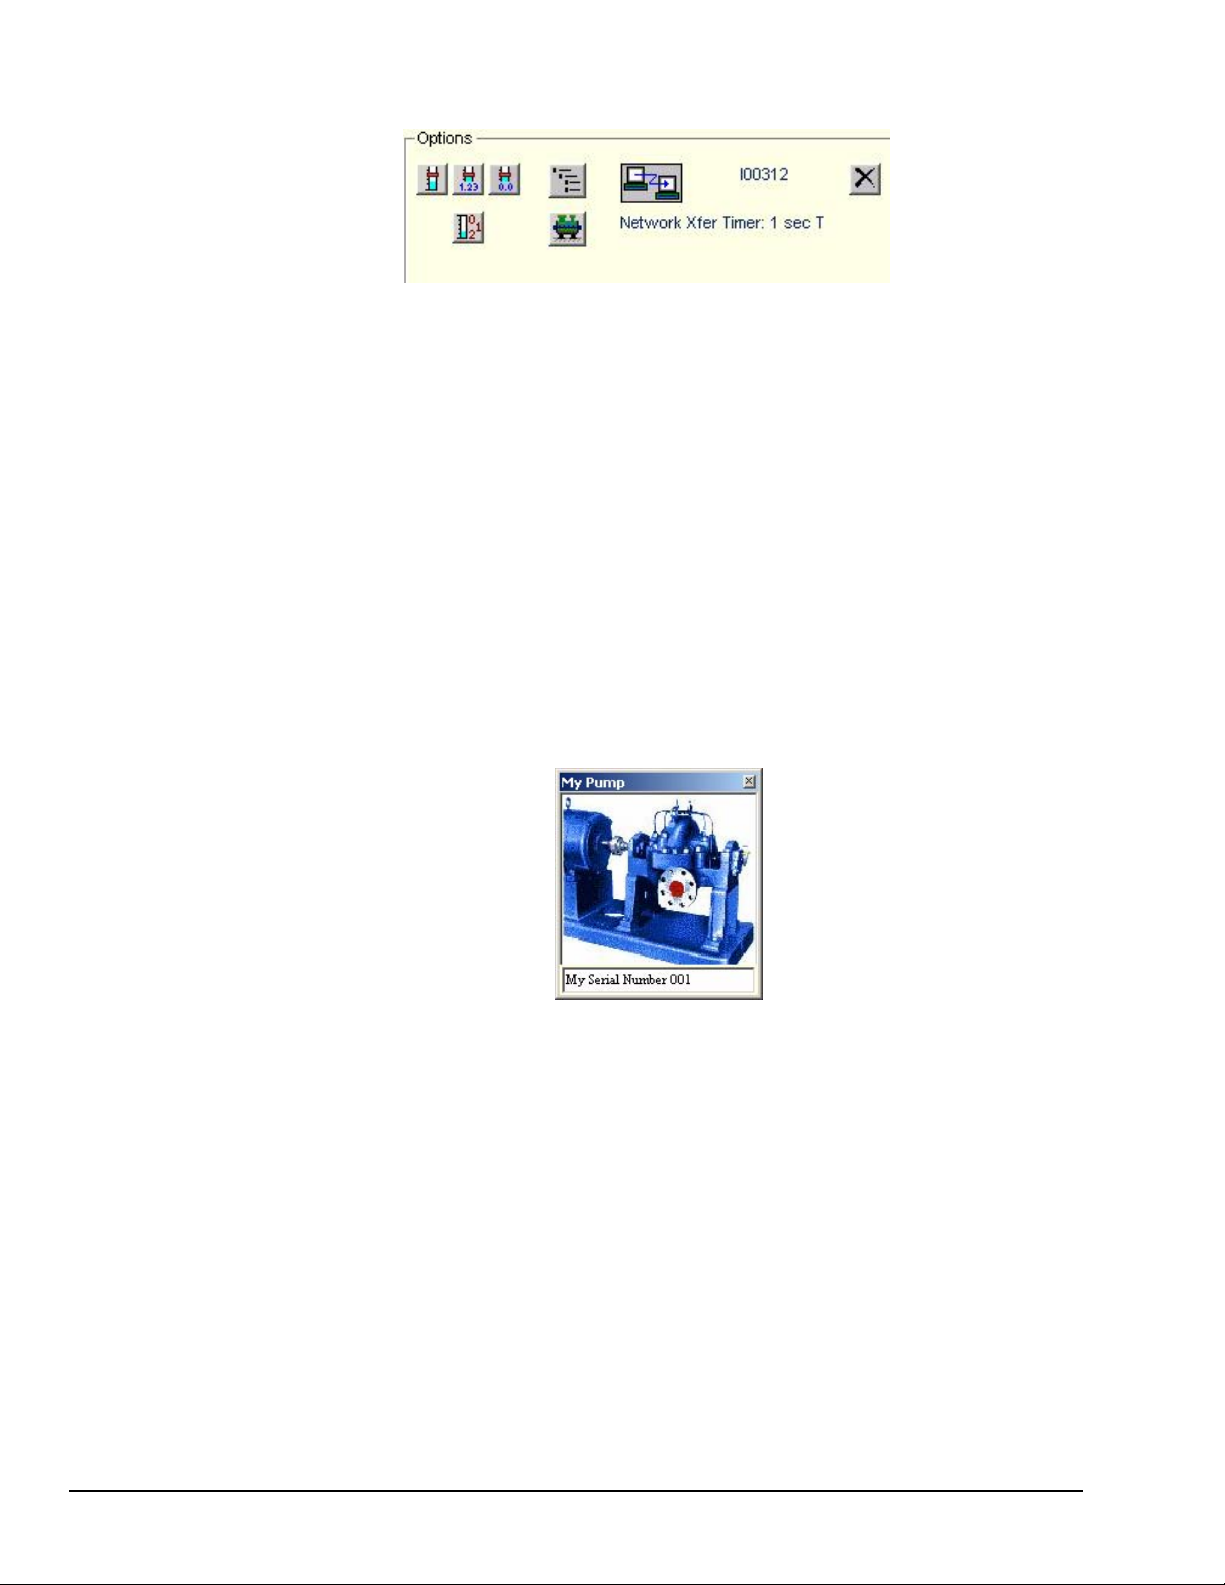
When eZ-TOMAS is being used by multiple computers, a network xfer graphic appears, as indicated in the
follow figure. Networking is discussed in Chapter 9.
Options Panel with the Network Xfer Icon
The Options Panel includes a <Rese t Peak Hold Gauge Values> button. Clicking the button momentarily
resets the peak values. However, the new peak acquisition values [which exist after the point of reset] will
immediately apply.
Clicking the <Display Machine Graphic Picture> button brings up a separate window, which allows you
to select a jpeg or bitmap image to represent the machine, for example, a picture of an engine or turbine. A
text field is present, which is convenient for entering a machine identifier, such as a serial number or a
factory reference label (see figure at right).
To change the title bar of the machine graphic, pull down the Gauge Window’s” Edit menu, select “Display
Preferences,” then type the desired entry into the Machine Information panel’s “Name” field.
In regard to the graphic image, if you right-click in the window, two choices will appear: “Load graphic
picture” and “Remove Graphic Picture.” Clicking on the former allow you to browse your PC for the
appropriate graphic. Note that this can also be accomplished through the Edit pull-down menu.
Machine Graphic Picture
1-10 Introduction 889895 eZ-TOMAS
Page 15

Monitoring a Machine 2
Creating a Project …… 2-1
Using “Initialize Project”….. 2-2
Using “New (Clone) Project”……2-4
Configuring the Project …… 2-5
Starting an Acquisition …… 2-6
Viewing Spectral Bands …… 2-6
Plotting Data …… 2-6
Multiple Plots …… 2-6
“Real Time” Plot Controls …… 2-7
“History Data” Plot Controls …… 2-8
Viewing Reports …… 2-9
Creating a Project
An eZ-TOMAS Project is a collection of data files, typically associated with a monitored machine. The
data files include configuration and measured data. When eZ-TOMAS runs it attempts to open the last
eZ-TOMAS Project accessed.
If you are monitoring a machine for the first time, you should create a new eZ-TOMAS Project to store the
machine’s configuration and vibration data. If you have already created an eZ-TOMAS Project for the
machine, use the File Open menu to pick up where you left off.
The vibration data files have a FIFO design. When you turn on the acqu isition switch, data will be
appended to the data files.
eZ-TOMAS 987294 Monitoring a Machine 2-1
Page 16
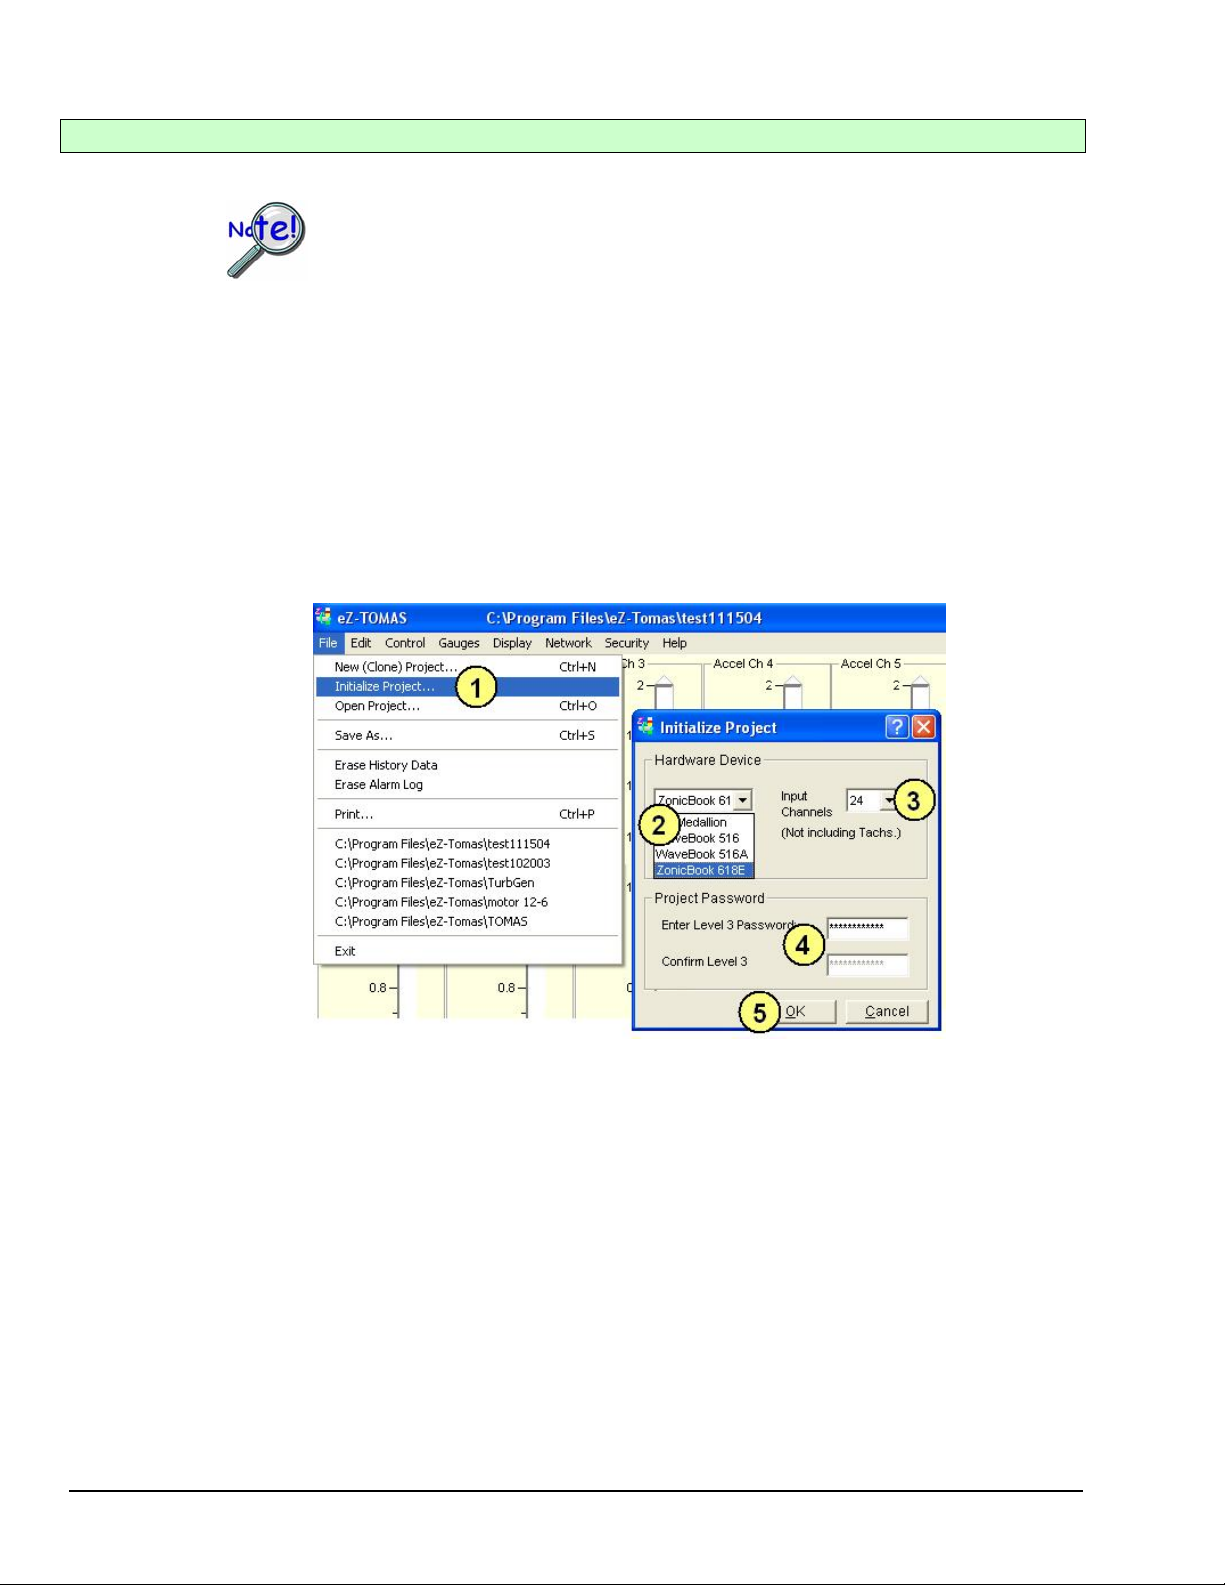
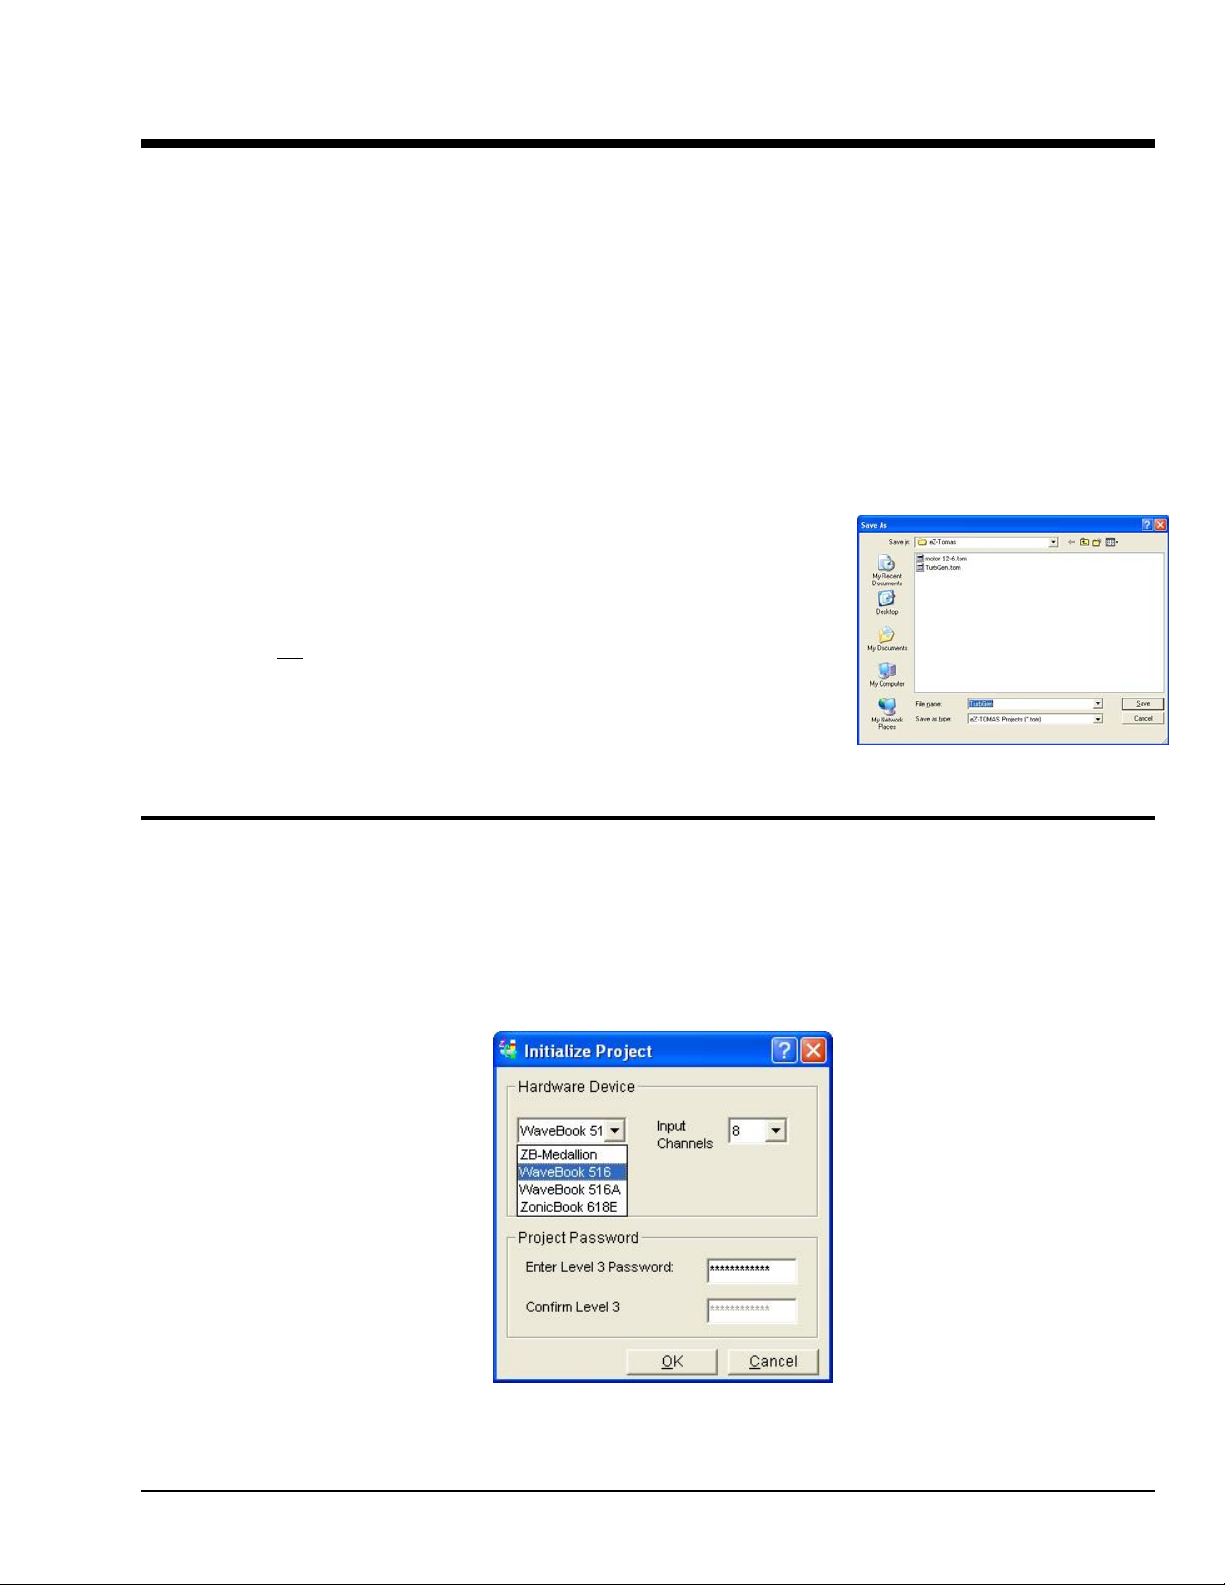
Using “Initialize Project”
If you have multiple hardware modules, and change the number of Input Channels, you
need to use the initialize function to create a new eZ-TOMAS Project. This needs to be
done once, for the first implementation of the new hardware setup. An explanation of
how to access and use the Initialize Project function follows.
When a project is initialized you are essentially starting with a “clean slate.” No data is
carried over, as would be when a project is cloned as discussed on page 2-4.
“Initialize Project” is accessed from the File pull-down menu. Initialize Project provides a means of
selecting the hardware device and setting the number of input channels. For example: If you had an 8
channel Medallion and were going to change your acquisition to 24 channels, for example, using a
ZonicBook/618E and two WBK18 modules, you would need to use the Initialize Project feature.
Complete the following steps to initialize a project. Note that the step numbers correspond to the numbers
in the figure.
1. From the File pull-down menu, open “Initialize Project.” An Initialize Project dialog will open.
2. Select the Hardware Device from the associated pull-down list.
3. Select the number of analog input channels from the associated pull-down list. For
ZonicBook/618E do not count the separate tach channels as input channels.
4. If applicable, enter and confirm the project password.
5. Click the <OK> button.
Staying with our 24 channel example [using a ZonicBook/618E and two WBK18 modules], the gauge panel
will now appear with three rows of data beneath the gauges (see following figure). Each row will have 8
data cells (one per input channel). Note that the gauge panel can display up to 7 rows of data, thus
accomodating 56 channels.
Only 8 gauges can be displayed at a time, but the cells allow you to choose which gauges to view, as will
be seen in the following three figures and related text.
Note: For greater clarity in the following three figures, gauges have been compressed vertically and several
gauges have been removed, e.g., channels 5, 6, an d 7 fo r Fi g 1; cha n nel s 1 3, 1 4, an d 15 for Fig . 2; and
channels 21, 22, and 23 for Fig. 3.
2-2 Monitoring a Machine 987294 eZ-TOMAS
Page 17
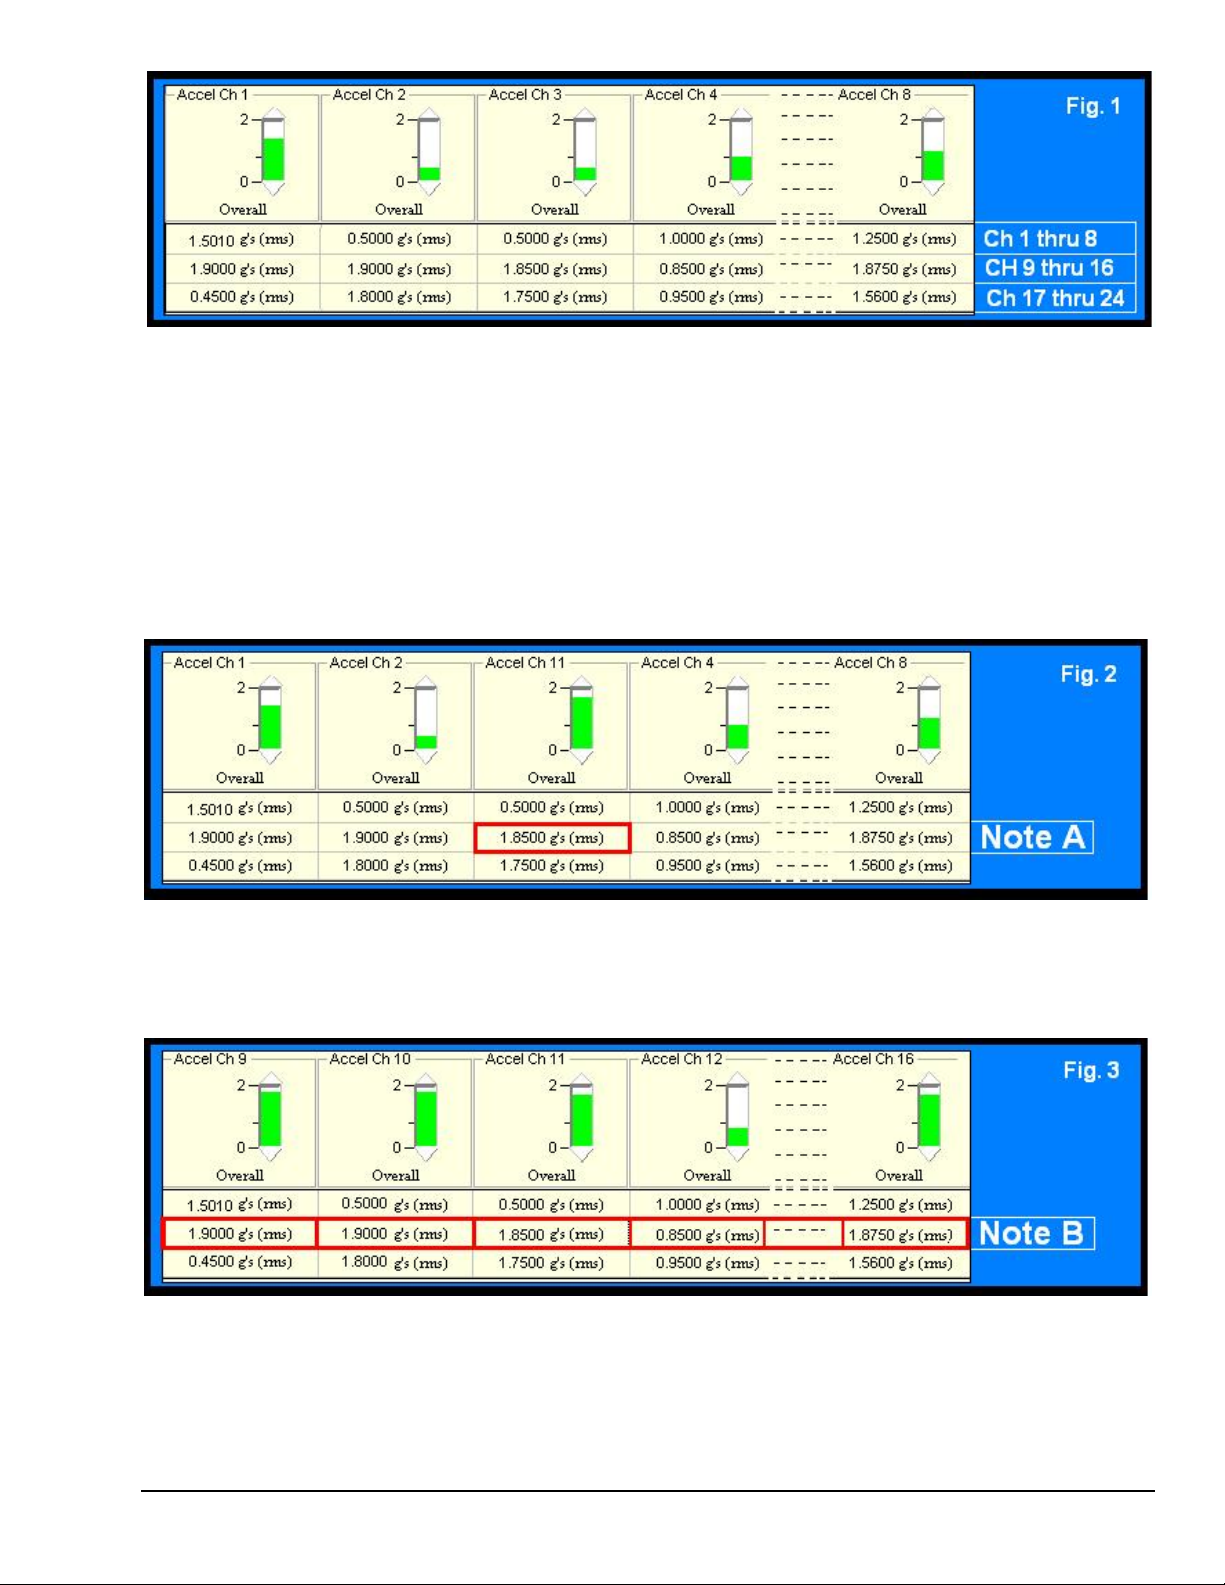
Fig. 1 Gauge Panel for 24 Input Channels – First Row (Channels 1 th rou gh 8) is selected for gauge display
In Fig. 1 we see that Accel Ch 1 through Accel Ch 8 are being display e d. Chan nel s 5, 6, and 7 would also be displayed, but
have been removed from the figure for clarity. In addition, the vertical gauges have been greatly compressed.
Below the gauges we see 3 rows of data cells. The top row provides data for Channels 1 through 8, the second row displays
data for channels 9 through 16, and the third row displays data f or channels 17 through 24. Up to 7 rows (channels 1 through
56) can be displayed.
We know that gauges are being displayed for channels 1 through 8. But suppose we wanted to see the gauge for channel 11?
A single click on the associated cell [in the second row] accomplishes this task. Simply single-click on the third cell in the
second row to display the gauge for Accel Ch 11. In the following figure we see that channel 11’s gauge replaced the
channel 3’s. This is because each of the 8 columns can display a gauge for only one channel at a time. Thus, column 3 is
home to channels 3, 11, and 19. The third gauge from the left can only display one of those channels at a time.
Fig. 2 - Displaying Accel Ch 11 in place of Accel Ch 3
Note “A” - Single click on a cell to display the gauge for that cell.
If we wanted to change our display to show an entire different set of gauges we could single click on individual cells; or we
could double-click on any cell in a row to display guages for all the chan nels in that row (see Fig. 3).
Fig. 3 - Selecting a New Set of Eight Gauges
Note B - Double-click on any cell in a row to display gauges for all channels in that row.
Notice the second row of data cells in Fig. 3. Double-clicking on any cell in that row causes all 8 channels in that row to
have a gauge display. The gauge for Accel Ch 1 has been replaced with a guage for Accel Ch 9, the gauge for Accel Ch 2
has been replaced with a gauge for Accel Ch 10, etc. If we double-clicked on a cell in the third row we would see gauges
displayed for channels 17 through 24.
eZ-TOMAS 987294 Monitoring a Machine 2-3
Page 18
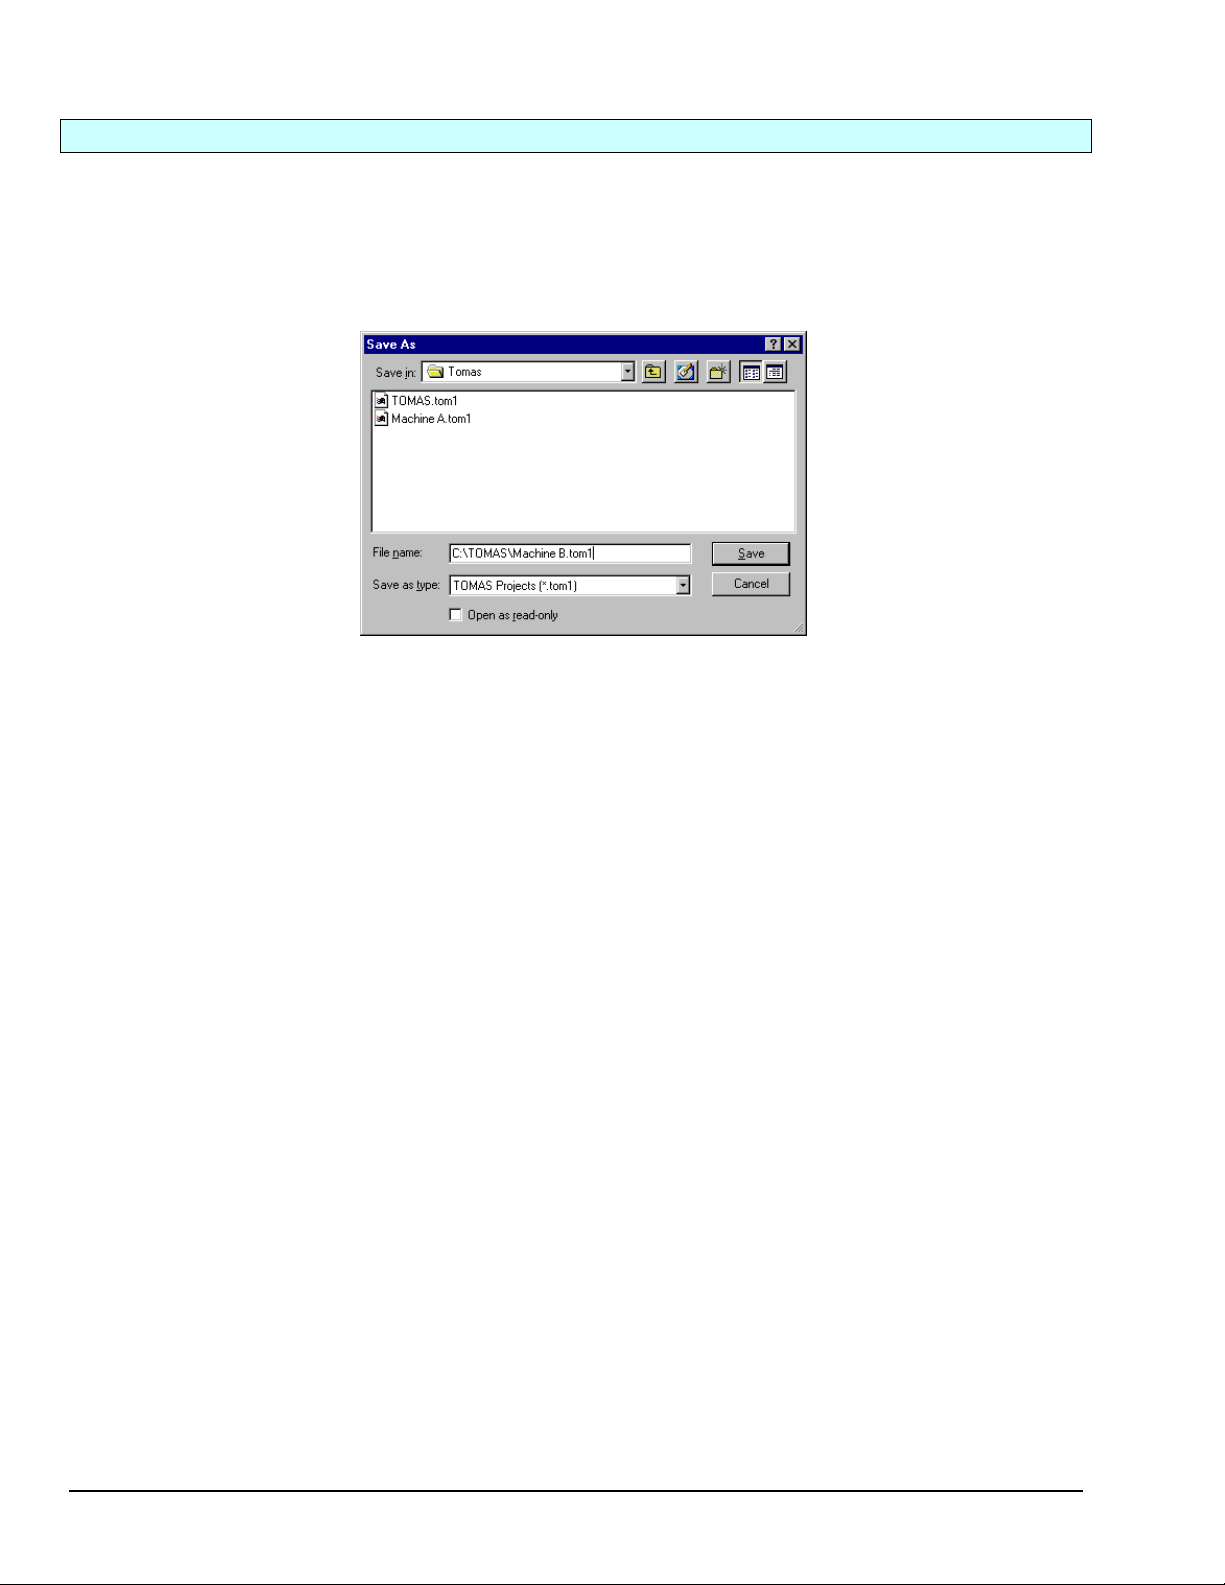
Using “New (Clone) Project”
Cloning a project keeps all of the values from the original project.
Each eZ-TOMAS Project contains eZ-TOMAS configuration and data files. You should logically equate
an eZ-TOMAS Project with a specific machine. This is accomplished as follows:
1. On the File pull-down menu, select New (Clone) Project. This opens the Save As window.
Save As Window, Being Used to Create a New File
2. Select [or create] a Windows folder for the eZ-TOMAS Project.
3. Enter the desired filename for this project.
4. Click the <Save> button to create the new project.
2-4 Monitoring a Machine 987294 eZ-TOMAS
Page 19
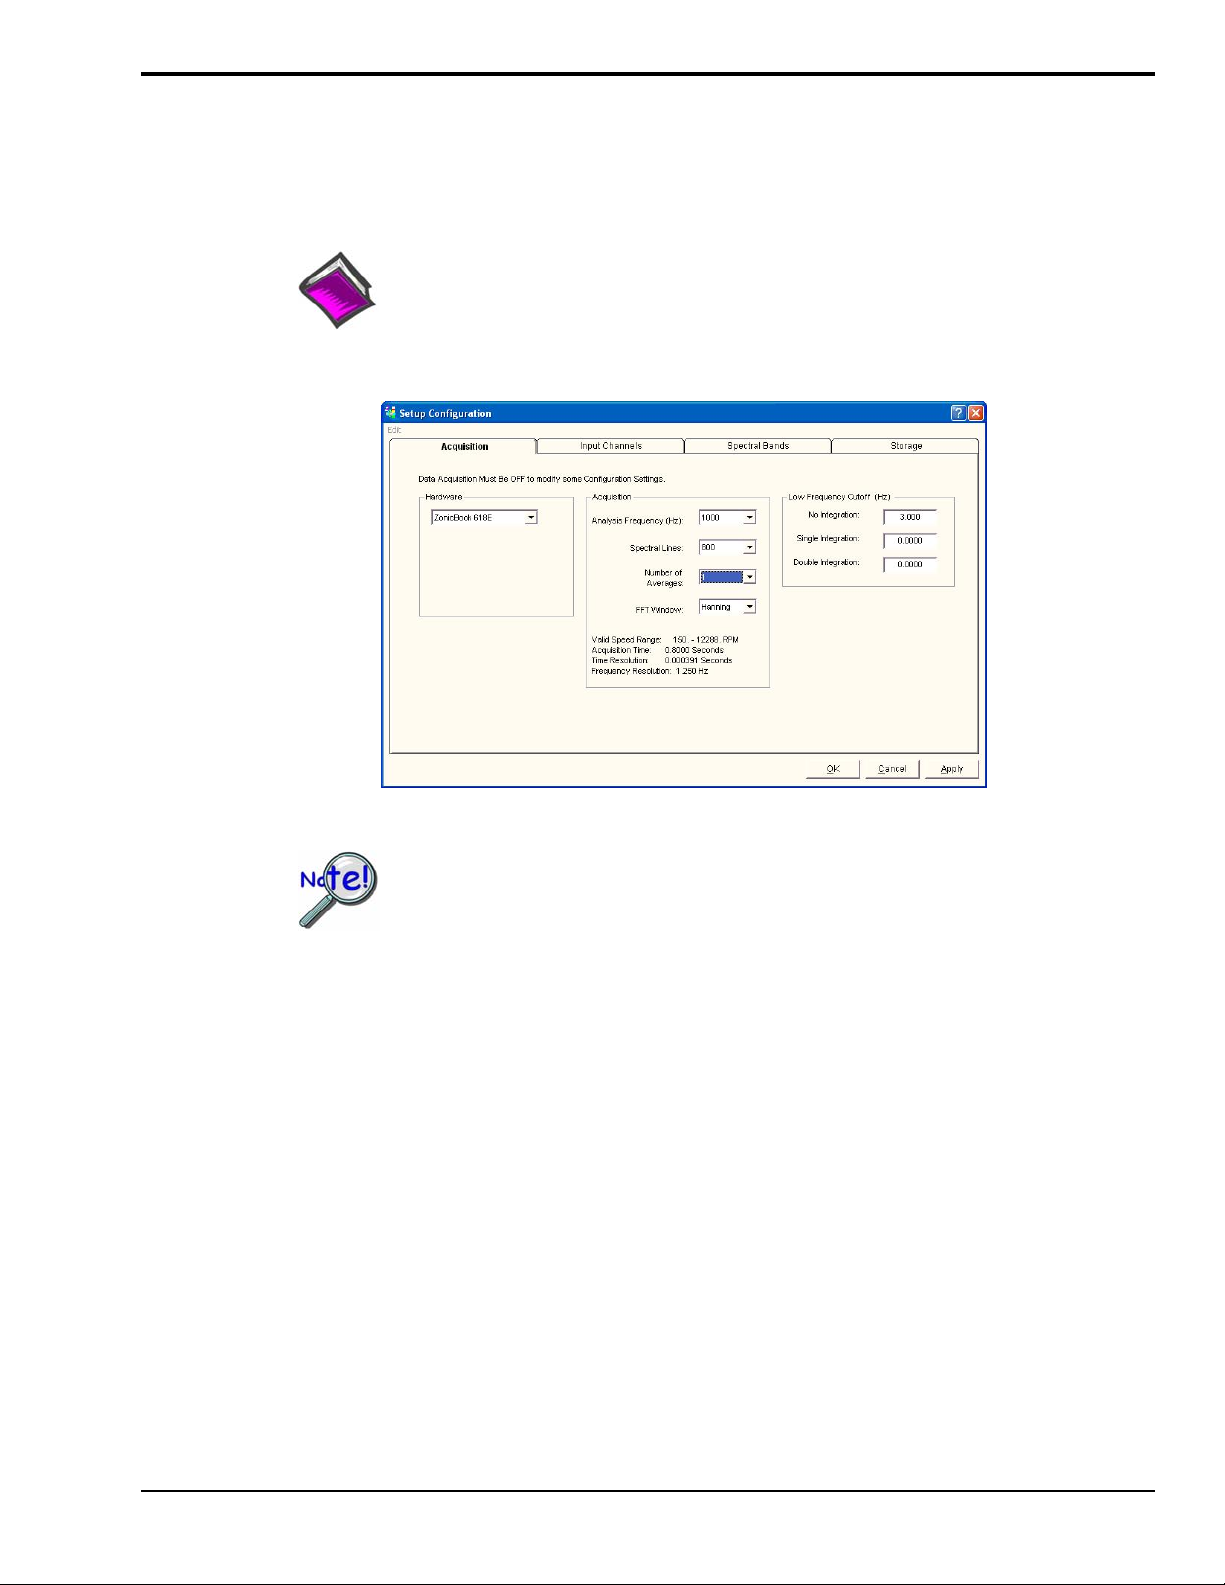
Configuring the Project
A default configuration is automatically loaded when you open an eZ-TOMAS file. However, you may
want to make some changes to the configuration. To make changes:
1. From the eZ-TOMAS Main Window, open the Edit pull-down menu.
2. In the Edit menu select Setup. The Setup Configuration window will appear.
Reference Note:
The four tabs of the Setup Configuration window are labeled: Acquisition, Input Channels,
Spectral Bands, and Storage. They are discussed briefly in this section and in detail at the
beginning of Chapter 4, Edit Menu.
3. Make sure that the Hardware panel reflects the correct device, e.g., ZonicBook/618E.
Setup Configuration Window, Acquisition Tab
Clicking the <Cancel> button will undo all the changes you’ve made since you
opened the Setup Configuration Window.
4. Make the desired changes for each of the tabs and then click the <Save> button.
You can start monitoring immediatel y .
Acquisition Tab – From the Acquisition tab you can set up parameters that include, but are not limited
to: Block Size, Analysis Frequency, Low Cutoff Frequency, FFT Window, and Number of Averages.
Input Channels Tab – From the Input Channels Tab you can change channel parameters. This
includes, but is not limited to assigning channel types, customizing channel names, settin g the instrument
range per channel, and assigning units.
Spectral Bands Tab – From the Spectral Bands Tab you can modify “User Defined” bands 5 through
10 according to your application. Note that Overall, DC Gap V, 1x Amp, and 1x Phase bands are
predefined and cannot be modified.
Storage Tab - From the Storage Tab you can specify how you want trigger data storage. If any one
event is triggered, data from all channels is stored. Data storage events are triggered when a change occurs
in the monitored machine’s condition. The basic idea is to activate storage based on Time Change and/or
Speed Change and/or Amplitude Chan ge.
Refer to chapter 4 for more information regarding the Setup Configuration tabs.
eZ-TOMAS 987294 Monitoring a Machine 2-5
Page 20
Starting an Acquisition
After you configure your eZ-TOMAS Project, click the <Acquisition> Toggle Switch to
place it in the upright position. This starts the data acquisition. The switch is located in the
in the lower left corner of the eZ-TOMAS gauge window.
When acquisition is active, real time overall values are displayed in the instrument gauges.
The toggle switch is green while data acquisition is active.
To stop data acquisition, click the switch toggling it down (red).
Viewing Spectral Bands
The Main Window’s gauges can be used to display different spectral bands. On the View menu select the
band of interest, e.g., Overall, DC Gap V, 1x Amp, 1x Phase, or one of the User Defined bands. Note that
selecting 1x Amp or 1x Phase results in two gauge types. In both cases vertical gauges will display for
1x Amplitude and circular phase gauges will display for 1x Phase. This is done automatically since the two
spectral bands are closely related.
Spectral Bands
Plotting Data
Click on “Display” in the main window’s menu bar, then select “Plots.” The Data Display Window
will open. Note that you can double-click on a gauge to open the Data Display Window to plot data for
that specific channel.
Multiple Plots
1. On the File pull-down menu of the Plots window, select Open Plot Window.
This opens a second display window.
2. On the Window pull-down menu of the Plots window, select either Tile Vertically or
Tile Horizontally.
All display windows will be shown simultaneously.
2-6 Monitoring a Machine 987294 eZ-TOMAS
Page 21
3. Select the Channel(s) and Display type for each window.
Time Display and Spectrum Display Plots Tiled Horizontally
Each plot is longer in the horizontal direction.
A cursor is provided with each display. To move the cursor, place your mouse icon over the cursor and
drag it to the desired location on the trace or use the East / West Arrows.
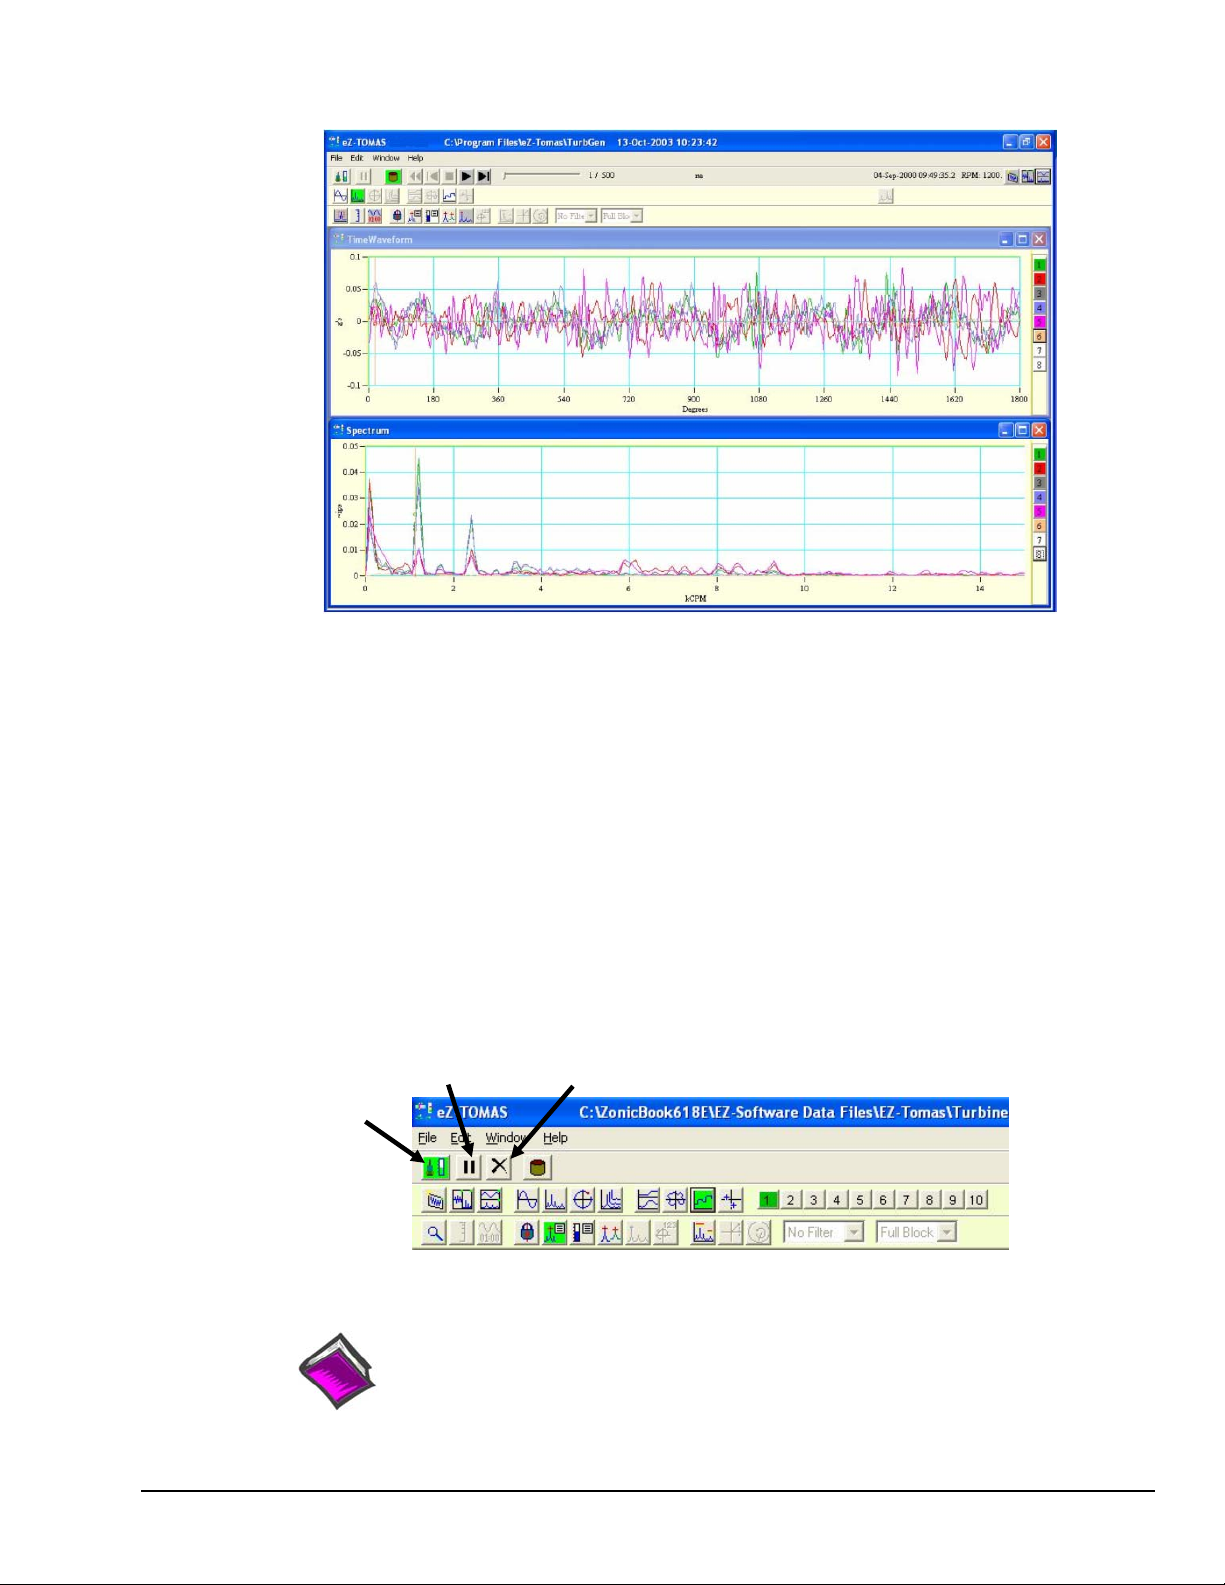
“Real Time” Plot Controls
“Real Time” is the default data source. For Real Time displ a y s you can Halt and Resume the display of
data by using the <Pause/Continue> toggle button (see following figure). As an option to the <Pause/
Continue> button you can use the “P” key on the PC’s keyboard. A table, which identifies all control
buttons follows shortly.
The <Clear Real Time Plot Buffer> button, which looks like a black “X,”allows you to clear the data in
the realtime trend displays. This display option can be used to clear the plot displays prior to starting a
test.
Selects
Real Time
Mode
Pause/
Continue
Clear Real Time
Plot Buffer
Real Time Mode is Selected
Reference Note:
Refer to chapter 6 for more detailed information regarding Plots and the associated toolbar
buttons and other controls.
eZ-TOMAS 987294 Monitoring a Machine 2-7
Page 22
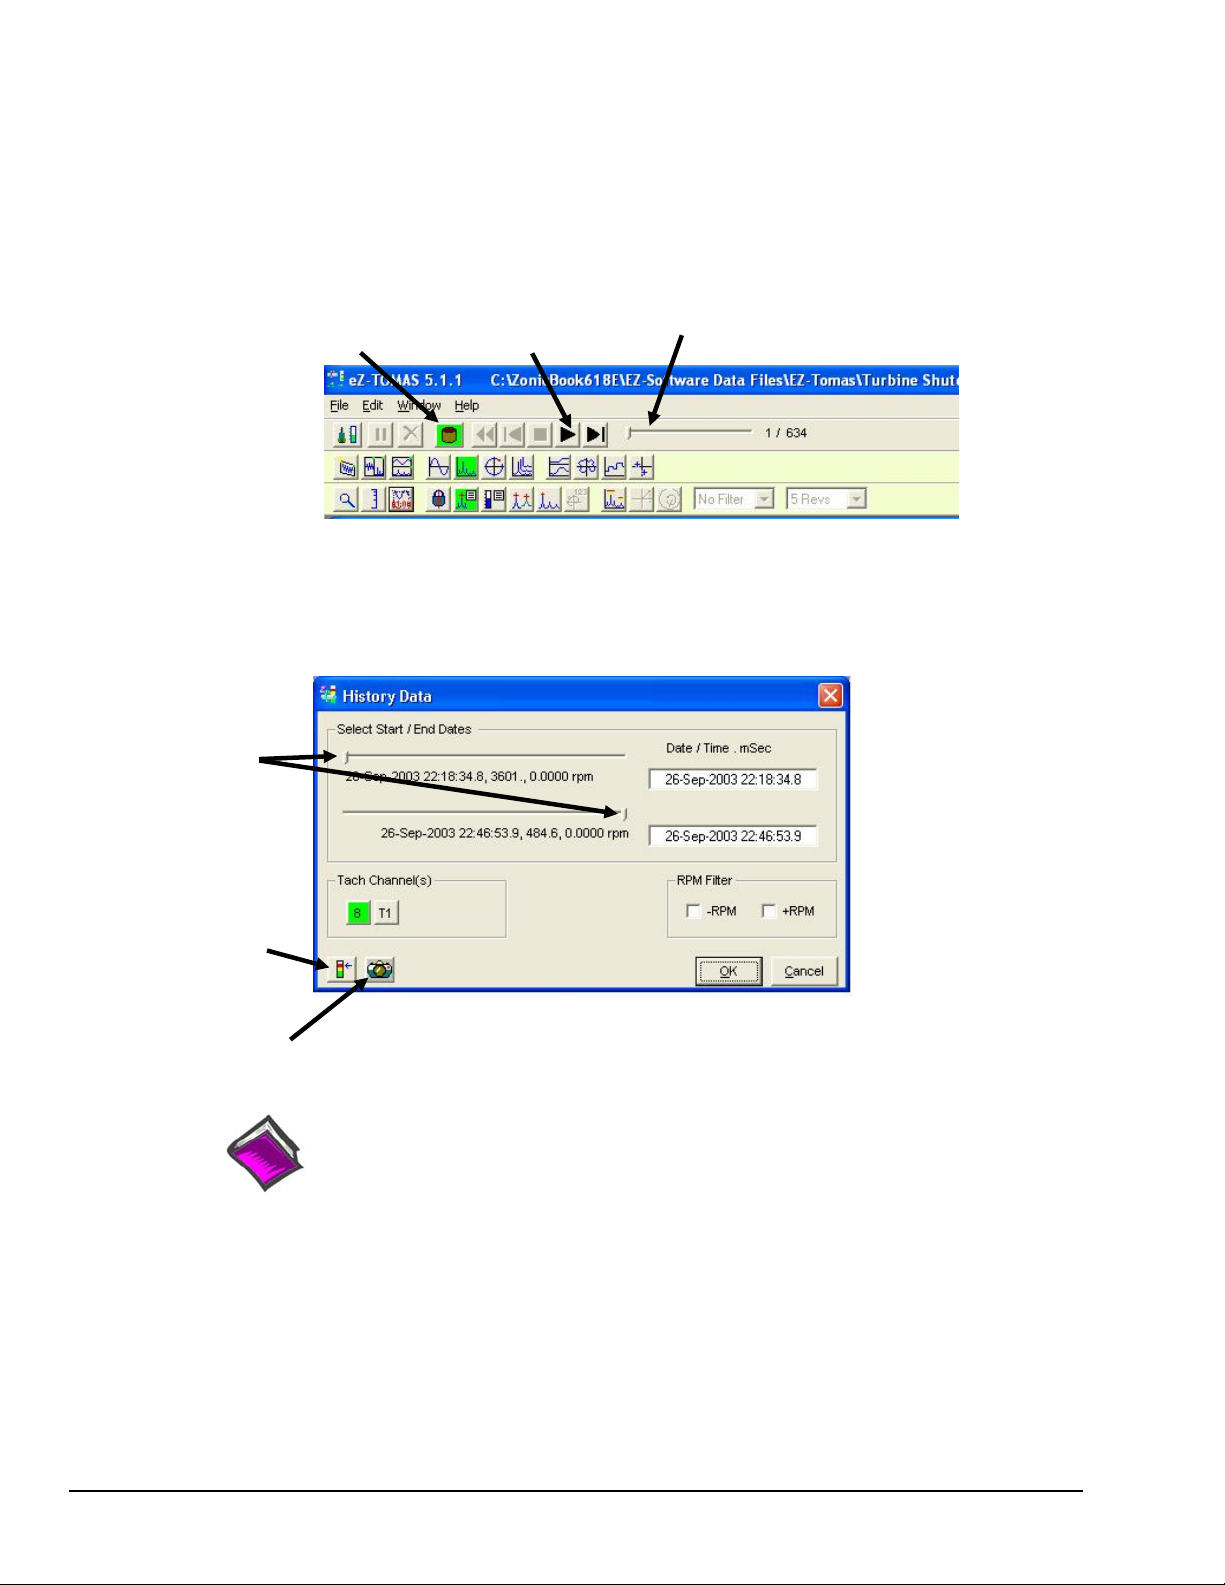
“History Data” Plot Controls
When viewing History Data (pre-recorded data files), you can use the set of playback buttons or the slider
bar to navigate through the data. A table, which identifies all control buttons, is included in chapter 6.
Note that the playback buttons and slider remain hidden in the GUI when eZ-TOMAS is in the Real Time
mode.
History Data is accumulated according to the parameters setup in the Setup Configuration window’s
Storage Tab, which is accessed via the Gauge Panel window’s Edit Menu.
Data SourceHistory File
Play Back
Buttons
Slider
History Data (Playback) Mode is Selected
Use sliders
to set the
start and
stop times
for the
desired
playback.
Show
Alarm Log
Show
Snapshot Log
Reference Note:
Refer to chapter 6 for more detailed information regarding Plot displays,
associated toolbar buttons, and other controls.
2-8 Monitoring a Machine 987294 eZ-TOMAS
Page 23
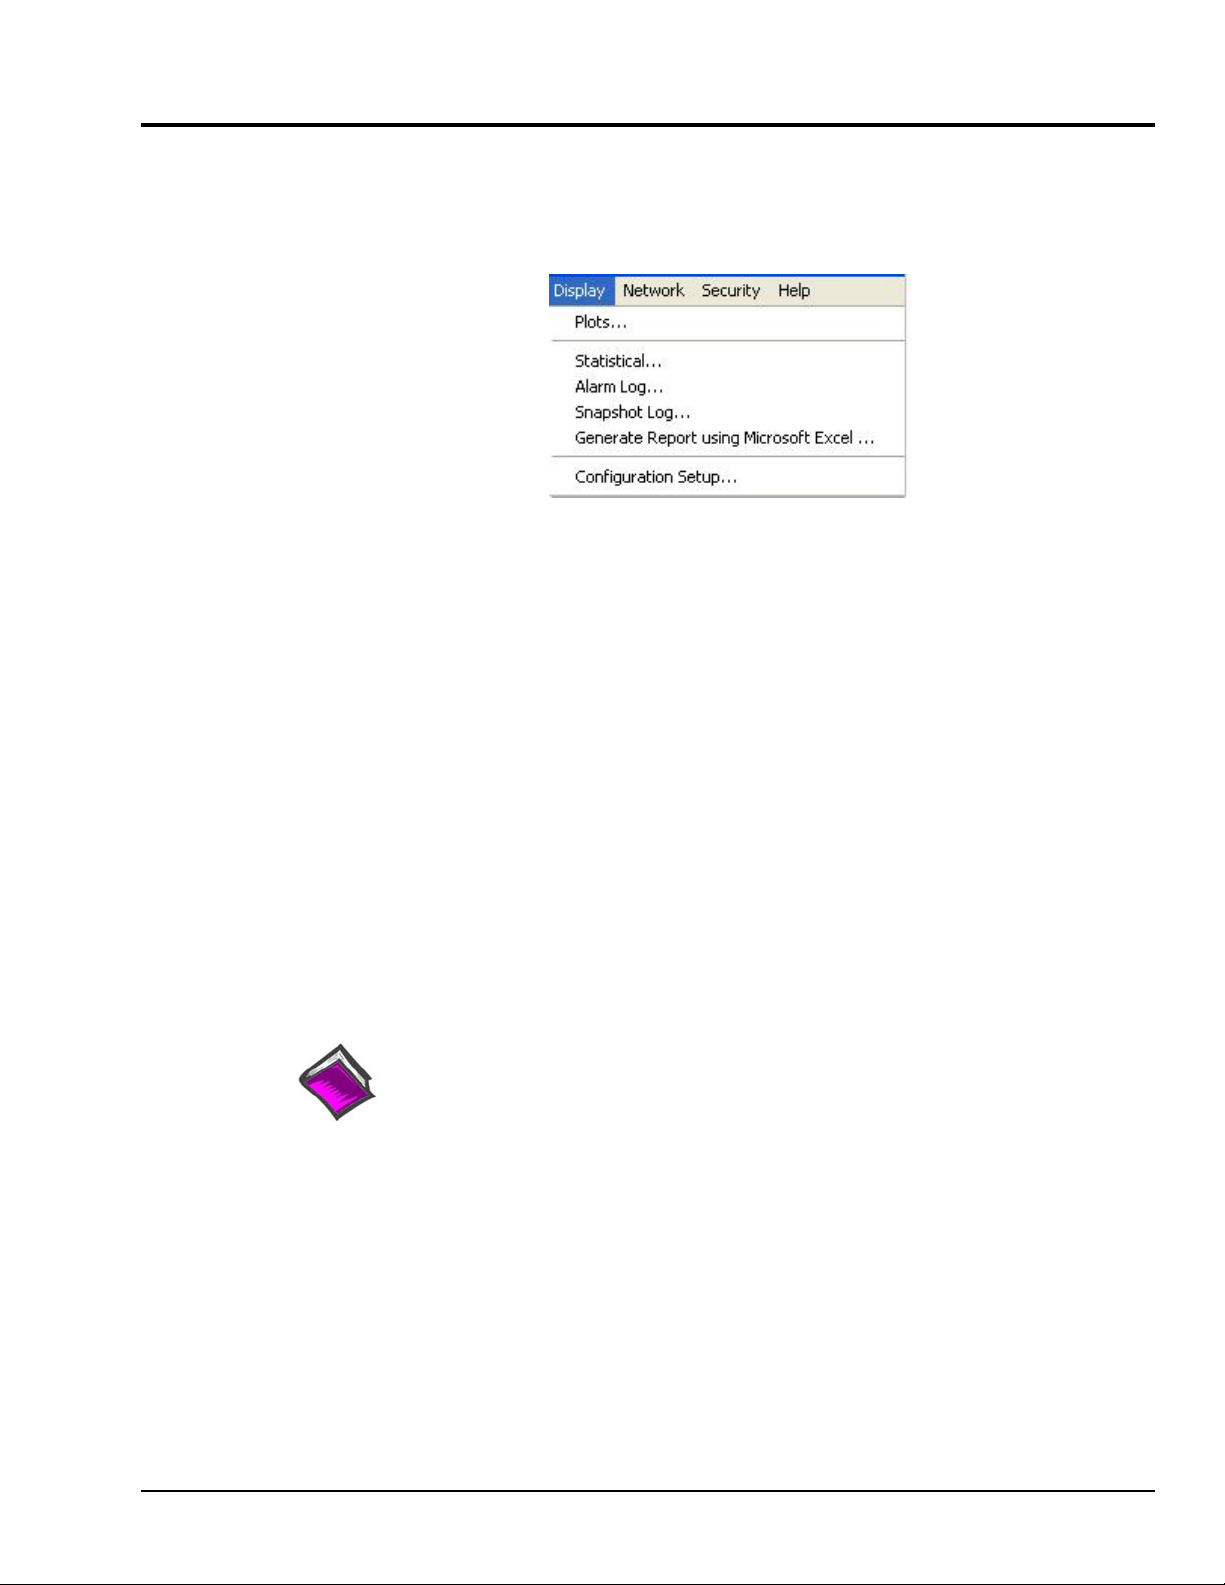
Viewing Reports
eZ-TOMAS can generate the following types of reports, which are accessible from the Display pull-down
menu.
The Statistical Report lists the historical spectral band data. It includes the instrument, the engineering
units, the minimum value, the mean average value, the maximum value, and the standard deviation by
channel. Statistical reports can be used to automatically generate limit values based on historical data.
The Alarm Log is a record of the last “N” number of alarm events. The number of alarms was specified in
the Setup Configuration window under the Storage Tab. The Alarm Log includes the date and time, the
channel number, reference tachometer, instrument name, spectral band type, alarm type, and value of the
alarm signal.
Display Pull-down Menu
The Snapshot Log can be accessed from the Reports pull-down menu, or from the History Data Window.
The Snapshot Log file contains entries which were created whenever the user clicked the <Snapshot>
button, which is located in the Gauge Window’s Data Storage panel.
The Generate Report using Microsoft Excel option is available beginning with eZ-TOMAS version
5.0.x. The feature allows you to generate a report using Microsoft Excel 2000 (version 9.x) or later.
An XL Report generation dialog box allows you to format the report and specify its contents.
Selecting Configuration Setup from the Reports pull-down menu creates a text file that contains
configuration details of the current project.
Reference Note:
Refer to Chapter 6, Display… Reports, for detailed information regarding each report type and
for instructions pertaining to generating limits.
eZ-TOMAS 987294 Monitoring a Machine 2-9
Page 24

2-10 Monitoring a Machine 987294 eZ-TOMAS
Page 25
File Menu [In Gauge Window] 3
New (Clone) Project …… 3-1
Initialize Project ….. 3-1
Open Project …… 3-2
Save As …… 3-2
Erase History Data …… 3-3
Erase Alarm Log …… 3-4
Print …… 3-4
Exit …… 3-4
New (Clone) Project – Creates a Copy of a Project and its Data
Cloning a project keeps all of the values from the original project.
The New (Clone) Project option opens the Save As window. The first step in
creating a new project is to select or create a Folder where the new project’s files
should be saved. Enter a filename for the project, then click the <Save> button.
Note that the “Save As” window that is accessed via the New (Clone) Project
selection is
in the Gauge Window’s File pull-down menu. The later is for saving one of
three backup formats. These are: Entire Project, Partial Project, and Gauge Data
(ASCII). After selecting one of the three formats and clicking the <Save> button,
the Save As window will appear.
not the same Window that results from clicking the “Save As” option
Note: The File Menu discussed in this chapter is located
in the Gauge Window’s menu bar. It is not to be
confused with the Plot Window’s File Menu.
Using the Save As Window to
Create a New Project
Initialize Project – Creates a New Project and Sets the Number of Available Channel Inputs
When a project is initialized you are essentially starting with a “clean slate.” No data is carried over as when a
project is cloned.
To inform eZ-TOMAS as to what type of hardware will be used, select “Initialize Project” from the Gauge Window’s
File pull-down menu. The resulting window allows you to select a Hardware Device and the applicable number of input
channels. Chapter 2 includes an example.
Initialize Project
eZ-TOMAS 958794 File Menu 3-1
Page 26
Open Project
The Open Project option provides a means of locating and opening an existing eZ-TOMAS project.
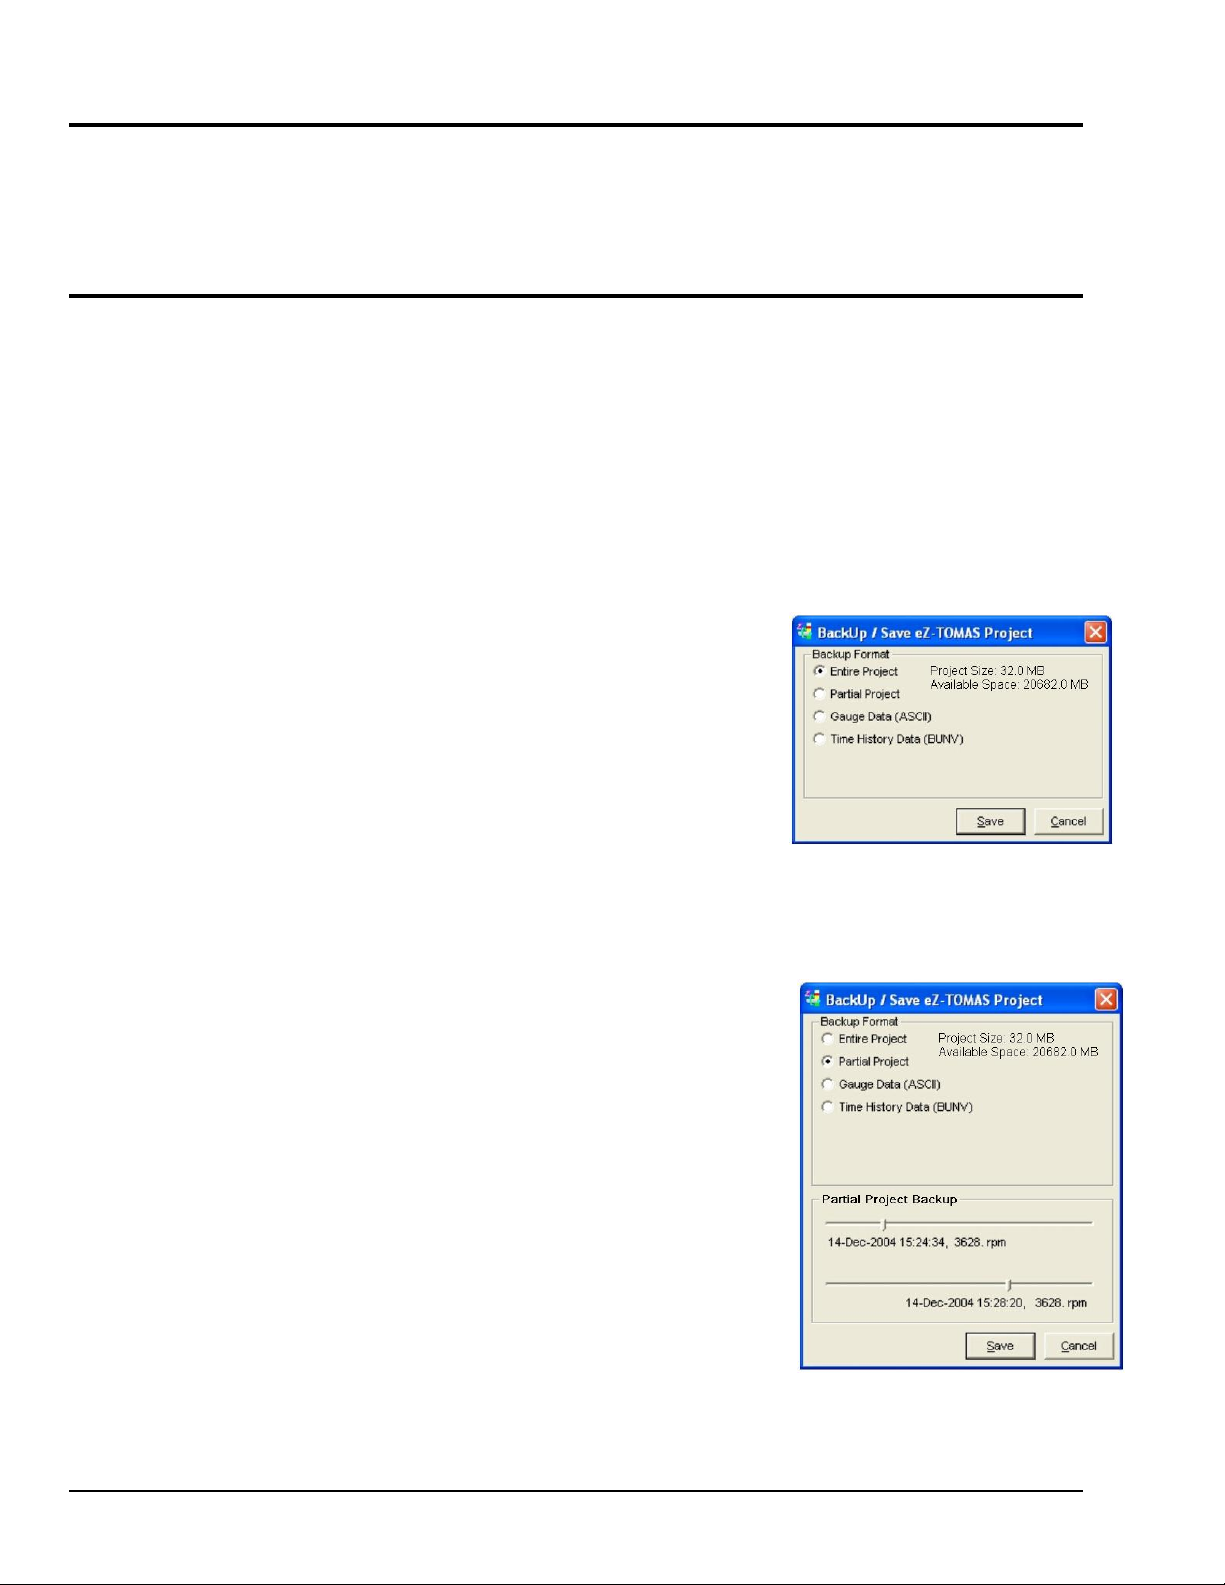
Save As
The Save As option allows you to backup history files in a binary file format, or export files in an ASCII
file format. This command opens the Backup/Save eZ-TOMAS Project window. The options in this
window change as you make selections. You can backup and export full or partial files.
Entire Project
The Entire Project option is only available when data acquisition is turned off. Entire Project performs a
file copy operation to the specified Windows Directory. This backup method is the fastest.
Note:
Note:
When eZ-TOMAS is started, it opens the last active project.
The disk space required to backup the selected records is displayed on the left panel.
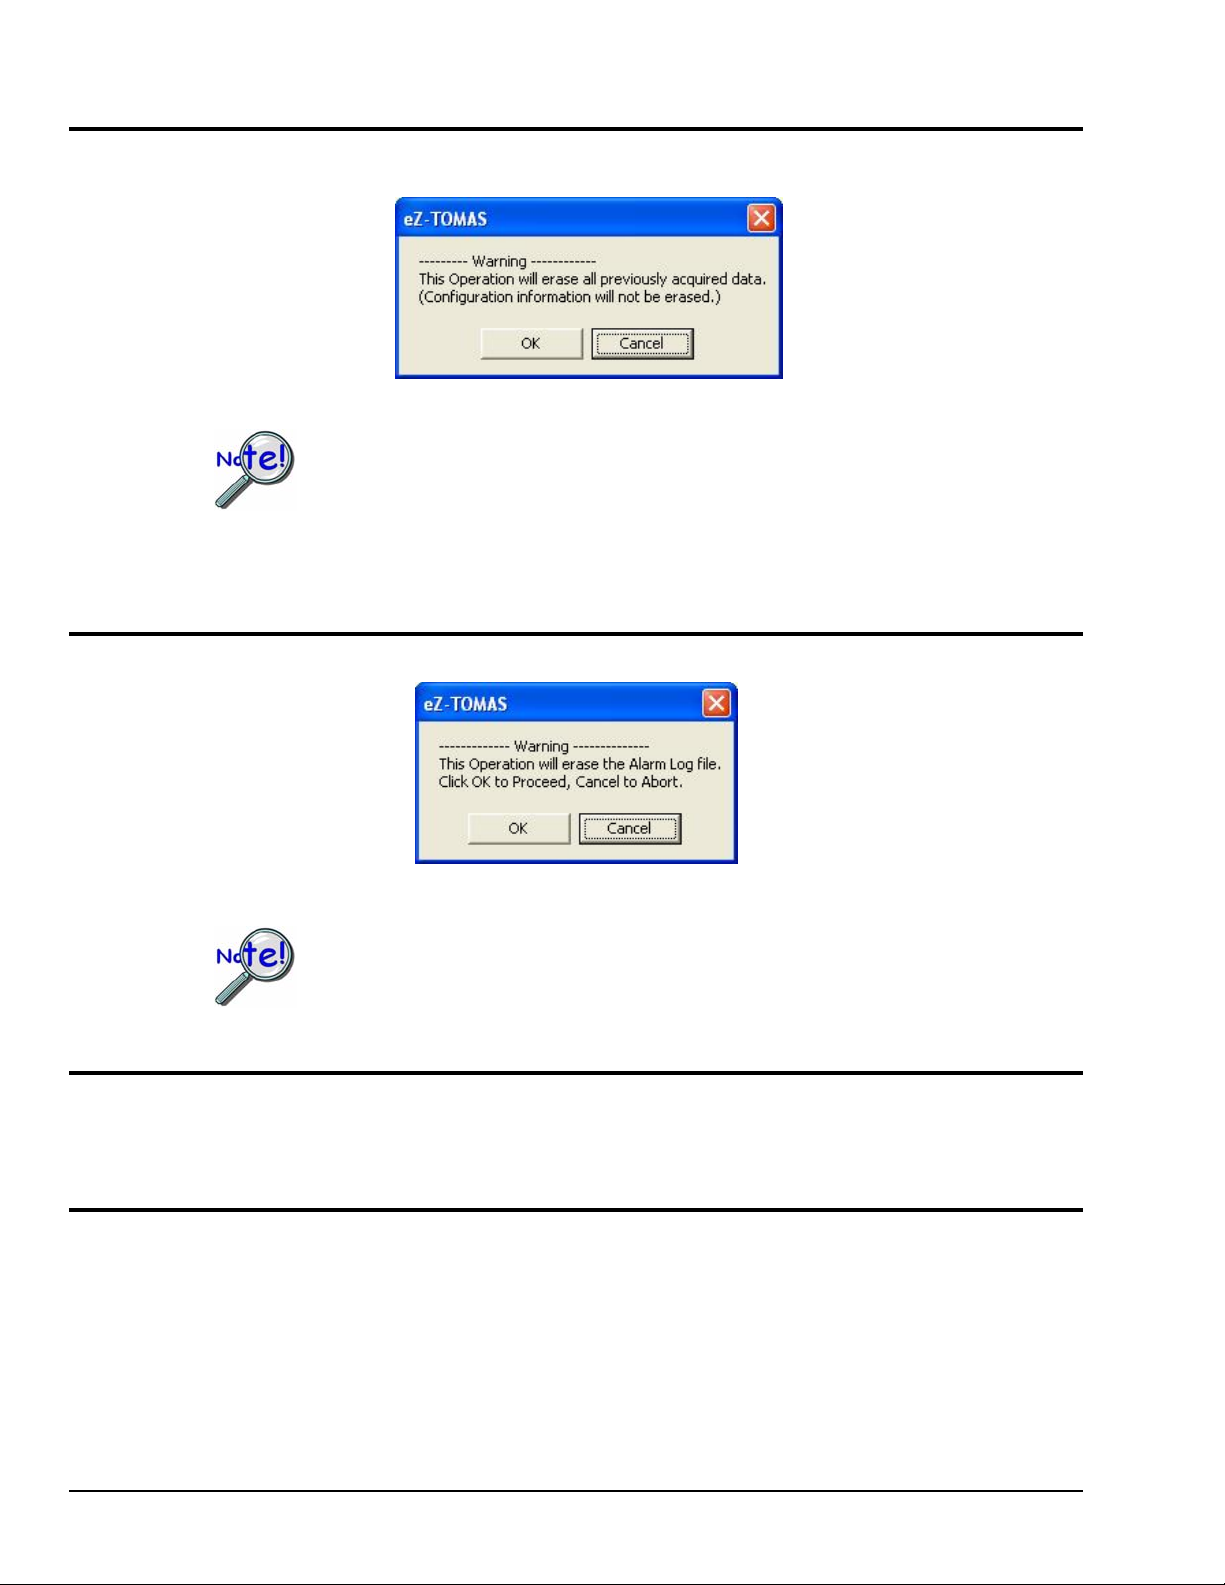
Partial Project
The Partial Project option can be used when data acquisition is
active. This option copies data and the configuration setup to the
designated folder for the date and time range specified in the panel on
the right.
To make a partial backup:
1. Use the sliders in the Partial Project Backup panel (see figure at
2. Click the <Save> button. The Save As window will open.
3. Select the folder where the file is to be saved.
4. Enter a filename.
5. Click the <Save> button.
Save As… Entire Project
right) to select the start and stop times of the range that you want
included in the backup.
Save As… Partial Project
3-2 File Menu 958794 eZ-TOMAS
Page 27

Backup Format – Guage Data (ASCII)
This option creates an exportable ASCII file for the gauge data.
Save As… Gauge Data (ASCII)
Backup Format – Time History Data (BUNV)
This option creates an exportable Binary Universal (UFF-58B) format (BUNV) file for the
Time History data.
Save As… Time History Data (BUNV)
eZ-TOMAS 958794 File Menu 3-3
Page 28
Erase History Data
Use the Erase History Data option with caution. This menu item will erase History Data
for the project. All data for the active project will be permanently removed. It is not
recoverable.
The configuration information will not be erased.
Erase Alarm Log
Erase History Warning
Exit
Erase Alarm Log
Use the Erase Alarm Log option with caution. This menu item will erase the Alarm Log
file for the project. It is not recoverable.
“Print” brings up the Print Window for printing the current screen.
Closes the eZ-TOMAS application.
3-4 File Menu 958794 eZ-TOMAS
Page 29

Edit Menu [In Gauge Window] 4
Setup…… 4-1
Acquisition Tab…… 4-1
Input Channels Tab …… 4-3
Spectral Bands Tab …… 4-9
Default Tach …… 4-5
Spectral Bands …… 4-5
Tachometer Notes ….. 4-7
Synopsis of Tach Modes …… 4-8
Storage Tab …… 4-10
Limits …… 4-12
Digital I/O…… 4-18
Display Preferences …… 4-20
Copy Window …… 4-22
Load [or Remove] Graphic Picture … 4-22
Reset Peak Hold Values …… 4-22
Note: The Edit Menu discussed in this chapter is located in the Gauge Window’s menu bar.
It is not to be confused with the Plot Window’s Edit Menu.
Setup……
The Setup Configuration Window has individual panels for configuring the acquisition device. Click the
appropriate tab at the top of the window to configure the data acquisition system. Make the necessary
changes in each panel. Click the <OK> button to save all your changes and close the window.
Clicking the <Cancel> button will undo all the changes you’ve made since you
opened the Setup Configuration Window.
Acquisition Tab
The Acquisition tab is used to configure how the data will be acquired and processed. A breakdown of
the panel tabs follows.
Acquisition Tab
eZ-TOMAS 947394 Edit Menu 4-1
Page 30

You must turn acquisition off and then on again for Acquisition Configuration changes
to take effect.
Panels of the Acquisition Tab
Hardware
The Hardware Panel has a pull-down list from which the applicable
data acquisition device must be selected; i.e., WaveBook, ZonicBook,
dB Reference
Acquisition
or Medallion.
This panel is used to set the 0 dB reference point in Engineering Units
(EU). The EU value for 0 dB reference is used with microphone input
channel types. The default setting is 20 micro-Pascals (0.000020 pa).
Analysis Frequency (Hz) The maximum frequency of interest. The
sampling rate will be 2.56 times the analysis frequency. Verify the
maximum frequency response of your probes. For a Tach signal,
your Analysis Frequency should be a higher multiple of the maximum
rotating speed. Typically, this multiple is at least 10 times the rotating
frequency.
Spectral Lines The number of lines per spectrum and the number of
data samples used in the FFT (Fast Fourier Transform) process. The
more spectral lines, the greater the data resolution. As the number of
spectral lines increases, so does the time that it takes to collect the
data and the amount of disk space.
Overlap Data Acquisition For slow speed data acquisition
applications, you have the option to select overlap data processing to
speed up real time data displays. This option is enabled when the
Acquisition Time is greater than 2 seconds.
If you select Overlap Data Acquisition, eZ-Tomas will automatically
determine the overlap percentage needed to achieve a 1 to 2 second
display update rate. For example, if your analysis frequency is
500 Hz and you have 3200 spectral lines, the acquisition time is 6.4
seconds. With Overlap Data Acquisition, the overlap percentage will
be 75% and the update rate will be 1.6 seconds. (6.4 sec / 4). The
divisor is a power of 2.
Number of Averages The number of data blocks averaged before a
block of data is accepted and displayed. Typically, the value is “1”
indicating no averaging.
FFT Window Fast Fourier Transform. FFT is an efficient technique
for calculating the frequency of components in a time-domain
waveform based on digitized voltage measurements. The result is a
display of amplitude versus frequency and phase versus frequenc y.
The FFT Window is a weighting window, typically either H anning or
Flat Top. Hanning provides better frequency resolution. Flat Top
provides better amplitude resolution.
4-2 Edit Menu 947394 eZ-TOMAS
Page 31

Note: Filter Panels apply to ZonicBook/618E and WBK18 channels. Filter Panel functionality does not apply
to WaveBook direct channels or to Medallion channels.
High Pass Coupling Filter (Hz)
High Pass Filter (AC Coupling): When AC Coupling is selected in
the Input Channels tab, the associated input signals will pass through
a 0.1 Hz or a 1 Hz High Pass Filter, depending on which radio button
is selected.
High Pass Display Filter (Hz)
Allows you to eliminate the lower frequencies from the full frequency
range for “no,” “single,” and “double” integrations by entering the
desired cutoff value in Hz. All data points that exist below the
specified value are set to zero.
Integration Units
Accelerometer and Velocity signals can be integrated. Select the
desired integration value (g’s/ips/mils, g’s/ips/in, or g’s/mmps/mm).
Points to note:
(1) If the signal is
(a) single integration results in velocity, and
(b) double integration results in displacement.
(2) If the signal is
displacement.
(3) The type of integration (none, single, or double) is selected in the
Input Channels tab.
acceleration, then
velocity, then single integration results in
Terms and factors related to the Acquisition Panel
Nyquist Factor
In eZ-TOMAS waveform frequency is multiplied by a nyquist factor of 2.56. This
ensures that a sampled analog signal is accurately reconstructed. The 2.56 nyquist
factor is the most efficient in FFT Analysis.
Sampling Rate
Spectral
Resolution
A rate that is 2.56 times the Analysis Frequency. If the Analysis Frequency was
1000 Hz and if the Spectral Lines was 800 lines; then the Sampling Rate would be
2560 samples per second. This rate would apply to each channel. Derived from:
Analysis Frequency x 2.56 = 1000 x 2.56 = 2560.
A value related to Analysis Frequency and Spectral Lines. Where Spectral
Resolution equals the Analysis Frequency divided by 2.56. If the Analysis Frequency
was 1000 Hz and if the Spectral Lines was 800 lines; then the Spectral Resolution
would be 1.25 Hz per spectral line.
Derived from:
Analysis Frequency divided by Spectral Lines = 1000 Hz / 800 = 1.25 Hz
eZ-TOMAS 947394 Edit Menu 4-3
Page 32

Input Channels Tab
This tab is used to configure each channel for your project. The available setup options in this window are
dependent on the instrument type selected.
Input Channels Tab, Showing the Leftmost Column
To configure a channel:
1. Select the channel to be configured.
2. Set the instrument type.
3. Set the value for each attribute of the channel.
Repeat this process for each channel.
The parameters of one channel can be copied to another channel by using
options on the Edit menu.
Medallion Users Only: Configure the Dip Switches for each probe, according to probe
type. For details refer to the Medallion user’s manual (p/n 1086-0901).
Input Channels Tab Column Functions
No.
is the channel number. Selecting the channel number highlights all attributes for that
channel.
Type
is the type of instrument attached to the channel. Options are:
o Accelerometer
o Velocity
o Displacement
o Static
o Tach
o Microphone
o Pressure
o General
o Unused (select “Unused” for channels that
have no instrument attached.)
Name
Gauge Min,
is a Label you will use to identify the channel.
represent the instrument range minimum and maximum gauge values.
Gauge Max
Units
is the Engineering Units you want to use. Options depend on the instrument type.
4-4 Edit Menu 947394 eZ-TOMAS
Page 33

Integration
Accelerometer and Velocity signals can be integrated. This column is used to select the
type of integration (none, single, or double). Points to note:
(1) If the signal is
(a) single integration results in velocity, and
acceleration, then
(b) double integration results in displacement.
(2) If the signal is
velocity, then single integration results in displacement.
(3) The integration value (g’s/ips/mils, g’s/ips/in, or g’s/mmps/mm) is selected in the
Acquisition Tab.
mV / EU
is the instrument sensitivity. (Typical displacement probes: 200 milli-Volts per mil.
Typical accelerometer probes: 100 milliVolts per G. For Tach probes
enter 1000.) For static channels, this property represents the slope variable (m) of the
linear equation y = mx + b.
Offset
Sets the offset factor that is to be applied to the Engineering Units.
FSV
FSV (Full Scale Voltage) is the maximum input voltage for the instrument. If you are
unsure of the instrument’s maximum voltage value, select a high voltage value.
ICP
A constant 4mA bias current is available for ICP transducers that are used as signal input
for ZonicBook/618E’s analog channels (CH1 through CH8) and for compatible expansion
modules that accept ICP transducers, for example, the WBK18. The bias current is
sourced through the center conductor of the input channel BNC connector and returns to
the acquisition device [e.g., ZonicBook/618E or the WBK18] via the BNC’s outer
conductor.
The current source features an operating compliance of 24V and is protected in regard to
both short-circuit and overvoltage. Operating compliance refers to the highest voltage
that can be applied without change of the current source value. In the absence of a
transducer, the current source will output an open circuit voltage of 30V. For applications
that do not require bias, the current source can be disconnected from the input by unchecking ICP in the Input Channels tab on a per-channel basis.
When the ICP cell is checked for a channel, the current source is enabled, the input
voltage is continuously monitored with level detection circuitry. Recognition of a voltage
greater than 25V (transducer open) or less than 1V (transducer short) triggers a transducer
fault condition for the affected channel. This error is communicated to the user via a front
panel LED and is also available through a software status request at the end of an
acquisition. When recognized, an error is latched until the commencement of a new
acquisition. Consequently, even intermittent faults are detected and communicated.
Detection of a fault does not, however, alter the acquisition process or its data.
When the ICP function is not available to a channel a dash appears in the ICP column for
the associated channel.
Coupling
AC or DC coupling can be set on an individual channel basis from the Input Channels tab.
Coupling is available for analog channels (CH1 through CH8) and for compatible
expansion channels [e.g., from a WBK18]. AC Coupling can be set to a high pass filter
value of 0.1 Hz or 1 Hz. The value is selected in the Edit Menu’s Acquis i t i on Tab.
Note that when DC Coupling is selected the high pass filter is bypassed.
When the Coupling function is not available to a channel, or not used by a channe l, a dash
appears in that channel’s Coupling column.
Angle Loc
is the physical angular location of a probe. Zero degrees is defined to be the top dead
center. The angle value is measured in the counterclockwise (CCW) direction as viewed
from the driver end. Orbit and Polar displays utilize Instrument Angle for data correction.
1xA Ref and
1xP Ref
Gap Volt
1x Amplitude Reference and 1x Phase Reference are the slow roll values used for Runout
Compensation on Bode or Polar displays.
is the DC voltage value when the shaft is at rest. This value is used for Shaft Center Line
displays.
eZ-TOMAS 947394 Edit Menu 4-5
Page 34

XY Pair
associates 2 probes on a bearing. Typically, probe pairs are located 90 degrees apart.
Orbit displays require a Channel Pair.
Brg Clear
Bearing Clearance is measured in the instrument’s engineering units. You can
optionally overlay the bearing clearance circle onto an orbit display or shaft centerline.
Brg Start
Bearing Start is the location of the shaft relative to the bearing when the machine is at
mechanical rest. Three possible locations are taken into consideration: Bottom, Center,
and Top. For horizontal shafts, a bearing start of bottom is typical, due to gravity;
However, in some situations mechanical linkage can result in a bearing start with the shaft
at the top. For shafts that are oriented vertically, a bearing start of center is likely.
Default
Tach
The "Default Tach" column allows you to define the Tach Preference for each channel.
Thus, on Gauge Display and Plot Display eZ-TOMAS can show 1x values relative to the
preferred tach. When two or more tachs are defined eZ-TOMAS computes spectral data
relative to each. For example, with two tachs: If Tach 1 measures 3000 rpm and Tach 2
measures 4500 rpm eZ-TOMAS computes 1xA values for each. With the RPMs given,
the resulting 1x Frequency values are 50 Hz for Tach 1 and 75 Hz for Tach2.
Clicking the Default Tach column brings up a pull-down list which indicates the
tachometer channels available for use as reference [for the currently displayed data].
Tach Section of the Input Channels Tab
Rotation
is the shaft’s rotation direction, either clockwise or counter-clockwise. The direction
indicated is as viewed from the driver end of the machine train.
Trig/Rev
Trig Dir
Trig Volt
is the number of pulses per 360 degree revolution. (Default: 1)
is the “negative’ [down arrow] or “positive” [up arrow] direction of the moving shaft.
defines the Tach pulse for tach signals. A keyway will generate a Negative Tach pulse.
Typical Tach signals will generate at least a 1 V pulse. You can check the voltage value
using a Time display.
Mode
Edge Detect
Used to select one of three available modes: Voltage, Counter, or Period.
Edge Detect – Edge Detect is short for “Tach Pulse Edge Detection.” The term
pertains to detecting the rising or falling edge of a tachometer pulse using either an
“Immediate” or “Delayed” mode.
Immediate Edge Detection (“Before Stable”) – “Immediate” is one of two Edge
Detect modes. The term is synonymous with “Before Stable.” If “Immediate” edge
detection is selected a tach pulse will be recognized on any instantaneous measurement
that meets the trigger level criteria. In this setup the “Delay Value” is the amount of time
before the next tach pulse can be recognized. If a keyway is being used as a tach trigger
you must calculate the minimum pulse width, based on the maximum RPM rate
expected.
Delayed Edge Detection (“After Stabl e”) – “Delayed” is one of two Edge Detect
modes. The term is synonymous with “After Stable.” If “Delayed” edge detection is
selected a tach pulse will be recognized when the measurement meets the trigger criteria
for the specified duration. In this setup the “Delay Value” defines the length of time that
the trigger criteria must be stable before the tach pulse will be recognized.
Delay Time:
One of several time settings between 500 ns and 25.5 ms. The delay time is used in
conjunction with edge detect and is used to optimize noise reduction.
4-6 Edit Menu 947394 eZ-TOMAS
Page 35

Tachometer Notes
To Assign a
Tachometer to a
Channel
To Assign
Tachometers to
the Gauge
Window View
To Edit a
Tachometer
Channel’s
Parameters
1. Navigate in eZ-TOMAS as follows: Edit [pull-down men] \ Setup
Configuration \ Input Channels Tab \ Default Tach column.
2. Click in the Default Tach column and select the desired tachometer from the
pull-down list.
1. Select “View” from the gage window’s tool bar.
2. From the resulting list, select the desired Tach, or select Default Tach. Note
that a Tach selection option will only be available if there are two or more
tachometers to choose from.
If you select a Tach, for example, Tach 1 – that Tachometer will apply to all
applicable gauges, regardless of what tachometer is assigned to the channel
in Setup Configuration.
If you select “Def ault Tach,” Tachometers will apply to the gauges in
accordance with the Setup Configuration assignments, as described in row 1
of this table, which describes how to assign a tachometer to a channel.
1. Navigate in eZ-TOMAS as follows: Edit [pull-down menu] \ Setup
Configuration \ Input Channels tab.
2. Edit the parameters on a column by column basis, as desired. Note that there
are two places from which you can edit tachometer parameters:
(a) The main area of the Input Channels tab. This is where you can edit the
tachometer channel’s name, minimum and maximum gauge values, units,
etc.
(b) The lower panel of the Input Channels tab. From here you can configure
the tachometer channel’s rotation (CW or CCW), trigger/revolution, trigger
direction (POS or NEG), and trigger voltage.
For applicable illustrations of the channel configuration areas, refer to the
preceding two figures.
To obtain optimal
noise rejection
1. Setup the input for Voltage Mode.
2. Take a measurement.
3. View the Tach Signal on a TimeWaveform plot.
4. Set the Trigger Slope [Trig Slope] to Positive (POS) or Negative (NEG).
5. Set Edge Detect to “Immediate” or “Delayed.” You may need to experiment
with Edge Detect settings to determine whether “Immediate” or “Delayed”
works best for your application. Optimum settings will vary from machine
to machine.
6. Set the Delay Time to a pre-set value between 500 ns and 25.5 ms. To have
no delay time select “none.”
eZ-TOMAS 947394 Edit Menu 4-7
Page 36

Synopsis of Tach Modes
When you connect a tach sensor to a tachometer designated connector, such as the ZonicBook/618E’s
TACH BNCs (TACH1, TACH2, TACH3, or TACH4) you can select one of the following three modes:
Counter, Period, or Voltage. If you connect a tachometer sensor to a direct Analog Signal Input channel
(CH1 through CH8) then the tachometer signal will only be accepted in the Voltage Mode.
If tachometer triggers will occur at a rate greater than or equal to the “scan rate
divided by 10” then the Period Mode must be used.
Counter Mode
Counter Mode generates a Pulse of Amplitude “+1” for each tach
trigger. The counter mode can be used when the number of
pulses is less than the scan rate divided by ten (< scan rate / 10).
Use Counter Mode when Pulses per
Revolution are needed.
Once you have established the phase relationship of a machine
running near optimum, the observance of phase shifts can be
used to signal the development of a mechanical problem.
Counter Mode can be used for phase
shift observance.
Period Mode
The period is the time from the rising edge of one pulse to the
rising edge of the next pulse, or the time from the falling edge of
one pulse to the falling edge of the next pulse.
The Period Mode is used for Tachometer inputs which exhibit
Use Period Mode when multiple
pulses are involved, such as from
gear teeth.
Period Mode cannot be used for
phase shift observance.
multiple pulses per revolution. The mode provides accurate
overall RPM without sacrificing scan rate. Phase measurements
are not possible when using period mode.
Note: 60 seconds divided by the period [in seconds] equals RPM.
Voltage Mode
Voltage Mode is used for Tachometer inputs to view actual input
voltages from the Tach Sensor. Voltage mode is useful for
locating an ideal Tach Trigger Voltage setting. An ideal trigger
voltage is one that is in a clean region of a leading edge. Note
that Voltage Mode cannot be used for Phase measurements
between Analog Inputs and Tachometer Inputs.
If you connect a tachometer sensor to one of the 8 Analog Signal
Use Voltage Mode when you need to
determine a trigger voltage.
4-8 Edit Menu 947394 eZ-TOMAS
Input channels (CH1 through CH8) instead of a TACH chann e l,
then the tachometer signal will only be accepted in the Voltage
Mode.
Page 37

Spectral Bands Tab
Up to 10 Spectral Bands can be selected for each dynamic channel. The bands named Overall, DC Gap V,
1x Amplitude and 1x Phase are pre-defined and cannot be modified. However, you can modify “User
Defined” bands 5 through 10, customizing them for your specific application.
Spectral Band values are displayed on the dynamic instrument gauges on the eZ-TOMAS main window.
All gauges are vertical, with exception of circular phase gauges. When “1x Amplitude or 1x Phase is
selected both a vertical gauge [for 1x Amplitude] and circular phase gauge [for 1x Phase] are displayed.
Default Tach
Channel Name
Band
Spectral Band
Freq Units
Freq LO
Freq HI
CALC
Amp LO
Amp HI
Spectral Bands Tab
Refers to the tach channels being used in the project. You must select the tach of
interest.
is the name you assigned to the input channel in the Channels Panel.
is the Spectral Band Number of interest. Only the “User Defined” bands
[5 through 10] can be modified.
is the name you assign to a spectral band. It is displayed on the dynamic instrument
gauge in the main window.
can be either Frequency or Orders. If you do not have a tach defined, the Orders
option will not be available.
Used to set the range of the frequency or order. It is a good practice to set the range
2 to 4 spectral lines wider than the frequency of interest. This is due to the FFT
window. For example, if your frequency of interest is the 3
rd
order. You should
specify a range of 2.9 to 3.1 orders
Specifies to calculate Peak, Overall, or Phase.
Peak is the highest spectral amplitude within the specified range.
Overall is the sum of vibrations of each spectral amplitude within the specified range.
Phase is the time relationship between the vibration probe and tach signal.
Used to set the low and high amplitudes. These high and low values define the gauge
range.
eZ-TOMAS 947394 Edit Menu 4-9
Page 38

Storage Tab
Basic Description
Data storage is activated by trigger events. If any one event is triggered, data from all channels is stored.
Data storage events are triggered when a change occurs within the range of your defined parameters. An
example follows the parameter definitions.
Storage Tab
Panel Description
History FIFO
RPM Range
Displays the number of storage records in the History FIFO (First-In-First-Out) file.
Based on the configuration, values for both the required and the available disk space
are shown. The panel includes a checkbox to enable backing up the project.
The range in which a specified RPM change and/or time change must occur to trigger
data storage.
RPM Change
An RPM-based trigger for the storage of data. Data will be stored when the machine
speed changes by the specified RPM value. To enable the delta RPM storage trigger
check the “Enabled” checkbox and enter an RPM value.
Time Change
A time-based trigger for the storage of data. Enter the number of seconds, minutes,
hours, or days between desired storage events. To enable the time-based trigger
check the “Enabled” checkbox.
Overall Change
An amplitude-based trigger that can be defined for each channel. Data is stored when
the overall amplitude changes by the specified value. The user must check the
“Enabled” box for each channel that is to be used as an overall change trigger.
User Snapshot
Used to specify the duration of continuous data gathering (in seconds) for a data
snapshot. When the snapshot button is clicked [the button with the camera image],
data will be collected for the specified duration.
The history file is a FIFO file. You can define the depth of the history file; however, the amount of time
needed to fill the file depends on the trigger event values. The smaller the trigger values, the faster the
history file fills. The current data storage status is shown in the Main Window.
4-10 Edit Menu 947394 eZ-TOMAS
Page 39

Example
Assume that a motor typically runs at 3600 RPM and we would like to store data when the motor is running
above 200 RPM and below 5000 RPM.
1. Open the Edit menu.
2. Select “Setup.” The Setup Configuration window will open.
3. Select “Storage Tab.”
4. For RPM Range enter a value of 5000 for the maximum and 200 for the minimum.
5. Set one or more of the following to trigger data storage:
a) Time Change
b) RPM Change
c) Overall Change (the overall change in engineering units)
For this example assume that Time Change and RPM Change were both set to “None” and the
Overall Change trigger for a channel was set to set to 0.25 mils.
6. Click <OK>.
With this configuration, data will be stored if . . . the motor’s speed is greater than 200 RPM and less
than 5000 RPM and the overall value changes by 0.25 mils [since the last trigger event]. In this case
eZ-TOMAS will store time waveform and spectral gauge (band) data for all channels. All event triggers
are reset whenever any event trigger occurs.
In other words:
IF minRPM < Motor Speed < maxRPM
AND IF {delta Time, OR delta Speed, OR delta EU = specified setting}
THEN data is stored.
eZ-TOMAS 947394 Edit Menu 4-11
Page 40

Limits
S
The Limits Configuration window is accessed from the Edit pull-down
menu. The window provides the user with a means of setting limits and
ranges via three main scenarios. These involve setting:
Default Spectral Limits [without RPM ranges]
•
(used for Acquisitions, or in Post Acquisition for reports)
• • RPM Alarm Ranges and RPM Alarm Limits
(used for Acquisitions, or in Post Acquisition for reports)
Excel Report Ranges and Delayed Limits
( Only used in Post Acquisition for reports)
The type of configuration is determined by radio button selection, as can be seen in the following pages.
Up to two High (HI and HI-HI) and two Low (LO and LO-LO) limits can be defined for each channel’s
operating condition. The gr aph colors are defined in the Display Preferences window. If the channel
value is lower than the LO-LO limit, the bar graph will change to the color indicated in the LO-LO column
header (see following figure). A value between LO-LO and LO limits will cause the bar graph color to
change to the specified LO limit color. HI and HI-HI limits have the same effect, relative to channel value.
A bar will be green for normal channel values (those between the LO and Hi limits.
electing Limits from the Edit
Pull-down Menu
Partial Spectral Limits Panel Showing
User-set Color Indications for LO-LO, LO, HI, and HI-HI
Example of Limits Effects on the Gage Panel’s Color Bars
4-12 Edit Menu 947394 eZ-TOMAS
Page 41

Gauges and Mouse-Clicks
Vertical Gauges Circular Phase Gauges
“Right-Click” on an active
limit-pointer to bring up the
Limit Configuration Window.
“Right-Click” elsewhere in a
vertical gauge to bring up the
Input Channels Tab [on the
Setup Configuration
Window].
“Left-Click and Hold” on a
limit-pointer to drag it to a
new position, thus setting a
new limit value.
Additional Limit Configuration Aspects
When a limit value is set to zero, the limit setting is turned off.
“Right-Click” within the
confines of a circular
phase gauge to bring up
the Limit Configuration
Window.
“Left-Click and Hold” on a
limit-line to drag it to a
new position, i.e., a new
limit angle.
In the Limits dialog you can choose to ignore the RPM limits feature by clicking the Use Defaults Spectral
Limits option (see upper screen shot on next page), or you can click the Use Spectral Limits with RPM
Ranges option and define an additional set of limits for each desired RPM range.
Settings pertaining to the “Set Excel Report Ranges and Delayed Limits” have no effect on an acquisition.
These settings only apply to Excel reports. Chapter 6 provides details.
The following pages pertain to the following three bulleted scenarios:
Default Spectral Limits [without RPM ranges]
•
(used for Acquisitions, or in Post Acquisition for reports)
• • RPM Alarm Ranges and RPM Alarm Limits
(used for Acquisitions, or in Post Acquisition for reports)
Excel Report Ranges and Delayed Limits
( Only used in Post Acquisition for reports)
Each section shows the Limit Configurations window with the appropriate radio button selection. In each
case a flow diagram is provided to allow the user to visualize the key configuration elements. Comparing
the three methods to each other will improve your understanding of the Limit Configuration windows
functionality.
In each of the following cases, a spreadsheet representation of Spectral Band limits is visible for only 1
input channel at a time. Note that a given channel can have several different sets of spectral limits and
delays. For example, a different set for each tachometer; and when ranges are used, a different set of limits
can for each of 5 possible ranges and for each of up to 3 tachometers.
Although Excel Report Ranges and Delays are set in the Limit Configurations window, it is from the XL
Report window (discussed in chapter 6) that the setting options are selected for the report. Please refer to
that chapter for details.
eZ-TOMAS 947394 Edit Menu 4-13
Page 42

Using Default Spectral Limits [RPM Ranges not used]
Note: In the above figure “Tach Channel(s) Tach Ref” is the same as “Default Tach.”
4-14 Edit Menu 947394 eZ-TOMAS
Page 43

If the RPM Range option is selected [following figure] you can define up to 5 non-overlapping RPM
ranges. There can be gaps in the user defined RPM ranges; however, the ranges may not overlap. For
example: Range 1 can be assigned to cover 400 to 800 RPM, and Range 2 can be set to cover 900 to 1000
RPM - ignoring speeds between 800 to 900 RPM. But you can't set Range 2 to cover 700 to 1000 RPM,
as that overlaps the coverage in Range 1.
When RPM ranges are used, there is a unique set of limit set-points for each combination of: Tach
Channel, Input Channel, Range, and Spectral Band. For convenience, you may copy and paste limit
settings between Channels.
Limit values are not used if:
(a) the ‘HiHi limit value’ minus the ‘LoLo limit value’ is less than 5% of the
instrument scale, or
(b) the limit value is outside of the instrument range.
(c) the limit value is set to Zero.
Limits from one channel can be copied to another from the Limit Configuration
Window’s Edit pull-down menu, using the “Copy Channel” option, or by selecting
multiple channels.
Tach
You may have up to three tachs per project.
Select the Default Tach for the limits.
Channel
Spectral Band
Number of interest. Select the channel(s) of interest.
To which the limits should be applied. ( i.e. Ove rall , DC Ga p, 1 x Amp,
1x Phase)
HIHI, HI, LO, LOLO
Are Limits. Up to two High and two Low limits can be defined for each
channel’s operating condition. Limit values are typed (entered) into the
applicable rows and columns. See previous figure.
You can modify limits on the graphical bar graph display in the main window by
dragging the limit arrows and then opening this window to save your changes. You may
also right-click on a limit arrow to open the Limit's configuration dialog box. Note that
right-clicking elsewhere on the bar will bring up the Setup Configuration Window.
FIFO Records
Is the number of Alarm events logged. When an alarm occurs, eZ-TOMAS
automatically saves the data to the History FIFO file.
RPM Range
The RPM range as defined by the minimum and maximum RPM values of the
limit check. This RPM Range is the limit check range.
An Example of Using Limit Ranges
With exception of speed change transients, an experimental induction fan was designed to run at one of three normal
operating speeds: 2,500 RPM at low speed; 7,500 RPM at medium speed, and 12,500 RPM at high speed. An
engineer wants to run limit checks for the medium and high speeds. More specifically, he wants to check Channel 2
for a range of 5,001 to 10,000 RPM; and Channel 3 for a range of 10,001 to 15,000 RPM. Thus, he performs the
following steps:
1. Opens the Edit menu.
2. Selects “Limits.” The Limit Configuration window opens.
3. In the Limit Configuration window he:
o Selects the Use Spectral Limits with RPM Ranges option.
o Checks Channel 2 and Channel 3 to “ON.” (See following figure, upper screen image).
o Sets the limit check range for Channel 2 as follo ws: Min. RPM to 5,001; Max RPM to 10,000.
o Sets the limit check range for Chann e l 3 as follows: Min RPM to 10,001; Max RPM to 15,000.
o Un-checks all remaining channels to turn them “Off.”
o Clicks <OK>.
Note that the following figure reflects these settings.
eZ-TOMAS 947394 Edit Menu 4-15
Page 44

Setting RPM Alarm Ranges and Limits
Note: In the above figure “Tach Channel(s) Tach Ref” is the same as “Default Tach.”
4-16 Edit Menu 947394 eZ-TOMAS
Page 45

Setting Excel Report Ranges and Limits
Note: In the above figure “Tach Channel(s) Tach Ref” is the same as “Default Tach.”
eZ-TOMAS 947394 Edit Menu 4-17
Page 46

Digital I/O Configuration
Hardware Panel
The top panel of the Digital I/O Configuration Window is the Hardware panel (see following figure).
To ensure proper output:
(1) An NDTRelay must be connected as indicated in separate NDTRelay documentation.
(2) The relay’s model number must be indicated in eZ-TOMAS’s Digital I/O
Configuration window.
(3) The applicable COM Port must be identified.
Model Number: Select the applicable output relay module: NDTRelay1 or NDTRelay2.
RS 232 COM Port: Select the COM (serial) Port to which the output Relay module is connected.
Digital Input
is Selected
Digital Output
is Selected
Enable/Disable
Digital I/O
Alarm Event for
Digital Output
Sets the Digital
Output’s Normal
State to “Opened”
or “Closed”
Time (seconds)
that the Digital
Output is to be
Active
Action Selected
(from pull-down
list) for Digital
Input
Digital I/O Configuration, Accessible from the Edit Pull-Down Menu (2 views)
The panel below the Digital I/O Panel will be an Alarm Event panel for Digital Output channels, as indicated in the
left-hand image; and will be an Action Performed panel for Digital Input channels, as indicated in the right-hand
image.
Digital I/O Channels Panel
The second panel of the Digital I/O Configuration window is the Digital I/O Channels panel. There are
four Digital I/O channels, each of which can be configured for digital input or digital output. As seen in the
above figure [which shows a Digital Output example on the left and a Digital Input example on the right].
Each of the 4 channels has a Checkbox that is used to enable or disable the digital I/O function of the
•
channel. A checkmark in the box indicates that the channel is active.
• • The “DI / DO” column is used to select Digital Input or Digital Output. Clicking on the small
schematic icon (in the column) toggles between the two options, i.e., Input and Output and displays an
associated image. The arrow going into a connector represents Digital Input, the arrow leaving the
connector represents Digital Output.
The “NO / NC” column refers to the normal state of the Digital Output. The normal state can be set to
be Normally Opened or Normally Closed on limit/alarm status . You can use up to four relays. A blue
line, showing an open between two points is used for Normally Open. A red line, connecting two
points, is used for Normally Closed.
4-18 Edit Menu 947394 eZ-TOMAS
Page 47

• The DO Timer column refers to the time [in seconds] that the Digital Outp ut is to be active. The DO
Timer box will display “n/a” when Digital I/O is selected.
Alarm Events Panel (Digital Output Only)
The color of the response channel in the “Alarm Events” panel indicates the limit/alarm status that will
cause the switch to change status, i.e., from Opened to Closed, or visa versa. Click on a channel number
until the desired limit color is displayed. If the relay is normally Opened when monitored data causes the
specified limit/alarm, the relay will change to Closed for the duration specified by the timer; then it will
return to the normally Opened status.
Note that you can have the system count the number of consecutive alarms and change the relay status
when that number of alarms is reached.
Action Performed Panel (Digital Input Only)
This panel consists of a pull-down list that allows you to select one of several “actions” for Digital Input
applications.
Possible actions are:
• Store Snapshot
• Change Acquisition State
• Change Limit Check State
• Increment Serial Number
• Increment Serial Number and Reset Peak Hold
When you click the Save button, any of the unchecked check boxes for relay channels
will close and stay closed until the condition is met for that relay channel. If you have
something that will actuate when the channel closes, it will do so as soon as you click the
Save button.
eZ-TOMAS 947394 Edit Menu 4-19
Page 48

Display Preferences Window [in Edit Menu]
Display Preferences Window
The Display Preferences Window provides a means of changing various display colors and other
parameters, including, but not limited to, Waterfall latitude and longitude angles, and units for the
frequency axis. If a machine name is entered (upper-right text field), it will appear on the eZ-TOMAS
main window, in the Machine Description region.
Although most display preference functionality is self-explanatory, the following information may be
useful to some.
The Gauge Window Colors panel allows you to define the colors seen on the
main EZ-TOMAS window. Gauge refers to the background color of th e
Analog Input Channel gauges. Tach is specific to the Tach Input Channels
on the ZonicBook/618E.
The Machine Information panel consists of a textbox for displaying the
machine name, serial number, of some other identifying information.
The Plot Window Colors panel allows you to define the Plot Display's
border, background, and grid colors.
The Display Buffer panel consists of a single numeric field for indicating
the Realtime Trend. This value defines the amount time [in minutes] that
data will be displayed before scrolling will begin. For example, if the
Realtime Trend was set for 2 minutes the trend display would show the data
being collected for two minutes, and then start scrolling after 2 minutes. In
this example the screen will always display the most recent 2 minutes of
data.
4-20 Edit Menu 947394 eZ-TOMAS
Page 49

Display Preferences (continued)
The Plot Trace Colors panel allows you to define colors for use
in the plot displays. If you select "By Trace" the sequential
order of the Trace Number will define the plot color. If you
select "By Channel" colors will be assigned to specific
channels according to the numbered color squares (see figure
at left).
The Alarms panel defines alarm colors for the Gauge and Plot displays. The
panel includes two numeric fields. The upper field indicates the number of
records to be displayed. The lower field, for Pre/Post Alarm Event, defines
the amount of data that will be displayed when using the Alarm Log report.
The Waterfall Display panel is limited to a fixed number of spectrum traces,
up to 100 traces. The Longitude Angle defines the vertical tilt of the display.
The Latitude Angle defines the horizontal tilt.
The Frequency Axis panel is used to set the frequency axis to Hz or CPM.
Select Hz-Orders for cycles per second; or select CPM-Orders for cycles
per minute.
The Bode Display panel allows for selecting “Unwrap Phase” by means of a
checkbox. When the box is unchecked the phase plot will be "Wrapped."
Wrapped means the Y-axis scale is 0 to 360 degrees. Data that straddles the
0 / 360 boundary will show a vertical line.
Unwrapped allows the Y-axis scale to span multiple 360 de grees. When
“Unwrap Phase” is selected data will smoothly transition across the 0 / 360
boundary.
The Main Cursor and Harmonic Cursors can be shown with or without a
vertical line. Click on the first button [in the associated cursor panel, left
figure] to toggle to the desired choice (line or no line). The second button in
each panel allows you to choose a color for the associated cursor.
The Orbit Display - Bearing Circle panel allows the user to select “Probe
Location” or “X / Y Axis.” The selection defines the Bearing Circle on the
Orbit display. If the bearing clearance is elliptical, select the locations that
will be used to measure the clearance.
eZ-TOMAS 947394 Edit Menu 4-21
Page 50

Copy Window
“Copy Window” is not a window, but a command to copy the currently selected window to the clipboard.
After using this command you can paste the copied window into anothe r application, such as Microsoft
Word or Excel. The feature is useful for creating reports, or sending screen images to others via e-mail.
Load [or Remove] Graphic Picture
The Load command places a selected graphic ( .bmp or .jpg format) into the Machine Description Window.
The Remove command removes it.
An alternative to using the command is to right-click in the graphic region. You can then load the desired
graphic file. Right-clicking in this region also provides you with the option of removing an existing
graphic.
The title bar text is entered in the Display Preferences Window (accessed via the Edit pull-down menu.
The lower text field information is entered directly into the field.
Reset Peak Hold Values
Momentarily resets the peak values. However, the new peak acquisition values [which exist from the point
of reset] will immediately apply.
4-22 Edit Menu 947394 eZ-TOMAS
Page 51

Display Menu . . . Plots 5
Introduction …… 5-1
Saving and Recalling Plot Setups …… 5-3
Changing Display Ranges and Scales …… 5-4
“Real Time” Plot Controls …… 5-5
“History Data” Plot Controls …… 5-5
Channels …… 5-7
Filtering Data …… 5-8
Introduction
The Display pull-down menu [following figure] provides a means of displaying plots and several types of
logs, or reports. This chapter covers the Plots aspect. Chapter 6 pertains to the various logs (reports) that
can be generated from the menu.
Select Plots from the Display Pull-down Menu
Selecting Plots from the Display pull-down menu opens a Data Display window. Note that you can
double-click on a gauge to open a Data Display window for plotting that gauge’s data.
For real-time displays, you can halt and resume the display of data by using the Pause/Continue toggle
button, or use the “P” key on the keyboard. When viewing hist ori cal dat a, y ou can use the five playback
buttons and the slider to navigate through the data (see the following figure).
You can view either real-time data or historical data. In the examples that follow we are view historical
data, thus the History button has been clicked, and appears “active” [green] on our screen.
Prior to viewing a plot you need to:
select the channels to be displayed •
•
select the desired data display format, e.g., Time Display, Spectrum, or Waterfall
•
select the data source, i.e., a “Real Time” source, or a history data file.
•
change the scale, if desired
Reference Notes:
For toolbar button functions re fer t o chapt er 6.
For examples of various plot display types refer to chapter 7.
eZ-TOMAS 947294 Display Menu … Plots 5-1
Page 52

In the Window below the following is true:
o four Time Waveform plots are present
o the plot at the lower right has “focus,” thus the toolbars currently apply to that plot
o channels 1 and 2 have been selected for display in each of the plots
o from the first (top) toolbar button we can see that historical data is bei n g u sed (t he < Hist o ry >
button is active)
o from the second toolbar we can see that the Time Waveform display format is selected
o from the third toolbar we know that:
- Auto Scale (magnifying glass) has been selected , instead of Instrument Scale or User Scale)
- Cursor Display (9
- Cursor Update for Peak Search (11
- Overlay Bearing Clearance Circle (16
th
button) is selected. This shows a plot cursor with annotation.
th
button) is active
th
button) is active
History Data – Time Waveforms
Plot controls can be data that is in “Real Time” or pre-recorded, i.e., “History Data.” A different set of
control buttons will be present depending on which mode you are using. In addition, Time Display and
Spectrum Display formats differ in regard to certain control options.
Reference Notes:
For toolbar button functions re fer t o chapt er 6.
For examples of various plot display types refer to chapter 7.
5-2 Display Menu … Plots 947294 eZ-TOMAS
Page 53

Saving and Recalling Plot Setups
You can save and recall plot setups. If you typically need to display data in a fixed format, this option can
simplify the display setup process. After you can setup your plot displays, select the “Save Plot Setup” file
menu option and save the setup. The next time you need to display data in that format, you can use the
”Recall Plot Setup” file menu option to quickly display data in that format.
File Pull-down Menu with
“Save Plot Setup” and “Recall Plot Setup” Options
Preparing to Save a Plot Setup
Preparing to Recall [Open] a Plot Setup
eZ-TOMAS 947294 Display Menu … Plots 5-3
Page 54

Changing Display Ranges and ScalesTo change the maximum or minimum range value (following figure): Left-click on
upper or lower scale value that is to be changed, then enter the new value. An example follows. This technique works for
both X and Y axis.
In this example, the cursor and PC
keyboard were used to change the
maximum scale value from 3.000 volts
to 3.800 volts.
To change the X-Axis (following figures): Hold down the <Ctrl> key, at the same time, left-click and drag the mouse
cursor horizontally on the plot. Two vertical cursor lines will define the new x-axis end points.
To change the Y-Axis (following figures): Hold down the <Alt> key, at the same time, left-click and drag the mouse
cursor vertically on the plot. Two horizontal cursor lines will define the new Y-axis end-points.
To simultaneously change the X & Y Axes (following figures): Hold down the <Ctrl> and <Alt> keys, at the same time,
left-click and drag the mouse cursor diagonally on the plot. A rectangle will define the new area of the plot.
5-4 Display Menu … Plots 947294 eZ-TOMAS
Page 55

“Real Time” Plot Controls
“Real Time” is the default data source. For Real Time displ a y s you can Halt and Resume the display of
data by using the <Pause/Continue> toggle button (see following figure). As an option to the <Pause/
Continue> button you can use the “P” key on the PC’s keyboard. A table, which identifies all control
buttons follows shortly.
The <Clear Real Time Plot Buffer> button, which looks like a black “X,”allows you to clear the data in
the realtime trend displays. This display option can be used to clear the plot displays prior to starting a
test.
Selects
Real
Time
Mode
Pause/
Continue
Clear Real Time
Plot Buffer
“History Data” Plot Controls
Real Time Mode is Selected
Data SourceHistory File
When viewing History Data (pre-recorded data files), you can use the set of playback buttons or the slider
bar to navigate through the data. A table, which identifies all control buttons, is presented in chapter 6.
Note that the playback buttons and slider remain hidden in the GUI when eZ-TOMAS is in the Real Time
mode.
History Data is accumulated according to the parameters setup in the Setup Configuration window’s
Storage Tab, which is accessed via the Gauge Panel window’s Edit Menu.
Play Back
Buttons
History Data Playback Update
Slider [Delay] Slider
History Data (Playback) Mode is Selected
The playback buttons from left to right are: Rewind, Step backward one record, Play Backward, Stop, Play,
and Step forward one record
Note that you can drag the History Data Slider (at the right of the play buttons) to a specific area of the file
before you start playing back the data.
The Playback Update [Delay] Slider allows you to slow down (delay) the playback update. The delay value
can be set to anywhere from 0 to 1000 milliseconds, in 200 millisecond increments.
eZ-TOMAS 947294 Display Menu … Plots 5-5
Page 56

Alternate clicking on the <Data Source History File> button will toggle the History Data dialogue box on
and off.
Use sliders
to set the
start and
stop times
for the
desired
playback.
Show
Alarm Log
Show
Snapshot Log
The default is the entire history file. To change the start and end dates drag the sliders to the desired start
and stop times. Click OK. Then, from the plot window, click the play button to play back the file.
Historical Data is not available via Networking remote access.
The History Data window includes a Show Alarm Log button. Click the button to open a table of alarm
events that are included in the file (if applicable). You can select an alarm event to display the data that
surrounds the event.
The History Data window also includes a Show Snapshot Log button. Click the button to open a list of
data snapshots. You can select a snapshot from the list to view it in the plot window.
RPM Filter – This feature eliminates hysterisis and is therefore useful for trend di spl a y s, e.g. , St ri pchart,
Polar, Shaft Centerline and Bode. If the RPM Filter checkbox is checked eZ-TOMAS will only display
data for increasing or decreasing RPM.
5-6 Display Menu … Plots 947294 eZ-TOMAS
Page 57

Channels
The vertical channel bar at the right-hand edge of each plot represents the input channels. The number of
channels that can be displayed is dependent on the plot display format. Some points regarding channels
follow.
The toolbars apply to the selected plot (the plot which has “focus”). In the figure below the
•
lower right-hand plot has “focus.” Toolbar buttons are explained in chapter 6.
•
A color-filled channel box indicates that the channel is currently being displayed as a trace of
matching color.
•
A white channel box indicates that the channel is active, but is not being displayed.
•
A dimmed channel number is not active, thus there is no data to display.
•
Multiple channels can be plotted on Time, Spectrum, Strip Chart, and Bode displays.
Examples of plot types are provided in chapter 7.
•
A single channel can be plotted on Waterfall, Polar, and Shaft Center Line displays.
•
For Orbit displays, the time display of a channel pair and tach pulse location are displayed.
•
Channel boxes for Tach channels appear in the row below the menu bar.
Four Bode Plots Displayed Simultaneously
Reference Notes:
For toolbar button functions re fer t o chapt er 6.
For examples of various plot display types refer to chapter 7.
eZ-TOMAS 947294 Display Menu … Plots 5-7
Page 58

Filtering Data
Time and Orbit plot displays can be cleaned up by the use of band and/or shaft revolution filters. The two
filter pull-down lists reside just to the right of the buttons in the third toolbar [when counting the main
window toolbar as toolbar 1]. The first filter list allows the user to select a Band Filter. The second filter
list allows the user to filter data based on the number of shaft revolutions.
In the example below, the plot on the left is based on 10 revolutions of unfiltered data. The plot on the
right makes use of the same data from 10 revolutions, but also makes use of a 1x filter.
Band Filter
Selections
No Filter
1x
2x
3x
4x
5x
6x
Shaft Revolution
Filter Selections
Full Block
1 Rev
2 Revs
5 Revs
10 Revs
Plots Showing the Same Data with Different Band Filter Selections
5-8 Display Menu … Plots 947294 eZ-TOMAS
Page 59

Toolbar Buttons 6
1st Toolbar
1
2
3
4
2nd Toolbar
1
2
3
4
5
6
7
8
9
10
11
12
13
Data Source-Real Time – selects the “Real Time” live data acquisition mode or the “History Data” (Play Back) mode.
Pause / Continue – toggles to pause or continue data monitoring. Applies only to the Real Time mode.
Clear Real Time Plot Buffer allows you to clear the data in the realtime trend displays. This display option can be used
to clear the plot displays prior to starting a test.
Data Source-History File – Opens the History Data Dialog Box to select a file for viewing via the playback (history data)
mode. After clicking this button the playback buttons and related slider will appear.
Add Plot Window – Adds one more plot window to the screen. Note that there is a limit of 8 plot windows. Versions of
eZ-TOMAS preceding 5.0 have this button located on the right side of the toolbar.
Align Plots, Vertical Orientation – Affective with 2 or more plots. This function orients the plot windows such that they
are longer in the vertical direction. With 8 plot windows, eZ-TOMAS will display 2 rows of 4 plot windows. Compare this
feature to the following “Align Plots, Horizontal Orientation.” Versions of eZ-TOMAS preceding 5.0 have this button
located on the right side of the toolbar.
Align Plots, Horizontal Orientation – Affective with 2 or more plots. This function orients the plot windows such that
they are longer in the horizontal direction. With 8 plot windows, eZ-TOMAS will display 4 rows of 2 plot windows.
Compare this preceding “Align Plots, Vertical Orientation.” Versions of eZ-TOMAS preceding 5.0 have this button located
on the right side of the toolbar.
Time Waveform - Selects Plot Display window for which the x-axis is in units of time.
Spectrum – Selects a Plot Display window for which the x-axis is in frequency-related units.
Orbit – Used to plot a time waveform for a channel pair. The data will is displayed in a polar format.
Waterfall – Selects a Plot Display window that makes use of x, y, and z axis. Waterfall plots display data as a series of
Spectral Maps. Some users refer to Waterfall Plots as Cascades.
Bode – Selects a plot display window in which the x-axis is scaled in RPM.
Polar – Selects a window for a circular plot with units of g’s/division.
Stripchart – Selects a stripchart type plot display window.
Shaft Centerline – Used to plot a shaft centerline orbit as a trend in Gap Voltage for a channel pair. The data is
displayed in a polar format.
Tachometer Reference – Choosing a channel number sets the tachometer reference channel to be displayed, regardless
of the Setup Configuration settings. If only one channel is displayed the “T” option is available. “T” assigns the reference
tachometer in accordance with Setup Configuration.
Show Baseline – superimposes a pre-recorded baseline on top of display data. This option is only available in the Time
or Spectrum plots. Show Baseline is typically used to compare a spectrum with another (the baseline) which was taken
when the machine was known to be in good working condition. Show baseline is only available for multiple plot
applications.
eZ-TOMAS 937694 Toolbar Buttons 6-1
Page 60

3rd Toolbar
1
Scale – Toggles between Instrument Scale, Auto Scale, and User Scale. User Scale is shown in the figure.
Instrument Scale is the default. It displays the data based on the instrument’s Engineering Units range.
Auto Scale automatically scales the axes based on the data being displayed.
User Scale is used to display data in relation to a user-defined scale. You can quickly customize a scale as
follows:
(1) press the <Ctrl> + <Alt> keys and hold them in.
(2) press the <left mouse button> and hold in
(3) move the mouse cursor to draw a rectangle around the area of the plot that you desire to view.
(4) release the mouse button and the two keys. Your plot should now have a new and more practical
scale.
Hz
Delta Time or Delta Record – For Stripcharts Only: Selects one of two X-axis spacing types.
(a) When button (7) is gray, Delta Time is selected for the X-Axis. Delta Time spacing displays data with
absolute time for the X-axis.
(b) When button (7) is green, Delta Record is selected for the X-Axis. Delta Record has X-axis time
spacing based on record changes. Thus the time line on the X-axis is not uniform. Delta Record spacing is
good when there are short acquisition durations over long periods of time as vacant time slots are
eliminated from the display.
Skip Records or Use All Records – For Waterfalls Only: Selects one of two display modes.
(a) When button (7) is gray, “use all Records” is selected and the entire Waterfall will scroll. Scrolling can
be forward or backward.
(b) When button (7) is green a maximum of 100 records will be scrolled based on a Skip Record Factor.
SRF = History Records / Waterfall Records - 1. Thus if we had 634 history records and 100 waterfall
records we would have a skip factor of 6.4 records, i.e., 634 / 100-1 = 6.4 records. This skip factor would
result in 100 records being scrolled. Note that the SRF is automatically calculated and applied by software.
Kcpm
Orders
10
11
Instrument
Scale
Auto Scale
User Scale
2
3
4
5
6
7
Manually Scale X and Y Axis – A diagonally oriented dual-arrow cursor appears. The cursor lets the user simultaneously
adjust both the X-axis and Y-axis by dragging the mouse.
Manually Scale Y Axis – A vertical dual-arrow cursor appears. The cursor lets the user manually adjust the Y-axis by
dragging the mouse.
Manually Scale X Axis – A horizontal dual-arrow cursor appears. The cursor lets the user manually adjust the X-axis by
dragging the mouse.
Linear / Log Scale Y Axis – Spectrum Display Only. This button allows you to switch between Linear and Log Y-axis
scaling. If you expand the data plot this feature is disabled until the plot is returned to its original scale via the Auto Scale
button.
Frequency Axis – Used to set the x-axis to Hz, kCPM, or Orders. Applies to Spectrum Plot Windows only. Each click of
the Frequency Axis button toggles the x-axis unit of measure, i.e., Hz, kCPM, Orders, Hz, kCPM, Orders, etc.
With
Stripcharts
selected
With
Waterfall
selected
8
9
Multiple Trace Cursor
Locked - When locked, a single cursor will maintain a reference mark for each trace in the plot window, i.e, at each point
where the cursor intersects a waveform.
Unlocked - When unlocked, there will only be one reference mark on the cursor. The mark will only apply to the first trace
(lowest number channel). However, a separate cursor can be used for each trace.
Display Cursor Values – allows you to show a plot cursor with annotation. A cursor is provided with each plot trace.
Cursors can be visible or hidden.
Display Gauge Values – opens a floating table of gauge values. Alternatively, it allows cursor values to be displayed, if
the Display Cursor Values button is activated. (see Display Cursor Values). Note that the “L” key on the keyboard can be
used to display the gauge values.
Cursor Update - Fixed X axis / Peak Search – When this button has a gray background, the x-axis is fixed and the
cursor will not move when a new spectrum is plotted. When the button has a green background “Peak Search” is in effect
and the cursor will automatically move to the highest point on the plot. The button is typically used for Spectrum plots,
either Real Time or Historical Data.
6-2 Toolbar Buttons 937694 eZ-TOMAS
Page 61

3rd Toolbar (continued)
12
Cursor Mode – Only available for Spectrum plot displays. The button cycles through the following four modes.
Normal (gauge values) – A free-moving single cursor provides a point for each trace displayed. This is the
only cursor that can be used with multiple traces.
Harmonic – Can only be used when 1 trace is displayed. Results in several cursors positioned to the right of
the primary cursor and at intervals that are at twice the x-axis value of the primary cursor. For example: When
the primary cursor is at 100 Hz, the first harmonic cursor will be at 200 Hz, the second at 400 Hz, the third at
600 Hz, etc. Moving the primary cursor to 400 Hz would result in the first harmonic cursor residing at 800 Hz,
the second at 1200 Hz, etc. If Display Gauge Values is selected, the applicable values will be shown for all
cursors. Harmonic cursors can only be moved by moving the primary cursor.
Side Band – Can only be used when 1 trace is displayed. Results in several cursors spaced at even intervals
on both sides of the primary cursor. Unlike the harmonic cursors, the sideband cursors can be moved by the
user. Once adjusted, they remain in position at until the next adjustment. If Display Gauge Values is selected,
the applicable values will be shown for all cursors.
Peak List – Can only be used when 1 trace is displayed. On a real-time or playing plot, the cursor will
automatically position itself at the highest point on the trace.
13
14
15
16
17
18
Annotation - Active with Polar, Waterfall, and Shaft Centerline Plots. Use this button to superimpose RPM or Time
values onto the displayed data.
Overlay Limits – For Spectrum, Stripchart, and Polar plot windows. Superimposes the limit values onto the displayed
data.
Runout Compensation – displays a graph of the RunOut compensated values. RunOut compensation is a vector math
operation in which the referenced first-order amplitude and phase vector is subtracted from the displayed first order
vector. This option is only available for Bode and Polar plots.
Overlay Bearing Clearance Circle – Superimposes the bearing clearance circle over the plot display. This feature can
be used with the following plot types: Orbit, Shaft Centerline, Bode, Stripchart, and Time Waveform.
Band Pass Filter Selection – Used with Time and Orbit plots. Allows the user to apply an nX filter to time data for Time
and Orbit plot displays.
Shaft Revolution Filter – Used with Time and Orbit plots. This filter selection is used to limit the amount of data
displayed. The limitation is set by selecting “n,” where “n” is equal to the number of shaft revolutions. The Shaft
Revolution Filter is used to make the plot display cleaner by reducing clutter from excess data.
eZ-TOMAS 937694 Toolbar Buttons 6-3
Page 62

6-4 Toolbar Buttons 937694 eZ-TOMAS
Page 63

Plot Examples 7
This chapter provides examples of the various plot types. The following chapters are directly related to this
one and may need reviewed or referred to.
Chapter 5, Display Menu… Plots, discusse s:
Selecting Plots from the Display pull-down menu opens a Data Display window. Note that you can
double-click on a gauge to open a Data Display window for plotting that gauge’s data.
For real-time displays, you can halt and resume the display of data by using the Pause/Continue toggle
button, or use the “P” key on the keyboard. When viewing hi st orical dat a , y ou can use the playback buttons
and the history data slider to navigate through the data.
You can view either real-time data or historical data. In the examples that follow we are view historical
data, thus the History button has been clicked, and appears “active” [green] on our screen.
o how to save and recall plot setups
o change display ranges
o change scales
o Real Time and History Data (playback) modes
o channels
o filtering data
Chapter 6, Toolbar Buttons, identifies the layout of the
toolbars and explains the purpose of each button.
Prior to viewing a plot you need to:
select the channels to be displayed •
•
select the desired data display format, e.g., Time Display, Spectrum, or Waterfall
•
select the data source, i.e., a “Real Time” source, or a history data file.
•
change the scale, if desired
The examples in this chapter consist of the following:
Time Waveform …… 7-2
Spectrum …… 7-3
Orbit …… 7-4
Waterfall …… 7-5
Bode …… 7-6
Polar …… 7-7
Strip Chart …… 7-8
Shaft Centerline …… 7-9
NOTE: In eZ-TOMAS version 5.2, Spectral Band types are designated as “A” through “J”
instead of “1” through “10” (as shown in related screen shots). Functionality of the
band types has not been changed.
eZ-TOMAS 937594 Display Menu … Plots Plot Examples 7-1
Page 64

Time Waveform Displays
Time Waveform displays show vibration amplitude as a function of time (seconds) for a block of time
domain data. This Block is the measured data used in Spectral Displays. The default amount of data
shown is Full Block. A subset of the Block can be displayed by selecting "N" Shaft Revolutions.
"N" can be 1, 2, 5, or 10.
Multiple channels can be shown on the Time Display.
Time
Waveform
Display
Display
Cursor
Values
Cursor
Update
(Peak
Search)
Overlay
Bearing
Clearance
Circle
Four Time Display Plots of Two Channels
In this figure the plot at the lower right has focus.
7-2 Display Menu … Plots Plot Examples 937594 eZ-TOMAS
Page 65

Spectrum Displays
)
Spectrum Displays show vibration amplitude as a function of frequency. The frequency
units can be either Hertz (Hz), cycles per minute (CPM) or orders.
Multiple channels can be shown on the Spectrum Display.
Spectrum
Display
Display
Cursor
Values
Display
Gauge
Values
Cursor
Update
(Peak
Search
Spectrum Displays
In this figure the plot at the lower right has focus.
eZ-TOMAS 937594 Display Menu … Plots Plot Examples 7-3
Page 66

Orbit Displays
Orbit Displays show simultaneous time domain vibration amplitud e for an X and Y probe pair.
The location of each Tach pulse is shown on the orbit plot using black circles; and a rotation direction label
("CCW" or "CW") is shown next to these (see figure).
The default display is “Full Block” of time data. However, a specific number of Shaft Revolutions can be
displayed (1, 2, 5, or 10) by using the associated pull-down list (see figure). The orbit display is corrected
for probe location.
You can optionally overlay the orbit onto a shaft center line display by clicking the Shaft Centerline
button. The center of the orbit trace in SCL computes the difference between the current gap voltage and
the reference gap voltage. Information regarding shaft centerline plots is presented on page 7-9.
To display an overlay of the bearing circle clearance, as indicated below (third plot), click the
<Overlay Bearing Clearance Circle> button (see figure).
Note: Only one probe pair can be shown on the Orbit Display.
Display
Cursor
Values
Cursor
Update
(Peak
Search)
Overlay
Bearing
Clearance
Circle
Display
(see pg. 7-9) Filter (Note 1)
Orbit Shaft Shaft
Centerline Revolutions
Three Orbit Plots and a Time Waveform Plot Display
In this figure the plot at the upper right has focus.
7-4 Display Menu … Plots Plot Examples 937594 eZ-TOMAS
Page 67

Waterfall Displays
(
)
Data Source
History File
Waterfall
Display
Display
Cursor
Values RPM
Annotation
Peak Cursor
Update Spectral Bands
1, 3, 5, 7 shown selected
Waterfall Display
Waterfall Displays show a series of Spectrums on a 3D graph. The X Axis is Frequency either Hz or CPM. The Y Axis is
Vibration Amplitude. And the Z Axis is time. The following factors apply to this figure.
Spectral Bands
(1x) amplitude, "5" and "7" are the user defined spectral bands. (2x and 4x respectively)
1, 3, 5, and 7 are overlaid. "1" is the spectrum for the current historical record pointer, "3" is the first order
Selected History Range is selected and a Skip Record Factor (SRF) is automatically determined to show the entire selected
history range. In this example, the requested history range includes 634 records, the Waterfall displays 100 records. In this
example
SRF = History Records / (Waterfall Records - 1) = 634 / 99 = 6.4 records.
Cursor Value and Peak Cursor Update options are selected. The cursor with annotation will be placed on the highest
amplitude value on the current spectrum.
RPM annotation is selected. RPM values are shown on the right side of the waterfall display. 10 annotation labels are
supported.
Note A: To adjust the Latitude Angle (Vertical Pitch) of the Waterfall display, Right Click in the Y-axis area and enter a
value between 0 and +75 degrees. This is indicated in the upper left corner of the display (see figure). Unless you
right-click in the Y-axis region, this feature will remain hidden.
Note B
: To adjust the Longitude Angle (Horizontal Pitch) of the Waterfall display, Right Click in the X-axis area and enter a
value between -75 and +75 degrees. This is indicated in the lower right corner of the display (see figure). Unless
you right-click in the X-axis region, this feature will remain hidden.
eZ-TOMAS 937594 Display Menu … Plots Plot Examples 7-5
Page 68

Bode Displays
Bode Displays show vibration amplitude and phase as a function of rotating speed. You can optionally
display the Runout compensation values on the same plot by clicking the associated button (see figure).
Runout Compensation is a vector math operation, in which the referenced first order amplitude and phase
vector is subtracted from the displayed first order vector.
Note: Bode displays can only be used when one channel is selected.
1x Amplitude, selected 1xPhase selected
via button [3] via button [4]
Bode
Display
Display
Cursor
Values
Cursor
Update
(Peak
Search)
Runout
Compensation
1x Phase
1x Amplitude
Bode Display, Four Plots
In this figure the plot at the lower right has focus.
In the above figure:
• 1xAmplitude is from button [3] in the center toolbar
• 1xPhase is from button [4]
• To get Runout Compensation press the associated button (see figure)
7-6 Display Menu … Plots Plot Examples 937594 eZ-TOMAS
Page 69

Polar Displays
Polar Displays show vibration amplitude and phase lag on a polar plot format. The data is corrected for
probe location. Phase lag is opposite the direction of rotation. You can option a lly display the “Runout”
compensated values by clicking the associated button (see figure). The compensation values are specified
for each channel in the setup configuration.
Runout Compensation is a vector math operation, in which the referenced first order amplitude and phase
vector is subtracted from the displayed first order vector.
Note: Only one channel can be shown on a Polar Display.
Display
Polar Cursor Cursor Update Annotation Overlay Runout
Display Values (Peak Search) Limits Compensation
Four Polar Plot Displays
In this figure the plot at the lower right has focus.
eZ-TOMAS 937594 Display Menu … Plots Plot Examples 7-7
Page 70

Strip Chart Displays
Strip Chart Displays, show selected instrument gauge values as a function of date and time.
The ten Spectral Band Types are: (1) Overall, (2) DC Gap V, (3)1x Amplitude, (4) 1x Phase,
with these four bands pre-determined; and spectral bands (5) through (10) being user defined.
The spectral bands are selected from numbered buttons located in the central toolbar (see figure).
Display Overlay
Cursor Stripchart Cursor Overlay Bearing Select Spectral Band Type
Display Display Update Limits Clearance (1 through 10)
Circle
Four Strip Chart Displays
In this figure the plot at the lower right has focus.
7-8 Display Menu … Plots Plot Examples 937594 eZ-TOMAS
Page 71

Shaft Center Line (SCL)
Shaft Centerline (SCL) is used to display the change in gap voltage for a Channel Pair. SCL is typically
used in conjunction with Displacement Probes.
In order to get valid SCL displays the input channels must be DC coupled.
The measured DC Gap Voltage is corrected to the Gap Reference Value and Shaft Starting Location
(Brg Start), which are set in the Edit pull-down menu’s Setup Configuration window, in the Input
Channels tab.
Display Shaft
Cursor Centerline Cursor Update Annotation Overlay Bearing
Values Display (Peak Search) Clearance Circle
Shaft Centerline Displays with Annotation
In this figure the plot at the left has focus.
The movement of the shaft centerline [towards the probe] can be easily calculated by dividing the change
in Gap Voltage by the Displacement Probe’s sensitivity. An example follows.
Example:
Machine running: Gap Voltage (GV
Machine at rest: Gap Reference Voltage (GV
Delta Gap Voltage: (GV
– GV2) is 1 VDC
1
) is -9 VDC
1
) is -10 VDC
2
Probe Sensitivity (S): 200 mV/mil
SCL movement equals Delta Gap Voltage divided by Probe Sensitivity, therefore:
Movement = (GV
– GV2) / S
1
= 1VDC / (200 mV/mil)
= 5 mil
Note: 1 mil = 0.001 inch, or 25.4 µm
eZ-TOMAS 937594 Display Menu … Plots Plot Examples 7-9
Page 72

7-10 Display Menu … Plots Plot Examples 937594 eZ-TOMAS
Page 73

Display Menu . . . Reports 8
Statistical Report …… 8-1
Alarm Log Report …… 8-4
Snapshot Log …… 8-5
Generate Report using Microsoft Excel …… 8-6
Configuration Setup
eZ-TOMAS can generate the following types of logs or reports: Statistical, Alarm, Snapshot, and
Configuration Setup text file (.txt). You can use Microsoft Excel to generate a report. Discussion of the
Excel aspect begins on page 8-6. Note that Plot displays, which can also be selected from the Display pulldown menu, are discussed in Chapters 5, 6, and 7.
Statistical Report
The Statistical Report lists the historical spectral band data. It includes the instrument, the engineering
units, the minimum value, the mean average value, the maximum value, and the standard deviation by
channel.
[.txt File] …… 8-15
Display Pull-down Menu
The Statistical Report can be accessed from the Gauge Window’s Reports Pull-down menu.
Statistical Report
The report can be saved as an ASCII text file for further use.
This data can be used to generate or fine tune limits. Note that you can have eZ-TOMAS automatically
compute limit values by selecting Generate Limits on the File menu. You can view and modify limits by
selecting Limits in the Gauge Window’s Edit pull-down menu. Chapter 2 contains additional information.
eZ-TOMAS 947494 Display Menu …. Reports 8-1
Page 74

Accessing a Statistical Report
To obtain a Statistical Report you need to specify the time period that the report is to cover. This is
accomplished as follows:
1. From the Gauge Window’s Display pull-down menu, select Statistical. The History Data window
will open (see following figure).
2. Drag the pointers across the slide scales to select the Start Date/Time, and the End Date/Time, which
is to define the period of time that the report is to cover.
3. Click the <OK> button to display the report.
History Data Window
4. To save the Statistical Report as an ASCII text file, select Save the Report from the Statistical
Report’s File pull-down menu (see following figure).
The Statistical Report’s File Pull-down Menu
With options to “Save the Report” and to “Generate Limits”
Statistical reports can be used to automatically generate limit values based on historical data. If your
monitored machine has been operating at a steady state condition and if you have stored data at this
condition, then eZ-TOMAS can use this data to determine limit values based on the average and variance
of the data. However, you probably will want to edit these limits if the machine is experiencing amplitude
or frequency shifts.
8-2 Display Menu…. Reports 947494 eZ-TOMAS
Page 75

Using a Statistical Report to Generate Limits
Statistical reports can be used to automatically generate limit values based on history data. If you have
acquired and stored data at a steady state machine condition Tomas can calculate limits for you based on
the Average and Variance of the data.
1. On the Display pull-down menu select Statistical; the History Data window will open.
2. Drag the top slide pointer across the time scale to select the Start Date and Time for the report.
3. Drag the lower slide pointer across the time scale to select the End Date and Time for the report.
4. Click the <OK> button. The Statistical Report will be displayed.
5. Open the File pull-down menu.
6. Select “Generate Limits.” The Limit Generation dialog box will appear (see following figure).
7. Select the Spectral Bands for which limits should be generated.
Limit values are not used if:
(a) the ‘HiHi limit value’ minus the ‘LoLo limit value’ is less than 5% of the
instrument scale, or
(b) the limit value is outside of the instrument range.
Limit Generation
8. In the Limit Value Calculation panel, specify the Standard Deviation to be used for Alert High,
Alert Low, and Danger High, Danger Low.
9. Click the <OK> button. A prompt will appear, asking if you want to Save New Limits.
10. Click <Yes>.
eZ-TOMAS 947494 Display Menu …. Reports 8-3
Page 76

Alarm Log
The Alarm Log contains the last “N” number of alarms. The number of alarms is the “FIFO Records”
number specified in the Limit Configuration window’s Alarm Log File panel.
Specifying an Alarm Log File Size of 100 FIFO Records
Note that this panel is located in the Limit Configuration Window.
The Alarm Log (following figure) includes the date and time, the channel number, reference tachometer,
instrument name, spectral band type, alarm type, and value of the alarm signal.
You can access the Alarm Log from the Gauge Window’s Display pull-down menu, or by clicking the
<Show Alarm Log> button [located in the History Data File window].
Alarm Log
To save the Alarm Log select “Save the Report” from the window’s File Menu. The log is saved as a TXT
file associated with the TOMAS project. Notepad is automatically activated to show the Alarm log. To
display data surrounding the alarm event Double Click on the alarm event.
Show
Alarm
The Show Alarm Log Button in the History Data Window
8-4 Display Menu…. Reports 947494 eZ-TOMAS
Page 77

Snapshot Log
<Snapshot Button>
on the Gauge Window
This button is used to take a
snapshot
of 1 frame of data.
The Snapshot Log can be accessed from the Gauge Window’s Reports pull-down menu, or fr om the
History Data Window. The Snapshot Log file contains entries which were created whenever the user
clicked the <Snapshot> button, which is located in the Gauge Window ’s Data Storage panel (see upper left
figure). That button should not be confused with the <Show Snapshot Log> button, which is located in
the History Data Window.
The <Show Snapshot Log> Button & Show Snapshot Log
This button is used to access the Snapshot Log.
The <Snapshot> button captures one frame of data which is stored in the log. In the above figure the log
contains 2 entries.
eZ-TOMAS 947494 Display Menu …. Reports 8-5
Page 78

Generate Report using Microsoft Excel
You can use eZ-TOMAS in conjunction with Excel to generate a custom report. This is true as long as you
are using eZ-TOMAS version 5.0 or higher and Microsoft Excel 2000 version 9 or higher.
Display Pull-down Menu
To create a report using Excel, first select the Generate Report using Microsoft Excel option from the
Display pull-down menu. The XL Report generation dialog box will appear. This allows you to select the
options that will determine the content and appearance of the report. Examples are included later in this
chapter.
Report Generation Dialog with Default Limits Selected
8-6 Display Menu…. Reports 947494 eZ-TOMAS
Page 79

Reports are created using the option settings that are defined in the project. Among the options available
you have your choice to include:
• Specific channels.
• Specific Spectral Bands.
• Choice of Reference Tach.
• Starting and Ending data block range.
• The Maximum, Minimum or Average data value associated with a specific Spectral Band.
• Inclusion of the Limits settings in the report and the selection of which limits to include.
• A Pass/Fail indication. A Pass condition exists if the Spectral Band data never exceeds the
selected limit(s).
• Machine and operator information, and a project comment.
• Report formatting option.
• Speed Ranges. You can choose one of five options via radio button (see following figure). A
brief description of each follows shortly.
Speed Range Options
Note that the Limits Configuration dialog (discussed in chapter 4) allows you to configure two
sets of Ranges [and their associated Range Limits] in addition to the range independent Default
Limits. One set of Ranges and Limits are for the Alarms. The alarm settings are used during your
monitoring session and provide range sensitive limits that, if exceeded, will cause an alarm
condition. The other set of Ranges and Limits have no bearing on the data acquisition and are
used by the Microsoft Excel report generator in post -acq ui sition.
When you run your Excel report, the five different Speed Range options are as follows. The
Limits section of chapter 4 includes information pertaining to the actual setting of limits.
Default Limits. Selects the default limits. These are range independent. When this option is
1.
selected all of the data [for each selected channel and gage] is compared against the default
limits.
Alarm RPM Range Limits. All of the data for each selected channel & gage is compared
2.
against this set of ranges & limits. Up to 5 ranges can be selected from the resulting range list
(see following figure). The ranges are set in the Limits Configuration dialog, discussed in
chapter 4.
RPM Ranges
eZ-TOMAS 947494 Display Menu …. Reports 8-7
Page 80

Report RPM Ranges. All of the data for each selected channel & gage is compared against
3.
this set of ranges & limits. Up to 5 ranges can be selected from the resulting range list which will
look like that in the previous figure, but with the values as set for the “Report RPM Ranges.” The
ranges are set in the Limits Configuration dialog box, discussed in chapter 4. Note that the Range
dependant delay values [set in Limits Configuration (reference chapter 4)] are ignored.
> (Greater Than) Report Limits Delay. This selection uses the Report Ranges and Limits.
4.
When “> Report Limits Delay” is selected the report generator only examines the data beyond the
specified delay time, added to the first data record that was detected within a specific RPM range.
For example: If data record number 100 was the first record that was stored when the turbine
RPM was in the range of 85,000 to 100,000 RPM, and data records were being saved at a constant
rate of 1 per second, and the specified delay value of 1.0 minute was given, then the first record
that will be used in the report will be record number 160. All further records acquired in the
85,000 to 100,000 RPM range will also be used in the calculations for Minimum, Average, or
Maximum values compared against the selected Report limit values. Note, however, if the
turbine should slow down enough that a range change is detected, and then speed back up to the
85,000 to 100,000 RPM range, another delay time will be observed before addition records are
added to the previous ones for generating the report.
< (Less Than) Report Limits Delay. This selection uses the Report Ranges and Limits.
5.
When “< Report Limits Delay” is selected the report generator only examines the data before the
specified delay time, added to the first data record that was detected within a specific range. Other
than this difference, this option behaves much like the greater than (>) option.
8-8 Display Menu…. Reports 947494 eZ-TOMAS
Page 81

Report Generation Dialog with “Alarm RPM Range Limits” Selected
In the Report Generation dialog box above, the user is creating a report for channel's 1 and 2, referenced to
tach T1. The report will show the Maximum values that were acquired for the first four Spectral Bands of
channel's 1 and 2 when the Turbine RPM range was within any one of the 3 selected Ranges. The report
will also show the Maximum value obtained when the Turbine was running outside any of the 3 selected
ranges [because the “Out of Ranges” check-box has been selected]. The report will include the Limits setpoints that are associated with each specified Channel, Tach, RPM Range and Spectral Band.
After the selection of report options has been made, click the <Create Report> button to have eZ-TOMAS
start Excel and create the report. If Excel is already running when the button is clicked the report will be
created in a new Worksheet in the currently selected Work bo o k. After th e report has been created, the XL
Report dialog box will be closed and the current Report option settings will be saved in the project settings.
Follow these steps if you do not wish to create a Report at this time, but want to set the Report options and
save them:
1. Select the desired report options.
2. Click the <Apply> button. This save s the Report settings.
3. Click <Cancel> to exit the dialog.
eZ-TOMAS 947494 Display Menu …. Reports 8-9
Page 82

Report as it appears in Microsoft Excel
8-10 Display Menu…. Reports 947494 eZ-TOMAS
Page 83

The preceding report was generated using the settings from the XL Report dialog box. Th e report contains
Channel's 1 and 2, the HiHi Limit values assigned to each Spectral Band in each RPM range, the
Maximum Spectral Band value obtained in each of the selected RPM ranges, and the Maximum Spectral
Band value obtained outside any of the selected RPM ranges (the Out of Ranges value).
Data and Limits selection
The Report contains the HiHi limit values from the Spectral Band RPM range limits set, because the HiHi
limits were selected in the Report options. When the Data Selection is set to Maximum, you have your
choice of either the HiHi or Hi limits. When set to Minimum, you can choose between the Lo or LoLo
limits. If Average is selected, two limits will be included in the report. One will be either HiHi or Hi, the
other either Lo or LoLo.
The colors displayed in the Evaluate Limits section of the XL Report dialog box, reflect the colors of the
limits as they are defined in the Display Preferences window.
Alarms Colors [in the Display Preferences Window]
When deciding what options will be selected for the report, if the Display Pass/Fail option is enabled,
eZ-TOMAS will perform an analysis of the data and include the results in the Excel Report.
eZ-TOMAS 947494 Display Menu …. Reports 8-11
Page 84

In the example report show, the user has enabled the Display Pass/Fail option, and has selected Average
for the Data Selection mode of operation. When Average is selected, an upper and lower limit must be
selected to define the limits for the analysis. In the example report, the LoLo and HiHi limits were
selected.
8-12 Display Menu…. Reports 947494 eZ-TOMAS
Page 85

Interpreting the Report
One Channel Block from a Report
In our report example, each channel block has three sections: Average Values, LoLo-HiHi Limit Values,
and Status. Each of these sections includes a grid made up of rows of the RPM ranges that were selected
for the report, and columns of Spectral Bands. If the Default Limits were used to generate the report, only
one row would have appeared in the grid since there are no limit ranges when the Default option is
selected.
The first section of the block (see figure) contains the results of the analysis of the data. In this case it is
the
Average Values for all the data. If Out of Ranges was included in the report, this is the only section
where that specific row will appear in the grid. In the example report, each cell in the grid contains the
Average value of all the data for a specific Spectral Band that was gathered for a specific RPM range. For
example, in Channel 1 -labeled Accel Ch 1- the cell under the Overall spectral band column, in the 400 to
799 RPM range row has the value of 0.0250. This means that all of the Overall Band readings, ob tained at
an RPM range of from 400 through 799 RPM, ha ve an A ver age val ue o f 0. 02 5 0. The nu mber of readings
that were obtained while the Turbine was running in that speed range is not displayed.
The grid cell under the Overall spectral band column in the Out of Ranges ro w has a val u e of 0. 03 1 0. This
means that all of the Overall Band readings, obtained at an RPM range that was not within any of the three
RPM ranges shown, has an Average value of 0.0310. The number of readings that were obtained while the
Turbine was not running within any of the three selected RPM ranges is not displayed.
The second section in the report (
configuration dialog for each Spectral Band and RPM range. Since Average was selected for the report, an
upper and lower limit is needed for the report. The selected upper and lower limit is shown in the green
shaded area; and the values of these limits are displayed in the grid. As you can see in the report, the
LoLo and HiHi limits were selected, and for the Overall spectral band in the 400 through 799 RPM range,
the lower to upper limits extend from a value of 0.2000 to 1.8000. If a spectral band has zero value for it's
associated RPM range, the Limits cell in the grid displays a "-" character, indicating that the value in the
cell is ignored.
The third (
Status) section of the report displays the Pass/Fail results of the Analysis. As stated above, the
Overall spectral band average value for the 400 to 799 RPM range was 0.0250 and the LoLo to HiHi limits
settings for the same spectral band and RPM range were 0.2000 to 1.8000. Since the value of 0.02 5 is
outside of the range of 0.2 to 1.8, the results of this spectral band/RPM range test resulted in a failure
condition. This is indicated by the word Fail in the Status grid cell [in the Overall spectral band column]
and in the 400 to 799 RPM range row. If a spectral band has zero value for its associated RPM range, the
limit value is ignored for the test and a dash (-) is displayed in the grid. This indicates neither a Pass nor
Fail condition for that value.
If any of the cells in the Status grid contain a Fail state, the right edge of the channel block is set to red, and
displays the word Fail.
LoLo-HiHi Limit Values) contains the Limits that were set in the Limits
eZ-TOMAS 947494 Display Menu …. Reports 8-13
Page 86

If all of the cells in the grid contain a Pass state, the right edge of the channel block is set to green, and
displays the word Pass.
If each cell in the grid contains a dash (-) the right edge of the cell is set to yellow to indicate that neither a
Pass nor a Fail condition exists. In this case no text appears.
If any of the channel blocks indicate a Fail condition, the Test Status line in the report header displays the
word Fail, as shown in the following figure.
Report Header Showing a Test Status of “Fail”
If all channel blocks indicate a Pass condition the Test Status line in the report header will display the word
Pass. If all channel blocks indicate a non Pass/Fail condition, Test Status line in the report header is set to
yellow and displays "n/a". In regard to the Test Status, the XL Report dialog has both Pass Text and Fail
Text entry fields where you can customize text to use in place of the “Pass” “Fail” defaults.
Auto Format
The XL Report generator includes an Auto Format option. When you select Auto Format you are
instructing the software to automatically include the entire eZ-TOMAS report in the Excel worksheet’s
print area. With Auto Format selected, the report’s page will automatically orientate to portrait or
landscape, whichever is optimal.
8-14 Display Menu…. Reports 947494 eZ-TOMAS
Page 87

Configuration Setup [.txt File]
Selecting “Configuration Setup” from the Reports pull-down menu creates a text file that contains
configuration details of the current project.
Setup Configuration .txt File
eZ-TOMAS 947494 Display Menu …. Reports 8-15
Page 88

8-16 Display Menu…. Reports 947494 eZ-TOMAS
Page 89

Network Menu [In Gauge Window] 9
This feature requires multiple copies of eZ-TOMAS, one on each networked computer. Each networked
computer must have eZ-TOMAS running in order to access the networking functions.
When networked, a node is set as either a client or a server. The server computer is the one which is
connected to the data acquisition hardware. It can be monitored by one or more remote client computers.
The client PC does not need to be connected to acquisition hardware, e.g., no Zon icBook, WaveBook, or
Medallion connection is required for the client machine.
In the server computer’s Configure Network Nodes window [accessed from the Network pull-down
menu] you will need to enter the remote computer’s network identification name or its IP address. You
should contact your network administrator prior to making the network configuration. Even if you know
the computer name and or IP address, the network administrator should be informed of your intent.
In the client computer’s Configure Network Nodes window you will need to enter the server computer’s
network identification name or its IP address.
Connecting to a Network Node
Find the computer you wish to connect to in the network node list, and left-click on it.
eZ-TOMAS will establish the client/server relationship. Once a network connection is
established, a connection icon (two computers connected by an arrow) and a disconnect button
(a large “X”) will be displayed. The name of the computer connected to will also appear between
the two buttons. In the above figure the computer is 100312.
Network Status Messages
There are four status messages that can be displayed in the Options panel of the Gauge window.
When not connected, the message: “Listening to Netw ork .. . ” appears.
While searching for eZ-TOMAS on another PC, the message:
“Connecting to <computer name> on port <number>...” appears.
If acting as a client that is connected to a server, the message will read:
“Received” and the current time will be displayed.
If acting as a server, and a client has connected, the message:
“Network Xfer Timer” will appear, followed by a number in seconds.
(See upper right figure).
Options Panel with a Network Transfer in Progress
Disconnecting a Network Node
Click the disconnect <X> button, which appears at the right edge of the Options panel
(see upper right figure).
eZ-TOMAS 947494 Network Menu 9-1
Page 90

9-2 Network Menu 947494 eZ-TOMAS
Page 91
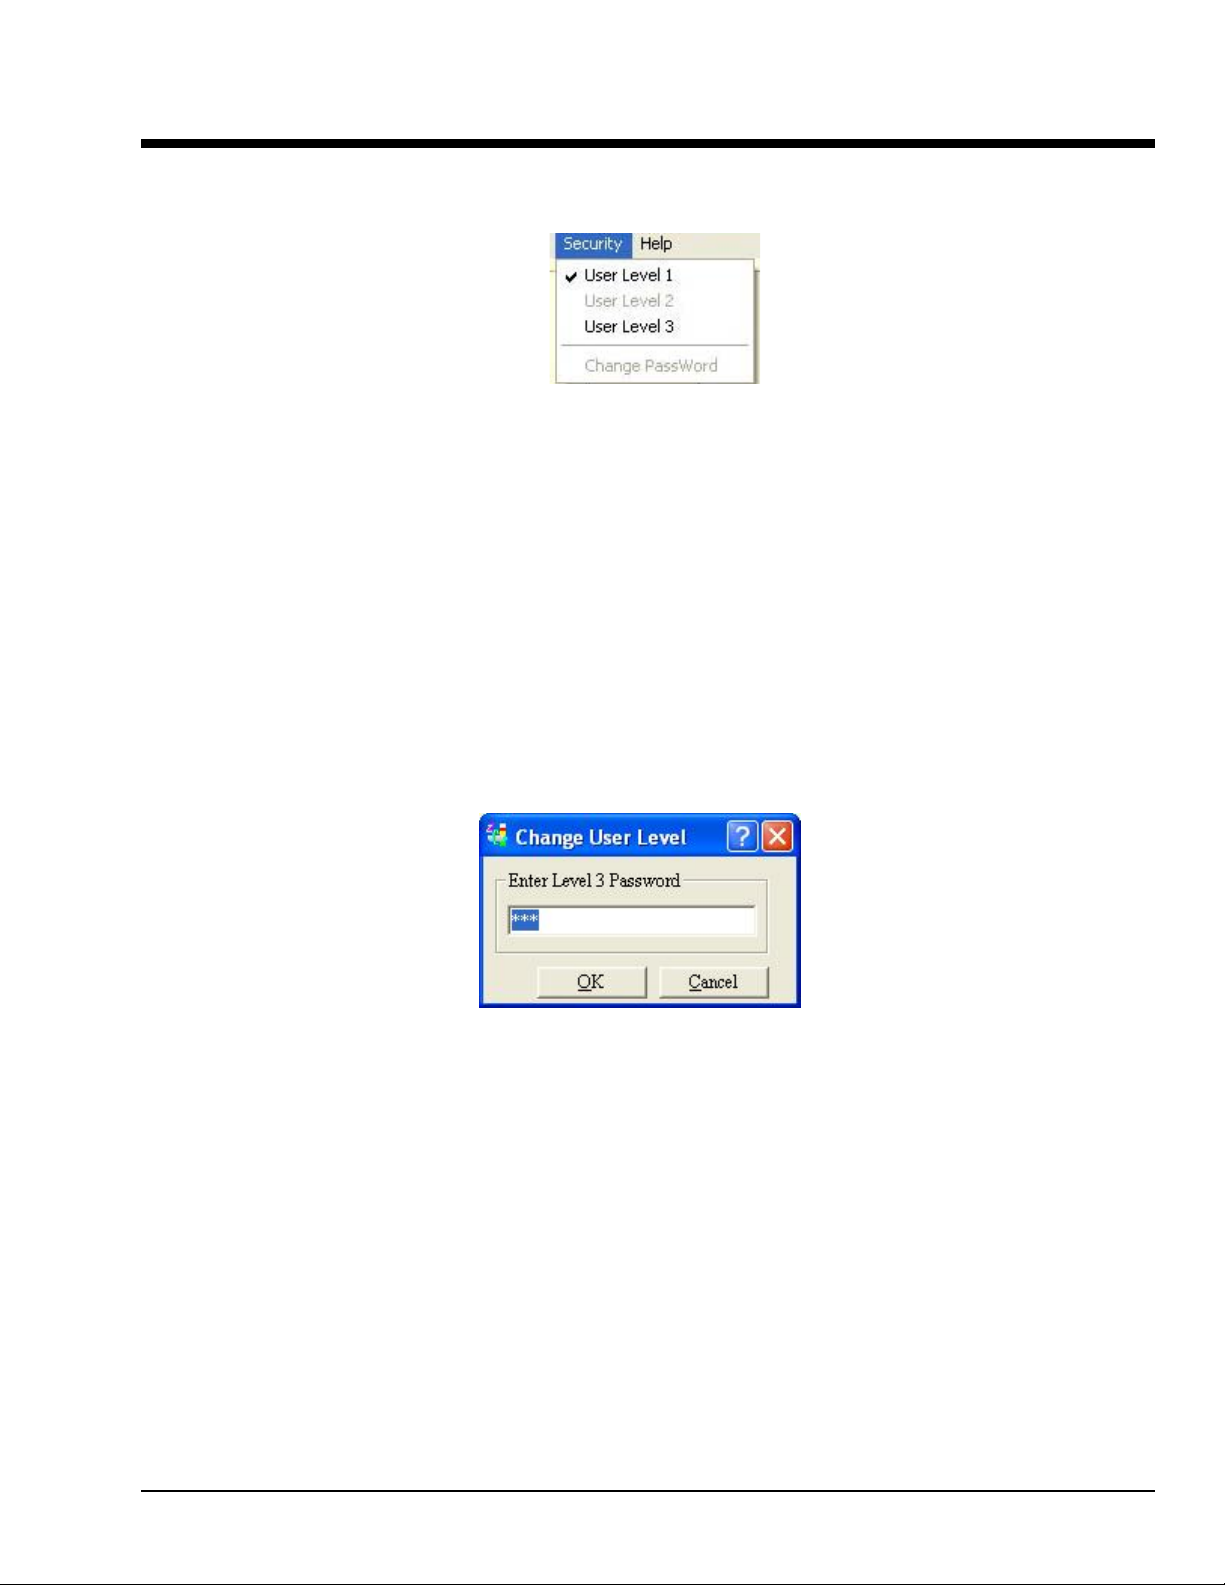
Security Menu [In Gauge Window] 10
Security Pull-Down Menu
eZ-TOMAS has 3 Security Levels.
• User Level 1 has very limited privileges – Exit, Print, Generate Alarm Log Report, and View
Gauge data in the Main menu.
• User Level 2 has a few limitations. Level 2 operators cannot start a new project, erase the History
file, or change the security password.
• User Level 3 has full privileges, which include the ability to start new projects and erase History
files. Level 3 is password protected.
After selecting User Level 3, a dialogue box similar to the following will appear. The user must enter the
project’s Level 3 password to enable full privileges.
No password is required to go from Level 3 down to Level 2 or to Level 1. However, the project password
is required to move from Level 1, or Level 2, to a higher level.
Security Level 3 Dialog Box
eZ-TOMAS 947494 Security Menu 10-1
Page 92

The “Change Password” command, in the Security pull-down menu, opens the Change Project Password
dialog box (see following figure). This dialog box will only be visible when the user selects the “Change
Password.” option. Note that you can only access the Change Project Password box from User Level 3.
Changing the Project Password
To change the password:
1. Open the Security pull-down menu.
2. Select “Change Password.” Note that you can only do this from User Level 3.
The Change Project Password dialog box will open.
3. Type the desired password in the field below “Enter Level 3 Password.”
4. Re-enter the password in the “confirm” text box.
5. Press the <OK> button.
If the confirmed password was entered correctly the new password will be in effect.
10-2 Security Menu 947494 eZ-TOMAS
Page 93

Appendix A - Using Function Keys A
tomasfkeys.ini
The tomasfkeys.ini file, distributed with eZ-TOMAS software, makes it possible to use your keyboard’s
Function Keys (F1 through F12) in conjunction w ith eZ-TOMAS. Through the ini file, you can set the
Function Keys to open frequently used projects.
The task of each Function Key is determined by how it is defined in the tomasfkeys.ini file. The following
table includes several definitions. In every case the first 4 characters are Fnn=, where the letters “n”
identify the Function Key of interest, e.g., F01 represents the F1 key, F02 the F2 key, etc. Each function
setup must start with the Fnn= syntax.
Example of Function Key Application
Key Function Setup in tomasfkeys.ini Function
F1 F01=HELP
F2 F02=ACQ
F3 F03=LC
F4 F04=SAVE
F5 F05=
F6 F06=
F7 F07=
F8 F08=
F9 F09=PRINT
F10 F10=
F11 F11=SN
See Customization,
See Customization,
page A-2
page A-2
Accesses the Help file
Turn the Acquisition On or Off
Turns the Limit Check On or Off
The same as clicking the <Snap Shot> button [camera
image] on eZ-TOMAS’s main window. Causes the
current record to be saved and stored into the History File.
An Acquisition must be running in order to use this
function.
Function Keys can be set to open a specified project. For
example, the following
F05=c:\program files\data\motor. t om1
sets F5 to open a motor project (motor.tom1) via the
path: c:\program files\data
Opens the Print window
--
Selects the serial number text field, which is located in the
Machine Description section of eZ-TOMAS’s main
window.
F12 F12=
eZ-TOMAS User’s Manual 897696 A-1
See Customization,
page A-2
--
Page 94

Customization
You can customize the Function Keys for eZ-TOMAS by completing the following steps:
1. Open the tomasfkeys.ini file in the Notepad application, or in a similar text editor. Note that
if you double-click on the ini file it will automatically open in Notepad, providing you have
that application.
2. Type new Function Key definitions, or edit the ones you want to change.
For example, for the F5 key, a user might enter: F05=d: \program files\data\turbine.tom3
where d:\program files\data is the path and turbine.tom3 is the file.
3. After you have made the desired changes, save the edited tomasfkeys.ini file.
Note: If eZ-TOMAS is running, you will need to close the program and restart it before the
changes go into effect.
A-2 897696 eZ-TOMAS User’s Manual
 Loading...