

Page 1

eZ-PostView
Time-Domain Post-Data Acquisition View Application
User’s Guide
(p/n 1086-0926, rev 2.0)
eZ-PostView User’s
eZ-Analyst Series
for Users of
eZ-Analyst
eZ-TimeView
eZ-FrequencyView
Users of these Applications
Click Here
Software Reference
Click Here
(p/n 1086-0922, rev 9.0)
938295
Page 2
eZ-PostView User’s Guide
Time-Domain Post-Data Acquisition View Application
eZ-PostView
User’s Guide
1086-0926
p/n
September 2002 Printed in the United States of America
Rev.
2.0
Page 3

ii
Page 4

Contents
Introduction
Ch 1 – Getting Started with eZ-PostView
Ch 2 – eZ-PostView Menus and Windows
Ch 3 – Interactive Features of eZ-PostView’s Plot Display Window
System Requirements …… 1-1
Software Installation …… 1-2
Features of eZ-PostView …… 2-1
File Menu …… 2-3
Edit Menu …… 2-4
Window Menu …… 2-11
How to Change Plot Display Characteristics ……3-2
How to Change “Focus” …… 3-2.
How to Add and Remove Channels …… 3-2
Other Features …… 3-3
Appendix A – Keyboard Controls
eZ-PostView
06-17-02
Contents iii
Page 5

iv
06-17-02
eZ-PostView
Page 6
Introduction
eZ-PostView is a time-domain post-acquisition data
viewing application that has been integrated with
primary data acquisition software, including
DaqView, Personal DaqView, ChartView, LogView,
and WaveView.
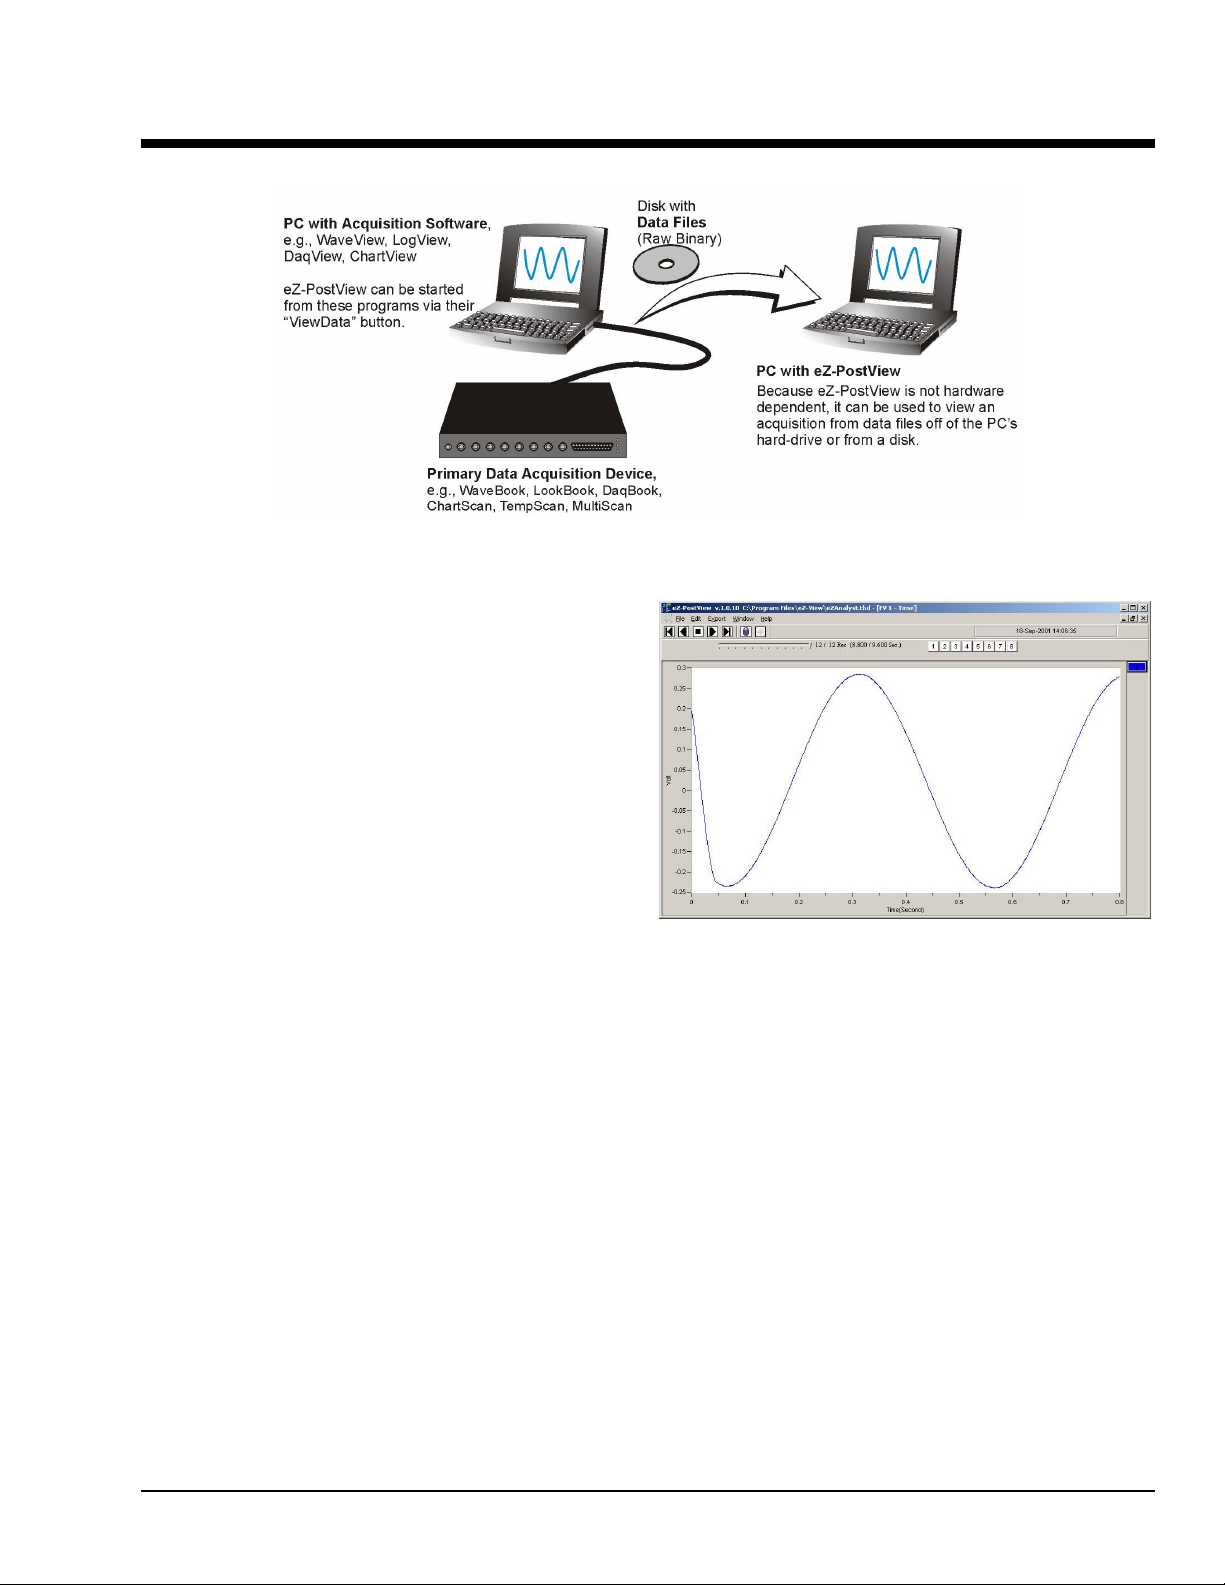
eZ-PostView Can Be Used without the Presence of Acquisition Hardware
The eZ-PostView application provides easy-to-use
post-acquisition analysis capability, and is included
free of charge as a part of product support. From
this application you can display up to 8 timedomain function windows and display up to 16
channel traces per window. Data is automatically
scaled to optimize its fit in the window.
From eZ-PostView you can customize window,
channel trace, and cursor colors.
Once installed, eZ-PostView can be launched from the data-acquisition program by a simple click of the
<View Data> button. As an alternative, the application can be launched independent of the acquisition program and
supported data files can be loaded for viewing.
eZ-PostView includes the following features:
• File Input Format Support for: DaqView, WaveView, Personal DaqView, ChartView,
Universal File Format UFF-58B.
• Can show 8 Display Windows simultaneously
• Can show 16 Channel Traces per Display Window
• Includes Automatic Data Scaling
• User-Configurable Data Display is provided for channels and trace colors
• Allows for multiple Tiling, or Cascading, of display windows
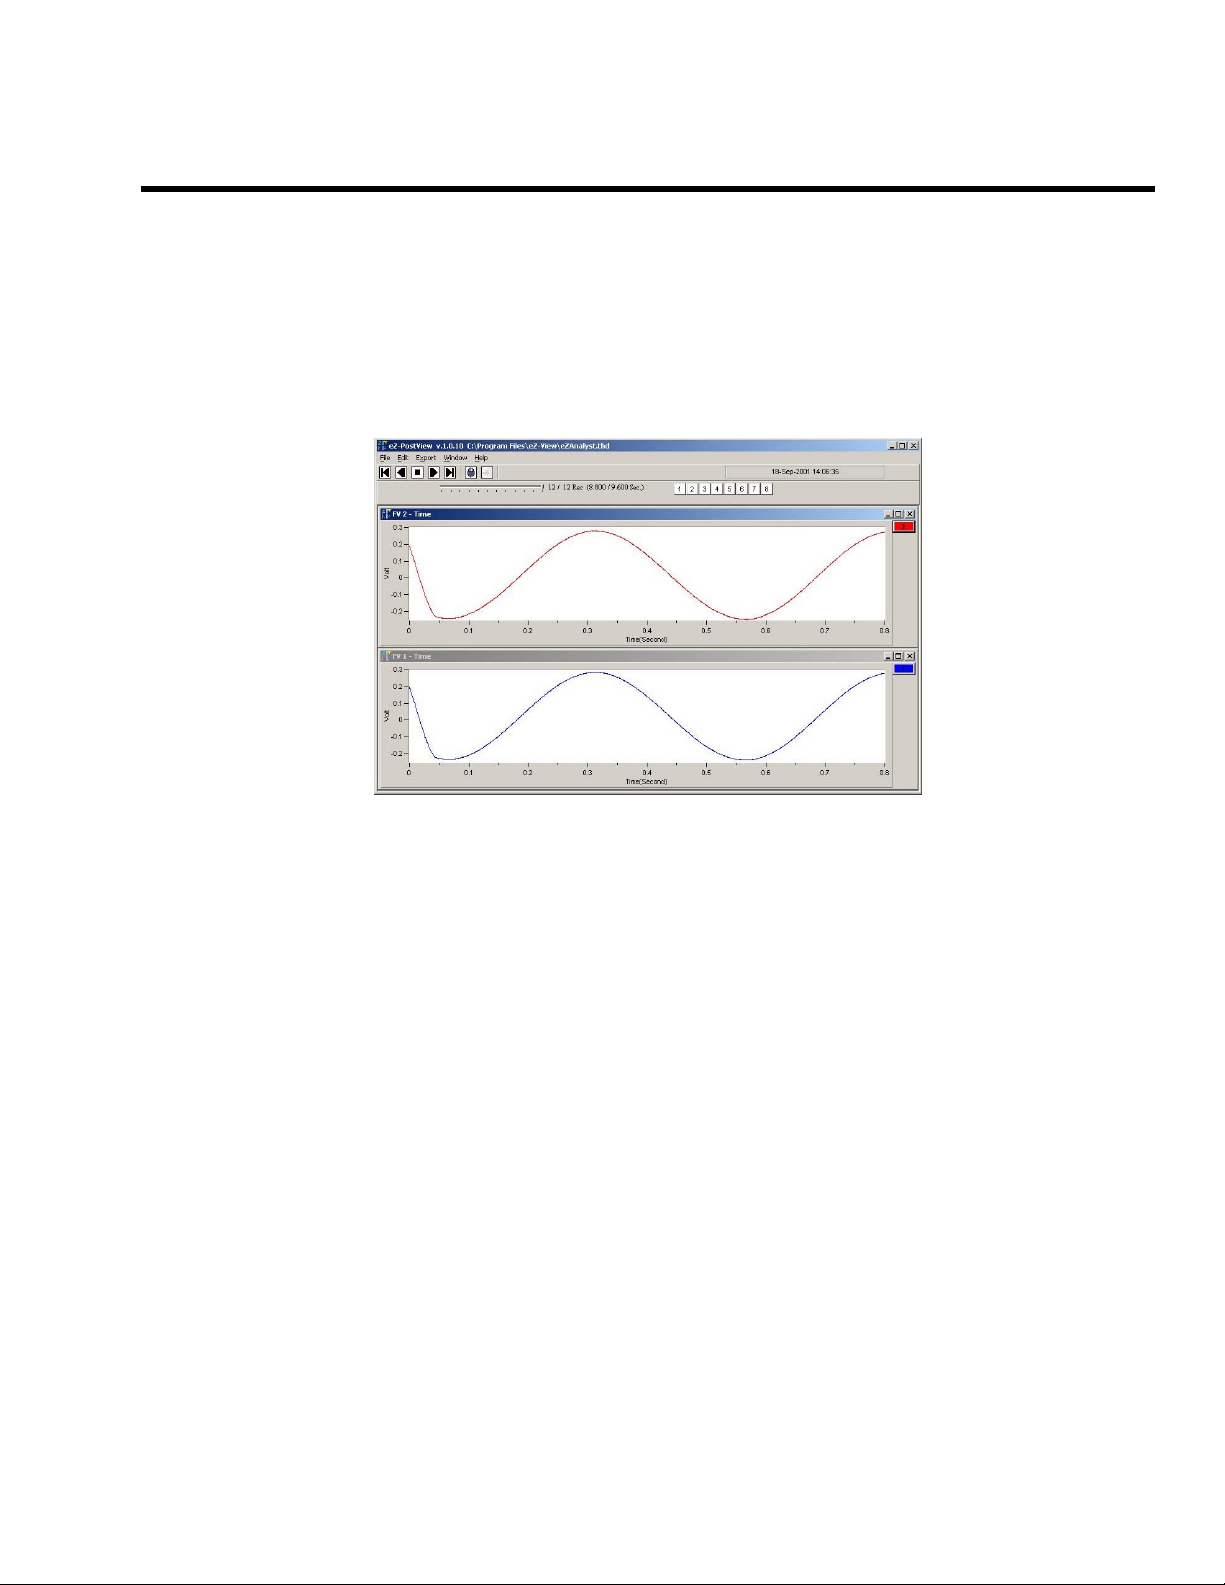
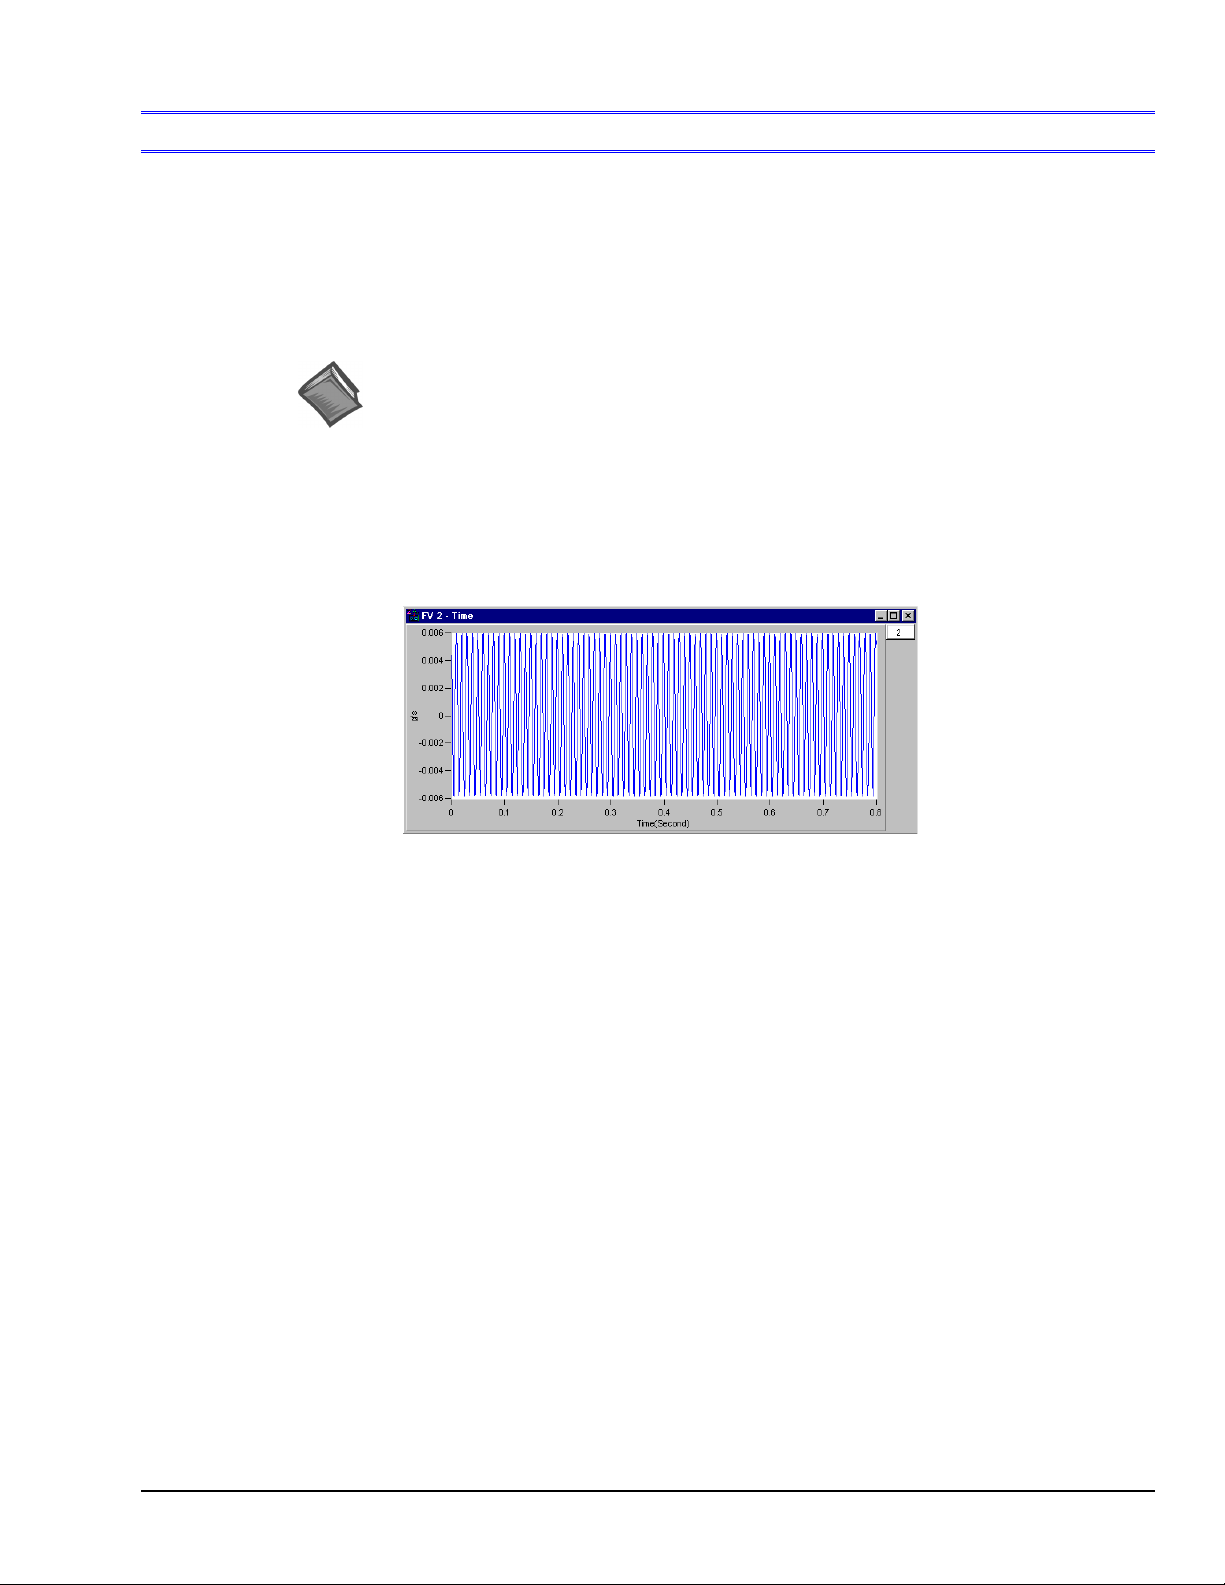
A Screen Capture from eZ-PostView
eZ-PostView
09-06-02
Introduction v
Page 7

eZ-PostView makes use of buttons similar to those found on VCRs. As indicated by the following figure,
you can select to play the data display forward, backward, or frame by frame in either direction. The
playback task bar is located just below the menu bar, which is detailed in chapter 2.
Play Backward, Play Backward Stop Play Play Forward
One Frame at a Time One Frame at a Time
Playback Task Bar
vi, Introduction
09-06-02
eZ-PostView
Page 8

Getting Started with eZ-PostView 1
System Requirements …… 1-1
Software Installation …… 1-2
System Requirements
Your computer should meet the following minimum requirements.
™
•
• 64 MB Memory
• 100 MB Hard Disk space
• Monitor: SVGA, 800 x 600 resolution
• One of the following Microsoft
, Pentium 90 MHz or equivalent
Intel
Windows 98
Windows Me
Windows NT
Windows 2000
Windows XP
®
Windows Operating Systems:
If you purchased software, associated authorization codes will accompany your
installation CD. If this is the case, keep your codes in a safe place. You will need to enter
them once, during an actual run of the purchased software.
Note that no authorization code or password is needed to run eZ-PostView.
eZ-PostView
09-05-02
Getting Started 1-1
Page 9

Software Installation
Before installing a version of our data-acquisition software, remove all
previous versions of that software.
Reference Notes:
➣
Adobe Acrobat PDF versions of documents pertaining to your system hardware and
software are automatically installed onto your PC’s hard-drive as a part of product
support at the time of software installation. The default location is the Programs group,
which can be accessed via the Windows Desktop Start Menu.
➣
PDF versions of documents can be read directly from the data acquisition CD.
➣
After your software is installed you can setup your data acquisition device, e.g.,
WaveBook, DaqBook, LogBook, and connect it to the host computer. Instructions for
hardware setup are included in your device user’s manual, which is included on the CD.
When you first install software for your acquisition device, eZ-PostView will automatically be selected for
installation along with the primary acquisition software application. For example, when a WaveBook is selected,
both WaveView and eZ-PostView will show as pre-selected software options.
To install eZ-PostView …
1. Start Windows.
2. Close all running applications.
3. Insert the Data Acquisition CD into your CD-ROM drive and wait for the CD to auto-run.
If the CD does not start on its own:
(a) click the desktop’s <Start> button
(b) choose the Run command
(c) select the CD-ROM drive, then select the setup.exe file
(d) click <OK>
An Opening Screen will appear.
4. Click the <ENTER SETUP> button.
5. On the hardware selection screen [which follows a licensing agreement], select your hardware from the
drop-down list.
6. On the resulting software options screen, select the software that is applicable to your system.
Note that eZ-PostView is already selected by default.
7. Click the <Install> button; then follow the screen prompts to complete the installation.
1-2 Getting Started
09-05-02
eZ-PostView
Page 10
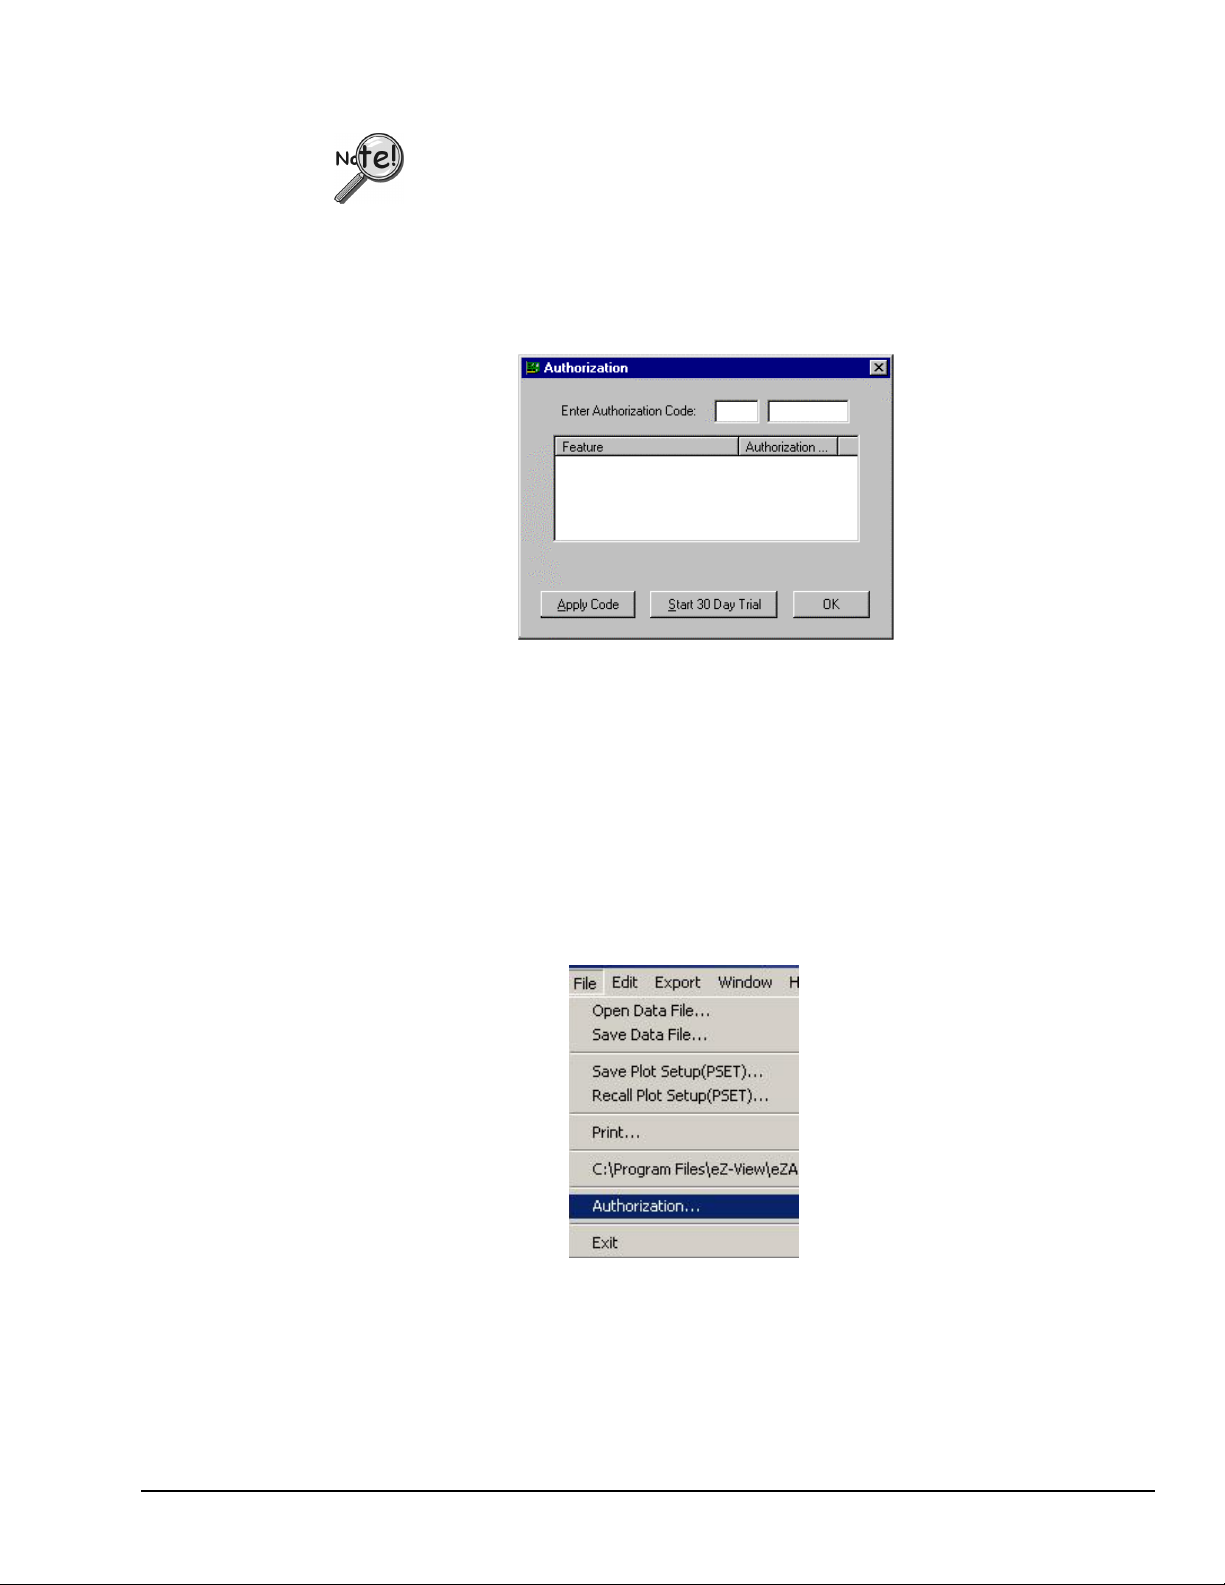
You will be prompted to enter an Authorization Code.
If you purchased eZ-TimeView or eZ-FrequencyView enter the code for the
➣
associated application; then click the <Apply Code> button.
If you are installing eZ-PostView [which requires no code], simply click the
➣
<OK> button or, if you prefer, click the <Start 30 Day Trial> button to try out
the more powerful eZ-FrequencyView Application.
Authorization Dialog Box
Note: Entry of your Authorization Code is only required once. However, you can enter a new code
at a future date, for example, if you wanted to upgrade from eZ-PostView to eZ-FrequencyView.
To open the Authorization Dialog Box:
1. Open eZ-PostView. You can open eZ-PostView by clicking the <ViewData> button
in your primary data acquisition program, e.g. WaveView, DaqView, LogView, etc.
2. From eZ-PostView’s File Pull-Down menu, select Authorization (following figure).
The Authorization dialog box appears.
To enter a code:
1. Type-in the code, as it appears on your Authorization Sheet.
File Menu
eZ-PostView
2. Click the <Apply Code> button.
09-05-02
Getting Started 1-3
Page 11

1-4 Getting Started
09-05-02
eZ-PostView
Page 12

eZ-PostView Menus and Windows 2
Contents
Features of eZ-PostView …… 2-1
File Menu …… 2-3
Edit Menu …… 2-4
Configuration Window …… 2-4
Acquisition Tab…… 2-5
Channels Tab …… 2-6
Playback Setup Window …… 2-7
Window Colors Window…… 2-8
Preferences Window …… 2-9
Window Menu …… 2-11
Add Function View (FV) …… 2-11
Delete Window …… 2-11
Channel Buttons …… 2-11
Cascade …… 2-12
Tile Vertically …… 2-12
Tile Horizontally …… 2-13
Refresh Windows …… 2-13
Features of eZ-PostView
The free eZ-PostView application includes the following features.
•
File Input Format Support for: DaqView, WaveView, Personal DaqView, ChartView, UFF-58B.
• 8 Display Windows
• 16 Channel Traces per Display Window
• Automatic Data Scaling
•
Configurable Data Display for channels and trace colors
•
Multiple Tiling of display windows
Note that eZ-PostView was derived from a much more versatile eZ-Analyst program. A comparison of
eZ-PostView features to those of eZ-Analyst and 2 other derived applications appears on page 2-2.
As indicated by the following table, many features do not apply to eZ-PostView. In the screen images, both those of
the actual application and those presented as figures in this manual, information that does not apply to eZ-PostView
is either “grayed-out” or “hidden.” The same applies to functions of the pull-down menus.
Reference Note:
The document, eZ-Analyst Series Software Reference, p/n 1086-0922 contains information that is
applicable to the higher-level “view” programs eZ-TimeView and eZ-FrequencyView, and to eZ-Analyst.
The eZ-Analyst Series document includes information regarding the Miscellaneous and the Octave Tabs,
which do not apply to eZ-PostView.
eZ-PostView
09-05-02
Menus and Windows 2-1
Page 13
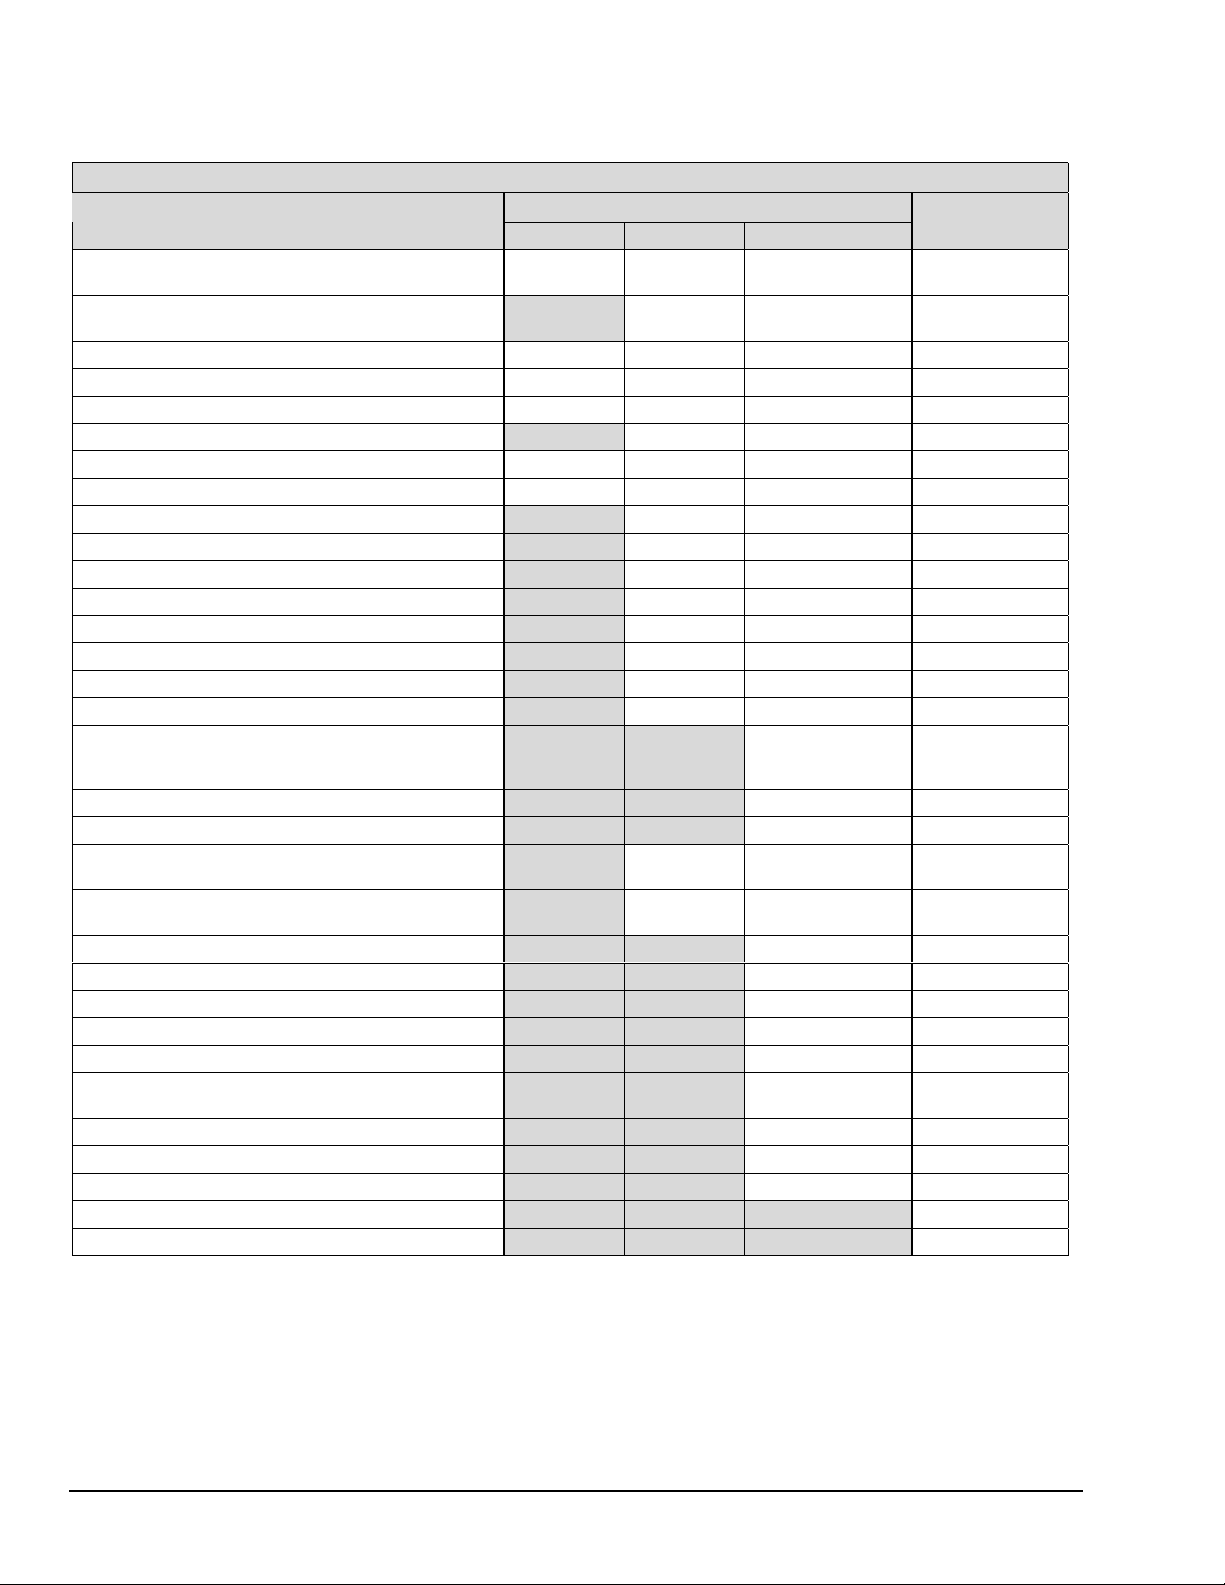
Comparing eZ-PostView to other eZ-Analyst Series Applications
eZ-Analyst Series Comparison Matrix
Feature
File Input Format Support for: DaqView, WaveView,
Personal DaqView, ChartView, UFF-58B.
File Export to: ME’Scope and SMS Modal, Microsoft
Excel, Binary Universal File, and ASCII text files.
Display Windows, number of 8 8 8 8
Channel Traces per Display Window 16 16 16 16
Automatic Data Scaling Yes Yes Yes Yes
Simulated Data Playback ----- Yes Yes Yes
Configurable Data Display for channels and trace colors Yes Yes Yes Yes
Multiple Tiling of display windows Yes Yes Yes Yes
Cursor Support - for both Single Cursor and Band Cursor ----- Yes Yes Yes
Data Strip Chart Display ----- Yes Yes Yes
Peak-to-Peak Calculations ----- Yes Yes Yes
Peak Searching, minimum and maximum ----- Yes Yes Yes
Mean Calculations ----- Yes Yes Yes
RMS Calculations ----- Yes Yes Yes
Zooming [of the data display] ----- Yes Yes Yes
Windowed Time Display Function ----- Yes Yes Yes
Cross Channel Support ----- ----- FFT, FRF, Cross,
Transfer Function Display Types ----- ----- Note 1 Note 1
Complex Function Display Types ----- ----- Note 2 Note 2
Scale Types ----- RMS, Peak,
Function Display Types ----- Time, Strip
Octave Types ----- ----- 1/3, Full 1/3, Full
Octave Weighting ----- ----- Linear, A, B, C Linear, A, B, C
Waterfall Plots ----- ----- Yes Yes
Integration/Differentiation (Single/Double) ----- ----- Yes Yes
Response Channel FFT Windows ----- ----- Note 4 Note 4
Reference Channel FFT Windows ----- -----
Low-Pass DC Noise Filtering ----- ----- Yes Yes
Spectral Strip Chart Display Synchronization ----- ----- Yes Yes
Octave Strip Chart Display Synchronization ----- ----- Yes Yes
Record and Save Data to Disk ----- ----- ----- Yes
“Real Time” Data Display ----- ----- ----- Yes
Post-Acquisition Viewing Package
eZ-PostView eZ-TimeView eZ-FrequencyView
Yes Yes Yes Yes
----- Yes Yes Yes
Coherence,
Transfer Function
Peak-to-Peak
Chart
RMS, Peak,
Peak-to-Peak
Note 3 Note 3
Rectangular,
Cosine Taper
eZ-Analyst
FFT, FRF, Cross,
Coherence,
Transfer Function
RMS, Peak,
Peak-to-Peak
Rectangular,
Cosine Taper
Notes: 1) eZ-Analyst and eZ-FrequencyView - each offers the following Transfer Function Display Types: Inertance, Mobility,
2-2 Menus and Windows
Compliance, Apparent Mass, Impedance, and Dynamic Stiffness.
2) eZ-Analyst and eZ-FrequencyView - each offers the following Complex Function Display Types: Magnitude, Phase, Real,
Imaginary, Nyquist, Magnitude and Phase, and Real and Imaginary.
3) eZ-Analyst and eZ-FrequencyView - each offers the following Function Display Types: Spectrum, Auto-Spectrum,
PSD (Power Spectral Function), Strip Chart.
4) eZ-Analyst and eZ-FrequencyView – each offers the following Response Channel FFT Windows: Hanning, Flat Top,
Exponential, and Blackman-Harris.
09-05-02
eZ-PostView
Page 14

File Menu
The File Menu provides a means to print plotted data, as well as open and save data files.
Open Data File … (.thd or .dsc)
Used to locate and open saved files. ZonicBook uses files with .thd extensions. View applications, i.e.,
WaveView, DaqView, Personal DaqView, LogView, and ChartView use files with .dsc extensions.
Save Plot Setup (PSET) …
These two menu items provide a means of saving [or opening] function files. Time and auto-spectrum data
is saved. If there is any reference channel cross-spectrum is saved for all channel pairs. The file extension is
.mds.
Recall Plot Setup (PSET) …
These two menu items provide a means of saving [or recalling] the current plot condition, such as window
locations and window content, including: channel numbers, function type, axis-type, and range. These files
can be recalled at a later date to process customized plot conditions.
Without user intervention, the plot setup file is automatically saved with .mds, .dsc, and .thd files.
You can have plot setups automatically recalled whenever you recall data files. To select this
option, open the Preferences window [accessed through the Edit pull-down menu] and check
the box labeled “Recall Plot Setup When Recall Data Files.”
The standard print window associated with your specific computer will open. Select a printer and the
number of copies needed before clicking <OK>.
Authorization
Exit
Note:
In regard to printing, black plot backgrounds changed to white.
Provides a means of enabling additional view features that are available with purchased software, i.e.,
eZ-TimeView and eZ-FrequencyView. Aside from a trial period, an authorization code is required to enable
the applications available features. eZ-TimeView, eZ-FrequencyView, and the eZ-Analyst program from
which they were derived are discussed in the document, eZ-Analyst Series Software Reference,
p/n 1086-0922.
This menu item closes the eZ-PostView application.
eZ-PostView
09-05-02
Menus and Windows 2-3
Page 15

Edit Menu
The Edit Menu provides a means of configuring eZ-PostView in regard to both functionality and
appearance. The menu contains the following selections, each of which is detailed in the subsequent
sections:
Configuration Window…… 2-4
Playback Setup Window…… 2-7
Window Colors Window…… 2-8
Preferences Window…… 2-9
Edit Menu >
Configuration Window
The Configuration item provides a means of changing the majority of eZ-PostView settings in regard to
determining how the data is manipulated. The Configuration selection displays the Configuration Window
with one of several tab dialogs displayed. Selectable tabs are:
Acquisition Tab…… 2-5
Input Channels Tab …… 2-6
Octaves Tab (the tab is present, but does not apply to eZ-PostView)
Miscellaneous Tab (the tab is present, but does not apply to eZ-PostView)
2-4 Menus and Windows
09-05-02
eZ-PostView
Page 16

Edit Menu
> Configuration >
eZ-PostView’s Acquisition Setup Tab
Acquisition Tab
Edit Menu > Configuration >
With respect to eZ-PostView, the Acquisition Panel provides “read-only” text pertaining to the following:
Sample Rate (samples per second)
Time Blocksize (Acceptable blocksizes range from 128 to 16384 data points).
Time Delta X
Time Block
File Size in:
seconds
blocks
disk space in MB
Acquisition Tab: Acquisition Panel
eZ-PostView
09-05-02
Menus and Windows 2-5
Page 17
Edit Menu
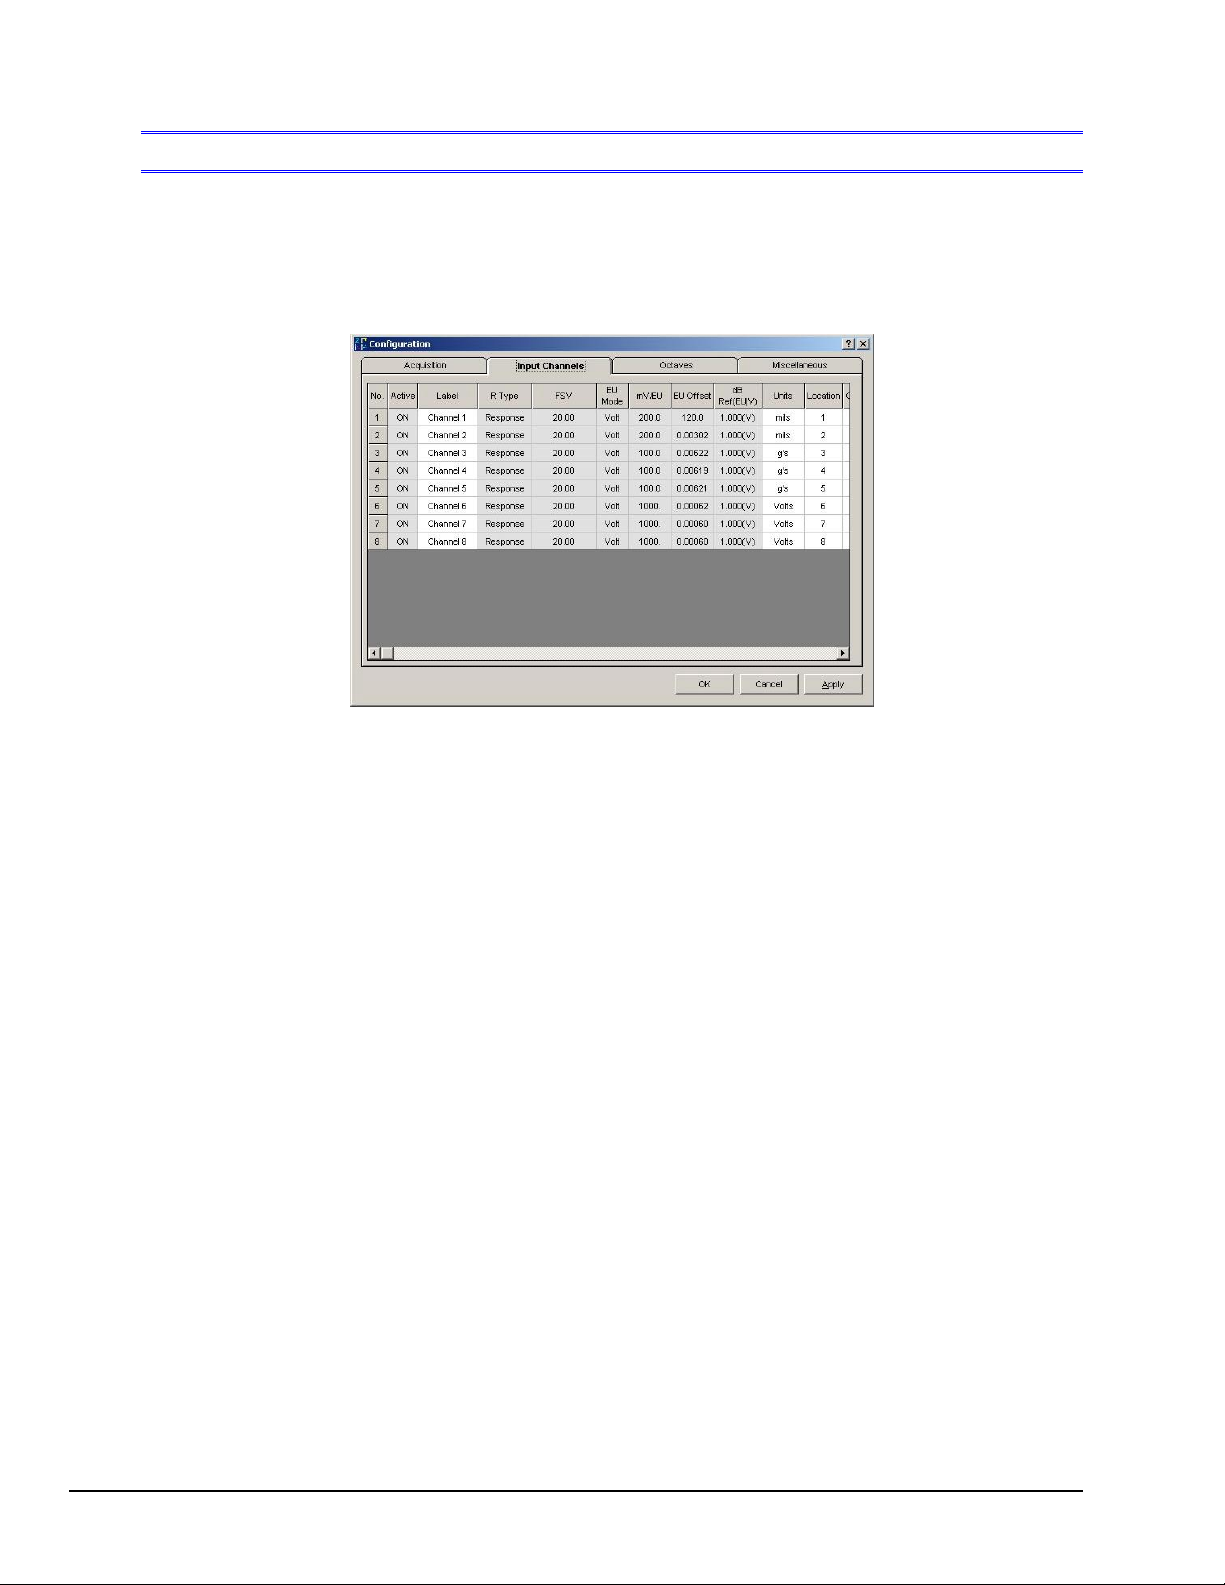
The Input Channels tab displays the setup conditions of the input channels as they were when the
acquisition was saved-to-disk. Actual hardware setup can not be changed from eZ-PostView. The grayed-
out columns, in the following figure, can not be changed from eZ-PostView.
> Configuration >
Input Channels Tab Selected
Input Channels Tab
No.: This column lists all available channels. It can not be edited.
Active:
Shows “ON” for input channels that were active during the acquisition.
The column can not be edited in eZ-PostView.
Label: This should be a meaningful channel name. Highlight a cell before typing a label.
When you press the Enter key, the label is accepted.
Response
Reference
FSV:
There are two types of channels, Response and Reference. All channels are initialized as
Response channels. The column can not be edited in eZ-PostView.
Full-Scale Voltage. The cells in this column are used to set the FSV value in Volts.
This column can not be edited in eZ-PostView.
EU Mode: E(ngineering) U(nits): Select EU or Volt.
This column can not be edited in eZ-PostView.
Units: Enter the measurement units you will be using.
Location: This is a simple numbering system. The channel number is the default value for location.
However, you can highlight a cell and type a different location number. When you press the
Enter key, the value is accepted.
Coord:
This is the axial direction of the transducer that was connected to the channel.
This column can not be edited in eZ-PostView.
Input Type: This is the type of instrument that was attached to the channel. Menu selections include:
Acceleration, Velocity, Displacement, Force, Pressure, Stress, Strain, General, and Tach
(Tachometer). This column can not be edited in eZ-PostView.
2-6 Menus and Windows
09-05-02
eZ-PostView
Page 18
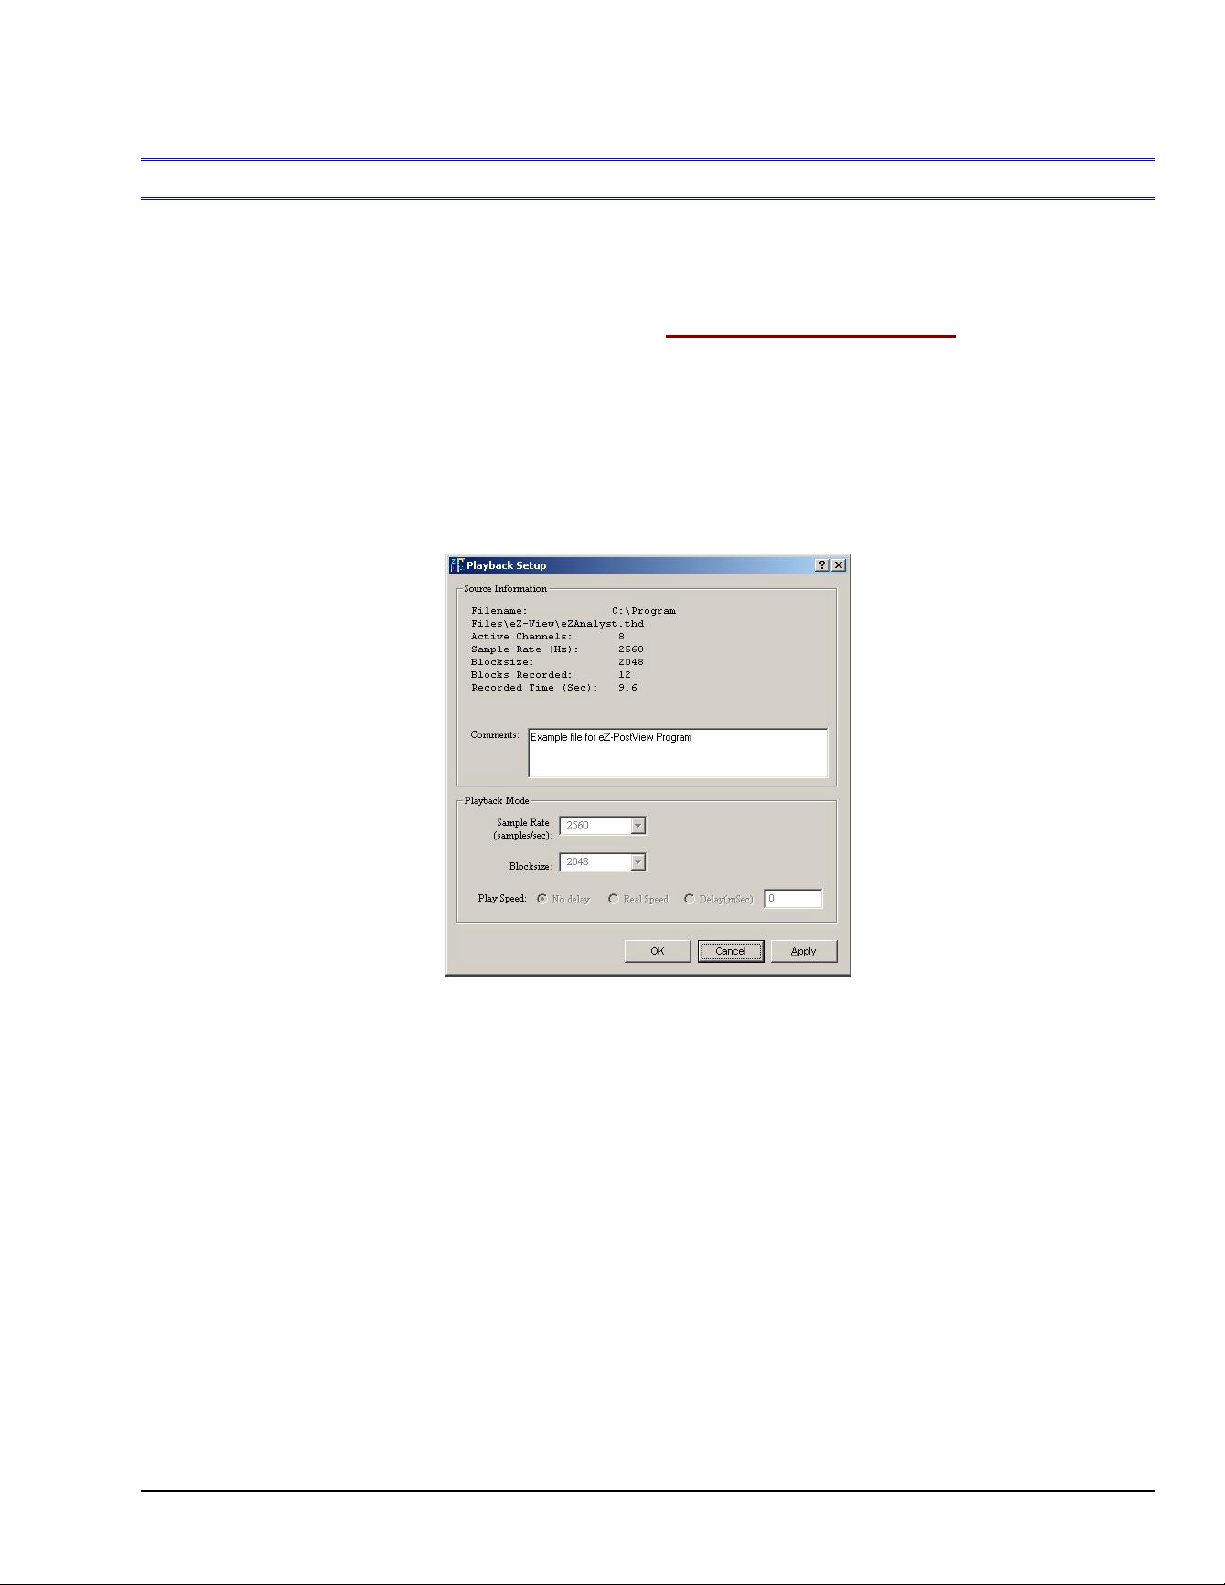
Edit Menu > Playback Setup Window
Edit Menu >
Playback Setup Window: Source Information Panel
There are no playback functions that can be setup from within the eZ-PostView application.
However, the window’s Source Information panel does provide general file related information
such as filename, file location, the number of active channels, sample rate, block size, the
number of blocks recorded, and recorded time.
The panel includes a Comments box for user remarks.
eZ-PostView
Playback Setup Window
09-05-02
Menus and Windows 2-7
Page 19
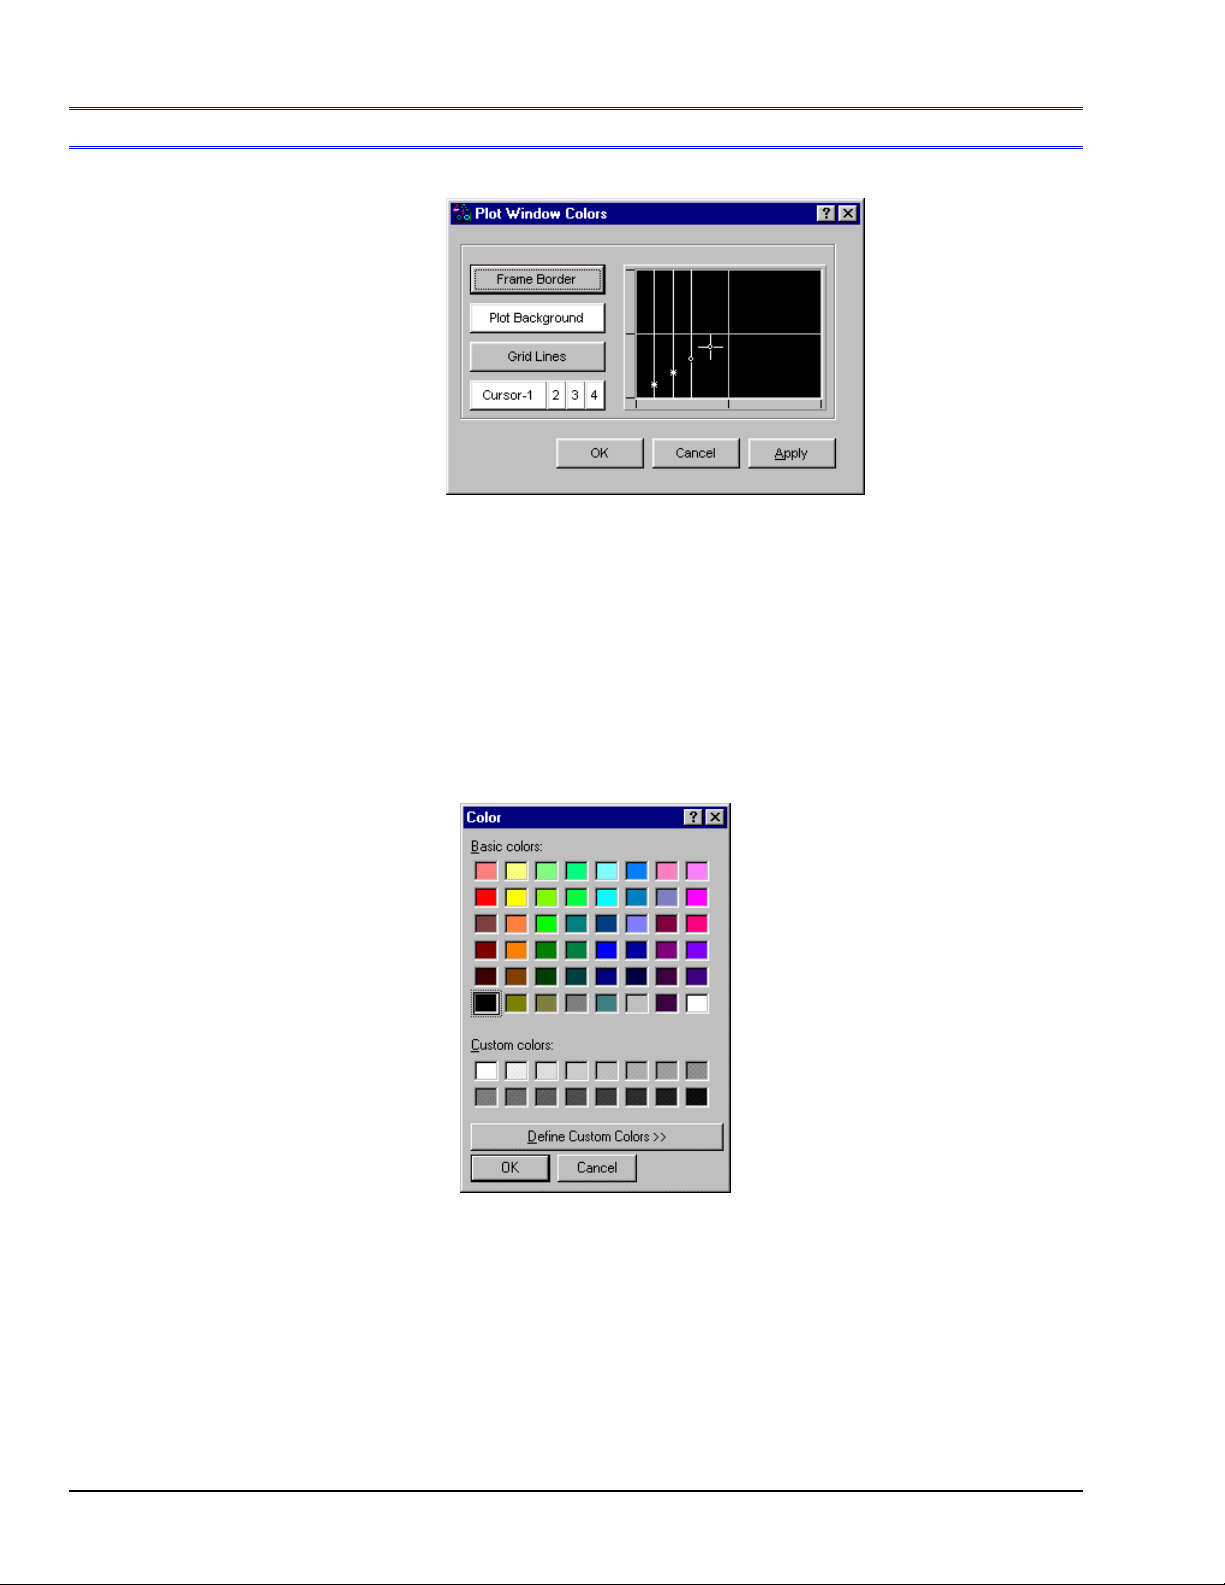
Edit Menu > Window Colors
Plot Window Colors
Plot window defaults are:
Frame Border = Grey
Plot Background = Black
Grid Lines = Grey
Cursor = White
The four possible types of cursor are:
Single cursor
Second cursor of band cursors
Peak Search cursor
Data List
1. To change a Plot Window display color, click on the button that applies to the display characteristic,
for example, <Plot Background>.
2. Click <OK>. The Color Palette will open.
3. Select a color by clicking on a color square, or by defining a Custom Color.
4. Click <OK>.
5. Repeat steps 1 through 4 for each Plot Window color that you want to change.
6. When finished, click <OK> in Colors [Color Palette] window.
2-8 Menus and Windows
Color Palette
09-05-02
eZ-PostView
Page 20
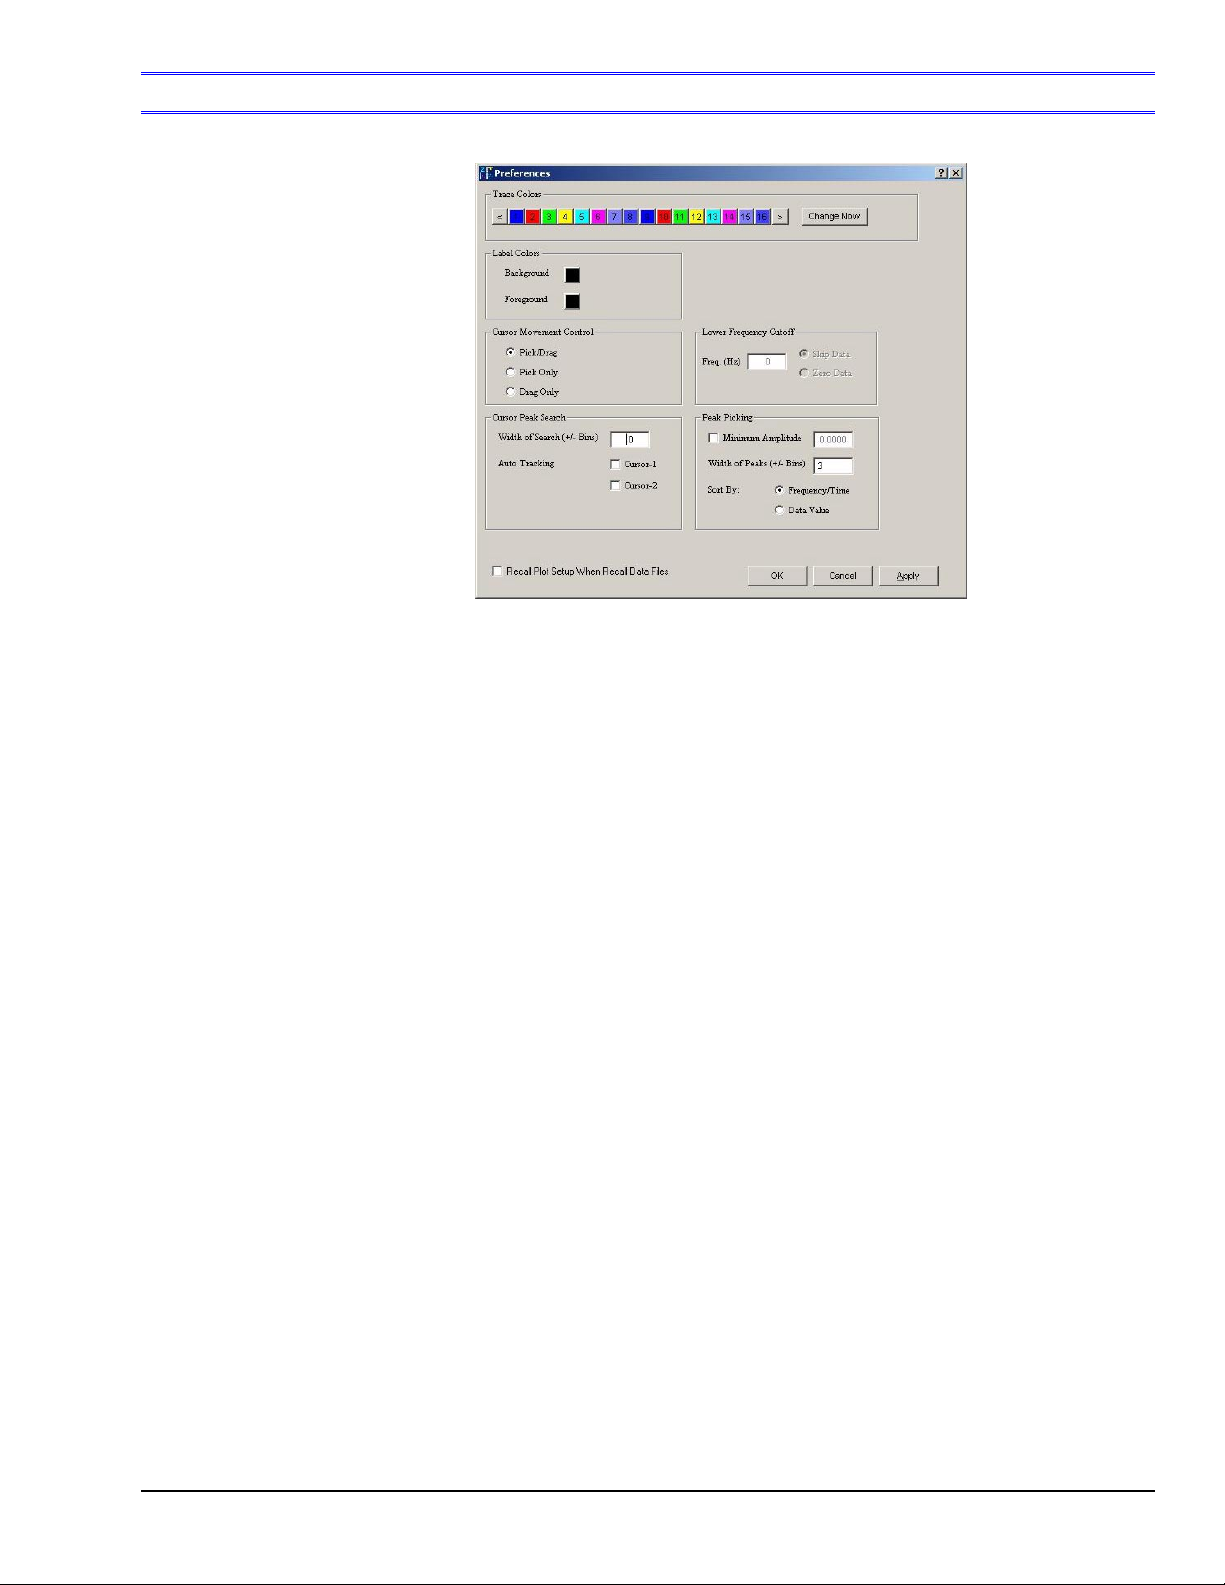
Edit Menu > Preferences Window
The Preferences window provides a mean of setting several acquisition-related processing options.
Preferences
Trace Colors:
Defines colors for traces. Click on a channel’s color chip to open a color palette.
Pick a new color, then click <OK>.
Labels Colors:
Defines colors for on-plot text labels. Click on a color chip to open a color palette.
Pick a new color, then click <OK>.
Cursor Movement
Control:
Sets the cursor’s action. Options are: Pick/Drag, Pick Only, and Drag Only.
Pick/Drag: Makes use of both the Pick Mode and the Drag Mode.
Pick Only: Clicking the left mouse button allows the cursor to move
instantaneously with the band cursor. The chosen cursor moves to the location
when the mouse is clicked.
Drag Only: Move the mouse pointer to the cursor location. The pointer will
change to a “Left and Right Arrow.” Click and drag the cursor to the designated
location.
Cursor Peak Search:n/a
Peak Picking:
Recall Plot Setup. . .
n/a
If the box is checked, the custom plot setup will be saved (recalled) and will be
applied when the next time the associated data file is opened.
eZ-PostView
09-05-02
Menus and Windows 2-9
Page 21

2-10 Menus and Windows
09-05-02
eZ-PostView
Page 22
Window Menu
Menu Items
Add Function View (FV) …… 2-11
Delete Window …… 2-11
Channel Buttons ……2-11
Cascade …… 2-12
Tile Vertically ……2-12
Tile Horizontally …… 2-13
Refresh Windows …… 2-13
Reference Note:
For information regarding the interactive features of Plot Display Windows, refer to chapter 3.
The interactive features are not selected from the Window Menu, but are accessed via mouse
buttons and/or hotkeys.
Window Menu
Window Menu
Window Menu
> Add Function View (FV)
This menu selection opens an additional plot window.
Example of an Added Function View
> Delete Window
Deletes the window that is currently in focus. When multiple plot windows are open, one is always the
“focus window. When a window does not have focus, its title bar is dimmed. To change the “focus
window,” simply click on top or side border of the window of interest.
> Channel Buttons
Brings up a display showing squares for all channel buttons. The buttons are used in the exact same
manner as the 16 channel buttons that are located on eZ-PostView’s main window, just below the
Date/Time region.
eZ-PostView
• To add a channel: use the mouse to click and drag a channel box from the complete channel button
display into the plot area.
• To remove a channel: use the mouse to click and drag a channel box (from the right-side of the plot)
into the plot area.
09-05-02
Menus and Windows 2-11
Page 23
Window Menu
> Cascade
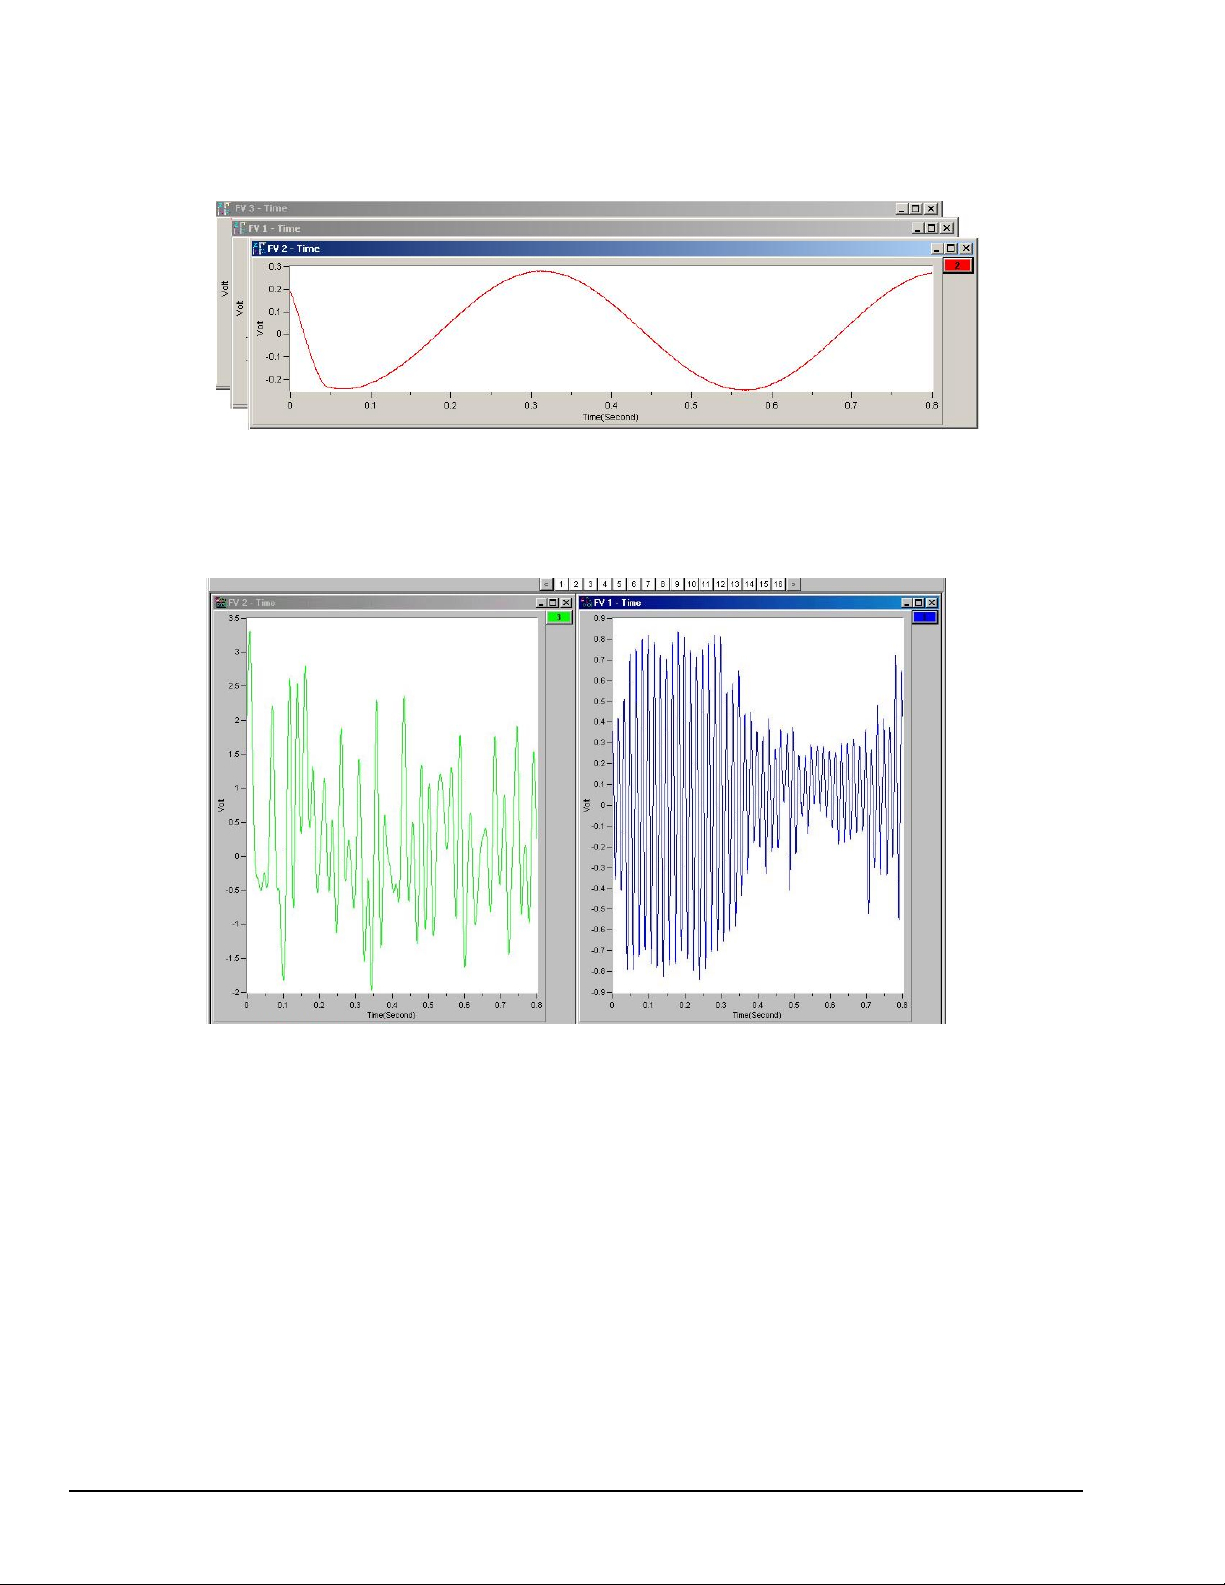
When you have multiple plot windows open, this menu selection arranges them on you screen as shown.
Example of using Cascade with three Plot Windows
Window Menu
> Tile Vertically
When you have multiple plot windows open, this menu selection arranges them on your screen as shown.
Example of using Vertical Tile with two Plots
Each plot is longer in the “vertical” direction.
2-12 Menus and Windows
09-05-02
eZ-PostView
Page 24
Window Menu
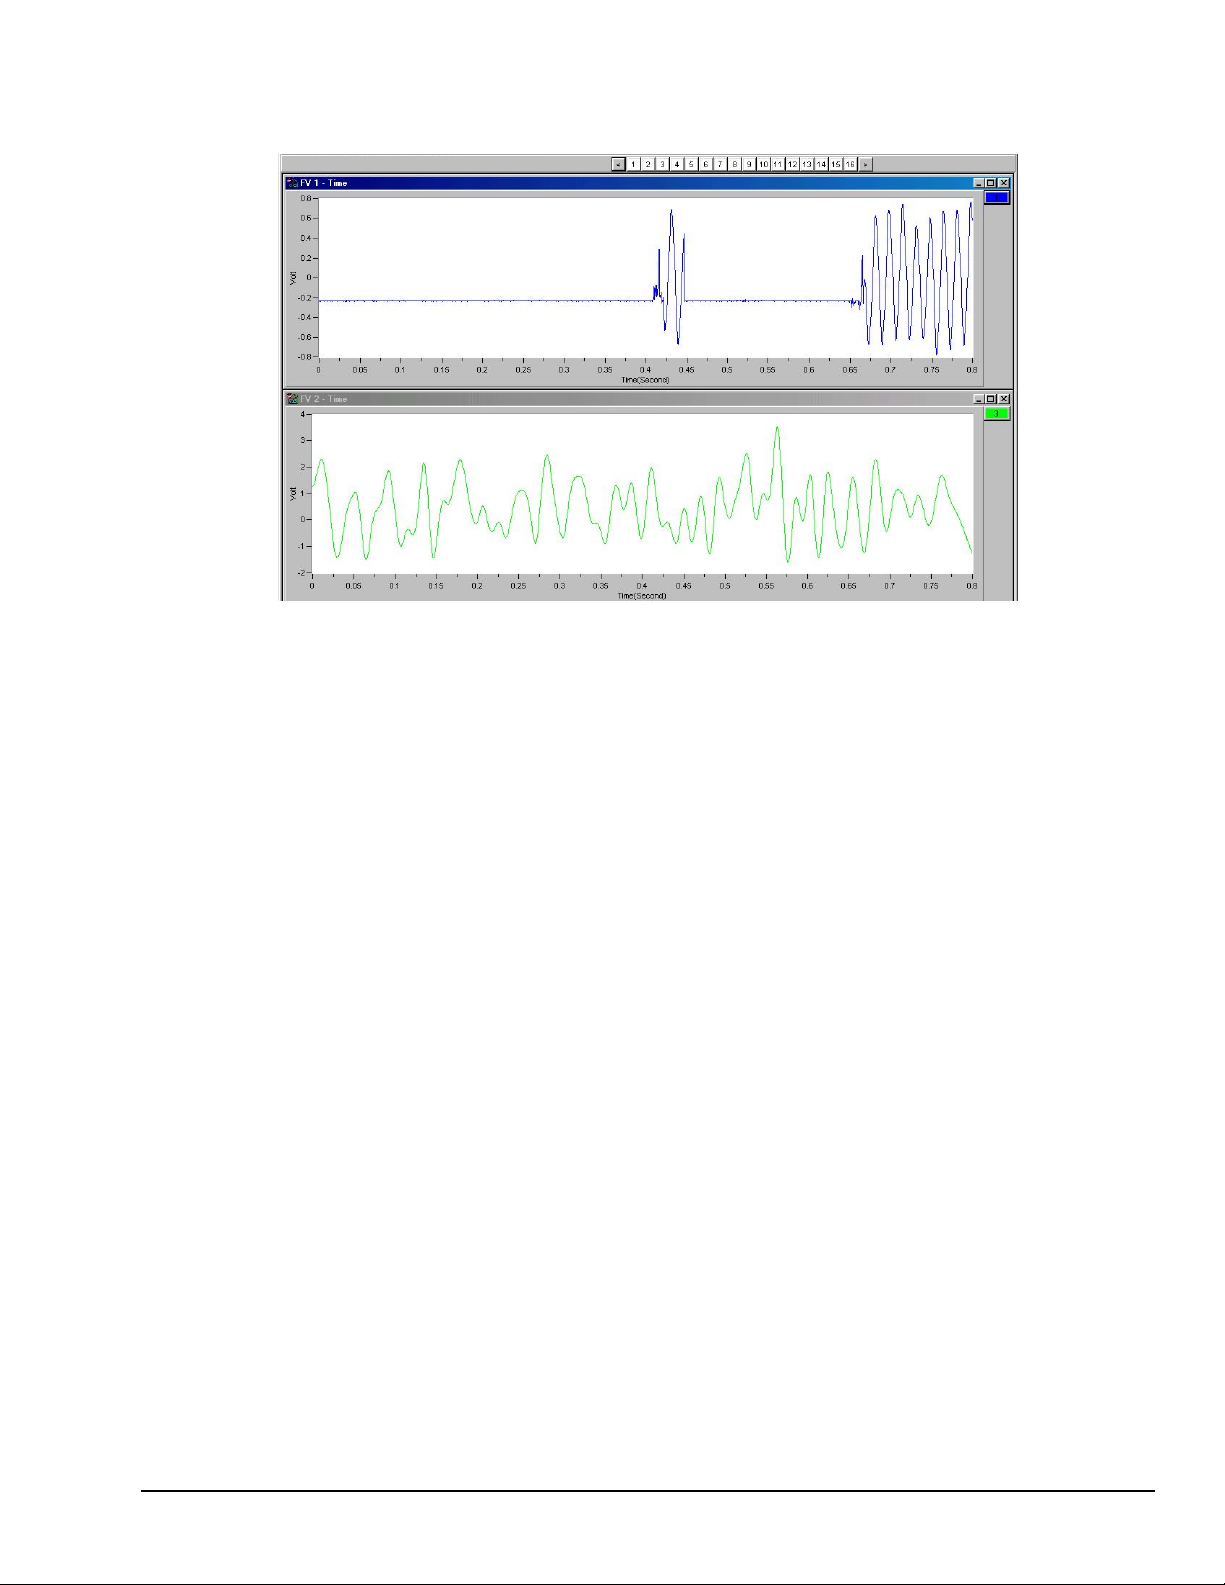
> Tile Horizontally
When you have multiple plot windows open; this menu selection arranges them on your screen as shown.
Example of using Horizontal Tile with two Plots
Each plot is longer in the “horizontal” direction.
Window Menu
> Refresh Windows
Used to refresh a window; for example, to refresh a Strip Chart. In this case, the refresh function blanks
out the present Strip Chart, essentially providing you with a new, clean window.
eZ-PostView
09-05-02
Menus and Windows 2-13
Page 25

2-14 Menus and Windows
09-05-02
eZ-PostView
Page 26

Interactive Features of eZ-PostView’s Plot Display Window
How to Change Plot Display Characteristics ……3-2
How to Change “Focus” …… 3-2
How to Add and Remove Channels …… 3-2
Other Features …… 3-3
Copy …… 3-3
Cursor …… 3-3
Label / List …… 3-4
Changing the Display Range …… 3-5
Changing the Plot’s Format / Scale / Grid …… 3-6
3
eZ-PostView
08-30-022
Interactive Plot Display 3-1
Page 27
How to Change Plot Display Characteristics
To change a plot’s display characteristics; it must be the “focus plot.” Then, you can either use the mouse
or key commands to make changes. “Focus” is explained in the following section.
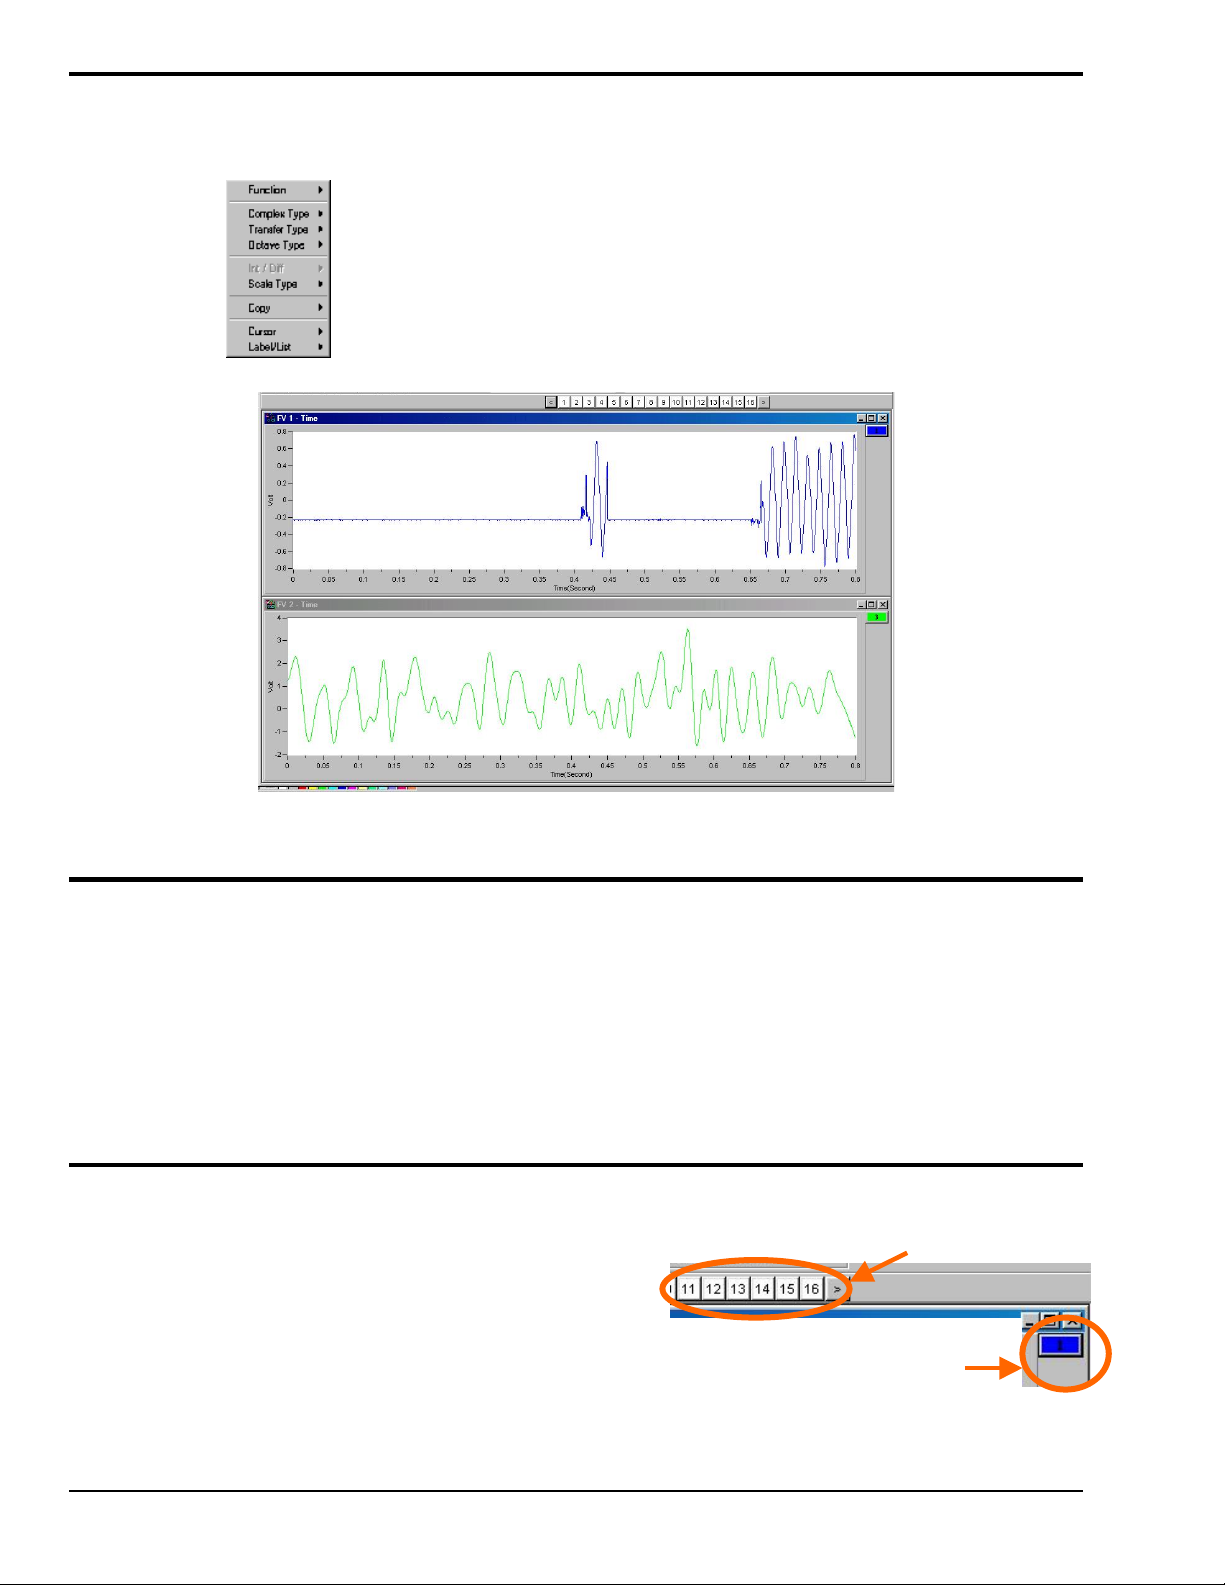
Open Plot Display Characteristics Menu: Press “D” or right click with the cursor
hovering over the plotted data.
Use the down arrow key to highlight a menu option, then press “Enter”. Note that in
some cases you can press the first letter of an option to open its sub menu, for example,
pressing the “S” key opens the Scale Type sub menu.
Two Plot Windows
In this figure, the upper plot has the “focus.”
How to Change “Focus”
Focus can refer to the window that is in focus, as well as to a plot that is in focus. When multiple plot
windows are open, one is always the “focus window. ” In the following figure, the window with the dark
title bar (top window) is the window that currently has “focus.” When a window does not have focus, its
title bar is dimmed. To change the “focus window,” simply click on top or side border of the window
of interest.
When multiple plot windows are open, a plot other than the one in the “focus” window can be the “focus
plot.” You would typically do this when you want to change a plot’s characteristics. To change the “focus
plot,” click in the plotted area of the window of interest. Note that the window must be in focus at the
time.
How to Add and Remove Channels
To add a channel to a plot . . .
With your mouse, click and drag a channel box
from above the plot to the plot area.
To remove a channel from a plot . . .
With your mouse, click and drag a channel box
from the right of the plot into the plot area.
To ADD a channel, click-on the desired “channel box”
in this area and drag it into the plot region.
To REMOVE a channel, click on the
desired “channel box” in this area and
drag it into the plot region.
3-2 Interactive Plot Display
08-30-02
eZ-PostView
Page 28
Other Features
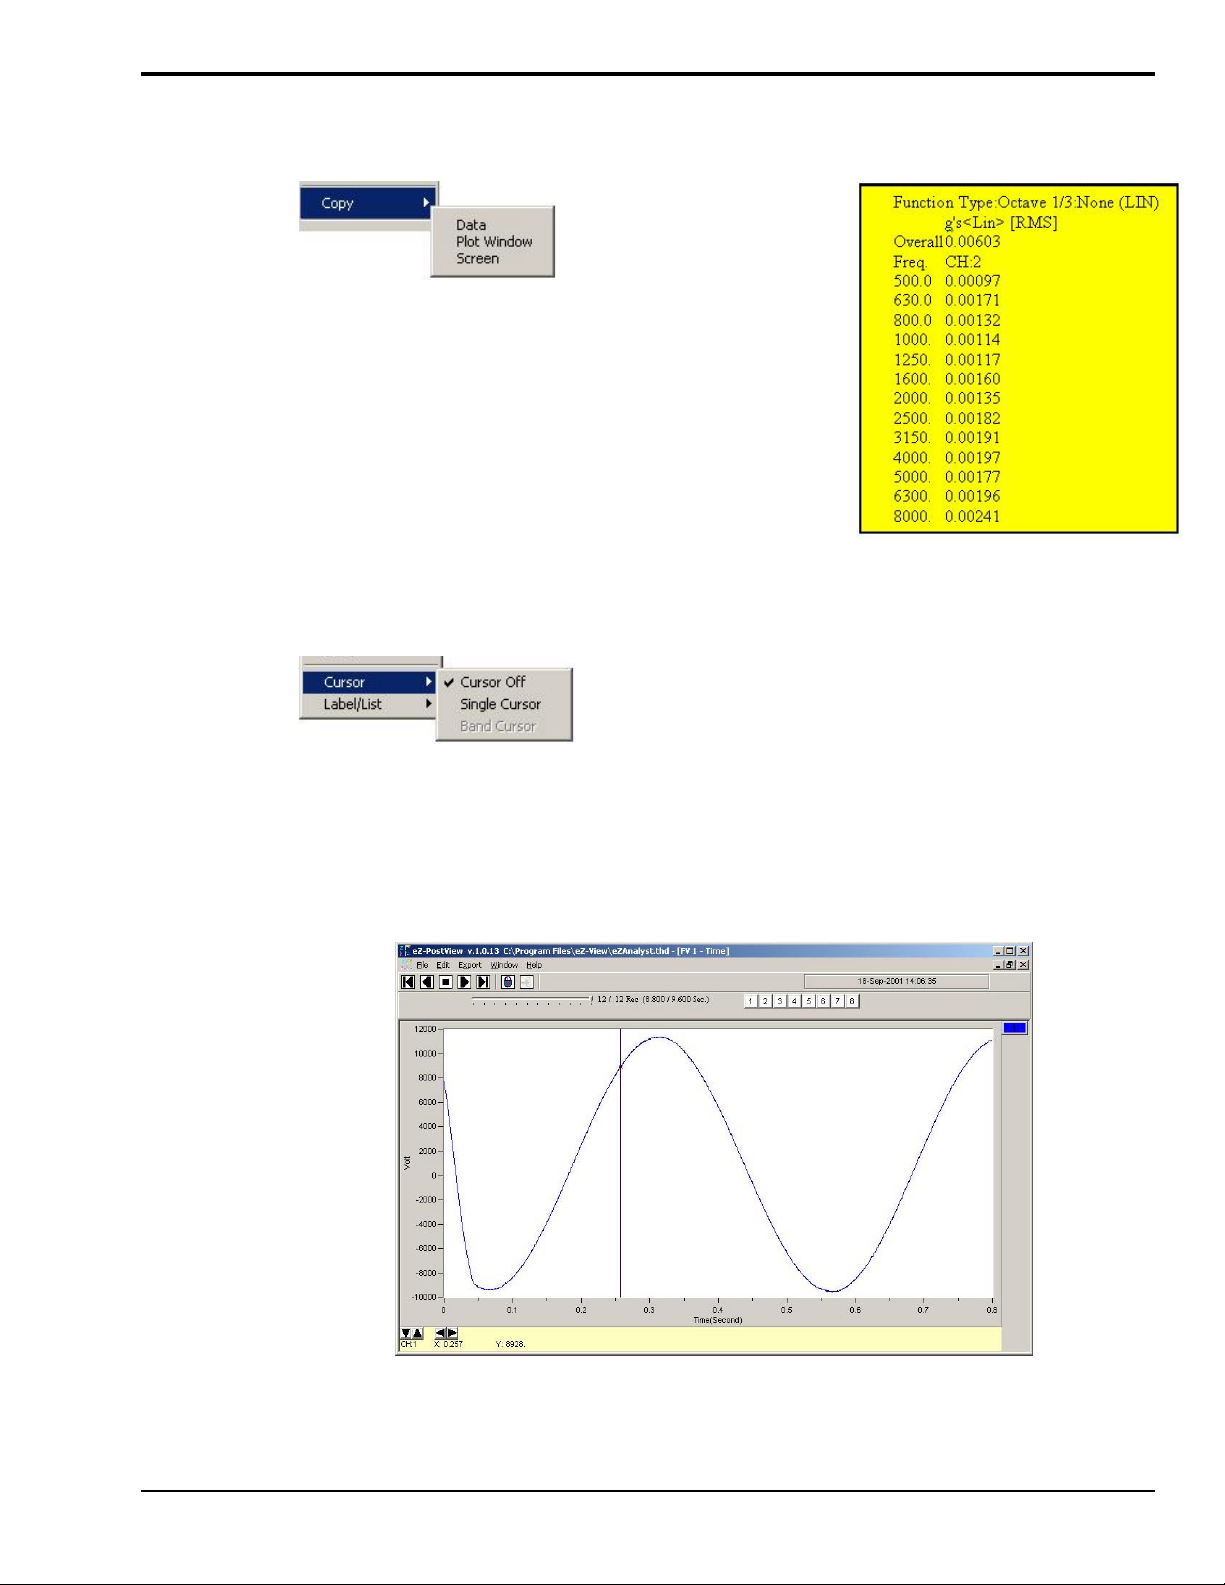
Copy
To Open the Copy Menu: Press “D” + “C,” then release the keys.
The Copy selection will be highlighted. Press “Enter.”
Next, use the down arrow key to select the item you desire to
copy: Data, Plot Window, or Screen, then press “Enter.”
You can paste the copied item into other applications. For
example, plotted data can be copied into Notepad, Word, or Excel
for use in reports or in the case of Excel further calculations.
The plot window and full screen can be copied and then pasted
into any application that accepts graphics, such as MSPaint or
Word.
Cursor
Plot Window Data
Copied and Pasted into Word
To Open the Cursor Menu: Press “D” + “C,” then release the
keys. Then use the down-arrow key to highlight Cursor and press
“Enter.”
Next use the down arrow key to select, Cursor Off or Single
Cursor, then press “Enter.”
When Single Cursor is selected, a cursor appears at the far left of the plot and cursor controls and cursor
information are added below the plot. Click on the plot where you want the cursor. To fine-tune the cursor
location, use the right and left arrows at the bottom. Use the X and Y information for additional help. If
you have multiple channels in the graph, use the up and down arrows to move the cursor from plot to plot.
Press “C” to toggle the cursor on and off.
eZ-PostView
Plot Window with Single Cursor
08-30-022
Interactive Plot Display 3-3
Page 29
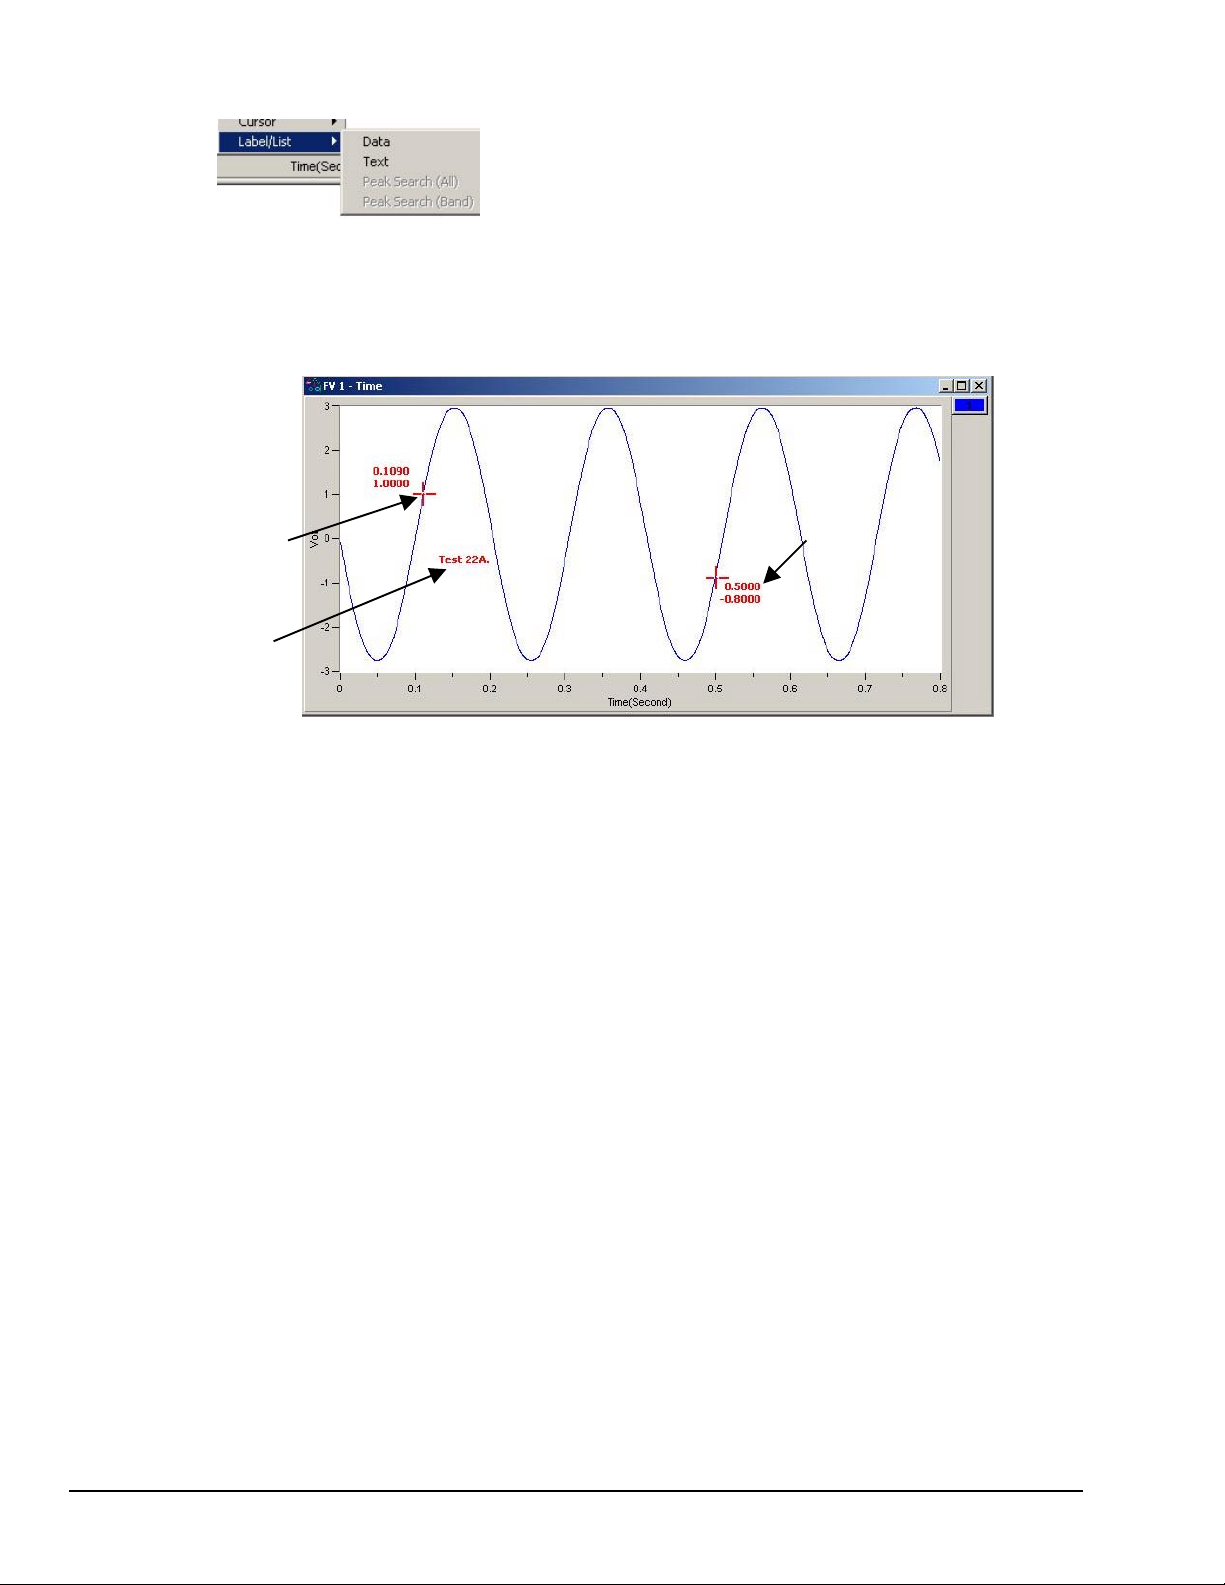
Label / List
To Open the Label/List Menu press “D” + “L,” then release the keys.
Label/List will be highlighted. Press “Enter.”
Using the down arrow key, select Data or Text. Then press “Enter.”
Data places up to 10 cursor values on your plot. After you select data, a temporary cursor is placed on the
plot and the x, y data values are shown for that location. As you move your mouse, the temporary cursor
will move across the plot with data values continuously updated. When you have the cursor where you
want it, click on the mouse to place the label. Another temporary cursor immediately appears. When you
are finished labeling values, right-click and select Pointer to return to a normal state.
Data
x and y
Data
Cursor
Text
values
Adding Data Point Cursors and Text
Text places a comments text box on the plot. After you select text, click on the plot and start typing. You
are limited to 26 character places. Click on the right corner of the text box to move it anywhere on the plot
window.
3-4 Interactive Plot Display
08-30-02
eZ-PostView
Page 30
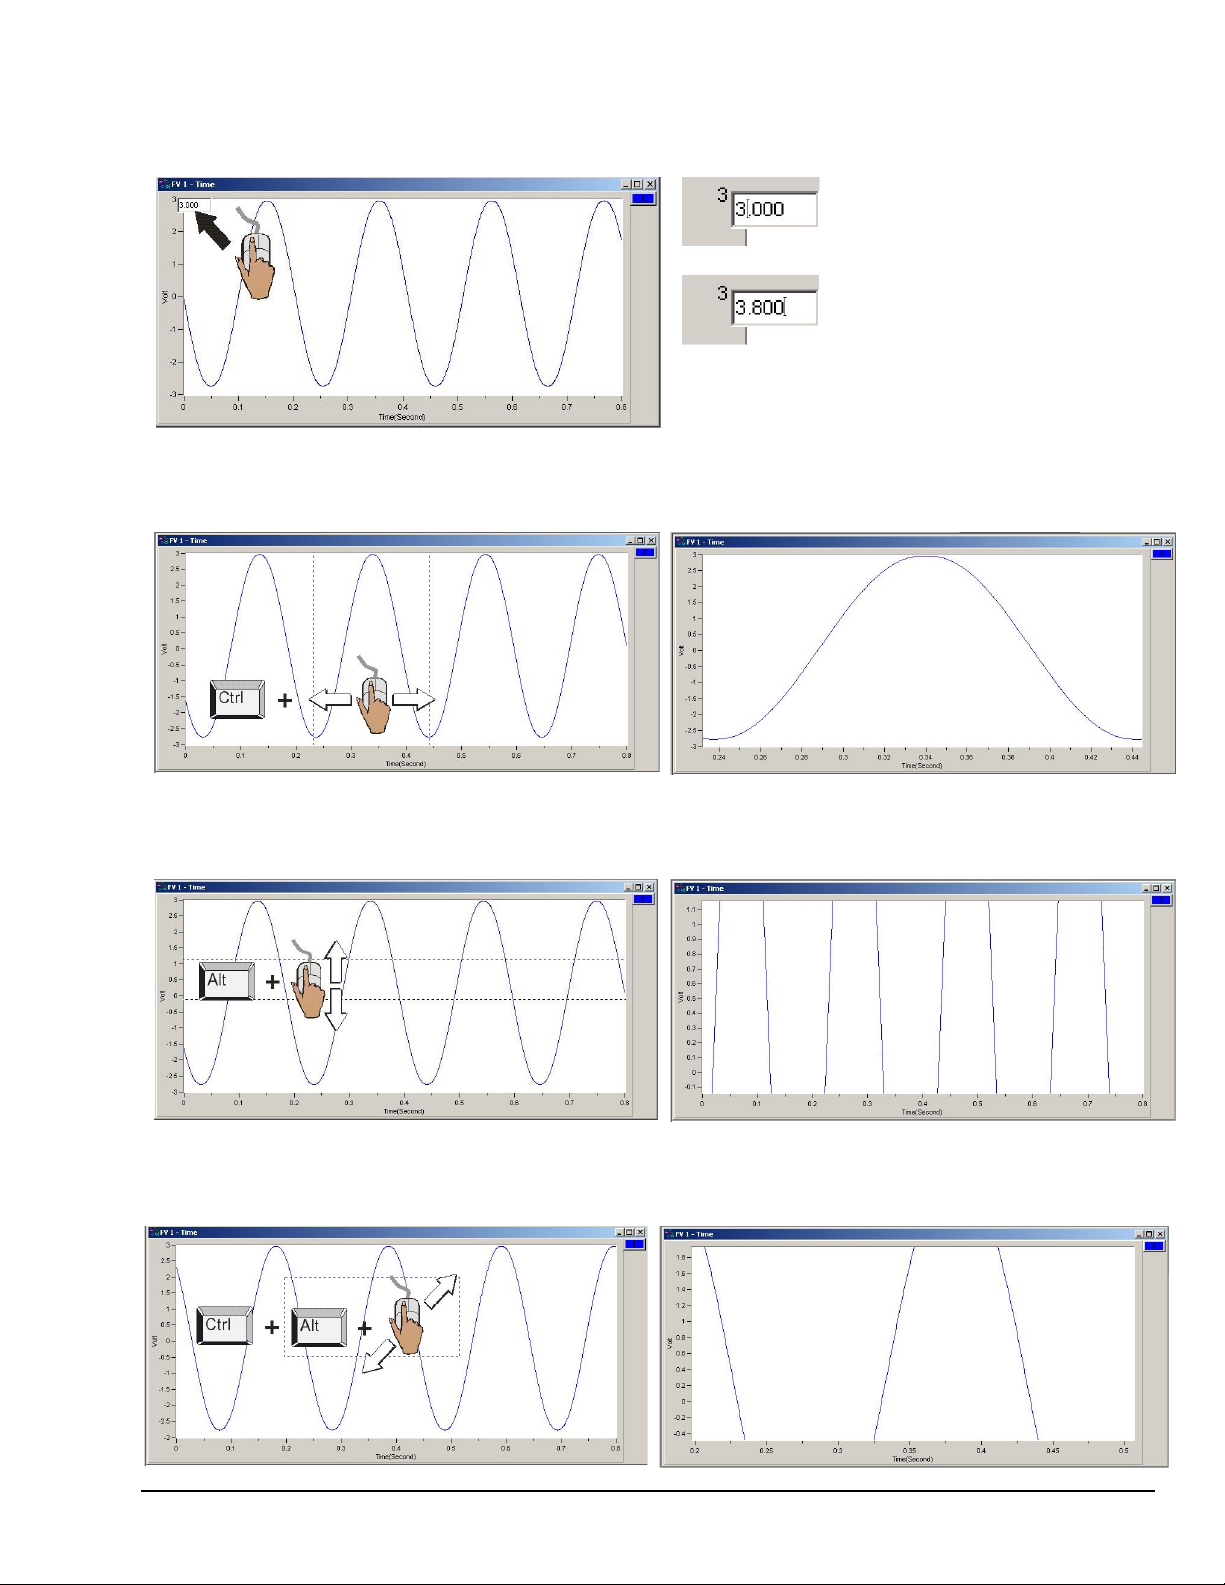
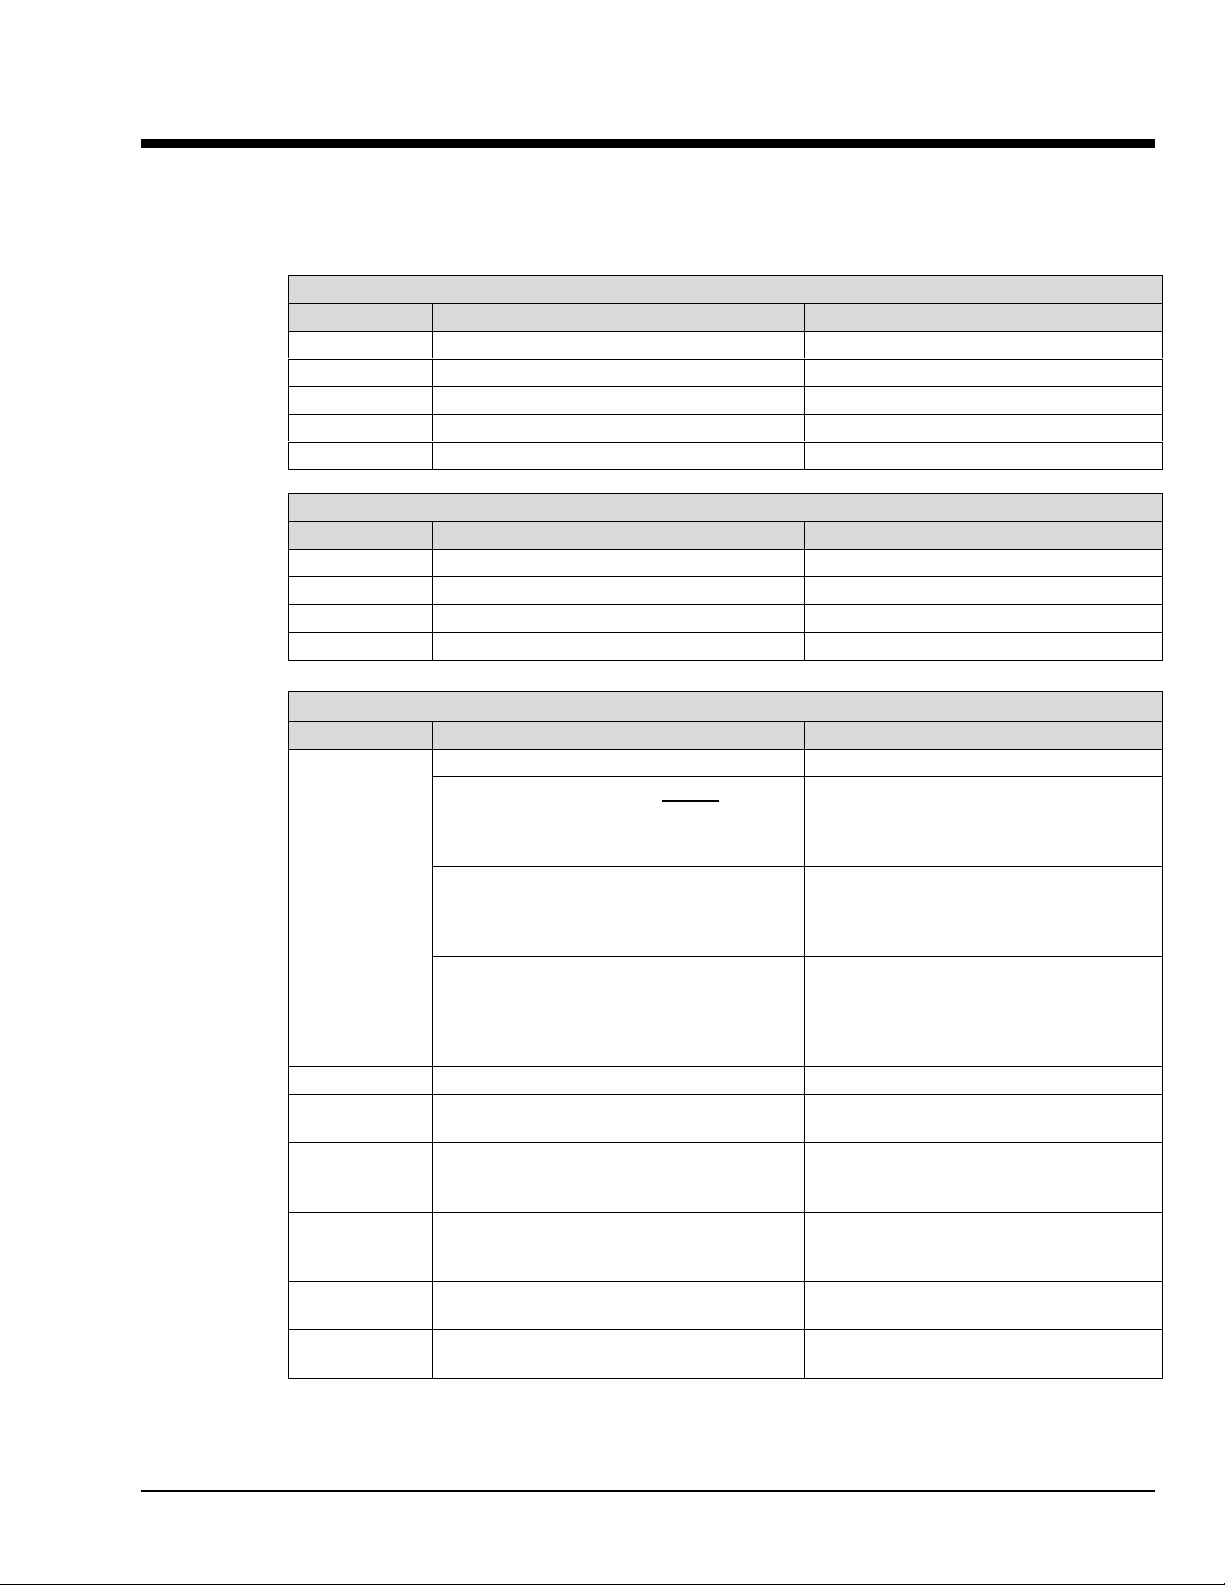
Changing the Display Range
To change the maximum or minimum range value: Left-click on upper or lower scale value that is to be changed, then
enter the new value. An example follows.
In this example, the cursor and PC
keyboard were used to change the
maximum scale value from 3.000 volts
to 3.800 volts.
To change the X-Axis: Hold down the <Ctrl> key, at the same time, left-click and drag the mouse cursor horizontally on
the plot. Two vertical cursor lines will define the new x-axis end points.
To change the Y-Axis: Hold down the <Alt> key, at the same time, left-click and drag the mouse cursor vertically on the
plot. Two horizontal cursor lines will define the new Y-axis end-points.
To simultaneously change the X & Y Axes: Hold down the <Ctrl> and <Alt> keys, at the same time, left-click and drag
the mouse cursor diagonally on the plot. A rectangle will define the new area of the plot.
eZ-PostView
08-30-022
Interactive Plot Display 3-5
Page 31

Changing the Plot’s Format / Scale / Grid
Right-Click on the plot’s border to open a popup menu (see figure). If you want to change the y-axis, rightclick on the plots left border. If you want to change the x-axis, right-click on the plot’s bottom border.
Changing the plot Format, Scale, or Grid affects the display only.
It does not change the real data.
Format
The Format menu allows you to change the axis format of the plotted data.
Scale
The Scale menu allows you to change the plot scale to AutoScale, FixedScale, or Manual.
Autoscale ensures that all the captured data is visible on the plot.
Grid
The Grid menu allows you to place and remove grid lines from the graph of plotted data. You can also turn
the grid on and off by pressing the “G” hot key.
3-6 Interactive Plot Display
08-30-02
eZ-PostView
Page 32

Note:
Appendix A, taken from the eZ-Analyst Series Software Reference Manual, p/n 1086-0922, consists of
several hot key tables for the benefit of those who prefer to use keys in place of mouse/cursor interaction
with a GUI.
Although eZ-PostView was derived from eZ-Analyst, certain key functions will not apply, for example,
the keys perta ining to Meas urement, Scope, and Generator Control.
eZ-PostView Note Regarding Appendix A
05-28-02
Keyboard Controls A-
i
Page 33

A-ii Keyboard Controls
04-24-02
Appendix A
Page 34
Appendix A
- Keyboard Controls for eZ-Analyst A
This appendix consists of several hot key tables for the benefit of those who prefer to use keys in place of
mouse/cursor interaction with a GUI. However, for certain functions, such as changing axis scales, a
mouse will be needed. Mouse use is pointed out in the tables, when applicable.
Record / Playback Control
Keys Function Comments
p
<Shift> + p
o
<Shift> + o
H
Play Forward
Play Backward
Step Forward and Record
Step Backward and Record
Halt Playback
Measurement, Scope, and Generator Control
Keys Function Comments
H
R
S
W
Halt the measurement
Start recording
Start Scope Mode (Measurement)
Turn the signal generator On
-----
-----
-----
-----
-----
-----
-----
-----
-----
Menu and Window Control
Keys Function Comments
Alt + E …
… C
… M
… P
Alt + F
Alt + W
Ctrl + M
Ctrl + O
Ctrl + P
D
Presents the
Presents the
Presents the
Presents the
Presents the
Presents the
Presents the
Presents the
Presents the
Presents the
to as the Plot Display Characteristics Menu.
Edit Menu
.
Plot Window Colors
Configuration
Playback Setup
File Menu
Window Menu
Configuration
Open File Dialog
Print Dialog
Display Menu
window.
window. After pressing
.
.
window.
window.
window.
, also referred
window.
After pressing
Menu, press C to get the Colors Window.
Use the Tab key to select a characteristic,
then hit <Enter>.
After pressing
Menu, press M to get the Configuration
Window. You will need a mouse to access
all panels. Also, see Ctrl + M.
Menu, press P to get the Playback Setup
Window. Use the Tab and arrow keys to
make selections within this window. Then
hit <Enter>.
You will need a mouse to make
selections.
You will need a mouse to access all
panels. An alternative to Ctrl + M is to
press M when the Edit Menu is open.
From within the window, use the Tab and
arrow keys. An alternative to Ctrl + O is to
press O when the File Menu is open.
An alternative to Ctrl + P is to press P
when the File Menu is open.
Refer to the following table for control
options related to the Display Menu.
-----
Alt + E
to access the Edit
Alt + E
to access the Edit
Alt + E
to access the Edit
-----
Appendix A
04-24-02
Keyboard Controls A-1
Page 35

Display Menu Control
Keys Function Comments
D
D + C
(3 functions)
D + F
D + I
D + L
D + O
D + S
D + T
Opens the
Plot Display Characteristics Menu
Used to open the
Complex Type Display Menu
This option is only available when a function
with complex data is displayed. Menu
choices are: Magnitude, Phase, Real,
Imaginary, Magnitude + Phase,
Real + Imaginary, and Nyquist
Used to open the
Menu choices are: Data, Plot Window,
Screen.
Used to open the
Menu choices are: Single Cursor,
Band Cursor, or Cursor Off.
Opens the
Note that right-clicking on the plot will also
open this menu.
Opens the
Integration/Differentiation Menu
Opens the
Opens the
Opens the
Menu choices are RMS, Peak, Pk-Pk.
Opens the
Copy Menu
Cursor Menu
Display Functions Menu
Label / List Menu
Octave Menu
Scale Type Menu
Transfer Type Menu
.
.
.
.
.
.
.
.
.
Option: “Right-clicking” the mouse, while
the cursor is over the plot will also open
this menu.
Press D + C; release, then press <Enter>.
The Complex Type Display Menu will
open. Use the arrow keys to highlight the
type of display, then press <Enter>.
Press D + C; release, then use the arrow
key to select Copy. After selecting Copy,
press <Enter>.
Press D + C; release, then use the arrow
key to select Cursor. After selecting
Cursor press <Enter>.
Use arrow keys to highlight your selection,
then press <Enter>. In some cases you
can select the first letter of an option to
select it.
Use arrow keys to highlight your selection,
then press <Enter>.
Use arrow keys to highlight your selection,
then press <Enter>.
Use arrow keys to highlight your selection,
then press <Enter>.
Use arrow keys to highlight your selection,
then press <Enter>.
Use arrow keys to highlight your selection,
then press <Enter>.
Plot Display Controls
Keys Function Comments
Mouse-Click
Bottom
Border
Mouse-Click
Left Border
,
.
<
>
<shift>
: Also see the Display Menu Control Table.
Note
Change the
and grid.
Change the
and grid.
Moves the primary cursor left along the trace.
Moves the primary cursor right along the
trace.
Moves the secondary cursor left along the
trace.
Moves the secondary cursor right along the
trace.
Peak search. Press the <shift> key while depressing the
(Note)
X-axis
Y-axis
in regard to format, scale,
in regard to format, scale,
Right-click on the plot’s bottom border to
access a menu for changing the X-axis in
regard to Format, Scale, and Grid.
Right-click on the plot’s left border to
access a menu for changing the Y-axis in
regard to Format, Scale, and Grid.
When in Band Cursor mode, the comma
moves the primary cursor to the left.
When in Band Cursor mode, the period
moves the primary cursor to the right.
When in Band Cursor mode, the “<”
moves the secondary cursor to the left.
When in Band Cursor mode, the “>”
moves the secondary cursor to the right.
left mouse button to search for peaks
along the trace.
Reference Note: For more detailed information, which includes graphics, refer to
chapter 3, Interactive Features of the Plot Display Window.
Continued
A-2 Keyboard Controls
04-24-02
Appendix A
Page 36

(continued)
Plot Display Control
(Note)
Keys Function Comments
A
Alt
Turns Auto-scale On.
Expands or contracts the
Y-Axis
.
(a) While holding down the <Alt> key,
place the cursor at the desired start point
of the Y-axis, (b) click the left mouse
button, (c) drag the mouse vertically until
the cursor is at the new end point of the
scale.
b
<shift> + b
C
Bank up.
Bank down.
Toggles the cursor On or Off; or cycles the
cursor options as follows (if Band Cursor is
selected): Adds a Cursor, Adds a second
When Band Cursor is selected, the “C”
key cycles through On (add a cursor), add
a second cursor, and Off.
Cursor, turns both cursors Off.
Ctrl
Expands or contracts the
X-Axis
.
(a) While holding down the <Ctrl> key,
place the cursor at the desired start point
of the X-axis, (b) click the left mouse
button, (c) drag the mouse horizontally
until the cursor is at the new end point of
the scale.
Ctrl + Alt
Simultaneously expands [or contracts]
both the X and
Y axes
.
(a) While holding down both the <Ctrl>
and <Alt> keys, place the cursor at the
desired start point on the plot, (b) click the
left mouse button, (c) drag the mouse
diagonally until the cursor is at the new
end point of the scale.
Zooms in or out. When you depress one of these keys,
F2 or Z
(2 functions)
while dragging with the right mouse
button depressed, you will zoom in or out,
according to the cursor-defined region.
Pan along the X-axis, Y-axis, or both. By depressing one of these keys, while
dragging with the left mouse button
depressed, you can pan in the direction of
the drag.
F3
Zoom in or out.
Use F3 with the left mouse button to zoom
in our out.
G
L
R
S
X
Y
Z
F2
or
: Also see the Display Menu Control Table.
Note
Turns Plot
Changes the
Start Recording
Start Scope Mode (Measurement)
Presents the
Presents the
Zooming or Panning.
Grid
On or Off.
Scale
to
X-Axis Menu
Y-Axis Menu
Linear
or to
Log
Toggles the grid to On or Off.
.
Toggles the scale to Linear or to Log.
See “F2.”
-----
-----
-----
-----
-----
-----
-----
Appendix A
Reference Note: For more detailed information, which includes graphics, refer to
chapter 3,
04-24-02
Interactive Features of the Plot Display Window
.
Keyboard Controls A-3
Page 37

eZ-Analyst Series Software Reference
the smart approach to instrumentation ™
IOtech, Inc.
25971 Cannon Road
Cleveland, OH 44146-1833
Phone: (440) 439-4091
Fax: (440) 439-4093
E-mail (sales): sales@iotech.com
E-mail (post-sales): productsupport@iotech.com
Internet: www.iotech.com
eZ-Analyst Series
Software Reference
p/n 1086-0922 Rev. 9.0
A Reference Manual for:
• eZ-Analyst
• eZ-FrequencyView
• eZ-TimeView
© 2001…2004 by IOtech, Inc. 987695 Printed in the United States of America
Page 38

ii
Page 39

Note: eZ-Analyst can only be used with WaveBook or ZonicBook type devices. Other
Manual Layout
This document is a reference manual for eZ-Analyst and its related series of “view”
applications.
It is intended for use with the following:
The document is a reference to Menu options, associated Toolbar buttons, and resulting GUI
screen images. When deemed beneficial, examples were placed to supplement the primary
material. For example, after describing the entry fields for "Double-Hammers," an example
demonstrates a typical setup.
The document discusses eZ-Analyst in relation to both ZonicBook and WaveBook applications.
It should be noted that certain eZ-Analyst functions that apply to ZonicBook, do not apply to
WaveBook, and visa versa. There are also differences in regard to non-Ethernet ZonicBook
models and the ZonicBook/618E model. These differences are pointed out when of
importance to the user.
devices, such as LogBook, DaqBook, and MultiScan are not compatible with
eZ-Analyst. However, they can make use of a related “view” application, e.g.,
eZ-PostView, eZ-TimeView, or eZ-FrequencyView.
• eZ-Analyst
• eZ-FrequencyView
• eZ-TimeView
The document is arranged as follows:
Ch 1 – Software Installation
WaveBooks
ZonicBook/618E
ZonicBook Medallion
Ch 2 – An Introduction to eZ-Analyst Series Software. Compares eZ-PostView,
eZ-TimeView, andeZ-FrequencyView to the eZ-Analyst program and discusses how the
manual relates to each.
Ch 3 – Menus discusses the following menus: Task, File, Control, Export, and Window.
The Edit Menu is discussed in chapter 4.
Ch 4 – Edit Menu discusses the following windows: Configuration, Playback Setup, Display
Preferences, and Output Channel Setup.
Ch 5 – Interactive Features of the Plot Display Window explains how to change plot
display characteristics, including display functions, by using the window’s interactive
features. The chapter includes a section on cursor types and annotation options.
Appendix A – Keyboard Controls for eZ-Analyst identifies keys for controlling plot
display, menus, windows, and record/playback functions.
Glossary
Check the README.TXT file, if present, for information that may not
have been available at the time this manual went to press.
* Do not use this manual as a reference for eZ-PostView. eZ-PostView users need to refer to the
eZ-PostView User’s Guide (p/n 1086-0926).
eZ-Analyst Series 978395 iii
Page 40

This page is intentionally blank.
iv 978395 eZ-Analyst Series
Page 41

Table of Contents
Manual Layout …… iii
Ch 1 – Software Installation
WaveBooks
ZonicBook/618E
ZonicBook Medallion
Ch 2 – An Introduction to eZ-Analyst Series Software
Ch 3 – Menus
Task Menu (eZ-Analyst Only) …… 3-2
File Menu …… 3-10
Control Menu …… 3-10
Export Menu …… 3-11
Window Menu …… 3-13
Edit Menu …… see chapter 4
Ch 4 – Edit Menu
Configuration Window …… 4-2
Analyzer Tab …… 4-4
Input Channels Tab …… 4-13
Analog Input Channels …..4-14
Tach Channels ….. 4-16
Recording Setup Tab …… 4-18
Block Rejection Tab …… 4-22
Octave Setup Tab…… 4-24
FFT Setup Tab …… 4-26
Output Channel Setup …… 4-33
Playback Setup Window …… 4-37
Display Preferences Window …… 4-39
Ch 5 – Interactive Features of the Plot Display Window
Introduction …… 5-1
Adding and Removing Channels …… 5-1
Using Cursors …… 5-2
Using the Toolbar Buttons …… 5-6
Additional Functionality …… 5-11
Copy …… 5-11
Strip Charts …… 5-11
XLS Overlay …… 5-12
Displaying Channel Pairs …… 5-13
Changing the Display Range …… 5-13
Changing Format, Scale, and Grid …… 5-15
Appendix A – Keyboard Controls for eZ-Analyst
Glossary
eZ-Analyst Series 978395 v
Page 42

This page is intentionally blank.
vi 978395 eZ-Analyst Series
Page 43

Software Installation 1
WaveBooks …… 1-1
ZonicBook/618E …… 1-3
ZonicBook Medallion …… 1-5
WaveBooks
System Requirements
Certain WBK options are not supported by eZ-Analyst. If you are using
WBK options with WaveBook and intend to use eZ-Analyst, refer to the
WBK support table on page 1-2.
Before setting up the hardware or installing the software, verify that you have the following
items.
In addition, verify that your computer meets the following minimum requirements.
• WaveBook data acquisition system
• Power supply with cord
• Data acquisition CD
• Passwords for purchased software
• Intel
™
, Pentium 90 MHz or equivalent
• 64 MB memory
• 100 MB hard disk space
• Monitor: SVGA, 800 x 600 resolution
• For WaveBook/516E: 10/100BaseT Ethernet port
• One of the following Microsoft
Windows 98
Windows Me
Windows NT
Windows 2000
Windows XP
Optional, but recommended:
EPP (Enhanced Parallel Port), or
ECP (Extended Capabilities Port)
* WaveBook/516E requires that the host PC is operating under Windows 2000 or
Windows XP.
®
Windows Operating Systems*
If you purchased software, associated passwords will accompany your
installation CD. If this is the case, keep your passwords in a safe place.
You will need to enter them once, during an actual run of eZ-Analyst.
eZ-Analyst 979495 Software Installation, WaveBooks 1-1
Page 44

Software Installation for Wa veBooks
Remove any previous-installed versions of WaveBook software before installing a
new version.
1. Start Windows.
2. Close all running applications.
3. Insert the Data Acquisition CD into your CD-ROM drive and wait for the CD to auto-run.
If the CD does not start on its own:
(a) click the desktop’s <Start> button
(b) choose the Run command
(c) select the CD-ROM drive, then select the setup.exe file.
(d) click <OK>.
An Opening Screen will appear.
4. Click the <ENTER SETUP> button.
5. From the hardware selection screen [which follows a licensing agreement], select
WaveBook Systems from the drop-down list and follow the on-screen instructions.
WBK Support for WaveBooks using eZ-Analyst
WBK Option
WBK10A – Analog Expansion Module
WBK11A – Simultaneous Sample & Hold (SSH) Card
WBK12A and WBK13A – Programmable Filter Cards
WBK14 – Dynamic Signal Conditioning Module
WBK15 – 5B Isolated Signal Conditioning Module - no WBK16 – Strain Gage Module - no WBK17 – Counter-Input Module, with Quadrature Encoder Support - no WBK18 – Dynamic Signal Conditioning Module
WBK20A – PCMCIA/EPP Interface Card and Cable
WBK21 – ISA/EPP Interface Plug-In Board
WBK23 – PCI/EPP Interface Plug-In Board
WBK25 – Ethernet Interface Module
WBK30 – WaveBook Memory Options
WBK40 and WBK41 – Thermocouple and Multi-Function I/O Modules - no WBK61 and WBK62 – High Voltage Adapters - no -
Information pertaining to these products is included in The WBK Options Manual, p/n 489-0902.
Reference Notes:
¾ Adobe Acrobat PDF versions of documents pertaining to WaveBook
are automatically installed onto your PC’s hard-drive as a part of
product support at the time of software installation. The default
location is the Programs group, which can be accessed via the
Windows Desktop Start Menu.
Supported
¾ After your software is installed you can setup your WaveBook device
and connect it to the host computer. Instructions for Hardware
Setup are included in your WaveBook User’s Manual.
1-2 Software Installation, WaveBooks 979495 eZ-Analyst
Page 45

ZonicBook/618E
This section applies to the Ethernet-based ZonicBook/618E. If you are
using a ZonicBook Medallion refer to page 1-5.
WBK Support
When used with ZonicBook/618E, eZ-Analyst supports WBK18 and WBK30.
System Requirements
Before setting up the hardware or installing the software, verify that you have the following
items.
• ZonicBook/618E Data Acquisition System
• Power Supply with cord
• Data Acquisition CD
• Passwords for purchased software
In addition, verify that your computer meets the following minimum requirements.
• Intel
• 10/100BaseT Ethernet port
• 64 MB memory
• 100 MB hard disk space
• Monitor: SVGA, 800 x 600 resolution
• One of the following Microsoft
™
, Pentium® III processor
Windows 2000
Windows XP
®
Windows Operating Systems:
If you purchased software, associated passwords will accompany your
installation CD. If this is the case, keep your passwords in a safe place.
You will need to enter them once, during an actual run of eZ-Analyst.
eZ-Analyst 987096 Software Installation, ZonicBook/618E 1-3
Page 46

Software Installation for ZonicBook/618E
Remove any previous-installed versions of eZ-Analyst software before
installing a new version.
1. Start Windows.
2. Close all running applications.
3. Insert the Data Acquisition CD into your CD-ROM drive and wait for the CD to
auto-run.
If the CD does not start on its own:
(a) click the desktop’s <Start> button
(b) choose the Run command
(c) select the CD-ROM drive, then select the setup.exe file.
(d) click <OK>.
An Opening Screen will appear.
4. Click the <ENTER SETUP> button.
5. From the hardware selection screen [which follows a licensing agreement], select
ZonicBook/618E from the drop-down list and follow the on-screen instructions.
Reference Notes:
¾ Adobe Acrobat PDF versions of documents pertaining to
ZonicBook/618E are automatically installed onto your PC’s hard-drive
as a part of product support at the time of software installation. The
default location is the Programs group, which can be accessed via the
Windows Desktop Start Menu.
¾ After your software is installed you can setup your ZonicBook/618 and
connect it to the host computer. Instructions are included in the
ZonicBook/618E User’s Manual, p/n 1106-0901.
1-4 Software Installation, ZonicBook/618E 979595 eZ-Analyst
Page 47

ZonicBook Medallion
General Information …… 1-5
WBK Support …… 1-5
System Requirements …… 1-6
ZonicBook Medallion, Software Installation for Windows 98/Me/2000/XP/NT …… 1-6
ZonicBook Medallion, A Special Note for Windows NT Users …… 1-7
ZonicBook Medallion, Hardware Setup and DSP-Card Installation…… 1-8
ZonicBook Medallion, Verifying DSP-Card Installation …… 1-8
General Information
The interface between a ZonicBook Medallion and its host PC is a type III PCMCIA card, which
we will refer to as a “DSP Card” (Digital Signal Processing Card). Machine conditions and
analysis solutions can be shared instantaneously with associates, providing that the ZonicBook
Medallion’s host PC is connected to an Ethernet LAN, file server, internet, or intranet.
Prior to using a ZonicBook Medallion system, it is essential that:
• the DSP program has been loaded into the DSP Card
• the ZonicBook is initialized
• system communications are working properly
Be sure to install the software prior to performing the hardware
installation. In regard to hardware installation for ZonicBook Medallion,
refer to the ZonicBook User’s Manual,
p/n 1086-0901.
WBK Support
Reference Note:
Adobe Acrobat PDF versions of documents pertaining to ZonicBook are
automatically installed onto your PC’s hard-drive as a part of product support at
the time of software installation. The default location is the Program Group, which
can be accessed via the Windows Desktop Start Menu.
No WBK cards or modules are supported when using eZ-Analyst with a ZonicBook Medallion.
eZ-Analyst 979595 Software Installation, ZonicBook Medallion 1-5
Page 48

System Requirements
Before setting up the hardware or installing the software, verify that you have the following
items.
• ZonicBook Medallion Data Acquisition Module
• ZonicBook Medallion DSP-Card
• Universal Power Su pply with cord (U.S.)
• Data Acquisition CD
• Passwords for purchased software
In addition, verify that your computer meets the following minimum requirements.
• Intel
• a slot for a Type III PCMCIA Card
• 64 MB Memory
• 100 MB Hard Disk space
• Monitor: SVGA, 800 x 600 resolution
• One of the following Microsoft
™
, Pentium 90 MHz or equivalent
®
Windows Operating Systems:
Windows 98
Windows Me
Windows NT
Windows 2000
Windows XP
If you purchased software, associated passwords will accompany your installation
CD. If this is the case, keep your passwords in a safe place. You will need to enter
them once, during an actual run of eZ-Analyst.
ZonicBook Medallion, Software Installation for Windows 98/Me/2000/XP/NT
1. Start Windows.
2. Close all running applications.
3. Insert the Data Acquisition CD into your CD-ROM drive and wait for the CD to auto-run.
If the CD does not start on its own:
(a) click the desktop’s <Start> button
(b) choose the Run command
(c) select the CD-ROM drive, then select the setup.exe file
(d) click <OK>
An Opening Screen will appear.
4. Click the <ENTER SETUP> button.
5. On the hardware selection screen [which follows a licensing agreement], select
ZonicBook Systems from the drop-down list and follow the on-screen prompts.
1-6 Software Installation, ZonicBook Medallion 979595 eZ-Analyst
Page 49

ZonicBook Medallion, A Special Note for Windows NT Users Windows NT
If your PC is using Windows NT, perform the following after you have installed the software.
1. Verify that you are logged on with Administrator capabilities.
2. Verify IRQ and I/O Port availability. This is done as follows:
(a) From the Start menu, navigate as follows:
Program ⇒ Windows NT Diagnostics ⇒ Resources
(b) Verify and write down the I/O Port Address; for example: 0110-011F
(c) Verify and write down available IRQs; for example: 9, 10, 11.
3. Open the Control Panel.
4. Double-click the CACDSP icon. This opens the CAC API Configuration Utility
window.
5. In the data entry box, enter the I/O Port Address [from step 8b].
Typically the I/O Port is either 0x0110 or 0x0120.
6. In the data entry box, enter an available interrupt (IRQ) for your system [from
step 8c].
Typically this is 10 or 11.
7. Click the DSP Tab.
8. Select PCMCIA.
9. Click the <ADD> button.
Note: For Windows NT operating systems, the I/O Port Address and IRQ
values do not show up in the menus after you close the window. They
are; however, stored in memory.
10. Click <OK.>
11. Restart your computer.
Your computer is now ready to run the software and communicate with the
ZonicBook Medallion module.
If the DSP-Card does not respond in Windows NT, try the following:
1. From the desktop, open the Control Panel. This is done by navigating as follows:
Start ⇒ Settings ⇒ Control Panel ⇒ System ⇒ Device Manager ⇒ CACDSP
Note: “CACDSP” represents the DSP-Card device
2. Double-click the “CACDSP” (DSP-Card) device.
3. Click the <Start> button. This starts the DSP-Card without the need to reboot the
computer.
4. To enable or disable the DSP-Card, click the <Startup> button, then click the
<Enable> or the <Disable> button as applicable.
5. Click the <HW Profiles> button.
6. If the Startup method is not set to “Automatic,” set the DSP-Card for “Automatic”
startup.
eZ-Analyst 979595 Software Installation, ZonicBook Medallion 1-7
Page 50
ZonicBook Medallion, Hardware Setup and DSP-Card Installation (All Windows Systems)
Reference Note:
If you have not already set up your hardware and installed your DSPcard, refer to your ZonicBook User’s Manual (p/n 1086-0901), and do so
at this time.
ZonicBook Medallion, Verifying DSP-Card Installation
You can use the Window’s Device Manager to verify that the DSP-card has been properly
installed.
The steps for this method are as follows.
1. From the Windows Desktop, click <Start>.
2. Click Settings.
3. Click Control Panel.
4. Click the System icon.
5. Click the “Device Manager” tab.
6. Locate one of the following nodes, as applicable to you Window’s operating
system.
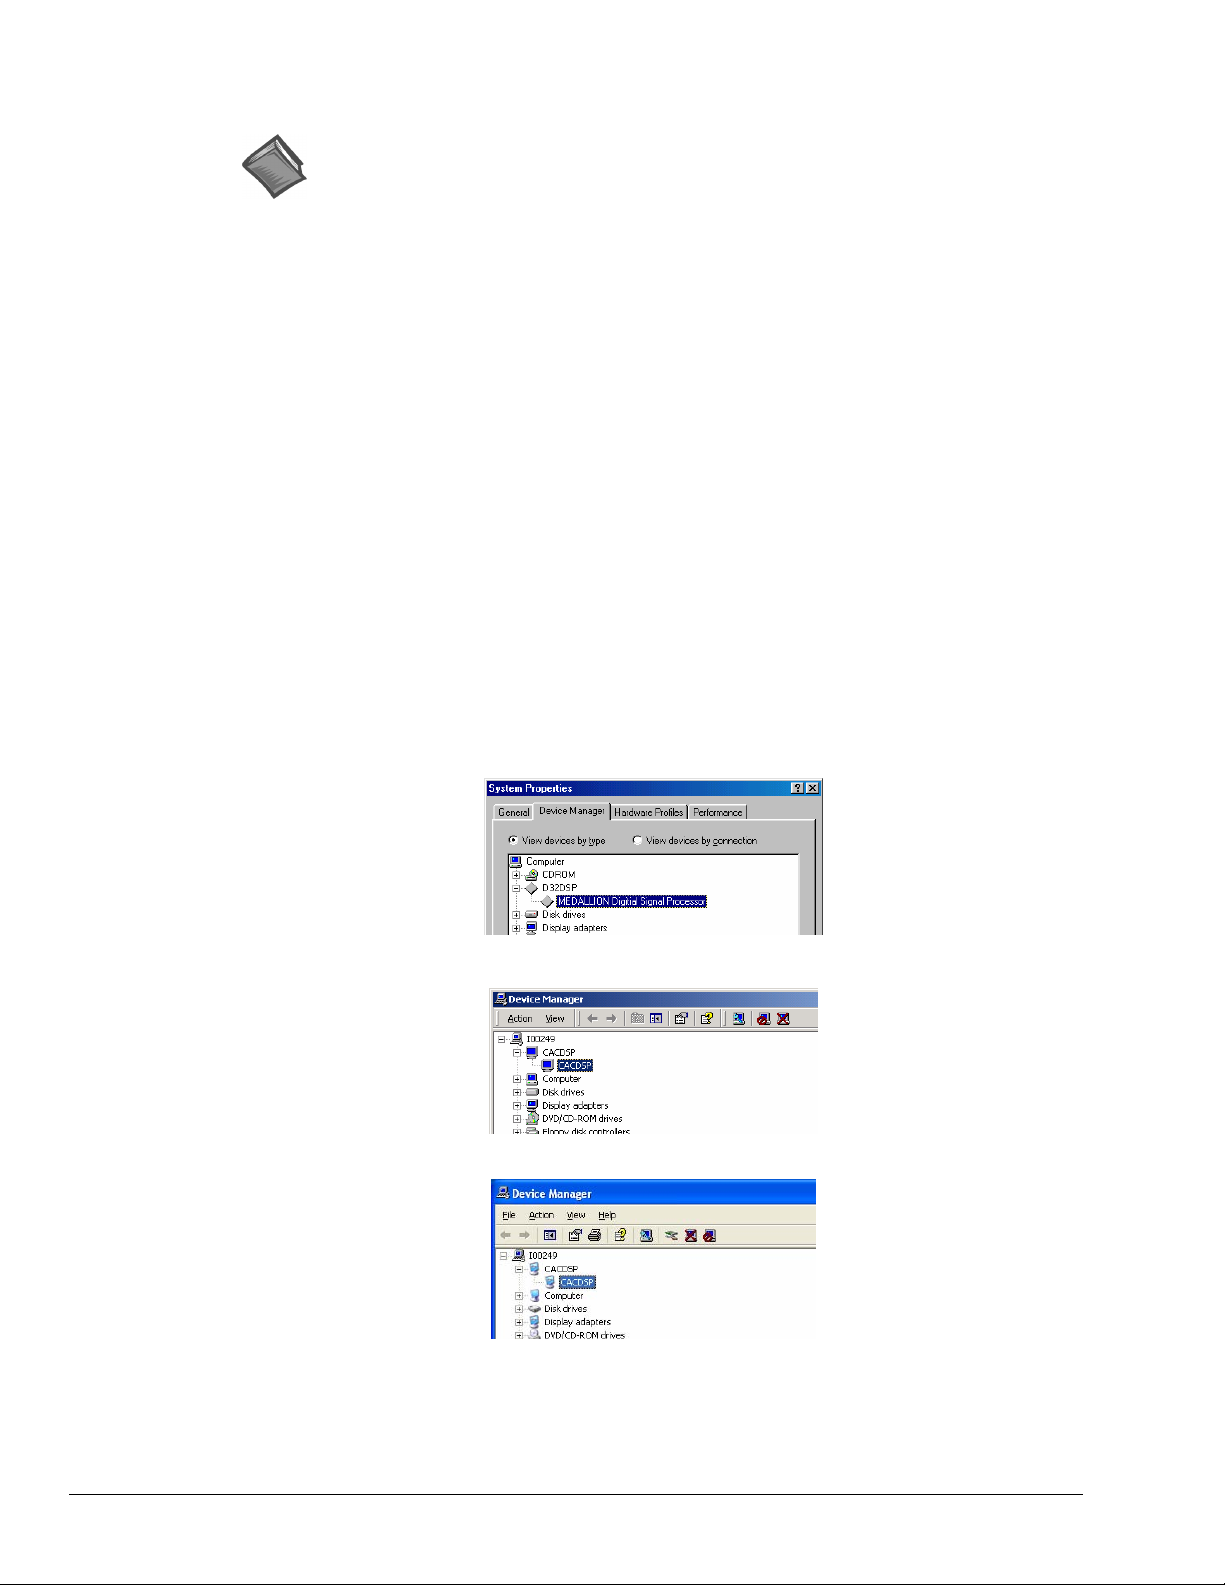
• Windows 98 and Windows Me users should locate a node called D32DSP.
• Windows 2000, Windows XP, Windows NT users should locate a node
called CACDSP.
7. Expand that node by clicking on the “+” symbol.
At this point you should see a screen similar to one of the following, depending on
which operating system your PC is using.
DSP Verification, Windows 98 and Windows Me
DSP Verification, Windows 2000
DSP Verification, Windows XP
Note: A screen image is not shown for Windows NT. However, Windows NT makes
use of a CACDSP node, as do Windows 2000 and Windows NT.
1-8 Software Installation, ZonicBook Medallion 979595 eZ-Analyst
Page 51
An Introduction to eZ-Analyst Series Software 2
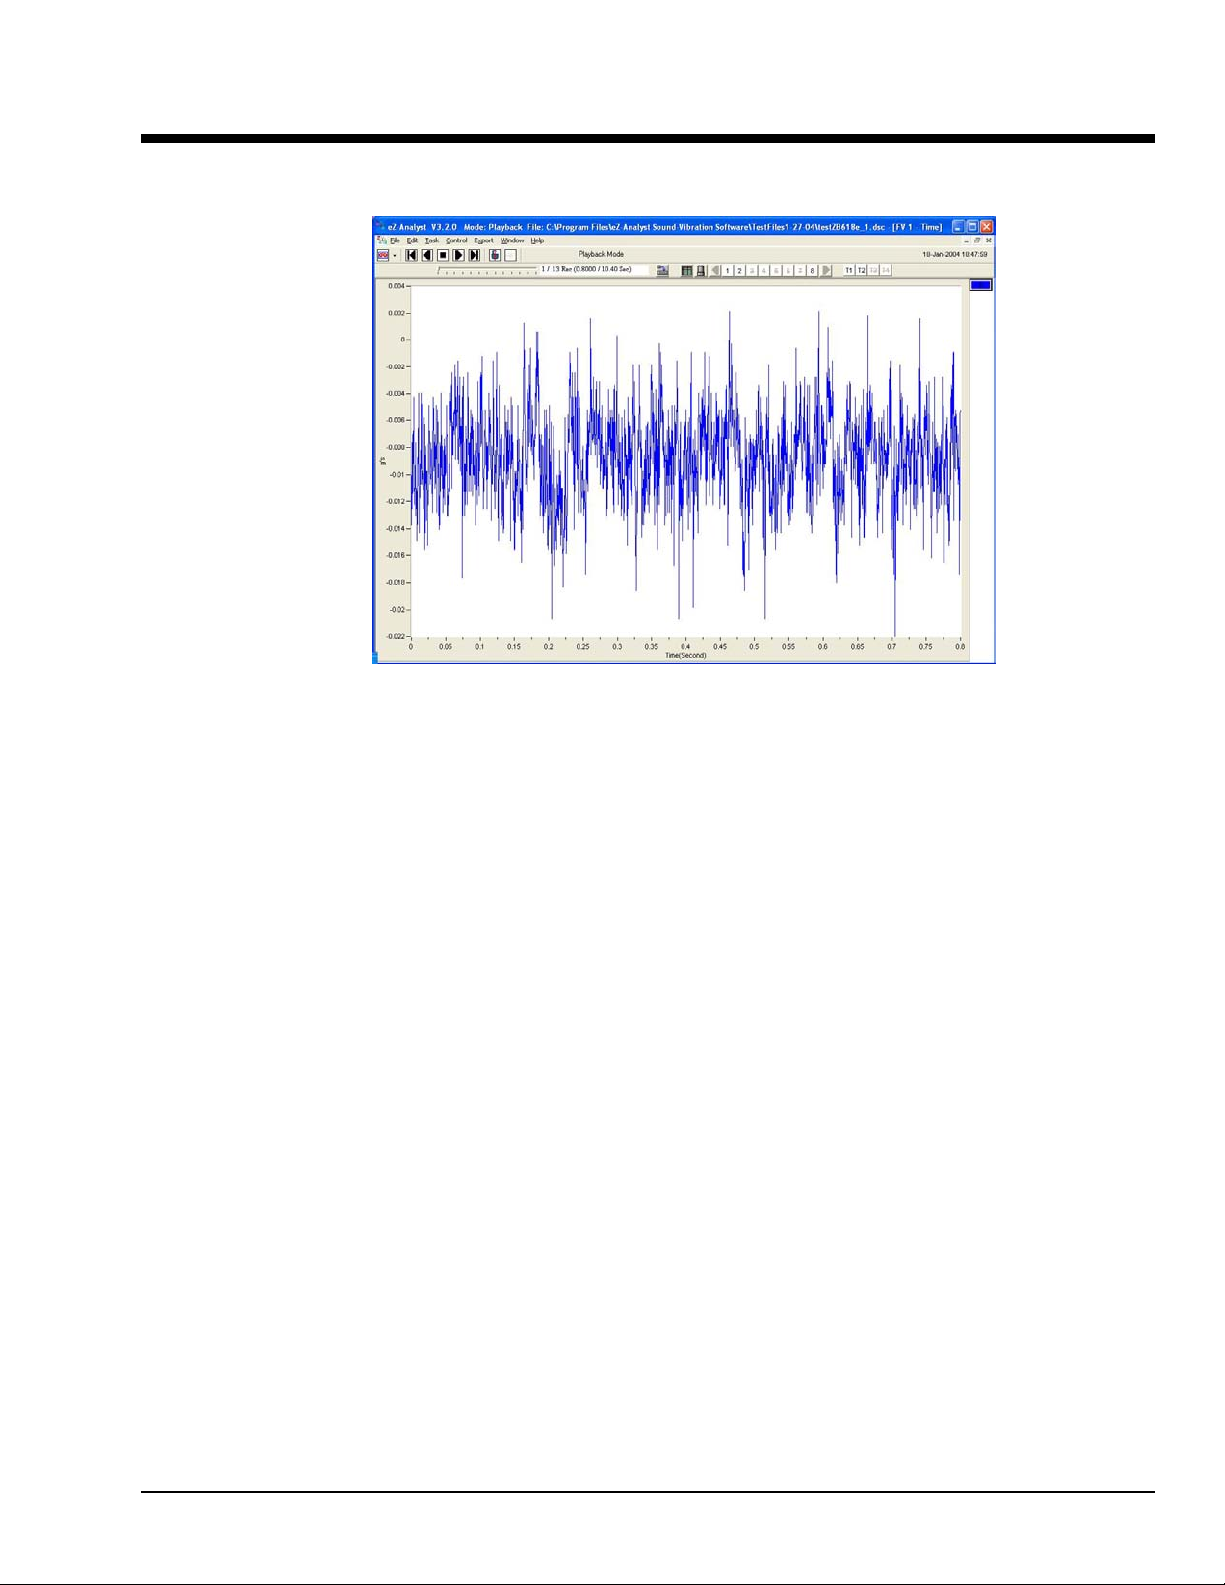
A Screen Capture from eZ-Analyst in Playback Mode
While the focus of this document is on eZ-Analyst, it can also be used for eZ-TimeView, and
eZ-FrequencyView. Those two post-acquisition analysis applications were derived from
the more powerful eZ-Analyst program.
It should be noted that the eZ-Analyst program is only compatible with WaveBooks,
ZonicBook/618E, and ZonicBook Medallion series devices. However, the related “view”
applications can be used with many other devices, for example, DaqBooks, DaqBoards,
LogBooks, ChartScans, and Personal Daqs.
Features of the view applications vary from one application to another, and are listed in
the comparative table on the following page. Although the table includes a column for
eZ-PostView, this document is not to be used as a reference for that application. eZ-PostView
is discussed in a separate document, the eZ-PostView User’s Guide, p/n 1086-0926.
The “view” applications are integrated with the primary data acquisition software, including
DaqView, Personal DaqView, ChartView, LogView, and WaveView. The eZ-PostView
application provides easy-to-use post-acquisition analysis capability, and is included free of
charge as a part of product support. The other two view programs (eZ-TimeView and eZ-
FrequencyView) have additional features and are available for purchase. These more versatile
“view” applications are initially accessed via an authorization-code. Note that the code is only
required to “unlock” the application for its first run and is not required for subsequent
startups.
The following table compares the “view” applications to the eZ-Analyst program, from which
they were derived.
eZ-Analyst Series 979595 Introduction 2-1
Page 52
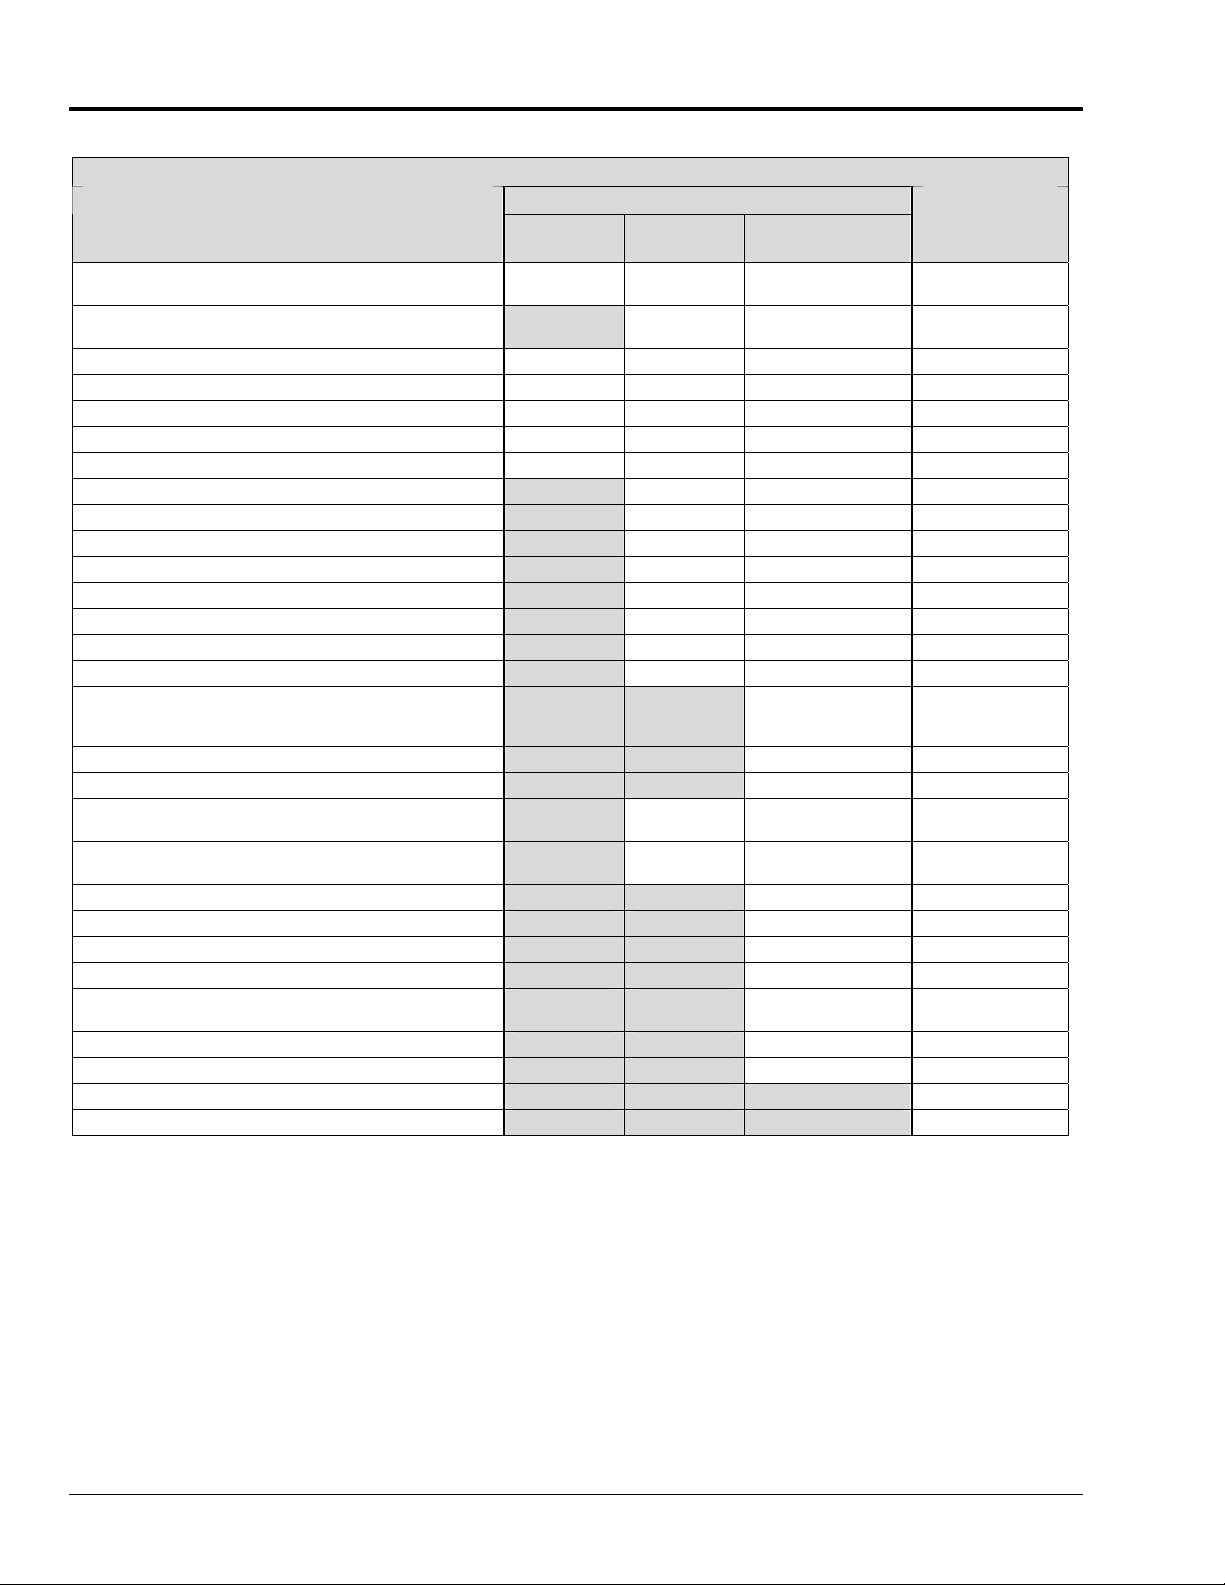
Comparing the “View” Applications to eZ-Analyst
eZ-Analyst Series Comparison Matrix
Feature
File Input Format Support for: DaqView, WaveView,
Personal DaqView, ChartView, UFF-58B.
File Export to: ME’Scope and SMS Modal, Microsoft Excel,
Binary Universal File, and ASCII text files.
Display Windows, number of 8 8 8 8
Channel Traces per Display Window 16 16 16 16
Automatic Data Scaling Yes Yes Yes Yes
Configurable Data Display for channels and trace colors Yes Yes Yes Yes
Multiple Tiling of display windows Yes Yes Yes Yes
Cursor Support - for both Single Cursor and Band Cursor ----- Yes Yes Yes
Data Strip Chart Display ----- Yes Yes Yes
Peak-to-Peak Calculations ----- Yes Yes Yes
Peak Searching, minimum and maximum ----- Yes Yes Yes
Mean Calculations ----- Yes Yes Yes
RMS Calculations ----- Yes Yes Yes
Zooming [of the data display] ----- Yes Yes Yes
Windowed Time Display Function ----- Yes Yes Yes
Cross Channel Support ----- ----- FRF, Cross,
Transfer Function Display Types ----- ----- Note 1 Note 1
Complex Function Display Types ----- ----- Note 2 Note 2
Scale Types ----- RMS, Peak,
Function Display Types ----- Time, Strip
Octave Types ----- ----- 1/3, Full 1/3, Full
Octave Weighting ----- ----- Linear, A, B, C Linear, A, B, C
Integration/Differentiation (Single/Double) ----- ----- Yes Yes
Response Channel FFT Windows ----- ----- Note 4 Note 4
Reference Channel FFT Windows ----- ----- Rectangular,
Low-Pass DC Noise Filtering ----- ----- Yes Yes
Strip Chart Display Synchronization ----- ----- Yes Yes
Record and Save Data to Disk ----- ----- ----- Yes
“Real Time” Data Display ----- ----- ----- Yes
Post-Acquisition Viewing Package
eZPostView
Yes Yes Yes Yes
----- Yes Yes Yes
eZTimeView
Peak-to-Peak
Chart
eZFrequencyView
Coherence,
Transfer Function
RMS, Peak,
Peak-to-Peak
Note 3 Note 3
Cosine Taper
eZ-Analyst
FRF, Cross,
Coherence,
Transfer Function
RMS, Peak,
Peak-to-Peak
Rectangular,
Cosine Taper
Notes: 1) eZ-Analyst and eZ-FrequencyView - each offers the following Transfer Function Display Types: Inertance, Mobility,
2-2, Introduction 979595 eZ-Analyst Series
Compliance, Apparent Mass, Impedance, and Dynamic Stiffness.
2) eZ-Analyst and eZ-FrequencyView - each offers the following Complex Function Display Types: Magnitude, Phase, Real,
Imaginary, Nyquist, Magnitude and Phase, and Real and Imaginary.
3) eZ-Analyst and eZ-FrequencyView - each offers the following Function Display Types: Spectrum, Auto-Sp ectr um,
PSD (Power Spectral Function), Strip Chart (Time).
4) eZ-Analyst and eZ-FrequencyView – each offers the following Response Channel FFT Windows: Hanning, Flat Top,
Exponential, and Blackman-Harris.
Page 53

The eZ-Analyst Series “view” programs make use of eZ-Analyst’s Playback Mode and, therefore, do
not require the presence of physical hardware. In fact, when eZ-Analyst is in Playback Mode, it is
functioning in the exact manner as eZ-FrequencyView. In other words, when in PlayBack Mode,
eZ-Analyst is strictly a post-acquisition display and analysis program.
Raw time-domain data, that has been recorded-to-disk, can be played back for analysis repeatedly.
For example, a raw signal could be played back several times, each time using a different filtering
algorithm to manipulate the original signal. Once the desired results have been achieved the new data
can be exported in a new format and to a different file. The original file can remain unchanged, and
kept for future analysis.
How this Manual Relates to the “View” Applications
This manual was original written as a reference guide for users of eZ-Analyst. This was prior to the
development of the “view” applications. However, since the post-acquisition “view” programs were
derived directly from eZ-Analyst, it is easy to apply the appropriate sections of the manual to your
specific “view” application, i.e., to eZ-TimeView and to eZ-FrequencyView.
Note: WaveBook user’s who want to have post-data analysis view capabilities accessible from
WaveView’s <View Data> button will need to install one of the “view” applications, i.e.,
eZ-PostView, eZ-TimeView, or eZ-FrequencyView. The latter two applications are available
for purchase. The eZ-PostView application is free.
eZ-FrequencyView
When you are using eZ-FrequencyView, you are essentially running eZ-Analyst in its Playback
Mode. The table on page 2-2 indicates the applicable features. You can not record data from
eZ-FrequencyView.
eZ-FrequencyView is supported by the primary data acquisition programs, for example, DaqView,
LogView, and WaveView. It can be accessed through the primary application’s View Data button, or
accessed independently from your program files directory (where you installed your software).
The first time you run eZ-FrequencyView, you will need to enter an authorization code. The code is
supplied when the package is purchased.
eZ-TimeView
When you are using eZ-TimeView, you are essentially running eZ-Analyst in its Playback Mode, minus
several analysis features that are available in eZ-FrequencyView and eZ-Analyst. For example, when
using eZ-TimeView there are no Transfer Function Display Types, Complex Function Display Types, or
FFT Windows available. However, the application does provide calculation options pertaining to peakto-peak, mean, RMS, and does allow for data zooming. Refer to the table on page 2-2 for a complete
list of the applicable features. Note that you can not record data from eZ-TimeView.
eZ-TimeView is supported by the primary data acquisition programs, for example, DaqView, LogView,
and WaveView. It can be accessed through the primary application’s View Data button, or accessed
independently from your program files directory (where you installed your software).
The first time you run eZ-TimeView, you will need to enter an authorization code. The code is
supplied when the package is purchased.
eZ-Analyst Series 979595 Introduction 2-3
Page 54

eZ-PostView
eZ-PostView provides simple “time-domain” viewing. From this application you can display up to 8
time-domain function windows and display up to 16 channel traces per window. Data is automatically
scaled to optimize its fit in the window. Window, channel trace, and cursor colors can be customized.
eZ-PostView is a free “view” program. The application has no Transfer Function Display Types,
Complex Function Display Types, or FFT Windows available. Refer to the table on page 2-2 for a
complete list of the applicable features. Note that you can not record data from eZ-PostView.
eZ-PostView is supported by the primary data acquisition programs, for example, DaqView, LogView,
and WaveView. It can be accessed through the primary application’s View Data button, or accessed
independently from your program files directory (where you installed your software).
You do not need to enter an authorization code to run eZ-PostView.
Reference Note:
If you are only making use of eZ-PostView you should refer to the eZ-PostView User’s
Guide, p/n 1086-0926. A PDF version of that document is installed onto your harddrive (in the Program Group by default) as a part of product support.
Note that PDF versions of documents can be read directly from the installation CD.
2-4, Introduction 979595 eZ-Analyst Series
Page 55
A Look at eZ-Analyst
eZ-Analyst can only be installed as software support for ZonicBook
Medallion, ZonicBook/618E, and WaveBook devices. If your system is
making use of another type of data acquisition device you cannot install
eZ-Analyst. However, you can still install one of the “view” applications,
i.e., eZ-PostView, eZ-TimeView, or eZ-FrequencyView.
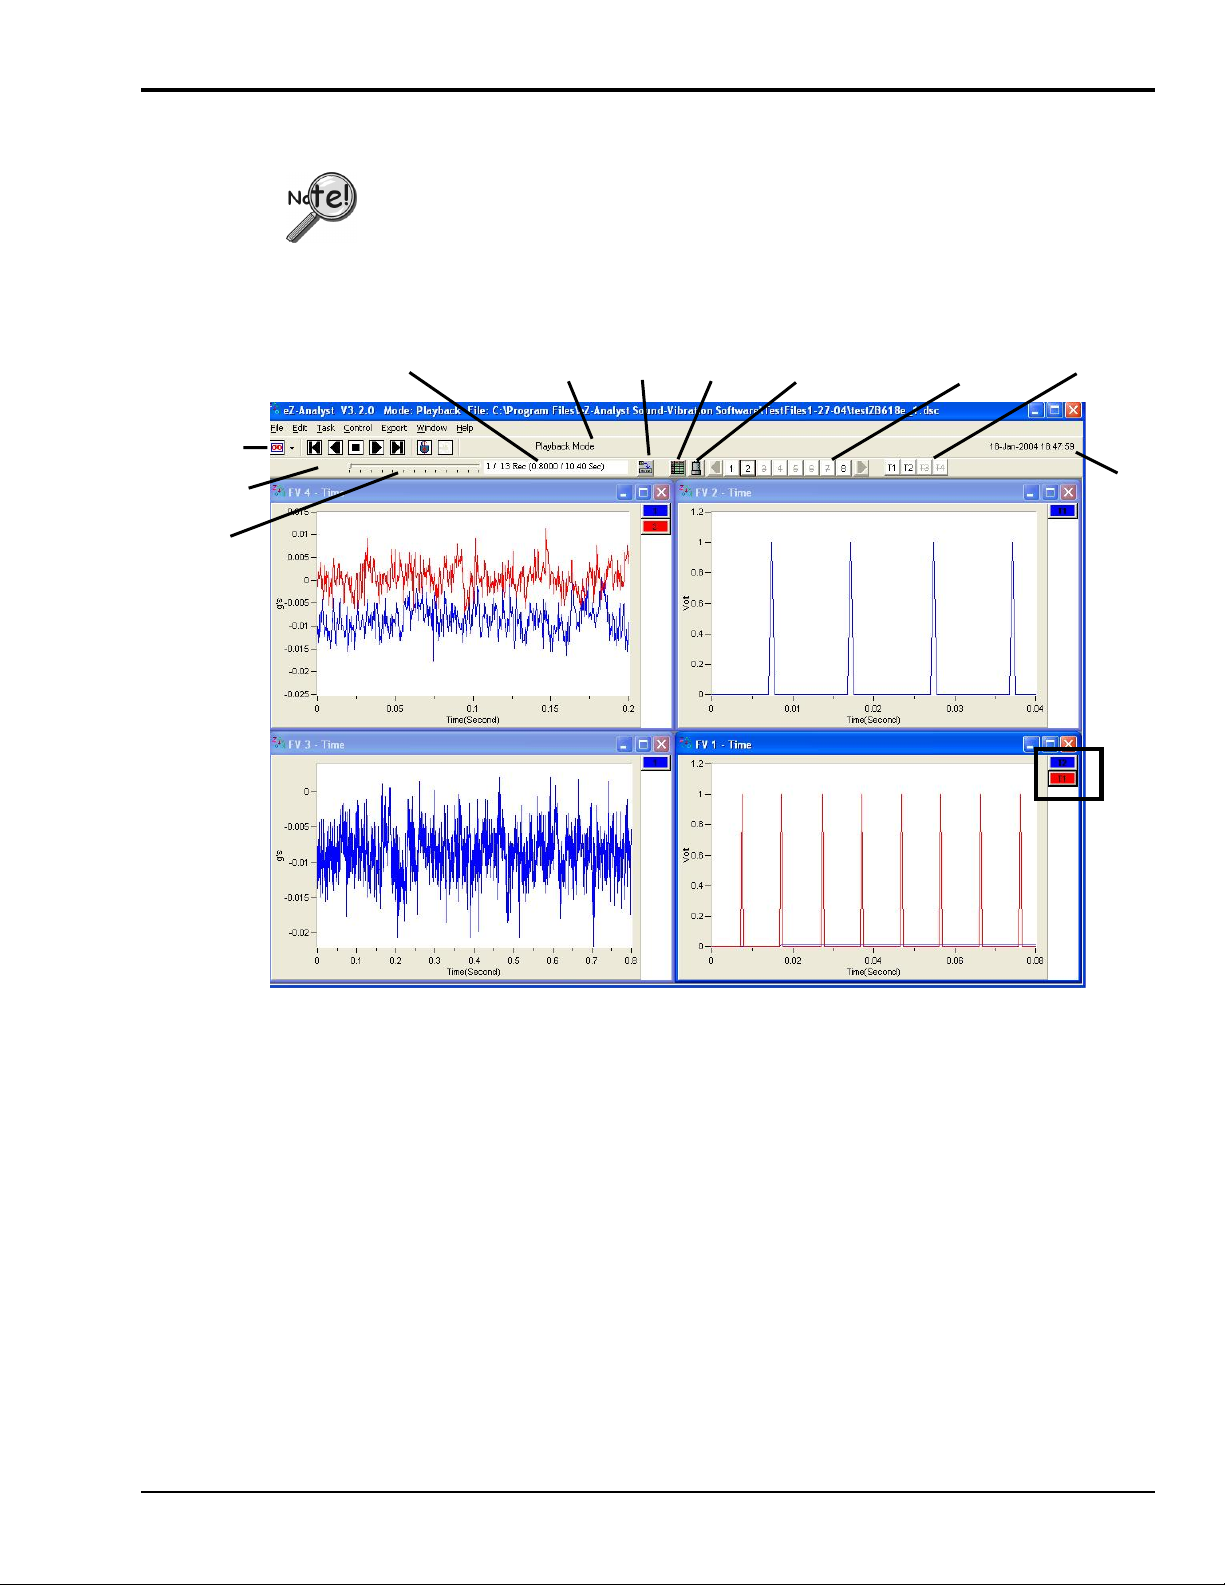
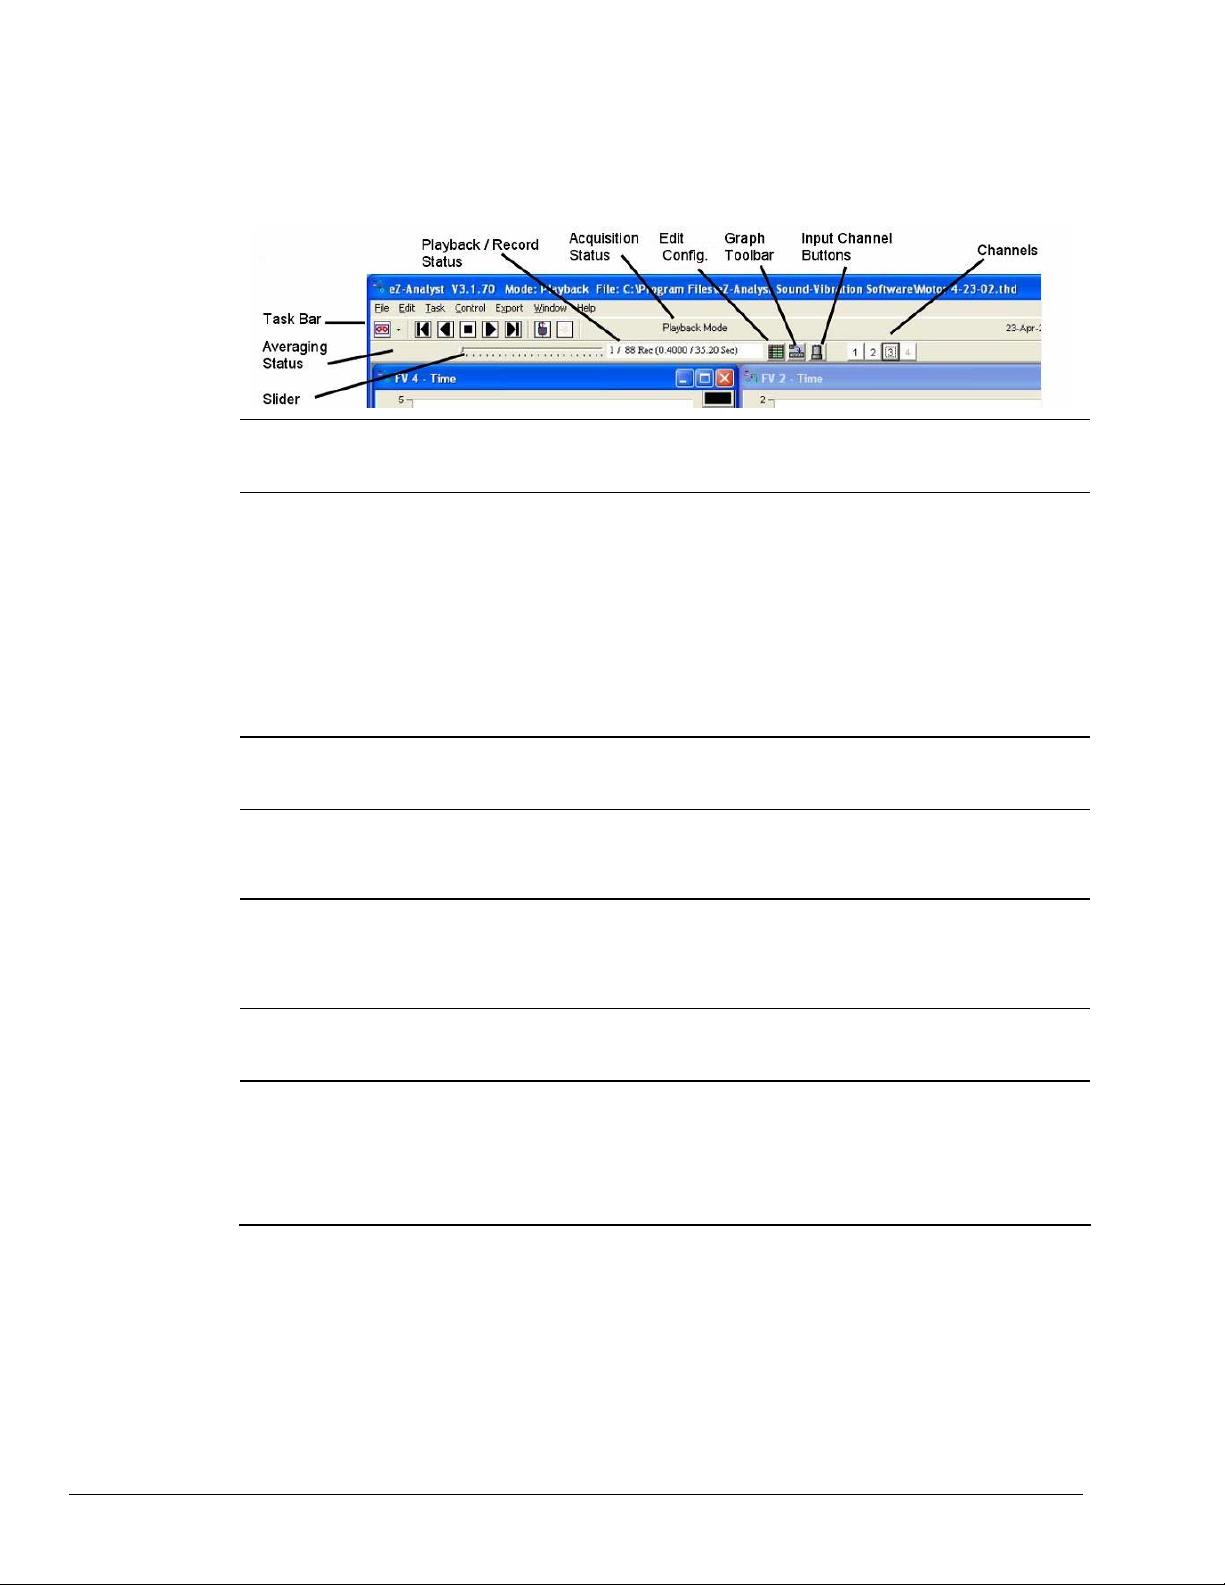
Playback / Record
Status
Acquisition Graph Edit Input Channel
Status Toolbar Config. Window (Open/Close)
Analog Input Tach
Channels Channels
Averaging
Status
Slider
Date/Time
Channel
Identifiers
Four Function View Windows in Playback Mode
eZ-Analyst is a graphical analysis application that can be used to collect, analyze, record, and
play back recorded data. Using ZonicBook or WaveBook hardware systems, ez-Analyst can
collect and display multiple channels of data in real-time. The graphical displays can consist
not only of the raw time-domain data, but also plots of frequency domain data. For example,
real time FFT (Fast Fourier Transform) plots.
Data that is recorded to disk-file is in the raw time domain and can be played back for
additional analysis time and time again. For example, a raw signal can be played back overand-over using different filtering algorithms to manipulate the signal. Once the desired results
have been achieved, the new data can be exported to a different file and format, while
preserving the original file. In addition, the playback capability does not require the presence
of a ZonicBook or WaveBook system.
eZ-Analyst Series 979595 Introduction 2-5
Page 56
You can select the Measurement Mode or the Playback mode from either the Task pull-down
menu, or by using the <Change Task Mode> button [the first button in the Task Bar]. The
Task Tool Bar automatically changes to accommodate the selected mode.
1 Status
Message
2 Acquisition
Status
3 Date/Time Provides time in the following format: Day-Month-Year, Hour: Minutes: Seconds.
4 Slider Bar The sliding bar indicates the relative location of the displayed data. The record number and
5 Playback /
Recording
Status
A message regard ing the status, if applicable, will be displayed in this area. Examples of
possible messages are: Double Hammer Rejected, Overload Reject ed, Reject (Manual Reject
Mode), and GAP.
Indicates the status of the acquisition.
Waiting Trigger indicates that a trigger has not been recognized since the Acquire button
was clicked.
Triggered indicates eZ-Analyst is capturing and processing data based on the s etup
conditions.
Acquiring indicates that data is being acquired, but is not being recorded to disk.
Recording indicates that data is being recorded-to-disk, as it is being acquired.
Completed indicates eZ-Analyst has finished processing the frame of data.
The “Averages Count” increments by 1 at this time.
When in Record Mode the current time is displayed.
When in Playback Mode the measured time is displayed.
the number of records in the file are listed to the right. The slider can be used to quickly
locate a specific record. Note that both the Record and the Playback mode make use of the
slider bar.
Displays the current record and the total number of records to be co llected. Time
equivalents are included in parenthesis
th
Example, 12/25 means that the record currently displayed is the 12
25 records.
record, out of a total of
Averaging
Status
6 Channels Each numbered box represents a channel. Drag a channel [channel-box] to the plot area to
This field shows when the Averaging Mo de is used, during the Scope Mode or the Playback
Mode. A display of 2/5 would indicate that 2 averages have been performed out of a total of
5 averages to be performed.
have its data displayed. That channel’s data is plotted in a distinct color and a color-coded
channel button is displayed to the right of the plot.
Reference channels are bold and italic. The under lined channel is the current reference
channel. Use the right mouse button to select current reference channel. Reference
channels are specified in the Configuration accessed via the Edit Menu.
2-6, Introduction 979595 eZ-Analyst Series
Page 57
Measurement Mode
The Measurement Mode is an active data-collecting mode, which, for that reason, requires the
use of data acquisition hardware. The Measurement Mode can only be selected if a ZonicBook
or WaveBook is available.
The Measurement Mode acquires data using one of the following three methods: (1) Scope-
Continuous, (2) Scope-Single, and (3) Record.
The Scope-Continuous and Scope-Single methods display data, but do not log data. The
scope methods are useful for signal validation and checkout. The Record method, in addition
to displaying data, logs data-to-disk based on user-defined start and stop criteria.
In addition to being selected from the Task Menu, the Measurement Mode can be selected
from the Task Tool Bar by clicking the <Change Task Mode> button while in the Playback
Mode. Clicking this button from Measurement Mode will change the task mode tool bar to
Playback.
Change
Task Mode
Note that grayed-out buttons indicate that the associated function is not available due to a
prerequisite not being met.
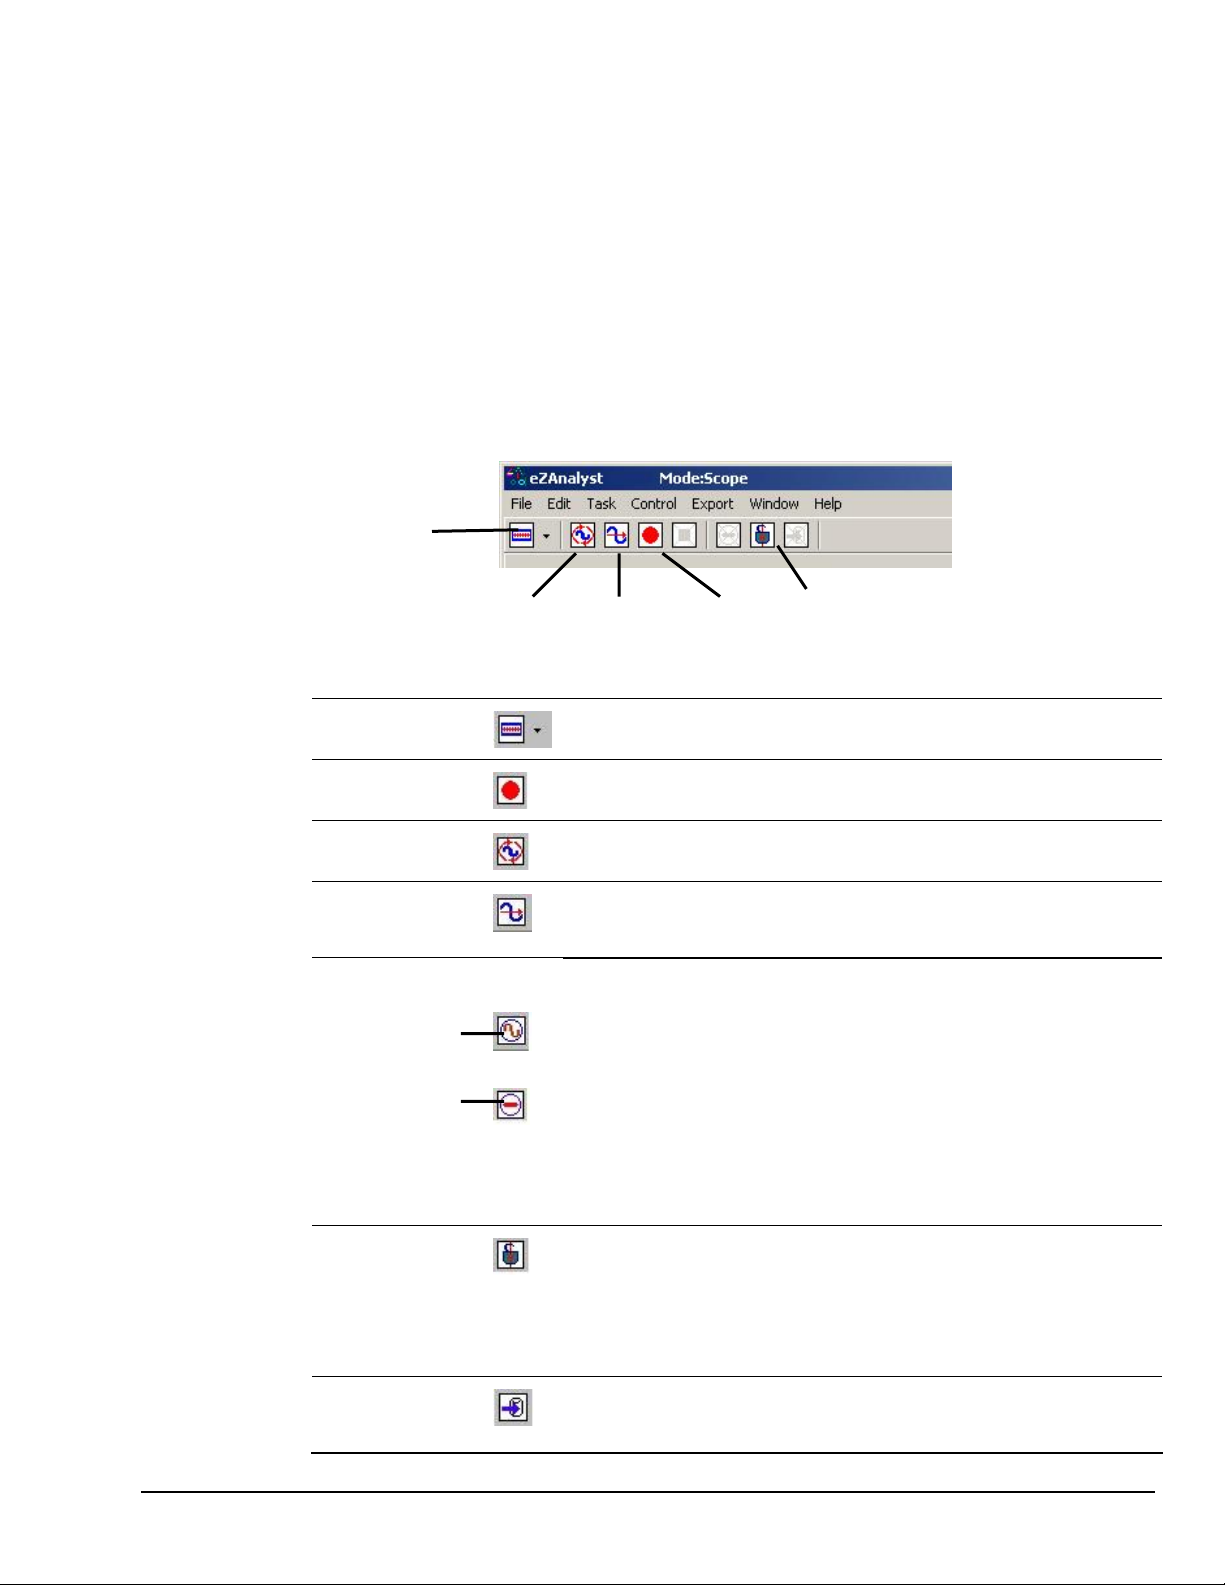
Change Task Mode
Scope-Continuous Scope-Single Record Cursor Lock
Measurement Mode Task Bar
Changes the task from Measurement Mode to Playback Mode.
The Task Bar buttons will change accordingly.
Record
Scope-Continuous
Scope-Single
Signal Generator
Indicates that
the Generator
is turned ON
Indicates that
the Generator
is turned OFF
Cursor Lock
Starts recording data-to-disk in continuous time. Note that a ZonicBook or
WaveBook must be used to acquire data.
Starts a block-time data acquisition. This scope method is typically used to
acquire impact data or to take measurements when data storage is not required.
Starts a single-time run data acquisition. This scope method is typically used
to acquire impact data or to take measurements when data storage is not
required.
The Signal Generator button toggles between two images and is on ly active when
hardware is present.
The sign wave button indicates that the generator is ON. Clicking on it will turn
the generator OFF and the button image will change to a circled red line,
indicating that the generator is OFF.
Clicking the button, while the “Off Status” image is present, will turn the Signal
Generator back ON, and will change the button to show th e sign wave image.
Note: For WaveBook and ZonicBook/618E applications you must set the
applicable output channel (that is to generate the signal) to “Active.” See
Output Channel Setup, in chapter 4.
An active cursor lock button will have the image of an opened or locked padlock.
When the padlock is locked (closed), cursors in multiple windows will be
synchronized and locked, providing that the windows are of the same time
domain, frequency domain, or have the same octave band data.
An opened padlock image indicates that cursors in multiple windows have
independent cursor movement, i.e., they are unsynchronized.
Export
This button exports data, if export conditions are set. For details, see th e
section, Export Menu> Function Data Set(s), in chapter 3.
eZ-Analyst Series 979595 Introduction 2-7
Page 58

Playback Mode
The Playback Mode does not require the presence of physical hardware. When in Playback,
eZ-Analyst is strictly a post-acquisition display and analysis program. Raw time-domain data,
that has been recorded-to-disk, can be played back for analysis repeatedly. For example, a
raw signal could be played back several times, each time using a different filtering algorithm
to manipulate the original signal. Once the desired results have been achieved the new data
can be exported in a new format and to a different file. The original file can remain
unchanged, and kept for future analysis.
To activate the Playback Mode, select Playback/Review on the Task Menu. An option is to click
the <Change Task Mode> button (the first button in the tool bar) while in the Measurement
Mode. If a WaveBook or ZonicBook is not available eZ-Analyst will automatically enter the
Playback mode and will display the data that was most recently recorded to disk.
Change
Task Mode
Play Backward, Play Backward Stop Play Play Forward
One Frame at a Time One Frame at a Time
A Word About Configuration
Playback Mode Task Bar
Configuring Input Channels
eZ-Analyst makes use of various menus and related windows for the purpose of configuration.
Chapter 4 is devoted exclusively to the Edit menu. It is that menu which provides access to
the Configuration Window (see figure). It is from that Configuration Window that the majority
of acquisition related settings are made. Other menus are discussed in the following chapter.
2-8, Introduction 979595 eZ-Analyst Series
Page 59

Menus 3
Foreword
In addition to use as a reference for eZ-Analyst, this chapter can also be used for
eZ-TimeView, and eZ-FrequencyView. However, there are many cases where a menu or
window does not apply to one or more of these “view” applications. In these instances,
functions or selection options that can not be used will be either “grayed-out” or hidden in
the actual application. The table on page 2-2 can be used as a quick reference as to what
features apply to a particular application.
The menus, with exception of the Task Menu and the Edit Menu, are presented in the
order that they appear on eZ-Analyst’s main window. The Task Menu is discussed first
since it is from this menu that the user (1) selects Measurement Mode or Playback
Mode and (2) makes use of the Auto-Ranging feature for input channels.
The Edit Menu is perhaps the most significant of all eZ-Analyst menus. It is used
frequently and has roughly 40 pages of support documentation. For this reason the Edit
Menu is discussed in a separate chapter.
Reference Note:
Refer to chapter 4 for information regarding the Edit Menu.
Note that the “view” programs have no Task Menu. This is because they actually have
only one task, “Playback Mode.”
Contents
Task Menu (eZ-Analyst Only)…… 3-2
Measurement Mode…….3-2
Playback Mode…….3-3
* Input Range (Auto/Manual)……..3-3
Calibration………..3-6
File Menu …… 3-10
Control Menu …… 3-10
Export Menu …… 3-11
Window Menu …… 3-13
Edit Menu …… see chapter 4
* The Input Range selection appears in the Task Menu for ZonicBook Medallions. For
WaveBooks and for ZonicBook/618E the AutoRange function is accessed via the
<AutoRange> button on the “Input Channels Tab.” The tab is reached via the
Configurations Window [accessed via the Edit pull-down menu].
Notes:
¾ eZ-Analyst only applies to ZonicBook Medallions, ZonicBook/618E, and WaveBook devices.
¾ LogBooks, DaqBoards, DaqBooks, ChartScans, etc., can use a “view” application such as
eZ-TimeView, eZ-FrequencyView, or eZ-PostView.
¾ The operational differences between the use of eZ-Analyst in ZonicBook Medallion,
ZonicBook/618E, and WaveBook are minor. The differences are noted when of importance
to the user.
eZ-Analyst 979595 Menus 3-1
Page 60

Task Menu eZ-Analyst Only
Task Menu > Measurement Mode
The Measurement Mode is an active data-collecting mode, which, for that reason, requires the
use of data acquisition hardware. The Measurement Mode can only be selected if a ZonicBook
Medallion, ZonicBook/618E, or WaveBook is available; otherwise, eZ-Analyst will run in the
Playback Mode.
The Measurement Mode acquires data using one of the following three methods:
(1) Scope-Continuous, (2) Scope-Single, and (3) Record.
The Scope-Continuous and Scope-Single methods display data, but do not log data. The scope
methods are useful for signal validation and checkout. The Record method, in addition to
displaying data, logs data-to-disk based on user-defined start and stop criteria.
In addition to being selected from the Task Menu, the Measurement Mode can be selected from
the Task Tool Bar by clicking the <Change Task Mode> button while in the Playback Mode.
Clicking this button from Measurement Mode will change the task mode tool bar to Playback.
Change
Task Mode
Scope-Continuous Scope-Single Record Cursor Lock
Measurement Mode Task Bar
Note that grayed-out buttons indicate that the associated funct ion is not available due to a prerequisite not being met.
Change Task
Mode
Changes the task from Measurement Mode to Playback Mode.
The Task Bar buttons will change accordingly.
Record
Scope-Continuous
Scope-Single
Signal Generator
Indicates that
the Generator
is turned ON
Indicates that
the Generator
is turned OFF
Cursor Lock
Starts recording data-to-disk in continuous time. Note that a ZonicBook or
WaveBook must be used to acquire data.
Starts a block-time data acquisition. This scope method is typically used to
acquire impact data or to take measurements when data storage is not required.
Starts a single-time run data acquisition. This scope method is typically used
to acquire impact data or to take measurements when data storage is not required.
The Signal Generator button toggles between two images and is on ly active when
hardware is present.
The sign wave button indicates that the generator is ON. Clicking on it will turn the
generator OFF and the button image will change to a circled red line, indicating
that the generator is OFF.
Clicking the button, while the “Off Status” image is present, will turn the Signal
Generator back ON, and will change the button to show th e sign wave image.
Note: For WaveBook applications you m ust set the applicable output channel
(that is to generate the signal) to “Active.” See, Output Channel Setup in chapter 4.
An active cursor lock button will have the image of an opened or locked padlock.
When the padlock is locked (closed), cursors in multiple windows will be
synchronized and locked, providing that the windows are of the same time domain,
frequency domain, or have the same octave band data.
An opened padlock image indicates that cursors in multiple windows have
independent cursor movement, i.e., they are unsynchronized.
Export
This button exports data, if export conditions are set. For details, see the section,
Export Menu> Export Function Data.
3-2 Menus 979595 eZ-Analyst
Page 61

Task Menu > Playback / Review Mode
The Playback Mode does not require the presence of physical hardware. When in Playback,
eZ-Analyst is strictly a post-acquisition display and analysis program. Raw time-domain data,
that has been recorded-to-disk, can be played back for analysis repeatedly. For example, a raw
signal could be played back several times, each time using a different filtering algorithm to
manipulate the original signal. Once the desired results have been achieved the new data can
be exported in a new format and to a different file. The original file can remain unchanged, and
kept for future analysis.
To activate the Playback Mode, select Playback/Review on the Task Menu. An option is to click
the <Change Task Mode> button (the first button in the tool bar) while in the Measurement
Mode. Also, note that when a WaveBook or ZonicBook is not available, eZ-Analyst will
automatically enter the Playback mode and will display the data that was most recently
recorded to disk.
Change
Task Mode
Play Backward, Play Backward Stop Play Play Forward
One Frame at a Time One Frame at a Time
Playback Mode Task Bar
Task Menu > Input Range (Auto/Manual) *
Auto-ranging is a procedure that automatically sets the input full-scale voltage (FSV) range for
input channels. The FSV is set by measuring a representative sample of real-time data. Autoranging is only performed on active channels.
WaveBook and ZonicBook/618E Applications
Auto-ranging works best if you supply the maximum expected voltage range for the data that
will be captured during the acquisition. Therefore, make the Auto Range Duration long enough
to apply a typical signal. The maximum duration is 65535 mSecond. Also, make sure that the
Auto Range Analysis Frequency is fast enough to capture the high frequency component.
Typically the Analysis Frequency will be the same setting as eZ-Analyst’s Acquisition Analysis
Frequency.
AutoRange Dialog Box, from a WaveBook
Note that the AutoRange Dialog Box for ZonicBook/618E looks similar.
* You can access the dialog box for WaveBook and ZonicBook/618E by clicking the <Auto Range>
button, which is located on the Input Channels tab, when in the “Measurement Mode.”
eZ-Analyst 979595 Menus 3-3
Page 62

ZonicBook Medallion Applications
Auto-ranging works best if you supply the maximum expected vol tage range for the data that will be
captured during the acquisition.
For ZonicBook Medallion the AutoRa nge window can be accessed from the Task pull-down menu when in
Measurement Mode. The window has four basic sections: Mode panel, Starting FSV panel, Channel Gauges,
and a %, FSV, Factors Display d
isplay.
Channel Active, if checked
Current Full Scale Voltage (FSV)
% of Full Scale
AutoRange Display, from a ZonicBook Medallion
Mode
The Mode panel consists of three radio buttons, which are used to select one of the following
range modes: AutoRange(%), AutoRange(V), or ManualRange(V).
Starting FSV
The Starting FSV (Full Scale Voltage) panel consists of three radio buttons, which are used to
set the starting FSV to Maximum, Minimum, or Current.
Channel Gauges
The channel gauges, one per channel, display the instantaneous peak value as percentage or
voltage, depending on the mode that was selected. The color of the vertical bar has the
following significance:
Yellow The signal range is from 0 to the minimum Full-Scale Voltage set in the Auto-range Setup
Green The signal range is from the minimu m to the maximum of the Full-Scale Voltage set in the
Red The signal range is over the maximum of the Full-Scale Voltage set in the Auto-range Setup
window.
Auto-range Setup window.
window.
3-4 Menus 979595 eZ-Analyst
Page 63

%, FSVF, & Factors Display
Maximum FSV is the high-end limit for the input voltage.
Note that 25.7 V is the highest possible FSV for a ZonicBook
Medallion.
Minimum FSV is the low-end limit for the input voltage. In
the figure at the right Minimum FSV is set to 0.2 volts.
HI Accept % defines the highest acceptable percentage of peak input voltage for the
selected FSV, i.e., Current, Minimum, or Maximum. Thus, if our selected FSV was 0.2 V
and we had an upper limit of 90%; then our upper limit in volts would be 0.18 V. An
example follows as to how exceeding this value causes a range adjustment.
LO Accept % defines the lowest acceptable percentage of peak input voltage for the
selected FSV, i.e., (Current, Minimum, or Maximum). Thus, if our selected FSV was 0.2 V
and we had a lower limit of 10%; then our actual low limit in volts would be .02 V.
Incr Factor (Increasing Factor) is the factor by which the Current FSV will increase,
should the peak exceed the upper limit. In the figure we see that the Increasing factor is
1.5.
Decr Factor (Decreasing Factor) is the factor by which the Current FSV will decrease,
should the peak not reach the lower limit. Keeping the decrease factor at “1” will result in
no decrease of the Current FSV. Setting the Decrease Factor to 0.8 would cause the
Current FSV to decrease to 80% of its value if the peak fell short of the low limit.
Note: These are the same values that were entered in the Vpeak column in the Channel Setup
window. The values are immediately replaced when the Auto ranging process begins.
An Example of Auto-Ranging
Maximum FSV set at 25.7 V
Minimum FSV set at 0.2 V
Upper Limit set at 90%
Lower Limit set at 10%
Increasing Factor set at 1.5
Decreasing Factor set at 1
In the first iteration we see
that we have a peak of 0.19 V.
This falls outside of our band of
0.02 to 0.18 V that was
established by our upper and
lower limit percentages; i.e.,
90% of the Current FSV and
10% of the FSV.
As a result, the Current FSV is increased by a factor of 1.5 (our Increasing Factor) and the
Current FSV becomes 0.30 V. Our limits, in volts, also changed since we are now looking
at percentages of 0.30 volts instead of the same percentages of 0.20 volts.
In the second iteration of our example, we see a 0.22 volt peak. This value is within our
established limits so the Current FSV does not change.
Note 1: If the Capture Mode is the Input Channel (Trigger Mode), the Auto Range process waits for a
trigger.
Note 2: A Start FSV of Minimum or Maximum can selected instead of Current FSV, as in our example.
Minimum FSV is the default.
In this example we have set the radio button for
Current FSV instead of Minimum or Maximum
(note 2). The starting value, in the example, is 0.20 V.
An Example of Auto-Ranging
eZ-Analyst 979595 Menus 3-5
Page 64
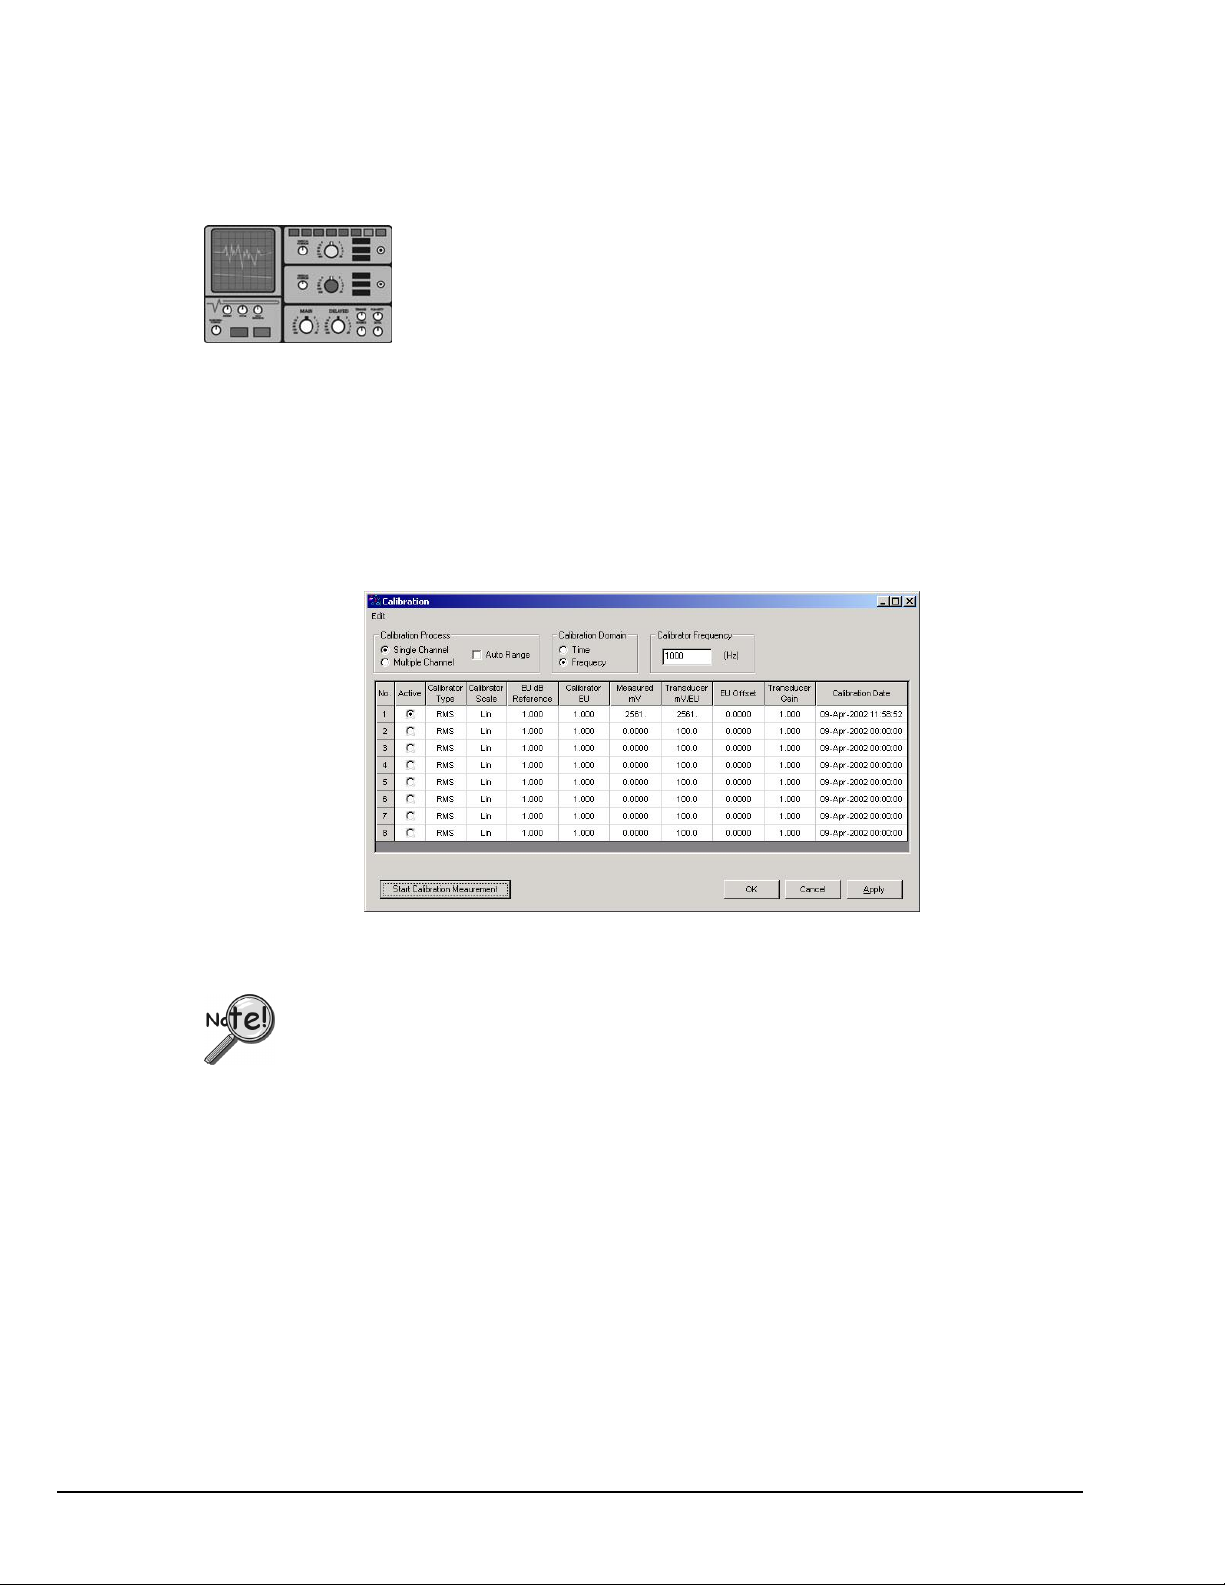
Task Menu > Calibration
When calibration is performed, a signal of known Peak level [or RMS value] is supplied to a
transducer that is connected to an active input channel. An accelerometer calibrator or piston
phone is typically used to generate the calibration signal for vibration sensors and microphones,
respectively.
eZ-Analyst includes a Calibration window for selecting the channels to be calibrated and for
entering several signal-related parameters. In addition, the calibration is actually started from
the window.
When you are in “Measurement Mode” you can access the Calibration window from the Task
Menu or from the Input/Output Channels tab.
Examples:
Accelerometer calibrators typically make use of linear engineering
units and, as their name implies, are used for calibrating
accelerometers.
Piston phones are most often used for calibrating microphones. Piston
phones typically make use of decibel (dB) engineering units.
Calibration Display Screen
¾ When a channel is calibrated, the number of averages used will be 5, or
the number that is designated in the “No. of Averages” field (located on
the Analyzer Tab). The greater of the two values will be used,
automatically.
¾ When a channel is calibrated, the blocksize of the acquisition will
automatically be 4096, or the blocksize value that is stated on the
Analyzer Tab, providing it is 4096
or higher.
A discussion of the various regions of the Calibration window now follows.
The section concludes with an example.
3-6 Menus 979595 eZ-Analyst
Page 65

Calibration Process
Single
Channel
Multiple
Channel
Auto Range The Auto-Range calibration process is only available for ZonicBook
Used to select one active channel at a time. When the calibrator only
has one channel output, the Single Channel method must be used.
When Single Channel is selected, the “Active” column shows a radio
button next to each channel.
Used to select two or more channels for simultaneous calibration.
This is only an option when the calibrator offers more than one
output. When Multiple Channel is selected, the “Active” column
shows a checkbox next to each channel.
Medallion applications. Auto-range sets the input full-scale voltage
(FSV) range for the input channels to be calibrated. FSV is
determined by measuring a representative sample of real-time data.
Calibration Domain
With the use of Fourier Transform, any signal can be viewed from a time domain or a
frequency domain. Either domain can be selected for use in the calibration process.
Time
Frequency The overall value is computed with frequency domain data by
The overall value is computed using time domain data.
summing up frequency component of FFT spectrum.
Calibrator Frequency (Hz)
This field is used to enter the frequency setting of the calibrator. The analysis frequency,
which is twice this frequency, is used if possible. Otherwise, the maximum allowed
analysis frequency is used.
Columns on the Calibration Window
No. This column displays channel numbers [1, 2, 3, … etc.] for easy
reference to their associated cells. The channel numbers, being for
display indication only, are fixed and can not be edited.
Active When “Single Channel” is selected, you can click on a radio button
in the “Active” column to enable one channel for calibration. When
the calibration is complete, select the radio button for the next
channel to be calibrated.
When “Multiple Channel” is selected, the radio buttons are
replaced by checkboxes. Ensure that each channel to be calibrated
has the associated box checked, and that the remaining channels
remain unchecked. For multiple channel applications note that you
can click on the column label, i.e., the word “Active” to
simultaneously check or uncheck all channel checkboxes in the
column.
Note: The channel settings in the Calibration window are
independent of the selections that appear in the Input
Channel Setup window. Only active channel shows up at
calibration window.
eZ-Analyst 979595 Menus 3-7
Page 66

Calibrator
Type
Peak Uses the peak amplitude of the spectrum around the specified frequency of the
RMS
Calibrator
Scale
This column is used to select Peak or RMS* as the calibrator type. Highlight a
cell, or range of cells, in the grid, then select Peak or RMS from the popup
menu.
calibration signal.
Uses a compensated overall level calculation to determine the RMS level of the
calibration signal, as specified in the Units field.
*RMS – Root-mean-square, is the square root of the arithmetic mean of the
squares of a set of numbers.
This column is used to select the calibrator scale to linear or to decibel.
Lin
Select Lin if the calibra t o r is in l in e a r sc a le.
Select dB if the calibrator scale is dB.
dB
Note: While there are several definitions to dB, in our application we are
using dB to express the ratio of the magnitudes of two quantities equal
to 20 times the common logarithm of the ratio.
The formula for dB is:
dB = 20 log (x/dBEUref)
EU dB
Reference
This field is used to enter the Engineering Units dB reference.
dB EU Reference is applied to displayed data when the Y-axis scale is set to dB.
This is valid only for frequency domain data.
Note: The dB Reference (Volt) can be changed simultaneously for all channels
from the associated entry box in the FFT Setup Tab. The tab is accessed
from the Configuration Window [via the Edit pull-down menu].
dB = 20 log (x/dBEUref)
The formula for dB display for Autospectrum, Cross Spectrum, and PSD is:
dB =10 log [x/((dBEUref)^2)]
The formula for dB display for Unaveraged Spectrum, Averaged Spectrum, and
FRF is:
Calibrator
EU
Measured
mV
Transducer
mV/EU
This field is used to set the Calibrator’s Engineering Units.
Displays the measured value of the channel in milli-volts.
The Transducer mV/EU value can be entered manually, or by the
measurement process. Highlight a cell, or cells, in the grid before typing a
value in the data entry box. Then press the <OK> button to accept the
value. All other fields linked to this value are updated when the value is
accepted.
mV/EU= Volts/Units * Transducer Gain
EU Offset EU Offset is used for DC signal compensation. Offset is added to, or
subtracted from the measured EU value.
3-8 Menus 979595 eZ-Analyst
Page 67

Transducer
Gain
Calibration
Date
Start
Calibration
Measurement
Transducer Gain is used as auxiliary scaling to compensate for the
transducer amplifier gain. Gain is a multiplied function.
This column displays the date and time of the last calibration. If any
channel value changes, even if the original number is restored, the
calibration date and time are automatically removed for that channel.
Clicking this button starts the calibration process for all selected channels.
At the completion of the calibration, the measured mV and the Transducer
mV/EU value for the applicable channels are automatically updated.
Calibration Procedure, an Example
Accelerometer type - Piezotronics 303A03
Calibrator - Piezotronics 394B05 - 1.02 G (RMS) at 80Hz
Unit of acceleration - in/sec^2
Note: 1.02 G RMS is equivalent to 393.811 in/sec^2 (1G=386.089in/sec^2).
This is a linear scale, thus we will be selecting Lin in the Calibrator Scale column.
In this example we will be calibrating channel 1.
1. Attach the accelerometer to the calibrator (signal source). Connect the other end of the
accelerometer cable to the channel 1.
2. Set the FSV into a proper range (i.e. 32.4 mV) in the Input Channels Setup window,
then click the <Apply> button.
3. Set the desired blocksize in the Analyzer Tab if a block size of greater than 4096 is
desired.
4. Set the “No. of Averages” in the Analyzer Tab if an average count of greater than 5 is
desired.
5. Open the Calibration Window from the Task Menu, or from the Input/Output Channels
Tab.
6. Select “Single Channel.”
7. Select “Auto Range,” if desired.
8. Select a Calibration domain. In this case, either “Time” or “Frequency” can be selected.
9. Enter 80 Hz in the Calibrator Frequency field.
10. Ensure the radio button for Channel 1 is enabled (in the Active column.)
11. Select RMS for the Calibrator Type.
12. Select Linear in the Calibrator Scale field.
13. Leave EU dB Reference set at 1.000. Note that this step can be skipped when linear
scale is used.
14. Set Calibrator EU at 1.02 ; implying an engineering unit of 1G.
15. Enter 393.811 in the Transducer mv/EU field.
16. Leave the EU Offset at 0.0000. We are assuming no offset in this example.
Leave 1.000 as the Transducer Gain. No amplifier or attenuator is being used in our
17.
example.
18. Click <Apply> so your new values will not be lost.
19. Click the <Start Calibration Measurement> button to begin calibration.
eZ-Analyst 979595 Menus 3-9
Page 68

File Menu
The File Menu provides a means to print plotted data, as well as open, save, and export data
files.
Open Time History Data (.thd or .dsc)
Used to locate and open saved files.
• ZonicBook Medallions use files with .thd extensions.
• ZonicBook/618E uses files with .dsc extensions.
• WaveBooks use files with .dsc extensions.
Save [or Open] Multiple Data Set (.mds)
These two menu items provide a means of saving [or opening] function files. Time and autospectrum data is saved. If there is any reference channel cross-spectrum is saved for all
channel pairs. The file extension is .mds.
Save [or Recall] Hardware Setup (.set)
These two menu items provide a means of saving [or recalling] current settings and processing
conditions. In addition, .thd files and .mds files can be used to recall setup conditions,
because these file-types include setup conditions in addition to measured data. Note that only
the setup condition is recalled.
Save [or Recall] Plot Setup (.pset)
These two menu items provide a means of saving [or recalling] the current plot condition, such
as window locations and window content, including: channel numbers, function type, axis-type,
and range. These files can be recalled at a later date to process customized plot conditions.
Without user intervention, the plot setup file is automatically saved with .mds, .dsc, and .thd
files.
You can have plot setups automatically recalled whenever you recall data
files. To select this option, open the Preferences window [accessed through
the Edit pull-down menu] and check the box labeled “Recall Plot Setup When
Recall Data Files.”
The standard print window associated with your specific computer will open. Select a printer
and the number of copies needed before clicking <OK>.
Note: In regard to printing, black plot backgrounds changed to white.
Authorization
Opens an Authorization Dialog box that provides a means of entering an authorization code to
enable the features of purchased software, i.e., eZ-FrequencyView, eZ-TimeView, or eZ-
Analyst. The dialog box includes an option to run a 30-day trial version of eZ-Analyst.
Exit
This menu item closes the eZ-Analyst application.
Control Menu
The Control Menu provides the same functionality as do the Task Bar buttons, which differ
depending on whether eZ-Analyst is in Measurement or Playback mode. The buttons are
typically used in place of the Control Menu selections, as they are visible and can be accessed
immediately, as opposed to opening a menu and then making a selection. Should you desire to
use the Control Menu, refer to the Measurement Mode and Playback Mode sections of chapter 2.
Applies to eZ-Analyst, eZ-TimeView, & eZ-FrequencyView
3-10 Menus 979595 eZ-Analyst
Page 69
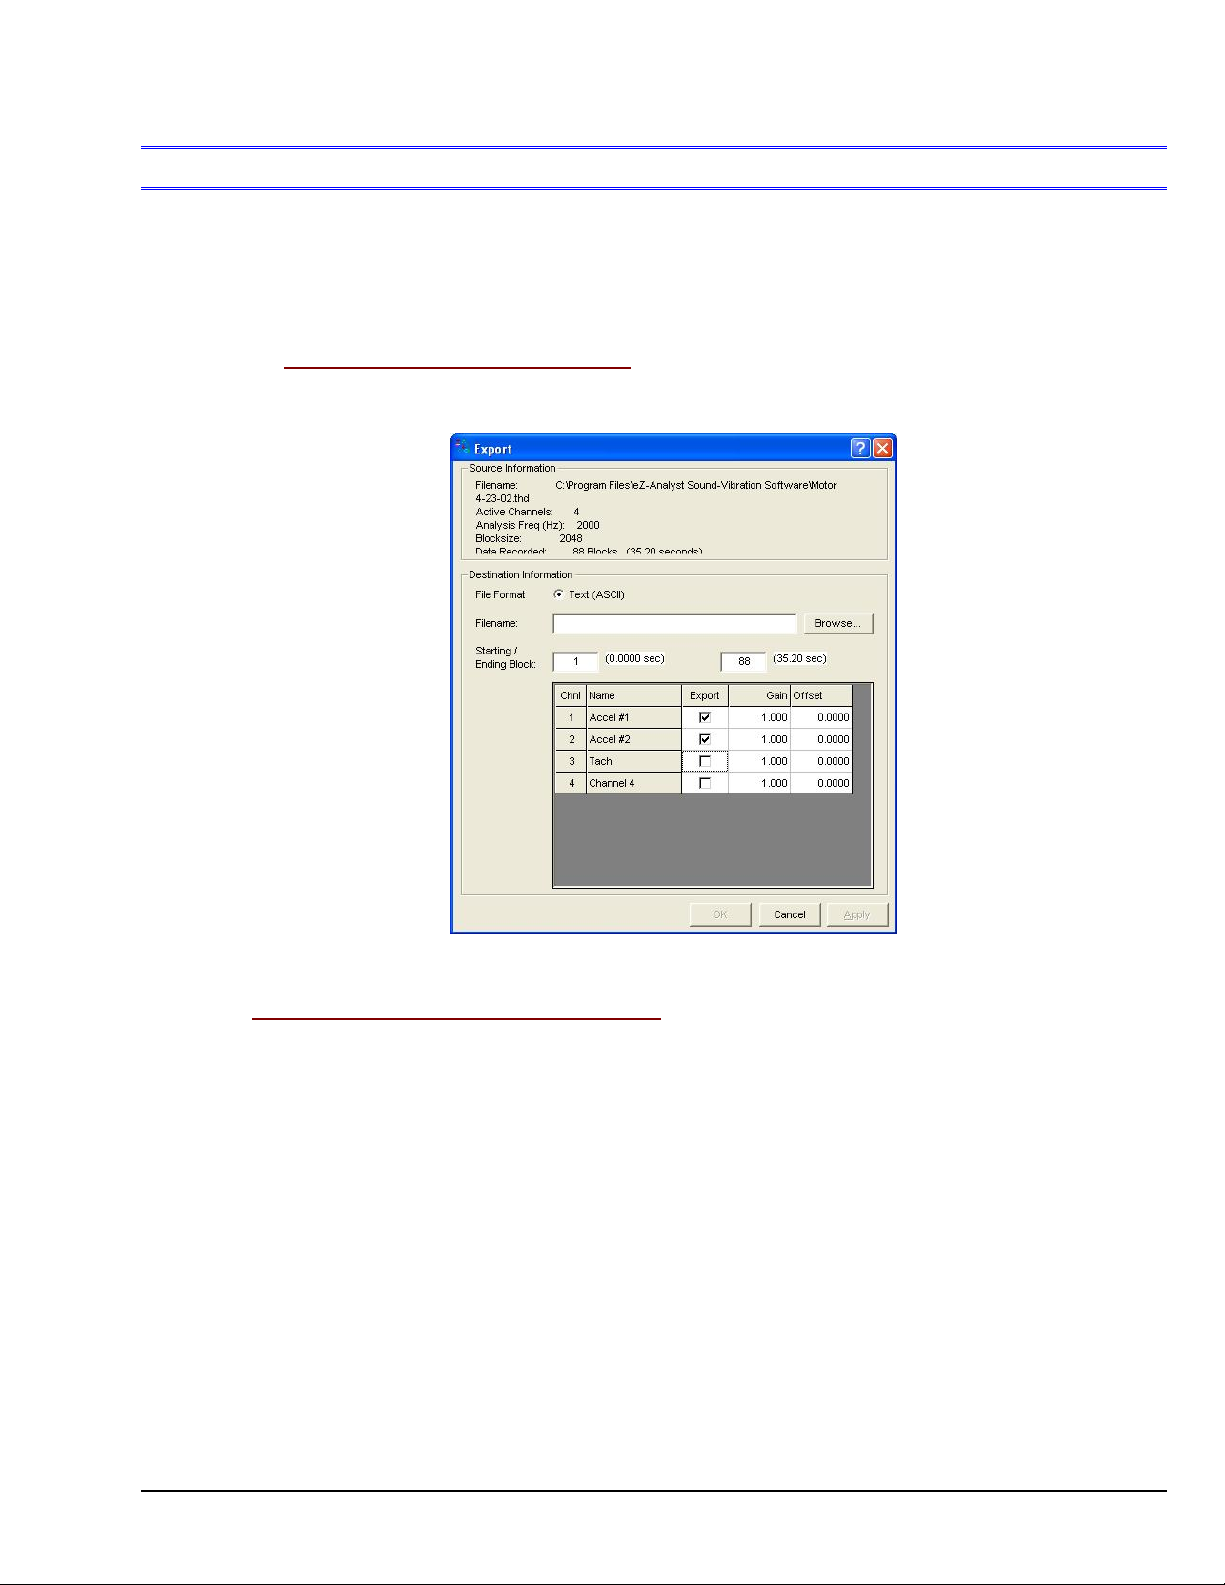
Export Menu
Applies to eZ-Analyst, eZ-TimeView, & eZ-FrequencyView
Export Menu > Time History Data …
This window is used to export recorded files. For ZonicBook Medallion, files can be exported as
THD (Binary) files or as Text (ASCII) files. WaveBook and ZonicBook/618E files are only
exported as Text (ASCII) files.
Source Information Panel
This panel, located at the top of the window, contains basic information about the source file
(see figure).
Export Window
Destination Information Panel
1. If you are using ZonicBook Medallion, select the type of file you want. If you are using a
WaveBook or a ZonicBook/618E, then the only choice of file format is Text (ASCII).
• THD (Time History Data), Binary
• Text (ASCII)
2. In the Filename data entry box, type the directory path and file name for the recorded
file, or use the <Browse> button to locate the desired file. The correct file extension will
be appended to the file name later, when the <OK> button is clicked.
3. Specify the First (Starting) and Last (Ending) records (blocks) that you want saved. In
the first figure above, “1” is specified for the Starting Block and “88” is specified for the
Ending Block.
4. Specify the channels of interest. Click to place a checkmark in the channel box for each of
the channels you want to export. The selected channels will be adjusted to continuous
channels starting with channel 1, but all the properties [including labels] will retain the old
definition. For example, selected channels 1,3,5,6,8,16 would be adjusted to channels
1,2,3,4,5,6 in the exported file.
5. If desired, change the gain and/or offset values on a per-channel basis.
6. Click the <OK> button.
eZ-Analyst 979595 Menus 3-11
Page 70
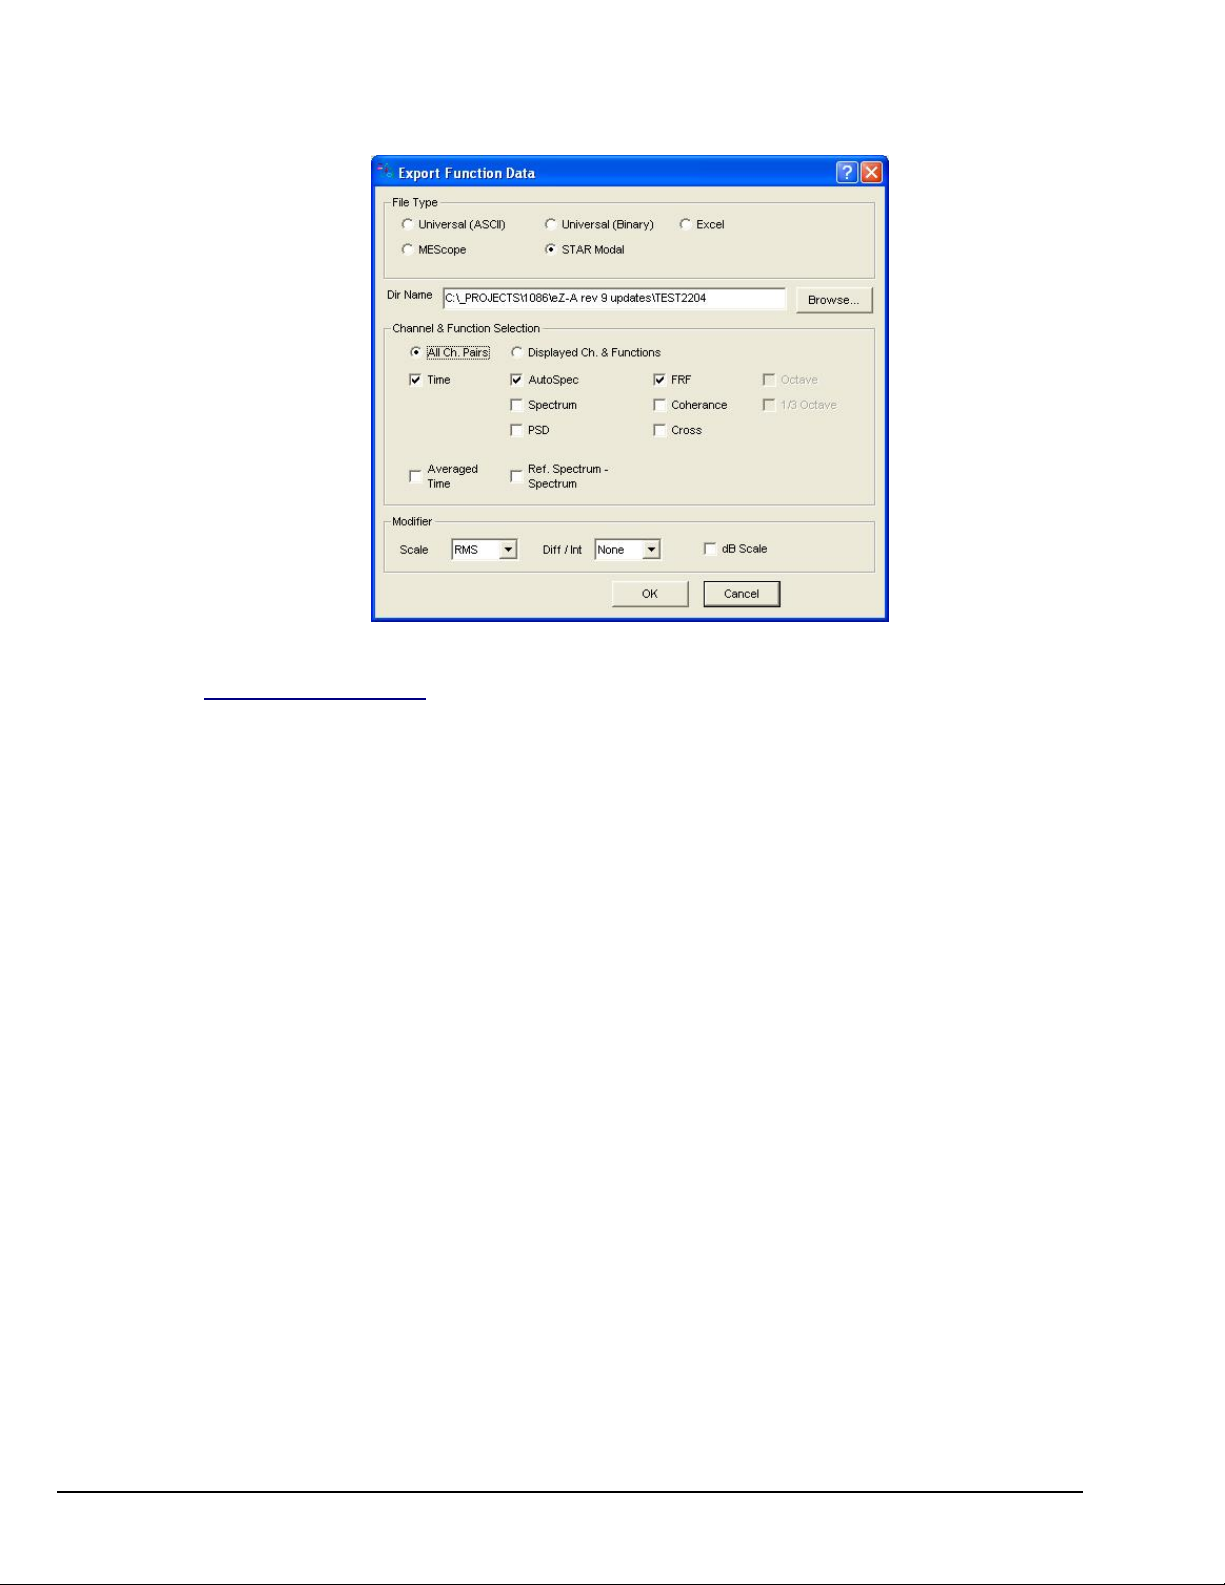
Export Menu > Function Data Set(s)*
This menu item is for exporting function files.
Export Function Data
*View-Program Users: The Export Function Data Screen has a slightly different appearance
in eZ-TimeView and eZ-FrequencyView and does not apply to eZ-PostView.
1. Select the type of file you want.
2. Type the directory path and file name for the function file, or use the <Browse> button to
locate the desired file.
3. If you want to have records automatically appended to the specified file, select Automatic
Save after Averaging.
4. Specify either All Ch. Pairs, or Displayed Ch. & Functions.
• All Ch. Pairs - exports all the data for all the channels pairs so that all functions
can be retrieved if desired.
• Displayed Ch. & Functions - exports only the data for the displayed functions.
5. Click to place a checkmark by each of the functions to be saved. See the following note.
6. Click <OK>.
Note: Selected functions can not be saved without the display of a warning prompt. This is in
case the selection is not valid. For example: if the functions FRF, Cross, and Coherence
were selected, but no reference channels were selected, then the three functions could
not be saved. This is because these three functions require a reference channel.
3-12 Menus 979595 eZ-Analyst
Page 71
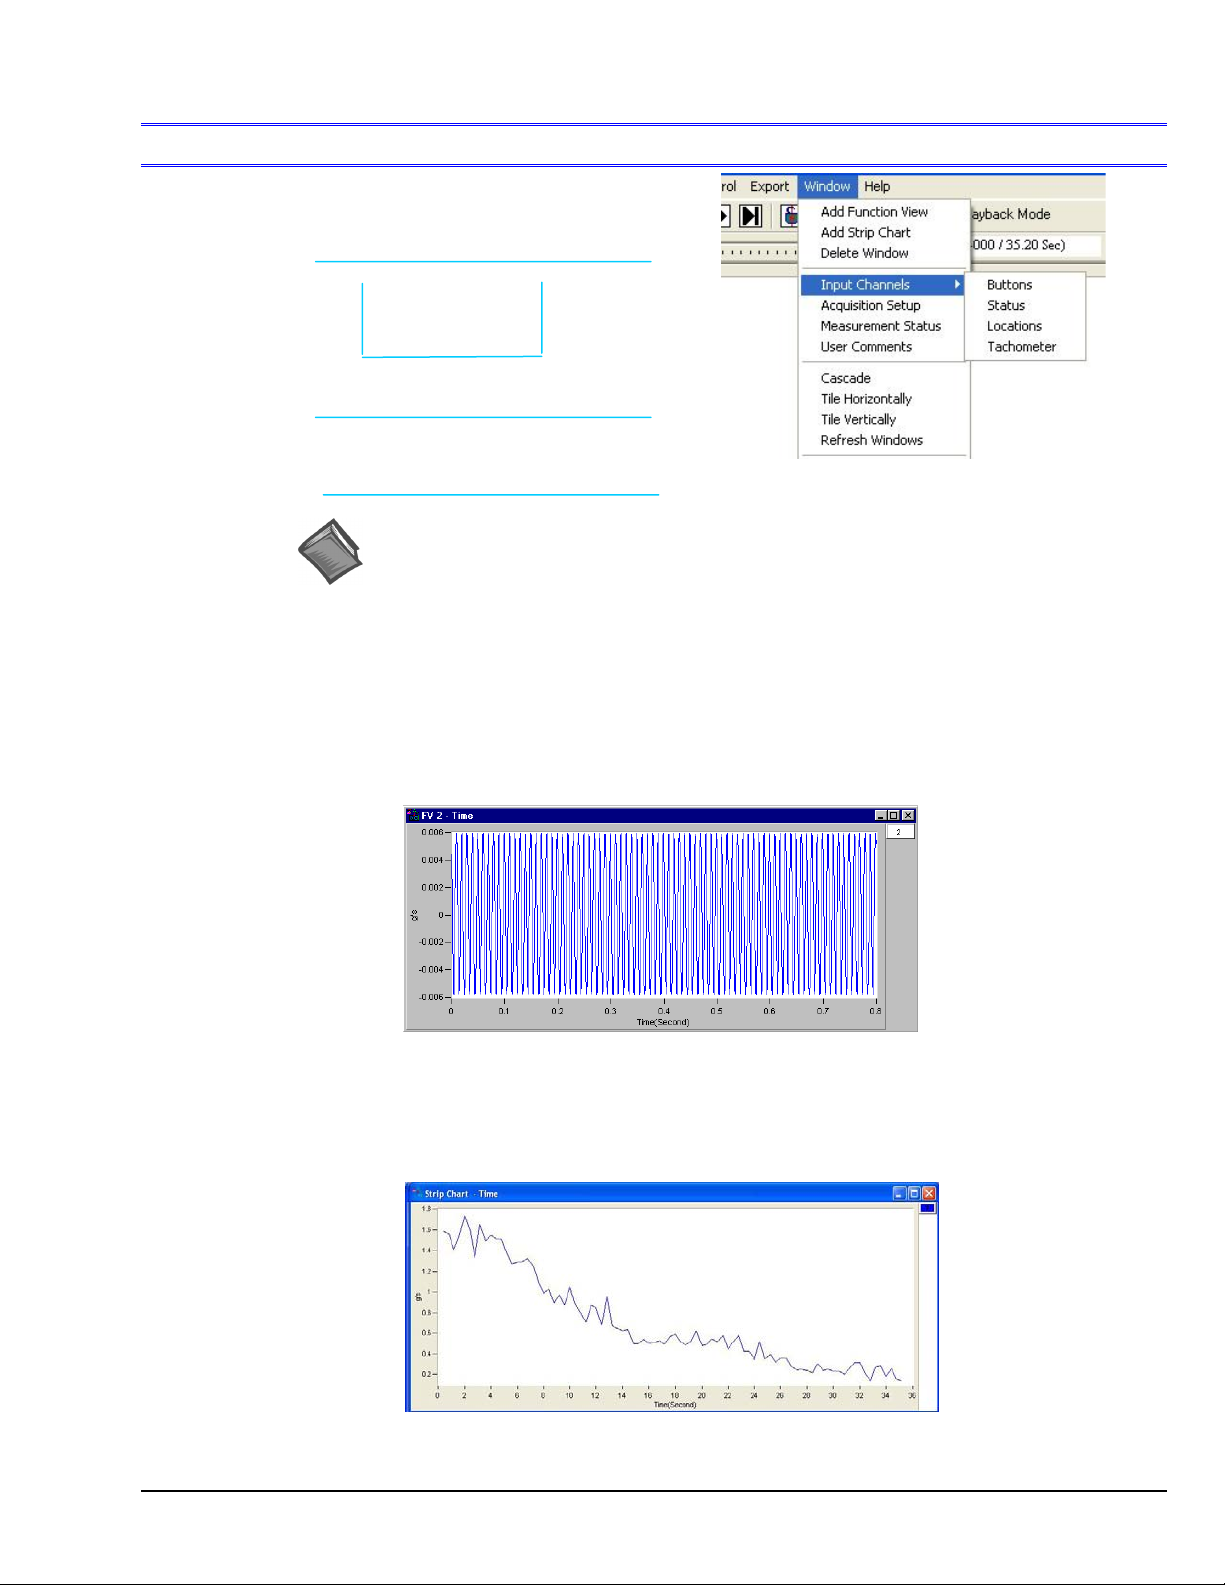
Window Menu
Menu Items
Add Function View (FV) …… 3-13
Add Strip Chart …… 3-13
Delete Window …… 3-14
Input Channels …… 3-14
Acquisition Setup …… 3-16
Measurement Status …… 3-17
User Comments ……3-17
Cascade …… 3-18
Tile Vertically …… 3-18
Tile Horizontally ……3-19
Refresh Windows …… 3-19
Buttons ……3-14
Status …… 3-14
Locations….… 3-15
Tachometer …… 3-15
Reference Note:
For information regarding the interactive features of Plot Display Windows,
including the Graphic Toolbar buttons, refer to chapter 5. The interactive features
are not selected from the Window Menu, but are accessed via toolbar buttons, the
mouse and/or hotkeys. Appendix A provides tables of the various hotkey
functions.
Window Menu > Add Function View (FV)
This menu selection opens an additional plot window.
Example of an Added Function View
Window Menu > Add Strip Chart
This menu selection opens a strip chart plot window. This feature does not apply to
eZ-PostView.
Example of an Added Strip Chart
eZ-Analyst 979595 Menus 3-13
Page 72
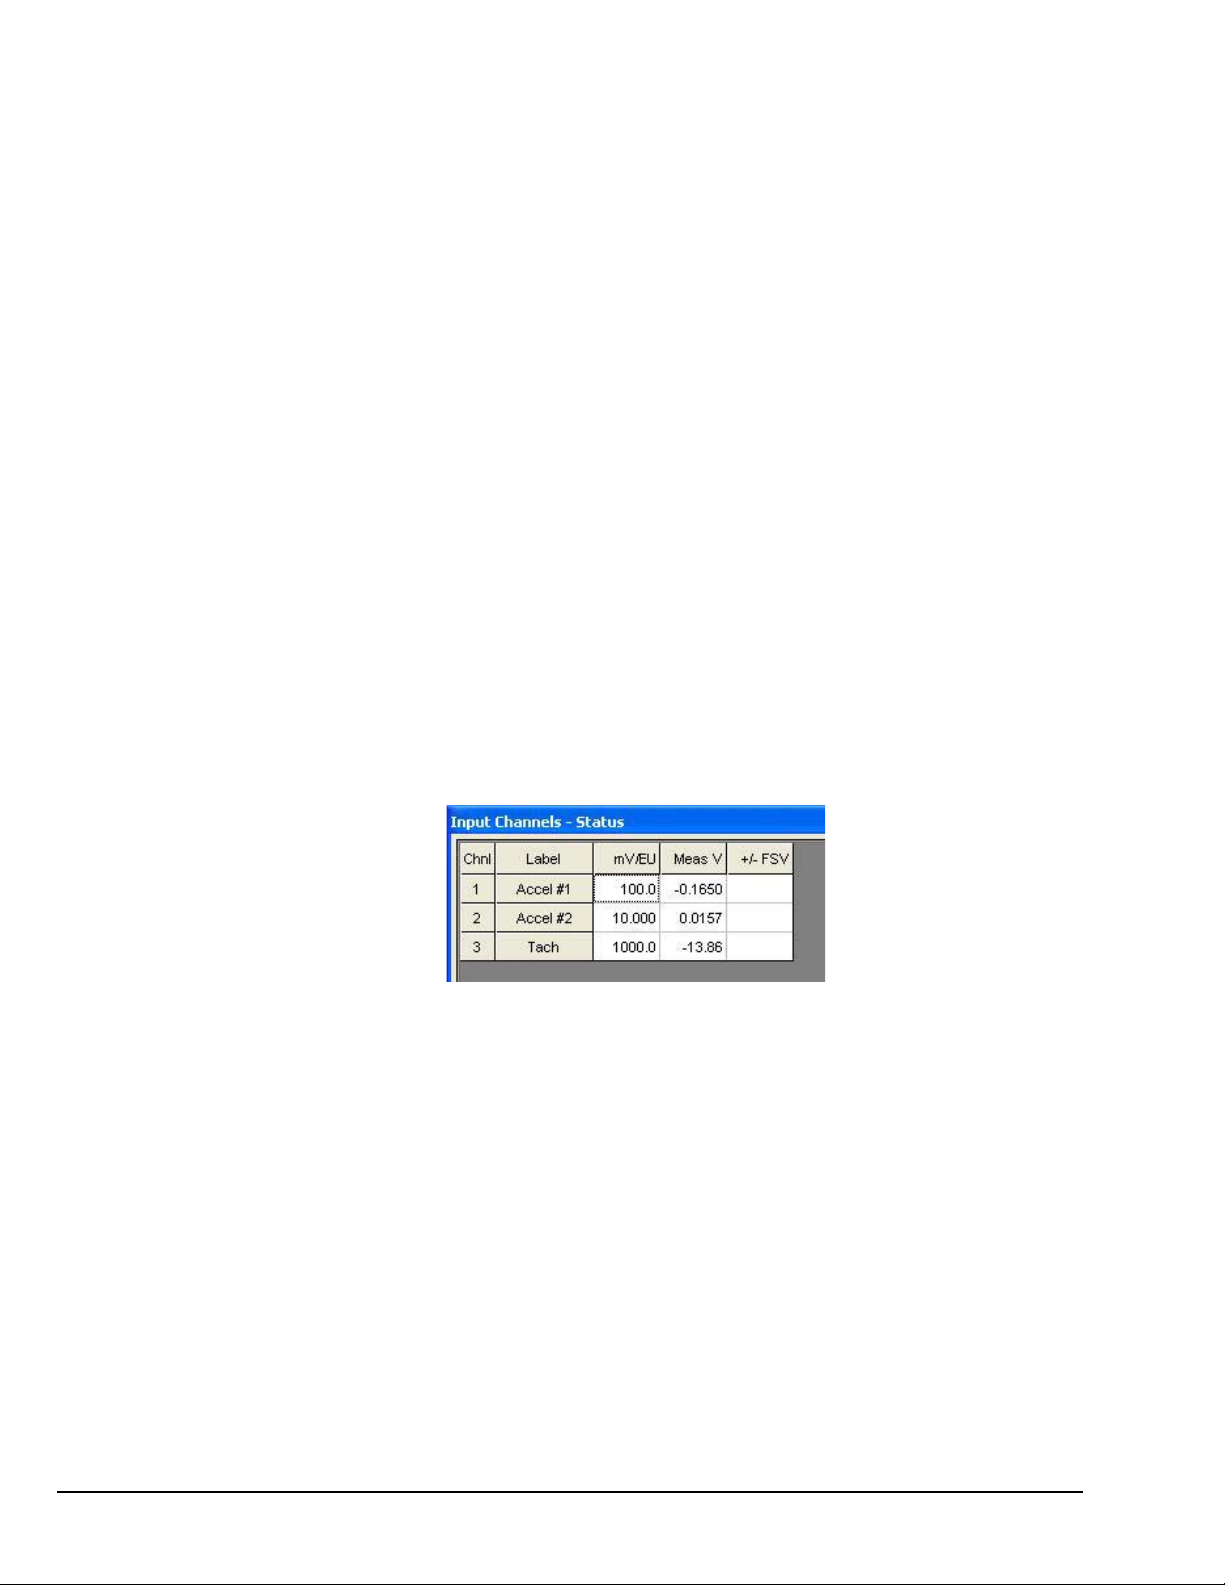
Window Menu > Delete Window
Deletes the window that is currently in focus. When multiple plot windows are open, one is
always the “focus window. When a window does not have focus, its title bar is dimmed. To
change the “focus window,” simply click on top or side border of the window of interest.
Window Menu
Buttons
Status
> Input Channels
The Input Channels window is selected from the eZ-Analyst Windows pull-down menu. This
Window only applies to eZ-Analyst.
When selected, “Buttons” removes the channel button boxes from the toolbar and displays
them in a floating window. The buttons are used in the exact same manner as when they were
located on eZ-Analyst’s main window. Removing the checkmark from “Buttons” places the
channel buttons back onto the toolbar. Note that the <Input Channel Buttons> button [located
on the toolbar, just to the left of where the channel buttons reside] provides the same
functionality. See chapter 5 for location.
• To add a channel: use the mouse to click and drag a channel box from the
complete channel button display into the plot area.
• To remove a channel: use the mouse to click and drag a channel box (from the
right-side of the plot) into the plot area.
The Status dialog box (following figure) uses a chart to indicate the followings:
• Volts linear
• percent of the Full-Scale Voltage (FSV)
The status box includes “maximum” bars to show the highest level of signal value reached by
each channel during the measurement process.
Status
+/- FSV The Full-Scale Voltage
Delta % The percentage difference between the measured voltage
Meas V
Measured Voltage
and the Full-Scale voltage, such that Meas V is n% of FSV;
with n being the value of Delta %.
3-14 Menus 979595 eZ-Analyst
Page 73

Locations
This window displays the current modal locations. The window only applies to eZ-Analyst and
to eZ-FrequencyView.
Modal Locations Window
As it appears in eZ-Analyst
Modal Locations Window
As it appears in eZ-FrequencyView
Clicking on the left or right arrow keys [ <Up> or <Down> buttons in eZ-FrequencyView]
increments or decrements the modal locations based on the bank setup criteria set in the
Configuration - FFT Setup Tab. The change in locations is dependent upon the active reference
and response channels, and whether Response Increase or Reference Increase is selected.
Tachometer
Tachometer
as seen in eZ-Analyst
Tachometer
as seen in eZ-TimeView
and in eZ-FrequencyView
This window displays three fields: tachometer channel number, measurement, and units.
Tachometer channels are set up in the Input Channels Window. See the Tach Channels
section of chapter 4 for additional information. Tachometer does not apply to eZ-PostView.
eZ-Analyst 979595 Menus 3-15
Page 74

Window Menu
> Acquisition Setup Applies to eZ-Analyst Only
Selecting “Acquisition Setup” brings up a display of setup information pertaining to the
acquisition, e.g., Analysis Frequency, Blocksize, Trigger, Mode, etc.
Acquisition Setup
3-16 Menus 979595 eZ-Analyst
Page 75
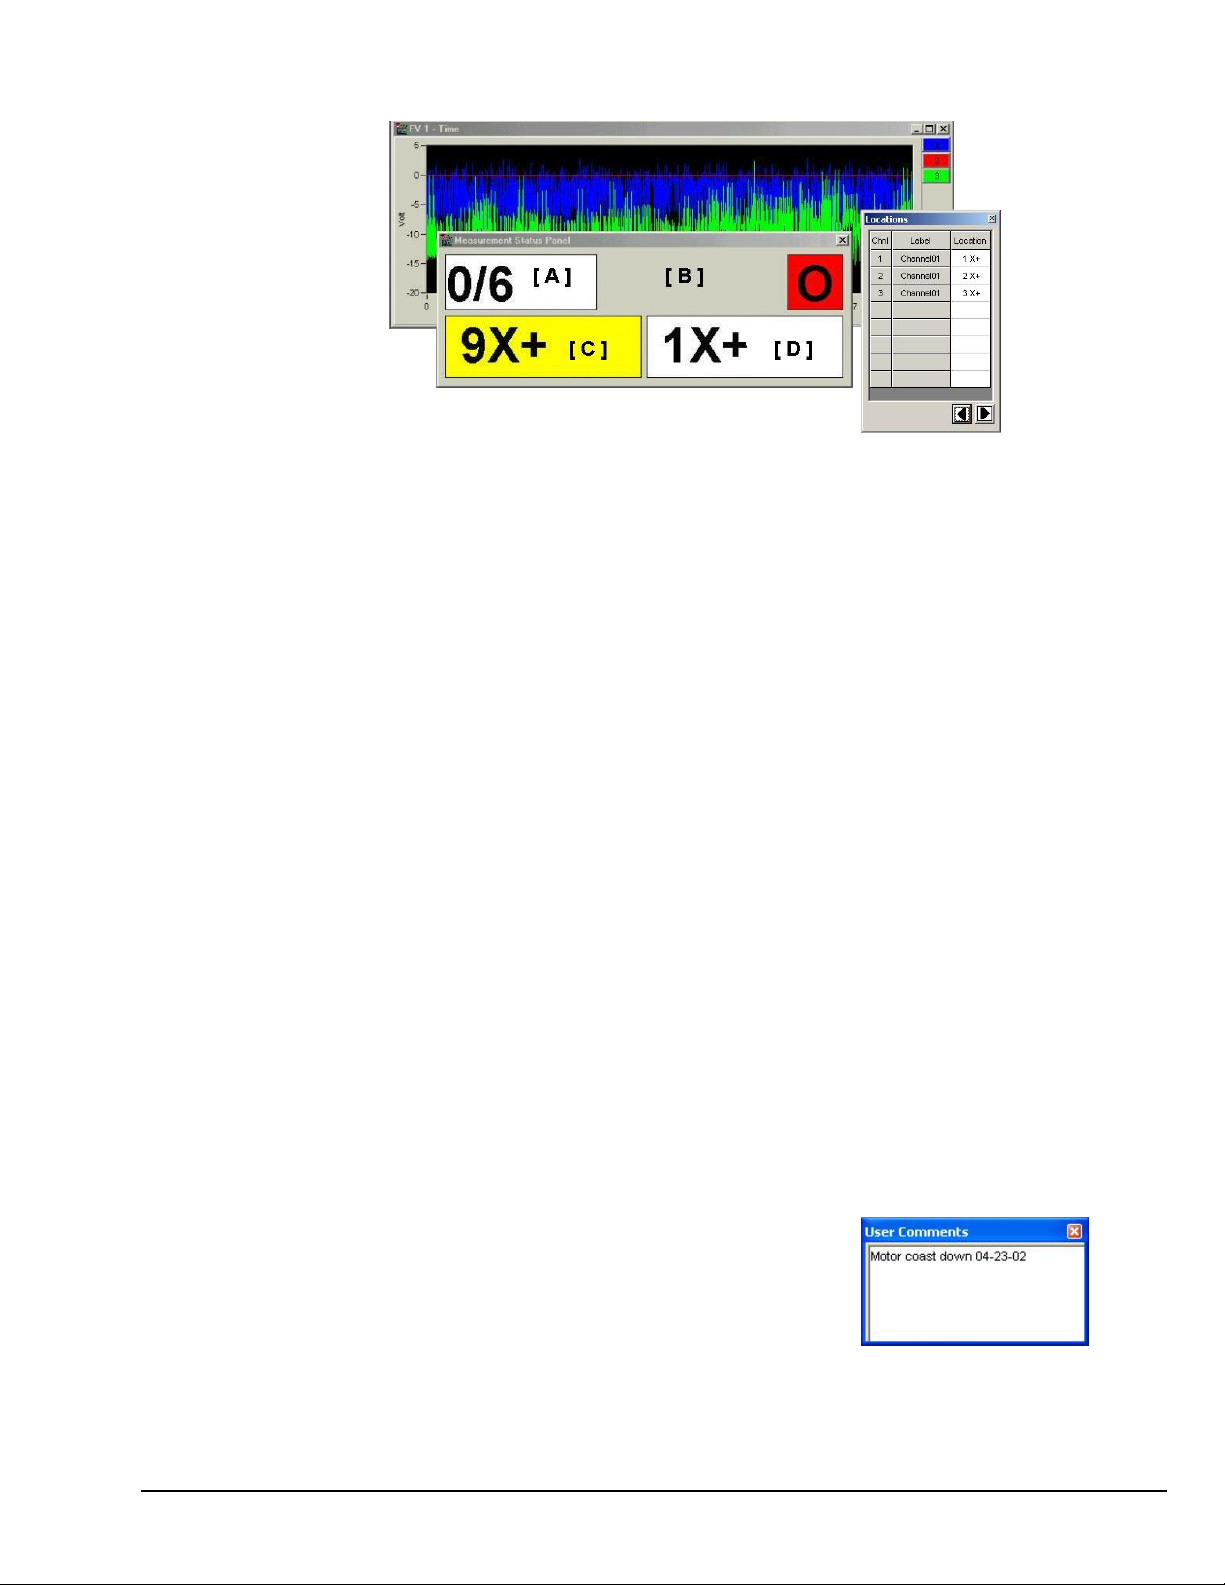
Window Menu > Measurement Status Panel Applies to eZ-Analyst Only
The Measurement Status Panel and Modal Locations Window
on Top of a Plot Window
Note: The bracketed letters pertain to definitions provided in the following text.
The Measurement Status Panel only applies to eZ-Analyst. The panel provides basic, but
important information, including trigger and processing conditions, and reference and response
coordinates. Status Areas of the panel are as follows:
[A] – Averaging Status. Displays the number of measurements completed followed by the total
number of measurements. For example, “1/6” indicates that 1 of 6 measurements has
been completed.
[B] – Trigger/Processing Status. Displays the following:
T – Triggered
W- Waiting for Trigger
S – Saved the data
C – Completed measurement
O – Overload rejected
D (with yellow background) – Double Hammer Rejected
[C] – First Response Coordinate. Shows the channel number and the modal location. (Note 1)
[D] – First Reference Coordinate. Shows the channel number and the modal location. (Note 1)
Note 1: A Response or a Reference Coordinate with a yellow background indicates that the
field is used for the “increasing” method. For example, the Response Field (figure,
item “C”) with a yellow background means that the response increase method is
being used. This is discussed in the FFT Setup Tab section of chapter 4.
Note 2: Measurement Status indicators are disabled when recording.
The large size of the status areas allows the user to see the measurement status from a
relatively long distance, i.e., as compared to the very limited viewing range offered by
standard-sized GUI text display fields. The feature has proven useful in one-man “impacttesting” operations pertaining to modal type measurements.
Window Menu
Selecting “User Comments” brings up a size-adjustable
dialog box, which consists of a text field. User Comments
provides the user a means by which he or she may review
previous comments and add new ones.
eZ-Analyst 979595 Menus 3-17
> User Comments
Page 76

Window Menu
Window Menu
> Cascade
When you have multiple plot windows open, this menu selection arranges them on you screen
as shown.
Example of using Cascade with three Plot Windows
> Tile Vertically
When you have multiple plot windows open, this menu selection arranges them on your screen
as shown. The Graph Toolbar, discussed in chapter 5, includes a button to allow for quick
vertical tiling. Refer to that chapter for button descriptions and locations.
Example of using Vertical Tile with two Plots
Each plot is longer in the “vertical” direction.
3-18 Menus 979595 eZ-Analyst
Page 77

Window Menu > Tile Horizontally
When you have multiple plot windows open; this menu selection arranges them on your screen
as shown. The Graph Toolbar, discussed in chapter 5, includes a button to allow for quick
horizontal tiling. Refer to that chapter for button descriptions and locations.
Example of using Horizontal Tile with two Plots
Each plot is longer in the “horizontal” direction.
Window Menu > Refresh Windows
Used to refresh a window; for example, to refresh a Strip Chart. In this case, the refresh
function blanks out the present Strip Chart, essentially providing you with a new, clean window.
eZ-Analyst 979595 Menus 3-19
Page 78

3-20 Menus 979595 eZ-Analyst
Page 79

Edit Menu 4
Foreword
In addition to use as a reference for eZ-Analyst, this chapter can also be used for
eZ-TimeView, and eZ-FrequencyView. However, there are many cases where a menu or
window does not apply to one or both of these “view” applications. In these instances,
functions or selection options that can not be used will be either “grayed-out” or hidden
in the actual application. The table on page 2-2 can be used as a quick reference as to
which features apply to a particular application.
The Edit Menu provides a means of configuring eZ-Analyst in regard to both functionality
and appearance. The menu contains the following selections:
Configuration Window …… 4-2
Analyzer Tab …… 4-4
Input Channels Tab …… 4-13
Analog Input Channels …..4-14
Tach Channels ….. 4-16
Recording Setup Tab …… 4-18
Block Rejection Tab …… 4-22
Octave Setup Tab …… 4-24
FFT Setup Tab …… 4-26
Output Channel Setup ….. 4-33
Playback Setup Window …… 4-37
Display Preferences Window …… 4-39
Notes:
¾ eZ-Analyst only applies to ZonicBook Medallions, ZonicBook/618E, and WaveBook
devices.
¾ LogBooks, DaqBoards, DaqBooks, ChartScans, etc., can use a “view” application
such as eZ-TimeView, eZ-FrequencyView, or eZ-PostView.
¾ The operational differences between the use of eZ-Analyst in ZonicBook Medallion,
ZonicBook/618E, and WaveBook are minor. The differences are noted when of
importance to the user.
eZ-Analyst 969795 Edit Menu 4-1
Page 80

Edit Menu >
Configuration . . .
Configuration provides a means of changing the majority of eZ-Analyst settings in regard to
collecting data and in determining how the collected data is manipulated. The Configuration
selection displays the Configuration Window with one of several tab dialogs. Possible tab
displays for both eZ-Analyst and the “view” programs are as follows:
Edit Menu > Configuration Window
Tabs in eZ-Analyst Corresponding Tabs of the
“View” Programs
Analyzer…… 4-4 Acquisition Setup
Input Channels …… 4-13 Input Channels
Recording Setup…… 4-18 n/a
Block Rejection……4-22 n/a
Octave Setup …… 4-24 Octave Setup
FFT Setup……4-26 Miscellaneous
Does not apply to eZ-PostView.
Does not apply to eZ-TimeView.
Does not apply to eZ-PostView.
4-2 Edit Menu 969795 eZ-Analyst
Page 81
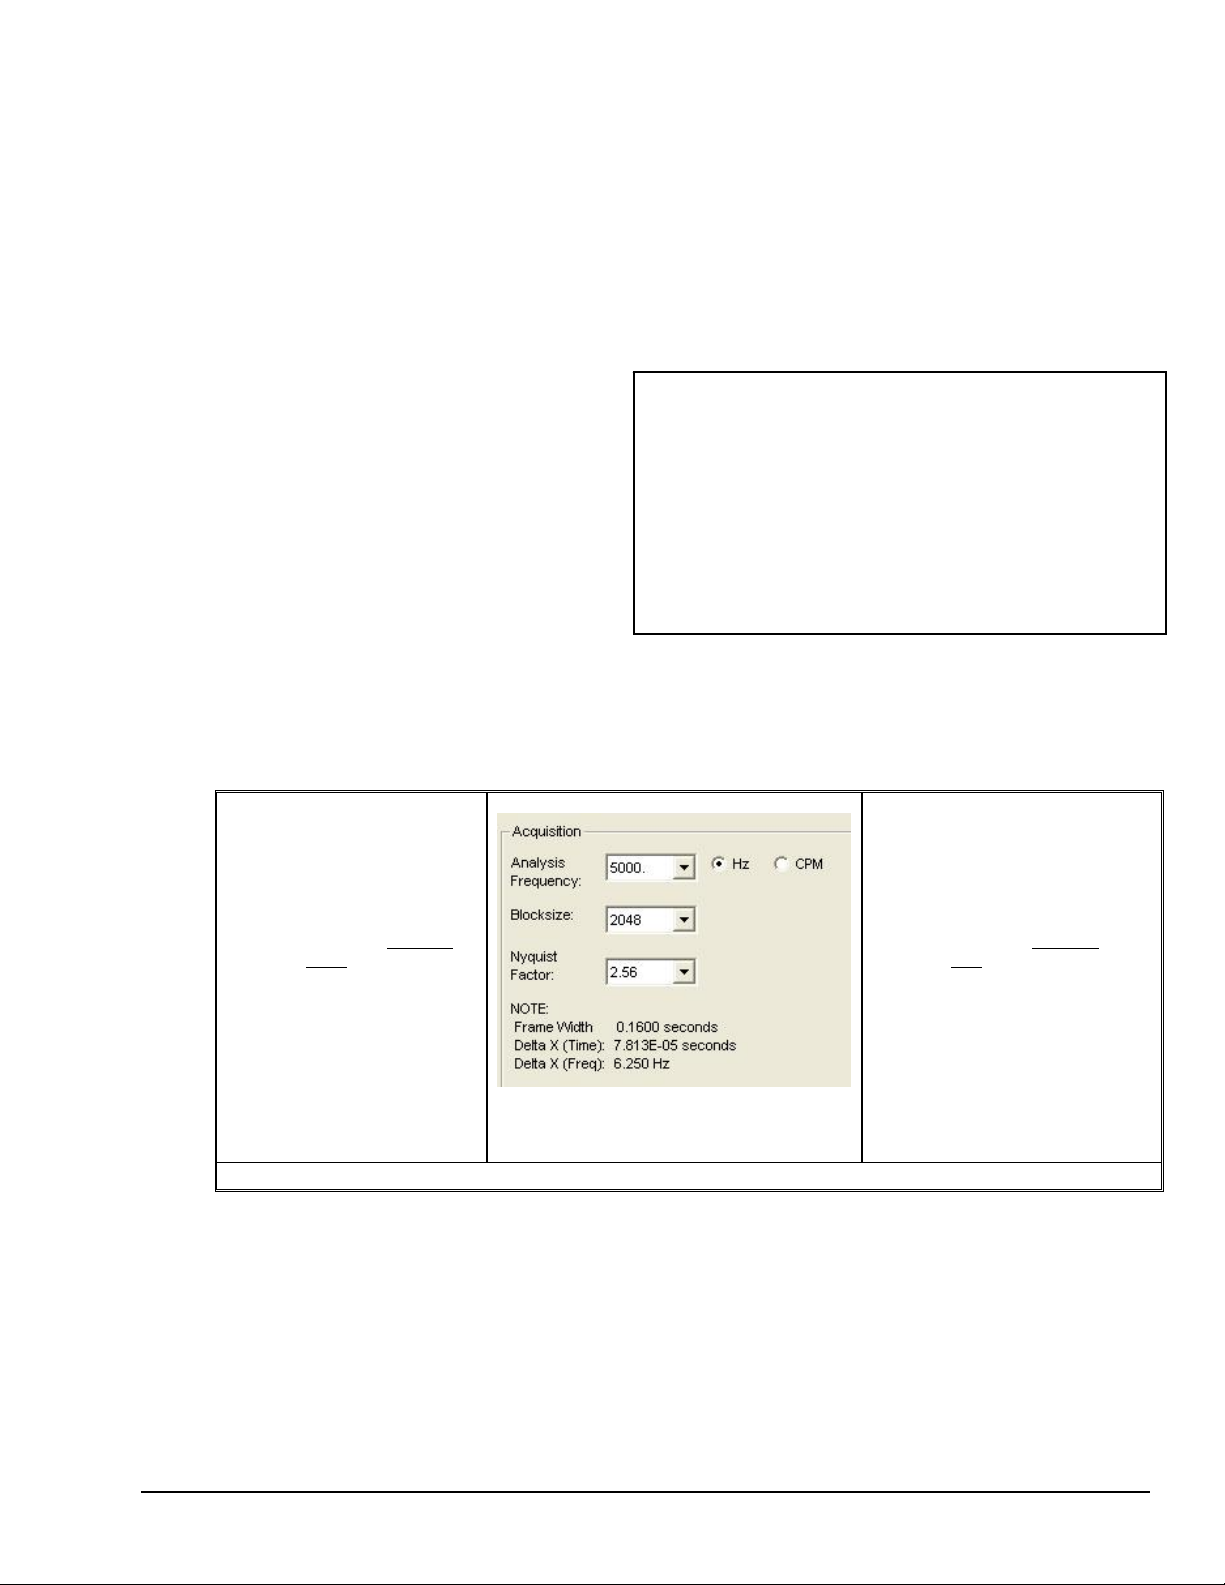
A Note Regarding Frequency Resolution
This note pertains to frequency resolution and is related to the values seen in the Analyzer Tab’s
Acquisiton Panel (next two figures). The frequency resolution is related to the Analysis Frequency
(bandwidth), Blocksize (the number of data points in one block of data), and the Nyquist factor (a
user-selected variable). The following equations apply.
w = b / 2.56f
Where:
w = Frame Width
b = Blocksize
2.56 is one of 3 selectable
Nyquist Factors. The other
two are: 5.12 and 10.24
f = Analysis Frequency
Delta X (Frequency) = 1/w
Where:
Delta X (Frequency) is the frequency resolution
w = Frame Width
With these equations we can see how the Frame Width and Delta X (Frequency) are calculated.
With other factors unchanged . . .
¾ Increasing Blocksize increases Frequency Resolution.
¾ Increasing Analysis Frequency decreases Frequency
Resolution.
¾ Increasing the Nyquist Factor decreases Frequency
Resolution.
The lower the “Delta X” frequency, the higher the
Frequency Resolution. Thus, a Delta X (Freq.) of 6.25
Hz indicates a higher frequency resolution than does a
Delta X (Freq.) of 100 Hz.
Example 1 (see figure)
2.56 is being used for the
value of the variable.
Given:
Analysis Frequency 5000 Hz
Blocksize 2048
w = b / 2.56f
= 2048 / (2.56)(5000)
= 0.16 seconds
Delta X (Freq) = 1/w
= 1 / 0.16
= 6.25 Hz
Note: A Delta X (Freq.) of 6.25 Hz indicates a higher frequency resolution than a Delta X (Freq.) of 100 Hz.
The values shown pertain to example 1.
Acquisition Panel on
the Analyzer Tab
Example 2 (no figure)
2.56 is being used for the value
of the variable.
Given:
Analysis Frequency 5000 Hz
Blocksize 128
w = b / 2.56f
= 128 / (2.56)(5000)
= 0.01 seconds
Delta X (Freq) = 1/w
= 1 / 0.01
= 100 Hz
Higher frequency resolutions indicate that the signal trace will be based on more data points for a
given time frame. The higher the frequency resolution, the smoother the trace will be.
eZ-Analyst 969795 Edit Menu 4-3
Page 82
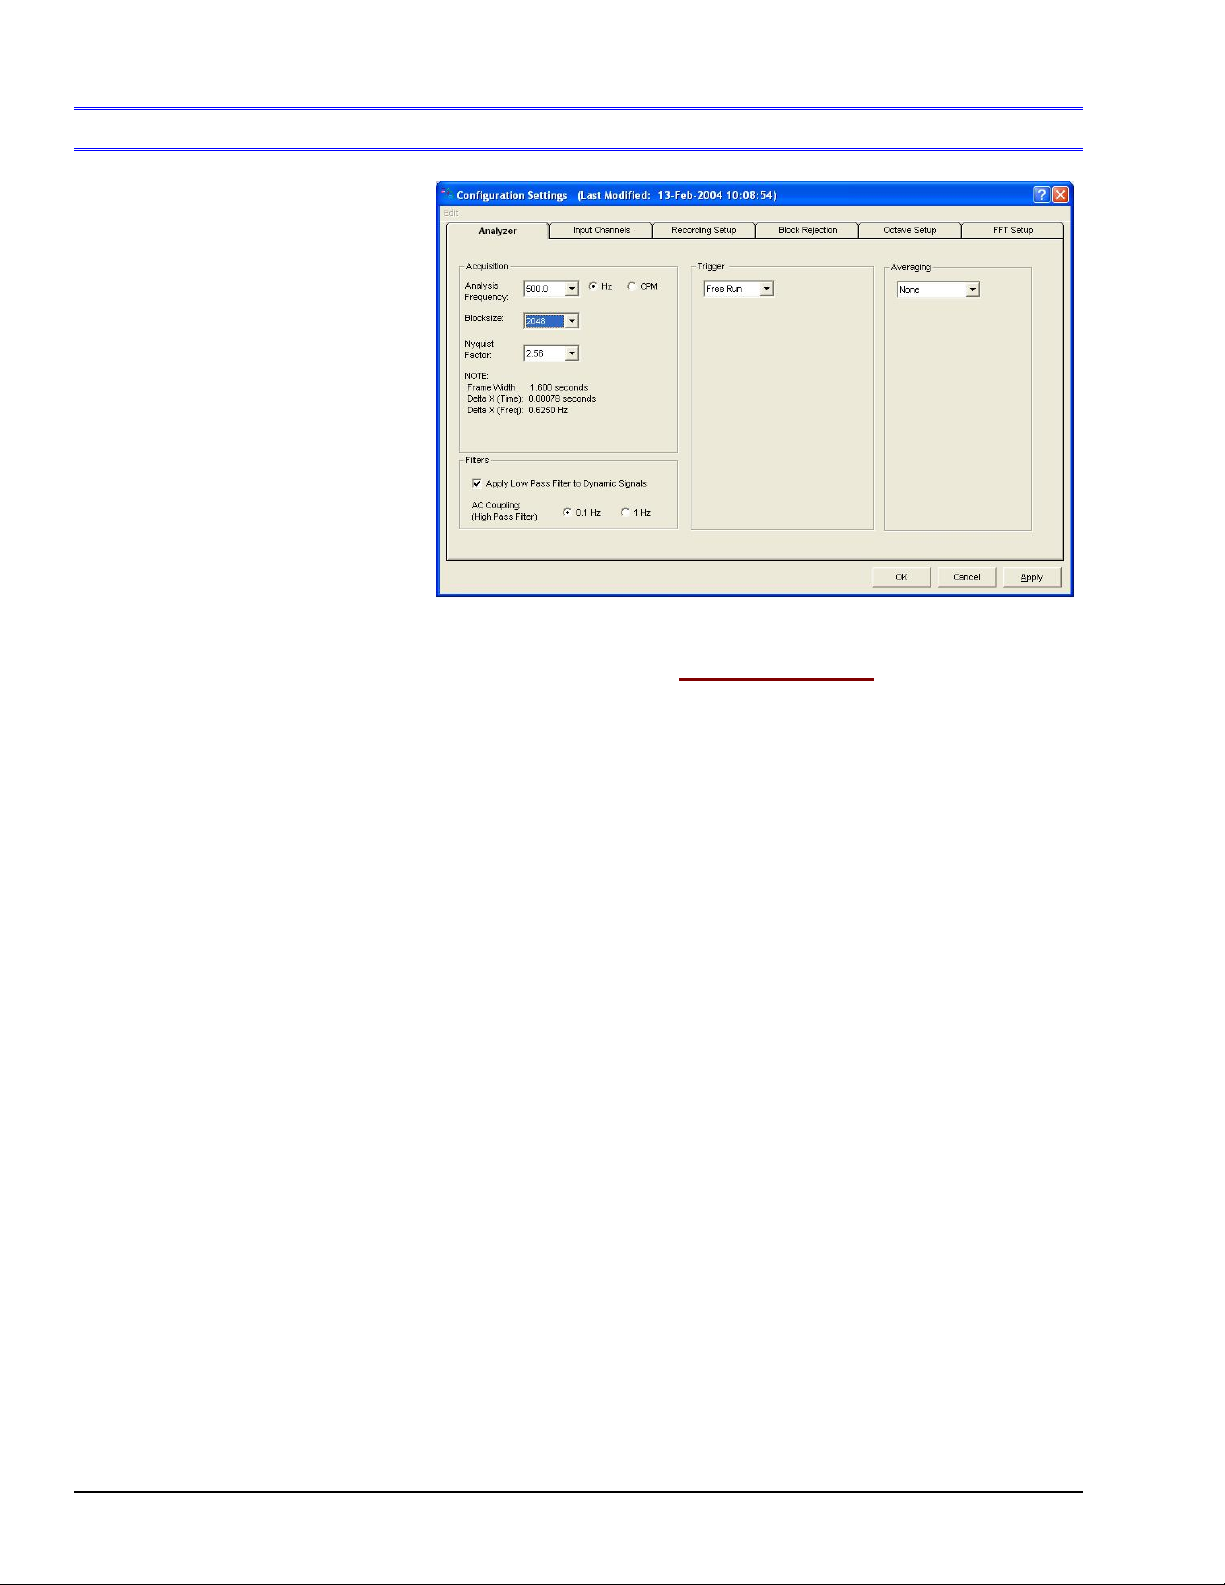
Edit Menu
> Configuration > Analyzer Tab
The Analyzer Tab
consists of four
panels:
Acquisition
Filters
Trigger
Averaging
Analyzer Tab
Edit Menu > Configuration > Analyzer Tab: Acquisiti on Panel
The Acquisition Panel provides a means of setting Analysis Frequency and Blocksize. A note
regarding the relationship of Analysis Frequency and Blocksize, to Frame Width and Delta X,
is located on the preceding page.
Analysis Frequency: This section of the Acquisition Panel is used to set the maximum
bandwidth for analysis. Frequency components above the Analysis Frequency setting will
result in aliasing errors in the data. The bandwidth measurement can be set for Hertz (Hz) or
Cycles Per Minute (CPM) by use of radio buttons. Note that the processing time for a selected
blocksize is fixed by CPU speed.
Increasing the analysis frequency results in:
(a) the hardware streaming packets of data more frequently to the software
(b) a greater demand placed on the software to process the data blocks, and
(c) less time between data blocks available for task performance.
Blocksize: This section of the Acquisition Panel is used to set the number of data points in a
frame or block of data. Acceptable blocksizes range from 128 to 16384 data points.
Blocksize can be viewed as chunks, or packets of data, that move through eZ-Analyst’s
software algorithms. As blocksize increases, the amount of data increases, the time required
to acquire a block of data increases, and the amount of space required to save the data
increases.
Nyquist Factor: A user-selected factor, for which waveform frequency is multiplied by, to
ensure that a sampled analog signal is accurately reconstructed. eZ-Analyst has three
selectable Nyquist Factors: 2.56, 5.12, and 10.24. The 2.56 Nyquist Factor should be used
in most cases as it is the most efficient in FFT Analysis. However, if you suspect signal
aliasing, a Nyquist factor of 5.12 or 10.24 should be selected. Higher Nyquist Factors result
in more time data in the FFT Analysis. Note that the maximum available Analysis Frequency
is reduced for higher Nyquist Factors.
4-4 Edit Menu 969795 eZ-Analyst
Page 83
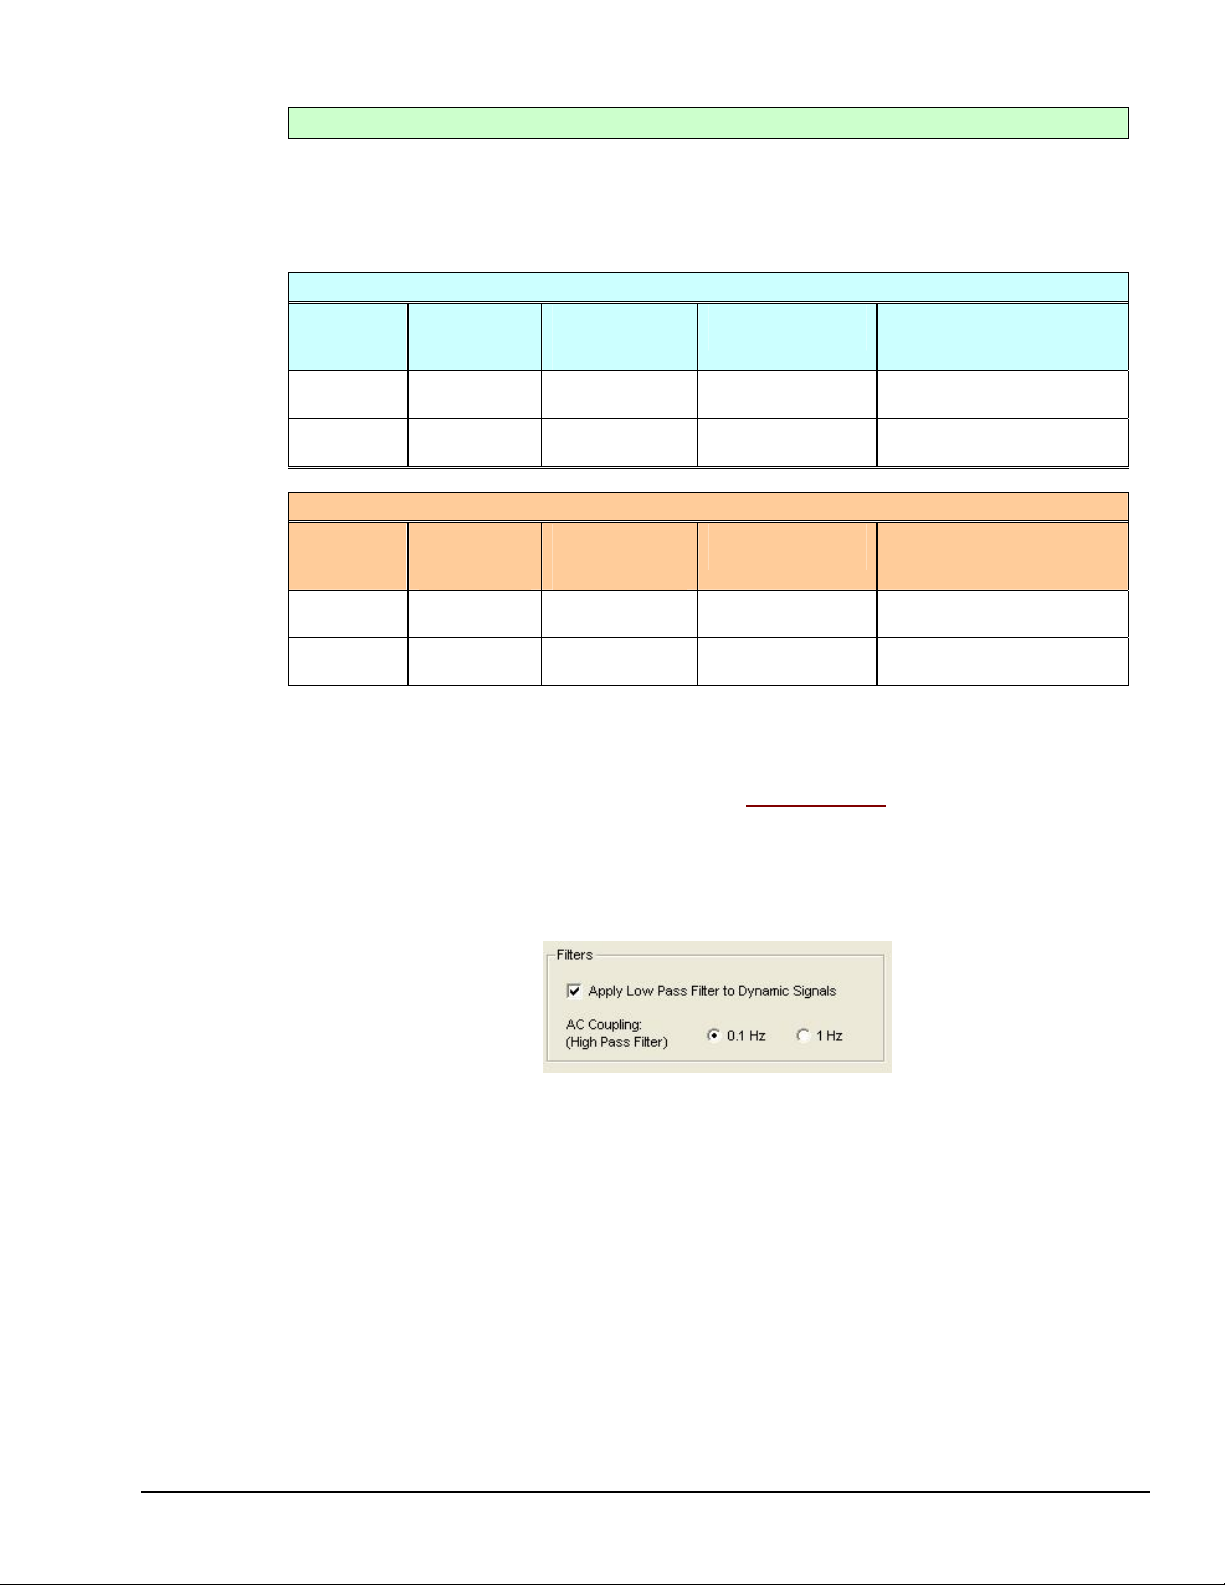
Effects of Changing Analysis Frequency, Blocksize, or Nyquist Factor
The effects indicated by the these two tables pertain to changing the Analysis Frequency while
the Blocksize and Nyquist Factor remain unchanged, and visa versa. If the Analysis
Frequency, Blocksize, and/or Nyquist Factor are changed [for the same acquisition], then the
effect on the other variables can differ, depending on the magnitude and direction of change
of those variables.
Analysis Frequency or Nyquist Factor
Change
Direction
Increase Larger
Decrease Smaller
File Size
(Recorded
Data)
disk file
disk file
Block
AcquisitionTime*
Faster Faster screen
Slower Slower screen
Data Displayed in
Scope Mode
updates
updates
Frequency
Resolution
Lower (higher Delta X)
Higher (lower Delta X)
Blocksize
Change
Direction
Increase Larger
Decrease Smaller
File Size
(Recorded
Data)
disk file
disk file
Block
AcquisitionTime*
Slower Slower screen
Faster Faster screen
Data Displayed in
Scope Mode
updates
updates
Frequency
Resolution
Higher (lower Delta X)
Lower (higher Delta X)
*Block Acquisition-Time: The time it takes to acquire one block of data.
Edit Menu > Configuration > Analyzer Tab: Filters Panel
The Filters Panel applies to both ZonicBook/618E and WBK18 channels. Filter Panel
functionality does not apply to WaveBook direct channels or to ZonicBook Medallion.
Filters Panel
Apply Low Pass Filter: When selected, a low pass filter provides alias protection and
removes undesired frequencies from the measured response for each associated channel.
AC Coupling (High Pass Filter): When AC Coupling is selected in the Input Channels tab,
the associated input signals will pass through a 0.1 Hz or a 1 Hz High Pass Filter, depending
on which radio button is selected.
eZ-Analyst 969795 Edit Menu 4-5
Page 84
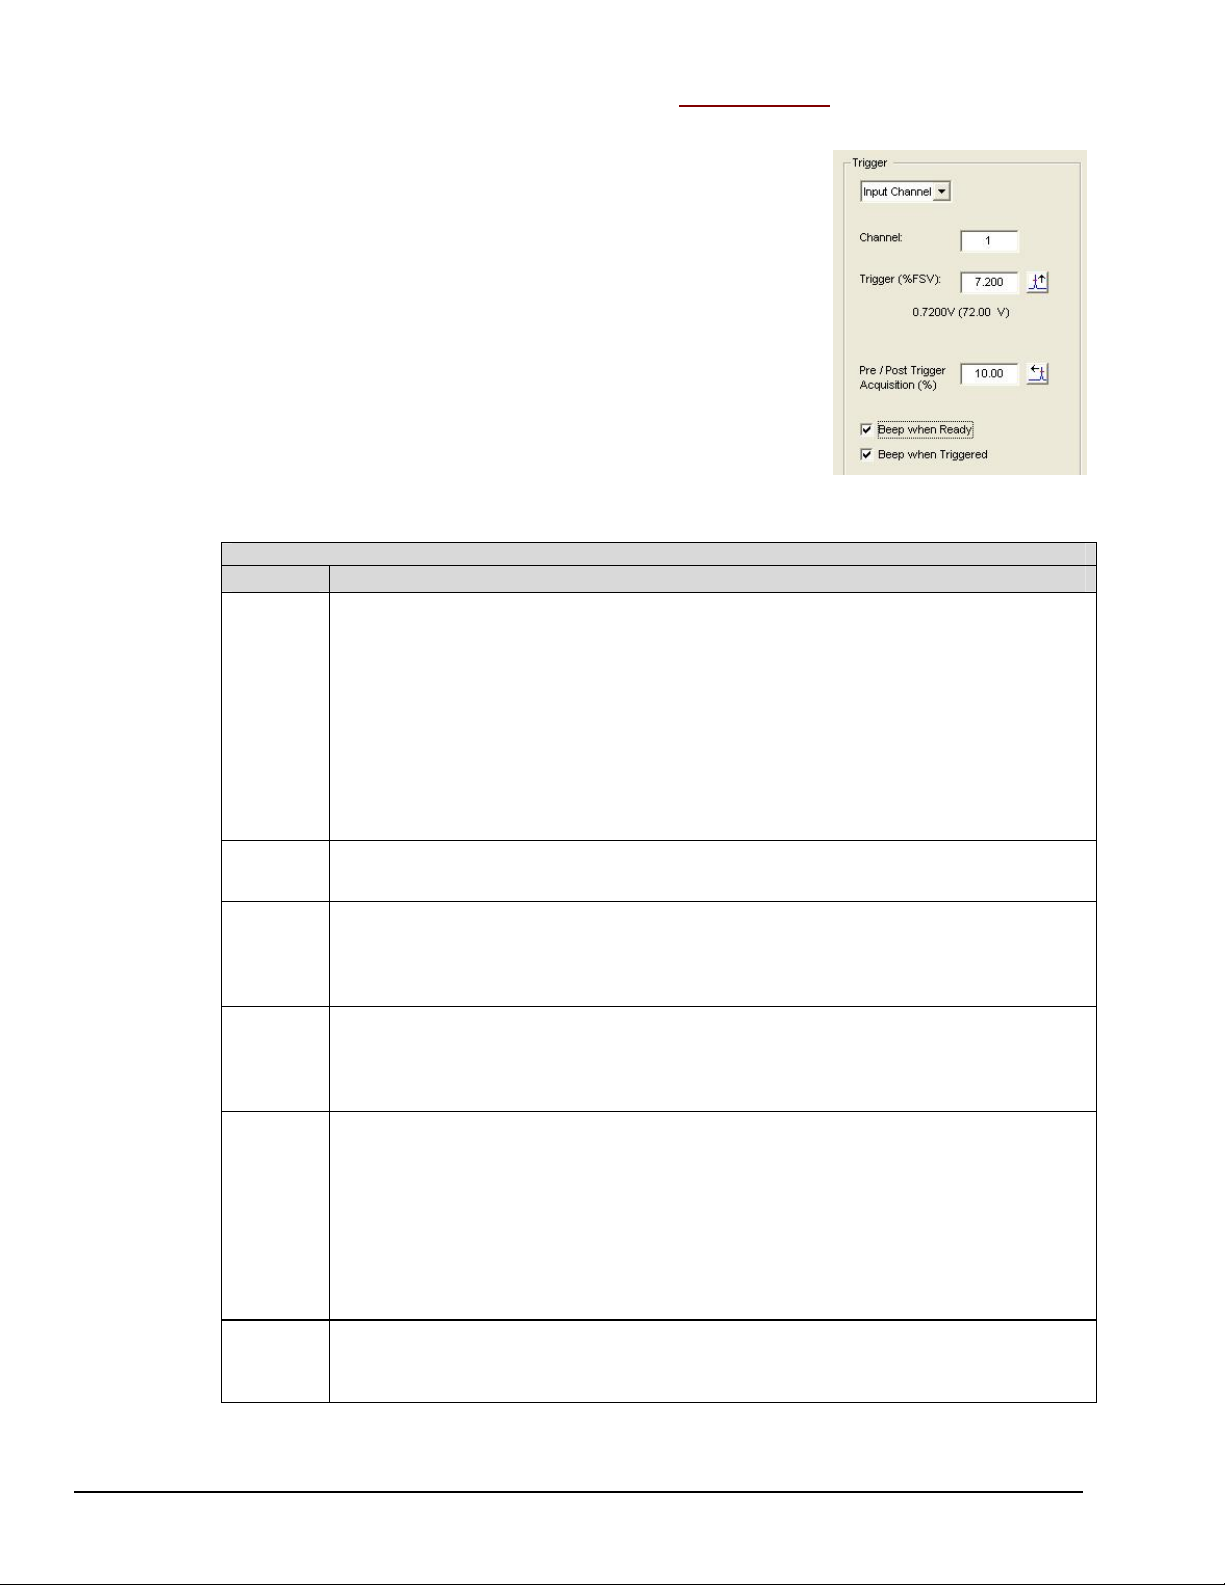
Edit Menu > Configuration > Analyzer Tab: Trigger Panel
The Trigger Panel provides a means of setting and defining trigger-rela ted parameters.
Triggering defines how eZ-Analyst is to begin the task of
capturing and processing data. To capture data without
using a trigger, select Free Run from the pull-down list. To
capture transient data, select Input Channel from the pulldown list and set values for the applicable parameters.
A Breakdown of the Analyzer Tab’s Trigger Panel
Category Description
Type
If “Free Run” is selected as the Type, the data acquisition and processing will
begin as soon as the <Acquire> button is clicked. Select “Free Run” if you want
to measure data in a continuous or Scope mode manner [from an active system].
Trigger Panel
on the Analyzer Tab
If “Input Channel” is selected as the Type, the data acquisition and processing
begin after the signal on the specified channel reaches the defined trigger
conditions. Select “Input Channel” if you want to capture transient data.
“TTL Pulse” applies to the TRIGGER INPUT BNC on ZonicBook/618E and to the
TTL TRIGGER on WaveBook’s DB25 connector (pin # 13). The input accepts a 0
to 5 V TTL compatible signal. Latency is 300 ns.
Channel
No.
Level This value is the point that the signal must pass through to be considered as a
Slope Slope icon buttons are used to select a “Positive” rising (up arrow) or a
Delay Selecting the ”Pre-Trigger” icon button (arrow left) instructs the system to
Selecting the “Trigger Delay” icon button instructs the system to skip a specified
Specifies the channel that the trigger condition applies to.
candidate for a trigger. When using a ZonicBook Medallion this value is entered
as a percentage of FSV. When using a WaveBook or a ZonicBook/618E this value
is entered as volts and must be within the selected FSV.
“Negative” falling (down arrow) slope of the signal that defines a trigger
condition. The signal must be on the defined slope before it can be considered
for use as a trigger
capture a specified percentage of data [a specified percent of the frame size]
prior to the start of trigger event.
In the previous figure we see that “Pre Trigger” is selected for 10.00 (%).
percentage of data [a specified percent of the frame size] after the start of
trigger event. If we selected “Trigger Delay” and entered 10.00 in the percent
box, we would see 10% of the data skipped, in relation to frame size.
Beep
Sound
If desired, check a box so a “beep” will sound when the Trigger is Ready, or when
the system has Triggered. If rapid triggering/acquiring data events are taking
place in succession, then the beep sound may become erratic.
4-6 Edit Menu 969795 eZ-Analyst
Page 85

Select Free Run from the Analyzer Tab’s Trigger Panel if you want to
measure data in a continuous or Scope mode manner [from an active
system].
To capture transient data, go to the Configuration dialog found under the
Edit menu and on the Analyzer tab select Input Channel and specify the
applicable channel and conditions.
Trigger-related items [in the Analyzer Tab or Recording Setup Tab] being
locked-out indicates that the current mode is for playback operation. If
so, perform the following:
(1) close the Configuration Window
(2) select “Measurement Mode” from the Task pull-down menu
(3) open the Configuration window
Capturing Transient Data
Setting eZ-Analyst to trigger on an Input Channel captures transient data when the
associated parameters are correctly specified. The following sections discuss the associate
parameter and how they apply to a signal such as an impact hammer striking an object. The
signal show is from an accelerometer located in the hammer’s head.
Set Trigger level:
The first and most important parameter is the trigger level. This parameter specifies the level
in which the signal must pass through in order for an acquisition process to begin. An ideal
level will assure that the signal is well above any noise or erroneous movement that will cause
a trigger. An ideal level will also assure that the level is not above the maximum output of
the signal source. Violating these ideal conditions can result in either a premature trigger or
no triggering at all. For example, if a signal has a noise floor of 0.5 volts and the trigger level
is set to 0.2 volts the acquisition will always trigger for obvious reasons. Conversely, if the
maximum signal output is 5.0 volts and the trigger is set to 5.5 volts the acquisition will never
trigger.
eZ-Analyst 969795 Edit Menu 4-7
Page 86
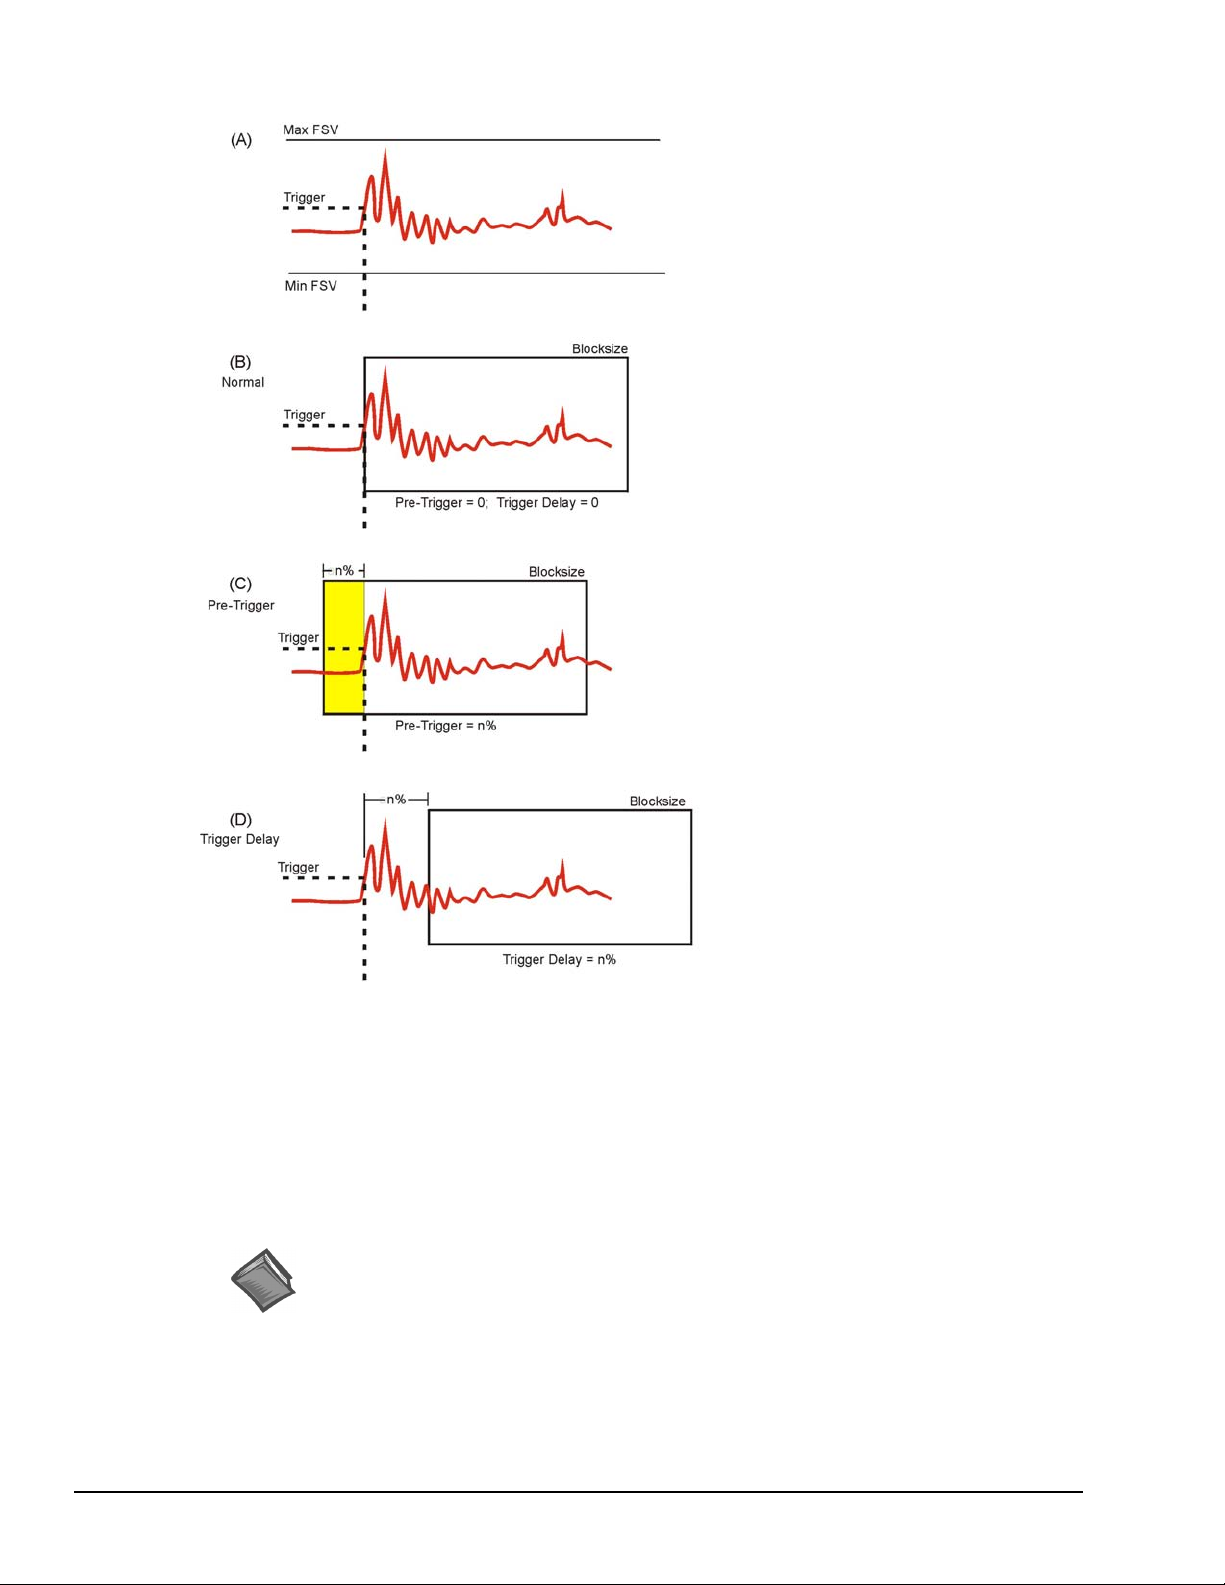
Shifting a Waveform with Pre-Trigger and Trigger Delay
(A) Setting Signal Position
Once an acceptable trigger level has
been ascertained, positioning the
signal within a block of sampled data
(and in the display window) is the
next consideration. Often it is
necessary to capture the events that
lead up to the trigger point. If this is
the situation then positioning should
be set for Pre-trigger capturing. On
the other hand, if the signal of
interest occurs after the trigger point,
then positioning should be set for
Trigger-Delay capturing.
(B) Normal Trigger
Normal Triggering is obtained by
specifying zero for the Pre-Trigger
and zero for the Trigger Delay; where
the trigger point occurs at the first
sample point as pictured in the figure
to the left.
(C) Pre-Triggering
To capture information before the
trigger point, select Pre-Trigger and
specify a percentage of the blocksize
(see note). For example, if the
blocksize was set at 1024 samples,
then setting the Pre-Trigger to 10%
would result in capturing 102 sample
points that exist prior to the trigger
point. This has the effect of shifting
the waveform to the right as pictured
in the figure.
(D) Trigger Delay
Trigger Delay is the opposite of PreTrigger. The Delay causes eZ-Analyst
to wait “n%” samples before it begins
filling a block of data. This has the
effect of shifting the signal to the left.
Note: For ZonicBook Medallion applications, the trigger level is specified in percentage
of full-scale voltage (FSV). For WaveBook and ZonicBook/618E applications, the
trigger level is an absolute signal level that must be within the physical input range
(within the FSV).
Reference Notes:
The following sections of this document contain information that closely relates to the
subject of Capturing Transient Data. Reading over the following material should
improve your understanding of the important concepts involved.
¾ Capturing Transient Data, page 4-7.
¾ Recording Setup, page 4-18.
¾ Block Rejection Tab, page 4-22.
¾ Considerations Regarding Double Hammer Rejection, page 4-23.
4-8 Edit Menu 969795 eZ-Analyst
Page 87
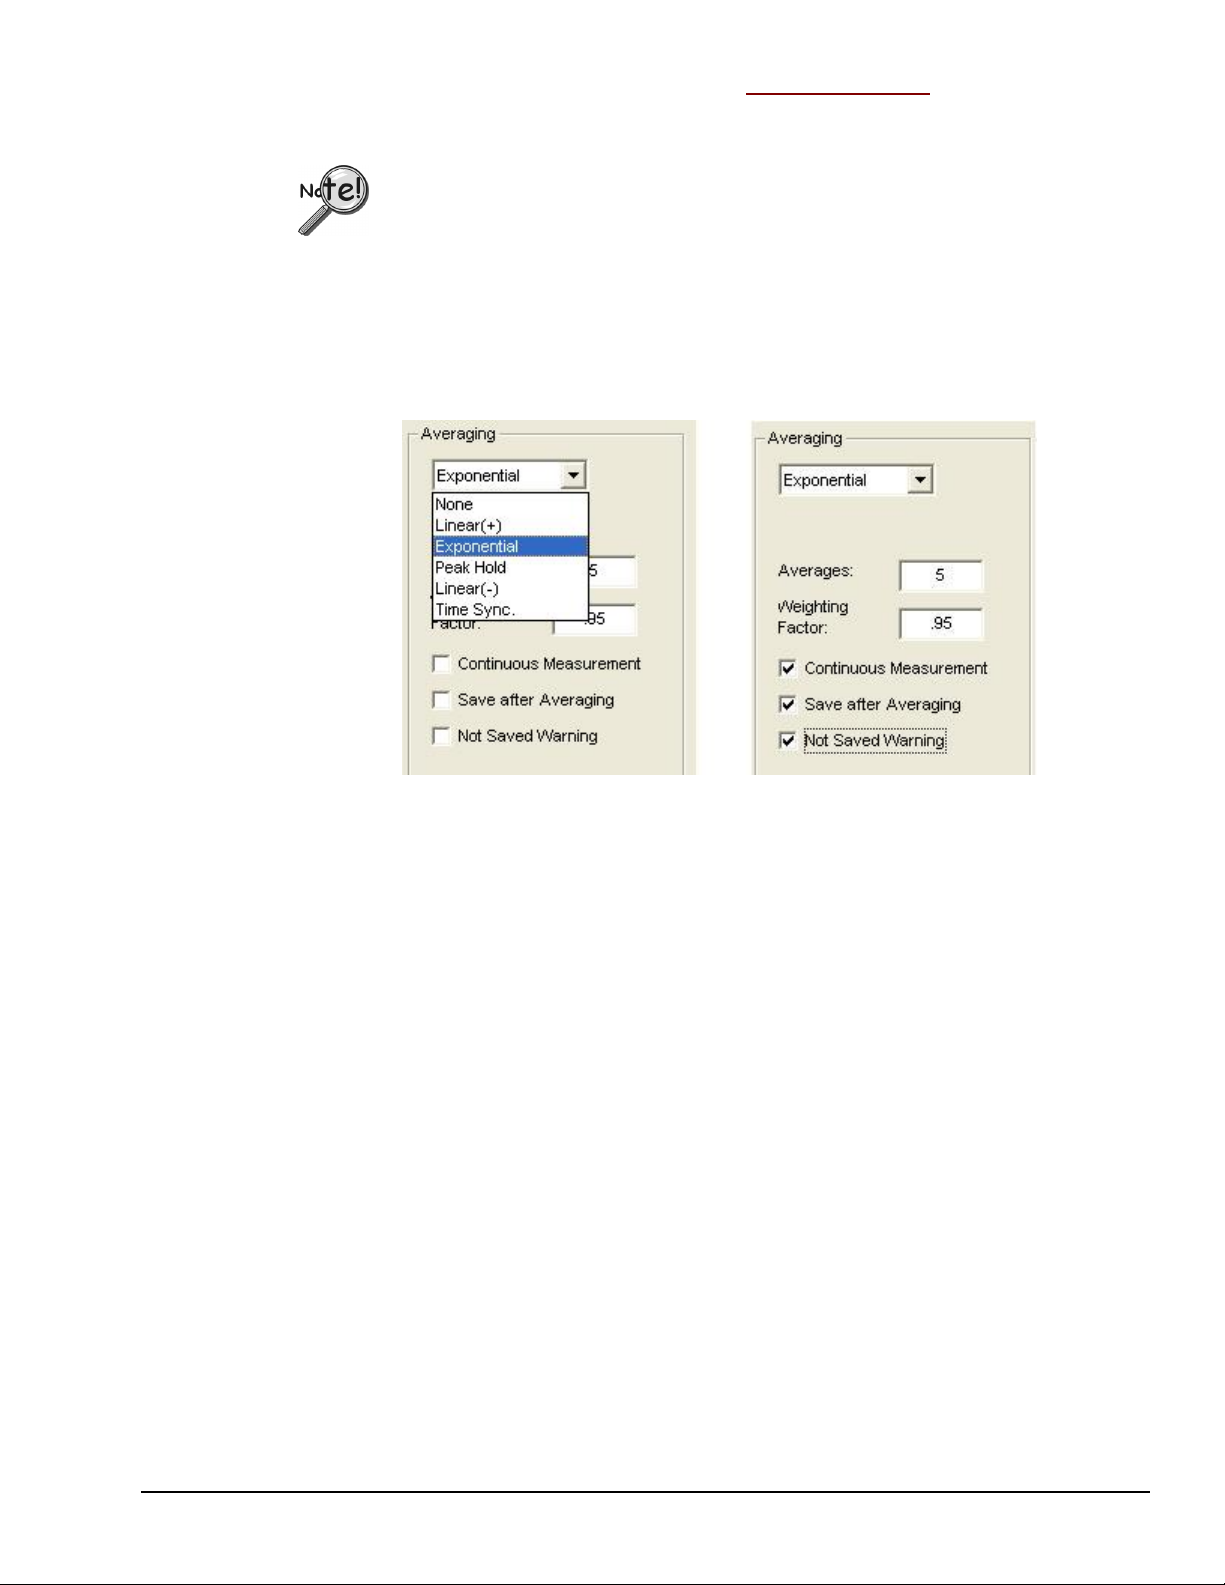
Edit Menu > Configuration > Analyzer Tab: Averaging Panel
The Averaging Panel is used to select the type of averaging that will be calculated during data
acquisition.
¾ To apply averaging to time-demand data, the Function View Window
must be changed to a Windowed “Time Function,” otherwise all
In the figure below, the first scenario shows the pull-down menu expanded, revealing the
types of averaging that can be selected. The second scenario shows that “Exponential” has
been selected. Exponential makes use of a Weighting Factor, which is not used by the other
averaging types.
averaging will be applied to a spectral date.
¾ Averaging can be used to decrease the noise in a measurement.
Averaging Panel of Analyzer Tab (2 Views)
A brief description of averaging types and other panel terms now follows.
Linear (+): All blocks of data are treated equally in terms of their effect on the averaged
result.
Exponential: Similar to linear averaging, Exponential requires a weighting factor that either
increases or decreases the effect of each new data block on the resultant average.
Weighting Factor: The Weighting Factor either increases or decreases the effect of each
new data block on the resultant average when Exponential Averaging is used.
New Average = ((New Data) * A.W.F.) + (Old Average * (1-A.W.F))
Peak Hold: The resultant block of data is a collection of points that represent the peak
amplitude for each point in the block. With each new block of data, the current data is
compared with the new data on a point by point basis. The highest amplitude for each point
in the block is retained.
Linear (-): Also known as Negative Averaging; Linear (-) Averaging is a technique used to
identify the natural frequencies of in-service machines that cannot be shut down for analysis.
Linear (-) Averaging is a two step process. First, a reference average is acquired. Second, a
normal linear average is acquired for each frame. The running average is subtracted from the
reference average and the result is displayed. The first time you attempt to start data
acquisition after you select Linear (-) averaging, the Negative Averaging Setup/ Measurement
window opens. An example of how to perform negative averaging follows these definitions.
eZ-Analyst 969795 Edit Menu 4-9
Page 88

Time Sync: Time synchronous averaging uses a keyway, or a similar point of reference, as a
trigger. The blocksize is set to allow enough time for at least one full revolution. This must
be performed in Scope Mode. Channel trigger mode should be used in conjunction with this
selection.
Number of Averages: This number specifies the condition for terminating a data acquisition
sample. After the number of averages (blocks/frames of data) have been captured and
averaged, the eZ-Analyst will automatically stop taking new data. This sample can then be
saved. If the number of averages is set to zero, acquisition is continuous and must be halted
by the user.
Continuous Measurement: Checking this option restarts the averaging process without
user intervention. Note that the data itself is not continuous between measurements. This
option is not meaningful for non-averaging operations.
Reference Notes:
The following sections of this document contain information that closely relates to the
subject of Averaging. Reading over the following material should improve your
understanding of the important concepts involved.
¾ Capturing Transient Data , page 4-7.
¾ How to Perform Negative Averaging, 4 - 10.
¾ Recordin g Setup, page 4-18.
¾ Block Rejection Tab, page 4-22.
¾ Considerations Regarding Double Hammer Rejection, page 4-23.
How to Perform Negative Averaging
1. Perform an impact measurement, with Averaging set to “Linear +” and “Triggered
Acquisition.” Take 5 to 10 impacts on a running machine.
2. Select “Spectrum Display.” View Results.
3. Then change to “Free Run Acquisition” with Averaging set to “Linear –.”
Take 10 to 20 averages.
4. Start Scope Measurement. Select “Use Current Spectrum as Reference.”
Note that the Displayed Spectrum is a Negative Averaged Spectrum. The running
Spectra is subtracted from the Impact + Running, and you are left with the Impact
vibration.
In regard to the following three screen shots, the first shows the impact spectra on the non-
running motor; the second shows the impact spectra on a running motor; and the third shows
the Negative Average spectra. If you compare the Negative Average spectra to the nonrunning impact you will notice that the Running Speed vibration has been subtracted out,
leaving Resonances.
4-10 Edit Menu 969795 eZ-Analyst
Page 89
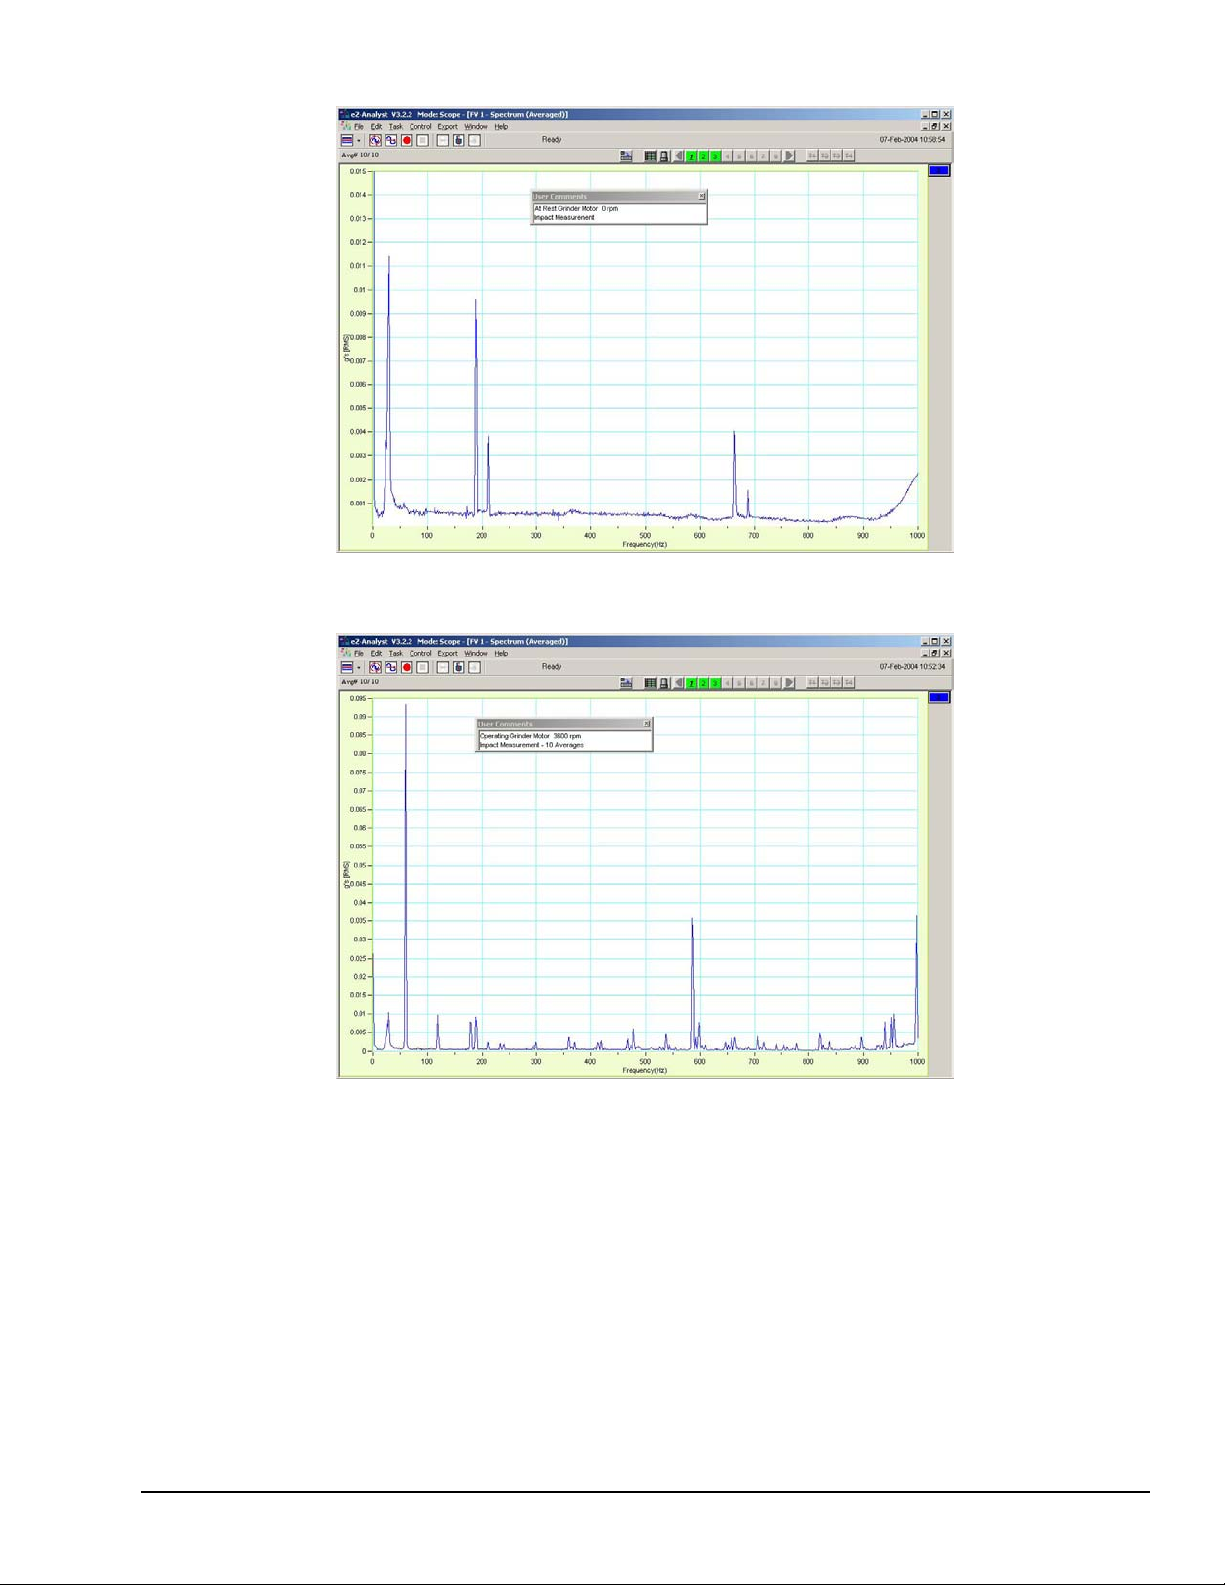
Impact Measurement on a Non-running Motor
Impact Measurement, 10 Averages on a Motor Running at 3600 RPM
eZ-Analyst 969795 Edit Menu 4-11
Page 90

Negative Averaging
4-12 Edit Menu 969795 eZ-Analyst
Page 91
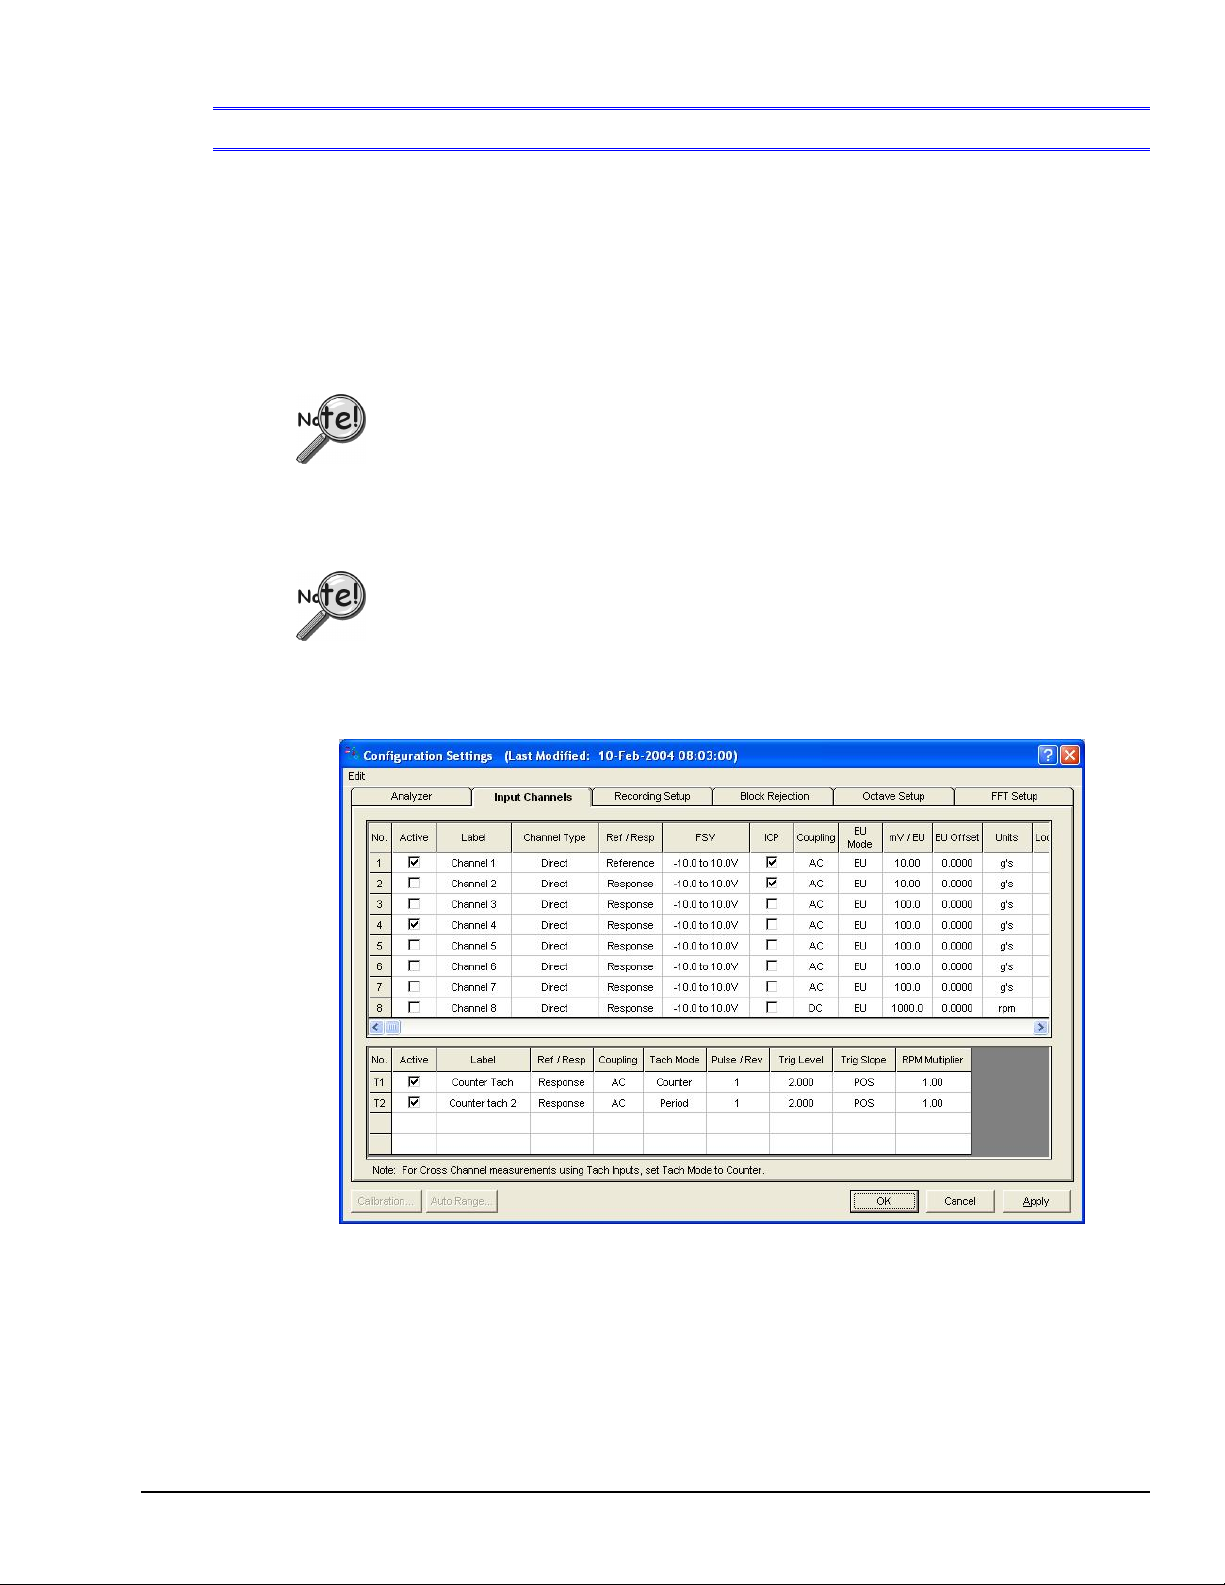
Edit Menu
The Input Channels tab displays the current setup conditions of the 8 Analog Input Channels
(CH1 through CH8) and the 4 Tachometer Channels (T1, T2, T3, and T4) on a channel-bychannel basis. It also provides a means of changing the input channel settings. These
changes are accepted as soon as the <Apply> or <OK> button is clicked.
Note: For ZonicBook Medallion applications eZ-Analyst displays an Input/Output Channels
> Configuration > Input Channels Tab
tab instead of an Input Channels tab. Output channel configuration is discussed on
page 4-13.
When using WaveBook hardware, eZ-Analyst supports up to 64 channels
of input. If your WaveBook’s hardware configuration has more than 64
channels, eZ-Analyst will display an error message and enter the Playback
mode. If you wish to use Measurement mode you will have to reduce the
channel count by removing expansion modules. To remove the expansion
modules you must physically disconnect them from the WaveBook system.
When using ZonicBook/618E hardware, eZ-Analyst supports up to 56
channels of input. If your ZonicBook/618E hardware configuration has
more than 56 channels, eZ-Analyst will display an error message and
enter the Playback mode. If you wish to run in the Measurement mode
you will have to reduce the channel count by removing expansion modules
by physically disconnecting them from the ZonicBook/618E system.
Analog Input
Channels
(CH1 – CH8)
Tachometer
Channels
(T1 – T4)
Input Channels Tab Selected – ZonicBook/618E and WaveBook Applications*
*Note: For a screen image of ZonicBook Medallion’s Input/Output Channels Tab, see page 4-15.
eZ-Analyst 969795 Edit Menu 4-13
Page 92

Configuring Analog Input Channels
Partial Column Headings for Analog Input Channels
No. This column lists the available analog input channels; for example, channels 1
through 8.
Active Initially all input channels are active. To set unused channels to OFF, remove the
check from the associated “Active” checkbox.
Label This should be a meaningful name. Highlight a cell before typing a label. When
you press the <Enter> key, the <Apply> button, or the <OK> button the label is
accepted.
Channel
Type*
Ref /
Resp
FSV Full-Scale Voltage. The cells in this column are used to set the FSV value in
ICP
This column applies to WaveBook and ZonicBook/618E systems. It does not
apply to ZonicBook Medallion. The column consists of a fixed label, which
indicates each channel’s parent hardware. Main unit channels, i.e., those that
connect directly to a WaveBook or ZonicBook/618E [as opposed to an expansion
module] are denoted by the label, “Direct”. Channel Type cannot be edited.
* The Channel Type column does not apply to ZonicBook Medallion applications.
There are two types of channels, Reference and Response. All channels are
initialized as Response channels. If you are using a force channel, then (1)
highlight that channel’s Response/Reference cell, and (2) select Reference on the
resulting popup menu.
Volts.
A constant 4mA bias current is available for ICP transducers that are used as
signal input for ZonicBook/618E’s analog channels (CH1 through CH8) and for
compatible expansion modules that accept ICP transducers, for example, the
WBK18. The bias current is sourced through the center conductor of the input
channel BNC connector and returns to the acquisition device [e.g.,
ZonicBook/618E or the WBK18] via the BNC’s outer conductor.
The current source features an operating compliance of 24V and is protected in
regard to both short-circuit and overvoltage. Operating compliance refers to the
highest voltage that can be applied without change of the current source value.
In the absence of a transducer, the current source will output an open circuit
voltage of 30V. For applications that do not require bias, the current source can
be disconnected from the input by un-checking ICP in the Input Channels tab on
a per-channel basis.
When the ICP cell is checked for a channel, the current source is enabled, the
input voltage is continuously monitored with level detection circuitry. Recognition
of a voltage greater than 25V (transducer open) or less than 1V (transducer
short) triggers a transducer fault condition for the affected channel. This error is
communicated to the user via a front panel LED and is also available through a
software status request at the end of an acquisition. When recognized, an error
is latched until the commencement of a new acquisition. Consequently, even
intermittent faults are detected and communicated. Detection of a fault does
not, however, alter the acquisition process or its data.
When the ICP function is not available to a channel a dash appears in the ICP
column for the associated channel.
4-14 Edit Menu 969795 eZ-Analyst
Page 93

Coupling AC or DC coupling can be set on an individual channel basis from the Input
Channels tab. Coupling is available for analog channels (CH1 through CH8) and
for compatible expansion channels [e.g., from a WBK18]. AC Coupling can be set
to a high pass filter value of 0.1 Hz or 1 Hz. The value is selected in the Edit
Menu’s Analyzer Tab (see page 4-5). Note that when DC Coupling is selected the
high pass filter is bypassed.
When the Coupling function is not available to a channel, or not used by a
channel, a dash appears in that channel’s Coupling column.
EU Mode E(ngineering) U(nits): Select EU or Volt.
Reference Note: Gain and offset adjustments are made from the Calibration
window. You can access the Calibration window from the Task Menu when in
Measurement Mode, or from the Input Channels tab. The following parameters
apply:
• mV/EU to set the scaling factor of millivolts to Engineering Units.
• EU Offset to set the offset factor that is to be applied to the Engineering
Units.
• dB EU Ref: is applied to displayed data when the Y-axis scale is set to
dB. This is valid only for frequency domain data.
Units Enter the measurement units you will be using.
Location
Coord
Input
Type
This is a simple numbering system. The channel number is the default value for
location. However, you can highlight a cell and type a different location number.
When you press the Enter key, the value is accepted.
This is the axial direction of the transducer connected to the channel. Make your
selection on the popup menu that appears after clicking in the applicable cell.
This is the type of instrument attached to the channel. Menu
selections include: Acceleration, Velocity, Displacement, Force,
Pressure, Stress, Strain, General, and Tach (Tachometer).
Input Type refers to the Analog Input channel type for CH1
through CH8.
Note: Tachometer properties for the eight Analog Input
channels (CH1 through CH8) are set in the FFT Setup
tab. Refer to that section of the document for additional
information.
ZonicBook/618E users - do not confuse an analog input channel (CH1
through CH8) with a TACH Channel input (T1, T2, T3, or T4). The later
is discussed in the following section.
eZ-Analyst 969795 Edit Menu 4-15
Page 94

Configuring Tach Channels (T1, T2, T3, and T4)
Tachometer Section of the Input Channels Tab*
No. This column lists the available Tach channels, e.g., T1, T2. Do not confuse these
channels with analog input channels which can also be used for tachometer
input.
Active Available Tach channels are initially active. To set unused channels to OFF,
remove the check from the associated “Active” checkbox.
Label This should be a meaningful name. Highlight a cell before typing a label. When
you press the <Enter> key, the <Apply> button, or the <OK> button the label is
accepted.
Ref / Resp There are two types of channels, Reference and Response. All channels are
initialized as Response channels. If you are using a force channel, then
(1) highlight that channel’s Response/Reference cell, and
(2) select Reference on the resulting popup menu.
Coupling Used to select AC or DC Coupling. For tachometer applications AC Coupling is
almost always preferred. DC Coupling is available to allow viewing of the DC
signal, but is of no practical use to tachometer related triggers.
Tach Mode
Used to select one of three available modes: Voltage, Counter, or Period.
Pulse /
Rev
Trig Level
Trig Slope
RPM
Multiplier
Displays the number of pulses per revolution.
Specifies the pulse level that the RPM algorithm considers valid.
Specifies whether counting is Positive or Negative. Positive means that the
trigger will be active on rising signal levels. Negative means that the trigger will
be active on falling signal levels.
This column is used for entering a value to convert RPM into other units, e.g.,
Miles per Hour, Revolutions Per Second, or HZ. The desired conversion factor is
entered as a multiplier. To divide, enter an appropriate decimal. For example,
divide by 2 you would enter a value of 0.5.
4-16 Edit Menu 969795 eZ-Analyst
Page 95

Synopsis of Tach Modes
When you connect a tach sensor to a tachometer designated connector, such as the
ZonicBook/618E’s TACH BNCs (TACH1, TACH2, TACH3, or TACH4) you can select one of the
following three modes: Counter, Period, or Voltage. If you connect a tachometer sensor to a
direct Analog Signal Input channel (CH1 through CH8) then the tachometer signal will only be
accepted in the Voltage Mode.
If tachometer triggers will occur at a rate greater than or equal to the
“scan rate divided by 10” then the Period Mode must be used.
Counter Mode
Use Counter Mode when Pulses per
Revolution are needed.
Counter Mode can be used for phase
shift observance.
Counter Mode generates a Pulse of Amplitude “+1” for
each tach trigger. The counter mode can be used when
the number of pulses is less than the scan rate divided
by ten (< scan rate / 10).
Once you have established the phase relationship of a
machine running near optimum, the observance of phase
shifts can be used to signal the development of a
mechanical problem.
Period Mode
The period is the time from the rising edge of one pulse
to the rising edge of the next pulse, or the time from the
falling edge of one pulse to the falling edge of the next
pulse.
Use Period Mode when multiple
pulses are involved, such as from
gear teeth.
Period Mode cannot be used for
phase shift observance.
The Period Mode is used for Tachometer inputs which
exhibit multiple pulses per revolution. The mode
provides accurate overall RPM without sacrificing scan
rate. Phase measurements are not possible when using
period mode.
Note: 60 seconds divided by the period [in seconds]
equals RPM.
Voltage Mode
Voltage Mode is used for Tachometer inputs to view
actual input voltages from the Tach Sensor. Voltage
mode is useful for locating an ideal Tach Trigger Voltage
setting. An ideal trigger voltage is one that is in a clean
region of a leading edge. Note that Voltage Mode cannot
be used for Phase measurements between Analog Inputs
and Tachometer Inputs.
Use Voltage Mode when you need to
determine a trigger voltage.
If you connect a tachometer sensor to one of the 8
Analog Signal Input channels (CH1 through CH8) instead
of a TACH channel, then the tachometer signal will only
be accepted in the Voltage Mode.
eZ-Analyst 969795 Edit Menu 4-17
Page 96
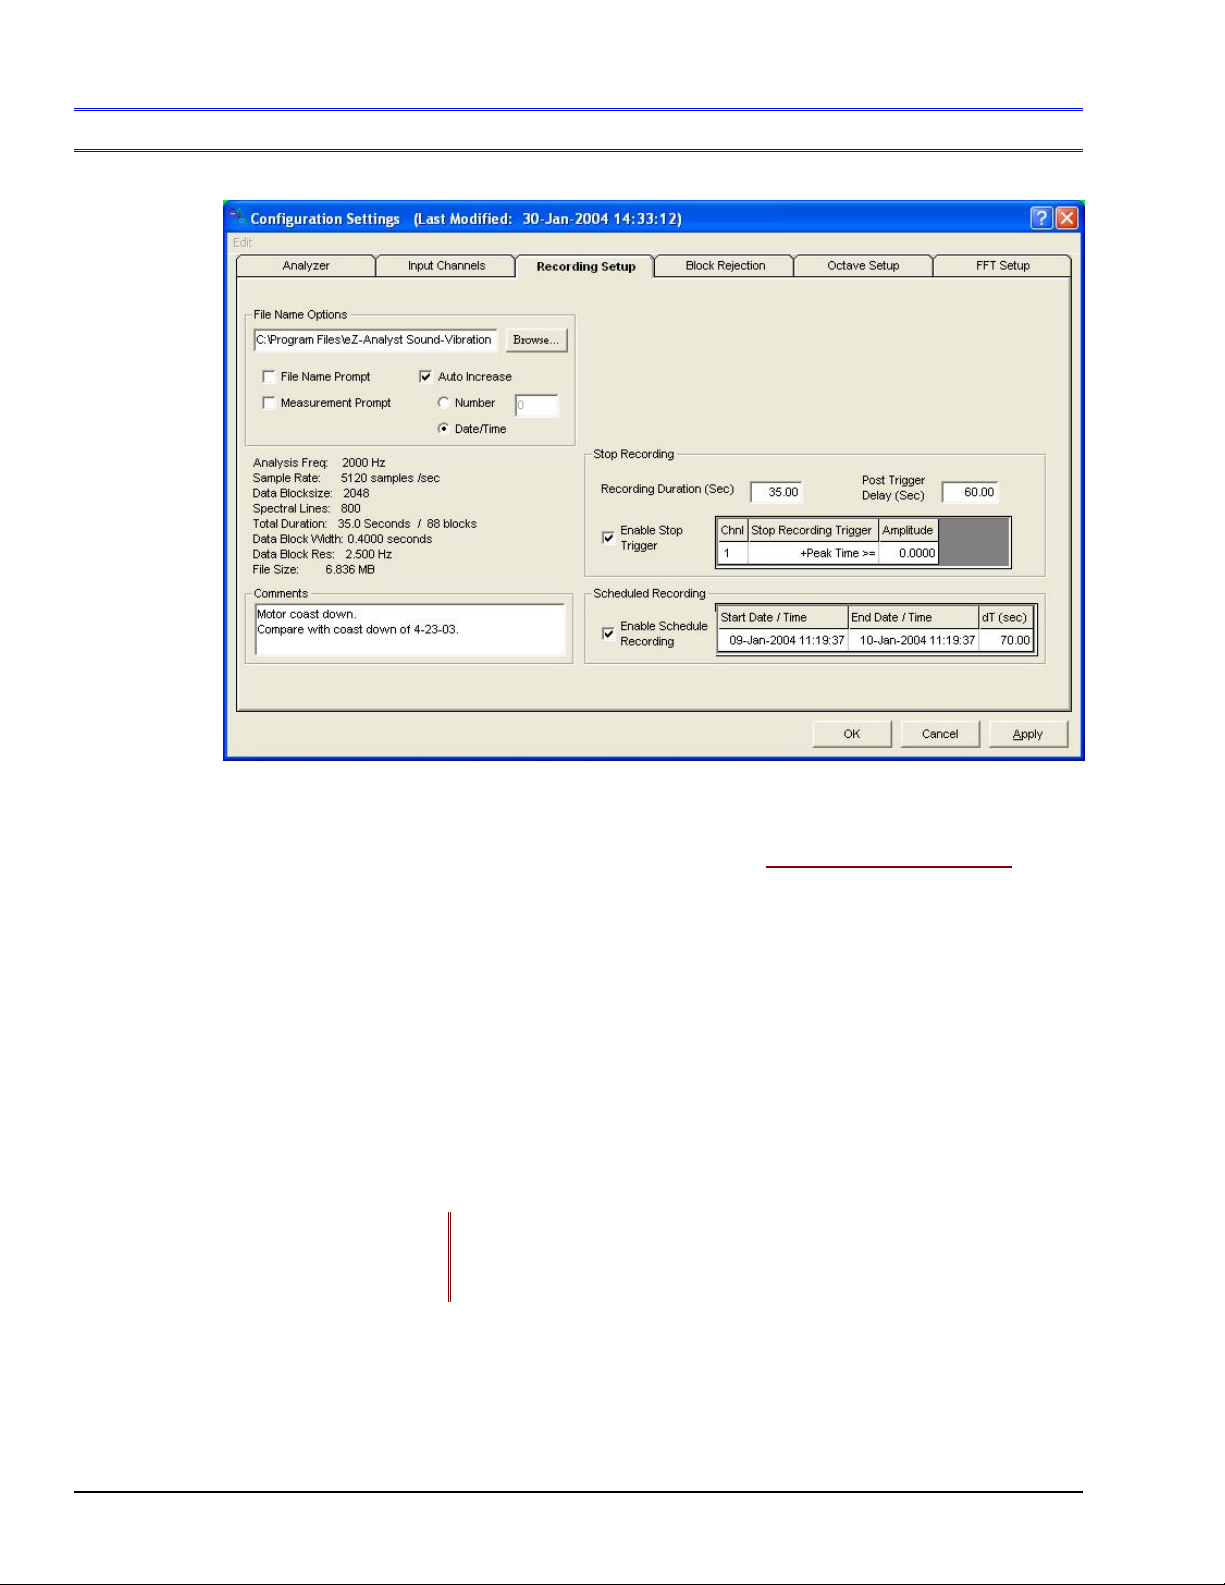
Edit Menu
> Configuration > Recording Setup Tab eZ-Analyst Only
Recording Setup Tab
Edit Menu > Configuration > Recording Setup Tab: Start Recor ding Panel
Provide a means of setting the following parameters that pertain directly to the start
condition.
Note that the Start Recording panel is not available for WaveBook applications.
PreAcq-Trigger – select this function to include [with the recording] data that precedes the
trigger event by the set number of seconds.
PostAcq-Trigger – select this function to exclude [from the recording] data that follows the
trigger event by the set number of seconds.
Note: You can not set a Start Delay for the start recording if PreAcq-Trigger is selected,
and visa versa.
Enable Start Trigger – if the checkbox is checked, amplitude-based data can be set as a
PreAcq-Trigger condition to Start Recording. The following options are provided.
Amplitude-Based
Data Types
Peak Time >=
Peak Time <
Spectrum >=
Spectrum <
at specified frequency
4-18 Edit Menu 969795 eZ-Analyst
Page 97
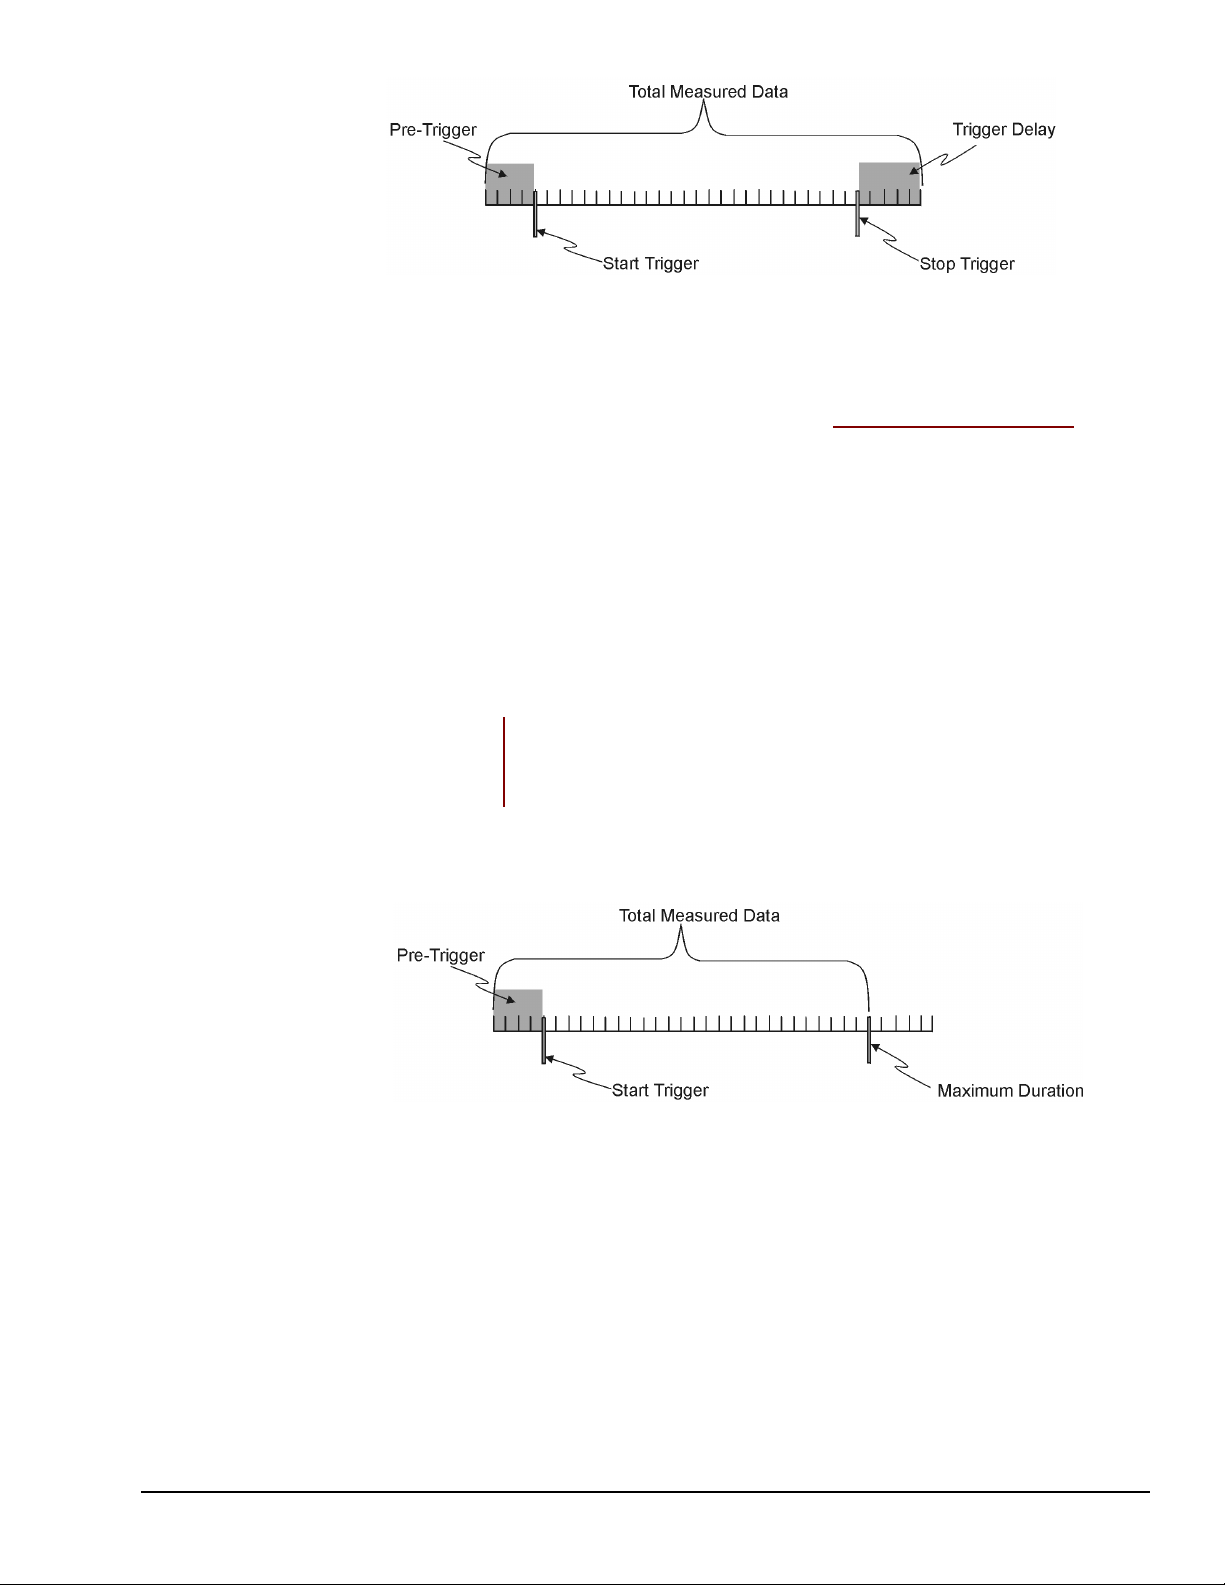
Understanding Total Measured Data
In this figure, the Start Recording panel’s PreAcq-Trigger data and the Stop Recording Pa nel’s
Trigger Delay data are both saved as part of the total measured data.
Edit Menu > Configuration > Recording Setup Tab: Stop Recording Panel
Provide a means of setting the following parameters that pertain directly to stop recording:
Recording Duration sets a “time-out” which the recording event is not to exceed. If an
acquisition has been triggered, the measurement will run until either (a) the amplitude-based
Enable Stop Trigger Condition is met, or (b) the Recording Duration is met, whichever occurs
first. When the Recording Duration value is met, the recording event is aborted.
Note: Entering a value of “0” in the Recording Duration block sets the duration to infinity.
Enable Stop Trigger – if the checkbox is checked, amplitude-based data can be set as a
stop condition for the recording. The following options are provided.
Amplitude-Based
Data Types
Delay (sec) – this function is used to include [with the recording] data that follows the stop
trigger event by the set number of seconds, as specified by the delay.
Peak Time >=
Peak Time <
Spectrum >=
Spectrum <
at specified frequency
Maximum Duration Limit Terminating a Measurement
eZ-Analyst 969795 Edit Menu 4-19
Page 98
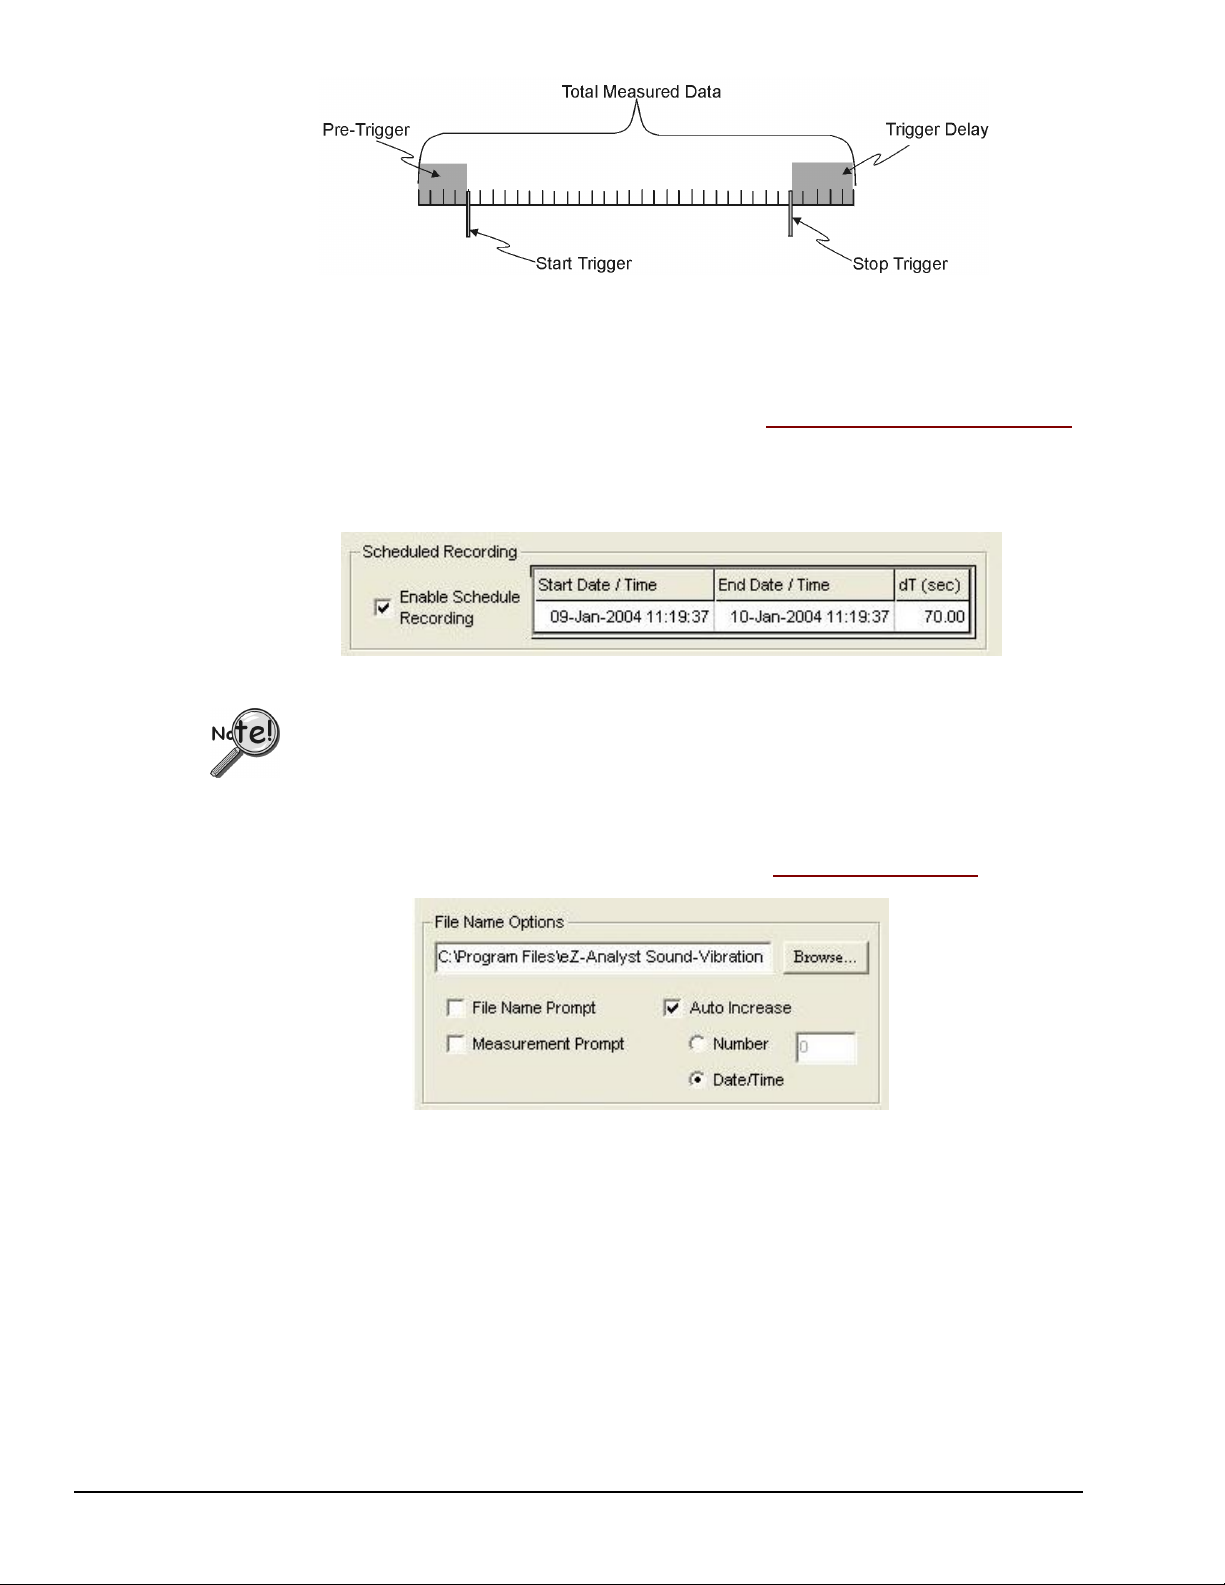
Understanding Total Measured Data
In this figure, the Start Recording’s PreAcq-Trigger data and the Stop Recording’s Delay data
are both saved as part of the total measured data.
Edit Menu > Configuration > Recording Setup Tab: Schedul ed Reco rdin g Panel
The Scheduled Recording panel includes a checkbox to enable the “scheduled recording”
function. It also includes three text fields (see following figure). The panel provides a means
of setting time conditions for starting and stopping a recording. dT is the delay time in
seconds.
Scheduled Recording Panel
¾ When using Scheduled Recording, you need to set up the recording
options for automatic .thd file creation. This is done in the Recording
Setup Tab’s “File Name Options” panel, discussed below.
¾ A “Start Recording” panel is visible for ZonicBook Medallion applications.
It is not available for WaveBook or ZonicBook/618E applications.
Edit Menu > Configuration > Recording Setup Tab: File Name Options
File Name Options Panel
4-20 Edit Menu 969795 eZ-Analyst
Page 99
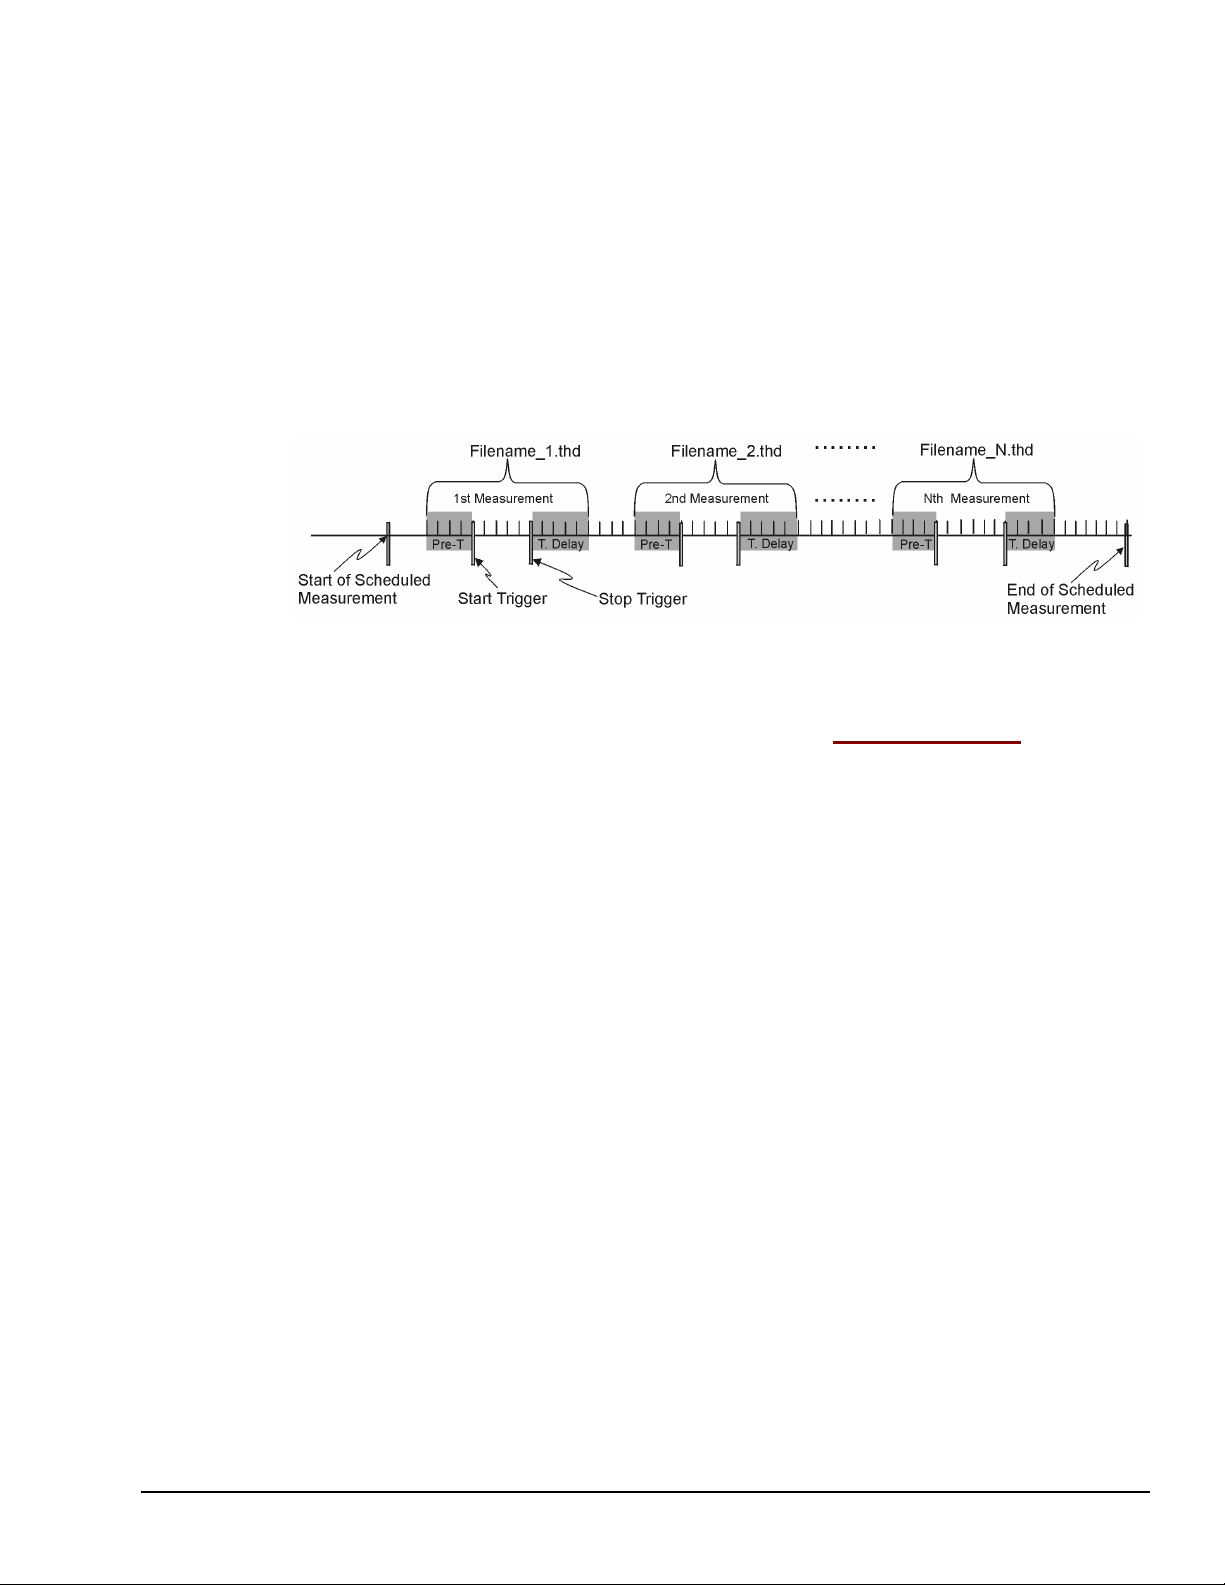
When using the Scheduled Recording feature the following steps should be taken to ensure
that each file will be automatically named by the program.
From the File Name Options panel, at the upper left of the Recording Setup Tab, verify that
the following is true. Make changes if needed.
• File Name Prompt – Not Checked
• Measurement Prompt – Not Checked
• Auto Increase – Checked
• Date/Time – Select the “Date/Time” radio-button if you want the Filenames to
automatically increase by a Date/Time convention, otherwise select “Number.”
• Number – Select the “Number” radio-button if you want the Filenames to
automatically increase by a numerical sequence (1, 2, 3, ….N) convention, otherwise
select “Date/Time.”
An Example of Filename Auto-Incrementing by Number
Edit Menu > Configuration > Recording Setup Tab: Comments Panel
The comments panel can be used to enter a variety of information regarding the recording.
For example, you may want to include the environmental conditions that existed at the time
of the recording, the phase of the project, or a problem that is being investigated. Note that
the comments are saved as part of the data file.
eZ-Analyst 969795 Edit Menu 4-21
Page 100
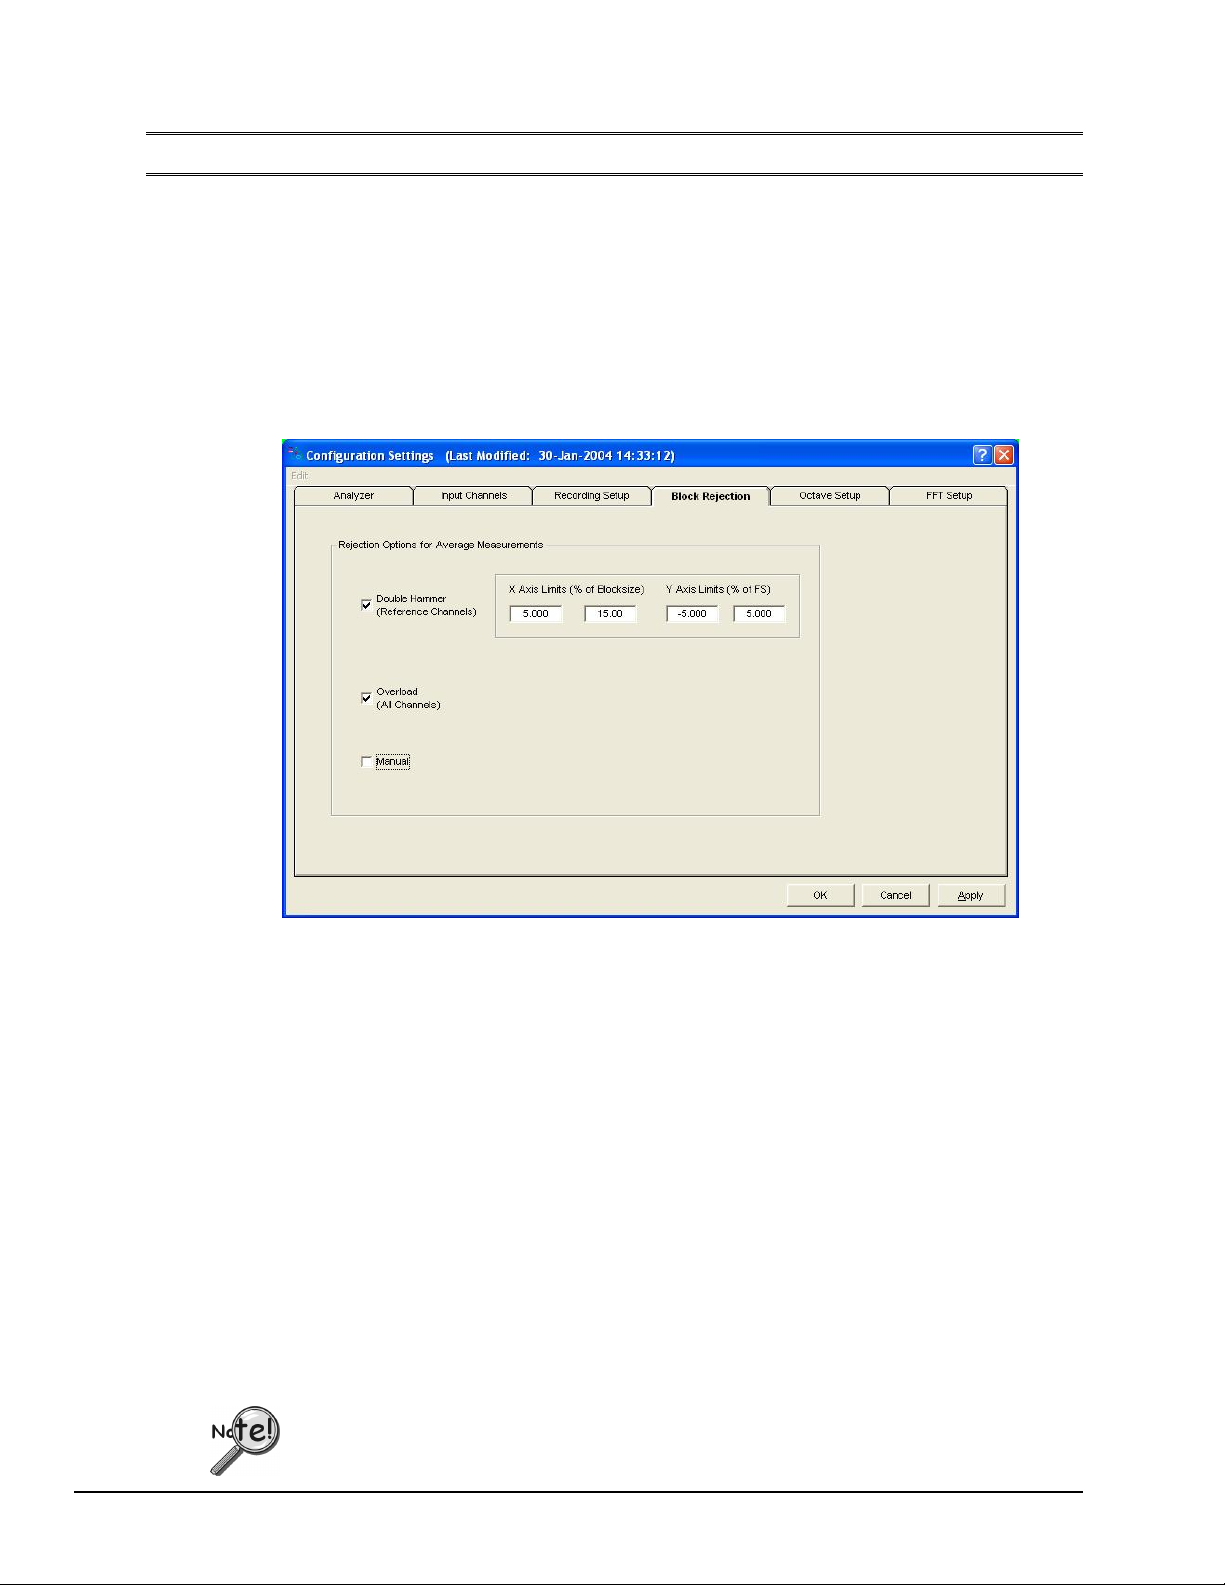
Edit Menu > Configuration > Block Rejection Tab eZ-Analyst Only
The Block Rejection Tab exists to allow the software (or user) to reject blocks of data that
result from hammer double strikes, overloads, or simply because the data block “doesn’t look
right.” There are three block rejection modes: Double Hammer protects measurements
against double hammering. Overload protects the measurement by automatically rejecting
overloaded data, and Manual allows you to inspect a measurement and optionally reject it.
You can select any or all of the rejection modes. Also see: Considerations Regarding Double
Hammer Rejection, page 4-23.
Note: The Block Rejection panel is only active when in “Measurement Mode.”
When in “Playback” mode the panel fields will be grayed-out.
Block Rejection Tab
Block rejection looks at the acceptable parameters for a block, and rejects blocks that do not
meet those parameters.
Double
Hammer:
Overload: An overload is any input signal that reaches or exceeds the specified input Full
Manual: This option allows you to review each block of data before acquiring the next
A double hammer occurs when a signal goes outside of the acceptable range that
is set up in the Hammer Rejection section. Click in the Double Hammer box to
turn the Double Hammer option ON and OFF. When the box is checked, the
option is ON.
Scale range. Click in the Overload box to turn the Overload Rejection option ON
and OFF. When the box is checked, the option is ON.
block. When manual rejection is selected, a <Reject?> button is activated in
the main window. At the end of each average, if you want to reject that
measurement, click on the <Reject?> button. eZ-Analyst will then reject the
current frame of data. The data and average counter will go back to the previous
measurement. Click in the Manual box to turn the Manual option ON or OFF.
When the box is checked, the option is ON.
Block Rejection is used in conjunction with Capturing Transient Data (Input
Channel triggering) and Averaging. These topics are discussed on pages 4-7
and 4-9, respectively.
4-22 Edit Menu 969795 eZ-Analyst
 Loading...