

Page 1
IOtech
www.iotech.com
eZ-NDT version 6.0.9
USER’S MANUAL
Software for Non-Destructive Testing
25971 Cannon Road
Cleveland, OH 44146-1833
(440) 439-4091
*372163C-01*
372163C-01 1086-0924 rev 9.2
productsupport@iotech.com
Fax: (440) 439-4093
sales@iotech.com
Page 2

ii
Page 3

Contents
1 - Introduction
2 - Investigative Mode Testing
3 - Inspection Mode Testing
4 - Windows and Menus
Main Window …… 4-1
Graphical Display …… 4-6
File Menu …… 4-8
Edit Menu, Configuration …… 4-10
Acquisition Tab …… 4-10
Input Channels Tab …… 4-11
Automation Tab …… 4-14
Edit Menu, Limits …… 4-17
Edit Menu – Display and General Options …… 4-18
Display Preferences ……4-18
Copy Window …… 4-18
Load Picture ……4-18
Remove Picture …… 4-18
Erase History File ……4-18
Erase Template File …… 4-18
Menus with Associated Window Panels ….. 4-19
Project …… 4-19
Control …… 4-19
Display …… 4-19
View …… 4-19
Report Menu …… 4-20
User Menu …… 4-25
Notes for Efficient use of eZ-NDT …… 4-26
5 - Setting Limits
eZ-NDT 938895 iii
Page 4

This page is intentionally blank.
iv
Page 5

Introduction 1
Reference Note:
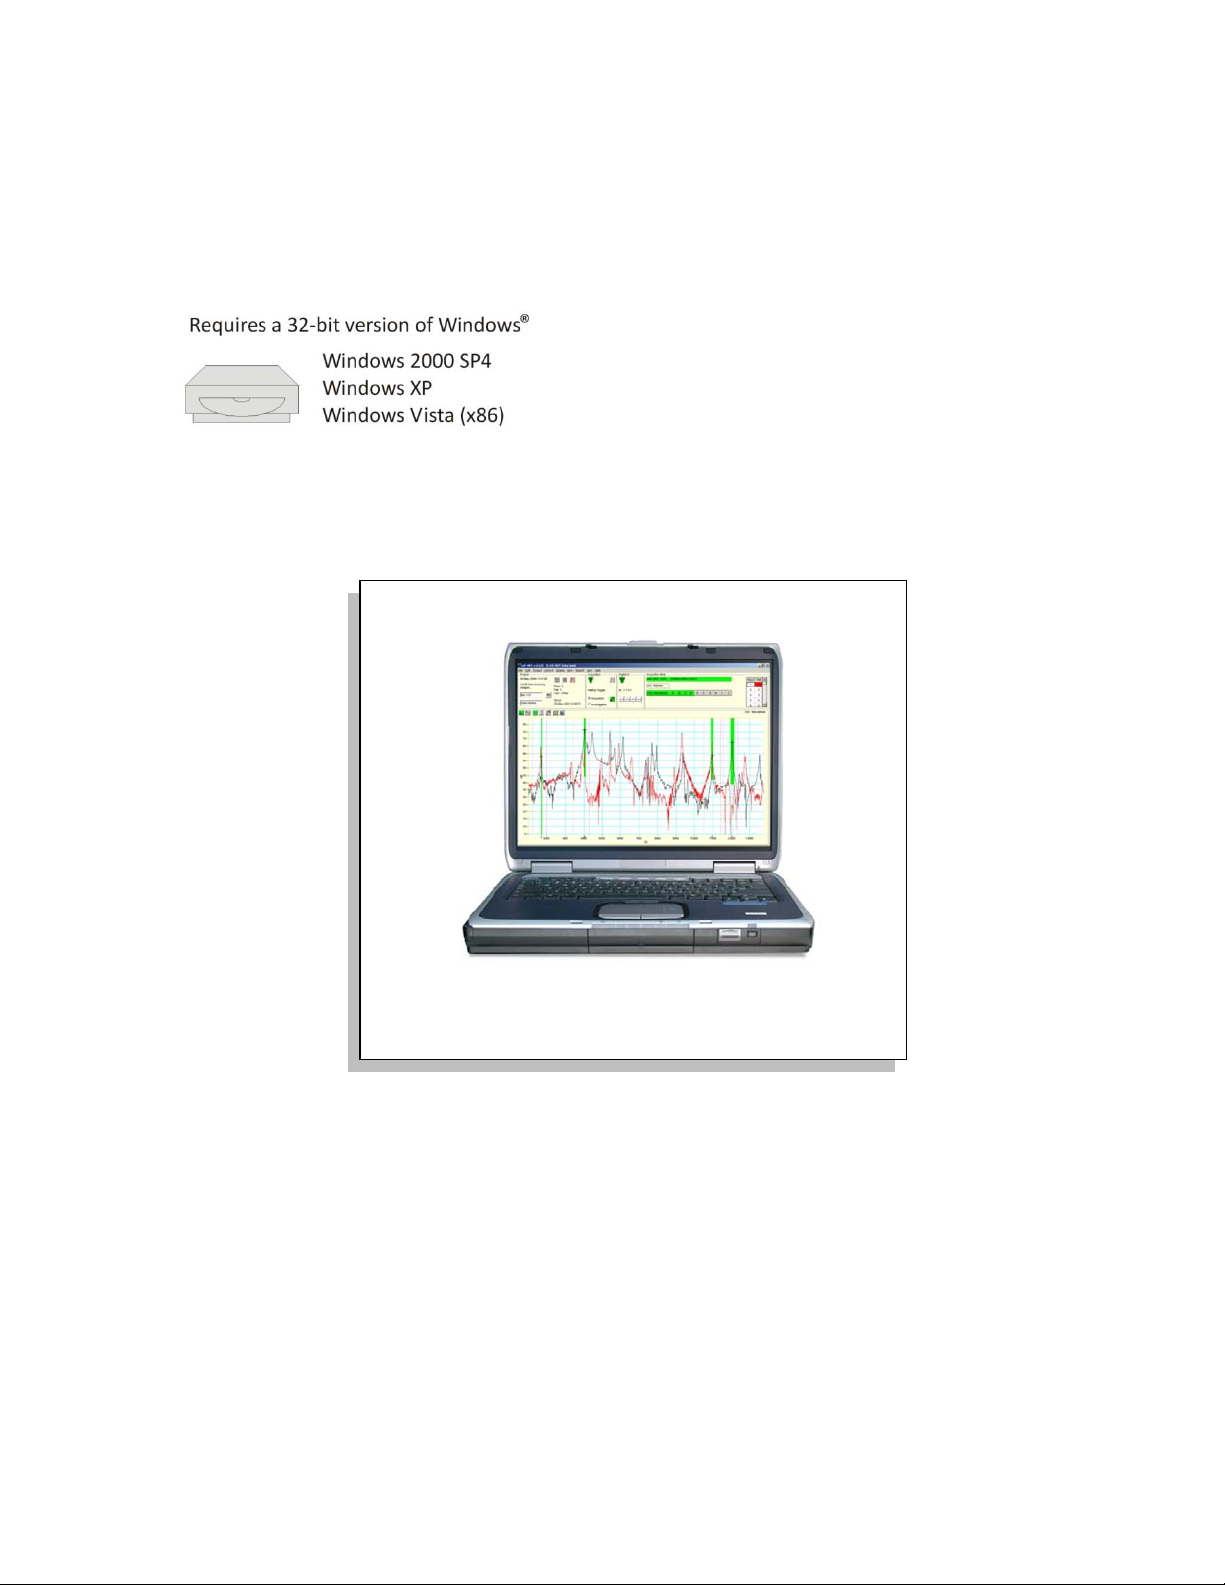
System Requirements
Minimum re quirement s include:
• Monitor: SVGA, 1024 x 768 screen resolution
• Requires 32-bit version of Windows: Windows 2000 SP4, Windows XP, or Windows Vista (x86)
Windows 2000 SP4 and Windows XP Users:
PC with Intel
Windows Vista (x86) users:
PC must be Windows Vista Premium Ready
What is eZ-NDT?
eZ-NDT is a non-dest ructive QA /QC inspecti on system based on the ZonicBook FFT. High frequency
vibration data is collected and compared against user-defined amplitude and frequency limits. A passed
(good) part will have the maximum spectral peak(s) within the defined limit band(s). A failed (bad) part
will have one or more spectral peaks outside the defined limit band(s).
™
Pentium 4 or equivalent; 1 GB memory; 10 GB disk space
If necessary, refer to your system’s associated hardware
manual for information regarding the following:
Software Installation
System Requirements
Hardware Setup
Driver Installation
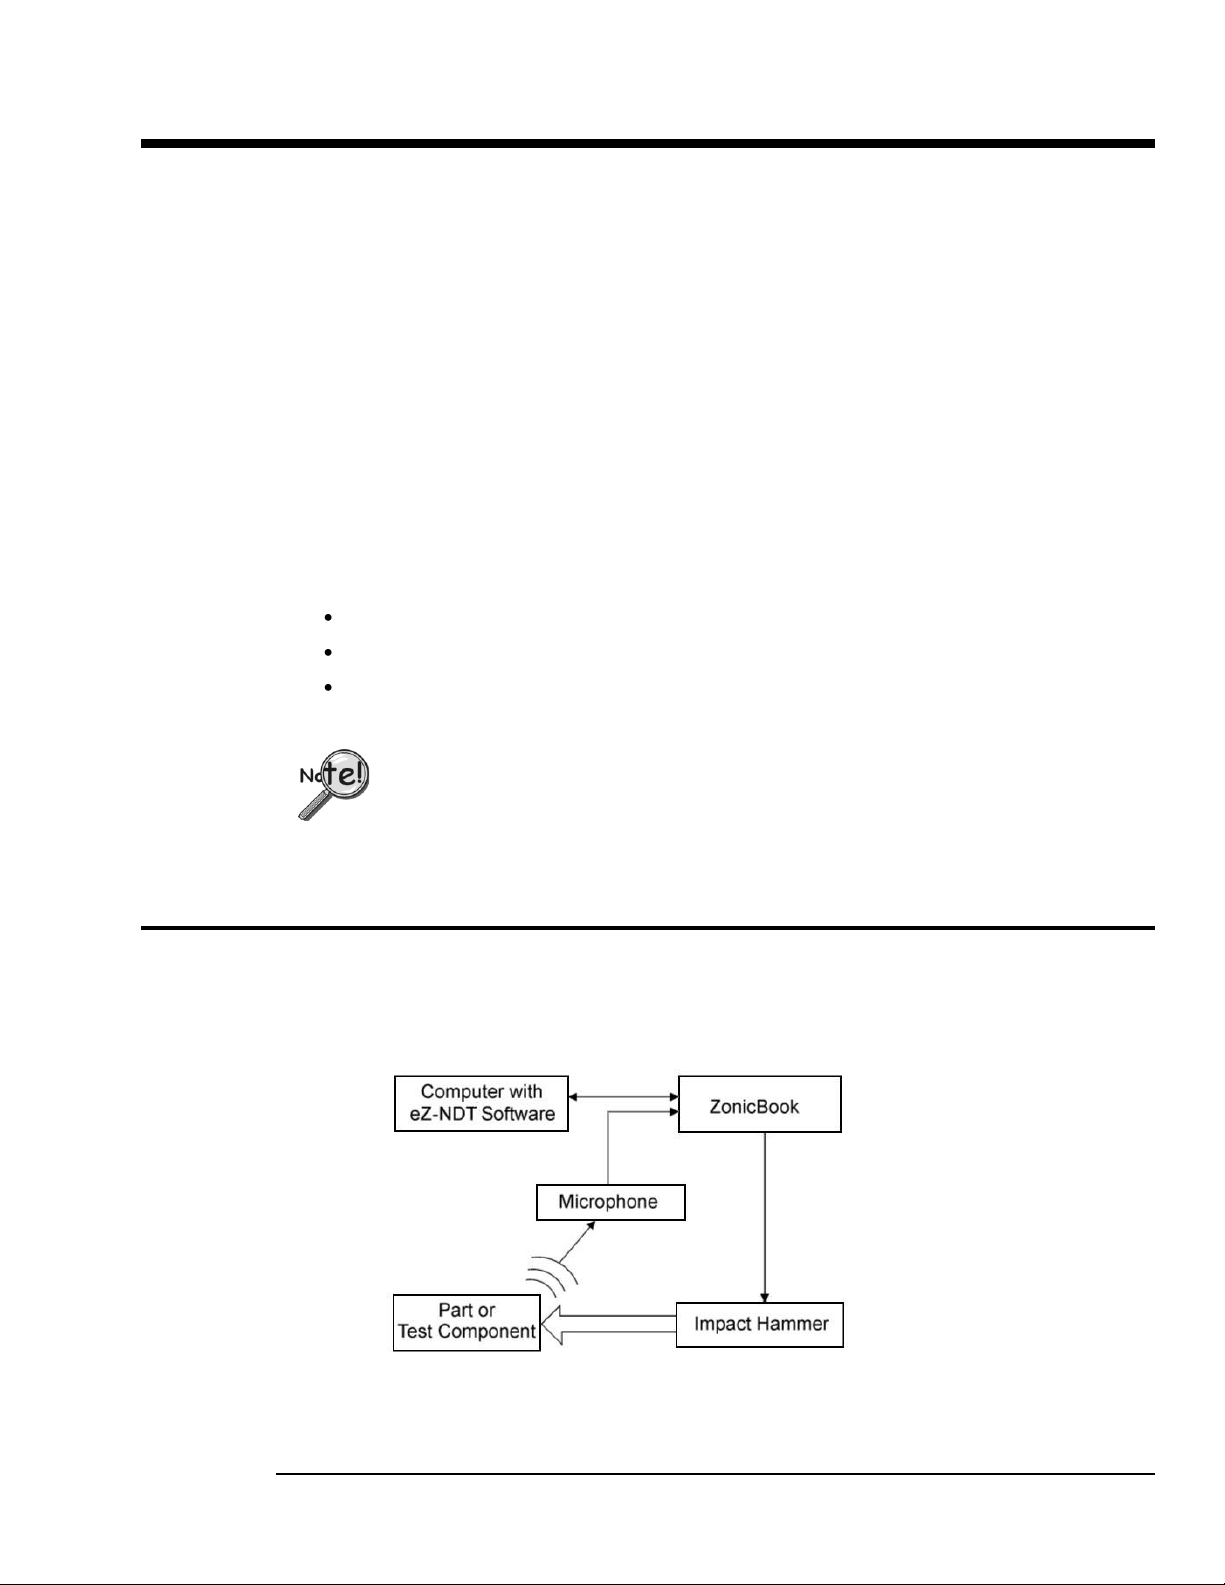
eZ-NDT systems typically include a computer running a Microsoft Windows 2000 SP4 or Windows XP,
an analyzer such as a ZonicBook FFT Analyzer, or an IOtech 640 or 650, one modal hammer, and one
response instrument, such as a microphone or an accelerometer.
Note: The term “ZonicBook” refers to a ZonicBook-Medallion and/or a ZonicBook/618E device unless
otherwise specified.
eZ-NDT has two modes: Investigation and Inspection.
The Investigation Mode is used to define the spectral acceptance regions. It is an iterative process that
compares the spectral frequency and amplitude differences between known Good and Bad parts.
Limit bands are defined based on vibration peaks that occur in the tests of “good” parts, but not in the tests
for “bad” parts. Aft er the limits are defined all the parts are tested to ensure t hat:
• all the “good” parts pass and
• all the “bad” parts fail
Some fine-tuning ma y be required.
When test results are consistent, you are ready to start testing pro duction parts in the Inspection Mode.
Typically, good parts should have a consistent spectral response, in other words, a good repeatable pattern.
A shift or change in spectral pattern indicates a change in the part’s Mass, Stiffness, or Damping. These
changes often indicate a problem with the part.
To ensure repeatable results make certain that setup conditions are consistent;
for example: the Impact Location and Force of hammer strike.
When an automated system is used, there are additional process considerations.
These are typically addressed and configured at the factory prior to shipment.
eZ-NDT 988390 Introduction 1-1
Page 6
Multiple user levels exist for project protection. Level 3 is for the manager and allows complete access to
the System. Level 2 is for the technician and Level 1 is for the inspector. Levels 1 and 2 do not permit
configuration modifications, among other limitations.
The first time eZ-NDT is executed it will automatically load the default configuration parameters into the
“Project Template”. The template is located in the Windows directory in which eZ-NDT was installed .
You should consider an “eZ-NDT Project” equal to a unique Part that you wish to test. For example, if you
manufacture Widgets and Gizmos, you would have 2 separate eZ-NDT projects, one for Widgets and one
for Gizmos.
Each eZ-NDT project is saved in one project file with the extension “.ndt.” Thus the widget project could
be named “widget.ndt” and the gizmo project could be named “gizmo.ndt”.
Each eZ-NDT project is saved in one project file with the extension “.ndt.”
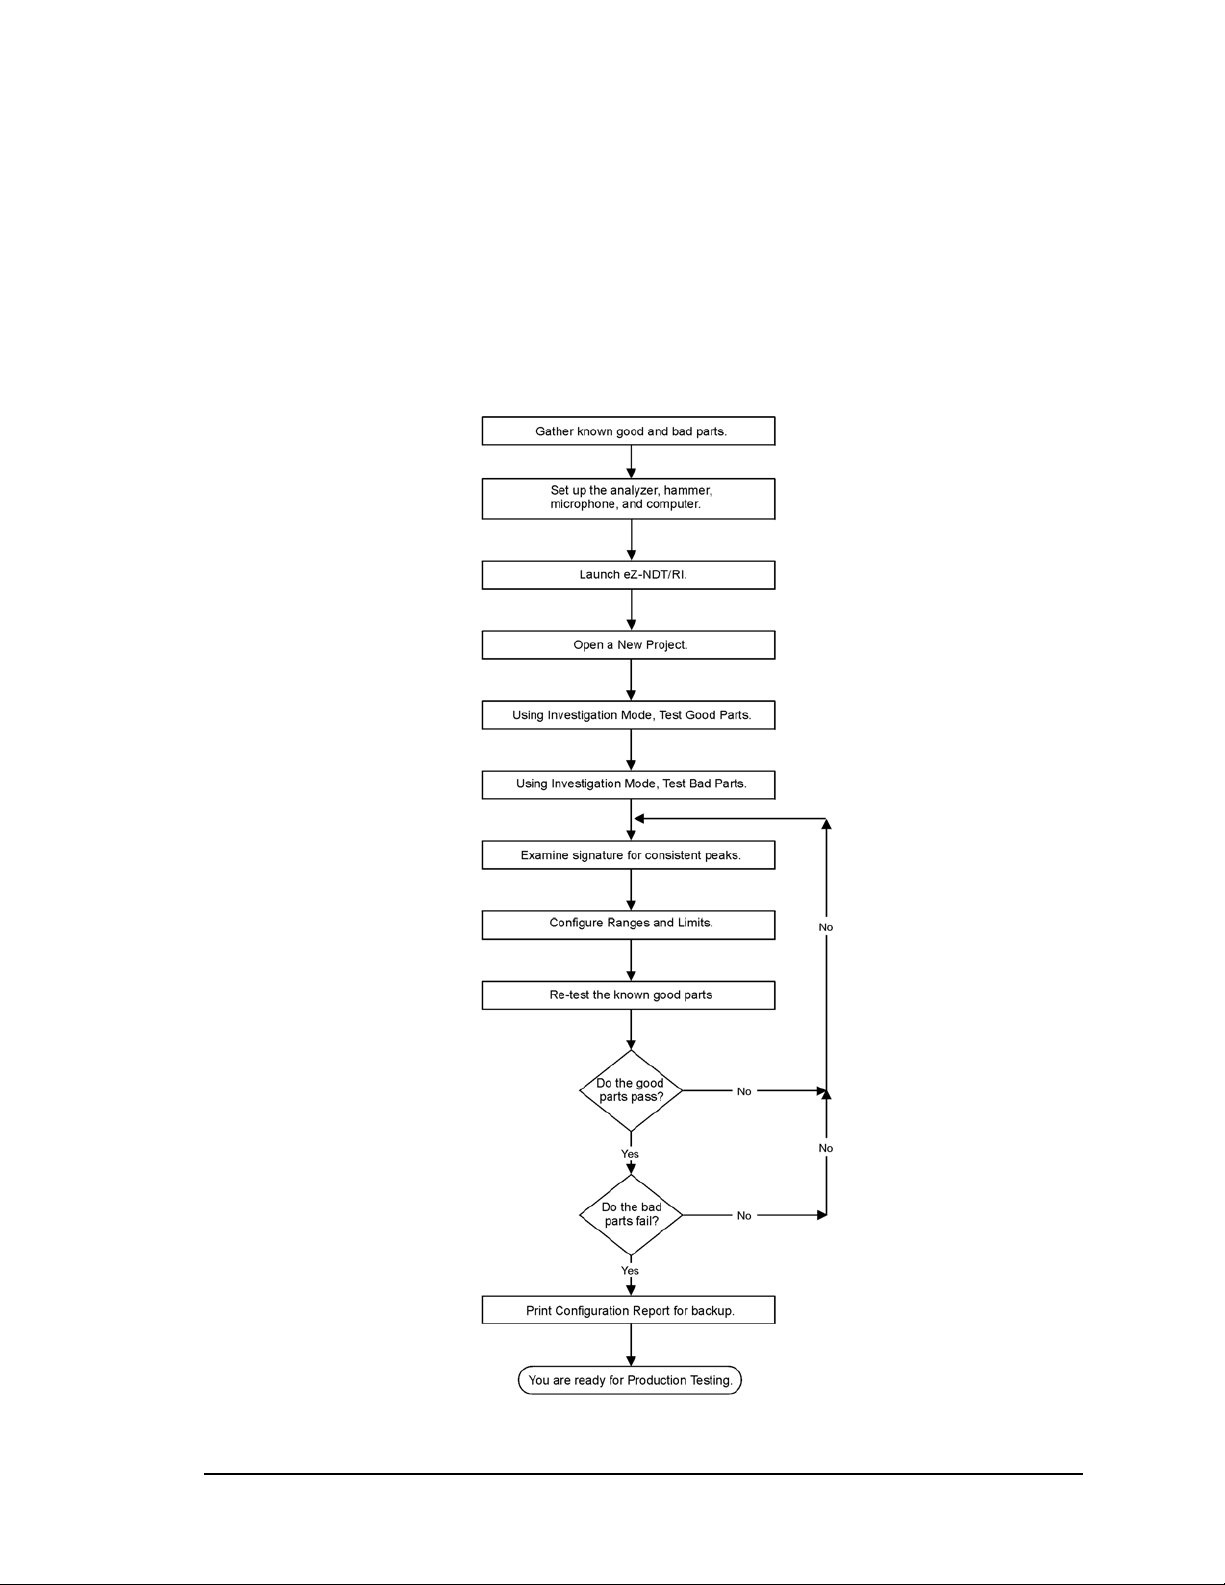
eZ-NDT, Operation Sequence
1-2 Introduction 958194 eZ-NDT
Page 7
Investigation Mode Testing 2
To ensure repeatable results make certain that setup conditions are consistent;
for example: the Impact Location and Force of hammer strike.
When an automated system is used, there are additional process considerations.
These are typically addressed and configured at the factory prior to shipment.
1. Gather known “good” and “bad” parts ……2-1
2. Set up the analyzer, hammer, microphone, and computer …… 2-1
3. Launch eZ-NDT …… 2-2
4. Open a New eZ-NDT Project …… 2-3
5. Select Investigation Mode …… 2-4
6. Configure the Analyzer …… 2-4
7. Select Plot Display Type …… 2-4
8. Turn on Data Acquisition ……2-4
9. Test All Good Parts …… 2-4
10. Test All Bad Parts ……2-6
11. Compare the Results of Good and Bad Tests ……2-7
12. Configure the Limits …… 2-7
13. Verifying the Limits and Ranges …… 2-9
The following process can be used to determine whether eZ-NDT testing is feasible for the part that is
being tested. Typically this is an iterative process in which the user:
establishes the resonant signature of the part
determines the distinct peaks of the signature
uses the peaks to set up eZ-NDT test criteria
1. Gather known “good” and “bad” parts.
Locate both good and bad parts. Typically 10 of each are sufficient. Make sure the Bad parts include all
possible reject (failure) modes. The good parts will be used to test for NDT feasibility.
Block Diagram of Typical NDT Setup
eZ-NDT 938691 Investigation Mode Testing 2-1
Page 8
2. Set up the analyzer, hammer, microphone, and computer.
Reference Note:
If necessary, refer to your hardware user’s manual as applicable for information regarding:
Software Installation
System Requirements
Hardware Setup
Driver Installation
Connect your analog input signals to the analyzer (e.g., ZonicBook/618E, 640, or 650 device) BNC inputs.
Configure the analyzer as needed.
a. Connect the Impact Hammer to Channel 1.
b. Connect the Microphone to Channel 2.
c. Place the microphone within range of the output.
3. Launch eZ-NDT.
To run eZ-NDT, double-click the eZ-NDT icon or use your Windows desktop Start button to navigate to
the program file.
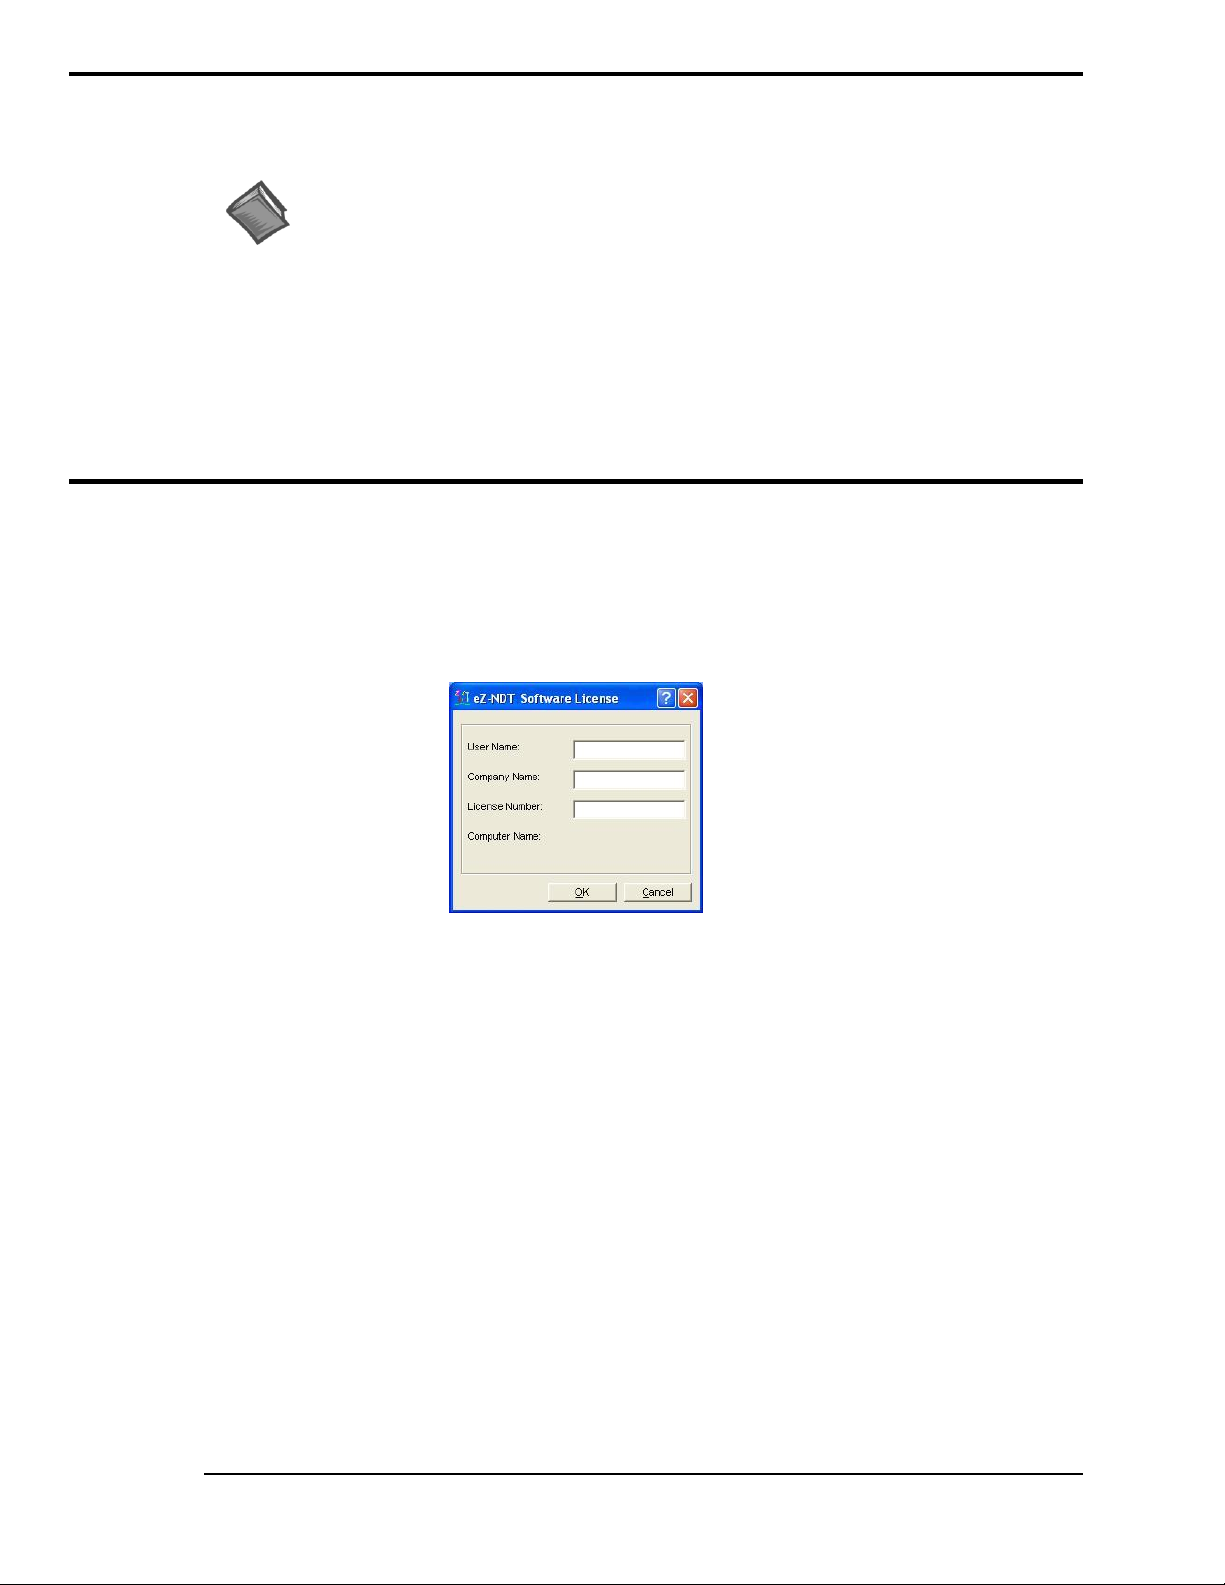
First Time Running eZ-NDT
Registration Form
Note: After you have completed the following steps, each succeeding time that you start eZ-NDT you will
be taken immediately to the main screen.
A registration form will open the first time you run eZ-NDT. You must complete the information in this
form to enable the eZ-NDT application.
The password accompanies your CD-ROM. You will not have to re-enter this information again, unless
you upgrade to a newer version, or have to re-install eZ-NDT.
2-2 Investigation Mode Testing 938691 eZ-NDT
Page 9
Because multiple eZ-NDT Projects will exist on your computer we suggest you create project
folders to organize and save your files. These folders can be located anywhere on your system.
eZ-NDT will open to its main screen, as indicated below.
4. Open a New eZ-NDT Project.
Each eZ-NDT Project contains configuration and data files. You should logically equate an eZ-NDT
project with a specific part that you wish to inspect.
a. On the File menu select New Project to open the “Save As” window.
b. Select a folder for your eZ-NDT Project or create a new folder.
eZ-NDT Main Window
Save As Dialog
eZ-NDT 938691 Investigation Mode Testing 2-3
Page 10
If you created a new folder...
DO NOT use NDT.ndt as a filename. NDT.ndt is the default template. A good file
name is on that identifies the part, for example, part232.ndt.
If you have tested both good and bad parts, and you do not see a difference between them,
you may need to modify one or more of the configuration values. Increasing the Trigger
Delay is the most common solution.
Spectrum/FRF Display
With “New Folder” highlighted, type a name for the Project Folder. Then, double-click on the folder to
open it. This is where you will save your new project files.
c. Type a filename for the project, including the file extension, in the File name data entry box.
i.e. part234.ndt
d. Click the Save button to create the new project. Now all the files for this project will be saved in the
folder you just used.
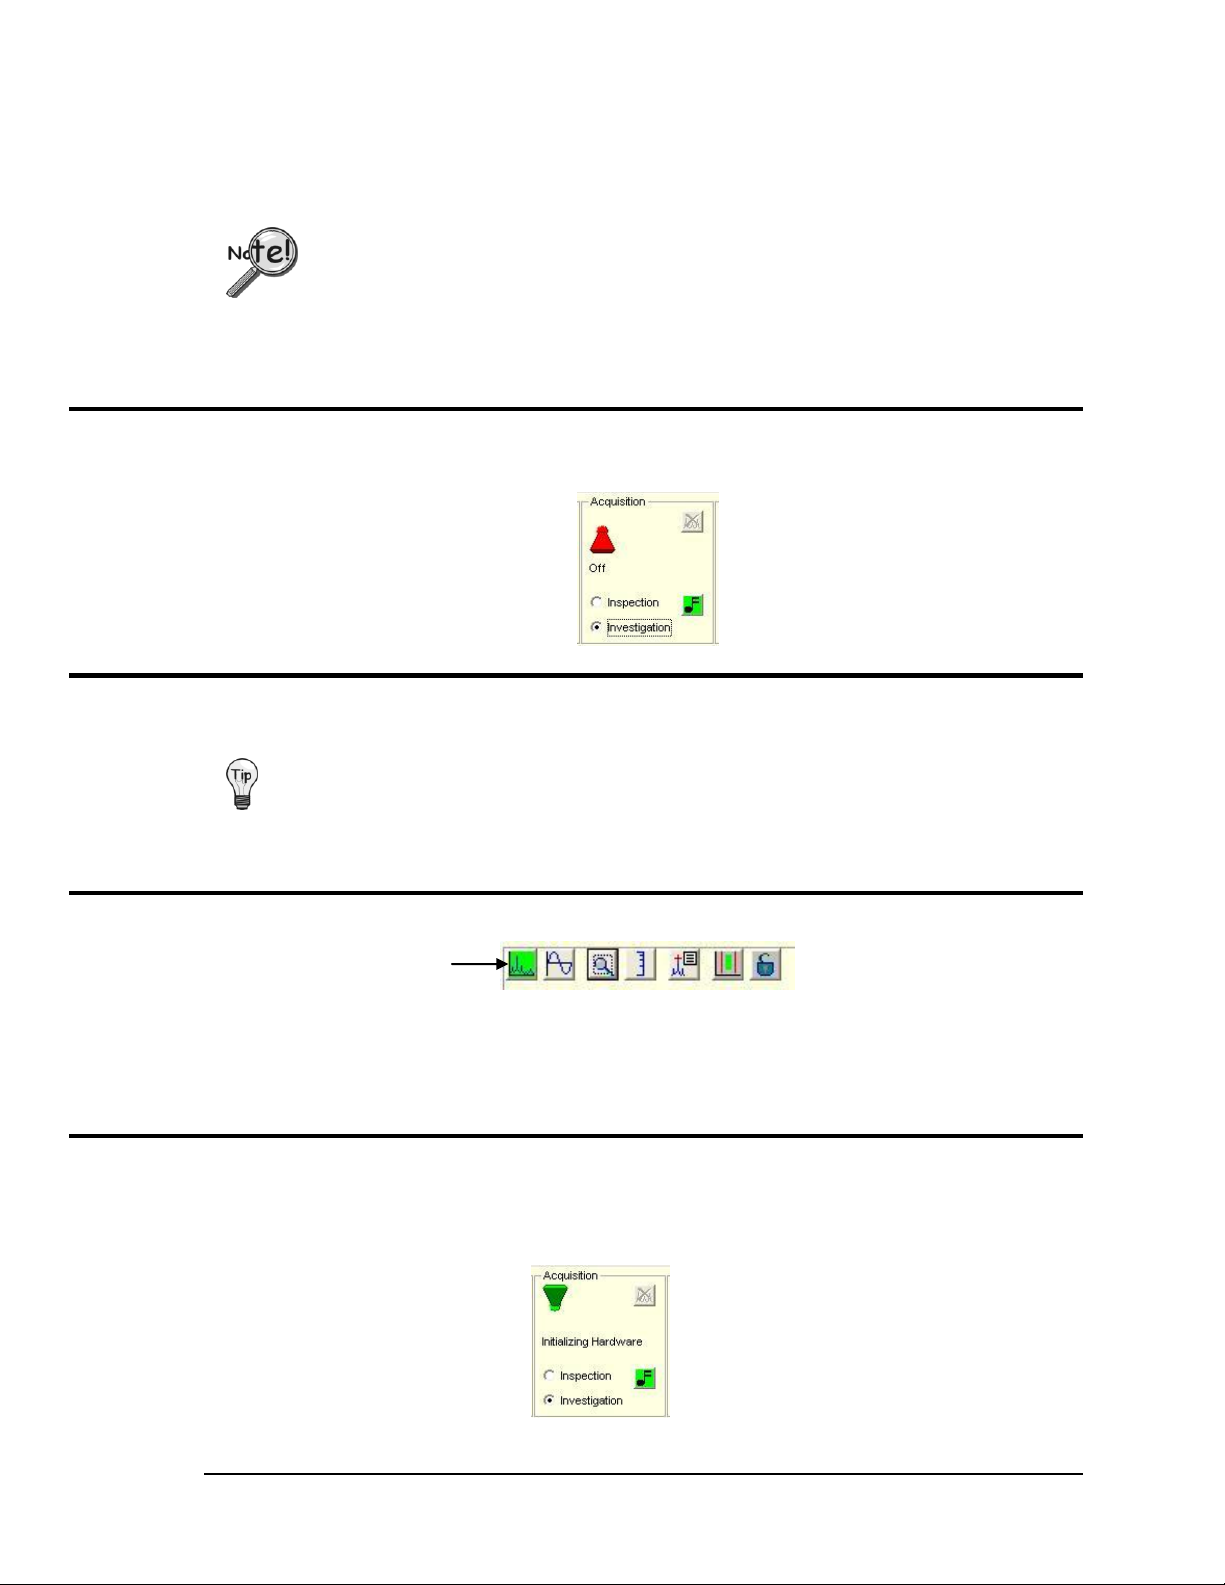
5. Select Investigation Mode.
On the main screen select Investigation Mode.
6. Configure the Analyzer.
To start use the default values.
7. Select “Spectrum/FRF Display” as the Plot Type.
The plot display types are selected by clicking on one of the first two buttons. The first button on the left is
“Spectrum / FRF Display.” The second button is “Time Display.”
For our “Investigation Mode” we want to use the “Spectrum/FRF Display” for the type of plot. Click on
the Spectrum icon (first button).
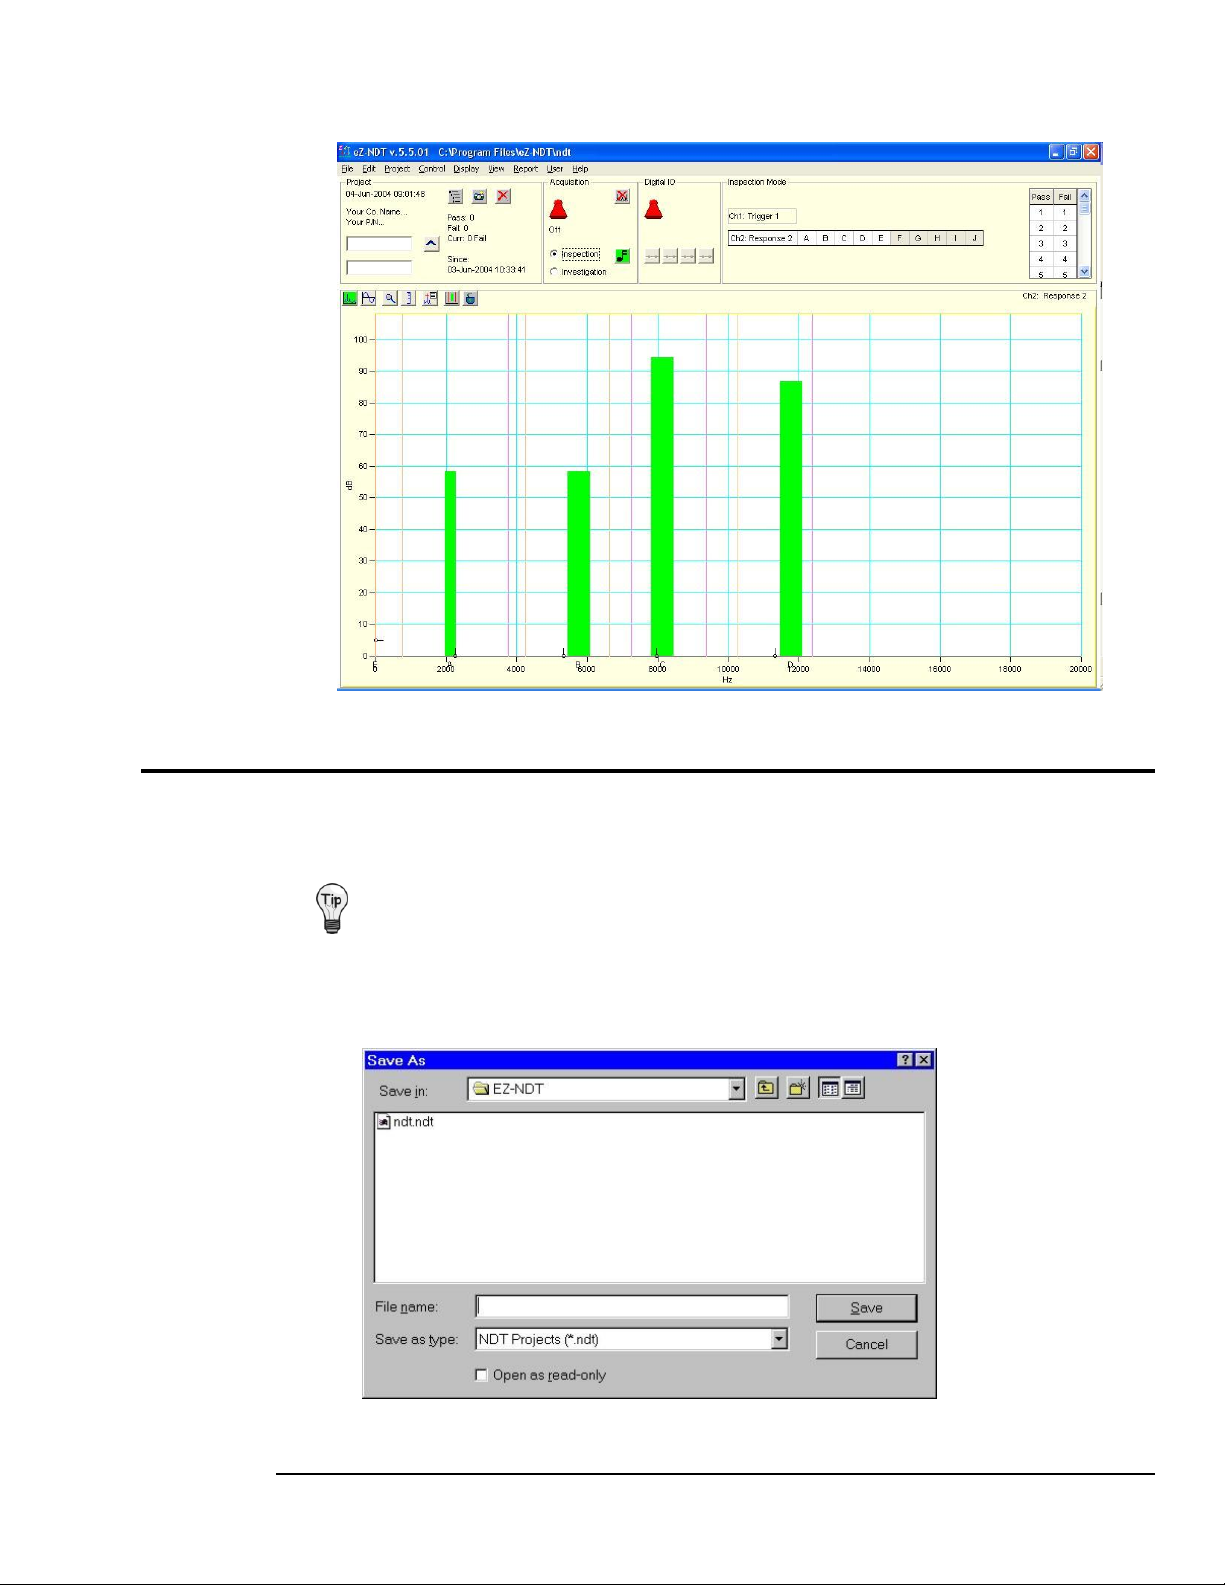
8. Turn on Data Acquisition.
To initialize the hardware and turn on the data acquisition, click the red toggle switch in the Acquisition
panel of the Main window. The toggle switch will flip up and change from red to green. Prior to
proceeding, wait for the status to change form “Initializing Hardware” to “Ready.”
2-4 Investigation Mode Testing 938691 eZ-NDT
Page 11
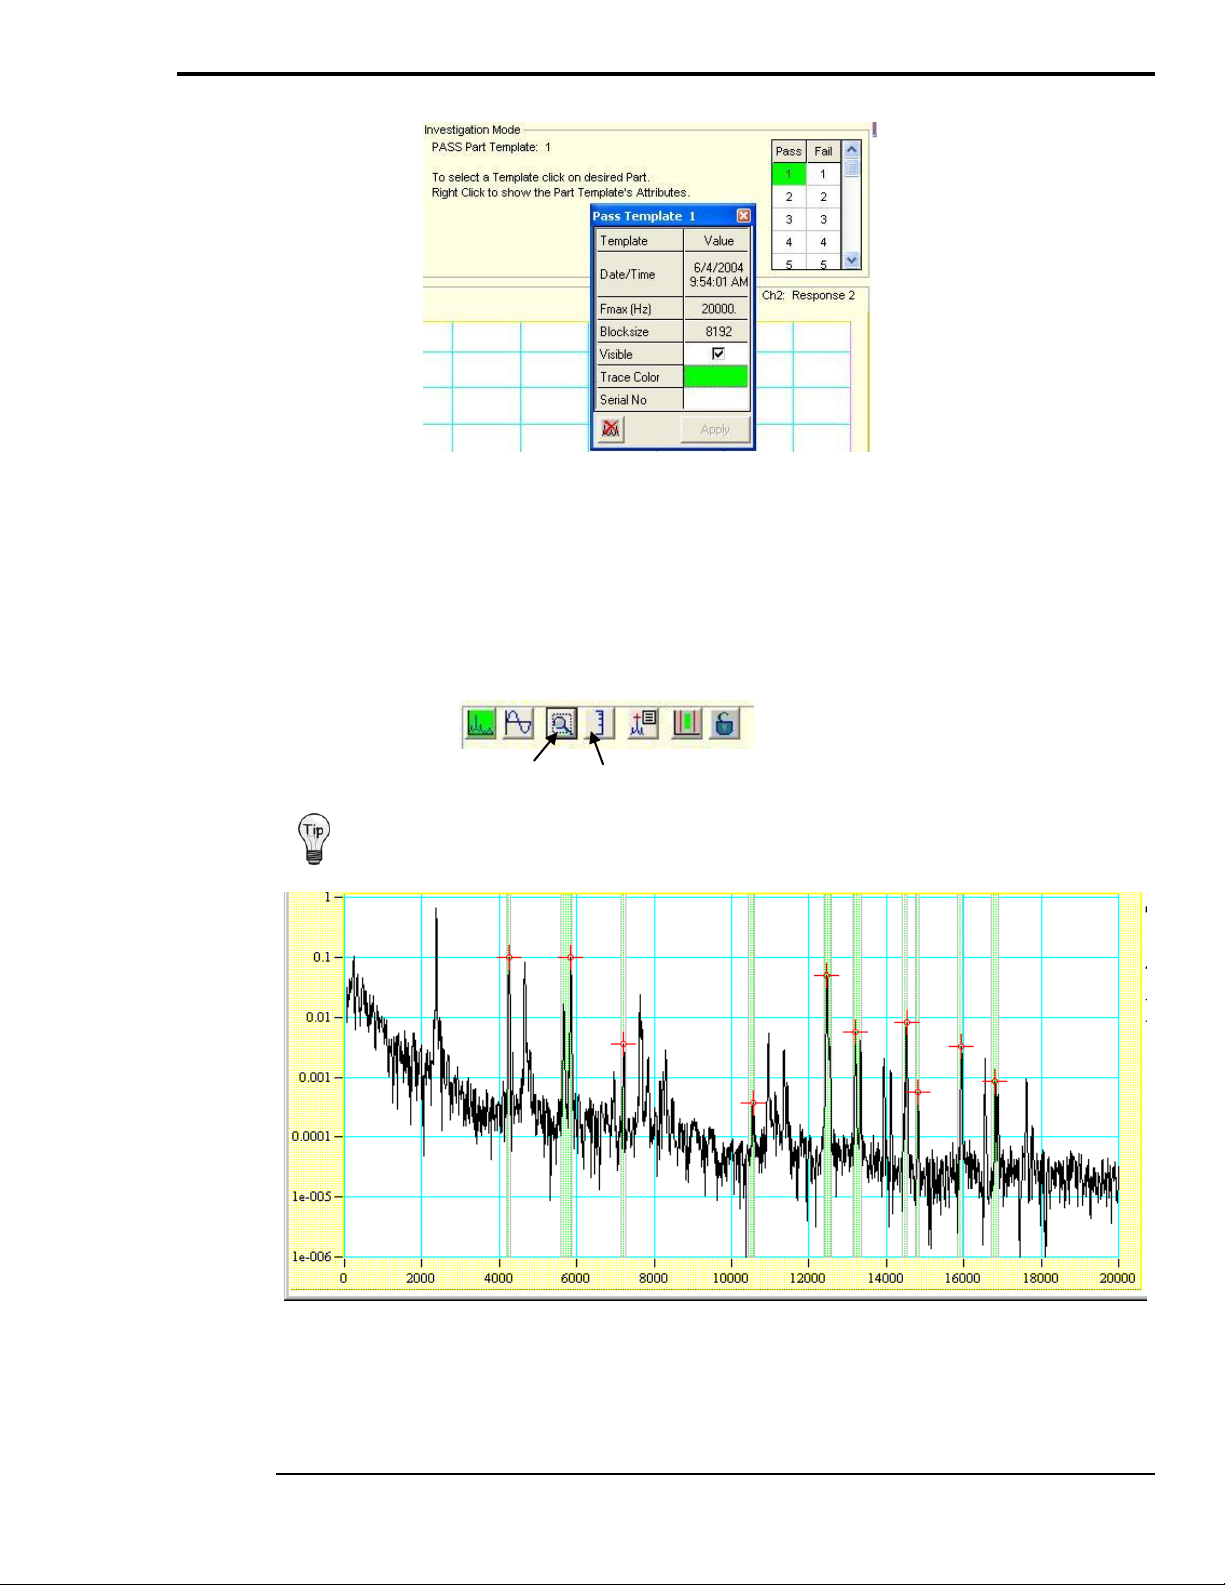
9. Test all “Pass” (Good) Parts.
Use of the logarithmic scale (Log Scale Y Axis button) tends to enhance the peaks. This makes
it easier determine significant peaks.
Investigation Mode, Pass Part Template
To test all “Pass” (Good) parts:
a) Select the Pass parts in the grid (see figure, upper right). Note that you can right-click on a part
number, e.g., “1” to access its associated template.
b) Strike the parts several times at a consistent location with a consistent amount of force.
c) If you do not see anything on your plot, click on the <Autoscale> button, or the <Log Scale Y Axis>
button, to expand the y-axis.
Autoscale Log Scale Y Axis
Linear Scale of Initial Strike
d. Click the Autoscale button to have the Y axis minimum and maximum scaled to the data
eZ-NDT 938691 Investigation Mode Testing 2-5
Page 12
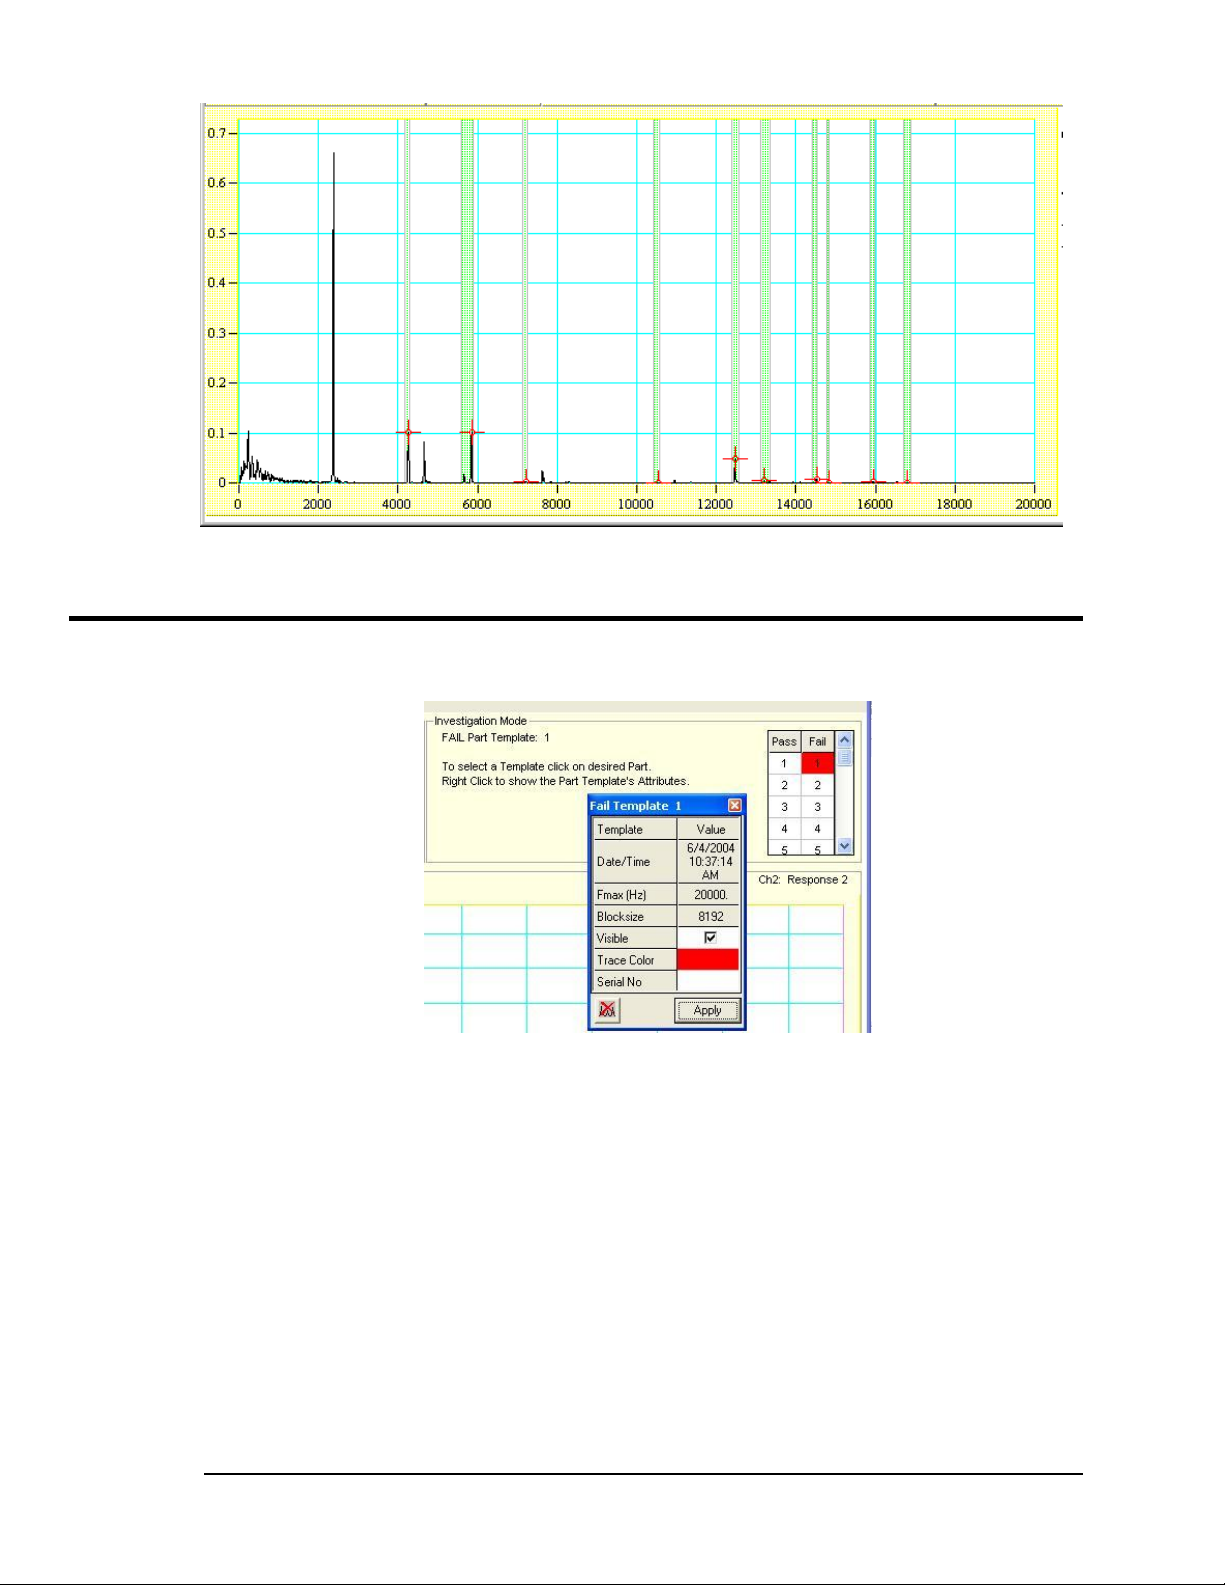
10. Test all “Fail” (Bad) Parts.
Autoscale of Initial Strike (Logarithmic Scale)
Investigation Mode, Fail Part Template
To test all “Fail” (Bad) parts:
a) Select the “Fail” parts in the grid (see figure, upper right). Note that you can right-click on a part
number, e.g., “1” to access its associated template.
b) Strike the parts several times at a consistent location with a consistent amount of force.
c) If you do not see anything on your plot, click on the <Autoscale> button, or the <Log Scale Y Axis>
button, to expand the y-axis.
2-6 Investigation Mode Testing 938691 eZ-NDT
Page 13
Because this process detects internal, non visible defects, you may have an occasional
part fail, which you thought was a “Pass” part.
If you do not need all four of the limit bands, remove the extra ones. Instructions for removing and
adding limit bands follow.
11. Compare the Test Results of Pass and Fail Parts.
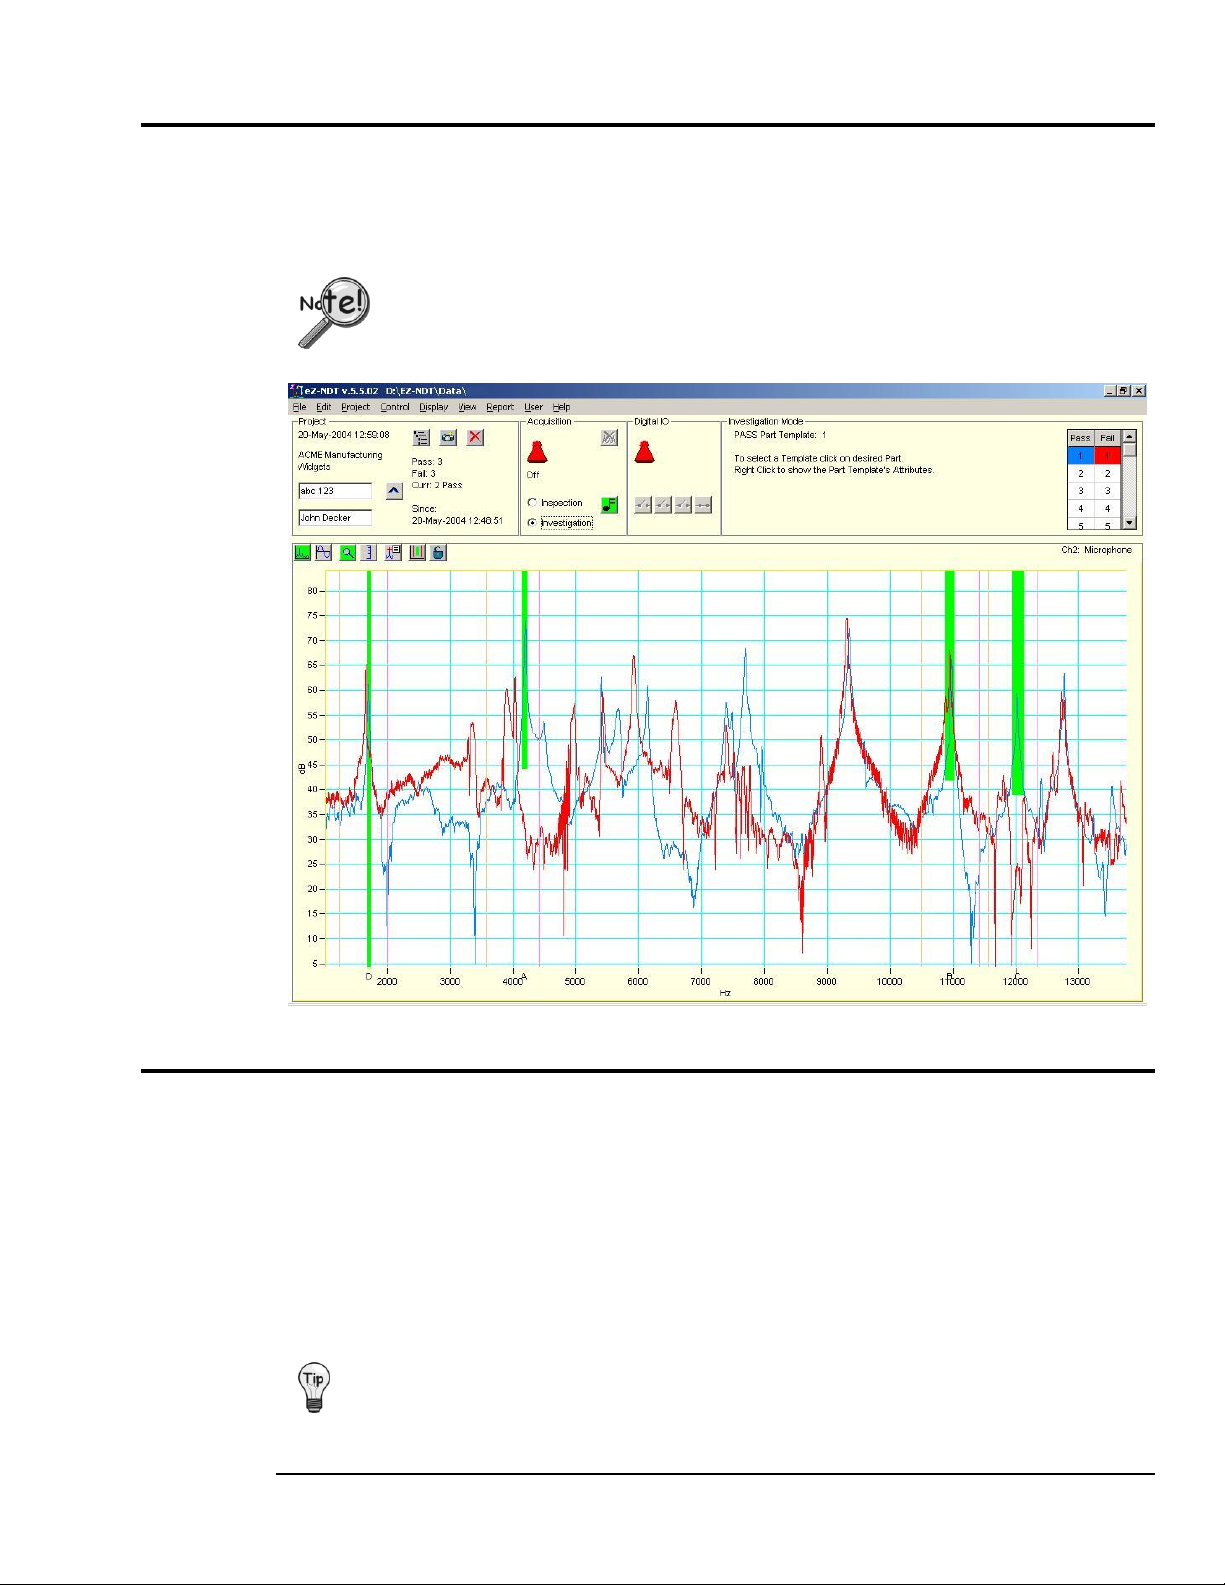
Visually locate the spectral differences between the Pass and Fail parts. You should be looking for
resonant peak(s) that shift in frequency (e.g., red lines to the left or right of the blue line) and/or amplitude
(red lines shorter or taller than the blue line). If blue and red peaks are almost identical, they are probably
not good choices. Ideally you will find significant single peaks.
Using Investigation Mode, Comparing a Good Part to a Bad Part
12. Configure the Limits.
Modify the limit bands to match the “Pass” part’s spectral peaks that you want to use. As mentioned earlier,
this is an iterative process. Quite often, some of your “Pass” parts will fail with these exact limits the first
time.
eZ-NDT will find the maximum spectral amplitude in a frequency range. If this point is in the defined limit
region, the range status is “Pass.”
The default step includes four limit bands, already placed on the plot. These limit bands are green
acceptance limits [peaks for subsequently tested parts must be within these limits to be counted as “Pass”
parts]. Working from left to right, drag the first band to the first peak you want to use. Next, drag the
second band to the second peak you want to use, etc.
eZ-NDT 938691 Investigation Mode Testing 2-7
Page 14
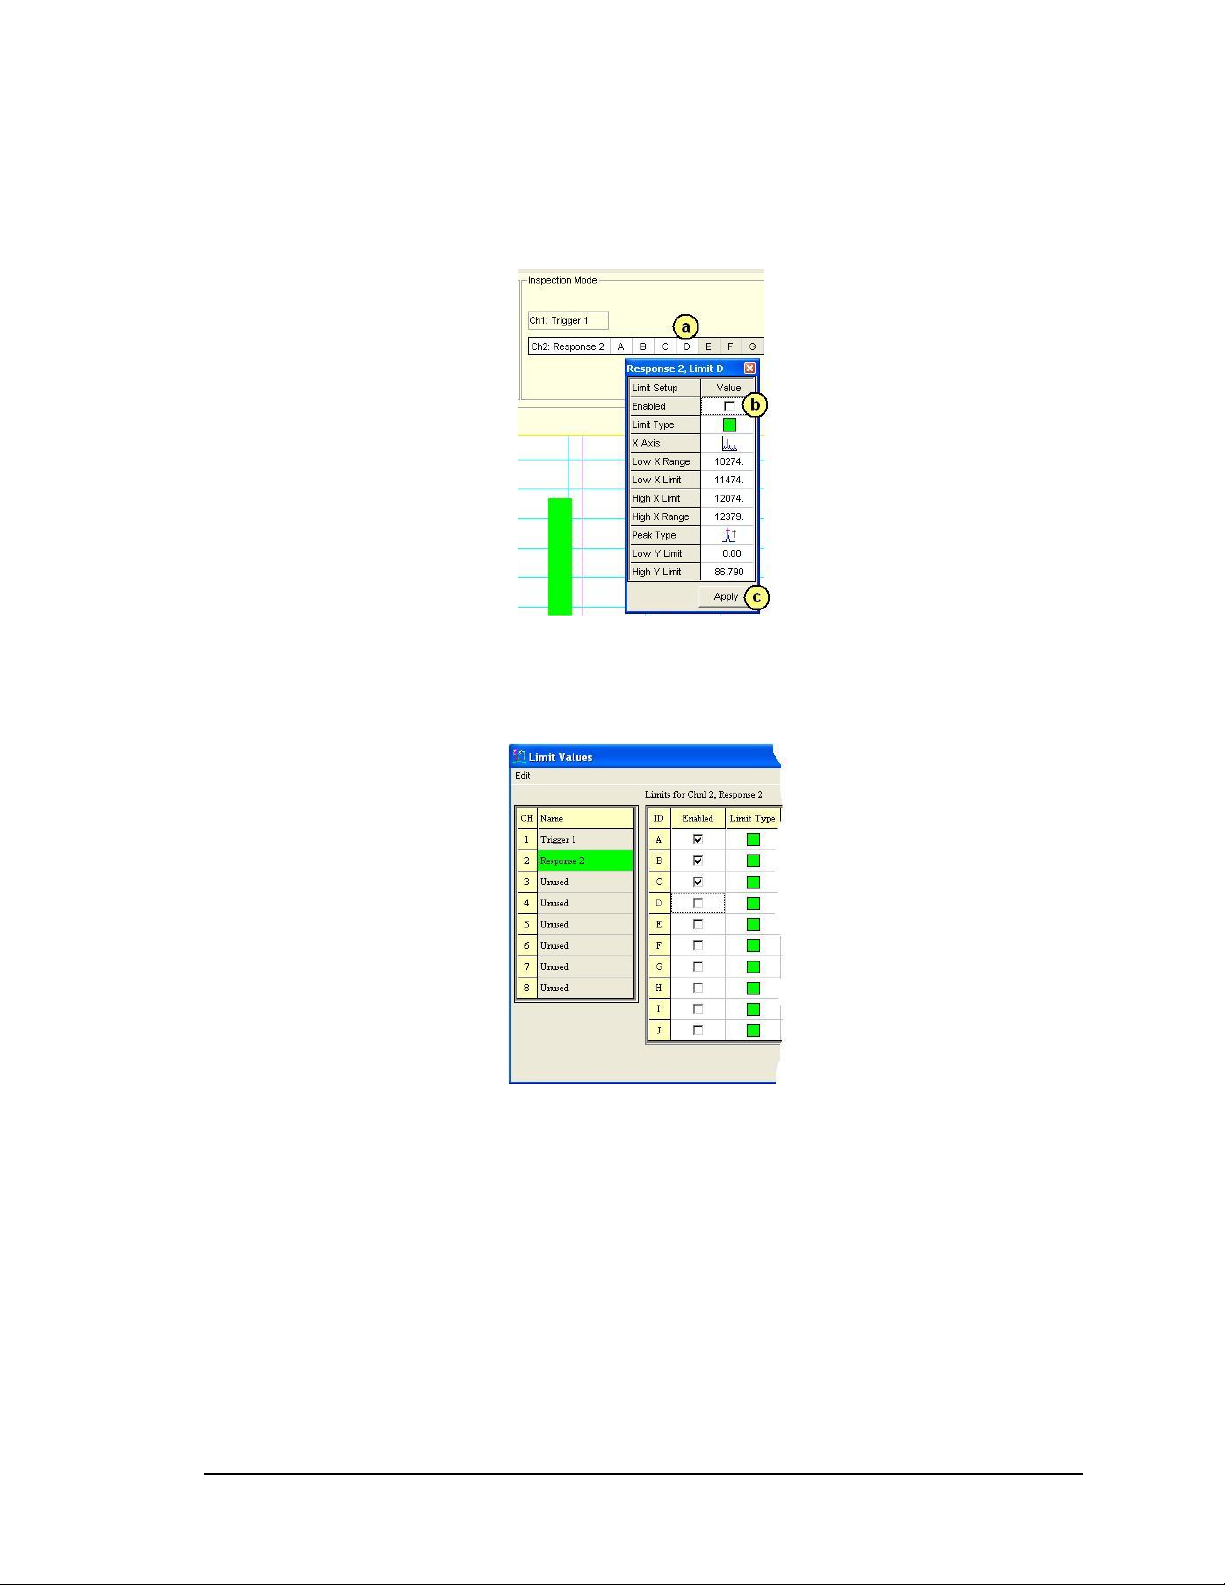
To remove a Limit Band from the plot:
a) Right-click on the Limit Band’s associated letter. Each enabled limit band has a letter in a white box
(see figure).
A property box will appear. In the figure below Limit D is being selected.
b) Remove the checkmark from “Enabled.”
c) Click the <Apply> button.
Removing a Limit Band
Note: Limit bands can also be added or removed via the “Limits” selection within the Edit pull-down
menu. The difference in using the Edit menu’s “Limits” selection is that all properties (for all limit
bands) are displayed at the same time [instead of one at a time]. See following figure.
Limit Values Window, Partial Display
Limit Bands can be “Enabled” and “Disabled” from the first column.
To add a Limit Band to the plot:
a) Right-click on a disabled Limit Band’s associated letter. Note that disabled limit bands are designated
as letters in gray boxes
A property box will appear.
b) Add a checkmark to the “Enabled” property.
c) Click the <Apply> button. The new limit band will appear on the plot display.
2-8 Investigation Mode Testing 938691 eZ-NDT
Page 15
Note: Limit bands can also be added or removed via the “Limits” selection within the Edit pull-down
menu. The difference in using the Edit menu’s “Limits” selection is that all properties (for all limit
bands) are displayed at the same time [instead of one at a time].
Note: Up to ten limit bands can exist on a plot.
13. Verify the Limits and Ranges.
a. Switch to Investigation Mode.
b. Test all the known “Pass” (Good) and “Fail” (Bad) parts. Look for consistent results.
If parts pass and fail as expected . . .
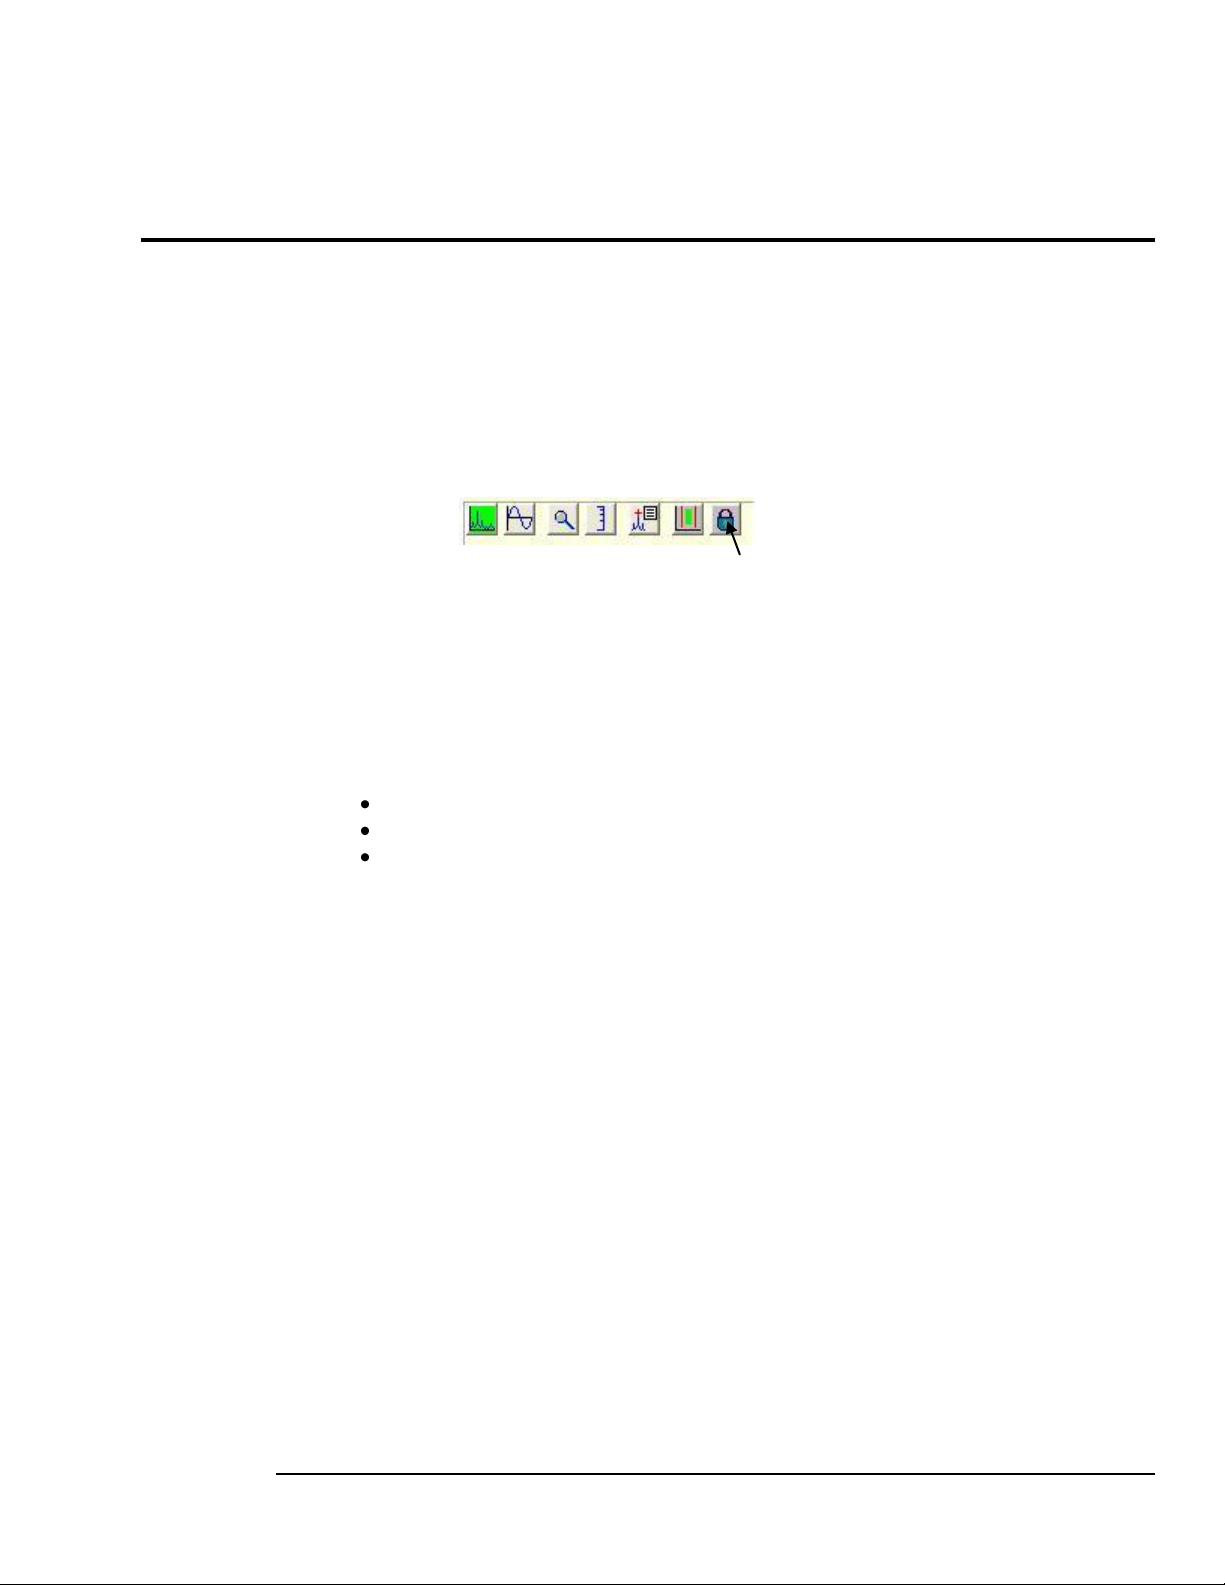
You are ready to run tests on production parts. If this is the case ensure that the “Graphical Limit
Changes are Disabled” (locked padlock) image is showing (following figure). If the padlock image is
open, click on it to lock in the limit bands at their current settings.
Graphical Limit Changes
If good parts fail and/or bad parts pass . . .
Are any peaks just a fraction out of range? If so, tweak those limits.
Are there peaks that you missed the first time? Add one or more limit bands.
Are there two peaks that are fairly close, one within the band and one just outside it?
Sometimes you will have 2 closely spaced peaks. These peaks will “fight” for dominance.
In this type of case you can either:
remove the entire range
widen the range to include both peaks, or
split the range with one peak in each range.
are Disabled
c. Re-test the known “Bad” parts. Did they all fail?
If not, consider setting amplitude limits. Sometimes, the only difference between a good and bad part
is a difference in amplitude of a significant peak.
You can change the amplitude and/or frequency limits of band by: (1) unlocking the “Graphical Limit
Changes” button, (2) placing the mouse cursor over the limit edge to be changed, (3) stretching or
shrinking the band to the desired new limit. (4) repeat steps 2 and 3 for the other limits of the band, as
desired. An example follows.
eZ-NDT 938691 Investigation Mode Testing 2-9
Page 16

Graphical Limit Changes are Enabled.
Three Views of Limit Band “A”
The third view shows the band after high and low amplitude limits have been adjusted.
The third view also shows that Low and High Frequency Limits can be adjusted.
If, following adjustments, you still can’t distinguish between “Good” and Bad parts . . .
Try changing the Pre/Post Trigger Delay Percentage value of the trigger channel. By increasing this
value, you are delaying the start of the sound measurement. This delay can be very helpful identifying
cracked parts, because a cracked part can not hold a tone. The resonant frequencies of a cracked part
die out quickly.
2-10 Investigation Mode Testing 938691 eZ-NDT
Page 17

Inspection Mode Testing 3
A feasibility test and setup of the test parameters must be completed prior to starting
production testing.
Acquisition (Off)
Acquisition (On)
1. Launch eZ-NDT …… 3-1
2. Open the eZ-NDT Project …… 3-1
3. Turn on the Analyzer …… 3-1
4. Test Parts …… 3-2
Reviewing NDT Inspection Results …… 3-3
Preparing Reports …… 3-4
1. Launch eZ-NDT.
To run eZ-NDT, double-click the eZ-NDT icon or use your Windows desktop Start button to navigate to
the program file.
2. Open the eZ-NDT Project.
Select Open Project on the File Menu. Find the project of interest and double-click on it. This will open
the project and set up the test parameters.
3. Turn on Analyzer.
Click the Red toggle switch in the Acquisition panel of the Main window. This will initialize the hardware,
for example a ZonicBook/618E, 640, or 650, as applicable. Wait for the Ready status.
eZ-NDT 938691 Inspection Mode Testing 3-1
Page 18

4. Test Parts.
If you are using an automated system, start the conveyor and start loading parts onto the conveyor.
If you are using a manual system, strike the part, at the prescribed location, with the hammer.
eZ-NDT performs the inspection process when the “Force” channel’s trigger conditions are met.
After you strike the part, check the Hammer Status message in the Acquisition Panel and the Status Panel.
If your hammer strike resulted in a Trigger, you will see the NDT inspection results, PASS or FAIL.
Note on Performance Speed: Each part may take from 1-2 seconds to test under Level 3. For quicker
results switch to Level 1 (graphics are not updated).
Using Inspection Mode to Compare a Production Part to a Known Bad Part
Troubleshooting: If the Trigger did not occur, you need to verify one or more possible causes.
There is a hardware problem. Check the trigger channel’s cable connections. If this instrument
requires ICP verify the configuration settings.
There is a configuration problem. Check the trigger channel’s FSV and Trigger Percentage. The input
trigger voltage may be lower than the configuration settings. If you are operating at the Technician or
Operator level, you will need to change the User Level to Manager to check and make changes to the
configuration settings. Clicking the “Reset/Set Default” button will normally correct any problems.
3-2 Inspection Mode Testing 938691 eZ-NDT
Page 19
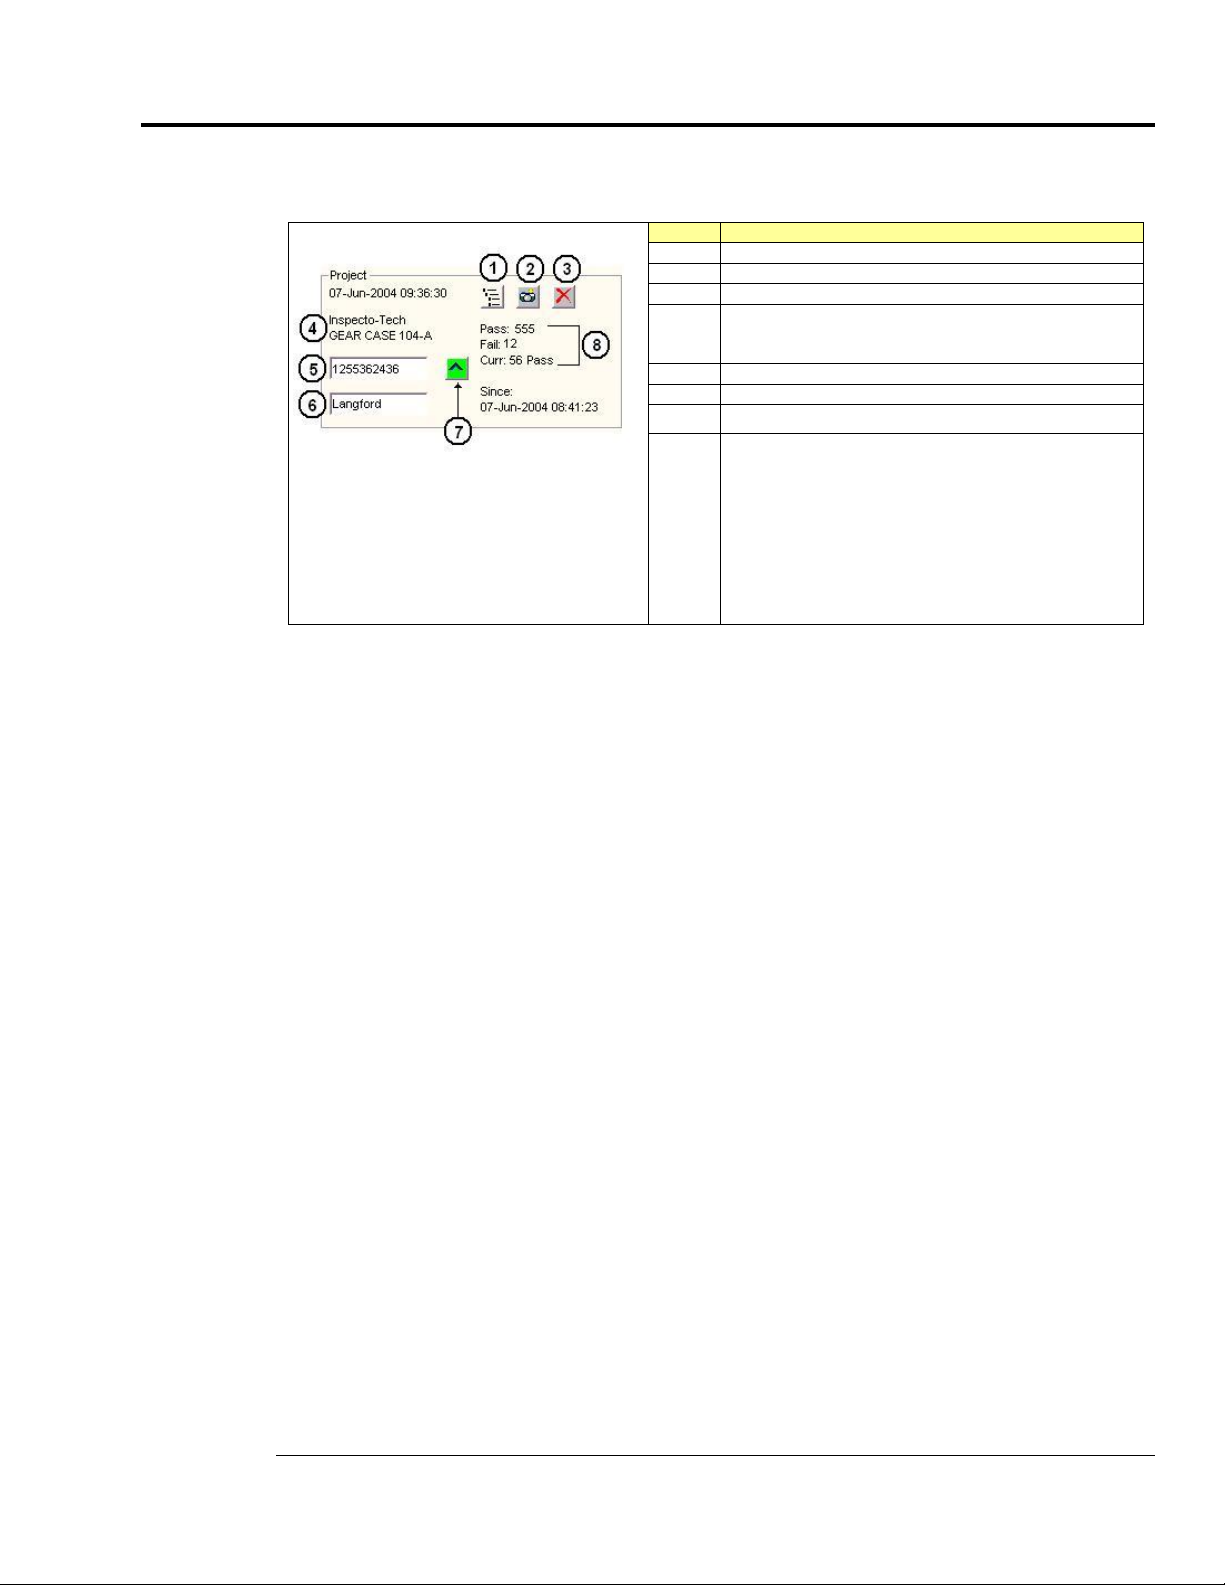
Project Panel
Item
Description
1
Lists eZ-NDT Projects
2
Shows a picture of the part
3
Resets the counts to zero
4
Displays name of company and part number.
The 2 fields are edited from the Acquisition Tab
under Edit / Configuration.
5
Serial number
6
Name of inspector
7
Automatically increments the serial number.
8
Pass: Displays the quantity of parts that passed.
Fail: Displays the quantity of parts that failed.
Curr: Displays the number of parts that have
consecutively passed or failed since the end of
the previous sequence. For example: If we had
56 parts in a row pass, Curr would display “56
Pass,” If the next part failed Curr would display
“1 fail.” If the very next part failed Curr would
display “2 fail” etc.
Reviewing NDT Inspection Results
The Project Panel contains the NDT inspection results since the last time the <Reset Summary Counts>
button (3) was pressed. The total number of Passed and Failed parts, as well as the consecutive count, are
listed (8).
The Since label displays the date and time that the <Reset Summary Counts> button (3) was last clicked.
The <Reset Summary Counts> button clears the entries for Passed, Failed, Current (Consecutive Count),
and resets the date and time [under the Since label]. Clicking the button does not erase the data stored in
the history file.
Note that the date and time of the last NDT inspection is displayed in the upper left corner of the panel.
eZ-NDT 938691 Inspection Mode Testing 3-3
Page 20

Preparing Reports
After each NDT inspection, the test results are stored in the history file. This is a FIFO, “First-In,
First-Out”file.
eZ-NDT is capable of generating three types of reports from this history file: Production, Plot Data, and
Configuration Settings.
The reports are text files. After selecting a report type, you will be prompted to enter a filename for the text
file using a standard Windows dialog box. The features of the three report types are as follows:
Production Report – After choosing Production from the Report menu, a production report dialog box
opens. It displays two radio buttons, allowing the user to choose either a Summary or Detailed production
report.
The Summary report lists the inspection status of each part tested over the selected date and time
range. The serial number and inspector name is also listed.
The Detailed report, in addition to the information contained in the summary report, also provides the
measured frequency and amplitude peak for each spectral band on a given response channel.
Both the Summary and the Detailed Report provide a statistical summary at the bottom of the report.
The statistical summary lists the counts, average, and standard deviation values for both Passed and
Failed parts.
Report Pull-down Menu
To the right of the production report dialog box is a graphic and a sliding scale, which both represent the
amount of data held in the project’s history file. The sliding scale allows the user to choose the amount of
data which will appear in the report. To use the sliding scale:
1. Click on the green start arrow and drag it to the desired starting percentage. The date and time of the
first data point will be displayed at the bottom of the scale.
2. Click on the red end arrow and drag it to the desired ending percentage. The date and time of the
final data point will be displayed at the top of the scale.
3. Click the <Okay> button.
For example, if you wanted to generate a report using only the last 50% of the history file, you would drag
the green arrow to between “40” and “60” on the scale, and drag the red arrow to “100”. To use the entire
history file, leave the green arrow at “0” and the red arrow at “100”.
Plot Data Report – Choosing Plot Data from the Report menu generates a list of all the data points (using
x and y coordinates) that are displayed on the graph. The units used for the x and y coordinates in the report
will depend on whether the graph was set to the Time display or Spectrum/FRF display.
eZ-NDT can also generate a Configuration Settings report, which lists many of the configuration options
that are set in the analyzer’s configuration screen (accessible by selecting the Edit menu, and then the
analyzer hardware).
3-4 Inspection Mode Testing 938691 eZ-NDT
Page 21

Windows and Menus 4
Main Window …… 4-1
Graphical Display …… 4-6
File Menu …… 4-8
Edit Menu, Configuration …… 4-10
Acquisition Tab …… 4-10
Input Channels Tab …… 4-11
Automation Tab …… 4-14
Edit Menu, Limits …… 4-17
Edit Menu – Display and General Options …… 4-18
Display Preferences ……4-18
Copy Window …… 4-18
Load Picture ……4-18
Remove Picture …… 4-18
Erase History File ……4-18
Erase Template File …… 4-18
Menus with Associated Window Panels ….. 4-19
Project …… 4-19
Control …… 4-19
Display …… 4-19
View …… 4-19
Report Menu …… 4-20
User Menu …… 4-25
Notes for Efficient use of eZ-NDT …… 4-26
eZ-NDT 878493 Windows and Menus 4-1
Page 22

Main Window
Test-specific information is located in the Project Panel. The panel includes Company Name and Part
Name (4), Serial Number (5), and Inspector’s Name (6). Pass/Fail information is included (8).
This information is stored with the data after each NDT inspection. Company Name and Part Name are set
up in the Acquisition Tab of the Configuration window [selected from the Edit pull-down menu].
The part’s Serial Number and the Inspector’s Name can be manually entered in the text fields.
A picture of the part being tested can be overlayed using the <Show Picture> button (2). To load a graphic
for the first time, or to change a previously loaded graphic:
Project Panel
Item Description
1 Lists eZ-NDT Projects
2 Shows a picture of the part
3 Resets the counts to zero; resets the “Since”
time to computer clock date and time.
4 Displays name of company and part number.
The 2 fields are edited from the Acquisition Tab
under Edit / Configuration.
5 Serial number
6 Name of inspector
7 Automatically increments the serial number.
8 Pass: Displays the quantity of parts that passed.
Fail: Displays the quantity of parts that failed.
Curr: The current consecutive part.
(a) Left-click on the <Show Picture> button (2). A “Part Picture” pop-up window appears.
(b) Right-click on the “Part Picture” pop-up window. A “Load Graphic Picture” context menu
appears.
(c) Left-click on the “Load Graphic Picture” menu. An “Open” window appears.
(d) Use the “Open” window to browse for your part image (.jpg or .bmp format). Then open the
image.
(e) You can re-size and reposition the part image.
Main Window with Part Image Displayed
4-2 Windows and Menus 878493 eZ-NDT
Page 23

Acquisition Panel with Mode Selection
The Acquisition Panel includes an ON/OFF toggle switch, two icon-buttons, and two radio buttons. The
toggle switch turns the acquisition “on” or “off.” The <Reject Last Test> button [at the panel’s upper right]
is for discounting and rejecting the last test, regardless of whether it was a Pass or a Fail. The lower button,
with the musical note image, is for playing a sound after each production test, or for turning that sound off.
The two radio buttons for selecting the mode of operation. Investigation Mode is for feasibility testing
and Limit Configuration. Inspection Mode is for normal testing of production parts.
Acquisition Panel
Mode Panel, Investigation Mode Selected
Mode Panel, Inspection Mode Selected
On eZ-NDT start-up, this button is blank. After each NDT inspection, the button’s color and status
message reflect the inspection results. Red indicates a failed part. Green indicates a good part. Click on
this button to view the entire spectral range.
Channels: <Channel> buttons are shown vertically from 1 to 8. Both Force and Response channels can be
displayed in either the Time or Spectrum format. Unused channels are not enabled (dimmed).
Limit Range Buttons: The horizontal numbered buttons show the NDT inspection status for the defined
limit ranges. Red indicates fail. Green indicates pass. Up to 10 ranges exist for each response point. To
display a range of interest, click on the desired <range> button. To view the full scale, press the
<Overall Part Status (PASS/FAIL)> button. To return to the original X-axis scale, click on the
<Overall Part Status> button again.
Clicking on a <Limit Range> Button expands the graphical display to show that particular Frequency and
Limit Range.
eZ-NDT 878493 Windows and Menus 4-3
Page 24

Digital I/O Panel
The Digital I/O Panel is used with the optional digital I/O control package. It is associated with the
Configuration window’s Automation tab, which is discussed later in this chapter
The Digital I/O panel’s toggle switch controls the ON/OFF status of the eZ-NDT Automation Module. The
four Relay Icons indicate the current status of the relays.
Each time you start the NDT software, the Automation main switch is turned “off.” You must turn the
switch “on” to send output to the relay channels.
The relay channels can be set to trigger according to:
Digital I/O Panel
• the state of a channel
• the number of consecutive fails
• the acquisition status
You can test a relay by clicking on its associated button.
Note that if Digital Inputs have been enabled, the digital input status will be present in the label above the
output relay buttons.
4-4 Windows and Menus 878493 eZ-NDT
Page 25

Display Toolbar
Display Toolbar
Button Function
Spectrum/
FRF Display
Time Display Sets the window to display data with the x-axis scaled to time and the
Auto Scale Automatically adjusts the scale. Auto scale will be either enabled or
Log Scale Y Axis Only applies to Spectrum/FRF Display. This sets the y-axis to a
Cursor Click the Show Cursor Values Icon to open a floating
Sets the window to display data with the x-axis scaled to frequency and
the y-axis scaled to dB or engineering units, depending on the setting in
the Acquisition tab of the Configuration window.
y- axis scaled to dB or engineering units, depending on the setting in the
Acquisition tab of the Configuration window.
disabled. When enabled, the Y axis scale is 20% greater than the data
range. When disabled, the Y-axis scale is defined by the instrument
range in the configuration.
logarithmic scale. Note that Time displays are always linear.
display of the cursor values. Click on the upper left
corner of the display to move it anywhere on the screen.
Values are displayed in the x, y format.
Cursor values exist for each defined limit range. The
cursor is automatically positioned to the highest peak in
the limit range. You can move the cursor by dragging it
across the graph with your mouse or by using the
keyboard. The “, (comma)” key moves the cursor Left.
The “. (period)” keys move the cursor Right
Show Frequency
Ranges
Graphical Limit
Changes
(Enable /
Disable)
Uses vertical lines to identify High and Low Frequency Limit Ranges for
the Spectrum / FRF display.
When the padlock image is unlocked, limit bands can be
adjusted with a mouse as described in chapter 2’s step
13.
When the padlock image is locked, limit bands cannot be
altered. This feature prevents limits from being
accidentally changed.
eZ-NDT 878493 Windows and Menus 4-5
Page 26

Graphical Display
Limit Range
The Graph displays the results of a strike. The acceptance limit regions are shaded in green;
failure limit regions are shaded red.
The Limit Range cells are used to access a specific Limit Band (lettered A through J). Right-clicking on a
Limit Range cell brings up a properties box, which allows you to change Limit Band parameters and Low
and High Frequency Range limits. Left-clicking on a cell focuses in on the limit aspect for the associated
band. Note that you can also select a Limit Band from the View pull-down menu.
Graph Displaying Three Acceptance Limit Regions
Adjusting Low and High Frequency Range Limits for Cell B
4-6 Windows and Menus 878493 eZ-NDT
Page 27
Modifying Limits from the Main Window
Add Limit Band: Using your mouse, right click on a Limit Range cell. Check “enabled,” then click the
<Apply> button.
Remove Limit Band: Using your mouse, right click on a Limit Range cell. Un-check “enabled,” then
click the <Apply> button.
Moving the Limit Band: To move a limit band, first unlock the Graphic Limits with the padlock icon
button; then select the desired Limit Range cell. Using your mouse, right-click anywhere within the band.
At this point you’ll see a crosshair. While pressing the right mouse-button, move the crosshair to the new
x-axis position. The Limit Band will relocate.
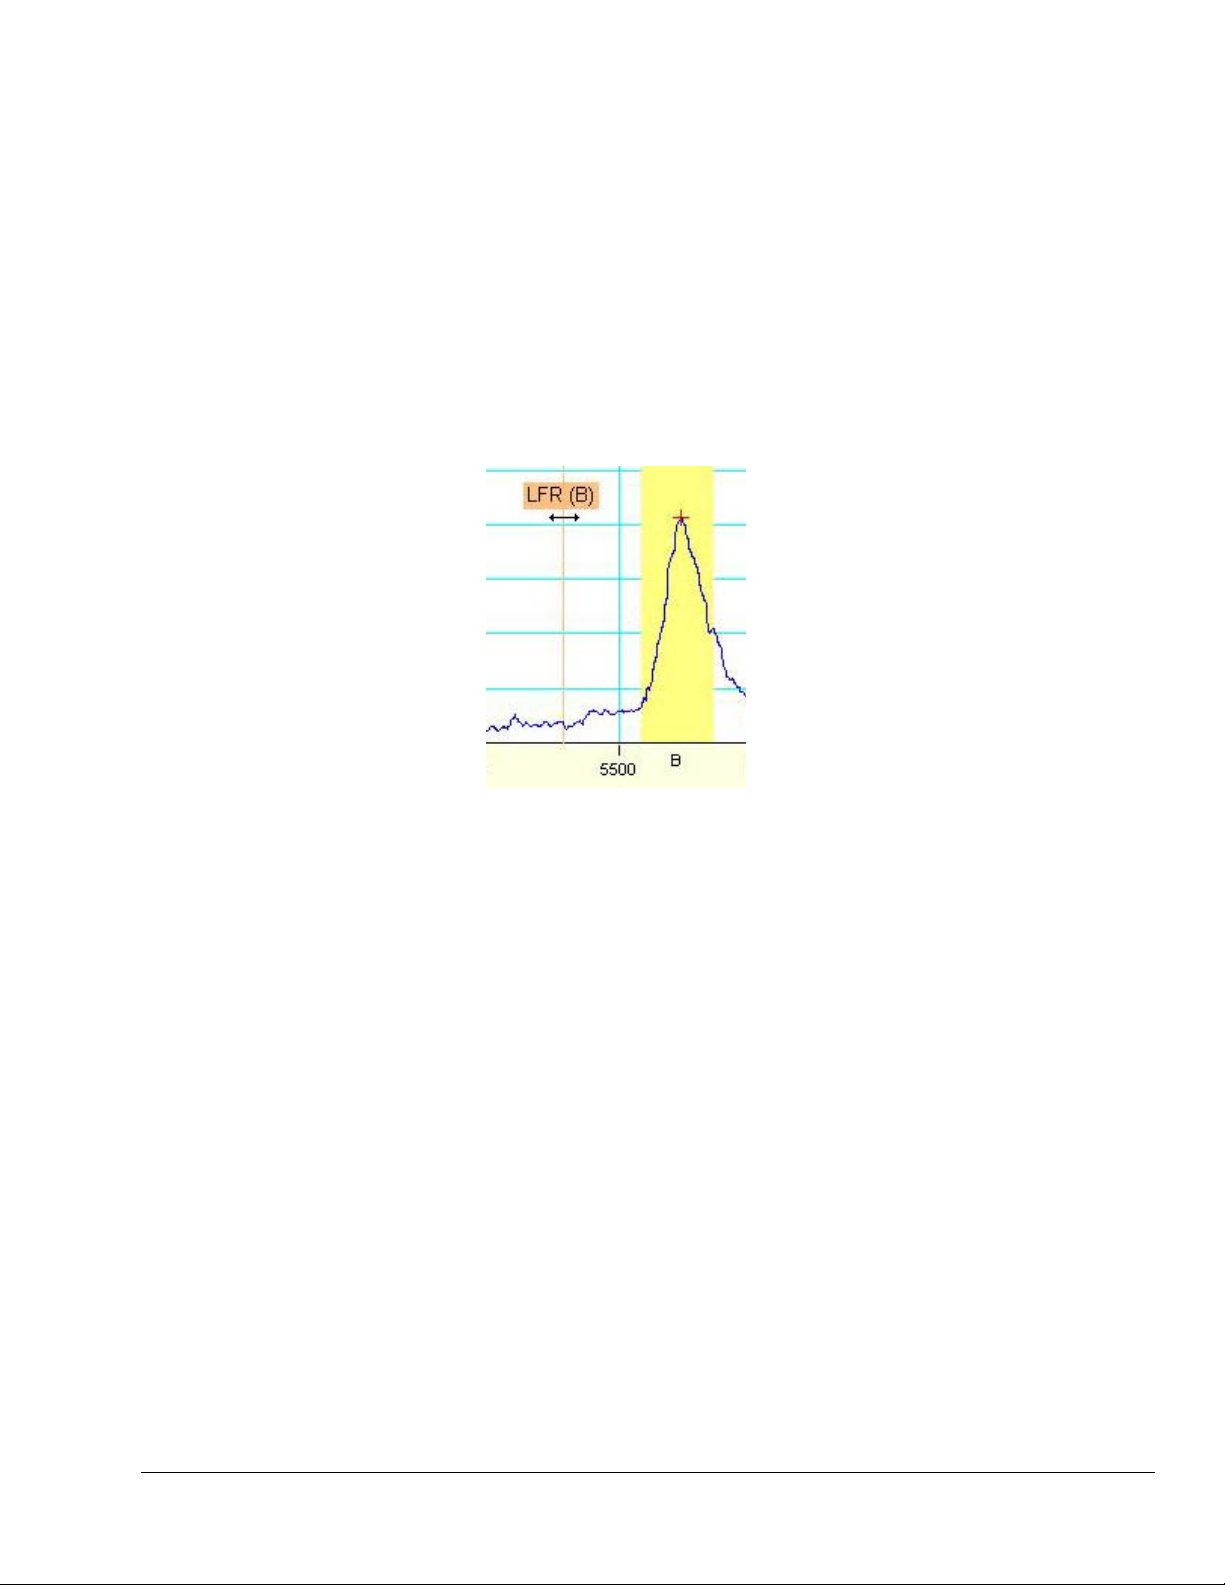
Changing the High and Low Frequency Range Limits: First unlock the Graphic Limits with the
padlock icon button; then select the desired Limit Range cell. Next place the mouse cursor of the vertical
line of the High or Low range limit. “HFR” or “LFR” will appear in a box (see preceding figure). Use the
double-arrow to adjust the limit. Note that you can also use the properties box to adjust the range limits, as
discussed on the previous page.
Other limit modifications include increasing or decreasing
• Limit Band Frequency
• Limit Band Amplitude
Adjustment of the Limit Band Frequency and Amplitude is discussed and illustrated in chapter 2, in the
section titled, 13. Verify the Limits and Ranges.
Magnifying Areas on Graph
X-axis: Hold down the <Ctrl> key, then left-click and drag the cursor lines across the area of interest.
Y-axis: Hold down the <Alt> key, then left-click and drag the cursor lines across the area of interest.
Both axes: At the same time, hold down the <Ctrl> and <Alt> keys while you draw a cursor box around
the area of interest.
In each of the above cases the x and y axis scales will automatically change to reflect the new view. Click
the <Auto Scale> button in the Display Toolbar to zoom back out to a full view.
Adjusting the Low Frequency Range Limit
eZ-NDT 878493 Windows and Menus 4-7
Page 28

File Menu
New Project
When you select New Project, the “Save As” window opens. If you already have a project defined, it will
open to the folder where that project is saved. You can create the new project here, or you can create a new
folder in which to save your project.
Save As Dialog
1. Select New Project on the File menu.
2. Find the folder in which to save this project, or create and name a new folder.
3. Type a file name (including the extension).
4. Click the <Save> button.
Open Project
The Open Project command, opens the “Open” window.
Open Project Dialog
1. Select Open Project on the File menu.
2. Find the folder in which your project was saved.
3. Click the <Open> button.
If you have an older EZ-NDT project with multiple files (i.e., files with extensions “.ndt1”, “.ndt2”,
etc.), they will be combined into one file (with a “.ndt” extension) once the latest version of the EZNDT.exe is used to open the old “.ndt1” file.
Save Project
This menu item save the current state of your project.
4-8 Windows and Menus 878493 eZ-NDT
Page 29

Save As...
Print
Exit
This menu item opens the Save As window. Enter a new path and file name for this project. Use this
command to save setup time on a new project if it is very similar to a current or older project.
Save As Dialog
The Print command prints the Main window.
Quits the NDT application. This can be performed only when the User level is Manager.
eZ-NDT 878493 Windows and Menus 4-9
Page 30
Edit Menu
Configuration . . .
The Configuration window includes three Tabs: Acquisition, Input Channels, and Automation. A
discussion of each follows.
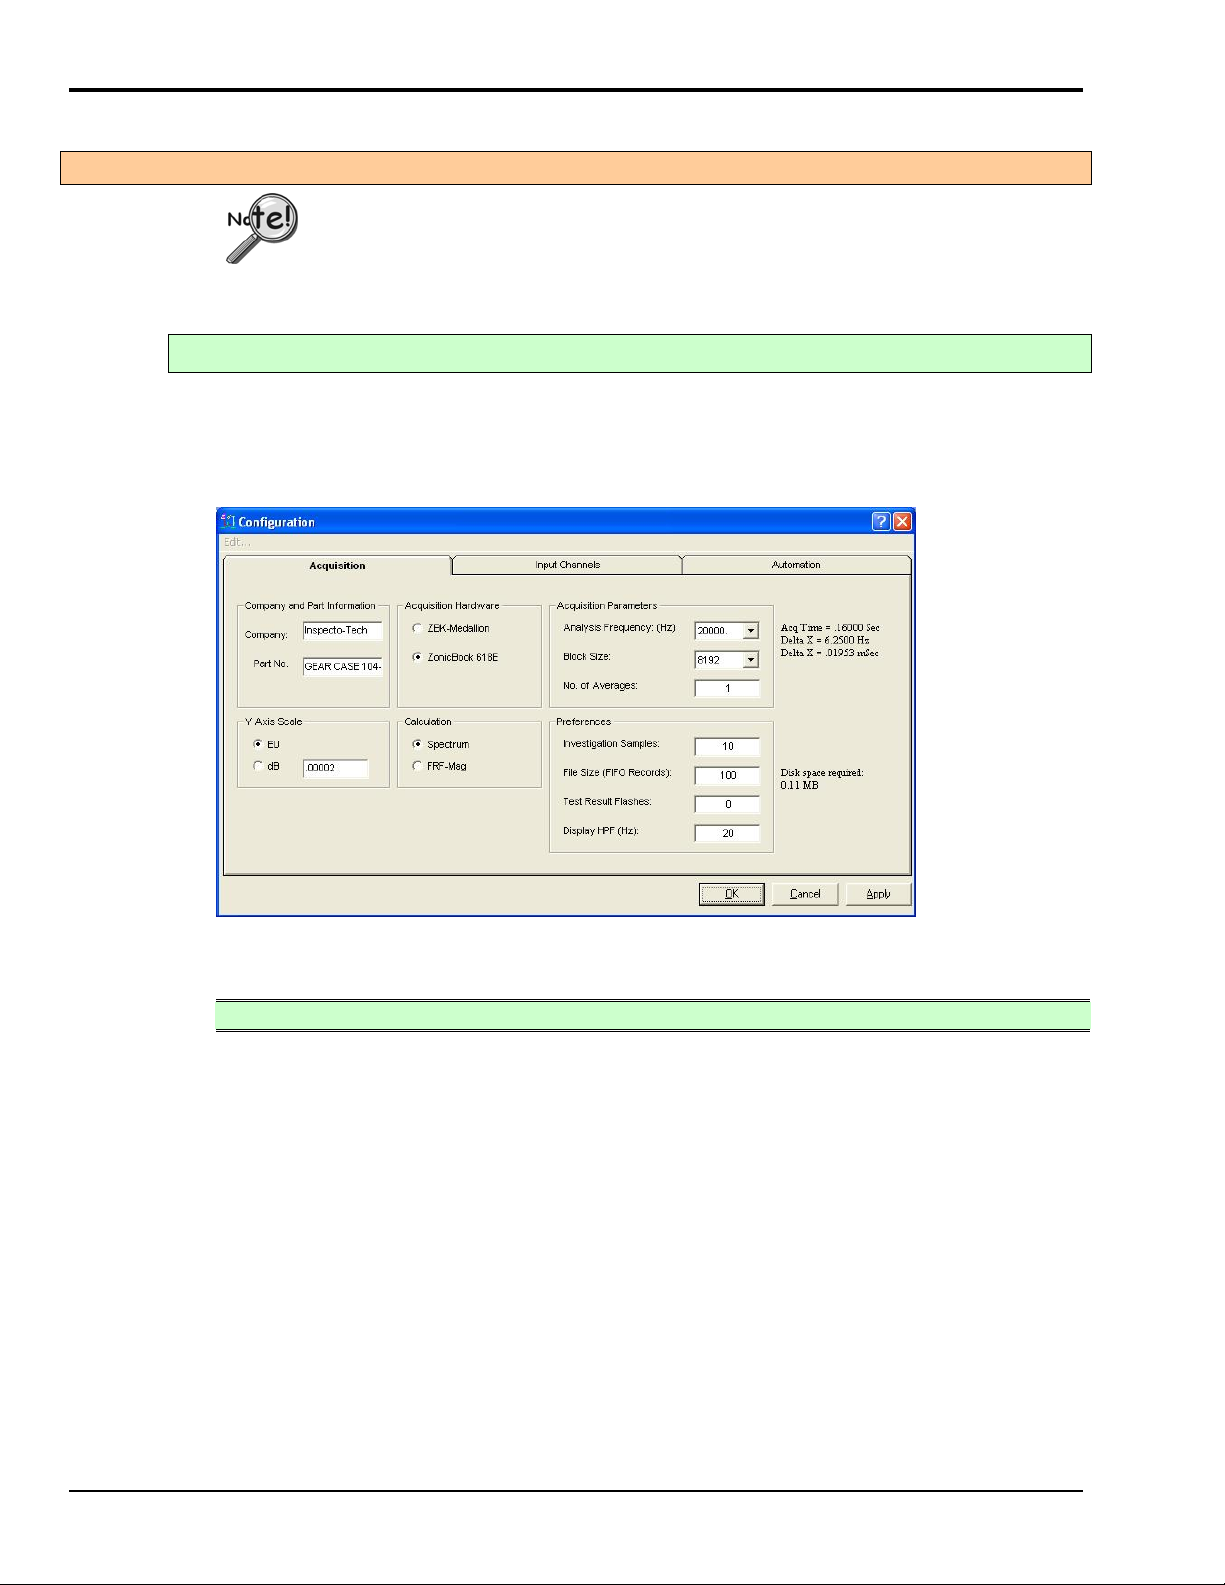
Acquisition Tab
This tab provides a means of setting acquisition parameters and preferences. It includes a means of adding
Company and Part Number association. The 4 left-side panels are self-explanatory and will not be
discussed other than to state that dB is typically used for the Y-axis scale. In regard to the Calculation
panel, FRF is generally preferred for getting data from multiple parts quickly; Spectrum mode should be
used for small numbers of parts, or slower acquisitions.
This menu option is only available at Level 3 operation AND when Data
Acquisition is OFF.
The Configuration Window, “Acquisition” Tab
Acquisition Parameters Panel
Analysis
Frequency
(Hz)
Block Size
No. of
Averages
Select the desired Analysis Frequency. This value is the maximum frequency of
interest. The sampling rate will be 2.56 times the analysis frequency. Verify the
maximum frequency response of your probes. Typically, the analysis frequency will
be 20 KHz. [Default: 20 KHz.]
Select the desired Block size. This value is the number of samples per block of data.
For example, a 2048 Block size contains 2048 data samples and will produce an 800
line spectrum. A larger Block size will provide you with greater data resolution.
However, it will require more time to collect a block of data.
The number of data blocks used in the NDT analysis. Typically, the number of
averages is set to one.
4-10 Windows and Menus 878493 eZ-NDT
Page 31

Preferences Panel
Investigation
Samples
Used to specify the number of samples to be used in the investigation mode. Up to
ten samples can be selected. On the main window, these will appear as numbers 1
through 10 in the Pass Fail columns.
File Size
(FIFO Records)
Enter the desired File Size. The required hard disk space for the requested file size is
displayed to the right of the data entry box and cannot exceed 2.1 gigabytes. Data is
stored to the history file after each NDT analysis.
Test Result
The number of times the results of each test will flash on the screen.
Flashes
Display HPF
(Hz)
Sets a frequency limit for the display window, such that all data at that frequency and
lower will be displayed as “0.” Thus, only data above the HPF value will be
displayed.
Input Channels Tab
The Input Channels Tab allows you to state the channel type (Trigger or Response), name the channel, and
set the channel parameters. Channel attributions can be copied and pasted to other channels.
The Configuration Window, “Input Channels” Tab
Input Channels Tab
No.
Type
Used to select the channel to be configured.
Select the instrument Type on the pull down menu. Types include Force, Response,
and Unused. You must have 1 Force Channel and 1 or more Response Channels.
[Default: Channel 1 is the Force channel; channel 2 is the Response channel;
channels 3 through 8 are unused.]
Users of ZonicBook-Medallion only
: Configure the Dip Switches located under
the ZonicBook-Medallion Input Module for each probe. Typically, Hammers,
Name
FSV (+/-)
Microphones, and Accelerometers are Single Ended, AC Coupled, and ICP On.
Enter a Name label for the channel; e.g., Trigger, Response, Microphone.
Double-click on the cell and select the maximum Full Scale Voltage expected for the
instrument. Erroneous results will occur if you select a voltage value that is less than
the actual input voltage.
ICP
Used for ICP transducers. Checking “ICP” sources a bias current through the center
conductor of the input channel BNC connector.
eZ-NDT 878493 Windows and Menus 4-11
Page 32

Input Channels Tab
Cplg
mV/EU
Selects AC or DC coupling.
Use to set the instrument’s input sensitivity.
Typically, sensitivities are as follows:
• Accelerometers: 100 mV per g
• Microphones: 25 mV per Pa
• Hammers: 1 mV per lbf.
Min Y
Max Y
Units
Trigger (%)
Delay (%)
Min Y is used to set the instrument minimum in engineering units.
[Default: Force Units are lbf (pounds force) for modal hammers; G’s for
accelerometers; and Pa for microphones.]
Max Y is used to set the instrument maximum in engineering units
Used to identify the Engineering Units (EU) for the channel. The user is free to enter
whatever unit name he or she prefers. Typical units are: dB, lbf, Pa.
Used to set the percentage value of the full scale voltage at which the force (hammer)
signal must reach before it is recognized as a trigger event.
Each trigger event results in a test inspection. For example, if the FSV for the
instrument is 1.000 V and the Trigger Percentage is 10%, eZ-NDT will trigger
acquisition when the Force Input is 0.100 V.
Used to define the start of the data block as a percentage of the block size from
minus 100% to plus 100 %.
A positive value will result in a Post Trigger. This is recommended for most
applications.
A negative value will result in a Pre-Trigger. For example, entering “-10” defines a
Pre-Trigger that is 10% of the block size. This means that 10% of the data block will
occur prior to the trigger event.
4-12 Windows and Menus 878493 eZ-NDT
Page 33

Input Channels Tab
FFT Window
Used to select the type of FFT Window:
Used to select the desired FFT Window function for the input channel. Choices are
None, Hanning, Flat top, Exponential, and Force.
When using FFT, one must be careful to avoid potentially serious errors due to “FFT
leakage." When this occurs, a signal at one frequency spreads out ("leaks") over a
wider frequency range in the FFT spectrum.
Intuitively, leakage arises from cutting out a finite length "window" of data from a
longer continuous signal. This causes an apparent discontinuity at the ends of the data
block. It has nothing to do with the actual signal. These "truncation" errors can be
effectively controlled, though not completely eliminated, by multiplying each data
frame by a suitable time-domain weighting-window that smoothly attenuates the data
near the ends of each block, prior to performing the FFT.
None: Select “None” if you want the display to have no window function.
Hanning: The Hanning window offers a reasonable trade-off of frequency accuracy
versus amplitude accuracy.
Flat Top: This window has a very low peak amplitude error, and its frequency
resolution is somewhat better. Its side lobes are considerably higher. Its effective
noise bandwidth is still almost twice that of the Hanning window, therefore this
window is used mainly to measure accurate peak amplitudes of discrete spectral
components that usually separated by at least several spectral lines.
Exponential: An Exponential weight window is equal to 1.0 at the beginning of the
block and decays exponentially to a smaller value at the end of the block. Exponential
is used only with transient data that is captured with pre-trigger to assure that the initial
values in all data channels are very close to zero. Exponential can be used with all
transient excitation methods in order to force the signals to decay close to zero, even if
the block length is not sufficient to capture all of the naturally occurring response. If
the data decays naturally to a low amplitude within the block, so that leakage is not
significant, exponential windowing can improve the signal-to-noise ratio by giving
reduced weight to the very low-amplitude data at the end of the block.
Force: This is a rectangular function that helps to ensure a consistent force is applied
to each part.
Input Channels “Edit…” Pull-down Menu
Set Defaults
Returns the channel configuration to the original factory
settings.
Copy Channel
(Ctrl + C)
Paste Channel
(Ctrl + V)
Fill Down
(Ctrl + D)
Fill Up
(Ctrl + U)
Copies the configuration of a channel into memory.
Used in conjunction with Paste Channel or “Ctrl + V”.
Used to paste a channel configuration that was copied
with Copy Channel or “Ctrl + C”.
Copies and pastes the setting of a selected cell to all
active cells directly below it. See note.
Copies the setting of a selected cell up to all active cells
directly above it. See note.
Edit Menu,
for Input Channels
If the selected cell is a response channel and a force channel is above or below it, the
force channel configuration will be overwritten.
eZ-NDT 878493 Windows and Menus 4-13
Page 34

Automation Tab
The “Automation” Tab is used for Automation Module (NDT Relay Module) applications. The tab has
two or three panels, depending on the hardware used. This is explained shortly.
Digital I/O Hardware Panel – This panel allows you to select the model number of the digital I/O
hardware and the RS232 COM Port number which it is connected to. In regard to the hardware model
number: if “NDTRelay2” is selected the Digital Inputs panel will be visible, as indicated in the following
figure. If “NDTRelay1” is selected the Digital Inputs panel will not appear on the tab.
The Configuration Window, “Automation” Tab
Digital Outputs Panel – Use this panel to configure the responses of your eZ-NDT Automation Module.
This device will allow you to have relay switches open and close based on the results of each test. You can
use up to four relays.
Normally the configuration settings defined during the feasibility study are used.
Please do not deviate from these unless you are an advanced technician.
The color of the response channel indicates the pass (green) or fail (red) status of the part. If the response
channel relay is normally open (green) when a part passes inspection the relay will remain open. On the
other hand, if the response channel relay is normally open and a part fails, the relay will close for the
duration specified by the time; and then it will reopen.
Additionally, you can have the system count the number of consecutive fails and change the relay status
when a specified number of consecutive failures is reached.
Digital Inputs Panel – This pane, located at the bottom half of the screen, is not displayed for NDTRelay1.
The panel allows you to set different eZ-NDT projects to run automatically when triggered to do so by a
digital pattern. This allows the process to inspect multiple part types, each of which uses a different eZNDT configuration.
Relays can be manually triggered in the Relay Output panel of the Main window by clicking on a
Relay Icon.
4-14 Windows and Menus 878493 eZ-NDT
Page 35

Digital Outputs Panel
The Automation Tab’s Digital Outputs Panel
No.
Active
NO / NC
Timer
Type
The relay number. Up to 4 relays can be used.
Check a box to make the associated relay active. Remove the checkmark to disable
the relay.
Used to set the relay’s normal operating state to open or closed, i.e.,
“Normally Open” or “Normally Closed.
Sets the time that the relay switch will stay in its triggered state, before returning to
its normal open or closed position. For example, for Relay No. 1 above, after 5 parts
failed the switch would open for 0.5 seconds, then close again.
Checks the “Count” number, which is entered in the adjacent column to the
right. The switch state changes when the number of failed parts equals the
count number. When the timer value is reached the switch will return to its
normal closed state.
Response Channel State. Triggers on a non-normal condition. This mode
compares the actual part status (good or bad) against the condition indicated
in the Digital Output panel. When the part condition matches the indicated
setting, the relay switch leaves its normal state. For example, with Relay
Number 2 [above] when Ch 1 and Ch 2 both fail, the normally closed switch
will open. When the timer value is reached the switch will return to its
normally closed state.
Manual trigger. The relay switch will remain in its normal state until
manually changed.
Count
Ch 1
Ch 2
Ch 3
Ch 4
Sets the number of consecutive failures. Used in conjunction with the “count” type.
Ch 1 through Ch4 cells are used to set a channel’s trigger condition in relation to the
“good” or “bad” state of a part. In the example above, Relay No. 2 will stay closed
as long as channel 1 and channel 2 have passed parts. If either or both have a failed
part the condition triggers the Relay switch to open. When the timer value is
reached the switch will return to its normal state.
eZ-NDT 878493 Windows and Menus 4-15
Page 36

An Example of Automation Relays at Work, Using the Response Channel Type
When the result of the part is equal to the result indicated by the Digital Outputs panel, the operating
state of the associated relay changes and a signal is sent to the relay switch.
Conversely, when the result of the part does not equal the result indicated by Digital Outputs panel, the
state remains unchanged and no signal is sent to the relay switch.
In this example, assume that we want all tested parts (good and bad) to be sent by conveyor to one of two
processes. Good parts go to finishing and bad parts go to rework.
We don’t want a failure of the relay switch to result in bad parts being misdirected to the finishing process.
Therefore we set up the conveyor so that the path to finishing is normally blocked, that is, it will be block
when there is no power to the relay. That path is only to open for reception of good parts.
In the following gate-related figures, Good parts are designated with a “G” and Bad parts are designated
with an “X.”
The relay is “de-energized” (normally open)
and the gate prevents entry to Finishing.
The relay must be energized (by seeing a good
part) in order to open the gate.
Example of an Automation Relay being used to Control a Gate
This means that the relay switch should be normally open (no current). When a good part activates the
relay switch, the switch closes. This sends power to open the gate to finishing. A bad part does nothing to
the relay. For bad parts the relay remains open and the gate to finishing remains without power. The bad
parts proceed on to rework. See the above diagrams.
Digital Setup for the Example
The timer must be set to allow enough time for one good part to pass through the open
gate. If a good part is followed by a bad part, the gate to must be able to close in time to
prevent entry of the bad part.
The relay is “energized” and the gate to
finishing is open until the timer times out.
Good parts keep the relay energized, therefore
keeping the gate open to “finishing.”
4-16 Windows and Menus 878493 eZ-NDT
Page 37
Edit Menu
Limits . . .
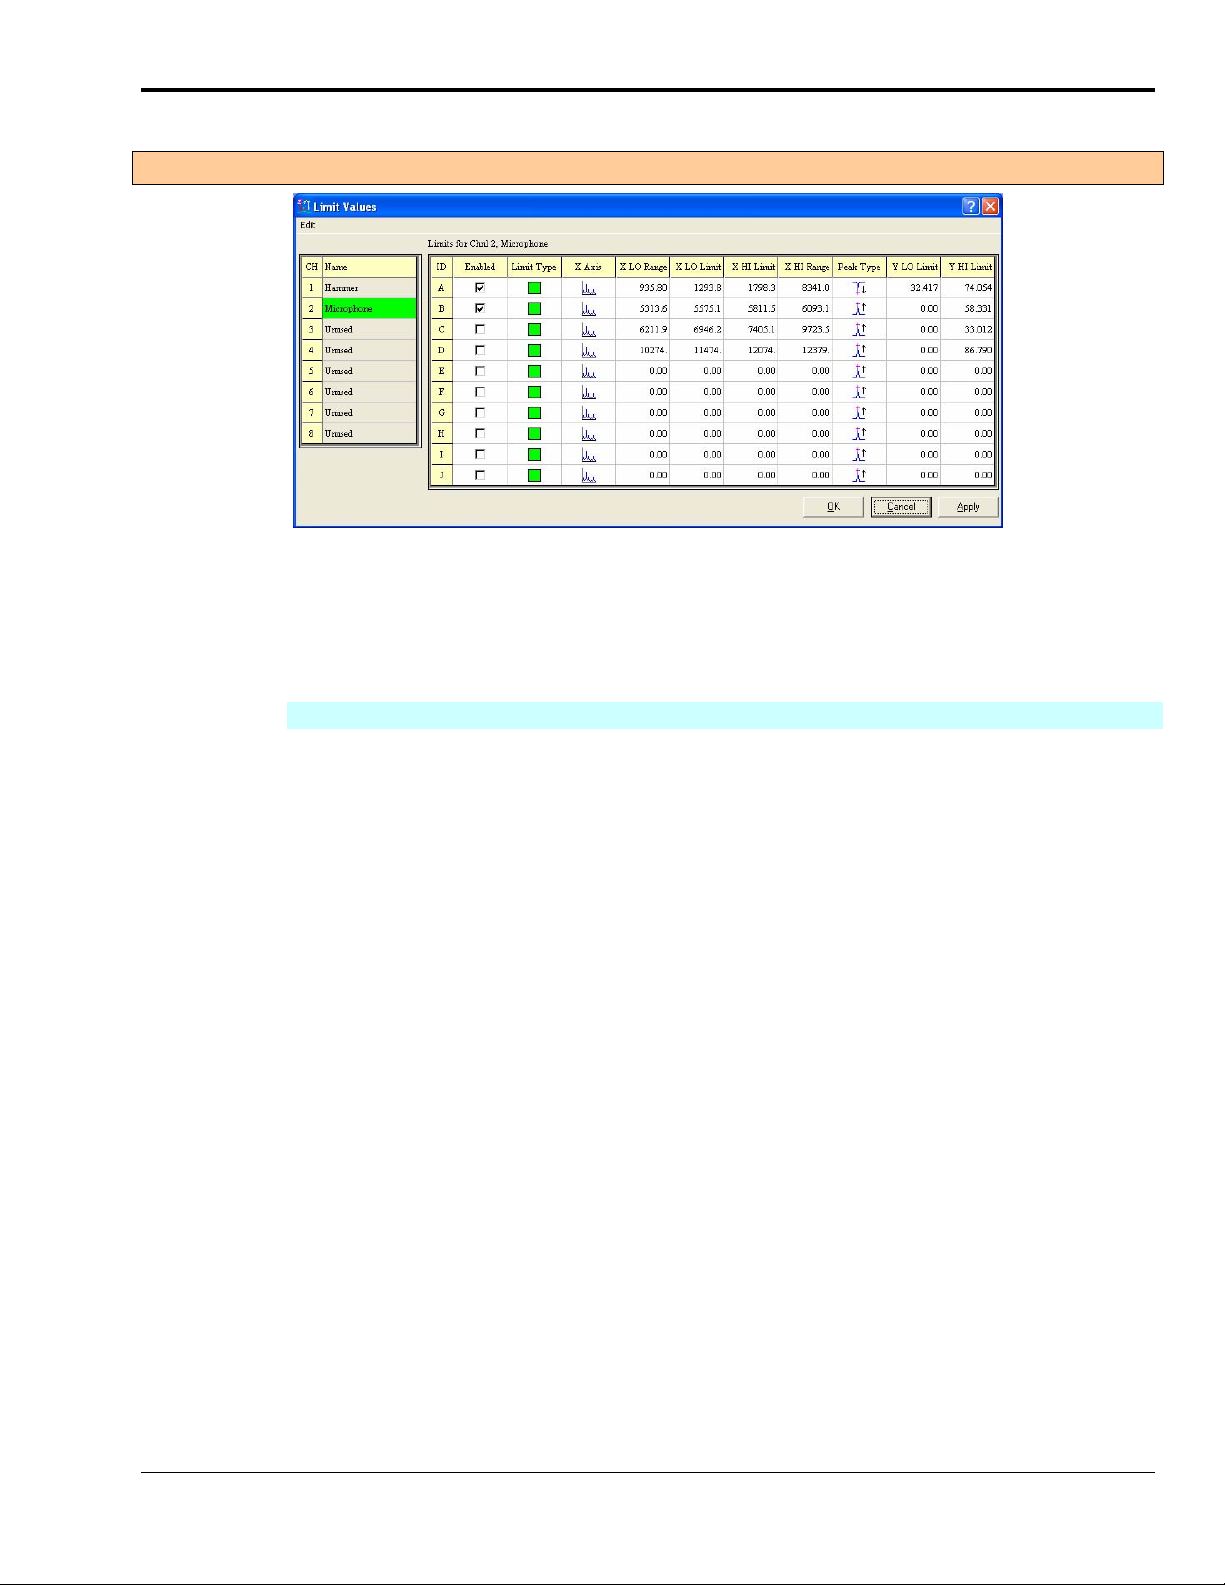
The Limit Values Window
The Limits Value window is used to configure the limit criteria for each input signal. You can define up to
10 limit ranges per response channel. Simply select the channel of interest; then define the range and limit
values. You can copy attributes of one range to another via the window’s Edit menu.
Limit Values
CH
Name
ID
Enabled
Limit Type
X Axis
X LO Range
X HI Range
X LO Limit
X HI Limit
Peak Type
Y LO Limit
Y HI Limit
The Channel number.
This is the response channel for which you will be setting limits. Typically there is
only one Response Channel.
For each significant peak you wish to monitor there should be a letter ID which has a
defined range and limits. IDs are lettered A through J.
Check the box to enable an ID. Remove the checkmark to disable the ID.
Sets the limit as a “pass” limit or a “fail” limit. Typically green and red.
Select the Spectral Graphic Image for Frequency (Hz) or
Select the smooth Sine Wave Graphic Image for Time-based (seconds).
Frequency is the most often used scale for the display’s X-axis.
Enter the lower and upper limit values of the frequency range.
eZ-NDT will find the maximum peak within this range.
Enter the upper and lower limits range.
For a green limit: if the frequency of the maximum spectral peak for the frequency
range is within the Limits range, the part passes.
For a red limit: if the frequency of the maximum spectral peak for the frequency
range is within the Limits range, the part fails.
Select the graphics image of peak rising or peak falling.
Enter the lower and upper limit values for the Amplitude.
For a green limit: if the amplitude of the maximum spectral peak for the frequency
range is within the amplitude range, the part passes.
For a red limit: if the amplitude of the maximum spectral peak for the frequency
range is within the amplitude range, the part fails.
eZ-NDT 878493 Windows and Menus 4-17
Page 38

Limits Tab - Edit Menu
Copy Channel
(Ctrl+C)
Paste Channel
(Ctrl+V)
Clear Limit
Clear ALL
Limits
This command copies the configuration of a channel
into memory. Use the Paste Channel command to
paste the values to another channel.
This command pastes to a select channel the
configuration of a channel previously copied with the
Copy Channel menu item.
This command clears the row in which a selected cell
resides. If no cell is selected, the top row is cleared.
This command clears the entire configuration grid.
Edit Menu – Display and General Options
Edit Menu . . .
Display
Preferences
The Display Preferences window is used to change eZ-NDT’s display colors.
As can be seen in the above figure, the window is self-explanatory.
Copy Window
(Ctrl+C)
Load Picture
Remove Picture
Erase History
File
Erase Template
File
This option copies the current window so it can be pasted into another application
such as Microsoft Word or Excel.
When documentation is required for your project a picture of the part being tested is
useful. If you have a picture of your part (.jpeg or .bmp format), select this
command to place it in the main window. The image can be positioned anywhere.
Remove picture removes the graphic from the main window.
These two commands each function as a file delete key. Depending on the option
used: all history data or all template data will be permanently deleted.
Display Preferences Window
4-18 Windows and Menus 878493 eZ-NDT
Page 39

Menus with Associated Window Panels
The following menus have functionality that is typically accessed directly from a main window panel. For
details regarding functions, please refer to the associated panel information. References are provided in the
following table.
Menus with Associated Window Panels
Project
Control
Display
The Project pull-down menu offers the same functionality as the
Project Panel found in the upper left corner of the main display
window. Refer to page 4-2 for details.
Functions that can be initiated from the Control pull-down menu
can also be initiated from the main window. However, in the main
widow the functions are divided by several panels.
Acquisition Panel
Digital I/O Panel
Inspection Mode Panel
Investigation Mode Panel
Control related information begins on page 4-3.
Items in the Display pull-down menu relate directly to the main
window’s toolbar as can be seen by comparing the two figures.
Function details begin on page 4-5.
Project Menu
Control Menu
Display Menu
Display Toolbar (On Main Window)
View
View provides a means of selecting Limit Range cells. This menu
has the same functionality as the horizontal display of Limit Range
cells found in the main window’s Inspection Panel (lower figure).
Details begin on page 4-3.
eZ-NDT 878493 Windows and Menus 4-19
Page 40

Report Menu
eZ-NDT generates four reports.
Generate a Production Report
The Production report contains the overall NDT inspection results for the specified time period. To
generate a Production report:
eZ-NDT Production Report Dialog
1. Select Production... on the Report menu.
2. The production report dialog is displayed.
3. Select whether you would like to generate a Summary or Detailed production report by clicking on
the appropriate radio button.
4. Select the number of records to be included in your report by dragging the arrows up/down the scale.
5. Press the Okay button.
6. A save file dialog box will open.
7. Type a name your report file in the filename data entry box. Use a unique name for each report.
8. Click the Save button.
After generating the report, eZ-NDT automatically opens the text file in Windows NotePad or WordPad.
4-20 Windows and Menus 878493 eZ-NDT
Page 41

Summary...
The Summary Report contains the overall NDT inspection results for the specified time period. Statistical
information is shown at the bottom of the report. The serial number and inspector name are also listed.
eZ-NDT v.5.0.43
Project Path: C:\PROGRAM FILES\ZONIC\EZ-NDT\ndt
Summary Report: 25-Oct-2001 08:57:03
Requested Range: 25-Oct-2001 08:50:01 - 25-Oct-2001 08:54:20
Company Name: Your Company Name
Part No.: Your P/N...
25-Oct-2001 08:50:01 FAILED
25-Oct-2001 08:50:05 FAILED
25-Oct-2001 08:50:10 FAILED
25-Oct-2001 08:53:10 FAILED
25-Oct-2001 08:53:11 FAILED
25-Oct-2001 08:53:13 FAILED
25-Oct-2001 08:53:14 FAILED
25-Oct-2001 08:53:15 FAILED
25-Oct-2001 08:53:18 FAILED
25-Oct-2001 08:53:35 FAILED
25-Oct-2001 08:53:36 FAILED
25-Oct-2001 08:53:39 FAILED
25-Oct-2001 08:53:44 FAILED
25-Oct-2001 08:53:48 FAILED
25-Oct-2001 08:53:52 FAILED
25-Oct-2001 08:53:54 FAILED
25-Oct-2001 08:54:04 FAILED
25-Oct-2001 08:54:06 FAILED
25-Oct-2001 08:54:18 FAILED
25-Oct-2001 08:54:20 FAILED
TOTAL PASSED: 0
AVERAGE PASSED: 0.00%
STD DEV PASSED:
TOTAL FAILED: 20
AVERAGE FAILED: 100.00%
STD DEV FAILED:
TOTAL: 20
AVERAGE TOTAL: 100%
STD DEV TOTAL:
eZ-NDT Summary Report
eZ-NDT 878493 Windows and Menus 4-21
Page 42

Detailed...
The Detailed Report, in addition to the information contained in the summary report, provides the measured
frequency and amplitude peak for each spectral band for each response channel.
eZ-NDT v.5.0.43
Project Path: C:\PROGRAM FILES\ZONIC\EZ-NDT\ndt
Detailed Report: 25-Oct-2001 08:56:43
Requested Range: 25-Oct-2001 08:50:01 - 25-Oct-2001 08:54:20
Company Name: Your Company Name
Part No.: Your P/N...
25-Oct-2001 08:50:01 FAILED Ch 02 F 1031.3 .00018 F 4056.3 .00006 F 7818.8 .00005 F
10044. .00003
25-Oct-2001 08:50:05 FAILED Ch 02 F 1231.3 .00019 F 4481.3 .00005 F 8131.3 .00004 F
12181. .00003
25-Oct-2001 08:50:10 FAILED Ch 02 F 1231.3 .00018 F 4556.3 .00006 F 8975.0 .00004 F
10806. .00004
25-Oct-2001 08:53:10 FAILED Ch 02 F 1625.0 .00017 F 4700.0 .00006 F 7443.8 .00004 F
10688. .00003
25-Oct-2001 08:53:11 FAILED Ch 02 F 1131.3 .00018 F 5018.8 .00005 F 7450.0 .00004 F
12125. .00003
25-Oct-2001 08:53:13 FAILED Ch 02 F 1231.3 .00020 F 4381.3 .00006 P 8243.8 .00005 F
10531. .00004
25-Oct-2001 08:53:14 FAILED Ch 02 F 1231.3 .00015 F 4037.5 .00006 F 9268.8 .00004 P
11375. .00004
25-Oct-2001 08:53:15 FAILED Ch 02 F 1231.3 .00015 F 4318.8 .00005 F 8025.0 .00004 F
10463. .00004
25-Oct-2001 08:53:18 FAILED Ch 02 F 1131.3 .00018 P 5250.0 .00005 F 9256.3 .00004 F
10769. .00004
25-Oct-2001 08:53:35 FAILED Ch 02 F 1231.3 .00016 F 4481.3 .00006 F 8056.3 .00005 F
10119. .00004
25-Oct-2001 08:53:36 FAILED Ch 02 F 1231.3 .00018 F 4006.3 .00006 F 7137.5 .00004 F
10350. .00003
25-Oct-2001 08:53:39 FAILED Ch 02 F 1231.3 .00018 F 4318.8 .00005 F 9987.5 .00004 F
10794. .00004
25-Oct-2001 08:53:44 FAILED Ch 02 F 1131.3 .00019 F 4481.3 .00006 F 8987.5 .00004 F
10119. .00003
25-Oct-2001 08:53:48 FAILED Ch 02 F 1231.3 .00018 F 4981.3 .00006 F 7381.3 .00005 F
10756. .00005
25-Oct-2001 08:53:52 FAILED Ch 02 F 1131.3 .00018 P 5550.0 .00005 F 7493.8 .00004 P
11644. .00003
25-Oct-2001 08:53:54 FAILED Ch 02 F 1231.3 .00018 F 4381.3 .00006 F 7043.8 .00004 F
12156. .00004
25-Oct-2001 08:54:04 FAILED Ch 02 F 1231.3 .00018 F 4718.8 .00005 F 7018.8 .00005 F
11094. .00004
25-Oct-2001 08:54:06 FAILED Ch 02 F 1231.3 .00017 F 4306.3 .00004 F 7350.0 .00004 F
11094. .00004
25-Oct-2001 08:54:18 FAILED Ch 02 F 1231.3 .00017 F 4381.3 .00006 F 9600.0 .00004 F
9987.5 .00003
25-Oct-2001 08:54:20 FAILED Ch 02 F 1231.3 .00017 F 4381.3 .00006 F 7112.5 .00004 F
12006. .00003
TOTAL PASSED: 0 Ch 02 0 2 1 2
AVERAGE PASSED: 0.00% Ch 02 0.00 0.00 5400.0 .00005 8243.8 .00005
11509. .00003
STD DEV PASSED: Ch 02 0.00 0.00 150.00 11.1E-07 0.00 0.00
134.38 25.6E-07
TOTAL FAILED: 20 Ch 02 20 18 19 18
AVERAGE FAILED: 100.00% Ch 02 1220.9 .00018 4443.8 .00006 8080.9 .00004
10893. .00004
STD DEV FAILED: Ch 02 107.91 .00001 273.87 59.9E-07 935.71 35.7E-07
727.93 45.1E-07
TOTAL: 20 Ch 02 20 20 20 20
AVERAGE TOTAL: 100% Ch 02 1220.9 .00018 4539.4 .00005 8089.1 .00004
10955. .00004
STD DEV TOTAL: Ch 02 107.91 .00001 389.94 62.0E-07 912.71 35.7E-07
716.14 43.8E-07
eZ-NDT Detailed Report
4-22 Windows and Menus 878493 eZ-NDT
Page 43

Plot Data…
The Plot Data report generates a list of all the data points (using x and y coordinates) that are displayed on
the graph. To generate a Plot Data report:
1. Select Plot Data... on the Report menu.
2. A save file dialog box will open.
3. Type a name your report file in the filename data entry box. Use a unique name for each report.
4. Click the Save button.
After generating the report, eZ-NDT automatically opens the text file in Windows NotePad or WordPad.
Configuration...
The Configuration Report is a comprehensive listing of the project’s parameters. It is a text file that can be
saved and included with project documentation.
1. Select Configuration Settings... on the Report menu.
2. A save dialog will open.
3. Type a name your report file in the filename data entry box. Use a unique name for each report.
4. Click the Save button.
eZ-NDT 878493 Windows and Menus 4-23
Page 44

After it is generated, eZ-NDT will automatically open the report using Windows NotePad or WordPad.
An example follows.
Company Name: Inspecto-Tech
Part No.: GEAR CASE 104-A
ACQUISITION CONFIGURATION ---------------
Analysis: 20000 Hz
Blocksize: 8192
Averages: 1
EU / dB: EU Amplitude
Project Size: 100 Records
Picture File: C:\_PROJECTS\1086\eZ-NDT\prop part image.JPG
Password: NDT
INPUT CHANNELS CONFIGURATION ------------
Channel 1: TRIGGER
Name: Hammer
Display Min: 0.00
Display Max: 1.0000
Eng. Units: lbf
FS Voltage: .20000
mV/EU: 1.0000
FFT Window: Force
Trigger (%FSV): 10.000
Trigger Delay (%): 5.0000
Channel 2: RESPONSE
Name: Microphone
Display Min: 0.00
Display Max: 1.0000
Eng. Units: Pa
FS Voltage: .20000
mV/EU: 25.000
FFT Window: Hanning
LIMITS CONFIGURATION ------------------
Channel 2:
Freq Range: 935.80 8341.0 (Hz)
Freq Limits: 1293.8 1798.3 (Hz)
Amp Limits: 32.417 74.054
Freq Range: 5313.6 6093.1 (Hz)
Freq Limits: 5575.1 5811.5 (Hz)
Amp Limits: 0.00 58.331
DIGITAL IO CONFIGURATION ------------
COM Port: 1
Example of a Configuration Report
4-24 Windows and Menus 878493 eZ-NDT
Page 45

User Menu
Remember your Level 3 password. If you go to Level 1 (Inspector), you will need the
password to return to Level 3 (Manager).
The current User Level is displayed in the lower portion of the Acquisition panel. There are 3 User Levels.
Level 3 (Manager) allows you complete access to all eZ-NDT features.
Level 1 (Inspector) enables minimal features. Typically you would use this feature if you have concerns
regarding unauthorized access to your eZ-NDT Projects while the system is unattended.
eZ-NDT 878493 Windows and Menus 4-25
Page 46

Notes for Efficient use of eZ-NDT
1. It will save you time, if you modify the NDT project in the executable’s directory to match your
standard configuration. Whenever you create a New Project, this project is the configuration
template that is copied into your new project.
2. For ZonicBook-Medallion users only: Make sure the Dip switches are configured correctly.
(Typically: Single Ended, AC coupled, and ICP ON.)
3. Use a standard channel location convention for your Force and Response channels.
Typically: Force is channel 1 and Response is channel 2. Popular labels are: “Trigger” or
“Hammer” for Force and “Microphone” for Response.
4. If you aren’t getting a Trigger after you strike the part, verify the Force channel’s FSV and
Trigger Level Percentage.
5. A negative Pre / Post Trigger percentage will result in FRF calculations and limit checking. A
positive Pre / Post Trigger percentage will use auto spectrum. Generally, you should use a positive
Pre / Post Trigger percentage.
6. Some older versions of eZ-NDT created multiple project files (i.e., files with extensions “.ndt1”,
“.ndt2”, etc.). If you wish to open an older file with newer versions of eZ-NDT which use only one
file, simply open the old “.ndt1” file. This old project will automatically be converted to a single file
with a “.ndt” extension.
7. If for some reason, you have an error where eZ-NDT does not start. You can work around the
problem by deleting the file, “ndt.ini,” located in the executable’s directory. This file identifies the
last Project opened. You can delete this file without affecting your data. Try reopening the last
project.
8. If you still experience problems. Please send an email to productsupport@iotech.com.
4-26 Windows and Menus 878493 eZ-NDT
Page 47

Setting Limits 5
Limits are defined frequency and amplitude ranges (where the resonances of a part will peak) across the
x-axis. In our example, we impacted several known good parts and captured a sample resonance in the
following display. We then placed cursors at the peaks we thought were significant. These same peaks
may change in amplitude or shift frequency if a part is bad. Please note that significant peaks are not
always the ones with the most amplitude. In fact, some of the peaks at lower amplitudes can be very
significant because when they are below a certain amplitude it indicates that the part is “bad.”
Significant Peaks
Now that we know where the peaks are located, we can set the limit range in which they will appear.
Use the cursor values listed to the right of the plot to help you determine where frequency and
limit ranges should be set.
Note that the first cursor is at 4250 and that there is another peak at approximately 4800, which we did not
mark with a cursor. However, if a part is bad, that peak may shift down in frequency. Therefore, when
setting our “good” limit, we must make sure that we set it low enough so that the resonance shift of the
“bad” peak doesn’t create a peak within our “good” limits.
In our example we set the frequency range from 4050 to 4450 and the frequency limits between 4150 and
4350. Remember our “good” peak should be around 4250.
Setting Limits using Significant Peaks
eZ-NDT 938895 Setting Limits 5-1
Page 48

5-2 Setting Limits 938895 eZ-NDT
 Loading...