

Page 1

DIAdem
Quick Start and User’s Guide
An abbreviated manual for rapid familiarization with the free
More detailed information is available in the DIAdem User’s Manual that is distributed
with Licensed-Versions of DIAdem.
®
the PC Workshop
-
DIA
dem
-VIEW
device.
the smart approach to instrumentation
™
IOtech, Inc.
25971 Cannon Road
Cleveland, OH 44146-1833
Phone: (440) 439-4091
Fax: (440) 439-4093
E-mail (sales): sales@iotech.com
E-mail (post-sales): productsupport@iotech.com
Internet: www.iotech.com
®
DIAdem
the PC Workshop
p/n
457-0903,
dem
DIA
GfS Systemtechnik GmbH & Co.KG maintains the copyright to the material
presented in this user’s guide, unless otherwise noted or implied.
® is owned and registered by GfS Systemtechnik GmbH & Co.KG.
Rev.
2.0
Released per EO# 2073R4 December 2000
Page 2

DIA
dem
Page 3

®
DIAdem
DIAdem® is owned and registered by GfS Systemtechnik GmbH & Co. KG.
Preface …… 2
®
dem
DIA
DIA
DIA
DIA
Quick Start …… 3
Installing
Launching
Using
Where to go from here …… 10
DIA
“Examples” Help Files …… 11
dem
The Overall Design …… 13
DIA
Options …… 19
dem
The Data Area …… 23
Copying, Pasting, and Deleting Data Channels …… 25
Saving and Opening Data Sets …… 26
dem
Viewing Data as Graphs …… 27
Using the Cursor Position to Measure a Graph …… 28
How to Copy or Delete a Graph …… 32
Using Zoom, Scrolling, & Screen Partition …… 33
DIA
dem …… 3
DIA
dem from an Acquisition Program …… 4
DIA
dem with ChartView …… 6
dem-VIEW Help Files …… 10
- the PC Workshop …… 13
Context Menus and Tool Tips …… 15
The DIAdem Devices …… 15
The Module Bar …… 15
Functions …… 16
The Working Area …… 16
Dialog Boxes …… 16
Default Settings for Functions …… 17
Commands …… 17
Menus …… 18
dem Help …… 18
Tool tips …… 18
Dialog Box Help …… 18
Help Menu …… 18
Active Help: Demos and Examples …… 19
Desktop Settings …… 19
The Device-Specific Settings …… 20
Directory Structure …… 20
Saving and Loading Settings …… 21
DATA: Loading and Saving Data …… 23
VIEW: Viewing, Measuring & Editing Data …… 27
Graph Definitions: Entering & Deleting Graphs in an Axis System …… 27
Using the Graphics Cursor in DIAdem View …… 28
Graph Legend: Displaying the Axis-Oriented Display …… 30
Global Coordinate Display: Displaying Cursor Coordinates in Overview Format …… 31
Axis-local Scaling: Various Graphs in one Axis System for Clarity …… 31
Zoom: Enlarging Graph Segments ……33
Scrolling Through Graph Segments…… 34
Screen Partition: Re-arranging Axis Systems…… 35
DIAdem® is owned and registered by GfS Systemtechnik GmbH & Co.KG.
GfS Systemtechnik GmbH & Co.KG maintains the copyright to the material
presented in this chapter, unless otherwise noted or implied.
Page 4
Preface
Devices and Interfaces of DIA
dem
- the PC Workshop
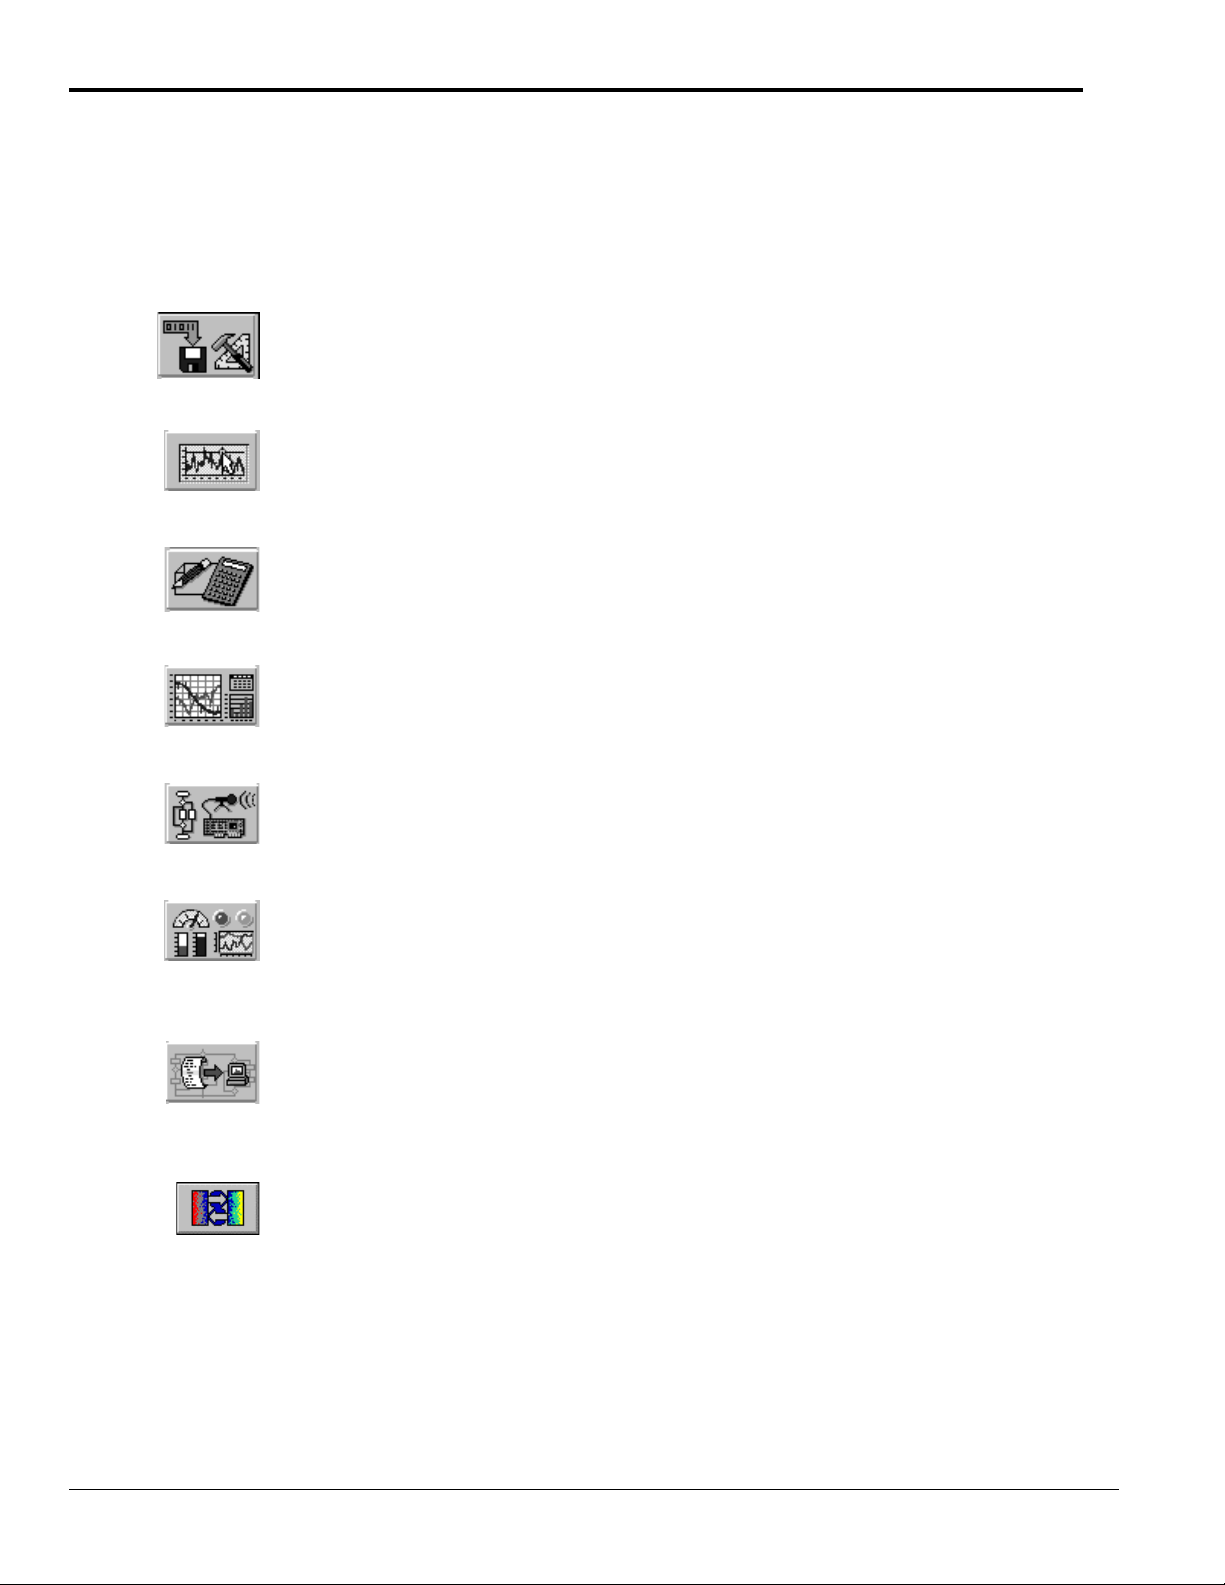
DIAdem®, the PC workshop provides solutions for your technical tasks. It is made up of seven components called
devices.
DIAdem® DATA manages data sets. Data can be processed individually, in blocks or in channels.
Data is displayed for overview in data channels; the corresponding data properties are displayed in
sorted table format.
DIAdem -DATA
With DIAdem® VIEW you can view data or “look at it under the magnifying glass.” The Working
area is divided into several axis systems to facilitate viewing. Curve sections can be deleted and
recalculated.
DIAdem®-VIEW
DIAdem® CALC lets you evaluate data mathematically. Each mathematical operation can be
performed with custom parameters or configured with permanent default settings. Individual
calculations are documented in the background in the form of a script.
DIAdem®-CALC
With DIAdem® GRAPH you can document data in presentation format. Represent your
information using graphs, bars, or tables. You c an also embed in ba ckground graphics.
DIAdem®-GRAPH
DIAdem®-DAC
DIAdem®-VISUAL
DIAdem-AUTO
DIAdem® Interfaces
With DIAdem® DAC (Data Acquisition and Control) you can process data online. Measurement
and control tasks are described graphically and are divided into four separate layers: the data
layer, the Packet Processing layer, the control layer and the system layer.
With DIAdem® VISUAL your terminal becomes a real-time display instrument. The wide range of
indicator and input instruments and the capability of linking in images and image sequences allow
you to simulate any number of measurement instruments and situations (real world
instrumentation).
DIAdem® AUTO allows you to automate procedures as Autosequences. Procedures can be
recorded interactively and then run off any number of times, with results that can be accessed by
all the DIAdem
®
devices. DIAdem® user dialogs enable you to intervene interactively while the
Autosequence is runni ng.
DIAdem® has various interfaces for linking external applications: data is exchanged with other
Windows applications via DDE and OLE and with databases via ODBC/SQL. External hardware
drivers (OPC server) can be accessed via OPC. Via the TCP/IP interface, (measured) data can be
exchanged online between DIAdem
®
-PCs within a network. The DLL interface GPI in DIAdem
®
can be used to integrate measurement hardware, data file drivers, commands and variables.
2 DIA
dem
Quick Start Guide
09-06-00
DIA
dem
Page 5
DIA
dem Quick Start
Reference Note:
DIAdem’s
including examples and user tips pertaining to all of the DIAdem software features and options.
Help Menu
, represented by a question mark (?) in the tool bar contains a great deal of helpful information,
Installing DIA
Minimum System Requirements
IBM compatible computer 80386, with coprocessor
•
Minimum 66 MHz
•
At least 8 MB RAM (16 MB RAM or more recommended)
•
At least 20 MB of available disk space
•
Microsoft Windows (version 3.1, Windows95/98, or WindowsNT)
•
Minimum monitor resolution: 800 x 600 pixels
•
Installation Steps
Note:
1. Install Software.
(a) Insert the install CD-ROM and wait for
your PC to auto-access the CD.
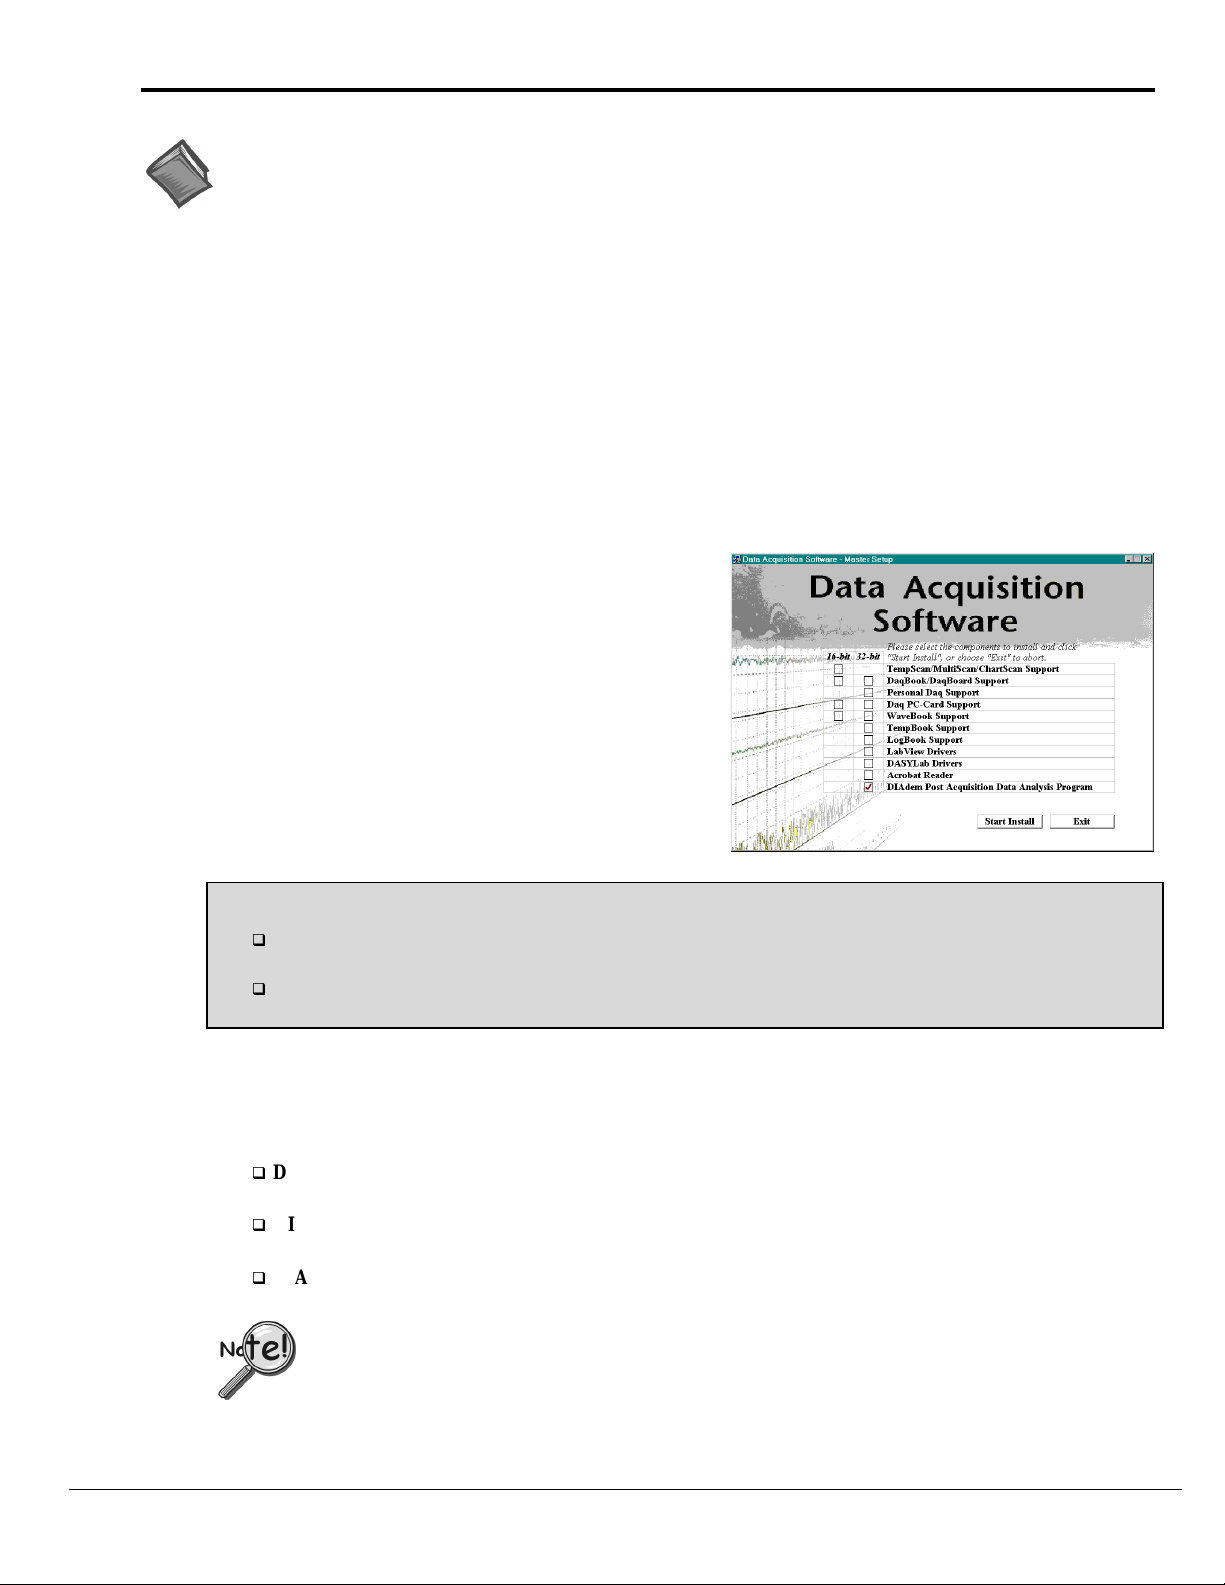
(b) When the Data Acquisition Software – Master Setup
screen appears, check:
“DIAdem Post Acquisition Data Analysis Program
(c) Click
2. Choose a DIAdem Installation Type.
You will be prompted to choose a DIAdem installation
type.
dem
More than likely you installed DIAdem during the installation of the primary Data Acquisition Software for
your device. If you already installed DIAdem, please ignore the following steps.
.”
Start Install.
Note
Select one of these two options unless you purchased a licensed version of DIAdem
:
DIAdem Shell + View for IOtech Customers
This version is provided free to users of IOtech hardware.
DIAdem 30 Day Trial –
Select this installation type if you did not purchase a licensed version of DIAdem,
– Installs a free version with DIAdem Shell and DIAdem View.
.
but would like to try out DIAdem’s expanded features.
Select one of the above options unless you purchased a DIAdem licensed version.
Do not confuse the
“Standard” Licensed version (below) with the DIAdem Shell + View for IOtech Customers version,
these are completely different installs.
have a license disk and password
To install any of the following three “Licensed” versions you must
. The DIAdem program will inform you when to insert a License Disk,
password, and user name.
DIAdem Licensed Version
DIAdem.
DIAdem Licensed Version
view” or “help files” installed.
DIAdem Licensed Version
licensed version.
(Customized)
(Minimized)
(Standard)
– Installs program, “quick view,” and documentation files for a DIAdem
– Allows you to specify the installed software components for licensed
– Installs only the program files for Licensed DIAdem. There are no “quick
If you purchased a licensed version of DIAdem, a license disk and password were included in your
order. The DIAdem install program will inform you when to insert the License Disk and when to
enter your license password and user name.
3. Click <Next
> (after making your sel ection from step 2).
as
DIA
dem
09-06-00
DIA
dem
Quick Start Guide 3
Page 6
4.
Select Options and Click <Finish>.
Just before the setup is complete, you will see the following two option check boxes.
Display the latest information now
This box is checked by default. Leaving the boxed checked brings up the rea dme file
contents listed below. We recommend that you leave this box checked.
Start the program now
Launches the
–
DIA
dem program for immediate use.
–
After selecting one, both, or neither option, click <Finish> to complete the setup.
Readme File Contents
Readme file contents are subject to change. File categories are typically as follows:
Getting Started
Updates to the Current Version
Additional Information
Conditions for Use
Launching DIA
1. Include the DIA
2. Acquire Data to Disk and Convert File
dem
from an Acquisition Program
The steps in this section do not apply to ChartView
The following steps can be used with data acquisition programs that contain a file converter capable
of converting r aw binary data to the DIA
following section, Using DIAdem with ChartView.
Reference Note:
The following steps apply to DaqView, Personal DaqView, LogView, and WaveView. The steps
are discussed in general terms since the data acquisition programs differ in regard to toolbars, pulldown menus, and other aspects of GUI layout. Refer to your specific application’s documentation
as needed.
dem
File Format as a Data Conversion Preference
Verify DIA
accomplished through your application’s
“Conversion Preferences.”
Refer to your application’s user documentation as
needed.
Note: DIA
is selected as a file format. This is
dem
is initially selected by default.
dem
.
data format. ChartView User’s should skip to the
dem
Selecting DIAdem as a File Format
4 DIA
When acquiring data to disk, your application’s file
converter automatically converts the Raw Binary data
to the DIA
Target Format (verified in the
dem
previous step).
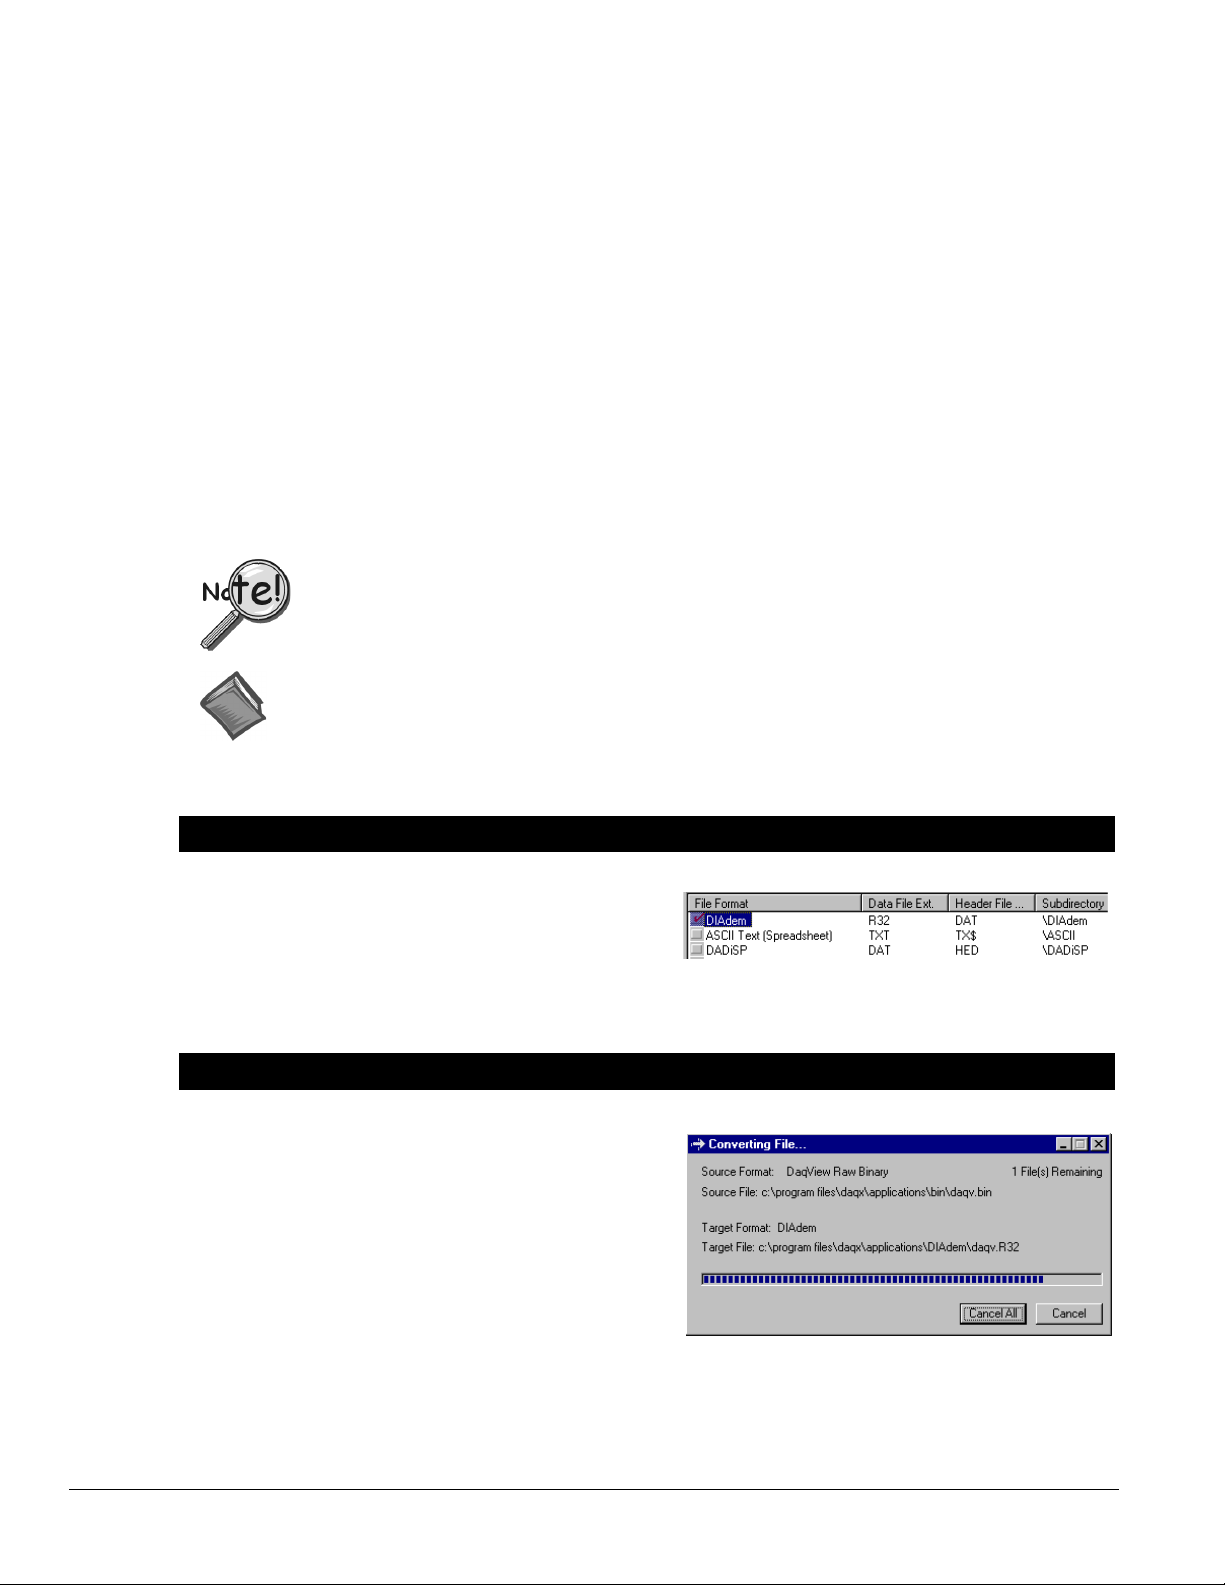
During the conversion, a “Converting Fil e” box
shows: an animated completion bar, format of the
source and target files, and file paths of the source
and target. The box is usually on screen for only a
moment; however, we can obtain the information
from your application’s Data Destination region,
as mentioned in the following tip.
dem
Quick Start Guide
File Conversion in Progress
09-06-00
DIA
dem
Page 7
After the data conversion completes, check the Data Destination area of your application. Certain applications,
such as DaqView, make use of a Data Destination tab. Other applications (such as WaveView), show data
destination after a “Direct to Disk” [or equivalent] button is pressed. Consult your application’s user
documentation as needed.
It is a good idea to write down the complete file path for the newly created DIAdem data. This allows you to
access the file later from DIAdem’s Load Data box, as discussed on page 8.
Checking Data Destination
In this example, the DIAdem target file is located at
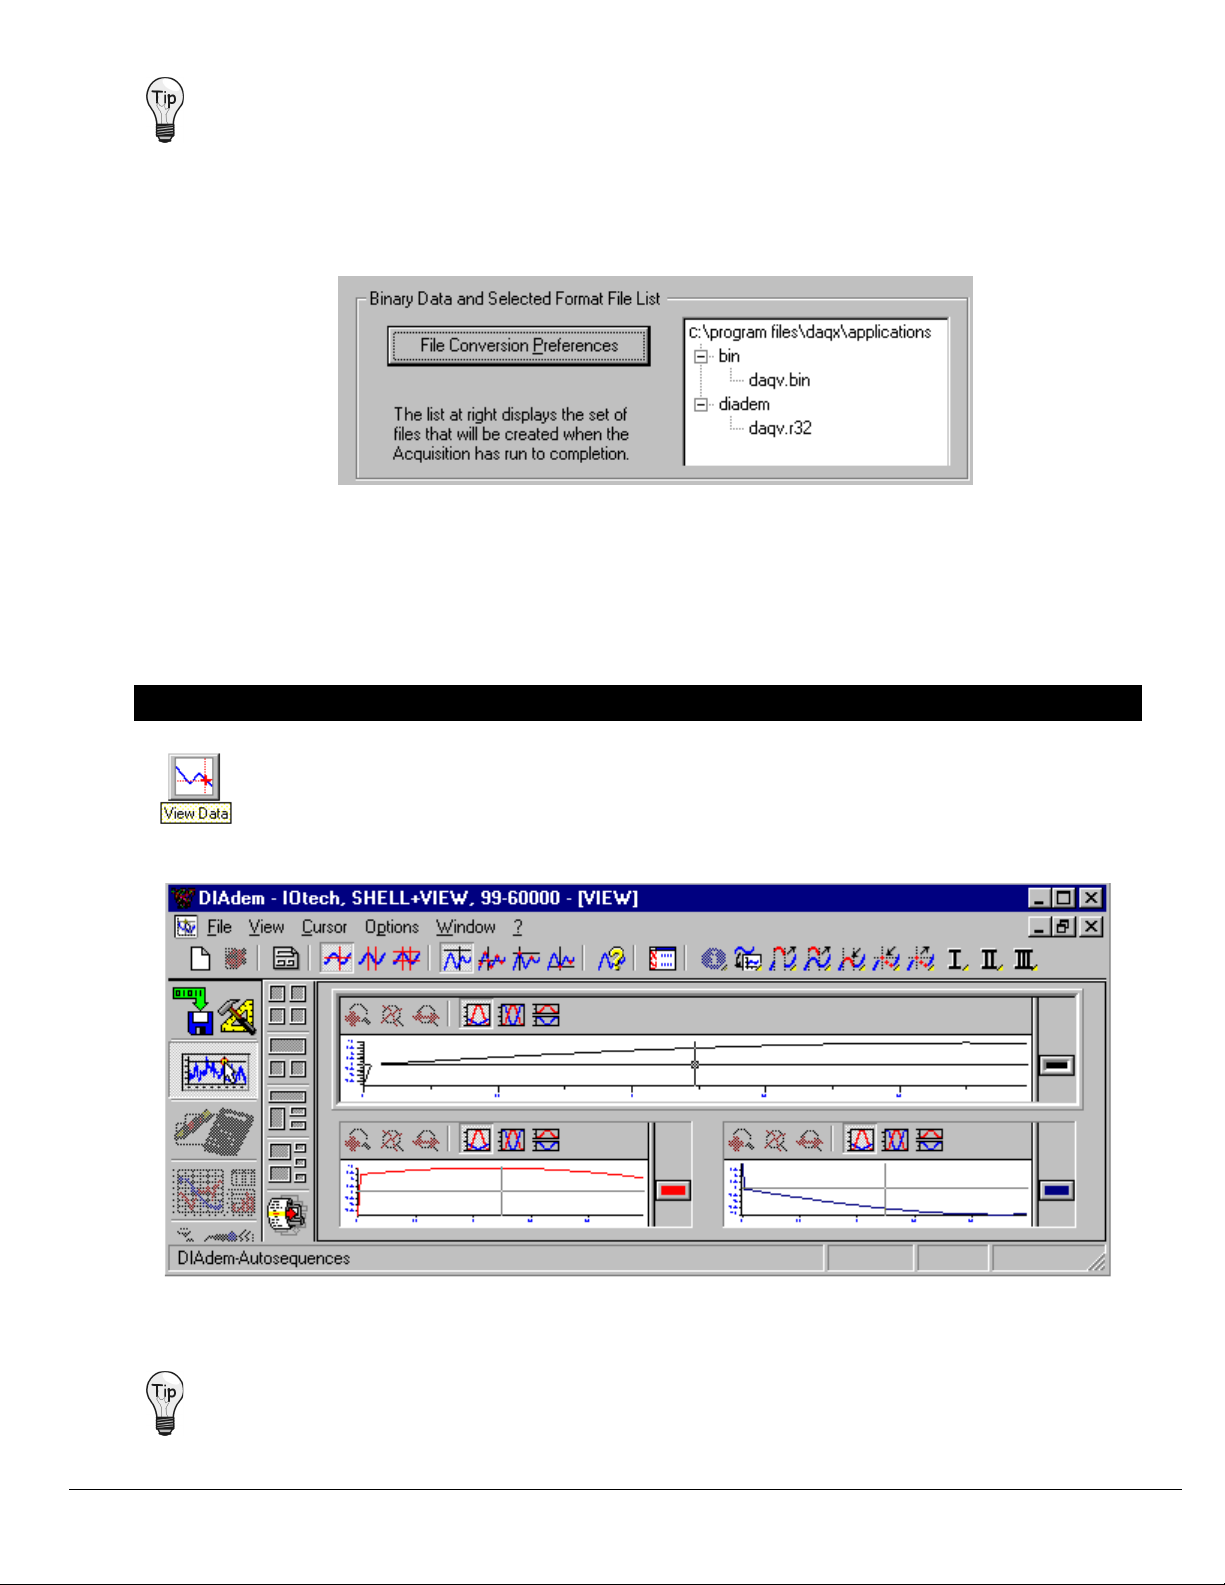
3. View Data
From your data acquisition program’s main window, click the View Data button. This launches the
DIAdem program. DIAdem’s main window will appear with waveforms from the most recently acquired
file.
c:\program files\daqx\applications\diadem\daqv.r32
DIA
DIAdem’s Main Window, Showing Graphs for Three Channels
We recommend that you review sections 1, 2, and 3 of this document, as well as DIAdem’s help files. The section
entitled, “Where to go from here….” on page 10 includes instruction on accessing the help files and identifies the
various help topics.
dem
09-06-00
DIA
dem
Quick Start Guide 5
Page 8
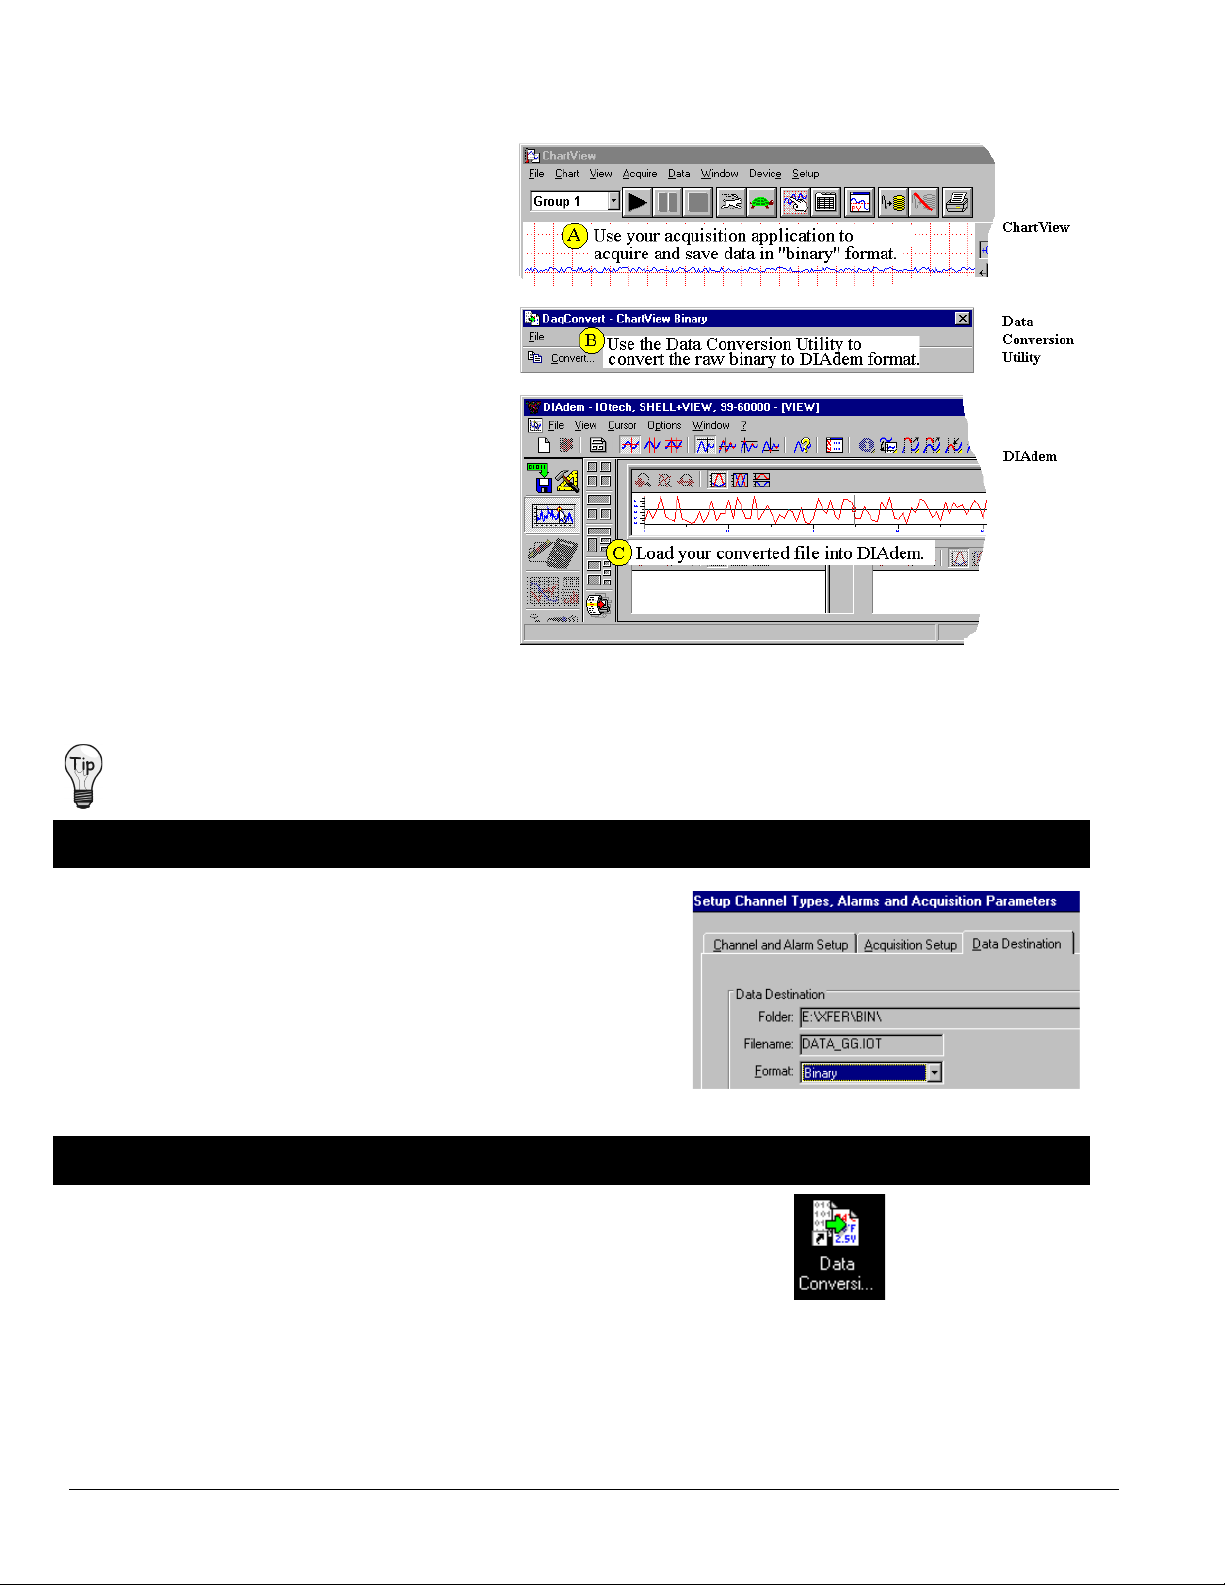
Using DIAdem with ChartView
This method must be used for data acquisition
programs that have no integrated converter capable
of converting r aw binary data to the DIAdem data
format.
ChartView has no direct support for DIAdem. In this
case a stand-alone file converter is used to convert
binary data to the DIAdem format.
Note: The Data Conversion Utility (file converter)
is installed automatically when you install
ChartView from CD-ROM release version 1.9
or greater.
The following steps show how to convert a bina ry
file from a data acquisition program to DIAdem
format, then load the converted file into DIAdem.
A simplified view of the procedure is at right.
(A) Use ChartView to acquire and save data in
binary [raw binary] format.
(B) Use the Data Conversion Utility to convert the
raw binary format into the DIAdem format.
(C) Load the converted file into DIAdem.
ChartView, Data Conversion Utility, and DIAdem
on a Desktop Concurrently
During a session in which several acquisitions are to be followed by viewing each file in DIAdem, it is recommended
that: the data acquisition application, the file converter, and DIAdem remain on the desktop concurrently.
(A) Acquire and Save Data in Binary Format
1.
Open ChartView.
Consult the ChartScan Users Manual as needed.
2.
Select Binary Data Format.
This is done in ChartView’s Data Destination section (see figure).
3.
Acquire and Save Data.
In the example at the right we are saving a binary data file named
DATA_GG.IOT
to folder
E:XFER\BIN\
(B) Convert Binary Data to DIAdem Format
1.
Open the Data Conversion Utility.
Use a shortcut i con, or navigate from your desktop’s Start Menu as follows and
double-click on the Data Conversion Utility item:
Start ⇒ Programs ⇒ ChartView ⇒Applications ⇒ Data Conversion Utility
Select Binary Format
Shortcut to the Data
Conversion Utility
The conversion utility appears similar to that shown in the following figure.
6 DIA
dem
Quick Start Guide
09-06-00
DIA
dem
Page 9
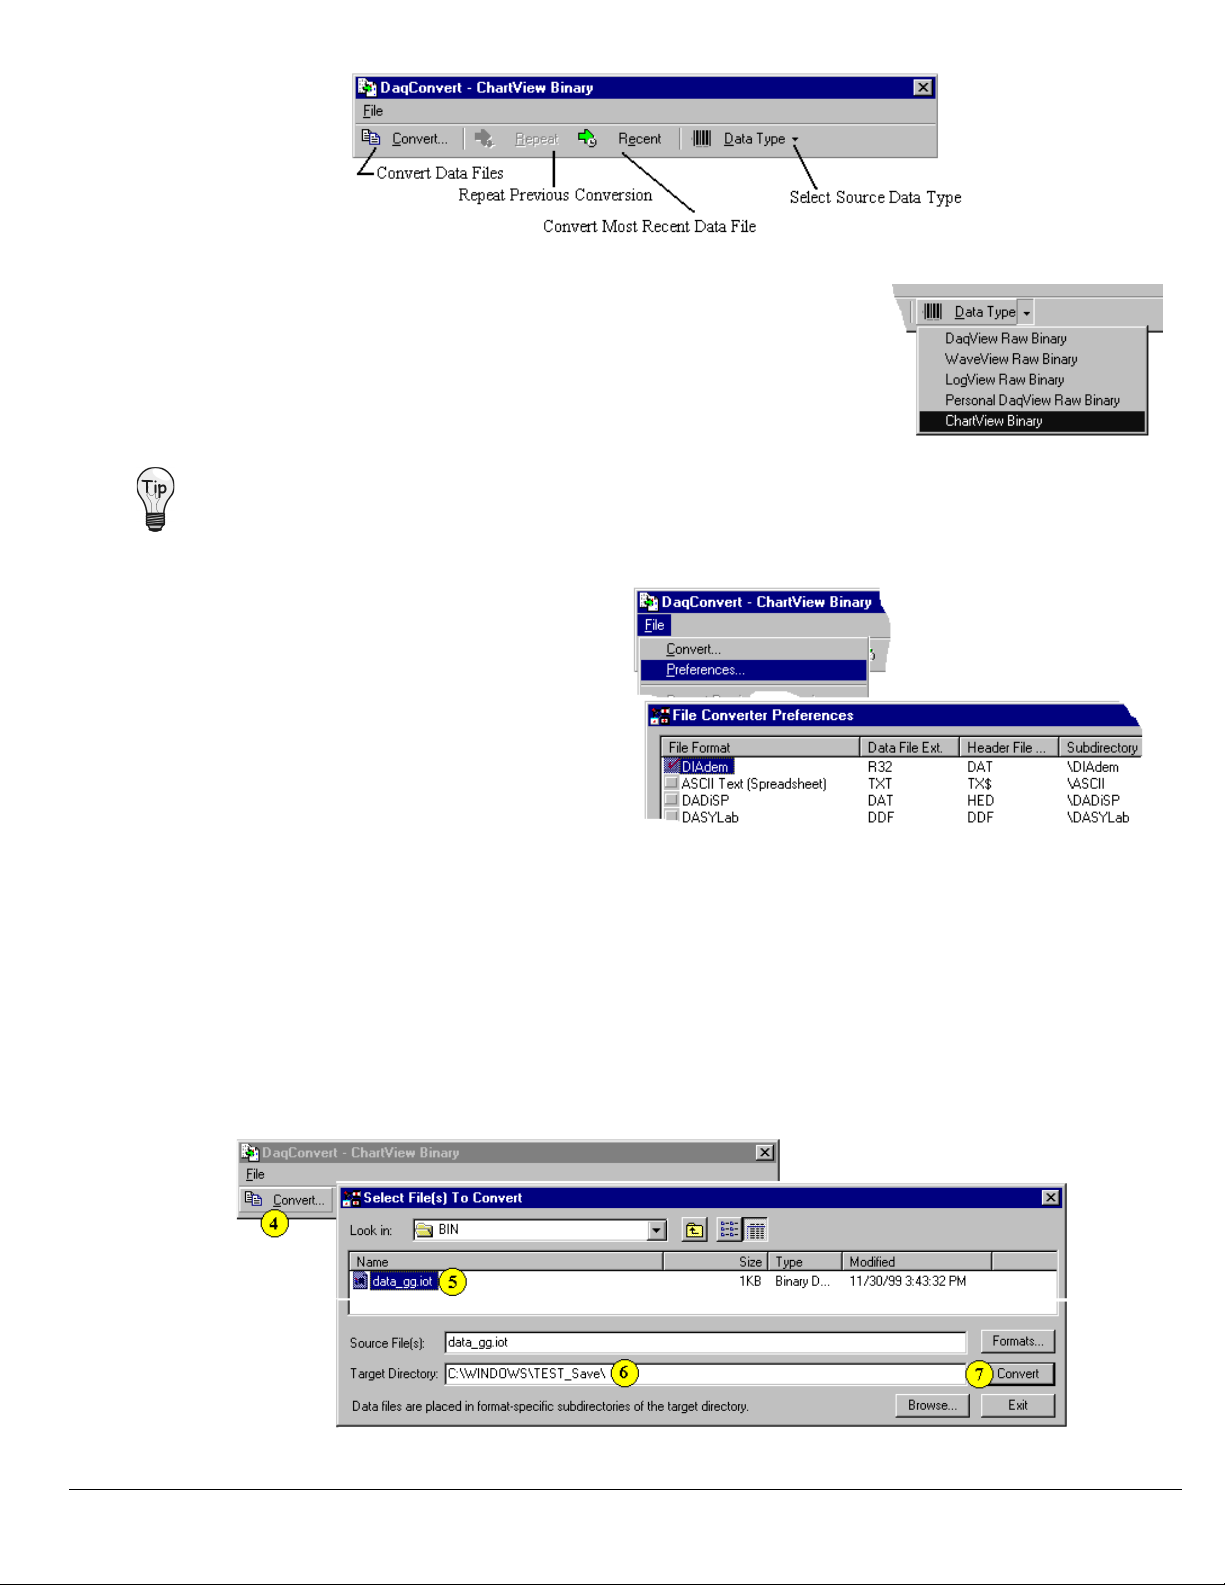
Data Conversion Utility (appearance shown is for ChartView)
2.
Select "ChartView Binary" as the Data Type.
The first time you run the data converter, a dialog box prompts you to select a data
type. The data type designation is based on the program that was used to collect the
data, e.g., ChartView.
If the prompting dialog box does not appear, use the Select Source Data Type Tool
to select ChartView Binary (as shown in the figure at the right).
If this is the first time you are using the data converter you can skip
to step 4 since the DIAdem format is initially selected by default.
3.
Select the DIAdem File Format.
This can be done as follows by dropping down the
data conver t er's File menu and clicking
"Preferences." This opens a dialog box displaying
a list of formats into which your data can be
converted.
If there is not a check mark next to the DIAdem
item, click on it once to check it.
Note: You can select additional file formats for
other application uses; but for our Quick Start
Selecting the DIAdem File Format
purposes we only need to select the DIAdem
format.
Selecting a Data Type
DIA
4.
Click the Convert Button [on the data converter's tool bar].
A dialog box will appear that is similar to the Open File dialog used by many programs (see following figure).
Note that this directory differs for each of the View programs.
If this is the first time that you are converting files of this type, you will have to navigate to the directory containing
your data. For example, to get to
E:\XFER\BIN\DATA_GG.IOT
Converting a ChartView Binary File to a DIAdem Format File
dem
data_gg.iot
Note that this is the path that was identified earlier in our example application’s Data
Destination for the binary file (on page 4).
(as shown if the following figur e), we navigated as follows:
09-06-00
DIA
dem
Quick Start Guide 7
Page 10
5.
Select the Files as you want to Convert.
In the example we only have one file available (
6.
Enter the Target Directory Path.
data_gg.iot
).
In the Target Directory textbox, type the path of the directory that you want to use as the parent directory of the
converted data. Note that you can press the Browse button to navigate to the target directory instead of typing it.
In the example above we used:
C:\WINDOWS\TEST_Save\
The converted data files will be placed in a sub-directory named "DIAdem". Thus the complete path for our saved
data is:
7.
Press the Convert Button (in the Select Files to Convert box).
C:\WINDOWS\TEST_Save\DIAdem\data_gg.DAT
This action starts the file conversion and displays a progress meter.
After the DIAdem format file has been created, we can load our acquired data into DIAdem as discussed in the
following section.
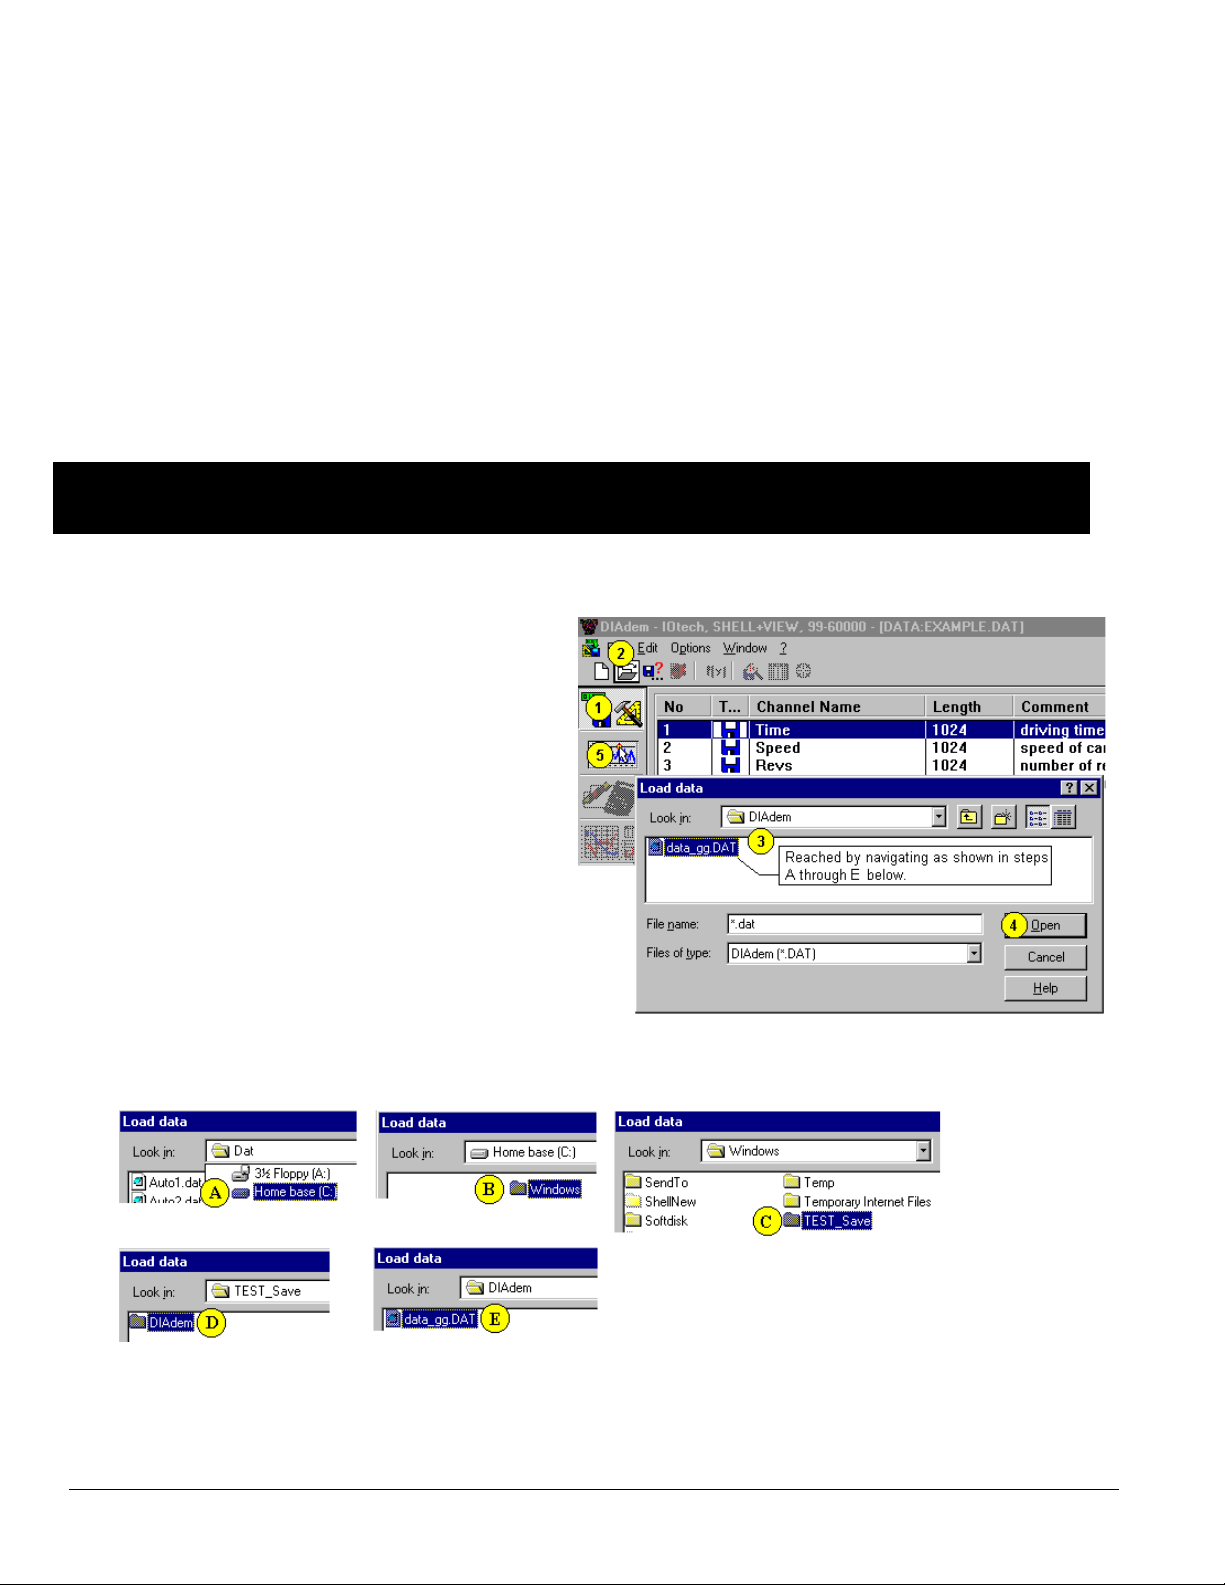
(C) Load the Converted File into DIAdem
(these steps are not exclusive to ChartView and can be applied to other acquisition programs)
If you do not already have DIAdem open, launch the program from a desktop shortcut (if applicable), or by
navigating from the PC desktop as follows:
Start ⇒ Programs ⇒ DIAdem ⇒ DIAdem
1. Click the DIAdem-DATA: Data Management button.
2. Click Load Data. A Load Data box appears.
3. Using the Load Data window, locate your DIAdem
target file and highlight its name.
In the example we have highl i ghted daqv.DAT.
Note: We reached this target file by navigating as shown in
steps A through E (below).
We used the Target Directory path we created earlier
C:\WINDOWS\TEST_Save\
The complete path for our saved data was
C:\WINDOWS\TEST_Save\DIAdem\data_gg.DAT
Note: DIAdem data files always have a "DAT" file
extension. The file name itself will match the name of
the raw binary file you converted.
If you need help finding a target directory path, see the
related tip on page 3; or consult your application’s
users manual, if needed.
Loading Converted ChartView Data into DIAdem
8 DIA
dem
Quick Start Guide
Navigating via DIAdem’s Load Data Box to Locate the Target File
09-06-00
DIA
dem
Page 11
4. Click Open.
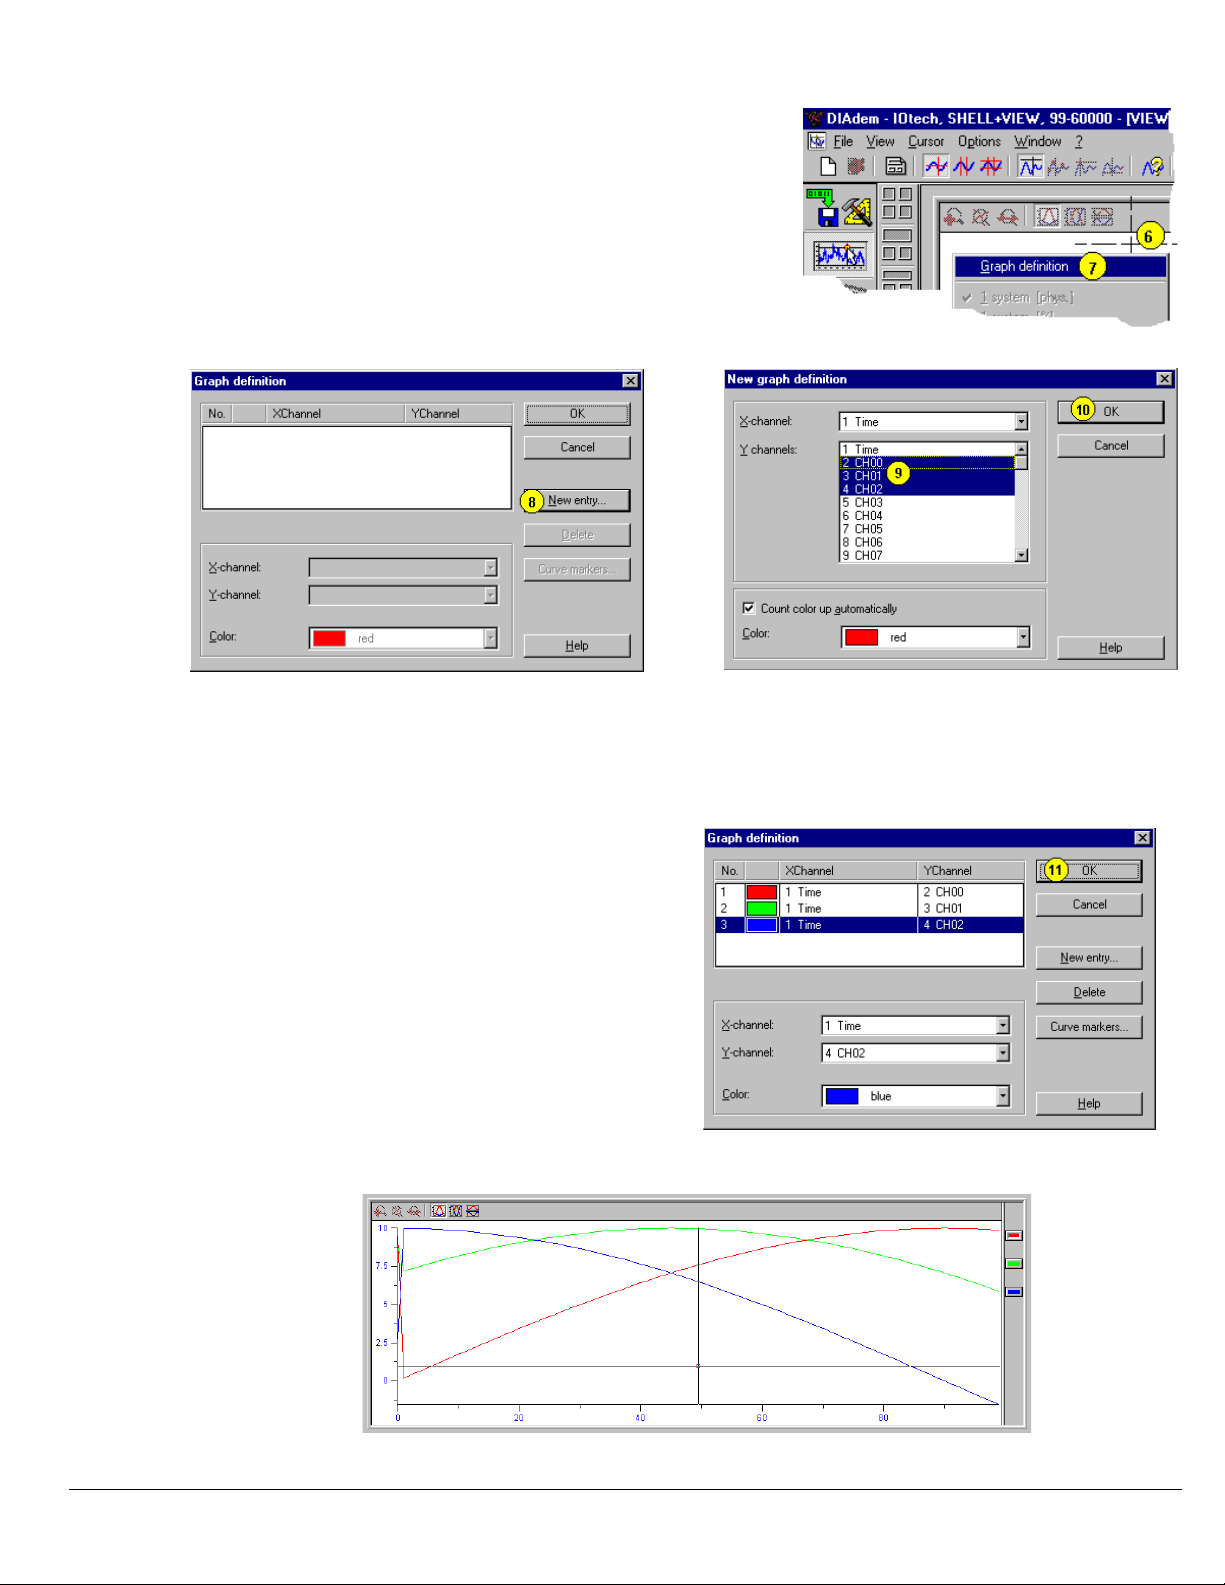
5. Click the DIAdem-VIEW: Data Viewing button.
6. Right-click in the empty graph region of a chart. A specific location
is not required.
7. Click on the Graph Definition item listed at top of the pop-up box.
A Graph Definition box appears, as shown in the following figure.
8. Click New Entry. A New Graph Definition box appears.
Selecting “New Entry”
Selecting Three Channels for Viewing
9. Select three channels. Do this by holding down your keyboard’s CTRL key, then selecting three channels with the
mouse. In our example we have selected Channels 0, 1, and 2 (CH00, CH01, CH02).
10. Click OK. A Graph Definition box appears with information regarding the three graphs. For each graph (1, 2, and 3)
the X-axis and Y-axis are identified and a graph color is indicated as shown in the following figure.
In the Graph Definitions example to the right, we see
that the X-axis represents time and the Y-axis
represents channel values.
11. Click OK.
The three graphs can now be viewed as indicated in
the following two figures.
Graph Definition for 3 Channels
DIA
dem
Viewing Three Graphs of Channel Values over Time
09-06-00
DIA
dem
Quick Start Guide 9
Page 12
Where to go from here …
At this point you should have just completed viewing data in DIAdem. What’s next?
We recommend that you experiment with the program to get a better feel for its many features and capabilities. You
should review the available documentation, including the DIAdem Help files. Several help topics are identified in the
remaining figures.
Reference Notes:
(1) Refer to the sections 1, 2, and 3 of this document for more
detailed information regarding DIAdem.
(2) DIAdem’s Help Menu, represented by a question mark (?)
in the tool bar contains a great deal of helpful information,
including examples and user tips.
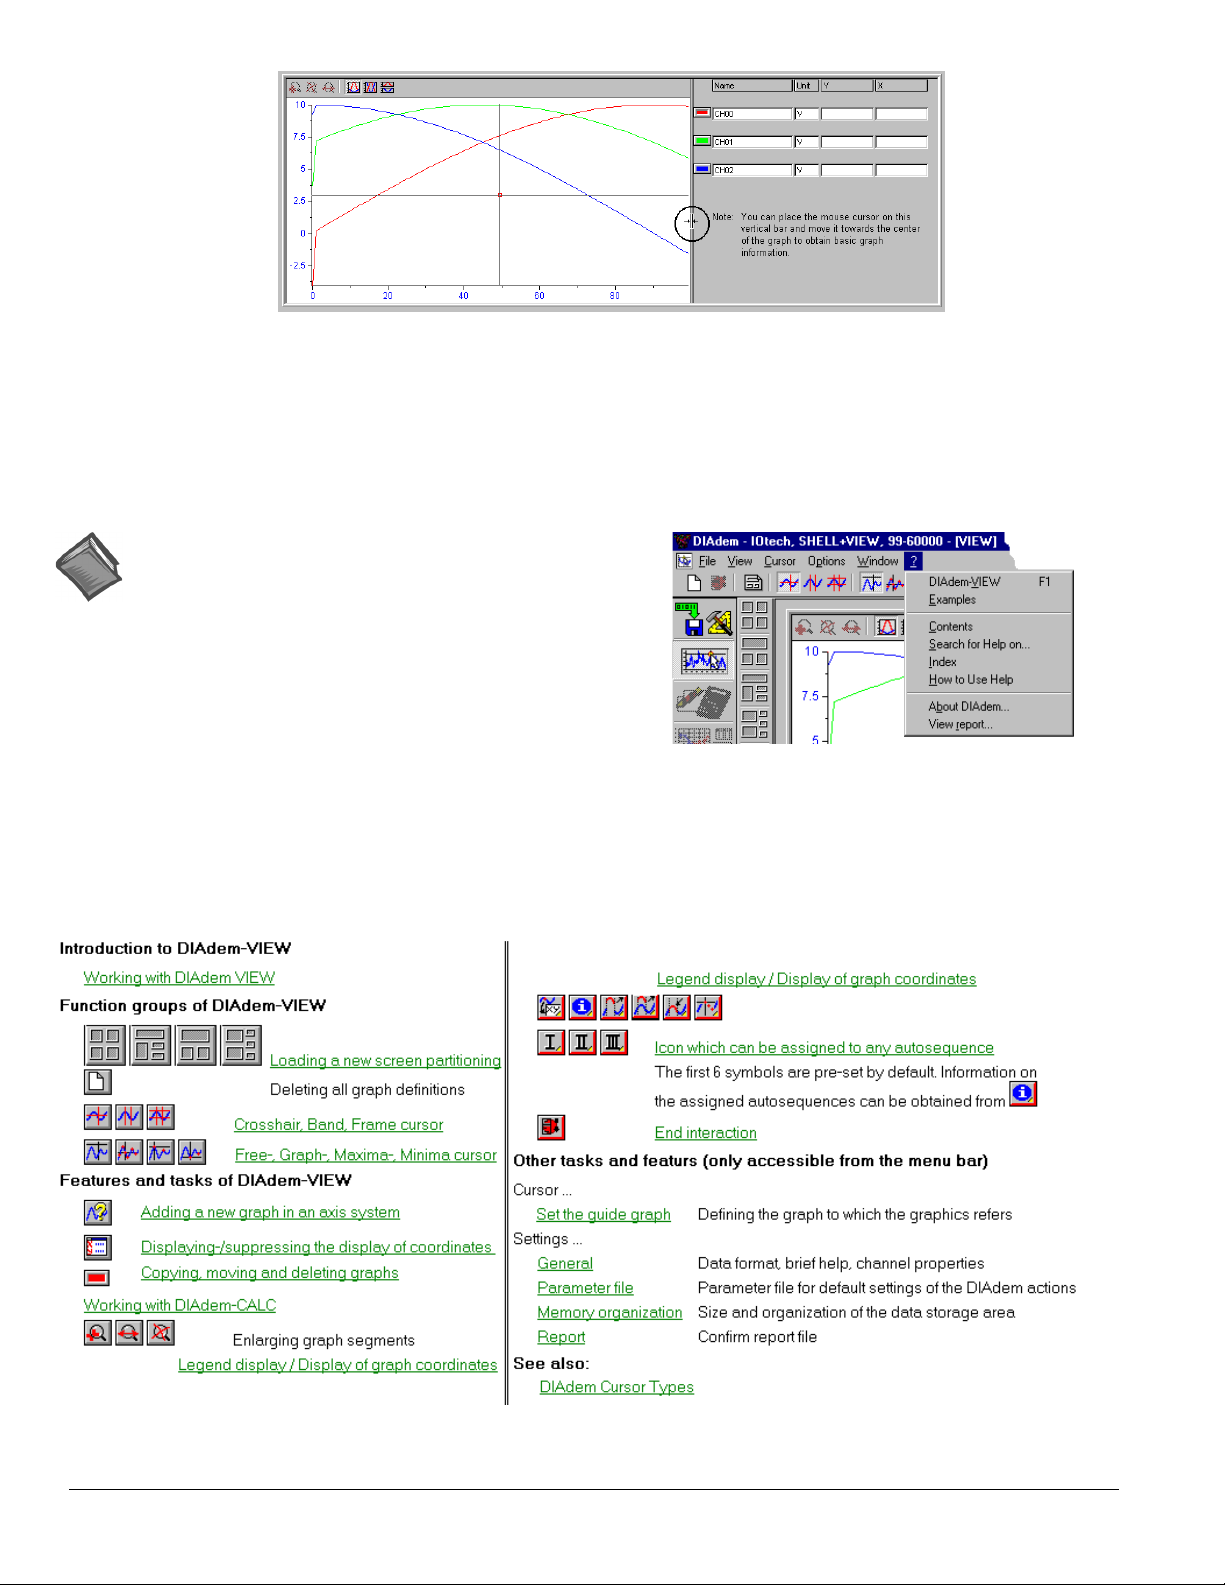
DIAdem-VIEW Help Files
Selecting DIAdem-VIEW from the Help pull-down menu provides quick access to the following help topics. You can
also use your keyboar d’s F1 key for immediate access to the topics identified below.
Viewing Three Graphs and Basic Graph Information
Accessing DIAdem’s Help Files
10 DIA
dem
Quick Start Guide
09-06-00
DIA
dem
Page 13

“Examples” Help Files
Selecting Examples from the Help pull-down menu provides quick access to the following help topics.
DIA
dem
09-06-00
DIA
dem
Quick Start Guide 11
Page 14

12 DIA
dem
Quick Start Guide
09-06-00
DIA
dem
Page 15

DIA
dem - the PC Workshop
DIAdem® has been designed as a PC workshop for solving technical tasks. The underlying
principle is a logical arrangement that gives you an overview of all program elements.
Individually encapsulated devices ensure an orderly division of tasks. Similar functions are
grouped together and parameters in dialog boxes are hierarchically ordered according to their
importance.
Symbolic interface
Three guidelines determine the nature of DIAdem
®
from the most basic layer up: functionality,
clear layout and an intuitive interface.
Functionality means that DIAdem
with consistent operating logic. All similar functions have been grouped together into complete
units, the DIAdem
DIAdem
®
CALC device, all functions for creating graphic documents in the optional DIAdem
®
devices. All mathematical analysis functions are found in the optional
®
allows you to manage, analyze and document your data
GRAPH device, etc.
®
This brings us to the second concept, DIAdem
’s clear layout. As a rule, only the device that
is currently being used is visible. The others remain in the background. The surface layer of a
device is designed so that only the functions required for the task at hand are visible.
The third concept,
intuitive interface
, makes it easy for you to use DIA
®
dem
’s full range of
features. All features can be activated by graphic symbols (icons). You can also make changes
to an axis system directly on-screen with the mouse. And context menus accessed by clicking
the right mouse button bring up context -specific menus, making it easy to se t parameters for an
object.
This document is an abbreviated manual designed for rapid familiarization with the free
dem
DIA
that is distributed with Licensed-Versions of DIA
Note that all available DIA
-VIEW device. More detailed information is available in the DIAdem User’s Manual
dem
.
®
dem
functions are explained in the program’s online help.
®
The Overall Design
®
Throughout the manual, you will see sample tasks you can execute with
DIA
dem
. The steps
demonstrate typical examples of the kind of work you can perform with each device.
Sections you can perform on your own computer are printed in italics.
The structure of the screen is based on a consistent operating logic. In the following figure you
will notice that the Device and Module Bars (used to access functions) are arranged vertically,
whereas the operating elements of the Function Bar are arranged horizontally. Common
operating elements are always visible.
The following screen view and detailed description [of the individual structural and interface
elements] illustrate the design of a DIA
®
dem
PC workshop. The description begins at the left
edge of the screen with the Device bar, moves right to the Module bar, then to the Function bar
and up to the Tool bar and Menu bar.
dem
DIA
®
04-19-00
dem
DIA
® – The PC Workshop 13
Page 16

DIAdem® screen layout
Note:
The DIAdem® devices are lined up one under the other on the left side of the screen, where
they are always accessible. Each of the individual DIAdem
device. They represent the topmost layer in the arrangement of PC workshop. The
®
application windows is known as a
Device bar
is always visible, making it easy to move from one device to another.
When you choose a device by clicking on it with the mouse, the corresponding
Module bar
appears for most devices. On this second layer, functions and actions are grouped thematically.
After you click on a button on the Module bar, the corresponding
horizontally. You can perform functions such as choosing an axis system and tables in the
optional DIAdem
DIAdem
®
CALC device. Functions are processed in the
®
GRAPH device or choosing mathematical functions in the optional
Working area
Function bar
of each device.
opens up
When symbols appear grayed-out in the Function bar, Module bar, or Device bar, the
corresponding function, option or device is not part of the current installation.
Devices and options can be included at any time.
The horizontal
commands you will need to use DIAdem
Tool bar
is located above the Working area. It contains all the features and
®
in the Working area.
You can also access all the features, functions and commands of the currently active device in
the corresp onding menus through the
You should also be familiar with the
messages appear here describing each symbol or function. For example if you are working with
an axis system in the optional DIAdem
Menu bar
Status line
®
GRAPH device, you can tell [from the Status line]
with the keyboard.
. In addition to general messages, brief help
which item is used to move an object.
14 DIA
dem
– The PC Workshop
04-19-00
DIA
dem
®
Page 17

Context Menus and Tool Tips
Two important elements do not appear in the screen above, since they are not normally visible:
context menus (sometimes called shortcut menus) and tool tips.
Context menus
clicking on the right mouse button from many places in the program. For example one context
menu offers features used in working with the active axis system in the optional DIA
GRAPH device.
provide rapid access to the most important features. You can access them by
®
dem
Tool tips
The DIAdem Devices
Part of the DIAdem® Device Bar
Mouse pointer
Tool tips
are text fields used to identify symbols. A tool tip appears whenever the mouse
pointer momentarily rests on the corresponding symbol.
You can use Tool tips to familiarize yourself with the individual devices. To activate a tool tip,
slowly move the mouse pointer over the Device bar without pressing a mouse key.
®
The DIA
dem
devices could be thought of as a set of work tools. Each tool is intend ed for a
specific purpose. Note tha t devices can be easily distinguished by their graphic images (ic ons).
The element common to each of these devices is the data, which is processed in different
manners by different devices. In our analogy, the data is then the work object on which the
tools are used. Data must first be available to be processed by the devices.
There are two types of devices:
•
devices that can create data, for example, the optional DATA and optional CALC devices
•
devices that merely display data, such as the VIEW device and the optional GRAPH
device.
The optional Autosequences represent a special case, as they can use features from all the
devices, in order to automate work sequences.
To select a device, simply click on the corresponding symbol in the Device bar with the left
mouse button. For example to choose the optional DIAdem
®
GRAPH device, if applicable.
Note:
The Module Bar
®
dem
DIA
GRAPH
Module Bar
Whenever you are told in this manual to activate, click on or execute a feature, device or
object, it means you should click on the appropriate symbol or object with the
button. Similarly, “double-clicking” and “pressing a button” refer to the
When you select a device, the Module bar, another vertical bar, appears to the right of the
DIA
®
dem
Device bar. Similar features and functions are arranged together in groups on this
left
left
mouse button.
mouse
bar.
®
For the optional DIA
dem
GRAPH device, this means that the symbols for individual graphic
modules are found here: axis system, tables, and background images to name a few.
®
For the optional DIA
dem
CALC device, the mathematical formulas are grouped together on
the module bar: basic math functions and features for signal analysis and statistics.
dem
DIA
®
04-19-00
dem
DIA
® – The PC Workshop 15
Page 18

Functions
Part of Function bar for 2D axis
systems in DIAdem
®
GRAPH
When a group symbol is activated, the c orresponding Function bar opens up horizontal l y.
Executable functions are for example choosing an axis system and tables in the optional
DIA
®
dem
GRAPH device, or choosing mathematical functions in the optional DIA
dem
®
CALC device.
®
If you have the optional DIAdem
GRAPH device, choose one of the various 2D axis systems
in by clicking on the corresponding symbol in the Function bar.
The Working Area
Mouse pointer
Marking a frame around an object
Dialog Boxes
All settings for objects are
handled in dialog boxes.
The selected axis system is indicated in the upper left-hand corner of the Working area.
The function bar is the same in all the DIA
®
dem
devices. Autosequences that are used
frequently can be assigned to these symbols and are thus available in all the devices.
When you select a device the Working area is automatically filled with a pattern. The same
procedure is always used for working with objects: a left-button mouse click is used to
activate, left double-click to set parameters and right mouse click to open context menus.
If you have the optional DIAdem® GRAPH device, click on one of the 2D axis systems.
You will notice light gray marking at the corners and at the middle of each side of the active
axis system. If you click inside the markings again and hold the left mouse button down, you
can move the axis system.
When you “pull” on one of the marks, the axis system increase in size correspondingly. You
can pull by clicking with the mouse and holding the left button down while you move the
mouse. If you pull the marks on the sides, the axis system will increase in size horizontally or
vertically. If you pull on a corner mark, you will zoom the entire axis system.
Generally dialog boxes are used to associate data with objects such as axis systems or tables,
or to set properties such as line style and color.
16 DIA
To access graph and axis definitions in DIA
in which you wish to represent the data.
dem
– The PC Workshop
04-19-00
dem
®
-GRAPH,
double-click
on the axis system
dem
DIA
®
Page 19

ntering a new graph
E
To enter a graph, use the New entry button. At this point it will be sufficient to specify from the list of
available data channels an X channel to represent data values on the X axis and a Y channel to represent
corresponding values on the Y axis. Exit the sub-dialog box and the main dialog box with the OK button.
Note:
In the “graph entries heading” of above mentioned dialog box , the word “Color” is not complete [it appears
as “Co…”]. As soon as the mouse cursor crosses the vertical line separating the columns "F..." and "Data,"
the cursor appears as parallel lines with arrows to the left and the right. You can use this cursor to expand
the column, allowing you to read "Color" [instead of “Co…”].
Graph and axis definition is a rather complicated example of a dialog box, but it illustrates well the concept
of hierarchy in dialog boxes.
Basic options that are often changed are at the top of the dialog box hierarchy. In the graph and axis
definition, for example, a quick glance reveals which data channels are represented and how. These can be
changed directly on the top layer.
Less common options are located one layer “deeper“ to allow room for the essential ones. They can be
reached by a button. Standard features such as OK, Cancel, Delete, Change, and Close are also accessed by
buttons. The Help button is always in the bottom right-hand corner. It provides explanations of the
individual dialog parameters.
Default Settings for Functions
The properties of any object can be changed at any time and maintained in a diagram or block diagram (see
the explanation of dialog boxes above). These settings, however, apply only to the object at hand or the
mathematical function which has just been called. The next time the mathematical function is called, the
default setting will appear again. To change settings permanently, use Default setting.
To reach the default settings for a function, click on the Function bar with the right mouse button
(for example on an analysis symbol in the optional
which includes the Default setting . Activate this menu item with the left mouse key, and the
appropriate configuration dialog box will appear.
DIA
®
CALC device). A context menu appears
dem
Default setting on the function
bar (use right-mouse button)
Note:
®
GRAPH
dem
Part of the DIA
GRAPH Tool bar
Sketch Mode in
dem
DIA
After you exit with Save changes, the changes you have made to the settings will become permanent.
In the optional DIA
background graphics; in the optional DIA
In optional DIA
dem
®
dem
GRAPH device you can change default settings for axis systems, tables, and
®
-CALC, the standard settings of the functions can be reproduced with “Reset.”
®
dem
CALC device all mathematical functions are affected.
The related action can be executed with “Activate.” The function bar for the Autosequences can be
assigned an Autosequence using “Default” and it can be removed with “Delete default.” The
Autosequence currently assigned to the icon can be edited by clicking “Edit.”
®
The altered default settings are automatically written into the Desktop file in DIA
dem
and thus saved.
When the default settings of an action have been altered, they no longer affect objects that have already
been used in a diagram or block diagram!
Commands
®
The Tool bar which extends horizontally above the DIA
will need most commonly for working with any of the DIA
®
commands such as Delete, Open and Save as; others are device-specific commands. The most important
commands in the optional DIA
®
dem
GRAPH device are: Print, Output to clipboard, various commands for
dem
Working area contains the commands you
®
dem
devices. Some of these are basic
aligning objects to each other, the magnifying glass and Sketch presentation. Most important in DIA
VIEW are graph definitions and various types of cursors.
Activate an object in
dem® GRAPH. As soon as you press the Sketch mode button, the object is faded
DIA
out and is represented only by a place holder.
Symbolically representing objects as rectangles makes it possible for you to work with them quickly and
easily even in diagrams containing numerous objects.
dem
®
dem
DIA
®
04-19-00
dem
DIA
® – The PC Workshop 17
Page 20

Menus
Part of the Menu bar in
DIAdem
®
GRAPH
All of the functions and commands needed for any device in which you are working are found in
text format in the Menu bar located above the Tool bar. In these menus any feature can be
accessed and executed via the keyboard instead of the mouse.
Use the<
Alt >
key to access the Menu bar. Then type the underlined letters for individual menu
items on you keyboard. When a second menu opens up, choose a feature from it and execute it
directly by again typing the underlined letter for the desired menu item.
DIA
dem
Help
Dialog Box Help
Note:
You can also use arrow keys to select a menu item and execute it with the <
Use DIAdem® Help to explain, describe and clarify the program. There are three separate types
of help in DIAdem
with explanations of all parameters, and the Help menu with explan ati on s g rouped by subject
matter.
Tool tips
You have already used Tool tips several times during the description o f t he DIAdem® interface
to learn the meaning and function of a symbol. Bring up Too l tips by letting the mouse pointer
rest for a moment on the unknown symbol. A yellow “banner” soon appears with a brief
explanation of the symbol.
Tool tips
You can choose
symbol will be described with m ore than just one word.
Dialog Box Help
Dialog boxes are used whenever the settings for an object need to be precisely adjusted. You
can get context-sensitive help for dialog boxes and parameters in them by pressing the Help
button found in any dialog box. Dialog box Help explains each of the parameters in the open
dialog box, and what parameters lead to what results. More complete explanations and related
topics are available th rough references.
Enter
®
: Tool tips for the user interface, context-sensitive help in dialog boxes,
long Tool tips
in the Options menu (under General). Then the function of a
> key.
Help Menu
The DIAdem® DATA Help menu
To reach the Help menu, use the question mark in the Menu bar. In the Help menu you will find
a description of the active DIAdem
®
device, the contents of the main Help subjects, Search for
Help on... and View report.
The first line of the Help menu is reserved for a description of the
the Help menu to the left, this is DIAdem
®
DATA. Descriptions of devices are arranged so that
the design and functionality and characteristics of each DIAdem
Device
currently running. I n
®
device are discussed first; then
you learn how to work with the device.
You can access the main Help file in DIAdem
with DIAdem
®
in general and the DIAdem® devices in particular are described here. These
®
through
Contents
in the Help menu. Working
explanations are intended for the user who wants to learn the basics about the design of the
program and how to use it.
On the other hand, if you need to learn something about a specific concept or a special topic, use
the menu item
subjects the one which best answers your question. The
of DIAdem
Search for Help on
®
definitions.
.... Enter a search concept. Then choose from the list of
Glossary
is especially useful as a source
18 DIA
dem
– The PC Workshop
04-19-00
DIA
dem
®
Page 21

Sample demos in Help
The
Report
is a DIA
®
dem
record of the previous DIA
®
dem
sessions with the start and finish of
each work session, along with error messages and warnings and the corresponding dates and
times. You can find out more about the nature and meaning of these messages from Report in the
Options menu. You can also delete the report there.
Active Help: Demos and Examples
®
The examples and demos are in general intended as solutions to specific tasks in a DIA
can start these examples directly from DIA
dem
®
Help.
dem
device. You
Click on the question mark in the Menu bar, then choose Examples. Click on a device symbol to go directly
to the list of corresponding examples.
With the examples, there are differences in the level of complexity between the demo sequences,
applications and templates. The demo sequences are short film sequences, which present the creation of a
graphic DIA
®
dem
-GRAPH ,for example. The applications and templates demonstrate not only the spectrum
of application for the program, they can also be used as the basis for your own (partial) solutions. For this
purpose, press the info button
before the particular example, for a display of a task description and the
files used.
ESC
Start Example
The Start button is used to start the example; and <
Autosequence.
To use a demo you have opened as a pattern, save it under a new name in the user directory
(..\diadem\user\dac). Since these solutions are not directed towards specific tasks, you can use them as
building blocks in material you are working on by transferring them with the clipboard.
Copy and Insert You can mark the entire display or block diagram with <
the blue frame to the desired dimension while holding down the left mouse button. Then you can copy the
selected portion to the clipboard with <
CTRL + C
> and insert it back into another block diagram in the
Working area at the position of the mouse cursor with <
Options
®
dem
can be accessed via the “Settings” menu. The “Desktop
®
-GRAPH device) to name a few.
General Settings
, such as those for program behavior (warnings, warning
Desktop Settings
General Settings
The various program settings in DIA
Parameters” include all the workshop-related settings such as the menu points
Device-specific, Memory organization, GPI-DLL Registration
also find device-specific settings such as the hardware assignment and packet processing, or the page
layout (in the optional DIA
dem
Desktop Settings
The Desktop settings include the
tone for errors, long Quickinfo), for the data format and channel characteristics as well as the selection of
other ASCII editors, in particular for the Autosequences.
> cancels the display, measurement, or
CTRL + A
CTRL + V
>. To select a portion of either, expand
>.
General, Parameter file
Report
and
. In the single devices, you will
,
The path selection (see Directory structure) and the specification of the standard files to be loaded for all
the DIA
®
dem
devices are mad e in the sub-menu with the same name. Although the library paths can only be
altered using the settings, DIA
device.
Device-specific
Device-specific settings
ASCII data and the data checks.
Note:
Another start file can be entered here. By the way, if no file name is entered here, no template will
be loaded in the appropriate device!
dem
DIA
®
®
dem
retains the path the last file was loaded from as the user path, for each
include, for example, specifying the memory form in DIA
04-19-00
dem
DIA
® – The PC Workshop 19
dem
®
-DATA, the
Page 22

Memory organization
Define Report
The Device-Specific Settings
Directory Structure
Standard directory structure
organization of the memory area or data area
The
device is active. This means that all the DIA
dem
with "Close all". As soon as only the SHELL is displayed, the size of the data area can be
increased or decreased. For these settings to become effective, DIA
can only be altered when no DIA
®
devices can be closed with the window menu
®
dem
has to be restarted. This
dem
®
is performed automatically if you affirm the appropriate request.
The
Report
contains a record of the DIA
®
dem
program start and finish, er ror messages and
confirmation messages. The extent of the Report, as well as the associated Editor, with which the
memory format is selected, can be defined.
®
Depending on which DIA
with the Desktop settings, such as, for example, the page layout and the color palette in the
DIA
®
dem
-GRAPH device. They are explained briefly in the following.
When you install DIA
dem
device is open, other settings specific to this device also appear
®
dem
, the setup program creates the directory structure shown below on the
path you enter. This structure consists of three directory layers.
20 DIA
I. In the
control files and others such as the Readme file.
II. The first sub-directory layer serves to organize the remaining files (ADDINFO, DEMO, LIBR,
SYMBOLS and USER).
You will find all the practice examples from the manual and the patterns (example.*) in the
DEMO directory. These can be used whenever you start the program. The library directory
LIBR contains all the examples and demos that can be started from Help (you choose during
installation whether to install these). Neither the demo files nor the Libr files should be changed
by individual users. Instead personal copies (which
personal directory, for example USER1, etc. This is especially important when you run
DIA
systems files necessary for DIA
The user path can be changed using the Autosequence "ChDir", which is connected to the
twelfth function symbol. This applies globally, i.e. the same for all the DIA
III. The individual files are located on the second sub-directory layer, each in the appropriate
directory:
dem
– The PC Workshop
Program directory
®
dem
on a network. The LIBR, SYMBOLS and ADDINFO sub-directories contain
04-19-00
(e.g.,
c:\diadem
®
dem
. They should
) you will find the program files (
can
be changed) should be stored in a
never
be changed.
*.exe, *.dll
®
dem
devices.
),
DIA
dem
®
Page 23

AUT
Autosequences (*.aut), compiled Autosequences (*.auc), list files (*.lst), variable definitions
(*.vas), user dialogs (*.cod),
Save Desktop under
New Name
Load Desktop file
DAC
DAT
GRA
Block diagrams (*.dac), sub-block diagrams (*.sub), control file (*.atr), message file (*.asc)
Data header file (*.dat), data file (*.r48, u.a.)
Picture definition (*.lpd), meta files (*.wmf)
Saving and Loading Settings
®
While you are working with DIA
requirements. The program settings are stored in the Desktop file (
DIA
®
dem
, modifications are registered and you are asked if you want to save them. You should save your
dem
, you will have to modify the standard settings according to your
desktop.ddd
). When you leave
personal settings in your own Desktop file , so you don’t lose them.
First close all the
dem® devices with "Close all " in the "Window" menu. Don’t worry: the contents of
DIA
the window are retained, even if they have not yet been saved. Then click to the diskette symbol in the
command line. Now you can save your settings in a new Desktop file.
®
In order for them to take effect, DIA
the files are to be saved and DIA
DIA
varying settings in DIA
starts with the Desktop file desktop.ddd. If you are working on various projects, which require
®
dem
, they can be saved in various Desktop files. The associated Desktop file is
®
dem
then to be loaded with each project. Don’t be startled when DIA
dem
is now automatically shut down. You will now be asked whether
®
dem
will start again with your settings.
®
dem
is restarted. This is necessary in order
for the settings in the newly-loaded Desktop file to take effect.
dem
DIA
®
04-19-00
dem
DIA
® – The PC Workshop 21
Page 24

22 DIA
dem
– The PC Workshop
04-19-00
DIA
dem
®
Page 25

DIA
dem Data: Loading and Saving Data
The functions of DIAdem® DATA available with the DIAdem®-SHELL allow you to manage
data: you can open and save data, and import external data. Data is organized in channels, with
each channel representing an independent series of data. The data may originate directly from
measurement by an external device connected to your PC or may be in file format. All the
DIAdem
DIAdem® DATA
®
devices use the data in the Data area.
The DIAdem®-DATA Tool bar allows you to open and save data files and delete all files in the
The DIAdem® DATA Tool bar
Data area.
The DIAdem®-DATA Working area gives you an overvie w of o pen data channels. From the
Working area you can cut, copy, paste or delete data channels.
Access context menus with
the right mouse button
Context menus play an important role in DIAdem
menu depending on whether you click the right mouse button in the data overview or in the
Channel contents.
®
-DATA. Different functions appear in a
The Data Area
DIAdem -DATA
You can see key information
on your stored data at a glance
in the Channel o vervi ew
Select DIAdem® DATA by clicking on the corresponding button on the Device bar.
An overview in table format appears in the Working area, representing the data channels
currently open in the Data area. This overview includes the name, index number, and other
information such as the length and type (origin) of each data channel. You can make the
columns larger or smaller as you wish to enhance readability. Simply move the column dividers
in the Title bar by holding down the left mouse button.
You can alter the appearance of the data overview by changing the order of the columns.
Select Data overview in the Options menu. The clicked line can be moved with the Up and
Down buttons. Confirm with “OK” and the column order will be altered accordingly.
dem
DIA
®
04-19-00
dem
DIA
Data – Loading and Saving Data 23
Page 26

Using Options
to move lines
Data Resources
Channel lengths and
number of channels
Sample Data Set
Data may originate from various sources. In the illustration above, various symbols and
descriptions represent the origin (type) of data in the column under T... (Type): Data which has
been input, read in, calculated and measured, or is “free.” Free channels do not yet contain any
data.
Data in DIA
®
dem
is organized into channels. A data set may contain several data channels,
which may be of unequal length. Each individual channel represents a series of logically
connected independent numbers. The maximum channel length and the maximum number of
channels are practically unlimited, since up to 2 billion values are possible. The resulting data
matrix is dynamically adjusted to the current data stock. If more channels arise than were
preset, DIA
extended to the actual number of values. The channel length and the number with which
dem
DIA
none of the DIA
®
dem
extends the data matrix accordingly. The channel length is also dynamically
®
is to be started is specified in the “Options” menu at the DIA
®
dem
devices are open) in the menu point “Memory organization - Data area.”
®
dem
main level (i.e. if
As this involves a complete reorganization of memory, these alterations do not become
effective until the program is automatically restarted.
The Data area exists only at program runtime! Manual changes to the Data area are
temporarily registered, but are not permanently stored until the data set is stored on
your hard drive. Data sets to which chang es have been made should be saved under a
new name so that the original data is still accessible.
The data opened by default was acquired during an automobile test drive. Included are the
driving time, speed and the motor rpm and torque.
®
If you have already made changes in the Data area after starting DIA
dem
, open the sample
data set ‘data.dat’ from Open in the File menu. For more information on opening files, see the
end of this chapter.
24 DIA
dem
® DATA – Loading and Saving Data
04-19-00
DIA
dem
®
Page 27

Copying, Pasting, and Deleting Data Channels
Not only does the Working area in DIA
copy, paste and delete data channels in the Working area. You can perform these operations on
individual channels or on groups of channels.
®
dem
DATA offer you a data overview; you can also
Marking multiple channels
Cutting and pasting channels
Cut channels are pasted i n
from the Windows clipboard
at the marked location.
In this case that leaves
a free channel in the first
line of the Working area.
Mark all four channels by holding down the left mouse button and dragging the mouse over the
desired channels.
You may also mark the first data channel by clicking with the mouse and then clicking on the
last channel while the Shift Key is held down. You can mark separate, non-contiguous data
channels in the same manner: click on the channels with the left mouse button while the
Control Key
is held down.
Click on the right mouse button. Choose the option “Cut” from the Context menu. After
confirmation the marked channels will be deleted from the Data area and copied into the
Windows clipboard. Click with the mouse on the second line of the channel overview. Paste in
the contents of the clipboard with <
CTRL + V
>.
dem
DIA
®
04-19-00
dem
DIA
Data – Loading and Saving Data 25
Page 28

Saving and Opening Data Sets
Save Data as…
Delete all data
Open new data file
Data in the Data area is only present during program runtime. It is deleted as soon as a new data
set is opened in DIAdem
®
DATA or when the program is terminated. To use this data in the
future you must save it to the hard drive.
To save the data set, click on the corresponding symbol in the Tool bar. Save the edited data set
to the demo path (...\diadem\demo\dat) under the name example1.dat. The data set can also be
saved directly with its name, using the file menu.
A bit of theory: as soon as you have saved data, DIAdem
®
stores two files with the same names
on the data path: the actual data file, usually with the extension *.R32, and the associated header
file with the extension *.DAT.
The header file contains all the information required to open the (numeric) data files. The header
file contains not only the general data set description, but also all the information required to read
in the single channels of the data file(s). The data file contains the numeric data, saved in one or
more channels.
The whole data area is emptied with the “empty page” symbol in the tool bar.
In the following, the example file “Data.dat” should be loaded from the hard disk, because this
data is used in the following chapters of the manual.
Click on the Open symbol in the Tool bar. Choose the file data.dat, which has the demo path
(..\diadem\demo\dat). Confirm your selection with “OK”.
The newly opened DIAdem
in the Data area to be used by other DIAdem
®
data channels now appear in the overview. They are thus available
®
devices.
Note: The last path [from which a data file was loaded]is used as a new user path in
DIAdem
®
-DATA for the current session.
Apart from DIAdem® data files, other external data can be imported using the File menu. The
user can extend the list of available file formats by including appropriate GPI file import/export
filters. Information about these filters can be requested in the “Options – External file type info”
menu. You will find more details about the GfS Programming Interface GPI in the program help.
26 DIA
dem
® DATA – Loading and Saving Data
04-19-00
DIA
dem
®
Page 29

DIA
dem VIEW: Viewing, Measuring & Editing Data
DIAdem® VIEW allows you to view, measure and edit your data. Data may be displayed as
graphs defined by an X and Y channel of the data area in various axis systems. Various cursors
are used for i nspecting the graphs, using which you can zoom, scroll or carry out
measurements.
DIAdem® VIEW
DIAdem® VIEW Module bar
Part of the DIAdem® VIEW Tool bar
Command icons
assigned Autosequences
Axis-specific Tool bar
The DIAdem® VIEW Module bar determines the way in which the screen is divided up. You
will find various possibilities for standard and customized screen partitions in the
corresponding Action bars.
After double-clicking on an axis system, you can coordinate the data channels to be displayed,
thereby defining the graphs. A legend can be displayed beside each axis system showing the
data channel name, the unit, the cursor coordinates and any expressions at will. Use the graph
symbol between the axis system and the legend to copy a graph into another axis system by
grabbing it with the mouse and moving it into the target axis (drag and drop).
In the Tool bar you will find various types of graphics cursors used to inspect graphs, as well as
various measurement cursors with which you can find characteristic graph points. Other useful
features are the symbol for turning the coordinate display off and on and the feature Delete all
graphs.
In addition to the standard functions, other functions can be assigned to the command icons,
which are marked with a yellow triangle, as Autosequences (requires the Autosequence option).
Each DIAdem® VIEW axis system has its own axis-specific Tool bar which you can use to
enlarge a selected region of the graph (zoom and scroll) and, in the case of several axes with
different value ranges, change the scaling of the Y-axis.
DIA
dem
®
04-19-00
dem
DIA
® VIEW: Viewing, Measuring & Editing Data 27
Page 30

Viewing Data as Graphs
Load data in DIAdem®-DATA
DIAdem® VIEW
Double-clicking on an axis
system opens the graph definition
Entering new graph(s)
The data file “Calc3.dat” has been used for the screen display on the first page of the chapter.
If you have modified the example data set in the DIAdem
®
-DATA device, which is loaded
automatically, load the data file “Data.dat” from the user data path (...\diadem\demo\dat).
To work with DIAdem® VIEW, click on the corresponding button in the Device bar.
The DIAdem
®
VIEW Working area contains several axis systems in which data from the Data
area may be viewed as graphs. Note that the active axis system is displayed with a highlighted
frame while the axis of the passive widows does not have a highlighted frame. The cursor can
be moved with the mouse through the active axis system, whereas it simply “follows along” in
the passive system when the value range is the same.
Graph Definitions:
Entering and Deleting Graphs in an Axis System
To enter a graph into an axis system, coordinate any set of X and Y channels in the graph
definition. Of course several graphs may be entered into an axis system.
Double-click (click twice in rapid succession) on the upper axis system. The Graph definition
dialog box appears.
The Graph definition gives you an overview of previously defined graphs in the active axis
system. In our example this line is still blank.
To specify the data channels you wish to display, click on the “New entry...” button. Choose
the data channel "Time" as the X channel and “Speed” as the Y channel. Exit the sub-dialog
box with "OK".
Note:
Deleting graph
The Graph definition dialog box
Graph symbol
Two or more graphs can be defined at once for the same basis. Use the X channel, and mark
the two Y channels with the right mouse key. After “OK”, two graphs are entered in the list.
This new graph entry now appears in the overview in the main dialog box. If you wish to, you
can later delete the graph from the axis system with Delete.
Graph points can be emphasized with colored symbols, as it will be shown in
DIAdem
®
-GRAPH, using the “Graph markers“.
After you exit the Graph definition with OK, the graph is entered into the active axis system. At
the same time, the corresponding graph symbol appears beside the axis system, a small
rectangle in the corresponding graph color, red.
28 DIA
dem
® VIEW: V i ewing, Measuri ng & Editing Data
04-19-00
DIA
dem
®
Page 31

Using the Graphics Cursor in DIAdem View
Crosshair cursor
The crosshair cursor,
used for example to
measure graph coordinates
A number of graphics cursors are available to move or measure one or more graphs. You can
choose from a crosshair, frame or band cursor. Use the mouse to access the cursor (in the active
axis system only). The graphics cursor follows along passively in the other axis systems to the
extent the range of values agree.
The crosshair cursor consists of horizontal and vertical cursor lines which can be moved
independently. The point of intersection defines the X and Y coordinates, which appear in the
Status line as X
, and Y1.
1
Whenever you press the left mouse button and hold it down in the active axis system, a small
Positioning the crosshair cursor
cross appears. When you move the mouse, the crosshair cursor “snaps” to the mouse cursor
coordinates and follows any further mouse movements.
Note:
If you move the mouse over one of the crosshairs, the graphics cursor changes into a horizontal
(√) or vertical arrow (⋅). At this point you can hold the left mouse button down and move the
cursor line horizontally or vertically.
Using the Cursor Position to Measure a Graph
The intersection point of the crosshair cursor is surrounded by a small square. This square is used
to follow the path of the graph. The other cursor types also use this “measuring square”.
The intersection point of the crosshair cursor is surrounded by a small square. This square is used
to follow the path of the graph. If you choose another of the cursor types, the “measuring square”
will remain at an intersection point.
By default, the graphics cursor is set to move freely, allowing the cursor to be moved anywhere in
Free Cursor
Delete all data
Graphics cursor
the active axis system. If you select other positioning settings, certain graph points will be
sampled and selectively displayed in the Status line.
The whole data area is emptied with the “empty page” symbol in the tool bar.
In the following, the example file “Data.dat” should be loaded from the hard disk, because this
data is used in the following chapters of the manual.
Choose the graphics cursor in the command line. When you move the mouse, the crosshair stays
on the graph and moves from point to point along it. In this manner you can display coordinates
for any point along the graph.
DIA
dem
®
Note:
Maxima-cursor
The
Minima-cursor
and
can be switched on. When on these settings, the
graphics cursor moves from one extreme value to the next.
04-19-00
dem
DIA
® VIEW: V i ewing, Measuri ng & Editing Data 29
Page 32

Displaying legends
The form of the coordinate
display can be changed.
Graph Legend:
Displaying the Axis-Oriented Display
The legend can be displayed next to any axis system.
Move the mouse cursor over the right border of the axis system. When the table cursor appears
with two vertical lines, hold the left mouse butto n down. Then move the legend off to the left.
The name of the Y data channel, the unit and, with the corresponding graphics cursor, the X and
Y coordinates are shown in the legend. It is possible to add additional displays and define their
arrangement.
Double click on the legend and the parameters dialog box appears. Click on “Type” in the 5
th
line and select “Free Text“.
Legend with graph data
as well as the maximum value
as the result of a formula
Close the dialog with “OK”.
Now, the channel name, the channel unit, the maximum value are displayed in the legend, as well
as the graph coordinates of the graphics cursor position, which are updated continuously.
30 DIA
dem
® VIEW: V i ewing, Measuri ng & Editing Data
04-19-00
DIA
dem
®
Page 33

Global Coordinate Display:
Displaying Cursor Coordinates in Overview Format
The current coordinates of the graphics cursor, represented in the unit of measure of the active axis
system, are shown in the status line. You can also choose to have an overview of the coordinate
display.
First activate the frame cursor. Then turn on the coordinate display in the Tool bar.
Coordinate display
A window appears with the current cursor coordinates of the active axis system. This window
may be positioned anywhere on the screen. For the frame cursor, the X and Y coordinates and the
distances for horizontal and vertical cursor lines (dx, dy) are displayed.
Coordinate
display with frame
cursor coordinates
Axis-local Scaling:
Various Graphs in one Axis System for Clarity
If graphs whose value ranges are different are to be compared with one another in an axis system,
the depiction can be improved by choosing a different scaling mode. The scaling mode is set
separately for every axis system.
Define one more graph in the upper axis system. Call the graph definition and set a new graph
Graph definition
with the X-channel “Time,” the Y-channel “Rotational Speed” and the color “Green.” Click
“OK” twice and return to the working area.
Since the absolute values of the rotational speeds are 100 times higher than the absolute speeds,
Axis-local scaling,
here: 1 System [%]
the speed curve is merely displayed as a colored line on the abscissa. In this case, it is advisable,
to switch the scaling mode for that axis system to “1 System [%].” The labeling of the ordinate
will now be done referred to the entire Y-value range as a percentage.
DIA
dem
®
04-19-00
dem
DIA
® VIEW: V i ewing, Measuri ng & Editing Data 31
Page 34

In a case of several graphs with
different value ranges, a scaling
that is more favorable for the
depiction should be chosen
Note:
Define main graph
The depiction can be done in separate sub-axis systems with the scaling “n Systems” [physical].
To carry out measurements on graphs, one of the two should be defined as the main graph. This
definition is made in the context menu of the corresponding graph symbol.
Open the context menu with a click of the right mouse button on the red graph symbol and select
“Set main graph.” When you call this context menu again, you can see that the main graph has
been set.
In the case of several graphs in
an axis system, the main graph
is defined via the context menu
of the graph icon
Now, if you move the crosshair cursor, it remains fixed on the red graph. Another crosshair is
displayed on the green graph. The point coordinates of the main graph are displayed in the
legend, as specified.
As mentioned above, if the value range is the same, the cursors in the passive axis systems follow
along. If you have selected the “Free Cursor,” the crosshairs in the passive windows orient
themselves according to the graph coordinates. If you have activated another cursor, e.g.
“Maxima-cursor,” the crosshair will be oriented in the passive windows according to the point
number; the relevant coordinate s can be read in the legends.
Depending on where you click in DIA
menu is displayed with other functions. For example, the image mode toggle may be displayed.
Note that the image mode determines whether a SHELL is displayed or suppressed.
How to Copy or Delete a Graph
Any graph that has previously been defined can be copied into another axis system using the
drag-and-drop procedure and the corresponding graph symbol.
®
dem
-VIEW [with the right mouse button] the context
32 DIA
Drag the red graph symbol by pressing on the left mouse button. With the left button still held
Copying a graph
with the graph
symbol activated.
down, move the graph symbol into the lower left axis system and release the left mouse button.
A copy of the graph and the corresponding red graph symbol now appear in the desired axis
system.
Deleting a graph
You can also delete a graph from the axis system using the graph symbol. Click on the green
graph symbol; it darkens. Then press the <DELETE
done from the context menu of the graph icon
Deleting or copying
multiple graphs
dem
® VIEW: V i ewing, Measuri ng & Editing Data
Multiple graphs can be deleted from or copied to the same axis system. Select the corresponding
graph symbols with the mouse and the <
04-19-00
CTRL
> key.
key. Alternatively, deletion can also be
>
DIA
dem
®
Page 35

Using Zoom, Scrolling and Screen Partition
Zoom:
Enlarging Graph Segments
Activating the band cursor
√
Widening the band cursor range
Zoom in
A graph in maximized view
and the band cursor section
in zoomed view
If you want to inspect a given region of a graph with increased precision, you can use the
DIA
®
dem
VIEW zoom feature to portray selected portions of the graph in enlarged format. The
zoom feature can be executed only with a band or frame cursor.
The band cursor consists of two parallel vertical cursor lines which define a segment of width
delta X (designated dx in the Status line). The X position of the cursor line that is set first is used
for the X
X-position of the cursor crosshair that is set last is used for the X
correspondingly for the Y
coordinate, to which is also assigned the small square, the so-called “Hot Spot.” The
1
-coordinate. The same applies
2
- and Y2-coordinates of the frame cursor.
1
Copy the graph from the upper axis system into the axis system on the lower left. Then activate
the band cursor in the Tool bar.
Move the band cursor by clicking between the two cursor lines and moving the mouse right or
left while the left mouse button is held down. You can define the width of the band cursor by
positioning the cursor crosshairs.
Move both band cursor lines with the left mouse button held down until the region of the graph
you wish to inspect lies between the two cursor lines.
Now turn the zoom on fo r this axis.
The graph segment delineated by the band cursor now fills up the entire axis system.
DIA
dem
®
Zoom off
Frame cursor
If several graphs are defined in the same axis system, graph segments [that are contained within
the band cursor] will be equally magnified. Note that you can zoom in on segments recursively,
thus inspecting smaller and smaller graph segments.
After you turn off the zoom, the original graph is displayed, no matter how many times you have
zoomed in.
The frame cursor is used in the same manner as the band cursor. In addition to horizontal lines, it
provides vertical definition.
04-19-00
dem
DIA
® VIEW: V i ewing, Measuri ng & Editing Data 33
Page 36

Scrolling Through Graph Segments
Turning on scrolling
Scrolling through a segment
n the lower right-hand axis system
While the zoom feature allows you to examine individual enlarged graph segments statically, the
scroll feature allows you to move along the enlarged graph. It is as if the graph were scrolled
along under a magnifying glass.
Using the graph symbol, copy the red graph into the lower right-hand axis system. If no band
cursor is active, choose one. Widen the segment width as needed. Then activate scrolling in the
axis-specific Tool bar.
Now you can let the speed graph move through by holding down the left mouse button while
moving the mouse cursor horizontally.
Since the graphics cursor is always visible in axis systems with graphs, the graphics cursor in
passive systems follows along correspondingly as long as the X value regions are equal. If
zooming is active in an axis system, the graph section that has been set there remains unchanged!
34 DIA
Apart from directly moving the graph with the mouse, the so-called scrollbar can also be used for
moving. For this purpose, the horizontal scrollbar should be activated in the context menu. Now,
the graph can also be moved by moving the scrollbar. If you are working with a frame cursor, it is
sensible to insert the vertical scrollbar.
Scrolling can be de-activated at any time. In contrast to zoom, the last segment viewed stays in
place; it is “frozen.” Enlargement can be undone with the Zoom off symbol, since zooming also
Scrolling off
occurs when scrolling is turned on.
When you activate another axis system, zooming and scrolling retain their settings in the old axis
system. This means in terms of the example above that you can place the band cursor in the upper
axis system over the speed graph and view the graph enlarged in the lower right-hand axis
system.
dem
® VIEW: V i ewing, Measuri ng & Editing Data
04-19-00
DIA
dem
®
Page 37

Screen Partition:
Re-arranging Axis Systems
Depending on the task, three axis systems may be too few - or too many, in order to view and
compare graph sections of one or more graphs. Modules with both regular and irregular screen
partitions are available for this purpose. For the following example, the number of axis systems is
to be reduced to two.
Click to the function group of the regular screen partitions with the four squares. Select the two
axis systems that are arranged underneath each other.
Two systems of the
same size in a vertical row
Delete all graphs
Autosequences for graph
manipulation and transformation
The defined graphs are retained in all axis systems.
Note that since graphs had been previously entered in more axis systems (than are selected now),
the “extra” graph definition is automatically lost. Even if three axis systems were to be selected in
a subsequent step, the third axis system remains without graph entries.
For further graphical analyses of the same or other data, all the defined graphs in all the axis
systems can be deleted in one go with the icon “Delete all graphs” in the toolbar of commands.
Special functions for graph manipulation and for documentation as a diagram are realized as
Autosequences and require the Autosequence option.
DIA
dem
®
04-19-00
dem
DIA
® VIEW: V i ewing, Measuri ng & Editing Data 35
Page 38

36 DIA
dem
® VIEW: V i ewing, Measuri ng & Editing Data
04-19-00
DIA
dem
®
 Loading...