

Page 1
MAX11300PMB1 Peripheral Module
and Munich (USB2PMB1) Adapter Board
Quick Start Guide
Rev 0; 7/14
For pricing, del ivery , and or der ing info r mation, p lea se co nta ct M axim D irect at 1-888-629-4642, or visit M axi m Inte grated ’s w ebs ite at ww w .maxi mintegra ted .com.
Maxim Integrate d cannot a ssume res ponsibi lity f or use of a ny circui try oth er than circuitry entirel y embodie d in a Maxim Inte grate d product. No circui t
patent licenses are implied. Maxim Integrated reserves the right to change the circuitry and specifications without notice at any time.
© 2014 Maxim Integrated Products, Inc. Ma xi m Integr at ed and the Maxim Integrate d logo ar e trad em arks of Maxim Integrate d Prod uc ts, Inc .
Page 2

MAX11300PMB1 Peripheral Module and Munich (USB2PMB1) Adapter Board Quick Start Guide
Table of Contents
1. Required Equipment ................................................................................................. 3
2. Overview ................................................................................................................... 3
3. Included Files............................................................................................................ 6
4. Procedure ................................................................................................................. 7
5. Munich GUI ............................................................................................................. 12
6. Examples ................................................................................................................ 17
7. References ............................................................................................................. 35
8. Trademarks............................................................................................................. 36
9. Revision History ...................................................................................................... 37
2
Page 3

MAX11300PMB1 Peripheral Module and Munich (USB2PMB1) Adapter Board Quick Start Guide
1. Required Equipment
• PC with Windows® OS (Windows XP®, Windows Vista, Windows 7, Wind ows 8
and Windows 8.1) with one USB port
• MAX11300PMB1# board
• Munich (USB2PMB1#) board
• USB Type A to Mini B Cable
• Munich Software GUI
2. Overview
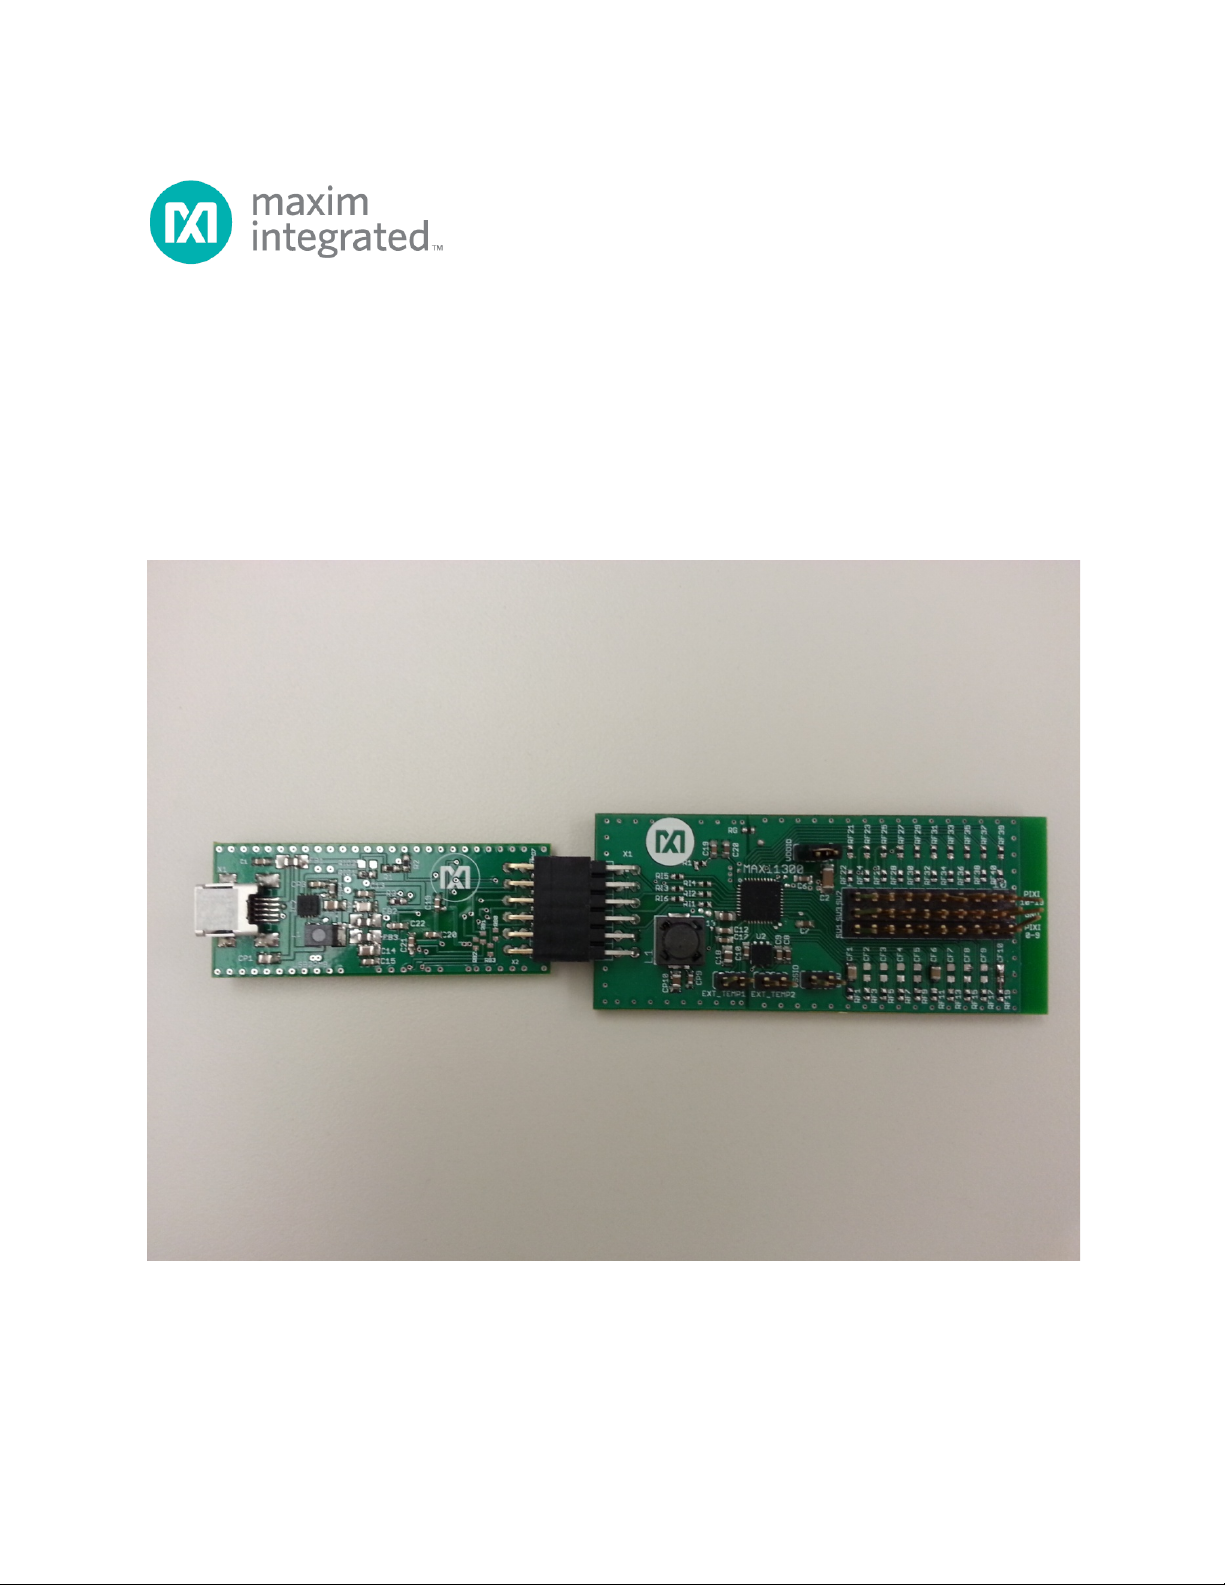
This document explains how the MAX11300PMB1 featuring the MAX11300 20-port
programmable mixed-signal I/O device interfaces with the Munich (USB2PMB1#)
adapter board and how to use the GUI.
The MAX11300PMB1 peripheral module provides the necessary hardware to interface
the MAX11300 20-port device to any system that utilizes Pmod™-compatible expansion
ports configurable for SPI communication (Figure 1). MAX11300 configura tion softwar e
is a design tool used to create the configuration bit stream that is downloaded to the
MAX11300 through the Munich adapter board (Figure 2
Refer to the MAX11300 IC data sheet for detailed information regarding operation of the
IC and to the USB2PMB1 adapter board data sheet for detailed information regarding
the Munich board and GUI. Refer to the MAX11300/MAX11301 PIXI™ Configuration
Software User Guide for detailed information using the design tool.
The Munich GUI and the USB2PMB1 adapter board are referred to as Munich
throughout this document.
).
3
Page 4
MAX11300PMB1 Peripheral Module and Munich (USB2PMB1) Adapter Board Quick Start Guide
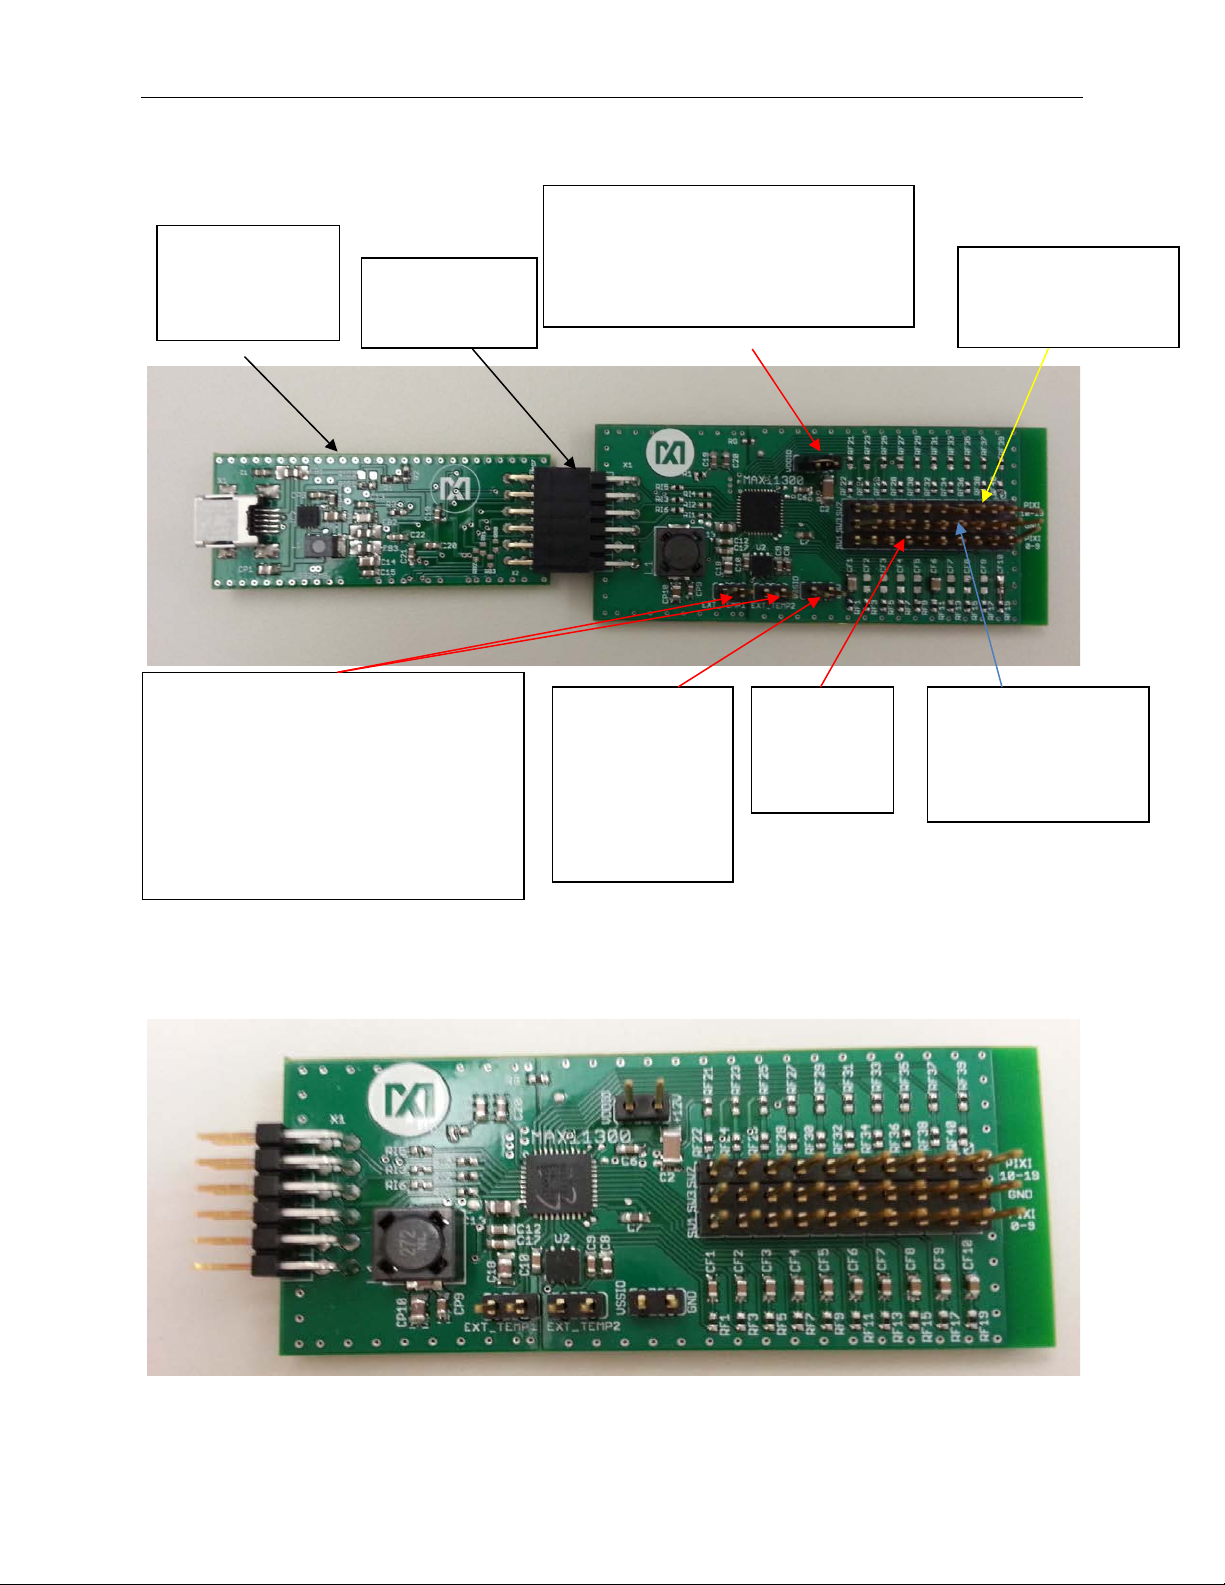
THE MUNICH
Pmod
VDDIO PROVIDES ON-BOARD +12 V
P10 TO P19 (FROM
VSSIO.
BIPOLAR.
EXTERNAL TEMPERATURE-
EXTERNAL TEMPERATURE.
P0 TO P9
ALL PINS IN THE
TO AVDD OF THE MAX11300. FOR
BOARD
(USB2PMB1)
CONNECTORS
BEST PERFORMANCE, USE +12.5V
EXTERNAL POWER SUPPLY.
SENSOR HEADERS. CONNECT THE
BASE AND COLLECTOR OF DIODECONNECTED TRANSISTORS SUCH
AS THE 2N3906 TO TEMP1 OR
TEMP2 PIN AND THE EMI T T ER TO
EXT PIN TO MEASURE THE
CONNECT TO
GND (OR -12V
EXTERNAL
POWER
SUPPLY FOR
(FROM
LEFT TO
RIGHT)
LEFT TO RIGHT)
MIDDLE ROW ARE
CONNECTED TO
GND.
Figure 1. MAX11300PMB1 Connected to Munich Adapter Board
Figure 2. MAX11300PMB1 Board
4
Page 5

MAX11300PMB1 Peripheral Module and Munich (USB2PMB1) Adapter Board Quick Start Guide
7
10
8
9
11
12
1
4
2
3
5
6
X1
SPI
CS
MOSI
MISO
SCLK
GND
3.3V3.3V
GND
X
INTB
CNVTB
The Munich adapter board is designed to supply power to external boards (i.e.,
MAX11300PMB1, Santa Fe, and many more) through the connector X2. It is i ntended to
provide power supply to the interface circuitry present in the connected board.
Figure 3 shows the pin configuration for the SPI-compatible connector at the
USB2PMB1 board. The MAX11300PMB1 board itself generates positive voltages from
3.3V on pins 6 and 12 with an on-board DC-DC converter. The 3.3V supply is limited to
~1.5W, limiting power available for the MAX11300PMB1 if a higher watt power supply is
required and external power supply is used. Refer to the MAX11300PMB1 data sheet
for details.
Figure 3. SPI Connector Inputs Found on the MAX11300PMB1
5
Page 6
MAX11300PMB1 Peripheral Module and Munich (USB2PMB1) Adapter Board Quick Start Guide
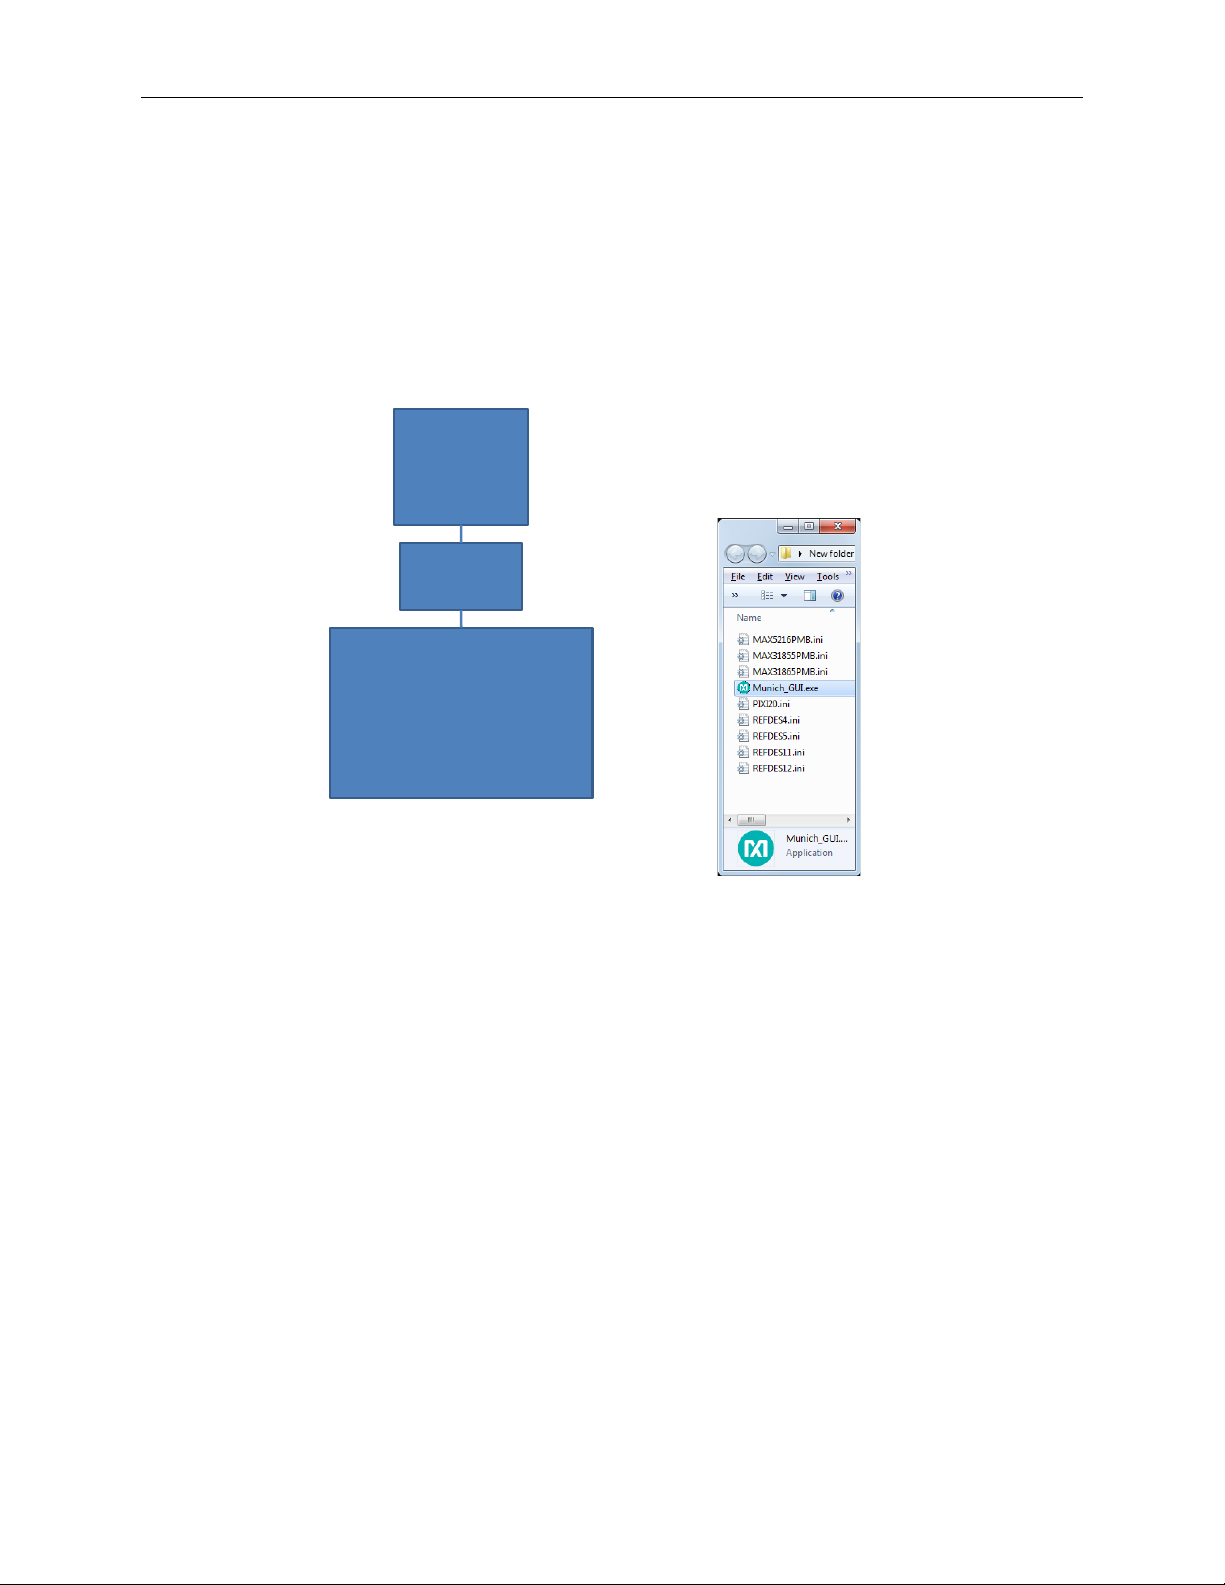
Munich
(USB2PMB)
PC
– USB-Port
(DUT) PMOD
MAX11300PMB1
Included Files:
GUI and the configuration-File
for each Tab.
Driver installs automatically on
WinXP, Win7, Win8, and
Win8.1 if PC is connected to
the Internet.
3. Included Files
Included files are the MAX11300 configuration software and Munich GUI (Figure 4). The
Munich GUI evaluates this MAX11300PMB1 and other Pmod designs from Maxim
Integrated.
Figure 4. MAX11300PMB1/Munich Included Files
6
Page 7
MAX11300PMB1 Peripheral Module and Munich (USB2PMB1) Adapter Board Quick Start Guide
4. Procedure
1) Go to www.maximintegrated.com/evkitsoftware to download the most recent
version of the Munich board software, Munich GUI. Double-click on the
installation file Munich GUISetupV1.0.exe to install the GUI.
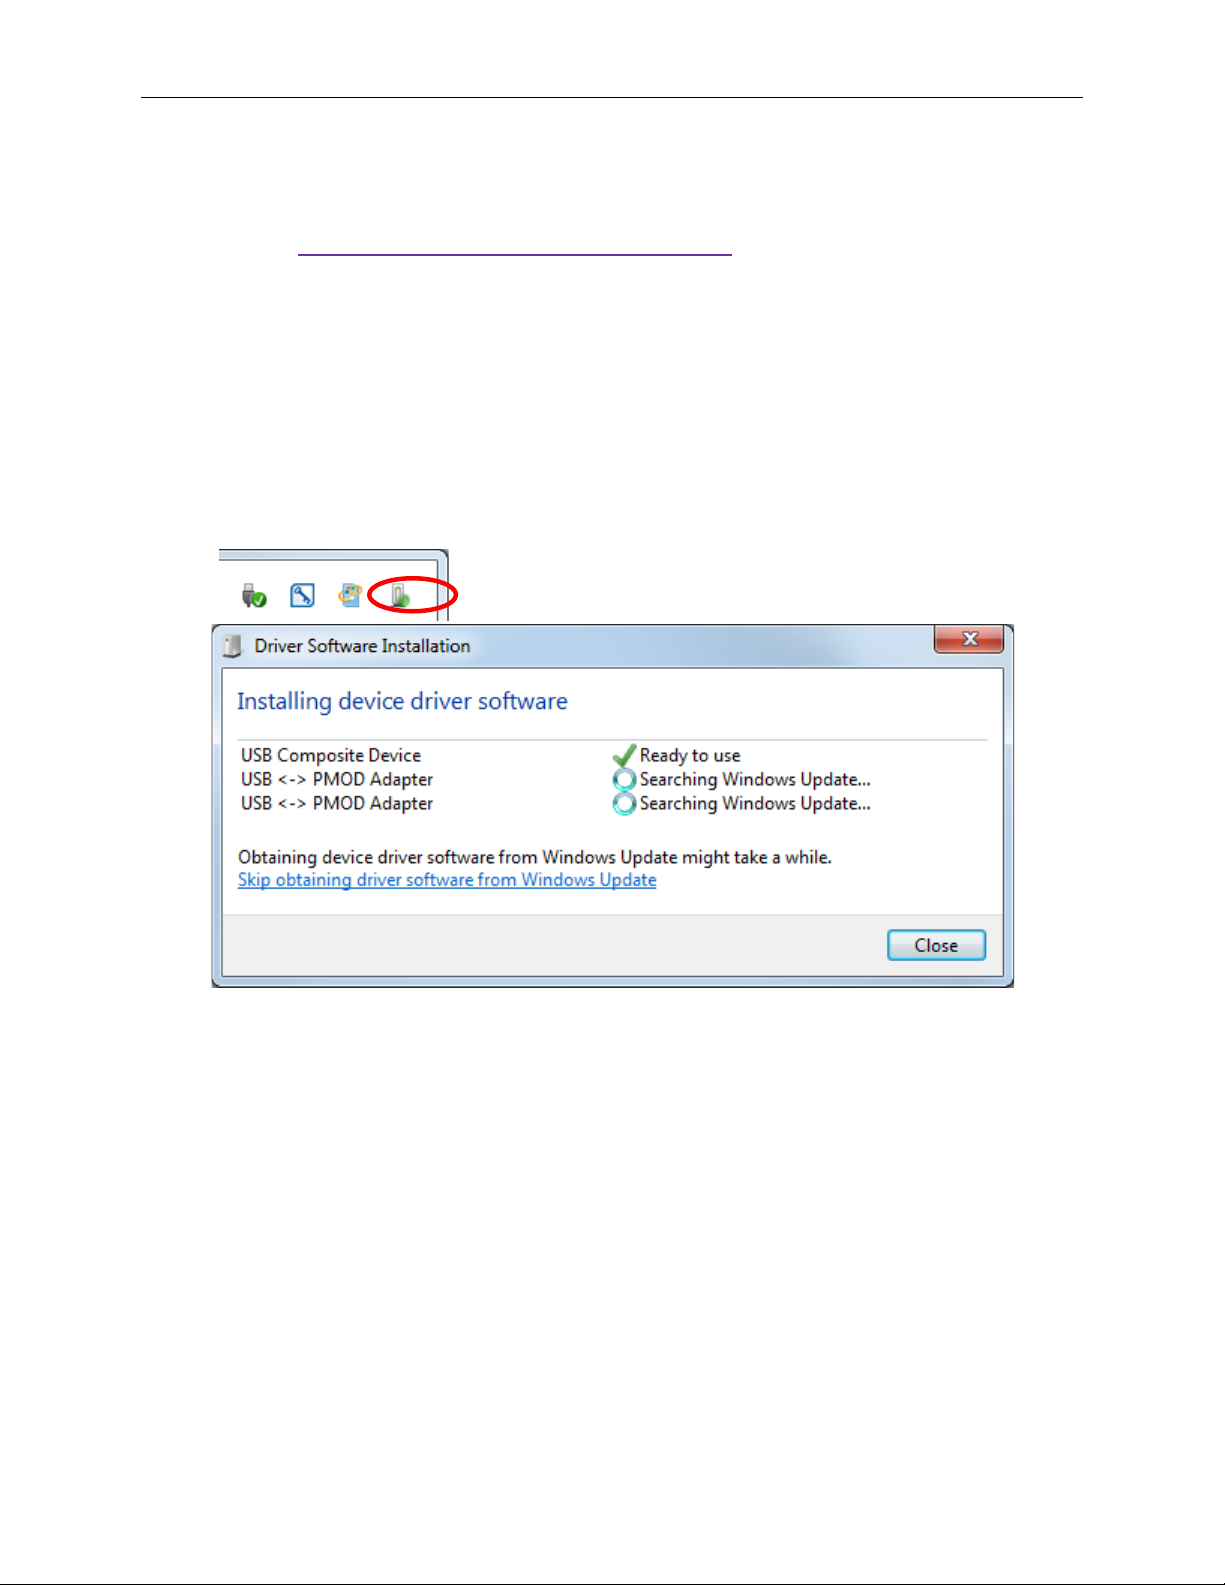
2) Connect the USB cable between the Munich board and the PC; the USB driver is
installed automatically (Internet connection required). Alternately, install the FTDI
driver by double-clicking on the CDM V2.08.30 WHQL Certified.exe application
file in the FTDI Driver.zip folder. See Figure 5, Figure 6, and Figure 7.
Figure 5. Driver Install ation for Munich Board
7
Page 8
MAX11300PMB1 Peripheral Module and Munich (USB2PMB1) Adapter Board Quick Start Guide
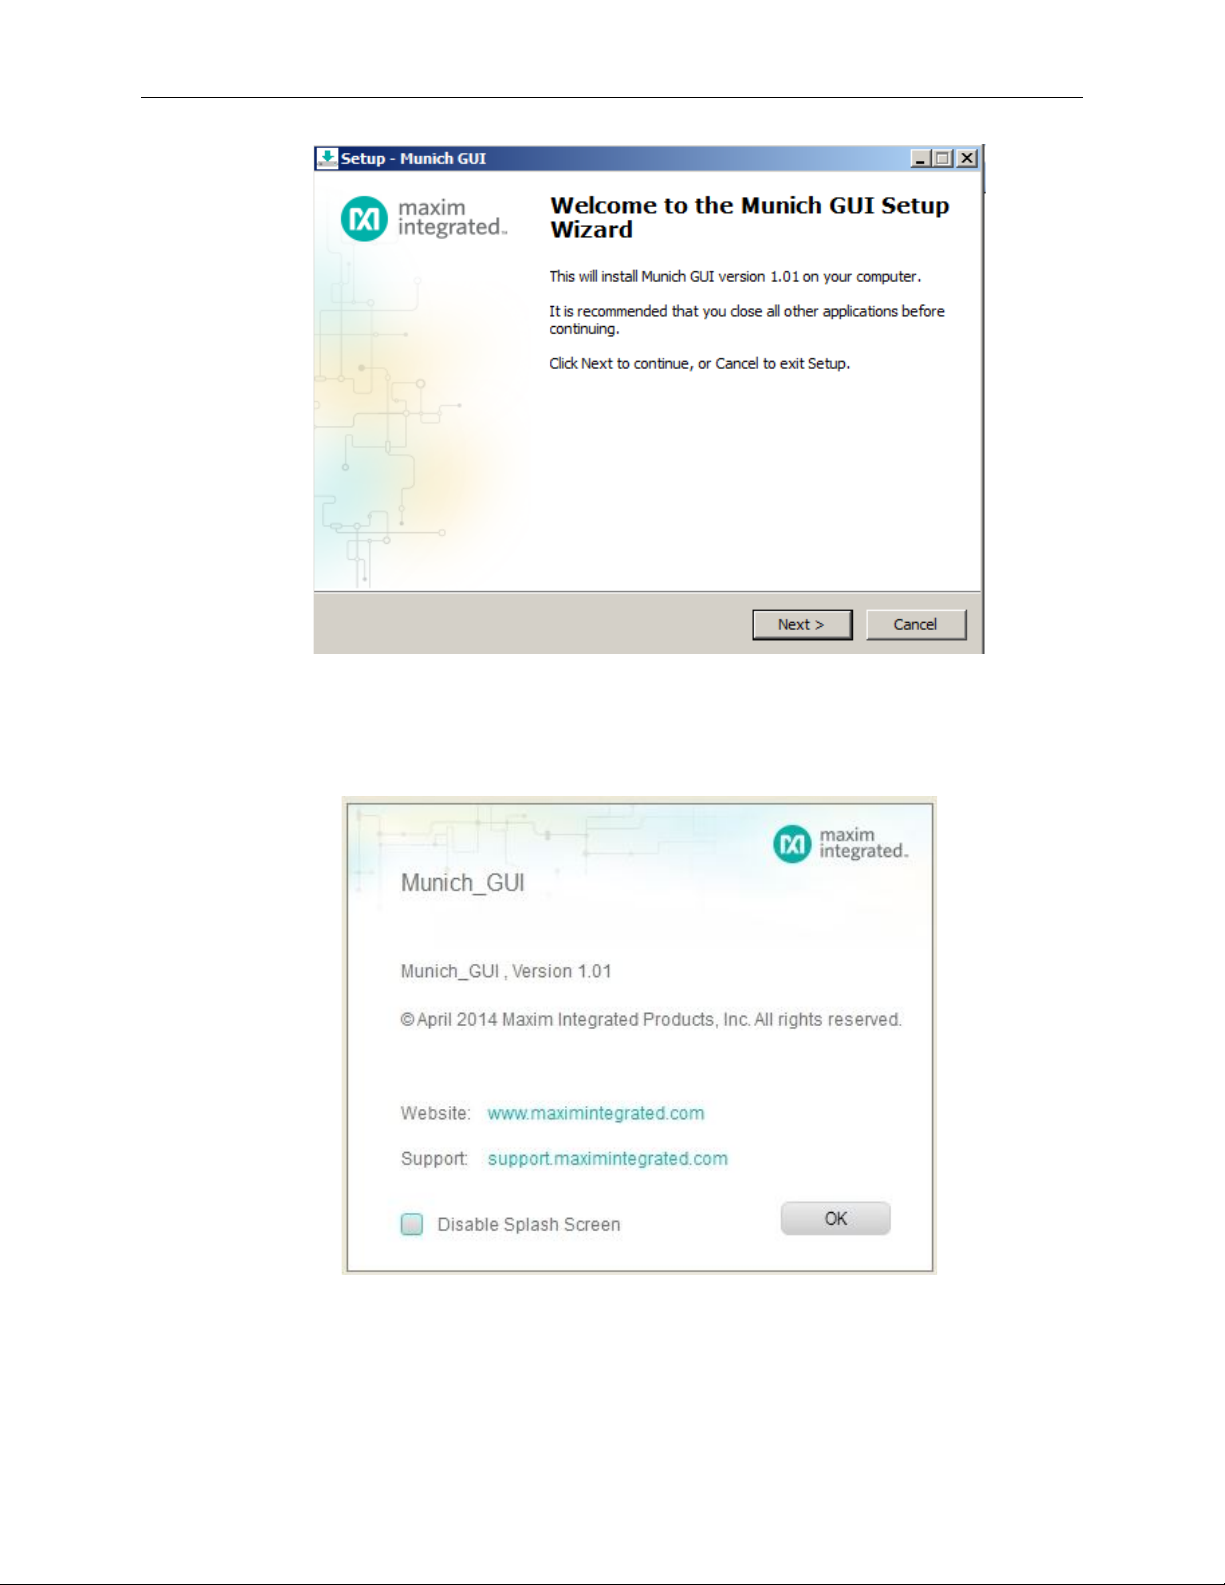
Figure 6. Munich GUI Setup Wizard
Figure 7. Munich GUI at Startup
8
Page 9
MAX11300PMB1 Peripheral Module and Munich (USB2PMB1) Adapter Board Quick Start Guide
3) Ensure that the jumper settings for VSSIO and VSSIO power supplies are correct
(both closed). Refer to the MAX11300P MB 1 d ata sheet for further details.
4) Connect the Munich board’s 2x6 pin right-angle connector to the
MAX11300PMB1’s 2x6 pin right-angle header.
5) Once the Munich board is connected with the MAX11300PMB1, open the
Munich GUI.exe (double-click) software.
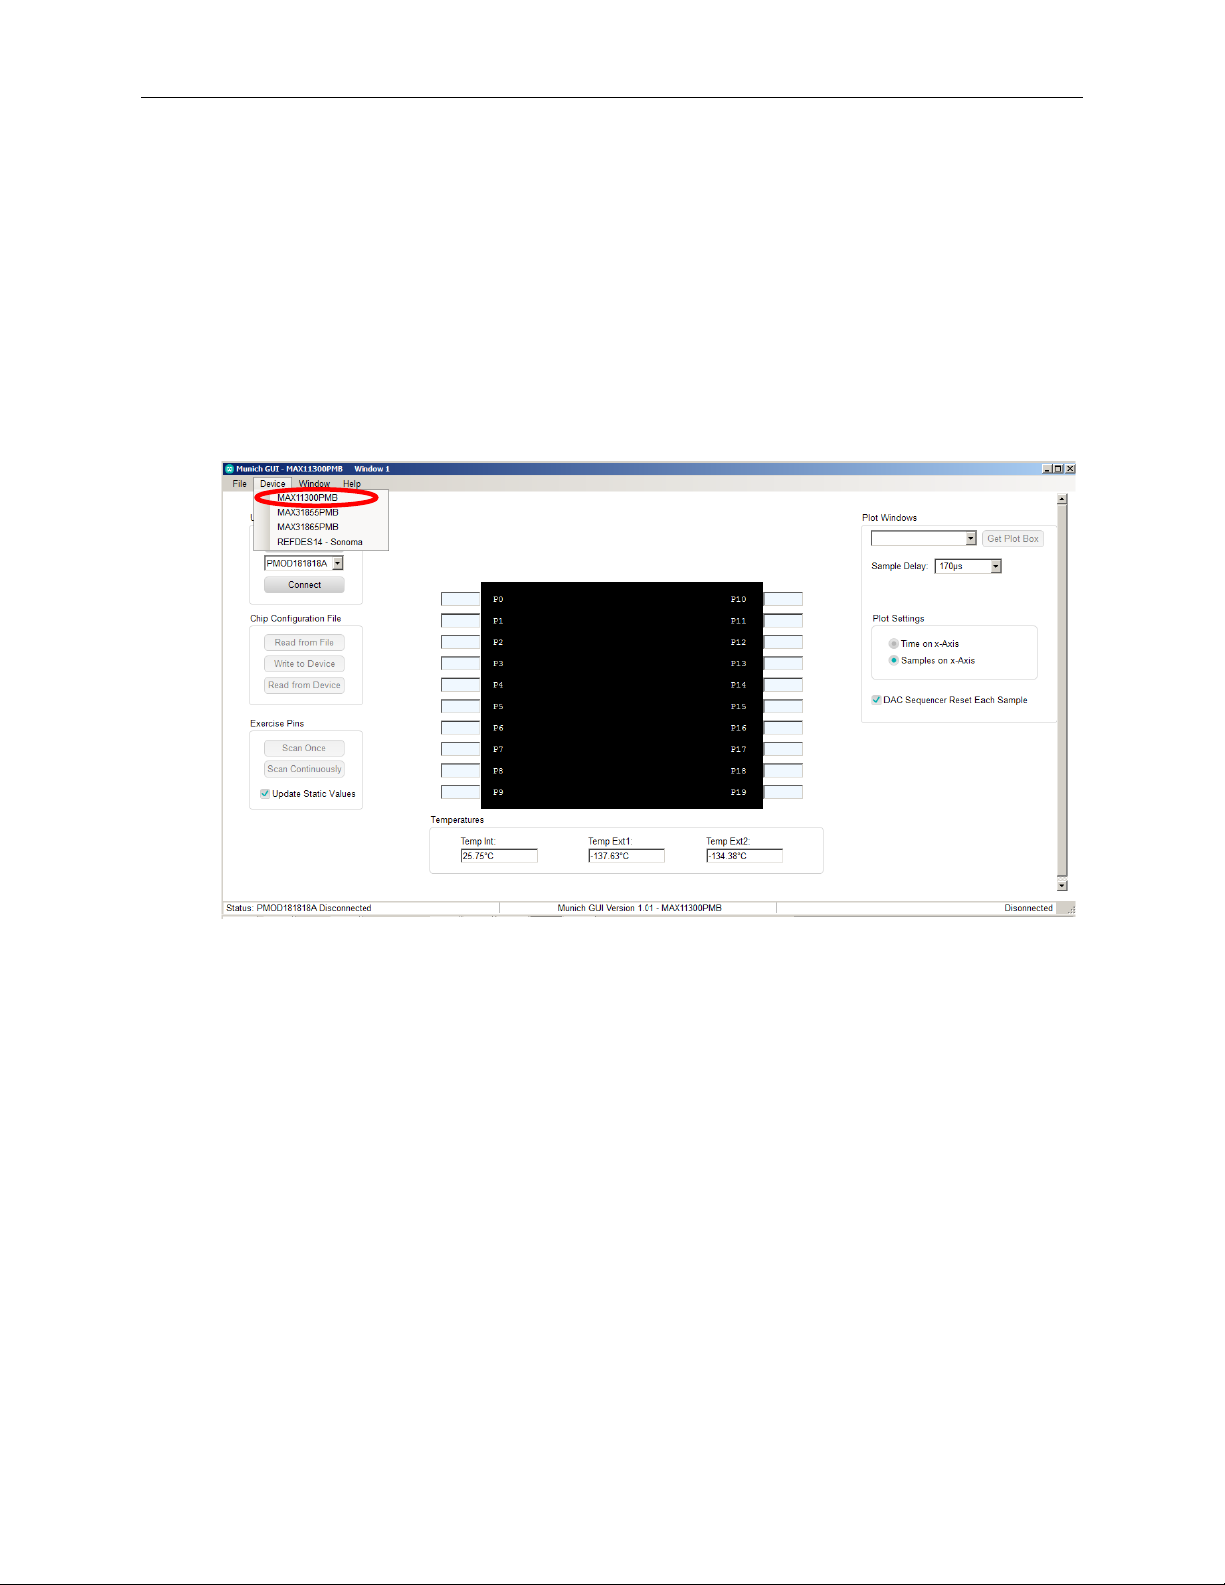
6) Click on Device tab and select the MAX11300PMB as shown in Figure 8, the
Munich GUI.
Figure 8. The Munich GUI
9
Page 10
MAX11300PMB1 Peripheral Module and Munich (USB2PMB1) Adapter Board Quick Start Guide
Scans for
boards
Available Munich
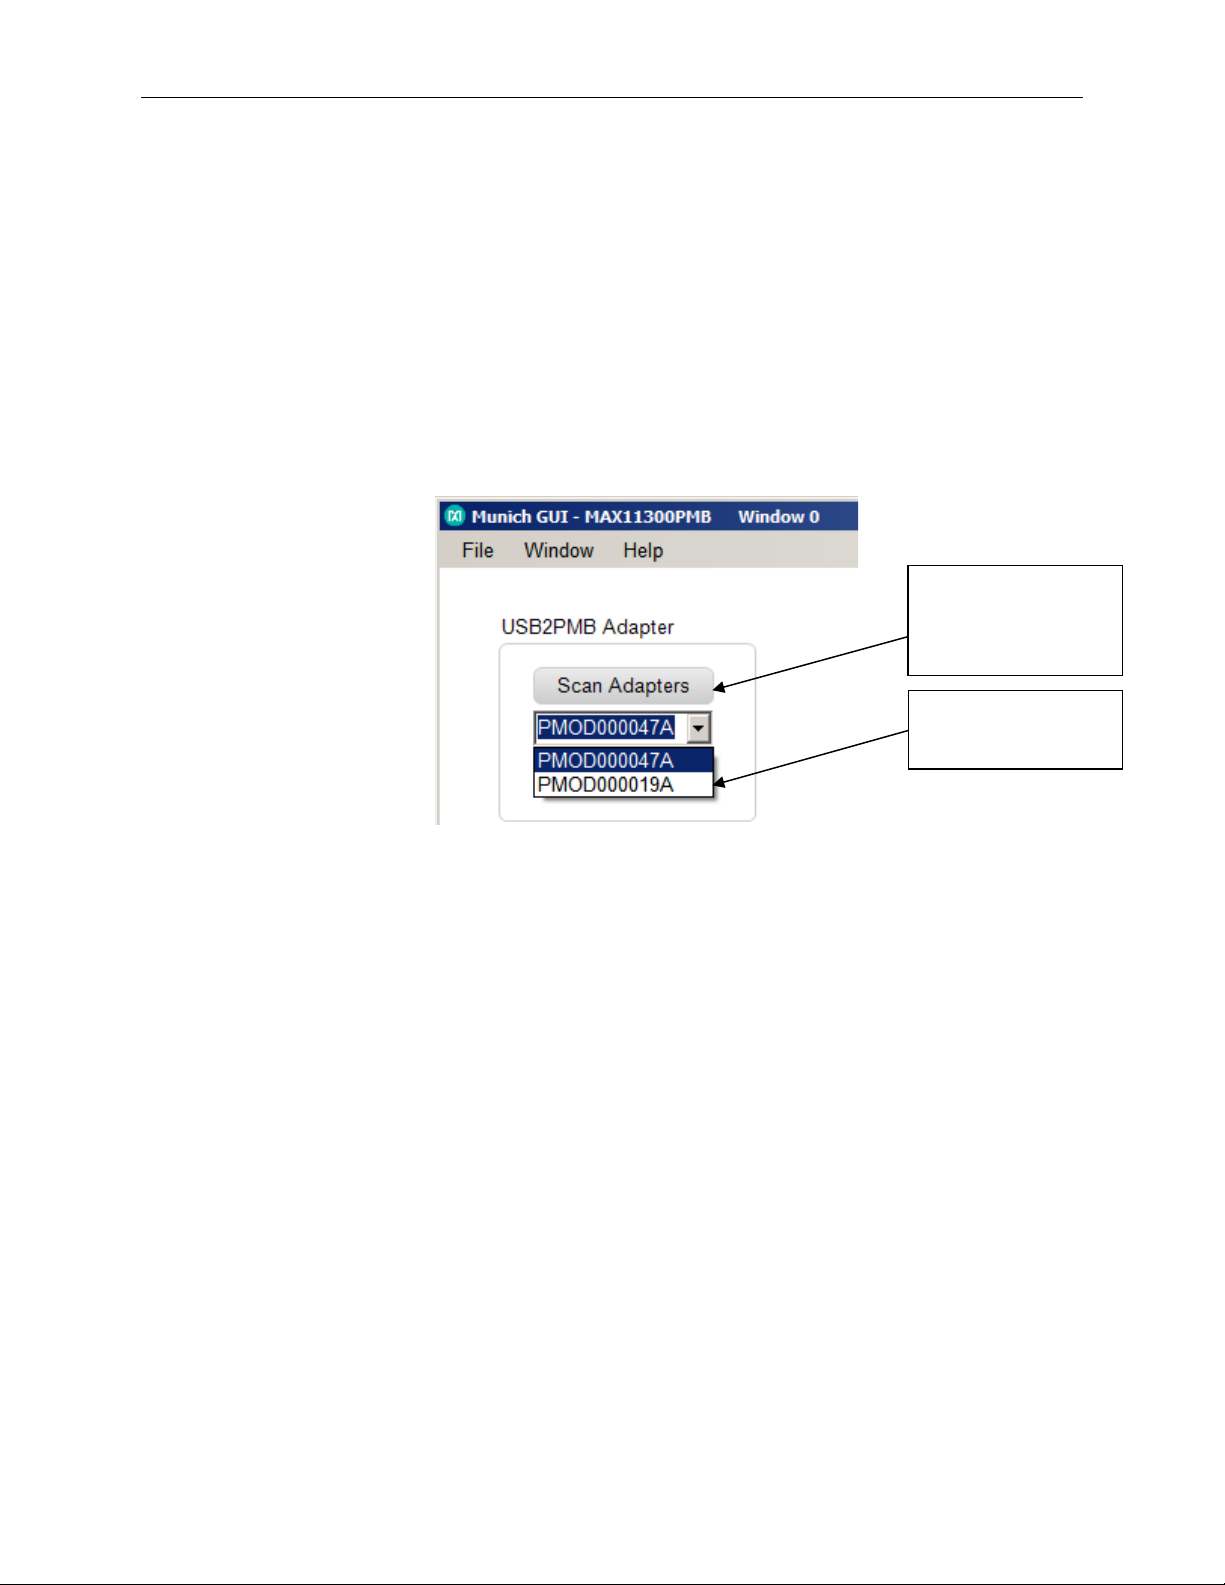
7) Press the Scan Adapters pushbutton to scan the available Munich boards
connected to the computer. This allows the user to test multiple companion driver
boards at the same time. Each Munich board has a unique ID that the software
determines.
Scan and Select:
Figure 9 depicts the scanning and available Munich devices connected.
The software has identified two devices:
1. PMOD000047A
2. PMOD000019A
connected
devices
Figure 9. Connect PMOD Adapter
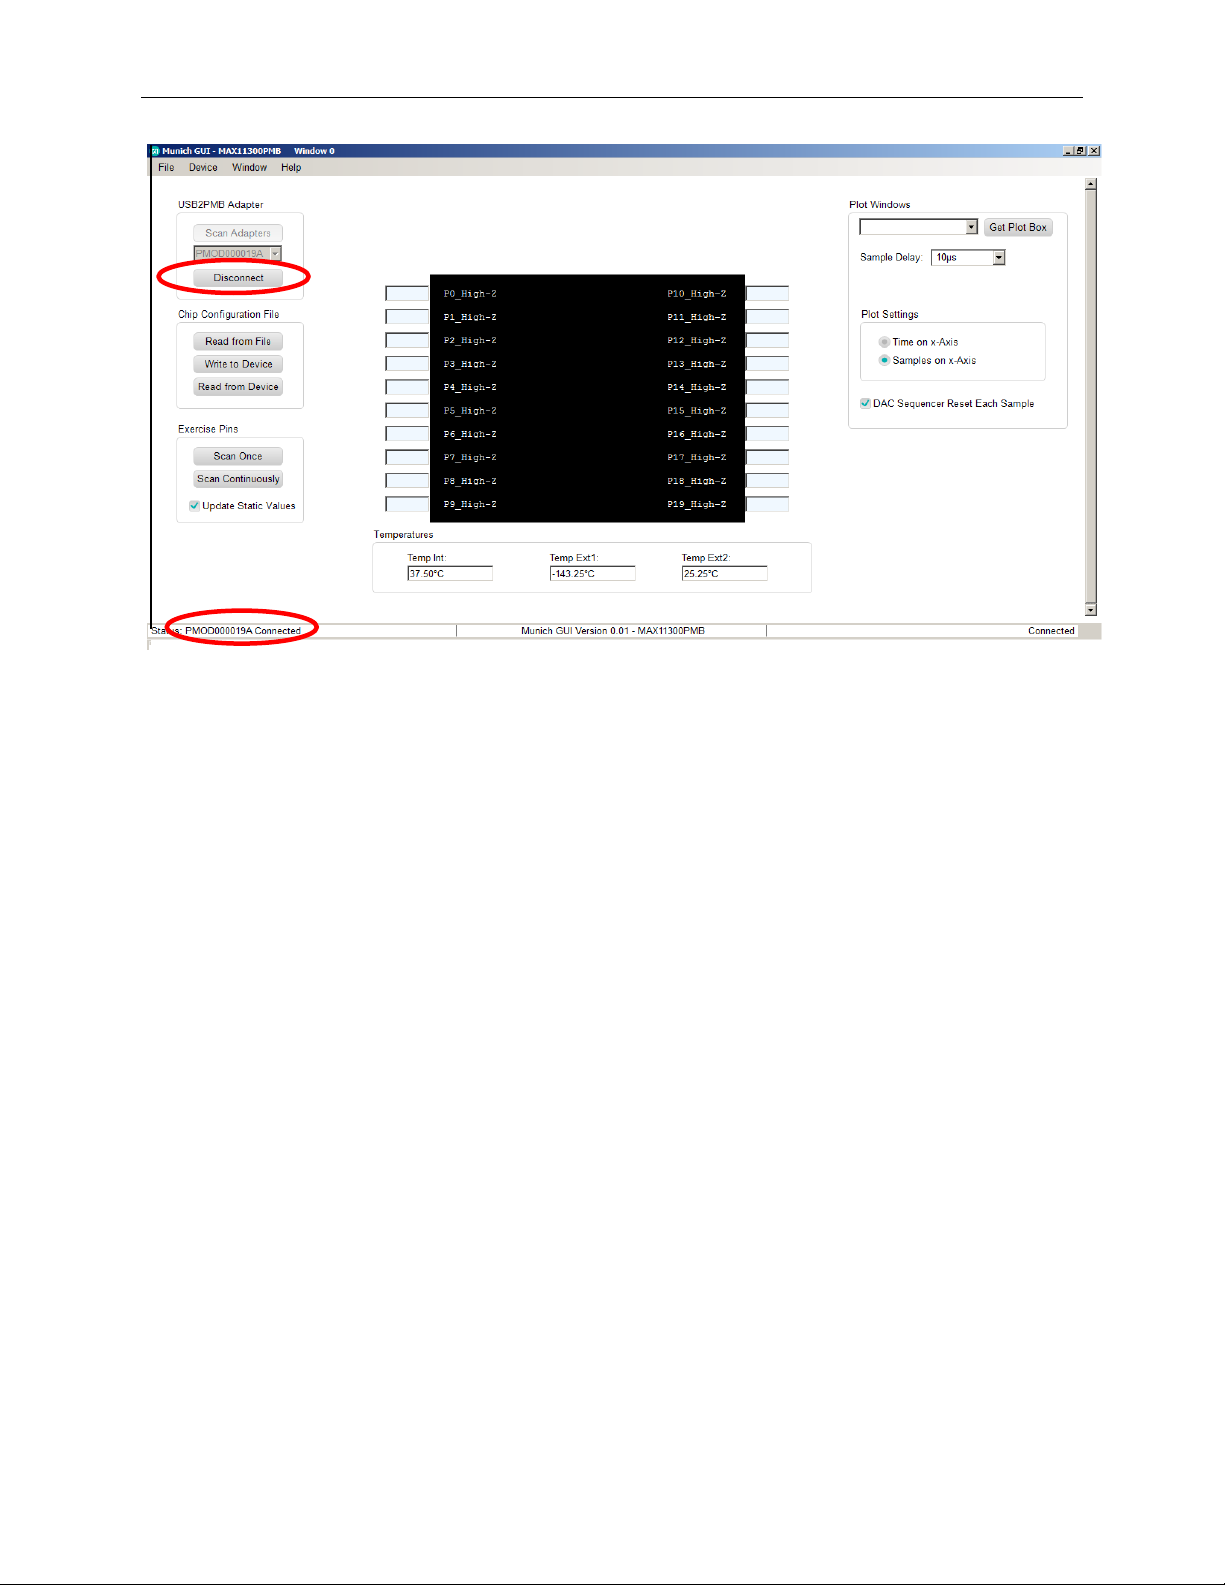
8) Within the tab sheet, press the Connect button and verify that the button
changes its text to Disconnect and the status bar at the bottom indicates that the
companion board is connected. See Figure 10.
10
Page 11
MAX11300PMB1 Peripheral Module and Munich (USB2PMB1) Adapter Board Quick Start Guide
Figure 10. MAX11300 Connected to Munich GUI
11
Page 12
MAX11300PMB1 Peripheral Module and Munich (USB2PMB1) Adapter Board Quick Start Guide
5. Munich GUI
The Munich GUI contains the internal block diagram of the MAX11300 device
showing the 20 programmable I/Os with their programmed setting.
At startup, the MAX11300 device is not programmed. To program the device,
click on Chip Configuration File | Read from File and select a .csv file that was
created with the MAX11300 Configuration Software tool. In the example
provided, the MAX11300Register_Demo.csv is selected. Next, write this
configuration bitstream to the MAX11300 device by clicking on
Chip Configuration File | Write to Device as shown in Figure 11.
Figure 11. Configuration Example
5.1 Write to Device
Click this button to transfer the configuration bit stream to the MAX11300. After
updating the device, use the Scan command to read the status and the port
name is updated to reflect the configuration. In this case, P10_ADC shown in
Figure 11 denotes that Port 10 is configured as an ADC.
12
Page 13

MAX11300PMB1 Peripheral Module and Munich (USB2PMB1) Adapter Board Quick Start Guide
The functions supported by the MAX11300 GUI are as follow s:
• Configuration
• Get predefined waveform files
• Choose sample delay and single or continue scan mode
• View/save plots
• Plot view options
Once the MAX11300 device is configured, click Scan Continuously. The GUI
then exercises each port with the programmed function.
5.2 Part Configuration
If the port is configu red as:
a. General-Purpose Input Port (GPI): The user-defined logic level is
read from the port and written to the appropri a t e port box.
b. General-Purpose Output Port (GPO): The user-defined logic level
defined in the port text box is written to the port (use either 0/1 or
high/low).
c. DAC Analog Output: The value written to the text box is applied to the
port. For DAC analog outputs, it is also possible to apply a complete
waveform. To do that, select a target DAC-port, and to apply a
waveform, click on Get Plot Box on the top right. A separate window
opens, and a comma separated file (.adc) that contains hex or decimal
numbers can be read with up to 1024 samples (Figure 12
). There are
a few waveform examples provided for sawtooth and sine and triangle
waveforms; these files have the suffix .adc*. Note that once a plot box
for the port is open, the text box in the GUI main window is ignored.
d. ADC Analog Input: the hexadecimal number in the text box
corresponds to the voltage applied to the pin. Note that the ADC input
type and the input range is selected in the configuration tool. As with
the DAC configuration, you can also open a plot box by selecting the
appropriate pin and clicking on Get Plot Box on the top right. If a plot
box is open, the plot box shows the waveform applied to the ADC input
pin.
e. Differential ADC Input: The MAX11300 can be configured for
differential ADC mode using two ports. The operation of the GUI is the
same as in step d.
f. Level Translator: The IC acts correctly, but the GUI shows only static
values for the input and the output.
*Although the files have suffix .adc, the content is a simple hex value that can either be a file saved from an
ADC analog input or as file that can be opened and written to a DAC to provide an analog output.
13
Page 14
MAX11300PMB1 Peripheral Module and Munich (USB2PMB1) Adapter Board Quick Start Guide
Figure 12. DAC Plot Box
The GUI also displays the three temperature-sensor measurements in degrees
Celsius (°C). The internal device temperature measures the IC die temperature.
For the external temperature measurements, add diode-connected transistors
sensors such as a 2N3906 to each channel. If the pins are left open, then the
temperature typically shows ~380°C. This is normal.
5.3 Sampling
The flexibility of the MAX11300 supports different modes of operation, including
different sampling schemes:
a. Scan Once: In this mode, the software reads the status of each input port a
single time and displays the value of each port.
b. Scan Continuously: In this mode, the software continually loops, reading all
input ports and updating the display to show the value of each port.
c. Sample Delay: This drop-down menu allows the user to select up to 1030µs
delay. This delay is enabled by the GUI between each complete sequence of
ADC read. See Figure 13.
14
Page 15

MAX11300PMB1 Peripheral Module and Munich (USB2PMB1) Adapter Board Quick Start Guide
Figure 13. Sample Delay Drop-Down Menu
5.4 DAC Sequencer Reset Each Sample
The DAC ports can be updated in different ways, either following a default sequence, or
as soon as new data is received, or using one of two data values that can be
programmed to all DAC ports. This button when selected enables the DAC to be
updated as soon as new data is received at the DAC Data register. See Figure 14.
15
Page 16

MAX11300PMB1 Peripheral Module and Munich (USB2PMB1) Adapter Board Quick Start Guide
Figure 14. DAC Sequencer Reset
16
Page 17

MAX11300PMB1 Peripheral Module and Munich (USB2PMB1) Adapter Board Quick Start Guide
6. Examples
The MAX11300PMB1 software includes a number of waveform plots and examples
for configuring and testing the MAX11300.
Figure 15 lists the files provided with the software tool. The files with suffix .ADC are
predefined waveform plots that can be used as input values to ports configured in
DAC mode. The files with suffix .csv are example configurations showing different
ways the MAX11300 can be configured. The files with suffix .mpix are design files
from MAX11300 configuration software.
Figure 15. MAX11300PMB1 Files
The Munich GUI is provided with an example configuration file for the examples in
Figure 15. To create a configuration file, a separate tool is needed: MAX11300
Configuration Software.
A step-by-step guide to use example register file is as follows:
1. Ensure the Munich board is connected to the MAX11300PMB1 board and the
USB is connected to a PC through a USB Type A to Mini B Cable as shown in
Figure 16.
2. Ensure the MAX11300PMB tab is opened in the Munich GUI and the adapter
number is shown in top-left corner. If you have multiple USB2PMB adapters,
verify the serial numbers.
17
Page 18

MAX11300PMB1 Peripheral Module and Munich (USB2PMB1) Adapter Board Quick Start Guide
HIGH-Z AT STARTUP
Figure 16. MAX11300PMB1/Munich Connected to PC Through a USB Cable
Figure 17. Munich GUI at Startup
3. Click the Connect button. The Munich GUI then reads the current
configuration from the connected MAX11300PMB and displays the pin
description for each pin. If the device is powered up, every pin is high-Z (high
impedance) as shown in Figure 17.
4. Under Configuration, click on Read from File and select the register file
MAX11300Register_Demo.csv as shown in Figure 18.
18
Page 19

MAX11300PMB1 Peripheral Module and Munich (USB2PMB1) Adapter Board Quick Start Guide
Figure 18. Register Files
5. The Munich GUI now shows all pin descriptions in the GUI according to the register
file. But the GUI does not immediately write it to the device, allowing the user
opportunity to double-check. This step is only important if something is already
connected to the MAX11300 ports as a DAC can provide up to ±10V and potentially
destroy the external circuitry. Also, do not connect 2-DAC ports together (shorted)
and set to different voltage levels. In addition, GPI ports can only support
levels between 0V and 5V. Therefore, do not connect a DAC to a GPI with a
voltage outside of the allowed range. A Confirmation window appears as depicted
in Figure 19.
19
Page 20

MAX11300PMB1 Peripheral Module and Munich (USB2PMB1) Adapter Board Quick Start Guide
Figure 19. Confirmation Window
Select Yes to write the new configuration to the MAX11300. If No is chosen, the GUI
does not write to the device, but reads the configuration from the device and displays
that again.
6. After the Example Register File is written, the screen on the GUI appears as shown in
Figure 20.
Figure 20. Pin Configuration
20
Page 21

MAX11300PMB1 Peripheral Module and Munich (USB2PMB1) Adapter Board Quick Start Guide
Pin configurations in this example are as follows:
P0:DAC Range 0V to +10V
P1:DAC + ADC Monitoring Range 0V to +10V
P2, P5, P7, P8, P9, P11, P12, P15, P18, P19: High-Z (not used)
P3: Unidirectional Level Translator Input from P14, Output Level 5.0V
P6: GPO General Purpose Digital Output, Level 4.0V
P10: ADC (Single-Ended ADC) Range 0V to +10V
P13: ADC (Single-Ended ADC) Range 0V to +10V
P14: GPI General-Purpose Digital Input, Threshold 1.0V
P16: GPI General-Purpose Digital Input, Threshold 1.0V
7. Hover the mouse cursor over the abbreviated pin description to obtain the detailed
description as shown in Figure 21.
Figure 21. Detailed Port Description
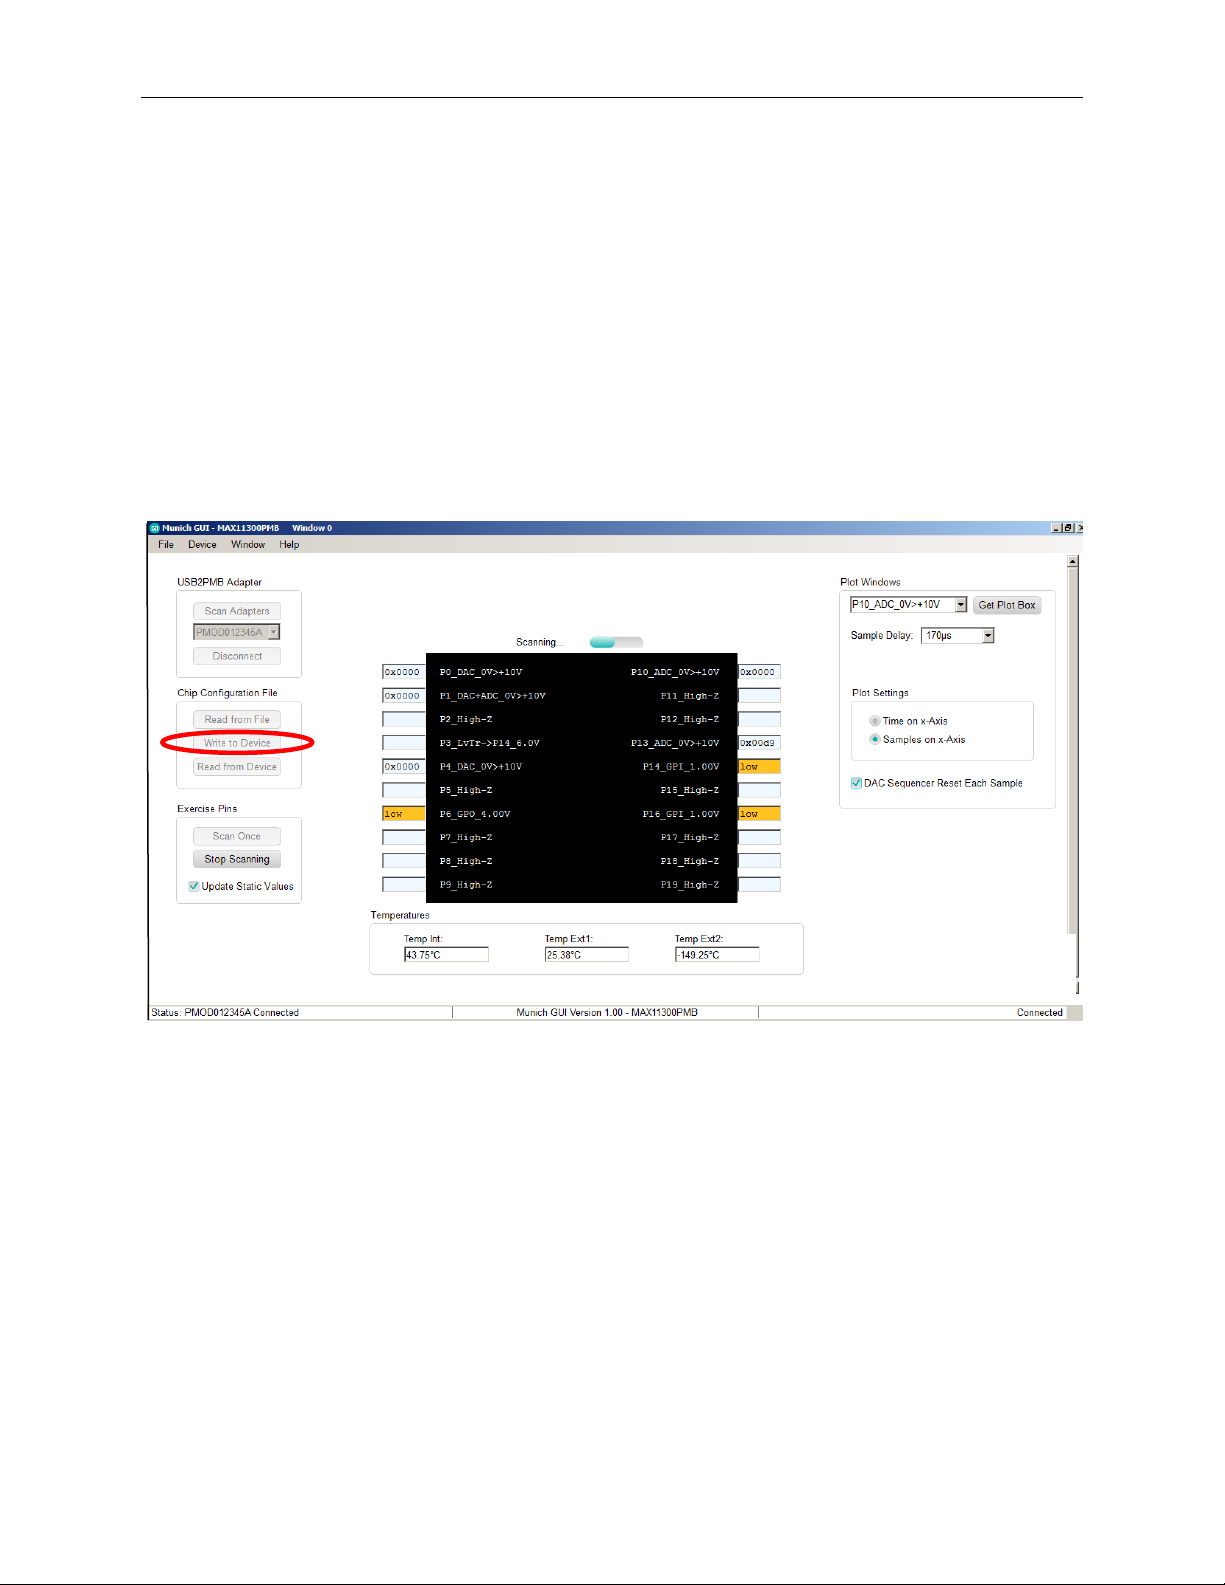
8. Select the Scan Once button under Exercise Pins. The Munich GUI then scans
through all 20 PIXI ports and executes its function. For DAC, it writes the value in the
port box to the DAC; for ADC, it reads the ADC and displays the received value into the
port box, similar to the GPIs and GPOs. Only switches and level translators are
independent, and the Munich GUI does not make any changes to them. The Scan
continuously button performs the same function as the Scan Once button, but it
repeats the scanning process until Stop Scanning is pressed.
To see results in real time, click on Scan Continuously. The Scan Continuously
button then changes to the Stop Scanning button, and the Scanning Progress bar
appears. All inputs are continuously updated (i.e., GPIs, ADCs, temperature sensors).
See Figure 22.
21
Page 22

MAX11300PMB1 Peripheral Module and Munich (USB2PMB1) Adapter Board Quick Start Guide
Figure 22. Continuous Scanning Mode
The following examples illustrate step-by-step instructions to:
• Write a waveform to a DAC and sample it back with an ADC.
• Demonstrate the behavior of a DAC with ADC monitoring.
• Generate PWM with potentiometer-adjustable pulse width.
6.1 Writing a Waveform to a DAC and Sampling It Back with an ADC
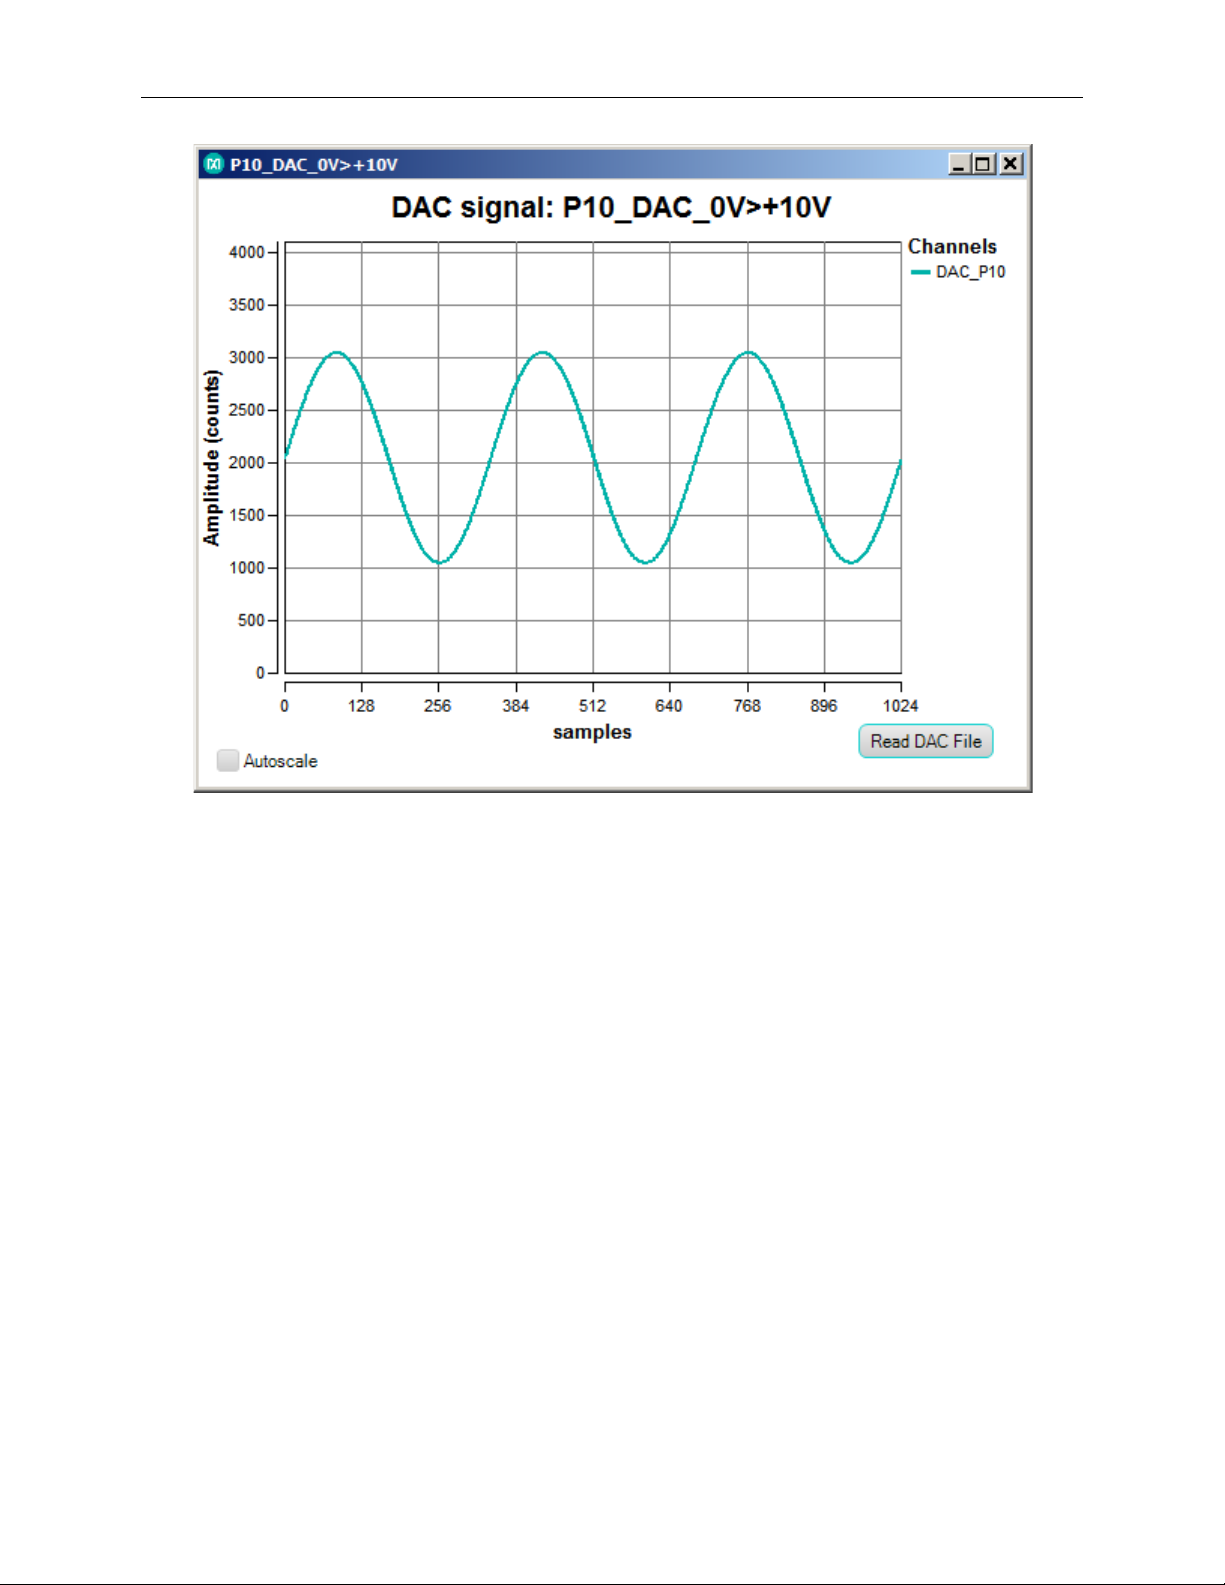
1.
Under Plot Windows in the drop-down menu at the top right, select
P0_DAC_0V>+10V and Get plot box. A small plot window appears on the screen as
shown in Figure 23
. Click Read DAC File and select an analog data point file called
ideal_sine_1000_3x.adc.
22
Page 23

MAX11300PMB1 Peripheral Module and Munich (USB2PMB1) Adapter Board Quick Start Guide
Figure 23. P0_DAC_0V>+10V Plot Window
The plot window now shows a sine wave, and the entire plot has 1024 data points.
While Continuous Scan is in progress, this waveform is written to the DAC and the
speed depends on how many DAC and ADC pins are available and how many plot
windows are open.
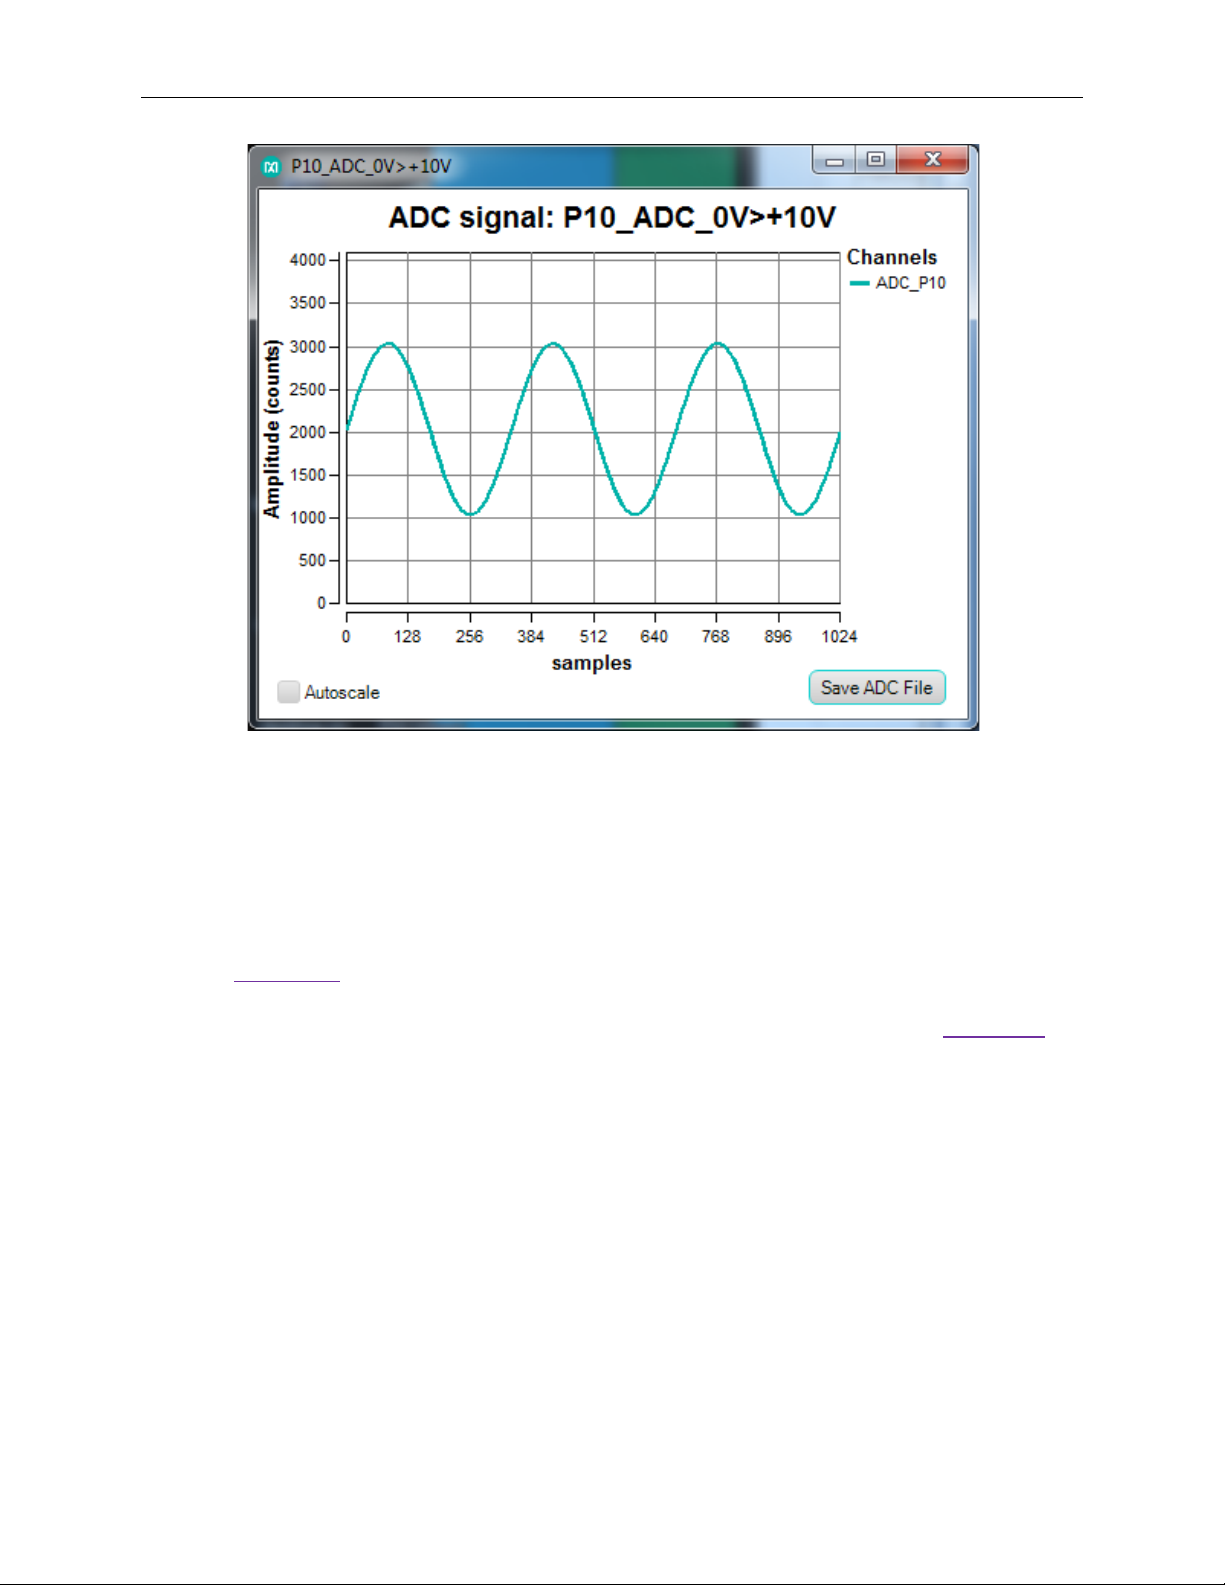
2. In the drop-down menu at the t op right, select P10_ADC_0>+10V and click the Get
plot box button. A plot window opens and shows the analog level on the ADC as shown
in Figure 24.
Figure 24. P10_ADC_0>+10V Plot Window
23
Page 24

MAX11300PMB1 Peripheral Module and Munich (USB2PMB1) Adapter Board Quick Start Guide
3. Use a jumper wire to connect P0 to P10 as shown in Figure 25.
Figure 25. P0 Connected to P10
4. After connecting the DAC to the ADC, observe a sine-wave-like-shaped waveform in
the ADC plot window as shown in Figure 26
.
24
Page 25

MAX11300PMB1 Peripheral Module and Munich (USB2PMB1) Adapter Board Quick Start Guide
Figure 26. Sine-Wave-Like Waveform Without Sample Delay
The waveform does not appear as smooth as the waveform applied in the DAC window.
The reason is that the DAC can sample 20ksps only, but the ADC can sample 400ksps.
Therefore, multiple data points are written to the DAC before the DAC can accept a new
data point. To allow ample time for the DAC to settle before writing a new value, insert a
sample delay between each sample by selecting 10μs or more in the Sample delay
drop-down menu.
5. After adding 170μs sample delay, the ADC shows the same waveform as we apply
to the DAC. See Figure 27
.
6. Keep the plot windows open.
25
Page 26
MAX11300PMB1 Peripheral Module and Munich (USB2PMB1) Adapter Board Quick Start Guide
Figure 27. Sine Wave with 170µs Sample Delay
6.2 Demonstrate the Behavior of a DAC with ADC Monitoring
In this example, a potentiometer is connected between ADC and DAC to adjust the
amplitude.
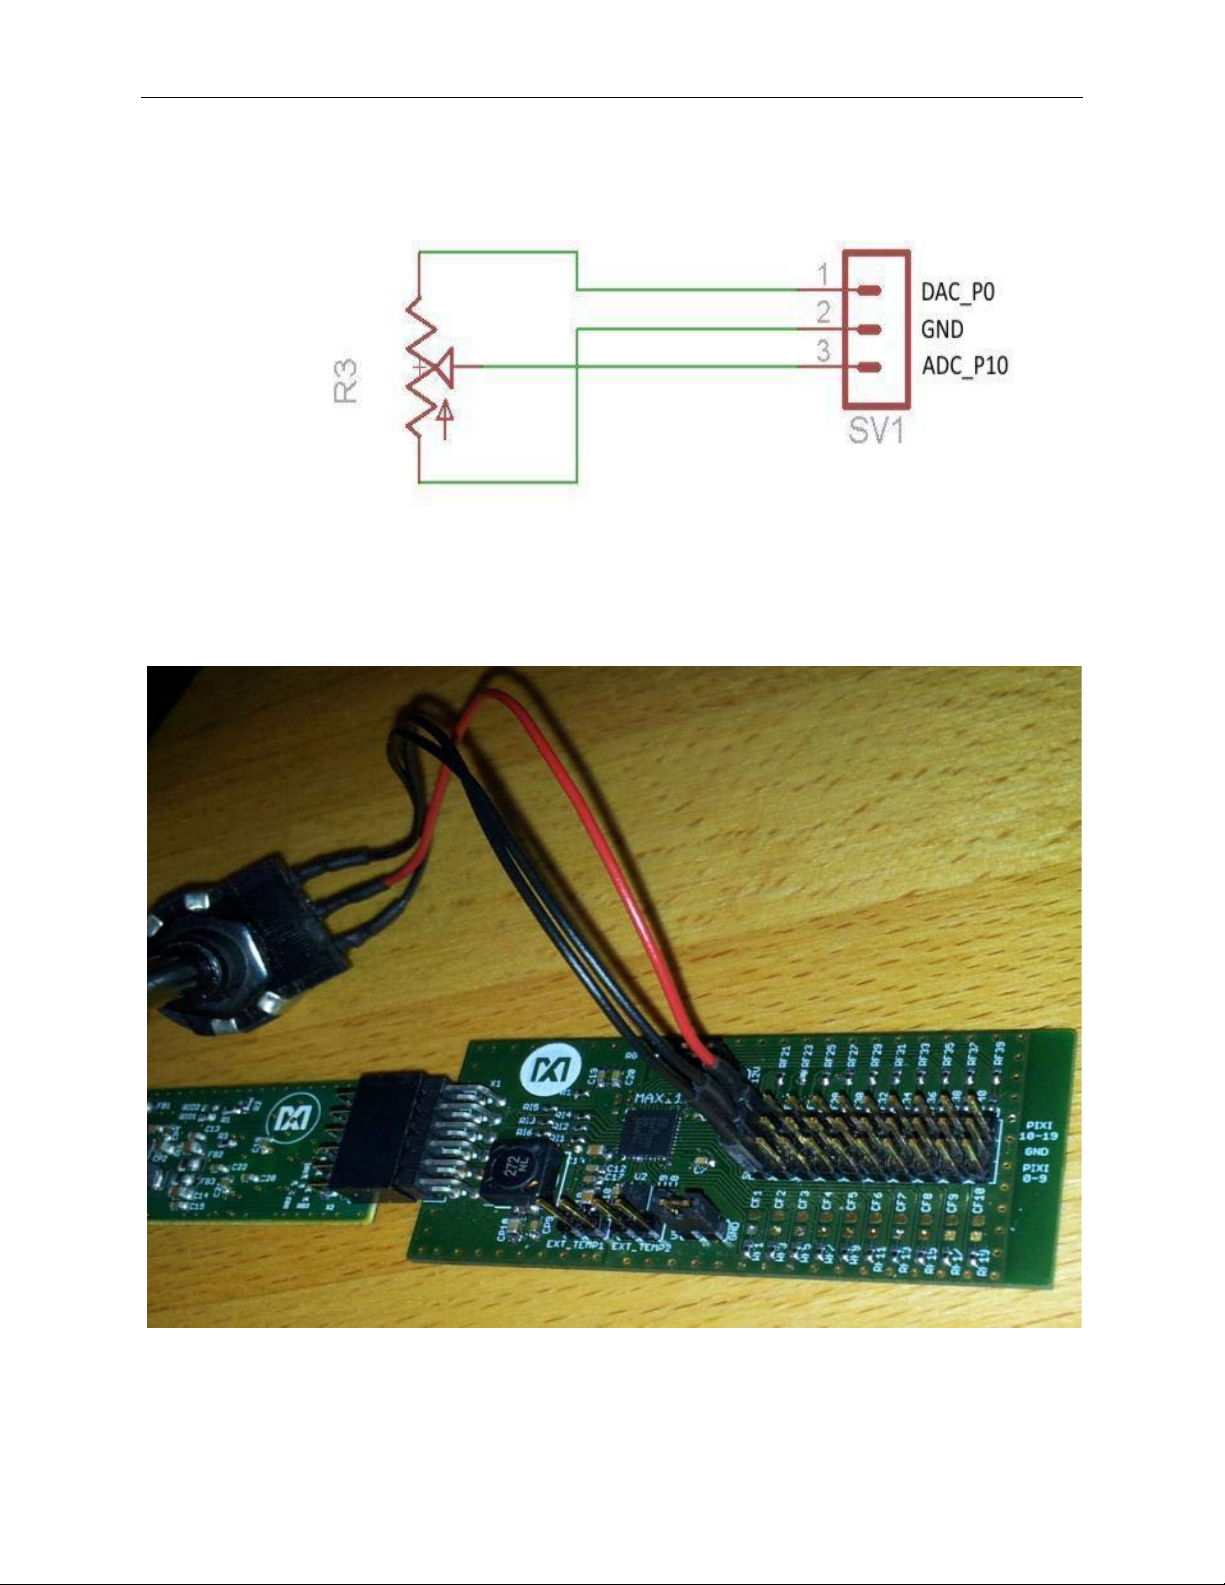
1. See Figure 28 for the potentiometer schematic connection. Make sure that (1) is
connected to the DAC output of the MAX11300 Port 0, (2) is connected to GND
(middle row), and (3) is connected to the ADC MAX11300 Port 10. See
Figure 29 for
the setup.
26
Page 27
MAX11300PMB1 Peripheral Module and Munich (USB2PMB1) Adapter Board Quick Start Guide
Figure 28. Potentiometer Schematic Connection
to MAX11300PMB Ports
Figure 29. Potentiometer Setup for Demonstrating the
Behavior of a DAC with ADC Monitoring
27
Page 28

MAX11300PMB1 Peripheral Module and Munich (USB2PMB1) Adapter Board Quick Start Guide
2. Adjust the potentiometer and observe the amplitude received at the ADC changes
as the potentiometer is varied.
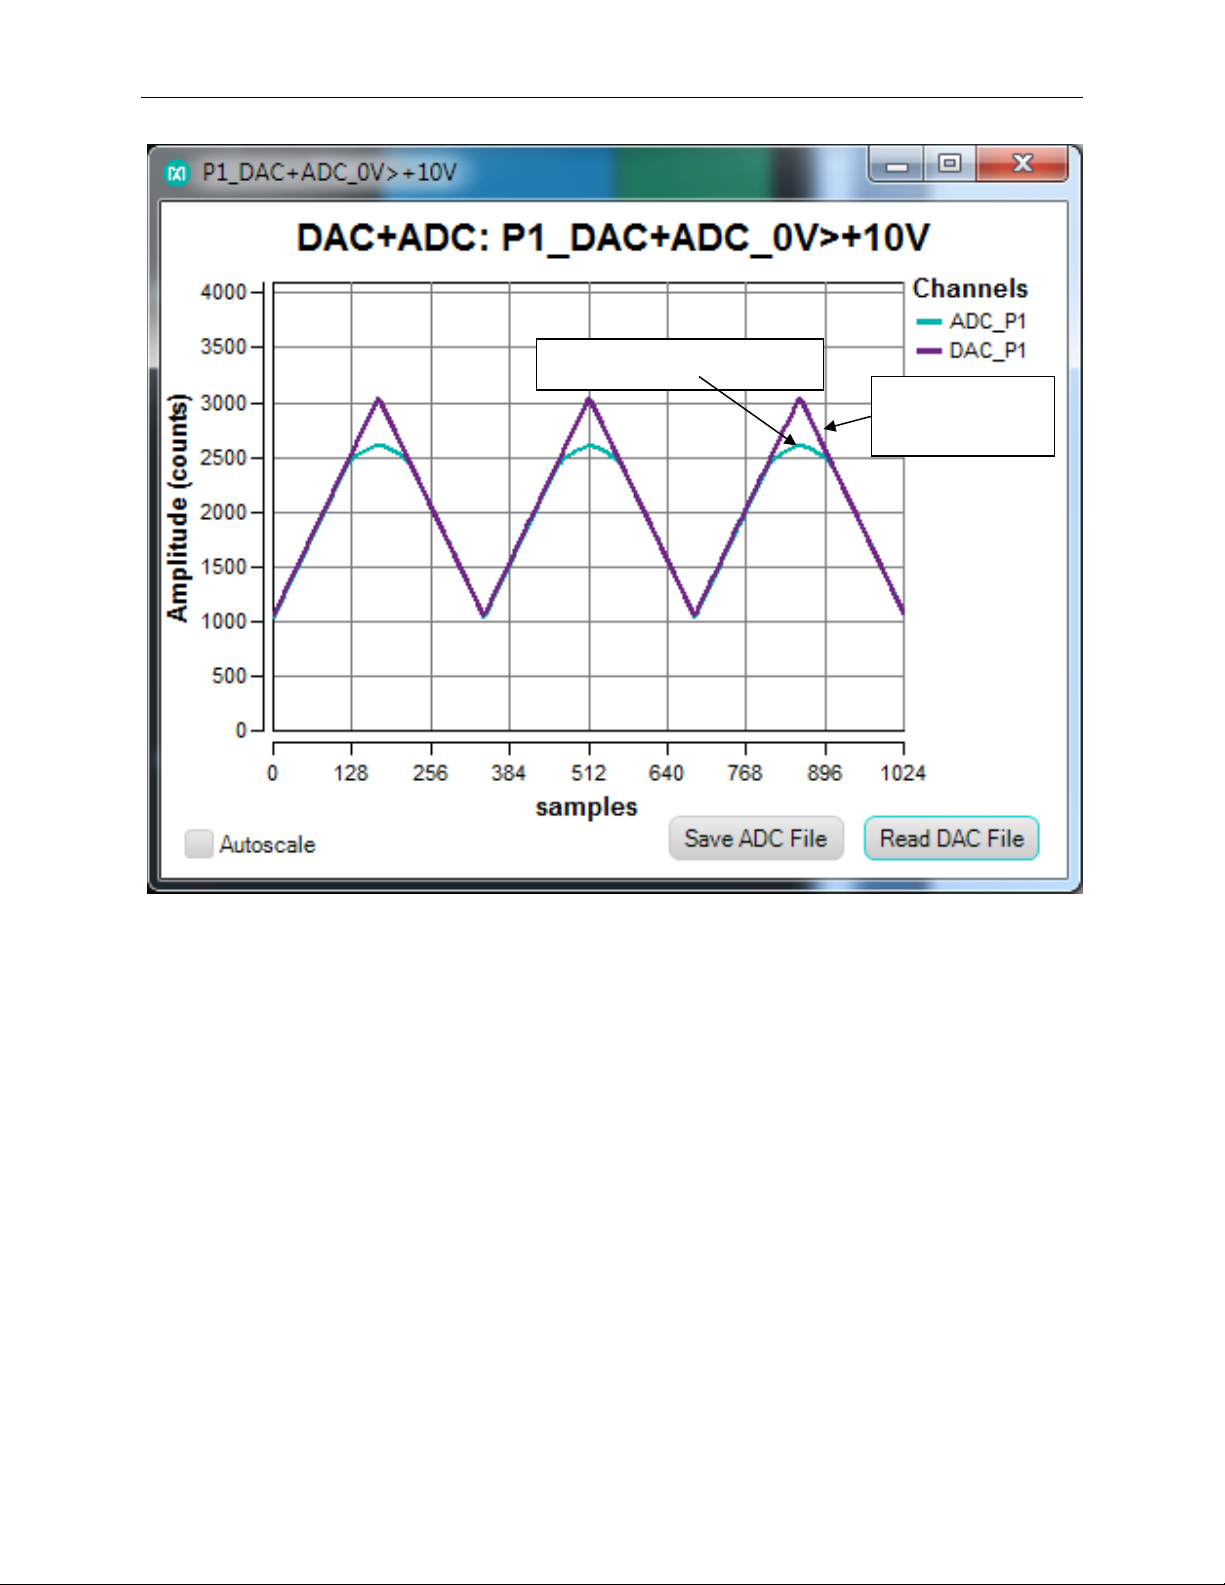
3. In drop-down menu at the top right, select P1_DAC+ADC_0>+10V and select the
Get plot box button. Another plot window opens and displays two waveforms: one
in teal and one in purple. The teal waveform is for A DC, and the purple waveform is
for DAC. Click on Read DAC File and open the ideal_triangle_1000_3x.adc file.
The purple DAC waveform shows a triangle as driven into the DAC. The teal plot
shows the waveform as sampled with the ADC on that same pin. Zoom in or make
the plot window full screen to see the difference between the ADC and DAC plots,
which is mostly due to timing. DAC allows current up to ~20mA; if more current is
drawn, the DAC voltage drops. This happens if the DAC has an output voltage of
10V with a load resistor of 500Ω or less. On the MAX11300PMB1 board, an RC filter
is installed on every port as shown in Figure 30.
Figure 30. RC Filters Are Installed on the MAX11300PMB1 Ports (P0–P19)
This filter is not necessary to use the device, but it provides short-circuit protection. On
this board, it is acceptable to connect a jumper between P1 and the middle row (GND).
Connect a jumper between P1 and GND and observe that the DAC does not reach the
peak of the triangle waveform that is driven into the DAC as shown in Figure 31.
28
Page 29
MAX11300PMB1 Peripheral Module and Munich (USB2PMB1) Adapter Board Quick Start Guide
Purple (signal
Teal (signal at ADC)
at DAC)
Figure 31. DAC Waveform Does Not Reach the Peak When the Port
Is Connected to Ground
4. The purple waveform is the signal driven into the DAC. The teal waveform is the
voltage the ADC sees on the DAC pin. Since there is resistance between MAX11300
pin and board pin, the voltage observed by the ADC is not equal to the voltage on
the board output pin.
5. Remove the jumper wire between P1 and GND.
6. Keep the plot windows open.
29
Page 30
MAX11300PMB1 Peripheral Module and Munich (USB2PMB1) Adapter Board Quick Start Guide
Threshold
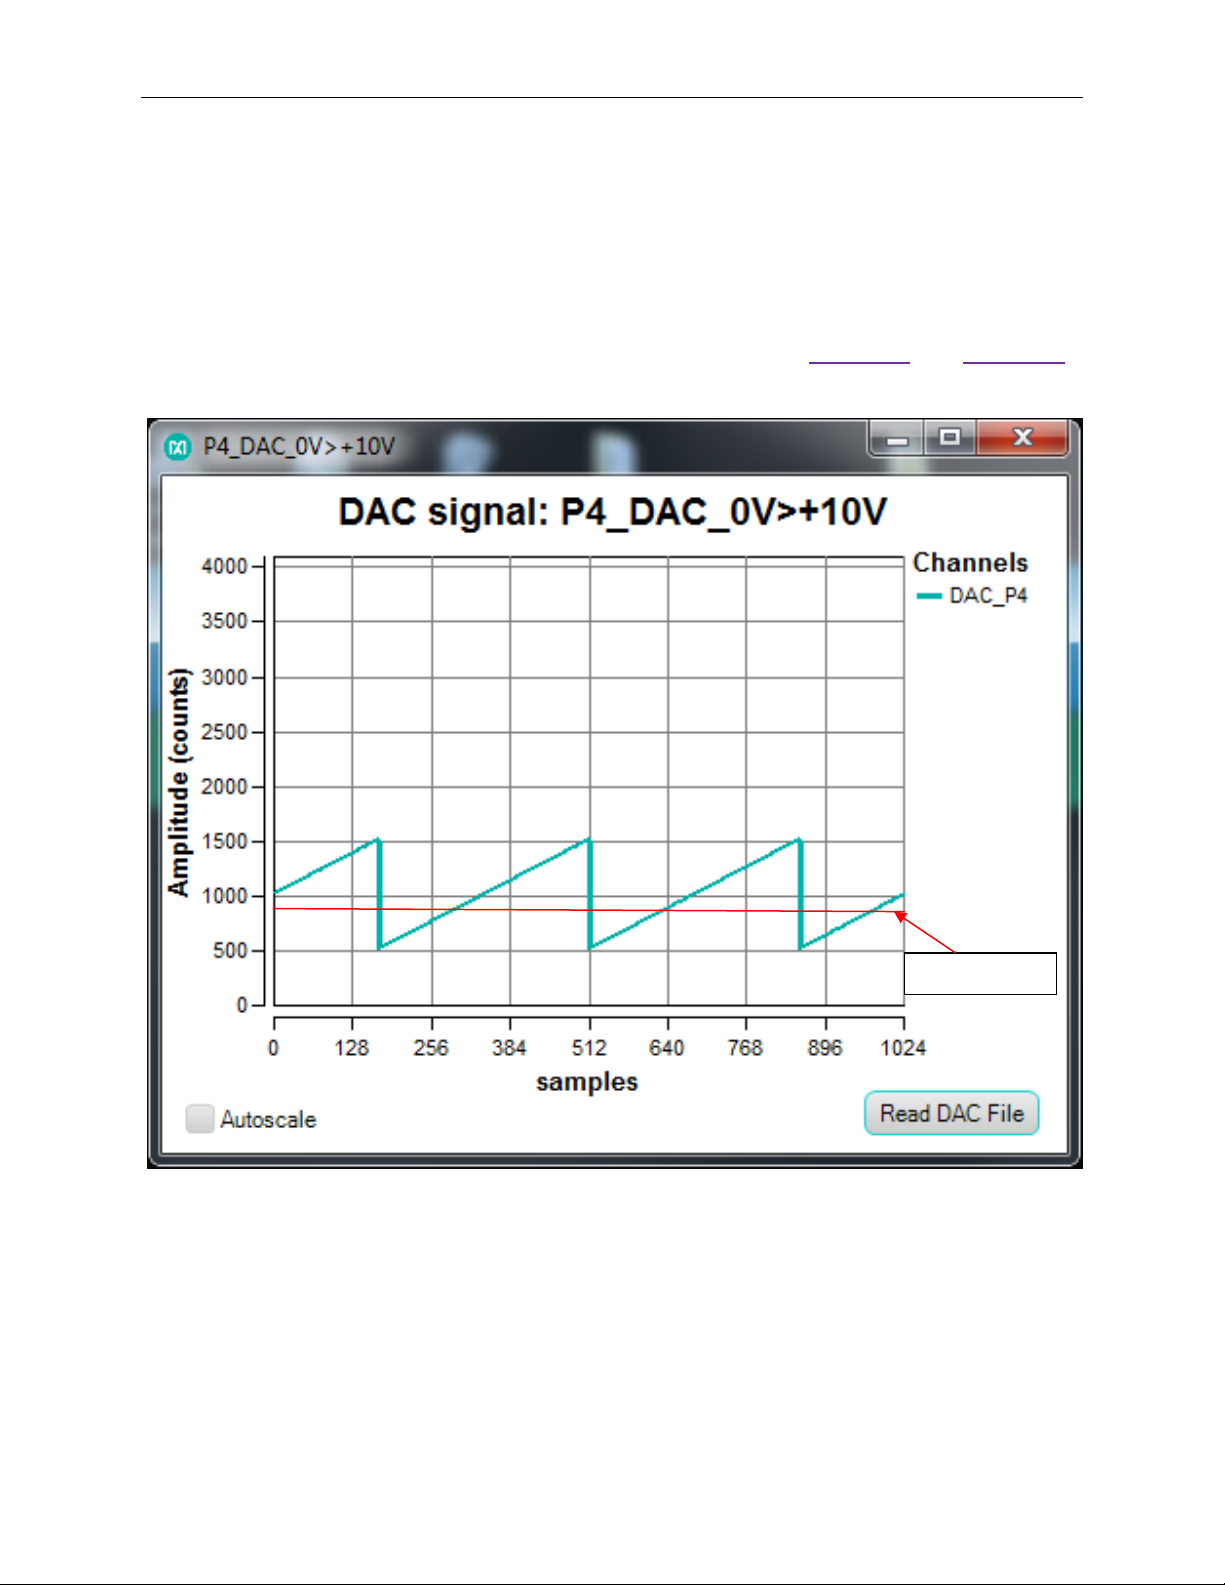
6.3. Generate PWM with Potentiometer-Adjustable Pulse-Width
In this example, a sawtooth waveform is generated and fed to a comparator (i.e., a level
translator). The output of the comparator is high if the signal is above the threshold or
low if the signal is below the threshold (same case for a level translator). As the position
of the sawtooth waveform is moved up or down when the potentiometer is adjusted, the
width of the curve above the threshold is wider or thinner. See Figure 32 and Figure 33.
Figure 32. A Sawtooth Waveform Shown Is Generated and Applied to a Level
Translator, Resulting in a PWM as Depicted in Figure 33
30
Page 31

MAX11300PMB1 Peripheral Module and Munich (USB2PMB1) Adapter Board Quick Start Guide
Figure 33. The Width of a PWM Is Adjusted by a Potentiometer
1. In the drop-down menu at the top right, select P4_DAC_0V>+10V and click the Get plot
box button. Another plot window opens for DAC on P4. Click on Read DAC File in the
newly opened P4_DAC window and open the analog data point
file ideal_sawtooth_right_1000_3x.adc.
2. Connect a potentiometer cable assembly to Port 4 (black jumper wire), Port 14 (red
jumper wire), and GND (black jumper wire). Connect Port 3 to Port 13 (yellow
jumper wire) as shown in Figure 34 and Figure 35.
31
Page 32

MAX11300PMB1 Peripheral Module and Munich (USB2PMB1) Adapter Board Quick Start Guide
Figure 34. A Potentiometer Is Connected to Ports 4, 14, and GND
32
Page 33

MAX11300PMB1 Peripheral Module and Munich (USB2PMB1) Adapter Board Quick Start Guide
Figure 35. A Potentiometer Is Connected to Ports 4, 14, and GND
3. In the drop-down menu on the top right, select P13_ADC_0V>+10V and click the
Get plot box button. Another plot window opens for ADC on P13. Observe PWM
signal in the ADC plot window. Adjust the pulse width by turning the
potentiometer to the low and high positions and observe the width of the PWM
waveform as shown in Figure 36 and Figure 37.
Note that the input of the level translator can handle up to 5V only. T he provided
configuration file is set to deliver a max of 5V in 0V to 10V mode. If other files are
used, be sure not to apply more than 5V at any digital inputs.
33
Page 34

MAX11300PMB1 Peripheral Module and Munich (USB2PMB1) Adapter Board Quick Start Guide
Figure 36. PWM Width as the Potentiometer Set to a Low Position (~20%)
34
Page 35

MAX11300PMB1 Peripheral Module and Munich (USB2PMB1) Adapter Board Quick Start Guide
Figure 37. PWM Width as the Potentiometer Set to a High Position (~80%)
7. References
For further detailed information, refer to the following documents available online:
• MAX11300 IC Data Sheet:
www.maximintegrated.com/datasheet/index.mvp/id/8175
• MAX11300PMB1 EV Kit Data Sheet:
www.maximintegrated.com/datasheet/index.mvp/id/8396
• MAX11300 EV Kit Dat a Sheet:
www.maximintegrated.com/MAX11300EVKIT
• MAX11300 EV Kit GUI:
www.maximintegrated.com/en/design/tools/applications/evkitsoftware/index.mvp?id=1171
• MAX11300 Configuration Software:
www.maximintegrated.com/en/design/tools/applications/evkitsoftware/index.mvp?id=1171
• USB2PMB1 Adapter Board (Munich) EV Kit Data Sheet:
www.maximintegrated.com/datasheet/index.mvp/id/8207
35
Page 36

MAX11300PMB1 Peripheral Module and Munich (USB2PMB1) Adapter Board Quick Start Guide
• USB2PMB1 (Munich) Adapter Board GUI :
www.maximintegrated.com/design/tools/applications/evkitsoftware/index.mvp?id=1161
8. Trademarks
PIXI is a trademark of Maxim Integrated Products, Inc.
Pmod is a trademark of Digilent Inc.
Windows is a registered trademark and registered service mark and Windows XP is a
registered trademark of Microsoft Corporation.
36
Page 37

MAX11300PMB1 Peripheral Module and Munich (USB2PMB1) Adapter Board Quick Start Guide
9. Revision Histor y
REVISION
NUMBER
REVISION
DATE
DESCRIPTION
0 7/14 Initial release —
PAGES
CHANGED
37
 Loading...