

Page 1

SystemTest™ 2
User’s Guide
Page 2

How to Contact The MathWorks
www.mathworks.
comp.soft-sys.matlab Newsgroup
www.mathworks.com/contact_TS.html Technical Support
suggest@mathworks.com Product enhancement suggestions
bugs@mathwo
doc@mathworks.com Documentation error reports
service@mathworks.com Order status, license renewals, passcodes
info@mathwo
com
rks.com
rks.com
Web
Bug reports
Sales, prici
ng, and general information
508-647-7000 (Phone)
508-647-7001 (Fax)
The MathWorks, Inc.
3 Apple Hill Drive
Natick, MA 01760-2098
For contact information about worldwide offices, see the MathWorks Web site.
SystemTest™ User’s Guid e
© COPYRIGHT 2006–20 10 by The MathWorks, Inc.
The software described in this document is furnished under a license agreement. The software may be used
or copied only under the terms of the license agreement. No part of this manual may be photocopied or
reproduced in any form without prior written consent from The MathW orks, Inc.
FEDERAL ACQUISITION: This provision applies to all acquisitions of the Program and Documentation
by, for, or through the federal government of the United States. By accepting delivery of the Program
or Documentation, the government hereby agrees that this software or documentation qualifies as
commercial computer software or commercial computer software documentation as such terms are used
or defined in FAR 12.212, DFARS Part 227.72, and DFARS 252.227-7014. Accordingly, the terms and
conditions of this Agreement and only those rights specified in this Agreement, shall pertain to and govern
theuse,modification,reproduction,release,performance,display,anddisclosureoftheProgramand
Documentation by the federal government (or other entity acquiring for or through the federal government)
and shall supersede any conflicting contractual terms or conditions. If this License fails to meet the
government’s needs or is inconsistent in any respect with federal procurement law, the government agrees
to return the Program and Docu mentation, unused, to The MathWorks, Inc.
Trademarks
MATLAB and Simulink are registered trademarks of The MathWorks, Inc. See
www.mathworks.com/trademarks for a list of additional trademarks. Other product or brand
names may be trademarks or registered trademarks of their respective holders.
Patents
The MathWorks products are protected by one or more U.S. patents. Please see
www.mathworks.com/patents for more information.
Page 3

Revision History
May 2006 Online only New for Version 1.0 (Release 2006a+)
September 2006 First printing Revised for Version 1.0.1 (Release 2006b)
March 2007 Online only Revised for Version 1.1 (Release 2007a)
September 2007 Second printing Revised for Version 2.0 (Release 2007b)
March 2008 Online only Revised for Version 2.1 (Release 2008a)
October 2008 Online only Revised for Version 2.2 (Release 2008b)
March 2009 Online only Revised for Version 2.3 (Release 2009a)
September 2009 O nline only Revised for Version 2.4 (Release 2009b)
March 2010 Online only Revised for Version 2.5 (Release 2010a)
Page 4

Page 5

Getting Started
1
Product Overview ................................. 1-2
Contents
Quick Tour of the SystemTest Software
Getting Familiar with the Desktop
General Desktop Features
Setting SystemTest Preferences
Viewing Test Results
Running Tests from the MATLAB Command Line
Example: Building a Test
Overview
Planning Your Test
Building Your Test
Running Your Test
Analyzing Your Test Results
........................................ 1-11
................................ 1-11
................................ 1-12
................................ 1-37
.......................... 1-5
...................... 1-7
.............................. 1-9
........................... 1-11
........................ 1-40
.............. 1-3
................... 1-3
Working with Test Vectors
2
Creating MATLAB Express io n Test Vectors .......... 2-2
.... 1-10
Creating Grouped Test Vectors
About Test Vectors and the MATLAB Workspace
Creating MA T-F ile Test Vectors
..................... 2-5
..................... 2-13
..... 2-12
v
Page 6

Creating Randomized Test Vectors with Probability
Distributions
Using Probability Distributions in Test Vectors
Creating a Test Vector with Probability Distributions
Viewing Data While Configuring the Test Vector
The Probability Distributions
Example: Creating Test Vectors with Probability
Distributions
.................................... 2-18
......... 2-18
........ 2-23
........................ 2-26
................................... 2-34
.... 2-18
Creating Spreadsh eet Data Test Vectors
Introduction
Creating a Spreadsheet Data Test Vector
Configuring the Spreadsheet Data Test Vector
Replacing Strings
Creating Simulink Design Verifier Data File Test
Vectors
Prerequisites
Automatically Creating a SystemTest Test Harness from
Simulink
Creating a Simul ink Design Verifier Data File Test
Vector
Important Usage Notes
Creating Signal Builder Block Test Vectors
Creating a Test Case Data Test Vector
Using a MATLAB Element to Access Test Case Data
Test Vector Information
...................................... 2-44
................................. 2-51
......................................... 2-53
..................................... 2-53
®
Design Verifier ........................ 2-53
......................................... 2-55
............................. 2-65
.......................... 2-76
............. 2-44
.............. 2-44
.......... 2-48
.......... 2-67
............... 2-73
vi Contents
Editing a Test Vector from within an Element
........ 2-77
Working with the Basic Elements
3
Working with the Sections of a Test ................. 3-2
Overview
........................................ 3-2
Page 7

Pre Test ......................................... 3-2
Main Test
Post Test
........................................ 3-3
........................................ 3-3
Basic Elements
Introduction
MATLAB Element
Limit Check Element — General Check
Limit Check Element — Tolerance Check
IF Element
General Plot Element
Vector Plot Element
Scalar Plot Element
Stop Element
Subsection Element
Deprecated Elements
Converting Elements
Scalar Plot Conversion Details
Vector Plo t Conversion Details
4
.................................... 3-5
...................................... 3-5
................................. 3-6
............... 3-7
.............. 3-11
....................................... 3-14
.............................. 3-15
............................... 3-20
............................... 3-23
..................................... 3-26
................................ 3-27
.............................. 3-29
.............................. 3-29
....................... 3-31
....................... 3-32
Using the Simulink Element
Before You Begin .................................. 4-3
Mapping Test Vectors and Test Variables to a Simulink
Model
Introduction
Adding a Simulink Element
Specifying the Simulink Model
Overriding Simulink Model Inputs
Mapping Simulink Model Outputs to Test Variables
Using the Model Output M appings Assistant
Editing a Test Vector or Test Variable from within the
Overriding Inport Block Signals
Introduction
.......................................... 4-5
...................................... 4-5
......................... 4-6
...................... 4-7
................... 4-7
........... 4-20
Element
....................................... 4-21
.................... 4-22
...................................... 4-22
..... 4-13
vii
Page 8

Overriding Inport Block Signals in a Simulink Element .. 4-23
Using the Inport Block Mappings Assistant
Example: Overriding Simulink Inport Blocks Using a
Spreadsheet Data Test Vector
Mapping Logged Signals from a Model to Inport Blocks
Editing a Test Vector or Test Variable from within the
Element
....................................... 4-37
..................... 4-28
............ 4-27
.. 4-36
Using Simulink Model Coverage
Using Simulink
Using Signal Builder Block Tes t Cases in a Test
Using Test Cases and Signals from the Test Case Editor
in a Simulink Element
®
Design Verifier Data Files in a Test .. 4-45
........................... 4-47
.................... 4-38
...... 4-46
Authoring Signals in the Test Case Editor
5
Introduction to the Test Case Editor ................ 5-2
Definitions
Workflow of Authoring and Using Signals
Creating a Test Case Data Test Vector
....................................... 5-2
........... 5-4
............... 5-6
viii Contents
Working in the Test Case Editor
Navigating in the Edit View and Test Case View
Creating Test Cases
Adding Signals to Test Cases
The Signal Types
Linking to Requirements in Telelogic
Introduction and Setup
Adding Requirements
Requirements Tab
............................... 5-13
.................................. 5-23
............................. 5-31
.............................. 5-31
................................. 5-34
.................... 5-9
........................ 5-18
®
DOORS ....... 5-31
........ 5-9
Page 9

Test Case Report .................................. 5-37
Using Test Cases and Signals in SystemTest Test
Elements
Introduction
Simulink Element
MATLAB Element
General Plot Element
....................................... 5-40
...................................... 5-40
................................. 5-40
................................. 5-41
.............................. 5-41
Using the Instrument Control Toolbox Elements
6
Introduction ...................................... 6-2
Instrument Control Toolbox Elements
Accessing Resources
............................... 6-2
................ 6-2
Example: Measuring a Generator’s F requency
Introduction
Setting Up the Signal Generator
Setting Up the Oscilloscope
Taking the Measurement
Saving Test Results
Running the Test and Viewing Test Results
...................................... 6-4
..................... 6-5
......................... 6-9
........................... 6-11
................................ 6-12
....... 6-4
............ 6-13
Using the Data Acquisition Toolbox Elements
7
Introduction ...................................... 7-2
Overview
Data Acquisition Toolbox Test Elements
Example: Testing a Voltage Regulator
Introduction
Sending Analog Stimulus Data to the DUT
Enabling the DUT with Digital Data
........................................ 7-2
............... 7-2
............... 7-3
...................................... 7-3
............ 7-4
.................. 7-7
ix
Page 10

Receiving Analog Response Data from the DUT ......... 7-9
Disabling the DUT with Digital Data
Performing Data Analysis
Defining Post Test Elements
Saving and Viewing Test Results
.......................... 7-12
........................ 7-13
................. 7-10
..................... 7-14
Using the Image Acquisition Toolbox Element
8
Introduction ...................................... 8-2
Example: Acquiring Video Data in a Test
Adding the Video Input Element to a Test
Saving and Viewing Test Results
Running the Test
.................................. 8-9
..................... 8-8
............ 8-3
............. 8-3
Distributing Tests Using Parallel Computing
Toolbox Integration
9
SystemTest Software and Parallel Computing Toolbox
Integration
Enabling Distributed Testing
Selecting a User Configuration
Setting Up File Dependencies
Setting Up Path Dependencies
..................................... 9-2
....................... 9-3
..................... 9-5
....................... 9-7
...................... 9-9
x Contents
Distributing Iterations Across Tasks
................ 9-12
Page 11

Running a Distributed Test ......................... 9-14
10
Example: Distributing a Test
....................... 9-17
Using the Test Results Viewer
Viewing Test Results ............................... 10-2
Before You Begin
A Quick Tour of the Test Results Viewer
Viewing Your Test Results
Reserved K ey w ords
Browsing Results
Generating Plots
Exploring Plots
Refining Your Test Results
Creating and Applying Constraints
Plotting Sin gle Iterations
.................................. 10-3
............. 10-6
.......................... 10-8
................................ 10-8
.................................. 10-8
.................................. 10-9
................................... 10-16
......................... 10-29
................... 10-29
........................... 10-36
Viewing Simulink Time Series Data
Overview
Creating a Time Series Plot
Saving and Reloading Test Results
Saving Test Results
Loading Test Results
........................................ 10-38
......................... 10-38
................................ 10-43
.............................. 10-44
................. 10-38
.................. 10-43
xi
Page 12

11
Accessing Test Results from the MATLAB
Command Line
Viewing Test Results at the C omm and Line .......... 11-2
Introduction
Accessing the Results Summary
Accessing the dataset Array
...................................... 11-2
..................... 11-2
......................... 11-5
12
A
Working with Test Results
Introduction
Managing Test Results Data in its Native Format
Managing Test Results as a Dataset Array
Plotting Results Data
Accessing Test Results While a Test Is Running
...................................... 11-8
.......................... 11-8
............. 11-9
.............................. 11-10
Function Reference
SystemTest Hot Keys
The dataset Array
....... 11-8
...... 11-15
xii Contents
B
Dataset Arrays .................................... B-2
Overview
Test Results Data
Looking at Data
Dataset Array Operations
........................................ B-2
................................. B-3
................................... B-3
.......................... B-5
Page 13

Index
xiii
Page 14

xiv Contents
Page 15

Getting Started
This se ction explains w hat the SystemTest™ software is and shows you how
to use it. It contains the following topics:
• “Product Overview” on page 1-2
• “Quick Tour of the SystemTest Software” on page 1-3
• “Running Tests f rom the MATLAB Command Line” on page 1-10
• “Example: Building a Test” on page 1-11
1
Page 16

1 Getting Started
Product Overview
The SystemTest software provides MATLAB®and Simulink®users with a
framework that integrates software, hardwa re, simulation, and other types
of testing in one environment. You use predefined elements to build test
sections that simplify the development and maintenance of standard test
routines. You can save and share tests throughout a development project to
ensure standard and repeatable test verification. The SystemTest sof twa r e
offers integrated data management and analysis capabilities for creating
and executing tests, and saving test results to facilitate continuous testing
across the development process.
The SystemTest software automates testing in MATLAB and Simulink
products. With the SystemTest software you get:
• Graphical test e diting — Quickly edit your test within a graphical test
• Repeatable test execution — All tests developed with the SystemTest
development environment.
software share the same execution flow, which provides a consistent test
framework among tests.
1-2
• Parameterized testing — Create test vectors over which your test iterates.
• Reusability — After you design a test, you can save it for later use b y you
or others.
• Maintainability — Because you design and execute tests from the
SystemTest desktop, you do not need to understand unfamiliar code or
concepts.
• Integration — The SystemTest software integrates with MATLAB,
Simulink, and other products based on MATLAB and Simulink.
Page 17

Quick Tour of the SystemTest Software
In this section...
“Getting Familiar with the Desktop” on page 1-3
“General Desktop Features” on page 1-5
“Setting SystemTest Preferences” on page 1-7
“Viewing Test Results” on page 1-9
Getting Familiar with the Desktop
The SystemTest desktop is an integrated deve lo pme nt environment that
lets you perform all of your testing activities from one centraliz ed location.
This section provides an overview of the SystemTest environment. For more
informationabouthowtousetheSystemTestsoftwaretobuildtestsandrun
them, see “Example: Building a Test” on p age 1-11.
To get familiar with the SystemTest environment, open the SystemTest
desktop from MAT LAB by selecting Start > MATLAB > SystemTest >
SystemTest Desktop or typing
systemtest at the M ATLAB command line.
Quick Tour of the SystemTest™ Software
1-3
Page 18

1 Getting Started
1-4
The desktop has a number of different panes that help you to build and run
your test.
• Test Browser — Shows the overall structure of a test. A test is made up of
Pre Test, Main Test, Save Results, and Post Test. Use the Test Browser to
add elements to your test. These elements determine what actions your
test performs.
• Test Vectors — Lets you define the parameters or test cases of your test.
The test vectors you define determine the number of iterations performed
by your test. Test vectors are automatically indexed during test execution.
Page 19

Quick Tour of the SystemTest™ Software
• Test Variables — Lets you define variables used in the scope of your test.
Variables can serve both input and output functions in your test. You can
define variables that are declared in the Pre Test section of your test or in
the Main T est section of your test.
• Properties — Shows the properties of the test or the element you are
editing. The contents of this pane change when you select a section or
element in your test.
• Elemen ts — If open, this undocked Elements pane allows you to add
elements to your test. If not open, you can add elements using the New
buttonintheTest Browser.
• Resources — Lists the instrument or other external device resources
associated with the current test. This is only used if you have a license for
the Instrument Control Toolbox™ software.
• Getting Started — Shows information to help you start using the
SystemTest software. If the Getting Started page is closed, select Help >
SystemTest Getting Started to open it.
• Desktop Help — Shows help about the element or aspect of the test that
is currently selected. For the full product Help, select Help > SystemTest
User’s Guide.
• Run Status — Shows a summary of the test’s execution status.
General Desktop Features
The SystemTest deskto p has a variety of features to make navigation easier.
Context Menus
Many areas of the user interface have context menus. For example, if you
right-click in the Test Vectors, Test Variables, Resources, Run Status,
Getting Started,orDesktop Help panes, you can access these context
menus.
If you have the Elements pane open, you can add elements to your test using
the context menus. If you right-click any element there, you can insert it
directly into Pre Test, Main Test, or Post Tes t using the Elements pane
context menus. If that section of the test already contains elements, the
inserted element will be placed below the currently selected element in that
1-5
Page 20

1 Getting Started
section. You can change the order of elements in the test by using the arrow
buttons in the Test Browser,orbydragginganddropping.
Hot Keys
The SystemTest software offers various keyboard shortcuts, or hot keys, to
access certain commands via the keyboard. For example, pressing F5 is an
alternative way to run a test, and pressing Ctrl+N creates a new untitled test.
See the full list of SystemTest hot keys in Appendix A, “SystemTest H ot Keys”.
Undo/Redo Support
Undo and redo support is available through the Edit menu or on the
SystemTest toolbar. This feature allowsyoutoundoactionsyouhavedone
throughout the desktop. The undo queue is global to the entire desktop. For
example, if you add a test vector and then perform an action in the Properties
pane, those two actions will be the last two items in the queue. The undo
order applies across all the panes in the desktop.
1-6
To use this feature, select the Edit > Undo action command, where action
is the last action you performed. Use the Undo command repeatedly to
undo multiple actions. The Edit > Redo action command will redo the last
undo you performed.
Most actions in the desktop are undoable. Some actions pertaining to the
elements that are part of the hardware toolboxes, Data Acquisition Toolbox™,
Instrument Control Toolbox, and Image Acquisition Toolbox™, cannot be
undone since they involve connections to hardware.
Thefollowingactionswillclearthelistofactionsintheundoqueue:
• Closing a test
• Opening a test
• Creating a new test
• Refreshing a Simulink model in the Simulink element
Page 21

Quick Tour of the SystemTest™ Software
Setting SystemTest Preferences
You can set SystemTest preferences by selecting File > Preferences on
the SystemTest desktop. This opens the MATLAB Preferences dialog box.
Click SystemTest in the left tree if SystemTest Preferences are not showing
in the right pane.
Most Recently Used Test List
This option determines how many tests will appear on the SystemTest File
menu’s most recent files list. The default is 4 tests. If you change it to 0, no
recent tests will appear on the list. The maximum number is 9.
1-7
Page 22

1 Getting Started
Test Run Options
Select Minimize SystemTest when starting a test if you want the
SystemTest desktop to minimize when a test starts running. This check box
is cleared by default.
Select Save test before running if you want the SystemTest software to
save your test before it runs. If this option is selected and you run a test
thatisnotyetsaved,youwillbepromptedtonameandsavethetest. This
check box is selected by default.
Note You can save a test any time, before or after running it, by selecting
File > Save.
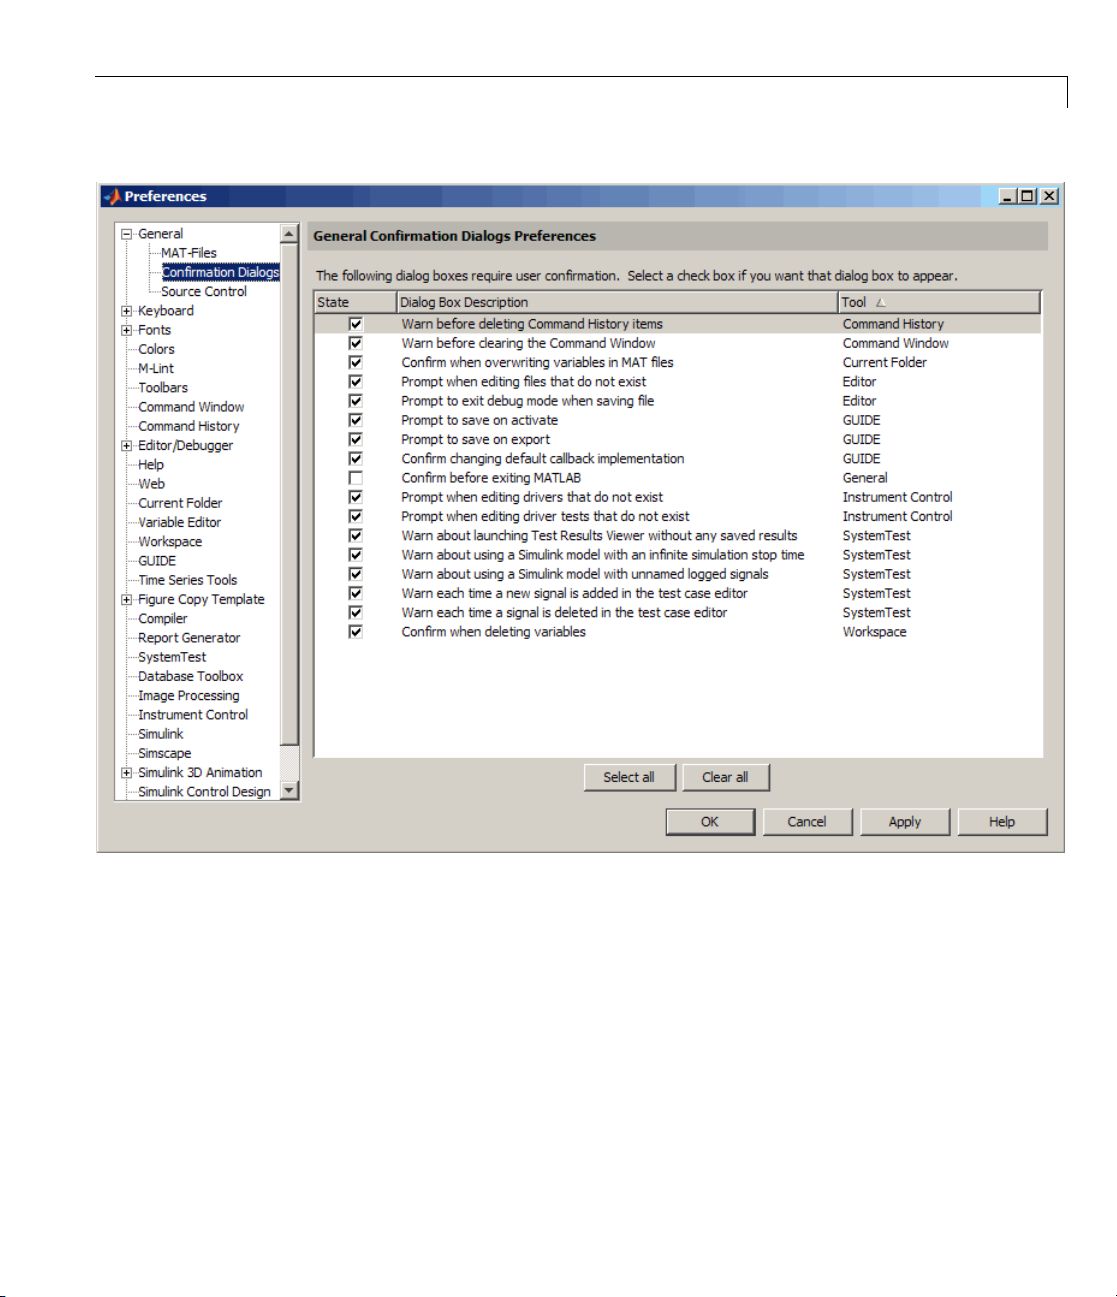
Confirmation Dialog Boxes
You can also turn off confirmation dialog boxes used in the SystemTest
software in a diffe rent area of the P re fere nces dialog box by selecting General
> Confirmation Dialogs. Three SystemTest confirmation dialog boxes are
listed there, as shown in the figure that follows.
1-8
• Warn about launching Test Results Viewer without any saved
results — Occurs if you attempt to open the Test Results Viewer when the
latest test that ran does not contain any mapped results under Saved
Results.Tosaveresults,clickSaved Results in the Test Browser.
• Warn about using a Simulink model with an infinite simulation
stop time — Occurs if you attempt to run a test containing a Simulink
element that uses a model with an infinite simulation stop time.
• Warn about using a Simulink model with unnamed logged signals
— Occurs if you have a model that has logging enabled but has logged
signals with no name, and you use that model in a Simulink element in the
SystemTest software.
• Warn each time a new signal is added in the test case editor —
Occurs if you add a signal in the Test Case Editor.
• Warn each time a signal is deleted in the test case editor — Occurs if
you delete a signal in the Test Case Editor.
Page 23
Quick Tour of the SystemTest™ Software
Viewing Test Results
The SystemTest software allows you to view the results you have chosen to
save for your test using a workspace variable called
access to the test results object, which is useful for comparing the results of
separate test runs and for postprocessing test results.
For more information, see Chapter 11, “Accessing Test Results from the
MATLAB Command Line”.
stresults.Itprovides
1-9
Page 24

1 Getting Started
Running Tests from the MATLAB Command Line
You can run one or more SystemTest tests from the MATLAB command line,
using the
batch or calling a test file as part of a MATLAB file .
Note If you use this feature, it is a good idea to first run the test from the
SystemTest desktop to verify that elements are not in an error state, and that
the test will run successfully, before running it via the MATLAB command
line using the
The function takes the name of your test file as a string. The test file must be
on the MATLAB path, or you can specify the full path in the string.
strun function. This is useful for running multiple test files as a
strun function.
For example, to run a test called
this syntax:
strun('mytest')
To run a test called mytest that is not on the MATLAB path, but is in a local
directory called
strun('c:\work\mytest.test')
To run multiple tests, use a cell array of strings, as follows:
strun({'mytest' 'mytest2'})
Note MATLAB will remain busy while tests are executing via the strun
command. Control is returned to the MATLAB command line once all tests
execute.
For more information about using strun, see the f unction page.
c:\work, use this syntax:
mytest that is on the MATLAB path, use
1-10
Page 25
Example: Building a Test
In this section...
“Overview” on page 1-11
“Planning Your Test” on page 1-11
“Building Your Test” on page 1-12
“Running Your Test” on page 1-37
“Analyzing Your Test Results” on page 1-40
Overview
This simple example illustrates the four primary stages of testing: planning,
building, running the test, and viewing test results.
The example uses a simple MATL AB expression to emulate a scalar
measurement during each iteration of the test. The example uses an arbitrary
formula d ependent on the test vector named
The example tests each measurement to determine if it falls within certain
specified limits. If a measurement exceeds these limits, that particular
iteration of the test fails. By default, the t est fails if any iteration fails, but
you can configure other pass/fail criteria.
Example: Bui lding a Test
signal to generate the Y data.
Thefollowingsectionsprovidemoreinformation about each stage, building
the example test along the way. If you prefer, instead of working through the
following sections to b uild the example, you can load it into the SystemTest
software by running the Getting Started with SystemTest demo from the
Demos page in the MATLAB H elp browser (under MATLAB > SystemTest
> MATLAB)orbyentering
command prompt.
systemtest Simple_Demo at the MATLAB
Planning Your Test
In this first stage, you must identify what it is you want to test. The
SystemTest so ftware lets you specify input data, such as measurements from
a model or device, and compare this input data to some predefined limits.
Based on this comparison, the SystemTest software can declare whether
a test passes or fails.
1-11
Page 26

1 Getting Started
Keep the following in mind as you plan tests:
• Identify your test data and test vectors.
• Specify test limits and determine if these limits can be expressed as scalar
or matrix values. (The Limit Check element supports both scalar and
matrix data.)
• Determinewhatoperationsyourtestmustperform. Mustcertain
operations happen before others?
• Determine pass/fail criteria for your test.
• Decidewhichtestvariablesyouwanttosaveastestresults.
After this planning, you can begin to construct your test, which is described in
“Building Your Test” on page 1-12.
Building Your Test
The SystemTest interface provides a graphical integrated environment that
you can use to create and edit tests. Tests consist of elements, test v ectors,
and test variables. You can use each of theseentitiestocreateavariety
of test scenarios ranging from a simple test that runs a series of elements
once to a full parameter sweep that iterates over the values of test vectors
that you define.
1-12
The following sections show how to construct a test:
• “Starting the SystemTest Software” on page 1-13
• “Structuring Your Test” on page 1-13
• “How Test Vectors and Test Variables Relate to the MATLAB Workspace”
on page 1-15
• “Creating a Test Vector” on page 1-15
• “Defining Test Variables” on page 1-18
• “Adding Elements” on page 1-20
• “Defining Pass/Fail Criteria” on page 1-30
• “SavingTestResults”onpage1-31
Page 27

Example: Bui lding a Test
• “Generating a Test Report” on page 1-34
• “Saving Your Test” on page 1-36
Starting the SystemTest Software
Start by opening the SystemTest desktop using the MATLAB Start button.
To open the SystemTest software, select Start > MATLAB > SystemTest >
SystemTest Desktop.
Alternatively, you can execute the
command line.
The SystemTest software displays the desktop on your screen. See “Quick
Tour of the SystemTest Software” on page 1-3 for an overview.
systemtest command from the MATLAB
Structuring Your Test
The SystemTest software divides tests into three sections.
• Pre Test — This sectio n is used to execute test elements in order to
perform any test set-up operations, such as initializing variables, loading
data from a file, and initializing system resources. Using Pre Test
variables, you can assign an initial value to a test variable that persists
between M ain Test section iterations (unless another element in Main Test
modifies the value). Pre Test is not mandatory, but it can be used if your
test requires set-up operations to be performed.
• Main Test —MainTestdefinesthetestelementsthatneedtobe
performed across the parameter space d efined by your test vectors. In this
section Main Test variables are initialized before each Main Test iteration,
which lets you assign an initial value to a test variable each time the Main
Test runs. This is u sefu l if your test variable has a derived valu e such as
being indexed by a test vector or is the result of a MATLAB expression.
The number of iterations performed in the Main Test is indicated in the
Test Browser in parentheses after Main Test. Iterations specifies the
number of times the Main Test section will be run. This is determined from
the test vectors you define. The SystemTest desktop also offers a Save
Results area for you to specify which test variables you want to save as
test results at the end of each Main Test iteration.
1-13
Page 28

1 Getting Started
• Post Test — In this section you can perform any cleanup work necessary
at the completion of the Main Test section, such as clearing workspace
variables, closing a file, or freeing system resources.
For details about the sections of the test, see “Working with the Sections
of a Test” on page 3-2.
The following figure illustrates the structure of a test.
1-14
Page 29

Example: Bui lding a Test
How Test Vectors and Test Variables Relate to the MATLAB
Workspace
The SystemTest software has its own internal workspace that it uses to
manage test variables and test vectors independently. However it does
leverage the MATLAB workspace during test execution, and when using
a MATLAB element.
During test execution, SystemTest test variables and test vectors are
evaluated in the MATLAB base workspace. Then at the end of test execution,
they are cleared out and the MATLAB base workspace is restored to what it
was before the test execution.
When using a MATLAB element in the SystemTest software, you can
reference a variable in the base workspace without having to create a test
vector or test variable in the SystemTest software. However the SystemTest
software will not be aware of this data, so you could not make use of it in any
other element type or in saved results. You can only access it from a MATLAB
element. If you need to use it in other elements, you can create test variables
or test vectors in the SystemTest software.
Creating a Test Vector
Test ve cto rs are composed of values derived from a MATLAB expression. You
can use any MATLAB expression that evaluates to a 1-by-n matrix or cell
array to define your test vector. Using test vectors, you can iterate through
a range of values to see how a system performs. Test vectors constitute
parameterized testing in the SystemTest software. They are the test cases
foryourtest.
For tests with multiple test vectors, the product of the lengths of the test
vectors defines the number of iterations the test performs. For example , if you
define the test vector
10 for the first run, 20 for the second, and 30 for the final run. If you add a
second test vector w ith three other values, the total number of test runs would
be nine. The SystemTest software iterates through each vector in combination
with the other vector as though the test were a group of nested FOR loops—the
outermost loop being the first test vector in your table and the innermost loop
being the last test vector. The Main Test sectionintheTest Browser shows
the total number of test iterations defined by your test v ectors .
[102030], the test runs three times, using a value of
1-15
Page 30

1 Getting Started
For the example, use the vector [pi/15:pi/15:4*pi] which defines 60 values
for our test vector ranging from
pi/15 to 4*pi in pi/15 increments. To specify
this test vector:
1 Click the New Vector button in the Test Vectors pane.
The Insert Test Vector dialog box opens.
1-16
2 Keep t
3 Assign a value to the test vector by clicking the Expression field. Enter
he default test vector type of M ATL AB Expression. Assign a name
test vector by clicking the Name field. For this example, name the
to the
ector
test v
signal.
the test vector specified above for the pi values. Click OK.
Page 31

Example: Bui lding a Test
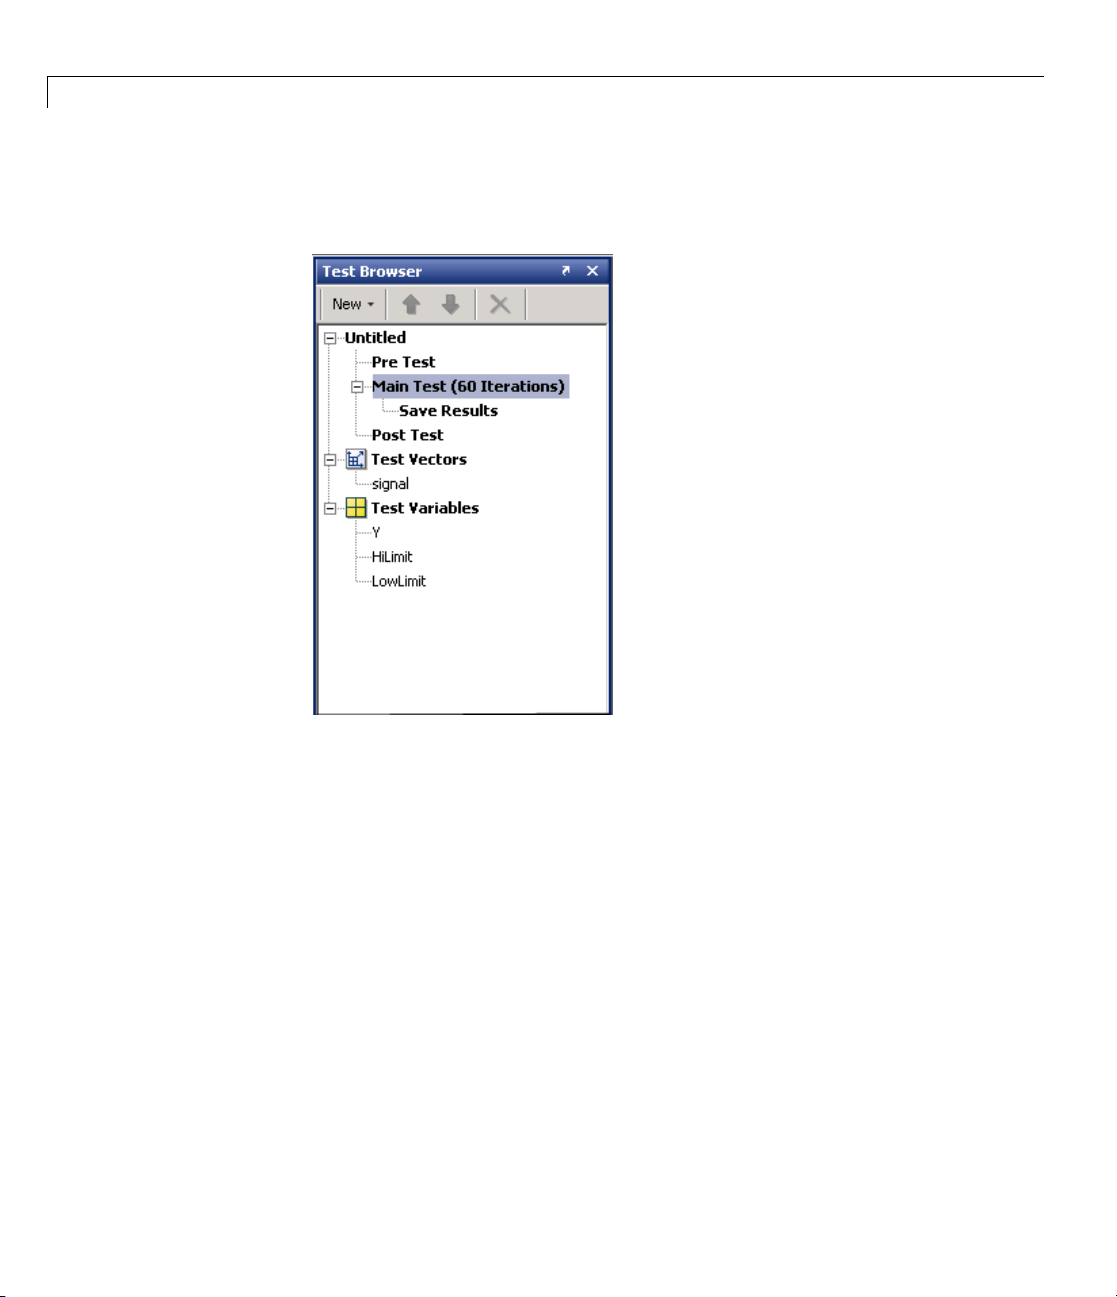
After you create the test vector, in the Test Browser pane, the Main Test
section label updates to include the number of iterations defined by the test
vector. It should say
Main Test (60 Iterations).
1-17
Page 32

1 Getting Started
Note Grouping test vectors determines how they will be iterated through
when the test runs. For information on grouping vectors, see “Creating
Grouped Test V ectors” on page 2-5.
Note You can also use probability distributions when you create a test vector.
For information, see “Creating Randomized Test Vectors with Probability
Distributions” on page 2-18.
Defining Test Variables
The SystemTest software u ses test variables to define temporary storage
variables that a test acts on or generates. You assign test variables in the Pre
Test or Main Test sections of your test.
You can define Pre Test variables or Main Test variables. Using Pre Test
variables, you can assign an initial value to a test variable that persists
between Main Test section ite rations (unless another element in M ain Test
modifies the value). Pre Test is not m an d atory, bu t it c a n be used if your test
requires set-up operations to be performed.
1-18
Main Test defines the test elements that need to be performed across the
parameter space defined by your test vectors. Main Test variables are
initialized before each Main Test iteration, which allows you to assign an
initial value to a test variable each time the Main Test runs. This is useful if
your test variable has a derived value such as being indexed by a te st vector
or is the resu l t of a MATLAB expression. You add elements in this section.
The example test requires three test variables:
•
Y — Contains a value that will be calculated from the signal test vector
at each iteration.
•
HiLimit — Contains the upper limit for Y that you do not want the signal
to exceed.
•
LowLimit — Contains the lower limit for Y that you do not want the signal
to go below.
Page 33

Example: Bui lding a Test
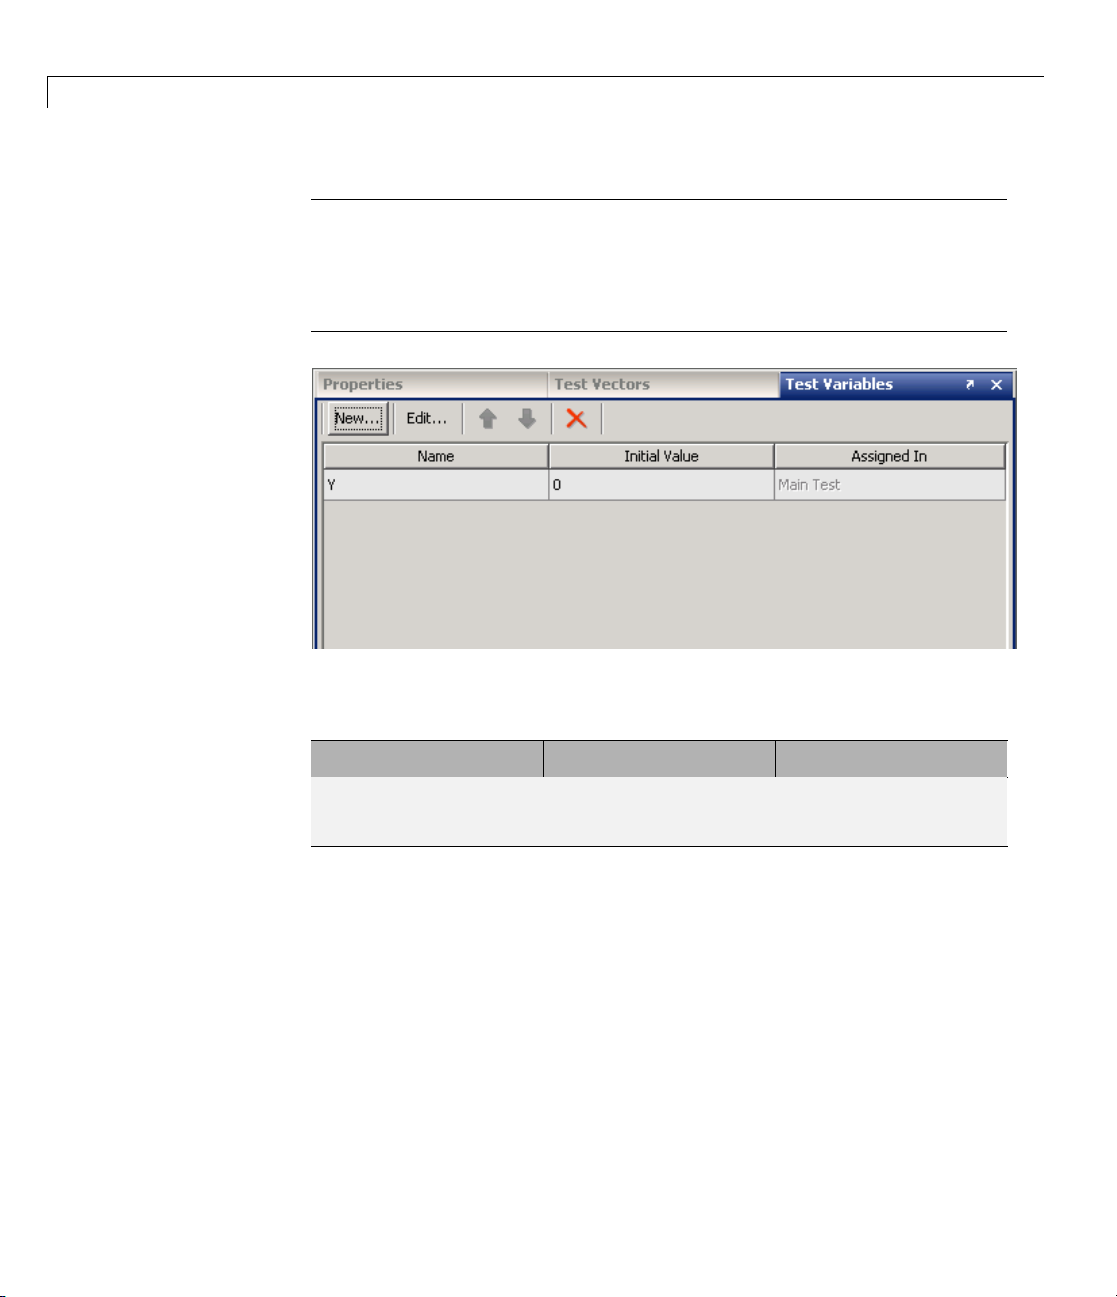
To create thes e test variables:
1 Click the Test Variables tab in the middle pane of the SystemTest desktop.
2 Click the New button to create a Pre Test or Main Test variable. The
Insert Test Variable dialog box opens. Leave the default value o f
in the Assigned in field, to create a new Main Test variable.
Test
Main
3 Assign a name to the test variable by clicking the Name field and entering
the test variable name. For this example, enter
4 Set the test variable’s initial value by clicking the Initial Value field and
entering a value. For the example test variable
Y.
Y,enter0.ClickOK.
Note If you do not provide an initial value, it will default to empty, that
is,
Var1 = []; in MATLAB code.
1-19
Page 34
1 Getting Started
Note Test variables are re-initialized at the start of each test iteration.
The Initial value field is blank by default when you create a test variable.
If you leave it blank, it will initialize to
(which can be any valid MATLAB expression), that value gets assigned in
every iteration.
[]. If you enter an initial value
1-20
5 Repeat st
setting
Variable Name Initial Value
HiLimit 1
LowLimit -1
Addin
Elements are the actions that a test performs. The SystemTest software
includes the following set of elements, listed in alphabetical order.
• General Plot — Used to plot any type of data over multiple iterations.
• IF — Implements a logic control operator.
• Limit Check — Specifies the comparison to be performed of the value(s)
under test and their e xpected value(s), or limit(s).
• MATLAB — Executes any MATLAB s tatements.
eps 2 to 4 to create the remaining two test variables, using the
s listed in the following table:
Assign in
Main Test
Main Te
st
gElements
Page 35

Example: Bui lding a Test
• Simulink — Runs a Simulink model. Note that you need to have a license
for Simulink to use this element.
• Stop — Implements a logic control operator.
• Subsection — Creates a new section in a test that you can use to group
elements within.
Note Some MathWorks products, such as the Image Acquisition Toolbox™
software, the Data Acquisition Toolbox™ software, and the Instrument
Control Toolbox™ software, provide their own elements that integrate those
products’ capabilities within the SystemTest software. If you have licenses for
those pro ducts, those elements will also appear in the elements list.
For more information about using the basic elements, see Chapter 3, “Working
with the Basic Elements”.
You add elements to a section in your test; however, not all elements can be
added to all sections. For example, you can use a MATLAB element anywhere
within a tes t, but you can o nly use the Limit Check element in the Main
Test section.
To illustrate using elements, let’s continue with this example. This test uses
three elements in the Main Test section.
Element
Description
MATLAB Use a MATLAB expression to assign data to Y that is
dependent on the test vector
signal.
Limit Check Compare the value generated in the MATLAB element to
the specified limit and see if the Y test variable exceeds
General Plo t
the upper or lower limit you defined in your
LowLimit test variables.
Plot the current test variable values and see whether the
HiLimit and
test variable exceeds the upper and lower limits.
To add these eleme n ts :
1-21
Page 36
1 Getting Started
1 Select the section of the test in which you want to add the element. For this
example, click Main Test in the Test Browser.
1-22
2 Specify the element you want to add to the test section. For this example,
click the New > Test Element button and select MATLAB.AMATLAB
element appears in the M ain Test section of your test and the MATLAB
element property page opens in the Properties pane of the SystemTest
desktop.
Page 37
Example: Bui lding a Test
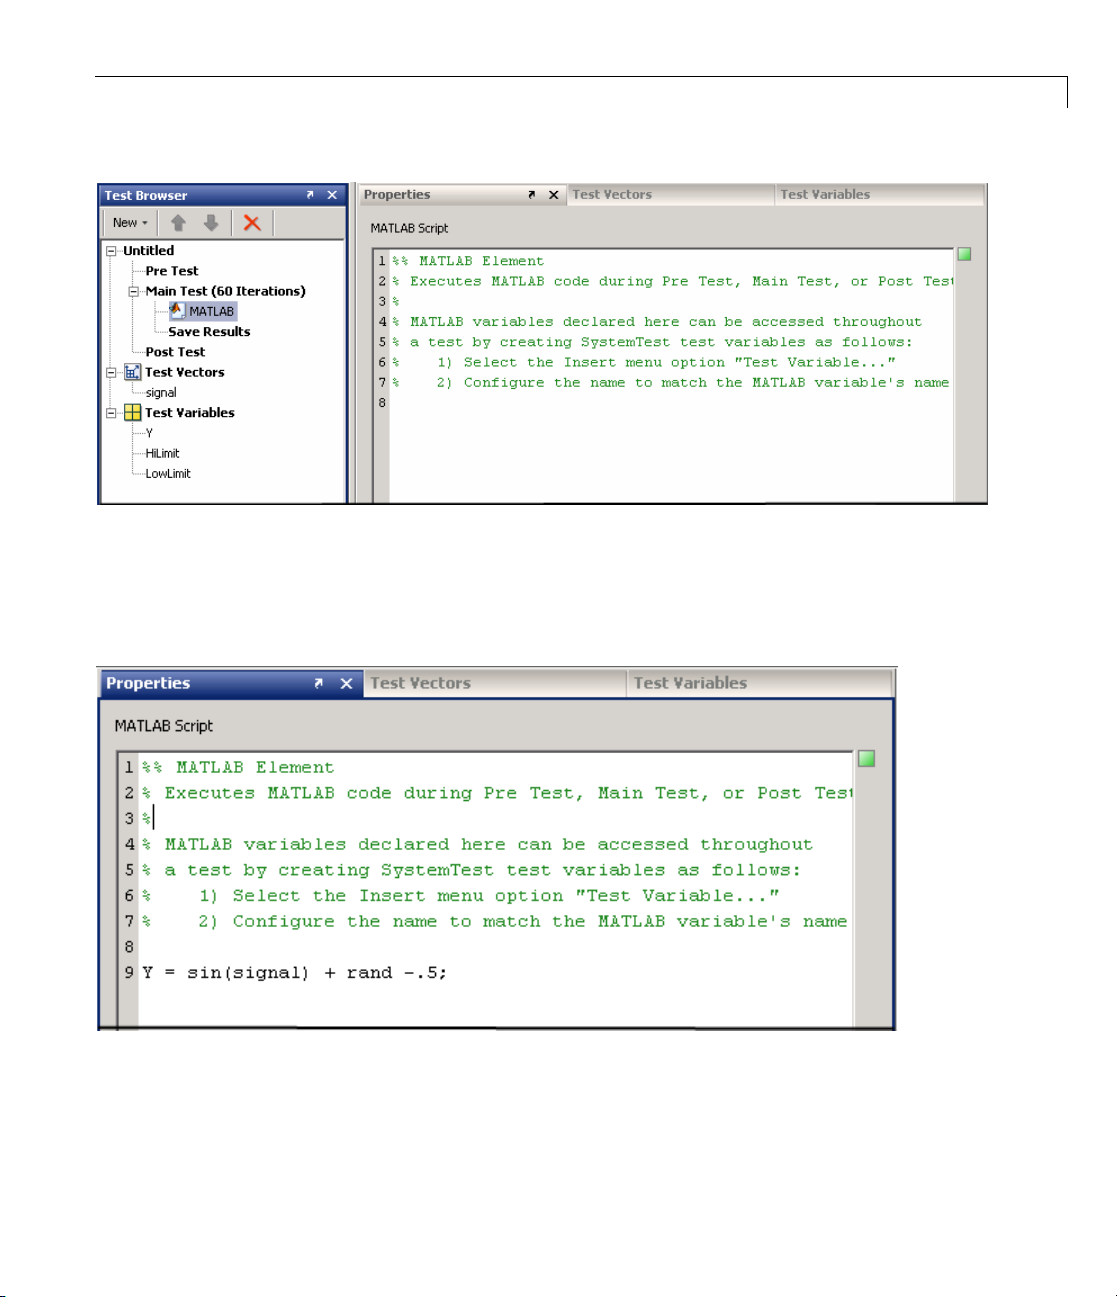
3 In the Properties pane, type the following code in the MATLAB Script
edit box. This MATLAB code calculates a value for
on the test vector
Y = sin(signal)+ rand -.5 ;
signal.
Y that is dependent
During each iteration, the SystemTest software evaluates the MATLAB
expression and assign s a value to
Y.
1-23
Page 38

1 Getting Started
4 Add the Limit Check element to the Main Test section of the test. With
the MATLAB element selected, click the New > Test Element button,
and click Limit Check. A Limit Check element appears in the Main
Test section of the test and the Limit Check properties page opens in the
Properties pane. For this example, the Limit Check element must follow
the MATLAB element in the test.
Note You can reposition an element in a test by selecting the element and
then clicking the up and down arrows in the Test Browser toolbar. Y ou
can also drag and drop elements within Main Test. You cannot move
elements between test sections.
1-24
Page 39

Example: Bui lding a Test
In the General Check tab, click the New button to add a limit check.
Notice that the Limit Check element icon in the Test Browser shows
a red x, which indicates that inform a t ion is missing. The corresponding
red outlining in the Properties pane highlights any fields that require
configuration. A test cannot run unless everything is properly configured.
1-25
Page 40

1 Getting Started
5 Specify the limit comparison operations in the Limit Check element.
a In the Test Variable column, click the drop-down list and select a test
variable you created in step 4. For this example, select
b In the Operator column, click the drop-down list and select the
Y.
comparison you want to perform. For this example, pick the
less-than-or-equal-to operator,
c In the Limit column, click the drop-down list and select the test variable
you w ant to compare to. For this example, select
<=.
HiLimit,whichisthe
test variable you created earlier.
The following figure shows the configuration of this limit.
1-26
6 To add another limit comparison operation, click the New button again in
the General Check Properties pane. A new row appears below the last
limit you specified. In this new row, set Test Variable to
to
>=,andsetLimit to LowLimit.
Y,setOperator
Page 41

Example: Bui lding a Test
The following figure shows the configuration of this second limit.
For e ach iteration of the Main Test, the MATLAB element’s expression is
evaluated and a new value assigned to
runs, it determines whether the value of
LowLimit values. If Y is outside this range, the test iteration fails. The
Y. When the Limit Check element
Y falls between the HiLimit and
default pass/fail criteria for the overall test passes the test only if both
expressions in the limit check evaluate to true.
7 To view the test variables as the test runs, plot the data. To add a Plot
element to the test, click the New > Test Element button, and select
General Plot. A General Plot element appears in the Main Test section,
and the properties page for the element opens in the Properties pane.
1-27
Page 42

1 Getting Started
1-28
With each Main Test iteration of the test, the General Plot element updates
a figure window with data you selected.
8 Click the Add Plot button, and choose plot fromthelisttocreatealine
plot.
9 We will
create
set up three axes. For the first axes, use the one automatically
d. Configure it as follows:
Click the arrow in YDataSourceand select
Keep t
of sol
he default Line color of blue, and keep the default Line style
id.
Y.
Change Line marker to point (the first selectio n in t he list that shows
one dot).
On the Options tab, select Keep any existing data on the figure.
10 Add t
11 Configure the second and third axes to match the following table, and using
he second and third axes by clicking the Add Plot button again twice
choosing plot fromthelisttocreatealineplot.
and
<Iteration Number> as the XDataSourcefor each one and selecting
Page 43

Example: Bui lding a Test
the Keepanyexistingdataonthefigureoption for each one. The
configured element looks like the figure following the table.
YDataSorce
Y
HiLimit
LowLimit
Line Color Line Style Li ne Marker
Blue
Solid
Point
Red Dashed No Marker
Black Dashed No Marker
1-29
Page 44

1 Getting Started
To see the resulting plot, see “Tracking Output” on page 1-37.
Defining Pass/Fail Criteria
You can define whether your test passes or fails by monitoring the outcome of
any or all Limit Check elements during any or all Main Test iterations. Your
test’s threshold of success can range from the passing of any Limit Check in
any single test iteration to the passing of all Limit Check elements in all test
iterations. If your test contains no Limit Check elements, there is no notion
of pass/fail and no pass/fail information is displayed. (Testing of this type
is useful for experimenting with a system or to e xplore its behavior rather
than validate its performance.)
You can set any of the following conditions to define when your test passes:
• All Limit Check eleme nts pass in a ll test iterations.
• All Limit Check elements pass in any test iteration.
• Any Limit Check element passes in all test iterations.
1-30
• Any Limit Check element passes in any test iteration.
You can configure this behavior within the test’s Properties pane. Click the
test name in the Test Browser (named Untitled by default) to open the
test’s properties and look for the section labe led This Test Passes If.
Using the signal test example that you constructed in this section, set the test
to pass if all Limit Check elements pass in all test iterations.
Page 45

Example: Bui lding a Test
Saving Te
You can save the results from the iterations of your test in a MAT-file. You
must explicitly specify which test variables to save as test results.
Note Test variables that are not s aved as a test result will be lost at the end
of the test execution.
The SystemTest software lets you save results at the end of each iteration.
Before running your test, select the Save Results section in your test and
specify w hich test variables to save as test results. Click the New Mapping
button and then select from the drop-down list the name of the test variable
to map to a result. You can optionally specify a name for the results that you
want to save. By default, the name of the saved result is the same as the
test variable. The following figure shows the mapping of test variables to
test results.
st Results
1-31
Page 46

1 Getting Started
After specifying which test variables to save as test results, specify the name
of the MAT-file to use. Using this MAT-file you can reload the test results
into the base workspace. By default for a test that is untitled, the SystemTest
software names the file
folderastheTEST-File. TochangethenameorlocationoftheMAT-file,
click the test name in the Test Browser,thenclicktheOutput Files tab in
the Properties pan e .
Untitled_results.mat and puts the file in the same
1-32
Use the Select File Names sectiontonametheresultsfile.UsetheOutput
Folder Numbering section to select overwrite behavior. By default, each
time you run the test you overwrite this file unless you select the Create new
folder for each run option. I f you sele ct that option, a ne w folder is created
for each run and a new results file is created and put inside the folder. In this
case, the
test run. For example, if the folder name is
create
MyResults\Outputs(1),followedbyMyResults\Outputs(2),etc.
Outputs subfolder name is appended by successive numbers for each
MyResults, the first test run will
MyResults\Outputs and the next test run results folder will be called
Page 47

Example: Bui lding a Test
Use the Select Output Folder sectiontodesignatethelocationtosavethe
results file, as follows:
• Same folder as TEST-file – This default setting saves any output files to
the same location as the TEST-F ile. In this case your test and any output
files it generates will be in the same location. You set this location when
you select File > Save to save your test, or if prompted to save when you
close the SystemTest software.
• Same folder as the MATLAB current folder (PWD) – Save any output
files to the current working directory in MATLAB. You can see the current
working directory when you open SystemTest from MATLAB.
• Browse – Select the third option and then click the Browse button to
choose an absolute directory location for the output files. This location
should be stable and not read-only.
1-33
Page 48

1 Getting Started
Note that the location you select here is also where the Test Report will be
saved if you generate one by selecting the Generate report check box.
Note If a file or folder location is read-only, you will get an error when the
test runs. For results files and Test Reports to be generated, the files and
folder locations must be writable.
Generating a Test Report
When you run your test, the test status appears in the Run Status pane.
This display contains basic information about your test:
• Time elapsed since your test started running.
• Which section your test is in.
• How many test iterations have passed or failed as defined by any limit
checks.
1-34
• Whether your test completed successfully.
• Any errors that cause your test to stop.
You can generate an d save mo re detail about the running test by enabling the
Test R eport, which is a test execution log file in HTML format. This report is
useful when you use limit checks in your test and you want to see specific test
iterations that passed or failed. For example, instead of just finding that a
test iteration failed, the report helps you determine how far a test variable
varied from the upper or lower limit you defined in a Limit Check element.
It also displays any plots that were generated. This report is also useful for
documenting and sharing your test results.
Page 49

Example: Bui lding a Test
To enable the Test Report:
1 SelectthetestnameintheTest Browser,thenclicktheOutput Files
tab on the Properties pane.
2 In the Select File Names section, select the Generate report check box.
3 Use the default name or type a new name in the edit field next to the check
box.
4 Use the Select Output Folder sectiontodesignatethelocationtosave
the Test Report:
• Same folder as TEST-file – This default setting saves any output
filestothesamelocationastheTEST-File. Inthiscaseyourtestand
any output files it generates will be in the same location. You set this
location wh en you select File > Save to save your test, or if prompted to
save when you close the SystemTest software.
• Same folder as the M ATL AB current folder (PWD) –Saveany
output files to the current working directory in MATLAB. You can see the
current working directory when youopenSystemTestfromMATLAB.
• Browse – Select the third option a nd then click the Browse button to
choose an absolute directory location for the output files. This location
should be stable and not read-only.
The Test Report is stored in an
Outputs subfolder in this folder, along with
all dependent files, such as plot or Simulink model snapshots. The overwrite
options y ou set for your test results MAT-file also apply to the file name and
folder of your report file. To learn how to change these options, see “Saving
Test Results” on page 1-31 .
Note that the locati o n you select here is also where the test results will be
saved.
Note If a file or folder location is read-only, you will get an error when the
test runs. For results files and Test Reports to be generated, the files and
folder locations must be writable.
1-35
Page 50

1 Getting Started
The Test Report contains the following information about the test run,
organized by iteration in the report:
• The test description, if you entered one in the Description field of the
Properties pane of the test.
• A test summary, including start and stop times, number of iterations
completed, number of iterations that passed and failed, and final status
of the test.
• Pass/fail results of Limit Check elements, by iteration.
• Values for any saved results you captured by setting up mappings in Saved
Results,byiteration.
• Test vector values, by i te ration.
• A snapshot of your model if you use a Simulink element in the test.
• AsnapshotofyourplotifyouuseaVector Plot, Scalar Plot, or General Plot
element in y our test, by iteration.
• A summary of generated files, with links to them. These can include a
Simulink model coverage report and test results.
1-36
Note Because the Test Report generates while the test is running, this
option results in the test taking longer to execute.
To see what information the report generates, see “Viewing the Test Report”
on page 1-40 .
Saving Your Test
You can save tests so that you can reu se them later. For example, to save
the signal test:
1 Select File > Save As to open the Save file as dialog box.
2 Select a directory location and enter mySavedTest in the File name field.
3 Click Save.
Page 51
Example: Bui lding a Test
The SystemTest software saves the test as mySavedTest.test and renames
your test as it appears in the Test Browser. This does not rename the test
results MAT-file or the Test Report file. Their names are controlled separately
from the name of the test, as explained in “Saving T est Results” on page 1-31.
Running Your Test
After you build a test, you are ready to run it. At run time, the SystemTest
softwareassignsvaluestotestvectors and test variables in the order they
appear in the Test Vectors and Test Variables panes. Each test section
runs elements in the order that they appear in the Test Browser.
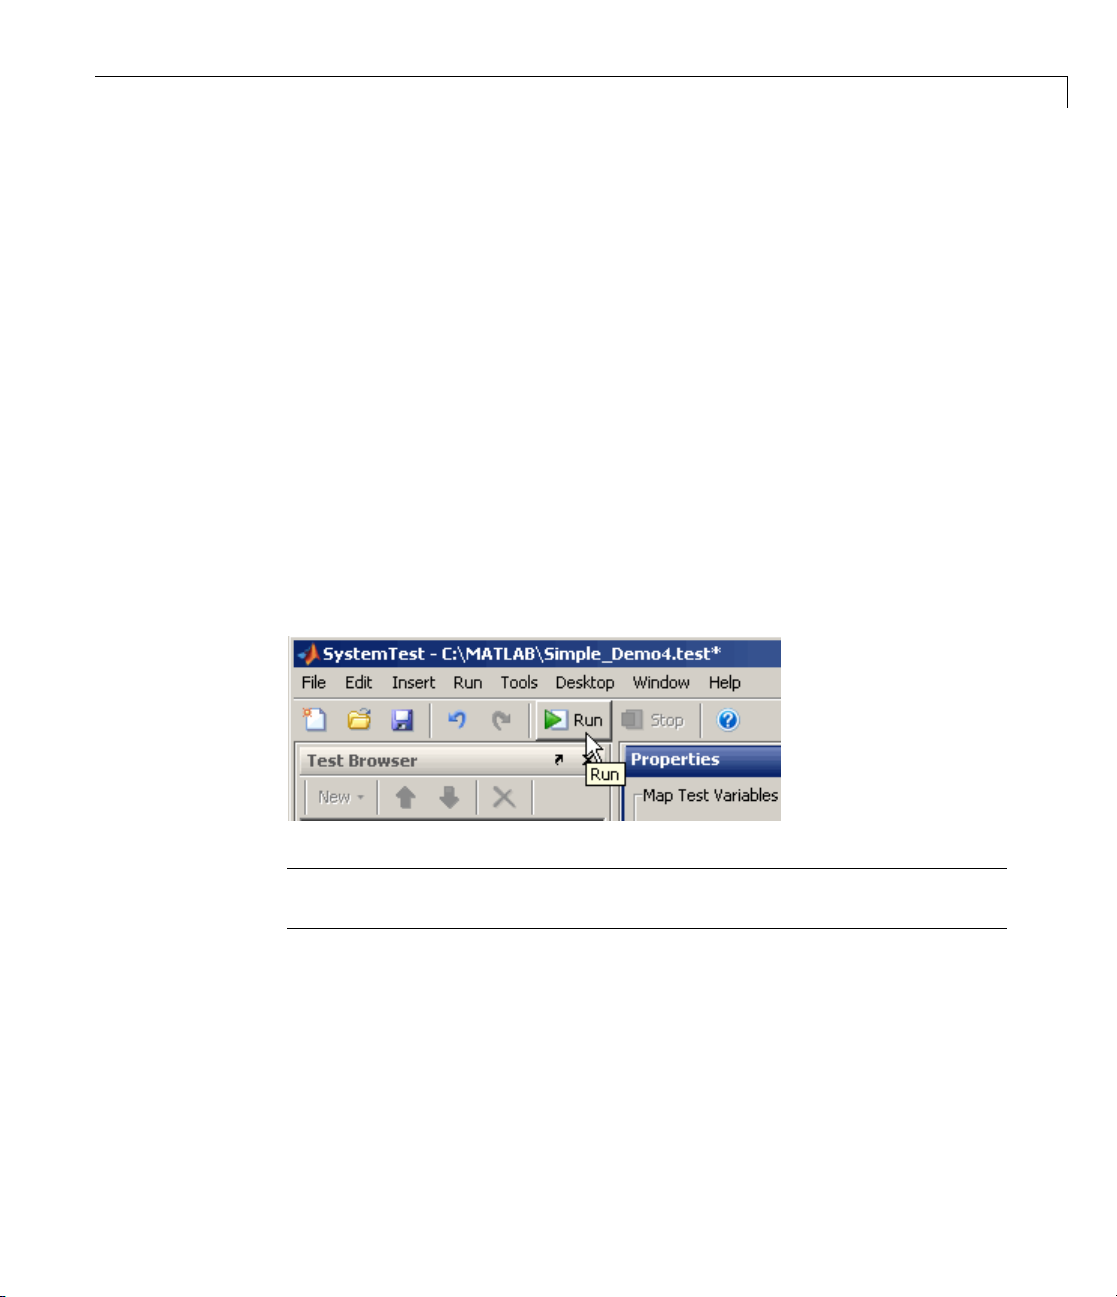
To execute your test, do one of the following:
• Click the Run button.
• Select Run > Run.
• Press the F5 key.
Note While a test is running, you can stop its execution by pressing Ctrl+C
or clicking the Stop button on the toolbar.
Tracking Output
While the test runs, the Run Status pane shows summary test output,
including start and stop times, number of iterations completed, number of
iterations that passed and failed, and final status of the test. It will also
display any error messages if the test has an error.
1-37
Page 52

1 Getting Started
1-38
Page 53
Example: Bui lding a Test
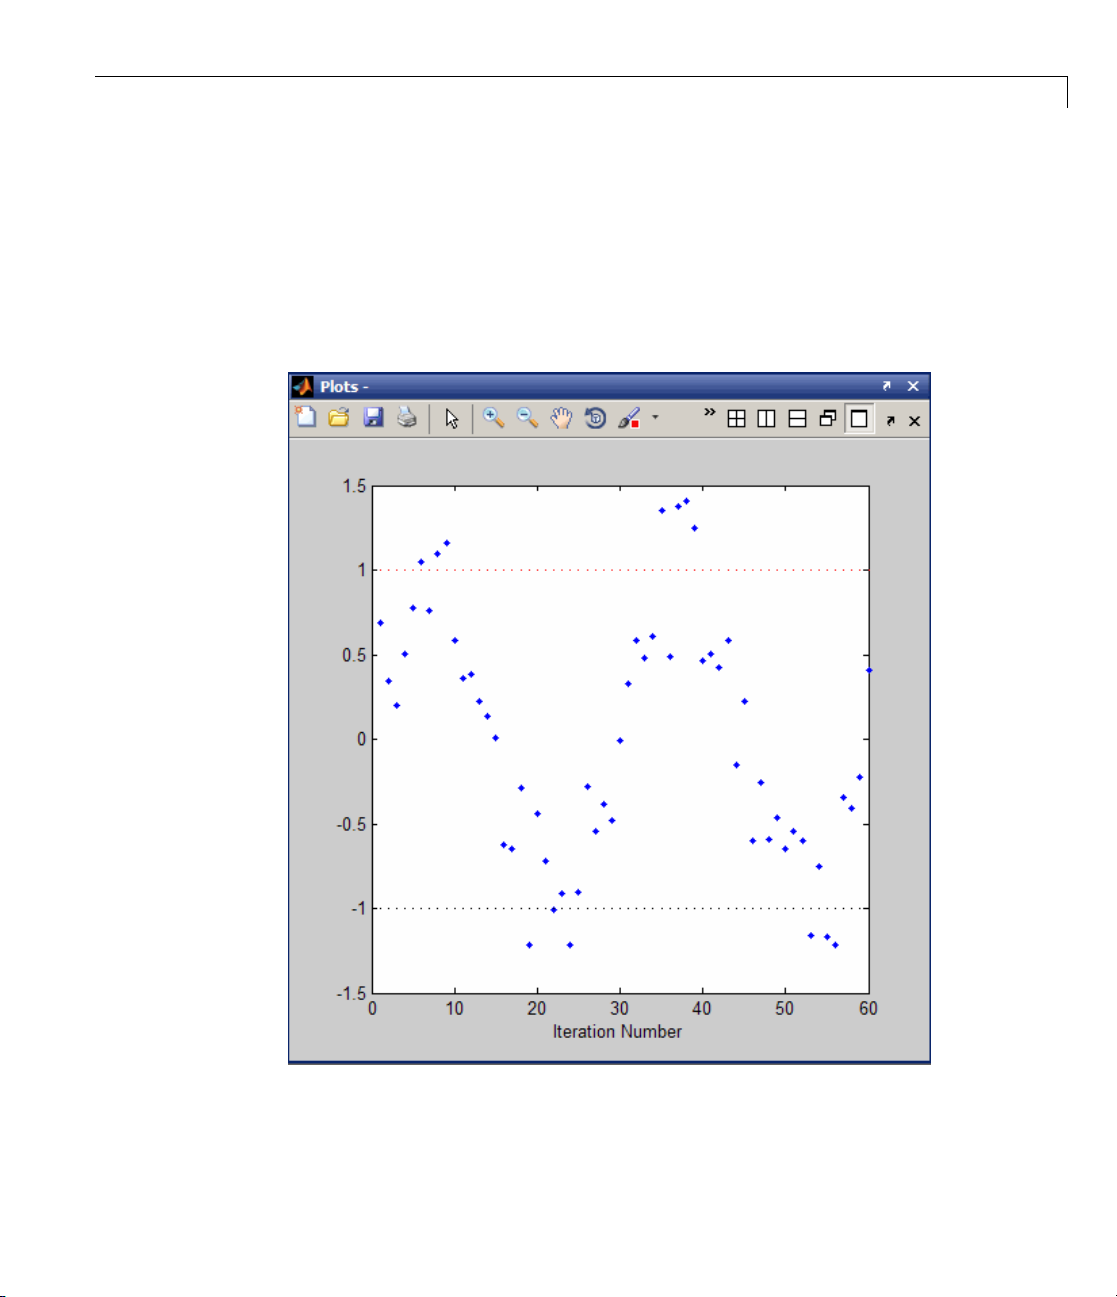
If your test includes a Plot element, the SystemTest software creates the
plot and updates the plot during each iteration. Since Limit Check elements
evaluate whether an iteration passed or failed, they directly affect the data
that appears in the Test Report and the Run Status pa ne.
In the example test, the plot includes the high and low limits defined in the
Limit Check element, to show w hich test iterations exceed the limits.
When the test is done running, the Run Status pane provides links to
generated output. The Generated Files section contains a summary of
1-39
Page 54

1 Getting Started
generated files, with links to them. These can include the Test Report; the test
results, opened in the Test Results Viewer; a nd a Simulink model coverage
report, if your test uses the model cove rag e feature.
Analyzing Your Test Results
After the SystemTest software runs your test, you can explore the results that
are generated. This section shows how to:
• View and interpret the Test Report.
• Inspect your test results.
Viewing the Test Report
When you enable the Test Report, the SystemTest software saves information
abouteachtestiterationinanHTMLfile. ToenabletheTestReport,check
the Generate report option on the Output Files tab of the Properties
pane before running your test. The report contains summary information
about the test run, snapshots of any plots you used, snapshots of any models
you used, pass/fail results of Limit Check elemen ts, and other in formation.
See Test Report for a full description of what the report contains.
1-40
Page 55

Example: Bui lding a Test
After a test runs, you can see the contents of this file by clicking Tools >
Test Report or using the Test Report link in the Run Status pane. The
generated output resembles the following.
1-41
Page 56
1 Getting Started
The M ain Test section of the report shows each iteration. Y ou see the value of
the test vector
in evaluating whether the test passed. For the first several iterations, the
value of
You can also see this in the scalar plot drawn w h ile the test ran. For other
iterations that failed, you can scroll through the report to find the values of
signal and determine the values the Limit C heck element used
Y did not exceed either the high or low limits so the ite rations passed.
Y.
Viewing Test Results
The SystemTest software allows you to view the results you have chosen to
save for your test using a workspace variable called
access to the test results object, which is useful for comparing the results of
separate test runs and for postprocessing test results.
For more information, see Chapter 11, “Accessing Test Results from the
MATLAB Command Line”.
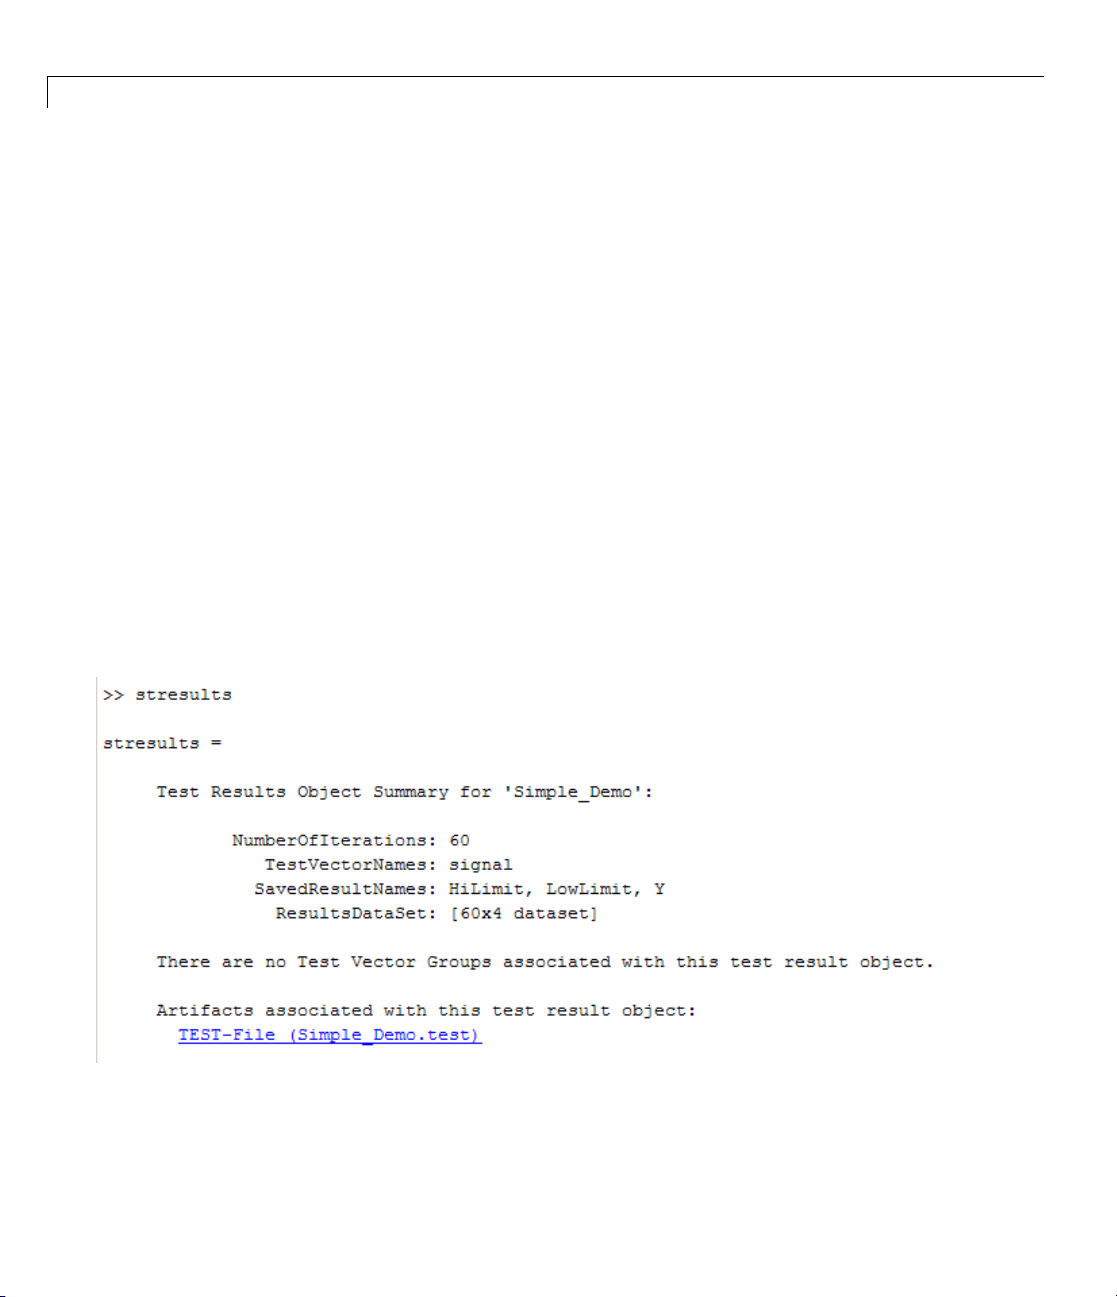
To continue the example of Simple Demo, after you run the test, return
to MATLAB and type
returned.
stresults. The following summary of the results is
stresults.Itprovides
1-42
Page 57
Example: Bui lding a Test
You can see that the test contains 60 iterations, that it contains a test vector
signal, and the names of the three saved results are HiLimit, LowLimit,
and
Y.
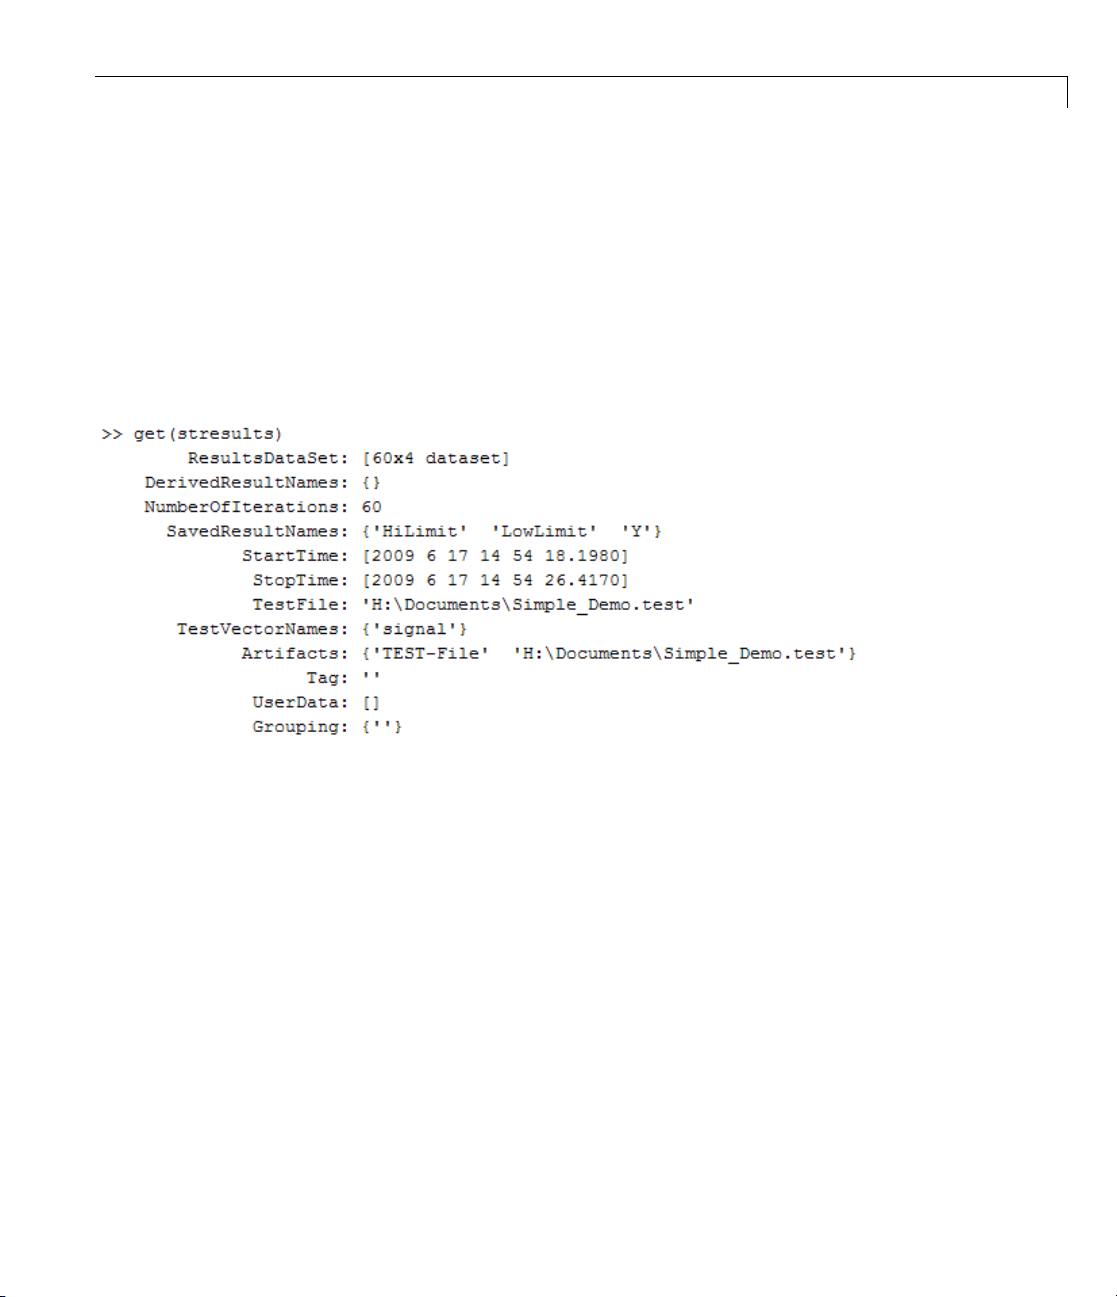
To see a more complete list of properties, type:
get(stresults)
That displays the following.
The ResultsDataSet property contains the test results data in the form of a
dataset array. This is what you set up using the Saved Results node in the
Test Browser. See “Saving Test Results” on page 1-31 for more information
on setting up saved results.
To access the
stresults.ResultsDataSet
ResultsDataSet property, type :
This returns the test results data in the form of a dataset array.
In the Simple Demo example, a portion of the test results data looks like this:
1-43
Page 58

1 Getting Started
In the dataset array, each row represents a test iteration, labeled using the
convention of
iterations. Test vector values are listed first, in alphabetical order, followed
by test results, listed in alphabetical order, as shown in the above figure. This
is a simple way to view the results you set up in Saved Results.Thetest
results for all iterations are displayed at the command line, even though
only the first ten are only shown here.
['I' + Iteration_Number]. Thisexampleshowsthefirst10
1-44
You can now plot the results. See “Plotting Results Data” on page 11-10 to
see plots created from these results.
Page 59

Working with Test Vectors
• “Creating MATLAB Express ion Test Vectors” on page 2-2
• “Creating Grouped Test Vectors” on page 2-5
• “About Test Vectors and the MATLAB Workspace” on page 2-12
• “Creating MAT-File Test Vectors” on page 2-13
• “Creating Randomized Test Vectors with Probability Di s trib u t ion s” on
page 2-18
• “Creating Spreadsheet D ata Test Vectors” on page 2-44
2
• “Creating Simulink Design Verifier Data File Test Vectors” on page 2-53
• “Creating Signal Builder Block Test Vectors” on page 2-67
• “Creating a Test Case Data Test Vector” on page 2-73
• “Using a MATLAB Element to Access Test Case Data Test Vector
Information” on page 2-76
• “Editing a Test Vector from within an Element” on page 2-77
Page 60

2 Working with Test Vectors
Creating MATLAB Expression Test Vectors
Test v ectors define the parameter space or set of test cases you want to run.
Test vectors are composed of values that can be d eriv ed from a MATLAB
expression. You can use any M A TLAB expression that evaluates to a 1-by-N
matrix or cell array to define your test vector. You must have at least one test
vector defined to run a test.
The total number of Main Test iterations is determined by permuting all test
vector values. For ex ample, if one test vector is a 1-by-3 array and another is
1-by-2, it wou ld result in a total of six iterations covering all the test vector
value combinations.
To add a test vector:
1 Click the New Vector button in the Test Vectors pane.
In the Insert New Test Vector dialog box, keep the default test vector type
of MATLAB Expression.
2-2
Page 61

Creating MATLAB Expression Test Vectors
2 Assign
3 EnterthevaluebytypinginvaluesoraMATLABexpressioninthe
anametothevectorintheName field.
Expression field.
The Size field fills in automatically based on what you entered if you press
Enter or click outside of the Size field. For example, if you entered
:10
in the Expression field, the Size would be a 1 x 10 double, which
1: 1
means 10 iterations.
ct the Evaluate Test Vector each time the test is run option if
4 Sele
want to use new values every time the test is run. For example, if
you
r expression included a
you
ld be calculated each time. Leave it unselected if you want to use the
wou
e values each time the test is run.
sam
rand function, a new set of random numbers
2-3
Page 62

2 Working with Test Vectors
5 Click OK in the Insert Test Vector dialog box.
The new vector appears in the Test Vectors pane.
Note Grouping test vectors determines how they will be iterated through
when the test runs. For information on grouping vectors, see “Creating
Grouped Test V ectors” on page 2-5.
For an example o f creating test vectors in a test, see “Creating a Test Vector”
on page 1-15.
2-4
Page 63

Creating Grouped Test Vectors
When you create a test vector, it is an ungrouped vector by default, except
for Probability Distribution test vectors. You can also create grouped vectors,
in order to affect the way iterations are run. By grouping test vectors, they
will be indexed simultaneously with the other vectors in their group. Each
set of grouped values are then permuted with all the ungrouped test vectors.
This gives more contro l over the flow of tests and is useful for Design of
Experiments (DOE) or Monte Carlo-based testing as well as defining signal
groups, similar to those defined in the Simulink Signal Bui lder block.
For example, if you are testing a throttle body controller, you may want to
sweep across a range of input level or gain values, while simultaneously
selecting different throttle body types, each defined by their mass and
damping characteristics.
An example of the vectors in this scenario could look like this:
gain = [1 10 100]
mass = [a b c d]
damping = [w x y z]
Creating Grouped Test Vectors
If the gain vector is ungrouped, and the mass and damping vectors are
grouped, it will result in
each value of
Run 1: (1, a, w)
Run 2: (1, b, x)
Run 3: (1, c, y)
Run 4: (1, d, z)
Run 5: (10, a, w)
Run 6: (10, b, x)
Run 7: (10, c, y)
Run 8: (10, d, z)
Run 9: (100, a, w)
Run 10: (100, b, x)
Run 11: (100, c, y)
Run 12: (100, d, z)
gain. The test runs would look like this:
mass and damping being indexed simultaneously for
2-5
Page 64

2 Working with Test Vectors
Note Grouped test vectors must be the same length.
You create a grouped test vector as you do any other vector, by clicking the
New Vector button in the Test Vectors pane. To group a vector, change the
selection using the Grouping tab in the Insert Test Vector dialog bo x. Y ou
can group any type of test vector, and you can create multiple test vector
groups. You can also group or ungroup test vectors after you create them.
In general, it doesn’t usually make sense to group Signal Builder Block
test vectors or Simulink Design Verifier Data File test vectors. There are
advantages to grouping MATLAB Expression, Probability Distribution, and
Spreadsheet Data test vectors at times, depending on your test goals. One
ofthemainadvantagestogroupingisforMonteCarlo-basedtesting,as
described by the example above.
To group a test vector:
2-6
1 Create a test v ector and configure it in the General tab of the Insert Test
Vector dialog box.
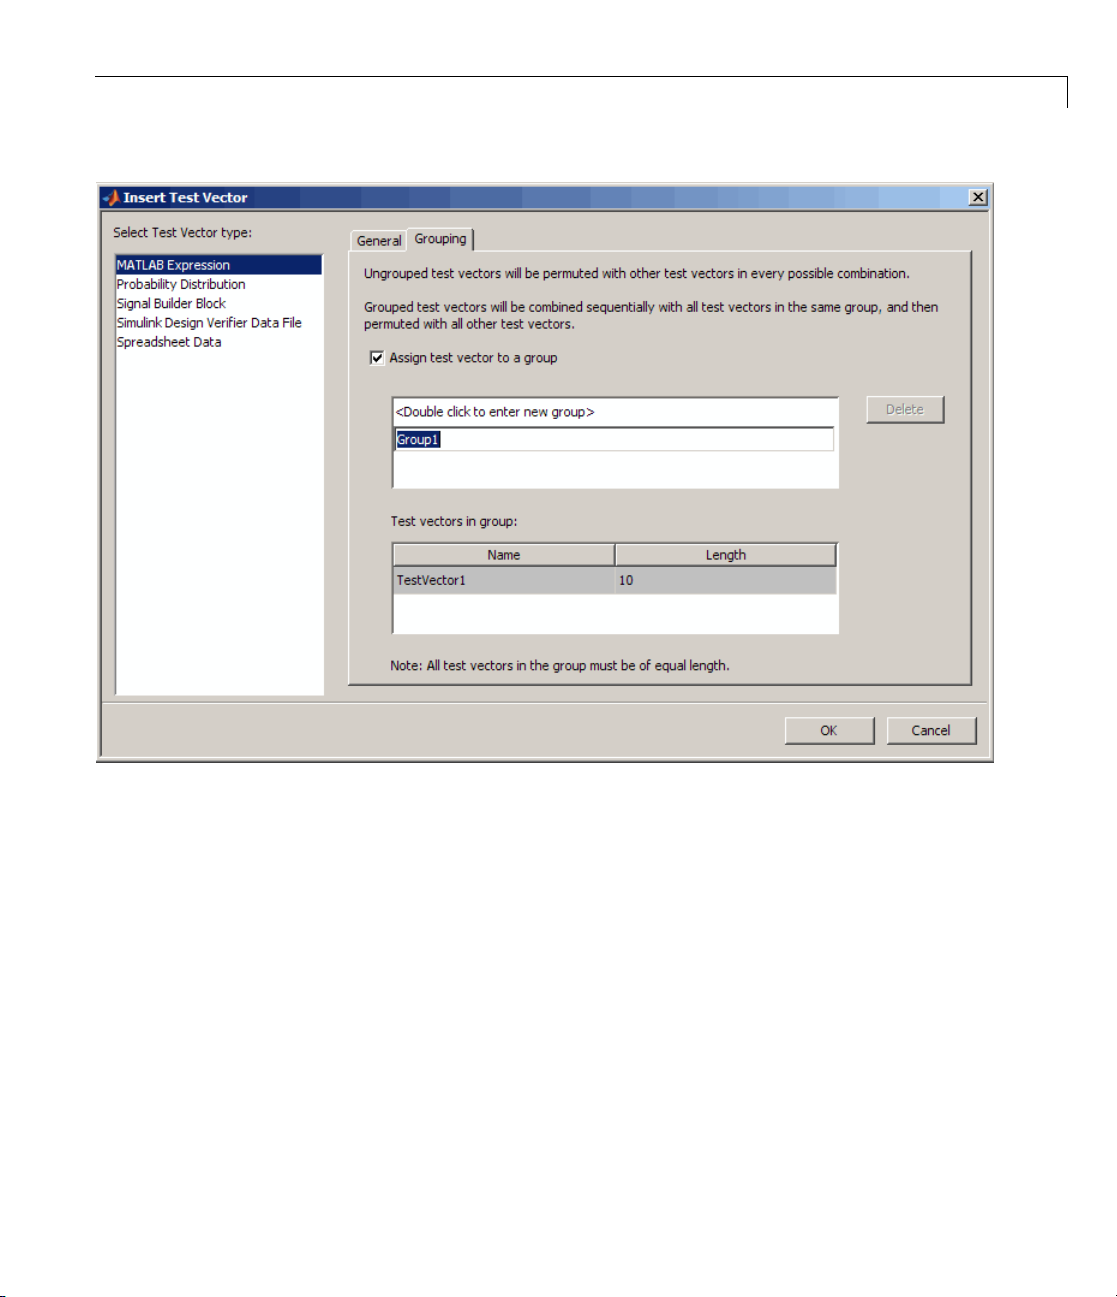
2 Click the Grouping tab in the Insert Test Vector dialog box.
3 Select the Assign test vector to a group option.
A group is created and given the default name of
Group1, as shown here.
Page 65
Creating Grouped Test Vectors
4 To chan
ge the name, type the new name over the default name and press
Enter.
5 Click OK in the Insert Test Vector dialog box.
In the Test Vectors pane, the name of the group is displayed in the table.
6 Now i
7 Select the test vector type and configure it in the General tab.
8 Click the Grouping tab, and select the Assign test vector to a group
f you create another test vector, you can add it to the same group as
irst one. To do this, click the New Vector button a gain.
the f
option.
te that test vectors in a group must all be the same length.
No
2-7
Page 66

2 Working with Test Vectors
If you already have one test vector group, the new vector is placed in that
group by default.
2-8
k OK in the Insert Test Vec tor dialog box.
9 Clic
Page 67

Creating Grouped Test Vectors
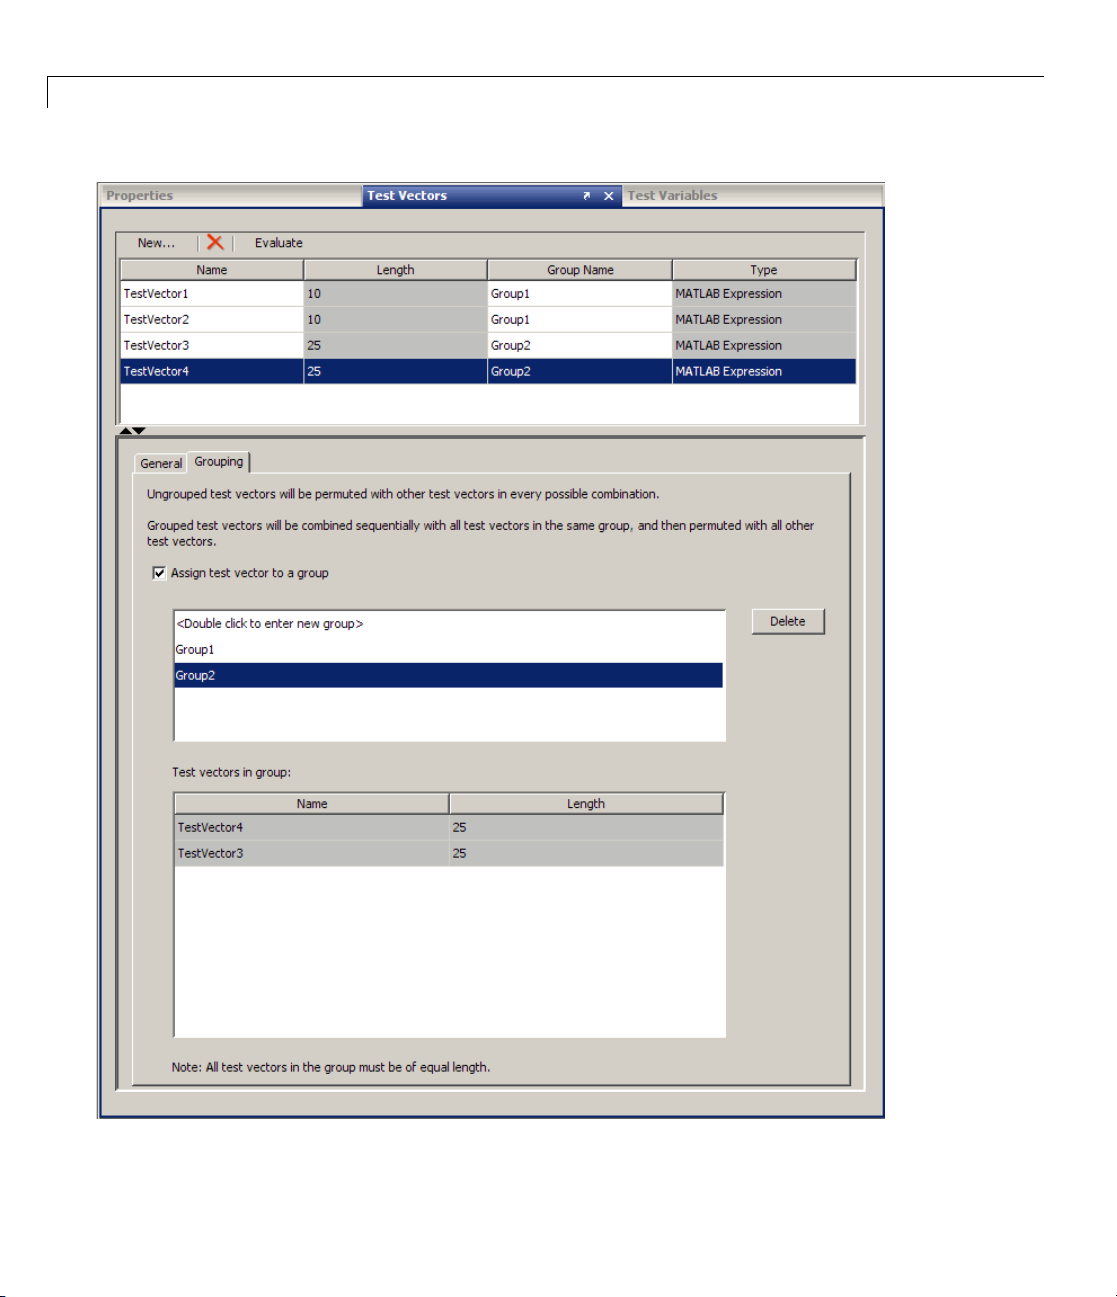
You can create multiple test vector groups. Onceyouhavemultiplegroups,
when you create new test vectors, you can select which group to put them in as
you create them. The following figure shows
Group1 containing TestVector1
and TestVect or2,andGroup2 containing TestVector3 and TestVector4.
2-9
Page 68
2 Working with Test Vectors
2-10
Page 69

Creating Grouped Test Vectors
You can also create groups after test vectors are already created by editing a
test vector in the Test Vectors pane. Select a test vector in the table to edit
its properties in the editor area below the table. There you can add it to a
group using the Grouping tab. You can also add it to a group in the table by
clicking in the Group Name column.
Managing Test Vector Groups
You can modify g roups to ungroup a test vector, move a test vector to another
group, rename a group, or d elete a group.
• Ungroup a test vector — To remove a test vector from a group, select
it in the test vectors table, then click the Group Name column. Use the
down-arrow to select the first entry, which is a blank space. The Group
Name co lumn will then be empty for that test vector, indicating it is no
longer in a group.
• Move a test vector to another group — To move a test vector from o ne
group to another, select it in the test vectors table, then click the Group
Name column. Use the down arrow to select the group to move it to. The
Group Name column will then show the new group name.
• Rename a group — You can change the name of a tes t vector group either
in the table or in the editor area. Renaming a group in the table results
in the group name for a single test vector being changed. Renaming a
group in the editor area results in the name being changed for all vectors
in the group.
To rename a group for a single test vector, select that vector in the table,
then click in the Group Name column. Typeanewnameandpress
Enter.
To rename a group for a ll test vectors in the group, select one of the
test vectors in the table. Then in the Grouping tab in the editor area,
select that group name in the upper section and type a new name. Press
Enter. You then see all of the test vectors in that group change to the
new name in the table.
• Delete a group — To delete a test vector group, select one of the test
vectors in the table that is in that group. Then in the editor area, under the
Grouping tab, that group name will be selected. Click the Delete button
on the Grouping tab. The group is deleted and all test vectors belonging
to that group become ungrouped.
2-11
Page 70

2 Working with Test Vectors
About Test Vectors and the MATLAB Workspace
The SystemTest software has its own internal workspace that it uses to
manage test variables and test vectors independently. However it does
leverage the MATLAB workspace during test execution, and when using
a MATLAB element.
During test execution, SystemTest test variables and test vectors are
evaluated in the MATLAB base workspace. Then at the end of test execution,
they are cleared out and the MATLAB base workspace is restored to what it
was before the test execution.
When using a MATLAB element in the SystemTest software, you can
reference a variable in the base workspace without having to create a test
vector or test variable in the SystemTest software. However the SystemTest
software will not be aware of this data, so you could not make use of it in any
other element type or in saved results. You can only access it from a MATLAB
element. If you need to use it in other elements, you can create test variables
or test vectors in the SystemTest software.
2-12
Page 71

Creating MAT-File Test Vectors
The MAT-File test vector offers an easy way for you to use data from a
MAT-file in the SystemTest software.
To add a test vector:
1 Click the New Vector button in the Test Vectors pane.
In the Insert New Test Vector dialog box, select the test vector type of
MAT-File.
Creating MAT-File Test Vectors
2-13
Page 72

2 Working with Test Vectors
2-14
The red border indicating that the element is in an error state is normal,
andwillgoawayonceyouaddfile(s)instep4.
gnanametothevectorintheName field.
2 Assi
3 Click the Add File(s) button.
4 In the Select MAT-File dialog box, browse for your MAT-file(s). You can
select multiple files at the same time. Only MAT-files can be added. Other
file types produce an error. After selecting the file(s), click the Open button
to bring them into the test vector.
Page 73
Creating MAT-File Test Vectors
In the MAT-Files to read table on the General tab, MAT-files that are
checked will be used in the test. Unchecking a file means it will not be
included in the test.
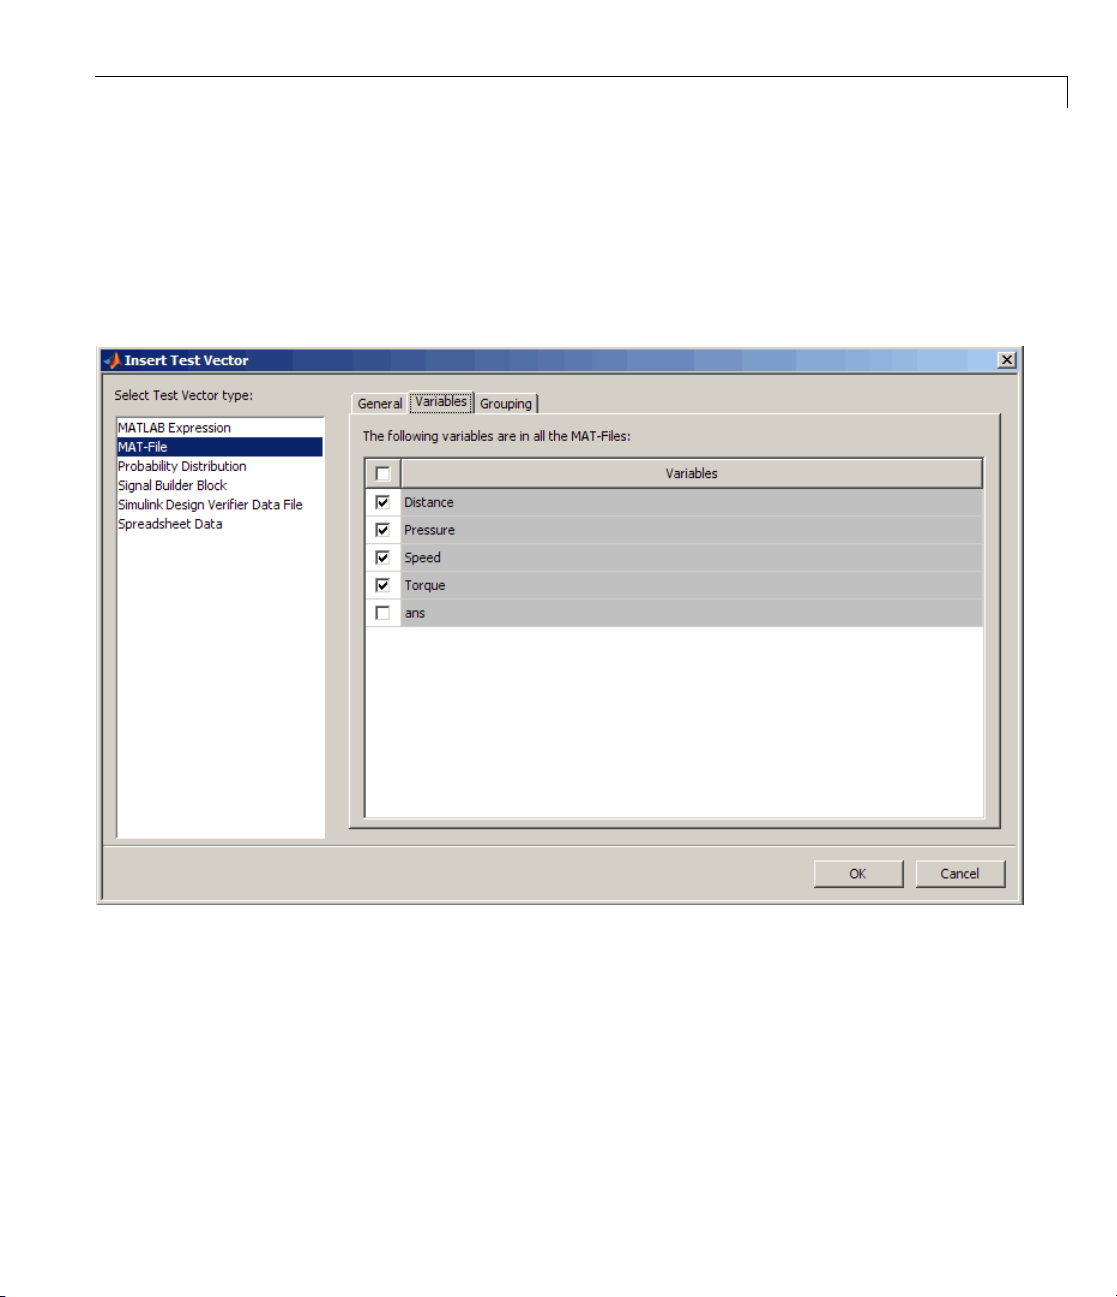
5 Click the Variables tab. All the common variables contained in all the
selected MAT-file(s) you added appear in the table.
Note that the variables are sorted in alphabetical order. If you have
multiple MAT-files, only variables that are common across all files appear
in the table.
ables that are checked will be used in the test. Unchecking a variable
Vari
ns it will not be included in the test. In the example above, all variables
mea
exc
ept for
ans will be used in the test.
2-15
Page 74

2 Working with Test Vectors
Checking or unchecking the checkbox in the table header will select or
unselect all variables. It is a Select All/Unselect All toggle option.
6 MAT-File test vectors are ungrouped by default. On the Grouping tab,
you can select the Assign test vector to a group option if you want to
group the test vector.
Grouping test vectors is useful for reducing the number of iterations to
execute. It means that the SystemTest software will sequentially combine
values for all grouped test vectors, instead of permuting their values. See
“Creating Grouped T est Vectors” on page 2-5 for more information on
grouped test vectors.
7 Click OK in the Insert T est Vector dialog box.
The new vector appears in the Test Vectors pane.
Important Usage Notes
• If you use multiple MAT-Files in a test vector, only commonly named
variables included in all of the files will be read and used. For example, if
you have variables in MAT-file A called
and in MAT-file B you have variables
only
Speed and Pressure will be shown since they are included in both
MAT-Files.
Distance and Torque will not be used since they do not exist
Speed, Distance,andPressure,
Speed, Pressure,andTorque,
in both files.
2-16
• If the order of execution of the MAT-files is important, then use the up and
down arrows to order the files accordingly in the test vector table. Each
MAT-file is one iteration of the test vector, and they are executed in the
order they appear in the table.
• The test vector is evaluated every time the test is run – that means the
data is read from the MAT-File(s) every time the test is run.
• If a MAT-File test vector is mapped to the inport blocks in a Simulink
element using the All Inport blocks are mapped option, the model
is simulated using all the variables that are selected in the Variables
table in the test vector. If it is mapped to the inport blocks using the
Individual Inport blocks are mapped option, the model is simulated
with individually selected variables from the M AT-file.
Page 75

Creating MAT-File Test Vectors
• Checking or unchecking the checkbox in the Variables table header will
select or unselect a ll variables. It is a Select All/Unselect All toggle option.
This option affects the variables selection behavior when you add or remove
or select or unselect MAT-files in the MA T -file list on the General tab.
For example, if the checkbox is selected (to Select All variables) and then a
MAT-file is added/removed or selected/unselected, all common variables
will be selected by default.
If the checkbox is unselected (to Unselect All variables) and then a
MAT-file is added/removed or selected/unselected, all common variables
will be unselected by default.
2-17
Page 76

2 Working with Test Vectors
Creating Randomized Test Vectors with Probability
Distributions
In this section...
“Using Probability Distributions in Test Vectors” on page 2-18
“Creating a Test Vector with Probability Distributions” on page 2-18
“Viewing Data While Configuring the Test Vector” on page 2-23
“The Probability Distributions” on page 2-26
“Example: Creating Test Vectors with Probability D istributions” on page
2-34
Using Pro
The Syste
vector v
set up te
If you h
ates with it to provide use of some of its probability distribution
integr
ons, such as exponential, gamma, lognormal, T (Student’s t), and
functi
Weibul
MATLA
Crea
You c
To us
l. If you do not have the S tatistics Toolbox software, you can use the
ting a Test Vector with Probability Distributions
an use a probability distribution when you create or edit a test vector.
e a probability distribution:
he Test Vectors pane, click the New Vector button.
1 In t
2 In the Insert Test Vector dialog box, select Probability Distribution as
the test vector type.
3 EnteranameforthenewvectorintheName field.
lect a distribution function from the Distribution list.
4 Se
bability Distributions in Test Vectors
mTest software provides an easy way to generate randomized test
alues for your test. You can use probability distribution functions to
st vectors, which i s useful for performing Monte Carlo analyses.
ave the Statistics Toolbox™ software, the SystemTest software
B probability distribution functions normal (Gaussian) and uniform.
2-18
Page 77

Creating Randomized Test Vectors with Probability Distributions
If you have the Statistics Toolbox s oftware, all of the functions shown in
the figure appear in the list. If you do not have this toolbox, you can use
normal (Gaussian) and uniform.
For inf
Distri
5 Once you select a distribution, the relevant options appear. Fill in the
ormation on the distribution functions,see“TheProbability
butions” on page 2-26.
parameters for your distribution.
2-19
Page 78

2 Working with Test Vectors
For example, normal (Gaussian) allows you to set Mean and Standard
deviation.
2-20
6 After setting the relevant probability parameters, type in the Number of
values you want to use. That is the number of values you would like to
generate for the test vector.
The Number of values must be a positive integer. It must also be the same
value for all of y our probability distributions because the vector is grouped.
7 If you want to see the data you have configured before running the test,
click the View Data button. This displays a histogram visualization of the
probability distribution data. If you are not satisfied with the data as it is
configured, you can adjust one or more of the parameters and hit Enter to
see the ch a n ges in the figure window.
For more information on viewing the data, see “Viewing Data While
Configuring the Test Vector” on page 2-23.
8 Select the Evaluate Test Vector each time the test is run option if you
want to use new values every time the test is run. For example, for the
Page 79

Creating Randomized Test Vectors with Probability Distributions
probability distribution, a new set of values for the parameters (such as
Mean) would b e calculated each time. Le av e it unselected if you want to
use the same values each time the test is run.
If you are doing Monte Carlo testing and you want repeatability of the
data,donotusethisoption.
9 On the Grouping tab, keep the default of Grouped,orselectUngrouped.
Randomized test vectors with probability distributions are grouped by
default, as indicated by Grouped being selected.
Grouping test vectors is useful for reducing the number of iterations to
execute. It means that the SystemTest software will sequentially combine
values for all grouped test vectors, instead of permuting their values. In
thecaseofrandomizedtestvectors,grouping avoids introducing additional
variation into your test. See Creating Grouped Test Vectors for more
information on grouped test vectors.
10 Click OK in the Insert Test Vector dialog box.
The new vector then appears in the Test Vectors pane.
2-21
Page 80
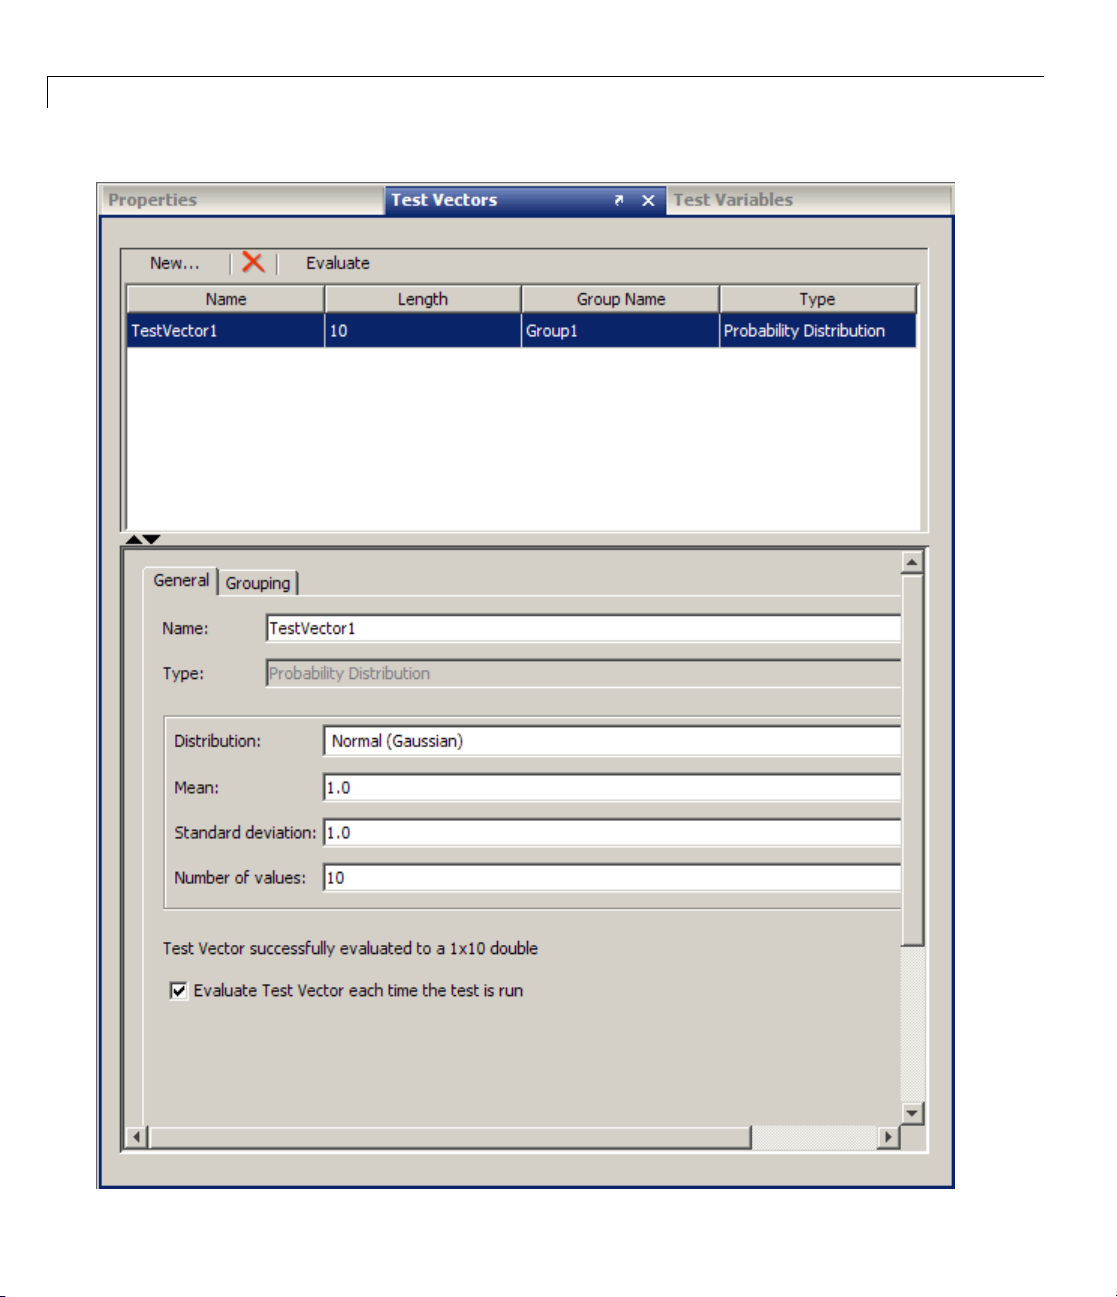
2 Working with Test Vectors
2-22
Page 81

Creating Randomized Test Vectors with Probability Distributions
Viewing Data While Configuring the Test Vector
You can view your probability distribution data while configuring the test
vector, without having to run the test. You can quickly inspect the test vector
data for outliers, data range coverage, or correctness of the test function
before running the test. This allows you to make necessary adjustments until
you have data you are satisfied with, which saves time.
To view data while configuring a test vector:
1 Create the test vector by clicking the New button in the Test Vectors pane.
2 In the Insert Test Vector dialog box, select Probability Distribution as
the test vector type.
3 Select a distribution function from the Distribution list.
4 Once you select a distribution, the relevant parameters appear. Fill in the
parameters for your distribution.
In this example, Normal (Gaussian) is shown, with a mean of 1.0, standard
deviation of 3, and 40 values.
ick the View Data button on the General tab.
5 Cl
2-23
Page 82
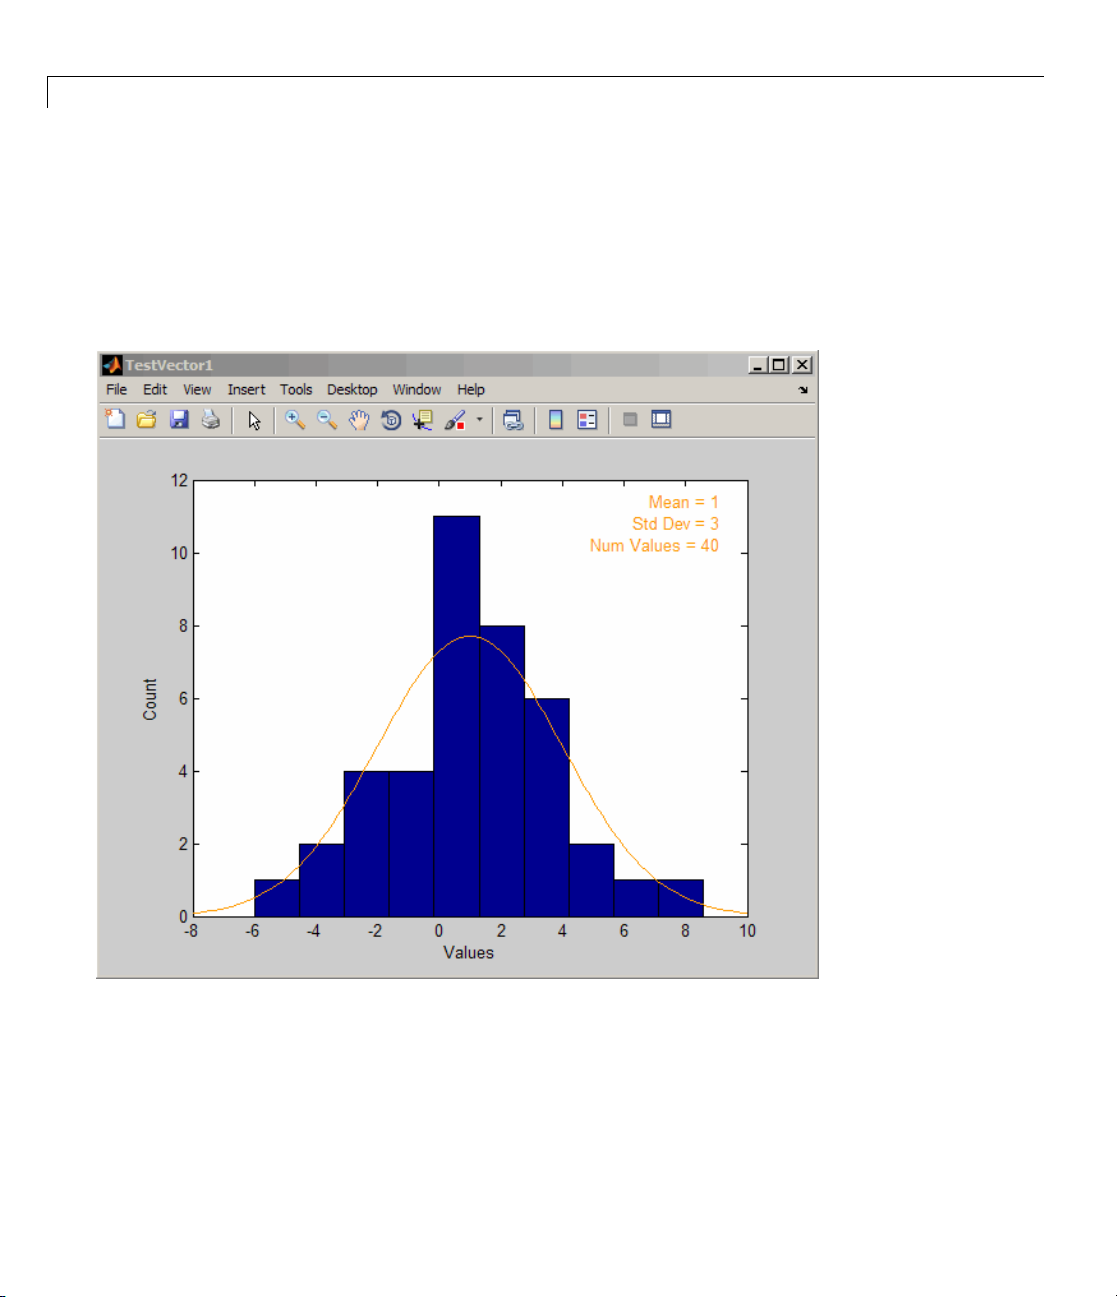
2 Working with Test Vectors
6 The data viewer window displays the data you configured in a histogram
visualization. The values are displayed on the x-axis, and in this case they
range from approximately
-6 to 9 . The parameters are also displayed
textually in the figure window in the upper right corner. For comparison
purposes, a light orange line showing the “ideal” probability distribution is
also displayed on top of your data.
2-24
7 When
8 If you are dissatisfied with the data, change one or mo re parameters and
satisfied with the data that is shown, click OK to finish creating
test vector.
the
redisplay it. In this case, change the standard deviation from 3 to 2. To
change a value, type a new value in the parameter you want to change
Page 83

Creating Randomized Test Vectors with Probability Distributions
and either press Enter or click outside of the field. The figure window
automatically updates to display the new data.
You can also view and modify the test vector data any time after creating
a test vector. Access the data viewer by clicking the Test Vectors tab in
the Properties pane, then selecting a test vector from the list. That test
vector then becomes editable, and you can click the View Data button on
the General tab.
2-25
Page 84

2 Working with Test Vectors
The Probability
If you have the St
integrates with
functions, suc
Weibull. If you
to the MATLAB p
uniform.
The SystemTe
following se
the Insert Te
The Insert T
pick in the l
the functi
want to gen
ctions. Select the Probability Distribution test vector type in
ist, as shown in the sections below. In each case, enter values for
on-specific parameters, and then enter the Number of values you
erate for the test vector.
Normal (Gaussian)
The norma
paramete
is often
l distribution is a two-parameter family of curves. The first
r is the mean. The second parameter is standard deviation. Normal
used for data that is symmetrical about the mean.
atistics Toolbox software, the SystemTest software
it to provide use of some of its probability distribution
h as exponential, gamma, lognormal, T (Student’s t), and
do not have the Statistics Toolbox software, you have access
robability distribution functions normal (Gaussian) and
st software supports the distribution functions shown in the
st Vector dialog box to access the functions.
est Vectors dialog box shows fields specific to the distribution you
Distributions
2-26
Page 85
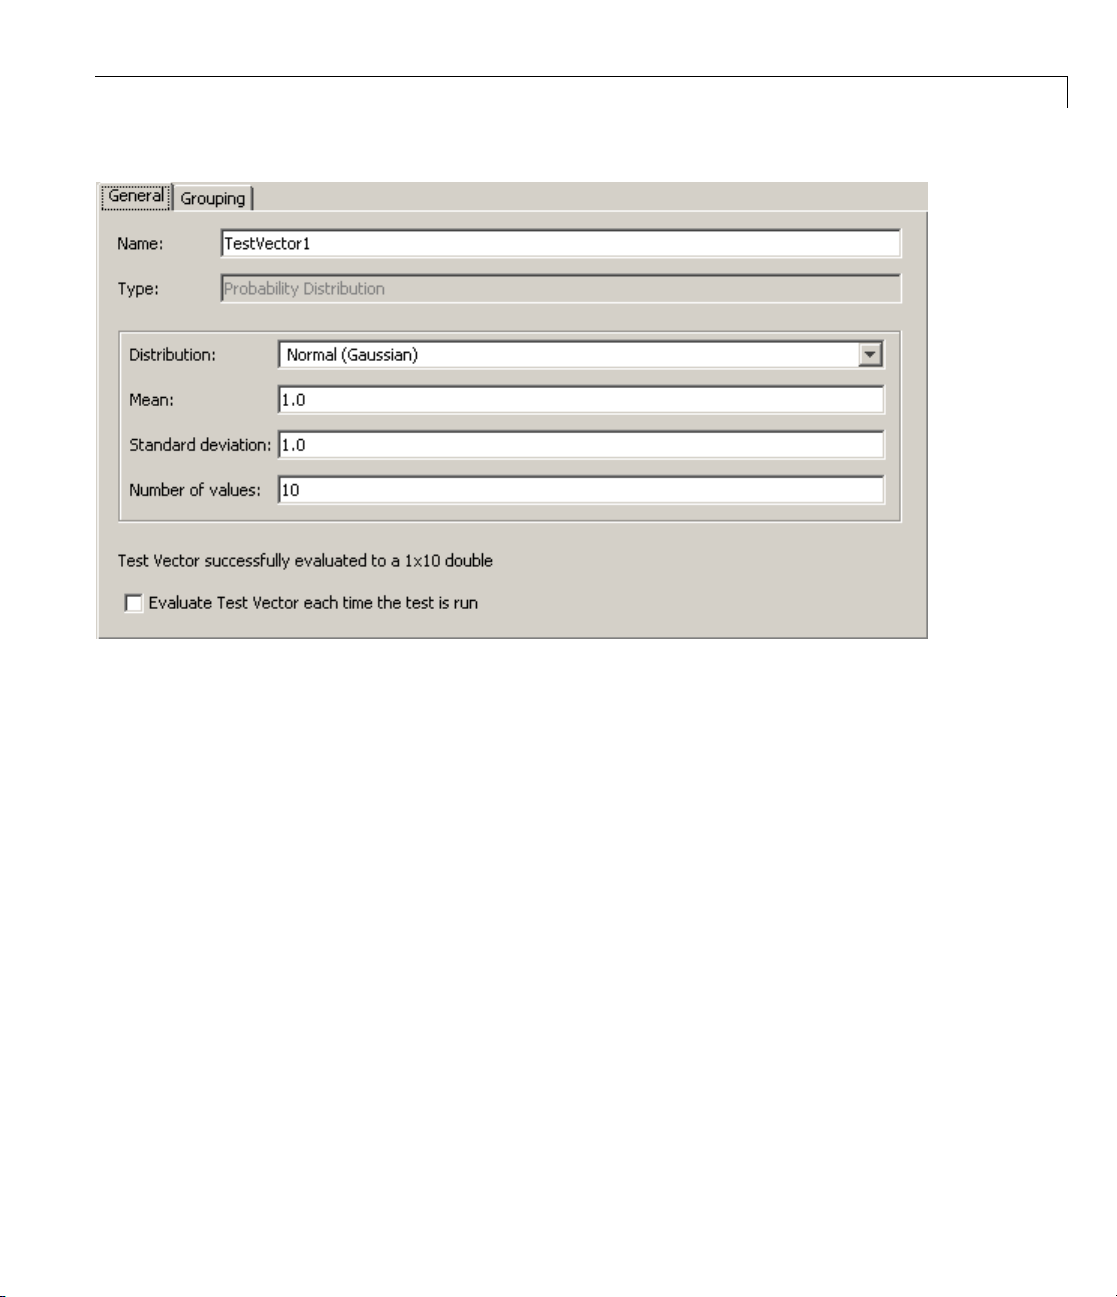
Creating Randomized Test Vectors with Probability Distributions
Normal uses the function randn and takes parameters for Mean and
Standard deviation. The SystemTest software us es the following
calculation for norm al:
mean + St
For more information, see randn in the MATLAB documentation.
Unifor
The uniform distribution (also called rectangular) has a constant probability
density function between its two parameters, the minimum and the maximum.
The uniform distribution is appropriate for representing the distribution of
round-off errors in values tabulated to a particular number of decimal places.
d_Dev * randn(1, #values)
m
2-27
Page 86
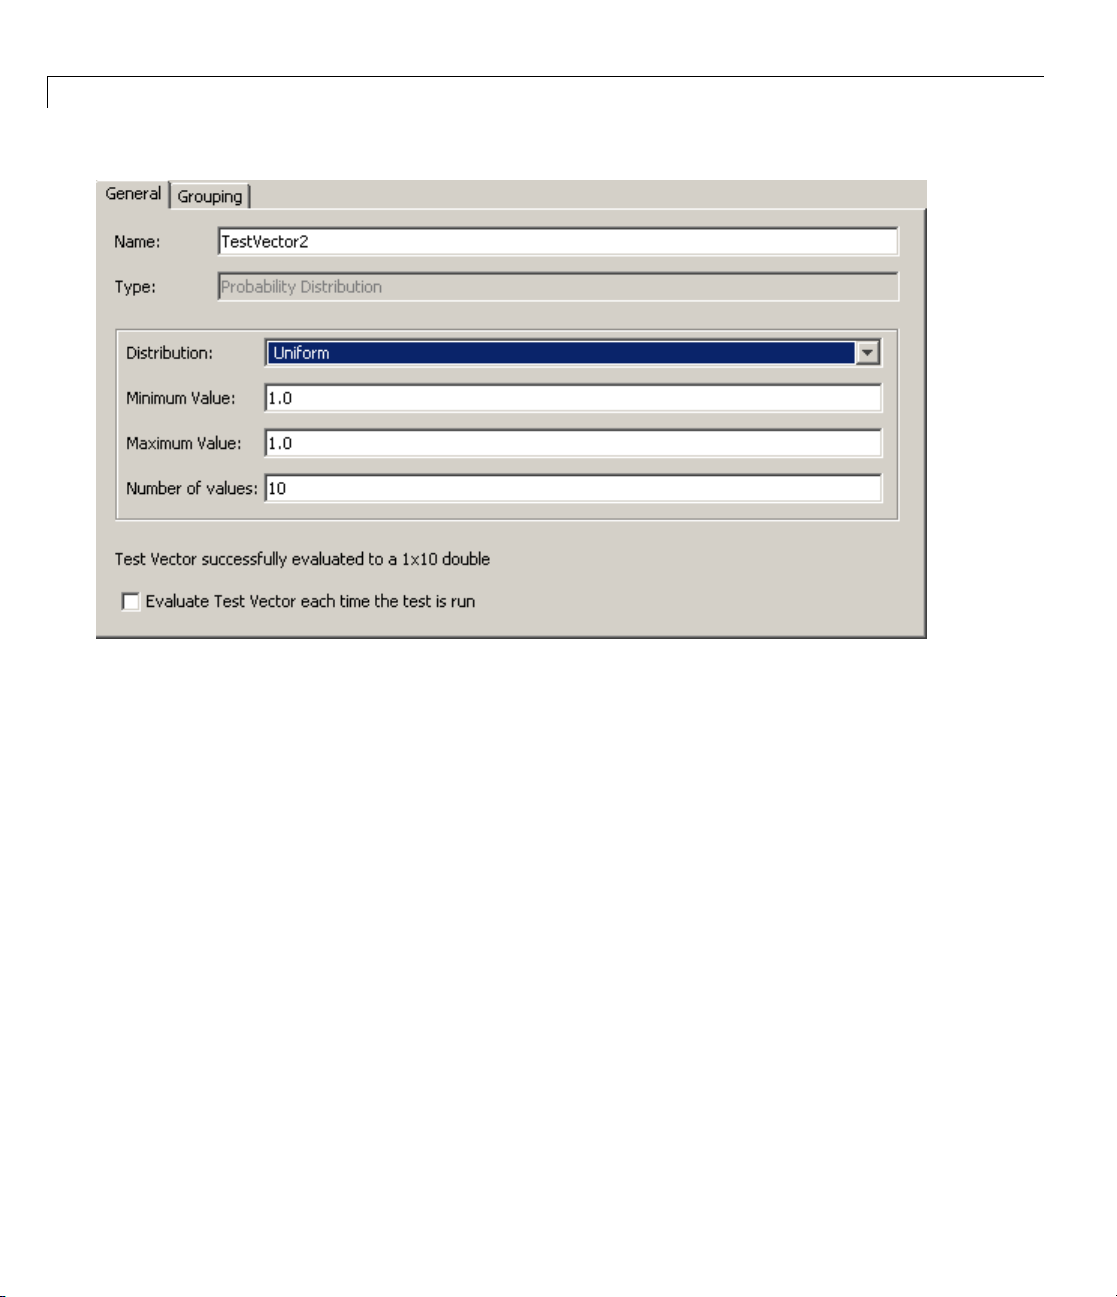
2 Working with Test Vectors
2-28
Uniform u
value an
calcula
min + (max-min) * rand(1, #values)
For mor
ses the function
d Maximum value. The SystemTest software uses the follow ing
tion for uniform:
e informatio n, see
rand and takes parameters for Minimum
rand in the MATLAB documentation.
Exponential
The ex
expon
that
Expo
happ
tim
sen
ponential distribution is a special case of the gamma distribution. The
ential distribution is special because of its utility in modeling eve nts
occurrandomlyovertime.
nential is often used to model the time between independent events that
en at a constant average rate. For example, y ou could use it for the
e it takes a radioactive particle decays, or the time between messages
toveranetwork.
Page 87
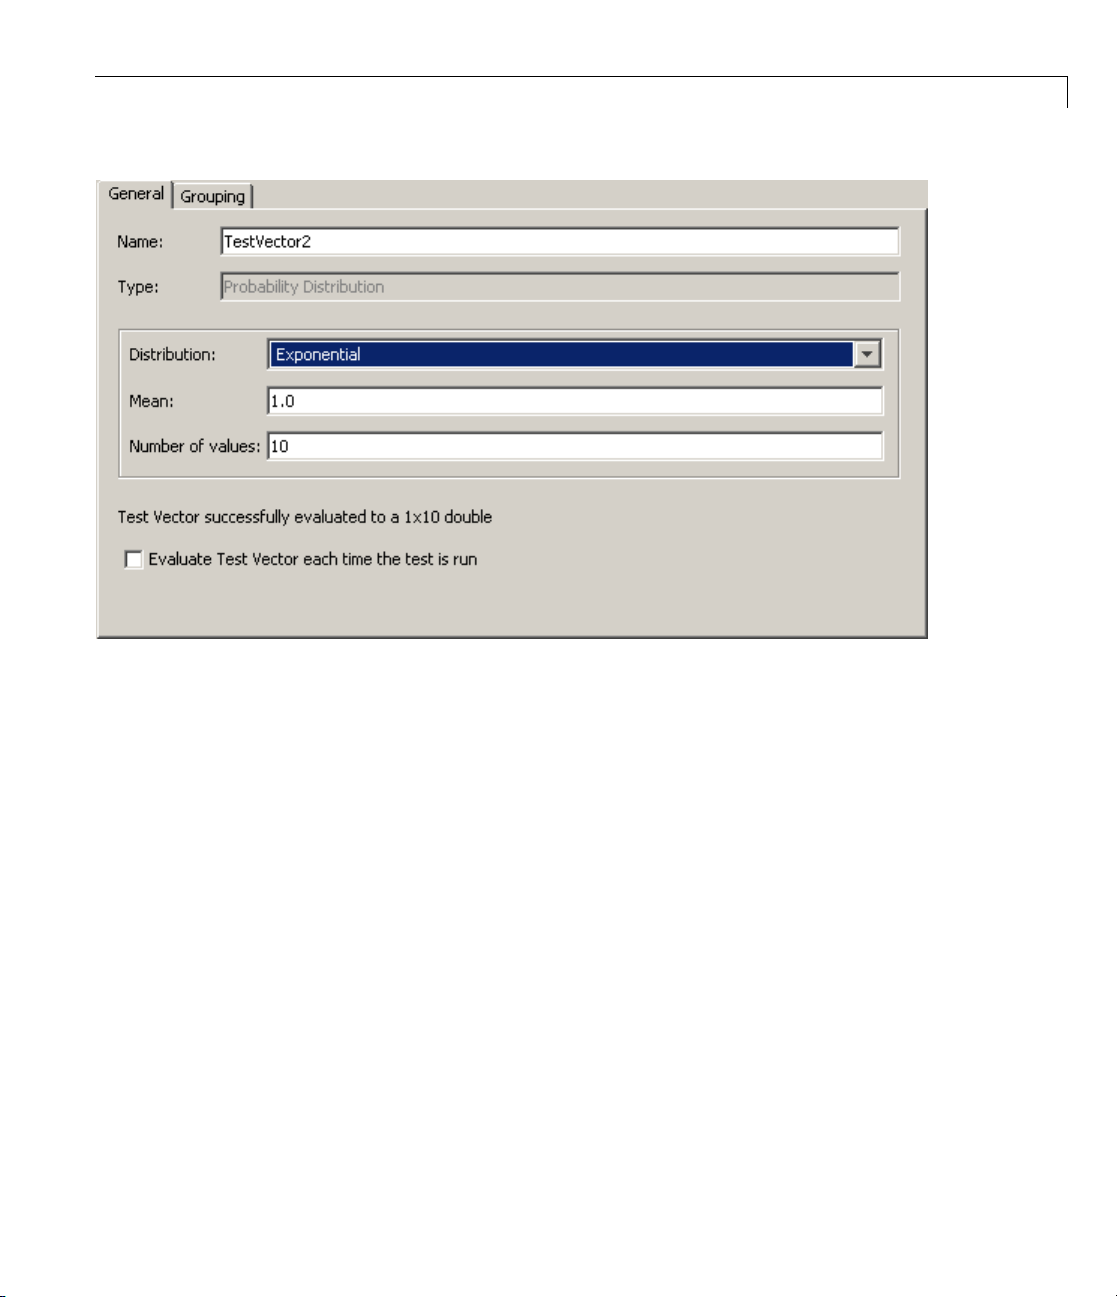
Creating Randomized Test Vectors with Probability Distributions
Exponent
For more
documen
ial uses the function
exprnd and takes o ne parameter for Mean.
information, see Exponential Distribution in the Statistics Toolbox
tation.
2-29
Page 88
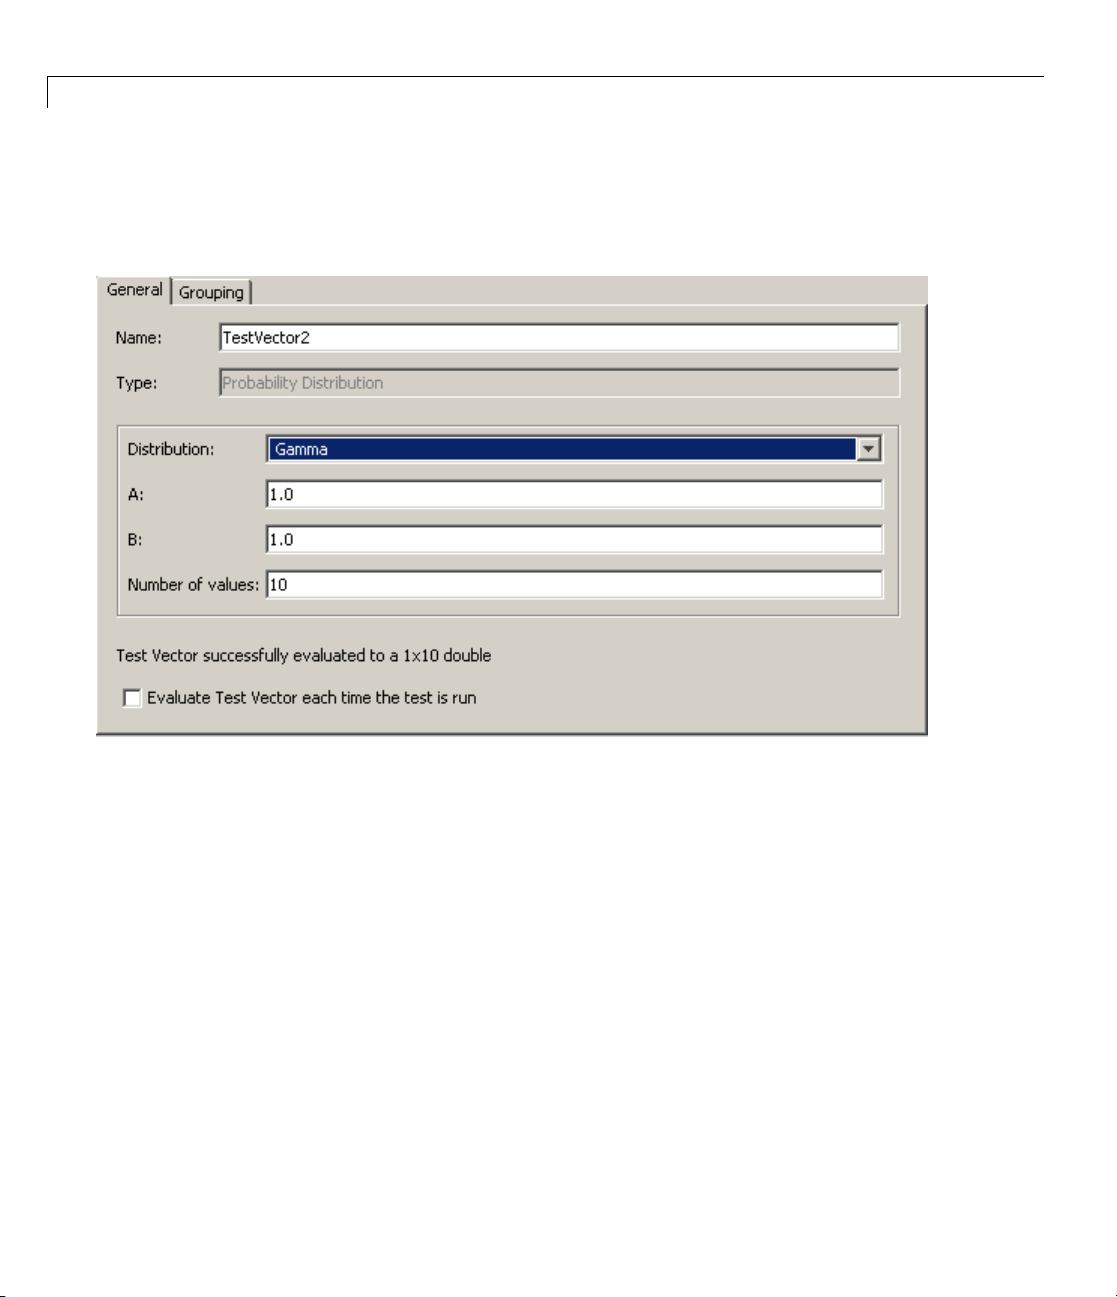
2 Working with Test Vectors
Gamma
The gamma distribution models sums of exponentially distributed random
variables.
2-30
Gamma uses the function gamrnd and takes parameters for A and B.
For more information, see Gamma Distribution in the Statistics Toolbox
documentation.
Page 89
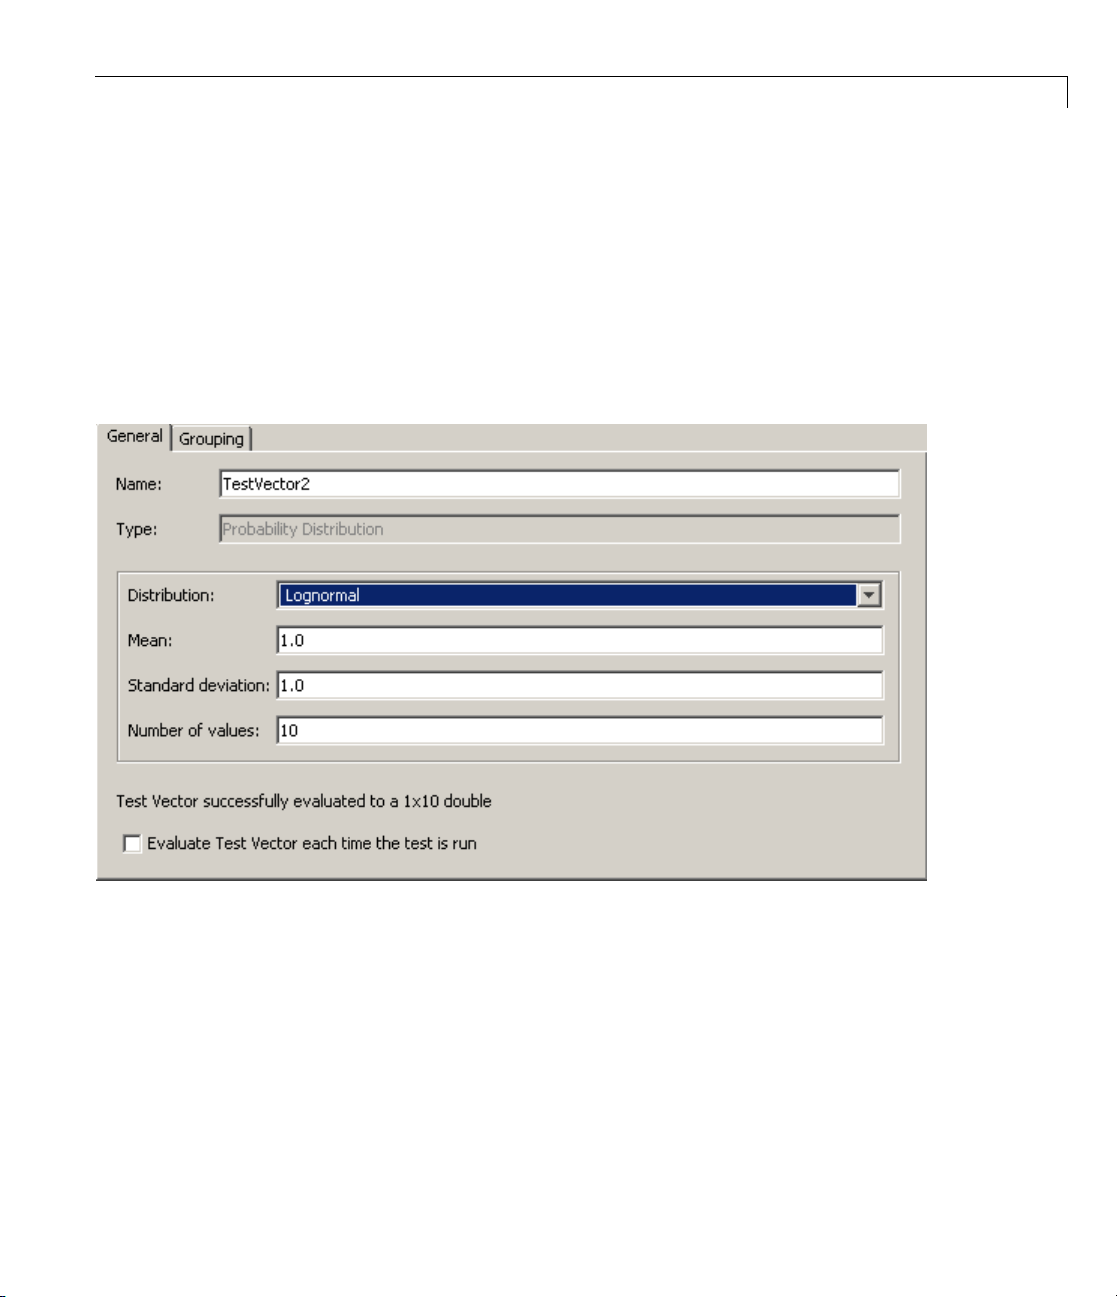
Creating Randomized Test Vectors with Probability Distributions
Lognormal
The normal and lognormal distributions are close ly related. The lognormal
distribution is applicable when the quantity of interest must be positive, since
log(X) exists only when X is positive .
Lognormal can be used to model something that can be thought of as the
multiplicative product of many small independent factors. A common
example is the long-term return rate on a stock investment, because it can
be considered as the product of daily return rates.
rmal uses the
Logno
ard deviation.
Stand
ore information, see Lognormal Distribution in the Statis tics Toolbox
For m
mentation.
docu
lognrnd function and takes parameters for Mean and
2-31
Page 90

2 Working with Test Vectors
T
The T (Student’s t) distribution is a family of curves that depend on a single
parameter v (the degrees of freedom). As v goes to infinity, the T distribution
approaches the standard normal d istribution.
T is often used to estimate properties when the sample size is small.
2-32
Tusesthetrnd function and takes one parameter for Degrees of freedom.
For more information, see Student’s t Distribution in the Statistics Toolbox
documentation.
Page 91

Creating Randomized Test Vectors with Probability Distributions
Weibull
The Weibull distribution is an appropriate analytical tool for modeling the
breaking strength of materials. Current usage also includes reliability
and lifetime modeling. The Weibull distribution is m ore flexible than the
exponential distribution for these p urposes.
Weibull uses the function wblrnd and takes parameters for A and B.
For more information, see Weibull Distribution in the Statistics Toolbox
documentation.
2-33
Page 92

2 Working with Test Vectors
Example: Creati
ng Test Vectors with Probability
Distributions
Many models must
model paramete
in electric mo
tester define
as single fixe
running the mo
to account fo
In this case,
The test var
and shaft in
To create t
1 In the Test
2 In the Insert Test Vector dialog box, select Probability Distribution as
the test vector type.
3 Enter ArmatureResistance in the Name field.
4 In the In
(Gauss
s the model’s parameters as distributions of values, rather than
d values. The tester then performs a Monte Carlo simulation,
r variability in manufacturing.
the tester defines the uncertain motor parameters as test vectors.
ies parameters for armature resistance, armature inductance,
ertia.
he first vector, for a rmature resistance:
sert Test Vector dialog box, use the default distribution, normal
ian).
take into account the effect of evaluating uncertainty in
rs. In this example the tester needs to account for uncertainty
tor characteristics that come off the production line so the
del repeatedly with random combinations of parameter values
Vectors pane, click the New Vector button.
2-34
You do not need to have the Statistics Toolbox software installed to use
normal (Gaussian) since it is included with MATLAB.
5 In the Mean field, enter 1.71.
6 In th
e Standard deviation field, enter
.056.
Page 93

Creating Randomized Test Vectors with Probability Distributions
7 In the Number of values field, enter 1000.
For this vector, the test is varying armature resistance up to a standard
deviation of .056, around a mean of 1.71, and using 1000 values.
8 Click the View Data button to see a visualization of the test vector
data that you configured. This displays a histogram visualization of the
probability distribution data that will be used when the test is run. If you
are not sati sf ied with the data as it is configured, you can adjust one or
more of the parameters and hit Enter to see the changes in the figure
window. In this case, we keep the data, as shown here.
2-35
Page 94

2 Working with Test Vectors
2-36
For more information on viewing the data, see “Viewing Data While
Configuring the Test Vector” on page 2-23.
9 Click
OK in the Insert Test Vector dialog box.
The new vector appears in the Test Vectors pane.
Page 95

Creating Randomized Test Vectors with Probability Distributions
create the second vector, for armature inductance:
To
2-37
Page 96

2 Working with Test Vectors
1 In the Test Vectors pa ne, click the New Vector button.
2 In the Insert Test Vector dialog box, select Probability Distribution as
the test vector type.
3 Enter ArmatureInductance in the Name field.
4 Use the default distribution, normal (Gaussian).
5 In the Mean field, enter .3.
6 In the Standard deviation field, enter .01.
2-38
Page 97
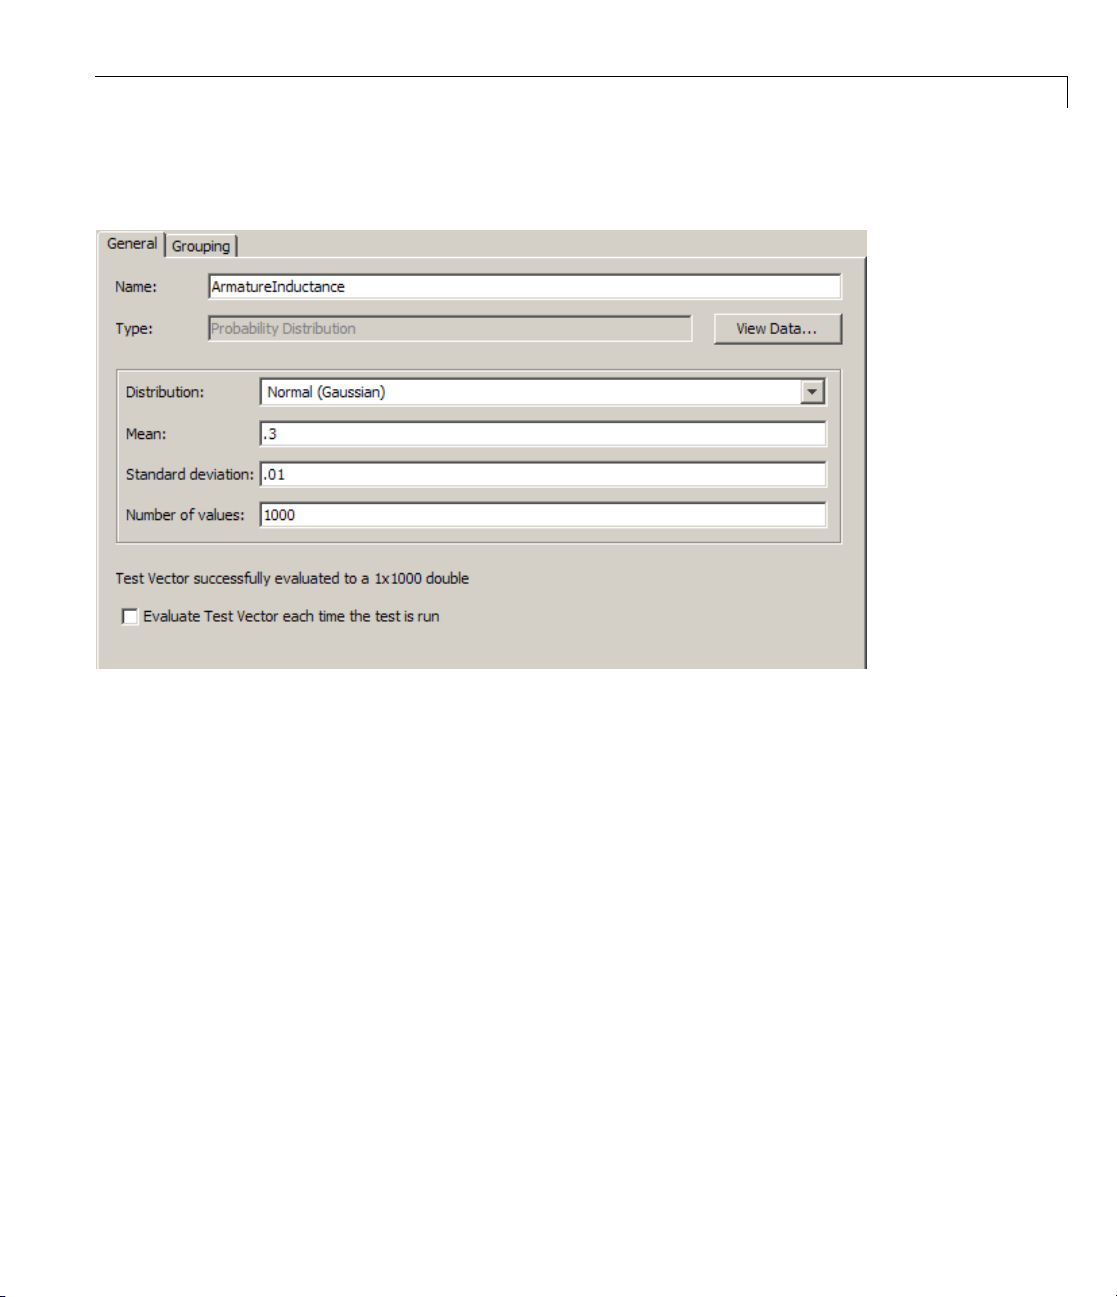
Creating Randomized Test Vectors with Probability Distributions
7 In the Number of values field, enter 1000.
For this vector, the test is varying armature inductance up to a standard
deviation of .01, around a mean of .3, and using 1000 values.
8 You can optionally click the View Data button to see a visualization of the
test vector data that you configured.
9 Click OK in the Insert T est Vector dialog box.
The new vector appears in the Test Vectors pane.
2-39
Page 98

2 Working with Test Vectors
2-40
To create the third vector, for shaft inertia:
Page 99

Creating Randomized Test Vectors with Probability Distributions
1 In the Test Vectors pa ne, click the New Vector button.
2 In the Insert Test Vector dialog box, select Probability Distribution as
the test vector type.
3 Enter ShaftInertia in the Name field.
4 Use the default distribution, normal (Gaussian).
5 In the Mean field, enter 44.5.
6 In the Standard deviation field, enter .443.
2-41
Page 100

2 Working with Test Vectors
7 In the Number of values field, enter 1000.
2-42
For this vector, the test is varying shaft inertia up to a standard deviation
of .443, around a mean of 44.5, and using 1000 values.
8 You can optionally click the View Data button to see a visualization of the
test vector data that you configured.
9 Click OK in the Insert T est Vector dialog box.
The new vector appears in the Test Vectors pane.
 Loading...