

Page 1

Simulink®Report G
User’s Guide
enerator™ 3
Page 2

How to Contact The MathWorks
www.mathworks.
comp.soft-sys.matlab Newsgroup
www.mathworks.com/contact_TS.html T echnical Support
suggest@mathworks.com Product enhancement suggestions
bugs@mathwo
doc@mathworks.com Documentation error reports
service@mathworks.com Order status, license renewals, passcodes
info@mathwo
com
rks.com
rks.com
Web
Bug reports
Sales, prici
ng, and general information
508-647-7000 (Phone)
508-647-7001 (Fax)
The MathWorks, Inc.
3 Apple Hill Drive
Natick, MA 01760-2098
For contact information about worldwide offices, see the MathWorks Web site.
®
Simulink
© COPYRIGHT 1999–2010 by The MathWorks™.
The software described in this document is furnished under a license agreem ent. The software may be used
or copied only under the terms of the license agreement. No part of this manual may be photocopied or
reproduced in any form without prior written consent from The MathW orks, Inc.
FEDERAL ACQUISITION: This provision applies to all acquisitions of the Program and Documentation
by, for, or through the federal government of the United States. By accepting delivery of the Program
or Documentation, the government hereby agrees that this software or documentation qualifies as
commercial computer software or commercial computer software documentation as such terms are used
or defined in FAR 12.212, DFARS Part 227.72, and DFARS 252.227-7014. Accordingly, the term s and
conditions of this Agreement and only those rights specified in this Agreement, shall pertain to and govern
theuse,modification,reproduction,release,performance,display,anddisclosureoftheProgramand
Documentation by the federal government (or other en tity acquiring for or through the federal government)
and shall supersede any conflicting contractual terms or conditions. If this License fails to meet the
government’s needs or is inconsistent in any respect with federal procurement law, the government agrees
to return the Program and Docu mentation, unused, to The MathWorks , Inc.
Trademarks
MATLAB and Simulink are registered trademarks of The MathWorks, Inc. See
www.mathworks.com/trademarks for a list of additional trademarks. O ther product or brand
names may be trademarks or registered trademarks of their respective holders.
Patents
The MathWorks products are protected by one or more U.S. patents. Please see
www.mathworks.com/patents for more information.
Report Generator™ User’s Guide
Page 3

Revision History
January 1999 First printing New (Release 11)
December 2000 Second printing Revised (Release 12)
June 2004 Third printing Revised for Version 2.02 (Release 14)
August 2004 Online only Revised for Version 2.1
October 2004 Online only Revised for Version 2.1.1 (Release 14SP1)
December 2004 Online only Revised for Version 2.2 (Release 14SP1+)
April 2005 Online only Revised for Version 2.2.1 (Release 14SP2+)
September 2005 Online only Revised for Version 2.3.1 (Release 14SP3)
March 2006 Online only Revised for Version 3.0 (Release 2006a)
September 2006 Online only Revised for Version 3.1 (Release 2006b)
March 2007 Fourth printing Revised for Version 3.2 (Release 2007a)
September 2007 Fifth printing Revised for V ersion 3.2.1 (Release 2007b) This publication
was previously for MATLAB
Simulink
®
only.
®
and Simulink®.Itisnowfor
March 2008 Online only Revised for Version 3.3 (Release 2008a)
October 2008 Online only Revised for Version 3.4 (Release 2008b)
October 2008 Online only Revised for Version 3.5 (Release 2008b+)
March 2009 Online only Revised for Version 3.6 (Release 2009a)
September 2009 Online only Revised for Version 3.7 (Release 2009b)
March 2010 Online only Revised for Version 3.8 (Release 2010a)
Page 4

Page 5

User’s Guide
Getting Started
1
Product Overview ................................. 1-2
Contents
What Is the Report Explorer?
About the Report Explorer
System De sig n Description Report
Opening the Report Explorer
The Outline Pane
The Options Pane
The Properties Pane
Simulink
How Simulink
Software Interact
Supported Report Formats
Browser Requirements for Web Views
®
Report Generator Workflow .............. 1-9
................................. 1-5
................................. 1-6
............................... 1-7
®
Report Generator and Simulink
................................ 1-10
....................... 1-3
.......................... 1-3
.................... 1-3
........................ 1-3
......................... 1-12
............... 1-13
Examples
Creating Reports .................................. 2
v
Page 6

Generating Reports from MATLAB Files ............. 2
Creating Web Views
Working with Components
............................... 2
......................... 2
Generating a System Design Description
2
The System Design Description Report .............. 2-2
What is the Report?
What You Can Do with the Report
Report Contents
Limitations
Choosing Report Options
Opening the System Design Description Options Dialog
Box
Choosing Report Options
Creating a Customized Version of the Report
Activating and Editing the Eval Component
Adding or Editing Other Components
Building a Dialog Box for a Custom Report Template
...................................... 2-5
........................................... 2-6
................................ 2-2
................... 2-2
.................................. 2-2
........................... 2-6
........................... 2-6
........ 2-8
............ 2-8
................. 2-9
.... 2-9
vi Contents
Creating Simulink Reports
3
About This Tutorial ................................ 3-2
Setting Report Options in the Report Template
Adding Components to the Report Template
What Are Components?
............................ 3-5
...... 3-3
......... 3-5
Page 7

Adding MATLA B Code ............................. 3-7
Adding a Title Page
Opening the Simulink Model
Adding Logical Then and Logical Else Components
Displaying an Error When the Model Cannot Be Opened
Creating the Body of the Report
................................ 3-13
........................ 3-16
...... 3-18
.. 3-19
...................... 3-22
Generating the Report
............................. 3-49
Generating Reports
4
Setting Report Output Options ..................... 4-2
Setting Preferences
Setting the Report File Folder
Setting the Report File Name
Setting the Report Format
Viewing and Printing Reports
Converting English Strings to Other Languages
Autosaving Report Templates
Reporting Compiled Simulink Model Data
Regenerating Images
Including a Report Description
Converting XML Documents
Why Convert XML Documents?
Converting XML Documents Using the Report Explorer
Converting XML Documents Using the Command Line
Editing XML Source Files
................................ 4-2
....................... 4-3
........................ 4-4
.......................... 4-4
....................... 4-8
........ 4-9
....................... 4-9
............. 4-9
.............................. 4-10
...................... 4-10
........................ 4-11
...................... 4-11
........................... 4-13
.. 4-11
.. 4-13
Creating Log Files
Generating MATLAB Code from Report Templates
Working with Legacy Report Templates
What Are Legacy Report Templates?
Enabling Legacy Interfaces
UsingLegacyInterfaces
................................. 4-14
............. 4-18
.................. 4-18
......................... 4-18
............................ 4-19
... 4-15
vii
Page 8

Troubleshooting ................................... 4-20
Managing Memory Usage
Displaying HTML Reports on UNIX Systems
........................... 4-20
........... 4-21
Exporting Simulink Models to Web Views
5
What Are Web Views? .............................. 5-2
Exporting Models to the Web
Opening the Export Interface
Setting Export Options
Generating and Reviewing Web Views
Navigating Web Views
Displaying Web Views
Viewing the Current Layer
Viewing Other Layers
Viewing All Layers
Tutorial: Creating Web Views of Simulink Models
About This Tutorial
Specifying Web View Export Options
Exporting M odels
Navigating Web Views
Troubleshooting
Addressing Web View Display Issues
................................... 5-22
............................. 5-3
............................. 5-7
............................. 5-7
.............................. 5-8
................................ 5-9
................................ 5-11
................................. 5-13
............................. 5-15
....................... 5-3
........................ 5-3
................ 5-5
.......................... 5-7
................. 5-11
................. 5-22
.... 5-11
viii Contents
Working with Components
6
About Components ................................ 6-2
Page 9

Working with Looping Components ................. 6-3
About Looping Components
Editing the Figure Loop Tutorial Report Template
Displaying Figure s
Editing Figure Loop Components
................................ 6-4
......................... 6-3
...... 6-3
.................... 6-4
Working with Property Table Components
About Property Table Components
Opening the Example Report Template
Examining the Property Table Output
Selecting Object Types
Displaying Property Name/Property Value Pairs
Editing Table Titles
Entering Text into Table Cells
Adding, Replacing, and Deleting Properties in Tables
Displaying or Hiding Cell Borders
Adding and Deleting Columns and Rows
Resizing Columns
Merging and Splitting Cells
Zooming and Scrolling
Selecting Tables
Working with Summary Table Components
About Summary Table Components
Opening the Example Report Template
Selecting Object Types
Adding and Removing Properties
Setting Relative Column Widths
Setting Object Row Options
............................. 6-12
............................... 6-15
................................. 6-18
......................... 6-18
............................. 6-19
.................................. 6-19
............................. 6-23
......................... 6-24
................... 6-9
............... 6-11
................ 6-11
....................... 6-15
.................... 6-17
.............. 6-18
.................. 6-21
............... 6-23
..................... 6-23
..................... 6-24
........... 6-9
........ 6-12
.... 6-16
.......... 6-21
Comparing XML Files Exported from Simulink
7
How to Compare XM L Files Exported from Simulink
Models
Introduction
Overview o f XML Comparison
Selecting Files to Compare
Demos of XML Comparison
......................................... 7-2
...................................... 7-2
....................... 7-3
.......................... 7-4
......................... 7-6
Models
ix
Page 10

See Also ......................................... 7-6
Using the XML Com parison Report
Navigating the Simulink XML Comparison Report
Displaying Item s in Original Models
Filtering Out Nonfunctional Changes
Understanding the Report
Saving Comparison Files in a Zip File
Comparing XML Exported From Models Managed With
Subversion
Introduction
Create file_comparison_driver Function
Configure TortoiseSVN
Test TortoiseSVN Setup
Example file_com parison_driv er Code
Known Limitations and Workarounds
Unexpected Re sults
Setting File and Memory Sizes
Comparing XML Files from Models with Identical
Names
CannotExportXMLTextFiles from Uns a ve d Models
Errors from UNC Paths
Resolving C os metic Issues with the HTML Browser
Working with Referenced M odels and Library Links
...................................... 7-13
...................................... 7-13
................................ 7-19
........................................ 7-20
.......................... 7-11
............................. 7-14
............................ 7-16
............................ 7-21
.................. 7-7
...... 7-7
.................. 7-9
................. 7-11
................. 7-12
............... 7-14
................. 7-17
............... 7-19
....................... 7-19
.... 7-21
..... 7-21
..... 7-22
x Contents
Component Reference
8
Real-Time Workshop Components ................... 8-2
Requirements Management Interface Components
Simulink Components
Simulink Blocks Components
.............................. 8-4
....................... 8-7
... 8-3
Page 11

Simulink®Fixed Point Components ................. 8-8
9
10
Stateflow Components
GUI .............................................. 10-2
Report Generation
Web Views
........................................ 10-4
............................. 8-9
Components: Alphabetical List
Function Reference
................................. 10-3
11
A
Functions – Alphabetical List
Examples
Creating Reports .................................. A-2
Generating Reports from MATLAB Files
Creating Web Views
............................... A-2
............. A-2
xi
Page 12

Working with Components ......................... A-2
Index
xii Contents
Page 13

User’s Guide
Chapter 1, Getting Started (p. 1-1) Overview of Simulink®Report
Generator™ product
_
Chapter 2, Generating a System
Design Description (p. 2-1)
Chapter 3, Creating Simulink
Reports (p. 3-1)
Chapter 4, Generating Reports
(p. 4-1)
Chapter 5, Exporting Simulink
Models to Web Views (p. 5-1)
Chapte
Compon
Chapt
Expor
(p. 7
Appe
r6,Workingwith
ents (p. 6-1)
er 7, Comparing X ML Files
ted from Simulink M odels
-1)
ndix A, Examples (p. A-1)
How to create a System Design
Description report for a Simulink
model
A step-by-step example that creates
a Simulink report
How to format and generate reports
How to cr
of Simul
view in
Exampl
templa
Introduces XML comparison
eate interactive renditions
ink models that you can
Web browsers
es of building report
tes with various components
®
Page 14

Page 15

Getting Started
• “Product Overview” on page 1-2
• “What Is the Report Explorer?” on page 1-3
®
• “Simulink
• “How Simulink
page 1-10
• “Supported Report Formats” on page 1-12
• “Browser Requirements for Web Views” on page 1-13
Report Generator Workflow” on page 1-9
®
Report Generator and Simulink Software Interact” on
1
Page 16

1 Getting Started
Product Overview
The Simulink Report Gene rator software creates documentation, called
reports, about Simulink, Stateflow
workflows. It enables you to:
• Create reports for snapshots of models (and their properties) and diagrams.
• Create interactive Web views of models and diagrams.
• Create reports of code generated by the Real-Time Workshop software in
• Document results of model simulation.
• Run checks on models using Model Advisor, and report the results.
• Create comparison reports for XML files.
Adobe
®
Acrobat®PDF and Microsoft®Word formats.
®
,andReal-TimeWorkshop®data and
1-2
Page 17

What Is the Report Explorer?
In this section...
“About the Report Explorer” on page 1-3
“System Design Description Report” on page 1-3
“Opening the Report Explorer” on pag e 1-3
“The Outline Pane” on page 1-5
“The Options P ane ” on page 1-6
“The Properties Pane” on page 1-7
About the Report Explorer
The Report Explorer is th e Simulink Report Generator graphical user
interface (GUI). It allows you to:
• Create and modify report templates.
What Is the Report Explorer?
• Apply stylesheets to f ormat the report.
• Specify the report file format.
• Generate reports.
System Design Description Report
From the Simulink Model Editor, you can access a Simulink Report G ene rator
report called the System Design Description report. The report provides
summary or detailed information about a system design represented by a
model. You can choose report options, using the report dialog, or you can
create a customized version using the Report Explorer. For details, see
“System Design Descriptio n Report” on page 1-3.
Opening the Report Explorer
To open the Report Explorer, click Tools > Report Generator in the
Simulink model window menu bar.
1-3
Page 18

1 Getting Started
Report Generator Help Menu
1-4
Properties paneOutline pane Options pane
The Report Explorer has three panes:
• The Outline pane on the left shows the hierarchy of components in currently
opened report templates. Report components can reside within other report
components, creating parent, child, and sibling relationships. For more
information, see “The Outline Pane” on page 1-5.
Page 19

What Is the Report Explorer?
• The Options pane inthemiddleliststheoptionsavailableinthecontext
of the Outline pane. If no report template is open, the Options pane lists
available reports. When a report template is open, the Options pane lists
components available to insert into it. When a stylesheet is open, the
Options pane lists available attributes. For more information, see “The
Options Pane” on page 1-6 .
• If no report template is open, the Properties pane on the right displays
tasks the Report Explorer can perform. If a report template is open, the
Properties pane displays the prope rties of the currently selected item in the
Options pane. For more information, see “The P roperties Pane” on page 1-7.
Tip If the Report Explorer window opens with only two panes, one of the
panesishidden. Youcanmovetheverticalboundariesbetweenthepanesto
reveal any hidden pane, or to make visible panes wider or narrower.
The Outline Pane
The Outline pane initially includes the top level of the report template.
1-5
Page 20

1 Getting Started
The Options Pane
The Options pane
templates. In th
Formatting, Ha
lists by category components that you can add to report
e following figure, the visible component categories are
ndle Graphics
, Logical and Flow Control,andMATLAB..
The folder ico
represents a c
n represents a component category. The blue square icon
omponent.
1-6
Page 21

What Is the Report Explorer?
The Properties Pane
After you create a report template, the Properties pane initially shows
properties for the report template as a whole.
1-7
Page 22

1 Getting Started
1-8
Page 23

Simulink Report Generator Workflow
1 Open the Report Explorer. In the menu bar on the Simulink model window,
click Tools > Report Generator.
2 Create a new report template. For more information about report
templates, see Simulink Reports.
3 Add existing Simulink or Stateflow components to the report template,
or create your own custom components. For more information on using
components, see Chapter 6, “Working with Components”.
4 Choose an existing stylesheet or create a custom stylesheet to apply styles
and standards to the report template. For more information, see “Creating
Custom Stylesheets” in the MATLAB
5 Generate the report.
The following figure illustrates a typical Simulink Report Generator w orkflow.
®
Simulink®Report Generator™ Workflow
Report Generator™ documentation.
Create
Simulink
model
Open
Report
Explorer
(GUI)
Report Generator
Export
Simulink
Web View
Create
setup
file
components
Add
Apply
stylesheet
Generate
report
1-9
Page 24

1 Getting Started
How Simulink Report Generator and Simulink Software
Interact
The Simulink and Simulink Report Generator software interact to create
reports and Web views. The following table describes these interactions.
User
Interface
Report
Explorer
Simulink
model
window
Interaction with Simulink Report
Generator software Description
The Report Explorer is the Simulink
Report Generator graphical user
interface (GUI). For more information,
see “What Is the Report Explorer?” on
page 1-3.
Use Simulink model window to:
• Export the model to a Web
• Generate a System Design
Description report
• Start the Report Explorer to export
the model to a Web view or create
and generate a report
Simulink Report Generator software also interacts with Real-Time Workshop
and Stateflow software.
Use report generation capabilities with the Real-Time Workshop software to:
Use the Report Explorer to edit
existing report templates, components,
stylesheets, and attributes , or to
customize your own.
Use the Simulink model window to:
• Create reports that incorporate the
current Simulink model
• Export the model to a Web view
For more information, see Chapter
5, “Exporting Simulink Models to
Web Views” and “The System Design
Description Report” on page 2-2.
1-10
• Create Adobe Acrobat PDF and Microsoft Word documents for generated
code.
Use report generation capabilities with the Stateflow software to:
• Take snapshots of charts.
• Describe truth tables.
Page 25

How Simulink®Report Generator™ a nd Simulink®Software Interact
• Document chart hierarchy.
• Document object properties.
1-11
Page 26

1 Getting Started
Supported Report Formats
When the report generation process first creates a report, it generates
a DocBook XML source file. You can custo miz e this XML as needed.
For more information, see the OASIS DocBook TC Web page at
http://www.oasis-open.org.
Next, the report generation process converts the XML source to one of these
user-specified report formats:
• Rich Text Format (RTF)
• Hypertext Markup Language (HTML)
• Microsoft Word (
• Adobe Acrobat PDF
Note Only PDF reports support .bmp and .jpg images.
.doc)
1-12
Page 27

Browser Requirements for Web V iews
Web views require a Web browser that supports Scalable Vector Graphics
(SVG). Web views use SVG to render and navigate m odels.
The MathWorks recommends the follow ing Web browsers:
• Mozilla Firefox Version 1.5 or later, which has native support for SVG. To
download the Firefox browser, see
Note Firefox for Mac OS®platforms does not currently support Web views.
• The Microsoft Internet Explorer®Web browser with the Adobe®SVG
Viewer plug-in. To download the Adobe SVG Viewer plug-in, see
http://www.adobe.com/svg/.
http://www.mozilla.com/.
Browser Requirements for Web Views
1-13
Page 28

1 Getting Started
1-14
Page 29

Examples
Use this list to find examples in the documentation.
_
Page 30

Examples
Creating Reports
ting Simulink Reports”
Generating Re
Chapter 3, “Crea
“How to Compare XML Files Exported from Simulink Models” on page 7-2
ports from MATLAB Files
Generating Reports from MATLAB®Files on page 4-15
Creating Web Views
“Tutorial
: Creating Web Views of Simulink Models” on page 5-11
Working with Components
“Working with Looping Components” on page 6-3
“Working with Property Table Components” on page 6-9
“Workin
Generating Reports on Specified Systems and their Subsystems on page
9-52
Temporarily Omitting a Model from a Loop on page 9-58
g w ith Summary Table Components” on page 6-21
Examples-2
Page 31

2
Generating a System Design
Description
• “The System Design Description Report” on page 2-2
• “Choosing Report Options” o n page 2-6
• “Creating a Customized Version of the Report” on page 2-8
Page 32

2 Generating a System Design Description
The System Design Description Report
In this section...
“What is the Report?” on page 2-2
“WhatYouCanDowiththeReport”onpage2-2
“Report Contents” on page 2-2
“Limitations” on page 2-5
What is the Report?
The System Design Description report describes a system design represented
by a Simulink model. The Simulink Report Generator generates the report
from the model.
What You Can Do with the Report
You can use the System Design Description to
2-2
• Review a system design without having the model open
• Generate summary and detailed descriptions of the design
• Assess compliance with design requirements
• Archive the system design in a format independent of the modeling
environment
• Build a version of the report, using the Report Explorer
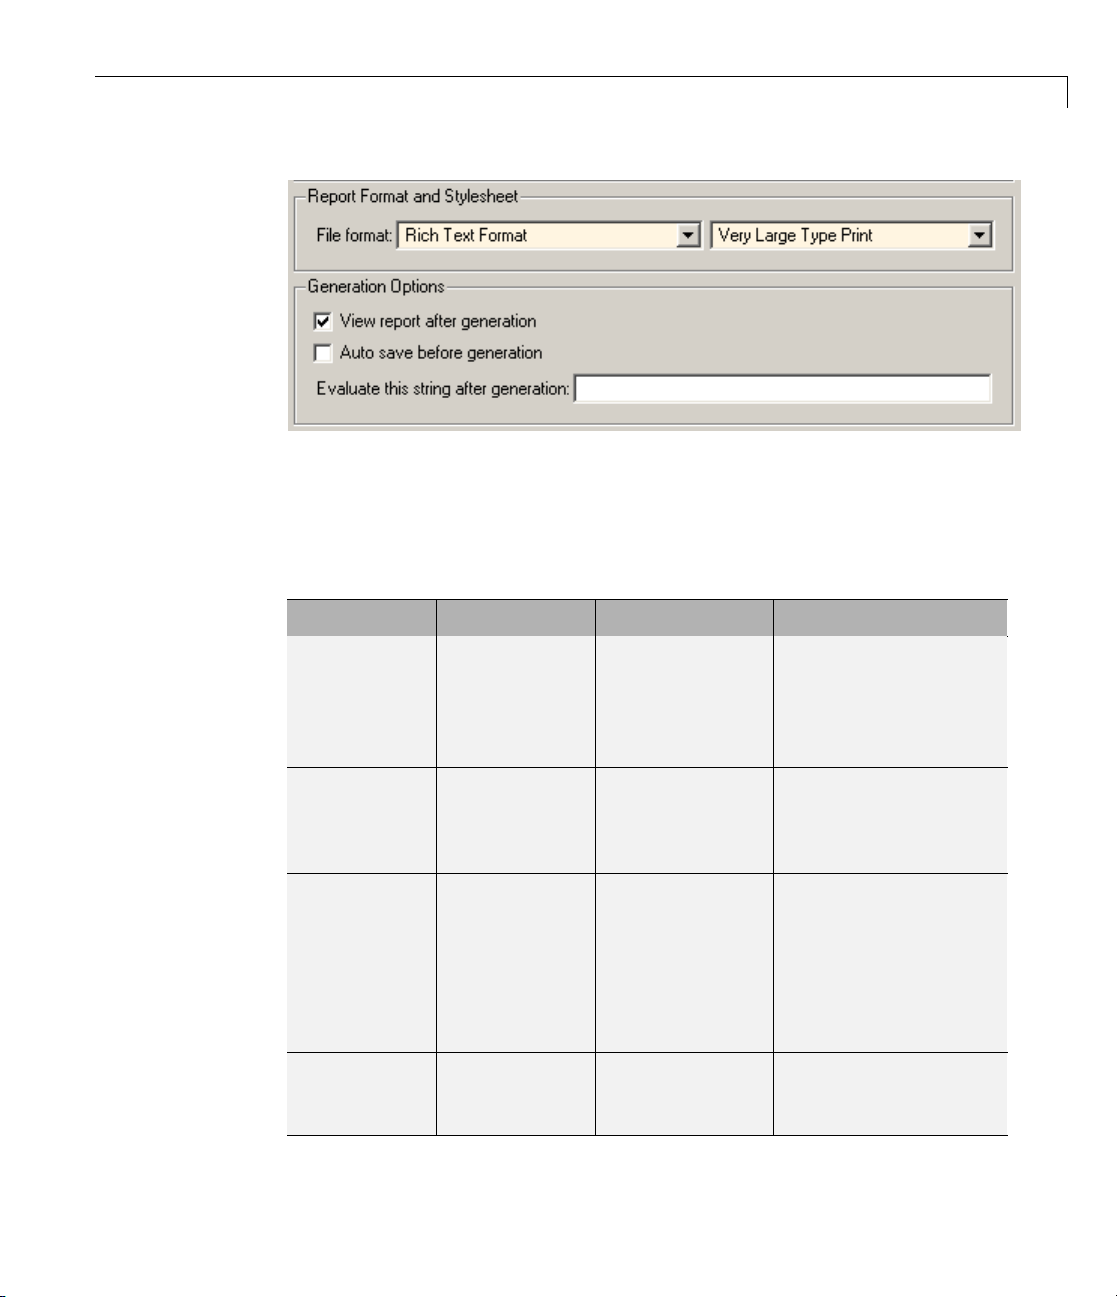
Report Contents
You can generate summary and detailed versions of the System Design
Description.
Page 33

Summary Version
The System Design Descrip tion Report
Section
Report Overview
Root System
Subsystems
System Design Variables
Information
Model version
• Block diagram representing the algorithms
that compute root system outputs
• Description (if available from m odel)
• Interface: name, data type, and other
properties of the system input and output
signals
• Subsystems: the path and a block diagram for
each subsystem
• Look-up tables
• State charts
• Requirements (optional)
• Path
• Block diagram
• Design variables
• Functions in design variable expressions
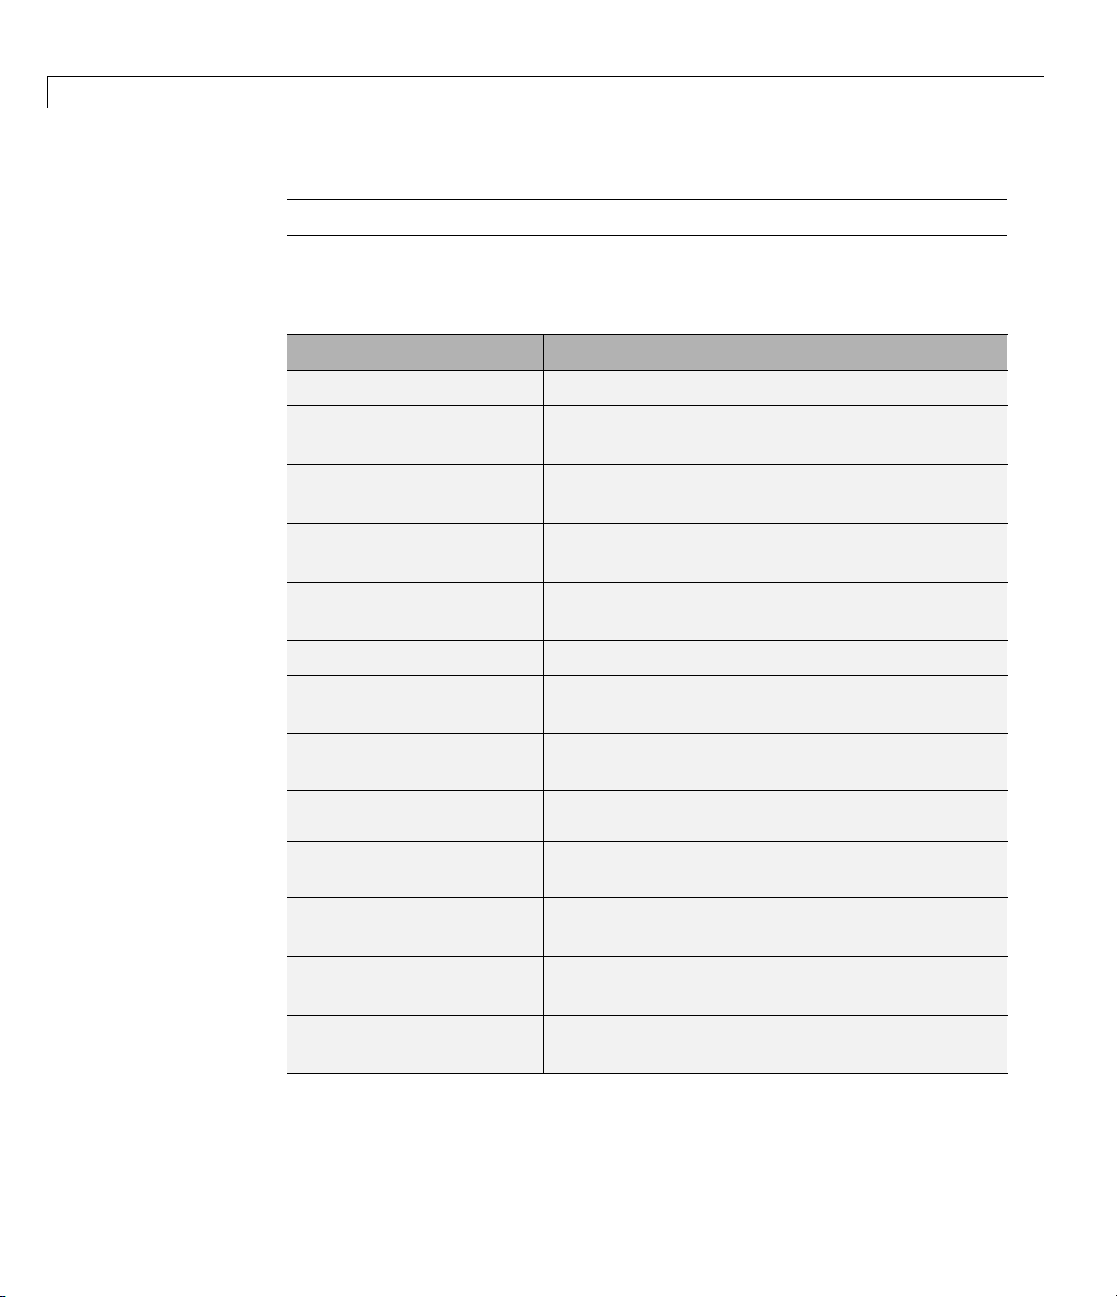
Detailed Version
The detailed version of the report includes all the information that is in the
summary form of the report, as well as more information about the system
components. The atomic subsystem information is more detailed than virtual
subsystem information.
2-3
Page 34

2 Generating a System Design Description
Section
Report Overview
Root system
Subsystems Similar information to the information for the
Information
Model version
• Block diagram representing the algorithms
that compute root system outputs
• Description (if available from m odel)
• Interface: name, data type, and other
properties of the root system input and output
signals
• Block parameters
• Block execution order for root system and
atomic subsystems
• Look-up tables
• State charts
• Requirements (optional)
root system, as well as:
• Path of the subsy stem in the model
• (For atomic subsystems) Checksum that
indicates whether the version of an atomic
subsystem used to generate the report differs
from other versions of the subsystem
2-4
State Charts • State chart
• States
• Transitions between the states
• Junctions
• Events that trigger state transitions
• Data types
• Targets
Page 35

The System Design Descrip tion Report
Report Captures Documentation Included in a Model
The System Design Description reports documentation included in a model,
including:
• The model description (from the m odel properties)
• The block property
• DocBlock model documentation blocks
Consider adding descriptive information in a model in these ways, to enrich
the generated System Design Description.
Description
Limitations
The System Design Description report does not include:
• Referenced models
- For each referenced model you want a System Design Description, you
must generate a separate report.
• Simulink data objects
2-5
Page 36
2 Generating a System Design Description
Choosing Report Options
In this section...
“Opening the System De sig n Description Options Dialog Box” on page 2-6
“Choosing Report Options ” on page 2-6
Opening the System Design Description Options
Dialog Box
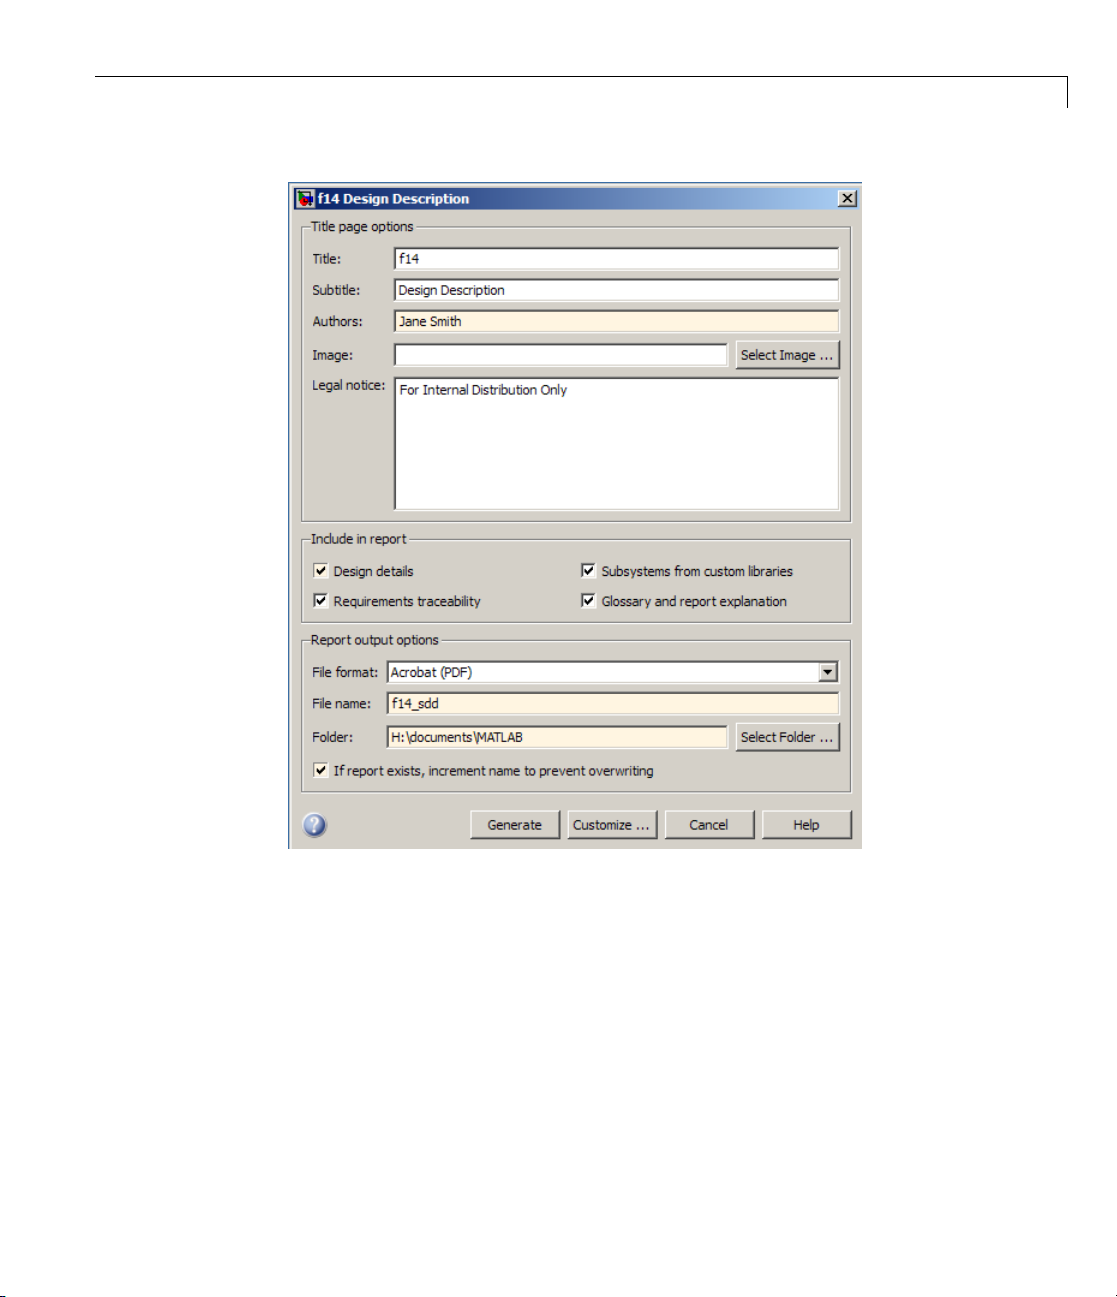
To open the System Design Description dial og box:
1 Open the model or subsystem for which you want to generate a report.
2 From the Simulink Model Editor File menu, select Reports > System
Design Description. The System Design Description dialog box opens, in
which you choose report options, generate, and save t he report.
2-6
Choosing Report Options
You can specify options for layout and content:
• Title page contents
• Report content
• Report file format and storage location
Page 37
Choosing Report Options
In the
on the
To cr
cust
the c
Repo
dialog box, to display detailed information about each option, right-click
option pro mpt and select the What’s Thiscontext-sensitive help.
eate a customized version of the report, click the Customize button. The
omize option creates a copy of the template file for the report and opens
opy in the Report Explorer. See “Creating a Customized Version of the
rt” on page 2-8.
2-7
Page 38
2 Generating a System Design Description
Creating a Customized Version of the Report
In this section...
“Activating and Editing the Eval Component” on page 2-8
“Adding or Editing Other Components” on page 2-9
“Building a Dialog Box for a Custom Report Template” on page 2-9
To customize the System Design Descriptio n template in the Simulink Report
Generatorusing the Report Explorer:
1 Activate and edit the Evaluate MATLAB Expression component
2 Add any other desired components.
Activating and Editing the Eval Component
1 In the Report Explorer Outline pane, select the SDD_custom.rpt.
2-8
2 Right-click the Eval component and select Activate/Deactivate
Component.
Page 39

Creating a Customized Version of the Report
3 In the Properties pane, replace the expression with the specific text that
you want, or replace it with another MATLAB
®
expression.
Adding or Editing Other Components
You can add components to the report template. You can also modify
any existing components in the report. See Chapter 6, “Working with
Components”.
Building a D ialog Box for a Custom Report Template
To provide options for your custom report, you can create a dialog box, like
the Sy stem Design Description dialog box. The dialog box that you create for
2-9
Page 40

2 Generating a System Design Description
your custom report can allow others to adapt the report to meet their needs,
without their having to use the Report Explorer.
2-10
Page 41

3
Creating Simulink Reports
• “About This Tutorial” on page 3-2
• “Setting Report Options in the Report Template” on page 3-3
• “Adding Components to the Report Template” on page 3-5
• “Generating the Report” on page 3-49
Page 42

3 Creating Simulink
®
Reports
About This Tutorial
This tutorial demonstrates the following tasks:
• Inserting models and scopes into reports
• Creating tables in reports using workspace data
• Evaluating MATLAB expressions
• Inserting values of workspace variables into reports
• Creating reports with chapters and subsections
• Running loops and flow control
• Handling errors
It show s you how to use the Report Explorer to design a report template and
generate a report that does the following:
• Opens a Simulink model for the van der Pol equation, called the
• Sets the
• Simulates the model each time the
• Collects the results. Results that fall within a specified range appear in a
table in the generated report.
You do not need to know MATLAB or Simulink software to run this tutorial.
However, knowledge of these products might be helpful for understanding th e
MATLAB code and model simulation that executes.
Gain parameter for the Mu block to five different valu es.
Gain parameter is set.
vdp model.
3-2
Page 43

Setting Report Options in the Report Template
Setting Report Options in the Report Template
To create and configure the report template:
1 Start a Simulink software session.
2 Open the Report Explorer by clicking Tools > Report Generator in the
Simulink model window menu bar.
3 Select File >
4 Save the report template.
New to create a report template.
In the Properties pane:
a Specify where to save the report t emplate. To save it in the current
working folder, select
Present Working Directory from the Directory
selection list.
b Specify the report format. In the File format selection list, select
Acrobat (PDF).
c Enter a description for the report. In the Report description text box,
replace the existing contents with the following text.
Tip Copy and paste this code from the HTML documentation into the
Report Explorer.
Simulink Dynamic Report
This report opens up a model, sets a block parameter
several times, simulates the model, and collects the
results. Results that fall within a specified range are
displayed in a table after the test is complete.
The report is configured to test the vdp model only.
By selecting the Eval String component immediately
below the Report component, you can modify
* model
* block
3-3
Page 44

3 Creating Simulink
®
Reports
* parameter
* tested values
5 Click File > Save As to save the report template as
simulink_tutorial.rpt.
The Outline pane on the left displays the new file name.
3-4
Page 45

Adding Components to the Report Template
Adding Components to the Report Template
In this section...
“What Are Components?” on page 3-5
“Adding MATLAB Code” on page 3-7
“Adding a Title Page” on page 3-13
“Opening the Simulink Model” on page 3-16
“Adding Logical Then and Logical Else Components” on page 3-18
“Displaying an Error When the Model Cannot Be Opened” on page 3-19
“Creating the Body of the Report” on page 3-22
What Are Components?
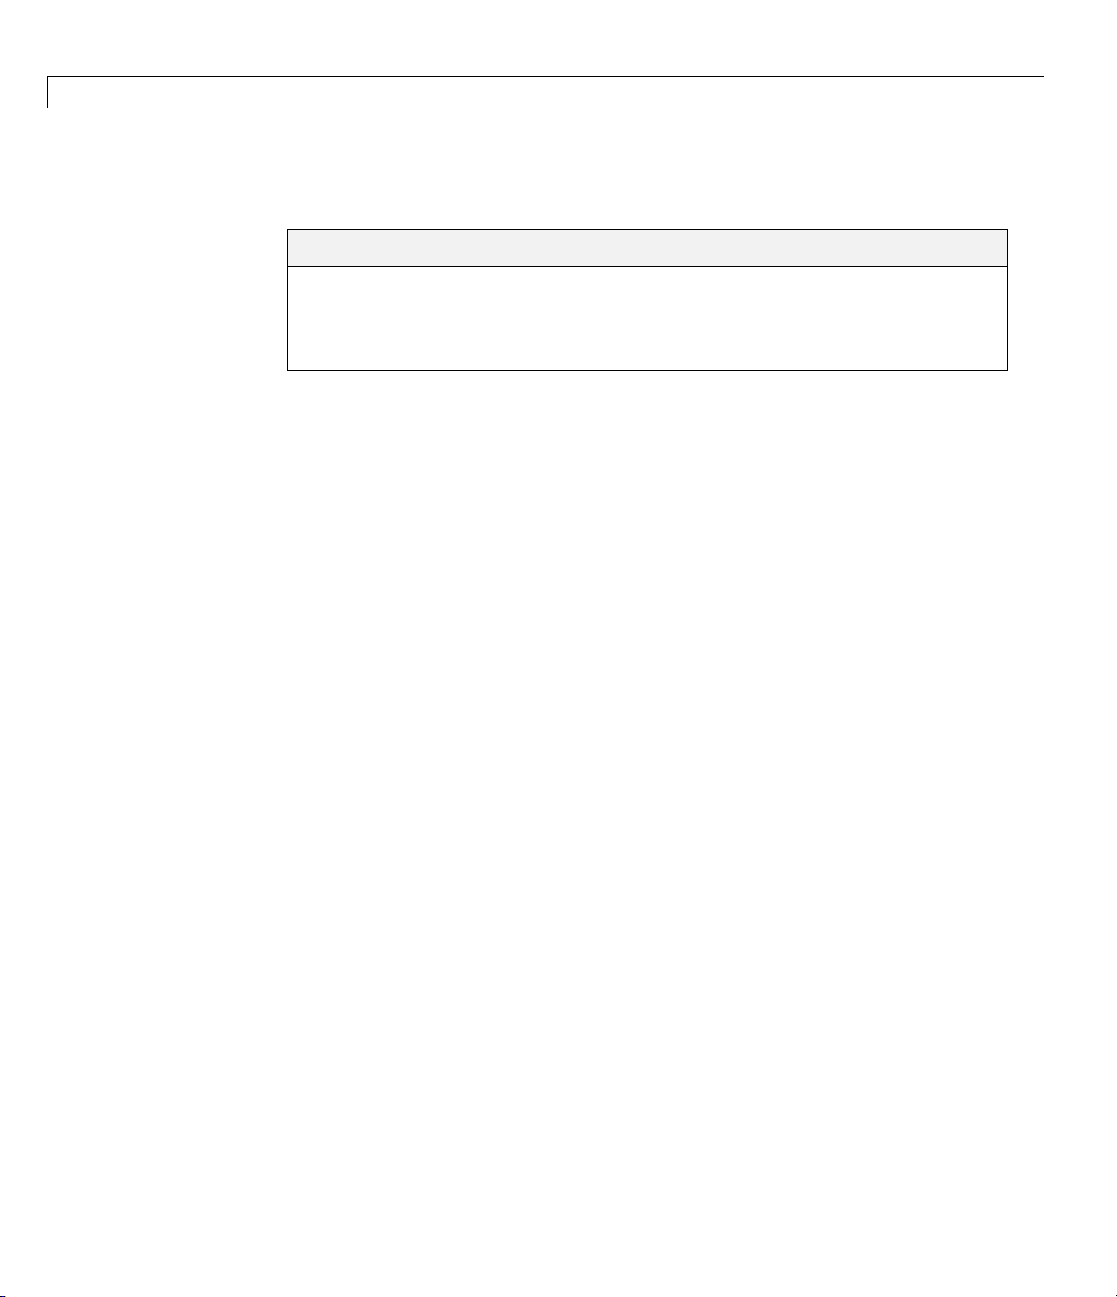
Report components specify what information to include in the report. The
following figure shows a sample page from the report you create in this
tutorial, and which components you use to produce this output.
Note Report components added to the report template must not be
deactivated in order for the report to generate correctly.
3-5
Page 46
3 Creating Simulink
Chapter/
Subsection
component
Paragraph
component
System
Snapshot
component
Chapter/
Subsection
component
®
Reports
3-6
Insert
Variable
component
Scope
Snapshot
component
Page 47
Adding Components to the Report Template
Adding MATLAB Co
The first compon
which evaluates
component assi
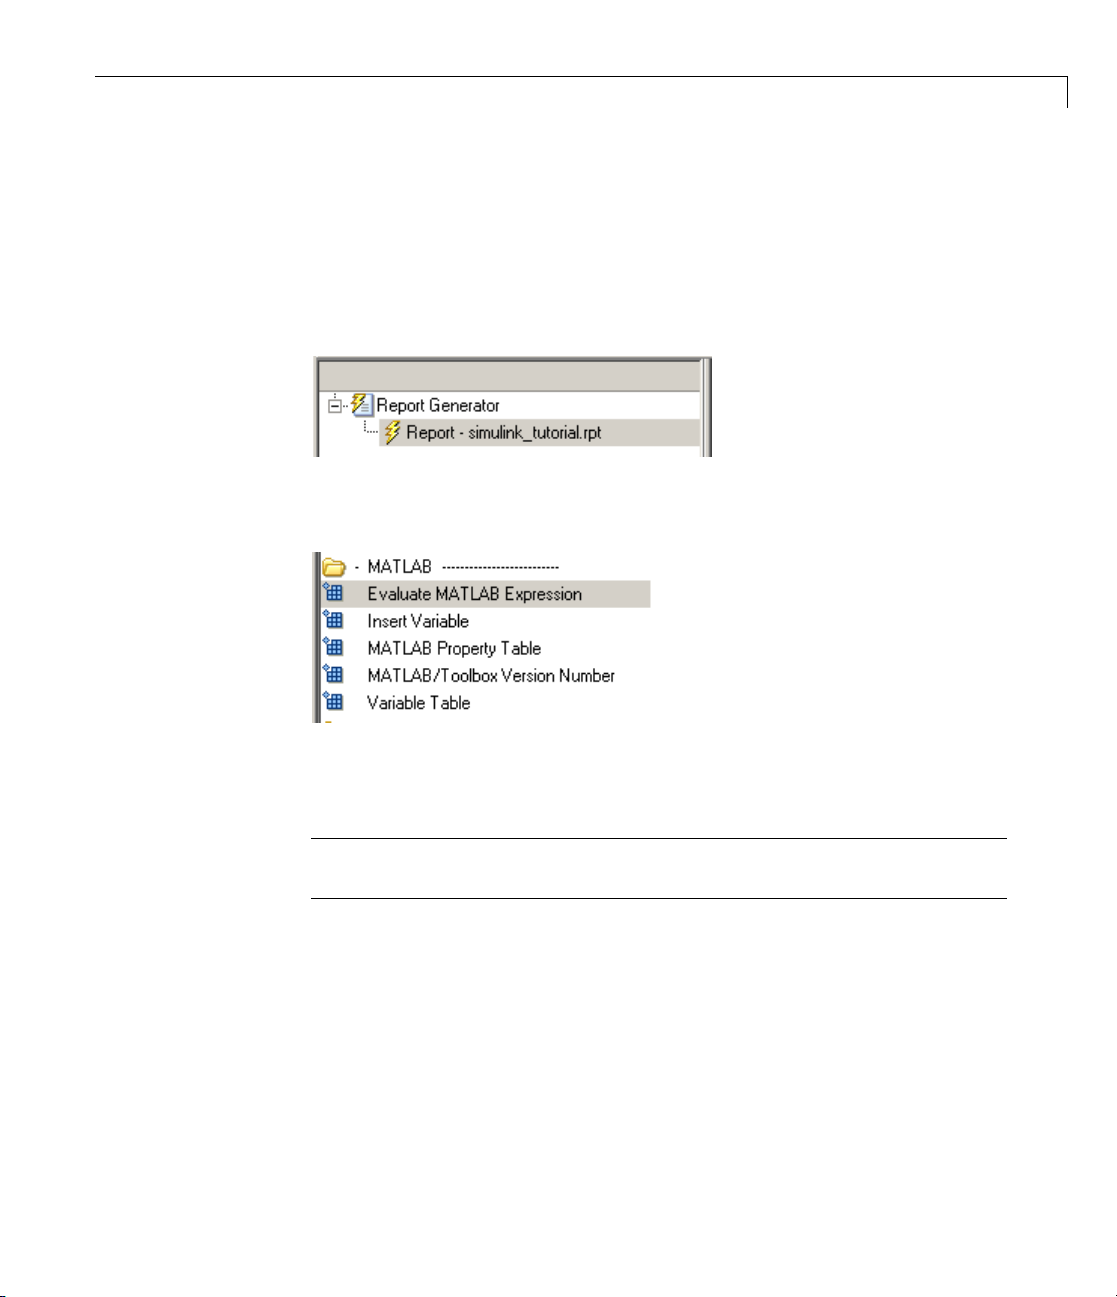
1 In the Outline
2 In the Options pane in the middle, under the MATLAB category, select
Evaluate MATLAB Expression.
3 In the Properties pane on the right, click the icon next to Add component
ent to add is the
MATLAB commands in the workspace. The code in this
gns initial values to variables used in this tutorial.
pane on the left, select
de
Evaluate MATLAB Expression component,
simulink_tutorial.rpt.
to current report to insert the component into the report.
Note You cannot edit the component information in the Properties pane
on the right until you add the component to the report.
In the Outline pane on the l eft, the Evaluate MATLAB Expression
component appears under the simulink_tutorial report template. The
Simulink Report Generator software abbreviates the component name
to
Eval.
3-7
Page 48

3 Creating Simulink
®
Reports
The icon in the upper-left corner of the Eval component’s icon indicates
that this component cannot have child components. By default, any
components you add while the
Eval component is selected are siblings of
this component.
The options for the
Evaluate MATLAB Expression component appear in
the Properties pane on the right.
3-8
Page 49
Adding Components to the Report Template
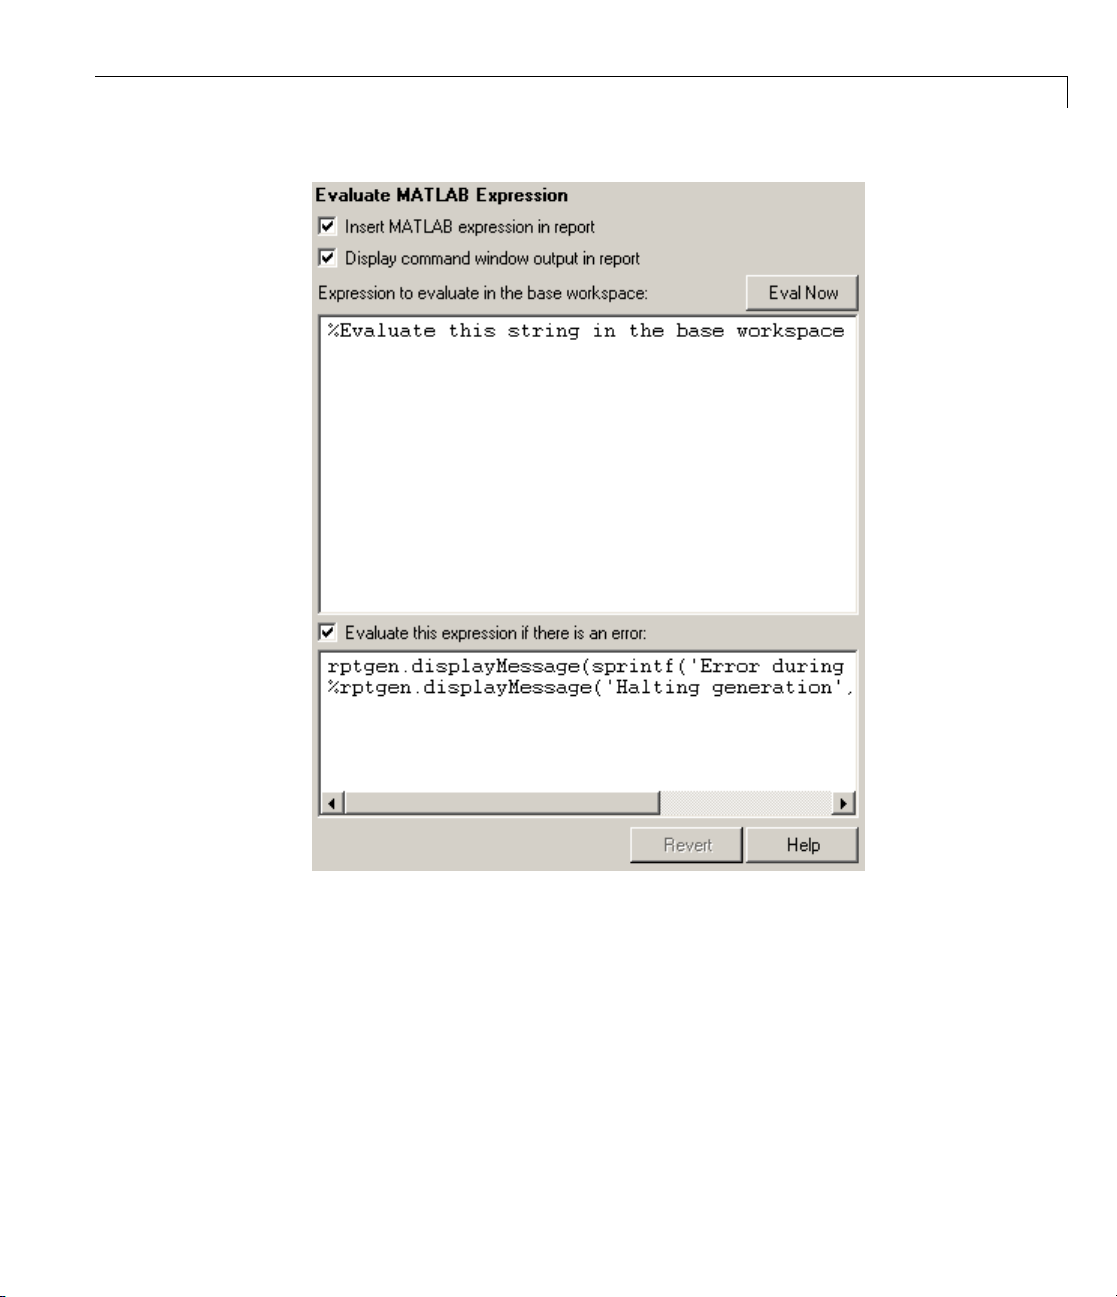
4 Clear the Insert MATLAB expression in report and the Display
command window output in report check boxes so you do not include
MATLAB code or output in this report.
5 Add M
wor
• The
• The
• Th
ATLABcodetotheExpression to evaluate in the base
kspace text box to specify the following values:
model name
block name
e block parameter
3-9
Page 50

3 Creating Simulink
®
Reports
• Parameter values
• Other initial values required for processing the vdp model
Replace the existing text with the following MATLAB code.
%The name of the model
%that will be changed
expModel='vdp';
%The name of the block in the model
%that will be changed
expBlock='vdp/Mu';
%The name of the block parameter
%that will be changed
expParam='Gain';
%The values that will be set
%during experimentation
expValue=[-1 0 .5 1 2];
3-10
%expValue can be either a vector
%or a cell array
testMin=2.1;
testMax=3;
%---- do not change code below line ---
try
open_system(expModel);
end
expOkValues=cell(0,2);
Page 51

Adding Components to the Report Template
Note When you change a field in the Properties pane on the right, the
fieldbackgroundchangescolor(thedefault is a cream color), indicating
that there are unapplied changes to that field. As soon as you perform
operations on another component, the Simulink Report Generator software
applies the changes, and the background color becomes white again.
6 Select the Evaluate this expression if there is an error check box.
7 In the field under the check box, replace the existing text with the following
text:
disp(['Error during eval: ', lasterr])
The Report Explorer window now looks as follows.
3-11
Page 52

3 Creating Simulink
®
Reports
3-12
Page 53

Adding Components to the Report Template
Tip To run the commands that you specified in your MATLAB expression,
click the Eval Now button. This button is located at the upper-right corner
of the Report Explorer. This is an easy way to ensure that your commands
are correct and will not cause report generation problems.
8 Click File > Save to save the report template.
Adding a Title Page
Create a custom title page for your report using the Title Page component.
1 In the Outline pane on the left, select the Eval component.
2 In the Options pane in the m iddle, under the Formatting category, click
Title Page.
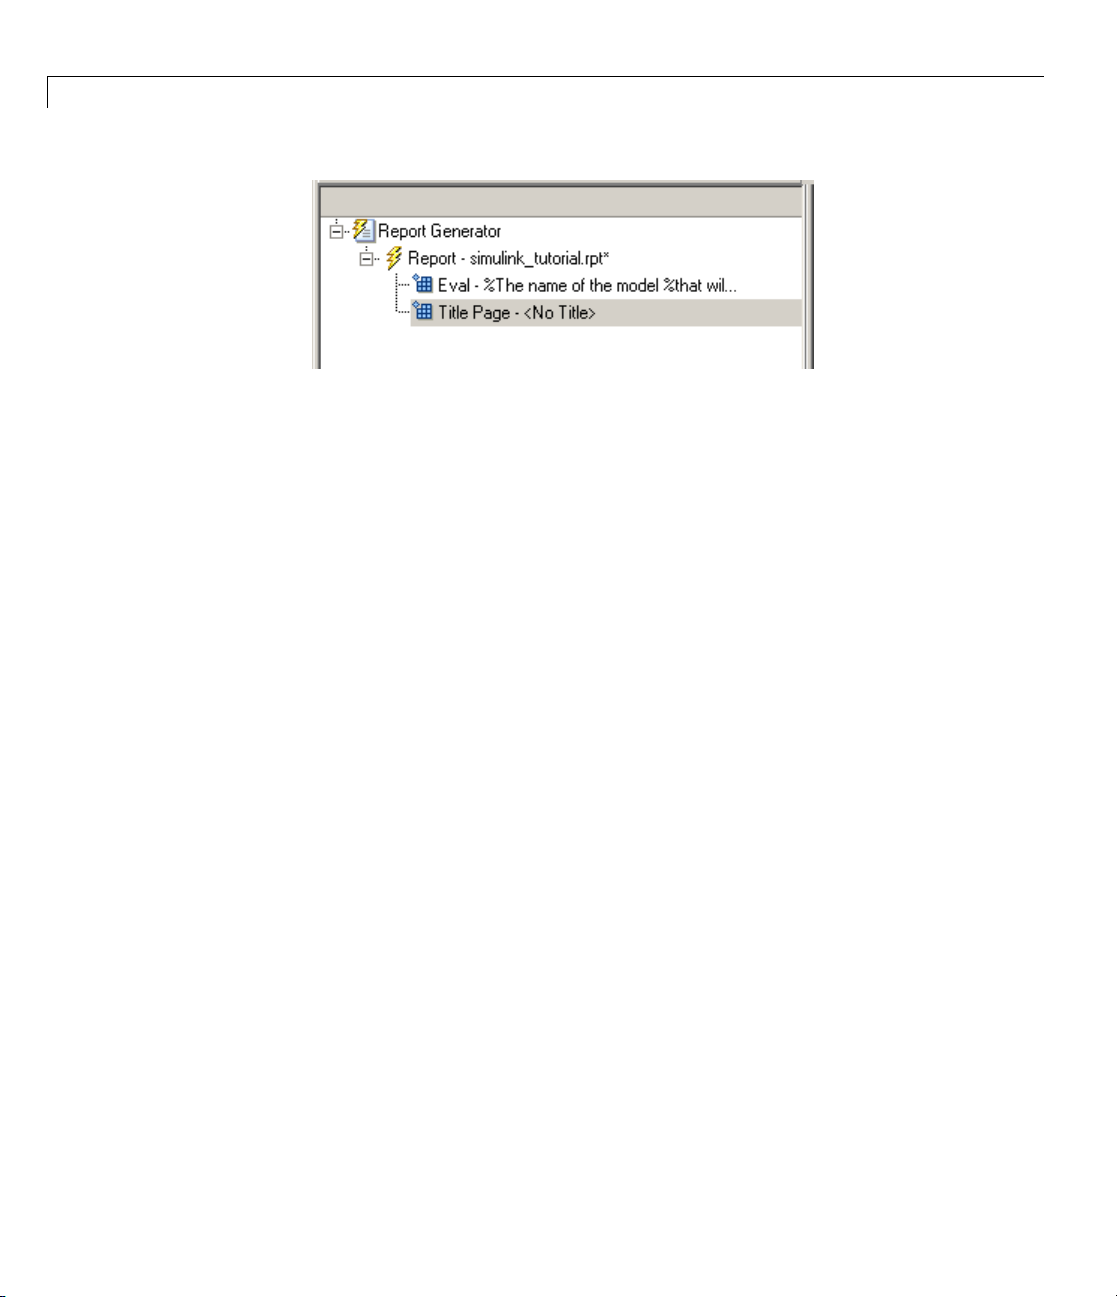
3 Click the icon next to Add component to current report.
The
Title Page component appears in the Outline pane.
3-13
Page 54
3 Creating Simulink
®
Reports
4 In the P roperties pane on the right:
a In the Title text box, enter:
Dynamic Simulink Report
b In the Subtitle text box, enter:
Using Simulink Report Generator to Document Changes
c In the Options section, choose Custom Author from the selection list.
3-14
d Enteryournameinthetextbox.
e Select the Include report creation date check box.
f Select the default date and time format from the selection list. The
Properties pane on the right looks as follows.
Page 55

Adding Components to the Report Template
5 Save the report template.
3-15
Page 56
3 Creating Simulink
®
Reports
Opening the Simu
The following st
that you created
atement in the
in “Adding MATLAB Code” on page 3-7 tries to open the
link Model
Evaluate MATLAB Expression component
vdp model:
try
open_system(expModel);
end
e
Tip Select th
this code ag
To see if th
open_syst
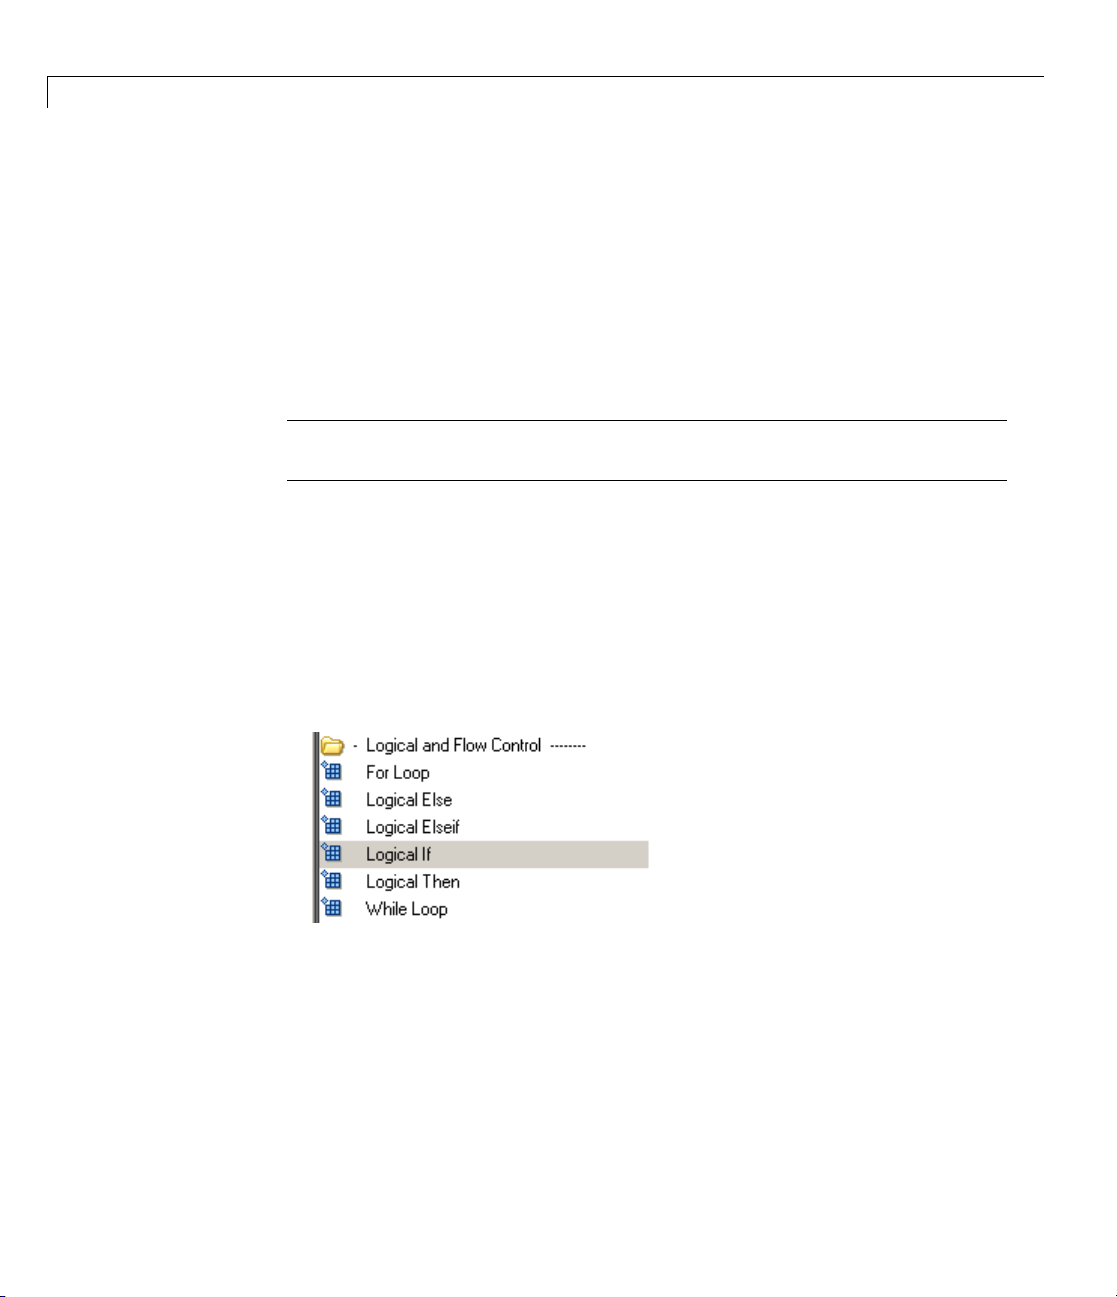
1 In the Out
2 In the Options pane in the middle, under the Logical and Flow Control
Eval component in the Outline pane on the left to loo k at
ain.
e vdp model was successfully opened, test the result of the
em
command using a Logical If component.
line pane on the left, select the
Title Page component.
category, select Logical If. This component checks to see if a given
condition is true or false; in this case, if the model opened successfully.
3-16
3 In the Properties pane on the right, click the icon next to Add component
to current report.The
Logical If component appears as if in the
Outline pane.
Page 57

Adding Components to the Report Template
These components are child components of the report and siblings of one
another. Components can have parent, child, and sibling relationships.
This component can have child components. “Adding Logical Then and
Logical Else Components” on page 3-18 explains how to add two child
components to the
if component.
4 In the Prop
replace th
strcmp(bdroot(gcs),expModel)
The if com
expressi
erties pane on the right, in the Test expression text box,
edefaulttext,
true, with the following text:
ponent name in the Outline pane changes to include this
on.
The strcmp function compares the name of the open Simulink model and
the value of
model opened successfully.
match, and
5 Save the report template.
expModel,whichwassetto'vdp'.Itteststoseeifthevdp
strcmp returns 1 (true)ifthetwostrings
0 (false)ifnot.
3-17
Page 58

3 Creating Simulink
®
Reports
Adding Logical T
The if strcmp(bd
results. Add two
child components to the report template to process these
hen and Logical Else Components
root(gcs), expModel))
component has two possible
cases.
1 In the Outline
2 In the Opt
category
3 In the Outline pane on the left, select the if component again.
4 In the Options pane in the middle, under the Logical and Flow Control
pane on the left, select the
ions pane in the middle, under the
,double-click
Logical Then.
if component.
Logical and Flow Control
category, double-click Logical Else.
Both el
shown i
ements are adde d as child components to the if component, as
ntheOutlinepane.
3-18
Page 59

Adding Components to the Report Template
5 To move the else component under the then component, select the else
component and click the down arrow on the toolbar once. The Outline
pane on the left looks as follows.
6 Save the report template.
Displaying an Error When the Model Cannot Be
Opened
If the if strcmp(bdroot(gcs), expModel)) component fails (the vdp model
cannot open), the
report using the
else component executes. Display an error message in the
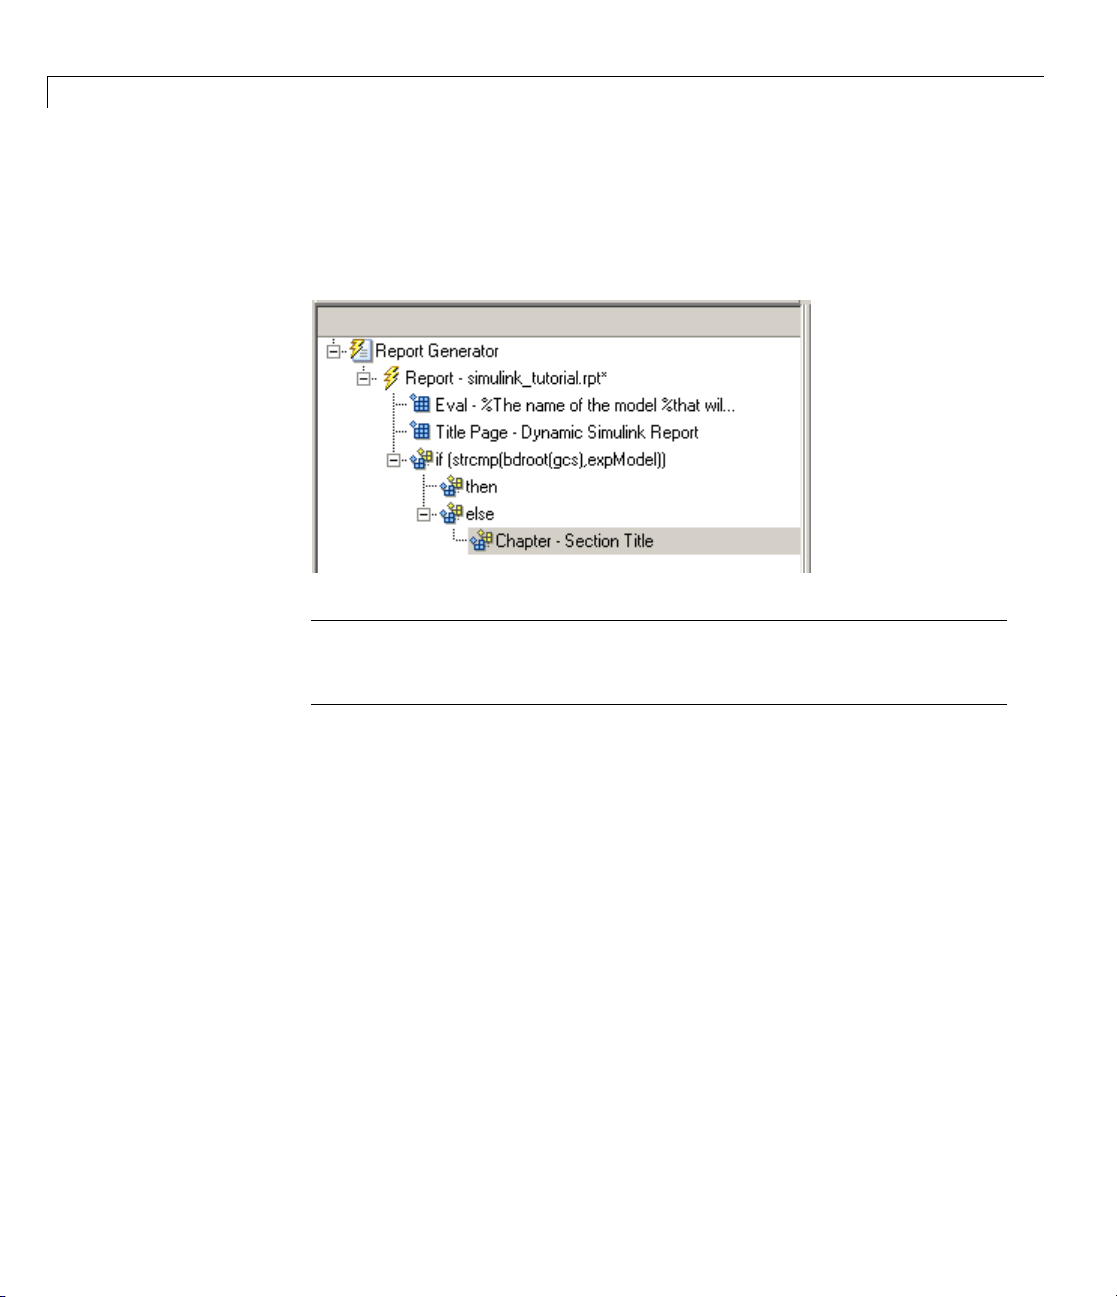
Chapter/Subsection component.
1 In the Outline pane on the left, select the else component.
3-19
Page 60
3 Creating Simulink
®
Reports
2 In the Options pane in the middle, under the Formatting category,
double-click
Chapter/Subsection toadditasachildoftheelse
component. This component displays an error message if an error occurs
when opening the vdp model.
Note When you add a component to a report, it is added by default
as a child component unless the selected component cannot have child
components.
3-20
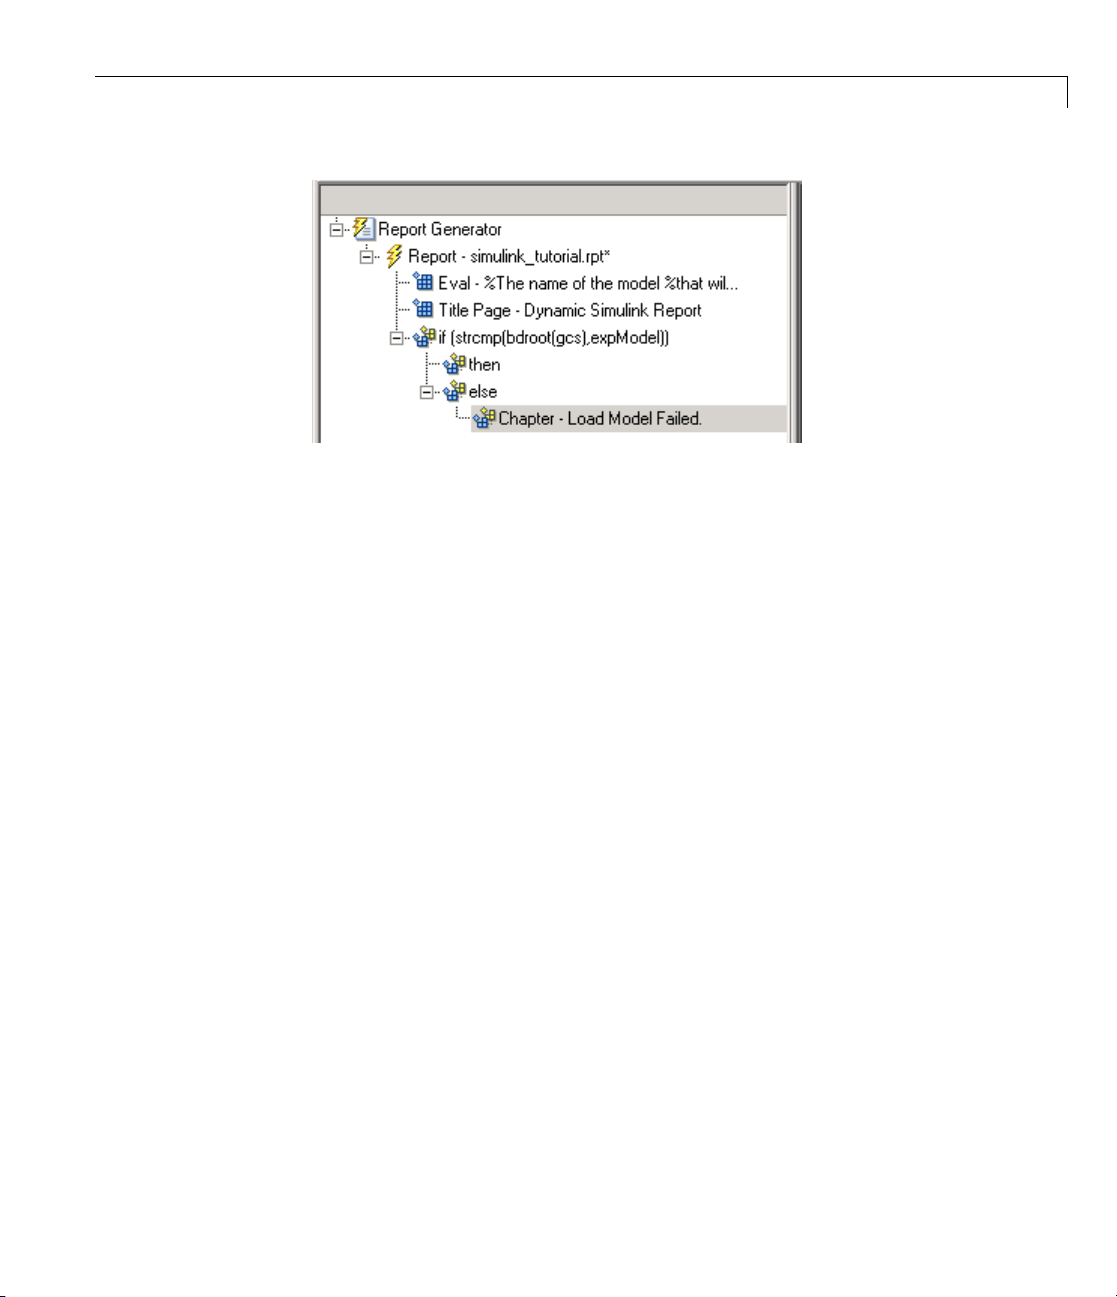
3 In the Properties pane on the right, choose Custom from the Title selection
list, and then enter the following text in the text box:
Load Model Failed.
The Outline pane looks as follows.
Page 61
Adding Components to the Report Template
4 In the Outline pane on the left, select the Chapter component.
5 In the Options pane in the middle, under Formatting, double-click
Paragraph.
6 In the Properties pane on the right, enter the following text in the
Paragraph Text text box to display the f ollowing error message:
Error: Model %<expModel> could not be opened.
The expression %<expModel> indicates that the value of the workspace
variable
expModel is inserted into the text, as in the following example.
Error: Model vdp could not be opened.
The Outline pane on the left looks as follows.
3-21
Page 62

3 Creating Simulink
®
Reports
7 Save the report template.
Creating the Body of the Report
The report generation process performs several tasks to successfully open
the vdp model. Each action requires a separate component under the
component.
then
3-22
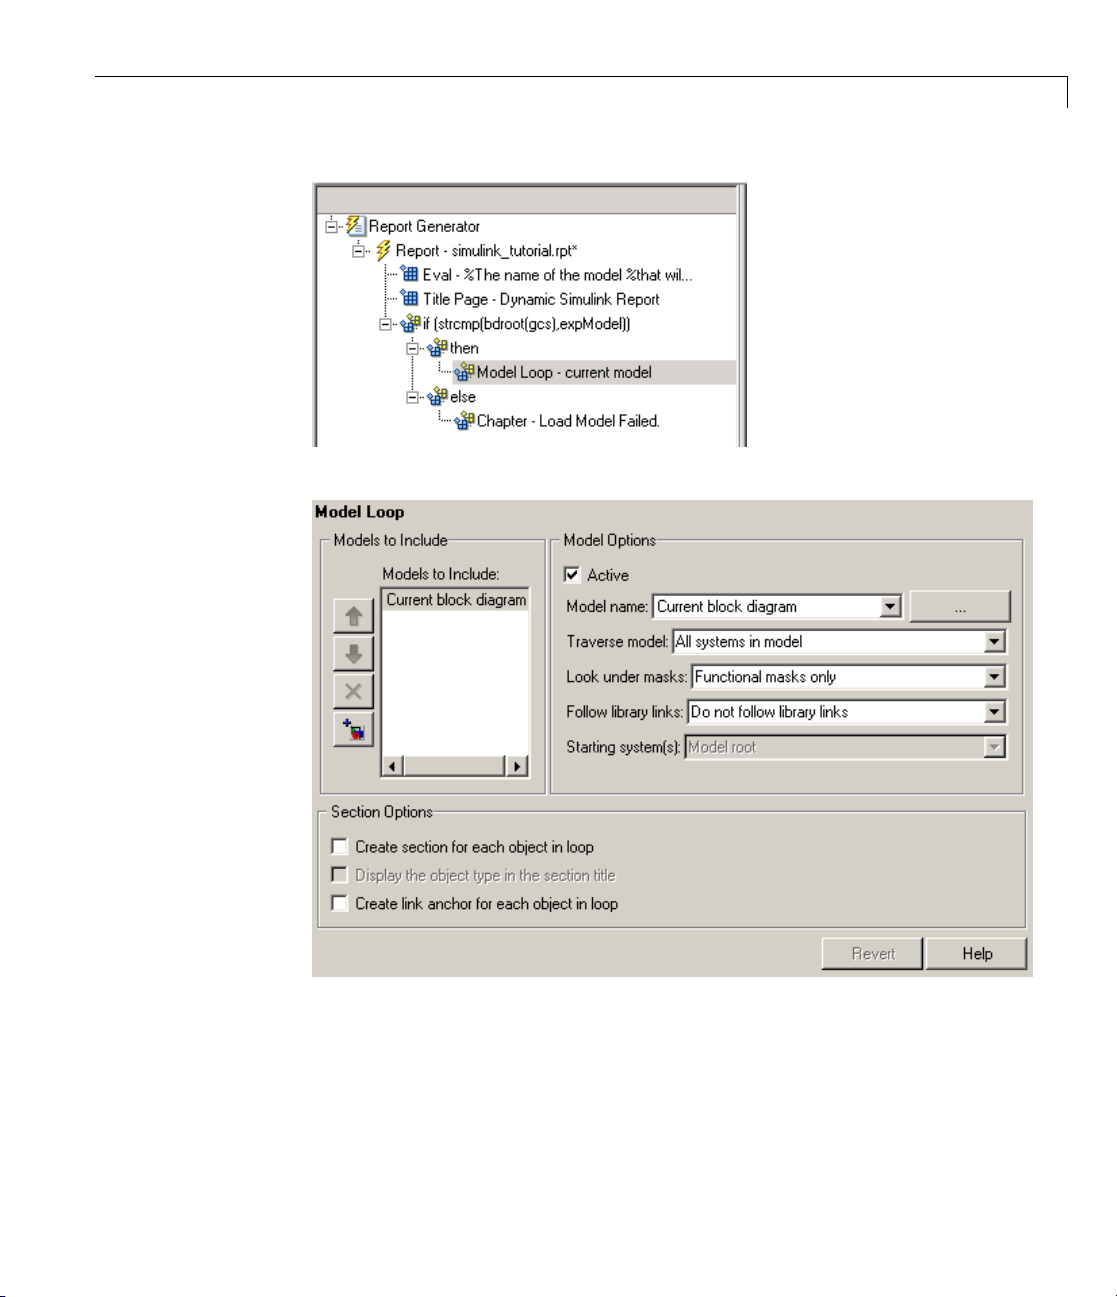
Processi
ng the Model with a Model Loop Component
The report changes the Gain parameter for the Mu block in the vdp model
several times. This task requires a
1 In the Outline pane on the left, select the then component.
2 In the O
and the
compo
ptions pane in the middle, scroll down to the
ndouble-click
Model Loop.Itisaddedasachildofthethen
nent.
Model Loop component.
Simulink category,
Page 63
Adding Components to the Report Template
The Properties pane on the right looks as follows.
3-23
Page 64

3 Creating Simulink
®
Reports
3 In the P roperties pane on the right:
a Select the Active check box to process the vdp model.
b In the Traverse model selection list, select Selected system(s) only
to traverse only the vdp model.
c Select Model root from the Starting system(s) selection list.
d At the botto m of the Properties pane on the rig ht, select the Create
section for each object in loop check box to create a chapter or section
for each model. When you select this check box, the component name in
the Outline pane on the left changes to
Model Loop Chapter.
3-24
e Select the Display th e object type in the section title check box to
include the object type (in this example, model) in the title name.
f Clear the Create link anchor for each object in loop check box.
4 Save the report template.
Adding a Paragraph for Each Model
In each Model Loop Chapter, add an explanation using the Paragraph
component.
1 In the Outline pane on the left, select the Model Loop Chapter component.
2 In the Options pane in the middle, scroll up to the Formatting category,
and then double-click
achildofthe
Model Loop Chapter component.
Paragraph.TheParagraph component is added as
Page 65

Adding Components to the Report Template
3 In the Properties pane on the right, in the Paragraph Text text box, enter
the following text:
This report demonstrates Simulink Report Generator's ability
to experiment with Simulink systems and auto-document
the results. In this report, you load the model
and simulate it %<length> times. This report modifies the
%<expBlock> block's "%<expParam>" value, setting it to the
values
a set of scope snapsnots in the report.
%<expValue>. Each iteration of the test includes
%<expModel>
When this report is generated, the variable names preceded by percent
signs (
%) and enclosed in brackets (<>) are replaced with the values of those
variables in the MATLAB workspace.
4 Save th
e report template.
Inserting a Snapshot of the Model into the Report
eeach
Insid
nt model using the
curre
1 In th
2 In the Options pane in the middle, scroll down to the Simulink category,
and then double-click the
Model Loop Chapter component, include a snapshot of the
System Snapshot component.
e Outline pane on the left, select the
System Snapshot component.
Model Loop Chapter component.
3-25
Page 66

3 Creating Simulink
®
Reports
This component inserts an image of the current model into your report.
The Properties pane on the right looks as follows.
3-26
3 In the P roperties pane on the right:
a Select Zoom from the Scaling selection list.
b Enter 70 as the % value.
4 In the
5 Click the down arrowonthetoolbaroncetomoveitundertheParagraph
Outlinepaneontheleft,selectthe
System Snapshot component.
component.
ve the report template.
6 Sa
Page 67

Adding Components to the Report Template
Adding a Loop for Processing the Model
Create a loop to process the model %length times using the For Loop
component.
1 In the Outline pane on the left, select the System Snapshot component.
2 In the Options pane in the middle, under the Logical and Flow Control
category, double-click For Loop.TheFor Loop component is added as a
sibling of the
System Snapshot component.
3 In the P roperties pane on the right:
a In the End text box, replace the existing text with the following text:
length(expValue)
expValue
is the array of Gain parameter values assigned in the Eval
component with the command expValue=[-1 0 0.5 1 2];.The
expression
b In the Variable name text box, replace the existing text with the name
of the
expIteration
length(expValue) evaluates to 5 in this example.
for loop variable. Enter the following text:
3-27
Page 68

3 Creating Simulink
®
Reports
ThenameoftheFor component in the Outline pane on the left changes
to reflect the loop variable and the termination value.
3-28
4 Save the report template.
Getting the Gain Parameter Value from the expValue Array
For each iteration, get a value from the expValue array to use as the Gain
parameter value. This task requires an Evaluate MATLAB Expression
component.
1 In the Outline pane on the left, select the for component.
2 In the Options pane in the middle, under the MATLAB category, double-click
Evaluate MATLAB Expression. In the Outline pane, the component name
is shortened to
Eval.
Page 69

Adding Components to the Report Template
3 On the Properties pane on the right:
a Clear the Insert M AT LAB expression in report and Display
command window output in report check boxes.
b Enter the following text in the Expression to evaluate in the base
workspace text box:
%Evaluate this string in the base workspace
if iscell(expValue)
Iteration_Value=expValue{expIteration};
else
Iteration_Value=...
num2str(expValue(expIteration));
end
The Iteration_Value variable represents the designated array element.
c Clear the Evaluate expression if there is an error check box.
4 Save the report template.
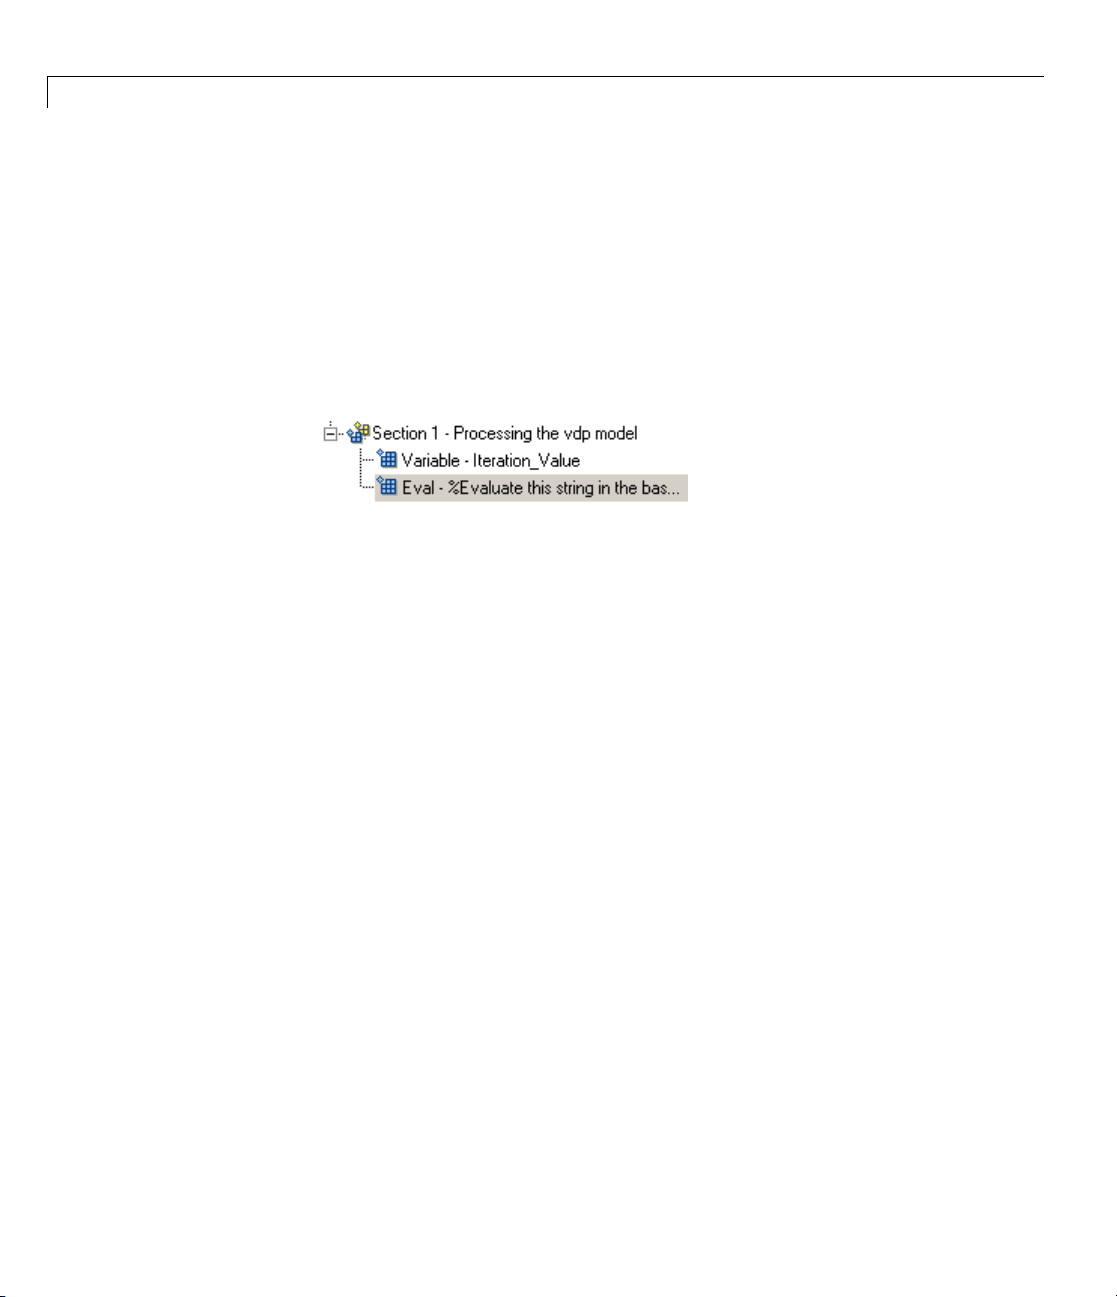
Creating a Section for Each Iteration
Create a separate section for each iteration of the loop that includes the data
using the
Chapter/Subsection component.
3-29
Page 70

3 Creating Simulink
®
Reports
1 In the Outline pane on the left, select the Eval component.
2 In the Options pane in the middle, under the Formatting category,
double-click the
This component is automatically added as
Chapter component (the Model Loop Chapter component).
Chapter/Subsection component to add it as a sibling.
Section 1 because it is inside a
3-30
3 In the P roperties pane on the right:
a In the Title selection list, select Custom.
b In the text box, enter the following title:
Processing the vdp model
This indicates that the section title comes from the first child component.
Do not change any other properties.
4 Save the report template.
Page 71

Adding Components to the Report Template
Inserting the Gain Value into the Report
Insert the Gain value that is used for each simulation.
1 In the Outline pane on the left, select the Section 1 component.
2 In the Options pane in the middle, under the MATLAB category, double-click
Insert Variable.
3 In the P roperties pane on the right:
a In the Variable name text box, enter Iteration_Value.
b In the Display as selecti on list, select Paragraph.
The Outline pane on the left looks as follows.
e the report template.
4 Sav
3-31
Page 72
3 Creating Simulink
®
Reports
Setting the Gain Parameter
For each iteration, set the Gain parameter to the value you extracted from
the
expValue array.
1 In the Outline pane on the left, select the Variable component.
2 In the Options pane in the middle, under the MATLAB category, double-click
Evaluate MATLAB Expression. This component is added as a sibling of
the
Variable component.
3 In the Prop
in report a
erties pane on the right, clear the Insert MATLAB expression
nd Display command window output in report check
boxes.
4 In the Expression to evaluate in the base workspace text box, replace
the existing text with the following text.
set_param(expBlock,expParam,Iteration_Value);
okSetValue=(1);
The set_param command sets the value of the Gain parameter for the Mu
block in the vdp model to the value of Iteration_Value.
5 Make sure you select Evaluate expression if there is an error.Enter
the following text into the text box:
Value=logical(0);
okSet
If the set_param command works, okSetValue is set to 1. If an error
occurs,
okSetValue is set to 0. The next component then reports the error
and terminates processing.
e the report template.
6 Sav
The Outline pane on the left looks as follows.
3-32
Page 73

Adding Components to the Report Template
Checking okSetValue
Check the value of okSetValue using a Logical If component. If the value is
0, the simulation cannot proceed because the Gain parameter could not be set.
1 In the Outline pane on the left, select the Eval component for the
set_param command.
2 In the Options pane in the middle, under the Logical and Flow Control
category, double-click Logical If. The component is added as a sibling
of
Eval.
3 In the Properties pane on the right, in the Test expression text box,
replace
true with okSetValue.
3-33
Page 74
3 Creating Simulink
®
Reports
okSetValue can be 1 (true)or0 (false), so insert two components—Logical
and Logical Else — to process those conditions:
Then
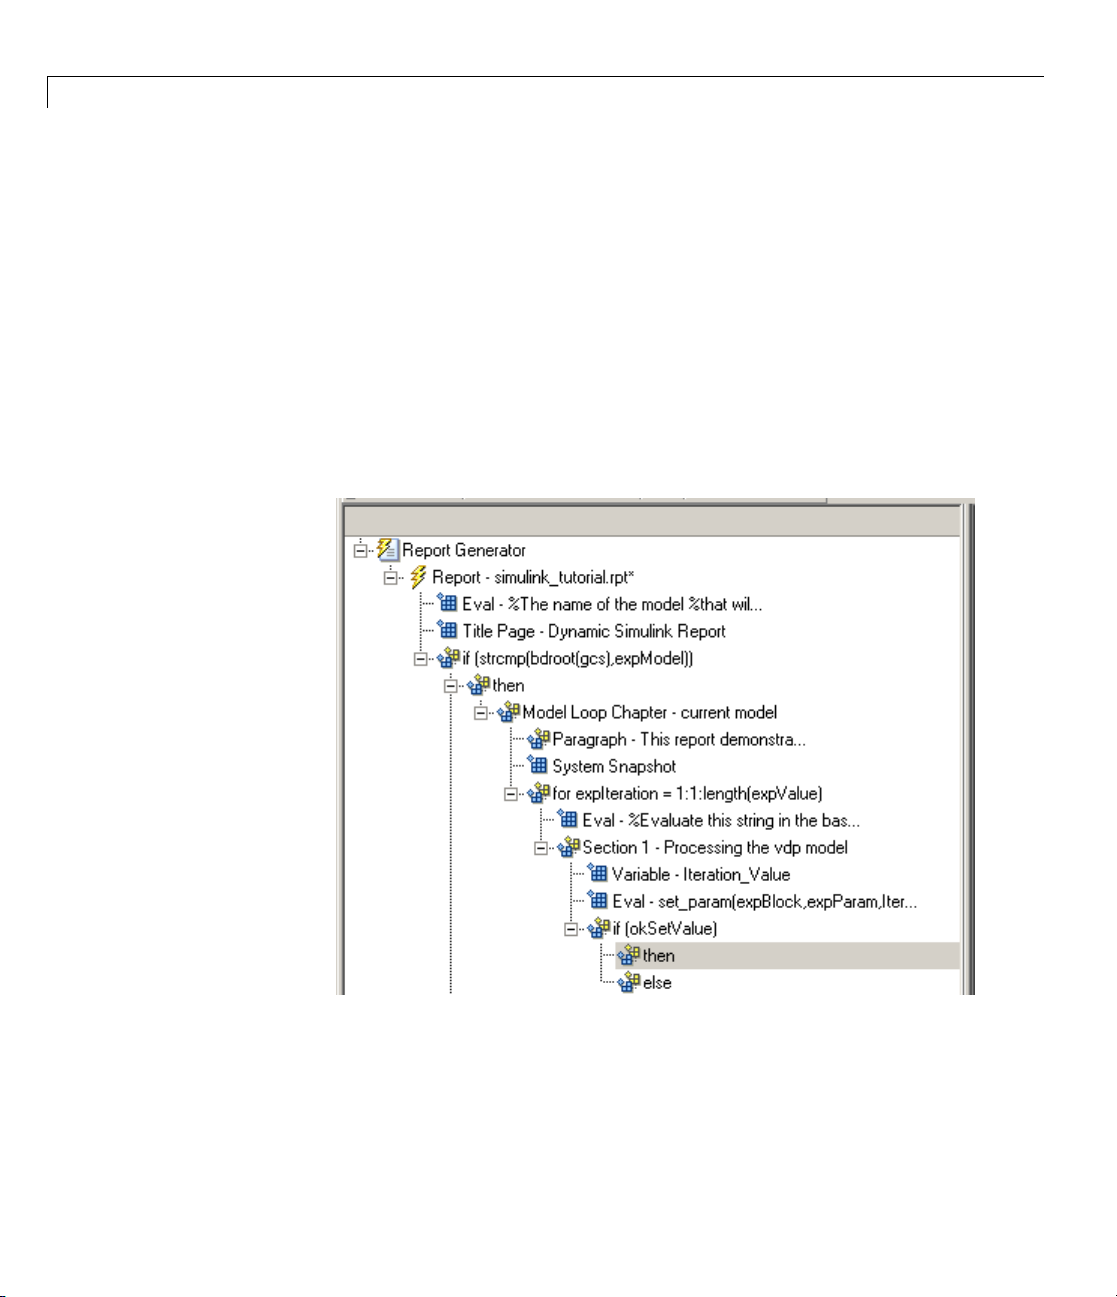
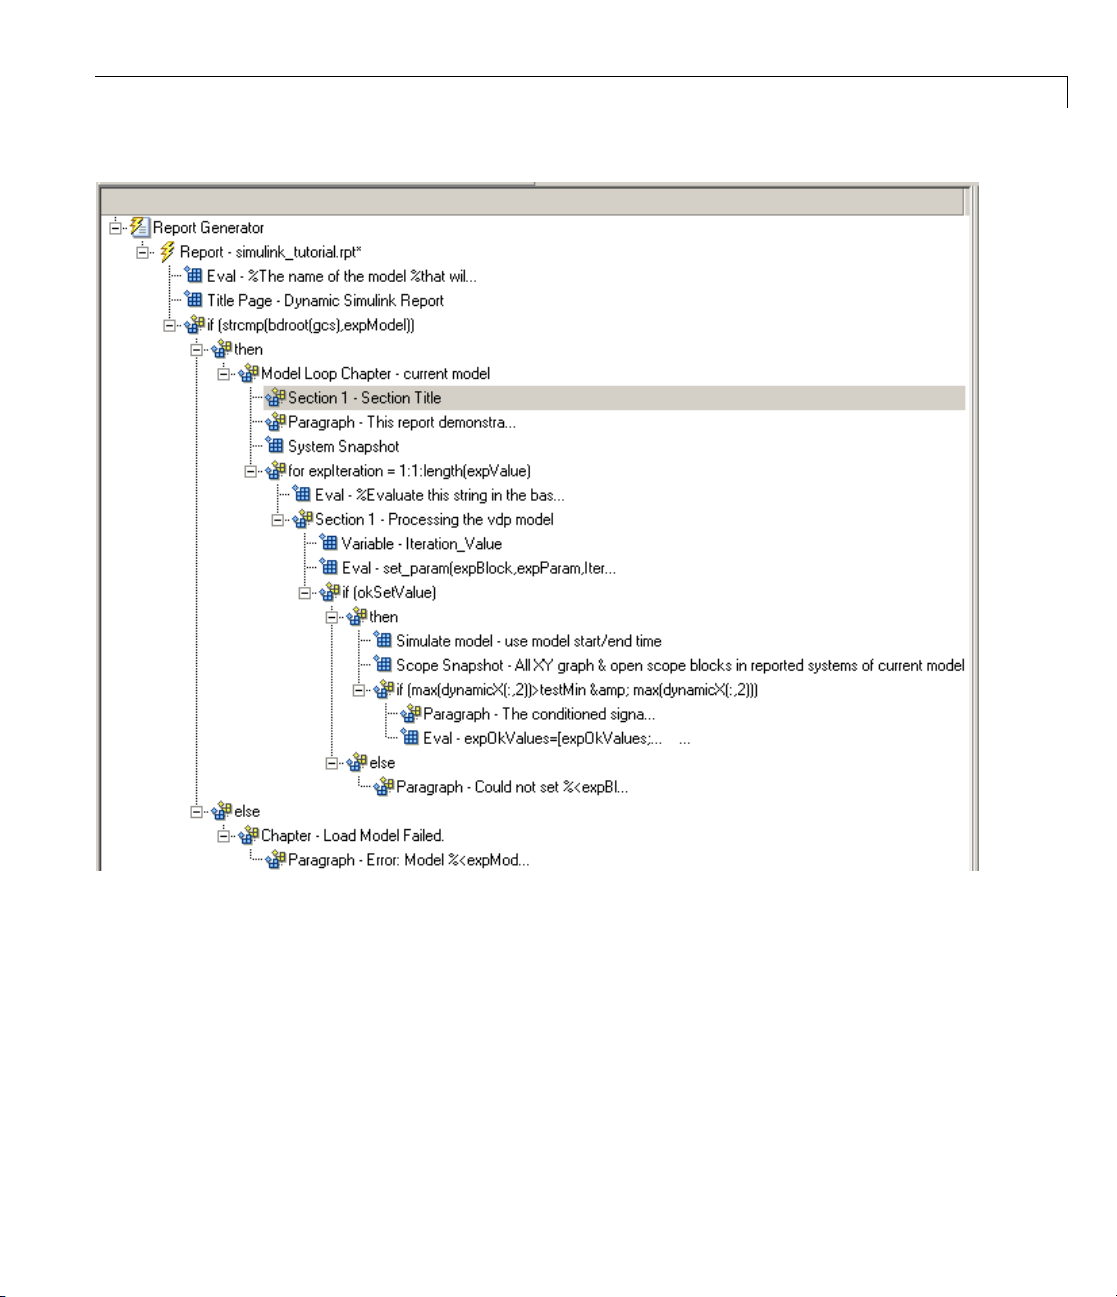
1 In the Outline pane on the left, select the if(okSetValue) component.
2 To insert Logical Then and Logical Else in the correct order:
a In the Options pane in the middle, double-click the Logical Else
component.
b Select the if(okSetValue) component again.
c Double-click the Logical Then component. The Outline pane on the
left looks as follows.
3-34
3 In the Outline pane on the right, select the else component.
4 In the Options pane in the middle, double-click Paragraph.
Page 75

Adding Components to the Report Template
If okSetValue = 0,theGain parameter value is not set and the report
displays an error.
5 In the Properties pane on the right:
a Choose Custom title from the Title Options selection list.
b Enter Error in the text box next to the selection list.
c Enter the following text into the Paragraph Text text box:
Could not set %<expBlock> "%<expParam>" to value
%<Iteration_Value>.
6 Save the report.
Simulating the Model, and Capturing the Scope and Data
Now that the model is open and the Gain parameter is set, use the Model
Simulation
component to simulate the vdp model.
1 In the Outline pane on the left, select the then component under the if
(okSetValue)
2 In the Options pane, under the Simulink category, double-click Model
Simulation
Simulate model.
component.
. In the Outline pane on the left, this component is renamed
3-35
Page 76

3 Creating Simulink
®
Reports
3-36
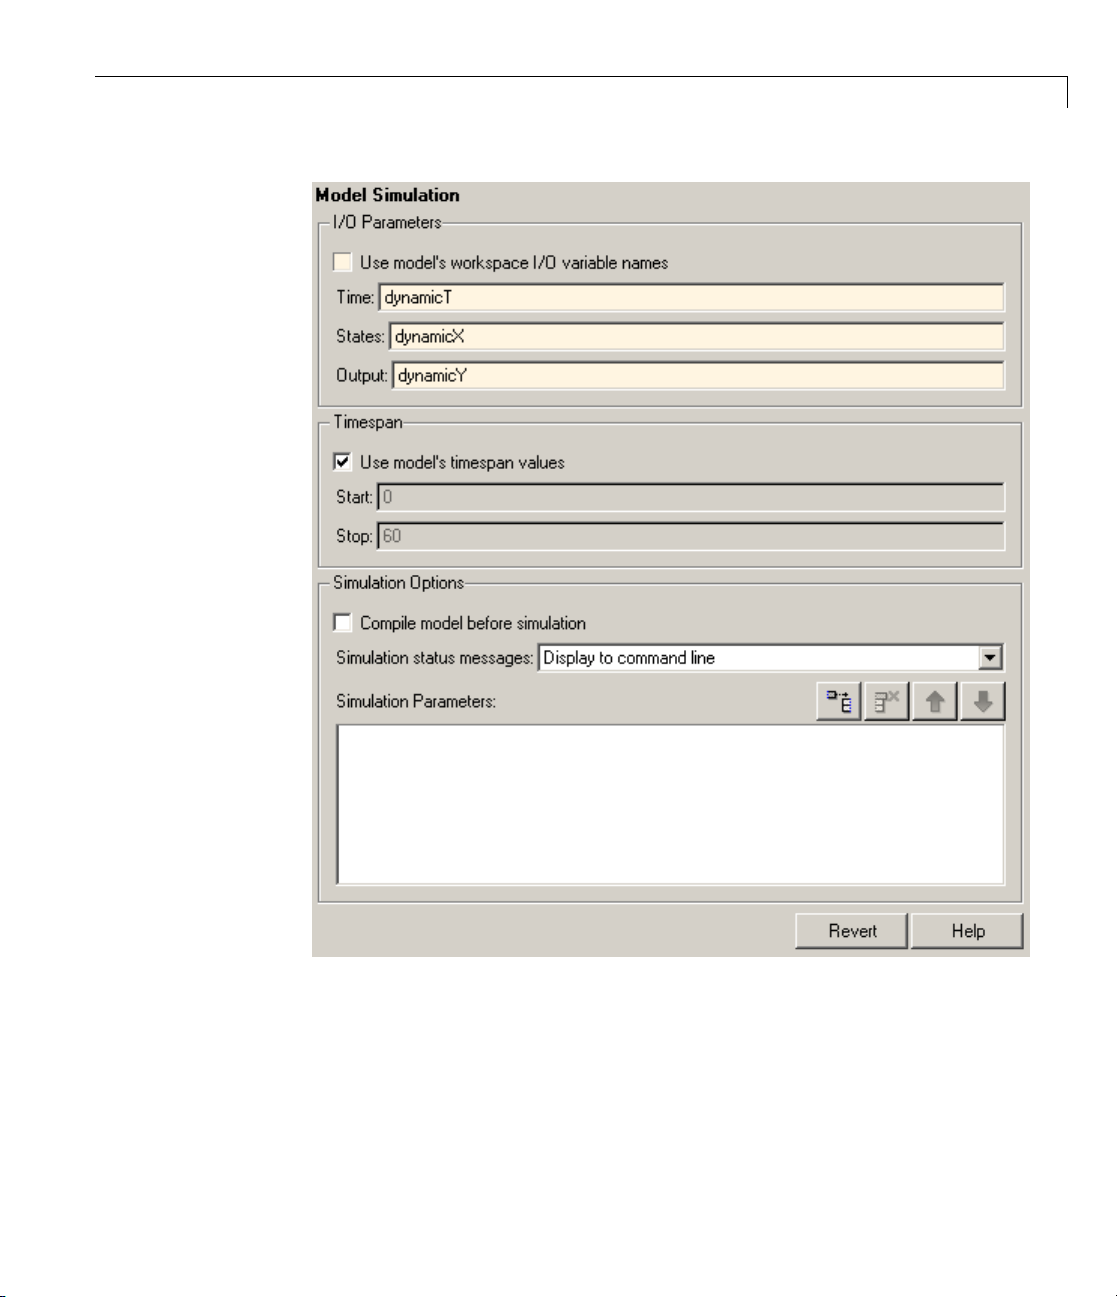
3 In the P roperties pane on the right:
a Clear the Use model’s workspace I/O variable names check box.
b In the Time text box, enter dynamicT.
c In the States text box, enter dynamicX.
d In the Output text box, enter dynamicY.
The Properties pane on the right looks as follows.
Page 77
Adding Components to the Report Template
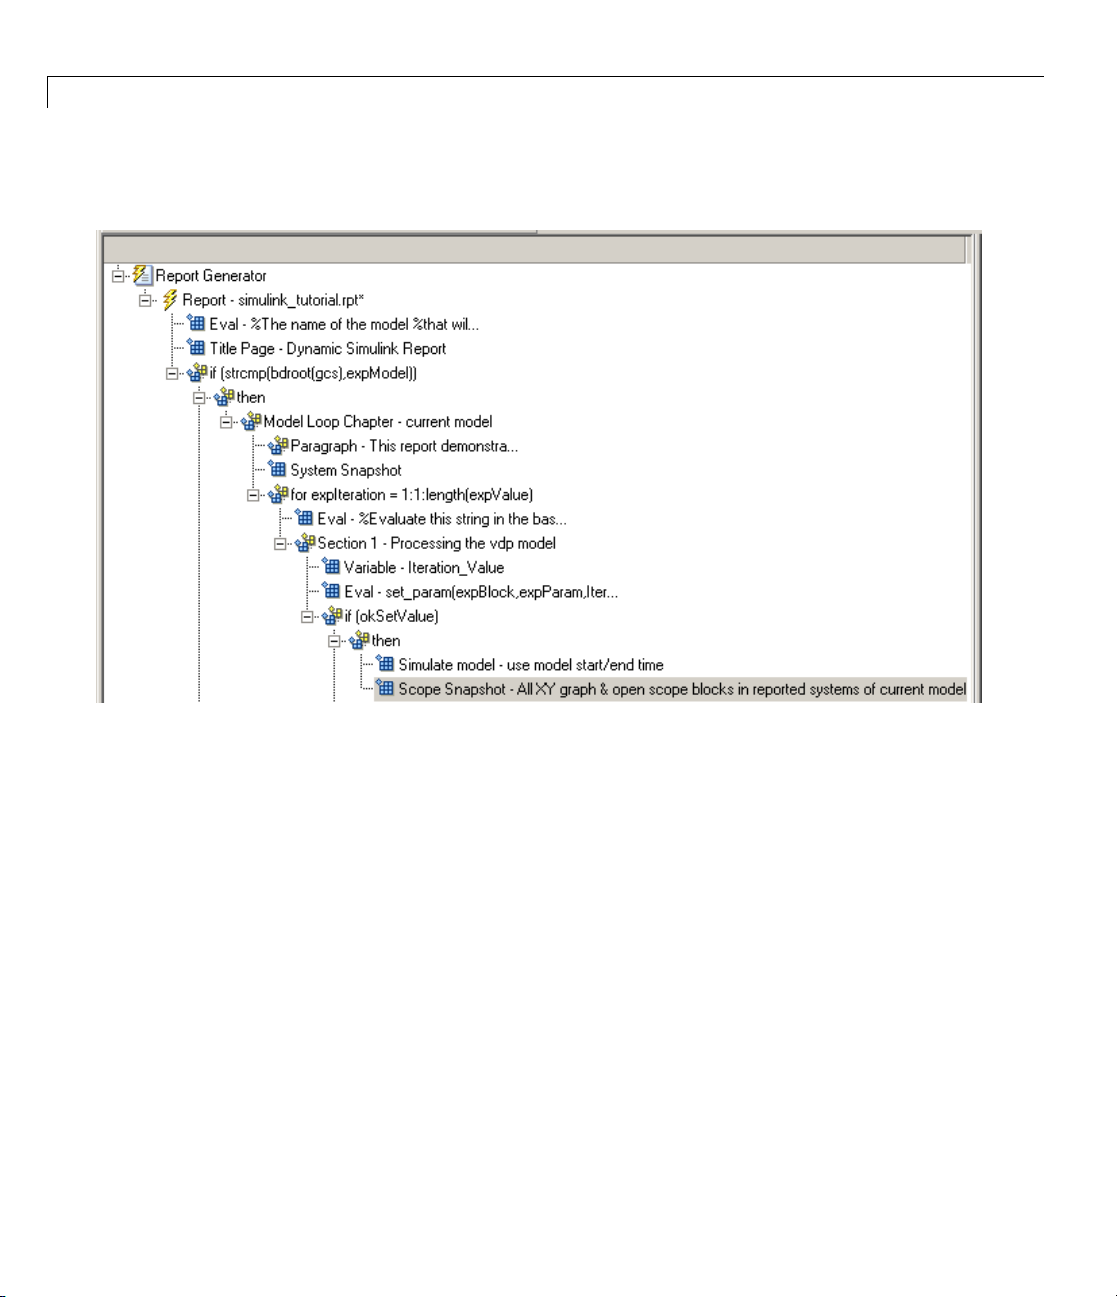
4 In th
5 In the O ptions pane in the middle:
e Outline pane on the left, select the
a Scroll down to the Simulink Blocks category.
b Double-click Scope Snapshot to add it as a sibling of the Simulink
Model
component.
Simulate model component.
3-37
Page 78
3 Creating Simulink
®
Reports
This component captures the scope for each iteration.
3-38
6 In the P roperties pane on the right:
a In the Paper orientation selection list, select Portrait.
b For the Image size,enter[5 4].
c In the Scaling selection list, select Zoom.
d Enter 75 for the % value.
7 Save the report template.
8 To test to see if the signal data falls within a specified range, add another
Logical If component:
a In the Outline pane on the left, select the Scope Snapshot component.
b In the Options pane in the middle, scroll up to the Logical and Flow
Control
c Double-click the Logical If component.
category.
Page 79
Adding Components to the Report Template
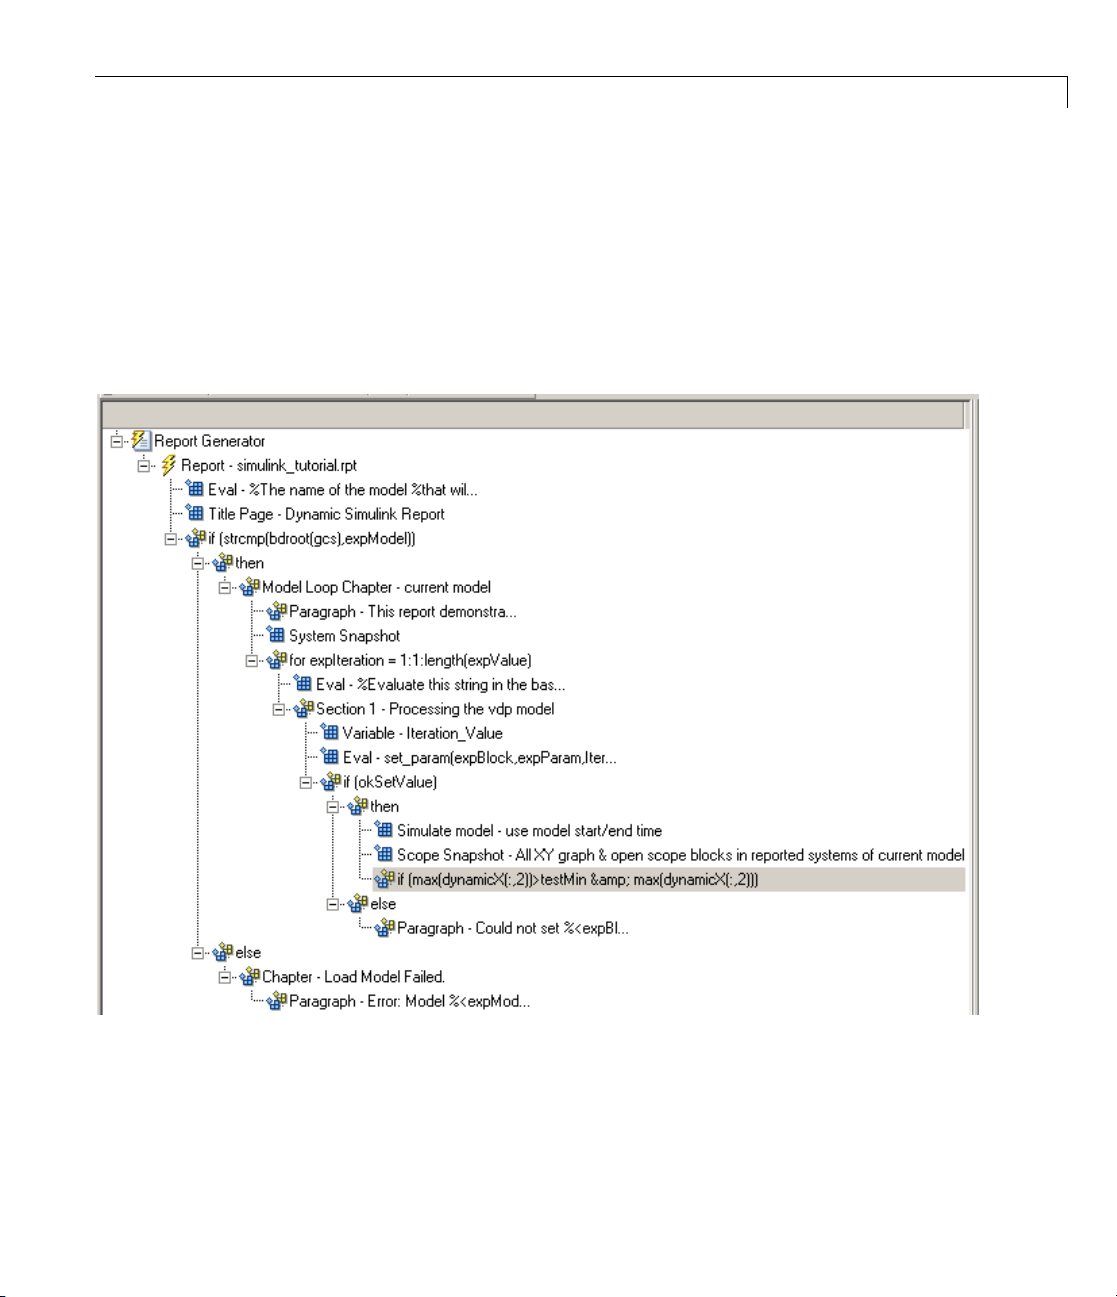
9 To test the signal data, replace true in the Test expression text box with
the following in the Properties pane on the right:
max(dynamicX(:,2))>testMin & max(dynamicX(:,2))
10 Save the report.
The Outline pane looks as follows:
11 If t
Add
in t
a In
his condition is true, the signal data falls w ithin the desired range.
a
Paragraph component to print information about the signal data
he report.
the Outline pane on the left, select the
if component you just added.
3-39
Page 80

3 Creating Simulink
®
Reports
b In the O ptions pane in the middle, under the Formatting category,
double-click
c In the Properties pane on the right:
Paragraph so that it becomes a child of the if component.
i From the Title Options selection list, select
ii Type
Success in the text box.
Custom title.
iii Enter the following text in the Paragraph text text box.
The conditioned signal has a maximum value
of %<max(dynamicX(:,2))>, which lies in the
desired range of greater than %<testMin> and
less than %<testMax>.
12 To save the success values to insert into a table at the end of the iterations,
use an
a In the Outline pane on the left, select the Paragraph component.
b In the Options pane in the middle, under the MATLAB category,
Evaluate MATLAB Expression component.
double-click
Evaluate MATLAB Expression.
An unintended result occurs: the new component is a child of the
Paragraph component.
c To make the new component a sibling of the Paragraph component, in
the Outline pane on the left, select the
the left arrow on the toolbar. The
the
Paragraph component.
Eval component, and then Click
Eval component becomes a sibling of
3-40
Page 81

Adding Components to the Report Template
13 In the Properties pane on the right, for the Eval component:
a Clear the Insert M AT LAB expression in report and Display
command window output in report check boxes.
b In the Expression to evaluate in the base workspace text box, enter
the following to save the desired signal values in the
expOkValues=[expOkValues;...
{Iteration_Value,max(dynamicX(:,2))}];
c Make sure you select Evaluate this expression if there is an error.
expOkValues array:
Insert the following text in the text box:
disp(['Error during eval: ', lasterr])
14 Save the report template.
Creating the Post-Test Analysis Section
Now that you have collecte d all the desired values, create the post-test
analysis section by creating a table and inserting it into your report at the
end of this chapter.
1 In the Outline pane on the left, select the Model Loop Chapter component.
3-41
Page 82

3 Creating Simulink
®
Reports
3-42
2 In the Options pane in the middle, under the Formatting category,
double-click
Chapter/Subsection.
The new section appears at the b eginning of the chapter.
Page 83
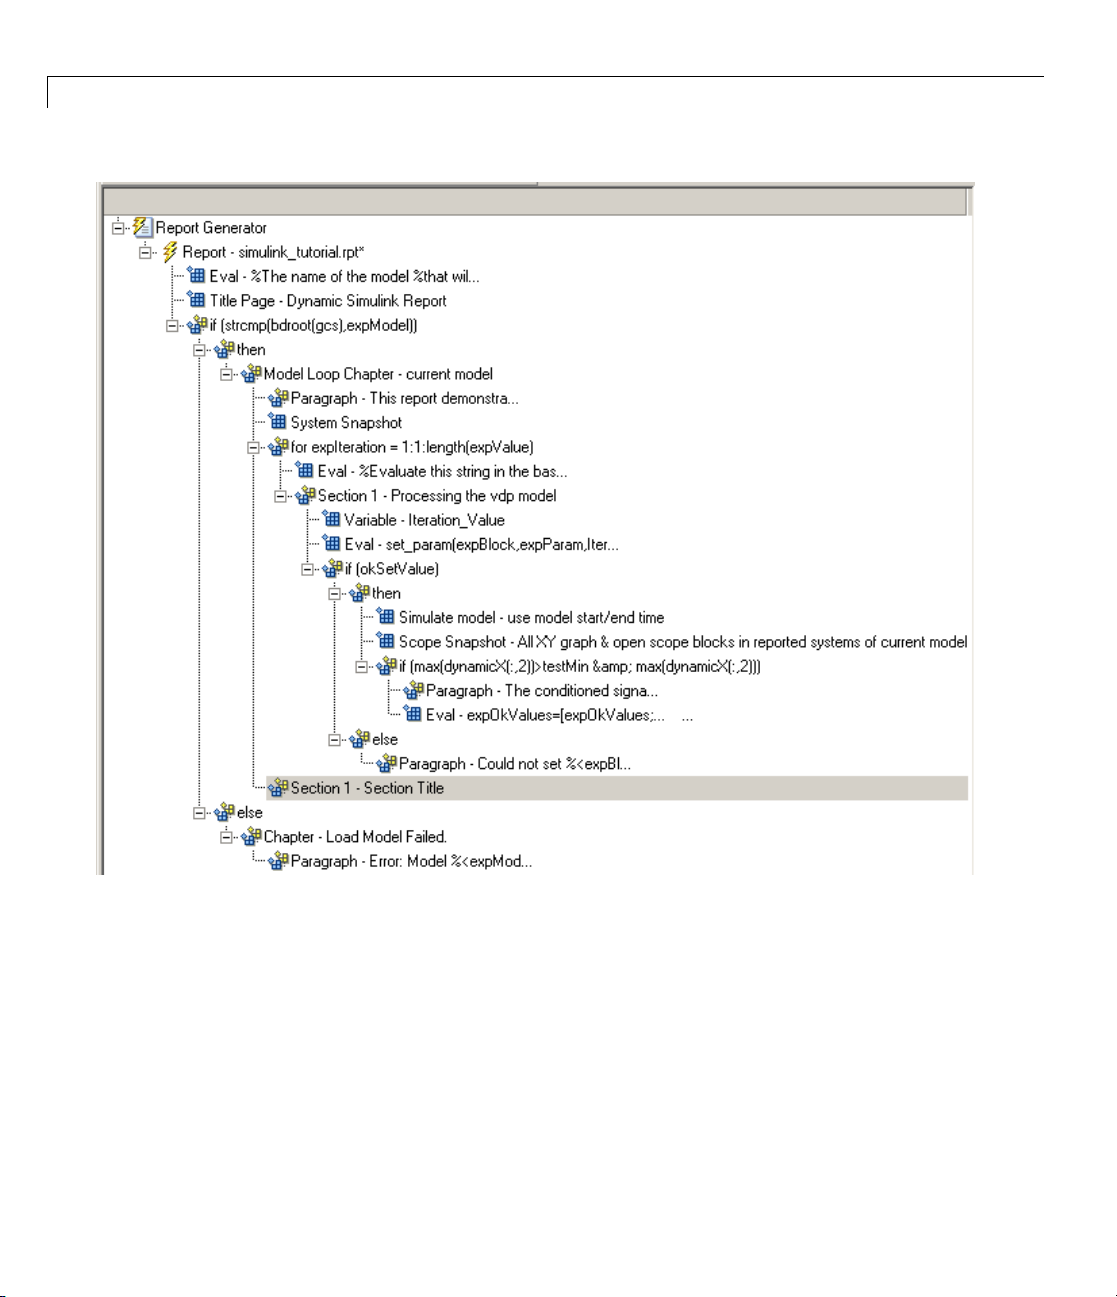
Adding Components to the Report Template
Click the down arrow three times so Section 1 moves to the end of the
Model Loop Chapter component.
3-43
Page 84
3 Creating Simulink
®
Reports
3-44
3 In the P roperties pane on the right:
a Select Custom in the Title selection list.
b Enter Post-Test Analysis in the text box.
4 In the Outline pane on the left, select the new Section 1 component.
5 In the Options pane in the middle, under the Formatting category,
double-click
Paragraph. Do not change its properties.
Page 85
Adding Components to the Report Template
6 To check whether there are any signal values within the desired
range, check the array
expOkValues is empty, there are no signal values in the desired range.
expOkValues with a Logical If component. If
Report the result of this check.
a In the Outline pane on the left, select the Paragraph component and
add a
Logical If child component.
b In the Propertie s pane on the right, enter the expressio n to evaluate
in the Test expression text box:
~isempty(expOkValues)
This expression evaluates to 0 (false)ifexpOkValues is empty;
otherwise, it evaluates to
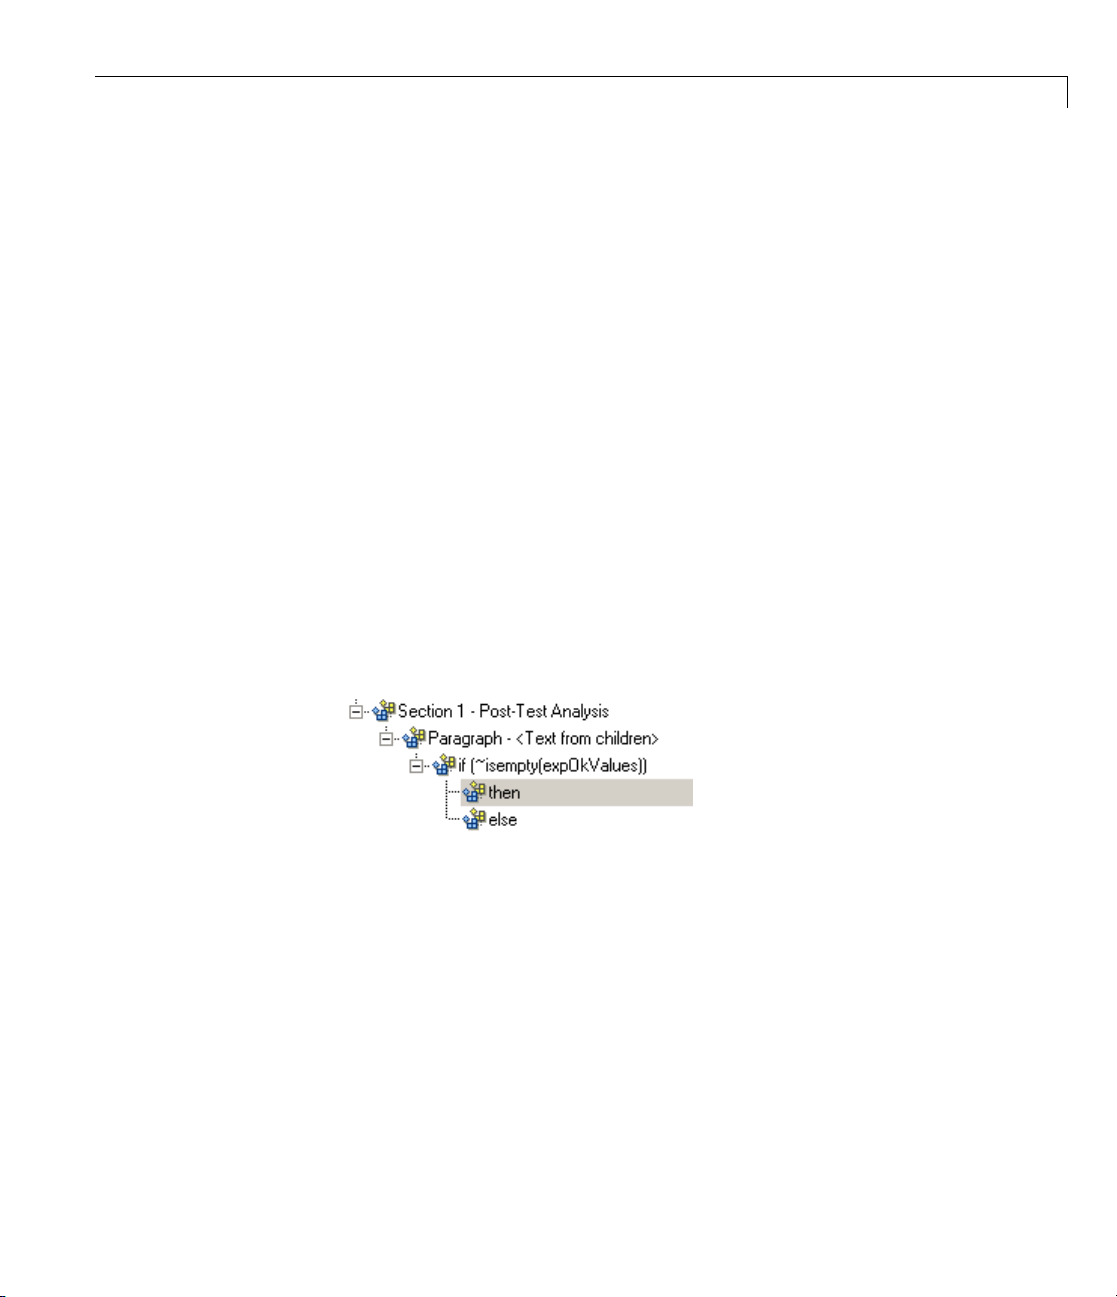
c In the Outline pane on the left, select the if(~isempty(expOkValue))
1 (true).
component a nd add the Logical Else component as a child.
d Select the if(~isempty(expOkValue)) component again and add the
Logical Then component as a child.
ThetwocomponentsaresiblingsintheOutlinepaneontheleft.
7 Save the report template.
8 Now, insert report components to handle the case where expOkValues is
empty; that is, where no signal valu es fall within the designated range.
a In the Outline pane on the left, select the else component.
b In the Options pane in the middle, double-click the Text component to
add it as a child of the
c In the Properties pane on the right, in the Text to include in r eport
else component.
text box, enter the following:
None of the selected iteration values had
3-45
Page 86

3 Creating Simulink
®
Reports
a maximum signal value between %<testMin> and %<testMax>.
9 Now handle the case where expOkValues is not empty and you want to
insert a table of the acceptable signal values.
a In the Outline pane on the left, select the then component.
b Add a Text component as a child to the then component.
c In the Properties pane on the right, in the Text to include in r eport
text box, enter the following text.
e(expOkValues, 1)> values for %<expBlock> were
%<siz
found
than
tabl
d In the Outline pane on the left, select the Text component under the
then component of the if(~isempty(expOkValues) component.
10 To create an array for use when formatting the table, use the Evaluate
MATLAB Expression
that resulted in a maximum signal value greater
%<testMin> but less than %<testMax>. The following
e shows those values and their resulting signal maximum.
component.
3-46
a In the Options pane in the middle, double-click Evaluate MATLAB
Expression
b In the Properties pane on the right:
.
i Clear the Insert MATLAB expression in report and Disp lay
command window output in report check boxes.
ii The next compo ne nt of the report uses the strings
Signal Maximum as table header values. Add the strings to the front
of the
expOkValues cell array by entering the following text into the
Mu Value and
Expression to evaluate in the base workspace text box:
expOkValues=[{'Mu Value','Signal Maximum'} expOkValues];
iii Make sure you select the Evaluate this expression if there is an
error check box. Enter the following text into the text box:
disp(['Error during eval: ', lasterr])
Page 87

Adding Components to the Report Template
11 In the Outline pane on the left, select the Eval component.
12 In the Options pane in the middle, under the Formatting category,
double-click the
Eval components.
13 In the Properties pane on the right:
a In the Workspace variable name text box, enter expOkValues.The
Simulink Report Generator software uses the contents of
Table component so it becomes a sibling of the Text and
expOkValues
to construct the table.
b In the Table title text box, enter Valid Iteration Values.
14 Save the report template.
The Outl
inepaneontheleftlooksasfollows.
3-47
Page 88

3 Creating Simulink
®
Reports
3-48
Page 89

Generating the Repor t
Now the report includes all required components. To generate the report,
click the Report icon on the toolbar. The following occurs:
1 A Message List window appears, displaying informational and error
messages as the report is processed. Specify the level of detail you would
like the Message List window to display while the report is being generated.
Options range from
list located under the title bar of the Message List window to choose an
option, as shown in the follow ing figure.
Generating the Report
0 (least detail) to 6(most detail). C lick the selection
Messag
this ex
e level 3 (Important messages)
ample.
is used for the remainder of
3-49
Page 90

3 Creating Simulink
®
Reports
2 The vdp mode
3 The scope window appears. The scope graph changes each time the
l appears. You can see each time it is simulated.
parameter value changes.
4 Each component of the report is highlighted as it executes, in the Outline
pane on the left in the Report Explorer window.
When the report is complete, Adobe Acrobat Reader opens your report in
PDF format.
3-50
Page 91

Generating the Report
3-51
Page 92

3 Creating Simulink
®
Reports
3-52
Page 93

Generating Reports
• “Setting Report Output Options” on page 4-2
• “Converting XML Documents” on page 4-11
• “Creating Log Files” on page 4-14
• “Generating MATLAB Code from Report Templates” on page 4-15
• “Working with Legacy Report Templates” on page 4-18
• “Troubleshooting” on page 4-20
4
Page 94

4 Generating Reports
Setting Report Output Options
In this section...
“Setting Preferences” on page 4-2
“Setting the Report File Folder” on page 4-3
“Setting the Report File Name” on page 4-4
“Setting the Report Format” on page 4-4
“Viewing and Printing Reports” on page 4-8
“Converting English Strings to Other Languages” on page 4-9
“Autosaving Report Templates” on page 4-9
“Reporting Compiled Simulink Model Data” on page 4-9
“Regenerating Images” on page 4-10
“Including a Report Description” on page 4-10
4-2
Setting Preferences
Specify report output settings using the Preferences pane. To open this
pane, click File > P references. A list of available options appears in the
following table.
ose
on
Opti
mat ID
For
tension
Ex
imulink Images
S
Purp
cify the report output format. Choices
Spe
lude
inc
and
Au
re
Fo
pecify the format for Simulink images to
S
nclude in the report. The default is
i
image
Acrobat (PDF), Rich Text format,
Word document. The default is Web (HTML).
tomatically sets the file extension of the
port file according to the value specified for
rmat ID
.Thedefaultishtml.
PNG 24-bit
.
Page 95
Setting Report Output Options
Option
Stateflow Images
HG Images
View command
Visible in Report
Explorer
Use version 1.x
environment
Animate Report
Explorer when
generating reports
Purpose
Specify the format for Stateflow charts to
include in the report. The default is
.
image
PNG 24-bit
Specify the format for Handle Graphics®images
to include in the report. The default is
24-bit image
.
PNG
Specify the MATLAB command you want to use
to view the report.
Deselect this check box to make the current
output format unavailable in the Report
Explorer Interface. For example, if your
specified report format is
Word document and
you d eselect this check box, then the Microsoft
Word document form at is no longer available for
reports created using the Report Explorer.
Choose this option to use previous ve rsions
of MATLAB Report Generator and Simulink
Report Generator interfaces. For more
information, see “Using Legacy Interfaces” on
page 4-19.
Select this check box if you want components in
the Outline pane to be animated as the report
generates. This box is selected by default.
Setting the Report File Folder
Choose a folder to which you have write privileges, to store the report file. A
list of options appears in the following table.
Folder Option
Thesamefolderasthe
report template
The current working
folder
Same as report template
Present working directory
4-3
Page 96
4 Generating Reports
Folder Option
Temporary folder
Another folder Custom.UsetheBrowse button (...) to select
You can use %<VariableName> notation to specify a folder in the Custom text
box. For more information, see “% Notation” on the
page in the MATLAB R eport Generator documentation.
Temporary directory
from a list of directories.
Text component reference
Setting the Report File Name
Imagesareplacedinafolderwiththesamenameasthereportfile.
For example,
testreport_files.
Choose a file name for the report file, using the op t ions listed in the following
table.
testreport.html images are placed in a folder named
4-4
File Name Option
Thesamefilenameasthe
report template
Afilenamedifferentfromthe
report template name
Use %<VariableName> notation to specify a file name in the Custom text box.
For more information, see “% Notation” on the
in the MATLAB Report Generator documentation.
Same as report template (default)
Custom. Enter the name of the report.
Text component reference page
Setting the Report Format
Choose the report output format in the File format text box. For example, if
you want to use Microsoft Word, choose
Word document or Rich Text Format.
Page 97
Setting Report Output Options
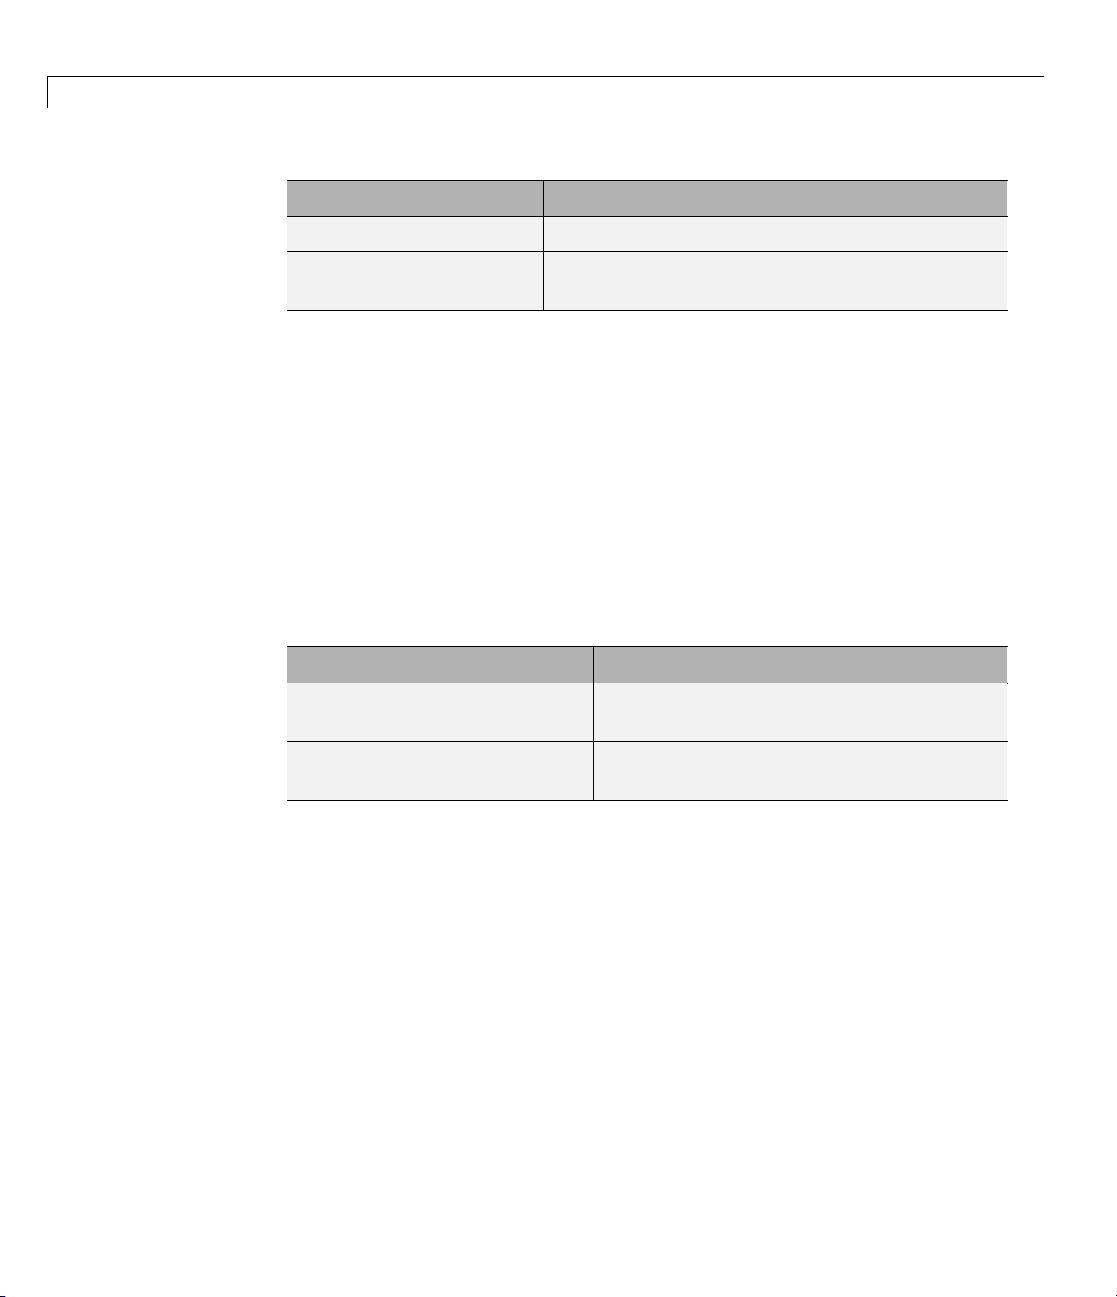
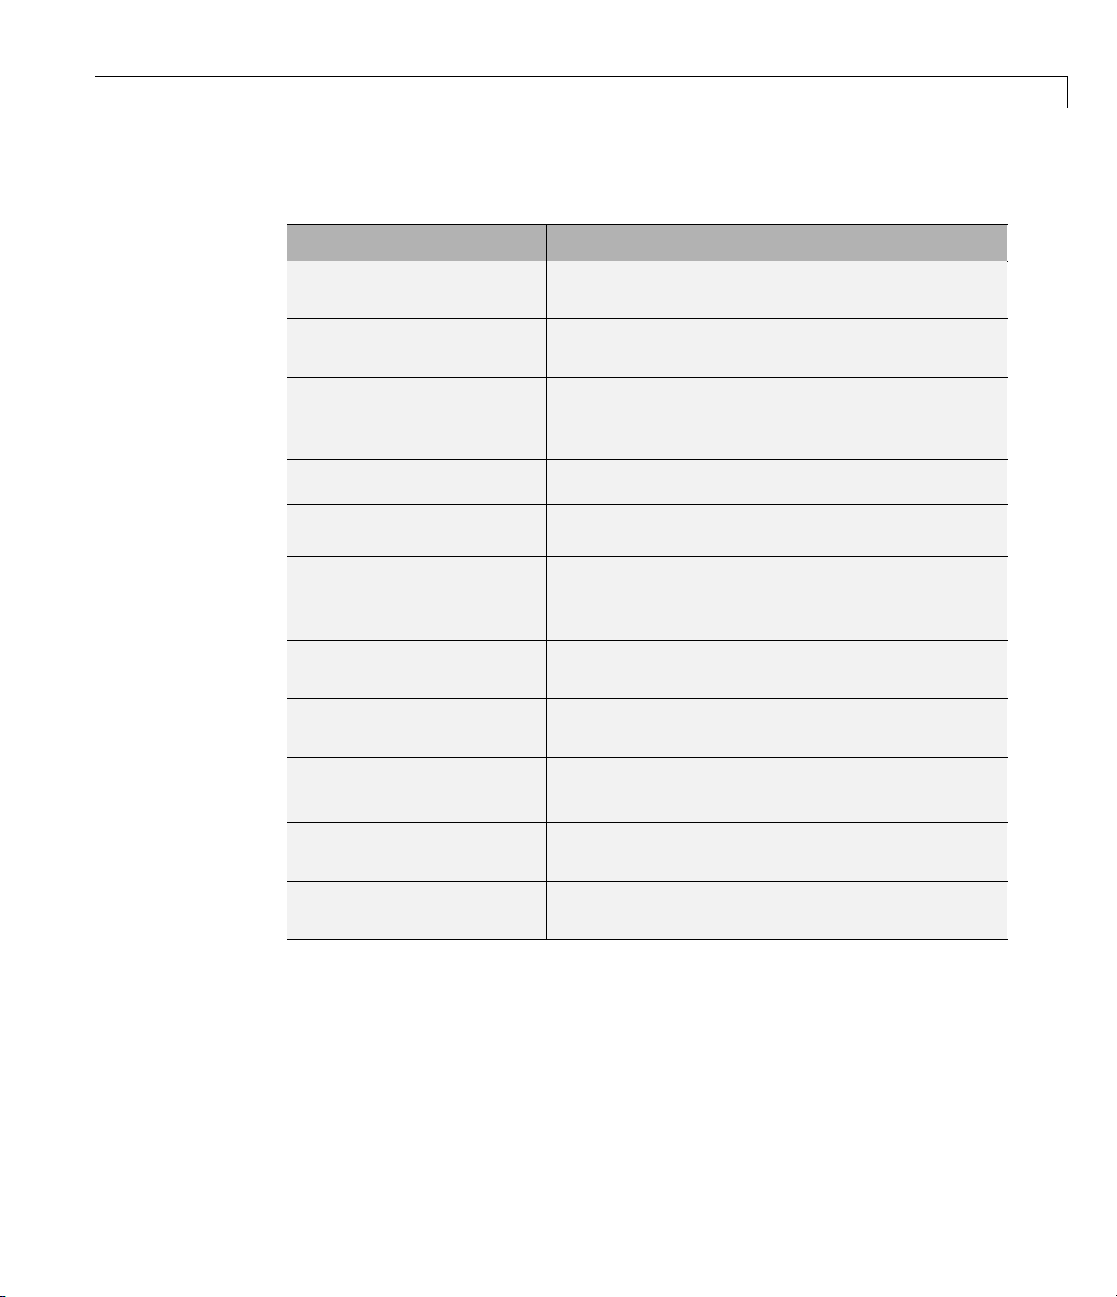
Each output format has a default stylesheet associated with it. Specify the
stylesheet in the text box next to the File format text box.
The following table shows which output format to use with different software,
and w hich stylesheets you can use with each output format.
Viewer Format Description Stylesheets
Adobe
Acrobat
Reader
Web browser
Word
processor
DocBook
Adobe Acrobat
(PDF)
Web (HTML)
(default)
Rich Text
Format (RTF)
or Word
Document
DocBook
(XML)
Produces a PDF
that you can
view using Adobe
Acrobat Reader
software
Use for
publishing on
the World Wide
Web
Compatible
with most
word-processing
packages,
including
Microsoft Word
software
Produces a
report in
DocBook format
PDF (see “PDF
Stylesheets” on page
4-6)
Web (see “Web
Stylesheets” on page
4-7)
Print (see “RTF
(DSSSL Print) and
Word Stylesheets” on
page 4-8)
N/A
4-5
Page 98
4 Generating Reports
Tip To create and use customized styles, see “Creating Custom Stylesheets”.
PDF Stylesheets
PDF Stylesheet Description
Standard Print
Simple Print
Compact Simple Print
Large Type Print
Very Large Type Print
Compact Print
Unnumbered Chapters &
Sections
Numbered Chapters &
Sections
Paginated Sections
Displays title page, table of contents, list of titles
Suppresses title page, table of contents, list of
titles
Minimizes page count, suppresses title, table of
contents, list of titles
Uses 12-point fo nt (slightly larger than
Standard Print)
Uses 24-point font and landscape paper
orientation
Minimizes white space to reduce page count
Chapters and sections are not numbered
Chapters and sections are both numbered
Sections are printed with page breaks
4-6
stom Header
Cu
Custom Titlepage
Logo stylesheet for
PDF
Verbose Print
s you specify custom headers and footers
Let
Lets you specify custom title page content and
presentation
Lets you specify a logo, such as your company
logo, in the header
Lets you specify advanced print options
Page 99
Web Stylesheets
Web Stylesheet Description
Default HTML
stylesheet
Simulink book HTML
stylesheet
Truth Table HTML
stylesheet
HTML on a single page
HTML on multiple pages; suppresses chapter
headings and table of contents
HTML on multiple pages; suppresses chapter
headings and table of contents
Setting Report Output Options
Multi-page Web
Single-page Web
Single-page
Unnumbered Chapters &
Sections
SingleChapte
Single-page Simple
Multi-page Simple
Multi-page Unnumbered
Chapters & Sections
Mul
Ch
page Numbered
rs & Sections
ti-page Numbered
apters & Sections
HTML, with each chapter on a separate page
HTML on a s
ingle page
HTML on a single page; chapters and sections
are not numbered
HTML on a single page; chapters and sections
are numbered
HTML on a single page; suppresses title page
and table of contents
HTML
and t
HTML
are
on multiple pages; suppresses title page
able of contents
on multiple pages; chapters and sections
not numbered.
HTML on multiple pages; chapters and sections
are numbered
4-7
Page 100

4 Generating Reports
RTF (DSSSL Print) and Word Stylesheets
RTF or Word Stylesheet Description
Standard Print
Simple Print
Compact Simple Print
Large Type Print
Very Large Type Print
Compact Print
Unnumbered Chapters &
Sections
Numbered Chapters &
Sections
Displays title page, table of contents, list of titles
Suppresses title page, table of contents, list of
titles
Minimizes page count, suppresses title, table of
contents, list of titles
Uses 12-point fo nt (slightly larger than
Standard Print)
Uses 24-point font and landscape paper
orientation
Minimizes white space to reduce page count
Chapters and sections are not numbered
Chapters and sections are both numbered
4-8
Note Some W eb and Print stylesheets include an automatically generated
list of titles. The list of titles includes a list of table titles and a list of figures
with titles.
Viewing and Printing Reports
To view your report after generation:
• To view the report automatically, select the View report after generation
check box in the Generation Options section in the Properties pane on
the right. When report gen eration is complete, the viewer associated with
the report output format displays the report.
• To view the report manually, browse to the location specified in the Report
File Location section in the Properties pane on the right, a nd open the file.
To print your report, select the Print option from the viewer.
 Loading...