

Page 1

Mapping Toolbox™ Release
Notes
Page 2

How to Contact The MathWorks
www.mathworks.
comp.soft-sys.matlab Newsgroup
www.mathworks.com/contact_TS.html Technical Support
suggest@mathworks.com Product enhancement suggestions
bugs@mathwo
doc@mathworks.com Documentation error reports
service@mathworks.com Order status, license renewals, passcodes
info@mathwo
com
rks.com
rks.com
Web
Bug reports
Sales, prici
ng, and general information
508-647-7000 (Phone)
508-647-7001 (Fax)
The MathWorks, Inc.
3 Apple Hill Drive
Natick, MA 01760-2098
For contact information about worldwide offices, see the MathWorks Web site.
Mapping Toolbox™ Release Notes
© COPYRIGHT 2000–20 10 by The MathWorks, Inc.
The software described in this document is furnished under a license agreement. The software may be used
or copied only under the terms of the license agreement. No part of this manual may be photocopied or
reproduced in any form without prior written consent from The MathW orks, Inc.
FEDERAL ACQUISITION: This provision applies to all acquisitions of the Program and Documentation
by, for, or through the federal government of the United States. By accepting delivery of the Program
or Documentation, the government hereby agrees that this software or documentation qualifies as
commercial computer software or commercial computer software documentation as such terms are used
or defined in FAR 12.212, DFARS Part 227.72, and DFARS 252.227-7014. Accordingly, the terms and
conditions of this Agreement and only those rights specified in this Agreement, shall pertain to and govern
theuse,modification,reproduction,release,performance,display,anddisclosureoftheProgramand
Documentation by the federal government (or other entity acquiring for or through the federal government)
and shall supersede any conflicting contractual terms or conditions. If this License fails to meet the
government’s needs or is inconsistent in any respect with federal procurement law, the government agrees
to return the Program and Docu mentation, unused, to The MathWorks, Inc.
Trademarks
MATLAB and Simulink are registered trademarks of The MathWorks, Inc. See
www.mathworks.com/trademarks for a list of additional trademarks. Other product or brand
names may be trademarks or registered trademarks of their respective holders.
Patents
The MathWorks products are protected by one or more U.S. patents. Please see
www.mathworks.com/patents for more information.
Page 3

Summary by Version ............................... 1
Contents
Version 3.1 (R2010a) Mapping Toolbox Software
Version 3.0 (R2009b) Mapping Toolbox Software
Version 2.7.2 (R2009a) Mapping Toolbox Software
Version 2.7.1 (R2008b) Mapping Toolbox Software
Version 2.7 (R2008a) Mapping Toolbox Software
Version 2.6 (R2007b) Mapping Toolbox Software
Version 2.5 (R2007a) Mapping Toolbox Software
Version 2.4 (R2006b) Mapping Toolbox Software
Version 2.3 (R2006a) Mapping Toolbox Software
Version 2.2 (R14SP3) Mapping Toolbox Software
...... 4
...... 10
.... 16
.... 17
...... 23
...... 34
...... 49
...... 55
...... 61
..... 65
Version 2.1 (R14SP2) Mapping Toolbox Software
Version 2.0.3 (R14SP1) Mapping Toolbox Software
Version 2.0.2 (R14) Mapping Toolbox Software
Version 2.0.1 (R13SP1+) Mapping Toolbox Software
Version 2.0 (R13SP1+) Mapping Toolbox Software
....... 86
..... 68
.... 82
... 87
.... 89
iii
Page 4

Version 1.3.1 (R13SP1) Mapping Toolbox Software .... 105
Version 1.3 (R13) Mapping Toolbox Software
Version 1.2 (R12) Mapping Toolbox Software
Compatibility Sum mary for Mapping Toolbox
......... 107
......... 109
........ 112
iv Contents
Page 5

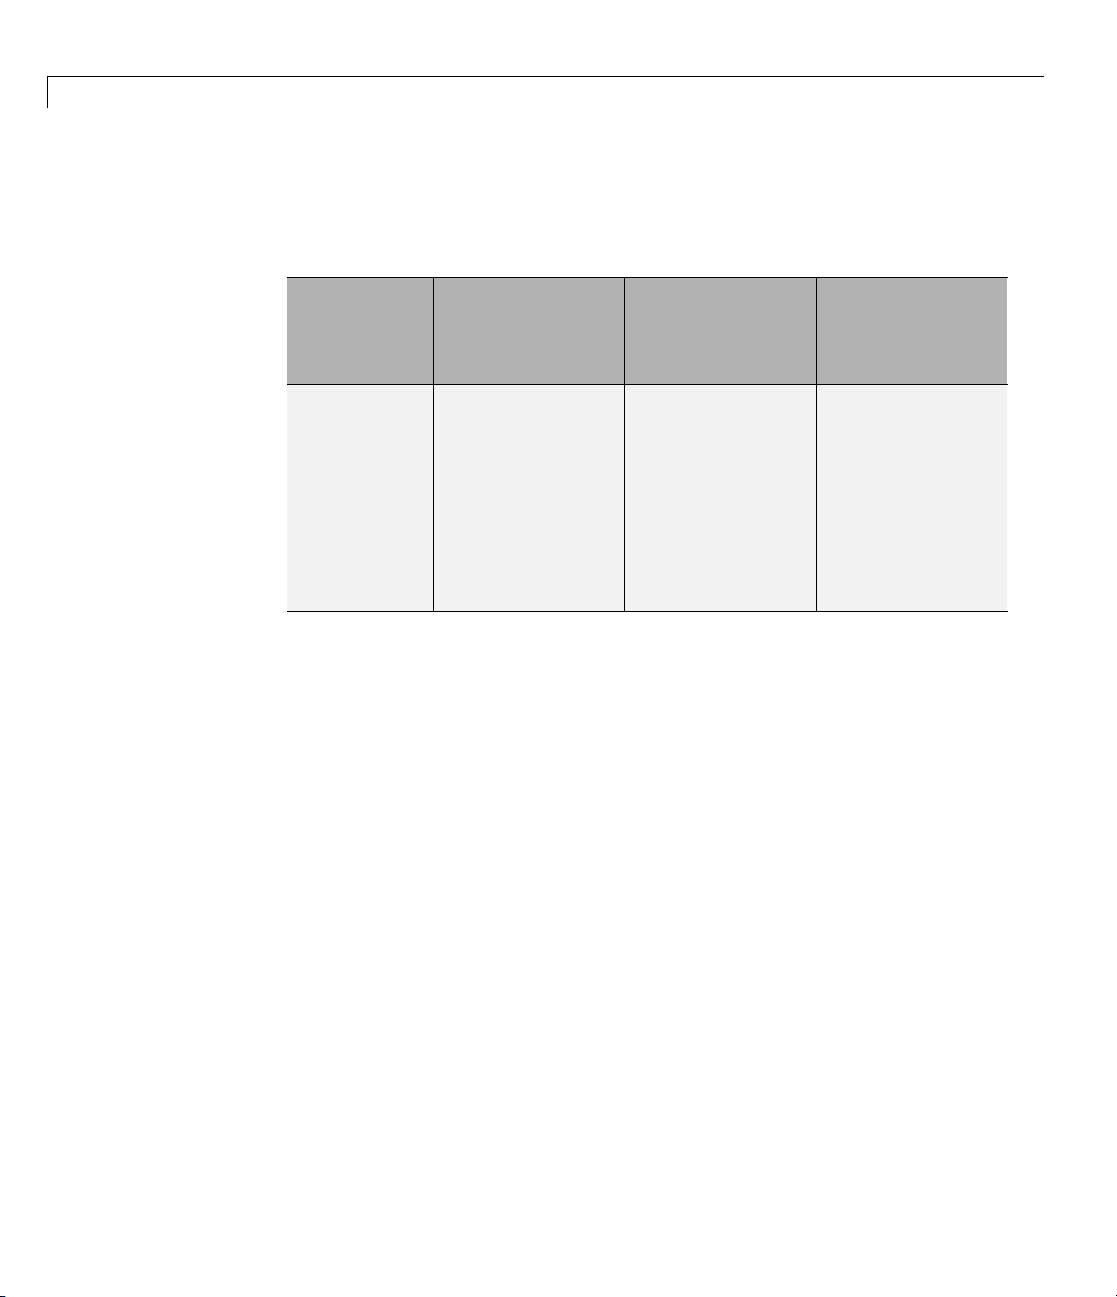
SummarybyVersion
This table provides quick access to what’s new in each version. For
clarification, see “Using Release Notes” on page 2 .
Mapping Toolbox™ Release Notes
Version
(Release)
Latest Versi
V3.1 (R2010a
V3.0 (R2009b)
V2.7.2 (R2009a)
V2.7.1 (
V2.7 (R2008a)
V2.6 (R2007b)
R2007a)
V2.5 (
V2.4 (R2006b)
on
)
R2008b)
New Features
and Changes
Yes
Details
Yes
Details
No Yes
Yes
Details
Yes
Details
Yes
ls
Detai
Yes
Details
Yes
Details
Version
Compatibilit
Consideratio
Yes
Summary
Yes
Summary
Summary
Yes
Summary
Yes
Summary
Yes
Summa
Yes
Summary
Yes
Summary
ry
y
ns
Fixed Bugs
and Known
Problems
Bug Reports
includes fix
Bug Reports
includes fixes
Bug Repor
includes
Bug Reports
includes fixes
Bug Reports
includes fixes
Bug Rep
des fixes
inclu
Bug Reports
includes fixes
Bug Reports
includes fixes
es
ts
fixes
orts
Related
Documentation
at Web Site
Printable R elease
Notes: PDF
Current product
documentation
No
No
No
No
No
No
No
V2.3 (R2006a)
.2 (R14SP3)
V2
V2.1 (R14SP2)
Yes
ails
Det
Yes
Details
Yes
Details
Yes
mary
Sum
Yes
Summary
Yes
Summary
Reports
Bug
ludes fixes
inc
Bug Reports
includes fixes
Bug Reports
includes fixes
No
No
No
1
Page 6

Mapping Toolbox™ Release Notes
Version
(Release)
V2.0.3 (R14SP1)
V2.0.2 (R14)
V2.0.1 (R13SP1+)
V2.0 (R13SP1+)
V1.3.1 (R13SP1)
V1.3 (R13)
V1.2 (R12)
New Features
and Changes
Yes
Details
Yes
Version
Compatibility
Considerations
Yes
Summary
No
Fixed Bugs
and Known
Problems
Fixed bugs
No bug fixes
Related
Documentation
at Web Site
No
No
Details
Yes
Details
No
“Fixed Bugs” on
page 87
Version
2.0.1 product
documentation
Yes
Details
Yes
Details
Yes
Yes
Summary
No
No
“Fixed Bugs” on
page 103
“Fixed Bugs” on
page 105
Fixed bugs
No
No
No
Details
Yes
No
No bug fixes
No
Details
Using Release Notes
Use release notes when upgrading to a newer version to learn about:
• New features
• Changes
• Potential impact on your existing files and practices
Review the release notes for other MathWorks™ products required for this
product (for example, MATLAB
®
or Simulink®). Determine if enhancements,
bugs, or compatibility considerations in other products impact you.
If you are upgrading from a software version other than the m ost recent one,
review the current release notes and all interim versions. For example, when
you upg rade from V1.0 to V1.2, review the release notes for V1.1 and V1.2.
2
Page 7

SummarybyVersion
What Is in the Rel
New Features and
• New functional
• Changes to exi
Version Compa
When a new fea
versions, th
impact.
Compatibil
Reports at
in incompa
compatibi
Fixed Bug
The Math
view Bug
time and
provisi
availa
is not a
ity issues reported after the product release appear under Bug
The MathWorks™ W eb site. Bug fixes can sometimes result
tibilities, so review the fixed bugs in Bug Reports for any
lity impact.
sandKnownProblems
Works offers a user-searchable Bug Reports database so you can
Reports. The development team updates this database at release
as more information becomes available. Bug Reports include
ons for any known workarounds or file replacements. Information is
ble for bugs existing in or fixed in Release 14SP2 or later. Information
vailable for all bugs in earlier releases.
ity
sting functionality
tibility Considerations
ture or change introduces a reported incompatibility between
e Compatibility Considerations subsection explains the
ease Notes
Changes
s Bug Reports using your MathWorks Account.
Acces
3
Page 8

Mapping Toolbox™ Release Notes
Version 3.1 (R2010a) Mapping Toolbox Software
This table summarizes what’s new in Version 3.1 (R2010a):
New Features
and Changes
Yes
Details below
• “WMS Database Modified” on page 4
• “The etopo Function Now Supports the ETOPO1 and ETOPO2v2 Data
Sets” on page 5
• “Now Possible to Retrieve Legend for WMS Map” o n page 6
• “The shaperead and shapewrite Functions Now Suppo rt Non-ASCII
Characters” on page 6
• “Display Range Increased for eqdazim and eqaazim Projections ” on page 6
• “The GUIs mlayers and mobjects No Longer Support EraseMode” on page 7
• “scatterm Now Returns a Handle to an hggroup Object” on page 7
Version
Compatibility
Considerations
Yes — Details
labeled as
Compatibility
Considerations
in descriptions
of changes,
below. S e e als o
Summary.
Fixed Bugs
and Known
Problems
Bug Reports at
Web site
Related
Documentation
at Web Site
Printable
Release Notes:
PDF
Current product
documentation
• “mdistort Now Returns a Handle to a contourgroup Object” on page 8
• “polybool No Longer Errors when Given Empty Input Vertex Arrays” on
page 8
• “Functions Being Removed” on page 9
WMS Database Modified
The WMS database changes on a release-to-release basis, as some new
servers are added and some unavailable servers are removed. A total of 199
servers (10.2% of the original number of servers) and 66,270 layers have
4
Page 9

Version 3.1 (R2010a) Mapping Toolbox™ Software
been removed from the database. A total of 602 servers, with 207,269 layers,
have been added.
Some notable new servers in the database are:
• The OnMars (
(
http://onmoon.jpl.nasa.gov/wms.cgi) servers from the Je t Propulsion
http://onmars.jpl.nasa.gov/wms.cgi)andOnMoon
Laboratory
• The MassGIS server
(
http://giswebservices.massgis.state.ma.us/geoserver/wms)from
the Massachusetts Office of Geographic and Environmental Information
• The National Map Seamless servers (
http://imsortho.cr.usgs.gov,andhttp://imselev.cr.usgs.gov)from
http://ims.cr.usgs.gov,
the U.S. G eolog ical Survey
Compatibility Considerations
Some servers are no longer accessible and have been rem ov ed from the
database. If you have code based on theseservers,itwillnolongerrun.Tofix
this problem, search the WMS Database for another comparable s erver.
Some examples from the R2009b documentation have been modified due to
server inaccessibility. Some notable servers that have been removed are:
• Several of the servers from CubeWerx
(http://demo.cubewerx.com/dem/cubeserver/cubeserv.cgi)
• Two of the servers from the European Space Agency (ESA)
(
http://mapdev.eo.esa.int/mapServer/mapServer and
http://mapdev.esrin.esa.int/mapServer/mapServer)
®
The etopo Function Now Supports the ETOPO1 and
ETOPO2v2 Data Sets
Before R2010a, the etopo function supported ETOPO2–2001 (2-minute)
and ETOPO5 (5-minute) data. Support has been added for ETOPO2v2c
(2-minute) and ETOPO1c (1-minute) data. The ETOPO1 model, released in
March 2009, is the most recent and contains the highest resolution data. For
information on downloading the ETOPO data sets, see Technical Note 2101:
5
Page 10

Mapping Toolbox™ Release Notes
Accessing Geospatial Data on the Internet for the Mapping Toolbox on the
MathWorks Web site.
Compatibility Considerations
The etopo function still works with ETOPO2 and ETOP O5 data.
Now Possible to Retrieve Legend for WMS Map
The Details property of the WMSLayer classcontainsaStyle field. A
LegendURL structure has been added to this field. The information in the
LegendURL structure, if provided by the server, enables you to retrieve a
legend image for a specific WMS map.
The shaperead an d shapewrite Functions Now
Support Non-ASCII Characters
You can now use the shaperead and shapewrite functions to import and
export attributes with non-ASCII characters. To use this feature, you must
set your character encoding scheme to match that used by the shapefile. For
example, if your session is configured to support
and you want to import a shapefile with Japanese characters, you m ust first
change your configuration to support
US_ASCII character encoding
Shift_JIS.
Display Range Increased for eqdazim and eqaazim Projections
In previous releases , the Equidistant Azimuthal (eqdazim)andLambert
Azimuthal Equal-Area (
display of data points farther than 160 degrees from the projection origin.
Now you can set the projection radius for either of these projections to up
to 179.5 degrees.
Use the
the largest possible value, pass the following p roperty name-value pair to
axesm or setm:
FLatLimit property to control this setting. For example, to choose
'FLatLimit',[-Inf 179.5]
6
eqaazim) projections did not allow projection or
Page 11

Version 3.1 (R2010a) Mapping Toolbox™ Software
Compatibility Considerations
The d efault value of the projection radius remains 160 degrees, so you do not
need to update any code that relies on the default value.
BeforeR2010a,youcouldusethefollowinglineofcodetoinitializethe
equatorial aspect of an azimuthal projection:
axesm(projectionName,'MapLonLimit',westernAndEasternLimits)
Now, if you enter this line of code with eq dazim or eqaazim in place
of
projectionName, you will receive a warning message, and your
'MapLonLimit' input will be ignored. To use the 'MapLonLimit' property to
initialize the equatorial aspect of an azimuthal projection, you should enter
the following:
axesm(projectionName,'FLatLimit',[], ...
'MapLonLimit',
See “Example 7: Equatorial Azimuthal Projection” in the Axes for Drawing
Maps section in the User’s Guide for an illustration of this usage.
westernAndEasternLimits)
TheGUIsmlayersandmobjectsNoLongerSupport EraseMode
The EraseMode property, represented by the Emode button, has been
removed from the
mlayers and mobjects GUIs.
Compatibility Considerations
Before R2010a, the mlayers and mobjects GUIs had an EraseMode option,
whichmadeitpossibletosettheerasemodeonaparticularmaplayeror
object. This property controlled the technique MATLAB used to draw and
erase hggroup child objects.
scatterm Now Returns a Handle to an hggroup Object
The function scatterm in the syntax
h = scatterm(...)
7
Page 12

Mapping Toolbox™ Release Notes
now returns a handle to an hggroup.
Compatibility Considerations
In previous releases, sc atterm returned a vector of patch handles.
mdistort Now Returns a Handle to a contourgroup Object
The output of the syntax
is now a scalar handle to a contourgroup object containing the contours and
text.
Compatibility Considerations
In previous releases, mdistort returned handles to the line and text objects
andusedthesyntax
h = mdistort(...)
[h,ht] = mdistort(...)
with two output arguments. The second output of mdistort is now redundant
because these handles will be available as children of
h.
polybool No Longer Errors when Given Empty Input Vertex Arrays
When one or both pairs of input vertex arrays is empty, the polybool function
now returns either empty values or the values of the non-empty input pair,
depending on the requested operation.
For example, consider the following case:
[x,y] = polybool('union', [0 0 1 1], [0 1 1 0], [], [])
The polybool function returns the first input pair: [0011],[0110].
Now consider the
[x,y] = polybool('intersection', [0 0 1 1], [0 1 1 0], [], [])
8
'intersection' operation:
Page 13

Version 3.1 (R2010a) Mapping Toolbox™ Software
The polybool function returns [], [].
Compatibility Considerations
In previous releases, if one or both pairs of input vertex arrays were empty,
the
polybool function would issue an error.
Functions Being Removed
Function Name
etopo5
What Happens
When You Use
the Function?
Errors
Use This
Instead
etopo
Compatibility
Considerations
Replace all
existing
instances of
etopo5 with
etopo.
9
Page 14

Mapping Toolbox™ Release Notes
Version 3.0 (R2009b) Mapping Toolbox Software
This table summarizes what’s new in Version 3.0 (R2009b):
New Features
and Changes
Yes
Details below
• “New Features for Creating Web Map Service Maps” on page 10
• “New makerefmat Syntax for Constructing Referencing Matrices” on page
11
• “Some Functions Now Accept Referencing Matrices as Input” on page 11
• “New Angle Conversion Functions” on page 11
• “Expanded Support for GSHHS Global Coastline Data” on page 12
• “New Behavior for polymerge when Three or More Line Segments Have
Common End Point” on page 12
• “Automatic Conversion of Latitude Limits to Ascending Order” on page 12
Version
Compatibility
Considerations
Yes — Details
labeled as
Compatibility
Considerations
in descriptions
of changes,
below. S e e als o
Summary.
Fixed Bugs
and Known
Problems
Bug Reports at
Web site
Related
Documentation
at Web Site
Printable
Release Notes:
PDF
Current product
documentation
10
• “Second Input Argument of roundn No Longer Supports Complex Numbers,
Non-integers, or Default Values” on page 13
• “Functions Removed” on page 13
New Features for Creating Web Map Service Maps
New functions and classes now make it possible to interact with Web Map
Service (WMS) servers and render WMS maps. Use the new features to
search a built-in database of pre-qualified WMS servers and layers. Retrieve
customized geographic data sets and related metadata from WMS servers.
The new classes encapsulate WMS servers, data layers, metadata, and map
Page 15

Version 3.0 (R2009b) Mapping Toolbox™ Software
requests. See the Creating Web Map Service Maps chapter in the User’s
Guide and related “Class Reference” for more information.
New makerefmat Syntax for Constructing Referencing Matrices
A new parameter name-value pair syntax makes it easier to construct
referencing matrices with
image or raster grid that is referencedtoandalignedwithageographic
coordinate sy stem but not for one that is referenced to a 2-D map coordinate
system. Use parameters to set the number of rows (M) and columns (N) of
the raster or image to be used with the referencing matrix; the latitude and
longitude limits of the geographic quadrangle bounding the georeferenced
raster; and the edges from which row and column indexing start, designating,
for example, columns that run either south-to-north or north-to-south.
makerefmat. You can use the new syntax for an
Some Functions Now Accept Referencing Matrices as Input
The functions below now accept referencing matrices as input, and some of
them (
output. The functions that generate referencing matrices as output do so only
in cas es where referencing matrices are used as input. If referencing vectors
are used as input, referencing vectors are also generated as output. Note that
the functions in this table work exclusively with data grids or images that are
referenced to geographic (latitude or longitude) coordinates.
maptrims, resizem,andvec2mtx) also generate referencing matrices as
areamat imbedm maptrims setltln usamap
filterm limitm meshgrat setpostn worldmap
findm los2 meshlsrm resizem
getseeds ltln2val meshm vec2mtx
gradientm mapprofile neworig viewshed
New Angle Conversion Functions
Two new functions, radtodeg and degto rad, replace older functions rad2deg
and deg2rad. They are functionally identical.
11
Page 16

Mapping Toolbox™ Release Notes
Compatibility Considerations
The older functions, rad2deg and deg2rad,willcontinuetowork,butwhen
writing new code the newer versions are recommended.
Expanded Support for GSHHS Global Coastline Data
The gshhs function now suppo rts Versions 1.4 and later of the Global
Self-Consistent, Hierarchical, High-Resolution Shoreline Database (GSHHS).
New B ehavior for polymer ge when Three or More
Line Segments Have Common End Point
The behavior of the polymerge function has changed in cases of three or more
distinct parts with a common end point. In such cases, the choice of which
parts to merge is ambiguous; therefore, none of the corres ponding parts are
connectedatthatcommonpoint.
Compatibility Considerations
In previous releases, if three or more parts shared a common end point, the
polymerge function attempted to merge them. T he result, however, was
unspecified and sometimes obviously wrong.
12
Automatic Conversion of Latitude Limits to Ascending Order
The functions axesm and setm require that the latitude limits in the
'MapLatLimit' property be provided in ascending orde r . If you enter the
limits in descending order, these functions will now automatically convert the
limits to ascending order, and return a warning message notifying you of
this change.
Compatibility Considerations
In prev io us releases, if you entered the latitude limits of the 'MapLatLimit'
property in descending order when using axesm or setm, you could end up
with a map axes that was in t ern ally inconsistent, possibly resulting in
unexpected errors during subsequent operations. This is no longer the case.
Page 17

Version 3.0 (R2009b) Mapping Toolbox™ Software
Second Input Argument of roundn No Longer
Supports Complex Numbers, Non-integers, or
Default Values
roundn no longer accepts certain types of input for the second input argument,
N, which is supposed to be a real, integer-valued exponent. Now, if you use
a complex number or non-integer as the second input to
receive a n error; and if you omit
receive an error if you call
error message strings.
N, you will receive a warning. You will also
roundn with a second output argument to capture
Compatibility Considerations
In previous releases, if you used a complex number or non-integer as the
second input to
you called
strings, you would receive an obsolete syntax warning.
roundn, th is number would be converted into a real integer. If
roundn with a second output argument to capture error message
roundn,youwill
In R2009b,
default is being p h ase d out, however, and in the future you will receive
an error if you fail to supply the second input argument. If there are any
instances in your code with the usage
with
The two-output syntax option was pre v iously deprecated and has resulted in
a warning in the past several releases.
-2 is still the default value for the second input argument. This
roundn(x), you should replace them
roundn(x,-2).
Functions Removed
Functions Being Removed in a Future Release
Name
colorui
eastof
Stage
Still
runs
Warns
Compatibility Considerations
Replace all existing instances of colorui with
uisetcolor.
If you are using degrees, replace
eastof(lon, meridian, 'degrees')
with
13
Page 18

Mapping Toolbox™ Release Notes
Functions Being Removed in a F uture Release (Continued)
Name
imagem
smoothl
tgrline
str
unit
ong
Stage
Errors
Warns
Still
runs
Warns
Compatibility Considerations
meridian + mod(lon - me ridi an, 360)
and if you are
eastof(lon, meridian, 'radians')
using radians, replace
with
meridian + mod(lon - me ridi an, 2*pi)
Replace all existing instances of
grid2image.
Use
require
in degre
More r
in sha
shape
apMultipart
unwr
s its input to be in radians. When working
es, use
radtodeg(unwrapMultipart(degtorad(lon)))
ecent Tiger/Line
pefile format and can be imported using
read
.
instead. This function
®
data sets are available
imagem with
The syntax
14
westof
Wa
str =
unitstr(str,'times')
has already been removed.
rns
If you are using degrees, replace
stof(lon, meridian, 'degrees')
we
with
eridian - mod(meridian - l on, 360)
m
and if you are using radians, replace
Page 19

Version 3.0 (R2009b) Mapping Toolbox™ Software
Functions Being Removed in a F uture Release (Continued)
Name
Stage
Compatibility Considerations
westof(lon, meridian, 'radians')
with
meridian - mod(meridian - lon, 2*p i)
Functions Removed in R2009b
deg2dm hms2hm hr2sec sec2hms cmapui
deg2dms hms2hr mat2dms sec2hr tigermif
dms2deg hms2mat mat2hms time2str tigerp
dms2dm hms2sec rad2dm timedim
dms2mat hr2hm rad2dms contorm
dms2rad hr2hms sec2hm contor3m
The functions above have been completely removed from the toolbox and
error if used.
15
Page 20

Mapping Toolbox™ Release Notes
Version 2.7.2 (R2009a) Mapping Toolbox Software
This table summarizes what’s new in Version 2.7.2 (R2009a):
New Features
and Changes
No
Version
Compatibility
Considerations
Yes — Details
labeled as
Compatibility Considerations
in descriptions
of changes,
below. S e e als o
Summary.
Fixed Bugs
and Known
Problems
Bug Reports at
Web site
Related
Documentation
at Web Site
Printable
Release Notes:
PDF
Current product
documentation
geoshow and mapshow Now Construct Ordinary Patch Objects
When displaying polygons, instead of constructing graphics objects whose
classes derive from patch,
objects.
Compatibility Considerations
This change has no effect on the display, and it is unlikely that you will need
tochangeanycodeinresponsetoit. Infact,itischallengingtodetectthis
change at all.
geoshow and mapshow now construct ordinary patch
16
The older (derived) class included several extra properties used only for
internal bookkeeping. You might notice them if you call
In R2009a, these properties have b een removed, and the output of
different in terms of both layout and property order. (It now looks the same
as for any ordinary patch.)
get on the handle.
get looks
Page 21

Version 2.7.1 (R2008b) Mapping Toolbox™ Software
Version 2.7.1 (R2008b) Mapping Toolbox Software
This table summarizes what’s new in Version 2.7.1 (R2008b):
New Features
and Changes
Yes
Details below
• “Using the Map Axes Map Limit Properties with axesm, setm, and
defaultm” on page 17
• “Changing Projection Type of an Existing Map Axes with setm” on page 18
• “Other Bug Fixes with Compatibility Considerations” on page 19
• “coast.MAT Data File Revised” on page 19
• “Map Limit Syntaxes Removed” on page 20
Version
Compatibility
Considerations
Yes — Details
labeled as
Compatibility
Considerations
in descriptions
of changes,
below. S e e als o
Summary.
Fixed Bugs
and Known
Problems
Bug Reports at
Web site
Related
Documentation
at Web Site
Printable
Release
Notes: PDF
Current product
documentation
UsingtheMapAxesMapLimitPropertieswith
axesm, setm, and defaultm
Changes and enhancements have been made to axesm, setm,anddefaultm
with respect to map axes properties that affect the fundamental display
geometry:
•
MapProjection
• Zone
• Origin
• FLatLimit
• FLonLimit
17
Page 22

Mapping Toolbox™ Release Notes
• MapLatLimit
• MapLonLimit
The changes result in the following improvements:
• The use of the map limit properties to set up a map axes is mo re intuitive.
• The way in which
properties is now consistent with the behavior of
• The map limit properties (
properties (
and
Zone propertie s interact in a more clear and predictable fashion.
For more information, see the section “Using the Map Limit Properties” in the
Mapping Toolbox™ User’s Guide and bug report 319891 on the MathWorks
Web site.
FLatLimit and FLonLimit), and the Origin, MapProjection,
defaultm resolves possible inconsistencies betw een these
axesm and setm.
MapLatLimit and MapLonLimit), the frame limit
Changing Projection Type of an Existing Map Axes with setm
In previous releases, calling the setm function to change the MapProjection
property of a map axes, especially when switching between an azimuthal and
non-azimuthal projection (e.g., a conic or cylindrical projection), often resulted
in the following types of problems:
• The modified map axes mig ht cover a different part of the Earth.
• The map frame and graticule might fail to update properly.
• Map limit properties changed at the same time as the projection might
not have the proper effect.
18
The
setm function now more effectively resets the projection, clearing out
settings that were specific to the earlier projection, updating the map frame
and graticule, and staying in the same general part of the world (even when
switching between azimuthal and non-azimuthal projections).
Page 23

Version 2.7.1 (R2008b) Mapping Toolbox™ Software
Compatibility Considerations
You may need to change the way in wh ich you reset various map axes
properties, such as
Origin, FLatLimit,andFLonLimit after changing
projections, as discussed in the section “Switching Between Projections” in the
Mapping Toolbox User’s Guide. In many cases it will no longer be necessary
to reset as many properties.
Other Bug Fixes with Compatibility Considerations
• The default FLatLimit for lambert and lambertstd has been changed to
[-45 45]. In previous releases, axesm produced huge map frames, due to
the
FLatLimit default of [-90 90].
• The function
the parallels and meridians. In previous releases, a call to
linespec or property name/property value syntaxes returned empty.
• The function
maplonlimit fields.
• A reference ellipsoid set to a non-default value (via the
gridm now returns handles to the line objects used to display
gridm using
geotiff2mstruct no longer sets the maplatlimit and
geoid property)
no longer reverts to the default when the UTM zone is reset. For more
information, see bug report 459353 on the MathWorks Web site.
• The
daspectm function now works for azimuthal projections and units of
radians.
coast.MAT Data File Revised
Portions of the global coastline l ati tud e-longitude vectors in the coast.MAT
data file have been revised to ensure proper polygon topology. The data edits
comprise the following:
• Replacingorremovingvarious"bow-tie" and degenerate linear
(non-polygonal) island features.
• Opening a "pinched" section in the middle of Lake Balkhash in Central
Asia.
• Merging the eastern and western sections of Wrangel Island ne ar the
Bering Strait (cut by the 180-degree m e ridian) into a single polygon with
longitudes ranging from slightly less than 180 to slightly greater than 180.
19
Page 24

Mapping Toolbox™ Release Notes
• Eight additional edits to pull apart landmasses w ith points of contact and
remove coastal "spikes."
Map Limit Syntaxes Removed
The f ollow ing syntaxes are obsolete. An error occurs if you u se them.
•
pcolorm(Z)
• pcolorm(Z,gratsize)
• surfacem(Z)
• surfacem(Z,gratsize)
• surflm(Z)
• surflm(Z,s)
• surfm(Z)
• surfm(Z,gratsize)
20
These syntaxes displ ay ed a data grid with geographic limits that matched
the map latitude and longitude limits in the current map axes. Using the
old syntaxes correctly involved knowing the latitude and longitude limits of
your data and matching them to the values listed under
maplonlimit in the map axes properties. We have replaced these syntaxes
maplatlimit and
with a more dire ct approach that requires you to enter the latitude and
longitude limits for the data grid.
Compatibility Considerations
The table below suggests alternative code to replace the obsolete syntaxes.
In the following table,
and
gratsize is a two-element vector specifying the size of the graticule
on which
gratsize = [number_of_parallels number_of_meridians]
isahandletothesurfacethatisdisplayed.Andlatlim and lonlim are the
h
Z displays:
geographic limits of the data grid (in degrees):
latlim = [southern_limit northern_limit]
Z is a regular data grid (a 2-D array of cl a ss double)
Page 25

Version 2.7.1 (R2008b) Mapping Toolbox™ Software
lonlim = [western_limit eastern_limit]
Original Syntax Replacement Syntax
h = pcolorm(Z)
[lat,lon] = meshgrat(latlim,lonlim,size(Z));
constructs a surface using the regular
data grid
(using
size(Z) and with geographic limits
Z and a graticule mesh
meshgrat) with size equal to
that match the map latitude and
longitude limits in the current map
axes.
h = pcolorm(Z,gratsize)
uses a graticule mesh with size equal
to
gratsize.
h = surfacem(Z)
constructs a surface using the regular
data grid
(using
Z and a graticule mesh
meshgrat) of size 50-by-100.
The geographic limits match the map
latitude and longitude limits in the
current map axes.
h = surfacem(Z,gratsize)
uses a graticule mesh with size equal
to
gratsize.
h = surflm(Z)
h = pcolorm(lat,lon,Z)
[lat,lon] = meshgrat(latlim,lonlim,gratsize);
h = pcolorm(lat,lon,Z)
h = surfacem(latlim,lonlim,Z)
[lat,lon] = meshgrat(latlim,lonlim,gratsize);
h = surfacem(lat,lon,Z)
h = surflm(latlim,lonlim,Z)
constructs a surface using the regular
data grid
(using
size(Z) and with geographic limits
Z and a graticule mesh
meshgrat) with size equal to
that match the map latitude and
longitude limits in the current map
axes. It is displayed with a default
light source.
21
Page 26

Mapping Toolbox™ Release Notes
Original Syntax Replacement Syntax
h = surflm(Z,s)
h = surflm(latlim,lonlim,Z,s)
specifies the direction of the light
source.
s is a two- or three-element
vector that specifies the direction
fromthesurfacemaptothe
light source as defined in the
documentation for
h = surfm(Z)
surfl.
h = surfm(latlim,lonlim,Z)
constructs a surface using the regular
data grid
(using
size(Z) and with geographic limits
Z and a graticule mesh
meshgrat) with size equal to
that match the map latitude and
longitude limits in the current map
axes.
h = surfm(Z,gratsize)
[lat,lon] = meshgrat(latlim,lonlim,gratsize);
uses a graticule mesh with size equal
to
gratsize.
22
h = surfm(lat,lon,Z)
Page 27

Version 2.7 (R2008a) Mapping Toolbox™ Software
Version 2.7 (R2008a) Mapping Toolbox Software
This table summarizes what’s new in Version 2.7 (R2008a):
New
Features
and
Changes
Yes
Details b elo w
• “Functions for Working with Geographic Quadrangles” on page 24
• “Fixes and Improvements to Function avhrrgoode” on page 25
• “Improved Accuracy for the limitm and setpostn Functions” on page 26
• “New Point Location Demo Data for Tsunami Events” on page 27
• “Better Trimming Benefits fillm Function” on page 28
• “Restored units Options for Function angl2str” on page 28
• “New Longitude-Wrapping Option in the closePolygonParts Utility ” on
page 29
Version
Compatibility
Considerations
Yes — Details
labeled as
Compatibility
Considerations
in descriptions
of new features
and changes,
below. See also
Summary.
Fixed Bugs
and Known
Problems
Bug reports at
Web site
Related
Documentation
at Web Site
Printable Release
Notes: PDF
Current product
documentation
• “Changes to Terminology for Geographic Data Structures” on page 29
• “Identifiers Provided for all Warnings” on page 30
• “Documentation for Functions tigermif and tigerp Removed” on page 31
• “Removed Syntaxes that Returned Error Messages in Optional A rgument”
on page 31
23
Page 28

Mapping Toolbox™ Release Notes
Functions for Working with Geographic Quadrangles
A geographic quadrangle is an area on the surface of a sphere or ellipsoid
bounded on the east and west by a pair o f meridians and on the north and
south by a pair of parallels. In many ways, such an object is similar to
a bounding rectangle in the plane, but they can be difficult to work with
because of the way longitudes w rap around and the way meridians converge
at the p oles. For example,
• The western longitude limit can have a larger numerical value than the
eastern longitude limit.
• If one of the bounding latitudes is +90 or -90 degrees, the quadrangle has
three sides rather than four.
• As noted below, the intersection o f two geographic quadrangles might
possibly comprise two separate parts—with the eastern e nd of the first
quadrangle intersecting the western end of the second quadrangle, and
vice versa.
Mapping Toolbox software typically represents a geographic quadrangle in
terms of its latitude and longitude limits, stored i n 1-by-2 vectors having
the forms
24
latlim = [southern_limit northern_limit]
lonlim = [western_limit eastern_limit]
Vectors like these have been used in various Mapping Toolbox functions
since its inception, and can appear in the input or output argument lists of
over dozen functions.
In R2008a, three new functions let you query, intersect, and display
geographic quadrangles, and account for subtleties such as those described
above:
•
ingeoquad — Returns true for points inside or on latitude-longitude
quadrangle
•
intersectgeoquad — Returns intersection(s) of two latitude-longitude
quadrangles
•
outlinegeoquad — Returns sampled p olyg on vertices for a
latitude-longitude geographic quadrangle
Page 29

Version 2.7 (R2008a) Mapping Toolbox™ Software
Use inge oqua d, for example, to check whether a geographic point is located
within the area covered by a regular data grid, given the latitude and
longitude limits computed by
Use
intersectgeoquad to compute overlap, if any, between two quadrangles.
limitm.
Interestingly, three general results are possible : no intersection, an
intersection that is itself a geographic quadrangle, and an intersection the
comprises two distinct geographic quadrangles. (The intersection can have
two parts if the input quadrangles wraparoundinlongitudetooverlapon
both their eastern and western sides. This case, of course, is not possible for
bounding boxes in the plane.)
Use
outlinegeoquad to generate a pair of latitude and longitude coordinate
vectors that define a polygon that traces the outline of a geographic
quadrangle. This can be useful for displaying the quadrangle graphically
using
geoshow, for example, especially on a projection where the meridians
and/or parallels do not project to straight lines, because in addition to
connecting the four corners
outlinegeoquad lets you interpolate additional
vertices along parallels, meridians, or both.
Fixes and Improvements to Function avhrrgoode
Function avhrrgo ode has been rewritten to improve its efficiency and to
remove a number of problems and limitations:
• Fixed a spatial referencing problem when a nonglobal region has been
specified which caused locationstobeoffsetbyhalfapixel.
• The function no longer returns incorrect NaN coordinate values at the
equator when given certain latitudelimitsthatcrosstheequator.
• The function no longer errors when attempting to read a file name with
certain legal latitude and longitude limits.
• The new version executes at least five times faster.
Compatability Considerations
• The nonfunctional syntaxes avhrrgoode and avhrrgoode(r egio n) have
been removed from the documentation.
25
Page 30

Mapping Toolbox™ Release Notes
• The function now returns empty when the user-supplied limits are outside
data limits.
• The function no longer permits longitude limits to be specified outside
the interval [-180 180].
• Parameters other than
to use their default values.
• In versions prior to R2008a, when reading from the global data set and
a smaller region data set, the size of the outputs differed by one column
from each other when given identical latitude and longitude limits. Now
thesizesarethesame.
region and filename can be specified as empty
Improved Accuracy for the limitm and setpostn Functions
In previous releases, after calculating the latitude and longitude limits of
the geographic quadrangle bound in g a regular data grid , function
arbitrarily rounded those limits to the nearest one millionth o f a degree
(equivalent to about 10 cm in latitude or equatorial longitude). Although it is
small, this rounding operation in effect applied an arbitrary shift to points on
or very near the edge of the grid. The direction of the shift and its m agnitude
were arbitrary because rounding can either increase or decrease a value. In
any given case, the shift depended on the specific referencing vector and the
number of columns and rows in the data grid. This behavior unnecessarily
degraded the numerical accuracy of
on it, and it has now been rem oved. For more information, see bug report
420038 on the MathWorks Web site.
limitm and those functions which depend
limitm
26
In the
Additional changes eliminate a problem for certain input points near
boundaries between grid cells that caused row and column subscripts returned
by
of the data grid—but still within the grid—returned subscript values could
exceed the corresponding grid size. For more information, see bug report
173338 on the MathWorks Web site.
setpostn function , an identical rounding step has been removed.
setpostn to be off by 1. For points near the northern and eastern edges
Page 31

Version 2.7 (R2008a) Mapping Toolbox™ Software
Compatibility Considerations
These corrections can cause subtle changes in the behavior of other functions
that work with regular data grids referenced to latitude-longitude, for
example,
imbedm.
If your referencing vector contains approximations to rational numbers that
do not have an exact a 64-bit floating point representation (e.g., for cells that
are 1.5 degrees wide,
refvec(1) is 0.666666...), you may still find that certain
points that are extremely close to a grid cell boundary cross into a neighboring
cell just across the boundary. Such numerical ambiguity is inevitable given
how the information in a referencing vector is encoded. Although it cannot
be eliminated within
within a few factors of
setpostn, the inexactness only affects points that fall
eps (very much less than a millionth of a degree) away
from a given cell boundary.
New Point Location Demo Data for Tsunami Events
The Mapping Toolbox demo data in the $MATLABROOT/toolbox/map/mapdemos
directory now includes a global tsunami data set in shapefile format with
'Point' geometry. The data set comprises four files:
tsunamis.dbf
tsunamis.shp
tsunamis.shx
tsunamis.txt
tsunamis.txt
is not part of the shapefile set. It is a text file docum enting
the data set.
The data includes tidal wave events for which the maximum water height
was at least one meter, ranging for the years 1950 to 2006, inclusiv e. The
Global Tsunami Databa se, U.S. National Geospatial Data Center (NGDC),
National Oceanic and Atmospheric Administration (NOAA), available at
http://www.ngdc.noaa.gov/seg/hazard/tsu.shtml, is the source of the
data. All the files consist of U.S. Government information that is in the public
domain and is not subject to copyright protection.
The approximate location of each event is a single point in geodetic coordinates
(latitude-longitude) with an unspecified datum. The
.dbf file contains 18
27
Page 32

Mapping Toolbox™ Release Notes
separate text or numeric attributes for most events, including wave height,
causes and seismic magnitudes, and location and country names.
TheshapefileswerecreatedatTheMathWorksfromqueryingtheonline
source data, importing the results into the MATLA B workspace, and
exporting them using the Mapping Toolbox
information, type
edit tsunamis.txt
at the M ATLAB prompt.
Better Trimming Benefits fillm Function
The changes described in the Versin 2.6 (R2007b) release note “Improvements
to Data Trimming in patchm and patchesm” on page 40 resulting from
improved polygon trimming also apply to the
Restored units Options for Function angl2str
The angl2str function once again can format strings for angles in
degrees-minutes (DM) and degrees-minutes-second (DMS) notations. These
options were removed in Version 2.6 (R2007b), and have now been restored.
In addition to the
obtain DM- and DMS-formatted strings by specifying
shapewrite function. For more
fillm function.
'degrees' and 'radians' units optio ns, you can now
28
•
'degrees2dm' — for degrees-decimal minutes formatting
'degrees2dms' — for degrees-minutes-decimal seconds formatting
•
To use these options, input angles must be in degrees. That is,
the string
units to indicate both the units in which the angle argument is
angl2str uses
provided and to control the output format.
This change restores the behavior of
angl2str prior to V ers ion 2.6 in a
slightly different form. Before V. 2.6, the DM and DMS options were specified
by a
units strings of 'dm' and 'dms', respectively. The new strings that
replace them signify that the functions
degrees2dm and degrees2dms,
introduced in Version 2.5 (R2007a), perform the conversions of inputs given in
degrees to DM and DMS notation.
Page 33

Version 2.7 (R2008a) Mapping Toolbox™ Software
New Longitude-W
closePolygonPa
The close Pol ygo
angleunits,th
'radians'. If
first two
for longitude
latitude with
alongitudeo
is not added.
at must be string-valued and can be either
you include this argument with a value appropriate for the
, lon)
(lat
wrapping. For example, a polygon that begins at a given
a longitude of -180 degrees, and ends at the same latitude with
f 180 degrees is regarded as closed and an a dditional vertex
Changes to T
rts Utility
nParts
arguments, cl oseP olygonParts can correctly account
erminology for Geographic Data
Structures
From Versi
to “versio
structure
shorthan
the toolb
defined t
• Geograp
feature
on 2.0 onward, the Mapping Toolbox docume ntation has referred
n 1 geographic data structures” and “version 2 geographic data
s,” using the terms “geostruct1” and “geostruct2” respectively as
d for them. T o reflect current usage, starting with this version of
ox, these terms are obsolete; new terms and distinctions hav e been
o help clarify what these structures are and can be used for:
hic data structure arrays, introduced in Version 2.0, contain vector
s and are called either
rapping Option in the
function now accepts an optional third argument,
'degrees' or
- Geostr
- Mapstr
• Displ
geogr
geoda
Due t
form
age raste r geodata is with regular or geolocated data grids (2-D numeric
pack
ays accompanied by referencing matrices or vectors). There are only a
arr
Mapping Toolbox functions that can still generate display structures (by
few
orting data from external file formats):
imp
wdata
•
dc
ucts, if they contain geographic coordinates (latitudes and
udes)
longit
ucts, if they contain projected map/planar coordinates (x and y)
ay structure arrays, dating from Version 1, also used to be called
aphic data structures, and can contain either vector features or raster
ta.
o their greater generality, geostructs and mapstructs are the preferred
in which to represent vector features in the toolbox. The preferred way to
— Returns line/patch display structures
29
Page 34

Mapping Toolbox™ Release Notes
• dcwgaz — Returns line/patch display structures
demdataui — Returns “regular”—as in regular data grid, that is—display
•
structures
•
mlayers — GUI to control plotting of display structure elements
tgrline — Returns line/patch display structures
•
vmap0data — Returns line/patch display structures
•
vmap0ui — GUI for selecting data from Vector Map Level 0
•
Even fewer functions accept display structures as inputs:
•
displaym — Displays elements of a display structure
extractm — Extracts lat-lon coordinates from line/patch display structure
•
In addition to
displaym and extractm,theupdategeostruct function
converts a line or patch display structure to a geostruct.
For m ore information, see “Mapping Toolbox Geographic Data Structures”.
Identifiers Provided for all Warnings
All warnings issued from within Mapping Toolbox functions now include
identifiers, enabling you to suppress them at your own discretion. Previously,
this was possible for only certain warnings, but with the addition of new
identifiers in over two dozen functions in R2008a, all warnings are now
covered. For example, you canturnoffthewarningthat
when given a latitude-longitude position outside the limits of the specified
data grid. In this case, the warning identifier is
'map:setpostn:pointOutsideLimits'
You can suppress it using the following statement:
warnstate = warning('off','map:setpostn:pointOutsideLimi ts') ;
Then, after making your call to setpostn, you can restore the original
warning state with
warning(warnstate);
setpostn issues
30
Page 35

Version 2.7 (R2008a) Mapping Toolbox™ Software
See the MATLAB warning function reference page for the for more
information on turning warnings off and on and managing the warning state.
Documentation for Functions tigermif and tigerp Removed
The reference pages for following functions, which themselves were removed
in R2007b, have been removed from the Mapping Toolbox User’s Guide:
•
tigerp —ReadTIGERp and pa thinned boundary files (ArcInfo format)
tigermif — Read the TIGER MIF thinned boundary file (MapInfo format)
•
Compatibility Considerations
SeetheR2007breleasenote“FunctionstigermifandtigerpAreObsoleteand
Error if Used” on page 48 for alternatives to
tigermif and tigerp.
Removed Syntaxes that Returned Error Messages in
Optional Argument
In earlier versions, the following Mapping Toolbox functions supported
syntaxes that included an optional output argume nt called
argument was included in a call to one of these functions, and certain error
conditions were encountered while executing the function, then instead of
issuing a n error, the function would return the corresponding error message
in
msg. The following functions are affected:
msg. If this output
•
axesm
• defaultm
• displaym
• gcm
• handlem
• lightm
• linem
• maps
31
Page 36

Mapping Toolbox™ Release Notes
• meshm
• namem
• patchesm
• roundn
• surfacem
• surflsrm
• textm
• unitstr
• utmzone
• utmzoneui
For example, even with no map axe s present, the command
[mstruct, msg] = gcm
32
returned without error in R2007b and earlier, but placed an error message
string in
msg.
These syntaxes have been disabled in R2008a. If you try to use them, a
warning is issued. The warning may be followed by an error, depending on
whether or not an error condition is encountered within the function. For
example, if a map axes is present, the command above results in
Warning: Function GCM no longer returns error message strings in
output argument MSG. Inst ead any errors are thrown where they occur.
You should remove the la st output argument (MSG) from your call to
GCM in order to avoid this warning. If you want to handle errors
yourself, call GCM in a try-catch block.
> In mapdisp/private/warnObsoleteMSGSyntax at 6
In gcm at 20
Ifthereisnomapaxes,itresultsin
Warning: Function GCM no longer returns error message strings in
output argument MSG. Inst ead any errors are thrown where they occur.
You should remove the la st output argument (MSG) from your call to
Page 37

Version 2.7 (R2008a) Mapping Toolbox™ Software
GCM in order to avoid this warning. If you want to handle errors
yourself, call GCM in a try-catch block.
> In mapdisp/private/warnObsoleteMSGSyntax at 6
In gcm at 20
??? Error using ==> gcm> chec kaxes at 41
No axes in current figure.
Select a figure with map axes or use AXESM to define o ne.
Error in ==> gcm at 24
h = checkaxes(varargin{:});
Compatibility Considerations
As suggested by this warning, if you have any scripts or functions of your own
that depend on the old syntax, you should remove the
the function call in a
try-catch block instead.
msg argument and place
33
Page 38
Mapping Toolbox™ Release Notes
Version 2.6 (R2007b) Mapping Toolbox Software
This table summarizes what’s new in Version 2.6 (R2007b):
New
Features
and
Changes
Yes
Details b elo w
• “Exporting Vector Geodata to Earth Browsers” on page 35
• “Improved Conversion Between Angle Units” on page 36
• “ImprovementsinHandlingLengthUnits”onpage38
• “New Angle Wrapping Functions” on page 39
• “New Function to Unwrap Sequences of Angles” on page 39
• “Improvements to Data Trimming in patchm and patchesm” on page 40
• “Higher Quality boston.tif GeoTIFF Satellite Image” on page 41
Version
Compatibility
Considerations
Yes — Details
labeled as
Compatibility
Considerations
in descriptions
of new features
and changes,
below. See also
Summary.
Fixed Bugs
and Known
Problems
Bug reports at
Web site
Related
Documentation
at Web Site
Printable Release
Notes: PDF
Current product
documentation
34
• “Map Axes Now Display Transparent Objects More Easily” on pag e 42
• “The arcgridread Function Now Imports Noninteger Data Grids” on page 43
• “Change to avhrrlam bert Function Behavior When No Data Is Available”
on page 43
• “Enhancements to Mapping Toolbox User’s G uid e” on page 43
• “Functions deg2rad and rad2deg No Longer Convert Complex to Real”
on page 43
Page 39

Version 2.6 (R2007b) Mapping Toolbox™ Software
• “Degrees-Minutes-Seconds Conversion Functions Are Obsolete and Error
if Used” on page 44
• “Time Conversion Functions Are Obsolete and Error if Used” on page 47
• “cmapui GUI is now Obsolete” on page 47
• “Functions tigermif and tigerp Are Obsolete and Erro r if Used” on page 48
Exporting Vector Geodata to Ear th Browsers
kmlwrite is a new function for exporting vector point data to a file in KML
format. KML stands for Keyhole Markup Language; it is an XML dialect
used to structure geographic data for display in an Earth browser, such as
Google™ Earth, Google Maps, and Maps for Google Mobile. KML has a
hierarchical structure of nested elements and attributes.
simpleAPIthatletsMappingToolboxuserswritevectordatatoaKMLfilein
order to subsequently display the data onto an Earth browser.
kmlwrite has a
When used with Google Earth, files output from
kmlwrite can be seen
immediately in Google Earth, if that application is available to the user.
If the files are uploaded to a publicly accessible Web server, they can be
viewed by anyone on the Internet via Google Maps or other Web sites and
browser utilities that can read and display KML files. Google Maps and
GoogleMapsformobiledonotsupporttherangeofKMLmarkupthatGoogle
Earth supports (for example, placemark locations m ust be specified to them
as coordinates, not as addresses). See the Google KML documentation at
http://code.google.com/apis/km l /d o cu mentation/mapsSupport.html for more
information.
kmlwrite accepts latitude and longitude point vectors, passed either in
geostructs or as column arrays. It also accepts addresses, w hich can be
as general as a country’s name or as specific as a street address. When
geostructs are the input, the attribute data in the geostruct can be formatted
as HTML tables and included in the KML output. When latitude-longitude
arrays are input, you can pass attributes to
kmlwrite with strings. When
addresses are the input, geostructs are not used.
To customize p lacemarks, you can control formatting of geostruct attributes in
the KML file with an attribute specification, a struct used to format them (for
example, to add units to length attributes or to control the number of decimal
places for numeric values). A new support function,
makeattribspec lets you
35
Page 40

Mapping Toolbox™ Release Notes
change the names used as labels in placemarks (geostruct field names are
used by default), omit fields from placemarks, and add HTML markup to the
attributes displayed in placemark tables.
See “Exporting Vector Geodata” in the Mapping Toolbox User’s Guide and
the mapexkmlexport demo, “Exporting Vector Point Data to KML” for more
information.
Improved Conversion Between Angle Units
The ang ledi m function has been replaced by four, more specific, functions:
fromRadians, fromDegrees, toRadians,andtoDegrees (described below
in “Four New Angle-Unit Conversion Functions” on page 37). However,
angledim has been retained in Version 2.6 for backward compatibility.
The functions
alternatives.
degtorad, radtodeg,andunitsratio provide additional
Because it must resolve both the input and output units,
excessive for most applications. It works only for class
angledim is
double and it quietly
discards the imaginary part of any complex input. You can use any of several
more efficient alternatives:
If you are working from the command line, you can often replace
angledim
with degtorad or radtodeg. If you are converting angle units within a script
or function and you know both the
coding, then you can also replace
If you know either
fromRadians, fromDegrees, toRadians,ortoDegree s.Applyoneofthe
from or to at the time of coding, then you can use
from and to unit names at the time of
angledim with degtorad or radtodeg.
following transformations to your code:
•
angledim(angleIn,'radians',to) ⇒ fromRadians(to, angleIin)
• angledim(angleIn,'degrees',to) ⇒ fromDeg rees (to,angleIin)
• angledim(angleIn,from,'radians') ⇒ toRadians(from,angleIn)
• angledim(angleIn,from,'degrees') ⇒ toDegrees(from,angleIn)
Also note that the functions in the fromRadians family can convert multiple
variables in a single function call. For example, you can replace this code
angle1 = angledim(angle1InRadians,'radians',to);
36
Page 41

Version 2.6 (R2007b) Mapping Toolbox™ Software
angle2 = angledim(angle2InRadians,'radians',to);
with
[angle1,angle2] =
fromRadians(
to,angle1InRadians,angle2InRadians);
If you do not know either f rom or to atthetimeofcoding,thenyoucancall
unitsratio to obtain the correct conversion factor, then multiply the values
of one or more variables. For example, you can replace:
angle1Out = angledim(angle1In, from, to);
angle2Out = angledim(angle2In,
from, to);
with
r = unitsratio(to, from);
angle1Out = r * angle1In;
angle2Out = r * angle2In;
Four New Angle-Unit Conversion Functions
The following functions have been added for efficient conversion of angle
units (degrees or radians) when either the target or destination units (but not
both) are unknown before run time.
•
toDegrees — Convert angles to degrees
toRadians — Convert angles to radians
•
fromDegrees — Co nvert angles from deg rees
•
fromRadians — Convert angles from radians
•
If the output units match the inputs units, as in
angle2,...)
,whereunits turns out to equal ' degr ees', then the input
angles are simply copied to the output angles.
Use these functions in place of
angledim. The new functions are more
efficient, especially when the value of either the
angledim is known in advance and the value of the other angle-unit argument
is not.
toDegrees(units, angle1,
from or to argument of
37
Page 42

Mapping Toolbox™ Release Notes
Improvements in
Handling Length Units
Alternatives to the distdim Function
There are now mo
than the
distd
compute multi
units of dista
For other alte
page for deta
re efficient ways to convert length and distance units
im
function. In place of distdim,youcanuseunitsratio to
plicative factors to apply when converting between different
nces and angles, which you can use in subsequent calculations.
rnatives, see “Replacing distdim” in the
ils.
The unitstr function Is Obsolete
The unitstr
distance, a
The syntax
Instead, s
Compatib
unitsrat
function, which validates names and abbreviations for units of
ngle, and time, is obsolete and will be removed in a future release.
str = unitstr(str,'times') has already been removed.
ee the documentation for
unitsratio for a list of val id unit strings.
ility Considerations. Thereisnoreplacementfor
io
recognizes all the unit strings known to the toolbox.
Interpretation of “Miles” Units has Changed
As of R20
'miles'
07b, the following functions interpret distance units specified as
as International Miles,notStatute Miles:
distdim reference
unitstr,but
38
•
almana
• daspec
• eleva
• mappr
• pape
• scal
rscale
eruler
c
tm
tion
ofile
Page 43

Version 2.6 (R2007b) Mapping Toolbox™ Software
Compatibility Conside rations. T his will not materially affect the
accuracy of results in most cases; the lengths of the two types of miles only
differ by about two parts per million (three millimeters). The
distdim
function’s interpretation of miles has not changed. However, there are better
alternatives to it; see the release note “Alternatives to the distdim Function”
on page 38.
New Angle Wrapping Functions
Four new low-level functions have been added that force longitudes, azimuths,
orphaseanglestospanintervalsof
2*pi]
•
•
•
•
or [-pi pi] radians.
wrapTo180 — Wrap angle in degrees to [-180 180]
wrapTo360 — Wra p angle in degrees to [0 360]
wrapToPi — Wrap angle in radians to [-pi pi]
wrapTo2Pi — Wra p angle in radians to [0 2*pi]
[0 360] or [-180 180] degrees or [0
The first two functions work in degrees, the next two in radians. None of
them perform argument checking.
You can use the new wrapping and functions in place of
npi2pi and zero22pi
for greater efficiency. The older functions will eventually be removed from
the toolbox.
New Function to Unwrap Sequences of Angles
The new unwrapMultipart function unwraps vectors of angles similarly to
the MATLAB function
NaN separators, unwrapping each section separately. Use it to remove
discontinuities from vectors of longitudes, azimuths, or phase angles that
contain NaN-delimited sequences and as a replacement for the obsolete
function
smoothlong.
unwrap,exceptthatithandlesvectorsthatinclude
39
Page 44

Mapping Toolbox™ Release Notes
Improvements to
Data Trimming in patchm and
patchesm
The patchm and pa
parts of polygo
also affects
f
shifted coord
where they wou
map frame. Thi
constructed
use of
by
AlphaD
Now Display T
tchesm
ns th a t fall ou tside your current map limits. This improvement
illm
, which calls patchm. Previously the patch functions simply
inates inward so that vertices collected at the edge of the limits,
ld appear as lines along map borders, unless obscured by the
s change allows OpenGL to better render the patch objects
patchm and patchesm, making them more compatible w ith the
ata
to achieve transparency. Seethereleasenote“MapAxes
ransparent Objects More Easily” on page 42 for more details.
Compatibility Considerations
Themoreco
circumsta
the data pr
objects c
display f
whenever
map limi
will bec
are trim
separat
will be
map lim
by
patc
map ax
mplete trimming in
nces under which automatic reprojection can no longer display all
ovided to these functions. Automatic reprojection causes map
reated with
unctions (but not
acallto
setm changes certain map axes properties, including the
ts and projection type. In the case of
ome unavailable for automatic reprojection if all of the polygons
med away completely. In the case of
e object for each polygon, any polygon that is trimmed away completely
unavailable for reprojection, even if it would lie within newly defined
its. In either of these cases, you should delete the handle(s) returned
hm
or patchesm, then repeat the original calls after changing your
es properties.
functions now completely trim away polygons and
patchm and patchesm means that there are
plotm, linem, patchm, patchesm, and certain other
geoshow) to be remov ed, projected, and redisplayed
patchm, a set of polygons
patchesm, which constructs a
40
Other
•
• You m
See
Eas
potential compatibility issues:
hm
patc
poly
and patches m exhibit greater sensitivity to incomplete or incorrect
gon topology.
ight need to manually set the renderer f or proper display of some
ch data
pat
the release note “Map Axes Now Display Transparent Objects More
ily” on page 42 for information about rendering and the Mapping Toolbox
Page 45

Version 2.6 (R2007b) Mapping Toolbox™ Software
demo mapexgshhs for an example of a situation where polygon topology
necessitates manual setting of the renderer.
Higher Quality boston.tif GeoTIFF Satellite Image
The original boston.tif GeoTIFF satellite image has been replaced by a
higher resolution image, created by and provided courtesy of GeoEye™.
Thenewimagehasthesamenameastheoldone,
boston.tif file, and an ov erview image in JPEG format, boston_ovr.jpg,
include m aterial copyright © by GeoEye, all rights reserved. The new image
is 2881-by-4481 pixels, with a ground pixel size of 3.2808333333 U.S. survey
feet (one meter). The original image was 720-by-1120 pixels and had a
ground pixel size of four meters. Both images cover the downtown section
of Boston, Massachusetts, the CharlesRiver,andpartsofCambridge. The
new image is a “pan-sharpened” multispectral image with visible red, green,
and blue bands, and is stored in RGB form. The original image was also
multispectral, but was a simple composite of red, green, and blue bands, and
it was written to the GeoTIFF file as an indexed-color image. One additional
change is that rather using meters, thenewimageisspatiallyreferenced
to the Massachusetts State Plane M ainland coordinate system with units
of U.S. survey feet. The overview image,
boston_ovr.jpg, is referenced to
latitude-longitude, with a ground pixel size of approximately 16 meters. For
further information, refer to the text files
boston_metadata.txt in toolbox/map/mapdemos.
boston.txt, boston_ovr.txt,and
boston.tif. The new
Compatibility Considerations
Older satellite images of Boston and a demo have been removed from
Mapping Toolbox directories. The new
images replace the images having the same names previously included
in
toolbox/map/mapdemos. In addition, several older images related to
boston.tif have been removed:
•
boston_red.tif
• boston_green.tif
• boston_blue.tif
• boston_pan.tif
• boston_enhanced_pan.tif
boston.tif and boston_ovr.jpg
41
Page 46

Mapping Toolbox™ Release Notes
The mapexenhance demo (“Enhancing Multispectral GeoTIFF Images”), which
used several of these images, has also been removed.
Map Axes Now Display Transparent Objects More Easily
It is now much easier to achieve transparency effects from the toolbox by
setting the
lightm, contourm,andcontour3m se t the figure’s Renderer property: axesm
and lightm set it to 'zbuffer',whilecontourm and contour3m set it to
'painters'. You then had to manually reset Renderer to 'opengl' in order
for transparency to take effect.
AlphaData property of an object. Previously, functions axesm,
Now the
of
'auto', causing M ATLAB to select the most appropriate renderer for
you; it will use OpenGL when appropriate, given your
RendererMode of the figure retains the default MATLAB value
AlphaData settings.
Using OpenGL not only enables transparency effects, it also can make use of
hardware graphics acceleration capabilities should they be available.
Compatibility Considerations
If you need a particular map display to look the same as it did in Mapping
Toolbox Version 2.5 (R2007a), in most cases you can just issue the command
set(gcf,'Renderer','zbuffer')
after you construct your map axes. If you are calling contourm or contour3m,
issue the command
set(gcf,'Renderer','painters')
after you call the contouring function.
Theconsequenceofdoingthisisthatyouwillnotbeabletousetransparency
with that map figure until you reset its renderer to
'RendererMode' back to 'auto', which is its default state.
'opengl' or set its
42
Page 47

Version 2.6 (R2007b) Mapping Toolbox™ Software
The arcgridread
Function Now Imports Noninteger
Data Grids
In pr evious rele
that had intege
been removed,
notation.
Change to avh
Data Is Avail
In previous
quadrangle
in the appro
intersect t
release,
matrices.
a
Compatibility Considerations
If you dep
quadran
gle, you will need to change your code.
Enhance
Severa
been re
topics
and th
new se
use th
l sections of the chapter “Understanding G eo spatial Geometry” have
written and new material has been added to better explain critical
such as ellipsoid models, units of and notations for angles and length,
e conversions that are possible between various units. There is also a
ction, “Exporting Vector Geodata”, explaining and illustrating how to
enew
ases of the toolbox,
r values (often of meters or feet). This limitation has now
such that input grids can contain arbitrary values in decimal
rrlambert Function Behavior When No
able
releases of the toolbox,
defined by
priate Lambert Equal Area Azimuthal projection) failed to
he bounding box of the data in the projected coordinates. In this
vhrrlambert
end on
latlim and lonlim (when projected to form a polygon
does not error when this occurs but returns empty
avhrrlambert to error when there is no data in your
ments to Mapping Toolbox User’s Guide
kmlwrite and makeattribspec functions.
arcgridread could only import data grids
avhrrlambert would error if the
Func
Comp
In p
iss
lon
fun
Fo
tions deg2rad and rad2deg No Longer Convert
lex to Real
rior versions, when given complex inputs, functions
ued a warning and then converted their inputs to real. Now they no
ger do either of these things; in the unlikely event of complex input, these
ctions simply scale the imaginary part by the same factor as the real part.
r example, in R2007a and earlier releases, they behave as follows:
deg2rad and rad2deg
43
Page 48

Mapping Toolbox™ Release Notes
>> deg2rad(180i)
Warning: Imaginary parts o f complex ANGLE argument ignored
> In deg2rad at 16
ans =
Going forward from this release, the result is
>> deg2rad(180i)
ans =
Degrees-Minutes-Seconds Conversion Functions Are
Obsolete and Error if Used
The following functions, which accepted or produced double scalars to
represent degrees, minutes, and seconds no w error when used, and will b e
removed completely from the toolbox in a future release:
0
0 + 3.1416i
44
•
deg2dm
• deg2dms
• dms2deg
• dms2dm
• dms2mat
• dms2rad
• mat2dms
• rad2dm
• rad2dms
The scalar DM and DMS encodings are being eliminated from the toolbox
because they were never used for internal computations, and alw ay s had
the potential to generate serious numerical errors if passed accidentally to
functions that expected normal latitude-longitude tuples. They also made the
functions that accepted them less efficient due to the need to convert from DM
or DMS to fractional latitudes and longitudes before processing the input data.
Page 49

Version 2.6 (R2007b) Mapping Toolbox™ Software
In every case, an alternative that does not use the old degrees-minutes-seconds
scalar encoding exists. See the following section on compatibility for
replacements and “New Functions for Degrees-Minutes-Seconds Conversions”
on page 51 in the V2.5 Release Notes for descriptions of replacement
functions, and the compatibility considerations below for descriptions of
alternative syntaxes and expressions you can use for degrees-minutes-seconds
conversions.
Compatibility Considerations
DM and DMS representations are widely used in published reports and
can occur in geodata that you want to read into the MATLAB workspace.
You can still import and export DM and DMS data, but Mapping Toolbox
functions no longer accepts the old encodings as alternatives to floating-point
representations of latitude and longitude for internal manipulations.
The following functions (which all use scalar DMS encoding) are being re tired.
They remain in the product for R2007b, but now generate errors when used.
They will be removed completely in the next version. Use the alternative
suggested in lieu of these functions.
•
deg2dm — Instead use degrees2dm to convert degrees to degrees-minutes
vector.
•
deg2dms —Insteadusedegrees2dms to convert d egre es to
degrees-minutes-seconds vector.
•
dms2deg — Instead use dms2degrees to convert degrees-minutes-seconds
vector to degrees.
•
dms2dm —Insteadcombinedms2degrees and degre es2dm,asin
degrees2dm(dms2degrees([-29 42 18.7])) to remove the seconds
component from a degree-minutes-second v ector.
•
dms2mat —Insteadusedegrees2dms to convert d egre es to
degrees-minutes-seconds vector.
•
dms2rad — Instead use dms2degrees to convert degrees-minutes-seconds
vector to degrees and call
mat2dms — Instead use dms2degrees to convert degrees-minutes-seconds
•
degtorad or multiply by pi/180.
vector to degrees.
45
Page 50

Mapping Toolbox™ Release Notes
• rad2dm — Instead, call radtodeg or multiply input arguments by 180/pi,
and then call
rad2dms —Instead,callradtodeg or multiply input arguments by 180/pi,
•
and then call
degrees2dm.
degrees2dms.
In addition, the
axesm and setm functions no longer accept the strings 'dms'
and 'dm' for setting either the AngleUnits or LabelUn its properties of
amapaxes.
Many other Mapping Toolbox functions optionally accept angle strings for
their
units parameter; the following 57 functions now only accept 'degrees'
and 'radians', whereas in prior versions they would also accept 'dm' and
'dms' as values for units:
angl2str distance histr putpole stdist
angledim eastof imbedm rcurve stdm
antipode elevation interpm reckon timezone
areaint ellipse1 intrplat rhxrh track
areamat epsm intrplon rotatem track1
areaquad eqa2grn mapprofile rsphere track2
axesm gc2sc meanm scaleruler unitstr
azimuth gcxgc meshgrat scircle1 westof
convertlat gcxsc neworig scircle2 zero22pi
crossfix gradientm newpole scxsc
daspectm grn2eqa npi2pi setm
departure hista org2pol smoothlong
46
These functions now error when provided 'dm' or 'dms' for their units
argument.
Page 51

Version 2.6 (R2007b) Mapping Toolbox™ Software
Time Conversion Functions Are Obsolete and Error if Used
The following functions, which converted time representations, now error
when used and will be rem ove d completely from the toolbox in a future release:
•
hms2hm
• hms2hr
• hms2mat
• hms2sec
• hr2hm
• hr2hms
• hr2sec
• mat2hms
• sec2hm
• sec2hms
• sec2hr
• time2str
• timedim
Compatibility Considerations
These functions now raise errors when they are invoked. They will be
completely removed in a future versionofthetoolbox. Nosubstitutes have
been provided, as no operations of the toolbox have ever depended on them.
cmapui GUI is now Obsolete
The cmapui GUI now errors if you attempt to use it. It will be completely
removed from the next Mapping Toolbox version. Use the MATLAB
colormapeditor GUI instead, which provides better functionality. You can
also use the Colormap drop-down menu in the Property Editor (part of
the MATLAB plotting tools and available via the
select a built-in colormap; the
colormapeditor. To set up a colormap for terrain displays, you can use the
custom option on that drop-down menu ope ns
propedit command) to
47
Page 52

Mapping Toolbox™ Release Notes
demcmap function. To generate an appropriate (but random) colormap for
political maps, use the
Functions tigermif and tigerp Are Obsolete and Error if Used
The following functions error and issue an error message when you attempt
to use them:
•
tigerp — Read TIGER p and pa thinned boundary files (ArcInfo format)
tigermif — Read the TIGER MIF thinned boundary file (MapInfo format)
•
Compatability Considerations
In place of these format readers, download U.S. Census cartographic boundary
files in shapefile format and use
polcmap function.
shaperead to import them.
48
Page 53

Version 2.5 (R2007a) Mapping Toolbox™ Software
Version 2.5 (R2007a) Mapping Toolbox Software
This table summarizes what’s new in Version 2.5 (R2007a):
New
Features
and
Changes
Yes
Details b elo w
New features and changes introduced in this version are
• “Performance Improvements for los2 and viewshed” on page 49
• “Utility Functions for Computing Distance and Position Along Meridians”
on page 50
• “SomeGUIsAreNoLongerAvailablefromtheCommandLine”onpage50
• “New Functions for Degrees-Minutes-Seconds Conversions” on page 51
• “Time Conversion Functions to be Removed” on page 54
Version
Compatibility
Considerations
Yes — Details
labeled as
Compatibility
Considerations
in descriptions
of new features
and changes,
below. See also
Summary.
Fixed Bugs
and Known
Problems
Bug reports at
Web site
Related
Documentation
at Web Site
Printable Release
Notes: PDF
Current product
documentation
Performance Improvements for los2 and viewshed
This release includes a faster los2 function (which com p utes intervisibility
between locations on or above a terrain grid). The
computes the portions of a terrain gridthatcanbeseenfromagiven
viewpoint) has also been accelerated as a result.
viewshed function (which
49
Page 54

Mapping Toolbox™ Release Notes
Utility Functions for Computing Distance and Position
Along Meridians
Two functions that reckon position and distance along a meridian on the
ellipsoid are now available:
•
meridianarc — Computes distance along a meridian between two latitudes
meridianfwd — R eckons position along meridian given a starting point
•
and distance
Some GUIs Are No Longer Available from the Command Line
In prior releases, when you typed certain Mapping Toolbox function names
with no argument list, a specialized GUI appeared that enabled you to
interactively set parameters related to the function. This feature was seldom
used and sometimes raised errors when users attempted to operate the GUIs.
Starting in this release, a GUI will no longer appear when you issue the
following commands:
50
•
comet3m
• cometm
• contourfm
• contour3m
• contourm
• demcmap
• fill3m
• fillm
• lightm
• limitm
• linem
• meshlsrm
• meshm
• patchesm
Page 55

• patchm
• pcolorm
• plot3m
• plotm
• quiver3m
• quiverm
• scatterm
• stem3m
• surfacem
• surflm
• surfm
• surflsrm
• symbolm
Version 2.5 (R2007a) Mapping Toolbox™ Software
• textm
Compatibility Considerations
Use the above functions with arguments to avoid raising errors. Their GUIs
will continue to be available via
containing map axes), but they are not being actively supported and will be
eliminated in a future release.
maptool (which places menus on a figure
New Functions for Degrees-Minutes-Seconds Conversions
Four new functions have been added to convert to and from decimal degrees
and degrees-minutes-seconds (DMS):
•
dms2degrees — Convert degrees-minutes-seconds to degrees
dm2degrees — Convert degrees-minutes to degrees
•
51
Page 56

Mapping Toolbox™ Release Notes
• degrees2dms — Convert degrees to degrees-minutes-seconds
degrees2dm — Convert degrees to degrees-minutes
•
The DMS inputs and outputs of these functions are vectors of one row and
three columns for each row in the decimal degrees input or output. The first
column contains the “degrees” element and is integer-valued. The second
column contains the “minutes” element and is integer-valued. The third
column contains the “seconds” element, and may have a nonzero fractional
part. Similarly, DM inputs and outputs are two-column vectors with integer
degrees and fractional minutes parts.
The new conversion functions dispense with the DMS encoding used in prior
versions of the toolbox. These represented DMS angles by a single real
number, the format of which is
internally by M apping Toolbox functions, as it is not self-documenting and
can lead to erroneous computations. For example, two DMS-encoded real
numbers cannot be added to obtain a meaningful result.
dddmm.ss. Such an encoding is no longer used
52
Compatibility Considerations
DM and DMS representations are widely used in published reports and
can occur in geodata that you want to read into the MATLAB workspace.
You can still import and export DM and DMS data, but Mapping Toolbox
functions no longer accepts the old encodings as alternatives to floating point
representations of latitude and longitude for internal manipulations.
The scalar DM and DMS encodings are being eliminated from the toolbox
because they were never used for internal computations, and always had the
potential to generate serious numerical errors if passed accidently to functions
that expected normal latitude-longitude tuples. They also made the functions
that accepted them le ss efficient d ue to the need to convert from DM or DMS
to fractional latitudes and longitudes before processing the input data.
The following existing functions (which all use scalar DMS encoding) are
being retired. They remain available but now issue warnings that they are
obsolete when used:
•
deg2dm — Instead use degrees2dm to convert degrees to degrees-minutes
vector
Page 57

Version 2.5 (R2007a) Mapping Toolbox™ Software
• deg2dms —Insteadusedegrees2dms to conv ert degrees to
degrees-minutes-seconds vector
•
dms2deg — Instead use dms2degrees to convert degrees-minutes-seconds
vector to degrees
•
dms2mat —Insteadusedegrees2dms to convert d egre es to
degrees-minutes-seconds vector
•
dms2rad — Instead use dms2degrees to convert degrees-minutes-seconds
vector to degrees and call
degtorad or multiply by pi/180
• mat2dms — Instead use dms2degrees to convert deg rees -minute s-seconds
vector to degrees
•
rad2dm — Instead, call radtodeg or multiply input arguments by 180/pi,
and then call
degrees2dm
• rad2dms —Instead,callradtodeg or multiply input arguments by 180/pi,
and then call
degrees2dms
In addition, the axesm and setm functions no longer accept the strings 'dms'
and 'dm' for setting either the AngleUnits or LabelUn its properties of
amapaxes.
Many other Mapping Toolbox functions optionally accept angle strings for
their
units parameter; the following 57 functions now only accept 'degrees'
and 'radians', whereas in prior versions they would also accept 'dm' and
'dms' as values for units:
angl2str distance histr putpole stdist
angledim eastof imbedm rcurve stdm
antipode elevation interpm reckon timezone
areaint ellipse1 intrplat rhxrh track
areamat epsm intrplon rotatem track1
areaquad eqa2grn mapprofile rsphere track2
axesm gc2sc meanm scaleruler unitstr
azimuth gcxgc meshgrat scircle1 westof
53
Page 58

Mapping Toolbox™ Release Notes
convertlat gcxsc neworig scircle2 zero22pi
crossfix gradientm newpole scxsc
daspectm grn2eqa npi2pi setm
departure hista org2pol smoothlong
These functions now issue warnings when provided 'dm' or 'dms' for their
units argument.
Time Conversion Functions to be Re m oved
The following functions to convert between time units and encodings will be
removed from a future release of the toolbox:
•
hms2hr
• hms2hm
• hms2mat
54
• hms2sec
• hr2hm
• hr2hms
• hr2sec
• mat2hms
• sec2hm
• sec2hms
• sec2hr
• time2str
• timedim
Compatibility Considerations
These functions remain available, but when they are invoked now issue
warnings that they are obsolete.
Page 59

Version 2.4 (R2006b) Mapping Toolbox™ Software
Version 2.4 (R2006b) Mapping Toolbox Software
This table summarizes what’s new in Version 2.4 (R2006b):
New
Features
and
Changes
Yes
Details b elo w
New features and changes introduced in this version are
• “Standard Formulations of Five Major Map Projections” on page 55
• “Two New Geodetic/Geocentric Latitude Conversion Functions” on page 56
• “Accelerated Performance for geoshow, mapshow, and bufferm” on page 56
• “Changes in Behavior of mapshow and geoshow” on page 56
• “dted Automatically Fixes Incorrectly Specified Longitude Directions in
DTED Data” on page 60
Version
Compatibility
Considerations
Yes — Details
in “Changes
in Behavi or
of mapshow
and geoshow”
on page 56
below. See also
Summary.
Fixed Bugs
and Known
Problems
Bug reports at
Web site
Related
Documentation
at Web Site
Printable Release
Notes: PDF
Current product
documentation
Standard Formulations of Five Major Map Projections
New formulations of five conic map projections are provided. The existing
implementations remain available under their old names. The new versions
use the same names as the ones they supplement, appended with “std”:
• Cassini Transverse Cylindrical (
• Albers Equal-Area Conic (
• Equidistant Conic (
• Lambert Conformal Conic (
eqdconicstd)
cassinistd)
eqaconicstd)
lambertstd)
55
Page 60

Mapping Toolbox™ Release Notes
• Polyconic (polyconstd)
Computations used for the new versions differ from the old ones only when the
latitude origin (the first element of the origin vector)isnonzero.Inthiscase,
the old versions shift the origin off the equator through a solid body rotation
of the sphere (or, for an ellipsoidal earth model, a suitable auxiliary sphere).
This is technically correct, but differs from accepted industry standards
for these projections. The new versions use the standard formulations and
give results that are consistent with projection results from other software
packages, regardless of the latitude origin. The old versions are retained in
the toolbox, with no change in behavior, to ensure backward compatibility.
See the Projections Reference documentation for more information.
Two New Geodetic/Geocentric Latitude Conversion Functions
Two new functions provide a more direct route to functionality already
available via the
convertlat function:
56
•
geocentric2geodeticlat converts an array of geocentric latitude in
radianstogeodeticlatitudeinradianson a reference ellipsoid given a first
eccentricity
•
geodetic2geocentriclat converts an array of geodetic latitude in radians
to geocentric latitude in radians on a reference ellipsoid given a first
eccentricity.
Accelerated Performance for geoshow, mapshow, and bufferm
Functions geoshow, mapshow,andbufferm run substantially faster in many
cases, especially when vector display is being controlled via symbol specs in
mapshow and geoshow.
Changes in Behavior of mapshow and geoshow
In addition to operating faster, the mapshow and geoshow functions now
behave slightly differently regarding their defaults, handles returned,
warnings issued, and several other aspects:
Page 61

Version 2.4 (R2006b) Mapping Toolbox™ Software
Default Symbols and Colors
• Point marker type changes from 'X' to '+'
• Point marker color changes from 'black' to 'red'
• Line color changes from 'black' to 'blue'
• Polygon facecolor changes from 'black' to pale yellow
Polygon edgecolor remains
'black'
Contour DisplayType Behavior Changes
• The DisplayType option 'contour' now returns an hggroup handle. The
children of the hggroup are patches. In prior versions, an array of line
handles was returned.
• You can specify any contourgroup property as a parameter value pair. In
previous versions,
no other contour properties.
• Both
• In R2006b, when plotting contours on a regular axes (not a map axes),
mapshow and geoshow might return a different number of contour
levels by default than in previous versions, in which you could not specify
contour intervals; in R2006b, you can control contour intervals and levels
via the
geoshow projects the contour lines using a Plate Carree projection; in
previous versions it simpl y displayed longitudes as x and latitudes as y
without doing any trimming or longitude wrapping.
LevelStep or LevelList contourgroup properties, among others.
mapshow allowed you to set the LineStyle property, but
Graphic Objects and Return Values for Vector Inputs
• Vector coordinate array input (x-y or latitude-longitude pairs) with a
DisplayType of 'Line' or 'Point' now generates an ordinary line object
insteadofamapgraphicsline.
• For geostruct input, an hggroup object is constructed; its handle is returned
instead of an array of handles to map graphic objects:
- For polygon geostructs, map graphics polygon objects are still
constructed, but become children of the hggroup.
57
Page 62

Mapping Toolbox™ Release Notes
- For point, multipoint, and line geostructs, the children of the hggroup
In both cases each child of the hggroup, rather than each element in an
array of handles, corresponds to a distinct feature in the geostruct.
Handles Returned for G raphic Objects
• Geostruct inputs result in an hggroup handle containing either line objects
(for point, multipoint, and line inputs) or modified patch objects (for
polygon inputs) as their children.
• Coordinate arrays (x,y pairs) displayed as lines now result in ordinary
line objects.
• Geostructs containing lines result as ordinary line objects within hggroups.
New Warnings Issued
• mapshow and geoshow now warn when given a geostruct within which the
Geometry field differs from a specified 'Dis playType' parameter.
are ordinary line objects; map graphics objects are no longer constructed.
58
mapshow will warn if it is given a geostruct containing Lat and Lon fields
•
instead of
geoshow will warn if it is given a geostruct containing X and Y fields instead
•
of
Lat and Lon fields.
X and Y fields.
geoshow Supplies Default Projection
geoshow now p rojects vector and raster in puts using a default projection
(Plate Carree) if the parent axes is not a map axes. The axes itself is
unchanged (it is not modified to become a map axes), but the scale factor of
the projection is set such that latitudes and longitudes in degrees can be read
directly from the axes ticks and grid lines.
Duplicate Parameter/Value Pair Inputs Allowed
mapshow no longer errors or warns if giv en duplicate Parameter/Value pair
inputs; in such circumstances,
SymbolSpecs)
mapshow now u ses the last value (even with
Page 63

Version 2.4 (R2006b) Mapping Toolbox™ Software
geoshow Supports True Surface Display
geoshow now creates a true 3-D surface if given a 'surface' DisplayType
rather than setting the ZData values to 0.
Texturemap DisplayType Behavior Changes
The 'texturemap' DisplayType now uses the pixel edges to create XData and
YData grids rather than using the pixel centers, which correctly registers the
display to map coordinates. The
same dimensions as the
XData and YData arrays, which exceed the input
grid in size by one in both the x and y dimensions.
ZData contains an array of zeros having the
You should use
coded by color (i.e. 2-D displays); use
show data w ith relief (nonzero
'texturemap' displays when the a ttribute being displayed is
'surface' displays when you n eed to
ZData).
More General Support for Graphics Properties
All Handle Graphics®patch properties are now supported for polygon inputs.
All Handle Graphics line properties are now supported for point and line
inputs, except that
'linestyle' is ignored for point inputs.
Limitations on Referencing Matrices for Geoshow Removed
geoshow is now capable of accepting any referencing matrix. Previously
it could only accept those referencing matrices that were convertible to
referencing vectors.
mapshow and geoshow Ignore Empty Inputs Rather than Erroring
In previous versions, mapshow and geoshow would throw errors when provided
with empty (
these functions via scripts. The new behavior is also more consistent with
that of MATLAB plotting functions such as
[]) arrays. This behavior could be inconvenient when running
plot, surf, mesh,andcontour.
59
Page 64

Mapping Toolbox™ Release Notes
dted Automatically Fixes Incorrectly Specified
Longitude Directions in DTED Data
Some DTED level 0 files available via the Nation al Geospatial-Intelligence
Agency’s (NGA) web interface may have minor errors. Specifically, Level
0 data for cells just to the east of the prime meridian may have longitude
coordinate strings with ’W’ substituted for ’E’. The
and automatically corrects this data error.
dted function now detects
60
Page 65

Version 2.3 (R2006a) Mapping Toolbox™ Software
Version 2.3 (R2006a) Mapping Toolbox Software
This table summarizes what’s new in Version 2.3 (R2006a):
New Features
and Changes
Yes
Details below
New features and changes introduced in this version are
• “Full Support for 64-Bit Windows” on page 61
• “Third-Party Library and Code Upgrades” on page 61
• “Support for 32-Bit Floating-Point GeoTIFF Images” on page 62
• “Utility Functions for NaN-Separated Polygons and Lines” on page 63
• “Standardized Vector Topology in coast.mat” on page 63
• “Three New Demos” on page 63
Version
Compatibility
Considerations
Yes — Details
in “GeoTIFF
Compatibility
Considerations”
on page 62
below. S e e als o
Summary.
Fixed Bugs
and Known
Problems
Bug reports at
Web site
Related
Documentation
at Web Site
Printable
Release
Notes: PDF
Current product
documentation
Full Support for 64-Bit Windows
Version 2.3 adds support for the mex- and library-based functions
geotiffinfo, geotiffread, sdtsinfo,andsdtsdemread on this new
MATLAB platform via library upgrades (described below) and a custom port
of STDS++.
Third-Party Library and Code Upgrades
Third-party libraries and software packages have been upgraded to their
current versions to ens ure best performance and compatibility with external
geospatial data s ou rces and applications software:
61
Page 66

Mapping Toolbox™ Release Notes
• General Polygon Clipper (GPC) upgraded to Version 2.32
• PROJ.4 library upgraded to Version 4.4.9
• SDTS++ library u pgraded to Version 1.5.1
• GeoTIFF library upgraded to Version 1.2.2
Support for 32-Bit Floating-Point GeoTIFF Images
The MATLAB function imread can now import TIFF images containing 32-bit
floating-point data. As a result,
variety of GeoTIFF.
GeoTIFF Compatibility Considerations
The structure returned by geotiffinfo in V. 2.3 has changed. The following
table describes the differences between the current and previous versions:
Version 2.3 Previous Versions
geotiffread now reads the corresponding
The TiePoints structure contains
two substructures,
WorldPoints. ImagePoints contains
[1-by-N] arrays Row and Col;
WorldPoints contains [1-by-N]
ImagePoints and
arrays X and Y.
The CornerCoords structure
contains six
respectively,
Lon.
[1-by-4] row vectors,
X, Y, Col, Row, Lat,and
The Zone field contains [] if the
UTM zone is not applicable or was
missing from the metadata.
TiePoints structure contained
The
two [
3-by-1] arrays, ImageP oint s
and WorldPoints.
The
CornerCoords structure
contained six
vectors:
LON.
[4-by-1] column
PCSX, PCSY, X, Y, LAT,and
The Zone fie ld contained 32767 if the
UTM zone was not applicable or was
missing from the metadata.
62
Page 67

Version 2.3 (R2006a) Mapping Toolbox™ Software
Utility Functions for NaN-Separated Polygons and Lines
closePolygonParts
Closes all rings in a multipart polygon to ensure proper analysis and
rendering.
isShapeMultipart
Boolean-valued function that returns true if a polygon or line has multiple
parts.
removeExtraNanSeparators
Eliminates redundant NaN separators that might exist in polygons and lines.
Standardized Vector Topology in coast.mat
Polygons in the low-resolution coastline sample data file coast.mat now
follow the convention used by
polygons with “holes” (inner rings representing lakes, inland seas, and islands
within them). Outer contours now always run clockwise and inner contours
run counterclockwise. These edits, which reversed the order of vertices in
some rings, enable th e display functions to f ill outer rings properly while
leaving inner rings blank.
geoshow, mapshow,andmapview to display
Three New Demos
If you are view ing these release notes using the Help browser, clicking any of
thedemolinksbelowwillopenthedemoin a browser window. Click the links
at the top of that window to view o r run the code for the demo.
Converting Coastline Data (GSHHS) to Shapefile Format
Shows how to extract coastlines from the Global Self-consistent Hierarchical
High-resolution Shorelines (GSHHS) data set, manipulate the polygon
features, and save the result to a polygon shapefile.
63
Page 68

Mapping Toolbox™ Release Notes
Plotting a 3-D Dome as a Mesh Over a Globe
Illustrates how to construct a 3-D feature in a system of local vertical
coordinates, then transform and combine it with a globe display in
Earth-Centered, Earth-Fixed (ECEF ) coordinates.
Unprojecting a Digital Elevation Model (DEM)
Shows how to unproject a georeferenced terrain elevation grid from Universal
Transverse Mercator (UTM) into a regular latitude-longitude grid having
comparable spatial resolution.
64
Page 69

Version 2.2 (R14SP3) Mapping Toolbox™ Software
Version 2.2 (R14SP3) Mapping Toolbox Software
This table summarizes what’s new in Version 2.2 (R14SP3):
New Features
and Changes
Yes
Details below
New features and changes introduced in this version are
• “Geodetic-Geocentric Coordinate Conversion Functions” on page 65
• “Additional User Control Over Shapefile Content” on page 65
• “Shapefile Read/Write Efficiency E nhanced” on page 66
• “Improved Rendering of Polygons with Inner Rings” on page 66
• “Map Viewer Now Georeferences Images It Saves” on page 66
• “TIGER/Line File Support Upgraded” on page 67
Version
Compatibility
Considerations
Yes—Details in
“Compatibility
Considerations”
on page 66
below. S e e als o
Summary.
Fixed Bugs
and Known
Problems
Bug reports at
Web site
Related
Documentation
at Web Site
Current product
documentation
Geodetic-Geocentric Coordinate Conversion Functions
New three-dimensional coordinate conversion functions (geodetic2ecef,
ecef2geodetic, ecef2lv, lv2ecef) transform 3-D point locations between
geodetic (latitude, longitude, height), geocentric Cartesian (Earth Centered,
Earth Fixed), and local vertical Cartesian coordinate systems.
Additional User Control Over Shapefile Content
Function shapewrite now allows user control over field names, lengths, and
decimal precision w hen writing feature attributes to the DBF file, via a
“DBF specification.” The new function
specification from a geographic data structure (geostruct2) array. Users can
customize the output and pass it to
makedbfspec constructs a default DBF
shapewrite.
65
Page 70

Mapping Toolbox™ Release Notes
Shapefile Read/Write Efficiency Enhanced
Improved implementations of functions shaperead and s hapewrite process
data substantially faster (about four times faster for a 10-MB shapefile of
major roads in Massachusetts).
Improved Rendering of Polygons with Inner Rings
The M ap Viewer (function mapview) and functions mapshow and geoshow now
properly render polygons containing inner rings (e.g., lakes and inland seas
within a continent, islands within a pond). Features in underlying layers
“show through” inner rings because they are not obscured by the patch faces
used to render the polygons.
Compatibility Considerations
Polygon Vertex Ordering Is Now Significant for Properly Rendering
Filled Polygons. The map display functions
now require that coordinate vectors representing polygons have consistent
directionality, such that
geoshow, m apsh ow,andmapview
66
• Vertices defining outer rings (to be filled) be encoded in a clockwise
direction.
• Vertices defining inner rings (often termed “lakes” or “islands,” to be
rendered as transparent holes) be encoded in a counterclockwise direction.
If you have vector map data sets that violate these conditions, the map display
functions
them as filled polygons. To determine the directionality of polygon vertices,
use the logical function
NaN-delimitedpolygoninanarrayofvertices.Ifyoufindinnerringswhichare
clockwise or outer rings which are counterclockwise, use the utility functions
poly2ccw or poly2cw, respectively, to reverse the direction of those rings.
geoshow, mapshow,andmapv iew might not be capable of rendering
ispolycw, which returns a separate result for each
Map V iewer Now Georeferences Images It Saves
When the Map Viewer saves the visible or sele cted area as a raster map (an
image file), it n ow also writes a worldfile to georeference the image.
Page 71

Version 2.2 (R14SP3) Mapping Toolbox™ Software
TIGER/Line File
e
Function tgrlin
sets from the U.S
now supports the most recent (2003/2004) TIGER/Line data
. Bureau of the Census.
Support Upgraded
67
Page 72

Mapping Toolbox™ Release Notes
Version 2.1 (R14SP2) Mapping Toolbox Software
This table summarizes what’s new in Version 2.1 (R14SP2):
New Features
and Changes
Yes
Details below
New features and changes introduced in this version are
• “New Function Reads Both 5-Minute and 2-Minute ETOPO Data” on page
69
• “Function gshhs Now Returns a Version 2 Geostruct” on page 69
• “Geodata Can Now Be Exported in Shapefile Format” on page 69
• “Accessing Geodata Resources on the Internet” on page 69
• “Compatibility Considerations for Atlas Data and Associated Functions”
on page 70
• “Compatibility Considerations for worldmap and usamap” on page 71
• “Data Files Added in This Release” on page 79
Version
Compatibility
Considerations
Yes — Details
labeled as
Compatibility
Considerations
below. S e e als o
Summary.
Fixed Bugs
and Known
Problems
Bug reports at
Web site
Related
Documentation
at Web Site
Current product
documentation
68
• “Atlas Data MAT-Files Removed in This Release” on page 79
• “Functions Deleted in This Release” on page 81
• “Functions Made O bs ole te in This Release” on p age 81
Page 73

Version 2.1 (R14SP2) Mapping Toolbox™ Software
New Function Rea
ds Both 5-Minute and 2-Minute
ETOPO Data
The new function
2-minute (ETOP
etopo5 and fix
Function gshh
Function gsh
High-resolu
a Version 2 ge
Version 1 ge
vertex-ord
and
outer ring
countercl
within a co
of the dat
ering convention (supported by functions
shapewr
s (e.g., continent outlines) are given in clockwise order, while
ockwise ordering is used for inner rings (e.g., lakes and inland seas
ntinent). Note that function
a set, released on Sept. 27, 2004.
Geodata
The new f
shapefi
creatin
the Poi
string
to the d
unction
le. It exports a Version 2 geographic data structure array (geo struct2),
g
.shp, .shx,and.dbf files. Like shaperead, the function supports
nt, MultiPoint, PolyLine, and Polygon shape types. The contents of
-valued attribute fields and scalar numerical attribute fields are w r i tte n
Base (
etopo reads from either the 5-minute (ETOPO5) o r the
O2) global terrain data set. This function supersedes function
es several significant bugs.
s Now Returns a Version 2 Geostruct
hs
, which reads the Global Self-consistent Hierarchical
tion Shoreline data set, has been upgraded. It now returns
ographic data structure (geostruct2) array instead of a
ostruct. Polygons returned from
ite
, for ex ample). Under this convention the c oo rdinates of
gshhs nowfollowtheshapefile
polybool, shaperead,
gshhs does not yet support Version 1.3
Can Now Be Exported in Shapefile Format
shapewrite writes a geographic data structure to a
.dbf)file.
Acces
Link
of di
Math
htt
Thi
acr
Co
sing Geodata Resources on the Internet
s and URLs to documentation and data files for various Internet sources
gital map data are now collected in the following technical note on the
Works Web site:
p://www.mathworks.com/support/tech-notes/2100/2101.html
s technical note replaces many individual links formerly scattered
oss the User’s Guide, reference pages, and MATLAB function help.
llectingthisinformationonaWebpageratherthanonproduct
69
Page 74

Mapping Toolbox™ Release Notes
CDs or printed documentation should substantially mitigate recurrent
problems with stale links. Please report any stale links that you
might find in the technical note to MathWorks Technical Support
(
http://www.mathworks.com/contact_TS.html), so that it can be updated
promptly.
Compatibility Considerations for Atlas Data and
Associated Functions
Through Version 2.0.3, the toolbox include d a set of atlas data with global
geopolitical data embedded as MATLAB arrays in four MAT-files:
worldhi, worldmtx,andworldmtxmed. How ever, g eopolitical data is difficult
to keep current, and is subject to inaccuracies and interpretations that can
cause contention. Therefore, starting with Version 2.1, Mapping Toolbox demo
data now excludes geopolitical data that would specify national sovereignty
over specific regions of the Earth. The only exceptions are the boundaries of
the 50 U.S. states and the District of Columbia.
worldlo,
This change means that the
worldlo, worldhi, worldmtx,andworldmtxmed
MAT-files are no longer part of the toolbox. However, the nonpolitical data
on global coas tlines, major lak es and inland seas, major rivers, and major
cities and populated places that was in
worldlo.mat has been retained
in the toolbox and transformed into shapefile format. This includes the
addition of name attributes for many previously unnamed features. There
are four new shapefiles in this category:
worldrivers.shp,andworldc itie s.shp.
landareas.shp, worldlakes.shp,
For consistency, the atlas data for the United States that was originally
stored in the
usalo and usahi MAT-files has also been transformed, although
none has been removed. Thes e data sets now reside in the following
shapefiles and MAT-files:
and
greatlakes.mat.
usastatelo.shp, usastatehi.shp, conus.mat,
The toolbox originally included four functions dedicated to extracting data
from the atlas data MAT-files:
worldlo, world hi, usalo,andusahi.Withthe
data removal/transformation described above, these functions are no longer
needed and h av e been removed from the toolbox in Version 2.1. You can
easily access the new shapefiles using the
shaperead function, which includes
powerful and flexible options for selecting features and even controlling which
attributes are read. In addition, function
country2mtx, whose sole purpose
70
Page 75

Version 2.1 (R14SP2) Mapping Toolbox™ Software
was to rasterize the country boundary polygons in worldlo.mat, has been
removed.
Related changes extend to the
worldmap function, which formerly combined
two purposes:
• Select an appropriate map projection and parameters with which to display
a given latitude-longitude area.
• Automatically display atlas data for that area.
In Version 2.1,
worldmap constructs a map axes object and can easily be followed with a
worldmap supports only the first of these actions. A call to
variety of Mapping Toolbox commands todisplaythemapdataofyourchoice.
Because the
usamap function is so similar to worldmap, corresponding changes
have been made there as well.
To help those who have relied heavily on
worldmap and usamap to plot base
maps w ith automatically selected vector map data, examples thro u ghout the
User’s Guide, reference pages, and MATLAB function help entries have been
updated to illustrate the new behavior of
worldmap and usamap,andtoshow
how to create maps including vector shapefile data layers. These examples
cover a wide variety of ways to read and subset data with
display data with
A good p lace to start is with the examples for the
geoshow and other Mapping Toolbox display functions.
worldmap and usamap
shaperead and
functions. Also see example code in “Changes to worldmap and usamap
Display Types” on page 72.
To help you update commands, scripts, and data for constructing and
maintaining base maps, a recently published technical note on the MathWorks
Web site provides links to data and documentation for many sources of vector
and raster digital map data that you can access over the Internet:
http://www.mathworks.com/support/tech-notes/2100/2101.html
Compatibility Considerations for worldmap and usamap
worldmap and usamap have been simplified to construct appropriate map axes
for a given area without displaying any map data.
71
Page 76

Mapping Toolbox™ Release Notes
In all cases, map frames, latitude-longitude grid lines, meridian labels, and
parallel labels are turned on. You can use the following command sequence
to remove them:
framem off; gridm off; m labe l off; plabel off
Other changes include the following:
•
usamap now accepts two-letter U.S. Postal S ervice abbreviations for state
names (e.g., AL, AK, AR, etc.).
• The following input opti o n s are n ow obsolete (if used, a warning is issued):
- A first argument equal to 'lo' or 'hi'
- The regiononly and stateonly syntax: a state or country name with
- All type options: 'none', 'line', 'lineonly', 'patch', 'patchonly',
the string
'mesh', 'meshonly', 'dem', 'demonly', 'dem3d', 'dem3donly',
'lmesh3d', 'lmesh3donly', 'ldem3d',and'ldem3donly' (the new
behavior matches the
'only' appended
'none' option)
72
Changes to worldmap and usamap Display Types
As of this release, the worldmap and usam ap functions no longer supports
the
type input argument. This argument provided an easy way to control
display behavior.
The
type option in worldmap was a single argument that could be one of
the following strings:
'mesh', 'meshonly', 'dem', 'demonly', 'dem3d', 'dem3donly ', 'lmesh3d',
'lmesh3donly', 'ldem3d',and'ldem3donly'.Inusamap, type was a subset
of the above names (the 3-D options were not supported).
In the current release, the various
following a call to
Toolbox commands. The following table specifies how you can achieve the
effects of the old
'none', 'line', 'lineonly', 'patch', 'patchonly',
type display options can be simulated by
worldmap or usamap with an appropriate set of Ma p ping
worldmap type argument using such auxiliary meth od s:
Page 77
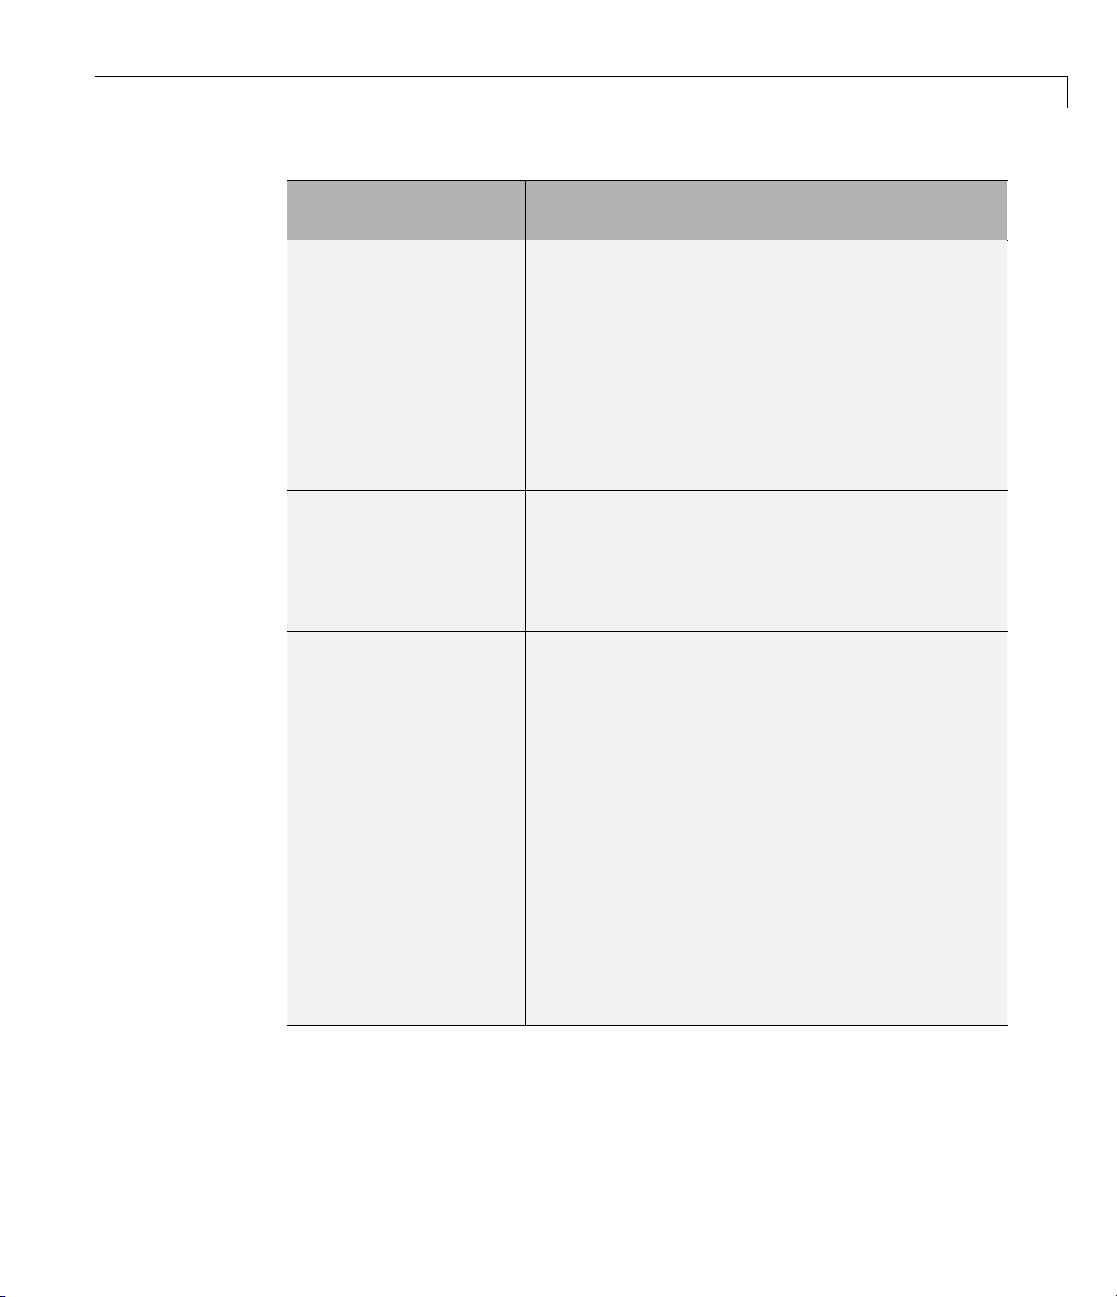
Version 2.1 (R14SP2) Mapping Toolbox™ Software
Mapping 1.x to
2.0.x Usage Mapping 2.1 Usage
load topo
load topo
worldmap(topo, ...
topolegend, 'dem')
load topo
worlmdap(topo, ...
topolegend,
'demonly')
load topo
worldmap(topo, ...
topolegend,
'dem3d')
worldmap(topo, topolegend)
meshm(topo, topolegend)
demcmap(topo)
land = shaperead('landareas.shp',...
'UseGeoCoords', true);
geoshow([land.Lat], [land.Lon])
load topo
worldmap(topo, topolegend)
meshm(topo, topolegend)
demcmap(topo)
load topo
worldmap(topo, topolegend)
meshm(topo, topolegend,size(topo),topo)
da = daspect;
pba = pbaspect;
da(3) = 7.5*pba(3)/da(3);
daspect(da);
demcmap(topo)
land = shaperead('landareas.shp',...
'UseGeoCoords', true);
geoshow([land.Lat], [land.Lon])
73
Page 78

Mapping Toolbox™ Release Notes
Mapping 1.x to
2.0.x Usage Mapping 2.1 Usage
load topo
load topo
worldmap(topo, ...
topolegend,
'dem3donly')
load korea
worldmap (map,
refvec,...
'mesh')
load korea
worldmap(map,
refvec,...
'meshonly')
load topo
worldmap(topo,...
worldmap(topo, topolegend)
meshm(topo, topolegend,size(topo),topo)
demcmap(topo)
load korea
worldmap(map, refvec)
meshm(map, refvec)
land = shaperead('landareas.shp',...
'UseGeoCoords', true);
geoshow([land.Lat], [land.Lon])
(Text North Korea and South Korea will be
missing)
load korea
worldmap(map, refvec)
meshm(map,refvec)
load topo
worldmap(topo, topolegend)
74
topolegend,
'mesh3d')
meshm(topo, topolegend,size(topo),topo)
da = daspect;
pba = pbaspect;
da(3) = 7.5*pba(3)/da(3);
daspect(da);
Page 79

Version 2.1 (R14SP2) Mapping Toolbox™ Software
Mapping 1.x to
2.0.x Usage Mapping 2.1 Usage
load topo
load topo
worldmap...
(topo,topolegend,...
'mesh3donly')
load topo
worldmap(topo,...
topolegend,
'ldem3d')
load topo
worldmap(topo, ...
worldmap(topo, topolegend)
meshm(topo, topolegend,size(topo),top
load topo
worldmap(topo, topolegend)
meshm(topo, topolegend,size(topo),topo)
da = daspect;
pba = pbaspect;
da(3) = 7.5*pba(3)/da(3);
daspect(da);
demcmap(topo)
camlight(90,5);
camlight(0,5);
lighting phong
material([0.25 0.8 0])
load topo
worldmap(topo, topolegend)
topolegend,'ldem3donly')
meshm(topo, topolegend,size(topo),topo)
da = daspect;
pba = pbaspect;
da(3) = 7.5*pba(3)/da(3);
daspect(da);
demcmap(topo)
75
Page 80

Mapping Toolbox™ Release Notes
Mapping 1.x to
2.0.x Usage Mapping 2.1 Usage
load topo
load topo
worldmap(topo,...
topolegend,
'lmesh3d'
load topo
worldmap(topo,...
topolegend,...
'lmesh3donly')
worldmap(topo, topolegend)
meshm(topo, topolegend,size(topo),topo)
da = daspect;
pba = pbaspect;
da(3) = 2*pba(3)/da(3);
daspect(da);
camlight(90,5);
camlight(0,5);
lighting phong
material([0.25 0.8 0])
load topo
worldmap(topo, topolegend)
meshm(topo, topolegend,size(topo),topo)
da = daspect;
pba = pbaspect;
da(3) = 2*pba(3)/da(3);
daspect(da);
76
Page 81

Version 2.1 (R14SP2) Mapping Toolbox™ Software
Mapping 1.x to
2.0.x Usage Mapping 2.1 Usage
load korea
load korea
worldmap(map,
refvec,...
load korea
worldmap(map,
refvec,...
'lineonly')
load korea
'line')
worldmap(map,
refvec,...
worldmap(map, refvec)
land =...
shaperead('landareas.shp',...
'UseGeoCoords', true);
geoshow([land.Lat], [land.Lon])
(Text North Korea and South Korea will be
missing. Land area boundaries resolution is
lower.)
load korea
worldmap(map, refvec)
land = ...
shaperead('landareas.shp',...
'UseGeoCoords', true);
geoshow([land.Lat], [land.Lon])
load korea
worldmap(map, refvec)
'none')
77
Page 82
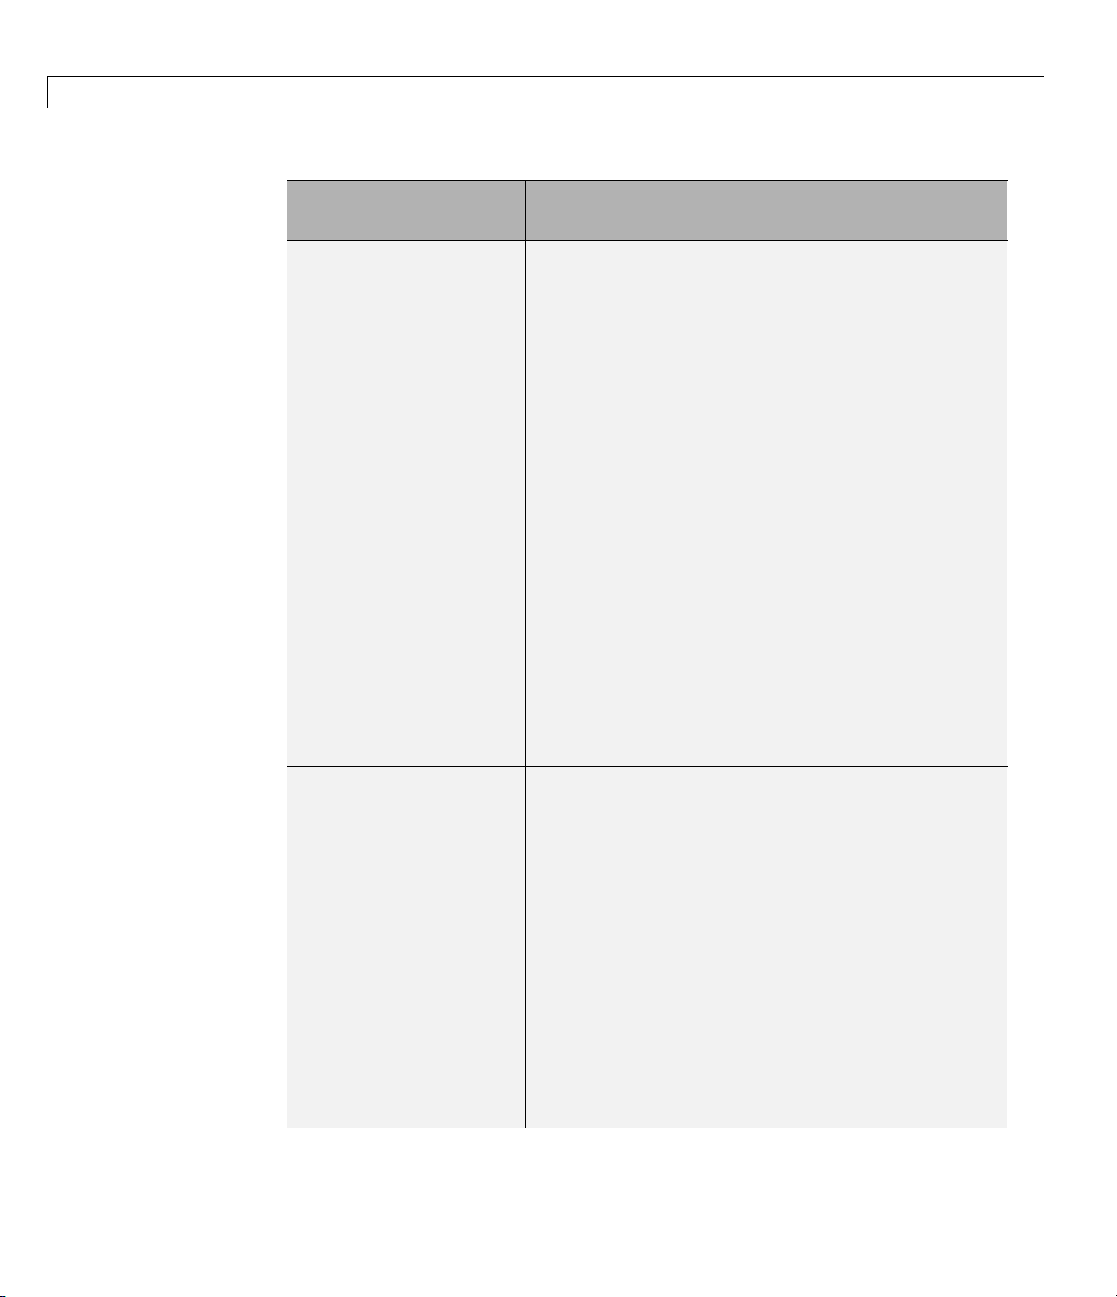
Mapping Toolbox™ Release Notes
Mapping 1.x to
2.0.x Usage Mapping 2.1 Usage
load korea
load korea
worldmap(map,
refvec,...
'patch')
load korea
worldmap(map,
refvec,...
'patchonly')
worldmap(map, refvec)
land = ...
shaperead('landareas.shp',...
'UseGeoCoords', true);
faceColors = ...
makesymbolspec('Polygon',...
{'INDEX', [1 numel(land)],...
'FaceColor', ...
polcmap(numel(land))});
geoshow(land,'SymbolSpec',...
makesymbolspec('Polygon',...
faceColors)
(Text North Korea and South Korea will be
missing. Country coloring will be missing.)
load korea
worldmap(map, refvec)
land = ...
shaperead('landareas.shp',...
78
'UseGeoCoords', true);
faceColors =...
{'INDEX', [1 numel(land)],...
'FaceColor', ...
polcmap(numel(land))});
geoshow(land,'SymbolSpec',...
Page 83

Version 2.1 (R14SP2) Mapping Toolbox™ Software
Mapping 1.x to
2.0.x Usage Mapping 2.1 Usage
faceColors)
(Country coloring will be missing.)
DataFilesAddedinThisRelease
Thefollowingfileswereaddedtothemapdemos directory, for use in toolbox
demos and examples:
•
landareas — Polygon shapefile: global coastlines, both exterior and
interior, including names for larger land masses
•
worldlakes — Polygon shapefile: coastlines and names of major lakes
and inland seas worldwide
•
worldrivers — PolyLine shapefile: major world rivers and their names
worldcities — Point shapefile: locations and names of major cities and
•
populated places worldwide
•
usastatelo — Polygon shapefile: low-resolution outlines and names of
the 50 U .S. states plus D.C.
•
usastatehi — Polygon shapefile: moderate-resolution outlines and names
of the 50 U.S. states plus D .C.
•
conus — MAT -f il e: Low-resolution latitudes and longit ud es, in degrees,
for the perimeter of the conterminous United States (CONUS), the Great
Lakes, and interstate borders
•
greatlakes — MAT-file: A Version 1 geographic data structure
(geostruct1) with outlines and names for the Great Lakes of North America
Atlas Data MAT-Files Removed in T his Release
MAT-files containing Atlas Data have been removed in Version 2.1. Some of
the data has been retained in a different form. The disposition of these data
sets and variables is described below.
79
Page 84

Mapping Toolbox™ Release Notes
World MAT-File Data
• worldlo.mat, which contained the following variables:
- DNline — Data moved to worldrivers.shp
- DNpatch —Datamovedtoworldlakes.shp
- POline — Data removed from toolbox
- POtext — Data removed from toolbox
- PPpoint — Data moved to worldcities.shp
- PPtext — Data moved to worldcities.shp
- gazette — Data removed from toolbox
worldhi.mat — D ata removed from toolbox
•
worldmtx.mat — D ata removed from toolbox
•
worldmtxmed.mat — D ata removed from too lbox
•
80
United States MAT-File Data
• usalo.mat, which contained the following variables (all retained):
- conus —Datamovedtoconus.mat
- greatlakes — Data moved to great lakes.mat
- gtlakelat —Datamovedtoconus. mat
- gtlakelon —Datamovedtoconus. mat
- state — Data moved to usastatelo.shp
- stateborder — Data moved to conus.mat
- statelat — Data moved to conus.mat
- statelon — Data moved to conus.mat
- uslat —Datamovedtoconus.mat
- uslon —Datamovedtoconus.mat
• usahi.mat — Data moved to usastat ehi.shp
Page 85

Version 2.1 (R14SP2) Mapping Toolbox™ Software
Functions Delet
The following fu
sets, have been r
•
country2mtx —C
data
usahi —Return
•
•
usalo —Retur
•
worldhi —Ret
•
worldlo —Re
Functions M
• etopo5 —Re
•
tigerp —Do
format an
•
tigermif
format a
nctions, which performed specific operations on Atlas Data
emoved in Version 2.1:
high-resolution vector atlas data for the United States
n vector atlas data for the United States
urn high-re solution vector atlas data for the world
turn v ector atlas data for the world or oceans
ade Obsolete in This Release
placed by
wnload U.S. Census cartographic boundary files in shapefile
duse
shaperead instead.
— Download U.S. Census cartographic boundary files in shapefile
nd use
shaperead instead.
ed in This Release
reate a raster map grid of a country from
etopo.Useetopo instead.
worldlo atlas
81
Page 86

Mapping Toolbox™ Release Notes
Version 2.0.3 (R14SP1) Mapping Toolbox Software
This table summarizes what’s new in Version 2.0.3 (R14SP1):
New Features
and Changes
Yes Details
below
The new features and changes introduced in this version are
Version
Compatibility
Considerations
Yes Details in
“Compatibility
Considerations”
on page 83
below. S e e als o
Summary.
Fixed Bugs
and Known
Problems
Fixed bugs
Related
Documentation
at Web Site
Current product
documentation
Polygon Vertex Ordering Functions
Four new functions have been added to Mapping 2.0.3. These are called by or
can be used in conjunction with the
Has New Helper Functions” on page 83.) Three of the functions check or
change the ordering of vertices that define a polygon, and the fourth one splits
polygons with holes in a consistent fashion.
These functions are
•
ispolycw — True if vertices of polygonal contour are clockwise ord ere d
polybool function (see “polybool Revised,
82
poly2cw — Convert polygonal contour to clockwise ordering
•
poly2ccw — Convert polygonal contour to counterclockwise ordering
•
poly2fv —Convertpolygonalregiontoface-vertex form for use with patch
•
in order to properly render polygons containing holes
Page 87

Version 2.0.3 (R14SP1) Mapping Toolbox™ Software
Compatibility C
onsiderations
axesm Does Not Reorder Longitude Limits
Function axes m
[west east],b
The form
now requires that 'MapLonLimit' values have the form
ut east can be less than west numerically (e.g.,
[east
west]
is no longer supported.
contourm Returns C ontourgroup Handle
Function con
an array of ha
tourm
now returns a handle to a contourgroup object instead of
ndlestolineobjects.
elevation Has New Azimuth Output
Function e
correspon
This elimi
with func
levation
ding to the elevation angle (output 1) and slant range (output 2).
nates the need to use a geodesic or rhumb line azimuth, computed
tions
can now return a third output,theline-of-sightazimuth
azimuth or distance, as an approximate substitute.
gtopo30 Has New Options
The func
• Data can
tionality of
be read from a more general directory structure.
gtopo30 has been extended so that:
[120 -60]).
• Empty m
• Latitu
Instea
NaNs.
ay be supplied in place of any input argument.
de and longitude limits are no longer restricted to lie within a tile.
d, areas not covered by available data are automatically filled with
inputm Has New Button Output
tm
inpu
func
now has an optional third output argument, 'button',which
tions like the third output of
ginput.
polybool Revised, Has New Helper Functions
ping 2.0.3 fixes major problems with the
Map
putes set operations on polygonal regions. The fixes include incompatible
com
ta structure and syntax changes.
da
polybool function, which
83
Page 88

Mapping Toolbox™ Release Notes
• The 'cutvector' option has been removed from the syntax. This option
facilitated plotting of polygonal regions containing holes, but the cutvector
computation was not robust, nor was it an effective way to represent
polygonal regions containing multiply nested holes and/or discontiguous
regions. To replace the cutvector functionality, a new function,
has been added.
holes and discontiguous regions, into a faces and a vertices matrix that
can be used with the patch function to display the region. The MATLAB
function help for
how to use
poly2fv,
poly2fv converts a polygonal region, possibly including
polybool and poly2fv contain examples illustrating
poly2fv.
• The
'cell' and 'vector' options have been removed from the syntax.
polybool now returns the output polygonal region using the same format
as the input polygonal region. Use
polysplit and polyjoin to convert
from one format to the other.
•
polybool now uses the “clockwise” rule to distinguish between external
polygonal contours and internal polygonal contours. This is the same rule
used by ESRI shapefiles.
polybool assumes that a polygonal contour
whose vertices are arranged in clockwise order is an external contour, and
that a polygonal contour whose vertices are arranged in counterclockwise
order is an internal contour. Use
polygonal contour is clockwise ordered, and use
ispolycw to determine whether a
poly2cw and poly2ccw to
convert polygonal contours to be clockwise or counterclockwise ordered,
respectively. If a polygonal region input has no external contours according
to this rule,
An input polygonal region can either take the form of a pair of
polybool issues a warning message.
NaN-separated
vectors, or it can take the form of a pair of cell arrays. In the cell array format,
each cell must contain the vertices of a single polygonal contour. Representing
a polygonal region as a cell array whose cells can contain
NaN-separated
vectorsisnolongersupported,andan error message will be issued.
Summary of new polybool-related helper functions. You can use the
helper functions that support
polybool foryourownpurposes. Theyare
84
•
ispolycw — True if vertices of polygonal contour are clockwise ordered
poly2cw — Convert polygonal contour to clockwise ordering
•
poly2ccw — Convert polygonal contour to counterclockwise ordering
•
Page 89

Version 2.0.3 (R14SP1) Mapping Toolbox™ Software
• poly2fv —Convertpolygonalregiontoface-vertex form for use with patch
Summary of known problems addressed. The issues solved by the
new implementation of
•
polybool no longer errors out or produces incorrect results for proper
polybool are
inputs.
•
polybool now produces consistent output when computing intersections,
with results no longer depending on the order of its inputs.
•
polybool now operates correctly on polygons with collinear edges.
polymerge Output Vertex Order Changes
Improvements in the algorithm that polymerge uses to chain together
adjacent polygon or line segments, required to address a bug and improve
efficiency, in some cas es also chang e the ordering of the output vertices.
85
Page 90

Mapping Toolbox™ Release Notes
Version 2.0.2 (R14) Mapping Toolbox Software
This table summarizes what’s new in Version 2.0.2 (R14):
New Features
and Changes
Yes
Details below
New features and changes introduced in this version are
Version
Compatibility
Considerations
No
Fixed Bugs
and Known
Problems
No bug fixes Current product
Related
Documentation
at Web Site
documentation
Mapping Toolbox Compilability Enhanced
Almost all Mapping Toolbox command line functions can be compiled using
the new MATLAB Compiler. However, large Atlas Data MAT-files need to be
added explicitly to use them in applications.
SDTS Functions Now Available on HP-UX
The input functions sdtsinfo and sdtsdemread are now available on the
HP-UX platform.
86
Page 91

Version 2.0.1 (R13SP1+) Mapping Toolbox™ Software
Version 2.0.1 (R13SP1+) Mapping Toolbox Software
This table summarizes what’s new in Version 2.0.1 (R13SP1+):
New Features
and Changes
Yes
Details below
Thenewfeatureintroducedinthisversionis
Version
Compatibility
Considerations
No
Fixed Bugs
and Known
Problems
Fixed bugs,
below
Related
Documentation
at Web Site
V2.0.1 product
documentation
mapexreg Demo (Georeferencing an Image to an
Orthotile Base Layer) Generalized and Clarified
Calls to imtransform and makerefmat arenolongerhard-codedforanoutput
pixel size of one meter. The choice of output pixel size now is explained
in detail.
Fixed Bugs
Version 2.0.1 contains the following bug fixes:
almanac
Function almanac now gives a precise inverse flattening (1/f) value for Bessel
1841 ellipsoid. Previously,
of the full precision value (299.1528128).
almanac used a truncated value (299.1528) instead
axesm
Function axesm now accepts the 'meridianlabel' parameter. Previously,
axesm would throw an error if the 'meridianlabel' parameter was specified.
distance
Function distance now computes correct results for rhumb line distances
along a parallel (including the e quator) on a (nonspherical) ellipsoid.
87
Page 92

Mapping Toolbox™ Release Notes
distance
Function distance now uses the robust “aversine formula” to compute great
circle distances on a sphere. For certain inputs roundoff sensitivities in the
previous implementation resulted in a small, but nonzero, distance between
identical points.
distance
Function distance now correctly obtains correct results for rhumb lines that
follow the e quator, or any other parallel, and cross the 180-degree meridian; it
gives the distance along the short arc of the parallel. Previously the length of
the long arc could be returned instead.
distance, azimuth
Functions distance and azimuth now produce accurate results even for long
geodesics on an ellipsoid, up to near-antipodal distances.
projfwd, projinv
Functions projfwd and projinv now use NaN separators on all platforms.
Previously, under certain circumstances,
coordinate arrays with
projfwd and projinv returned
Inf separators rather than NaNs.
88
reckon
Function reckon now supports geodesics on an ellipsoid, in addition to rhumb
linesonanellipsoidandbothgeodesicsandrhumblinesonasphere.
Page 93

Version 2.0 (R13SP1+) Mapping Toolbox™ Software
Version 2.0 (R13SP1+) Mapping Toolbox Software
This table summarizes what’s new in Version 2.0 (R13SP1+):
New Features
and Changes
Yes
Details below
New features and changes introduced in this version are
• “Release Summary” on page 90
• “New Demos and Sample Data” on page 90
• “New Map Viewer” on page 92
• “Spatially Referenced Image Formats” on page 93
• “Working with Images Referenced to Map Coordinates” on page 94
• “SDTS Terrain Data Access” on page 95
• “Shapefiles and Vector Features” on page 96
• “Geographic Data Structure Enhancements” on page 96
Version
Compatibility
Considerations
Yes—Detailsin
“Compatibility
Considerations”
on page 101
below. S e e als o
Summary.
Fixed Bugs
and Known
Problems
“Fixed Bugs” on
page 103, below
Related
Documentation
at Web Site
V2.0.1 product
documentation
• “Attribute-Driven Vector D ata Symbolization” on page 97
• “Access to PROJ.4 Map Projections” on page 97
• “Minor Enhancements” on page 98
• “Summary of Functions Added in Version 2.0” on page 99
• “Compatibility Considerations” on page 101
• “Fixed Bugs” on page 103
89
Page 94

Mapping Toolbox™ Release Notes
Release Summary
Mapping Toolbox
graphical user i
data analysis i
toolbox, new fu
Version 2.0 provides a compre hensiv e set of functions and
nterfaces for building map displays and performing geospatial
n the MATLAB environment. In this major release of the
nctions a nd capabilities include:
• Support for st
- ESRI shapefil
only)
- “Worldfiles
• New display
grids in x-y
• New functi
• Transvers
• Anewinte
- Support f
- Data imp
- Zooming
- Cursor c
- Data ti
- Graphi
- Map ex
• Amajo
conce
and e
rial to mak e the documentation easier to access
mate
map coordinates (as well as unprojected latitude-longitude)
ons for vector symbolization based on feature attributes
e Mercator projection a nd PROJ.4 projection library support
ractive M ap Viewer with the following features:
or multiple raster and vector layers
ort from file or workspace
/panning/map navigation tools
oordinateandmap-scalereadout
pandinfotools
cal overlays
porting/printing
r update of the Mapping Toolbox User’s Guide, focused on clarifying
pts and terminology, explaining features and functions, adding new
nhancing existing examples, and organizing and cross-referencing
andard GIS and geospatial file fo rm ats:
e; GeoTIFF; Arc ASCII Grid; SDTS Raster Profile (read
” f or spatially registered images (read and write)
functions for vector features, georeferenced imagery, and data
90
New
Six
the
Demos and Sample Data
new Mapping Toolbox demos are now, available from the Demos tab of
Help Brow ser. You can also access this demos page by typing
mapdemos
Page 95

Version 2.0 (R13SP1+) Mapping Toolbox™ Software
The demos consist of the following:
• mapexenhance — Enhancing Multispectral GeoTIFF Images
• mapexfindcity — Interactive Global City Finder
• mapexgeo — Creating Maps using
• mapexmap — Creating Maps using
geoshow (for latitude, longitude data)
mapshow (for x, y data)
• mapexrefmat — Creating and Using Referencing Matrices
• mapexreg — Georeferencing an Image to an Or th o tile Base Layer
• viewmaps — GUI Demonstrating Map Projections (not new in 2.0)
Note that the above commands run the demo scripts to produce figures,
whereas
mapdemos describes and illustrates the demos in the Help Browser.
In addition, a number of new sample data sets containing vector features,
digital elevation models, and georeferenced images have been added for
use in demos and examples. The new data includes satellite images o f the
Boston area, topographic grids of the White Mountains in New Hampshire,
and vecto r data for roads and hydrographic features in the Boston area. The
data sets are provided in standard geospatial and GIS formats: GeoTIFF,
TIFF images with worldfiles, SDTS Raster Profile, Arc ASCII Grid, and ESRI
shapefiles. They are accompanied by ASCII text files (with suffix
.txt),
containing descriptive metadata.
The new data files are in addition to existing sample data sets stored
in MAT-files, such as
geoid, russia,andkorea. In addition, metadata
indicating the source and describing the contents of most sample data and
atlas data has been added to their respective MAT-files.
To read the metadata for a Mapping Toolbox MAT-file data set,
inspect the
source and description workspace v aria bles.
load it and
To read brief descriptions of the demos and sample data sets, type
help mapdemos
91
Page 96

Mapping Toolbox™ Release Notes
New Map Viewer
The toolbox includes a new interactive tool for displaying and examining map
data, called the Map Viewer. The Map Viewer helps you work with data
that is already in a projected map coordinate system, which is the case for
many high-resolution satellite and aerial imagery products, as well as many
vector map data sets that cover small areas of the Earth in substantial detail.
The Map Viewer gives you a view (or views) of an x-y map coordinate plane
where, for example, x and y may correspond to the easting and northing
coordinates of a given UTM or State Plane zone. If some of your d ata is
referenced to geographic (latitude-longitude) coordinates, you first need to use
an appropriate projection to transform it to map coordinates.
Key features of the Map Viewer include:
• A two-dimensional view of the x-y map plane with interactive tools for
navigating in that plane: magnification, de-magnification, panning, setting
the map scale, and zooming the view to the extent of a giv en data set, or
all data sets
• Vector and image data import from files or from the MATLAB workspace
92
• Management of each data set in a separate layer. You can control layer
ordering and visibility to bring what you need into view.
• Multiple, simultaneous views (differing in scale or view extent) of the same
data layers
• A data tip tool to identify vector shapes or query a feature attribute that
you specify
• An info tool to display, in a separate window, all the attributes of a selected
feature
• Tools to annotate the map with lines, arrows, and text
• Ability to expo rt a raster snapshot of the map view
To start the Map Viewer, use the
mapview
will open a Map Viewer window. You can then import standard format files
or load workspace data into the Map Viewer. The following figure shows the
mapview function. Typing
Page 97

Version 2.0 (R13SP1+) Mapping Toolbox™ Software
Map Viewer’s main window after loading image, line, and point data sets, also
illustrating user-specified symbology for streets and landmarks, and Data
Tip labels for selected point features:
You can print maps as they appear in the Map Viewer w indow, to either a
printerorafile.EitherclickthePrint button on the left end of the toolbar or
select Print in the File menu. A standard figure print dialog appears. You
should consider selecting a driver appropriate to your printer; this may be
necessary if you attempt to print in color.
Spatially Referenced Image Formats
The toolbox adds support for several industry-standard formats for spatially
referenced images and data grids: Arc ASCII G rid files, GeoTIFF files, and
worldfiles. You do this by using the following new functions:
arcgridread,
93
Page 98

Mapping Toolbox™ Release Notes
geotiffinfo, geotiffead, ge tworldfilename, worldfileread,and
worldfilewrite.
The grid and image file-reading functions construct referencing matrices,
enabling a general and consistent approach to managing the relationship
between map coordinates and pixel columns and rows (see below).
Working with Images Referenced to Map Coordinates
The toolbox includes a family of function s supporting images and gridded data
sets that are referenced to two-dimensional projected map coordinates. These
functions represent the relationship between a point at position (
an image and point in map coordinates (x,y) with a referencing matrix.A
referencing matrix is a 3-by-2 matrix,
transformation such that
[x y] = [row col 1] * R
Most often the image (or data grid) consistsofsquarepixelsandhasedgesthat
align with the map coordinate axes, but you are not limited to this situation.
row,col)in
R, that represents a general affine
94
The new function
makerefmat provides several options for constructing
referencing matrices from scratch. See its MATLAB function help for further
information. However, you can most often obtain a referencing matrix from a
world file, via
worldfileread, or from a GeoTIFF file via geoti ffre ad.If
you have created a new referencing matrix for an image in a generic image
format such as TIFF or JPEG, you can save this information in a world file
using
worldfilewrite.
New functions
defined above, along with its inverse. With functions
pix2map and map2pix implement the basic transformation
mapbbox and mapoutline
you can calculate the image bounds or perimeter in map coordinates. You
can u se the function
pixcenters to calculate the coordinates of the center of
each image pixel. This is helpful if you have a data grid that you want to
display using
The new function
surface.
mapshow accepts a referencing matrix in order to correctly
position an image in a standard Handle Graphics axes (i.e., not a map axes).
Page 99

Version 2.0 (R13SP1+) Mapping Toolbox™ Software
Because the affine transformation is extremely general, it can equally well
represent the registration of an imagetogeographiccoordinates,with
longitude taking the place of map
[lon lat] = [row col 1] * R
x and latitude replacing map y:
A referencing matrix is a more general version of the 1-by-3 map legend
vector, perhaps better characterized as a referencing vector, that many toolbox
functions already use. To convert a referencing vector to a referencing
matrix, you can use function
refvec2mat. The inverse transformation exists
only for referencing matrices having a special form, but if it does you can
compute it with
refmat2vec. Functions latlon2pix and pix2latlon support
transformations for referencing m atrices in geographic coordinates, allowing
for longitude-wrapping differences.
Use the new function
geoshow along with map axes to display data grids
referenced to latitude and longitude via either a referencing vector or a
referencing m atrix. Or, you can use the new function
grid2image to quickly
display an unprojected grid with latitude as the ordinate (x-axis) and
longitude as the abscissa (y-coordinate).
SDTS Terrain Data Access
Mapping Toolbox functions can now import terrain grids stored in United
States Spatial Data Transfer Standard (SDTS) raster profile format, giving you
access to a wide selection of public domain terrain data sets, principally those
prepared by the U.S. Geo logical Survey (USGS). USGS DEM data is no longer
distributed from government Internet sites. Instead, these and other USGS
files are now available from a commercial server at no charge. For further
information, see
and http://edc.usgs.gov/geodata/.
Two new toolbox functions support SDTS data handling:
•
sdtsinfo returns a structure containing metadata for an SDTS data set.
sdtsdemread returns elevation data and a referencing matrix from an
•
SDTS DEM data set.
For details, type
prompt.
http://edc.usgs.gov/products/elevation/dem.html
help sdtsinfo or help sdtsdemread at the MATLAB
95
Page 100

Mapping Toolbox™ Release Notes
Shapefiles and Vector Features
The toolbox now reads the shapefile format defined by Environmental
Systems Research Institute (ESRI) and widely used as a data exchange format
for nontopological GIS data. You can query a shapefile for its shapetype,
attribute names and types, number of records, etc., using
read 2-D shapes usin g
geostruct2 geographic data structure array (see “Geographic Data Structure
Enhancements” on page 96 ), tailored to the contents read in from shapefiles.
The s hape data is represented in the MATLAB workspace as a 1-D structure
array, with one e lem ent per feature. Attribute values are stored in structure
fields,orinaseparate,parallelstructure array. Because attributes are
defined according to the needs of the shapefile author and might be unknown
until the time a given shapefile is read, the new Mapping Toolbox geographic
data structures (des cribed below) are necessarily more general than the
existing toolbox geographic data structures.
Geographic Data Structure Enhancements
Certain Mapping Toolbox functions introduced in Version 2 use an enhanced
geographic data structure layout (called a geostruct2) to store and manipulate
vector geodata. This layout has the flexibility to store any kind and number of
attributes, and handles either geographic (latitude and longitude) or plane
(x and y ) coordinates. In contrast, a V ersion 1 geographic data structure
(geostruct1) — which is still supported — is limited to a fixed set of fields and
can contain geographic coordinates only.
shapeinfo,and
shaperead.Theshaperead function constructs a
96
One way to create a Version 2 geographic data structure is to input vector
geodata to the workspace from a shapefile. The function
shaperead returns
a geostruct2 that encapsulates s ome or all of the data stored in a shapefile
and its supporting index and dBASE files. To determine what kinds of data a
shapefiles contains, you can use the
The new functions
in geostruct2 form. Use
the geostruct, and use
mapshow, geoshow,andmapview each display vector data
geoshow when Lat and Lon coordinate fields exist in
mapshow or mapview when X and Y fields are present.
shapeinfo function to query it.
You can transform a geostruct1 into a geostruct2 (but not the reverse). Use
the function
updategeostruct for this purpose. See “Mapping Toolbox
 Loading...