

Page 1

Data Acquisition T
User’s Guide
oolbox™ 2
Page 2

How to Contact The MathWorks
www.mathworks.
comp.soft-sys.matlab Newsgroup
www.mathworks.com/contact_TS.html Technical Support
suggest@mathworks.com Product enhancement suggestions
bugs@mathwo
doc@mathworks.com Documentation error reports
service@mathworks.com Order status, license renewals, passcodes
info@mathwo
com
rks.com
rks.com
Web
Bug reports
Sales, prici
ng, and general information
508-647-7000 (Phone)
508-647-7001 (Fax)
The MathWorks, Inc.
3 Apple Hill Drive
Natick, MA 01760-2098
For contact information about worldwide offices, see the MathWorks Web site.
Data Acquisition Toolbox™ User’s Guide
© COPYRIGHT 2005–20 10 by The MathWorks, Inc.
The software described in this document is furnished under a license agreement. The software may be used
or copied only under the terms of the license agreement. No part of this manual may be photocopied or
reproduced in any form without prior written consent from The MathW orks, Inc.
FEDERAL ACQUISITION: This provision applies to all acquisitions of the Program and Documentation
by, for, or through the federal government of the United States. By accepting delivery of the Program
or Documentation, the government hereby agrees that this software or documentation qualifies as
commercial computer software or commercial computer software documentation as such terms are used
or defined in FAR 12.212, DFARS Part 227.72, and DFARS 252.227-7014. Accordingly, the terms and
conditions of this Agreement and only those rights specified in this Agreement, shall pertain to and govern
theuse,modification,reproduction,release,performance,display,anddisclosureoftheProgramand
Documentation by the federal government (or other entity acquiring for or through the federal government)
and shall supersede any conflicting contractual terms or conditions. If this License fails to meet the
government’s needs or is inconsistent in any respect with federal procurement law, the government agrees
to return the Program and Docu mentation, unused, to The MathWorks, Inc.
Trademarks
MATLAB and Simulink are registered trademarks of The MathWorks, Inc. See
www.mathworks.com/trademarks for a list of additional trademarks. Other product or brand
names may be trademarks or registered trademarks of their respective holders.
Patents
The MathWorks products are protected by one or more U.S. patents. Please see
www.mathworks.com/patents for more information.
Page 3

Revision History
May 1999 First printing New for Version 1
November 2000 Second printing Revised for Version 2 (Release 12)
June 2001 Third printing Revised for Version 2.1 (Release 12.1)
July 2002 Online only Revised for Version 2.2 (Release 13)
June 2004 Online only Revised for Version 2.5 (Release 14)
October 2004 Online only Revised for Version 2.5.1 (Release 14SP1)
March 2005 Online only Revised for Version 2.6 (Release 14SP2)
September 2005 Online only Revised for Version 2.7 (Release 14SP3)
October 2005 Reprint Version 2.1 (Notice updated)
November 2005 Online only Revised for Version 2.8 (Release 14SP3+)
March 2006 Fourth printing Revised for Version 2.8.1 (Release 2006a)
September 2006 Online only Revised for Version 2.9 (Release 2006b)
March 2007 Online only Revised for Version 2.10 (Release 2007a)
May 2007 Fifth printing Minor revision for Version 2.10
September 2007 Online only Revised for Version 2.11 (Release 2007b)
March 2008 Online only Revised for Version 2.12 (Release 2008a)
October 2008 Online only Revised for Version 2.13 (Release 2008b)
March 2009 Online only Revised for Version 2.14 (Release 2009a)
September 2009 Online only Revised for Version 2.15 (Release 2009b)
March 2010 Online only Revised for Version 2.16 (Release 2010a)
Page 4

Page 5

Introduction to Data Acquisition
1
Product Overview ................................. 1-2
Understanding Data Acquisition Toolbox Software
Exploring the Toolbox
Supported Hardware
.............................. 1-3
............................... 1-4
...... 1-2
Contents
Anatomy of a Data Acquisition Experiment
System Setup
Calibration
Trials
Data Acquisition System
Overview
Data Acquisition Hardware
Sensors
Signal Conditioning
The Computer
Software
Analog Input Subsystem
Function of the Analog Input Subsystem
Sampling
Quantization
Channel Configuration
Transferring Da ta from Hardware to System Memory
Making Quality M easurements
What Do You Measure?
Accuracy and Precision
Noise
Matching the Sensor Range and A/D Converter Range
How Fast Should a Signal Be Sampled?
........................................... 1-6
........................................... 1-38
..................................... 1-5
....................................... 1-5
........................... 1-7
........................................ 1-7
......................... 1-10
.......................................... 1-11
............................... 1-15
.................................... 1-17
......................................... 1-17
........................... 1-20
.............. 1-20
........................................ 1-20
..................................... 1-24
............................. 1-28
...................... 1-34
............................ 1-34
............................. 1-34
............... 1-40
.......... 1-5
... 1-31
... 1-40
Getting Comm and-Line Function Help
.............. 1-45
v
Page 6

Selected Bibliography .............................. 1-46
Using Data Acquisition Toolbox Software
2
Installation In formation ........................... 2-2
Prerequisites
Toolbox Installation
Hardware and Driver Installation
..................................... 2-2
............................... 2-2
.................... 2-3
Toolbox Components
Information and Interaction
MATLAB F unctions
Data Acquisition Engine
Hardware Driver Adaptor
Supported Hardware
Unsupported Hardware
Accessing Your Hardware
Connecting to Your Hardware
Acquiring Data
Outputting Data
Reading and Writing Digital Values
Acquiring Data in a Loop
Understanding the Toolbox Capabilities
Contents File
Documentation Examples
Quick Reference Guide
Demos
Examining Your Hardware Resources
Using the daqhwinfo Function
General Toolbox Information
Adaptor-Specific Information
Device Object Information
..................................... 2-19
.......................................... 2-20
............................... 2-4
......................... 2-4
............................... 2-6
............................ 2-6
........................... 2-9
............................... 2-9
............................ 2-11
.......................... 2-12
....................... 2-12
................................... 2-12
.................................. 2-13
.................. 2-14
........................... 2-17
........................... 2-19
............................. 2-20
....................... 2-21
........................ 2-21
........................ 2-22
.......................... 2-23
............. 2-19
............... 2-21
vi Contents
Getting Help
...................................... 2-25
Page 7

The daqhelp Function .............................. 2-25
The propinfo Function
.............................. 2-25
Data Acquisition Session
3
Understanding the Data Acquisition Session ......... 3-2
Overview
Real-Time Data Acquisition
Example: The Data Acquisition Se ssion
........................................ 3-2
......................... 3-3
............... 3-4
Creating a Device Object
Understanding Device Objects
Creating an Array of Device Objects
WhereDoDeviceObjectsExist?
Hardware Channels or Lines
Adding Channels and Lines
Mapping Hardware Channel IDs to the MATLAB
Indices
Configuring an d Returning P roperties
Overview
Property Types
Returning Property Names and Property Values
Configuring Property Values
Specifying Property Names
Default Property Values
The Property Inspector
Acquiring a nd Outputting Data
Device Object States
Starting the Device Object
Logging or Sending Data
Stopping the Device Object
........................................ 3-12
........................................ 3-14
................................... 3-14
........................... 3-6
....................... 3-6
.................. 3-7
...................... 3-8
....................... 3-10
......................... 3-10
.............. 3-14
........................ 3-20
......................... 3-22
............................ 3-22
............................. 3-23
..................... 3-24
............................... 3-24
.......................... 3-25
........................... 3-25
.......................... 3-26
........ 3-16
Cleaning Up
....................................... 3-28
vii
Page 8

Getting Started with Analog Input
4
Creating an Analog Input Obje ct .................... 4-2
Adding Channels to an Analog Input Object
Channel Group
Referencing Individual Hardware Channels
Example: Adding Channels for a Sound Card
Configuring Analog Input Properties
Analog In pu t: Basic Properties
The Sampling Rate
Trigger Types
The Samples to Acquire per Trigger
Acquiring Data
Starting the Analog Input Object
Logging Data
Stopping the Analog Input Object
Analog Input Examples
BasicStepsforAcquiringData
Acquiring Data with a Sound Card
Acquiring Data with a National Instruments Board
Evaluating the Analog Input Object Status
Status Properties
The Display Summary
................................... 4-4
................ 4-9
...................... 4-9
................................ 4-10
.................................... 4-12
.................. 4-13
.................................... 4-14
..................... 4-14
..................................... 4-14
.................... 4-15
............................ 4-16
...................... 4-16
................... 4-16
.................................. 4-24
............................. 4-25
.......... 4-4
............ 4-6
........... 4-7
..... 4-20
........... 4-24
viii Contents
Doing More with Analog Input
5
Configuring and Sampling Input Channels .......... 5-2
Properties Associated with Configuring and Sampling Input
Channels
Input Channel Configuration
...................................... 5-2
........................ 5-2
Page 9

The Sampling Rate ................................ 5-4
Channel Skew
.................................... 5-7
Managing Acquired Data
Analog Input Data Management Properties
Previewing Data
Rules for Using peekdata
Extracting Data from the Engine
Returning Time Information
Configuring Analog Input Triggers
Analog Input Trigger Properties
Defining a Trigger: Trigger Types and Conditions
Executing the Trigger
Trigger Delays
Repeating Triggers
How Many Triggers Occurred?
When D id the Trigger Occur?
Device-Specific Hardware Triggers
Events and Callbacks
Understanding Events and Callbacks
Event Types
Recording and Retrieving Event Information
Creating and Executing Callback Functions
Examples: Using Callback Properties and Functions
.................................. 5-10
.................................... 5-28
...................................... 5-46
........................... 5-10
............ 5-10
........................... 5-11
..................... 5-13
........................ 5-18
.................. 5-21
..................... 5-21
.............................. 5-27
................................ 5-32
....................... 5-37
........................ 5-38
................... 5-39
.............................. 5-46
................. 5-46
............ 5-53
....... 5-22
........... 5-49
.... 5-55
Linearly Scaling the Data: E ngineering Units
Analog Input Engineering Units Properties
Example: Performing a Linear Conversion
Linear Conversion with Asymmetric Data
........ 5-58
............ 5-58
............. 5-60
............. 5-61
Analog Output
6
Getting Started with Analog Output ................. 6-2
Creating an Analog Output Object
Adding Channels to an Analog Output Object
Configuring Analog Output Properties
................... 6-2
.......... 6-3
................ 6-5
ix
Page 10

Outputting Data .................................. 6-7
Analog Output Examples
Evaluating the Analog OutputObjectStatus
........................... 6-9
........... 6-12
Managing Output Data
The Analog Output Subsystem
Queuing Data with putdata
Example: Queuing Data with putdata
Configuring Analog Output Triggers
Analog O utput Trigger Properties
Defining a Trigger: Trigger Types
Executing the Trigger
How Many Triggers Occurred?
When D id the Trigger Occur?
Device-Specific Hardware Triggers
Events and Callbacks
Understanding Events and Callbacks
Event Types
Recording and Retrieving Event Information
Examples: Using Callback Properties and Callback
Functions
Linearly Scaling the Data
Engineering Units
Example: Performing a Linear Conversion
...................................... 6-26
...................................... 6-32
............................. 6-16
...................... 6-16
......................... 6-16
................. 6-18
................ 6-20
.................... 6-20
.................... 6-21
.............................. 6-22
....................... 6-22
........................ 6-23
................... 6-24
.............................. 6-26
................. 6-26
.......................... 6-35
................................. 6-35
............. 6-36
........... 6-29
x Contents
Starting Multiple Device Objects
Advanced Configurations Using Analog Input
7
Starting Analog Input and Analog Output
Simultaneously
.................................. 7-2
.................... 6-39
and Analog Output
Page 11

Synchronizing Analog Input and Analog Output Using
RTSI Hardware
................................. 7-4
Digital Input/Output
8
Digital I/O Objects ................................. 8-3
Creating a Digital I/O Object
The Parallel Port
.................................. 8-4
........................ 8-3
Adding Lines to a Digital I/O Object
Using the Addline Function
Line and Port Characteristics
Referencing Individual Hardware Lines
Writing and Reading Digital I/O Line Values
Writing Digital Values
Reading Digital Values
Example: Writing and Reading Digital Values
Generating Timer Events
Overview
Timer Events
Starting and Stopping a Digital I/O Object
Example: Generating Timer Events
Evaluating the Digital I/O Object Status
Running Property
The Display Summary
........................................ 8-21
..................................... 8-21
................................. 8-25
......................... 8-7
....................... 8-9
............................. 8-16
............................. 8-18
........................... 8-21
............................. 8-25
................. 8-7
............... 8-13
............. 8-22
.................. 8-23
............. 8-25
......... 8-16
.......... 8-19
Saving and Loading the Session
9
Saving and Loading Device Objects ................. 9-2
Saving Device Objects to a File
...................... 9-2
xi
Page 12

Saving Device Objects to a MAT-File .................. 9-4
10
Logging Information to Disk
Analog Input Logging Properties
Specifying a Filename
Retrieving L ogg ed Information
Example: Logging and Retrieving Information
.............................. 9-6
........................ 9-5
..................... 9-5
...................... 9-7
.......... 9-9
softscope: The Data Acquisition Oscilloscope
Oscilloscope Overview ............................. 10-2
Opening the Oscilloscope
Hardware Configuration
Displaying Channels
Creating a Display
Creating Additional Displays
Configuring Display Properties
Math and Reference Channels
Removing Channel Displays
........................... 10-2
............................ 10-3
............................... 10-5
................................ 10-5
........................ 10-6
...................... 10-8
....................... 10-9
......................... 10-12
xii Contents
Channel Data and Properties
Scaling the Channel Data
Configuring Channel Properties
Triggering the Oscilloscope
Acquisition Types
Trigger Types
Configuring Trigger Properties
Making Measurements
Predefined Meas ure m ent
Defining a Measurement
Defining a New Measurement Type
Configuring Measurement Properties
Exporting Data
................................. 10-18
.................................... 10-18
.................................... 10-28
........................... 10-14
............................. 10-21
........................... 10-21
........................... 10-22
....................... 10-14
..................... 10-15
........................ 10-18
...................... 10-20
................... 10-24
................. 10-25
Page 13

Channels ........................................ 10-28
Measurements
.................................... 10-29
11
Saving and Loading the Oscilloscope Configuration
.. 10-31
Using the Data Acquisition Blocks in Simulink
Overview ......................................... 11-2
Opening the Data Acquisition Block Library
Using the daqlib Command from the MAT LAB
Workspace
Using the Simulink Library Browser
Building Simulink Models to Acquire Data from a
Device
Data Acquisition Toolbox Block Library
Example: Bringing Analog Data into a Model
..................................... 11-4
.................. 11-5
.......................................... 11-7
............... 11-7
......... 11-4
.......... 11-7
12
Function Reference
Device Object Creation ............................. 12-2
Channels and Lines
Property Getting and Setting
Object Execution
Data Manipulation
................................ 12-3
....................... 12-4
.................................. 12-5
................................. 12-6
xiii
Page 14

Information and Help .............................. 12-7
13
14
Utilities
........................................... 12-8
Functions — Alphabetical List
Base Property Reference
Analog Input Properties ............................ 14-3
Common Properties
Channel Properties
Analog Output Properties
Common Properties
Channel Properties
Digital I/O Properties
Common Properties
Line Properties
Getting Command-Line Property Help
................................ 14-3
................................ 14-6
.......................... 14-7
................................ 14-7
................................ 14-10
.............................. 14-11
................................ 14-11
................................... 14-12
................ 14-13
xiv Contents
Page 15

15
16
Base Properties — Alphabetical List
Device-Specific Property by Vendor Reference
Advantech ........................................ 16-2
17
18
Measurement Computing
National Instruments
Parallel Port
Sound Card
Getting Command-Line Property Help
Device-Specific Properties — Alphabetical List
...................................... 16-4
....................................... 16-4
........................... 16-2
.............................. 16-2
................ 16-5
Block Reference
Troubleshooting Your Hardware
A
Advantech Hardware .............................. A-3
What Driver Are You Using?
........................ A-3
xv
Page 16

Is Your Hardware Functioning Properly? .............. A-3
Measurement Computing Hardware
What Driver Are You Using?
Is Your Hardware Functioning Properly?
National Instruments Hardware
NI-DAQmx Versus Traditional NI-DAQ Drivers
What Driver Are You Using?
Is Your Hardware Functioning Properly?
Sound Cards
Verify If Your Sound Card Is Functioning
MicrophoneandSoundCardTypes
Testing with a Microphone
Testing with a CD Player
Running in Full-Duplex Mode
Other M anufactu rers
Other Things to T ry
Registering the Hardware Driver Adaptor
Contacting The MathWorks
...................................... A-10
.............................. A-18
................................ A-19
........................ A-5
........................ A-8
.......................... A-15
........................... A-15
....................... A-16
......................... A-20
................. A-5
.................... A-7
................... A-14
.............. A-5
........ A-7
.............. A-9
.............. A-10
............. A-19
xvi Contents
B
nal Instrumen ts Hardware
Natio
urement Computing Hardwa re
Meas
dows Sound Cards
Win
Vendor Limitations
....................
.................
.............................
B-2
B-4
B-5
Page 17

Managing Your Memory Resources
C
Memory Allocation ................................. C-2
How M uch Memory Do You Need?
Example: Managing Memory Resources
D
Getting Started with Data Acquisition Toolbox
Software
Getting Started with A nalog Input
Doing More with Analog Input
Analog Output
Digital I/O
........................................ D-2
...................... D-2
..................................... D-2
......................................... D-3
................... C-4
............. C-5
Examples
.................. D-2
Saving and Loading the Session
Bringing Analog Data into a Model
..................... D-3
.................. D-3
xvii
Page 18

Glossary
Index
xviii Contents
Page 19

Introduction to Data Acquisition
Before you set up any data acquisition system, you should understand the
physical quantities you want to measure, the characteristics of those physical
quantities, the appropriate sensor to use, and the appropriate data acquisition
hardware to use.
The purpose of this chapter is to provide you with some general guidelines
about making measurements with a data acquisition system. The information
provided should assist you in understanding the above considerations, and
understanding the specification sheet associated with your hardware. The
sections are as follows.
1
• “Product Overview” on page 1-2
• “Anatomy of a Data Acquisition Experiment” on page 1-5
• “Data Acquisition System” on page 1-7
• “Analog Input Subsystem” on page 1-20
• “Making Quality Measurements” on page 1-34
• “Getting Command-Line Function Help” on page 1-45
• “Selected Bibliography” on page 1-46
Page 20
1 Introduction to Data Acquisition
Product Overview
In this section...
“Understanding Data Acquisition Toolbox Software” on page 1-2
“Exploring the Toolbox” on page 1-3
“Supported Hardware” on page 1-4
Understanding Data Acquisition Toolbox Software
Data Acquisition Toolbox™ software is a collection of functions and a MEX-file
(shared library) built on the MATLAB
The toolbox also includes several dynamic link libraries (DLLs) called
adaptors, which enable you to interface with specific hardware. The toolbox
provides you with these main features:
• A framework for bringing live, measured data into the M ATL AB workspace
using PC-compatible, plug-in data acquisition hardware
®
technical computing environment.
1-2
• Support for analog input (AI), analog output (AO), and digital I/O (DIO)
subsystems including simultaneous analog I/O conversions
• Support for these popular hardware vendors/devices:
- Advantech
®
boards that use the Advantech Device Manager
- Measurement Computing™ Corporation (ComputerBoards) boards
- National Instruments
NI-DAQmx software
Note The Traditional NI-DAQ adaptor will be deprecated in a
future version of the toolbox. If you create a Data Acquisition
Toolbox™ object for Traditional NI-DAQ adaptor beginning in
R2008b, you will receive a warning stating that this adaptor will
be removed in a future release. See the supported hardware page
at
www.mathworks.com/products/daq/supportedio.html for more
information.
®
boards that use Traditional NI-DAQ or
Page 21

- Parallel ports LPT1-LPT3
Note The parallel port adaptor will be deprecated in a future
version of the toolbox. If you create a Data Acquisition
Toolbox™ object for
receive a warning stating that this adaptor will be removed
in a future release. See the supported hardware page at
www.mathworks.com/products/daq/supportedio.html for more
information.
'parallel' beginning in R2008b, you will
Product Overview
- Microsoft
Additionally, you can use the Data Acquisition Toolbox A daptor Kit to
interface unsupported hardware devices to the toolbox.
• Event-driven acquisitio ns
®
Windows®sound cards
Exploring the Toolbox
A list of the toolbox functions is available to you by typing
help daq
You can view the code for any function by typing
type function_name
You can view the help for any function by typing
daqhelp function_name
You can change the way any toolbox function works by copying and renaming
the file, then modifying your copy. You can also extend the toolbox by adding
your own files, or by using it in combination with other products such as
Signal Proce ssing Toolbox™ or Instrument Control T oolbo x™.
The MathWorks™ provides several related products that are especially
relevant to the kinds of tasks you can perform with Data Acquisition
Toolbox software. For more information about any of these products, see
http://www.mathworks.com/products/daq/related.jsp.
1-3
Page 22

1 Introduction to Data Acquisition
Supported Hardw
The list of hardw
change in each re
MathWorks Web s
To see the full
hardware page
For more infor
Hardware” on
are supported by the Data Acquisition Toolbox software can
lease, since hardware support is frequently added. The
ite is the best place to check for the most up-to-date listing.
list of hardware that the toolbox supports, visit the supported
at
www.mathworks.com/products/daq/supportedio.html.
mation about unsupported hardware, see “Unsupported
page 2-11.
are
1-4
Page 23

Anatomy of a Data Acquisition Experiment
Anatomy of a Data Acquisition Experiment
In this section...
“System Setup” on page 1-5
“Calibration” on page 1-5
“Trials” on page 1-6
System Setup
The first step in any data acquisition experiment is to install the hardware
and software. Hardware installation consists of plugging a board into your
computer or installing modules into an external chassis. Software installation
consists of loading hardware drivers and application software onto your
computer. After the hardware and software are installed, you can attach
your sensors.
Calibration
After the hardware and software are installed and the sensors are connected,
the data acquisition hardware should be calibrated. Calibration consists of
providing a known input to the system and recording the output. For many
data acquisition devices, calibration can be easily accomplished with software
provided by the vendor.
1-5
Page 24

1 Introduction to Data Acquisition
Trials
After the hardwa
You might think t
signal you are m
acquisition sy
re is set up and calibrated, you can begin to acquire data.
hat if you completely understand the characteristics of the
easuring, then you should be able to configure your data
stem and acquire the data.
In the real wor
noise levels a
higher rate,
frequency co
These realmeasuremen
different h
perform mu
or perhaps you need to add an antialias filter to remove unwanted
mponents.
world effects act as obstacles between you and a precise, accurate
t. To overcome these obstacles, you need to experiment with
ardware and software configurations. In other words, you need to
ltiple data acquisition trials.
ld however, your sensor might be picking up unacceptable
nd require shielding, o r you might need to run the device at a
1-6
Page 25
Data Acquisition System
In this section...
“Overview” on page 1-7
“Data Acquisition Hardware” on page 1-10
“Sensors” on page 1-11
“Signal Conditioning” on page 1-15
“The Computer” on page 1-17
“Software” on page 1-17
Overview
The Data Acquisition Toolbox software, in conjunction with the MA TLAB
technical computing environment, gives you the ability to measure and
analyze physical phenomena. The purpose of any data acquisition system is
to provide you with the tools and resources necessary to do so .
Data Acquisition System
You can think of a data acquisition system as a collection of software and
hardware that connects you to the physical w orld . A typical data acquisition
system consists of these components.
Components
Data acquisition
hardware
sors and
Sen
uators
act
ransducers)
(t
iption
Descr
e heart of any data acquisition system lies the
At th
acquisition hardware. Th e main function of this
data
ware is to convert analog signals to digital s ignals,
hard
o conve rt digital signals to analog signals.
and t
sors and actuators can both be transducers.A
Sen
nsducer is a device that converts input energy of one
tra
rm into output energy of another form. For example,
fo
icrophone is a sensor that converts sound energy
am
n the form of pressure) into electrical energy, while
(i
oudspeaker is an actuator that converts electrical
al
nergy into sound energy.
e
1-7
Page 26

1 Introduction to Data Acquisition
Components
Signal
conditioning
hardware
Computer
Software Data acquisition software allows you to exchange
The data acquisition components, and their relationship to each other, are
shown below.
Description
Sensor signals are often incompatible w ith
data acquisition hardware. To overcome this
incompatibility, the signal must be conditioned. For
example, you might need to condition an input signal
by amplifying it or by removing unwanted frequency
components. Output signals might need conditioning
as well. However, only input signal conditioning is
discussed in this chapter.
The computer provides a proces sor, a system clock, a
bus to transfer data, and memory and disk space to
store data.
information between the computer and the hardware.
For example, typica l software allows y o u to configure
the sampling rate of your board, and acquire a
predefined amount of data.
1-8
Page 27

Data Acquisition System
The figure depicts the two important features of a data acquis ition system :
• Signals are input to a sensor, conditioned, converted into bits that a
computer can read, and analyzed to extract meaningful information.
For example, sound level data is acquired from a microphone, amplified,
digitized by a sound card, and stored in MATLAB workspace for subsequent
analysis of frequency content.
• Data from a computer is converted into an analog signal and output to
an actuator.
For example, a vector of data in MATLAB workspace is converted to an
analog signal by a sound card and output to a loudspeaker.
1-9
Page 28

1 Introduction to Data Acquisition
Data Acquisitio
Data acquisitio
expansion slot i
computer throu
At the simples
subsystems it
hardware that
• Analog input
• Analog outp
• Digital inp
• Counter/ti
Hardware d
depicted b
n hardware is either internal and installed directly into an
nside your computer, or external and connected to your
gh an external cable, which is typically a USB cable.
t level, data acquisition hardware is characterized by the
possesses. A subsystem is a component of your data acquis ition
performs a specialized task. Common subsystems include
ut
ut/output
mer
evices that consist of multiple subsystems, such as the one
elow, are called multifunction boards.
n Hardware
1-10
Analog Input Subsystems
Analog input subsystems convert real-world analog input signals from
a sensor into bits that can be read by your computer. Perhaps the most
important of all the subsystems commonlyavailable,theyaretypically
multichannel devices offering 12 or 16 bits of resolution.
Analog input subsystems are also referred to as AI subsystems, A/D
converters, or ADCs. Analog input subsystems are discussed in detail
beginning in “Analog Input Subsystem” on page 1-20.
Page 29

Data Acquisition System
Analog Output Subsystems
Analog output subsystems convert digital data store d on your computer to a
real-world analog signal. These subsystems perform the inverse conversion
of analog input subsystems. Typical acquisition boards offer two output
channels wi th 12 bits of resolution, with special hardware availabletosupport
multiple channel analog output operations.
Analog output subsystems are also referred to as AO subsystems, D/A
converters, or DACs.
Digital Input/Output Subsystems
Digital input/output (DIO) subsystems are designed to input and output
digital values (logic levels) to and from hardware. These values are typically
handled either as single bits or lines,orasaport, which typically consists
of eight lines.
While most popular data acquisition cards in clude some dig ita l I/O ca pa b il ity ,
it is usually limited to simple operations, and special dedicated hardware is
often necessary for performing advanced digital I/O operations.
Counter/Timer Subsystems
Counter/timer (C/T) subsystems are used for event counting, frequency and
period measurement, and pulse train generation.
Sensors
A sensor converts the physical pheno m ena of interest into a signal that is
input into your data acquisition hardware. There are two main types of
sensors based on the output they produce: digital sensors and analog sensors.
Digital sensors produce an output signal that is a digital representation of
the input signal, and has discrete values of magnitude measured at discrete
times. A digital se ns or must output logic levels that are compatible with the
digital receiver. Some standard logic levels include transistor-transistor logic
(TTL) and emitter-coupled logic (ECL). Examples of digital sensors include
switches and p osition encoders.
1-11
Page 30

1 Introduction to Data Acquisition
Analog sensors produce an output signal that is directly proportional to the
input signal, and is continuous in both magnitude and in time. Most physical
variables such as temperature, pressure, and acceleration are continuous in
nature and are readily m easured withananalogsensor. Forexample,the
temperature of an automobile cooling system and the acceleration produced
by a child on a swing all vary continuously.
The sensor you use depends on the phenomena you are measuring. Some
common analog sensors and the physical variables they measure are listed
below.
Common Analog Sensors
Sensor Physical Variable
Accelerometer Acceleration
Microphone
Pressure gauge Pressure
Resistive temperature device (RTD)
Strain gauge
Thermocouple
When choosing the best analog sensor to use, you must match the
characteristics of the physical variable you are measuring with the
characteristics of the sensor. The two most important senso r characteristics
are:
• The sensor output
• The sensor bandwidth
Pressure
Temperature
Force
Temperature
Sensor Output
The output from a sensor can be an analog signal or a digital signal, and the
output variable is usually a voltage although some sensors output current.
1-12
Page 31

Data Acquisition System
Current Signals. Current is often used to transmit signals in noisy
environments because it is much less affected by environmental noise. The
full scale range of the current signal is often either 4-20 mA or 0-20 mA.
A 4-20 mA signal has the advantage that even at minimum signal value,
there should be a detectable current flowing. The absence of this indicates a
wiring problem.
Before conversion by the analog input subsystem, the current signals are
usually turned into voltage signals by a current-sensing resistor. The resistor
should be of high precision, perhaps 0.03% or 0.01% depending on the
resolution of your hardware. A dditionally, the voltage signal should match the
signal to an input range of the analog input hardware. For 4-20 mA signals, a
50 ohm resistor will give a voltage of 1 V for a 20 mA signal by Ohm’s law.
Voltage Signals. The most commonly interfaced signal is a voltage signal.
For example, thermocouples, strain gauges, and accelerometers all produce
voltage signals. There are three major aspects of a voltage signal that you
need to consider:
• Amplitude
If the signal is smaller than a few millivolts, you might need to amplify it.
If it is larger than the maximum range of your analog input hardware
(typically ±10 V), you will have to divide the signal down us i ng a resistor
network.
The amplitude is related to the sensitivity (resolutio n) of your hardware.
Refer to “Accuracy and Precision” on page 1-34 for more information about
hardware sensitivity.
• Frequency
Whenever you acquire data, you should decide the highest frequency you
want to measure.
The highest frequency component of the signal determines how often
you should sample the input. If you have more than one input, but only
one analog input subsystem, then the overall sampling rate goes up in
proportion to the number of inputs. Higher frequencies might be present as
noise, which you can remove by filtering the signal before it is digitized.
If you sample the input signal at least twice as fast as the highest frequency
component, then that signal will be uniquely characterized. However, this
1-13
Page 32

1 Introduction to Data Acquisition
rate might not mimic the waveform very closely. For a rapidly varying
signal, you might need a sampling rate of roughly 10 to 20 times the
highest frequency to get an accurate picture of the waveform. For slowly
varying signals, you need only consider the minimum time for a significant
change in the signal.
The frequency is related to the bandwidth of your measurement.
Bandwidth is discussed in the next section.
• Duration
How long do you want to sample the signal for? If you are storing data
to memory or to a disk file, then the duration determines the storage
resources required. The format of the stored data also affects the amount of
storage space required. For example, data stored in ASCII format takes
more space than data stored in binary format.
Sensor Bandwidth
Inareal-worlddataacquisitionexperiment, the physical phenomena you
are measuring has expected limits. For example, the tempera ture of your
automobile’s cooling system varies continuously betwee n its low limit and
high limit. The temperature limits, as w ell as how rapidly the temperature
varies between the limits, depends on several factors including your driving
habits, the weather, and the condition of the cooling system. The expected
limits might be readily approximated, but there are an infinite number of
possible temperatures that you can measure at a given time. As explained in
“Quantization” on page 1-24, these unlimited possibilities are mapped to a
finite set of values by your data acquisition hardware.
1-14
The bandwidth is given by the range of frequencies present in the signal
being measured. You can also think of bandwidth as being related to the rate
of change of the signal. A slowly varying signal has a low bandwidth, while
a rapidly varying signal has a high bandwidth. To properly measure the
physical phenomena of interest, the sensor bandwidth must be compatible
with the measurement bandwidth.
You might want to use sensors with the widest possible bandwidth when
making any physical measurement. This is the one way to ensure that the
basic measurement system is capable of responding linearly over the full
range of interest. However, the wider the bandwidth of the sensor, the
Page 33

Data Acquisition System
more you must be concerned with eliminating sensor response to unwanted
frequency components.
Signal Conditioning
Sensor signals are often incompatible with data acquisition hardware. To
overcome this in compatibility, the sensor signal must be conditioned. The
type of signal conditioning required depends on the sensor you are using. For
example, a signal might have a small amplitude and require amplification,
or it might contain unwanted frequency components and require filtering.
Common ways to condition signals include
• Amplification
• Filtering
• Electrical isolation
• Multiplexing
• Excitation source
Amplification
Low-level – less than around 100 millivolts – usually need to be amplified.
High-level signals might also require amplification depending on the input
range of the analog input subsystem.
For example, the output signal from a thermocouple is small and must be
amplified before it is digitized. Signalamplificationallowsyoutoreduce
noise and to make use of the full range of your hardware thereby increasing
the resolution of the measurement.
Filtering
Filtering removes unwanted noise from the signal of interest. A noise filter
is used on slowly varying signals such as temperature to attenuate higher
frequency signals that can reduce the accuracy of your measurement.
Rapidly varying signals such as vibration often require a different type
of filter known as an antialiasing filter. An antialiasing filter removes
undesirable higher frequencies that might lead to erroneous measurements.
1-15
Page 34

1 Introduction to Data Acquisition
Electrical Isolation
If the signal of interest contains high-voltage transients that could damage
the computer, then the sensor signals should be electrically isolated from the
computer for safety purposes.
You can also use electrical isolation to make sure that the readings from
the data acquisition hardware are not affected by differences in ground
potentials. For example, when the hardware device and the sensor signal are
each referenced to ground, problems occur if there is a potential difference
between the two grounds. This difference can lead to a ground loop,which
might lead to erroneous measurements. Using electrically isolated signal
conditioning modules eliminates the ground loop and ensures that the signals
are accurately represented.
Multiplexing
A common technique for measuring several signals with a single measuring
device is multiplexing.
1-16
Signal conditioning devices for analog signals often provide multiplexing for
use w ith slowly changing signals such as temperature. This is in addition to
any built-in multiplexing on the DAQ board. The A/D converter samples
one channel, switches to the next channel and samples it, switches to the
next channel, and so on. Because the same A/D converter is sampling many
channels, the effective sampling rate of each individual channel is inversely
proportional to the number of channels sampled.
You must take care when using multiplexers so that the switched signal has
sufficient time to settle. R efer to “Noise” on page 1-38 for more information
about settling time.
Excitation Source
Some sensors require an excitation source to operate. For example, strain
gauges, and resistive temperature devices (RTDs) require external voltage
or current excitation. Signal conditioning modules for these sensors usually
provide the necessary excitation. RTD measurements are usually made with
a current source that converts the variation in resistance to a measurable
voltage.
Page 35

The Computer
The computer pro
memory and disk s
vides a processor, a system clock, a bus to transfer data, and
Data Acquisition System
pace to store data.
The processor c
clock provide
recorded a sen
when that meas
Data is trans
memory acces
therefore e
between whe
responds. T
bus archit
for more in
s time information about the acquired data. Knowing that you
ferred from the hardware to system memory via dynamic
s (DMA) or interrupts. DMA is hardware controlled and
xtremely fast. Interrupts might be slow because of the latency time
n a board requests interrupt servicing and when the computer
he maximum acquisition rate is also determined by the computer’s
ecture. Refer to “How Are Acquired Samples Clocked?” on page 1-27
formation about DMA and interrupts.
Software
Regardle
to the ha
configu
receive
error me
so that
This in
There
ss of the hardware you are using, you must send information
rdware and receive information from the hardware. You send
ration information to the hardware such as the sampling rate, and
information from the hardware s uch as data, status messages, and
ssages. You might also need to supply the hardware with information
you can integrate it with other hardware and with computer resources.
formation exchange is accomplished with software.
are two kinds of software:
ontrols how fast data is accepte d by the converter. The system
sor reading is generally not enough. You also need to know
urement occurred.
• Drive
• Appl
rsoftware
ication software
1-17
Page 36

1 Introduction to Data Acquisition
For example, suppose you are using Data Acquisition Toolbox software with
a National Instruments AT-MIO-16E-1 board and its associated NI-DAQ
driver. The relationship between you, the driver so ftware, the application
software, and the hardware is shown below.
1-18
The diagram illustrates that you supply information to the hardware, and you
receive information from the hardware.
Driver
For data acquisition device, there is associated driver software that you must
use. Driver software allows you to access and control the capabilities of your
hardware. Among other things, basic driver software allows you to
• Bring data on to and get data off of the board
• Control the rate at which data is acquired
• Integrate the d a ta acquisition hardware with computer resources such as
• Integrate the data acquisition hardware with signa l conditioning hardware
• Access multiple subsystems on a given data acquisition board
• Access multiple data acquisition boards
Software
processor interrupts, DMA, and memory
Page 37

Data Acquisition System
Application Software
Application software provides a convenient front end to the driver software.
Basic application software allows you to
• Report relevant information such as the number of samples acquired
• Generate events
• Manage the data stored in computer memory
• Condition a signal
• Plot acquired data
With some application software, you can also perform analysis on the data.
MATLAB and Data Acquisition Toolbox software provide you with these
capabilities and more.
1-19
Page 38

1 Introduction to Data Acquisition
Analog Input Subsystem
In this section...
“Function of the Analog Input Subsystem” on page 1-20
“Sampling” on page 1-20
“Quantization” on page 1-24
“Channel Configuration” on page 1-28
“Transferring Data from Hardware to System Memory” on page 1-31
Function of the Analog Input Subsystem
Many data acquisition hardware devices contain one or more subsystems that
convert (digitize) real-world sensor signals into numbers your computer can
read. Such devices are called analog input subsystems (AI subsystems, A/D
converters, or ADCs). A fter the r ea l- world sig nal is digitized, you can analyze
it, store it in system memory, or store it to a disk file.
1-20
The function of the analog input subsystem is to sample and quantize the
analog signal using one or more channels. You can think of a channel
as a path through which the sensor signal travels. Typical analog input
subsystems have eight or 16 input channels available to you. After data is
sampled and quantized, it must be transferred to system memory.
Analog signals are continuous in time and in amplitude (within predefined
limits). Sampling takes a “snapshot” of the signal at discrete times, while
quantization divides the voltage (or current) value into discrete amplitudes.
Sampling, quantization, channel configuration, and transferring data from
hardware to system memory are discussed next.
Sampling
Sampling takes a snapshot of the sensor signal at discrete times. For most
applications, the time interval between samples is kept constant (for example,
sample every millisecond) unless externally clocked.
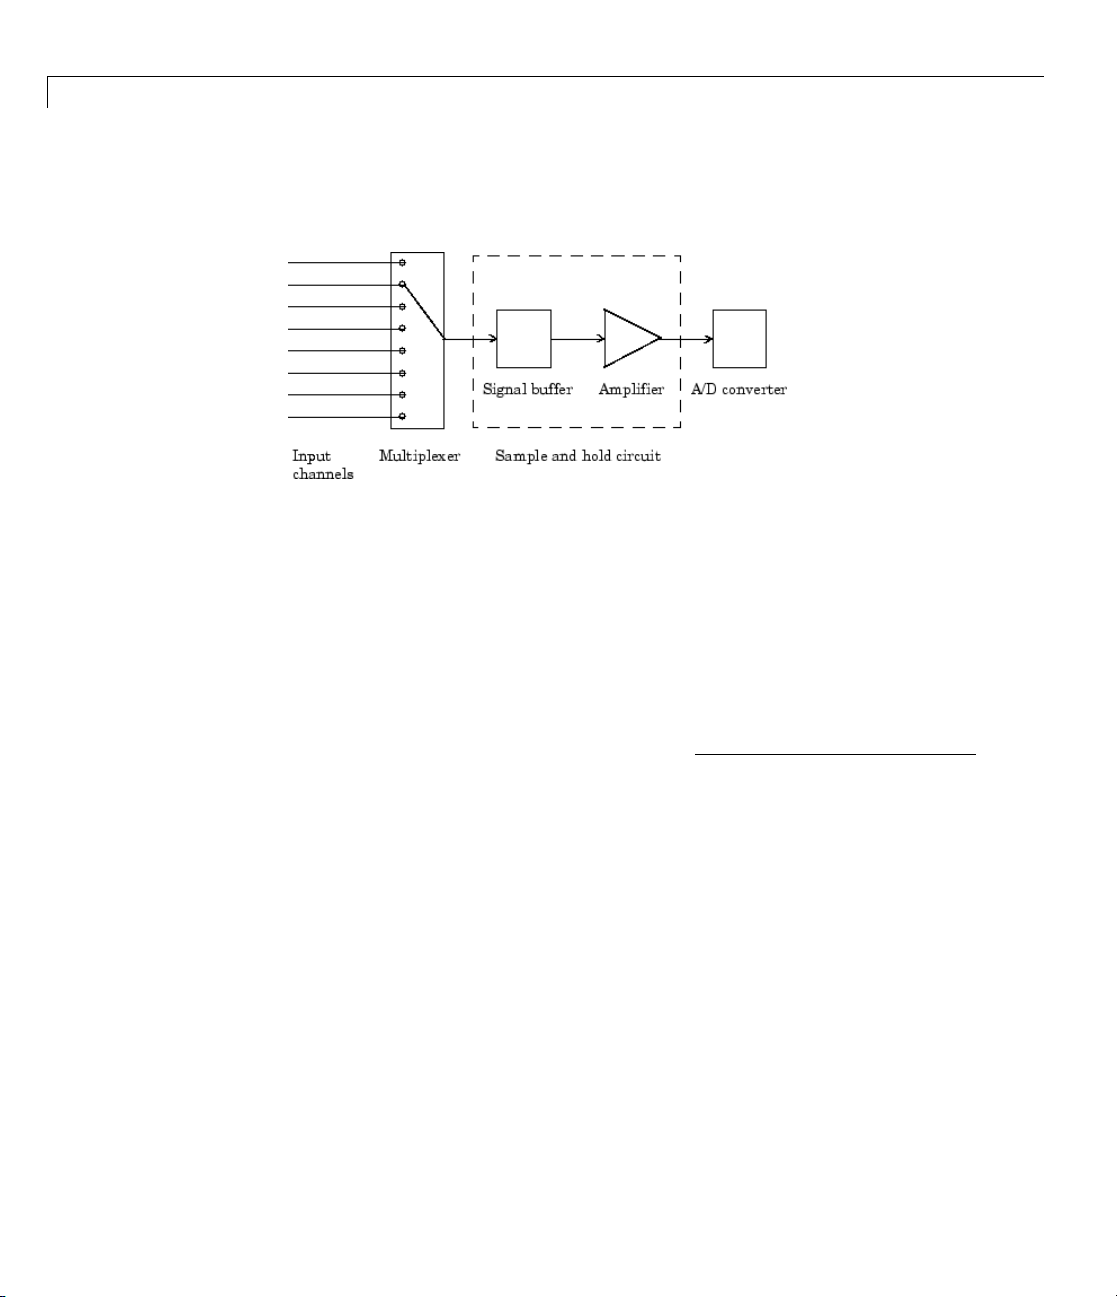
For most dig ital converters, sampling is performed by a sample and hold
(S/H) circuit. An S/H circuit usually consists of a signal buffer followed by an
Page 39

Analog Input Subsystem
electronic switch connected to a capacitor. The operation of an S/H circuit
follows these steps:
1 At a given sampling instant, the switch connects the buffer and capacitor
to an input.
2 The capacitor is charged to the input voltage.
3 The charge is held until the A/D converter digitizes the signal.
4 For multiple channels connected (multiplexed) to o ne A/D converter, the
previous s teps are repeated for each input channel.
5 The entire process is repeated for the next sampling instant.
A multiplexer, S/H circuit, and A/D converter are illustrated in the next
section.
Hardware can be divided into two main categories based on how signals are
sampled: scanning hardware, which samples input signals sequentially, and
simultaneous sample and hold (SS/H) hardware, which samples all signals at
thesametime. Thesetwotypesofhardwarearediscussedbelow.
Scanning Hardware
Scanning hardware samples a single input signal, converts that signal to a
digital value, and then repeats the process for every input channel used. In
other words, each input channel is sampled sequentially. A scan occurs when
each input in a group is sampled once.
1-21
Page 40
1 Introduction to Data Acquisition
As show n below, mos t data acquisition devices have one A/D converter that is
multiplexed to multiple input channels.
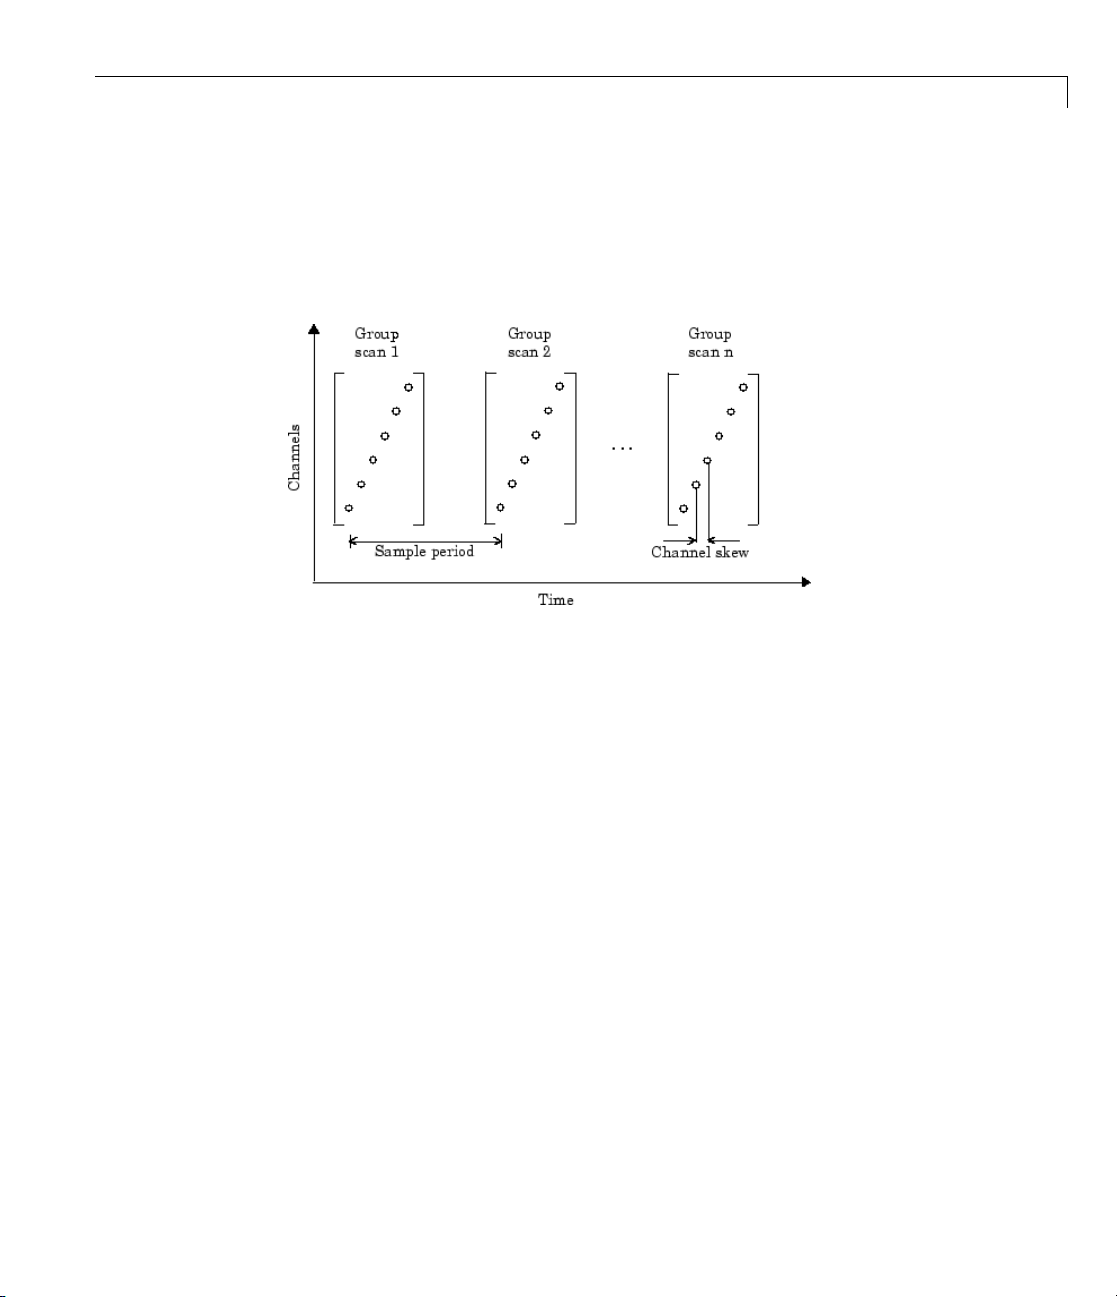
Therefore,
simultaneo
This time g
as the time
Addition
applies f
is given b
if you use multiple channels, those channels cannot be sampled
uslyandatimegapexistsbetweenconsecutive sampled channels.
ap is called the channel skew. You can think of the channel skew
it takes the analog input subsystem to sample a single channel.
ally, the maximum sampling rate your hardware is rated at typically
or one channel. Therefore, the maximum sampling rate per channel
y the formula:
maximum sampling rate per channel
=
maximum board rate
eer of channels scanned
numb
1-22
Page 41
Analog Input Subsystem
Typically, you can achieve this maximum rate only under ideal conditions.
In practice, the sampling rate depends on several characteristics of the
analog input subsystem including the settling time and the gain, as well as
the channel skew. The sample period and channel skew for a multichannel
configuration using scanning hardware is shown below.
If you cannot tolerate channel skew inyourapplication, you must use
hardware that allows simultaneous sampling of all channels. Simultaneous
sample and hold hardware is discussed in the next section.
Simultaneous Sample and Hold Hardware
Simultaneous sample and h old (SS/H) hardware samples all input signals
at the same time and holds the values until the A/D converter digitizes all
the signals. For high-end systems, there can be a separate A/D converter
for each input channel.
For example, suppose you need to simultaneously measure the acceleration of
multiple accelerometers to determine the vibration of some device under test.
To do this, you must use SS/H hardware because it does not have a channel
skew. In general, you might need to use SS/H hardware if your sensor signal
changes significantly in a time that is less than the channel skew, or if you
need to use a transfer function or perform a frequency domain correlation.
1-23
Page 42

1 Introduction to Data Acquisition
The sample period for a multichannel configuration using SS/H hardware is
shown below. Note that there is no channel skew.
Quantization
As discussed in the previous section, sampling takes a snapshot of the input
signal at an instant of time. When the snapshot is taken, the sampled analog
signal must be converted from a voltage value to a binary number that the
computer can read. The conversion from an infinitely precise amplitude to a
binary number is called quantization.
1-24
During quantization, the A/D converter uses a finite number of evenly spaced
values to represent the analog signal. The number of different values is
determined by the number of bits used for the conversion. Most modern
converters use 12 or 16 bits. Typically, the converter selects the digital value
that is closest to the actual sampled value.
Page 43

Analog Input Subsystem
The fig ure below shows a 1 Hz sine wave quantized by a 3 bit A/D converter.
The number of quantized values is given by 23= 8, the largest representable
value is given by 111 = 2
2+21+20
= 7.0, and the smallest representable
value is given by 000 = 0.0.
Quantization Error
There is always some error associated with the quantization of a continuous
signal. Ideally, the maximum quantization error is ±0.5 least significant bits
(LSBs), and over the full input range, the average quantization error is zero.
1-25
Page 44

1 Introduction to Data Acquisition
As shown below, the quantization error for the previous sine wave is
calculated by subtracting the actual signal from the quantized signal.
1-26
Input Range and Polarity
The input range of the analog input subsystem is the span of input values for
which a conversion is valid. You can change the input range by selecting a
different gain value. For example, National Instruments’ AT-MIO-16E-1
board has eight gain values ranging from 0.5 to 100. Many boards include
a programmable gain amplifier that allows you to change the device gain
through software.
When an input signal exceeds the valid input range of the converter, an
overrange condition occurs. In this case, most devices saturate to the largest
representable value, and the converted data is almost definitely incorrect.
The gain setting affects the precision of your measurement — the higher
(lower) the gain value, the lower (higher) the precision. Refer to “How Are
Range, Gain, and Measurement Precision Related?” on page 1-37 for more
information about how input range, gain, and precision are related to each
other.
Page 45

Analog Input Subsystem
An analog input subsystem can typically convert both unipolar signals and
bipolar signals. A unipolar signal contains only positive values and zero,
while a bipolar signal contains positive values, negative values, and zero.
Unipolar and bipolar signals are depicted below. Refer to the figure in
“Quantization” on page 1-24 for an example of a unipolar signal.
In many cases, the signal polarity is a fixed characteristic of the sensor and
you must configure the input range to match this polarity.
As you can see, it is crucial to understand the range of signals expected from
your sensor so that you can configure the input range of the analog input
subsystemtomaximizeresolutionandminimizethechanceofanoverrange
condition.
How Are Acquired Samples Clocked?
Samples are acquired from an analog input subsystem at a specific rate by a
clock. Like any timing system, data acquisition clocks are characterized their
resolution and accuracy. Timing resolution is defined as the smallest time
interval that you can accurately measure. T he timing accuracy is affected by
clock jitter. Jitter arises when a clock produces slightly different values for
a given time interval.
For a ny data acquisition system, there are typically three clock sources that
you can use: the onboard data acquisition clock, the computer clock, or an
1-27
Page 46

1 Introduction to Data Acquisition
external clock. Data Acquisition Toolbox software supports all of these clock
sources, depending on the requirements of your hardware.
Onboard Clock. The onboard clock is typically a timer chip on the hardware
board that is programmed to generate a pulse stream at the desired rate. The
onboard clock generally has high accuracy and low jitter compared to the
computer clock. You should always use the onboard clock when the sampling
rate is high, and when you require a fixed time interval between samples. The
onboard clock is referred to as the internal clock in this guide.
Computer Clock. The computer (PC) clock is used for boards that do not
possess an onboard clock. The computer clock is less accurate and has more
jitter than the onboard clock, and is generally limited to sampling rates below
500 Hz. The computer clock is referred to as the software clock in this guide.
External Clock. An external clock is often used when the sampling rate is
low a nd not constant. For example, an external clock source is often used in
automotive applications where samples are acquired as a function of crank
angle.
1-28
Channel Configuration
You can configure input channels in one of these two ways:
• Differential
• Single-ended
Your choice of input channel configuration might depend on whether the
input signal is floating or grounded.
A floating signal uses a n isolated ground reference and is not connected to the
building ground. A s a result, the input signal and hardware device are not
connected to a common reference, which can caus e the input signal to exceed
the valid range of the hardware device. To circumvent this problem, you must
connect the signal to the onboard ground of the device. Examples of floating
signal sources include ungrounded thermocouples and battery devices.
A grounded signal is connected to the building ground. As a result, the input
signal and hardware device are connected to a comm on reference. Examples of
Page 47

Analog Input Subsystem
grounded signal sources include nonisolated instrument outputs and devices
that are connected to the building power system.
Note For more information about channel configuration, refer to your
hardware documentation.
Differential Inputs
When you configure your hardware for differential input, there are two signal
wires associated with each input signal — one for the input signal and one for
the reference (return) signal. T he measurement is the difference in voltage
between the two wires, which helps reduce noise and any voltage that is
common to both wires.
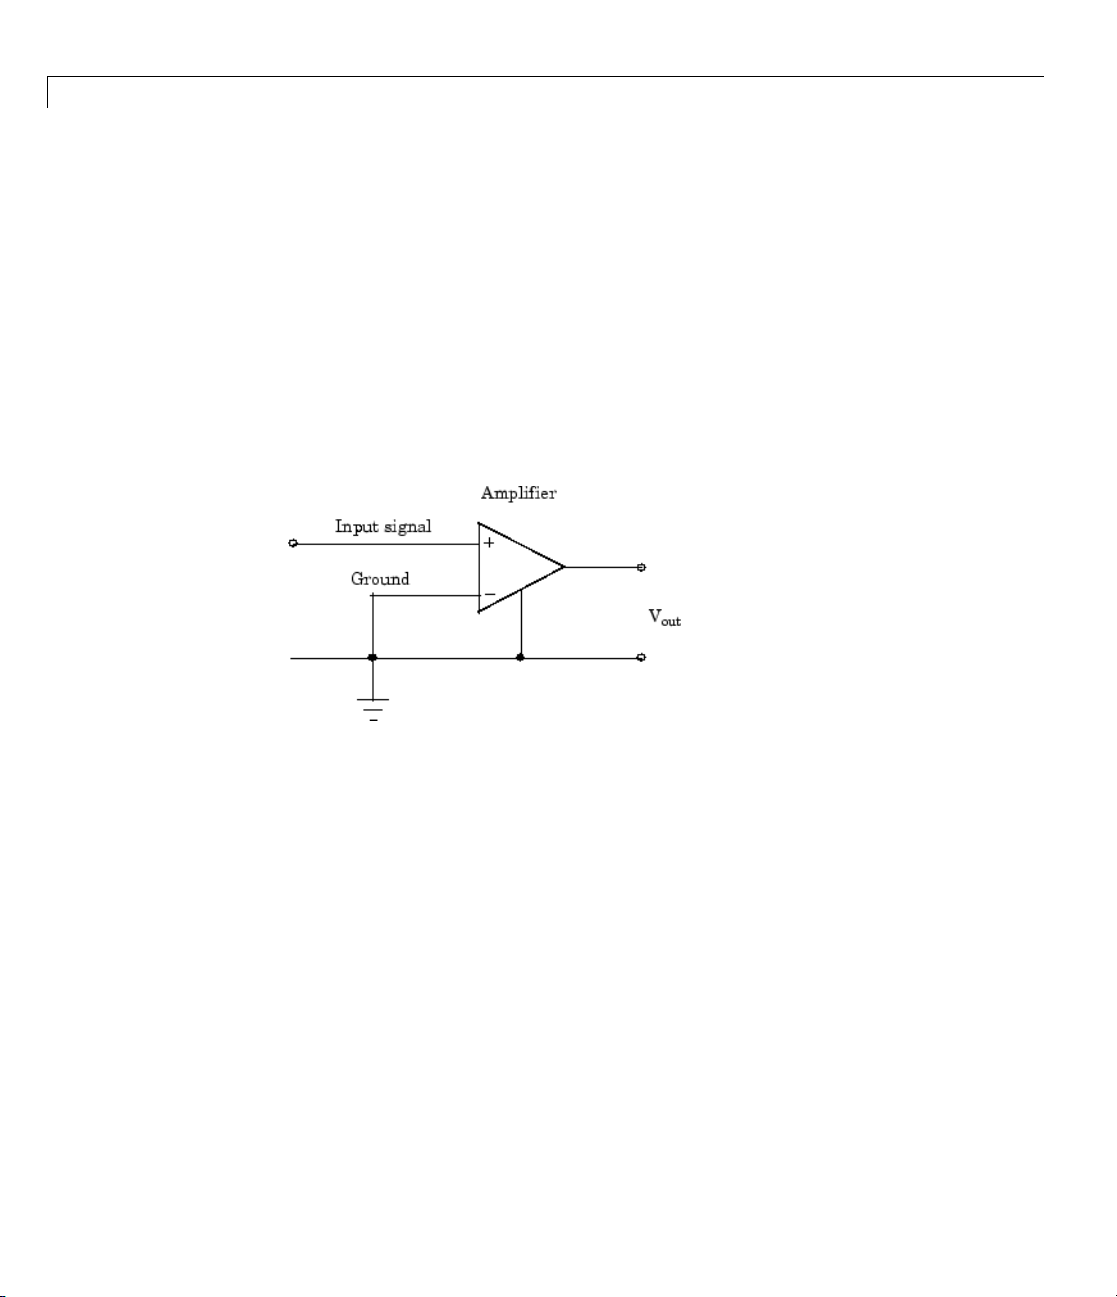
As shown below, the input signal is connected to the positive amplifier socket
(labeled +) and the return signal is connected to the negative amplifier socket
(labeled -). The amplifier has a third connector tha t allows these signals
to be referenced to ground.
National Instruments recommends that you use differential inputs under
any of these conditions:
• The input signal is low level (less than 1 volt).
• The leads connecting the signal are greater than 10 feet.
• The input signal requires a separate ground-reference point or return
signal.
1-29
Page 48
1 Introduction to Data Acquisition
• The signal leads travel through a noisy environment.
Single-Ended Inputs
When you configure your hardware for single-ended input, there is one signal
wire associated with each input signal, and each input signal is connected to
the same ground. Single-ended measurements are more susceptible to noise
than differential measurements because of differences in the signal paths.
As shown below, the input signal is connected to the positive amplifier socket
(labeled +) and the ground is connected to the negative amplifier socket
(labeled -).
1-30
National Instruments suggests that you can use single-ended inputs under
any of these conditions:
• The input signal is high level (greater than 1 volt).
• The leads connecting the signal are less than 10 feet.
• The input signal can share a common reference point with other signals.
You should use differential input connectors for any input signal that do es not
meet the preceding conditions. You can configure many National Instruments
boards for two different types of single-ended connections:
• Referenced single-ended (RSE) connection
The R SE configuration is used for floating signal sources. In this case, the
hardware device itself provides the reference ground for the input signal.
Page 49

Analog Input Subsystem
• Nonreferenced single-ended (NRSE) connection
The NRSE input configuration is used for grounded signal sources. In this
case, the input signal provides its own reference ground and the hardware
device should not supply one.
Refer to your National Instruments hardware documentation for more
information about RSE and NRSE connections.
Transferring Data from Hardware to System Memory
The transfer of acquired data from the hardware to system memory follows
these steps:
1 Acquired data is stored in the hardware’s first-in first-out (FIFO) buffer.
2 Data is transferred from the FIFO buffer to system memory using
interrupts or DMA.
These steps happen automatically. Typically, all that’s required from you is
some initial configuration of the ha r dwaredevicewhenitisinstalled.
FIFO Buffer
The FIFO buffer is used to temporarily store acquired data. The data is
temporarily stored until it can be transferred to system memory. The p rocess
of transferring data into and out of an an a lo g input F IFO buffer is given below:
1 The FIFO buffer stores newly acquired samples at a constant sampling rate.
2 Before the FIFO buffer is filled, the software starts removing the samples.
For example, an interrupt is generated when the FIFO is half full, and
signals the software to extract the samples as quickly as possible.
3 Because servicing interrupts or programming the DMA controller can take
up to a few milliseconds, additional data is stored in the FIFO for future
retrieval. For a larger FIFO buffer, longer latencies can be tolerated.
4 Thesamplesaretransferredtosystemmemoryviathesystembus(for
example, PCI bus or AT bus). After the samples are transferred, the
software is free to perform other tasks until the next interrupt occurs. For
1-31
Page 50

1 Introduction to Data Acquisition
example, the data can be processed or saved to a disk file. As long as the
average rates of storing and extracting data are equal, acquired data will
not be missed and your application should run smoothly.
Interrupts
The slowest but most common method to move acquired data to system
memory is for the board to generate an interrupt request (IRQ) signal. This
signal can be generated when one sample is acquired or when multiple
samples are acquired. The process of transferring data to system memory
viainterruptsisgivenbelow:
1 When data is ready for transfer, the CPU stops whatever it is doing and
runs a special interrupt handler routine that saves the current machine
registers, and then sets them to access the board.
2 The data is extracted from the board and placed into system memory.
3 The saved machine registers are restored, and the CPU returns to the
original interrupted process.
1-32
The actual d ata move is fairly quick, but there is a lot of overhead time
spent saving, setting up, and restoring the register information. Therefore,
depending on your specific system, transferring data by interrupts might not
be a good choice when the sampling rate is greater than around 5 kHz.
DMA
Direct memory access (D MA ) is a system whereby samples are automatically
stored in system memo ry while the processor does something else. The
process of transferring data via DMA is given below:
1 When data is ready for transfer, the board directs the system DMA
controller to put it into in system memory as soon as possible.
2 As soon as the CPU is able (which is usually very quickly), it stops
interacting with the data acquisition hardware and the DMA controller
moves the data directly into memory.
3 TheDMAcontrollergetsreadyforthenextsamplebypointingtothenext
open memory location.
Page 51

Analog Input Subsystem
4 The previous steps are repeated indefinitely, with data going to each open
memory location in a continuously circulating buffer. No interaction
between the CPU and the board is needed.
Your computer supports several different DMA channels. Depending on
your application, you can use one or more of these channels, For example,
simultaneous input and output with a sound card requires one DMA channel
for the input and another DMA channel for the output.
1-33
Page 52
1 Introduction to Data Acquisition
Making Quality M easurements
In this section...
“What Do You Measure?” on page 1-34
“Accuracy and Precision” on page 1-34
“Noise” on page 1-38
“Matching the Sensor Range and A/D Converter Range” on page 1-40
“How Fast Should a Signal Be Sampled?” on page 1-40
What Do You Measure?
For most data acquisition applications , you need to measure the signal
produced by a sensor at a specific rate.
In many cases, the sensor signal is a voltage level that is proportional to
the physical phenomena of interest (for example, temperature, pressure,
or acceleration). If you are measuringslowlychanging(quasi-static)
phenomena like temperature, a slow sampling rate usually suffices. If you are
measuring rapidly changing (dynamic) phenomena like vibration or acoustic
measurements, a fast sampling rate is required.
1-34
To make high-quality measurements, you should follow these rules:
• Maximize the precision and accuracy
• Minimize the noise
• Match the sensor range to the A/D range
Accuracy and Precision
Whenever you acquire measured data, you should make every effort to
maximize its accuracy and precision. The quality of your measurement
depends on the accuracy and precision of the entire data acquisition system,
and can be limited by such factors as board resolution or environmental noise.
In general terms, the accuracy of a measurement determines how close the
measurement comes to the true v alue. Therefore, it indicates the correctness
Page 53

Making Quality Measurements
of the result. The precision of a measurement reflects how exactly the result is
determined without reference to what the result means. The relative precision
indicates the uncertainty in a measurement as a fraction of the result.
For example, suppose you measure a table top with a meter stick and find
its length to be 1.502 meters. This number indicates that the meter stick
(and your eyes) can resolve distances down to at least a millimeter. Under
most circumstances, this is consideredtobeafairlyprecisemeasurement
with a relative precision of around 1/1500. However, suppose you perform
the measurement again and obtain a result of 1.510 meters. After careful
consideration, you discover t h at your initial technique for reading the meter
stick was faulty because you did not read it from directly above. The refore,
the first measurement was not accurate.
Precision and accuracy are illustrated below .
For analog input subsystems, accuracy is usually limited by calibration
errors while precision is usually limited by the A/D converter. Accuracy and
precision are discussed in more d etail below.
1-35
Page 54

1 Introduction to Data Acquisition
Accuracy
Accuracy is defined as the agreement between a measured quantity and the
true value of that quantity. Every component that appears in the analog
signal path affects system accuracy and performance. The overall system
accuracy is given by the component with the worst accuracy.
For data acquisition hardware, accuracy is often expressed as a percent or a
fraction of the least significant bit (L SB). Under ideal circumstances, board
accuracy is typically ±0.5 LSB. Therefore, a 12 bit converter has only 11
usable bits.
Many boards include a programmable gain a mplifier, which is located just
before the converter input. To prevent system accuracy from being degraded,
the accuracy and linearity of the gain must be better than that of the A/D
converter. The specified accuracy of a board is also affected by the sampling
rate and the settling time of the amplifier. The settling time is defined as
the time required for the instrumentationamplifiertosettletoaspecified
accuracy. To maintain full accuracy, the amplifier output must settle to a
level give n by the magnitude of 0.5 LSB before the next conversion, and is on
the order of several tenths of a millisecond for most boards.
1-36
Settling time is a function of sampling rate and gain value. High rate, high
gain configurations require longer settling times while low rate, low gain
configurations require shorter settling times.
Precision
The number of bits used to represent an analog signal determines the
precision (resolution) of the device. The more bits provided by your board, the
more precise your measurement will be. A high precision, high resolution
device divides the input range into more divisions thereby allowing a smaller
detectable voltage value. A low precision, low resolution device divides the
input range into fewer divisions thereby increasing the detectable vol t age
value.
The overall precision of your data acquisition system is usually determined by
the A/D converter, and is specified by the number of bits used to represent
the analog signal. Most boards use 12 or 16 bits. The precision of your
measurement is given by:
Page 55

Making Quality Measurements
precision
= one part in 2
number of bits
The precision in volts is given by:
precision
voltage range
=
2
number of bits
For example, if you are using a 12 bit A/D converter configured for a 10 volt
range, then
volts
precision
10
=
12
2
This means that the converter can detect voltage differences at the level of
0.00244 volts (2.44 mV).
How Are Range, Gain, and Measurement Precision Related?
When you configure the input range and gain of your analog input subsystem,
the end result should maximize the measurement resolution and m inimize
the chance of an overrange condition. The actual input range is given by
the formula:
actual input range
=
input range
gain
The relationship between gain, actual input range, and precision for a
unipolar and bipolar signal having an input range of 10 V is shown below.
1-37
Page 56
1 Introduction to Data Acquisition
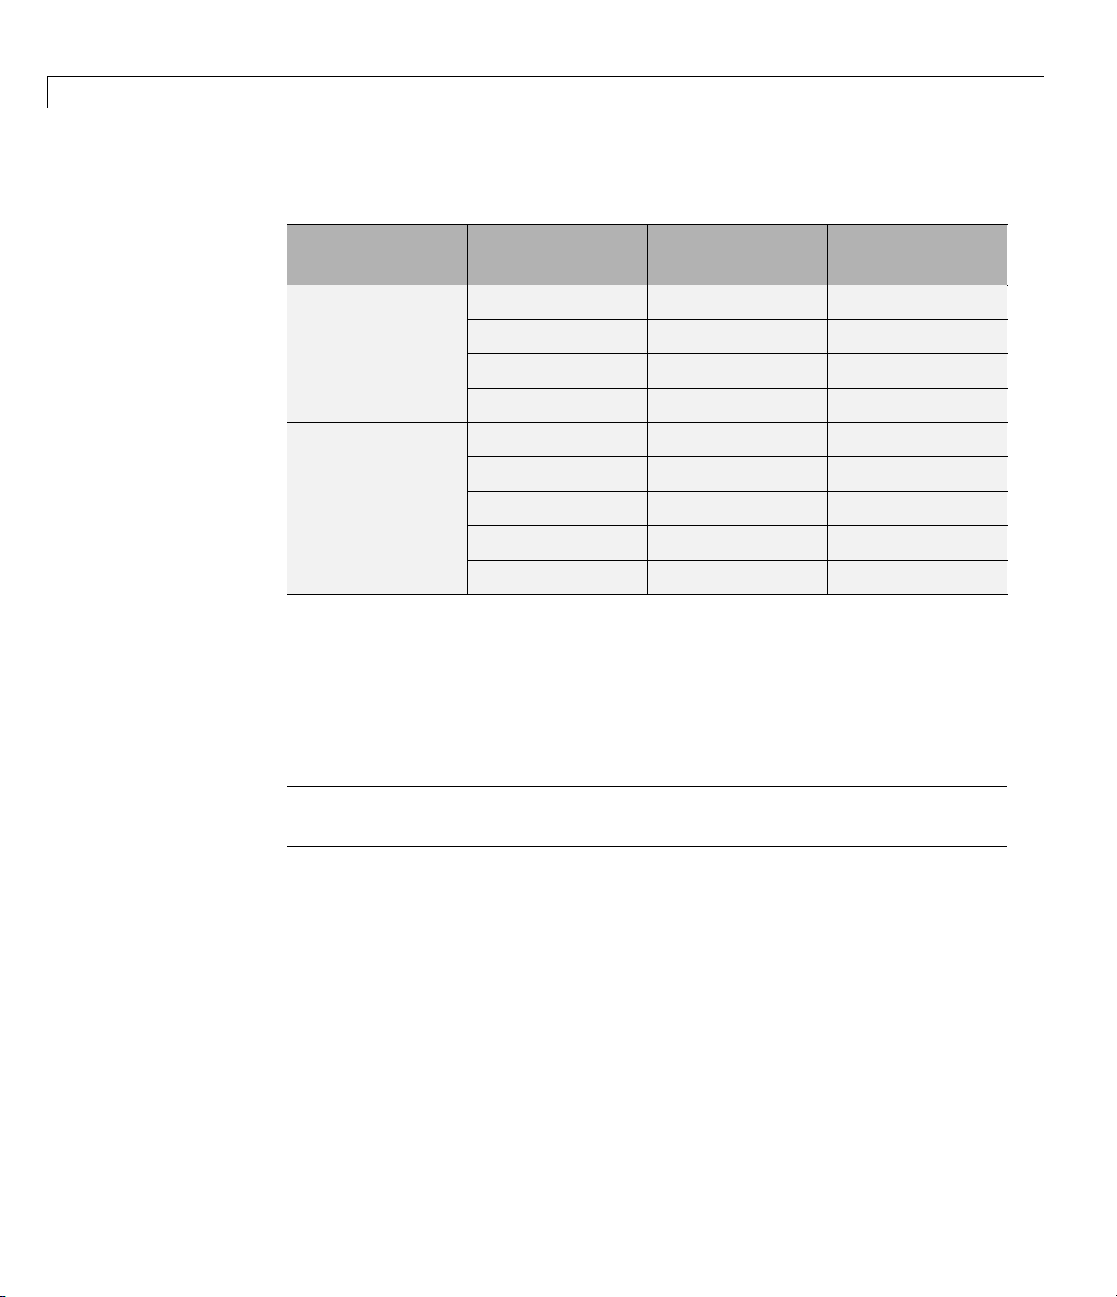
Relationship Between Input Range, Gain, and Precision
Actual Input
Input Range Gain
0to10V
-5 to 5 V
As shown in the table, the gain affects the precision of your measurement.
If yo u select a gain that decreases the actual input range, then the precision
increases. Conversely, if you select a gain that increases the actual input
range, then the precision decreases. This is because the actual input range
varies but the number of bits used by the A/D converter remains fixed.
Note With the Data A cquisition Toolbox s oftware, you do not have to specify
the range and gain. Instead, you simply specify the actual input range desired.
1.0
2.0
5.0
10.0
0.5
1.0
2.0
5.0
10.0
Range
0to10V 2.44mV
0to5V 1.22mV
0to2V 0.488mV
0to1V 0.244mV
-10 to 10 V 4.88 mV
-5 to 5 V 2.44 mV
-2.5 to 2.5 V 1.22 mV
-1.0 to 1.0 V 0.488 mV
-0.5 to 0.5 V 0.244 mV
Precision (12
Bit A/D)
1-38
Noise
Noise is considered to be any measurement that is not part of the phenomena
of interest. Noise can be generated within the electrical com ponents of the
input amplifier (internal noise), or it can be added to the signal as it travels
down the input wires to the amplifier (external noise). Techniques that you
can use to reduce the effects of noise are described below.
Page 57

Making Quality Measurements
Removing Internal Noise
Internal noise arises from thermal effects in the amplifier. Amplifiers
typically generate a few microvolts of internal noise, which limits the
resolution of the signal to this level. The amount of noise added to the signal
depends on the bandwidth of the input amplifier.
To reduce internal noise, you should select an amplifier with a bandwidth
that closely matches the bandwidth of the input signal.
Removing External Noise
External noise arises from many sources. For example, many data acquisition
experiments are subject to 60 Hz noise generated by AC power circuits. This
type of noise is referred to as pick-up or hum, and appears as a sinusoidal
interference signal in the measurement circuit. Another common interference
source is fluorescent lighting. These lightsgenerateanarcattwicethepower
line frequency (120 Hz).
Noise is added to the acquisition circuit from these external sources because
the signal leads act as aerials picking up environmental electrical activity.
Much of this noise is common to both signal wires. To remove m ost of this
common-mode voltage, you should
• Configure the input channels in differential mode. Refer to “Channel
Configuration” on page 1-28 for more information about channel
configuration.
• Use signal wires that are twisted together rather than separate.
• Keep the signal wires as short as possible.
• Keep the signal wires as far away as possible from environmental electrical
activity.
Filtering
Filtering also reduces signal noise . For many data acquisition applications, a
low-pass filter is beneficial. As the name suggests, a low-pass filter passes the
lower frequency components but attenuates the higher frequency components.
The cut-off frequency of the filter must be compatible with the frequencies
present in the signal of interest and the sampling rate used for the A/D
conversion.
1-39
Page 58

1 Introduction to Data Acquisition
A low-pass filter that’s used to prevent higher frequencies from introducing
distortion into the digitized signal is known a s an antialiasing filter if the
cut-off occurs at the Nyquist frequency. That is, the filter removes frequencies
greater than one-ha l f the sampling frequency. These filters generally have
a sharper cut-off than the normal low-pass filter used to condition a signal.
Antialiasing filters are specified according to the sampling rate of the system
and there must be one filter per input signal.
Matching the Sensor Range and A/D Converter Range
When sensor data is digitized by an A/D converter, you must be aware of
these two issues:
• The expected range of the data produced by your sensor. This range
depends on the physical phenomena you are measuring and the output
range of the sensor.
• The range of your A/D converter. For many devices, the hardware range is
specified by the gain and polarity.
1-40
You should select the sensor and hardware ranges such that the maximum
precision is obtained, and the full dynamic range of the input signal is covered.
For example, suppose you are using a microphone with a dynamic range of 20
dB to 140 dB and an output sensitivity of 50 mV/Pa. If you are measuring
street noise in your application, then you might expect that the sound level
never exceeds 80 dB, which corresponds to a sound pressure magnitude of
200 mPa and a voltage output from the microphone of 10 mV. Under these
conditions, you should set the input range of your data acquisition card for a
maximum signal amplitude of 10 mV, or a little more.
How F ast Should a Signal Be Sampled?
Whenever a continuous signal is sampled, some information is lost. The
key objective is to sample at a rate such that the signal of interest is well
characterized and the amount of information lost is minimized.
If you sample at a rate that is too slow, then signal aliasing can o ccur.
Aliasing can occur for both rapidly varying signals and slowly varying signals.
Page 59

Making Quality Measurements
For example, suppose you are measuring temperature once a minute. If your
acquisition system is picking up a 60-Hz hum from an AC power supply, then
that hum will appear as constant noise level i f you are sampling at 30 Hz.
Aliasing occurs when the sampled signal contains frequency components
greater than one-half the sampling rate. The frequency components could
originate from the signal of interest in which case you are undersampling and
should increase the sampling rate. The frequency components could also
originate from noise in which case you might need to condition the signal
using a filter. The rule used to prevent aliasing is given by the Nyquist
theorem,whichstatesthat
• An analog signal can be uniquely reconstructed, without error, from
samples taken at equal time intervals.
• Thesamplingratemustbeequaltoorgreaterthantwicethehighest
frequency component in the analog signal. A frequency of one-half the
sampling rate is called the Nyquist frequency.
However, if your input signal is corrupted by noise, then aliasing can still
occur.
1-41
Page 60

1 Introduction to Data Acquisition
For example, suppose you configure your A/D converter to sample at a rate
of 4 samples per second (4 S/s or 4 Hz), and the signal of interest is a 1 Hz
sine wave. Because the signal frequency is one-fourth the sampling rate, then
according to the Nyquist theorem, it should be completely characterized.
However,ifa5Hzsinewaveisalsopresent,thenthesetwosignalscannot
be distinguished. In other words, the 1 Hz sine wave produces the same
samples as the 5 Hz sine wave when the sampling rate is 4 S/s. This situation
is shown below.
1-42
In a re
signa
Even
of on
with
al-world data acquisition environment, you might need to condition the
l by filtering out the high frequency components.
though the samples appear to represent a sine wave with a frequency
e-fourth the sampling rate, the actual signal could be any sine wave
a frequency of:
n sampling rate±
()
×
025.
()
Page 61

Making Quality Measurements
where n is zero or any positive integer. For this example, the actual signal
could be at a frequency of 3 Hz, 5 Hz, 7 Hz, 9 Hz, and so on. The relationship
0.25
x (Sampling rate) is called the alias of a signal that may be at another
frequency. In other words, aliasing occurs when one frequency assumes the
identity of another frequency.
If you sample the input signal at least twice as fast as the highest frequency
component, then that signal might be uniquely characterized, but this rate
would not mimic the waveform very closely. As shown below, to get an
accurate picture of the waveform, you need a sampling rate of roughly 10
to 20 times the highest frequency.
As shown in the top figure, the low sampling rate produces a sampled signal
that appears to be a triangular waveform. As shown in the bottom figure, a
higher fidelity sampled signal is produced when the sampling rate is higher.
In the latter case, the sampled signal actually looks like a sine wave.
1-43
Page 62

1 Introduction to Data Acquisition
How Can Aliasing Be Eliminated?
The primary considerations involved in antialiasing are the sampling rate
of the A/D converter and the frequencies present in the sampled data. To
eliminate aliasing, you must
• Establish the useful bandwidth of the measurement.
• Select a sensor with sufficient bandwidth.
• Select a low-pass antialiasing analog filter that c an eliminate all
frequencies exceeding this bandwidth.
• Sample the data at a rate at least twice that of the filter’s upper cutoff
frequency.
1-44
Page 63

Getting Command-Line Function Help
To get command-line function help, you should use the daqhelp function. For
example, to get help for the
daqhelp addchannel
Alternatively, you can use the h elp command.
help addchannel
However, the Data Acquisition To olbo x software provides “overloaded”
versions of several MATLAB functions. That is, it provides toolbox-specific
implementations of these function s using the same function name. To
get command-line help for an overloaded toolbox function using the
command, you must supply one of two possible class directories to help:
help daqdevice/function_name
help daqchild/function_name
addchannel function, type
Getting Command-Line Function Help
help
Note that the same help information is returned regardless of the class
directory specified.
For example, the Data Acquisition Toolbox softw are provides an overloaded
version of the
delete function. To obtain help for the MATLAB version
of this function, type
help delete
You can determine if a function is overloaded by examining the last section
of the help. For
delete, the help contains the following overloaded versions
(not all are show n):
Overloaded methods
help char/delete.m
help scribehandle/delete.m
help daqdevice/delete.m
help daqchild/delete.m
So, to obtain help on the toolbox version of this function, type
help daqdevice/delete
1-45
Page 64

1 Introduction to Data Acquisition
Selected Bibliography
[1] Transducer Interfacing Handbook — A Guide to Analog Signal
Conditioning, edited by Daniel H. Sheingold; Analog D evices Inc., Norwood,
MA, 1980.
[2] Bentley, John P., Principles of Measurement Systems, Second Edition;
Longman Scientific and Technical, Harlow, Essex, UK, 1988.
[3] Bevington, Philip R., Data Reduction and Error Analysis for the Physical
Sciences; McGraw-Hill, N ew York, NY, 1969.
[4] Carr, Joseph J., Sensors; Prompt Publications, Indianapolis, IN, 1997.
[5] The Measurement, Instrumentation, and Sensors Handbook,editedby
John G. Webster; CRC Press, Boca Raton, FL, 1999.
[6] PCI-MIO E Series User Manual, January 1997 Edition; Part Number
320945B-01, National Instruments, Austin, TX, 1997.
1-46
Page 65

Using Data Acquisition Toolbox Software
This chapter provides the information you need to get started with Data
Acquisition Toolbox software. The sections are as follows.
• “Installation Information” on page 2-2
• “Toolbox Components” on page 2-4
• “Accessing Your Hardware” on page 2-12
2
• “Understanding the Toolbox Capabilities” o n page 2-19
• “Examining Your Hardware Resources” on page 2-21
• “Getting Help” on page 2-25
Page 66
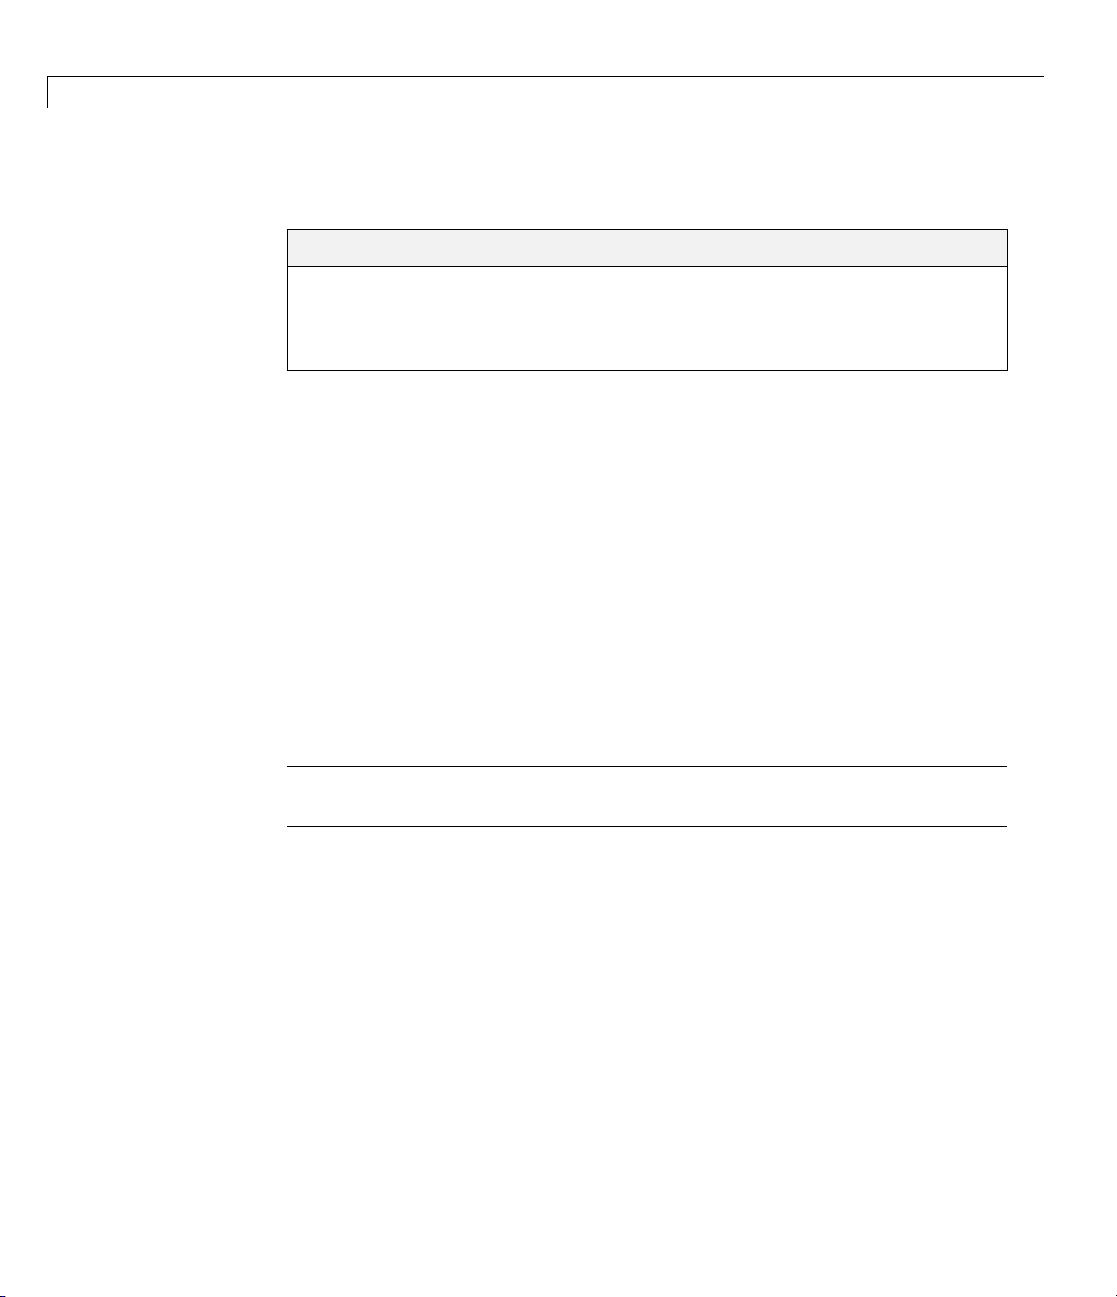
2 Using Data Acquisition Toolbox™ Software
Installation Information
In this section...
“Prerequisites” on page 2-2
“Toolbox Installation” on page 2-2
“Hardware and Driver Installation” on page 2 -3
Prerequisites
To acquire live, measured data into the MATLAB workspace, or to output
data from the MATL AB software, you must install these com ponents:
• MATLAB
• Data Acquisition Toolbox
• A supported data acquisition device (the toolbox page on
theMathWorksWebsitelistsallsupporteddevicesat
http://www.mathworks.com/products/daq/supportedio.html)
2-2
• Software such as drivers and support libraries, as required by your data
acquisition device
Note If you have a hardware that is not supported by Data Acquisition
Toolbox, see “Unsupported Hardware” on page 2-11.
Toolbox Installation
To determine if the Data Acquisition Toolbox software is installed on your
system, type
ver
at the MATLAB prompt. The MATLAB Command Window lists information
about the software versions you are running, including installed add-on
products and their version numbers. Check the list to see if the Data
Acquisition Toolbox product appears. For information about installing the
toolbox, see the MATLAB Installation Guide for your platform.
Page 67

Installation Information
If you experience installation difficulties and have Web access, look for the
license manager and installation information at the MathWorks Web site
(
http://www.mathworks.com).
Hardware and Driver Installation
Installation of your hardware device, hardware drivers, and any other
device-specific software is described in the documentation provided by your
hardware vendor.
Note You need to install all necessary device-specific software provided by
your hardware vendor in addition to the Data Acquisition Toolbox software.
2-3
Page 68
2 Using Data Acquisition Toolbox™ Software
Toolbox Components
In this section...
“Information and Interaction” on page 2-4
“MATLAB Functions” on page 2-6
“Data Acquisition Engine” on page 2-6
“Hardware Driver Adaptor” on page 2-9
“Supported Hardware” on page 2-9
“Unsupported Hardware” on page 2-11
Information and Interaction
The Data Acquisition Toolbox software consists of three distinct components:
• MATLAB functions
2-4
• the data acquisition engine
• hardware driver adaptors
As shown in the figure, these components allow you to pass information
between the MATLAB workspace and your data acquisition hardware.
Page 69

Toolbox Components
The preceding diagram illustrates how information flows from component to
component. Information consists of:
• Property values – You can control the behavior of your data acquisition
application by configuring property values. In general, you can think of a
property as a characteristic of the toolbox or of the hardware driver that
can be manipulated to suit your needs.
2-5
Page 70

2 Using Data Acquisition Toolbox™ Software
• Data – You can acquire data from a sensor connected to an analog input
subsystem and store it in the MATLAB workspace, or output data from
the MATLAB workspace to an actuator connected to an analog output
subsystem. Additionally you can transfer values (1s and 0s) between the
MATLAB workspace and a digital I/O subsystem.
• Events – An event occurs at a particular time after a condition is met
and might result in one or more callbacks that you specify. Events can
be generated only after you configure the associated propertie s. Some
ways you can use events include initiating analysis after a predetermined
amount of data is acquired, or displaying a message to the MATLAB
workspace after an error occurs.
MATLAB Functions
To perform any task with your data acquisition application, you must call
MATLAB functions from the MATLAB environment. Among other things,
these functions allow you to:
• Create device objects, which provide a gateway to your hardware’s
capabilities and allow you to control the behavior of your application.
2-6
• Acquire or output data.
• Configure property values.
• Evaluate your acquisition status and hardware resources.
For a listing of all Data Acquisition Toolbox functions, refer to Chapter 13,
“Functions — Alphabetical List”. You can also display all these functions
by typing
help daq
Data Acquisition Engine
The data acquisition engine (or just engine) is a MEX-file (shared library that
is executable within the MATLAB software) that
• Stores the device objects and associated property values that control your
data acquisition application
• Controls the synchronization of events
Page 71

Toolbox Components
• Controls the storage of acquired or queued data
While the engine performs these tasks, you can use MATLAB for other
tasks such as analyzing acquired data. In other words, the engine and the
MATLAB software are asynchronous. The relationship between acquiring
data, outputting data, and data flow is described next.
Flow of Acquired Data
Acquiring data means that data is flowing from your hardware device into
the data acquisition engine where it is temporarily stored in memory, until
you explicitly extract it using the
If you do not extract this data, and the amount of data stored in memory
reaches the limit for the data acquisition object (see
DataMissed event occurs. At this point, the acquisition stops.
Therateatwhichtheacquisitionstopsdepends on several factors including
the available memory, the rate at which data is acquired, and the number of
hardware channels from which data is acquired.
getdata function.
daqmem(obj)), a
The flow of acquired data consists of these two independent steps:
1 Data acquired from the hardware is stored in the engine.
2 Data is extracted from the engine and stored in the MATLAB workspace,
or output to a disk file.
These two steps are illustrated below.
2-7
Page 72
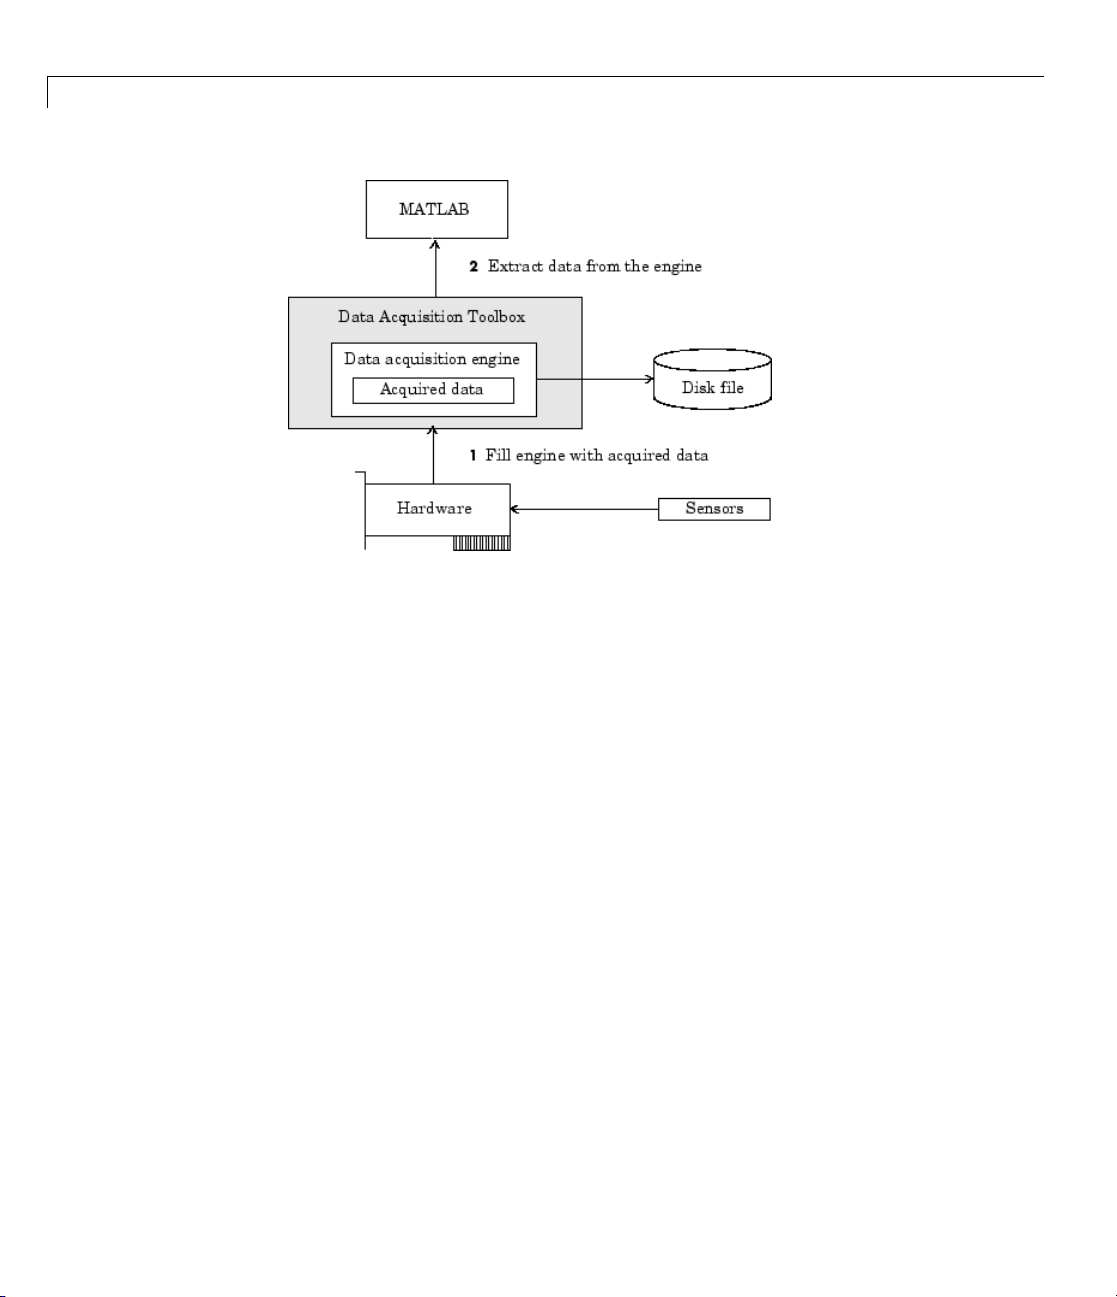
2 Using Data Acquisition Toolbox™ Software
Flow of Output Data
Outputting data means that data is flowing from the data acquisition engine
to the hardware device. However, before data is output, you must queue it in
theenginewiththe
depends on several factors including the available memory, the number of
hardware channels to which data is output, and the size of each data sample.
putdata function. The amount of data that you can queue
2-8
The flow of output data consists of these two independent steps:
1 Data from the MATLAB workspace is queued in the engine.
2 Data queued in the engine is output to the hardware.
These two steps are illustrated below.
Page 73

Toolbox Components
Hardware Driver Adaptor
The hardware driver adaptor (or adaptor) is the interface between the data
acquisitionengineandthehardwaredriver. Theadaptor’smainpurposeisto
pass information between MATLAB and your hardware device via its driver.
Hardware drivers are provided by your device vendor. For e xample, to acquire
data using a National Instruments board, the appropriate version of the
NI-DAQ driver must be installed on your platform. For further information
about NI-DAQmx and Traditional NI-DAQ drivers, see “NI-DAQmx Versus
Traditional NI-DAQ Drivers” on page A-7. Hardware drivers are not installed
as part of the toolbox with the exception of a special parallel port driver
that allows access to the port’s protected memory addresses. Additionally, a
suitable driver is usually installed on PCs that are equipped with a sound
card. For the remaining supported devices, the drivers must be installed.
Supported Hardware
You can obtain most adaptors either from the MathWorks or
from the device vendors. Se e the supported hardware page at
www.mathworks.com/products/daq/supportedio.html for a list of vendors
whose hardware the toolbox supports, and for information about how to
2-9
Page 74

2 Using Data Acquisition Toolbox™ Software
obtain an adaptor. The toolbox provides the following adaptors. The name
of the vendor or device is also listed in the table.
Adaptor Provided by the Data Acquisition Device
Vendor or Device Adaptor Name
Advantech
Measurement Computing
National Instruments
NI-DAQmx adaptors
National Instruments
Traditional NI-DAQ
adaptors
Parallel port
Windows sound cards
advantech
mcc
nidaq
nidaq
parallel
winsound
2-10
Notes The Traditional NI-DAQ adaptor will be deprecated in a future version
of the toolbox. If you create a Data Acquisition Toolbox™ object for Traditional
NI-DAQ adaptor beginning in R2008b, you will receive a warning stating
that this adaptor will be removed in a future release. See the supported
hardware page at
www.mathworks.com/products/daq/supportedio.html
for more information.
The Parallel adaptor will be deprecated in a future version of the
toolbox. If you create a Data Acquisition Toolbox™ o bject for
'parallel'
beginning in R2008b, you will receive a warning stating that this adaptor
will be removed in a future release. See the supported hardware page
at
www.mathworks.com/products/daq/supportedio.html for more
information.
Page 75

Toolbox Components
Note Additional vendors not in this table are listed in the supported
hardware page at
www.mathworks.com/products/daq/supportedio.html.
This page contains a comprehensive list of vendors whose hardware the
toolbox supports, and it provides information on how to obtain an adaptor.
As described in “Examining Your Hardware Resources” on page 2-21, you can
list the installed adaptor names with the
daqhwinfo function.
Unsupported Hardware
Refer to the supported hardware page for Data Acquisition Toolbox software
at
www.mathworks.com/products/daq/supportedio.html for the list of
vendors whose hardware the toolbox supports, and for information about how
to obtain an adaptor. If the device you are using is not listed on this page, you
candooneofthefollowing:
• Contact the device vendor to request them to develop an interface
to the toolbox. Refer them to the s upported hardware page at
www.mathworks.com/products/daq/supportedio.html for a list of
currently supported hardware and for information about contacting The
MathWorks.
• Search for your device on The MathWorks support page at
www.mathworks.com/support/ to see if a solution is listed for using your
unsupported device. Such solutions are typically available for devices that
the next Data Acquisition Toolbox release will support.
• Create the interface yourself. To interface unsupported hardware devices
to the toolbox, use the Data Acquisition Toolbox Adaptor Kit installed with
the toolbox. For more information about the adaptor kit, read the Data
Acquisition Toolbox Adaptor Kit User’s Guide.
• Hire a consultant to write the interface or a systems integrator
to build the system. For a potential list of consultants or systems
integrators, go to the Third Party Products and Services page at
www.mathworks.com/connections.
• Consider using hardware that the toolbox already supports.
2-11
Page 76

2 Using Data Acquisition Toolbox™ Software
Accessing Your Hardware
In this section...
“Connecting to Your Hardware” on page 2-12
“Acquiring Data” on page 2-12
“Outputting Data” o n page 2-13
“Reading and Writing Digital Values” on page 2-14
“Acquiring Data in a Loop” on page 2-17
Connecting to Your Hardware
Perhaps the most effective way to get started with Data Acquisition Toolbox
software is to connect to your hardware, and input or output data.
Each example illustrates a typical data acquisition session.Thedata
acquisition session comprises all the steps you are likely to take when
acquiring or outputting data using a supported hardware device. You should
keep these steps in mind when constructing your own data acquisition
applications.
2-12
Note that the analog input and analog output examples use a sound card,
while the digital I/O example uses a National Instruments PCI-6024E board.
If you are using a different supported hardware device, you should modify the
adaptor name and the device ID supplied to the creation function as needed.
If you want detailed information about any functions that are used, refer to
Chapter 13, “Functions — Alphabetical List”. If you want detailed information
about any properties that are used, refer to Chapter 15, “Base Properties
— Alphabetical List”.
Acquiring Data
If you have a sound card installed, you can run the following example, which
acquires 1 second of data from two analog input hardware channels, and
then plots the acquired data.
Page 77

Accessing Your Hardware
You should modify this example to suit your specific application needs. If
you want detailed inform ation about acquiring data, refer to Doing More
with Analog Input.
1 Create a device object — Create the analog input object ai for a sound
card.
ai = analoginput('winsound');
2 Add channels — Add two hardware channels to ai.
addchannel(ai,1:2);
3 Configure property values — Configure the sampling rate to 44.1 kHz
and collect 1 second of data (44,100 samples) for each channel.
set(ai,'SampleRate',44100)
set(ai,'SamplesPerTrigger',44100)
4 Acquire data — Start the acquisition and issue wait to block the
MATLAB Command Window until all data is acquired. When all the data
is acquired,
wait returns and the data is then available to getdata.
start(ai)
wait(ai,2)
data = getdata(ai);
plot(data)
5 Clean up — When you no longer need ai, you should remove it from
memory and from the MATLAB workspace.
delete(ai)
clear ai
Outputting D
If you have a
outputs 1 se
You should
you want de
“Analog Ou
cond of data to two analog output hardware channels.
modify this example to suit your specific application needs. If
tailed information about outputting data, refer to Chapter 6,
tput”.
ata
sound card installed, you can run the following example, which
2-13
Page 78

2 Using Data Acquisition Toolbox™ Software
1 Create a device object — Create the analog output object ao for a sound
card.
ao = analogoutput('winsound');
2 Add channels — Add two hardware channels to ao.
addchannel(ao,1:2);
3 Configure property values — Configure the sampling rate to 44.1 kHz
for each channel.
set(ao,'SampleRate',44100)
4 Output data — Create 1 second of output data, and queue the data in
the engine for eventual output to the analog output subsystem. You must
queue one column of data for each hardware channel added.
data = sin(linspace(0,2*pi*500,44100)');
putdata(ao,[data data])
2-14
Start the output. When all the data is output, ao automatically stops
executing.
start(ao)
5 Clean up — When you no longer need ao, you should remove it from
memory and from the MATLAB workspace.
delete(ao)
clear ao
Reading and Writing Digital Values
If you have a supported National Instruments board with at least two digital
I/O ports, you can run the following example, which writes and reads digital
values.
You sho uld modify this example to suit your specific application needs. Adjust
the example if the ports on your device do not support the input/output
directions specified here.
Page 79

Accessing Your Hardware
If you want detailed information about reading and writing digital values,
refer to Digital Input/Output.
1 Create a device object — Create the digital I/O object dio for a National
Instruments U SB -6212 board with hardware ID Dev1.
dio = digitalio('nidaq','Dev1');
2 Add output lines — Add four lines from port 0 to dio, and configure
them for output.
addline(dio,0:3, 0,'out');
3 Add input lines — Add two lines from port 1 to dio, and configure them
for input.
addline(dio,0:1, 1,'in');
To display a summary of the digital I/O object, type:
dio
%display returns the following
Display Summary of DigitalIO (DIO) Object Using 'USB-6212'.
Port Parameters: Port 0 is port configurable for reading and writing.
Port 1 is port configurable for reading and writing.
Port 2 is port configurable for reading and writing.
Engine status: Engine not required.
DIO object contains line(s):
Index: LineName: HwLine: Port: Direction:
1 '' 0 0 'Out'
2 '' 1 0 'Out'
3 '' 2 0 'Out'
4 '' 3 0 'Out'
5 '' 0 1 'In'
6 '' 1 1 'In'
2-15
Page 80

2 Using Data Acquisition Toolbox™ Software
4 Write values — Create an array of output values, and write the values to
the digital I/O subsystem. Note that reading and writing digital I/O line
values typically does not require that you configure specific property values.
pval = [1 1 0 1];
putvalue(dio.Line(1:4),pval)
5 Read values— To read only the input lines, type:
gval = getvalue(dio.Line(5:6))
%input lines values displayed
gval =
00
To read both input and output lines, type:
gval = getvalue(dio)
%input and output lines va lue s displayed
gval =
110100
2-16
When you read output lines getvalue returns the most recently output
value set by
6 Clean up — When you no longer need dio, you should remove it from
putvalue.
memory and from the MATLAB workspace.
delete(dio)
clear dio
Note Digital line values are usually not transferred at a specific rate.
Although some specialized boards support clocked I/O, the Data Acquisition
Toolbox software does not support this functionality.
Page 81

Accessing Your Hardware
Acquiring Data in a Loop
To make multiple acquisitions using a single analog input object, create a
single object and execute the acquisition in a loop. Delete the object at the
end of the loop.
% Create the object outside of the loop.
ai = analoginput('nidaq', 'Dev1');
addchannel(ai, 0);
% Execute acquisition.
for ii = 1:num_iterations
start(ai);
wait(ai, 2)
data = getdata(ai);
plot(data);
end
% Delete the object out of the loop.
delete(ai)
clear ai
If you are creating the object within the loop, you must delete the object
within the loop as well.
% Execute acquisition.
for ii = 1:num_iterations
% Create the object within the loop.
ai = analoginput('nidaq', 'Dev1');
addchannel(ai, 0);
start(ai);
wait(ai, 2)
data = getdata(ai);
plot(data);
% Delete the object within the loop.
delete(ai)
end
clear ai
Note Make sure you delete the object within the loop as it can consume
system resources.
2-17
Page 82

2 Using Data Acquisition Toolbox™ Software
For more information about cleaning up the MATLAB workspace, refer to
Cleaning Up.
2-18
Page 83
Understanding the Toolbox Capabilities
In this section...
“Contents File” on page 2-19
“Documentation Examples” on page 2-19
“Quick Reference Guide” on page 2-20
“Demos” on page 2-20
Contents File
The Contents file lists the toolbox functions and demos. You can display
this information by typing:
help daq
Documentation Examples
This guide provides detailed examples that show you how to acquire or output
data. These examples are collected in the index.
Understanding the Toolbox Capabilities
Some examples are constructed as mini-applications that illustrate one or
two important features of the toolbox and serve as templates so you can see
how to build applications that suit your specific needs. These examples are
included as to olbo x files and are treated as demos. You can list all Data
Acquisition Toolbox demos by typing
help daqdemos
All documentation e xample files begin with daqdoc. To run an example,
type the file name at the command line. Note that most analog input (AI)
and analog output (AO) examples are written for sound cards. To use these
examples with your hardware device, you should modify the adaptor name
and the device ID supplied to the creation function as needed.
Additionally, most documentation examples are written for clocked
subsystems. However, some supported hardware devices—particularly
Measurement Computing devices—do not possess onboard clocks. If the AI or
AO subsystem of your hardware device does not have an onboard clock, then
these examples will not work. To use the documentation examples, you can:
2-19
Page 84

2 Using Data Acquisition Toolbox™ Software
• Input single values using the getsampl e function, or output single values
using the
putsample function.
• Configure the
ClockSource property to Software.
Quick Reference Guide
The Quick Reference Guide provides an overview of the toolbox capabilities,
functions, and properties. You might find it useful to print this guide and
keep it handy when using the toolbox. You can access this guide through
the Help browser.
Demos
The toolbox includes a large collection of tutorial demos, which you can access
through the Help browser Demos pane. Use the following command to open
the Help browser to the toolbox demos:
demo toolbox 'Data Acquisition'
Note that the analog input and analog output tutorials require that you have
a sound card installed. The digital I/O tutorials require that you have a
supported National Instruments board with digital I/O capabilities.
2-20
Page 85

Examining Your Hardware Resources
In this section...
“Using the daqhwinfo Function” on page 2-21
“General Toolbox Information” o n page 2-21
“Adaptor-Specific Information” on page 2-22
“Device Object Information” on page 2-23
Using the daqhwinfo Function
You can examine the data acquisition hardware resources visible to the
toolbox with the
boards, hardware drivers, and adaptors. The information returned by
daqhwinfo depends on t h e supplied arguments, and is divided into three
categories described in this section.
If you configure hardware parameters using a vendor tool such as N ational
Instruments Measurement and Automation Explorer or Measurement
Computing InstaCal,
For example, if you configure your Measurement Computing device for 16
single-ended channels using InstaCal,
However, the toolbox does not preserve configuration information that is
not directly associated with your hardware. For example, channel name
information is not preserved. Refer to Appendix A, “Troubleshooting Your
Hardware” for more information about using vendor tools.
daqhwinfo function. H ard w are resources include in sta lled
daqhwinfo will return this configuration information.
daqhwinfo returns this configuration.
Examining Your Hardware Resources
General Toolbox Information
To display general information about the toolbox, enter:
out = daqhwinfo
out =
ToolboxName: 'Data Acquisition Toolbox'
ToolboxVersion: '2.2 (R13)'
MATLABVersion: '6.5 (R13)'
InstalledAdaptors: {4x1 cell}
2-21
Page 86

2 Using Data Acquisition Toolbox™ Software
The InstalledAdaptors field lists the hardware driver adaptors installed on
your system. To display the installed adaptors, enter:
out.InstalledAdaptors
ans =
'mcc'
'nidaq'
'parallel'
'winsound'
This information tells you that an adaptor is available for Measurement
Computing and National Instruments devices, parallel ports, a nd sound cards.
Notes The list of installed adaptors might differ for your platform. Toolbox
adaptors are available to you only if the associated hardware driver is
installed.
The Traditional NI-DAQ adaptor will be deprecated in a future version of the
toolbox. If you create a Data Acquisition Toolbox™ object for Traditional
NI-DAQ adaptor beginning in R2008b, you will receive a warning stating that
this adaptor will be remo ved in a future release.
2-22
The Parallel adaptor will be deprecated in a future version of the
toolbox. If you create a Data Acquisition Toolbox™ o bject for
'parallel'
beginning in R2008b, you will receive a warning stating that this adaptor
will be removed in a future release. See the supported hardware page
at
www.mathworks.com/products/daq/supportedio.html for more
information.
Adaptor-Specific Information
To display hardware information for a particular vendor, you must supply
the adaptor name as an argument to
and adaptor names are given in Hardware Driver Adaptor. For example, to
display hardware information for the
out = daqhwinfo('winsound')
out =
AdaptorDllName: 'd:\v6\toolbox\daq\daq\private\mwwinsou nd.dll'
daqhwinfo. The supported vendors
winsound adaptor, enter:
Page 87

Examining Your Hardware Resources
AdaptorDllVersion: 'Version 2.2 (R13) 01-Jul-2002'
AdaptorName: 'winsound'
BoardNames: {'AudioPCI Record'}
InstalledBoardIds: {'0'}
ObjectConstructorName:{'analoginput('winsound',0)'[1x26 char]}
The ObjectConstructorName field lists the subsystems supported by the
installed sound cards, and the syntax for creating a device object associated
with a given subsystem. To display the device object constructor names
available for the AudioPCI Record board, enter:
out.ObjectConstructorName(:)
ans =
'analoginput('winsound',0)'
'analogoutput('winsound',0)'
This information tells you that the sound card supports analog input and
analog output objects. To create an analog input object for the sound card,
enter:
ai = analoginput('winsound');
To create an analog output object for the sound card, enter:
ao = analogoutput('winsound');
Device Object Information
To display hardware information for a specific device object, you supply the
device object as an argument to
analog input object
ai created in the “Adaptor-Specific Information” on page
2-22 section is given below.
out = daqhwinfo(ai)
out =
AdaptorName: 'winsound'
DeviceName: 'AudioPCI Record'
DifferentialIDs: []
daqhwinfo. The hardware information for the
Bits: 16
Coupling: {'AC Coupled'}
Gains: []
ID: '0'
2-23
Page 88

2 Using Data Acquisition Toolbox™ Software
VendorDriverDescription: 'Windows Multimedia Driver'
VendorDriverVersion: '5.0'
Among other things, this information tells you that the minimum sampling
rate is 8 kHz, the maximum sampling rate is 44.1 kHz, and there a re two
hardware channels that you can add to the analog input object.
Alternatively, you can return hardware information via the Workspace
browser by right-cli cking a device object, and selecting Explore > Display
Hardware Info from the context menu.
InputRanges: [-1 1]
MaxSampleRate: 44100
MinSampleRate: 8000
NativeDataType: 'int16'
Polarity: {'Bipolar'}
SampleType: 'SimultaneousSample'
SingleEndedIDs: [1 2]
SubsystemType: 'AnalogInput'
TotalChannels: 2
2-24
Page 89

Getting Help
Getting Help
In this section...
“The daqhelp Function” on page 2-25
“The propinfo Function” on page 2-25
The daqhelp Function
You can use the daqhelp function to:
• Display help for functions and properties.
• List all the functions and properties associated with a specific device object
A device object nee d not exist for you to obtain this information. For e xample,
to display all the functions and properties associated with an analog input
object, as well as the constructor help, enter:
daqhelp analoginput
To display help for the Samp leRa te property
daqhelp SampleRate
You can also display help for an existing dev ice object. For example, to display
help for the
with a sound card
ai = analoginput('winsound');
out = daqhelp(ai,'BitsPerSample');
Alternatively, you can display help via the Workspace browser by
right-clicking a device object, and selecting Explore > DAQ Help from the
context menu.
BitsPerSample property for an analog input object associated
The propinfo Function
You can use the propinfo function to return the characteristics of toolbox
properties. For example, you can find the default value for any property using
this function.
propinfo returns a structure containing the following fields:
2-25
Page 90

2 Using Data Acquisition Toolbox™ Software
propinfo Fields
Field Name Description
Type
Constraint
ConstraintValue
DefaultValue
ReadOnly
DeviceSpecific
The property data type. Possible values are callback,
any, double,andstring.
The type of constraint on the property value. Possible
values are
callback, bounded, enum,andnone.
The property value constraint. The constraint can be a
range of valid values or a list of valid string values.
The property default value.
Indicates when the property is read-only. Possible
values are
always, never,andwhileRunning.
If the property is device-specific, a 1 is returned. If a
0 is returned, the property is supported for all device
objects of a given type.
2-26
For example, to return the characteristics for all the properties associated
with the analog input object
ai created in the “The daqhelp Function” on
page 2-25 section, enter:
AIinfo = propinfo(ai);
The characteristics for the TriggerType property are displayed below.
AIinfo.TriggerType
ans =
Type: 'string'
Constraint: 'enum'
ConstraintValue: {'Manual' 'Immediate' 'Software'}
DefaultValue: 'Immediate'
ReadOnly: 'whileRunning'
DeviceSpecific: 0
Page 91

This information tells you that:
• The property value data type is a string.
• The property value is constrained as an enumerated list of values.
Getting Help
• The three possible property values are
• Thedefaultvalueis
Immediate.
Manual, I mmediate,andSoftware.
• The property is read-only while the device object is running.
• The property is supported for all analog input objects.
2-27
Page 92

2 Using Data Acquisition Toolbox™ Software
2-28
Page 93

Data Acquisition Session
The data acquisition session consists of all the steps you are like ly to take
when acquiring or outputting data. These steps are described in the following
sections.
• “Understanding the Data Acquisition Session” on page 3-2
• “Creating a Device Object” on page 3-6
• “Hardware Channels or Lines” on page 3-10
• “Configuring and Returning Properties” on page 3-14
3
• “Acquiring and Outputting Data” on page 3-24
• “Cleaning Up” on page 3-28
Page 94
3 Data Acquisition Session
Understanding the Data Acquisition Session
In this section...
“Overview” on page 3-2
“Real-Time Data Acquisition” on page 3-3
“Example: The Data Acquisition Session” on page 3-4
Overview
The data acquisition session consists of all the steps you are like ly to take
when acquiring or outputting data. These steps are
1 Create a device object — You create a device object using the
analoginput, analogoutput,ordigitalio creation function. Device
objects are the basic toolbox elements you use to access your hardware
device.
3-2
2 Add channels or lines — After a device object is created, you must add
channels or lines to it. Channels are added to analog input and analog
output objects, while lines are added to digital I/O objects. Channels and
lines are the basic hardware device elements with which you acquire or
output data.
3 Config
assig
You can configure many of the properties at any time. However, some
properties are configurable only when the device object is not running.
Conversely, depending on your hardware settings and the requirements of
your application, you might be able to accept the default property values
andskipthisstep.
4 Queue data (analog output only) — Before you can output analog data,
you must queue it in the engine with the
5 Sta
mu
ou
ure properties — To establish the device object behavior, you
n values to properties using the
rt acquisition or output of data — To acquire or output data, you
st execute the device object with the
tput occurs in the background, while MATLAB continues executing. You
set function or dot notation.
putdata function.
start function. Acquisition and
Page 95

Understanding the Data A cquisition Session
can e xecute other MATLAB commands while the acquisition is occurring,
and then wait for the acquisition or output to complete.
6 Wait for the acquisition or output to complete — You can continue
working in the MATLAB workspace while the toolbox is acquiring or
outputting data. (For more information,seeChapter5,“DoingMorewith
Analog Input”.) However, in many cases, you simply want to wait for the
acquisition or output to complete before continuing. Use the
wait function
to pause MATLAB until the acquisition is complete.
7 Extract your acquired data (analog input only) — After data is acquired,
you must extract it from the engine with the
8 Clean up — When you no longer need the device object, you should
remove it from memory using the
MATLAB workspace using the
delete function, and remove it from the
clear command.
getdata function.
The data acquisition session is used in many of the do cumentation examples
included in this guide. Note that the f ourth step is treated differently for
digital I/O objects because they do not store data in the engine. Therefore,
only analog input and analog output objects are discussed in this section.
Real-Time Data Acquisition
Because it is operating on a consumer operating system, the Data Acquisition
Toolbox cannot ensure response to an event within a specified maximum time
limit. In order to ensure a high throughput of the acquisition, the toolbox
manages acquired data in blocks, which increases the latency associated with
any given acquired data point. In addition, it must share system resources
with other applications and drivers on the system.
If you want to create a control loop with the least latency, and do not require a
deterministic response time, you can perform single point operations using
getsample and putsample. In this case, the data is acquired and processed as
follows:
1 Data is acquired through your hardware vendor’s software.
2 The data is then handed off to the Data Acquisition Toolbox engine.
3 The toolbox makes the data available in MATLAB or Simulink.
3-3
Page 96

3 Data Acquisition Session
4 The data is run through the control algorithm that you develop in MATLAB
or Simulink.
5 Thedataisthenroutedbacktotheengine,throughthehardwarevendor’s
software, and onto the board.
This still does not guarantee the response time of a control loop. A higher
priority thread can take precedence over the control loop.
Most PC based data acquisition cards provide an internal, high accuracy clock
that is used to pace data acquisition. Th ecardsstorethedatatheycollectin
local memory, and then transfer the samples to main c ompute r memory (using
interrupts or DMA). The timing of samples acquired this way is extremely
accurate, and these cards can guarantee that the acquired data was obtained
at the requested sample rate, and that no samples were dropped. The
maximum sampling rate is governed by the data acquisition card, not the PC.
For true real-time closed loop control with MATLAB, consider some of these
other MathWorks products:
3-4
• Real-Time Workshop
• Real-Time Windows Target for Real-Time Workshop
• xPC Target
Example: The Data Acquisition Session
This example illustrates the basic steps you take during a data acquisition
session using an analog input object. You can run this example by typing
daqdoc3_1 at the MATLAB Command Window.
1 Create a device object — Create the analog input object AI for a sound
card. The installed adaptors and hardware IDs are found with
AI = analoginput('winsound');
%AI = analoginput('nidaq','Dev1');
%AI = analoginput('mcc',1);
2 Add channels — Add two channels to AI.
addchannel(AI,1:2);
daqhwinfo.
Page 97

Understanding the Data A cquisition Session
%addchannel(AI,0:1); % For NI and MCC
3 Configure property values — Configure the sampling rate to 11.025 kHz
and define a 2 second acquisition.
set(AI,'SampleRate',11025)
set(AI,'SamplesPerTrigger',22050)
4 Start acquisition —Beforethestart function is issued, you might want
to begin inputting data from a microphone or a CD player.
start(AI)
5 Wait for the acquisition or output to complete — Pause MATLAB
until either the acquisition completesor3secondshaveelapsed(whichever
comes first). If 3 seconds elapse, an error occurs.
wait(AI,3);
6 Extract the acquired data from the engine and plot results
data = getdata(AI);
Plot the data and label the figure axes.
plot(data)
xlabel('Samples')
ylabel('Signal (Volts)')
7 Clean up — When you no longer need AI, you should remove it from
memory and from the MATLAB workspace.
delete(AI)
clear AI
3-5
Page 98
3 Data Acquisition Session
Creating a Device Object
In this section...
“Understanding Device Objects” on page 3-6
“Creating an Array of Device Objects” on page 3-7
“Where Do Device Objects Exist?” on page 3-8
Understanding Device Objects
Device objects are the toolbox components you use to access your hardware
device. They provide a gateway to the functionality of your hardware, and
allow you to control the behavior of your data acquisition application. Each
device object is associated with a specific hardware subsystem .
To create a device object, you call functions called object creation functions
(or object constructors). These functions are implemented using the
object-oriented programming capabilities provided by the MATLAB software,
which are described in the chapters “Classes (Data Types)” and “Using
Objects” in the MATLAB Programming Fundamentals documentation. The
device object creation functions are listed below.
3-6
Device Object Creation Functions
on
Functi
ginput
analo
ogoutput
anal
talio
digi
Before you can create a device object, the associated hardware driver adaptor
must be registered. Adaptor registration occurs automatically. However, if for
some reason an adaptor is not automatically registered, then you must do so
manually with the
Driver Adaptor” on page A-19 for more information.
You can find out how to create device objects for a particular vendor and
subsystem with the
daqregister function. Refer to “Registering the Hardware
ObjectConstructorName field of the daqhwinfo function.
Descri
Creat
Crea
Crea
ption
e an analog input object.
te an analog output object.
te a digital I/O object.
Page 99

Creating a Device Object
For example, to find out how to create an analog input object for an installed
National Instruments board, you supply the appropriate adaptor name to
daqhwinfo.
out = daqhwinfo('nidaq');
out.ObjectConstructorName(:)
ans =
'analoginput('nidaq','Dev1')'
'analogoutput('nidaq','Dev1')'
'digitalio('nidaq','Dev1')'
The constructor syntax tells you that you must supply the adaptor name and
the hardware ID to the
ai = analoginput('nidaq','Dev1');
analoginput function
The association between device objects and hardware subsystems is shown
below.
Creating an Array of Device Objects
In the MATLAB workspace, you can create an array from existing variables
by concatenating those variables together. The same is true for device objects.
For example, suppose you create the analog input object
output object
ao for a sound card:
ai and the analog
3-7
Page 100

3 Data Acquisition Session
ai = analoginput('winsound');
ao = analogoutput('winsound');
You can now create a device object array consisting of ai and ao using the
usual MATLAB syntax. To create the row array
x=[aiao]
Index: Subsyste m: Name:
1 Analog Input winsound0-AI
2 Analog Output winsound0-AO
x:
To create the column array y:
y = [ai;ao];
Note that you cannot create a matrix of device objects. For example, you
cannot create the matrix
3-8
z = [ai ao;ai ao];
??? Error using ==> analog inp ut/vertcat
Only a row or column vector of device objects can be created.
Depending on your application, you might want to pass an array of device
objects to a function. For example, using one call to the
configure b oth
set(x,'SampleRate',44100)
ai and ao to the same property value.
set function, you can
Refer to Chapter 13, “Functions — Alphabetical List” to see which functions
accept a device object array as an input argument.
Where Do Device Objects Exist?
When you create a device object, it exists in b oth the MATLAB workspace and
the data acquisition engine. For example, suppose you create the analog input
object
ai for a sound card and then make a copy of ai.
ai = analoginput('winsound');
newai = ai;
 Loading...