

Page 1

Bioinformatics Toolbox™ 3
User’s Guide
Page 2

How to Contact The MathWorks
www.mathworks.
comp.soft-sys.matlab Newsgroup
www.mathworks.com/contact_TS.html T echnical Support
suggest@mathworks.com Product enhancement suggestions
bugs@mathwo
doc@mathworks.com Documentation error reports
service@mathworks.com Order status, license renewals, passcodes
info@mathwo
com
rks.com
rks.com
Web
Bug reports
Sales, prici
ng, and general information
508-647-7000 (Phone)
508-647-7001 (Fax)
The MathWorks, Inc.
3 Apple Hill Drive
Natick, MA 01760-2098
For contact information about worldwide offices, see the MathWorks Web site.
Bioinformatics Toolbox™ User’s Guide
© COPYRIGHT 2003–20 10 by The MathWorks, Inc.
The software described in this document is furnished under a license agreement. The software may be used
or copied only under the terms of the license agreement. No part of this manual may be photocopied or
reproduced in any form without prior written consent from The MathW orks, Inc.
FEDERAL ACQUISITION: This provision applies to all acquisitions of the Program and Documentation
by, for, or through the federal government of the United States. By accepting delivery of the Program
or Documentation, the government hereby agrees that this software or documentation qualifies as
commercial computer software or commercial computer software documentation as such terms are used
or defined in FAR 12.212, DFARS Part 227.72, and DFARS 252.227-7014. Accordingly, the terms and
conditions of this Agreement and only those rights specified in this Agreement, shall pertain to and govern
theuse,modification,reproduction,release,performance,display,anddisclosureoftheProgramand
Documentation by the federal government (or other entity acquiring for or through the federal government)
and shall supersede any conflicting contractual terms or conditions. If this License fails to meet the
government’s needs or is inconsistent in any respect with federal procurement law, the government agrees
to return the Program and Docu mentation, unused, to The MathWorks, Inc.
Trademarks
MATLAB and Simulink are registered trademarks of The MathWorks, Inc. See
www.mathworks.com/trademarks for a list of additional trademarks. Other product or brand
names may be trademarks or registered trademarks of their respective holders.
Patents
The MathWorks products are protected by one or more U.S. patents. Please see
www.mathworks.com/patents for more information.
Page 3

Revision History
September 2003 Online only New for Version 1.0 ( Release 13SP1+)
June 2004 Online only Revised for Version 1.1 (Release 14)
November 2004 Online only Revised for Version 2.0 (Release 14SP1+)
March 2005 Online only Revised for Version 2.0.1 (Release 14SP2)
May 2005 Online only Revised for Version 2.1 (Release 14SP2+)
September 2005 Online only Revised for Version 2.1.1 (Release 14SP3)
November 2005 Online only Revised for Version 2.2 (Release 14SP3+)
March 2006 Online only Revised for Version 2.2.1 (Release 2006a)
May 2006 Online only Revised for Version 2.3 (Release 2006a+)
September 2006 Online only Revised for Version 2.4 (Release 2006b)
March 2007 Online only Revised for Version 2.5 (Release 2007a)
April 2007 Online only Revised for Version 2.6 (Release 2007a+)
September 2007 Online only Revised for Version 3.0 (Release 2007b)
March 2008 Online only Revised for Version 3.1 (Release 2008a)
October 2008 Online only Revised for Version 3.2 (Release 2008b)
March 2009 Online only Revised for Version 3.3 (Release 2009a)
September 2009 Online only Revised for Version 3.4 (Release 2009b)
March 2010 Online only Revised for Version 3.5 (Release 2010a)
Page 4

Page 5

Getting Started
1
Product Overview ................................. 1-2
Features
Expected Users
......................................... 1-2
................................... 1-3
Contents
Installation
Installing
Required Software
Optional Software
Features and Functions
Data Formats and Databases
Sequence Alignments
Sequence Utilities and Statistics
Protein Property Analysis
Phylogenetic Analysis
Microarray Data Analysis
Microarray Data Storage
Mass Spectromet ry Data Analysis
Graph Theory Functions
Graph Visualization
Statistical Learning and Visualization
Prototyping and Development Environment
Data Visualization
Algorithm Sharing and Application Deployment
Using Spreadsheet Link EX with Bioinformatic Data
....................................... 1-5
........................................ 1-5
................................. 1-5
................................. 1-6
............................ 1-8
........................ 1-8
.............................. 1-10
..................... 1-10
.......................... 1-11
.............................. 1-12
........................... 1-12
........................... 1-13
.................... 1-14
............................ 1-17
............................... 1-18
................ 1-18
............ 1-19
................................ 1-20
........ 1-20
.. 1-22
Creating get Functions
What Are get Functions?
Creating the getpubmed Function
Extracting Information from Large Multi-Entry Text
Files
............................................ 1-34
............................. 1-29
........................... 1-29
.................... 1-30
v
Page 6

Overview ........................................ 1-34
What Files Can You Access?
Before You Begin
Creating a BioIndexedFile Object to Access Your Source
File
........................................... 1-36
Determining the Number of Entries in Your Source File
Retrieving Entries from Your Source File
Reading Entries from Your Source File
.................................. 1-35
......................... 1-34
.............. 1-37
................ 1-38
Sequence Analysis
2
Example: Sequence Statistics ....................... 2-2
Overview o f Example
Determining Nucleotide Content
Reading Sequence Information
Determining Nucleotide Compositi on
Determining C odon Composition
Open Reading Frames
Amino Acid Conversion and Composition
.............................. 2-2
..................... 2-2
...................... 2-4
................. 2-6
..................... 2-9
............................. 2-12
.............. 2-15
.. 1-37
vi Contents
Example: Sequence Alignment
Overview o f Example
Finding a Model Organism to Study
Retrieving Sequence Information from a Public
Database
Searching a Public Database for Related Genes
Locating Protein Coding Sequences
Comparing Amino Acid Sequences
Sequence Tool
Overview o f the Sequence Tool
Importing a Sequence
Viewing Nucleotide Sequence Information
Searching for Words
Exploring Open Reading Frames
Viewing Amino Acid Sequence Statistics
Closing the Sequence Tool
References
...................................... 2-20
..................................... 2-38
....................................... 2-51
.............................. 2-18
.............................. 2-38
............................... 2-42
...................... 2-18
.................. 2-18
................... 2-25
.................... 2-29
....................... 2-38
..................... 2-44
.......................... 2-51
......... 2-23
............. 2-40
............... 2-47
Page 7

Multiple Sequence Alignment Viewer ............... 2-52
Overview o f the Multiple Sequence Alignment Viewer
Loading Sequence Data and Viewing the Phylogenetic
Tree
Selecting a Subset of Data from the Phylogenetic Tree
Aligning Multiple Sequences
Adjusting Multiple Sequence Alignments Manually
Closing the Multiple Sequence Alignment Viewer
Storing and Managing Short-Read Sequence Data in
Objects
Overview
Representing Sequence and Quality Data in a BioRead
Object
Representing Sequence, Quality, and Alignment/Mapping
Data in a B ioMap Object
Retrieving Information from a BioRead or BioMap
Object
Setting Information in a BioRead or BioMap Object
Determining Coverage of a Reference Sequence
Constructing Sequence Alignments to a Reference
Sequence
Filtering Read Sequences Using SAM Flags
.......................................... 2-52
........................ 2-54
......................................... 2-59
........................................ 2-59
......................................... 2-60
......................... 2-62
......................................... 2-66
......... 2-69
...................................... 2-71
............ 2-72
... 2-52
... 2-53
..... 2-55
....... 2-58
..... 2-68
Microarray Analysis
3
Storing and Managing Gene Expression Data in
Objects
Representing Expression Data Values in DataMatrix
Objects
Overview of DataMatrix Objects
Constructing DataMatrix Objects
Getting and Setting Properties of a DataMatrix Object
Accessing Data in DataM atrix Objects
Representing Expression Data Values in ExptData
Objects
......................................... 3-2
......................................... 3-5
..................... 3-5
.................... 3-6
................ 3-8
......................................... 3-11
... 3-7
vii
Page 8

Overview o f ExptData Objects ....................... 3-11
Constructing ExptData Objects
Using Properties of an ExptData Object
Using Methods of an ExptData Object
References
Representing Sample and Feature Metadata in
MetaData Objects
Overview o f MetaData Objects
Constructing MetaData Objects
Using Properties of a MetaData Object
Using Methods of a MetaData Object
Representing Experiment Information in a MIAME
Object
Overview o f MIAME Objects
Constructing MIAME Objects
Using Properties of a MIAME Object
Using Methods of a MIAME Object
Representing All Data and Information in an
ExpressionSet Object
Overview o f ExpressionSet Objects
Constructing ExpressionSet Objects
Using Properties of an ExpressionSet Object
Using Methods of an ExpressionSet Object
....................................... 3-14
............................... 3-15
.......................................... 3-22
............................ 3-27
...................... 3-12
............... 3-12
................. 3-13
....................... 3-15
...................... 3-16
................ 3-19
................. 3-20
........................ 3-22
....................... 3-22
.................. 3-25
................... 3-25
................... 3-27
.................. 3-29
........... 3-30
............. 3-30
viii Contents
Example: Visualizing Microarray Data
Overview o f the Mouse Example
Exploring the Microarray Data Set
Spatial Images of Microarray Data
Statistics of the Microarrays
Scatter Plots of Microarray Data
Example: Analyzing Gene Expression Profiles
Overview o f the Yeast Example
Exploring the Data Set
Filtering Genes
Clustering Genes
Principal Component Analysis
................................... 3-61
............................. 3-57
.................................. 3-64
..................... 3-33
........................ 3-46
..................... 3-48
...................... 3-57
....................... 3-68
.............. 3-33
................... 3-34
................... 3-36
....... 3-57
Page 9

Phylogenetic Analysis
4
Overview of Phylogenetic Analysis .................. 4-2
Example: Building a Phylogenetic Tree
Overview o f the Primate Example
Searching NCBI for Phylogenetic Data
Creating a Phylogenetic Tree for Five Species
Creating a Phylogenetic Tree for Twelve Species
Exploring the Phylogenetic Tree
Phylogenetic Tree Tool Reference
Overview o f the Phylogenetic Tree Tool
Opening the Phylogenetic Tree Tool
File Menu
Tools Menu
Window Menu
Help Menu
........................................ 4-18
...................................... 4-31
.................................... 4-40
....................................... 4-40
.................... 4-3
..................... 4-11
.............. 4-3
................ 4-5
.......... 4-6
........ 4-9
................... 4-16
................ 4-16
.................. 4-16
Examples
A
Introduction ...................................... A-2
Sequence Analysis
Microarray Analysis
Phylogenetic Analysis
................................. A-2
............................... A-2
.............................. A-2
Index
ix
Page 10

x Contents
Page 11

Getting Started
• “Product Overview” on page 1-2
• “Installation” on page 1-5
• “Features and Functions” on page 1-8
• “Using Spreadsheet Link EX with Bioinformatic Data” on page 1-22
• “Creating get Functions” on page 1-29
• “Extracting Information from Large Multi-Entry Text Files” on page 1-34
1
Page 12
1 Getting Started
Product Overview
Features
The Bioinformatics Toolbox™ product extends the MATLAB®environment
to provide an integrated software environment for genome and proteome
analysis. Scientists and engineers can answer questions, solve problems,
prototype new algorithms, and build applications for drug discovery and
design, genetic engineering, and biological research. An introduction to these
features will help you to develop a conceptual model for working with the
toolbox and your biological data.
The Bioinformatics Toolbox product includes many functions to help you
with genome and proteome analysis. Most functions are implemented in the
MATLAB programming language, with the source available for you to view.
This open environment lets you explore and customize the existing to olbox
algorithms or develop your own.
In this section...
“Features” on page 1-2
“Expected Users” on page 1-3
1-2
You can use t h e basic bioinformatic functions provided with this toolbox
to create more complex algorithms and applications. These robust and
well-tested functions are the functions that you would otherwise have to
create yourself.
Toolbox features and functions fall within these categories:
• Data formats and databases — Connect to Web-accessible databases
containing genomic and proteomic data. Read and conv ert between
multiple data formats.
• Sequence analysis — Determine the statistical characteristics of a
sequence, align two sequences, a nd multiply align several sequences.
Model patterns in biological sequences using hidden Markov model (HMM)
profiles.
• Phylogenetic analysis — C reate and manipulate phylogenetic tree data.
Page 13

Product Overview
• Microarray data analysis — Read, normalize, and visualize microarray
data.
• Mass spectrometry data analysis — Analyze and enhance raw mass
spectrometry data.
• Statistical learning — Classify and identify features in data sets with
statistical learning tools.
• Programming interface — Use other bioinformatic software (B io P erl
and BioJava) within the MATLAB environment.
The field of bioinformatics is rapidly growing and will become increasingly
important as biology becomes a more an al ytical scie nce. The toolbox pro vi de s
an open environment that you can customize for development and deploymen t
of the analytical tools you will need.
• Prototype and develop algorithms — Prototype new ideas in an open
and extensible environment. Develop algorithms using efficient string
processing and statistical functions, view the source code for existing
functions, and use the code as a template for customizing, improving,
or creating your own functions. See “Prototyping and Development
Environment” on page 1-19.
• Visualize data — Visualize sequences and alignments, gene expression
data, phylogenetic trees, mass spectrometry data, protein structure,
and relationships between data with interconnected graphs. See “Data
Visualization” on page 1-20.
• Share and deploy applications — Use an interactive GUI builder to
develop a custom graphical front end for your data analysis programs.
Create standalone applications that run sepa rately from the MATLAB
environment. See “Algorithm Sharing and Application Deployment” on
page 1-20.
1-3
Page 14

1 Getting Started
Expected Users
The Bioinformat
and research sci
published ones
ics Toolbox product is intended for computational biologists
entists who need to develop new algorithms or implement
, visualize results, and createstandaloneapplications.
• Industry/Pro
supported by e
whowanttocre
industries.
• Education/P
and teachin
and student
programmin
While the t
to be a comp
However, t
prototyp
g genome and proteome analysis techniques. Educators
s can concentrate on bioinformatic algorithms instead of
g basic functions such as reading and writing to files.
oolbox includes many bioinformatic functions, it is not intended
lete set of tools for scientists to analyze their biological data.
he MATLAB environment is ideal for rapidly designing and
ing the tools you need.
fessional — Increasingly, drug discovery methods are being
ngineering practice. This toolbox supports tool builders
ate applications for the biotechnology and pharmaceutical
rofessor/Student — This toolbox is well suited for learning
1-4
Page 15

Installation
Installation
In this section...
“Installing” on page 1-5
“Required Software” on page 1-5
“Optional Software” on page 1-6
Installing
Install the Bioinformatics Toolbox software from a DV D or W eb release using
the MathWorks™ Installer. For more information, see the Installation Guide
foryourplatform.
Required Software
The Bioinformatics Toolbox software requires the following MathWorks
products to be installed on your computer.
Require
MATLAB Provide
Stat
dSoftware
istics Toolbox™
Descrip
softwa
Toolbo
Versio
res MATLAB Version 7.10 on the Release
requi
2010a
ides basic statistics and probability functions
Prov
by the functions of the Bioinformatics
used
box software.
Tool
sion 3.5 of the Bioinformatics Toolbox software
Ver
uires Statistics Toolbox Version 7.3 on the
req
ease 2010a DVD.
Rel
tion
s a command-line interface and integrated
re environment for the Bioinformatics
x software.
n 3.5 of the Bioinformatics Toolbox software
DVD.
1-5
Page 16

1 Getting Started
Optional Software
MATLAB and the Bioinformatics Toolbox software environment is open and
extensible. In this environment you can interactively explore ideas, prototype
new algorithms, and develop complete solutions to problems in bioinformatics.
MATLAB facilitates computation, visualization, prototyping, and deployment.
Using the Bioinformatics Toolbox software with other MATLAB toolboxes and
products will allow you to do advanced algorithm development and solve
multidisciplinary problems.
Optional Software
Parallel Computing
Toolbox™
Signal Processing
Toolbox™
Image Processing
Toolbox™
SimBiology
Optimization
Toolbox™
Neural Network
Toolbox™
Database Toolbox™
®
Description
Perform parallel bioinformatic computations on
multicore computers and computer clusters . For
an example of batch processing through parallel
computing, see the Batch Processing of Spectra
Using Distributed Computing demo.
Process signal data from bioanalytical
instrumentation. Examples include acquisition
of fluores cence data for DNA sequence analyzers,
fluorescence data for microarray scanners, and
mass spectrometric data from protein analyses.
Create complex and custom image processing
algorithms for data from microarray scanners.
Model, simulate, and analyze biochemical systems.
Use nonlinear optimization to predict the
secondary structure of proteins and the structure
of other biological macromolecules.
Use neural networks to solve problems where
algorithms are not available. For example, you
can train neural networks for pattern recognition
using large sets of sequence data.
Create your own i n-house databases for sequence
data with custom annotations.
1-6
Page 17

Installation
Optional Software
MATLAB
®
Compiler™
Description
Create standalone applications from MATLAB
GUI applications, and create dynamic link
libraries from MATLAB functions to use with any
programming environment.
MATLAB®Builder™NECreate COM objects to use with any COM-based
programming environment.
MATLAB Builder JA Integrate MATLAB applications into your
organization’s Java™ programs by creating a Java
wrapper around the application.
MATLAB Builder EX Create Microsoft®Excel®add-in functions
from MATLAB functions to use with Excel
®
spreadsheets.
Spreadsheet Link™EXConnect Microsoft Excel with the MATLAB
WorkspacetoexchangedataandtouseMATLAB
computational and visualization functions. For
more information, see “Using Spreadsheet Link
EX with Bioinformatic Data” on page 1-22.
1-7
Page 18

1 Getting Started
Features and Functions
In this section...
“Data Formats and Databases” on page 1-8
“Sequence Alignments” on page 1-10
“Sequence Utilities and Statistics” on page 1-10
“Protein Property Analysis” on page 1-11
“Phylogenetic Analysis” on page 1-12
“Microarray Data Analysis” on page 1-12
“Microarray Data Storage” on page 1-13
“Mass Spectrometry Data Analysis” on page 1-14
“Graph Theory Functions” on page 1-17
“Graph Visualization” on page 1-18
“Statistical Learning and Visualization” on page 1-18
1-8
“Prototyping and Development Environment” on page 1-19
“Data Visualization” on page 1-20
“Algorithm Sharing and Application Deployment” on page 1-20
Data Formats and Databases
The toolbox accesses many of the databases on the W eb and other online data
sources. It allows you to copy data into the MATLAB Workspace, and read
and write to files with standard bioinformatic formats. It also reads many
commongenomefileformats,sothatyoudonothavetowriteandmaintain
your own file readers.
Web-based databases — You can directly access public databases on the
Web and copy sequence and gene expression information into the MATLAB
environment.
The sequence databases currently supported are GenBank
GenPept (
(
getembl), and Protein Data Bank (PDB) (getpdb). You can also access data
getgenpept), European Molecular Biology Laboratory (EMBL)
®
(getgenbank),
Page 19

Features and Functions
from the NCBI Gene Expression Omnibus (GEO ) Web site by using a single
function (
getgeodata).
Get multiply aligned sequences (
profiles (
gethmmprof), and phylogenetic tree data (gethmmtree)fromthe
gethmmalignment), hidden Markov model
PFAM database.
Gene Ontology database — Load the database from the Web into
a gene ontology object (
ontology with methods for the geneont object (
geneont.getdescendants, geneont.getmatrix, geneont.getrelatives),
and manipulate data with utility functions (
geneont.geneont). Select sections of the
geneont.getancestors,
goannotread, num2goid).
Read data from instruments — Read d ata generated from gene
sequencing instruments (
(
jcampread), and Agilent
scfread, joinseq, traceplot), mass spectrometers
®
microarray s canners (agferead).
Reading data formats — The toolbox provides a number of functions for
reading data from common bioinformatic file formats.
• Sequence data: GenBank (
(
emblread), PDB (pdbread), and FASTA (fastaread)
• Multiply aligned sequences: ClustalW and GCG formats (
genbankread), GenPept (genpeptread), EMBL
multialignread)
• Gene expression data from microarrays: Gene Expression Omnib us (GEO)
data (
geosoftread), GenePix
galread), SPOT data (sptread), Affymetrix
and ImaGene
®
results files (imageneread)
®
data in GPR and GAL files (gprread,
®
GeneChip®data ( affyread),
• Hidden Markov model profiles: PFAM -HM M file (
pfamhmmread)
Writing data formats — The functions for getting data from the Web
include the option to save the data to a file. However, there is a function to
write data to a file using the FASTA format (
BLAST searches — Request Web-based BLAST searches (
the results from a search (
BLAST formatted report file (
getblast) and read results from a previously saved
blastread).
fastawrite).
blastncbi), get
1-9
Page 20

1 Getting Started
The MATLAB environment has built-in support for other industry-standard
file formats including Microsoft Excel and comma-separated-value (CSV) files.
Additional functions perform ASCII and low-level binary I/O, allowing you to
develop custom functions for working with any data format.
Sequence Alignments
You can select from a list of analysis methods to compare nucleotide or amino
acid sequences using pairwise or multiple sequence alignment functions.
Pairwise sequence alignment — Efficient implementations of standard
algorithms such as the Needleman-Wunsch (
(
swalign) algorithms for pairwise sequence alignment. The toolbox also
includes standard scoring matrices such as the PAM and BLOSUM
families of matrices (
sequence similarities with
showalignment.
blosum, dayhoff, gonnet, nuc44, pam). Visualize
seqdotplot and sequence alignment results with
Multiple sequence alignment — Functions for multiple sequence
alignment (
sequences (
graphical interface (
multialign, profalign) and functions that support multiple
multialignread, fastaread, showalignment). There is also a
multialignviewer) for viewing the results of a multiple
sequence alignment and manually making adjustment.
nwalign) and Smith-Waterman
1-10
Multiple sequence profiles — Implementations for multiple alignment and
profile hidden Markov model algorithms (
gethmmtree, pfamhmmread, hmmprofalign, hmmprofestimate,
hmmprofgenerate, hmmprofmerge, hmmprofstruct, showhmmprof).
gethmmprof, gethmmalignment,
Biological codes — Look up the letters or numeric equivalents for
commonly used biological codes (
revgeneticcode).
aminolookup, baselookup, geneticcode,
Sequence Utilities and Statistics
You can manipulate and analyze your sequences to gain a deeper
understanding of the physical, chemical, and biological characteristics of
your data. Use a graphical user interface (GUI) with many of the sequence
functions in the toolbox (
seqtool).
Page 21

Features and Functions
Sequence conversion and manipulation — The toolbox provides routines
for common operations, such as converting DNA or RNA sequences to amino
acid sequences, that are basic to working w ith nucleic acid and protein
sequences (
seqcomplement, seqrcomplement, seqreverse).
aa2int, aa2nt, dna2rna, rna2dna, int2aa, int2nt, nt2aa, nt2int,
You can manipulate your sequence by performing an in silico digestion with
restriction e ndonucleases (
restrict) and proteases (cleave).
Sequence statistics — Determine various statistics about a sequence
(
aacount, basecount, codoncount, dimercount, nmercount, ntdensity,
codonbias, cpgisland, oligoprop), search for specific patterns within a
sequence (
(
seqshoworfs). In addition, you can create random sequences for test cases
(
randseq).
seqshowwords, seqwordcount), or search for open reading frames
Sequence utilities — Determine a consensus sequence from a set of multiply
aligned amino acid, nucleotide sequences (
profile (
seqprofile). Format a sequence for display (seqdisp)orgraphically
show a sequence alignment with frequency data (
seqconsensus,orasequence
seqlogo).
Additional MATLAB functions efficiently handle string operations with
regular expressions (
sequence and search through a library for string matches (
regexp, seq2regexp) to look for specific patterns in a
seqmatch).
Look for possible cleavage sites in a DNA/RNA sequence by searching for
palindromes (
palindromes).
Protein Property Analysis
You can use a collection of protein analysis methods to extract information
from your data. You can determine protein characteristics and simulate
enzyme cleavage reactions. The toolbox provides functions to calculate various
properties of a protein sequence, such as the atomic composition (
molecular weight (
cleave a protein with an enzyme (
and Ramachandran plots for PDB data (
molweight), and isoelectric point (isoelectric). You can
cleave, rebasecuts) and create distance
pdbdistplot, ramachandran). The
toolbox contains a graphical user interface for protein analysis (
and plotting 3-D protein and other molecular structures with information
from molecule m odel files, such as PDB files (
molviewer).
atomiccomp),
proteinplot)
1-11
Page 22

1 Getting Started
Amino acid sequence u tilities — Calculate amino acid statistics for a
sequence (
aacount) and get information about character codes (aminolookup).
Phylogenetic Analysis
You can use functions for phylogenetic tree building and analysis. There is
also a GUI to draw phylograms (trees).
Phylogenetic tree data — Read and write Newick-formatted tree files
(
phytreeread, phytreewrite) into the MATLAB Workspace as phylogenetic
tree objects (
Create a phylogenetic tree — Calculate the pairwise distance between
biological sequences (
dndsml), build a phylogenetic tree from pairwise distances (seqlinkage,
seqneighjoin, reroot), and view the tree in an interactive GUI that allows
you to view, edit, and explore the data (
allows you to prune branches, reorder, rename, and explore distances.
phytree).
seqpdist), estimate the substitution rates (dnds,
phytreetool or view). This GUI also
1-12
Phylogenetic tree object methods — You can access the functionality
of the
(
the patristic distances between pairs of leaf nodes (
phytreetool GUI using methods for a phylogenetic tree object
phytree). Get property values (get) and node names (getbyname). Calculate
pdist, weights)
and draw a phylog enetic tree object in a MATLAB Figure window as a
phylogram, cladogram, or radial treeplot (
selecting branches and leaves using a specified criterion (
and removing nodes (
Newick-formatted strings (
prune). Co mpare trees (getcanonical) and use
getnewickstr).
plot). Manipulate tree data by
select, subtree)
Microarray Data Analysis
The MATLAB environment is widely used for microarray data analysis,
including reading, filtering, normalizing, and visualizing microarray data.
However, the standard normalization and visualization toolsthatscientists
use can be difficult to implement. The toolbox includes these standard
functions:
Microarray data — Read Affymetrix GeneChip files (
data (
probesetplot), ImaGene results files (imageneread), SPOT files
(
sptread) and Agilent microarray scanner files (agferead). Read GenePix
affyread)andplot
Page 23

Features and Functions
GPR files (gprread)andGALfiles(galread). Get Gene Expression Omni bus
(GEO)datafromtheWeb(
(
geosoftread).
getgeodata) and read GEO data from files
A utility function (
reader functions (
magetfield) extracts data from one of the microarray
gprread, agferead, sptread, imageneread).
Microarray normalization and filtering —Thetoolboxprovidesa
number of methods for normalizing microarray data, such as low ess
normalization (
multiple arrays (
clean raw data before analysis (
generangefilter, genevarfilter), and calculate the range and variance of
values (
exprprofrange, exprprofvar).
malowess) and mean normalization (manorm), or across
quantilenorm). You can use filtering functions to
geneentropyfilter, genelowvalfilter,
Microarray visualization — The toolbox contains routines for visualizing
microarray data. These routines include spatial plots of microarray data
(
maimage, redgreencmap), box plots (maboxplot), loglog plots (maloglog),
and intensity-ratio plots (
profiles (
clustergram, redgreencmap). You can create 2-D scatter plots of
principal components from the microarray data (
mairplot). You can also view clustered expression
mapcaplot).
Microarray utility functions — Use the following functions to work
with Affymetrix GeneChip data sets. Get library information for a probe
(
probelibraryinfo), gene information from a probe set (probesetlookup),
and probe set values from CEL and CDF information (
Show probe set information from NetAffx™ Analysis Center (
and plot probe set values (
probesetplot).
probesetvalues).
probesetlink)
The toolbox accesses statistical routines to perform cluster analysis and
to visualize the results, and you can view your data through statistical
visualizations such as dendrograms, classification, and regression trees.
Microarray Data Storage
The toolbox includes functions, objects, and methods for creating, storing, and
accessing microarray data.
The object constructor function,
object to encapsulate data and metadata from a microarray experiment. A
DataMatrix, lets you create a DataMatrix
1-13
Page 24

1 Getting Started
DataMatrix object stores experimental data in a matrix, with rows typically
corresponding to gene names or probe identifiers, and columns typically
corresponding to sample identifiers. A DataMatrix object also stores
metadata, including the gene names or probe identifiers (as the row names)
and sample identifiers (as the column names).
You can reference microarray expressionvaluesinaDataMatrix object the
same way you reference data in a MATLAB array, that is, by using linear or
logical indexing. Alternately, you can reference this experimental data by
gene (probe) identifiers and sample identifiers. Indexing by these identifiers
lets you quickly and conveniently access subsets of the data without having
to maintain additional index arrays.
Many MATLAB operators and arithmetic functions are available to
DataMatrix objects by means of methods. These methods let you modify,
combine, compare, analyze, plot, and access information from DataMatrix
objects. Additionally, you can easily extend the functionality by using
general element-wise functions,
accessing the properties of a DataMatrix object.
dmarrayfun and dmbsxfun, and by manually
1-14
Note For more information on creating and using DataMatrix objects, see
“Representing Expression Data Values in DataMatrix Objects” on page 3-5.
Mass Spectrometry Data Analysis
The mass spectrometry functions preprocess and classify raw data from
SELDI-TOF and MALDI-TOF spectrometers and use statistical learning
functions to identify patterns.
Reading raw data — Load raw mass/charge and ion intensity data from
comma-separated-value (CSV) files, or read a JCAMP-DX-formatted file with
mass spectrometry data (
You can also have data in TXT files and use the
Preprocessing raw data — Resample high-resolution data to a lower
resolution (
the baseline (
msresample) where the extra data points are not needed. Correct
msbackadj). Align a spectrum to a set of reference masses
jcampread) into the MATLAB environ ment.
importdata function.
Page 25

Features and Functions
(msalign) and visually verify the alignment (msheatmap). N ormalize the
area betw ee n spectra for comparing (
msnorm), and filter out noise (mslowess
and mssgolay).
Spectrum analysis — Load spectra into a GUI (
msviewer) for selecting mass
peaks and further analysis.
The following graphic illustrates the roles of the various mass spectrometry
functions in the toolbox.
1-15
Page 26

1 Getting Started
mzXML File
mzxmlread
mzXML Structure
mzxml2peaks
Peak Lists
(Centroided Data)
mspeaks msppresample
Raw
Data
Reconstructed
Data
Semicontinuous Signal
msresample
msdotplot
msheatmap
msviewer
Plot
Plot
Mass
Spectra
Viewer
1-16
Page 27

Features and Functions
Graph Theory Fun
Graph theory fun
sparse matrices
the matrix repr
represent the a
edge. Graph al
if a
NaN or an In
information w
algorithms l
notattheval
Sparse matr
• Directed Gr
(column) i
in the diag
values.
• Undirect
real or lo
stored in
• Direct A
with zer
require
aDAGwi
ment of a DAG, it does not guarantee a DAG. An algorithm expecting
ctions in the toolbox apply basic graph theory algorithms to
. A sparse matrix represents a graph, any nonzero entries in
esent the edges of the graph, and the values of these entries
ssociated weight (cost, distance, length, or capacity) of the
gorithms that use the weight information will cancel the edge
f
is found. Graph algorithms that do not use the weight
ill consider the edge if a
ook only at the connectivity described by the sparse matrix and
ues stored in the sparse matrix.
ices can represent four types of graphs:
aph — Sparse matrix, either double real or logical. Row
ndex indicates the source (target) of the edge. Self-loops (values
onal) a re allowed, although most of the algorithms ignore these
ed Graph — Lower triangle of a sparse matrix, either double
gical. An algorithm expecting an undirected graph ignores values
the upper triangle of the sparse matrix and values in the diagonal.
cyclic Graph (DAG) — Sparse matrix, double real or logical,
o values in the diagonal. W hile a zero-valued diagonal is a
ll not test for cycles because this will add unwanted complexity.
ctions
NaN or an Inf is found, because these
• Spanni
connec
There
all fo
will
Grap
can i
h algorithm for DAG, however testing if a graph is acyclic is expensive
pat
pared to the algorithm. Therefore, it is important to select a graph theory
com
ction a nd properties appropriate for the type of the graph represente d by
fun
r input matrix. If the algorithm receives a graph type that differs from
you
at it expects, it will eith er:
wh
ng Tree — Undirected graph with no cycles and with one
ted component.
are no attributes attached to the graphs; sparse matrices representing
ur types of graphs can be passed to any graph algorithm. All functions
return an error on nonsquare sparse matrices.
h algorithms do not pretest for graph properties because such tests
ntroduce a time penalty. For example, there is an efficient shortest
1-17
Page 28

1 Getting Started
• Return an error when it reaches an inconsistency. For example, if you pass
a cyclic graph to the
the
method property.
• Produce an invalid result. For example, if you pass a directed graph to a
function with an algorithm that expects an undirected graph, it will ignore
valuesintheuppertriangleofthesparsematrix.
graphshortestpath function and specify Acyclic as
The graph theory functions include
graphisdag, graphisomorphism, graphisspantree, graphmaxflow,
graphminspantree, graphpred2path, graphshortestpath, graphtopoorder,
and
graphtraverse.
graphallshortestpaths, graphconncomp,
Graph Visualization
The toolbox includes functions, objects, and methods for creating, viewing,
and manipulating graphs such as interactive maps, hierarchy plots, and
pathways. This allows you to view relationships between data.
The object constructor function (
hold graph data. Methods o f the biograph object let you calculate the position
of nodes (
edges (
and find relations between the nodes (
and
algorithms to the biograph object.
Various properties of a biograph object let you programmatically change the
properties of the rendered graph. You can customize the node representation,
for example, drawing pie charts inside every node (
you can associate your own callback functions to nodes and edges of the graph,
for example, opening a Web page with more information about the nodes
(
NodeCallback and EdgeCallback).
dolayout), draw the graph (view), get handles to the nodes and
getnodesbyid and getedgesbynodeid) to further query information,
getrelatives). There are also methods that apply basic graph theory
biograph) lets you create a biograph object to
getancestors, getdescendants,
CustomNodeDrawFcn). Or
1-18
Statistical Learning and Visualization
You can classify and identify features in data sets, set up cross-validation
experiments, and compare different classification methods.
Page 29

Features and Functions
The toolbox provides functions that build on the classification and statistical
learning tools in the Statistics Toolbox software (
treefit).
classify, kmeans,and
These functions include imputation tools (
classifiers (
(
knnclassify).
svmclassify, svmtrain) and K-nearest neighbor classifiers
Other functions include set up of cross-validation experiments (
knnimpute), support vector m achine
crossvalind)
and comparison of the perform ance of different classification methods
(
classperf). In addition, there are tools for selecting diversity and
discriminating features (
rankfeatures, randfeatures).
Prototyping and Development Environment
The MATLAB environment lets you prototype and develop algorithms and
easily compare alternatives.
• Integrated environment — Explore biological data in an environment
that integrates programm i ng and visualization. Create reports and plots
with the built-in functions for mathematics, graphics, and statistics.
• Open environment — Access the source code for the toolbox functions.
The toolbox includes many of the basic bioinformatics functions you will
need to use, and it includes prototypes for some of the more advanced
functions. Modify these functions to create your own custom solutions.
• Interactive programming language — Test your ideas by typing
functions that are interpreted interactively with a language whose basic
data element is an array. The arrays do not require dimensioning and
allow you to solve many technical computing problems,
Using matrices for sequences or groups of sequences allows you to work
efficiently and not worry about writing loops or other programming controls.
• Programming tools — Use a visual debugger for algorithm development
and refinement and an algorithm performance profiler to accelerate
development.
1-19
Page 30

1 Getting Started
Data Visualizat
You can visually
sequences, gene
protein charac
create custom g
can also creat
®
Adobe
PostSc
Algorithm Sh
The open MATL
other users
With the add
applicatio
of MATLAB B
applicati
• Share alg
algorith
platform
MATLAB e
Environ
• Deploy M
enviro
to crea
MATLAB
ns independent of the MATLAB environment, and, with the addition
ons w ithin other programming environments.
ms created in the MATLAB language across all supported
ment (GUIDE).
nment using GUIDE, and then use MATLAB Compiler software
te a standalone GUI application that runs separately from the
compare pairwise sequence alignments, multiply aligned
expression data from microarrays, and plot nucleic acid and
teristics. The 2-D and volume visualization features let you
raphical representations of multidimensional data sets. You
e montages and overlays, and export finished graphics to an
®
ript
image file or copy directly into Microsof t®PowerPoint®.
aring and Application Deployment
AB environment lets you share your analysis solutions with
, and it includes tools to create custom software applications.
ition of MATLAB Compiler software, you can create standalone
uilder NE software, you can create GUIs and standalone
orithms with other users — You can share data analysis
s by giving files to other users. You can also create GUIs within the
nvironment using the Graphical User Interface Development
ATLAB GUIs — Create a GUI within the MATLAB
environment.
ion
1-20
• Creat
• Crea
• Crea
• Cre
e dynamic link libraries (DLLs) — Use MATLAB Compiler
are to create DLLs for your functions, and then link these libraries to
softw
programming environments such as C and C++.
other
te COM objects — Use MATLAB Builder NE software to create
COM o
(Vis
cre
spr
au
bjects, and then use a COM-compatible programming environment
ual Basic
te Excel add-ins — Use MATLAB Builder EX software to
ate Excel add-in functions, and then use these functions with Excel
eadsheets.
ate Java classes — Use MATLAB Builder JA software to
tomatically generate Java classes from algorithms written in the
®
) to create a standalone application.
Page 31

Features and Functions
MATLAB programming language. You can run these classes outside the
MATLAB environment.
1-21
Page 32

1 Getting Started
Using Spreadsheet Link EX with Bioinformatic Data
If you have bioinformatic data in a Microsoft Excel spreadsheet, you can
use Spreadsheet Link EX software to connect Excel with the MATLAB
Workspace to exchange data and to use MATLAB and Bioinformatics Toolbox
computational and visualization functions.
Note The following example assumes you have Spreadsheet Link EX
software installed on your system.
The file used in th e following example contains data from DeRisi, J.L., Iyer,
V.R., and Brown, P.O. (Oct. 24, 1997). Exploring the metabolic and genetic
control of gene expression on a genomic scale. Science 278(5338), 680–686.
PMID: 9381177. The data has been filtered using the steps described in the
Gene Expression Profile Analysis demo.
1 If you have not already done so, modify your system path to include the
MATLAB root directory as described in “Modifying Your System Path” in
the Spreadsheet Link EX documentation.
1-22
2 If you have not already done so, configure the software as described in
“Configuring the Spreadsheet Link EX Software” in the Spreadsheet Link
EX documentation.
3 Close MATLAB if you have it open.
4 Start Microsoft Excel. MATLAB and Spreadsheet Link EX software open
also.
5 From Excel, open the following file provided with the Bioinformatics
Toolbox software:
matlabroot\toolbox\bioinfo\biodemos\Filtered_Yeastdata.xls
Note The notation matlabroot is the MATLAB root directory, which is
the directory where the MATLAB softw are is installed on your system.
Page 33

Using Spreadsheet Link™ EX with Bioinformatic Data
Note When the Security Warning appears, click Enable Macros.
6 Note that cells J5, J6, J7, and J12 of the spreadsheet contain formulas
using Spreadsheet Link EX functions
MLPutMatrix and MLEvalString.
Tip To view a cell’s formula, select the cell, then view the formula in the
formula bar
at the top of the Excel w indow .
Cells J5, J6, and J7 each create a MATLAB variable from the data
in the spreadsheet, and cell J12 runs the Bioinformatics Toolbox
clustergram function using these three variables as input. For more
information on adding formulas using Spreadsheet Link EX functions, see
“Entering Functions into Worksheet Cells” in the Spreadsheet Link EX
documentation.
1-23
Page 34

1 Getting Started
Cells J5, J6, and J7 contain formulas
that use the MLPutMatrix function
to create three MATLAB variables.
Cell J12 contains a formula
that uses the MLEvalString function
to run the Bioinformatics Toolbox function
clustergram.
1-24
Cell J17 contains a formula
that uses a macro function,
Clustergram, created in
Visual Basic Editor.
Note that cell J17 contains a formula using a macro function Clustergram,
which was created in the Visual Basic Editor. R unning this macro does the
same as the formulas in cells J5, J6, J7, and J12. To view the
macro function, select Tools > Macro > Visual Basic Ed itor.Formore
information on creating macros using Visual Basic Editor, see “Examples:
Using Spreadsheet Link EX Functions in Macros” in the Spreadsheet Link
EX documentation.
Clustergram
Page 35

Using Spreadsheet Link™ EX with Bioinformatic Data
7 Run the formula in cell J17 to ana ly z e and visualize the data:
a Select cell J17.
b Press F2.
c Press Enter.
The macro function
(
data, Genes,andTimeSteps) and displaying a Clustergram window
Clustergram runs creating three MATLAB variables
containing dendrograms and a heat map of the data.
8 Edit the formulas in cells J5 and J6 to analyze a subset of the data. Do
this by editing the formulas’ cell ranges to include data for only the first
30 genes:
a Select cell J5,thenpressF2 to display the formula for editing. Change
H617 to H33,thenpressEnter.
1-25
Page 36

1 Getting Started
b Select cell J6,thenpressF2 to display the formula for editing. Change
A617 to A33,thenpressEnter.
9 Run the formulas in cells J5, J6, J7, and J12 to analyze and visualize
a subset of the data.
a Select cell J5,pressF2,thenpressEnter.
b Select cell J6,pressF2,thenpressEnter.
c Select cell J7,pressF2,thenpressEnter.
d Select cell J12,pressF2,thenpressEnter.
1-26
Page 37

Using Spreadsheet Link™ EX with Bioinformatic Data
10 Use the commands in the Spreadsheet Link EX toolbar to interact with
the data:
a C lick-drag to select cells B5 through H7,clickputmatrix in the toolbar,
type YAGenes for the variable name, then click OK.Thevariable
YAGenes is added to the MATLAB Workspace as a 3-by-7 matrix.
b Click evalstring in the toolbar, type plot(YAGenes ) for the command,
then click OK. A Figure window displays a plot of the data.
Note Make sure you use the ' (transpose) symbol when plotting the
data in this step. You need to transpose the data in
YAGenes so that it
plots as three genes o ve r seven time interv als.
c Select cell J20,thenclickgetfigure in the toolbar. The figure is added
to the spreadsheet
1-27
Page 38

1 Getting Started
1-28
Page 39

Creating get Functions
In this section...
“WhatAregetFunctions?”onpage1-29
“Creating the getpubmed Function” on page 1-30
What Are get Functions?
Bioinformatics Toolbox includes several get functions that retrieve
information from various Web databases. Additionally, with some basic
MATLAB programming skills, you can create your own get function to
retrieve information from a specific Web database.
The following procedure illustrates how to create a function to retrieve
information from the NCBI PubMed database and read the information into
a MATLAB structure. The NCBI PubMed database contains biomedical
literature citations and abstracts.
Creating get Functions
1-29
Page 40

1 Getting Started
Creating the get
The following pr
using the MATLAB
information fr
MATLAB structu
Specifically
to the PubMed d
structure ar
found by the s
identifier,
The functio
the user of t
number of r
1 From MATLA
ocedure shows you how to create a function named
om PubMed literature searches and write the data to a
, this function will take one or more search terms, submit them
atabase for a search, then return a MATLAB structure or
ray, with each structure containing information for an article
earch. The returned information will include a PubMed
publication date, title, abstract, authors, and citation.
n will also include property name/property value pairs that let
he function limit the search by publication date and limit the
ecords returned.
B, open the MATLAB Editor by selecting File > New >
pubmed Function
getpubmed
Editor. This function will retrieve citation and abstract
re.
M-File.
2 Define the getpubmed function, its input arguments, and return values by
typing:
function pmstruct = getpubmed(searchterm,varargin)
% GETPUBMED Search PubMed database & write results to MATLAB structure
1-30
3 Add code to do some basic error checking for the required input SEARCHTERM.
% Error checking for required input SEARCHTERM
if(nargin<1)
error('GETPUBMED:NotEnoughInputArguments',...
'SEARCHTERM is missing.');
end
4 Create variables for the two property name/property value pairs, and set
their default values.
% Set default settings for property name/value pairs,
% 'NUMBEROFRECORDS' and 'DATEOFPUBLICATION'
maxnum = 50; % NUMBEROFRECORDS default is 50
pubdate = ''; % DATEOFPUBLICATION default is an empty string
Page 41

Creating get Functions
5 Addcodetoparsethetwopropertyname/propertyvaluepairsifprovided
as input.
% Parsing the property name/value pairs
num_argin = numel(varargin);
for n = 1:2:num_argin
arg = varargin{n};
switch lower(arg)
% If NUMBEROFRECORDS is passed, set MAXNUM
case 'numberofrecords'
maxnum = varargin{n+1};
% If DATEOFPUBLICATION is passed, set PUBDATE
case 'dateofpublication'
pubdate = varargin{n+1};
end
end
6 You access the PubMed database through a search URL, which submits
a search term and options, and then returns the search results in a
specified f ormat. This search URL is comprised of a base URL and defined
parameters. Create a variable containing the base URL of the PubMed
database on the NCBI Web site.
% Create base URL for PubMed db site
baseSearchURL = 'http://www.ncbi.nlm.nih.gov/sites/entrez?cmd=search';
7 Create variables to contain five defined parameters that the getpubmed
function will use, namely, db (database), term (search term), report (report
type, such as MEDLINE
®
), format (format type, such as text), and dispmax
(maximum number of records to display).
% Set db parameter to pubmed
dbOpt = '&db=pubmed';
% Set term parameter to SEARCHTERM and PUBDATE
% (Default PUBDATE is '')
termOpt = ['&term=',searchterm,'+AND+',pubdate];
1-31
Page 42

1 Getting Started
% Set report parameter to medline
reportOpt = '&report=medline';
% Set format parameter to text
formatOpt = '&format=text';
% Set dispmax to MAXNUM
% (Default MAXNUM is 50)
maxOpt = ['&dispmax=',num2str(maxnum)];
8 Create a variable containing the search URL from the variables created
in the previous steps.
% Create search URL
searchURL = [baseSearchURL,dbOpt,termOpt,reportOpt,formatOpt,maxOpt];
9 Use the urlread function to submit the search URL, retrieve the search
results, and return the results (as text in the MEDLINE report type) in
medlineText, a character array.
1-32
medlineText = urlread(searchURL);
10 Use the MATLAB regexp function and regular expressions to parse and
extract the information in
medlineText into hits, a cell array, where each
cell contains the MEDLINE-formatted text for one article. The first input
is the character array to search, the second input is a search expression,
which tells the
while the third input,
regexp function to find all records that start with PMID-,
'match',tellstheregexp function to return the
actual records, rather than the positions of the records.
hits = regexp(medlineText,'PMID-.*?(?=PMID|</pre>$)','match');
11 Instantiate the pmstruct structure returned by getpubmed to contain six
fields.
pmstruct = struct('PubMedID','','PublicationDate','','Title','',...
'Abstract','','Authors','','Citation','');
12 Use the MATLAB regexp function and regular expressions to loop through
each article in
hits and extract the PubMed ID, publication date, title,
Page 43

Creating get Functions
abstract, authors, and citation. Place this information in the pmstruct
structure array.
for n = 1:numel(hits)
pmstruct(n).PubMedID = regexp(hits{n},'(?<=PMID- ).*?(?=\n)','match', 'once');
pmstruct(n).PublicationDate = regexp(hits{n},'(?<=DP - ).*?(?=\n)','match', 'once');
pmstruct(n).Title = regexp(hits{n},'(?<=TI - ).*?(?=PG -|AB -)','match', 'once');
pmstruct(n).Abstract = regexp(hits{n},'(?<=AB - ).*?(?=AD -)','match', 'once');
pmstruct(n).Authors = regexp(hits{n},'(?<=AU - ).*?(?=\n)','match');
pmstruct(n).Citation = regexp(hits{n},'(?<=SO - ).*?(?=\n)','match', 'once');
end
13 Select File > Save A s.
When you are done, your file should look similar to the
getpubmed.m
file included with the Bioinformatics Toolbox software. The sample
getpubmed.m file, including help, is located at:
matlabroot\toolbox\bioinfo\biodemos\getpubmed.m
Note The notation matlabroot is the MATLAB root directory, which is
the directory where the MATLAB softw are is installed on your system.
1-33
Page 44

1 Getting Started
Extracting Information from Large Multi-Entry Text Files
In this section...
“Overview” on page 1-34
“What Files Can You Access?” on page 1-34
“Before You B eg in” on page 1-35
“Creating a BioIndexedFile Object to Access Your Source File” on page 1-36
“Determining the Number of Entries in Your Source File” on page 1-37
“Retrieving Entries from Your Source File” on page 1-37
“Reading Entries from Your Source File” on page 1-38
Overview
Many biological experiments produce huge data files that are difficult to
access due to their size, which can cause memory issues when reading the file
into the MATLAB Workspace. You can construct a
to access the contents of a large text file (up to 4 GB) containing nonuniform
size entries, such as sequences, annotations, and cross-references to data sets.
The
BioIndexedFile object lets you quickly and efficiently access this data
without loading the source file into memory.
BioIndexedFile object
1-34
You can use the
subset of entries when the source file is too big to fit into memory. You can
access entries using indices or keys. You can read and parse one or more
entries using provided interpreters or a custom interpreter function.
Use the
• Access a subset of the entries for validation or further analysis.
• Parse entries using a custom interpreter function.
BioIndexedFile object in conjunction with your large source file to:
BioIndexedFile object to access individual entries or a
What Files Can You Access?
You can use the BioIndexedFile object to access large text files up to 4 GB
in size.
Page 45

Extracting Information from Large Multi-Entry Text Files
Your source file can have these application-specific formats:
• FASTA
• FASTQ
• SAM
Your source file can also havethesegeneralformats:
• Table — Tab-delimited table with multiple columns. Keys can be in any
column. Rows with the same key are considered separate entries.
• Multi-row Table — Tab-de limited table with multiple colum ns . Keys
can be in any column. Contiguous rows with the same key are considered
a single entry. Noncontiguous rows with the same key are considered
separate entries.
• Flat — Flat file with concatenated entries separated by a character string,
typically
entrybyawhitespace.
//. Within an entry, the key is separated from the rest of the
Before You B egin
Before constructing a BioIndexedFile object, locate your source file on your
hard drive or a local network.
When you construct a
first time, you also create an auxiliary index file, wh ich by default is saved
to the same location a s your source file. However, if your source file is in a
read-only location, you can specify a different location to save the index file.
Tip If you construct a BioIndexedFile object from your source file on
subsequent occasions, it takes advantage of the existing index file, which
saves time. However, the index file must be in the same location or a location
specified by the subsequent construction syntax.
BioIndexedFile object from your source file for the
1-35
Page 46

1 Getting Started
Tip If insufficient memory is not an issue when accessing your source file,
you m ay want to try a n appropriate read function, such as
importing data from GenBank files. For a complete list of read functions
in the Bioinformatics Toolbox, see “Data Formats and Databases” in the
Bioinformatics Toolbox Reference.
genbankread,for
Additionally, several read functio ns such as
and
sffread include a Blockread property, which lets you read a subset of
entries from a file, thus saving memory.
fastaread, fastqread, samread,
Creating a BioIndexedFile Object to Access Your
Source File
To construct a BioIndexedFile object from a multi-row table file:
1 Create a variable containing the full absolute path of your source file. For
your source file, use the
Bioinformatics Toolbox software.
sourcefile = which('yeastgenes.sgd');
2 Use the BioIndexedFile constructor function to construct a
BioIndexedFile object from the yeastgenes.sgd source file, which is a
multi-row table file. Save the index file in the Current Folder. Indicate that
thesourcefilekeysareincolumn3. Also, indicate that the header lines in
the source file are prefaced w ith
gene2goObj = BioIndexedFile('mrtab', sourcefile, '.', ...
yeastgenes.sgd file, which is included with the
!, so the constructor ignores them.
'KeyColumn', 3, 'HeaderPrefix','!')
1-36
The BioIndexedFile constructor function constructs gene2goObj,a
BioIndexedFile object, and also creates an index file with the same name
as the source file, but with an IDX extension. It stores this index file in the
Current Folder because we specified this location. However, the default
location for the index file is the same location as the source file.
Page 47

Extracting Information from Large Multi-Entry Text Files
Caution Do not modify the index file. If you modify it, you can get invalid
results. Also, the constructor function cannot use a modified index file to
construct future objects from the associated source file.
Determining the Number of Entries in Your Source File
To determine the number of entries in your source file, u se the NumEntries
property of the gene2goObj BioIndexedFile object.
gene2goObj.NumEntries
ans =
6476
Note For a list and description of all properties of a BioIndexedFile object,
see
BioIndexedFile class.
Retrieving Entries from Your Source File
Retrieve entries from your source file using either:
• Theindexoftheentry
• The entry key
Retrieving Entries Using Indices
Use the getEntryByIndex method to retrieve a subset of entries from your
source file that correspond to specified indices. For e xample, retrieve the first
12 entries from the
subset_entries = getEntryByIndex(gene2goObj, [1:12]);
yeastgenes.sgd source file:
1-37
Page 48

1 Getting Started
Retrieving Entries Using Keys
Use the getEntryByKey method to retrieve a subset of entries from your
source file that are associated with specified keys. For example, retrieve all
entries with keys of AAC1 and AAD10 from the
subset_entries = getEntryByKey(gene2goObj, {'AAC1' 'AAD10'});
The output subset_entries is a single string of concatenated entries.
Because the keys in the
method returns all entries that have a key of AAC1 or AAD10.
yeastgenes.sgd source file are not unique, this
yeastgenes.sgd source file:
Reading Entries from Your Source File
The BioIndexedFile object includes a read method, which you can use to
read and parse a subset of entries from your source file. The
parses the entries using an interpreter function specified by the
property of the BioIndexedFile object.
Setting the Interpreter Property
Before using the read method,makesuretheInterpreter property of the
BioIndexedFile object is set appropriately.
read method
Interpreter
1-38
If you constructed a
BioIndexedFile object from
...
A source file with an
application-specific format
(FASTA,FASTQ,orSAM)
A source file with a table,
multi-row table, or flat format
The Interpreter property ...
By default is a handle to a function
appropriate for that file type and
typically d oe s not require you to change
it.
By default is [], which means the
interpreter is an anonymous function
in which the output is equivalent to the
input. You can change this to a handle
to a function that accepts a single string
of one or more concatenated entries
and returns a structure or an array of
structures containing the interpreted
data.
Page 49

Extracting Information from Large Multi-Entry Text Files
TherearetwowaystosettheInterpreter property of the BioIndexedFile
object:
• When constructing the
BioIndexedFile object, use the Interpreter
property name/property value pair
• After constructing the
BioIndexedFile object, set the Interpreter
property
Note For more information on setting the Interpreter property of a
BioIndexedFile object, see BioIndexedFile class.
Reading a Subset of Entries
The read method reads and parses a subset of entries that you specify using
either entry indices or keys.
Example
To quickly find all the gene ontology (GO) terms associated with a particular
gene because the entry keys are gene names:
1 Set the Interpreter property of the gene2goObj BioIndexedFile object
to a handle to a function that reads entries and returns only the column
containing the GO term. In this case the interpreter is a handle to an
anonymous function that accepts strings and extracts strings that start
with the characters
GO.
gene2goObj.Interpreter = @(x) regexp(x,'GO:\d+','match')
2 Read only the entries that have a key of YAT2, and return their GO terms.
GO_YAT2_entries = read(gene2goObj, 'YAT2')
GO_YAT2_entries =
'GO:0004092' 'GO:0005737' 'GO:0006066' 'GO:0006066' 'GO:0009437'
1-39
Page 50

1 Getting Started
1-40
Page 51

Sequence Analysis
Sequence analysis is the process you use to find in formation about a nucleotide
or amino acid sequence using com putational methods. Common tasks in
sequence analysis are identifying genes, determining the similarity of two
genes, determining the protein coded by a gene, and determining the function
of a gene by finding a similar gene in another organism with a known function.
• “Example: Sequence Statistics” on page 2-2
• “Example: Sequence Alignment” on pa ge 2-18
• “Sequence Tool” on page 2-38
2
• “Multiple Sequence Alignment Viewer” on page 2-52
• “Storing and Managing Short-Read Sequence D ata in Objects” on page 2-59
Page 52

2 Sequence Analysis
Example: Sequence Statistics
In this section...
“Overview of Example” on page 2 -2
“Determining Nucleotide Content” on page 2-2
“Reading Sequence Information” on page 2-4
“Determining Nucleotide Composition” on page 2-6
“Determining Codon Composition” on page 2-9
“Open Reading Frames” on page 2-12
“Amino Acid Conversion and Composition” on page 2-15
Overview of Example
After sequencing a piece of DNA, one of the first tasks is to investigate the
nucleotide content in the sequence. Starting with a DNA sequence, this
example uses sequence statistics functions to determine mono-, di-, and
trinucleotide content, and to locate open reading frames.
2-2
Determining Nucleotide Content
The following procedure illustrates how to use the MATLAB Help browser
to search the Web for information. In this example you are interested in
studying the human mitochondrial genome. While many g enes that code for
mitochondrial proteins are found in the cell nucleus, the mitochondrial has
genes that code for proteins used to produce energy.
First research information about the human mitochondria and find the
nucleotide se quence for the genome. Next, look at the nucleotide content for
the entire sequence. And finally, determine open reading frames and extract
specific gene sequences.
1 Use the MATLAB Help browser to explore the Web. In the MATLAB
Command Window, type
web('http://www.ncbi.nlm.nih.gov/')
Page 53

Example: Sequence Statistics
A separate browser window opens with the home page for the NC BI Web
site.
2 Search the NCBI Web site for information. For example, to search for the
human mitochondrion genome, from the Search list, select
the for box, enter
mitochondrion homo sapiens.
Genome,andin
The NCBI Web search returns a list of links to relevant pages.
3 Select a result page. For example, click the link labeled NC_001807.
The MATLAB Help browser displays the NCBI page for the human
mitochondrial genome.
2-3
Page 54

2 Sequence Analysis
2-4
Readi
The fo
apubl
envi
acce
inte
envi
The
Gen
ng Sequence Information
llowing procedure illustrates how to find a nucleotide sequence in
ic database and read the sequence information into the MATLAB
ronment. Many public databases for nucleotide sequences are
ssible from the Web. The MATLAB Command Window provides an
grated enviro nment for bringing sequence informatio n into the MATLAB
ronment.
consensus sequence for the human mitochondrial genome has the
Bank accession number
NC_001807. Since the whole GenBank entry is
Page 55

Example: Sequence Statistics
quite large and you might only be interested in the sequence, you can get
just the sequence information.
1 Get sequence information from a Web database. For example, to retrieve
sequence information for the human mitochondrial genome, in the
MATLAB Command W indow, type
mitochondria = getgenbank('NC_001807','SequenceOnly',true);
The getgenbank function retrieves the nucleotide sequence from the
GenBank database and creates a character array.
mitochondria =
gatcacaggtctatcaccctattaaccactcacgggagctctccatgcat
ttggtattttcgtctggggggtgtgcacgcgatagcattgcgagacgctg
gagccggagcaccctatgtcgcagtatctgtctttgattcctgcctcatt
ctattatttatcgcacctacgttcaatattacaggcgaacatacctacta
aagt...
2 If you don’t have a Web connection, you can load the data from a MAT file
included with the Bioinformatics Toolbox software, using the command
load mitochondria
The load function loads the sequence mitochondria into the MATLAB
Workspace.
3 Get information about the sequence. Type
whos mitochondria
Information about the size of the sequence displays in the MATLAB
Command Window.
Name Size Bytes Class
mitochondria 1x16571 33142 char array
Grand total is 16571 elements using 33142 bytes
2-5
Page 56

2 Sequence Analysis
Determining Nuc
The following pr
dimers, and then
sequence with a
parts of the seq
indicate poss
before a gene.
After you rea
the sequence
characteris
mitochondr
on page 2-4.
1 Plot monom
the MATLAB
ntdensity(mitochondria)
This grap
ocedure illustrates how to determine the monomers and
visualize data in graphs and bar plots. Sections of a DNA
high percent of A+T nucleotides usually indicate intergenic
uence, while low A+T and higher G+C nucleotide percentages
ible genes. Many times high CG dinucleotide content is located
d a sequence into the MATLAB environment, you can use
statistics functions to determine if your sequence has the
tics of a protein-coding region. This procedure uses the human
ial genome as an example. See “Reading Sequence Information”
er densities and combined monomer densities in a graph. In
Command Window, type
h shows that the genome is A+T rich.
leotide Composition
2-6
Page 57

Example: Sequence Statistics
2 Count the nucleotides using the basecount function.
basecount(mitochondria)
A list of nucleotide counts is shown for the 5’-3’ strand.
ans =
A: 5113
C: 5192
G: 2180
T: 4086
3 Count the nucleotides in the reverse complement of a sequence using the
seqrcomplement function.
basecount(seqrcomplement(mitochondria))
2-7
Page 58

2 Sequence Analysis
As expected, the nucleotide counts on the reverse complement strand are
complementary to the 5’-3’ strand.
ans =
A: 4086
C: 2180
G: 5192
T: 5113
4 Use the function basecount with the chart option to visualize the
nucleotide distribution.
basecount(mitochondria,'chart','pie');
A pie chart displays in the MATLAB Figure w indow.
2-8
5 Count the dimers in a sequence and display the information in a bar chart.
dimercount(mitochondria,'chart','bar')
Page 59

Example: Sequence Statistics
Determining Codon Composition
The following procedure illustrates how to look at codons for the six reading
frames. Trinucleotides (codon) codeforanaminoacid,andthereare64
possible codons in a nucle otide sequence. Knowing the percent of codons
in your sequence can be helpful when you are comparing with tables for
expected codon usage.
After you read a sequence into the MATLAB environment, you can analyze the
sequence for codon composition. This procedure uses the human mitochondria
genome as an example. See “Reading Sequence Information” on page 2-4.
1 Count codons in a nucleotide sequence. In the MATLAB Command
Window, type
codoncount(mitochondria)
The codon counts for the first reading frame displays.
AAA-172 AAC-157 AAG-67 AAT-123
ACA-153 ACC-163 ACG-42 ACT-130
AGA-58 AGC-90 AGG-50 AGT-43
2-9
Page 60

2 Sequence Analysis
ATA-132 ATC-103 ATG-57 ATT-96
CAA-166 CAC-167 CAG-68 CAT-135
CCA-146 CCC-215 CCG-50 CCT-182
CGA-33 CGC-60 CGG-18 CGT-20
CTA-187 CTC-126 CTG-52 CTT-98
GAA-68 GAC-62 GAG-47 GAT-39
GCA-67 GCC-87 GCG-23 GCT-61
GGA-53 GGC-61 GGG-23 GGT-25
GTA-61 GTC-49 GTG-26 GTT-36
TAA-136 TAC-127 TAG-82 TAT-107
TCA-143 TCC-126 TCG-37 TCT-103
TGA-64 TGC-35 TGG-27 TGT-25
TTA-115 TTC-113 TTG-37 TTT-99
2 Count the codons in all six reading frames and p lot the results in heat maps.
for frame = 1:3
figure('color',[1 1 1])
subplot(2,1,1);
codoncount(mitochondria,'frame',frame,'figure',true);
title(sprintf('Codons for frame %d',frame));
subplot(2,1,2);
codoncount(mitochondria,'reverse',true,...
'frame',frame,...
'figure',true);
title(sprintf('Codons for reverse frame %d',frame));
end
2-10
Heat maps display all 64 codons in the 6 reading frames.
Page 61

Example: Sequence Statistics
2-11
Page 62

2 Sequence Analysis
2-12
Open Reading Frames
The following procedure illustrates how to locate the open reading frames
using a specific genetic code. Determining the protein-coding sequence for a
eukaryotic gene can be a difficult task because introns (noncoding sections)
are mixed with exons. However, prokaryotic genes generally do not have
introns and mRNA sequences have the introns removed. Identifying the
start and stop codons for translation determines the protein-coding section,
or open reading frame (ORF), in a sequence. Once you know the ORF for a
gene or mRNA, you can translate a nucleotide sequence to its corresponding
amino acid sequence.
After you read a sequence into the MATLAB environment, you can analyze
the sequence for open reading frames. This procedure uses the human
mitochondria genome as an example. Se e“ReadingSequenceInformation”
on page 2-4.
1 Display open reading frames (ORFs) in a nucleotide sequence. In the
MATLAB Command Window, type:
seqshoworfs(mitochondria);
Page 63

Example: Sequence Statistics
If you compare this output to the genes shown on the NCBI page for
NC_001807, there are fewer genes than expected. This is because vertebrate
mitochondria use a genetic code slightly different from the standard genetic
code. For a list of genetic codes, see the “Genetic Code” table in the
aa2nt
reference p age in the Bioinformatics Toolbox Reference.
2 Display ORFs using the Vertebrate Mitochondrial code.
orfs= seqshoworfs(mitochondria,...
'GeneticCode','Vertebrate Mitochondrial',...
'alternativestart',true);
Notice that there are now two large OR Fs on the first reading frame. One
starts at position 4471 and the other starts at 5905. These correspond to
the genes ND2 (NADH dehydrogenase subunit 2 [Homo sapiens] ) and
COX1 (cytochrome c oxidase subunit I) genes.
3 Find the corresponding stop codon. ThestartandstoppositionsforORFs
havethesameindicesasthestartpositionsinthefields
Start an d Stop.
ND2Start = 4471;
StartIndex = find(orfs(1).Start == ND2Start)
ND2Stop = orfs(1).Stop(StartIndex)
The stop position displays.
ND2Stop =
5512
4 Using the sequence indices for the start and stop of the gene, extract the
subsequence from the sequence.
ND2Seq = mitochondria(ND2Start:ND2Stop);
codoncount (ND2Seq)
The subsequence (protein-coding region) is stored in ND2Seq and displayed
on the screen.
attaatcccctggcccaacccgtcatctactctaccatctttgcaggcac
actcatcacagcgctaagctcgcactgattttttacctgagtaggcctag
aaataaacatgctagcttttattccagttctaaccaaaaaaataaaccct
2-13
Page 64

2 Sequence Analysis
cgttccacagaagctgccatcaagtatttcctcacgcaagcaaccgcatc
cataatccttc . . .
5 Determine the codon distribution.
codoncount (ND2Seq)
The codon count show s a high amount of ACC, ATA , CTA, and ATC.
AAA-10 AAC-14 AAG-2 AAT-6
ACA-11 ACC-24 ACG-3 ACT-5
AGA-0 AGC-4 AGG-0 AGT-1
ATA-22 ATC-24 ATG-2 ATT-8
CAA-8 CAC-3 CAG-2 CAT-1
CCA-4 CCC-12 CCG-2 CCT-5
CGA-0 CGC-3 CGG-0 CGT-1
CTA-26 CTC-18 CTG-4 CTT-7
GAA-5 GAC-0 GAG-1 GAT-0
GCA-8 GCC-7 GCG-1 GCT-4
GGA-5 GGC-7 GGG-0 GGT-1
GTA-3 GTC-2 GTG-0 GTT-3
TAA-0 TAC-8 TAG-0 TAT-2
TCA-7 TCC-11 TCG-1 TCT-4
TGA-10 TGC-0 TGG-1 TGT-0
TTA-8 TTC-7 TTG-1 TTT-8
2-14
6 Look up the amino acids for codons ATA, CTA, ACC,andATC.
aminolookup('code',nt2aa('ATA'))
aminolookup('code',nt2aa('CTA'))
aminolookup('code',nt2aa('ACC'))
aminolookup('code',nt2aa('ATC'))
The following displays:
Ile isoleucine
Leu leucine
Thr threonine
Ile isoleucine
Page 65

Example: Sequence Statistics
Amino Acid Conve
The following pr
from a gene seque
protein. Deter
give you a chara
information t
composition,
for similar pr
After you loc
an amino sequ
uses the hum
Frames” on p
1 Convert a n
only the pr
converted
ND2AASeq = nt2aa(ND2Seq,'geneticcode',...
The sequ
code. Be
default
ocedure illustrates how to extract the protein-coding sequence
nce and convert it to the amino acid sequence for the
mining the relative amino acid composition of a protein will
cteristic profile for the protein. Often, this profile is enough
o identify a protein. Using the amino acid composition, atomic
and molecular weig ht, you can also search public databases
oteins.
ateanopenreadingframe(ORF)inagene,youcanconvertitto
ence and determine its amino acid composition. This procedure
an mitochondria genome as an example. See “Open Reading
age 2-12.
ucleotide sequence to an amino acid sequence. In this example,
otein-coding sequence betw een the start and stop codons is
.
ence is converted using the
cause the property
, the first codon
rsion and Composition
'Vertebrate Mitochondrial');
Vertebrate Mitochondrial genetic
AlternativeStartCodons is set to 'true' by
att is converted to M instead of I.
MNPLAQPVIYSTIFAGTLITALSSHWFFTWVGLEMNMLAFIPVLTKKMNP
RSTEAAIKYFLTQATASMILLMAILFNNMLSGQWTMTNTTNQYSSLMIMM
AMAMKLGMAPFHFWVPEVTQGTPLTSGLLLLTWQKLAPISIMYQISPSLN
VSLLLTLSILSIMAGSWGGLNQTQLRKILAYSSITHMGWMMAVLPYNPNM
TILNLTIYIILTTTAFLLLNLNSSTTTLLLSRTWNKLTWLTPLIPSTLLS
LGGLPPLTGFLPKWAIIEEFTKNNSLIIPTIMATITLLNLYFYLRLIYST
SITLLPMSNNVKMKWQFEHTKPTPFLPTLIALTTLLLPISPFMLMIL
2 Comp
areyourconversionwiththepublishedconversionintheGenPept
base.
data
ND2protein = getgenpept('NP_536844','sequenceonly',true)
getgenpept function retrieves the published conversion from the NCBI
The
tabase and reads it into the MATLAB Workspace.
da
2-15
Page 66

2 Sequence Analysis
3 Count the amino acids in the protein sequence.
aacount(ND2AASeq, 'chart','bar')
A bar graph displays. Notice the high content for leucine, threonine and
isoleucine, and also notice the lack of cysteine and aspartic acid.
2-16
4 Determine the atomic composition and molecular weight of the prote in .
atomiccomp(ND2AASeq)
molweight (ND2AASeq)
The following disp la ys in the MAT LAB Workspace:
ans =
C: 1818
H: 3574
N: 420
O: 817
S: 25
ans =
Page 67

Example: Sequence Statistics
3.8960e+004
If this sequence was unknown, you could use this information to identify
the protein by comparing it with the atomic composition of other proteins
in a database.
2-17
Page 68

2 Sequence Analysis
Example: Sequence Alignment
In this section...
“Overview of Example” on page 2-18
“Finding a Model Organism to Study” on page 2-18
“Retrieving Sequence Information from a Public Database” on page 2-20
“Searching a Public Database for Related Genes” on page 2-23
“Locating Protein Coding Sequences” on page 2-25
“Comparing Amino Acid Sequences” on page 2-29
Overview of Example
Determining the similarity between two sequences is a common task in
computational biology. Starting with a nucleotide sequence for a human gene,
this exam pl e uses alignment algorithms to locate and verify a corresponding
gene in a model organism.
2-18
Finding a Model Or g anism to Study
The following procedure illustrates how to use the MATLAB Help browser
to search the Web for information. In this example, you are interested in
studying Tay-Sachs disease. Tay-Sachs is an autosomal recessive disease
caused by the absence of the enzyme beta-hexosaminidase A (Hex A). This
enzyme is responsible for the breakdown of gangliosides (GM2) in brain and
nerve cells.
First, research information about Tay-Sachs and the enzyme that is a ssociated
with this disease, then find the nucleotide sequence for the human gene
that codes for the enzyme, and finally find a corresponding gene in another
organism to use as a model for study.
1 Use the MATLAB Help browser to explore the Web. In the MATLAB
Command window, type
web('http://www.ncbi.nlm.nih.gov/')
Page 69

Example: Sequence Alignment
The MATLAB Help browser opens with the home page for the NCBI Web
site.
2 Search the NCBI Web site for information. For example, to search for
Tay-Sachs, from the Search list, select
box, enter
Tay-Sachs.
NCBI Web Site,andinthefor
The NCBI Web search returns a list of links to relevant pages.
3 Select a result page. For example, click the link labeled Tay-Sachs
Disease.
A page in the genes and diseases section of the NCBI Web site opens. This
section provides a comprehensive introduction to medical genetics. In
particular, this page contains an introduction and pictorial representation
of the e nzyme Hex A and its role in the metabolism of the lipid GM2
ganglioside.
2-19
Page 70
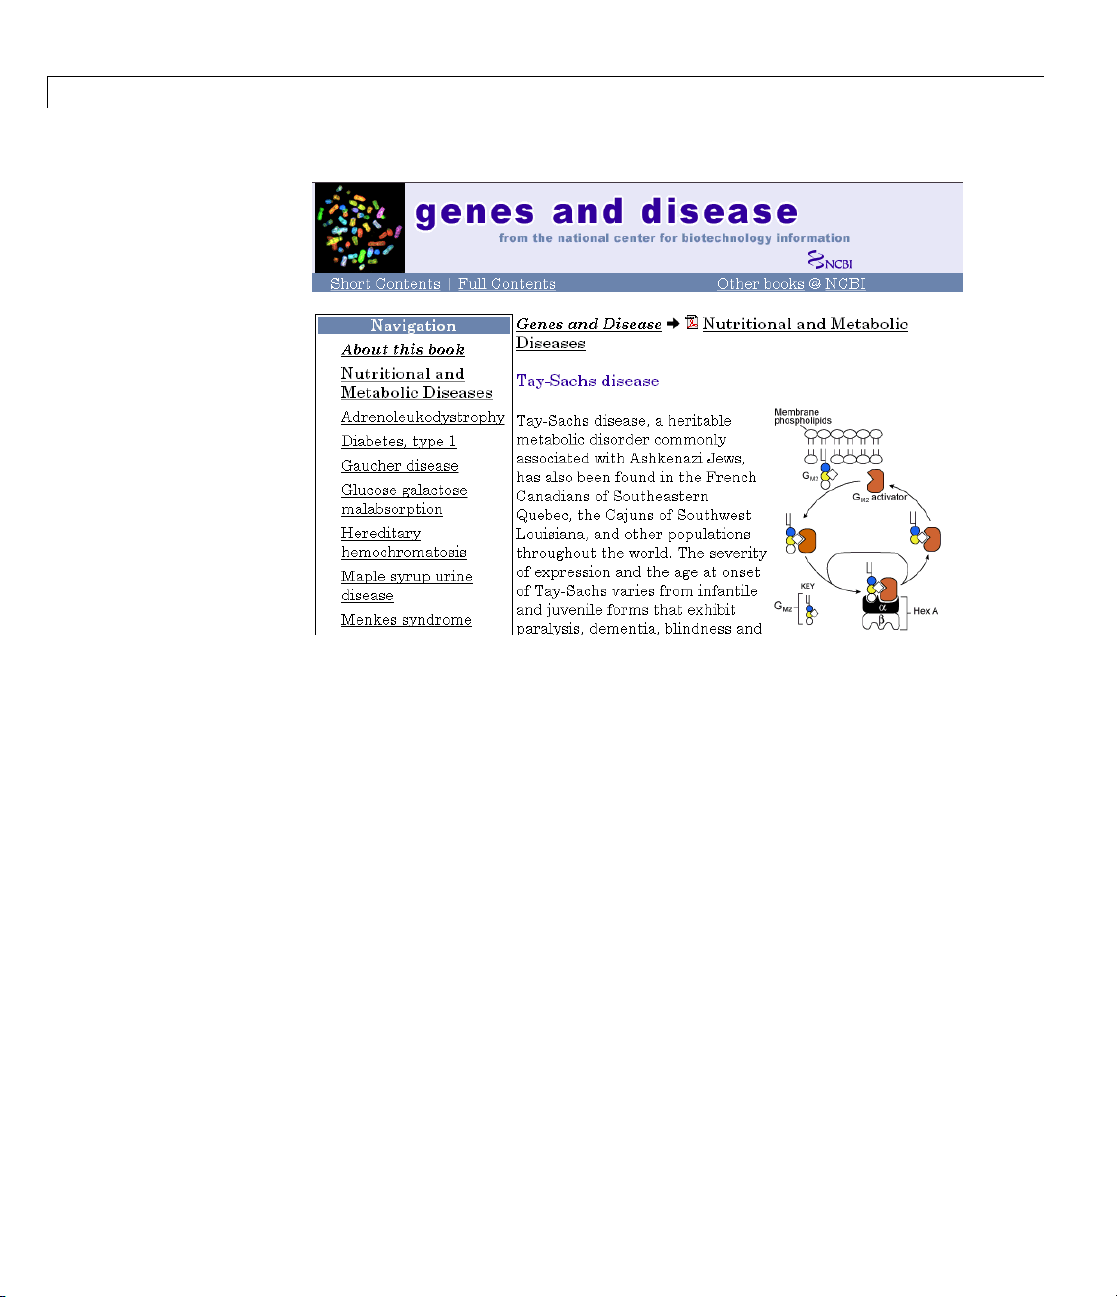
2 Sequence Analysis
2-20
4 After completing your research, you have co ncluded the following:
The gene HEXA codes for the alpha subunit of the dimer enzyme
hexosaminidase A (Hex A), while the gene HEXB codes for the beta subunit
of the enzyme. A third gene, GM2A, codes for the activator protein GM2.
However, it is a mutation in the gene HEXA that causes Tay-Sachs.
Retrieving Sequence Information from a Public
Database
The following procedure illustrates how to find the nucleotide sequence for a
human gene in a public database and read the sequence information into the
MATLAB environment. Many public databases for nucleotide sequences (for
example, GenBank, EMBL-EBI) are accessible from the Web. The MATLAB
Command Window with the MATLAB Help browser provide an integrated
environment for searching the Web and bringing sequence information into
the MATLAB environment.
After you locate a sequence, you need to move the sequence data into the
MATLAB Workspace.
Page 71

Example: Sequence Alignment
1 Open the MATLAB Help browser to the NCBI Web site. In the MATLAB
Command Widow, type
web('http://www.ncbi.nlm.nih.gov/')
The MATLAB He lp browser w indow opens with the NCBI home page .
2 Search for the gene you are interested in studying. For example, from the
Search list, select
Nucleotide,andinthefor box enter Tay-Sachs.
The search returns entries for the genes that code the alpha and beta
subunits of the enzyme hexosaminidase A (Hex A), and the gene that codes
the activator enzyme. The NCBI reference for the human gene HEXA has
accession number
NM_000520.
2-21
Page 72

2 Sequence Analysis
2-22
3 Get sequ
sequenc
ence data into the MATLAB environment. For example, to get
e information for the human gene HEXA, type
humanHEXA = getgenbank('NM_000520')
Note B
chara
The h
lank spaces in GenBank accession numbers use the underline
cter. Entering
'NM 00520' returns the wrong entry.
uman gene is loaded into the MATLAB Workspace as a structure.
humanHEXA =
LocusName: 'NM_000520'
LocusSequenceLength: '2255'
LocusNumberofStrands: ''
LocusTopology: 'linear'
Page 73

LocusMoleculeType: 'mRNA'
LocusGenBankDivision: 'PRI'
LocusModificationDate: '13-AUG-2006'
Definition: 'Homo sapiens hexosaminidase A (alpha polypeptide) (HEXA), mRNA.'
Accession: 'NM_000520'
Version: 'NM_000520.2'
GI: '13128865'
Project: []
Keywords: []
Segment: []
Source: 'Homo sapiens (human)'
SourceOrganism: [4x65 char]
Reference: {1x58 cell}
Comment: [15x67 char]
Features: [74x74 char]
CDS: [1x1 struct]
Sequence: [1x2255 char]
SearchURL: [1x10⁸ char]
RetrieveURL: [1x97 char]
Example: Sequence Alignment
Searching a Public Database for Related Genes
The following procedure illustrates how to find the nucleotide sequence for
a mouse gene related to a human gene, and read the sequence information
into the MATLAB environment. The sequence and fun ction of many gen es
is conserved during the evolution of species through homologous genes.
Homologous genes are genes that have a common ancestor and similar
sequences. One goal of searching a pu blic database is to find similar genes.
If you are able to locate a sequence in a database that is similar to your
unknown gene or protein, it is likely that the function and characteristics of
the known and unknown genes are the same.
After finding the nucleotide sequence for a human gene, you can do a BLAST
search or search in the genome of another organism for the corresponding
gene. This procedure uses the mouse genome as an example.
1 Open the MATLAB Help browser to the NCBI Web site. In the MATLAB
Command window, type
web('http://www.ncbi.nlm.nih.gov')
2-23
Page 74

2 Sequence Analysis
2 Search the nucleotide database for the gene or protein you are interested in
studying. For example, from the Search list, select
for box e nter
hexosaminidase A.
Nucleotide,andinthe
The search returns entries for the mouse and human genomes. The NCBI
reference for the mouse gene HEXA has accession number
AK080777.
2-24
3 Get sequence information for the mouse gene into the MATLAB
environment. Type
mouseHEXA = getgenbank('AK080777')
Page 75

Example: Sequence Alignment
The mouse gene sequence is loaded into the MATLAB Workspace as a
structure.
mouseHEXA =
LocusName: 'AK080777'
LocusSequenceLength: '1839'
LocusNumberofStrands: ''
LocusTopology: 'linear'
LocusMoleculeType: 'mRNA'
LocusGenBankDivision: 'HTC'
LocusModificationDate: '02-SEP-2005'
Definition: [1x150 char]
Accession: 'AK080777'
Version: 'AK080777.1'
GI: '26348756'
Project: []
Keywords: 'HTC; CAP trapper.'
Segment: []
Source: 'Mus musculus (house mouse)'
SourceOrganism: [4x65 char]
Reference: {1x8 cell}
Comment: [8x66 char]
Features: [33x74 char]
CDS: [1x1 struct]
Sequence: [1x1839 char]
SearchURL: [1x10⁷ char]
RetrieveURL: [1x97 char]
Locating Protein Coding Sequences
The following procedure illustrates how to convert a sequence from nucleotides
to amino acids and identify the open reading frames. A nucleotide sequence
includes regulatory sequences before and after the protein coding section. By
analyzing this sequence, you can determine the nucleotides that code for
the amino acids in the final protein.
After you have a list of genes you are interested in studying, you can
determine the protein coding sequences. This procedure uses the human gene
HEXA and mouse gene HEXA as an example.
2-25
Page 76

2 Sequence Analysis
1 If you did not retrieve gene data from the Web, you can load example data
from a MAT-file included with the Bioinformatics Toolbox software. In the
MATLAB Command window, type
load hexosaminidase
The structures humanHEXA and mouseHEXA load into the MATLAB
Workspace.
2 Locate open reading frames (ORFs) in the human gene. For example, for
the human gene HEXA, type
humanORFs = seqshoworfs(humanHEXA.Sequence)
seqshoworfs
creates the output structure humanORFs. This structure
contains the position of the start and stop codons for all open reading
frames (ORFs) on each reading frame.
humanORFs =
1x3 struct array with fields:
Start
Stop
The Help browser opens displaying the three reading frames with the
ORFs colored blue, red, and green. Notice that the longest ORF is in the
first reading frame.
2-26
Page 77

Example: Sequence Alignment
3 Locate open reading frames (ORFs) in the mouse gene. Type:
2-27
Page 78

2 Sequence Analysis
mouseORFs = seqshoworfs(mouseHEXA.Sequence)
seqshoworfs
mouseORFs =
1x3 struct array with fields:
creates the structure mouseORFS.
Start
Stop
The m o use gene shows the longest ORF on the first reading frame.
2-28
Page 79

Example: Sequence Alignment
Comparing Amino
The following pr
functions to com
functions to lo
alignment func
are using amin
After you have
you can conve
their corres
for similari
1 Using the op
and mouse DN
human and m
you do not n
humanProtein = nt2aa(humanHEXA.Sequence);
mouseProtein = nt2aa(mouseHEXA.Sequence);
2 Draw a do
ocedure illustrates how to use global and local alignment
pare two amino acid sequences. You could use alignment
ok for similarities between two nucleotide sequences, but
tions return more biologically meaningful results when you
o acid sequences.
located the open reading frames on your nucleotide sequences,
rt the protein coding sections of the nucleotide sequences to
ponding amino acid sequences, and then you can compare them
ties.
en reading frames identified previously, convert the human
A sequences to the amino acid sequences. Because both the
ouse HEXA genes were in the first reading frames (de fault),
eed to indicate which frame. Type
t p lot comparing the human and mouse amino acid sequences.
Acid Sequences
Type
seqdotplot(mouseProtein,humanProtein,4,3)
ylabel('Mouse hexosaminidase A (alpha subunit)')
xlabel('Human hexosaminidase A (alpha subunit)')
ots are one of the easiest ways to look for similarity between
Dot pl
nces. The diagonal line shown below indicates that there may be a
seque
good a
lignment between the two sequences.
2-29
Page 80

2 Sequence Analysis
3 Globally align the two amino acid sequences, using the Needleman-Wunsch
algorithm. Type
[GlobalScore, GlobalAlignment] = nwalign(humanProtein,...
mouseProtein);
showalignment(GlobalAlignment)
2-30
showalignment
displays the global alignment of the two sequences in
the Help browser. Notice that the calculated identity between the two
sequences is
60%.
Page 81

Example: Sequence Alignment
2-31
Page 82

2 Sequence Analysis
The alignment is very good between amino acid position 69 and 599, after
which the two sequences appear to be unrelated. Notice that there is a
stop (
*) in the sequence at this point. If you shorten the sequences to
include only the amino acids that are in the protein you might g et a better
alignment. Include the amino a cid positions from the first methionine (
the first stop (
4 Trim the sequence from the first start amino acid (usually M)tothefirst
stop (
*) and then try alignment again. Find the indices for the stops in
*) that occurs after the first methionine.
M)to
the sequences.
humanStops = find(humanProtein == '*')
humanStops =
41 599 611 713 722 730
mouseStops = find(mouseProtein == '*')
2-32
mouseStops =
539 557 574 606
Looking at the amino acid sequence for humanProtein,thefirstM is at
position 70, and the first stop after that position is actually the second
stop in the sequence (position 599). Looking at the amino acid sequence
for
mouseProtein,thefirstM is at position 11, and the first stop after that
position is the first stop in the sequence (position 557).
5 Truncate the sequences to include only amino acids in the protein and
the stop.
humanProteinORF = humanProtein(70:humanStops(2))
humanProteinORF =
MTSSRLWFSLLLAAAFAGRATALWPWPQNFQTSDQRYVLYPNNFQFQYDV
SSAAQPGCSVLDEAFQRYRDLLFGSGSWPRPYLTGKRHTLEKNVLVVSVV
TPGCNQLPTLESVENYTLTINDDQCLLLSETVWGALRGLETFSQLVWKSA
EGTFFINKTEIEDFPRFPHRGLLLDTSRHYLPLSSILDTLDVMAYNKLNV
Page 83

Example: Sequence Alignment
FHWHLVDDPSFPYESFTFPELMRKGSYNPVTHIYTAQDVKEVIEYARLRG
IRVLAEFDTPGHTLSWGPGIPGLLTPCYSGSEPSGTFGPVNPSLNNTYEF
MSTFFLEVSSVFPDFYLHLGGDEVDFTCWKSNPEIQDFMRKKGFGEDFKQ
LESFYIQTLLDIVSSYGKGYVVWQEVFDNKVKIQPDTIIQVWREDIPVNY
MKELELVTKAGFRALLSAPWYLNRISYGPDWKDFYIVEPLAFEGTPEQKA
LVIGGEACMWGEYVDNTNLVPRLWPRAGAVAERLWSNKLTSDLTFAYERL
SHFRCELLRRGVQAQPLNVGFCEQEFEQT*
mouseProteinORF = mouseProtein(11:mouseStops(1))
mouseProteinORF =
MAGCRLWVSLLLAAALACLATALWPWPQYIQTYHRRYTLYPNNFQFRYHV
SSAAQAGCVVLDEAFRRYRNLLFGSGSWPRPSFSNKQQTLGKNILVVSVV
TAECNEFPNLESVENYTLTINDDQCLLASETVWGALRGLETFSQLVWKSA
EGTFFINKTKIKDFPRFPHRGVLLDTSRHYLPLSSILDTLDVMAYNKFNV
FHWHLVDDSSFPYESFTFPELTRKGSFNPVTHIYTAQDVKEVIEYARLRG
IRVLAEFDTPGHTLSWGPGAPGLLTPCYSGSHLSGTFGPVNPSLNSTYDF
MSTLFLEISSVFPDFYLHLGGDEVDFTCWKSNPNIQAFMKKKGFTDFKQL
ESFYIQTLLDIVSDYDKGYVVWQEVFDNKVKVRPDTIIQVWREEMPVEYM
LEMQDITRAGFRALLSAPWYLNRVKYGPDWKDMYKVEPLAFHGTPEQKAL
VIGGEACMWGEYVDSTNLVPRLWPRAGAVAERLWSSNLTTNIDFAFKRLS
HFRCELVRRGIQAQPISVGCCEQEFEQT*
6 Globally align the trimmed amino acid sequences. Type
[GlobalScore_trim, GlobalAlignment_trim] = nwalign(humanProteinORF,...
mouseProteinORF);
showalignment(GlobalAlignment_trim)
showalignment
that the percent identity for the untrimmed sequences is
displays the results for the second global alignment. Notice
60% and 84% for
trimmed sequences.
2-33
Page 84

2 Sequence Analysis
2-34
7 Another way to truncate an amino acid sequence to only those amino acids
in the protein is to first truncate the nucleotide sequence with indices from
Page 85

Example: Sequence Alignment
the seqshoworfs function. Remember that the ORF for the human HEXA
gene and the ORF for the mouse HEXA were both on the first reading
frame.
humanORFs = seqshoworfs(humanHEXA.Sequence)
humanORFs =
1x3 struct array with fields:
Start
Stop
mouseORFs = seqshoworfs(mouseHEXA.Sequence)
mouseORFs =
1x3 struct array with fields:
Start
Stop
humanPORF = nt2aa(humanHEXA.Sequence(humanORFs(1).Start(1):...
humanORFs(1).Stop(1)));
mousePORF = nt2aa(mouseHEXA.Sequence(mouseORFs(1).Start(1):...
mouseORFs(1).Stop(1)));
[GlobalScore2, GlobalAlignment2] = nwalign(humanPORF, mousePORF);
Show the alignment in the Help browser.
showalignment(GlobalAlignment2)
The result from first truncating a nucleotide sequence before converting it
to an amino acid sequence is the same as the result from truncating the
amino acid sequence after conversion. See the result in step 6.
An alternative method to working with subsequences is to use a local
alignment function with the nontruncated sequences.
2-35
Page 86

2 Sequence Analysis
8 Locally align the two amino acid seque nces using a Smith-Waterman
algorithm. Type
[LocalScore, LocalAlignment] = swalign(humanProtein,...
mouseProtein)
LocalScore =
1057
LocalAlignment =
RGDQR-AMTSSRLWFSLLLAAAFAGRATALWPWPQNFQTSDQRYV . . .
|| | ||:: ||| |||||||:| ||||||||| :|| :||: . . .
RGAGRWAMAGCRLWVSLLLAAALACLATALWPWPQYIQTYHRRYT . . .
9 Show the alignment in color.
showalignment(LocalAlignment)
2-36
Page 87

Example: Sequence Alignment
2-37
Page 88

2 Sequence Analysis
Sequence Tool
In this section...
“Overview of the Sequence Tool” on page 2-38
“Importing a Sequence” on page 2-38
“Viewing Nucleotide Sequence Information” on page 2-40
“Searching for Words” on page 2-42
“Exploring Open Reading Frames” on page 2-44
“Viewing Amino Acid Sequence Statistics” on page 2-47
“Closing the Sequence Tool” on page 2-51
“References” on page 2-51
Overview of the Sequence Tool
The Sequence Tool window integrates many of the sequence functions in the
toolbox. Instead of entering commands in the MATLAB Command Window,
you can se le ct and enter options.
2-38
Importing a Sequence
The first step when analyz in g a nucleotide or amino acid sequence is to import
sequence information into the MATLAB environment. The Sequence Tool can
connect to Web databases such as NCBI and EMBL and read information into
the MATLAB environment.
The following procedure illustrates how to retrieve sequence information from
the NCBI database on the Web. This example uses the GenBank accession
number NM_000520, which is the human gene HEXA that is associated with
Tay-Sachs disease.
1 In the MATLAB Command Window, type
seqtool
The Sequence Tool window opens without a sequence loaded. Notice that
the panes to the right and bottom are blank.
Page 89

Sequence Tool
2 To retrieve a sequence from the NCBI database, select File > Download
Sequence from > NCBI.
The Download Sequence from NCBI dialog box opens.
3 In the Enter Sequence box, type an accession number for an NCBI
database e ntry, for example, NM_000520.ClicktheNucleotide option
button, and then click OK.
The MATLAB software accesses the NCBI database on the Web, loads
nucleotide sequence information for the accession number you entered,
and calculates some basic statistics.
2-39
Page 90

2 Sequence Analysis
2-40
Viewin
After y
infor
for OR
1 In the
info
2 Now click Features. The right pane displays NCBI feature information,
including index numbers for a gene and any CDS sequences.
3 Click ORF to show the search results for ORFs in the six reading frames.
g Nucleotide Sequence Information
ou import a sequence into the Sequence Tool window, you can read
mation stored with the sequence, or y ou can view graphic representations
Fs and CDSs.
left pane tree, click Comments. The right pane displays general
rmation about the sequence.
Page 91

Sequence Tool
4 Click Annotated CDS to show the protein coding part of a nucleotide
sequence.
2-41
Page 92

2 Sequence Analysis
2-42
Search
The fol
seque
and pa
1 Selec
2 In the Find Word dialog box, type a sequence word or pattern, for example,
atg,andthenclickFind.
ing for Words
lowing procedure illustrates how to search for characteristic words and
nce patterns. You will search for sequence patterns like the TATAA box
tterns for specific restriction enzymes.
t Sequence > Find Word.
Page 93

Sequence Tool
The Sequence T
selected wor
d.
ool window s earches and displays the location of the
3 Clear the display by clicking the Clear Word Selection button on
the toolbar.
2-43
Page 94

2 Sequence Analysis
Exploring Open R
The following pr
nucleotide sequ
of a nucleotide
coding part of a
amino a cid seq
1 In the left pan
TheSequenceToolwindowdisplaystheORFsforthesixreadingframesin
the lower-rig ht pane. Hover the cursor over a frame to display information
about it.
2 Click the longest ORF on reading frame 2.
The ORF is highlighted to indicate the part of the sequence that is selected.
ocedure illustrates how to identify the protein coding part of a
ence and copy it into a new view. Identifying coding sections
sequence is a common bioinformatics task. After locating the
sequence,youcancopyittoanewview,translateittoan
uence, and continue with your analysis.
e, click ORF.
eading Frames
2-44
3 Right-click the selected ORF and then select Export to Workspace.In
theExporttoMATLABWorkspacedialogbox,typeavariablename,for
example, NM_000520_ORF_2,thenclickExport.
Page 95

The NM_000520_ORF_2 variable is added to the MATLAB Workspace.
4 Select File > Import from Workspace. Type the name of a variable
with an exported ORF, for example, NM_000520_ORF_2,andthenclick
Import.
The Sequence Tool window adds a tab at the bottom for the new sequence
while leaving the original sequence open.
Sequence Tool
2-45
Page 96

2 Sequence Analysis
2-46
5 In the left pane, click Full Translation. Select Display > Amino Acid
Residue Display > One Letter Code.
The Sequence Tool window displays the amino acid sequence below the
nucleotide sequence.
Page 97
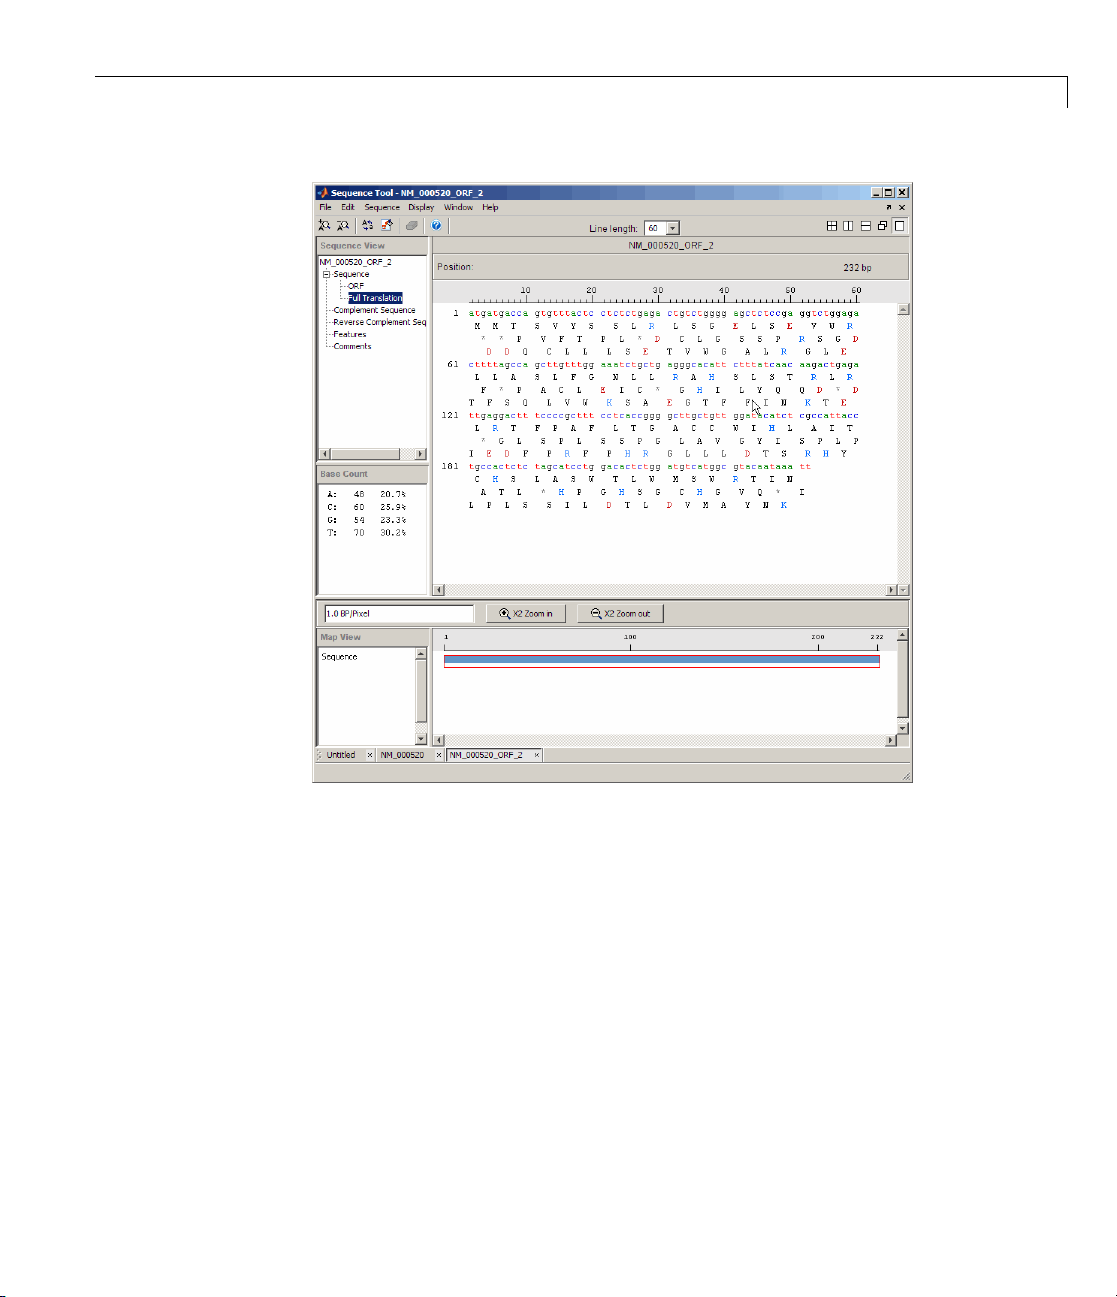
Sequence Tool
Viewin
The fol
an ORF
acid s
This e
alpha
1 Sele
The Download Sequence from NCBI dialog box opens.
g Amino Acid Sequence Statistics
lowing procedure illustrates how to view an amino acid sequence for
located in a nucleotide sequence. You can import your own amino
equence, or you can get a protein sequence from the GenBank database.
xample uses the GenBank accession number NP_000511.1, which is the
subunit for a human enzyme associated with Tay-Sachs disease.
ct File > Download Sequence from > NCBI.
2-47
Page 98

2 Sequence Analysis
2 In the Enter Sequence box, type an accession number for an NCBI
database entry, for example, NP_000511.1.ClicktheProtein option
button, and then click OK.
The MATLAB software accesses the NCBI database on the Web and loads
amino acid sequence information for the accession number you entered.
2-48
Page 99

Sequence Tool
3 Select Display>AminoAcidColorScheme,andthenselectCharge,
Function, Hydrophobicity, Structure,orTaylor. Fo r example, select
Function.
The display colors change to highlight charge information about the amino
acid residues. The following table shows color legends for the amino acid
color schemes.
2-49
Page 100

2 Sequence Analysis
2-50
Amino Acid Color Schem e Color Leg end
Charge • Acidic — Red
• Basic — Light Blue
• Neutral — Black
tion
Func
• Acidic — Red
• Basic — Light Blue
• Hydropobic, nonpolar — Black
• Polar, uncharged — Green
 Loading...