

Page 1

Español
Italiano
English
Deutsch
Français
Nederlands
Instruction Manual
DATA LOGGING SOFTWARE FOR
4-WAY BALL VALVE DIGITAL MANIFOLD
Gebrauchsanweisung
DATA LOGGING-SOFTWARE FÜR
DIGITALE 4-WEGE-MONTEURHILFE
Manuel d’Instructions
LOGICIEL D’ENREGISTREMENT DE DONNEES POUR
MANIFOLD NUMERIQUE A VANNE A BILLE - 4 VOIES
Manual de Instrucciones
PROGRAMA DEL DATA LOGER PARA
EL MANOMETRO DIGITAL DE 4-VIAS
Manuale d’Istruzioni
SOFTWARE DI REGISTRAZIONE-DATI PER GRUPPO
MANOMETRICO DIGITALE A 4 VIE CON VALVOLA A SFERA
Handleiding
DATA LOGGING SOFTWARE VOOR DIGITALE 4-WEG
MANIFOLD MET KOGELKRANEN
www.mastercool.com
1
Page 2
DATA LOGGING SOFTWARE FOR
4-WAY BALL VALVE DIGITAL MANIFOLD
The Mastercool Data Logger Application provides all the necessary Recorder and Display
Functions to record, display and save new data or playback and review previously recorded
files.
SYSTEM REQUIREMENTS
The application is designed to run under Windows 2000, XP, Windows Vista and Windows 7.
There are two installers on the CD:
1) Setup.exe: Installs the Mastercool Data Logger application and all
required components except for the USB driver for the digital manifold.
(see CP210x_VCP_Win_XP_S2K3_Vista_7.exe information below)
2) CP210x_VCP_Win_XP_S2K3_Vista_7.exe: Installs the USB device driver
for the digital manifold.
Note: for Windows 7 or later versions the driver installation will not be
necessary.
SOFTWARE AND DRIVER INSTALLATION
Software Installation
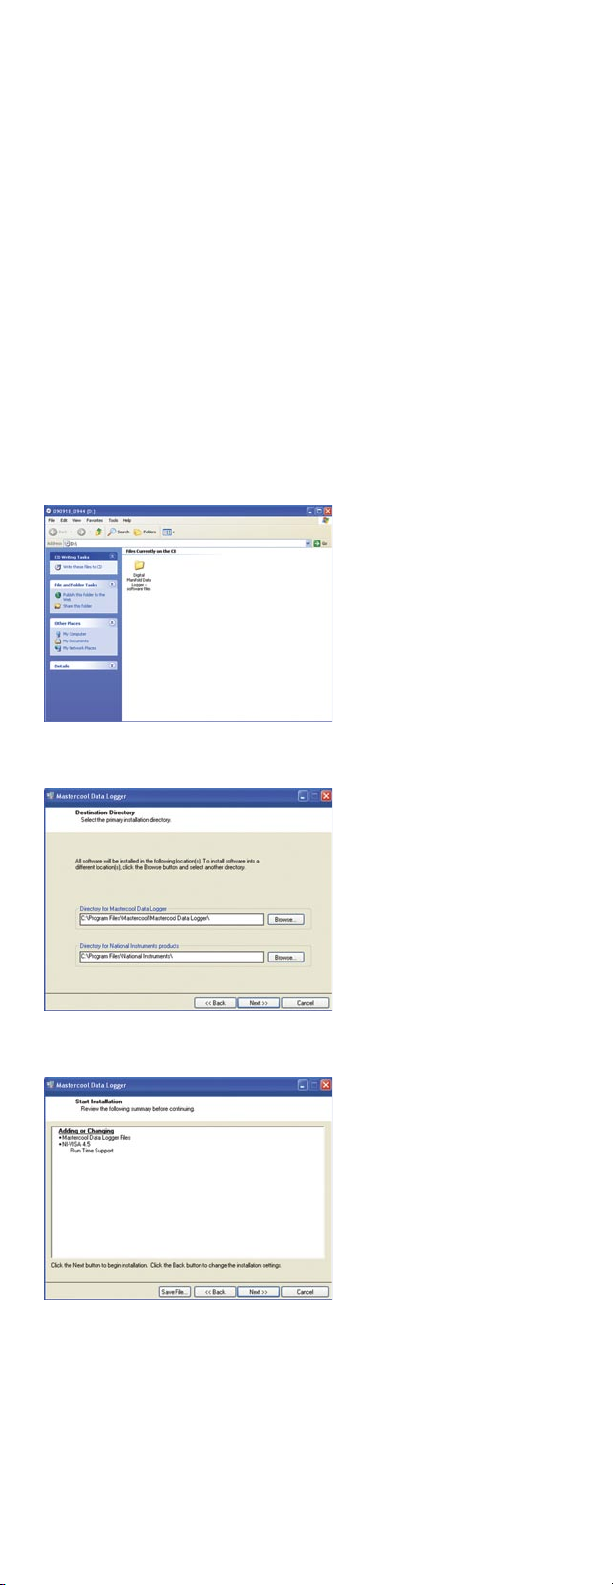
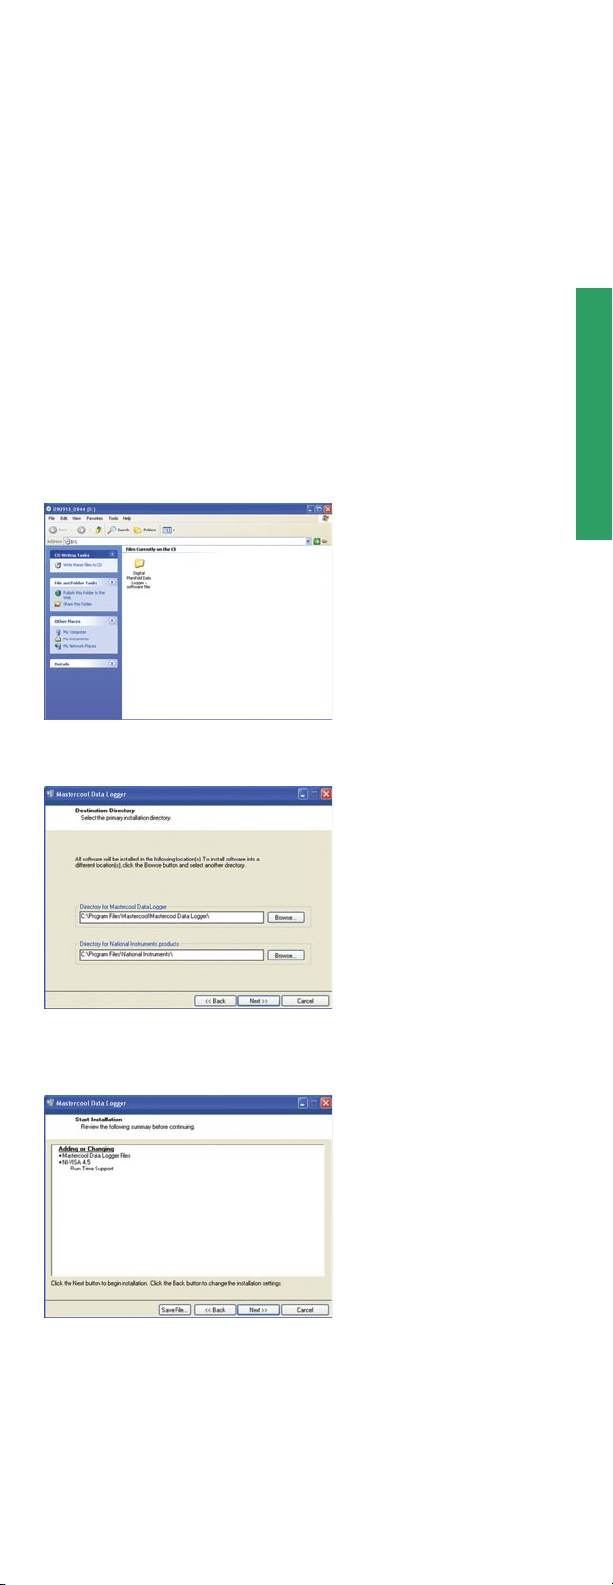
1) Insert the Mastercool Data Logger Software into your CD-ROM drive.
2) Open the Digital Manifold Data Logger Software file folder.
3) Double click Setup.exe.
4) Choose a destination directory and select NEXT.
5) Accept the License Agreement and select NEXT.
6) The Start Installation Dialog box will appear, Review the Summary and select NEXT.
7) Once installation is completed successfully, select FINISH.
2
www.mastercool.com
Page 3
8) You will then be prompted to restart your computer. Select RESTART LATER
and proceed to install the USB device drivers.
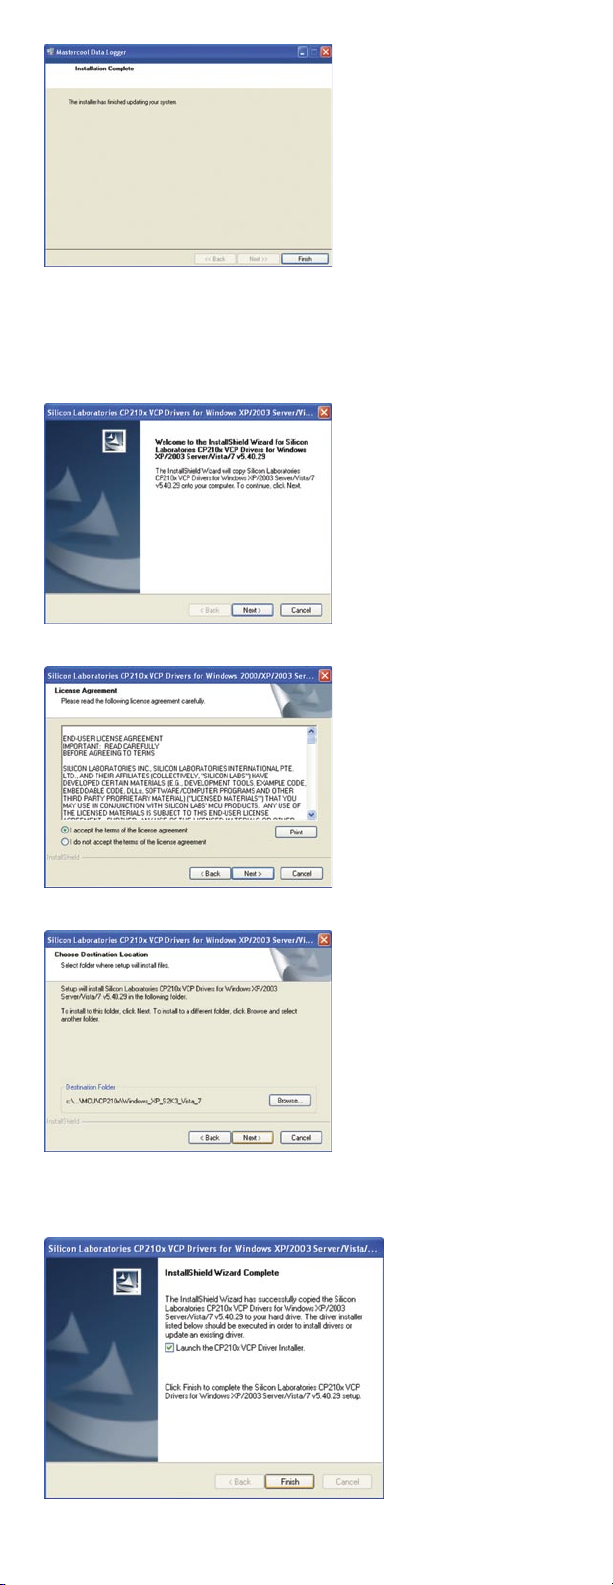
Driver Installation
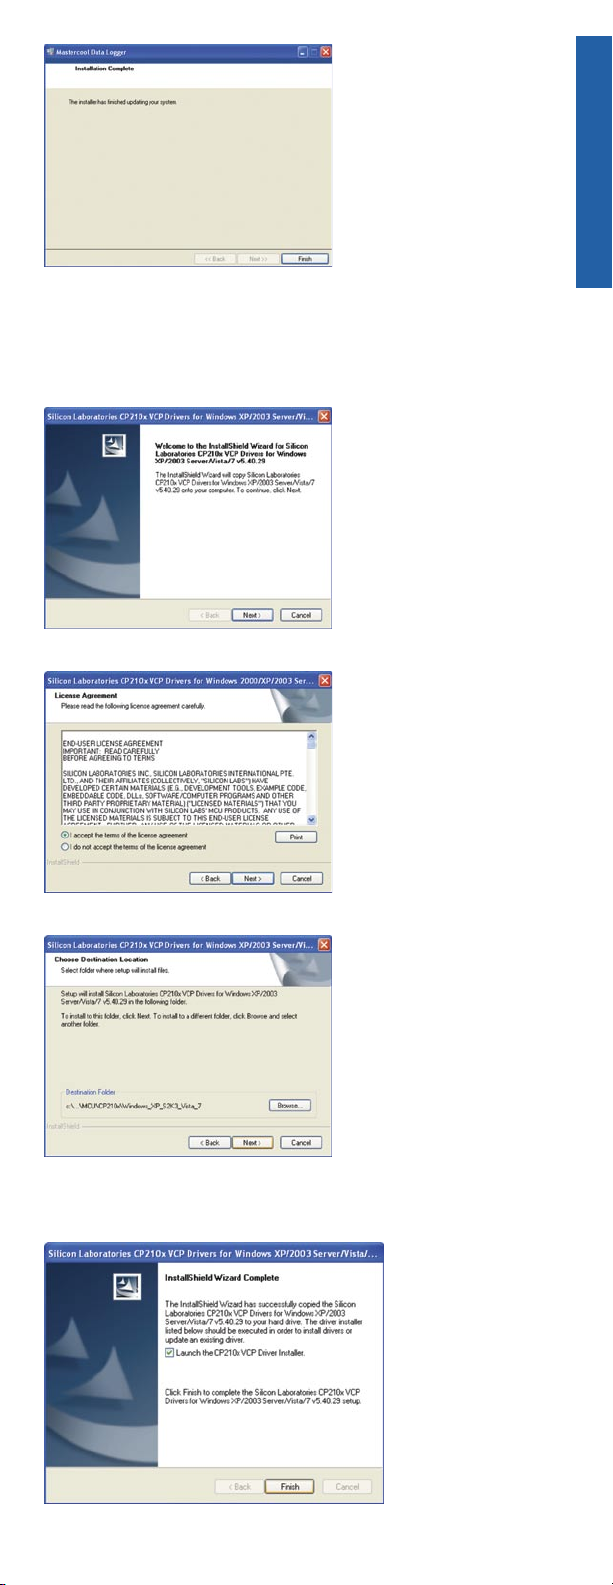
1) Double click CP210x_VCP_Win_XP_S2K3_Vista_7.exe.
2) When “Welcome to the Install Shield Wizard” appears select NEXT.
3) Accept the License Agreement.
English
4) Choose a destination location and select NEXT.
5) When “Ready to Install the Program” appears select INSTALL.
6) Once installation is complete, select FINISH. Be sure “Launch the CP210xVCP
Driver Installer” is checked.
7) Silicon Lab CP210x USB to UART Bridge Installer appears, select NEXT.
www.mastercool.com
3
Page 4
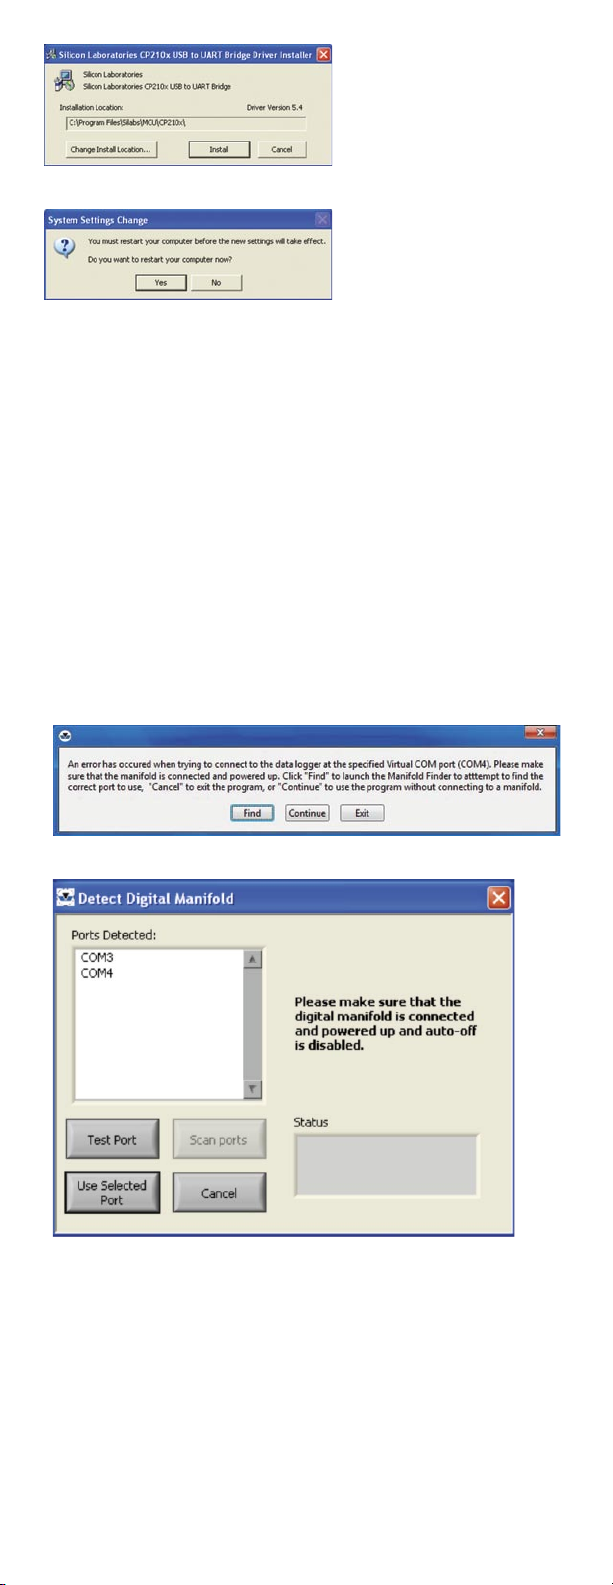
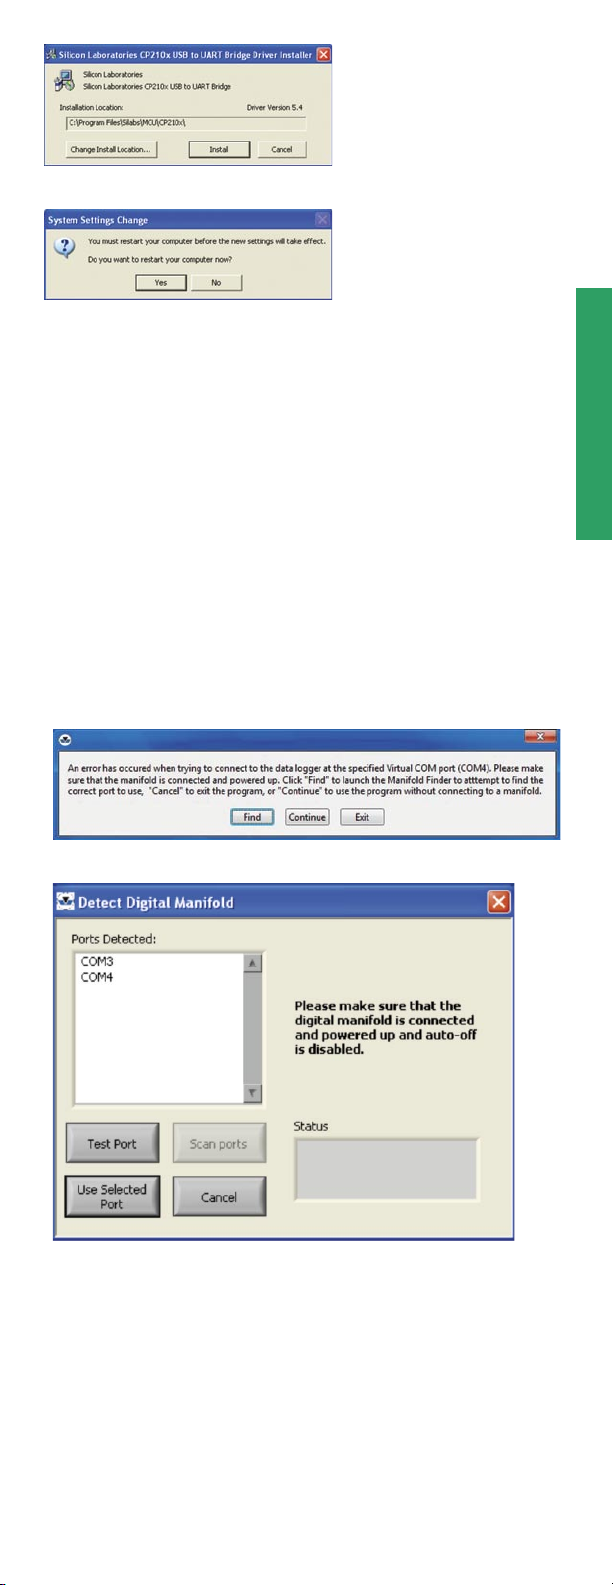
8) Restart your computer when prompted.
To Display data from the digital manifold in “real time” please follow the
below instructions.
CONNECTING TO THE MANIFOLD FOR THE FIRST TIME
IMPORTANT: Auto-Off must be disabled for the manifold to communicate with the
software
1) Install the Data Logger application and the USB device driver as described
above.
2) Connect the manifold to the computer using the provided USB cable.
3) Power on the Digital Manifold.
4) Windows will assign a “Virtual COM” port to the manifold. Please note that the port
number assigned can vary on different machines.
5) Open the Mastercool Data Logger Application by going to Start > All Programs>
Mastercool Data Logger > Mastercool Data Logger.
6) The first screen includes: a Customer Name (or installation location), Date and
Technician’s Name text box, followed by an ENTER command. Enter all three fields and
select ENTER.
7) If your PC has not assigned COM4 as the port for the manifold, then you will be
prompted after a few seconds:
Select Find to Display the Manifold Finder Window:
Select the last port listed, and click “Test Port.” If this is the port that was signed to the
manifold, you will receive the message “Digital Manifold Detected.” Select “Use
Selected Port” to continue. If the Status box indicates that the manifold isn’t detected, try
testing the other ports. Highlight a port and select “Test Port.” Once you have
determined which port the manifold has been assigned to, the application will continue
to use this port each time the program is launched.
LAUNCHING THE MASTERCOOL DATA LOGGER SOFTWARE
To initiate the Mastercool Data Logger (MDL), go to the folder where you installed the data
logger program and double click the Mastercool icon.
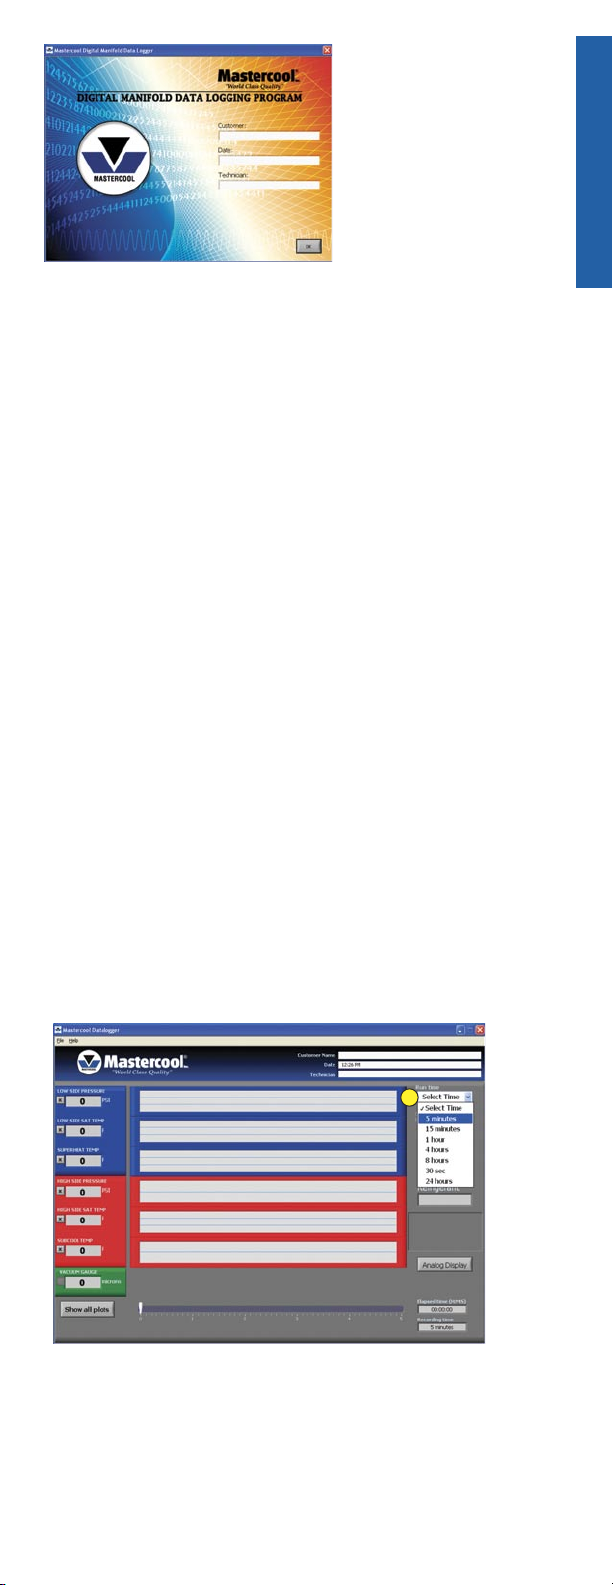
The welcome screen appears and includes: a Customer Name (or installation location),
Date and Technician’s Name text box, followed by an ENTER command. Enter all three
fields and select ENTER to proceed.
4
www.mastercool.com
Page 5
DATA LOGGER BASICS
• A Time-Line is displayed at the bottom of the screen, that measures the selected
recording time with respect to the elapsed time from the start of the recording event.
In the event that a cursor is also selected, a “time” window appears beneath the cursor,
indicating when that event took place, as measured from the start of the recording event.
When the cursor is de-selected, the “time” window disappears.
• A selected Recording Time window is displayed in the bottom right hand corner of the
screen, which displays the total length of the Recording Time selected.
• The program uses the units information contained in each data bit on the manifold and
displays these units on the main screen and/or the analog screen as required.
• The Data Logger will display NaN or 0 when no value is displayed. (NaN stands for “Not a
Number”). Data points that are NaN or 0 do not appear on a plot, but are present
nonetheless. Periods of time in a plot where there is no value displayed will show up as
a gap in the plot.
WARNING DIALOG BOX
The warning dialog box is located on the right hand side of the screen. When a warning is
displayed it will blink in red and yellow text. The following warnings may be displayed:
• Warning! Please replace the battery in your digital manifold!
This message alerts the user that the digital manifold’s battery needs replacing.
• No data/invalid data! Please confirm that the manifold is connected, powered up and
auto-off is disabled. Go to the file menu and select manifold finder to attempt to
reconnect.
When this message appears navigate to File > Manifold Finder to select the appropriate
port for communicating with the manifold as discussed in section entitled CONNECTING
TO THE MANIFOLD FOR THE FIRST TIME.
English
RECORDING MEASUREMENTS
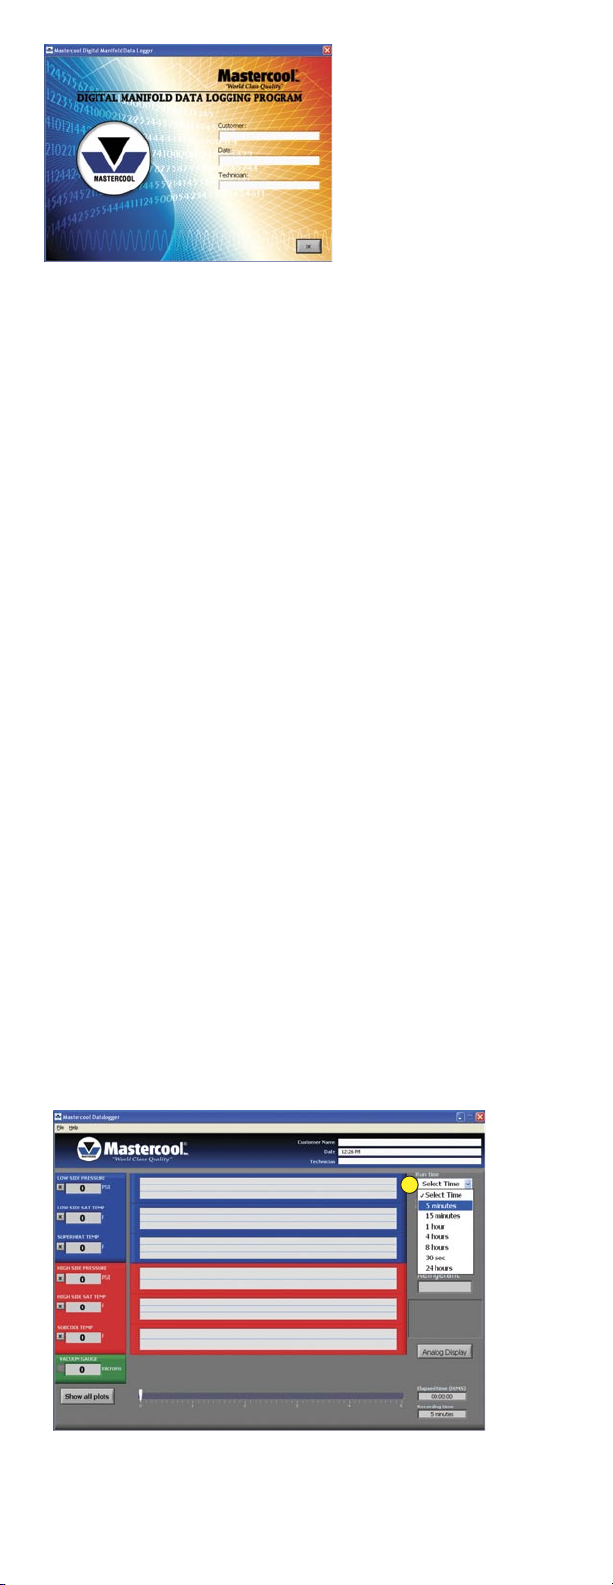
• Recorder Time command [RUN TIME] is the selected amount of time the data logger
software records the data from the manifold. The following recorder times are available:
5 minutes, 15 minutes, 1 hour, 4 hours, 8 hours and 24 hours.
• Data will be recorded to a log file. You will have an opportunity to save this file when the
run is complete.
TO BEGIN RECORDING
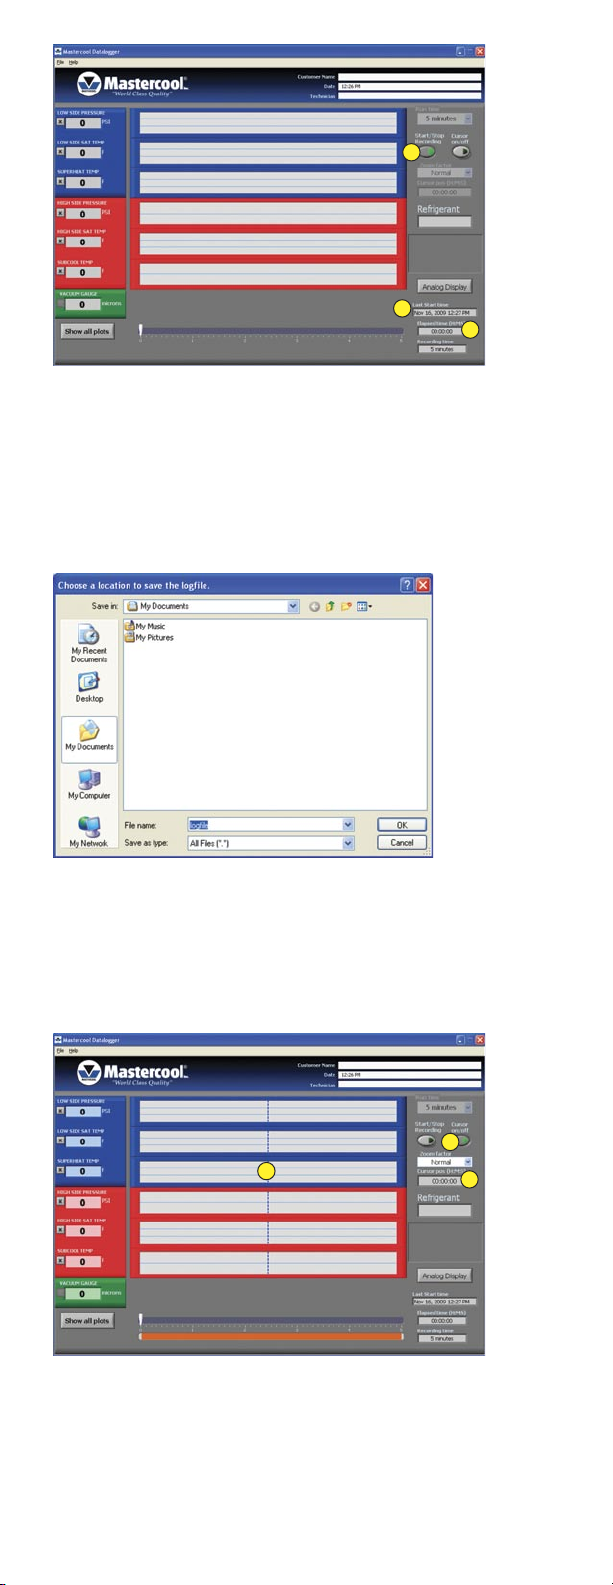
1) Click the “SELECT TIME” (fig. 1) drop down menu to choose a length of time for
recording.
1
2) Click the “START/STOP RECORDING” button (fig. 2) to begin plotting the data. The
START/STOP RECORDING arrow on the button will illuminate green to indicate the
recording process has begun.
www.mastercool.com
5
Page 6
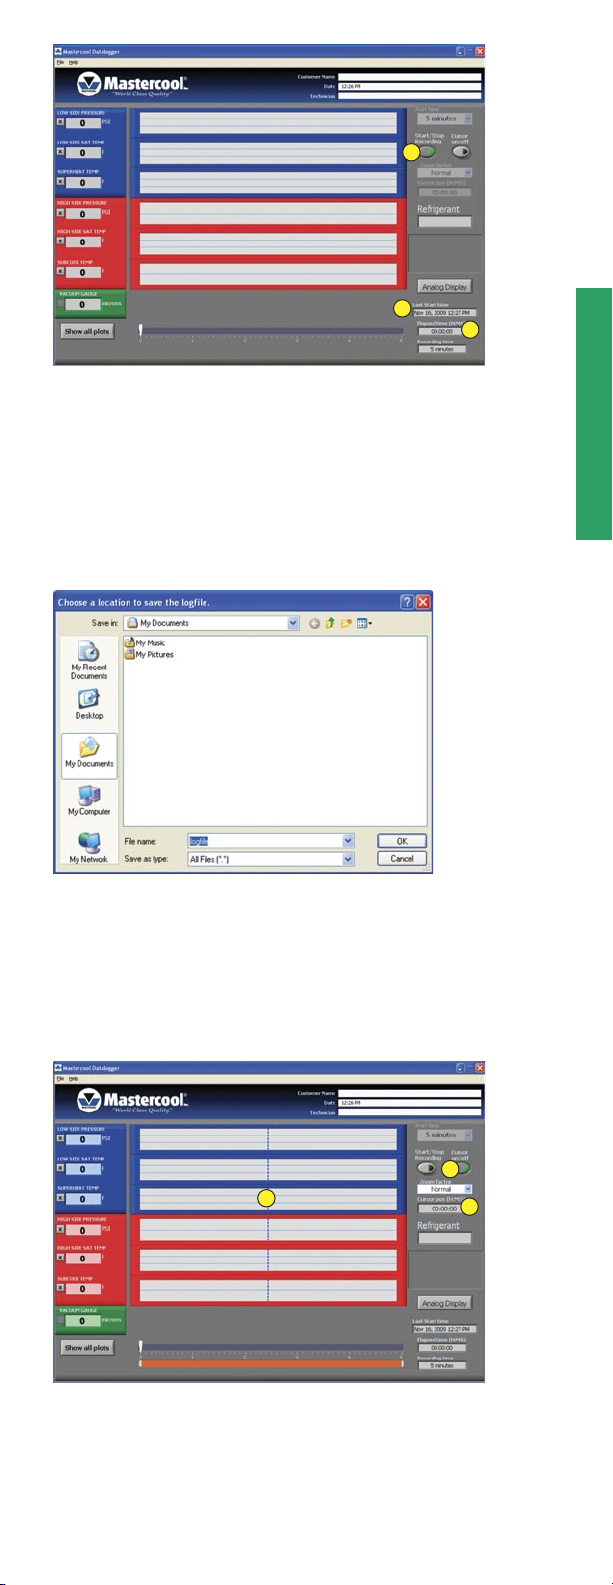
2
4
3
3) While the recording is in progress, indicators will show the ELAPSED TIME (fig. 3) and
the LAST START TIME of the recording (fig. 4) in the bottom right hand corner of the
screen.
NOTE: To end the recording before the time has elapsed, click “START/STOP RECORDING” (fig. 2.) You will be prompted to confirm that you want to end the recording and
if so, if you would like to save the log file.
4) When the set recording time is complete, you will be prompted to save the recording. A
window will appear that states: CHOOSE A LOCATION TO SAVE THE LOG FILE. Give the
file a name and specify where you would like to save the file.
USING CURSORS & ZOOM
CURSOR COMMAND
• CURSOR ON/OFF command is used to provide a better view of the features in the plot
that you wish to examine more closely. It is also used to show the temperature and
pressure values at specific times.
1) Click the CURSOR ON/OFF button (fig. 5) to turn the cursor on or off. The CURSOR ON/
OFF arrow on the button will illuminate green to indicate you are in cursor mode.
5
6
2) When the cursor is turned on, you will see a vertical dashed line (fig. 6) that denotes the
cursor location. Click and drag this vertical dashed line to the position of interest.
NOTE: When the cursor is turned on, the numeric indicators will have a colored
background and will display the value at the location of the cursor.
3) The time position of the cursor can be found in the “CURSOR POSITION” indicator (fig. 7)
on the right side of the screen. The time position is indicated in Hours:Minutes:Seconds.
4) When the cursor is turned off, the plot will revert to the full recording length and the
numeric indicators will revert to a gray background color.
6
www.mastercool.com
7
Page 7
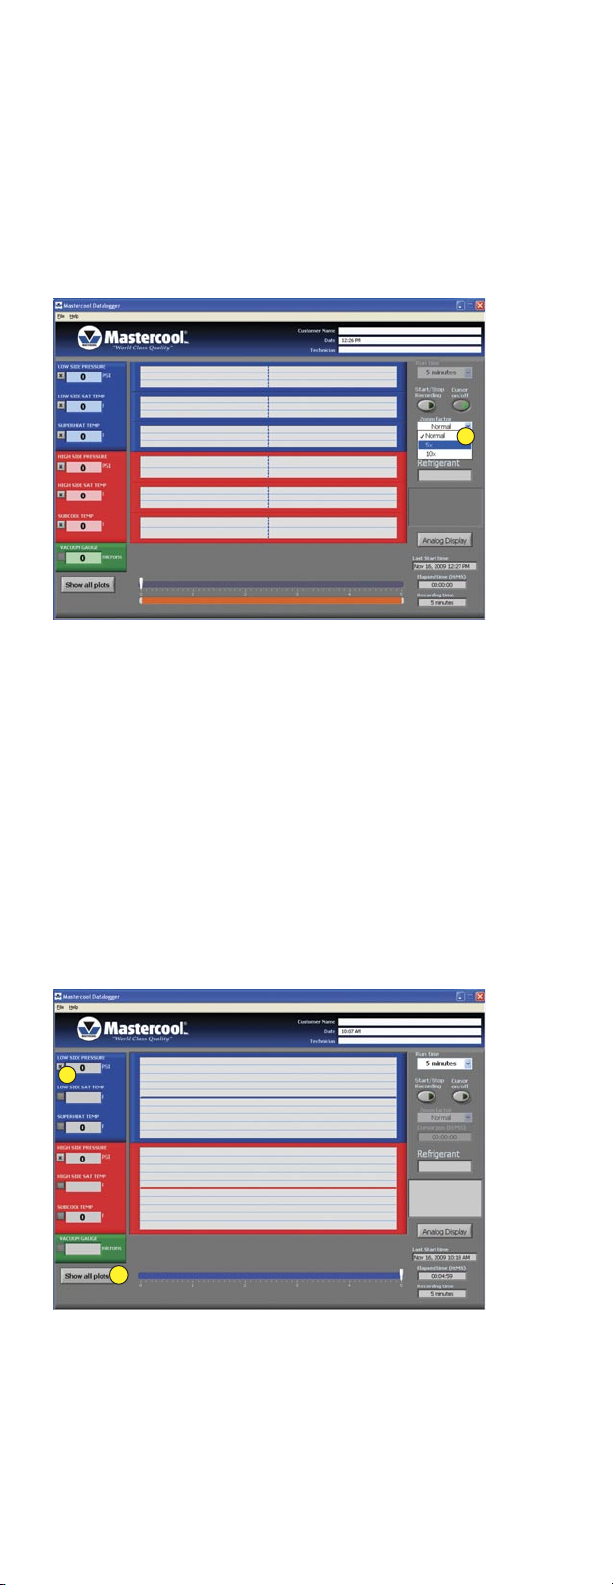
ZOOM COMMAND
• ZOOM FACTOR can be displayed in NORMAL, 5X or 10X mode. The selected scale;
NORMAL, 5X or 10X does not have any affect on the data being recorded other than
digitally stretching the data being viewed and displayed. The intended use and
application of the zoom (scale) factor is to view specific data points of interest. The
cursor command must be turned on to enter the Zoom mode.
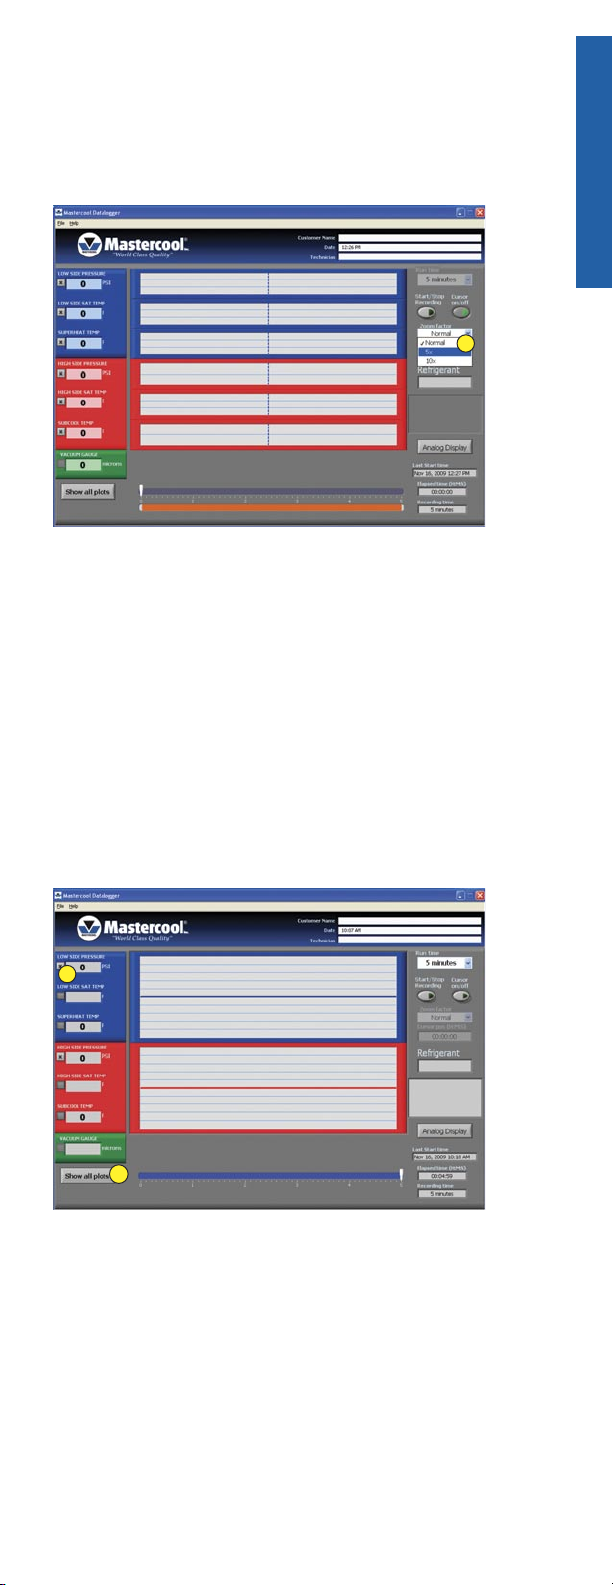
1) Click the “ZOOM FACTOR” (fig. 8) drop-down menu to select either a factor of
5x or 10x.
8
DISPLAY FUNCTION FEATURES
• Display ALL command. This enables all parameters of the Digital Manifold to be displayed
simultaneously. As the line functions propagate across the screen, the value of the
“real-time” data will also be displayed digitally.
• The user also has the option of monitoring only specific individual functions if desired. In
that event, even if the display is in the view ALL functions mode, the user can
over-ride the view ALL option by simply selecting the function of interest with his mouse.
The Mastercool Data Logger shall continue to record all the functions in the background,
regardless of how many individual functions are being displayed.
• Display DEEP VACUUM ONLY command. This enables only the deep vacuum readings to
be displayed on the screen. The software will automatically enter this mode when deep
vacuum is achieved through a thermocouple connection and the manifold is recording in
“real time.”
SELECTING THE PLOTS TO VIEW
1) Click the check box buttons on the left side of the screen to enable or disable the
viewing of specific plots (fig. 9.)
English
9
10
2) Click “SHOW ALL PLOTS” (fig. 10) to quickly turn on all plots that are not being
displayed.
NOTE: Data continues to be logged for all plots regardless of whether a plot is being
displayed.
VACUUM READINGS
• There are two ways to measure vacuum:
a) Directly through the manifold where negative pressure is represented in PSI, INHg, Bar,
MPa or Kg/cm2.
b) Using a thermocouple connection to achieve a high accuracy reading. Readings can be
represented in Micron, mBar, KPa, mmHg, Pa, Torr and mTorr.
THERMOCOUPLE CONNECTION
When using a thermocouple connection the data can be graphed and recorded using the
DEEP VACUUM ONLY selection mentioned above.
1) Connect the thermocouple sensor and press the vacuum button. When DEEP
www.mastercool.com
7
Page 8
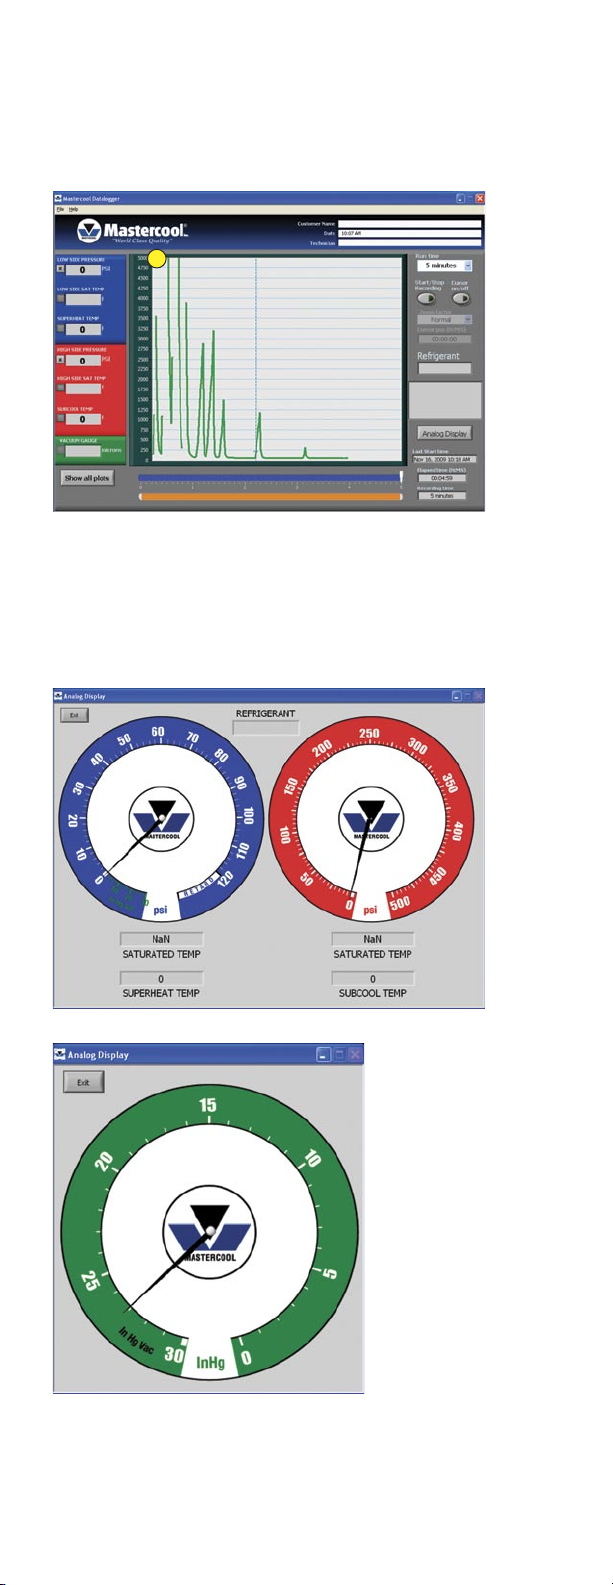
VACUUM ONLY is selected a larger green graph as seen below will appear and begin to
chart the activity.
2) The standard range represented on the data logger chart is 0 - 5000. The user can
manually change this range by clicking on the top number and changing it to the desired
range (fig. 11.)
NOTE: When positive pressure is achieved the DEEP VACUUM screen will revert to the
display ALL screen.
11
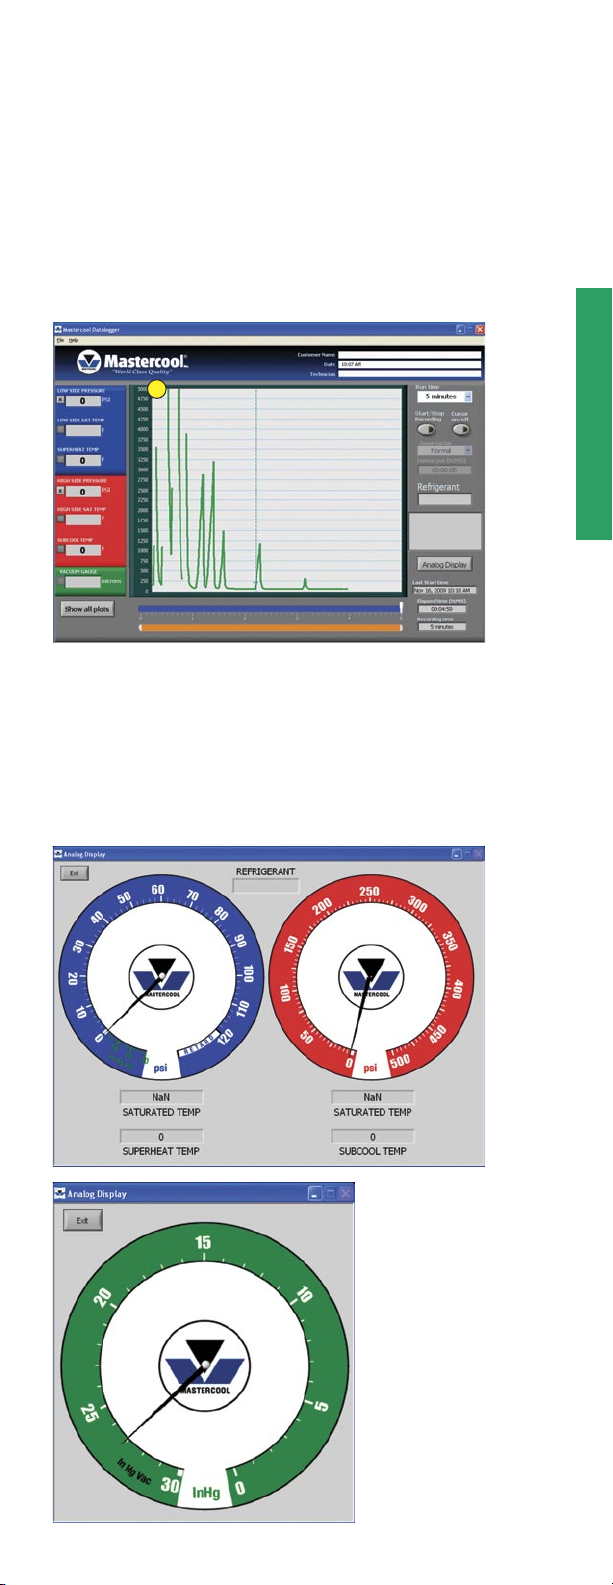
ANALOG DISPLAY
• The ANALOG DISPLAY function enables the user to represent the Digital Manifold digital
data in the form of two large analog gauges.
1) Select the ANALOG DISPLAY button to enter the analog mode. A separate window will
display showing the digital data in an analog format (fig. 12).
NOTE: When pressure enters a negative range the gauges will switch to vacuum
gauge mode (fig 13).
Fig. 12
Fig. 13
2) Click the EXIT button in the top left hand corner of the screen to return to the main
screen.
PLAYING BACK A RECORDING
1) To play back a file that was previously recorded and saved, go to File > Replay from File.
8
www.mastercool.com
Page 9
2) A “CHOOSE FILE TO READ” dialog box will be displayed. Select the log file you
wish to display.
a) Navigate to the location of the file
b) Select it
c) Click OK.
English
The application will show you a plot of the data from the run. To scroll through the data you
must be in CURSOR mode. Move the cursor along the time line to examine the data. All of
the program features are enabled except for displaying the data in “real time.”
PRINTING DATA
• A Print Window option is located under the file menu. If at any point you would like to
print the data that is on the display.
EXPORTING DATA
• An export data option is located under the file menu. If you would like to export a log
file go to File > Export. A window appears asking you to select a log file to export and a
destination. Once those options are selected click Export. A .txt file will be created.
IMPORTING RECORDED DATA INTO THE MASTERCOOL DATA LOGGING
PROGRAM
NOTE: Auto-Off must be disabled for the manifold to communicate with the software.
1) Connect the manifold to the computer using the provided USB cable.
2) Power ON the digital manifold.
3) Open the Data Logger Program.
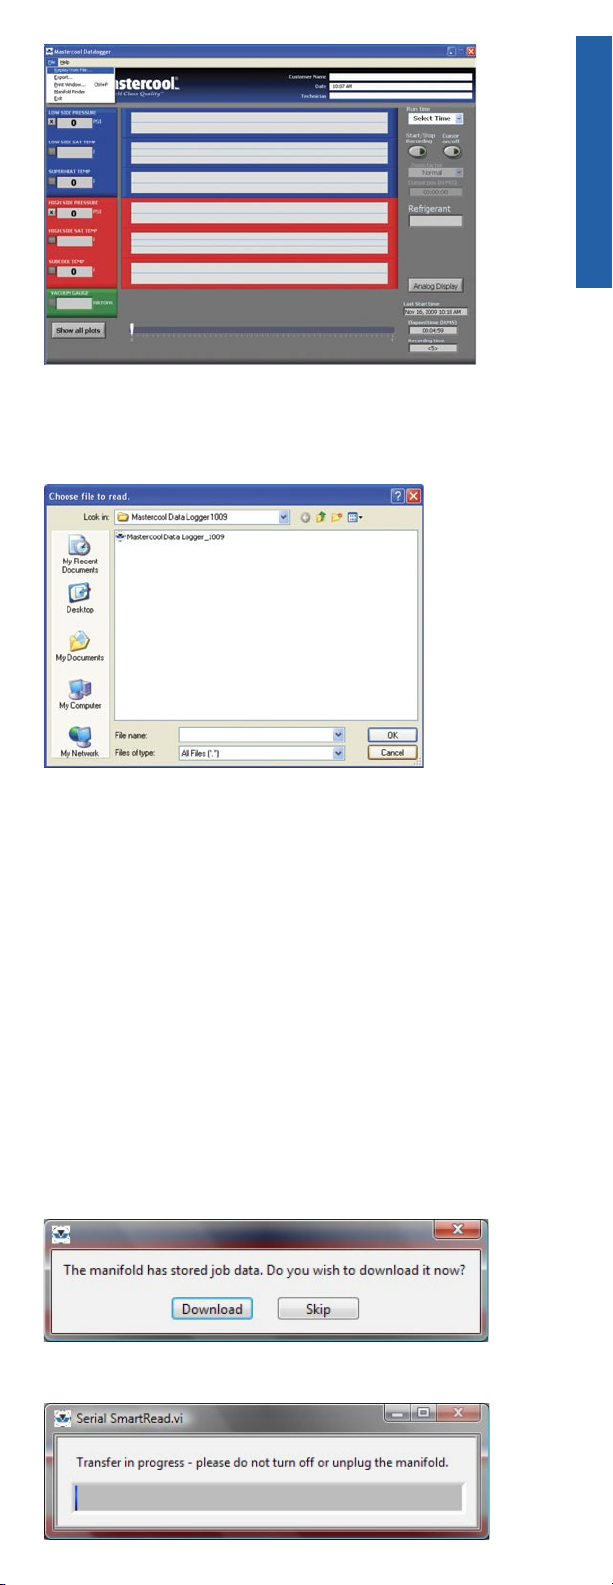
4) Upon startup, the logger will show the following screen if there is data to download.
Select download.
5) The user will see the following screen during the transfer. The slider represents the %
complete.
www.mastercool.com
9
Page 10
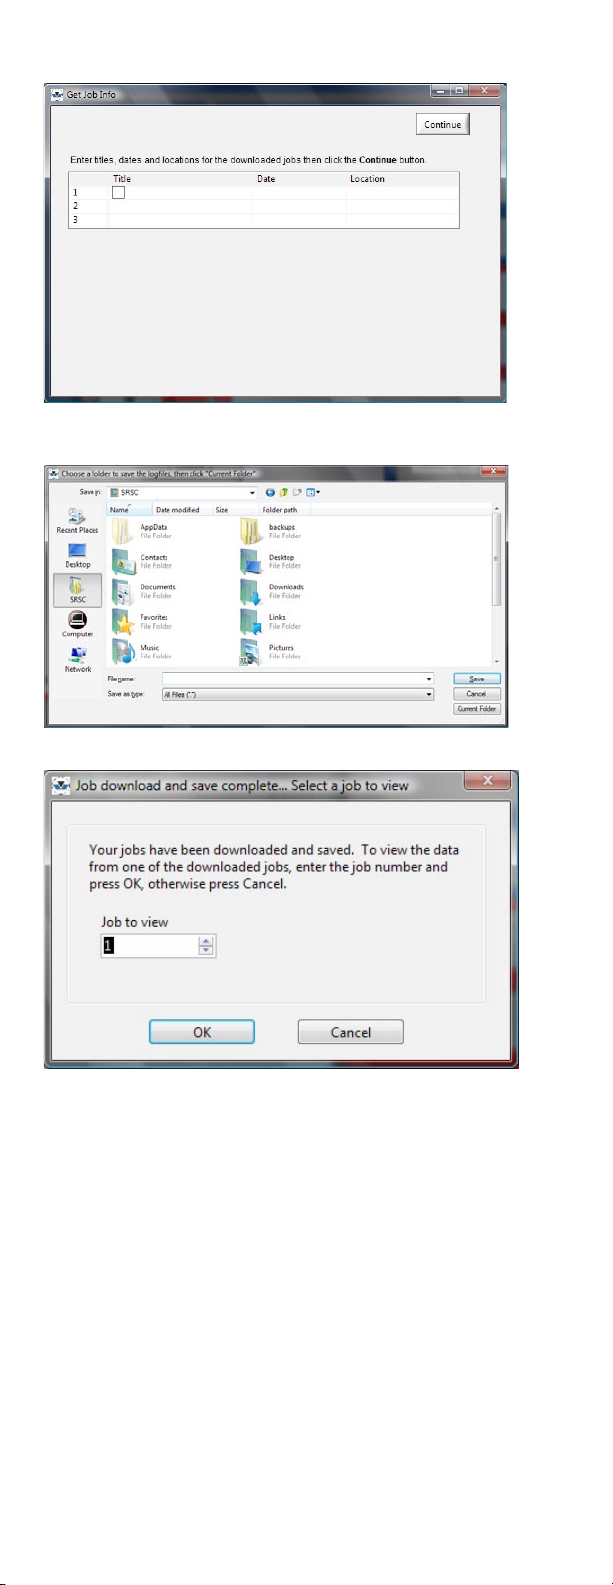
6) After the transfer is complete, the user will be prompted to enter titles, dates and
locations.
7) After clicking continue, the user will be prompted to choose a folder.
Click “Current Folder after finding the file path you want.
8) The last step is to find out what job the user wants to view:
Refer to the Mastercool Data Logging Instructions to view the recorded data.
NOTE: To scroll through the data you must be in CURSOR mode. Move the cursor
along the time line to examine the data. All of the program features are enabled
except for the display of data in “real time” which includes the recording measure-
ments section of the instructions.
10
www.mastercool.com
Page 11
DATA LOGGING-SOFTWARE FÜR
DIGITALE 4-WEGE-MONTEURHILFE
Die Data Logger-Applikation von Mastercool liefert alle notwendigen Erfassungs- und
Anzeigefunktionen, um neue Daten aufzuzeichnen, anzuzeigen und zu sichern, oder um
zuvor aufgezeichnete Dateien wiederzugeben und nachzuprüfen.
SYSTEMANFORDERUNGEN
Die Applikation wurde entwickelt, um unter Windows 2000, XP, Windows Vista und
Windows 7 zu laufen.
Auf der CD befinden sich zwei Installationsdateien:
1) Setup.exe: Installiert die Mastercool Data Logger-Applikation und alle erford
erlichen Komponenten, bis auf den USB-Treiber für die digitale Monteurhilfe
(siehe CP210x_VCP_Win_XP_S2K3_Vista_7.exe Information unten)
2) CP210x_VCP_Win_XP_S2K3_Vista_7.exe: Installiert den USB-Gerätet reiber für
die digitale Monteurhilfe.
Für Windows 7 oder neuere Versionen ist die Installation vom driver nicht notwendig.
SOFTWARE UND TREIBER-INSTALLATION
Software-Installation
1) Legen Sie die Mastercool Data Logger-Software in das CD-ROM-Laufwerk.
2) Öffnen Sie den Ordner der Data Logger-Software für die digitale Monteurhilfe.
Deutsch
3) Doppelklick auf Setup.exe
4) Wählen Sie einen Zielordner und klicken Sie auf NEXT.
5) Akzeptieren Sie die Lizenzvereinbarung und klicken Sie auf NEXT.
6) Es öffnet sich das Dialogfeld für den Installationsstart, sehen Sie sich die
Zusammenfassung an und klicken Sie auf NEXT.
7) Nach erfolgreicher Installation klicken Sie auf FINISH.
www.mastercool.com
11
Page 12
8) Sie werden dann aufgefordert, Ihren Computer neu zu starten. Wählen Sie
RESTART LATER und gehen Sie zur Installation des USB-Gerätetreibers über.
Treiberinstallation
1) Doppelklick auf CP210x_VCP_Win_XP_S2K3_Vista_7.exe.
2) Erscheint das Dialogfeld “Welcome to the Install Shield Wizard“, klicken Sie auf NEXT.
3) Akzeptieren Sie die Lizenzvereinbarung.
4) Wählen Sie einen Zielordner und klicken Sie auf NEXT.
5) Erscheint das Dialogfeld “Ready to Install the Program“, klicken Sie auf NEXT.
6) Nach erfolgreicher Installation klicken Sie auf FINISH. Stellen Sie sicher, dass bei
“Launch the CP210xVCP Driver Installer” das Häkchen gesetzt wurde.
7) Erscheint „Silicon Lab CP210x USB to UART Bridge Installer“, klicken Sie auf NEXT.
12
www.mastercool.com
Page 13
8) Starten Sie den Computer neu, wenn Sie dazu aufgefordert werden.
Um die Daten der digitalen Monteurhilfe in „Echtzeit“ darzustellen, befolgen Sie die
nachfolgenden Anweisungen.
ERSTMALIGE VERBINDUNG MIT DER MONTEURHILFE
WICHTIG: Deaktivierung von Auto-Off, damit die Monteurhilfe mit der Software
kommunizieren kann.
1) Installieren Sie die Data Logger-Applikation und den USB-Gerätetreiber wie oben
beschrieben.
2) Schließen Sie die Monteurhilfe mit dem mitgelieferten USB-Kabel an den Computer an.
3) Schalten Sie die digitale Monteurhilfe ein.
4) Windows wird der Monteurhilfe einen “Virtual COM“-Port zuweisen. Die zugewiesene
Port-Nummer kann bei verschiedenen Geräten variieren.
5) Öffnen Sie die Mastercool Data Logger-Applikation, indem Sie auf Start > Alle
Programme > Mastercool Data Logger > Mastercool Data Logger gehen.
6) Die erste Bildschirmanzeige enthält: einen Kundennamen (oder Installation sort), Datum
und Textfeld mit dem Techniker-Namen, gefolgt vom ENTER-Befehl. Geben Sie alle drei
Felder ein und wählen Sie ENTER.
7) Hat Ihr PC den COM4 nicht als Port für die Monteurhilfe zugewiesen, werden Sie nach
einigen Sekunden aufgefordert:
Deutsch
Wählen Sie Suchen, um das Monteurhilfe-Suchfenster anzuzeigen:
Wählen Sie den letzten gelisteten Port und klicken Sie auf “Test Port.” Ist das der
Port, der der Monteurhilfe zugewiesen wurde, erhalten Sie die Mitteilung “Digitale
Monteurhilfe gefunden“. Wählen Sie “Use Selected Port”, um fortzufahren. Zeigt das
Status-Feld an, dass die Monteurhilfe nicht gefunden wurde, versuchen Sie die anderen
Ports zu prüfen. Markieren Sie einen Port und wählen Sie “Test Port.” Nachdem Sie
ermittelt haben, welchem Port die Monteurhilfe zugewiesen wurde, wird die Applikation
immer diesen Port verwenden, wenn das Programm gestartet wird.
STARTEN DER MASTERCOOL DATA LOGGER-SOFTWARE
Um den Mastercool Data Logger (MDL) auszuführen, gehen Sie zum Ordner der Installation
des Data Logger-Programms und machen Sie auf das Mastercool-Symbol einen Doppelklick.
Die Begrüßungsanzeige erscheint und enthält: einen Kundennamen (oder Installationsort),
Datum und Textfeld mit dem Techniker-Namen, gefolgt vom ENTER-Befehl. Geben Sie alle
drei Felder ein und wählen Sie ENTER, um fortzufahren.
www.mastercool.com
13
Page 14
DATA LOGGER-GRUNDLAGEN
• Am unteren Bildschirmrand wird ein Zeitbalken angezeigt, der die gewählte
Erfassungszeit mit Bezug auf die verstrichene Zeit, ab dem Beginn der Erfas sung misst.
Für den Fall, dass ebenfalls ein Cursor markiert wurde, erscheint ein “Time”-Fenster
unter dem Cursor und zeigt an, wann das Ereignis stattfand, mit Zeitangabe ab Beginn
der Erfassung. Wenn die Markierung des Cursors wieder aufgehoben wird, verschwindet
das „Time“-Fenster.
• In der rechten unteren Ecke des Bildschirms wird das gewählte Fenster der
Erfassungszeit angezeigt, das die Gesamtlänge der gewählten Erfassungszeit darstellt.
• Das Programm nutzt die Informationen des Geräts, die in jedem Datenbit in der
Monteurhilfe enthalten sind und zeigt diese Geräte auf dem Hauptschirm und/oder nach
Bedarf auf dem Analog-Schirm an.
• Der Data Logger zeigt NaN oder 0 an, wenn kein Wert dargestellt wird. (NaN steht für
“Not a Number”). Datenpunkte, die NaN oder 0 sind, erscheinen nicht auf dem Plot
(Ausdruck des Kurvenschreibers), sind aber gleichwohl vorhanden. Zeiträume in einem
Plot, wo kein Wert angezeigt wird, erscheinen als eine Lücke im Kurvenausdruck.
DIALOGFELD WARNUNG
Das Dialogfeld Warnung befindet sich auf der rechten Bildschirmseite. Wird eine Warnung
angezeigt, blinkt sie als roter und gelber Text. Die folgenden Warnungen können dargestellt
werden:
• Warning! Please replace the battery in your digital manifold! Diese Mitteilung weist den
User darauf hin, dass die Batterien der digitalen Monteurhilfe ersetzt werden müssen.
• No data/invalid data! Prüfen Sie, ob die Monteurhilfe angeschlossen, eingeschaltet und
Auto-Off deaktiviert wurde. Gehen Sie in das Datei-Menü und wählen Sie die
Monteurhilfe-Suche, um ein erneutes Verbinden zu versuchen.
Erscheint diese Mitteilung, gehen Sie auf Datei > Monteurhilfe suchen, um den entsprechenden Port für die Kommunikation mit der Monteurhilfe zu wählen, wie in dem Abschnitt
ERSTMALIGE VERBINDUNG MIT DER MONTEURHILFE beschrieben wurde.
ERFASSEN DER MESSWERTE
• Der „Recorder Time command“ [RUN TIME] ist die gewählte Zeitspanne, über die die
Data Logger-Software die Daten von der Monteurhilfe erfasst. Die folgenden
Erfassungszeiten stehen zur Verfügung: 5 Minuten, 15 Minuten, 1 Stunde, 4 Stunden, 8
Stunden und 24 Stunden.
• Die Daten werden in einer Log-Datei erfasst. Sie haben die Möglichkeit, diese Datei nach
Vervollständigung des Vorgangs zu speichern.
STARTEN DER ERFASSUNG
1) Das Aufklappmenü „SELECT TIME“ (Abb. 1) anklicken, um eine Erfassungsdauer
auszuwählen.
1
2) Die Schaltfläche „START/STOP RECORDING” (Abb. 2) anklicken, um mit dem Auswerten
der Daten zu beginnen. Der Pfeil „START/STOP RECORDING“ auf der Schaltfläche
leuchtet grün auf um anzuzeigen, dass der Erfassungsvorgang begonnen hat.
14
www.mastercool.com
Page 15
2
4
3
3) Während des Erfassungsvorgangs zeigen Anzeigelemente die „ELAPSED TIME“ (Abb. 3)
und die „LAST START TIME” der Erfassung (Abb. 4) unten rechts am Bildschirmrand an.
ANMERKUNG: Um die Erfassung vor Ablauf der Zeit zu beenden, klicken Sie auf
„START/STOP RECORDING“ (Abb. 2). Sie werden aufgefordert, das Beenden der
Erfassung zu bestätigen und falls ja, werden Sie gefragt, ob Sie die Log-Datei
speichern wollen.
4) Ist die voreingestellte Zeit verstrichen, werden Sie zur Speicherung der Erfassung
aufgefordert. Es erscheint ein Fenster mit folgendem Hinweis: „CHOOSE A LOCATION TO
SAVE THE LOG FILE“. Geben Sie der Datei einen Namen und legen Sie fest, wo Sie die
Datei abspeichern wollen.
Deutsch
VERWENDUNG VON CURSOR & ZOOM
CURSOR-BEFEHL
• Der „CURSOR ON/OFF“-Befehl wird verwendet, um eine bessere Ansicht der Funktionen
im Plot zu liefern, die Sie näher betrachten möchten. Er wird ebenfalls verwendet, um die
Temperatur- und Druckwerte zu bestimmten Zeiten anzuzeigen.
1) Die Schaltfläche „CURSOR ON/OFF ” (Abb. 5) anklicken, um den Cursor an- oder
abzuschalten. Der Pfeil „CURSOR ON/OFF“ auf der Schaltfläche leuchtet grün auf um
anzuzeigen, dass Sie sich im Cursor-Modus befinden.
5
6
2) Ist der Cursor eingeschaltet, sehen Sie eine senkrechte gestrichelte Linie (Abb. 6), die
die Cursor-Position anzeigt. Klicken Sie diese senkrechte gestrichelte Linie an und
ziehen Sie sie auf die entsprechende Position.
ANMERKUNG: Ist der Cursor eingeschaltet, haben die numerischen Anzeigen einen
farbigen Hintergrund und zeigen den Wert auf der Cursor-Position an.
3) Die Zeit-Position des Cursors kann im Anzeigelement “CURSOR POSITION” (Abb. 7) auf
der rechten Bildschirmseite gefunden werden. Die Zeit-Position wird in Stunden:
www.mastercool.com
7
15
Page 16
Minuten:Sekunden angezeigt.
4) Ist der Cursor abgeschaltet, kehrt der Plot zur vollen Erfassungslänge zurück und die
numerischen Anzeigen haben wieder eine graue Hintergrundfarbe.
ZOOM-BEFEHL
• Der ZOOM-FAKTOR kann im Modus NORMAL, 5X oder 10X angezeigt werden. Der
gewählte Maßstab NORMAL, 5X oder 10X hat keinen Einfluss auf die erfassten Daten, bis
auf das digitale Verzerren der Daten bei der Ansicht oder Anzeige. Die vorgesehene
Verwendung und Anwendung des Zoom-Faktors (Maßstab) sind die Anzeige spezieller
entsprechender Datenpunkte. Der Cursor-Befehl muss eingeschaltet werden, um zum
Zoom-Modus zu gelangen.
1) Klicken Sie auf das „ZOOM-FACTOR“-Aufklappmenü (Abb. 8), um entweder den Faktor
5x oder 10x zu wählen.
8
DISPLAYFUNKTIONEN
• Display ALL Befehl. Ermöglicht die gleichzeitige Anzeige aller Parameter der digitalen
Monteurhilfe. Sowie die Linienfunktion auf den Bildschirm übertragen werden, werden
die Werte der „Real time“-Daten (Echtzeit) ebenfalls digital angezeigt.
• Der User hat ebenfalls die Möglichkeit der Anzeige spezieller individueller Funktionen,
falls gewünscht. In diesem Fall kann der User, auch wenn das Display sich im Modus
ALLE Funktionen befindet, die Display ALL überschreiben, indem die entsprechende
Funktion mit seiner Mouse ausgewählt wird. Der Master Data Logger erfasst weiterhin
alle Funktionen im Hintergrund, egal wie viele individuelle Funktionen angezeigt werden.
• Anzeige „DEEP VACUUM ONLY“-Befehl. Ermöglicht, dass nur die Hochvakuum Messungen auf dem Bildschirm angezeigt werden. Die Software gelangt automatisch
in diesen Modus, wenn durch einen Temperaturfühleranschluss ein Hochvakuum erreicht
wurde und die Monteurhilfe in „Real time“ erfasst.
AUSWAHL DER ANZUZEIGENDEN PLOTS
1) Klicken Sie auf die Schaltfläche des Kontrollkästchens auf der linken Bildschirmseite, um
die Anzeige spezieller Plots (Abb. 9) zu aktivieren oder zu deaktivieren.
9
10
2) Klicken Sie auf „SHOW ALL PLOTS“ (Abb. 10), um schnell alle bisher nicht angezeigten
Plots anzuzeigen.
ANMERKUNG: Die Daten werden weiterhin für alle Plots aufgezeichnet, egal ob ein
Plot angezeigt wird, oder nicht.
VAKUUM-MESSUNGEN
• Es gibt zwei Möglichkeiten das Vakuum zu messen:
a) Direkt mit der Monteurhilfe, wo der Unterdruck in PSI, INHg, bar, MPa oder kg/cm2
dargestellt wird.
b) Unter Verwendung eines Temperaturfühleranschlusses, um hochpräzise Mes sungen
16
www.mastercool.com
Page 17
zu erhalten. Die Messungen können in Mikron, mbar, kPa, mmHg, Pa, Torr und mTorr
dargestellt werden.
TEMPERATURFÜHLER-ANSCHLUSS
Wird ein Temperaturfühler-Anschluss genutzt, können die Daten durch Verwendung der
oben genannten „DEEP VACUUM ONLY“-Auswahl dargestellt und erfasst werden.
1) Schließen Sie den Sensor des Temperaturfühlers an und drücken Sie die Vakuum Schaltfläche. Wurde „DEEP VACUUM ONLY“ gewählt, erscheint eine größere grüne Kurve
als unten gezeigt und es wird begonnen, den Ablauf aufzuzeichnen.
2) Der von der Data Logger-Grafik angezeigte Standardbereich liegt bei 0 - 5000. Der User
kann diesen Bereich manuell ändern, indem er auf die obere Nummer klickt und sie auf
den gewünschten Bereich ändert (Abb. 11).
ANMERKUNG: Bei Erreichen von Überdruck, kehrt die HOCHVAKUUM-Anzeige zur
Display ALL zurück.
11
Deutsch
ANALOG-DISPLAY
• Die ANALOG-DISPLAY- Funktion ermöglicht dem User die digitalen Daten der digitalen
Monteurhilfe als zwei große analoge Manometer anzuzeigen.
1) Wählen Sie die ANALOG-DISPLAY- Schaltfläche, um in den Analogmodus zu gelangen.
Ein separates Fenster erscheint und zeigt die digitalen Daten im analogen Format an
(Abb. 12).
ANMERKUNG: Erreicht der Druck den Unterdruckbereich, schalten die Manometer auf
den Vakuummessbereich um (Abb. 13).
Fig. 12
www.mastercool.com
Fig. 13
17
Page 18

2) Klicken Sie auf die EXIT-Schaltfläche in der linken oberen Bildschirmecke, um
zur Hauptbildschirmanzeige zurückzukehren.
WIEDERGABE EINER ERFASSUNG
1) Um eine zuvor erfasste und gespeicherte Datei wiederzugeben, gehen Sie auf Datei >
Wiedergabe aus Datei.
2) Es wird das Dialogfeld “CHOOSE FILE TO READ” dargestellt. Wählen Sie die Log-Datei,
die Sie anzeigen möchten.
a) Gehen Sie zum Speicherort der Datei.
b) Auswählen
c) Auf OK klicken.
Die Applikation zeigt Ihnen einen Plot der Daten auf der Festplatte. Um durch die Daten zu
scrollen, müssen Sie sich im CURSOR-Modus befinden. Bewegen Sie den Cursor entlang
der Zeitlinie, um die Daten zu prüfen. Alle Programmfunktionen sind deaktiviert, außer der
Darstellung der Daten in „Real time“.
DATEN DRUCKEN
• Die PrintWindow-Option befindet sich im Datei-Menü. Sofern Sie bei jedem Datenpunkt,
die auf dem Display erscheinenden Daten ausdrucken möchten.
DATEN-EXPORT
• Die Datenexportoption befindet sich im Datei-Menü. Möchten Sie eine Log-Datei
exportieren, gehen Sie auf Datei > Export. Es erscheint ein Fenster, in dem Sie nach der
zu exportierenden Log-Datei und einem Zielort gefragt werden. Nach Auswahl der
Optionen klicken Sie auf Export. Eine .txt-Datei wird erzeugt.
IMPORT DER ERFASSTEN DATEN IN DEN MASTERCOOL DATA
LOGGING-PROGRAMM
ANMERKUNG: Auto-Off muss deaktiviert sein, damit die Monteurhilfe mit der Software kommunizieren kann.
1) Schließen Sie die Monteurhilfe mit dem mitgelieferten USB-Kabel an den Computer an.
2) Schalten Sie die digitale Monteurhilfe ein (ON).
3) Öffnen Sie das Data Logger-Programm.
4) Bei Inbetriebsetzung zeigt der Logger die folgende Bildschirmseite, wenn Daten zum
Download vorhanden sind.
18
www.mastercool.com
Page 19

5) Der User sieht das folgende Bild während des Transfers. Der Balken zeigt die
durchgeführten Prozent.
6) Nach dem Transfer wird der User aufgefordert, Titel, Datum und Zielordner
einzugeben.
7) Nach dem Klicken auf NEXT (WEITER) wird der User aufgefordert, einen Ordner
zu wählen. Klicken Sie auf „Current Folder“ (Aktueller Ordner), nachdem Sie
den gewünschten Pfad gefunden haben.
Deutsch
8) Im letzten Schritt ist festzustellen, welches Datenpaket sich der User anzeigen
lassen möchte:
Beziehen Sie sich auf die Mastercool Data Logging-Anweisungen, um die erfassten Daten
darzustellen.
ANMERKUNG: Um durch die Daten zu scrollen, müssen Sie sich im CURSOR-Modus
befinden. Bewegen Sie den Cursor entlang der Zeitlinie, um die Daten zu prüfen.
Alle Programmfunktionen sind deaktiviert, außer der Darstellung der Daten in „Real
time“, welche die Aufzeichnung des Messbereiches der Anweisungen beinhaltet.
www.mastercool.com
19
Page 20

LOGICIEL D’ENREGISTREMENT DE DONNEES POUR
MANIFOLD NUMERIQUE A VANNE A BILLE - 4 VOIES
L’application Mastercool Data Logger fournit toutes les fonctions nécessaires d’enregistreur
et d’affichage pour enregistrer, visualiser et sauvegarder de nouvelles données ou reproduire et réviser des fichiers précédemment enregistrés.
EXIGENCES DU SYSTEME
Cette application est conçue pour être exécutée sous Windows 2000, XP, Windows Vista et
Windows 7.
Le CD contient deux programmes d’installation :
1) Setup.exe : Installe l’application Mastercool Data Logger et tous les com
posants nécessaires sauf pour le gestionnaire USB pour le manifold
numéri que (voir les informations ci-dessous sur
(CP210x_VCP_Win_XP_S2K3_Vista_7.exe)
2) CP210x_VCP_Win_XP_S2K3_Vista_7.exe : installe le gestionnaire de périphérique
USB pour le manifold numérique.
Pour Windows 7 ou des versions postérieures, l’installation du conducteur ne sera pas
nécessaire.
INSTALLATION DU LOGICIEL ET DU GESTIONNAIRE
Installation du logiciel
1) Introduisez le CD du logiciel Mastercool Data Logger dans votre unité CD-ROM.
2) Ouvrez le répertoire de fichiers du logiciel Digital Manifold Mastercool Data Logger
3) Double-cliquez sur Setup.exe.
4) Choisissez un répertoire de destination et cliquez sur NEXT.
5) Acceptez le contrat de licence et cliquez sur NEXT.
6) La fenêtre de dialogue de début d’installation apparaîtra, contrôlez les informations et
cliquez sur NEXT.
7) Une fois l’installation terminée avec succès, cliquez sur FINISH.
20
www.mastercool.com
Page 21

8) Vous serez invités à redémarrer votre ordinateur. Cliquez sur RESTART LATER et passez
à l’installation des gestionnaires de périphérique USB.
Installation du gestionnaire
1) Double-cliquez sur CP210x_VCP_Win_XP_S2K3_Vista_7.exe.
2) Quand “Welcome to the Install Shield Wizard” apparaît, cliquez sur NEXT.
3) Acceptez le contrat de licence.
Français
4) Choisissez une position de destination et cliquez sur NEXT.
5) Quand “Ready to Install the Program” apparaît, cliquez sur INSTALL.
6) Une fois l’installation terminée, cliquez sur FINISH. Assurez-vous que “Launch the
CP210xVCP Driver Installer” soit coché.
7) Silicon Lab CP210x USB to UART Bridge Installer apparaît, cliquez sur NEXT.
www.mastercool.com
21
Page 22

8) Redémarrez votre ordinateur quand vous y êtes invités.
Pour visualiser des données du manifold numérique en “temps réel”, suivez les
instructions ci-dessous.
CONNEXION AU MANIFOLD POUR LA PREMIERE FOIS
IMPORTANT : Auto-Off doit être désactivé pour permettre au manifold de communiquer avec le logiciel.
1) Installez l’application Data Logger et le gestionnaire de périphérique USB comme décrit
ci-dessus.
2) Connectez le manifold à l’ordinateur à l’aide du câble USB fourni.
3) Allumez le manifold numérique.
4) Windows attribuera un port “Virtual COM” au manifold. Notez que le numéro de port
attribué peut varier d’un ordinateur à l’autre.
5) Lancez l’application Mastercool Data Logger en allant sur Start > All Programs >
Mastercool Data Logger > Mastercool Data Logger.
6) La première page vidéo comprend : une fenêtre avec le nom client (ou position
d’installation), la date et le nom du technicien, suivie d’une commande ENTER.
Remplissez les trois champs et cliquez sur ENTER.
7) Si votre PC n’a pas attribué COM4 comme le port pour le manifold, vous recevrez un
message après quelques secondes :
Cliquez sur Find pour visualiser la fenêtre de recherche de manifold :
Sélectionnez le dernier port de la liste et cliquez sur “Test Port”. Si c’est le port qui a
été attribué au manifold, vous recevrez le message “Digital Manifold Detected”. Cliquez
sur “Use Selected Port” pour continuer. Si la fenêtre Status indique que le manifold
n’est pas détecté, essayez de tester les autres ports. Sélectionnez un port et cliquez
sur “Test Port”. Une fois que vous avez déterminé le port qui a été attribué au manifold,
l’application continuera à utiliser ce port chaque fois que le programme sera lancé.
LANCER LE LOGICIEL MASTERCOOL DATA LOGGER
Pour lancer le Mastercool Data Logger (MDL), allez dans le répertoire où vous avez installé
le programme d’enregistrement de données et double-cliquez sur l’icône Mastercool.
La page vidéo d’accueil apparaît et comprend : une fenêtre avec le nom client (ou position
d’installation), la date et le nom du technicien, suivie d’une commande ENTER. Remplissez
les trois champs et cliquez sur ENTER pour poursuivre.
22
www.mastercool.com
Page 23

L’ESSENTIEL DE L’ENREGISTREUR DE DONNEES
• Une ligne du temps est visualisée en bas de l’écran, elle mesure le temps
d’enregistrement sélectionné par rapport au temps écoulé depuis le début de
l’événement d’enregistrement. Si un curseur est également sélectionné, une fenêtre
“Time” apparaît sous le curseur, indiquant quand l’événement a lieu, tel que mesuré à
partir du début de l’événement d’enregistrement. Quand le curseur est désélectionné, la
fenêtre “Time” disparaît.
• Une fenêtre de temps d’enregistrement sélectionné est visualisée dans le coin inférieur
droit de l’écran, laquelle visualise la durée totale du temps d’enregistrement sélectionné.
• Le programme utilise les informations d’unités contenues dans chaque bit de données
sur le manifold et visualise ces unités sur l’écran principal et/ou sur l’écran analogique
comme prescrit.
• L’enregistreur de données affichera NaN ou 0 quand aucune valeur n’est affichée (NaN
signifie “Pas un nombre”. Des points de données qui sont NaN ou 0 n’apparaissent pas
sur un tracé, mais sont néanmoins présents. Des périodes de temps sur un tracé où
aucune valeur n’est visualisée seront représentées comme un vide dans le tracé.
FENETRE D’AVERTISSEMENT
La fenêtre d’avertissement est située sur le côté droit de l’écran. Quand un avertissement
est visualisé, il clignotera en caractères rouges et jaunes. Les avertissements suivants
peuvent être visualisés :
• Warning! Please replace the battery in your digital manifold! Ce message
avertit l’utilisateur que la batterie du manifold numérique doit être remplacée.
• No data/invalid data! Confirmez que le manifold est connecté, activé et auto-off est
invalidé. Allez dans le menu fichiers et cliquez sur recherche manifold pour essayer de le
reconnecter. Quand ce message apparaît, allez sur File > Manifold Finder pour
sélectionner le port approprié pour communiquer avec le manifold comme indiqué dans
la section CONNEXION AU MANIFOLD POUR LA PREMIERE FOIS.
ENREGISTREMENT DE MESURES
• La commande de temps d’enregistrement [RUN TIME] est la période de temps
sélectionnée durant laquelle le logiciel d’enregistrement de données enregistre les
données provenant du manifold. Les temps d’enregistrements suivants sont disponibles :
5 minutes, 15 minutes, 1 heure, 4 heures, 8 heures et 24 heures.
• Les données seront enregistrées dans un fichier d’enregistrement. Vous devrez
sauvegarder ce fichier quand l’exécution est terminée.
POUR COMMENCER L’ENREGISTREMENT
1) Cliquez sur “SELECT TIME” (fig. 1), faire défiler vers le bas pour sélectionner une période
de temps pour l’enregistrement.
Français
1
2) Cliquez sur le bouton “START/STOP RECORDING” (fig. 2) pour commencer le tracé des
données. La flèche START/STOP RECORDING sur le bouton sera illuminée en vert pour
indiquer que la procédure d’enregistrement a commencé.
www.mastercool.com
23
Page 24

2
4
3
3) Alors que l’enregistrement est en cours, des indicateurs montreront le temps écoulé
ELAPSED TIME (fig. 3) et le dernier temps de début de l’enregistrement LAST START
TIME (fig. 4) dans le coin inférieur droit de l’écran.
NOTE : Pour terminer l’enregistrement avant que le temps soit écoulé, cliquez sur
“START/STOP RECORDING” (fig. 2). Vous serez invités à confirmer que vous souhaitez terminer l’enregistrement et, si c’est le cas, si vous désirez sauvegarder le
fichier d’enregistrement.
4) Quand le temps d’enregistrement fixé est terminé, vous serez invités à sauvegarder
l’enregistrement. La fenêtre suivante sera visualisée : CHOOSE A LOCATION TO SAVE THE
LOG FILE. Donnez un nom au fichier et indiquez l’endroit où voua désirez sauvegarder le
fichier.
UTILISATION DES CURSEURS ET DU ZOOM
COMMANDE CURSEUR
• La commande CURSOR ON/OFF est utilisée pour fournir une meilleure vision des
caractéristiques que vous souhaitez examiner plus en détail sur le tracé. Elle est
également utilisée pour montre les valeurs de température et de pression à des instants
spécifiques.
1) Cliquez sur le bouton CURSOR ON/OFF (fig. 5) pour activer ou désactiver le curseur.
5
6
2) Quand le curseur est activé, vous observerez une ligne verticale en pointillés (fig. 6) qui
indique la position du curseur. Cliquez sur cette ligne verticale en pointillés et traînez-la
dans la position désirée.
NOTE : Quand le curseur est activé, les indicateurs numériques auront un fond coloré
et visualiseront la valeur dans la position du curseur.
3) La position de temps du curseur peut être trouvée dans l’indicateur “CURSOR POSITION”
24
www.mastercool.com
7
Page 25

(fig. 7) à droite de l’écran. La position de temps est indiquée en Heures: Minutes:
Secondes.
4) Quand le curseur est désactivé, le tracé retournera à la longueur d’enregistrement totale
et les indicateurs numériques redeviendront avec un fond gris.
COMMANDE ZOOM
• ZOOM FACTOR peut être visualisé en mode NORMAL, 5X ou 10X. L’échelle sélectionnée
NORMAL, 5X ou 10X n’a aucun effet sur les données qui sont enregistrées à part un
rétrécissement numérique des données qui sont visionnées et affichées. L’utilisation et
l’application prévues du facteur de zoom (échelle) sont de visionner des points de
donnée spécifiques d’intérêt. La commande de curseur doit être activée pour passer en
mode Zoom.
1) Cliquez le menu défilant “ZOOM FACTOR” (fig. 8) pour sélectionner un facteur de 5x ou
10x.
8
FONCTIONS D’AFFICHAGE
• Commande Display ALL. Elle permet de visualiser simultanément tous les paramètres du
manifold numérique. Alors que les fonctions de ligne avancent à travers l’écran, la valeur
de la donnée en “temps réel” sera également visuali sée numériquement.
• L’utilisateur a également la possibilité de surveiller seulement des fonctions individuelles
spécifiques s’il le désire. Dans ce cas, même si l’affichage est dans le mode de
visualisation de toutes les fonctions, l’utilisateur peut annuler l’option view ALL
simplement en sélectionnant la fonction d’intérêt avec la souris. L’enregistreur de
données maître continuera à enregistrer toutes les fonctions en arrière-plan,
indépendamment du nombre de fonctions individuelles qui sont visualisées.
• Commande Display DEEP VACUUM ONLY. Elle permet de visualiser seulement les
mesures de vide poussé sur l’écran. Le logiciel passera automatiquement dans ce mode
quand un vide poussé est atteint à travers la connexion de thermocouple et le manifold
enregistre en “temps réel”.
SELECTION DES TRACES A VISIONNER
1) Cliquez sur les boutons de fenêtre de vérification sur le côté gauche de l’écran
pour valider ou invalider la visualisation de tracés spécifiques (fig. 9).
9
Français
10
2) Cliquez sur “SHOW ALL PLOTS” (fig. 10) pour activer rapidement tous les tracés qui ne
sont pas affichés.
NOTE : Les données continuent d’être enregistrées pour tous les tracés indépendamment du fait qu’un tracé est affiché.
MESURES DE VIDE
• Il existe deux manières de mesurer le vide :
a) Directement par le biais du manifold où une pression négative est représentée en PSI,
INHg, bar, MPa ou Kg/cm2.
www.mastercool.com
25
Page 26

b) En utilisant une connexion de thermocouple pour obtenir une mesure de grande
précision. Les mesures peuvent être représentées en Micron, mbar, KPa, mmHg, Pa, Torr
ou mTorr.
CONNEXION DE THERMOCOUPLE
Quand une connexion de thermocouple est utilisée, les données peuvent être mises en
graphique et enregistrées en utilisant la sélection DEEP VACUUM ONLY indiquée ci-dessus.
1) Connectez la sonde de thermocouple et appuyez sur le bouton du vide. Quand DEEP
VACUUM ONLY est sélectionné, un plus grand graphique vert apparaîtra, comme
représenté ci-dessous, et commencera à montrer l’activité.
2) La plage standard représentée sur le graphique de l’enregistreur de données est
0 – 5000. L’utilisateur peut changer manuellement cette plage en cliquant sur le chiffre
supérieur et le changer pour la plage désirée (fig. 11).
NOTE : Quand une pression positive est atteinte, l’écran DEEP VACUUM retournera à
l’écran Display ALL.
11
AFFICHAGE ANALOGIQUE
• La fonction ANALOG DISPLAY permet à l’utilisateur de représenter les données
numériques du manifold numérique sous la forme de deux grands manomètres
analogiques.
1) Cliquez sur le bouton ANALOG DISPLAY pour passer en mode analogique. Une fenêtre
séparée sera visualisée, représentant les données numériques dans un format
analogique (fig. 12).
NOTE : Quand la pression entre dans une plage négative, les manomètres commuteront en mode de manomètre à vide (fig. 13).
Fig. 12
26
www.mastercool.com
Fig. 13
Page 27

2) Cliquez sur le bouton EXIT dans le coin supérieur gauche de l’écran pour retourner à la
page vidéo principale.
REPRODUCTION D’UN ENREGISTREMENT
1) Pour reproduire un fichier qui a été précédemment enregistré et sauvegardé, allez sur
File > Replay from File.
2) Une fenêtre “CHOOSE FILE TO READ” sera visualisée. Sélectionnez le fichier
d’enregistrement que vous souhaitez visualiser.
a) Déplacez vous sur la position du fichier.
b) Sélectionnez le.
c) Cliquez sur OK.
L’application vous montrera un tracé des données à partir de l’exécution.
Pour faire défiler les données, vous devez être en mode CURSOR. Déplacez le curseur le
long de la ligne du temps pour examiner les données. Toutes les fonctions de programme
sont validées sauf pour la visualisation en “temps réel”.
IMPRESSION DES DONNEES
• L’option d’impression de fenêtre Print Window est située sous le menu de fichier. Vous
pouvez à tout moment imprimer les données qui sont présentes à l’écran.
EXPORTER DES DONNEES
• Une option Export Data est située sous le menu de fichier. Si vous désirez exporter un
fichier d’enregistrement, allez sur File > Export. Il apparaîtra une fenêtre vous demandant
de sélectionner un fichier d’enregistrement à exporter et une destination. Une fois que
ces options sont sélectionnées, cliquez sur Export. Un fichier .txt sera créé.
IMPORTER LES DONNEES ENREGISTREES DANS LE PROGRAMME
D’ENREGISTREMENT DE DONNEES MASTERCOOL
NOTE : Auto-Off doit être désactivé pour permettre au manifold de communiquer
avec le logiciel.
1) Connectez le manifold à l’ordinateur avec le câble USB de série.
2) Allumez le manifold numérique.
3) Lancez le programme d’enregistrement de données.
4) Au démarrage, l’enregistreur montrera la page vidéo suivante s’il existe des
données à télécharger (download).
Français
www.mastercool.com
27
Page 28

5) L’utilisateur verra l’écran suivant durant le transfert. L’indicateur à barre
coulissante représente le % exécuté.
6) Quand le transfert est terminé, l’utilisateur sera invité à saisir les titres, les
dates et les positions.
7) Après avoir cliqué sur continue, l’utilisateur sera invité à choisir un répertoire.
Cliquez sur “Current Folder” après avoir trouvé le parcours de fichier désiré.
8) La dernière étape consiste à trouver quel tâche vous souhaitez visionner :
Voir les instructions d’enregistrement de données Mastercool pour visionner les données
enregistrées.
NOTE : Pour faire défiler les données, vous devez être en mode CURSOR. Déplacez le
curseur le long de la ligne du temps pour examiner les données. Toutes les fonctions
de programme sont validées sauf pour l’affichage en “temps réel” qui comprend la
section d’enregistrement de mesures des instructions.
28
www.mastercool.com
Page 29

PROGRAMA DEL DATA LOGER PARA
EL MANOMETRO DIGITAL DE 4-VIAS
Las Aplicaciones del Data Loger de Mastercool tiene todas las funciones de Grabar y Exhibir para grabar, exhibir y guardar la información o revisar archivos previamente grabados.
SISTEMA REQUERIDO
Esta aplicación esta diseñada para trabajar con Windows 2000, XP, Windows Vista y
Windows 7.
Hay dos instalaciones en el CD:
1) Setup.exe: Instala las aplicaciones del Data Loger de Mastercool y todo los
componentes requeridos con excepción del driver del USB para el manómetro
digital
(ver la información mas abajo CP210x_VCP_Win_XP_S2K3_Vista_7.exe)
2) CP210x_VCP_Win_XP_S2K3_Vista_7.exe: Instala el driver para el USB del
manómetro digital.
Nota: para Windows versión 7, o más nuevas, no será necesario instalar el driver.
INSTALACION DEL PROGRAMA Y DRIVER
Instalación del Programa
1) Coloque el Programa (CD) del Data Loger de Mastercool en el CD-ROM driver,
2) Abra la carpeta del archivo Digital Manifold Data Logger.
3) Haga un doble “click” en Setup.exe.
4) Elija el directorio de destino y seleccione Next.
5) Acepte el License Agreement y seleccione NEXT.
6) Aparecerá la caja del Diálogo para de comenzar la Instalación, Revise el Summary y
seleccione NEXT
Español
7) Una vez que haya logrado la instalación satisfactoriamente, seleccione FINISH.
www.mastercool.com
29
Page 30

8) En ese momento se le indicara que re-encienda su PC. Seleccione RESTAR
LATER y proceda a instalar el driver del USB.
Instalación del Driver
1) Haga doble “click” CP210x_VCP_Win_XP_S2K3_Vista_7.exe.
2) Cuando aparezca “Welcome to the Install Shield Wizard” seleccione NEXT.
3) Acepte el License Agreement.
4) Elija la ubicación de destino y seleccione NEXT.
5) Cuando aparezca “Ready to Install the Program” seleccione INSTALL.
6) Una vez que haya logrado la instalación, seleccione FINISH. Asegúrese que haya
seleccionado “Launch the CP210xVCP Driver Installer.”
7) Aparecerá “Silicon Lab CP210x USB to UART Bridge Installer”, seleccione NEXT.
30
www.mastercool.com
Page 31

8) Reiniciar su computadora cuando se le indique.
Para mostrar la información del manómetro digital en “tiempo real” por favor siga
las instrucciones que se dan mas abajo.
CONECTANDOSE AL MANOMETRO POR PRIMERA VEZ
IMPORTANTE: Auto-Off debe estar desactivado para que el manómetro se comunique
con el software
1) Instale las aplicaciones del Data Loger y del driver USB como si indica arriba.
2) Conecte el manómetro a la computadora usando el cable USB que se proporciona.
3) Encienda el Manómetro Digital.
4) Windows asignara un Puerto “Virtual COM” para el manómetro. Es importante notar que
el numero de puerto asignado puede variar dependiendo de cada computadora.
5) Para abrir las aplicaciones del Data Loger vaya a Star> All Programs > Mastercool Data
Logger > Mastercool Data Loggert.
6) La primera pantalla incluye tres ventanas: Customer Name (Nombre del Cliente o
ubicación de la instalación), Date (Fecha) y Technician’s Name, (Nombre del Tecnico).
Ingrese la información en las tres ventanas y seleccione ENTER.
7) Si su PC no le ha asignado un Puerto COM4 como puerto del manómetro, entonces se le
indicará después de unos segundos:
Seleccione Find para Exhibir el Manifold Finder Window.
Seleccione el último Puerto que esta en la lista y haga “click” en el “Puerto de Prueba”.
Si este es el puerto asignado para el manómetro, recibirá el mensaje “Digital Manifold
Detected”. Seleccione “Use el Puerto Seleccionado” para continuar. Si la ventana
Estatus indica que el manómetro no ha sido detectado, trate de probar los otros puertos.
Highlight un puerto y seleccione “Puerto de Prueba”. Una vez que haya determinado el
puerto que se le asigno al manómetro, la aplicación seguirá usando este puerto cada
vez que se inicie el programa.
ACTIVANDO EL PROGRAMA DATA LOGGER DE MASTERCOOL:
Para iniciar el Data Loger de Mastercool (MDL), vaya al archivo donde instalo el programa y
haga un doble “click” en el icono de Mastercool.
Aparecerá la pantalla de bienvenida la cual incluye tres ventanas: Customer Name (Nombre
del Cliente o ubicación de la instalación), Date (Fecha) y Technician’s Name (Nombre del
Técnico), seguido por el comando ENTER. Ingrese la información en las tres ventanas y
seleccione ENTER.
Español
www.mastercool.com
31
Page 32

BASICOS DEL DATA LOGER
• Una Línea de Tiempo se muestra en la parte baja de la pantalla que mide el tiempo
grabado que se ha seleccionado con respecto al lapso de tiempo desde el comienzo del
evento que se está grabando. En caso que también se haya seleccionado un cursor,
aparecerá una ventana debajo del cursor, indicando cuando de llego a efecto ese evento,
medido desde el comienzo de la grabación del mismo. Una vez que el cursor es
desactivado, el lapso de “tiempo” desaparece.
• Una ventana de Recording Time se vera en la esquina inferior derecha de la pantalla, la
cual muestra el tiempo total del Recording Time (Tiempo de Grabación) seleccionado.
• El programa usa las unidades de cada bit de información del manómetro y muestra estas
unidades en la pantalla principal y/o pantalla análoga según se requiera.
• El Data Loger mostrara NaN o cuando no haya un valor a mostrar. (NaN significa “No hay
Numero). Puntos de información que son NaN o 0 no aparecerán en el gráfico; pero están
presentes. Periodos de tiempo en un gráfico donde no hay un valor que se muestre se
vera como un espacio vacío en el gráfico.
MENSAJE DE ATENCION/CUIDADO
El Dialogo de atención/cuidado esta ubicado en el lado derecho de la pantalla. Cuando un
aviso de atención/cuidado aparecerá en forma intermitente el texto en rojo y amarillo.
• ATENCION/CUIDADO! Por favor reemplace la batería del manómetro digital. Este mensaje
alerta al usuario que la batería del manómetro digital debe ser reemplazada.
• No hay información/información inválida! Por favor verifique que el manómetro esta
conectado, encendido y que el “auto-off” esta desactivado. Vaya al menú de archivos y
seleccione “Manifold Finder” para intentar re-conectarse. Cuando este mensaje
aparezca, vaya (navegue) a File > Manifold Finder para seleccionar el puerto apropiado
para comunicarse con el manómetro de acuerdo a lo indicado en la sección titulada
CONNECTING TO THE MANIFOLD FOR THE FIRST TIME (CONECTANDOSE AL MANOMETRO
POR PRIMERA EVZ).
TIEMPOS DE GRABACION
• El comando Recorder Time [RUN TIME] selecciona el tiempo de grabación que el
software del Data Loger grabara del manómetro digital. Los siguientes son los tiempos
de grabación disponibles: 5 minutos, 15 minutos, 1 hora, 4 horas, 8 horas y 24 horas.
• La información será grabada en un archivo. Ud. Tendrá la oportunidad de guardar este
archivo cuando el trabajo se haya completado.
PARA COMENZAS A GRABAR
1) Haga un “click” en “SELECT TIME” (fig. 1) y aparecerá el menú donde puede elegir el
tiempo de grabación.
1
2) Haga un “click” en la tecla “START/STOP RECORDING” (fig 2) para comenzar a graficar
la información. La flecha de “START/STOP RECORDING” aparecerá iluminada en la parte
baja en color verde indicando que el proceso de grabación ha comenzado.
32
www.mastercool.com
Page 33

2
4
3
3) Mientras se esta grabando, un indicador mostrara el LAPSO DE TIEMPO QUE YA HA
GRABADO (FIG. 3) y el LAST START TIME (ULTIMO ENCENDIDO) de la grabación (fig. 4) en
la parte inferior derecha de la pantalla.
NOTA: Para terminar una grabación antes que haya terminado el tiempo seleccionado, haga un “click” en “START/STOP RECORDING” (fig. 2.). Se le consultara
que confirme que quiere terminar la grabación y a la vez si lo quiere guardar en un
archivo.
4) Cuando termine el tiempo de grabación, se le indicara que guarde lo grabado. Se
abrirá una ventana que dice: : CHOOSE A LOCATION TO SAVE THE LOG FILE (ELIJA UNA
UBICACIÓN PARA GUARDAR LA CARPETA REGISTRTADA). Déle un nombre al archivo y
especifique donde quiere que se guarde el archivo.
USANDO EL CURSOR Y ZOOM
COMANDO CURSOR
• Se usa el comando CURSOR ON/OFF para entregar una mejor visión del grafico que Ud.
desee examinar EN FORMA mas detenida. También se usa para mostrar los valores de
temperatura y presión en tiempos específicos.
1) Haga un “click” en la tecla CURSOR ON/OFF (fig. 5) para activar o desactivar el cursor.
La flecha de CURSOR ON/OFF “” aparecerá iluminada en la parte baja en color verde
indicando que esta en el modo “cursor mode”.
5
6
2) Cuando el cursor esta activado, vera una línea vertical punteada (fig. 6) que indica la
ubicación del cursor. Haga un “click” sobre la línea punteada y arrástrela a la posición
de su interés.
Nota: Cuando el cursor esta activado, el indicador numérico tendrá un fondo
coloreado y mostrara el valor en la posición del cursor.
7
Español
www.mastercool.com
33
Page 34

3) La posición de tiempo del cursor se puede encontrar en el indicador “CURSOR
POSITION” (POSICION DEL CURSOR - fig. 7) en la parte derecha de la pantalla. La
posición de tiempo esta indicado en: Horas, Minutos, Segundos.
4) Cuando el cursor esta desactivado, la grafica se revertirá al largo de la grabación y el
indicador numérico se revertirá a un fondo de color gris.
COMANDO ZOOM
• El FACTOR ZOOM se puede ver en modo NORMAL, 5X O 10 X. La escala seleccionada;
NORMAL, 5X o 10X no tiene ningún efecto en la información que se esta grabando fuera
de estirar la información digital que se esta viendo en la pantalla. La intención del uso y
aplicación del factor zoom (escala) es ver puntos de interés y específicos de información.
El comando cursor debe estar activado para usar el modo Zoom.
1) Haga un “click” en el FACTOR ZOOM (fig. 8) y elija del menú el factor que quiera usar,
5x o 10x.
8
MUESTRA CARACTERISTICAS DE LAS FUNCIONES
• Comando Mostrar TODO (ALL). Este comando activa todos los parámetros del
Manómetro Digital para ser mostrados en forma simultánea. Tan pronto como la línea de
las funciones se propaga a través de la pantalla, el valor de la información “tiempo real”
se vera en la pantalla en forma digital.
• El usuario – si es que lo desea – tiene la opción de monitorear funciones específicas. En
ese caso, aun si lo que se muestra está en el modo función ALL (todo), el usuario puede
“cancelar” función ALL simplemente seleccionando con su “ratón” la función de su
interés. El Master Data Logger (Data Loger) continuará – en el trasfondo – grabando
todas las funciones, sin importar cuantas funciones individuales se estén mostrando en
la pantalla.
• Comando DEEP VACUUM ONLY (Mostrar Solo Vacío Profundo). Esto permite que solo las
lecturas del vacío profundo se vean en la pantalla. El software ingresara
automáticamente este modo una vez que se haya alcanzado vacío profundo a través de
la conexión de la termocupla y el manómetro que está grabando en “tiempo real”.
SELECCIONANDO LOS GRAFICOS A VER
1) Haga un “click” en la caja marcada en el lado izquierdo de la pantalla para activar o
desactivar la muestra del grafico específico (fig. 9)
9
10
2) Haga un “click” en “SHOW ALL PLOTS”(MOSTRAR TODOS LOS GRAFICOS) (fig. 10) para
activar rápidamente todos los gráficos que no se han mostrado.
Nota: LA información continúa siendo registrada para todos los gráficos sin importar
si el grafico se esta viendo en ese momento.
LECTURAS DE VACIO
• Hay dos maneras de medir vacío:
a) Directamente a través del manómetro donde la presión negativa es representada en
34
www.mastercool.com
Page 35

PSI, Bar, MPa or Kg/cm2.
b) Usando una conexión termocupla para alcanzar una lectura de alta precisión, Las
lecturas están representadas en Micron, mBar, KPa, mmHg, Pa, Torr and mTorr
CONEXION TERMOCUPLA
Cuando se esta usando una conexión termocupla la información puede ser graficada
usando el modo DEEP VACUUM ONLY mencionado más arriba.
1) Conecte el censor termocupla y presione la tecla de vacío. Cuando se selecciona DEEP
VACUUM ONLY (SOLO VACIO PROFUNDO) aparecerá un grafico verde y grande como se
ve abajo y comenzara a graficar la actividad.
2) El rango standard representado en el grafico del data loger es de 0 – 5000. El usuario
puede cambiar manualmente este rango haciendo un “click” sobre el número y
cambiarlo al rango deseado (fig. 11)
NOTA: Cuando se alcanza la presión positiva la pantalla DEEP VACUUM (VACIO PROFUNDO) se cambiara y se vera la pantalla ALL (TODO).
11
MUESTRA ANALOGA
• La función ANALOG DISPLAY (MUESTRA ANALOGA) permite al usuario representar la
información del Manómetro Digital en la forma de dos grandes relojes análogos.
1) Seleccione el botón ANALOG DISPLAY (MUESTRA ANALOGA) para ingresar al modo
análogo. Aparecerá una nueva ventana mostrando la información digital en un formato
análogo (fig. 12)
NOTA: Cuando la presión entre en el rango negativo, los medidores cambiaran a
modo medidor de vacío (fig. 13)
Fig. 12
Español
www.mastercool.com
Fig. 13
35
Page 36

2) Haga un “click” en el botón EXIT (SALIDA) en la parte superior izquierda de la pantalla
para volver a la pantalla principal.
REVISANDO LO GRABADO
1) Para revisar un archivo que ha sido grabado y guardarlo, vaya a File > Replay from File.
2) Se mostrara una caja de dialogo ‘CHOOSE FILE TO READ” (ELIJA EL ARCHICO A LEER).
Seleccione al archivo que desea que se muestre.
a) Navegar a la ubicación del archivo
b) Seleccionarlo
c) Haga un “click” en OK
La aplicación le mostrara un gráfico de la información deL trabajo. Para revisar la información Ud. debe estar en el modo CURSOR. Mueva el cursor a través de la línea de tiempo
para examinar la información. Todas las características del programa están activadas con
excepción de la muestra de la información en “tiempo real”.
IMPRIMIR
• La opción de imprimir de Window esta ubicada bajo el archivo menú, Esto es para que
imprima la información que esta viendo en cualquier momento que lo desee.
EXPORTANDO LA INFORMACION
• La opción de exportar la información esta ubicada bajo el archivo menú. Si Ud. desea
exportar un archivo registrado vaya a File > Export. Aparecerá una ventana
preguntándole que seleccione un archivo registrado para exportar y un destino. Una
vez que esas opciones han sido elegidas, haga un “click” en Export. Un .archivo .txt será
creado.
IMPORTANDO LA INFORMADION GRABADA EN EL PROGRAMA DE DATA
LOGGING DE MASTERCOOL
NOTA: La función “Auto-Off” debe estar desactivada para que el manómetro se
comunique con el “software”.
1) Conecte el manómetro a la computadora usando en cable USB que se provee.
2) Encienda el manómetro digital.
3) Abra el Programa Data Logger
4) Una vez encendido y si hubiese información que descargar del Data Loger, la misma se
vera la siguiente pantalla:
36
www.mastercool.com
Page 37

5) El usuario verá la siguiente pantalla durante la transferencia. La barra representa el %
descargado.
6) Una vez que haya terminado la transferencia, se le instruirá al usuario que
ingrese un título y ubicación.
7) Después de hacer un “click” en continúe, el usuario será instruido que elija una carpeta.
Haga un “click” en “Current Folder” después de encontrar el archivo carpeta que Ud.
quiere.
8) El último paso es encontrar que trabajo quiere ver el usuario.
Refiérase a las instrucciones del Data Loger de Mastercool para ver la
información grabada.
NOTE: Para repasar la información debe estar en el modo CURSOR. Mueva el cursor a
través de la línea de tiempo para examinar la información. Todas las características
del programa están activados excepto la muestra de la información en “tiempo
real” lo cual incluye la sección del tiempo de grabación de las instrucciones.
Español
www.mastercool.com
37
Page 38

SOFTWARE DI REGISTRAZIONE-DATI PER GRUPPO
MANOMETRICO DIGITALE A 4 VIE CON VALVOLA A SFERA
L’applicazione Mastercool Data Logger fornisce tutte le funzioni di registrazione e visualizzazione necessarie a registrare, visualizzare e salvare nuovi dati o riprodurre e rivedere file
registrati in precedenza.
REQUISITI DI SISTEMA
L’applicazione è progettata per funzionare con Windows 2000, XP, Windows Vista e
Windows 7.
Sul CD sono presenti due software di installazione:
1) Setup.exe: installa l’applicazione Mastercool Data Logger e tutti i componenti
necessari, tranne il driver USB del gruppo manometrico (v. le informazioni relative
al CP210x_VCP_Win_XP_S2K3_Vista_7.exe più sotto)
2) CP210x_VCP_Win_XP_S2K3_Vista_7.exe installa il driver USB del gruppo
manometrico digitale.
Per Windows 7 o le versioni successive l’installazione del driver non sarà necessaria
INSTALLAZIONE DEL SOFTWARE E DEL DRIVER
Installazione del software
1) Inserire il software Mastercool Data Logger nel proprio lettore CD-ROM.
2) Aprire la cartella contenente il file del software Mastercool Data Logger.
3) Cliccare due volte su Setup.exe.
4) Scegliere una cartella di destinazione e cliccare su NEXT.
5) Accettare il contratto di licenza e cliccare su NEXT.
6) Apparirà il box di dialogo di avvio installazione; controllare il riepilogo e selezionare
NEXT.
7) A installazione completata, cliccare su FINISH.
38
www.mastercool.com
Page 39

8) Vi verrà poi suggerito di riavviare il computer. Cliccate su RESTART LATER e procedete
con l’installazione dei driver USB.
Installazione del driver
1) Cliccare due volte su CP210x_VCP_Win_XP_S2K3_Vista_7.exe.
2) Quando compare “Welcome to the Install Shield Wizard” cliccare su NEXT.
3) Accettare il contratto di licenza.
4) Scegliere una cartella di destinazione e cliccare su NEXT.
5) Quando compare “Ready to Install the Program”, cliccare su INSTALL.
6) Una volta completata l’installazione, cliccare su FINISH. Assicurarsi che la casella
“Launch the CP210xVCP Driver Installer” sia barrata.
Italiano
7) Appare Silicon Lab CP210x USB to UART Bridge: cliccate su NEXT.
www.mastercool.com
39
Page 40

8) Alla richiesta di riavviare il computer, rispondete Sì .
Si prega di seguire le seguenti istruzioni per visualizzare i dati del manometro
digitale in tempo reale.
PRIMO COLLEGAMENTO DEL MANOMETRO
IMPORTANTE: perché il manometro interagisca con il software, l’Auto-Off [autospegnimento] deve essere disattivato.
1) Installare l’applicazione DataLogger e il driver USB come descritto qui sopra.
2) Collegare il gruppo manometrico al computer usando il cavo USB in dotazione.
3) Accendere il gruppo manometrico digitale.
4) Windows assegnerà al gruppo manometrico una porta “Virtual COM”. Ricordate che da
macchina a macchina il numero di porta assegnato può variare.
5) Lanciare il Mastercool Data Logger attraverso la sequenza Start > All Programs >
Mastercool Data Logger > Mastercool Data Logger.
6) La prima schermata comprende una casella di testo per: nome del cliente (o della
postazione di installazione), data, nome del tecnico, seguiti dal comando ENTER.
Compilare i tre campi e cliccare su ENTER.
7) Se sul PC la porta COM4 non è stata assegnata al gruppo manometrico, dopo pochi
secondi apparirà la seguente finestra di dialogo:
Selezionare FIND per visualizzare la finestra di ricerca del gruppo manometrico:
Selezionare l’ultima porta dell’elenco e cliccare su “Test Port”. Se si tratta della porta
assegnata al gruppo manometrico, si riceverà il messaggio “Digital Manifold Detected”.
Selezionare “Use Selected Port” per continuare. Se la casella Status indica invece che il
gruppo manometrico non è stato rilevato, provare con altre porte. Selezionare una porta
e cliccare su “Test Port”. Una volta individuata la porta assegnata al gruppo manomet-
rico, l’applicazione la utilizzerà ad ogni avvio del programma.
LANCIARE IL SOFTWARE MASTERCOOL DATA LOGGER
Per lanciare il software Mastercool Data Logger (MDL), aprire la cartella in cui è stato
installato e cliccare due volte sull’icona Mastercool. Comparirà la schermata di benvenuto,
contenente il nome del cliente (o postazione di installazione), data e nome del tecnico
seguiti dal comando ENTER. Compilare i tre campi e cliccare su ENTER per continuare.
40
www.mastercool.com
Page 41

ELEMENTI DI BASE DEL DATA LOGGER
• Nella parte bassa dello schermo viene visualizzata una riga cronometrica, che misura il
tempo di registrazione selezionato in rapporto a quello trascorso dall’inizio della
registrazione. Se si è selezionato anche un cursore, al di sotto di esso apparirà una
finestra “time” in cui si legge in quale momento dall’inizio della registrazione tale evento
ha avuto luogo. Quando il cursore viene de-selezionato, la finestra “time” scompare.
• Nell’angolo inferiore destro dello schermo appare poi una finestra Recording Time, in cui
viene visualizzato il tempo di registrazione totale selezionato.
• Il programma utilizza le informazioni unitarie contenute in ciascun bit proveniente dal
gruppo manometrico, visualizzandole a scelta sullo schermo principale e/o sullo schermo
analogico.
• In mancanza di valori da visualizzare, il registratore dati visualizzerà NaN o 0 (NaN sta
per “Not a Number [non un numero]”). I valori corrispondenti a NaN o a 0 non compaiono
sul grafico, ma sono tuttavia presenti. I tratti del grafico in cui non vi sono valori da
visualizzare appariranno sul grafico come un’interruzione.
IL BOX di AVVERTIMENTO
Il box di avvertimento si trova all’estremità destra dello schermo. Gli avvisi appaiono scritti
in giallo, su fondo rosso lampeggiante. Gli avvisi che possono apparire sono:
• Warning! Please replace the battery in your digital manifold! [Attenzione, la batteria del
gruppo va sostituita!], che avverte l’operatore quando la batteria del gruppo manometrico
deve essere sostituita.
• No data/Invalid data! [Nessun dato/Dati non validi!] Accertatevi che il gruppo
manometrico sia collegato e alimentato e che l’auto-spegnimento sia disattivato. Tornate
al menù file e attivate la ricerca del gruppo manometrico per tentare di ricollegarlo.
Quando appare quest’avviso, eseguire la sequenza File > Manifold Finder per selezionare
la porta di comunicazione con il gruppo manometrico, come spiegato al paragrafo PRIMO
COLLEGAMENTO DEL MANOMETRO.
REGISTRAZIONE DELLE MISURAZIONI
• Col comando Time [RUN TIME] si decide la durata della registrazione dei dati del gruppo
manometrico da parte del software. I periodi di registrazione pre visti sono: 5 e 15 minuti,
1, 4, 8 e 24 ore.
• I dati vengono registrati in un file di log, che potrà essere salvato a fine registrazione.
PER INIZIARE LA REGISTRAZIONE
1) Cliccare sul menù a tendina “SELECT TIME” (fig. 1) per scegliere la durata della
registrazione.
1
2) Cliccare sul pulsante “START/STOP RECORDING” (fig. 2) per far partire il tracciamento
del grafico. La freccia START/STOP RECORDING sul pulsante si illuminerà di verde per
indicare che il processo di registrazione è iniziato.
www.mastercool.com
Italiano
41
Page 42

2
4
3
3) Durante la registrazione, nell’angolo inferiore destro dello schermo si potranno leggere
la quantità di TEMPO TRASCORSO [ELAPSED TIME] (fig. 3) e l’ORA DI PARTENZA
DELL’ULTIMA registrazione [LAST START TIME] (fig.4).
NOTA: per interrompere la registrazione prima che sia trascorso il tempo previsto
cliccare su “START/STOP RECORDING” (fig. 2.). Vi verrà chiesto di confermare
l’interruzione della registrazione e se volete salvare il file di log.
4) Una volta esaurito il tempo di registrazione impostato vedrete apparire una finestra con
la scritta: CHOOSE A LOCATION TO SAVE THE LOG FILE [Scegliere un indirizzo di
salvataggio del file], che vi invita a salvare il file, dandogli un nome e specificando dove
volete che venga salvato.
UTILIZZARE I CURSORI E LO ZOOM
COMANDO CURSORE
• Il comando CURSOR ON/OFF viene usato per visualizzare meglio il grafico che si vuole
analizzare più nel dettaglio. Si utilizza anche per mostrare i valori di temperatura e di
pressione in un dato momento.
1) Cliccare sul pulsante CURSOR ON/OFF (fig. 5) per attivare o disattivare il cursore. La
freccia CURSOR ON/OFF sul pulsante si illuminerà di verde per indicare l’attivazione
della modalità Cursore.
5
6
2) Quando il cursore è attivo, vedrete apparire una linea verticale tratteggiata che
rappresenta la sua posizione (fig. 6); cliccandoci sopra potrete trascinare la linea
verticale nella posizione che vi interessa.
NOTA: quando il cursore è attivo, lo sfondo degli indicatori numerici si colora e vi
viene visualizzato il valore corrispondente alla posizione del cursore.
3) La posizione cronologica del cursore – in ore, minuti e secondi - si può leggere
42
www.mastercool.com
7
Page 43

nell’indicatore “CURSOR POSITION” (fig. 7) sul lato destro dello schermo.
4) Quando il cursore viene disattivato, il grafico ritornerà alla lunghezza totale di
registrazione e lo sfondo degli indicatori numerici ritornerà ad essere di colore grigio.
IL COMANDO ZOOM
• ZOOM FACTOR può essere visualizzato in modalità NORMALE, 5x o 10x. Sui dati in
registrazione la scala selezionata non ha altro effetto che quello di dilatare digitalmente i
dati visualizzati. Il fattore di zoom (scalatura) serve a visualizzare punti di particolare
interesse del flusso di dati. Per entrare in modalità Zoom occorre attivare il comando
Cursor.
1) Per selezionare il fattore d’ingrandimento cliccare sul menù a tendina “ZOOM FACTOR”
(fig. 8)
8
CARATTERISTICHE DELLA FUNZIONE DI VISUALIZZAZIONE
• Il comando Display ALL [Visualizza TUTTO] permette di visualizzare simultaneamente tutti
i parametri del gruppo manometrico: mentre le funzioni lineari scorrono sullo schermo,
verrà visualizzato in forma numerica anche il valore dei dati in “tempo reale”.
• Se lo desidera, l’operatore ha comunque la possibilità di tenere d’occhio anche singole
funzioni. In tal caso, anche se è attivato il Visualizza TUTTO, l’operatore può scavalcare
tale opzione semplicemente andando con il mouse sulla funzione che gli interessa. Il
Data Logger continuerà a registrare in background tutte le funzioni, indipendentemente
da quante sono quelle visualizzate singolarmente.
• Il comando Display DEEP VACUUM ONLY [Visualizza solo VUOTO SPINTO] permette di
visualizzare sullo schermo unicamente le letture del vuoto spinto. Il software passerà
automaticamente a questa modalità nel momento in cui viene raggiunto lo stato di vuoto
spinto attraverso un collegamento a termocoppia e il gruppo manometrico sta
registrando in “tempo reale”.
SELEZIONARE IL GRAFICO DA VISUALIZZARE
1) Cliccare sui pulsanti di controllo che si trovano sul lato sinistro dello schermo per
attivare o disattivare la visualizzazione di uno specifico grafico (fig.9).
9
Italiano
10
2) Cliccare su “SHOW ALL PLOTS” (fig. 10) per attivare rapidamente i grafici che non sono
visualizzati.
NOTA: anche i dati dei grafici momentaneamente non visualizzati continuano ad
essere registrati.
LETTURA DEL VUOTO
• Vi sono due modalità per misurare il vuoto:
a) direttamente attraverso il gruppo manometrico dove la pressione negativa viene
rappresentata in PSI, INHg, Bar, MPa o Kg/cm2.
b) Utilizzando una termocoppia, per ottenere una lettura molto precisa. Le letture possono
essere allora in Micron, mBar, KPa, mmHg, Pa, Torr e mTorr.
www.mastercool.com
43
Page 44

COLLEGAMENTO DELLA TERMOCOPPIA
Quando si utilizza un collegamento a termocoppia i dati possono essere rappresentati e
registrati utilizzando la funzione DEEP VACUUM ONLY, di cui sopra.
1) Collegare il sensore della termocoppia e premere il pulsante del vuoto. Una volta
selezionata la modalità DEEP VACUUM ONLY, apparirà un grafico verde ingrandito come
quello qui sotto e comincerà a tracciare il grafico dell’attività.
2) L’intervallo standard rappresentato nel grafico tracciato dal registratore dati è 0 - 5000.
L’operatore può modificare manualmente tale intervallo cliccando sul numero che
corrisponde al limite superiore e portandolo all’intervallo desiderato (fig. 11).
NOTA: una volta raggiunta una pressione positiva, la schermata DEEP VACUUM
ritornerà a quella Display ALL.
11
VISUALIZZAZIONE ANALOGICA
• La funzione ANALOG DISPLAY permette all’operatore di far apparire i dati relativi al
gruppo manometrico digitale sotto forma di due grandi quadranti analogici.
1) Selezionare il pulsante ANALOG DISPLAY per attivare la modalità analogica. Una finestra
separata comparirà mostrando i dati numerici in modalità analogica (fig.12).
NOTA: quando la pressione entra nella zona negativa, i manometri passano alla
modalità di misurazione del vuoto (fig.13).
Fig. 12
Fig. 13
2) Cliccare sul pulsante EXIT nell’angolo superiore sinistro dello schermo per tornare alla
schermata principale.
RIPRODURRE UNA REGISTRAZIONE
44
www.mastercool.com
Page 45

1) Per riprodurre un file registrato e salvato precedentemente, andare su File > Replay from
File.
2) Comparirà la finestra di dialogo “CHOOSE FILE TO READ”. Selezionare il file log che si
vuole visualizzare.
a) Andare alla posizione del file
b) Selezionarlo
c) Cliccare su OK.
L’applicazione mostrerà il grafico dei dati provenienti da tale ciclo.
Per scorrere attraverso i dati è necessario essere in modalità CURSOR e muovere il cursore
lungo la linea del tempo. Eccetto la visualizzazione dei dati in “tempo reale”, tutte le carat-
teristiche del programma sono attivate.
STAMPARE I DATI
• In qualunque momento si volessero stampare i dati che appaiono sul display, l’accesso
alla finestra di stampa si trova sotto il menu File.
ESPORTARE I DATI
• Un’opzione di esportazione-dati si trova sotto il menu File. Se volete esportare un file log
andate su File > Export. Apparirà una finestra con l’invito a selezionare il file log da
esportare e la destinazione. Fatto ciò, cliccate su Export: verrà generato un file .txt.
IMPORTARE DATI NEL PROGRAMMA DI REGISTRAZIONE MASTERCOOL
NOTA: perché il manometro interagisca con il software, l’Auto-Off
[auto-spegnimento] deve essere disattivato.
1) Collegare il gruppo manometrico al computer usando il cavo USB fornito.
2) Accendere il gruppo manometrico digitale.
3) Lanciare il programma Data Logger.
4) All’avvio, qualora vi siano dati da scaricare il registratore-dati mostrerà la seguente
schermata.
Italiano
5) Durante il trasferimento, l’operatore vedrà la seguente schermata, con un cursore che
rappresenta la percentuale di completamento.
www.mastercool.com
45
Page 46

6) Una volta completato il trasferimento, l’operatore verrà invitato ad inserire titoli, date e
postazioni.
7) Dopo aver selezionato Continua, l’operatore verrà invitato a scegliere una cartella.
Cliccare su “Current Folder” dopo aver individuato il percorso desiderato.
8) L’ultimo passo consiste nell’individuare il ciclo che si desidera visualizzare:
Per visualizzare i dati archiviati seguire le istruzioni relative alla registrazione-dati.
NOTA: per scorrere attraverso i dati è necessario essere in modalità CURSOR e muovere il cursore lungo la linea del tempo. Tutte le caratteristiche del programma sono
attivate eccetto la visualizzazione-dati in “tempo reale”, che include il paragrafo
registrazione-misurazioni delle istruzioni.
46
www.mastercool.com
Page 47

DATA LOGGING SOFTWARE VOOR DIGITALE 4-WEG
MANIFOLD MET KOGELKRANEN
The Mastercool Data Logger Toepassing verschaft alle nodige recorder- en displayfuncties
voor het registreren, vertonen en opslaan van nieuwe gegevens en het weer vertonen en
herzien van voordien geregistreerde bestanden.
SYSTEEMEISEN
De toepassing is ontworpen om op Windows 2000, XP, Windows Vista en Windows 7 te
draaien.
De CD bevat twee installatie-bestanden:
1) Setup.exe: installeert de Mastercool Data Logger Toepassing en alle vereiste
onderdelen, behalve the USB driver voor de digitale MANIFOLD
(zie de informatie hierna) CP210x_VCP_Win_XP_S2K3_Vista_7.exe)
2) CP210x_VCP_Win_XP_ S2K3_Vista_7.exe: installeert de driver voor de USB voor
de digitale manifold.
Voor Windows 7 of latere versies zijn de installaties van de driver niet nodig.
INSTALLATIE VAN SOFTWARE EN DRIVER
Installatie van de software
1) Plaats de Mastercool Data Logger software in uw CD-drive.
2) Open het bestand van de Mastercool Data Logger software.
3) Dubbel klik op Setup.exe.
4) Kies een doeldirectory en kies NEXT.
5) Aanvaard de licentie-overeenkomst en kies NEXT.
6) Het dialoogvenster voor het starten van de installatie verschijnt; controleer de gegevens
en kies NEXT.
7) Zodra de installatie vervolledigd is, kies FINISH.
www.mastercool.com
Nederlands
47
Page 48

8) Nu wordt U gevraagd uw computer weer op te starten. Kies RESTART LATER en ga
verder met de installatie van de USB drivers.
Installatie van de Driver
1) Dubbel klik op CP210x_VCP_Win_XP_S2K3_Vista_7.exe.
2) Het venster “Welcome to the Install Shield Wizard” verschijnt, kies NEXT.
3) Aanvaard de licentie-overeenkomst.
4) Kies een doeldirectory en kies NEXT.
5) Wanneer “Ready to Install the Program” verschijnt, kies INSTALL.
6) Zodra de installatie vervolledigd is, kies FINISH. Verzeker u ervan dat de box “Launch the
CP210xVCP Driver Installer” aangevlagd is.
7) Silicon Lab CP210x USB to UART Bridge Installer verschijnt, kies NEXT.
48
www.mastercool.com
Page 49

8) Herstart uw computer wanneer dit gevraagd wordt.
Om de gegevens van de digitale manifold in “real time” te tonen, volgt men de
volgende aanwijzingen.
EERSTE VERBINDING VAN DE MANIFOLD
BELANGRIJK: Auto-Off moet uitgeschakeld zijn opdat de manifold met de software
kan communiceren.
1) Installeer de Data Logger toepassing en de USB driver zoals hierboven beschreven.
2) Verbind de manifold aan de computer met de voorziene USB kabel.
3) Schakel de digitale manifold aan.
4) Windows zal een “Virtual COM” toewijzen aan de manifold. Let op, het nummer van de
poort kan veranderen van machine tot machine.
5) Open de Mastercool Data Logger Toepassing via Start > All Programs > Mastercool Data
Logger > Mastercool Data Logger.
6) Het eerste venster bevat: een tekstbox met Klantennaam (of plaats van installatie),
Datum en Naam van de Technicus , gevolgd door een ENTER commando. Vul alle drie de
velden in en kies ENTER.
7) Als uw PC niet COM4 als poort voor de manifold heeft toegeschreven, zal u na enkele
seconden de volgende melding verkrijgen:
Kies Find om het Venster voor het opsporen van de manifold te tonen.
Kies de laatste poort van de lijst en klik op “Test Port”. Als dit de poort is die
toegewezen werd aan de manifold, verschijnt er een melding “Digitaal Manifold
Detected”. Kies “Use Selected Port” om verder te gaan. Als de status-box aangeeft dat
de manifold nog niet gevonden is, gaat u verder met het testen van de andere poorten.
Kies een poort en klik op “Test Port”. Zodra u bepaald hebt welke poort aan de manifold
werd toegewezen, kan de toepassing verder deze poort blijven gebruiken bij alle
volgende gebruiken van het programma.
OPSTARTEN VAN DE MASTERCOOL DATA LOGGER SOFTWARE
Om de Mastercool Data Logger (MDL) op te starten, gaat u naar de folder waar het programma van de data logger geïnstalleerd werd en klikt u tweemaal op het pictogram van
de Mastercool.
Het welkomvenster verschijnt en bevat: een tekstbox met Klantennaam (of plaats van
installatie), Datum en Naam van de Technicus , gevolgd door een ENTER commando. Vul
alle drie de velden in en kies ENTER om verder te gaan.
Nederlands
www.mastercool.com
49
Page 50

BASISPRINCIPES VAN DE DATA LOGGER
• Onderaan het scherm wordt een Tijd-Lijn getoond, die de gekozen opnametijd meet ten
opzichte van de tijd die verlopen is sinds het begin van de opname. Als er ook een cursor
gekozen is, verschijnt er een “tijd” venster onder de cursor, dat aangeeft wanneer die
gebeurtenis plaats gevonden heeft, gemeten vanaf het begin van de opname. Als de
cursor niet geselecteerd is, verdwijnt het tijd-venster.
• In de rechtse hoek onderaan het scherm verschijnt een geselecteerd venster voor de
opname-tijd, dat de totale duur van de gekozen opname-tijd toont.
• Het programma gebruikt de informatie-eenheden in iedere data bit op de manifold en
toont deze eenheden op het hoofdscherm en/of het analoge scherm, zoals gewenst.
• De Data Logger toont NaN of 0 als er geen waarde beschikbaar is. (NaN staat voor “Not
a Number”). Data-punten die NaN of 0 zijn, verschijnen niet op een plot, maar zijn wel
aanwezig. Tijdperiodes in een plot waar er geen waarde getoond is, worden aangegeven
als een hiaat in de plot.
DIALOOGVENSTER WAARSCHUWINGEN
Het dialoogvenster voor waarschuwingen verschijnt aan de rechterkant van het scherm.
Wanneer er een waarschuwing aangegeven wordt, zal dit met rood en gele tekst knipperen. De volgende waarschuwingen kunnen verschijnen:
• Warning! Please replace the battery in your digital manifold!
Deze melding waarschuwt de bediener dat de batterij van de digitale manifold
vervangen moet worden.
• No data/invalid data! Bevestig dat de manifold verbonden en aangeschakeld is en dat de
auto-off uitgeschakeld is. Ga naar het bestandenmenu en kies de zoeker voor de
manifold om te proberen het opnieuw te verbinden. Wanneer deze melding verschijnt,
dient men naar File > Manifold Finder te gaan om de geschikte poort te kiezen voor
communicatie met de manifold, zoals verklaard in de rubriek EERSTE VERBINDING VAN
DE MANIFOLD.
OPNAME-METINGEN
• Het commando voor de opnametijd (RUN TIME) is de gekozen hoeveelheid tijd voor de
opname van de gegevens van de manifold door de data logger software. De volgende
opnametijden zijn beschikbaar: 5 minuten, 15 minuten, 1 uur, 4 uren, 8 uren en 24 uren.
• De gegevens worden geregistreerd in een log file. U kan deze file opslaan zodra de run
ten einde is.
OPNAME STARTEN
1) Klik op het selectiemenu “SELECT TIME” (afb.1) om de duur van de opnametijd te
kiezen.
1
2) Klik op de toets “START/STOP RECORDING” (afb.2) om de registratie van de gegevens te
starten. Het pijltje START/STOP RECORDING op de toets wordt groen verlicht om aan te
geven dat het opnameproces gestart is.
50
www.mastercool.com
Page 51

2
4
3
3) Terwijl de opname bezig is, zullen indicatoren de ELAPSED TIME (afb. 3) en de LAST
START TIME van de opname (afb.4) aangeven in de rechtse hoek onderaan het scherm.
NOTA: Om de opname te stoppen voordat de tijd verstreken is, klikt men op “START/
STOP RECORDING” (afb.2). U wordt gevraagd te bevestigen dat u de opname wil
stoppen en indien dit zo is, of u de log file wil opslaan.
4) Wanneer de afgestelde opnametijd ten einde is, wordt U gevraagd de opname op te
slaan. Er verschijnt een venster met de melding: KIES EEN PLAATS OM DE LOG FILE OP
TE SLAAN. Geef de file een naam en geef aan waar u de file wilt opslaan.
GEBRUIK VAN CURSOREN & ZOOM
COMMANDO CURSOR
• Het commando CURSOR ON/OFF wordt gebruikt om een beter zicht te verkrijgen van
de kenmerken in de plot die men nader wil onderzoeken. Het wordt ook gebruikt om de
waarden van de temperatuur en de druk op specifieke momenten te visualiseren.
1) Klik op de toets CURSOR ON/OFF (afb. 5) om de cursor aan of uit te schakelen. Het pijltje
CURSOR ON/OFF op de toets wordt groen verlicht om aan te geven dat de cursor aan is.
5
6
2) Wanneer de cursor aangeschakeld is, zal u een verticale stippellijn zien (afb. 6) die de
positie van de cursor aangeeft. Klik en sleep deze verticale stippellijn naar de gewenste
positie.
NOTA: Als de cursor aangeschakeld is, zullen de numerieke indicatoren een
gekleurde achtergrond hebben, en de waarde op de positie van de cursor visualiseren.
3) De tijdpositie van de cursor vindt men met de indicator “CURSOR POSITION” (afb. 7) aan
de rechterkant van het scherm. De tijdpositie wordt aangegeven in Uren:Minuten:
Seconden.
www.mastercool.com
7
Nederlands
51
Page 52

4) Als de cursor uitgeschakeld is, schakelt de plot over naar de volledige opnametijd en
wordt de achtergrond van de numerieke indicatoren grijs.
COMMANDO ZOOM
• De ZOOM FACTOR kan worden weergegeven in NORMAL, 5X of 10X. De gekozen schaal
NORMAL, 5X of 10X heeft geen invloed op de gegevens die geregistreerd worden,
behalve dan dat de gegevens die getoond worden digitaal uitgerekt worden. De
bedoeling en toepassing van de zoom- (schaal-) factor is specifieke datapunten te
visualiseren. Het cursor-commando moet aangeschakeld zijn om de Zoom te kunnen
aanschakelen.
1) Klik op het selectiemenu van de “ZOOM FACTOR” (afb. 8) om een factor 5X of 10X te
kiezen.
8
TOON DE KENMERKEN VAN DE FUNCTIES
• Display ALL commando’s. Dit staat toe alle parameters van de digitale manifold
tegelijkertijd te tonen. Terwijl de functielijnen op het scherm verschijnen, wordt
ook de waarde van de real-time gegevens digitaal weergegeven.
• De gebruiker kan ook slechts enkele specifieke functies controleren, indien
gewenst. In dit geval, ook al is het scherm in werkwijze voor het tonen van
ALLE functies, kan de gebruiker het ALL-zicht overschrijven door gewoon de
gewenste functie met de muis te kiezen. De Master Data Logger blijft alle
functies op de achtergrond registreren, onafhankelijk van hoeveel individuele
functies getoond worden.
• Toon het commando DEEP VACUUM ONLY. Dit staat toe enkel de lezingen van
diep vacuüm op het scherm te tonen. De software schakelt automatisch over
naar deze werkwijze wanneer het diep vacuüm bereikt wordt door een
thermokoppel verbinding en de manifold in “real time” opneemt.
KIES DE PLOTS VOOR VISUALISATIE
1) Klik op de keuzeboxen aan de linkerkant van het scherm om de visualisatie van
specifieke plots aan of uit te schakelen (afb. 9).
9
10
2) Klik op “SHOW ALL PLOTS” (afb. 10) om snel alle plots aan te schakelen die nog niet
getoond worden.
NOTA: De gegevens worden nog steeds geregistreerd, onafhankelijk van het feit dat
ze niet getoond worden.
VACUUM METINGEN
• Er zijn twee manieren om het vacuüm te meten:
a) Direct door de manifold, wanneer de negatieve druk uitgedrukt is is PSI, INHg, Bar, MPa
of Kg/cm2.
52
www.mastercool.com
Page 53

b) Door middel van een thermokoppelverbinding voor een nauwkeurigere meting. De
metingen kunnen weergegeven worden in Micron, mBar, KPa, mmHg, Pa, Torr e mTorr.
TERMOKOPPEL VERBINDING
Wanneer men een thermokoppel verbinding gebruikt, kunnen de data op een grafiek
weergegeven worden en geregistreerd worden met de selectie DEEP VACUUM ONLY die
hiervoor vermeld werd.
1) Verbind de sensor van het thermokoppel en druk op de vacuümtoets. Wanneer DEEP
VACUUM ONLY geselecteerd is, verschijnt er een bredere groene grafiek, zoals hieronder,
en de activiteit wordt op de grafiek weergegeven.
2) De standaard range die weergegeven wordt op de data logger chart is 0-5000. De
gebruiker kan handmatig deze range wijzigen door op het nummer te klikken en het te
naar de gewenste waarde veranderen (afb. 11).
NOTA: Wanneer een positieve druk bereikt wordt, zal het scherm DEEP VACUUM
omschakelen naar het scherm ALL.
11
ANALOGE DISPLAY
• De functie ANALOG DISPLAY staat de gebruiker toe de digitale gegevens van de digitale
manifold als twee grote analoge manometers weer te geven.
1) Kies de toets ANALOG BUTTON om naar het analoge scherm te gaan. Er verschijnt een
apart venster dat de digitale gegevens in analoog formaat aangeeft (afb. 12)
NOTA: Wanneer de druk negatief wordt, zullen de manometers overschakelen naar
de vacuümstand. (afb. 13).
Fig. 12
www.mastercool.com
Nederlands
Fig. 13
53
Page 54

2) Klik op de toets EXIT in de rechterhoek bovenaan het scherm om terug te gaan naar het
hoofdscherm.
EEN OPNAME WEER AFSPELEN
1) Om een voordien geregistreerde en opgeslagen file weer af te spelen, gaat men naar
File > Replay from File.
2) Er verschijnt een dialoogbox “CHOOSE FILE TO READ”. Kies de gewenste log file.
a) Ga naar de positie van de file.
b) Kies deze.
c) Klik OK.
De toepassing toont u een plot van alle gegevens uit de run. Om de gegevens te doorlopen,
moet u in de CURSOR werkwijze zijn. Beweeg de cursor langs de tijdlijn om de gegevens
na te gaan. Alle kenmerken van het programma zijn aangeschakeld behalve de gegevens
in “real time”.
GEGEVENS AFDRUKKEN
• De optie voor het afdrukken van het venster bevindt zich onder het bestandenmenu. Dit
dient om, op eender welk moment, de gegevens op het scherm af te drukken.
GEGEVENS EXPORTEREN
• Onder het bestandenmenu is er een optie voor het exporteren van de gegevens. Om een
log file te exporteren, gaat u naar File > Export. Er verschijnt een venster dat u vraagt een
log file voor export en een bestemming te kiezen. Na deze opties gekozen te hebben,
klikt men op Export. Er wordt een .txt file gecreëerd.
GEREGISTREERDE GEGEVENS IN HET PROGRAMMA VAN DE MASTERCOOL
DATA LOGGER IMPORTEREN
NOTA: Auto-Off moet uitgeschakeld zijn opdat de manifold met de software kan
communiceren.
1) Verbind de manifold aan de computer met de voorziene USB-kabel.
2) Schakel de manifold aan.
3) Open het Programma van de Data Logger.
4) Bij het opstarten, zal de logger het volgende scherm tonen als er data beschikbaar zijn
voor download.
54
www.mastercool.com
Page 55

5) Tijdens de transfer ziet de gebruiker het volgende scherm. De slider geeft het
vervolledigde % aan.
6) Na vervollediging van de transfer, wordt de gebruiker gevraagd titels, datums
en locaties in te geven.
7) Na op “continue” geklikt te hebben, wordt de gebruiker gevraagd een folder te
kiezen. Klik op “Current Folder” na het gewenste pad gevonden te hebben.
8) De laatste stap is het bepalen van welke job de gebruiker wenst te zien:
Zie de instructies van de Mastercool Data Logging om de opgeslagen gegevens te visualiseren.
NOTA: Om de gegevens te doorlopen, moet u in de CURSOR werkwijze zijn. Beweeg
de cursor langs de tijdlijn om de gegevens na te gaan. Alle kenmerken van het programma zijn aangeschakeld behalve de gegevens in “real time”, inclusief de sectie
van de instructies voor de metingen van de opname.
Nederlands
www.mastercool.com
55
Page 56

USA
PH (973) 252-9119
Belgium
TELEFON
+32 (0) 3 777 28 48
56
www.mastercool.com
99903-DL-INTINS
 Loading...