

Page 1
SOFTWARE MANUAL
Version 1.5.21
Page 2

INDEX
1 INTRODUCTION.........................................................................
2 INITIAL SETTINGS......................................................................
3 PROGRAMMING.........................................................................
4 BATCHES....................................................................................
5 MEASUREMENT PAGE..............................................................
6 GLOBAL SETUP..........................................................................
7 PROTOCOLS..............................................................................
8 TRACING DATA..........................................................................
9 M
ERLIN DIGITAL SIGNALS MANAGEMENT..................................
10 BACKUP/RESTORE .........................................................................
APPENDIX - STATISTICAL ANALYSIS.................................................................
APPENDIX - P
ROGRAM THE WINDOWS® CE OPERATING SYSTEM.......................
P
AGE. 4
P
AGE. 12
P
AGE. 25
AGE. 37
P
P
AGE. 42
P
AGE. 51
P
AGE. 58
P
AGE. 68
P
AGE. 72
P
AGE. 81
P
AGE. 84
AGE. 92
P
- 2 -
Page 3

- 3 -
Page 4
1 INTRODUCTION
Designed for simple measuring applications up to 16 sensors/measurements and
basic statistics analysis, Merlin represents a new concept of gage computer using
the same technologies created for PDA and portable electronics, for data collection
from traditional or wireless measuring devices.
The Merlin software is based on Microsoft® .Net® technology and uses the Microsoft®
Windows® CE operating system.
The simple, user-friendly touch-screen user interface can be used to program and perform measurements without the need for additional input devices.
1.1 Operating limits
Maximum number of connectable sensors 16
Maximum number of characteristics 16
Maximum number of steps 16
Maximum number of classes 32
Maximum number of part programs 200
Maximum number of batches 200
1.2 Command bar
A command bar containing a series of icons corresponding to the selected menu is
always displayed at the bottom of the screen, each icon includes a brief description;
move the mouse over any icon to display a more detailed description of the command associated with the icon in the centre of the bar.
1.3 User interface
The user interface is a touch-screen, so it is necessary to tap the icons and fields in
order to interact with the Merlin software, alternatively, it is also possible to connect
a USB type mouse.
MENU: tap this icon to select the main menu from which it is possible to
access all the software functions at any moment.
OK: this icon appears in all the programming windows when it is necessary to confirm that the user wishes to save the data.
- 4 -
Page 5
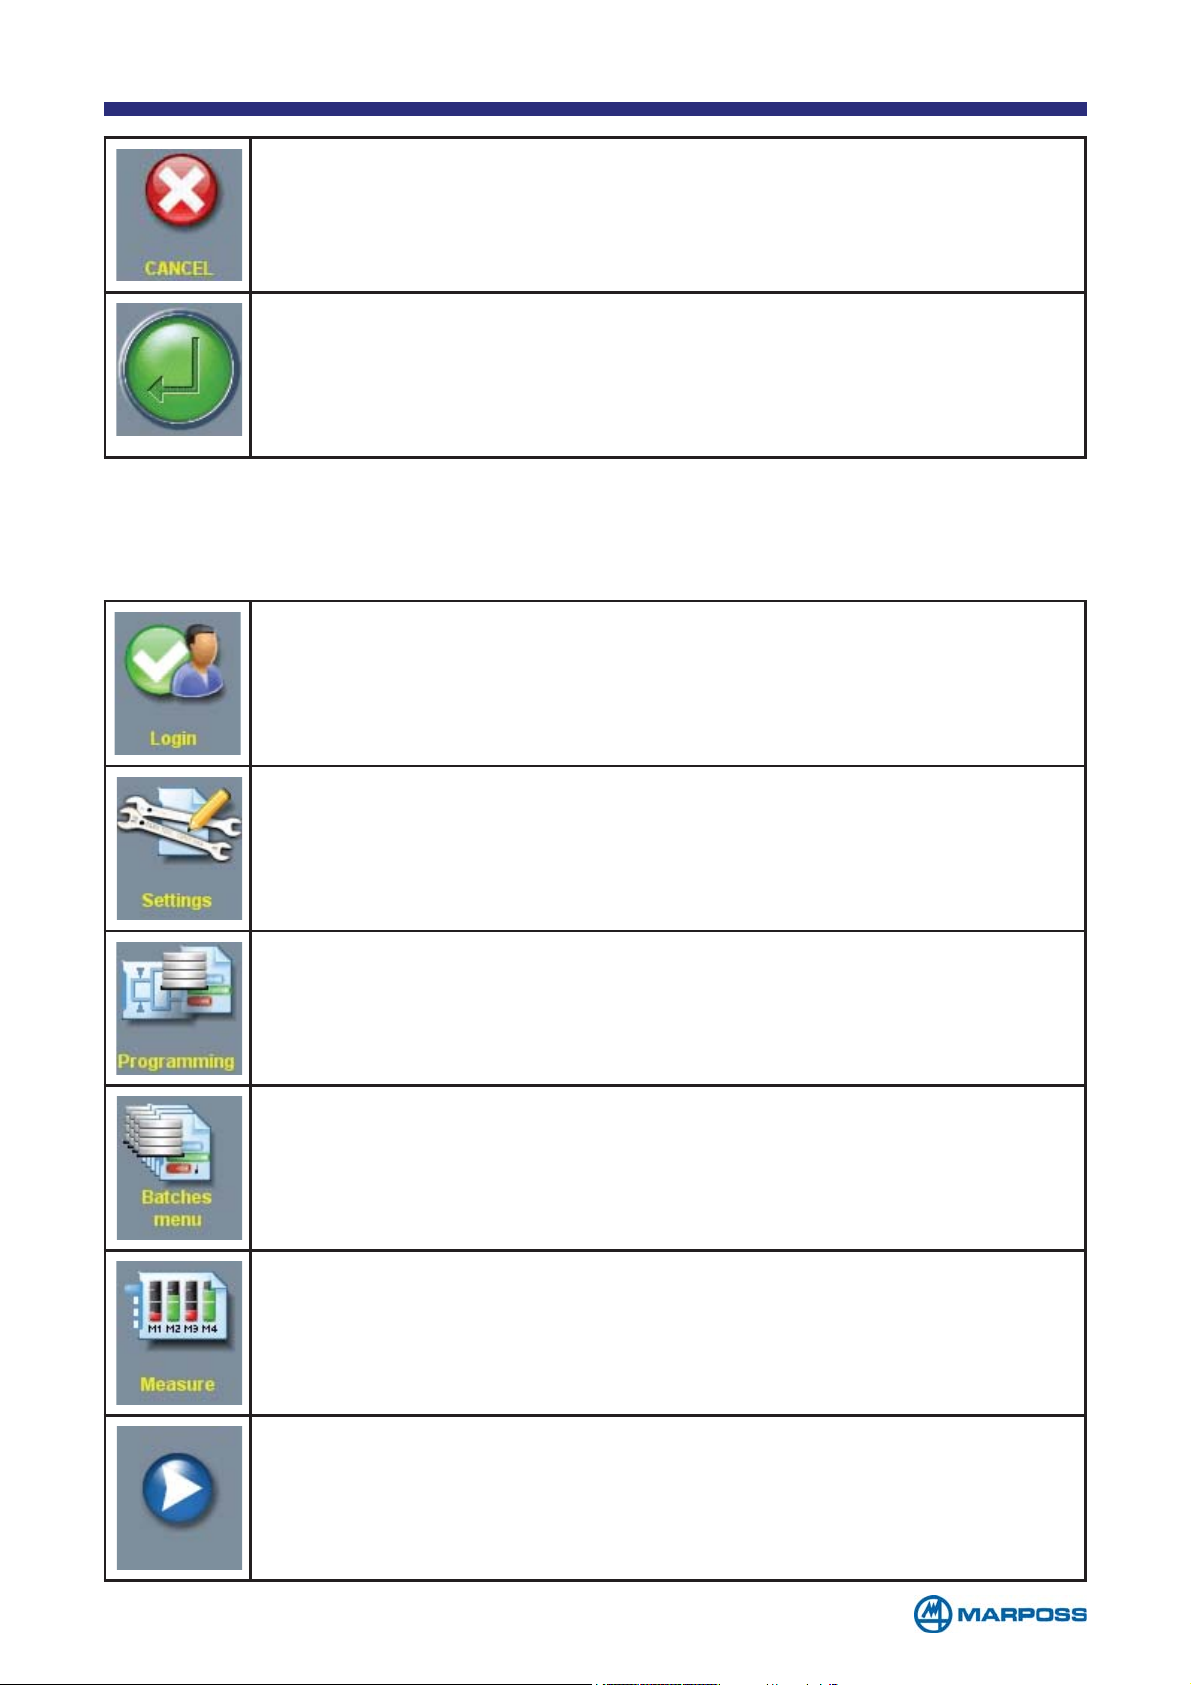
CANCEL: this icon appears in all programming windows and it permits
to exit without saving the data.
ENTER: it permits the user to confirm data entered via the virtual
keypad.
1.4 Menu
The menu can be used to access all the functionalities.
Switch between ADMINISTRATOR and OPERATOR user levels
Access to configuration phase
Access to programming phase
Access to BATCH creation phase
Access to MEASUREMENT page
If the menu contains more than 5 icons, this command can be used
to scroll through the subsequent icons.
- 5 -
Page 6
1.4.1 Settings menu
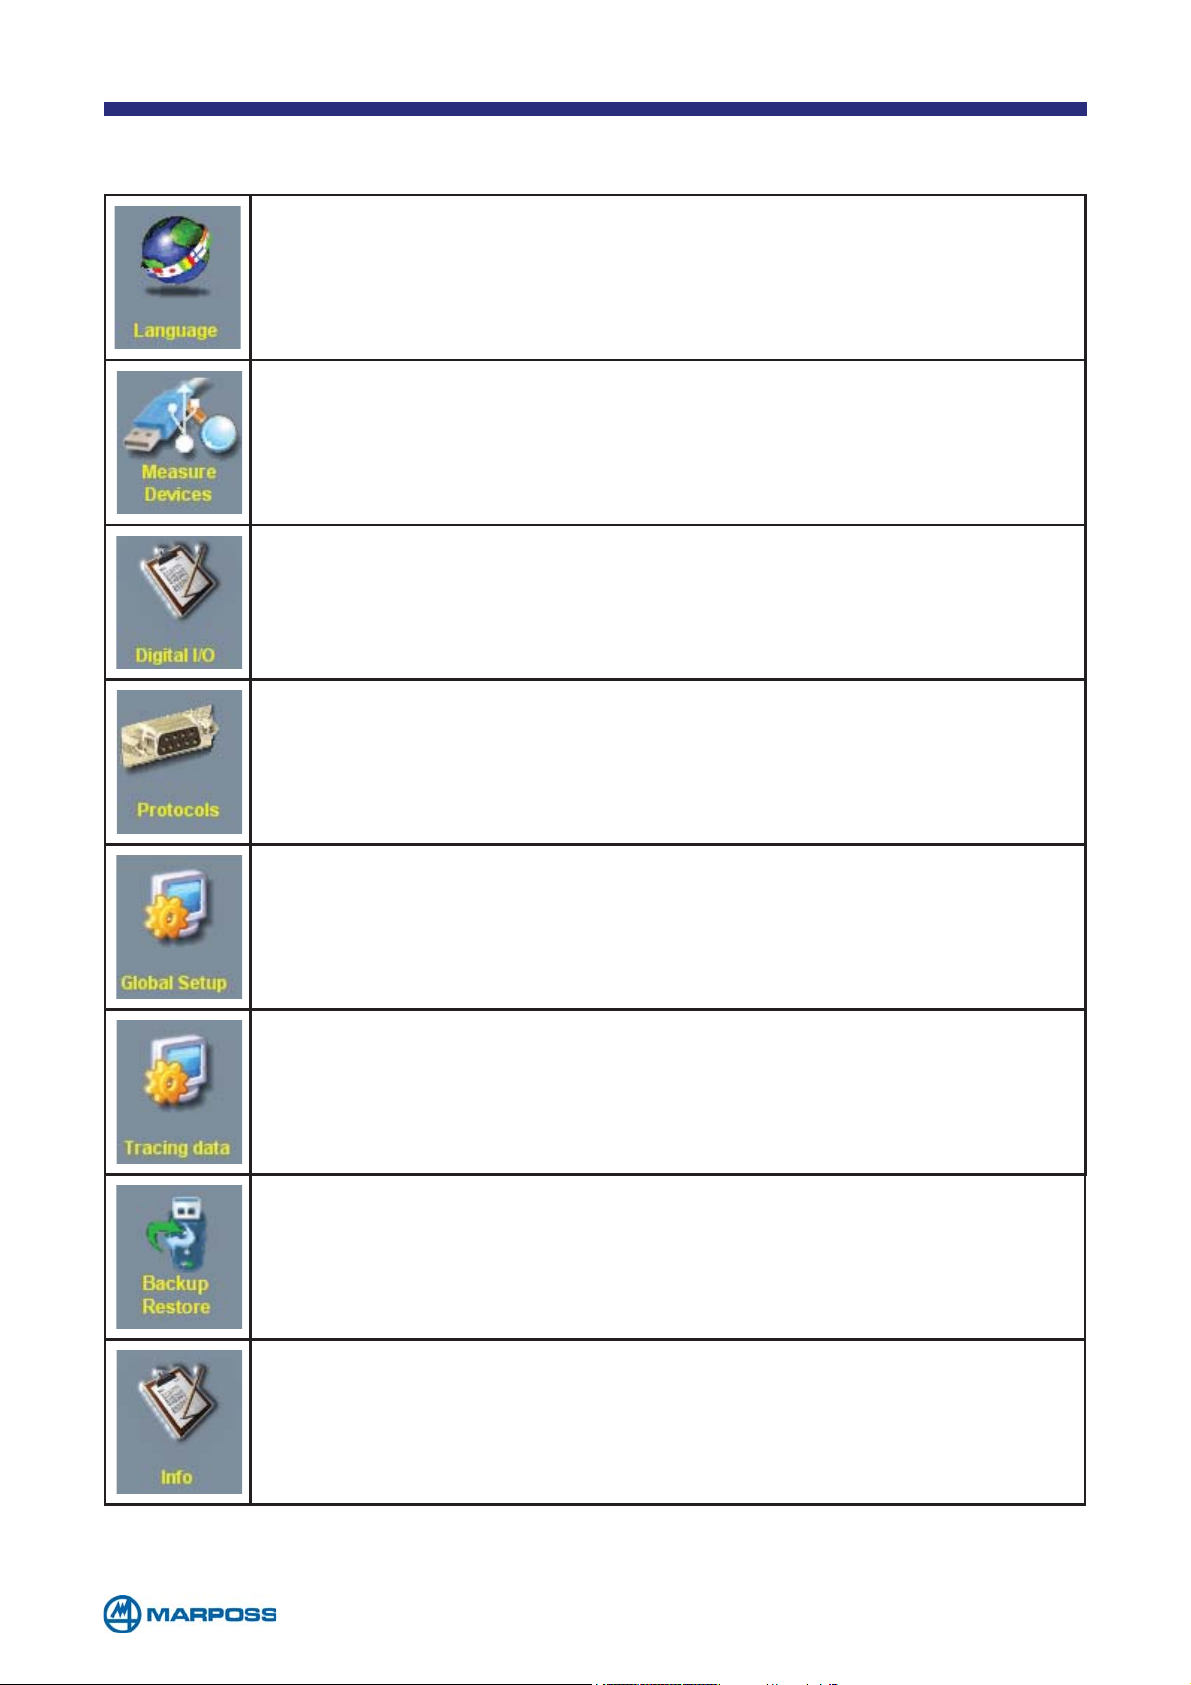
Access to sub-menu where it is possible to change the LANGUAGE
Access to MEASUREMENT DEVICES MAP page where it is possible to insert
additional devices (See chapter 2)
Access to I/O LINES MAP page that provides a rapid overview of all the
I/O signals associated with the connected devices (See paragraph
2.7).
Access to LIST OF SERIAL PROTOCOLS page that lists all the standard protocols handled by Merlin and enables the user to create customised
protocols (See chapter 7).
Access to MAIN SETUP page (See chapter 6).
Access to TRACING DATA (See chapter 8).
Access to software function which enables the BACKUP RESTORE of the
application (See Chapter 10).
Display the MERLIN VERSION, ALLOCATED MEMORY and FREE SPACE REMAINING
ON DISC.
- 6 -
Page 7
Exit from the measuring software.
1.4.1 Programming menu
Access to PART PROGRAM LIST (See paragraph 3.2).
Access to MASTER SET LIST (See paragraph 3.1).
NOTE: Available languages: English, Italian, German, French, Japanese, Spanish, Portuguese, Chinese, Dutch, Swedish, Polish, Hungarian,
Romanian, Czech, Korean and Turkish.
For Chinese, Korean and Japanese languages an appropriate operating
system is required.
- 7 -
Page 8
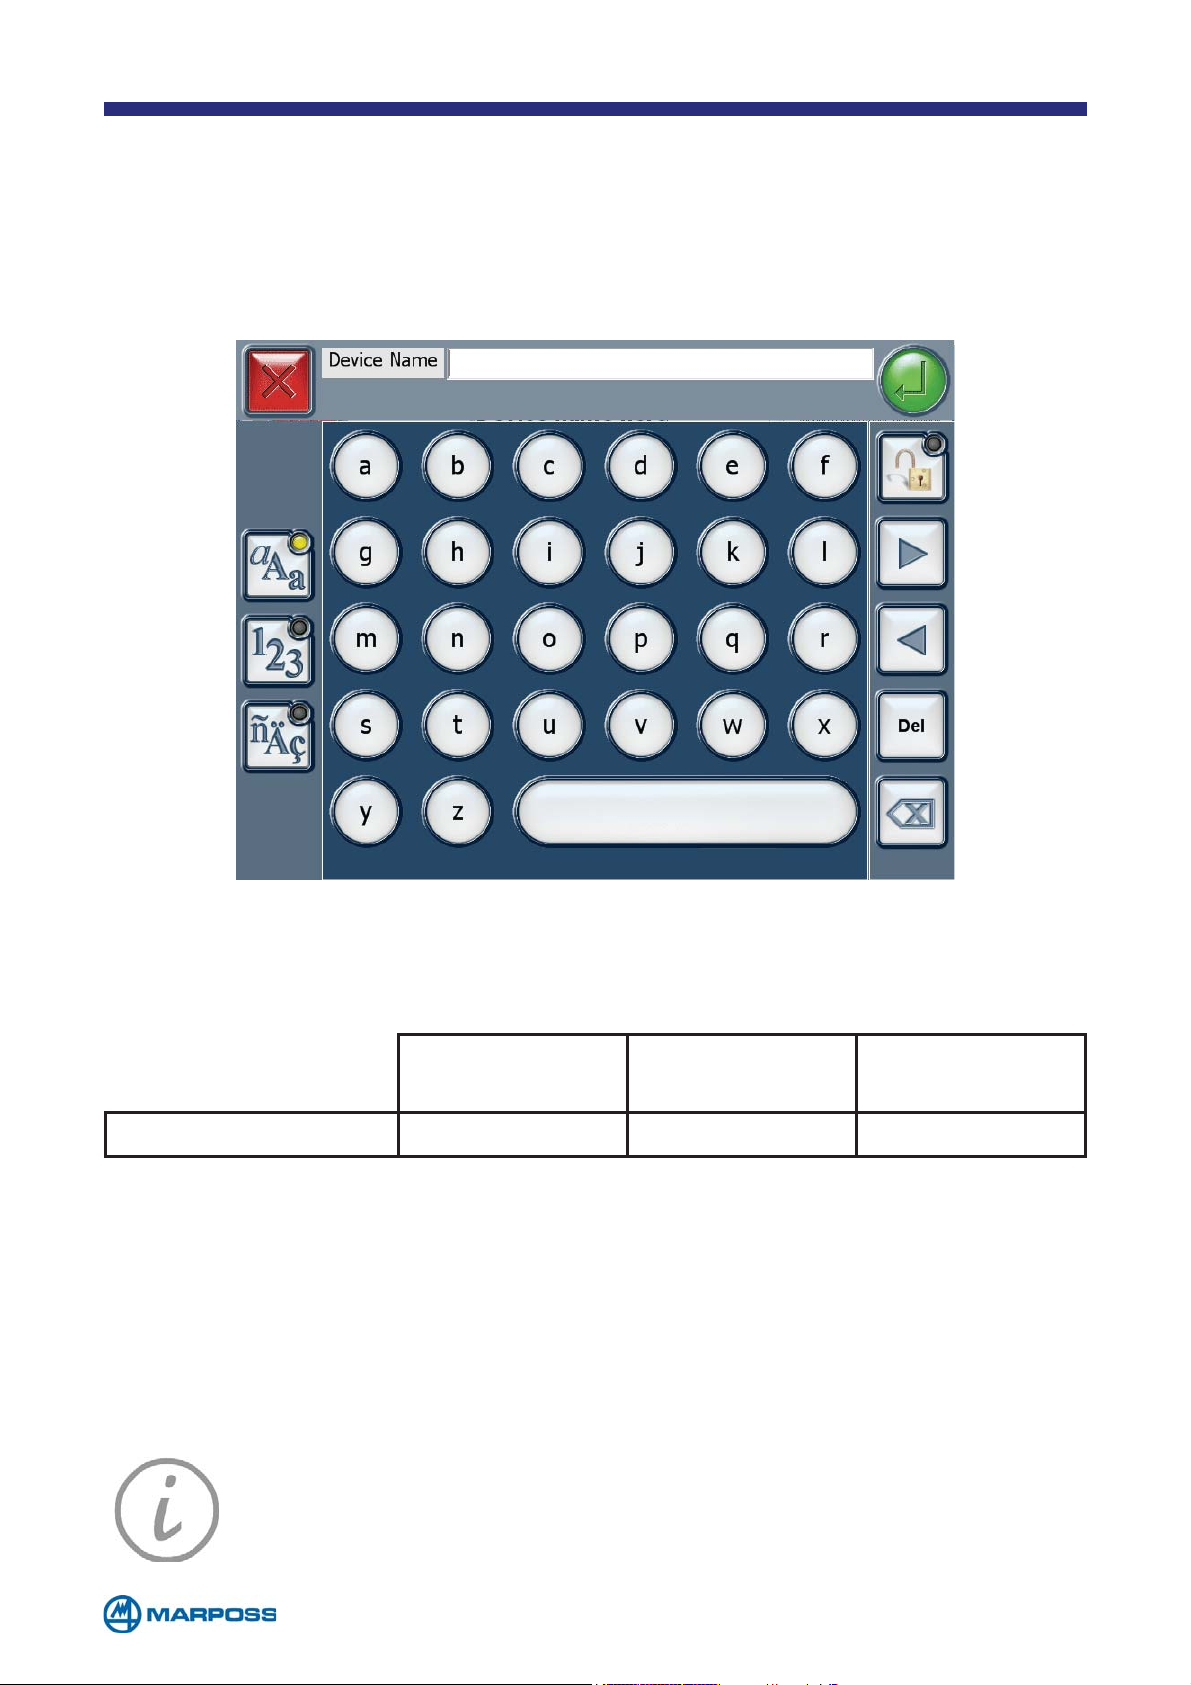
1.5 The virtual keyboards
The operator can enter data by using the virtual keyboards that vary in their format
depending on the language and type of data to be entered or modified.
Alphanumerical E
NTER icon to confirm the data that have been entered.
Oriental keyboards available:
Chinese
830MEFBC00
Japanese
830MECBC00
Korean
830MEEBC00
Merlin Si Si Si
NOTE: It is also possible to connect a USB keyboard to Merlin, or a
laser scanner (for reading barcodes or datamatrix) if it is configured in
wedge emulation.
- 8 -
Page 9
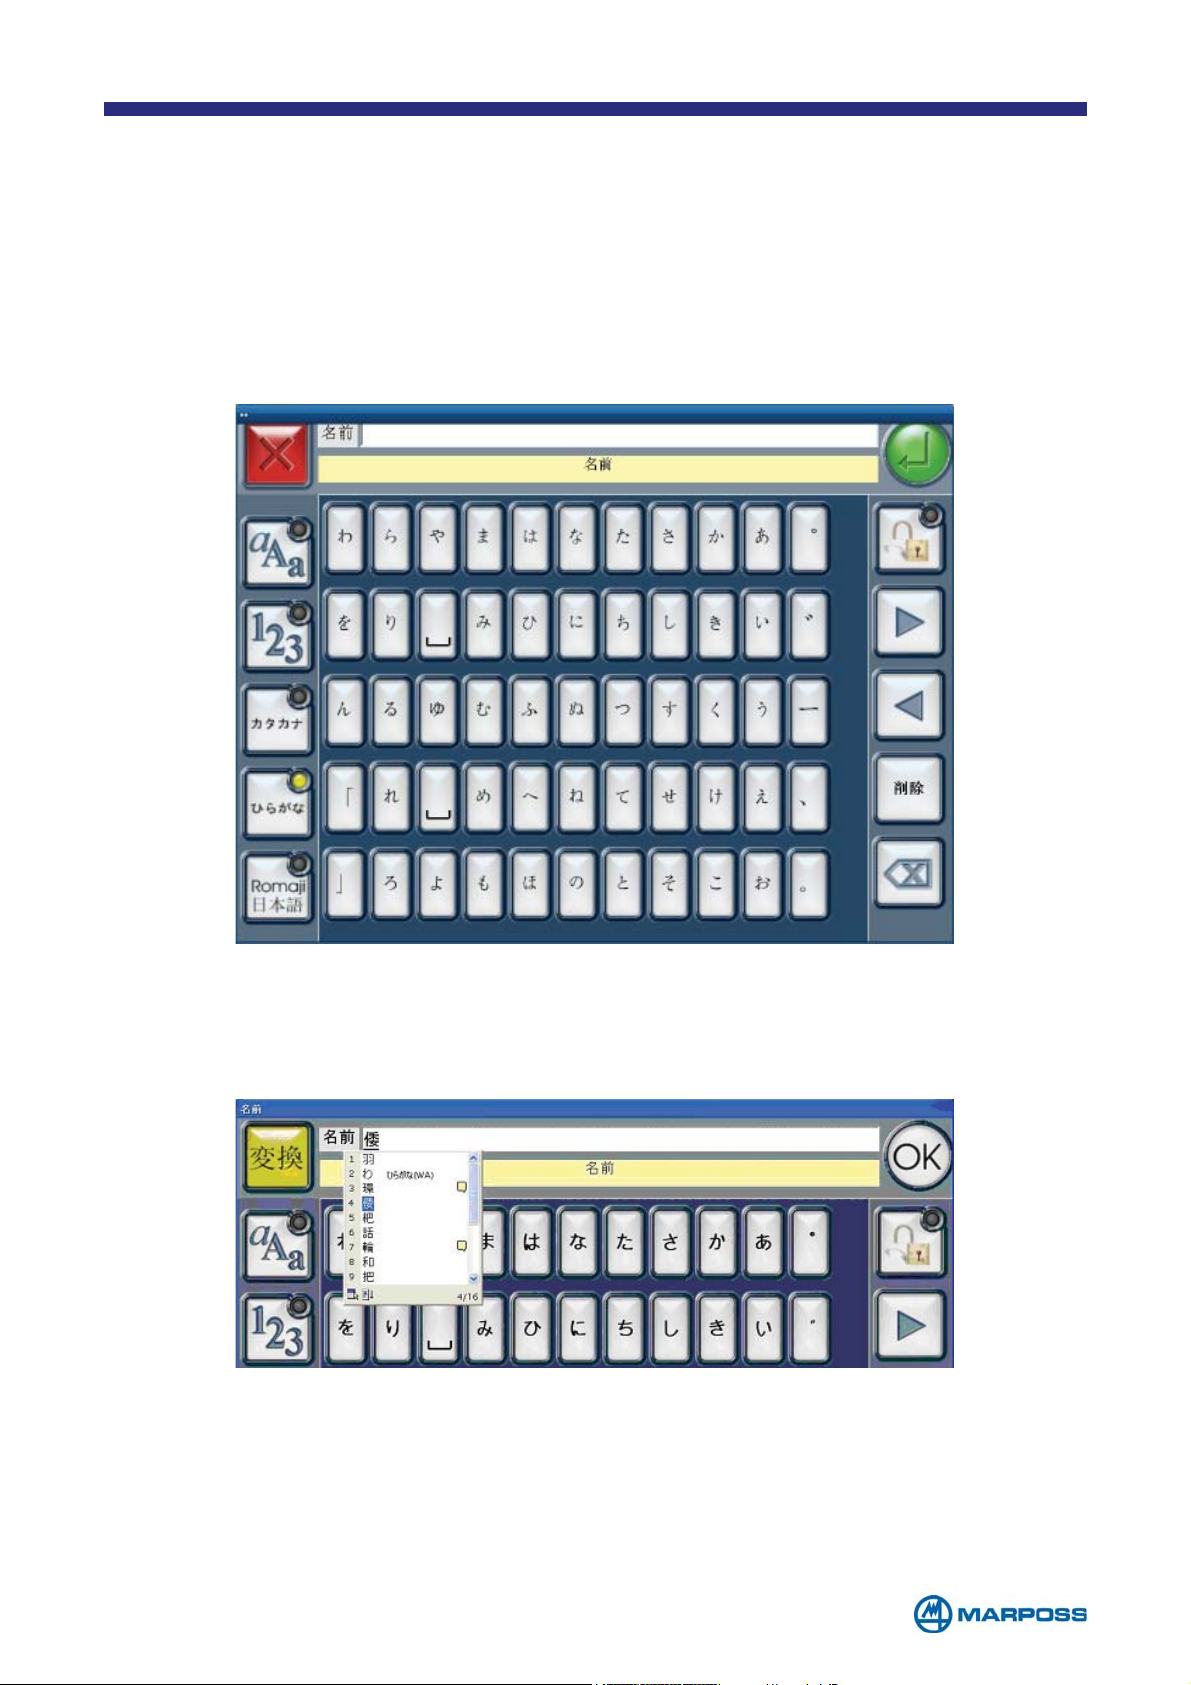
1.5.1 Using the Japanese keyboard (Hiragana or Katakana)
When the operator selects the language from the general Menu, the software opens the
corresponding keyboard and handles all the communications with the IME and selects
the appropriate O.S. settings for the specific input language.
In the case of Japanese, it is possible to select between 3 different keyboard types:
Hiragana, Katakana, Romanji, in additional to the traditional versions. When the operator
taps a button, the corresponding character is displayed in the text box at the top of the
page.
The EXIT key is replaced with a character selector key and the Enter key is replaced
by the OK button, which is used to confirm the character selected from the list.
Once the operator has finished entering the string, the standard buttons reappear
and it is possible to confirm the input by tapping the E
NTER button.
- 9 -
Page 10
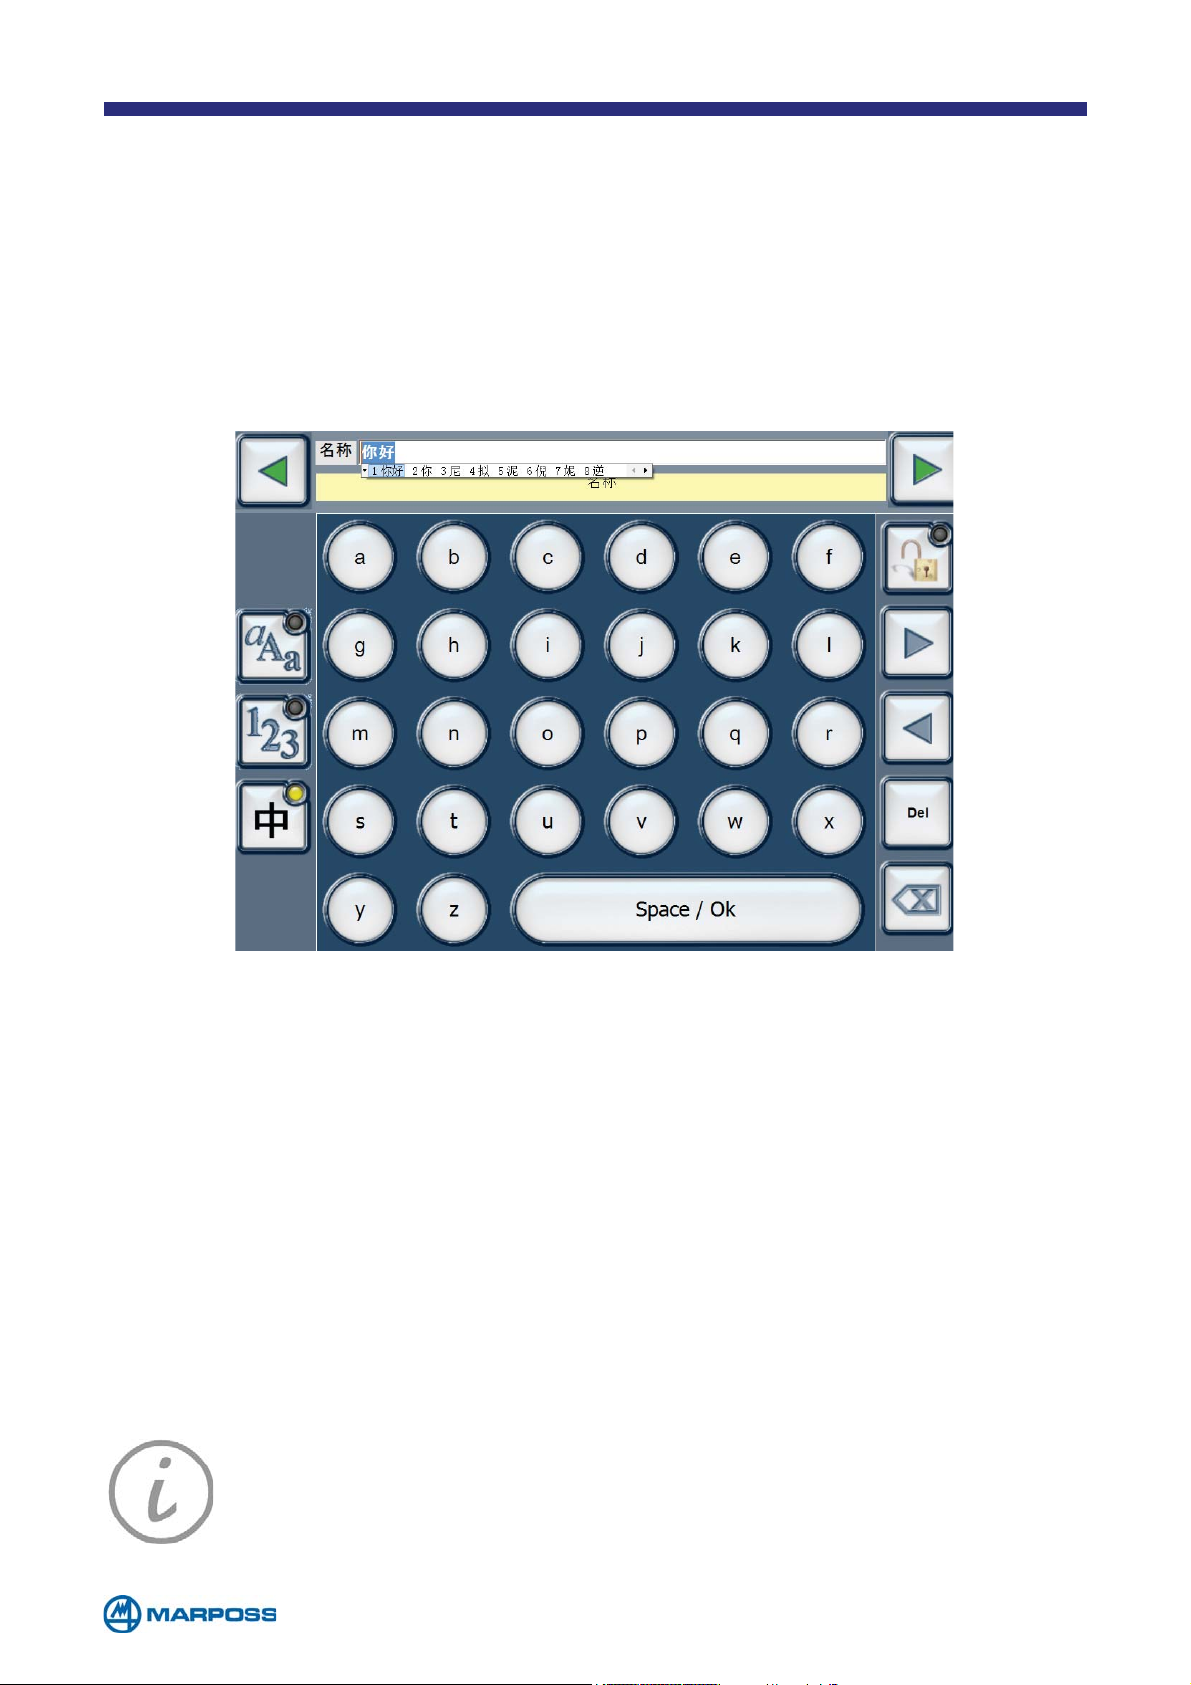
1.5.2 Using the Chinese keyboard (Pinyin)
To enter text in Chinese, select the last keyboard on the list, type the desired
characters and tap Space/Ok to display the list of candidates. The green arrows
located next to the text box, can be used to scroll left and/or right through the list.
Once the desired letter has been entered, tap ‘Space/Ok’ to confirm the selection,
tap again to close the IME and return to the standard keyboard. Tap the Enter button
to confirm the data and return to the initial form.
NOTE: It is also possible to connect a USB keyboard to Merlin Plus, or
a laser scanner (for reading barcodes or datamatrix) if it is configured in
wedge emulation (for example Honeywell 6300 Series DPM).
- 10 -
Page 11
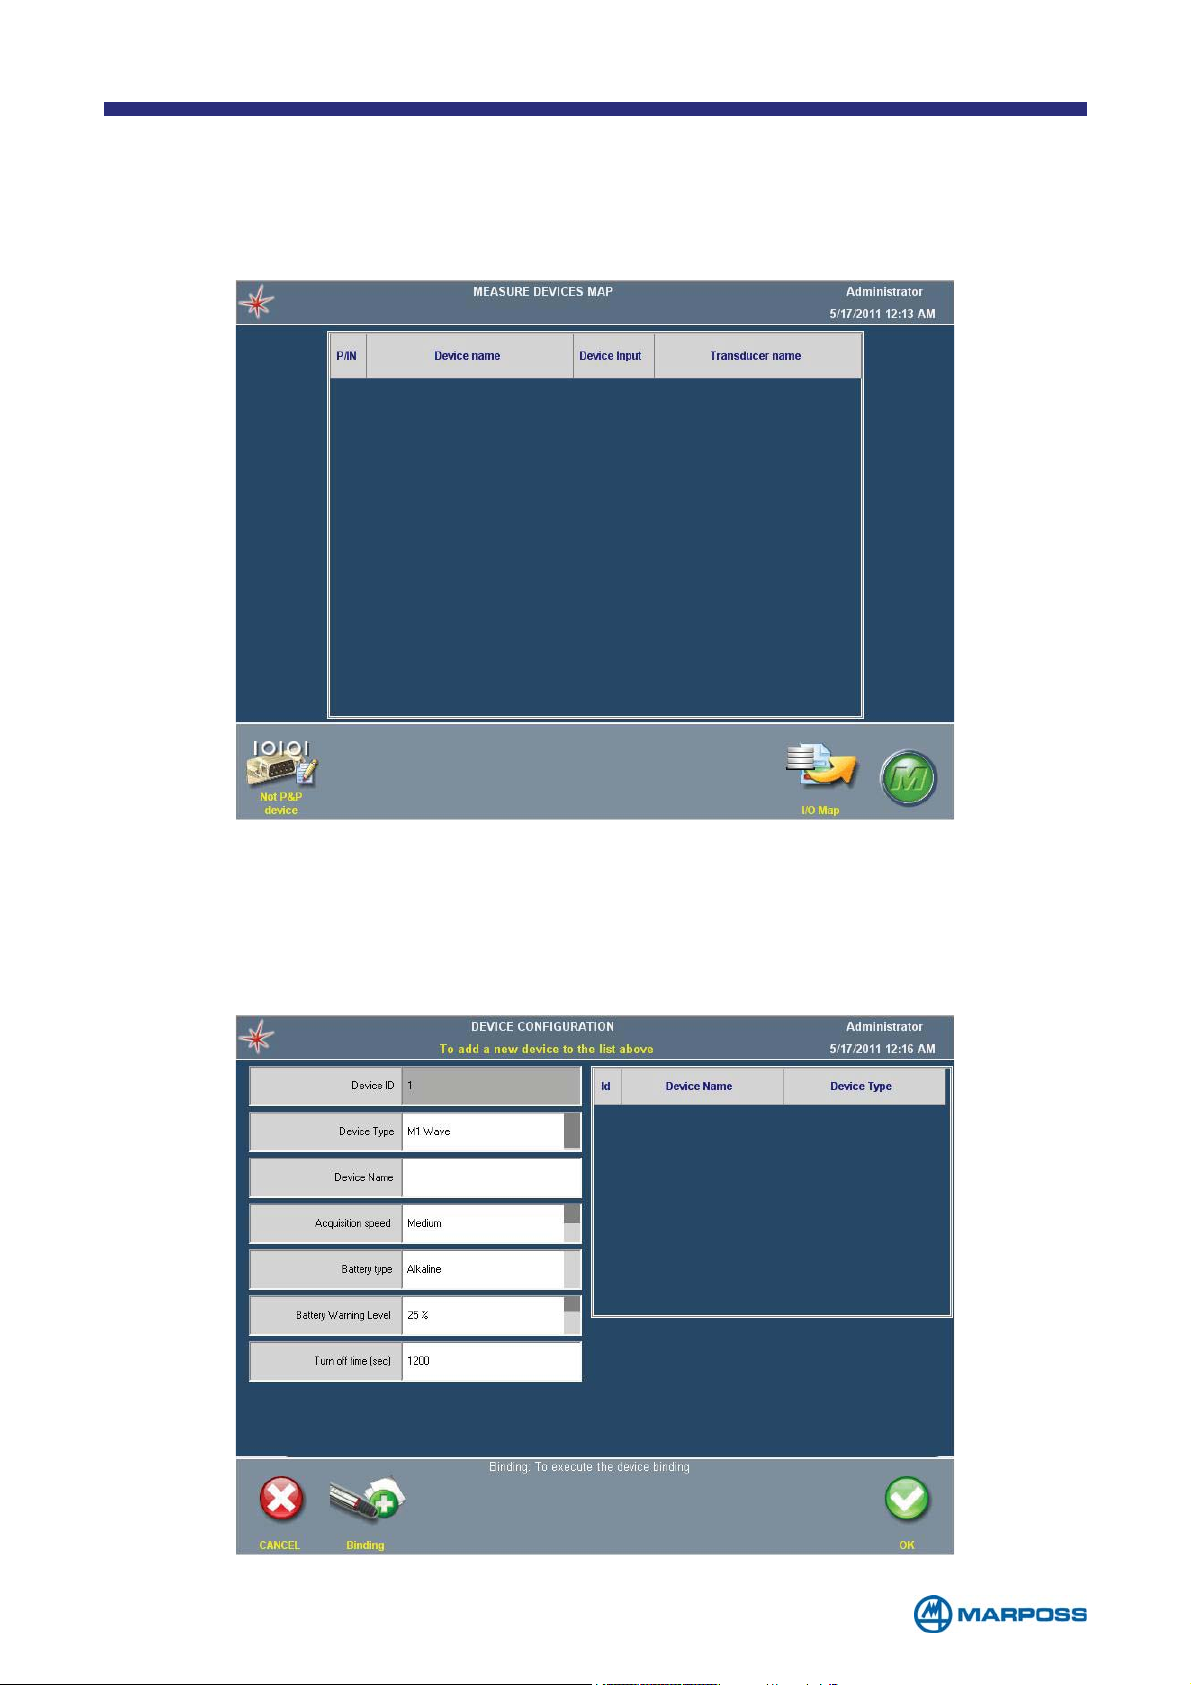
2 INITIAL SETTINGS
When a new and unprogrammed Merlin is switched on, the MEASUREMENT DEVICES MAP
page is displayed, initially empty.
To carry out the initial set-up, proceed as follows; note that it is not necessary to
connect any of the devices at this stage.
• Select N
• The Device
Merlin by tapping the D
ON P&P DEVICE from the command bar
SETTINGS WINDOW appears, select the type of device connected to
EVICE TYPE FIELD repeatedly (See paragraph 2.2).
- 11 -
Page 12
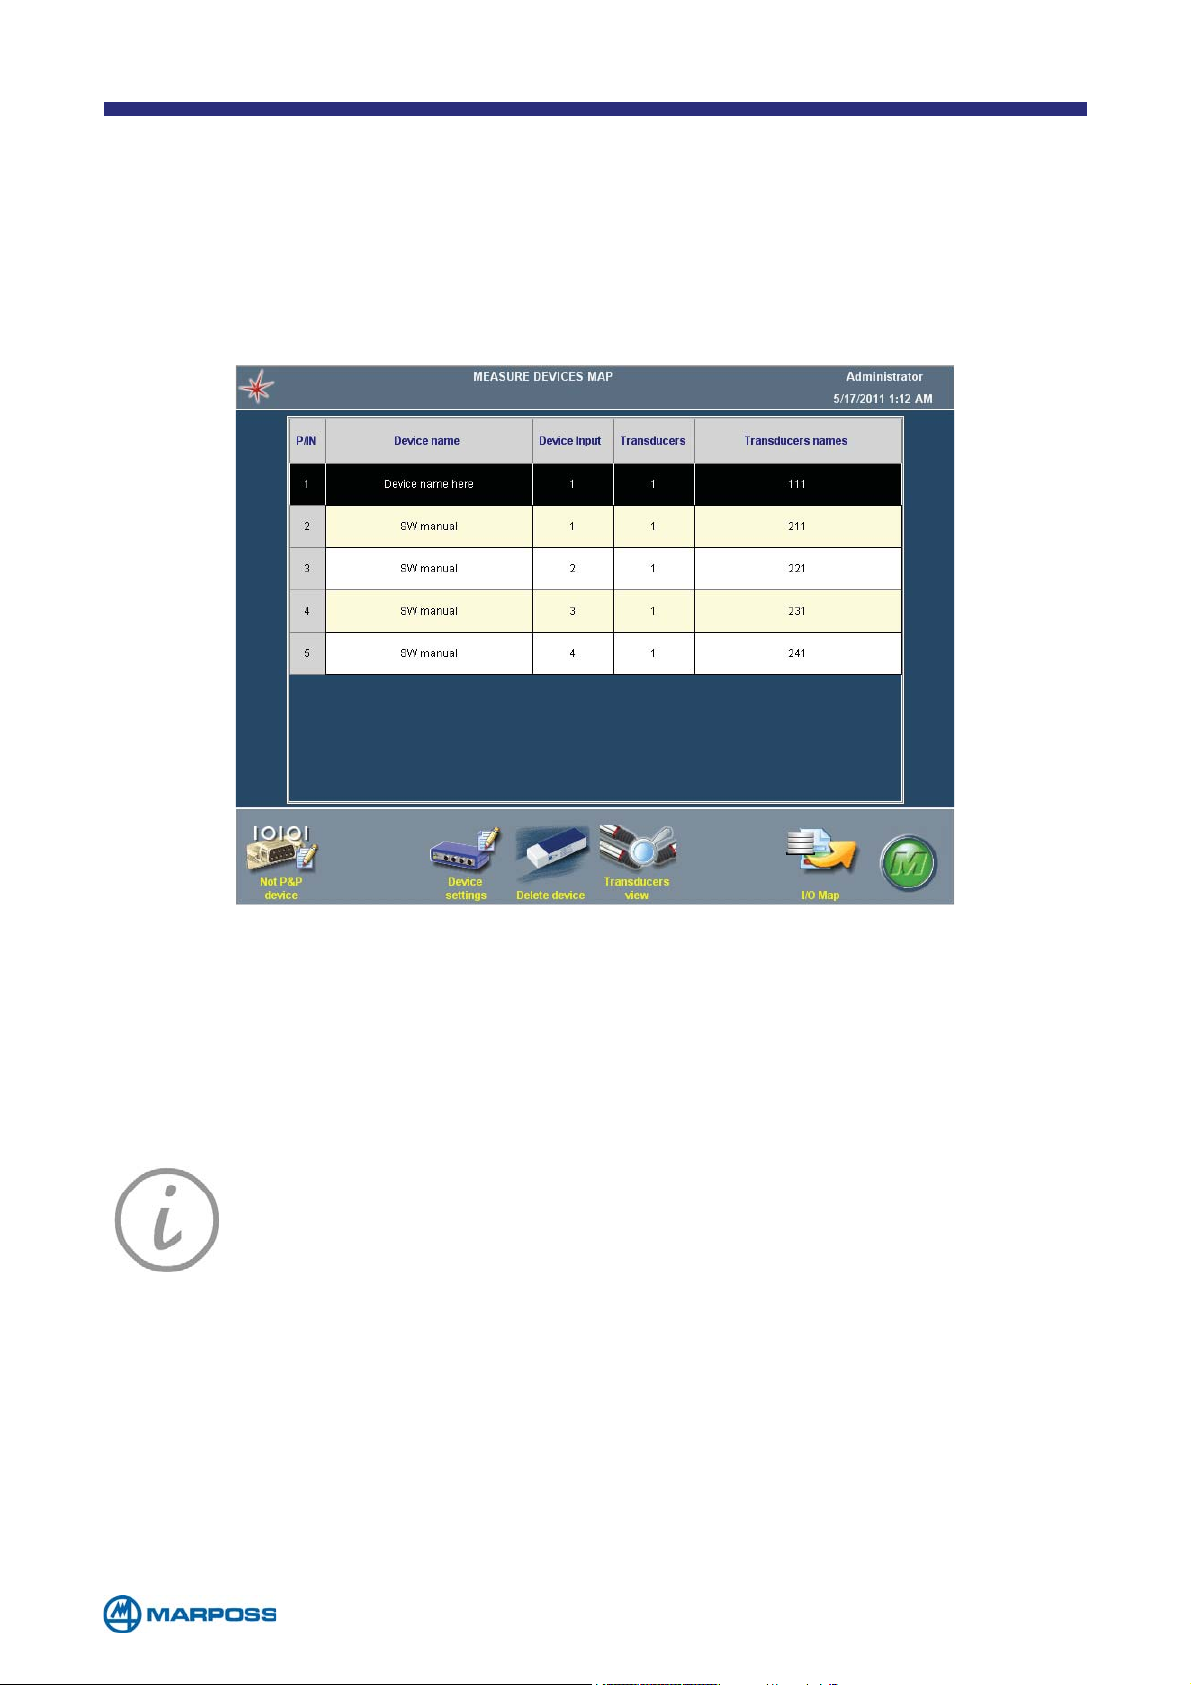
• Enter a name in order to identify the device in the DEVICE NAME FIELD.
• Tap Ok to save the data; if the device has not connected yet, the message “E
ROR OPENING DRIVER” is displayed.
As new devices are entered the M
EASUREMENT DEVICES MAP begins to fill up, displaying
a line for every input available on each device.
R-
Key: Each transducer is identified by a three figure value, for example,
T213. The first figure identifies the device, the second the channel and the
third the instance. Hence, the transducer identified as T213 corresponds
to the third instance of the first transducer on the second device.
NOTE: If a DigiCrown network with more than 9 transducers, it may be
necessary to use 4 figures to identify the transducers (e.g. T1121). In this
case, the middle two figures indicate that it is the twelfth transducer on
the network.
NOTE: if more than one device of the same type is connected make a
note of the order in which they were connected; this is because, if it is
necessary to disconnect them they must be reconnected in the same
order otherwise Merlin will fail to recognize them.
NOTE: If it is necessary to modify a device type that has already been
configured, the system checks that the new type has the same number
of inputs, and hence that it is compatible with the previous type. This is
especially useful when replacing a faulty device.
- 12 -
Page 13
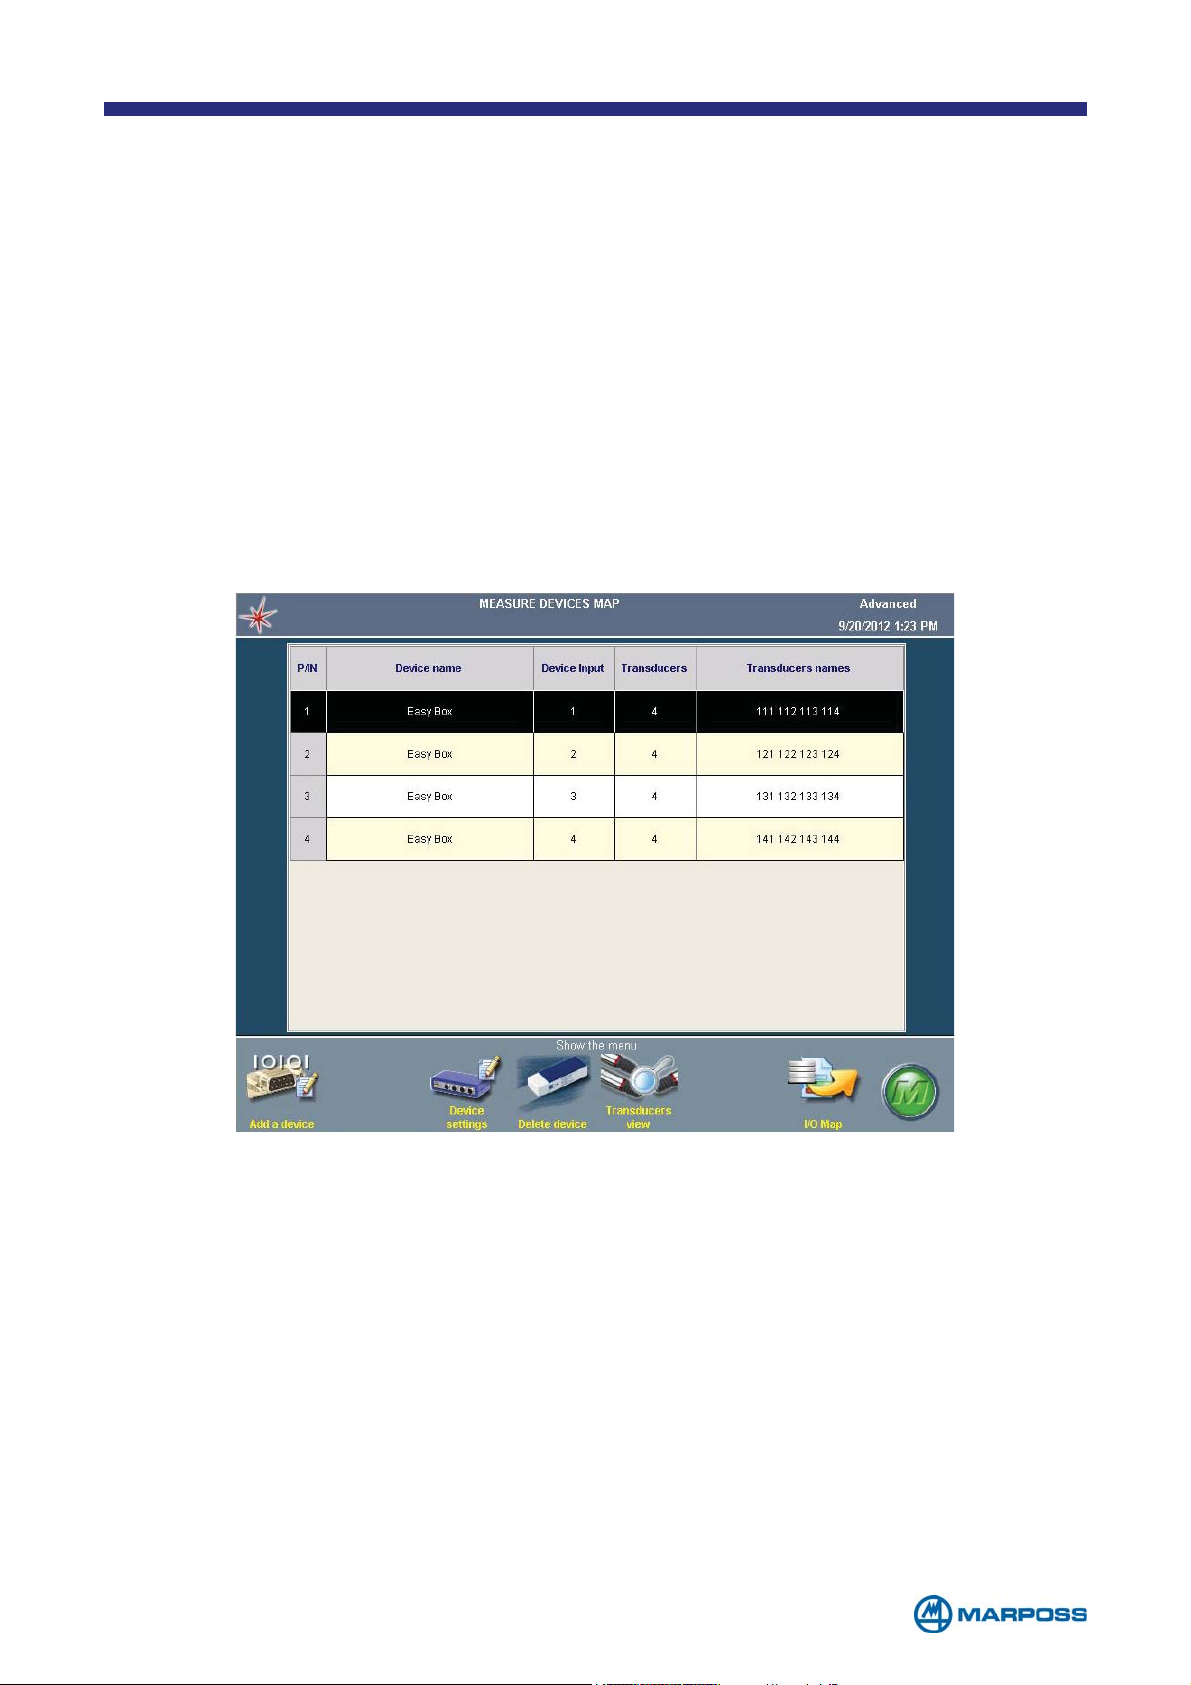
2.1 Multiple transducer instance
Defining multiple instances for the same transducer (by the GENERAL SETUP menu,
see para. 6.1) makes it possible to use different transducers in the measurement
formulas, provided the same device and input are used. In fact, the transducers
connected to a given device may have different operating ranges, sensitivity etc.
The different instances are identified by the third figure in the T
(e.g. T121 and T122 are two instances of the second channel on the first device).
RANSDUCER NAME field,
If the M
ULTIPLE TRANSDUCER INSTANCE option is activated in the set-up, the Device map
displays an additional 3 columns that represent all different configurable istances
for transducers, to every istance, it is possible to assign during the configuration, a
customized name (for example the fixture name where the sensors are installed) in
this way the list can appear easy to read.
The commands DELETE device and TRANSDUCERS VIEW, available when a transducer
column is selected, can delete or add or modify an istance.
It is possible to leave the cells empty, if the channel is not used by an istance, it is
possible to manage up to 4 istances for every transducer.
- 13 -
Page 14

2.2 Basic devices
The following is a list of devices that can be connected to Merlin.
Whatever type of device is selected, it is necessary to enter a customized name in
the related field
• M1 Wave: Marposs Bluetooth
• I-Wave: Marposs Bluetooth
• MultiWave: Marposs multisection buffers with Bluetooth
®
buffers with electrical capsules (see par. 2.3.1)
®
buffers with mechanical capsules (see par. 2.3.1)
®
interface. Manages up to
7 measurement channels, excluding the optional heat sensor (i.e. a maximum of 6
channels if the system is also fitted with the heat sensor) (see par. 2.3.1)
• Easy Box U1AIR: 1 pneumatic input
• Easy Box U3AIR: 3 pneumatic inputs
• Easy Box U4AIR: 4 pneumatic inputs
• Easy Box U4H: for Marposs standard half-bridge/HBT transducers (see par. 2.3.5)
• Easy Box U4D: Mitutoyo Digimatic compatible
• Easy Box U4T: half-bridge/HBT compatible with Tesa amplifiers
• Easy Box U4F: for Marposs standard full-bridge/LVDT transducers
• Easy Box U8IO: 8 digital Input/Output lines
• Easy Box U4P: push button for remote control and data acquisition (see par. 2.3.2)
• Easy Box U4M: “MG” 4 HBT transducers interface
• Easy Box U4TP_E: for type-E thermocouples
• Easy Box U4TP_J: for type-J thermocouples
• Easy Box U4TP_K: for type-K thermocouples
• Easy Box U4TE: for “Trac” tranducers
• Easy Box U4E: 3 inputs for incremental transducers (see par. 2.3.3)
• Easy Box U4F-HR: for Marposs standard full-bridge/LVDT transducers with
sub-micron resolution
• Easy Box U4S: 4 serial devices (see par. 2.3.4)
• Digi Crown: Marposs digital network for various devices (see par. 2.3.6)
• Serial gauge: devices equipped with RS232 interface (see par. 2.3.7)
• Vectrix DR-200R: wireless system to connect various devices (see par. 2.3.8)
NOTE: If it is necessary to connect more than 5 Easy Boxes to the Merlin,
use a HUB USB with its own power supply (7 USB ports: D-Link DUB
H7, 4 USB ports: LINDY Smart Hub Pro powered - code 4701300468).
As reported in the operating limits table (paragraph 1.1) the limit of
connectable sensors is 16 and then is possible connect up to 4 devices
which can manage 4 sensors, (i.e. EasyBox U4F, U4Air...), 5 devices which
can manages 3 sensors (i.e. EasyBox U3Air or U4E) up to 8 devices which
can manage one sensor (EasyBox U1Air, iWave, M1Wave...); it is possible
to connect up to 7 channels Bluetooth
®
working simultaneously.
- 14 -
Page 15
2.3 Devices with additional parameters
On some devices it is necessary to set up additional configuration parameters, as
well as the name.
2.3.1 M1Wave, I-Wave e MultiWave
Tap BINDING to execute interfacing/pairing with a M1 Wave, I-Wave
or MultiWave plug
Configurable parameters:
• A
• B
• B
• T
CQUISITION SPEED: data acquisition speed (Options: SLOW 10 sample/second,
F
AST 40 sample/s, MEDIUM 20 sample/s, default: MEDIUM).
ATTERY TYPE: select the battery type of the Wave plug (Options: ALKALINE, NI-
M
H, LI-ION, default: ALKALINE).
ATTERY WARNING LEVEL: the system provides the battery level indication
(Options: 05%, 10%, 25%, 40%, 60%, 85%, default: 25%).
URN OFF TIME (SEC): the plug switches itself off if it is inactive for a given period
(default: 1200 sec, minimum = 30, maximum 28800 = 8 hours)
NOTE: The maximum number of Bluetooth® devices that may be con-
nected to Merlin is 16, and up to 7 of these may be accessed simultaneously.
2.3.2 Easy Box U4P
Box fitted with 4 push-buttons, used for remote control and data acquisition. Each
input may be defined as N
• N
• C
ORMAL: this button is activated by pressing it, and deactivated releasing it.
OMMUTATIVE: the button remains active even after it is released and must be
ORMAL or COMMUTATIVE, these two modes differ as follows:
pressed again in order to deactivate it.
2.3.3 Easy Box U4E
Easy Box with 3 inputs for incremental or absolute type, rotary or linear encoders,
with analogue or digital interfaces.
• E
XTERNAL POWER SUPPLY: The U4E requires its external power supply unit when
the current consumption of the connected encoders is over 200 mA.
2.3.4 Easy Box U4S
The Easy Box U4S is recognized automatically by the system, so that no set-up is
required. The programming of these inputs is handled within the parameters of the
S
ERIAL GAUGE.
NOTE: Only one Easy Box U4S may be connected to Merlin.
- 15 -
Page 16
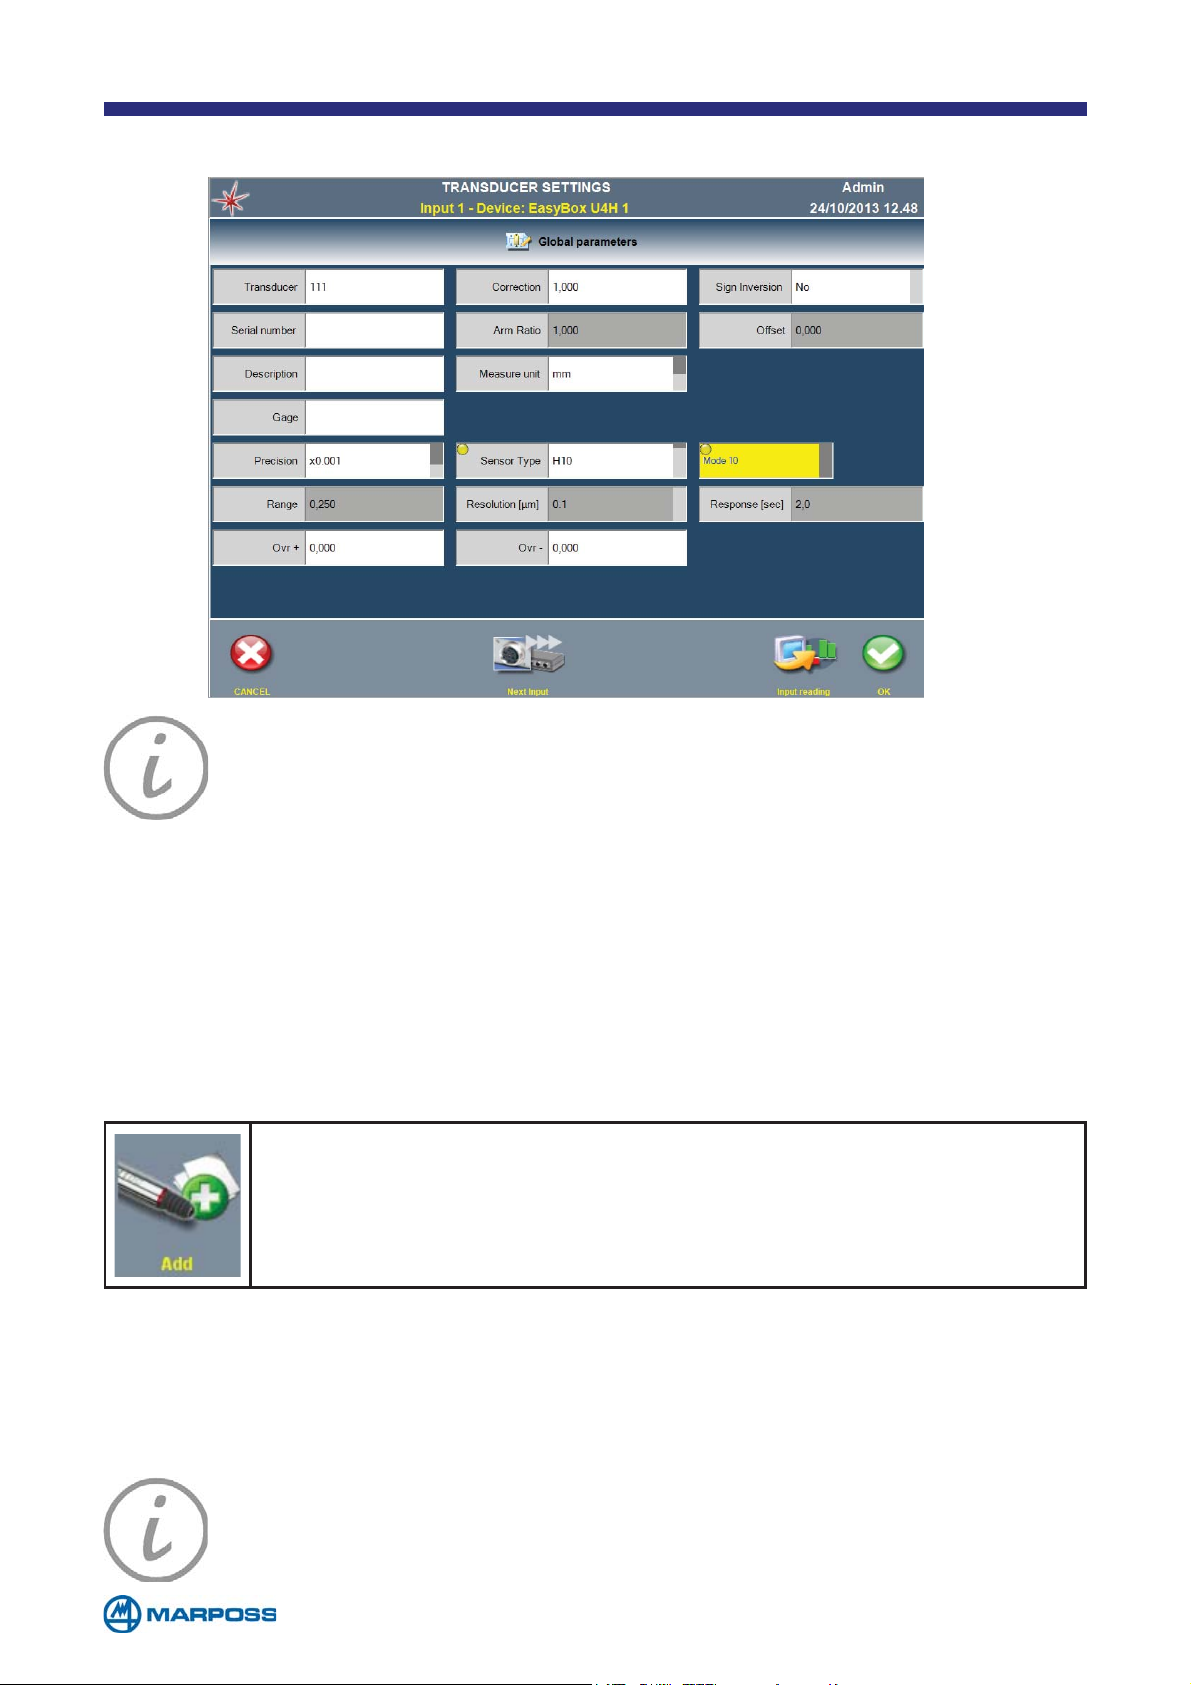
2.3.5 Easy Box U4H
NOTE:
propose the R
after the selection of the sensor type, the system automatically
ESOLUTION and RESPONSE values. Tapping the MODE field is
possible to select the required compromise. Through that device, it isn’t
allow to manage the complete range in some pencil probe models.
2.3.6 Digi Crown
Up to one Digi Crown digital network (31 modules) can be connected to the RS232COM port and managed by Merlin. The following Digi Crown boxes are compatible:
Digicrown 232, Digicrown PSU, Digicrown BOX (single channel only), Digicrown I/O
(Sink, Source and Only Input versions), Digicrown PBB (push button for “Only Input”
I/O module)
Tap ADD to execute the Digi Crown digital network automatic recognition (only modules with firmware V1.3 or greater are permitted).
Configurable parameters:
• N
ET BAUDRATE: network data transmission speed expressed in baud/s (options:
9600, 208.3k; default: 208.3k).
• B
AUDRATE: Digi Crown modules communication speed in baud/s (options:
4800, 9600, 19200, 38400, 57600, 115200, default: 115200).
NOTE: The Merlin with a DigiCrown digital network cannot accept a Red
Crown pencil probe connected to any box of this network.
- 16 -
Page 17
2.3.7 Serial gauge
In order to connect them, serial type devices require a physical port (RS232 or USB)
and a communication protocol.
Configurable parameters:
• D
• P
• M
• S
EVICE NAME: to enter the unit name using the keyboard.
ROTOCOL NAME: STANDARD or PERSONAL protocol type in use (See chapter 7).
ANUFACTURER: manufacturer’s name of the serial gauge.
ERIAL PORT: comunication serial port (options: COM1, INPUT 1/2/3/4 – U4S).
2.3.8 Vectrix DR-200R
The Vectrix telemeasure units are used to send wirelessly the measure from a
transmitter (connected to a gauge) to a receiver. The Vectrix receiver operates connected to the COM port of the Merlin only (no EasyBox U4S).
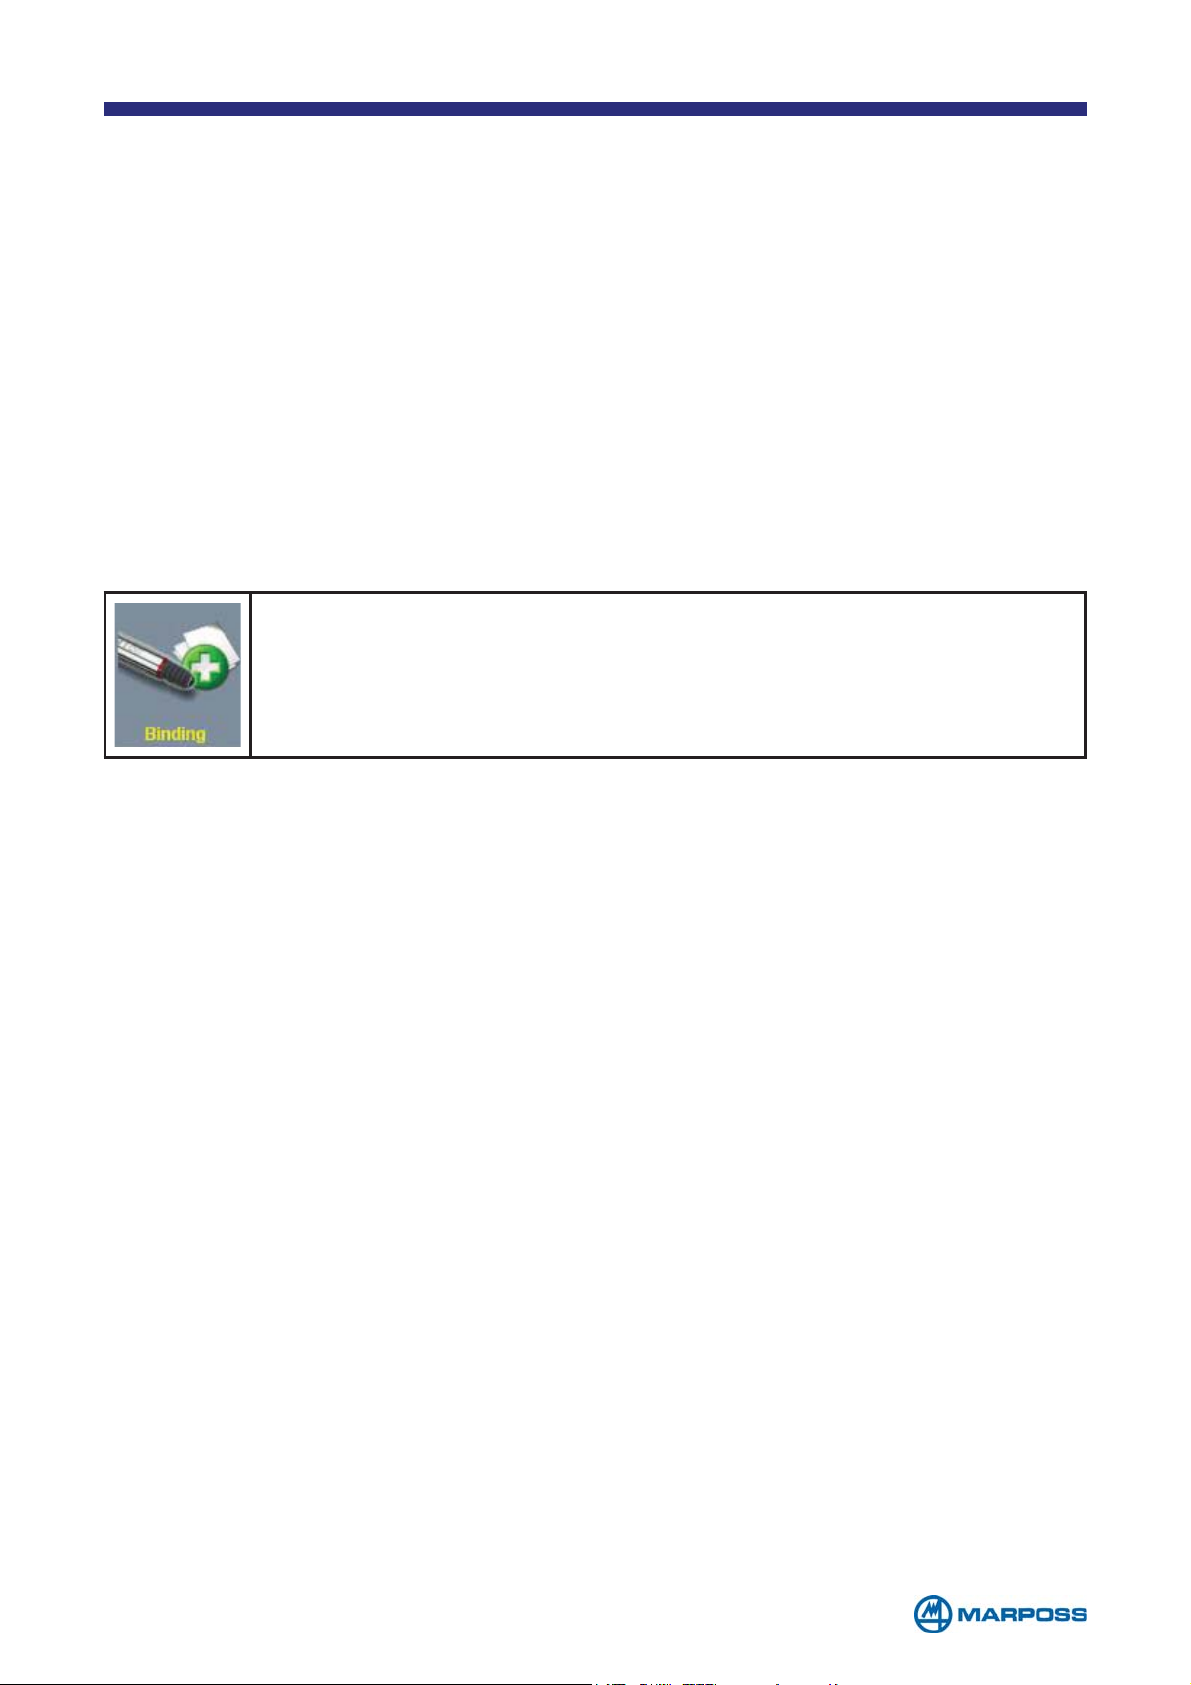
Tap on BINDING to interface a Vectrix transmitter. Afterwards tap the
“data” button on the transmitter itself, in order to establish a communication between the transmitter and the receiver.
- 17 -
Page 18
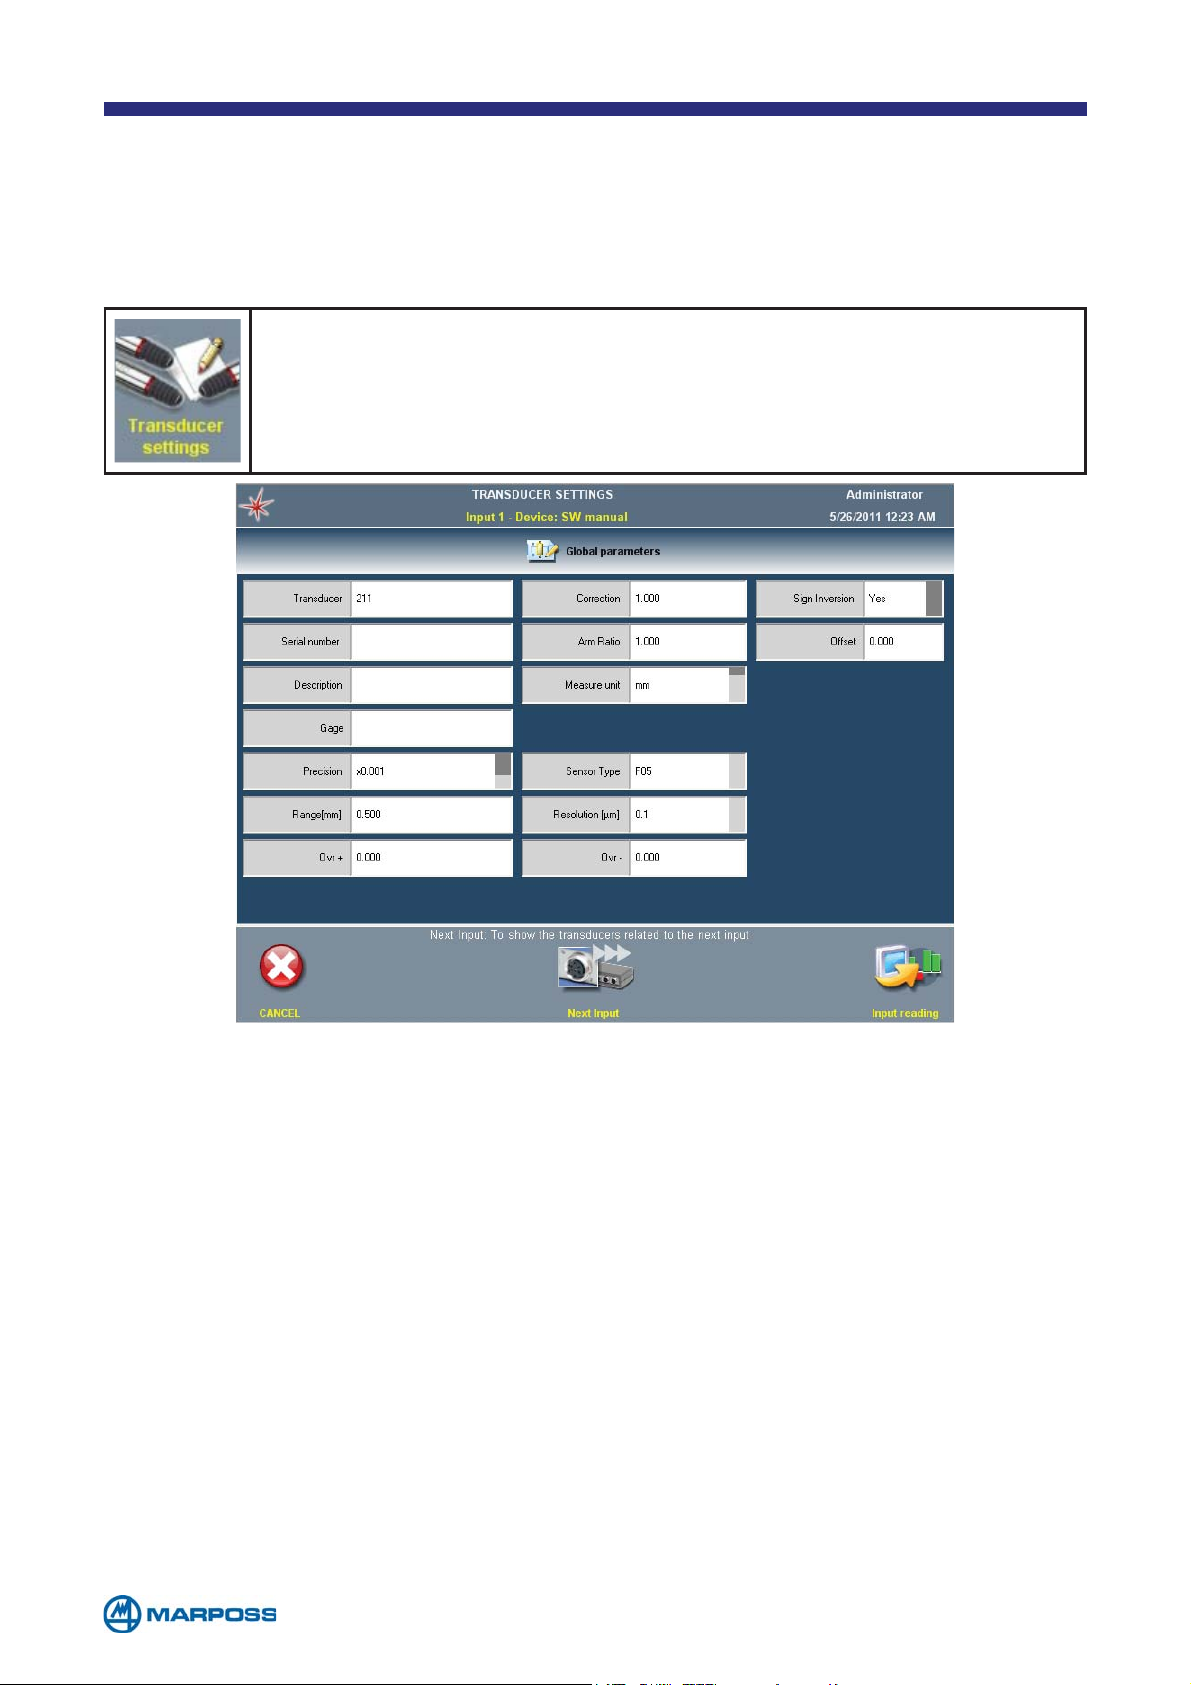
2.4 Transducer settings
Once at least one device has been added to the MEASUREMENT DEVICES MAP page, it
is possible to select the commands that are used to set the parameters for each
transducer.
Tap on TRANSDUCERS SETTINGS to edit the transducer parameters. The
following parameters are always present, for all device types.
• TRANSDUCER: transducer name (max. 5 characters editable using the keyboard). The transducer default name consists of three figures, representing the
device number (as indicated on the M
EASURE DEVICE MAP), the channel number
and the instance number. For example: T231 indicates the first instance of the
second device on the third channel.
• S
• D
• G
• M
• P
ERIAL NUMBER: it can be edited using the keyboard.
ESCRIPTION: it can be edited using the keyboard.
AGE: the gage name can be edited using the keyboard, only in multi-instance.
EASURE UNIT: the available measurement units depend on the device type.
RECISION: number decimal places displayed (options: x1, x0.1, x0.01, x0.001,
x0.0001, x0.00001)
• O
• C
VR ±: transducer over-range settings.
ORRECTION: sensitivity correction; if non-standard transducers are in use, the
different behaviour can be compensated with this multiplication factor.
- 18 -
Page 19
• SIGN INVERSION: transducer signal sign inversion option and behaviour.
TRANSDUCER TYPE
MEASUREMENT VALUE
WHEN SENSOR IS PUSHED
PENCIL PROBE LVDT-HBT DECREASING YES
ECREASING NO
WIRELESS BORE GAUGE M1WAVE-MINIWAVE (LVDT)
D
WIRELESS BORE GAUGE M1WAVE-MINIWAVE (HBT) INCREASING NO
PNEUMATIC (USED WITH U1AIR, U3AIR, U4AIR DECREASING YES
• RANGE: transducer measurement field (expressed in μm)
• A
• R
• O
RM RATIO: to set the arm ratio
ESOLUTION: real measurement accuracy
FFSET: additional constant applied to the value measured by the transducer
Tap on NEXT INPUT to setup the transducer related to the next input.
SIGN
INVERSION
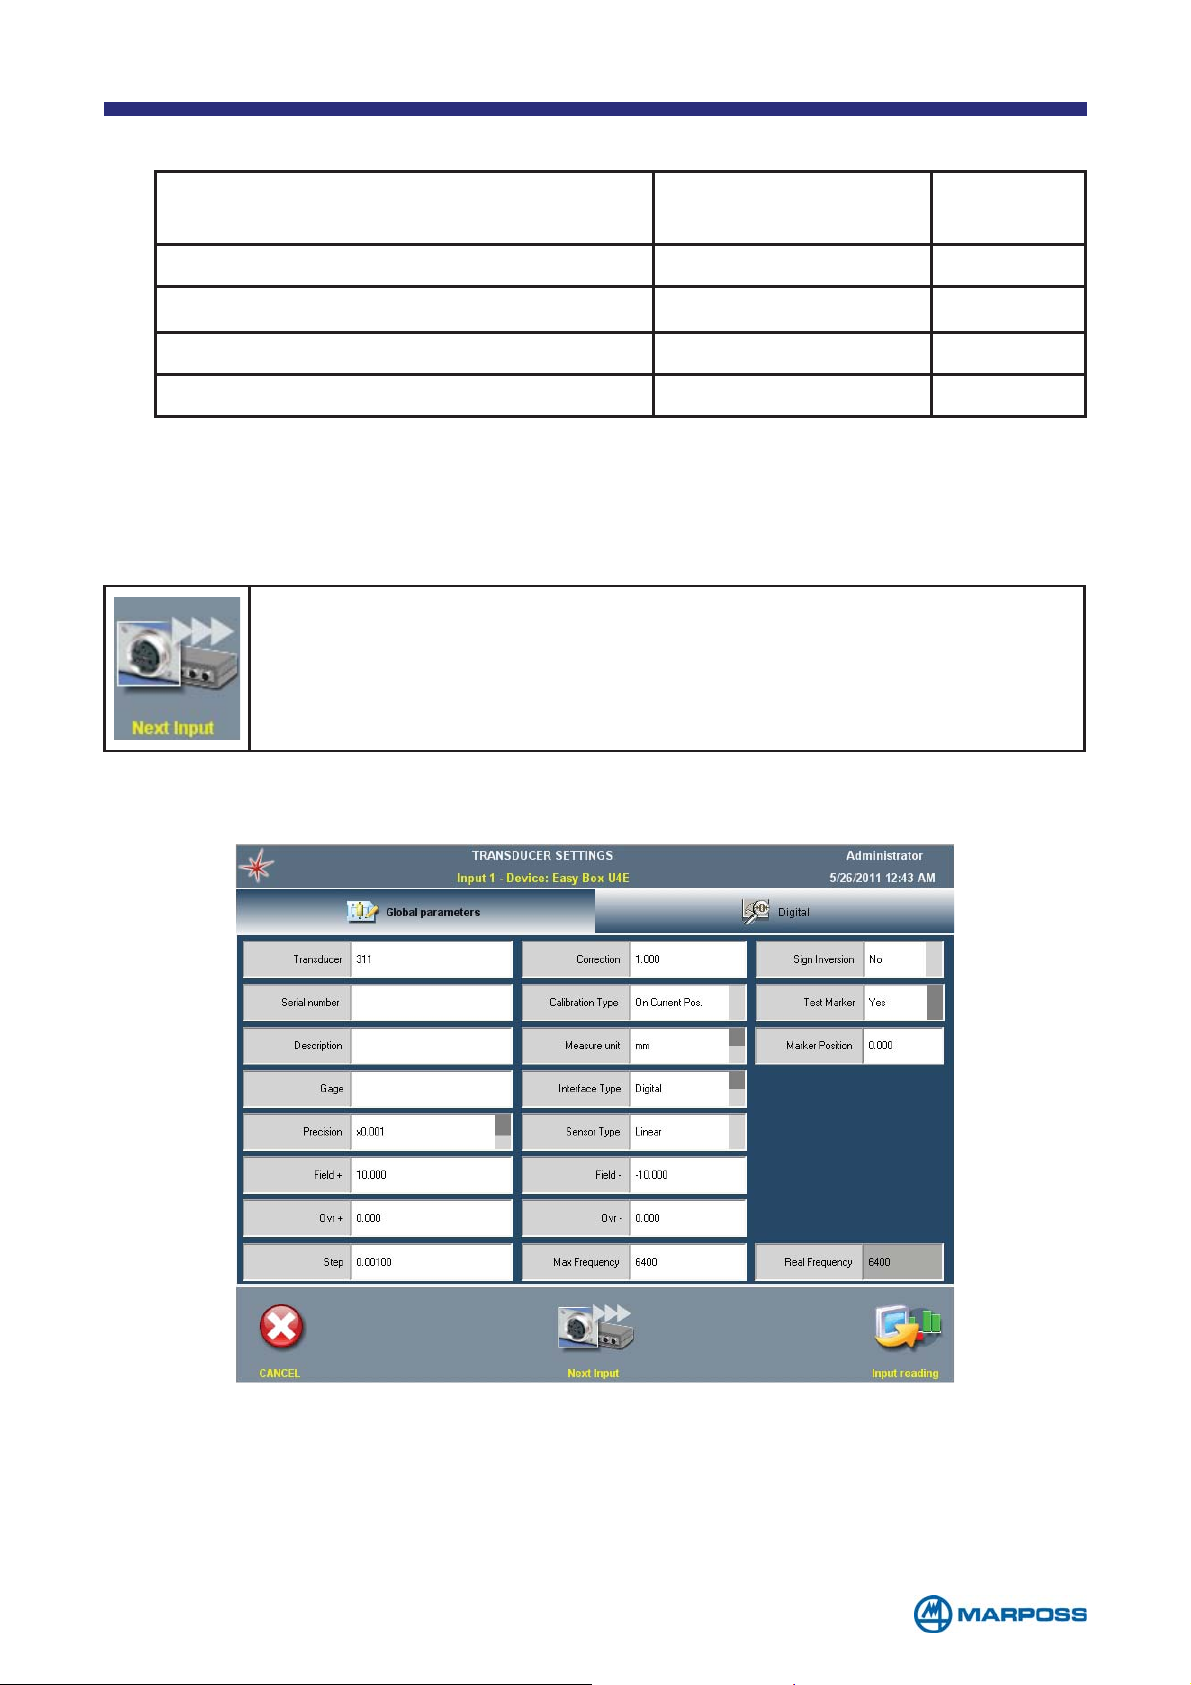
2.4.1 Parameters for Easy Box U4E
There are two tabs available for this device, the second depends on the type of
encoder selected in the I
NTERFACE TYPE field.
- 19 -
Page 20

GENERAL PARAMETERS TAB
• R
• T
ANGE±: measurement range of the encoder or line.
YPE OF INTERFACE: DIGITAL / COUNTER/ ANALOGUE
• TYPE OF SENSOR :
• L
• ROTARY:
INEAR:
to be used for linear positioning transducers (optical scales typically).
to be used for angular positioning transducers (rotary encoders
typically), when an information is required about both the number of
revolutions made and the position within the lap.
• PERIODICAL:
to be used for angular positioning transducers (rotary encoders
typically), when an information is required only about the position within the
lap, but not about the number of revolutions made (for example in
applications concerning spindles).
• STEP: It defines the variation (in the measuring unit mentioned above) against a
S
TEP of the sensor. For example:
- if a scale with 20 μm step is used, 20 has to be programmed
- if an encoder featuring 7200 step/rev is used, 0.05 has to be programmed
(360°/7200=0,05 °/step)
• M
AX. FREQUENCY: defines the maximum frequency of the signal generated by
the sensor (expressed as P
ULSES-STEPS per second), if the frequency exceeds
this value an error signal is generated and the counter is decalibrated. The maximum value depends on the T
- D
IGITAL AND COUNTER: 2500 Ksteps per second
- A
NALOGUE: 250 Ksteps per second
• R
EAL FREQUENCY: in this column the control frequency is displayed, which the
hardware is able to deploy against the programmed value of the parameter M
F
REQUENCY.
• T
• O
YPE OF CALIBRATION:
N CURRENT POS.: the transducer value becomes the value programmed in
YPE OF INTERFACE:
AX
the parameter Marker Position when the zeroing command is received.
• N
• T
ONE: No calibration is foreseen.
EST ON MARKER: It enables the input of the reference signal I or M (and the
related connection checks)
ANALOGUE TAB
• A
MPLITUDE TOLERANCE (%): It defines the maximum percentage variation al-
lowed for the amplitude of the resulting of the signals A and B, i.e. (A
2
+ B2)
• AMPL. CHECK ENABLE: It enables the control described in the previous point
• O
FFSET A: Offset value of the channel A, normally calculated by the specific
calibration utility
• O
FFSET B: Offset value of the channel B, normally calculated by the specific
calibration utility
• A
MPLITUDE A: Amplitude of the signal of channel A, normally calculated by the
specific calibration utility
- 20 -
1/2
Page 21

• AMPLITUDE B: Amplitude of the signal of channel B, normally calculated by the
specific calibration utility
• A
NGULAR CORRECTION: Phase correction of the signal of channel B, with respect
to the signal of channel A, normally calculated by the specific calibration utility
DIGITAL TAB
• D
IVISION: It allows to increase the resolution of the digital sensors by splitting
the steps in 2 or 4 parts according to the logical combination of the signals. The
possible choices are:
• S
TEP: no subdivision of the step. The resolution is set in the “STEP” box in the
related row of the general data table.
• H
value set in the “S
ALF STEP:
subdivision of the step in two parts. The resolution is half the
TEP
” box in the related row of the general data table.
• QUARTER STEP: subdivision of the step in four parts. The resolution is on
quarter of the value set in the “S
TEP” box in the related row of the
general data table.
• A
• W
LARM: The control can be enabled only if the encoder has this output signal,
which normally is not present. The possible choices are Y
ARNING: It enables the report of a warning alert in response to linking pro-
ES or NO.
blems of the channels (open circuit, short circuit, exceeding of the limits of common mode, signal below threshold, etc...). The possible choices are Y
ES or NO.
COUNTER TAB
• C
OUNTING EDGE: It allows to program on which front(s) of the input signal(s)
the count shall be made (in the case Frequency/Direction it applies only to the
fronts of the signal Frequency). The possible choices are:
• R
• F
• R
ISING EDGE: the count is made on the rising edge of the signal.
ALLING EDGE: the count is made on the falling edge of the signal.
ISING & FALLING EDGE: the count is made on both the rising and falling edge
of the signal.
• D
IGITAL FILTER: Enables digital filtering of the input signal to reduce the probabili-
ty of incorrect counting. Filtering is only activated if in the related row of the table
of general data a max. frequency less than or equal to 712 KStep / second has
been programmed. The possible choices are Y
ES or NO.
- 21 -
Page 22
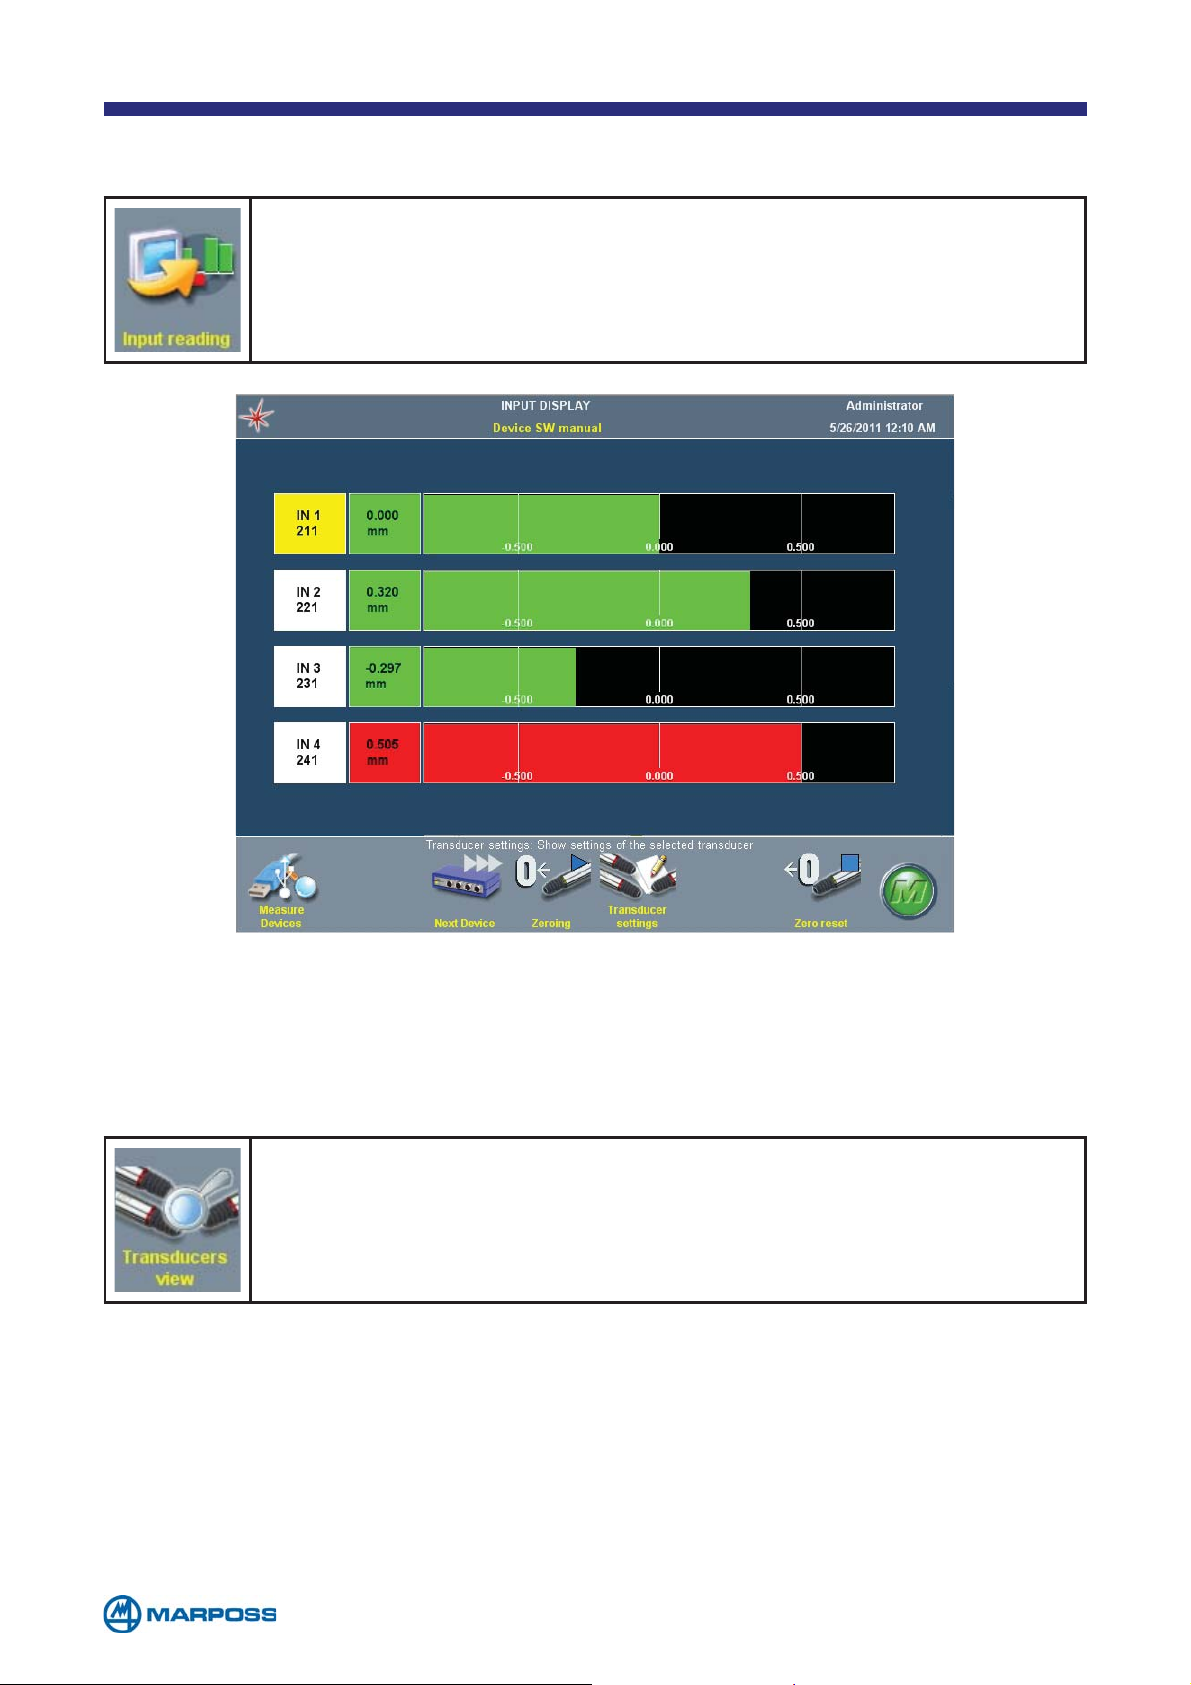
2.5 Input reading
Once the transducer programming procedure has been completed,
it is possible to check the transducers by tapping on R
This opens the Input page where the individual transducer readings
are displayed in real time.
EAD INPUTS.
The ZEROING and the ZERO RESET functions allow to set/reset a zero value on the
transducers. This value is for set-up purpose only, and does not affect the measurement value.
2.6 Transducers view
If the MULTIPLE TRANSDUCER INSTANCE on the MEASUREMENT DEVICES MAP page has
been activated in the settings, the operator can use the T
command to view the various different transducer instances which are
available.
Defining more than one instance, for the same transducer, enables the system to
use multiple transducers in the measurement formula on the same device and input; in fact, the transducers connected to a given device input may have different
measurement ranges, sensitivities etc., the different instances are identified by the
third figure in the T
RANSDUCER NAME field.
For example: T121 and T122 are two instances of the first device second channel.
The A
DD and DELETE commands can be used to add or delete a new instance.
The user can create up to four instances for each channel.
RANSDUCERS MAP
- 22 -
Page 23
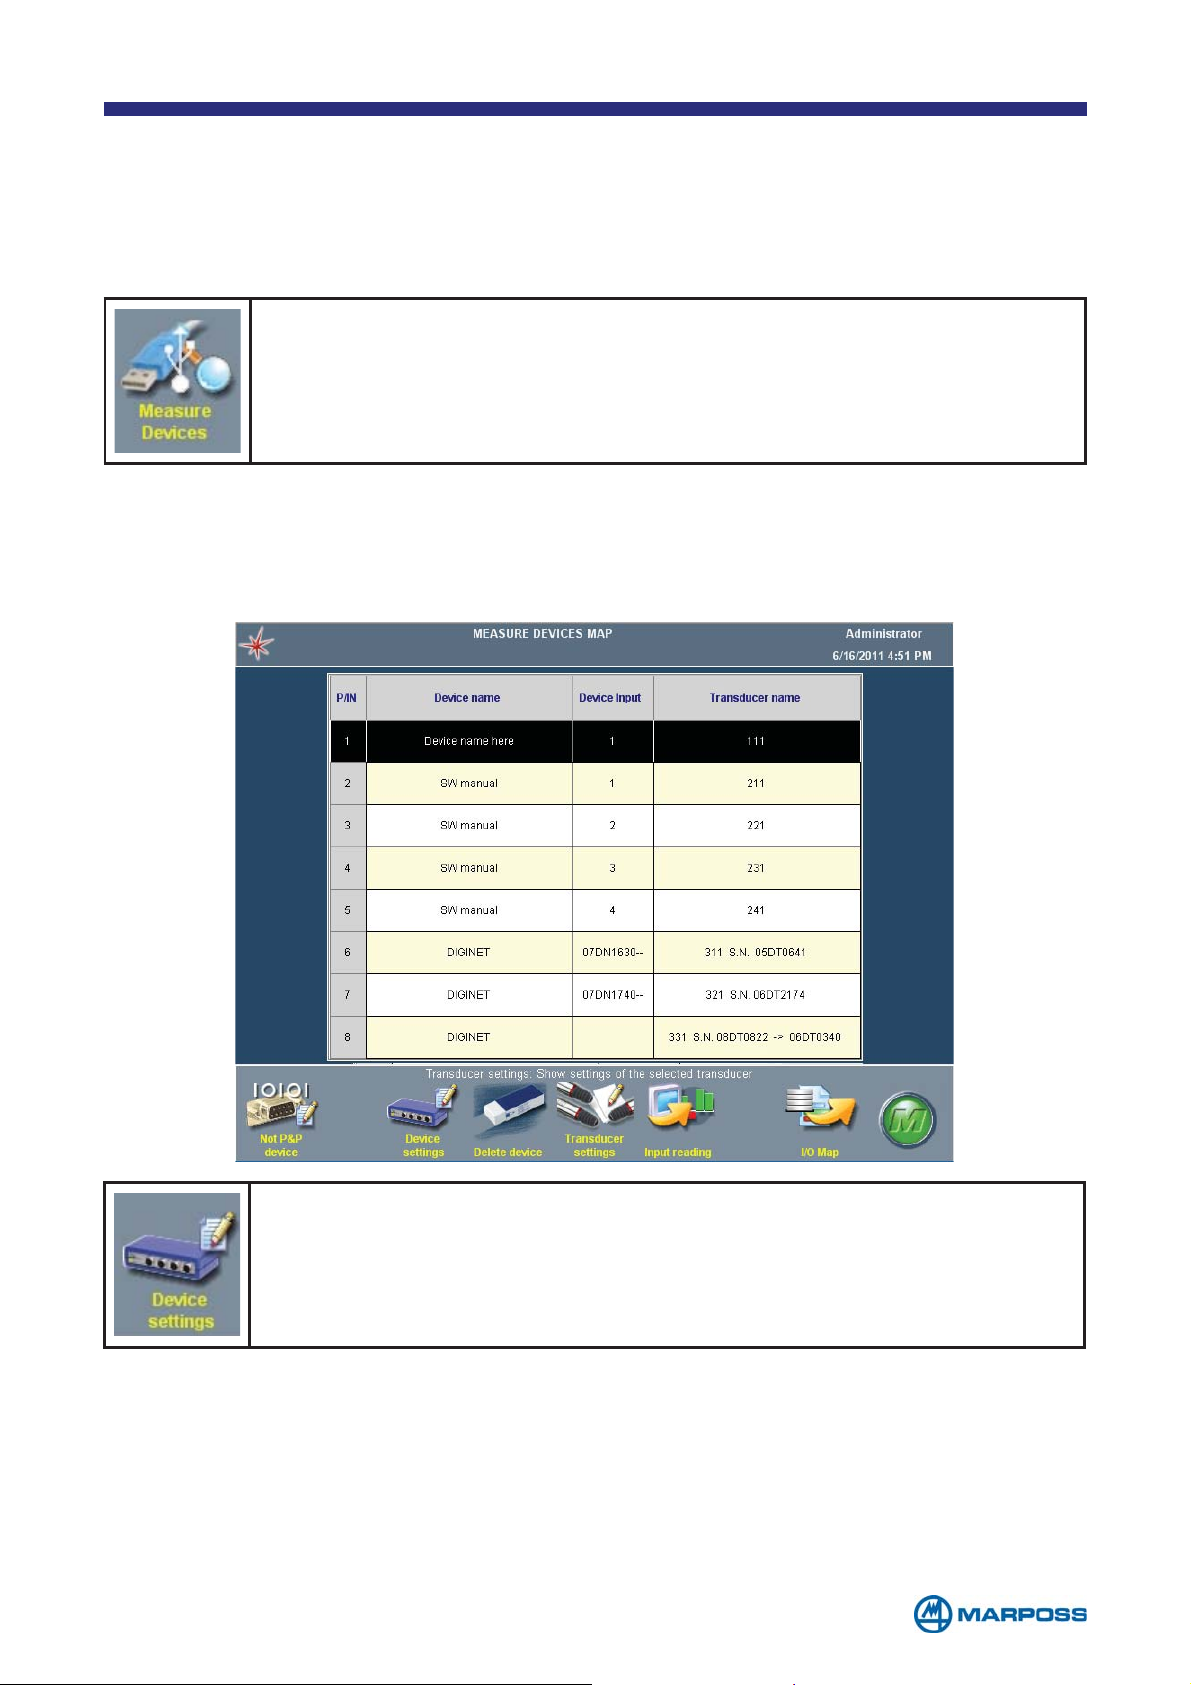
2.7 Digi Crown probe replacement function
In order to simplify the Digi Crown probe replacement after failure, we added the
R
EPLACE button in the DEVICE CONFIGURATION PAGE. It follows the sequence to carry out a
single probe replacement.
From the menu, tap on SETTINGS. Select MEASURE DEVICES to enter the
map of the measure devices previously configured.
In the M
EASURING DEVICES MAP, the system automatically detects which a digital probe
has been replaced, showing both the serial number of the old probe and the serial
number of the new one.
Select the Digi Crown driver (DIGINET) in the list and then tap DEVICE
SETTINGS.
In the D
Tapping the R
EVICE CONFIGURATION page it is now possible to ADD or REPLACE a new probe.
EPLACE button on the toolbar, it will change definitely the two probes,
while tapping A
transducers.
DD the software will add the new probes in the list of the available
- 23 -
Page 24
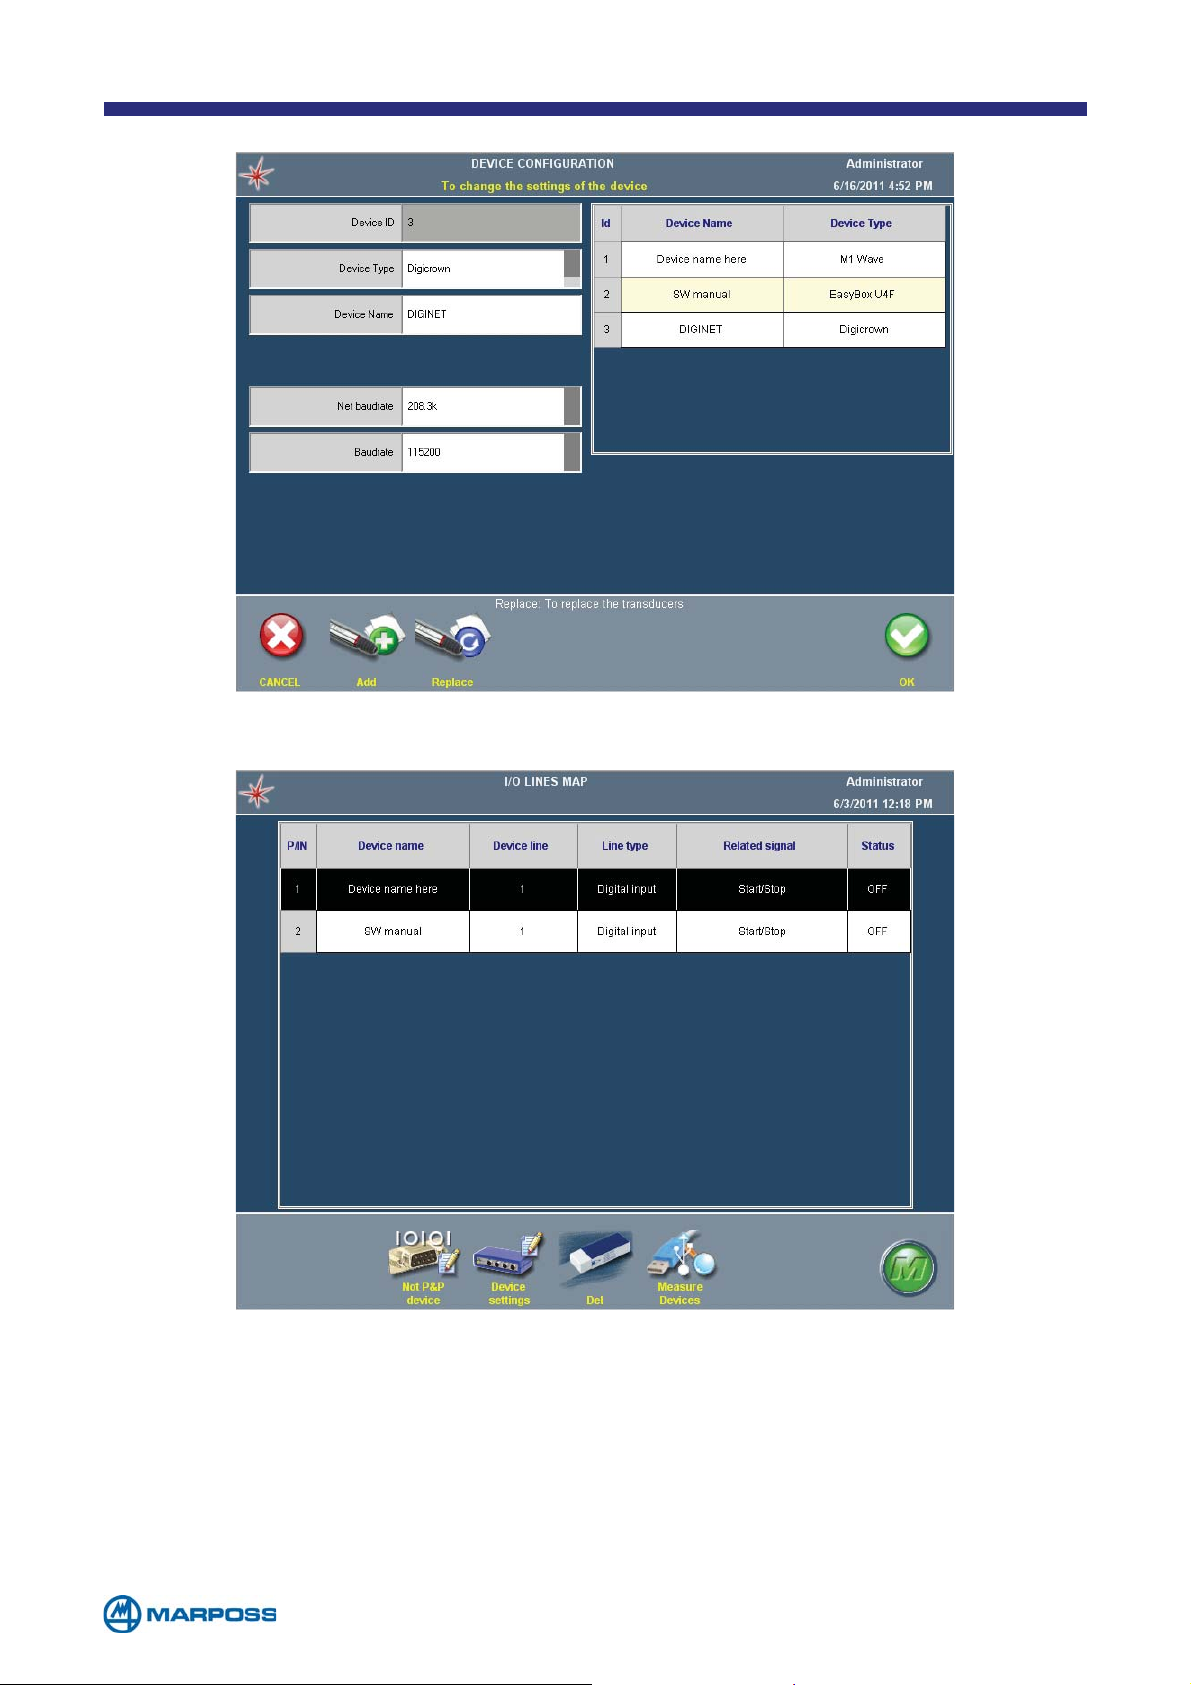
2.8 I/O lines map
This page can be used to view the status of all the I/O bits associated with the connected devices.
- 24 -
Page 25
3 PROGRAMMING
3.1 Master Set
The MASTER SETS are groups of real masters used to zero and adjust the sensitivity on
the programmed characteristics. Each set can be created using one (
two (min/max mastering - S
master it is possible to program a master value, a S
ENSITIVITY) or three masters (ZEROING & SENSITIVITY). For each
ERIAL NUMBER and a MESSAGE to
guide the operator during the acquisition.
From the menu, select PROGRAMS then MASTER SET to access the
M
ASTER SET LIST PAGE, where it is possible to use one of the following
functions:
• A
• E
DD: to create a new MASTER SET.
DIT: to modify an existing MASTER SET
• DEL: to delete a MASTER SET
• COPY: to create a new MASTER SET by copying an existing one
ZEROING ONLY),
NOTE: this feature causes the loss of Z
means that in case of a Merlin software updating, the M
need to be programmed and a new Z
EROING/SENSITIVITY compatibility. It
ASTER SET fields
EROING/SENSITIVITY acquisition must
be performed prior to restart the production.
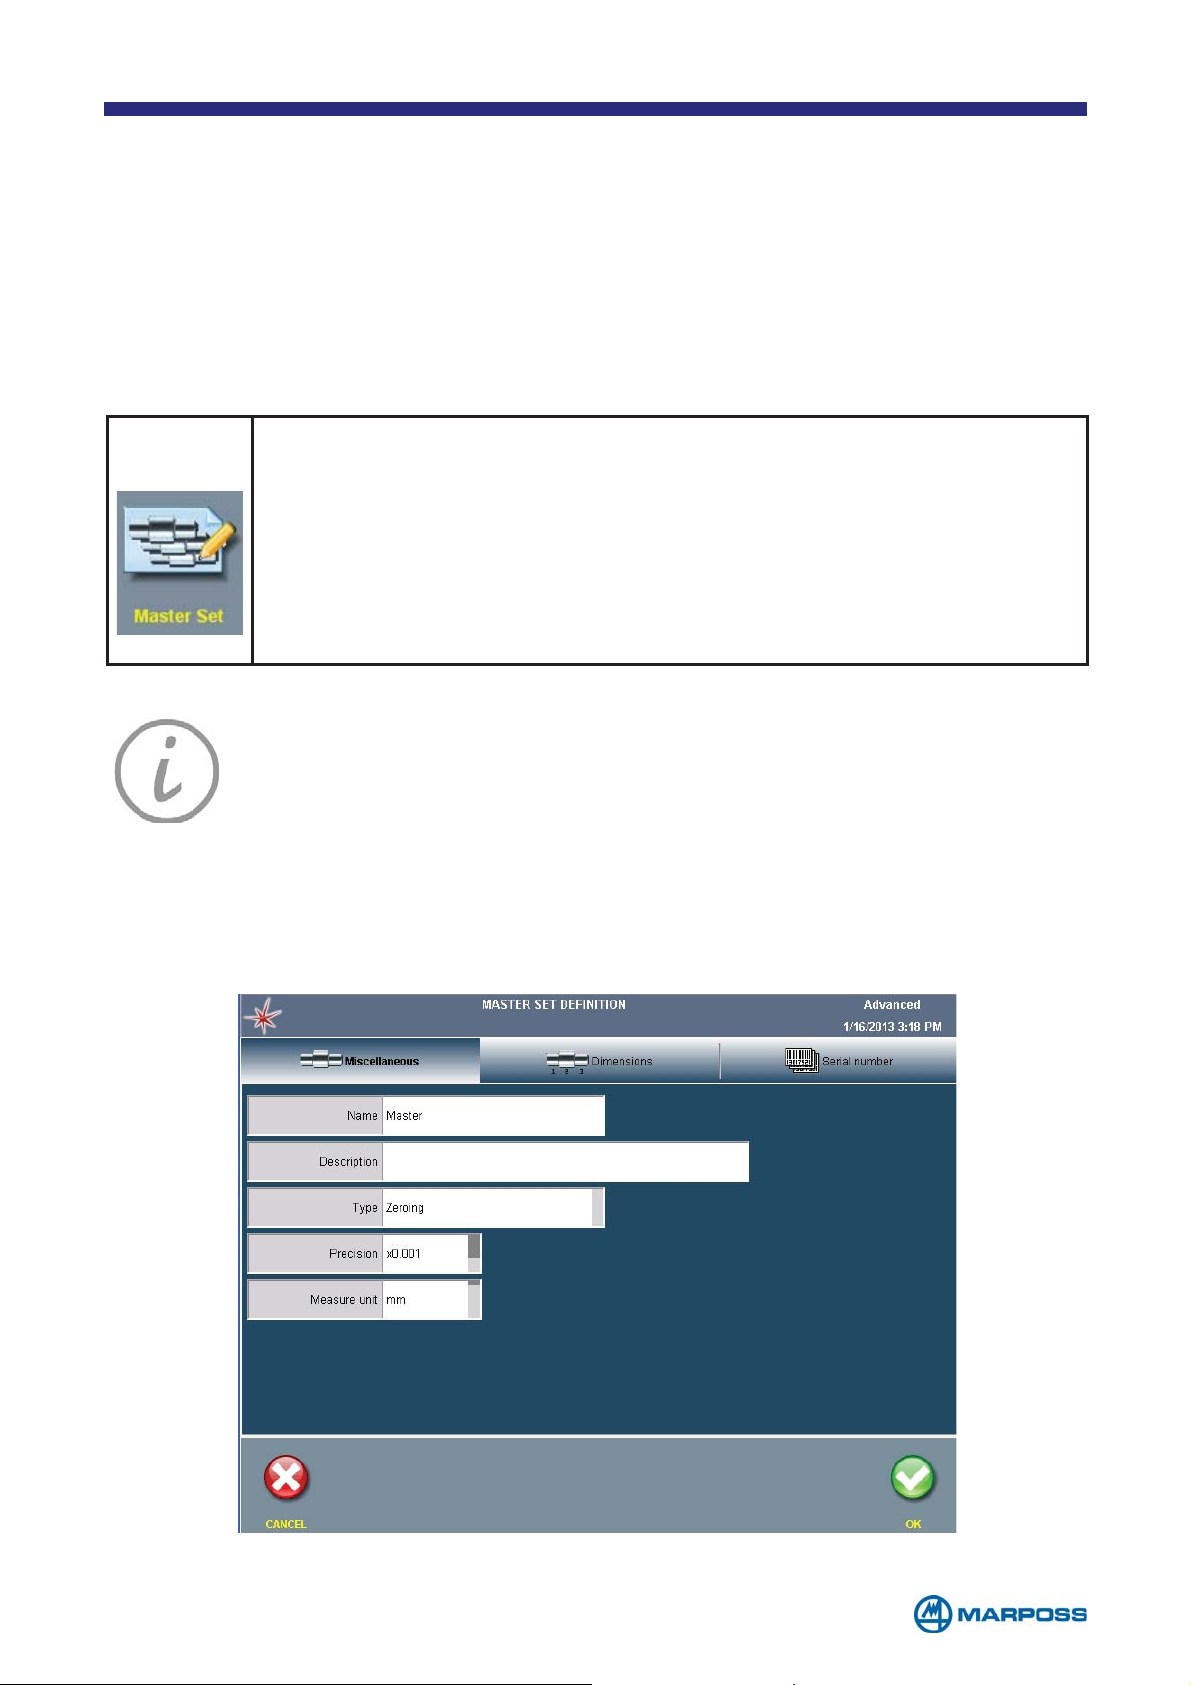
3.1.1 Miscellaneous TAB
When creating a new MASTER SET access the MISCELLANEOUS in order to define the
basic M
ASTER SET information.
- 25 -
Page 26
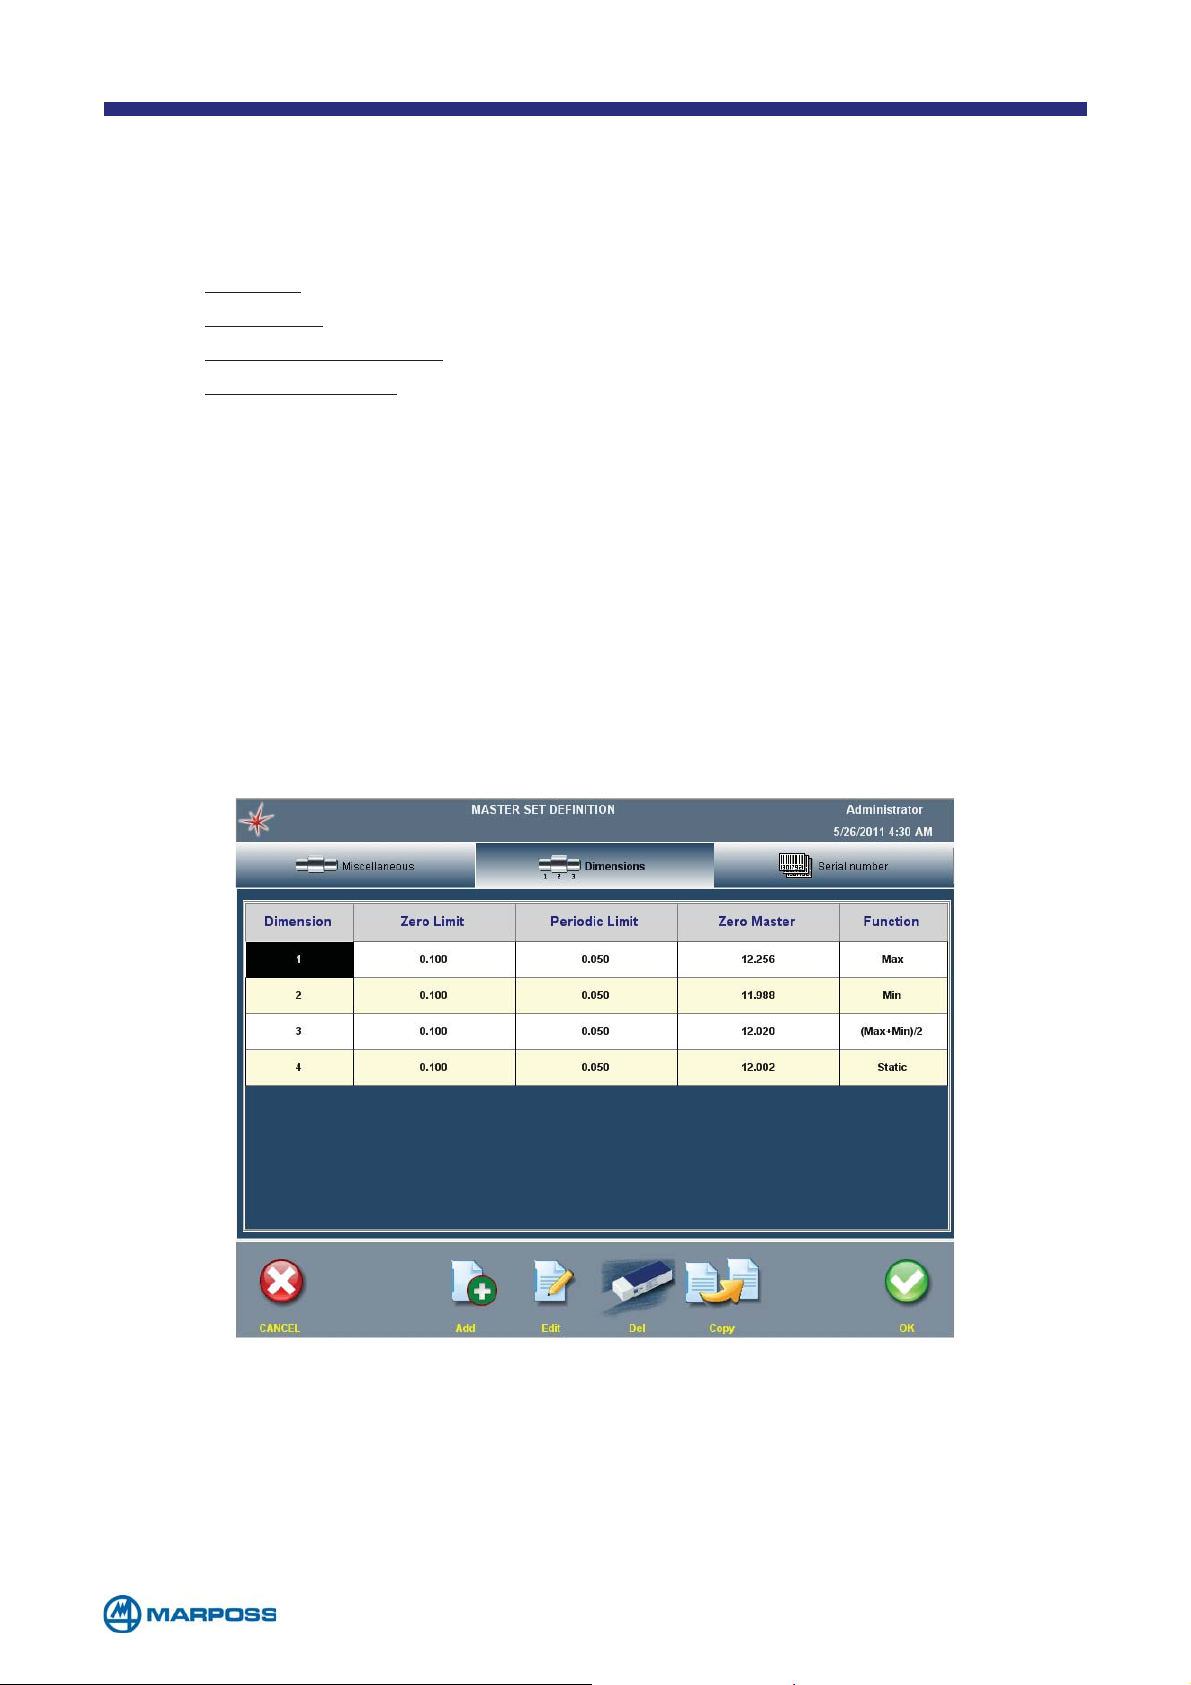
The configuration parameters are described below.
• N
• D
• T
AME: name of the MASTER SET to be programmed.
ESCRIPTION: description of the MASTER SET (optional).
YPE: MASTER SET TYPE
• ZEROING: one static master
• S
• Z
• D
• P
that make up the M
• M
SET (options: mm, in, deg, g, °C, °F, mm).
ENSITIVITY: two static masters
EROING & SENSITIVITY: three static masters
YNAMIC ZEROING: a dynamic master
RECISION: defines the number of places after the decimal point for the dimensions
ASTER SET (options: x1, x0.1, x0.01, x0.001, x0.0001, x0.00001).
EASURE UNIT: measurement units for the dimensions that make up the MASTER
3.1.2 Dimensions TAB
Afterwards tap on the DIMENSIONS tab where, according to the number of dimensions of
the M
value for each dimension. If M
and sensitivity correction, two more master values must be defined for each dimension.
Tap on the field to be changed, and then E
button.
ASTER SET, it is possible to set the ZERO LIMIT, the PERIODIC LIMIT and the ZERO MASTER
ASTER SET TYPE foresees up to three masters for zeroing
DIT the value tapping on the relevant
• ZERO LIMIT: this value is the maximum permissible difference between the last
acquired zero and the first.
• P
ERIODC LIMIT: this value is the maximum permissible difference between the
last acquired zero and the last but one.
• Z
ERO MASTER: this is the certified value of the master associated with the zero.
- 26 -
Page 27
• FUNCTION: this is the function used for dynamic zeroing.
• S
TATIC: the zero is acquired at the STOP
• MAX: the zero is acquired at the point that corresponds to the dynamic maximum between S
TART and STOP
• MIN: the zero is acquired at the point that corresponds to the dynamic minimum determined between S
TART and STOP
• (MAX+MIN)/2: the zero is acquired at the arithmetic mean point, determined
between S
TART and STOP.
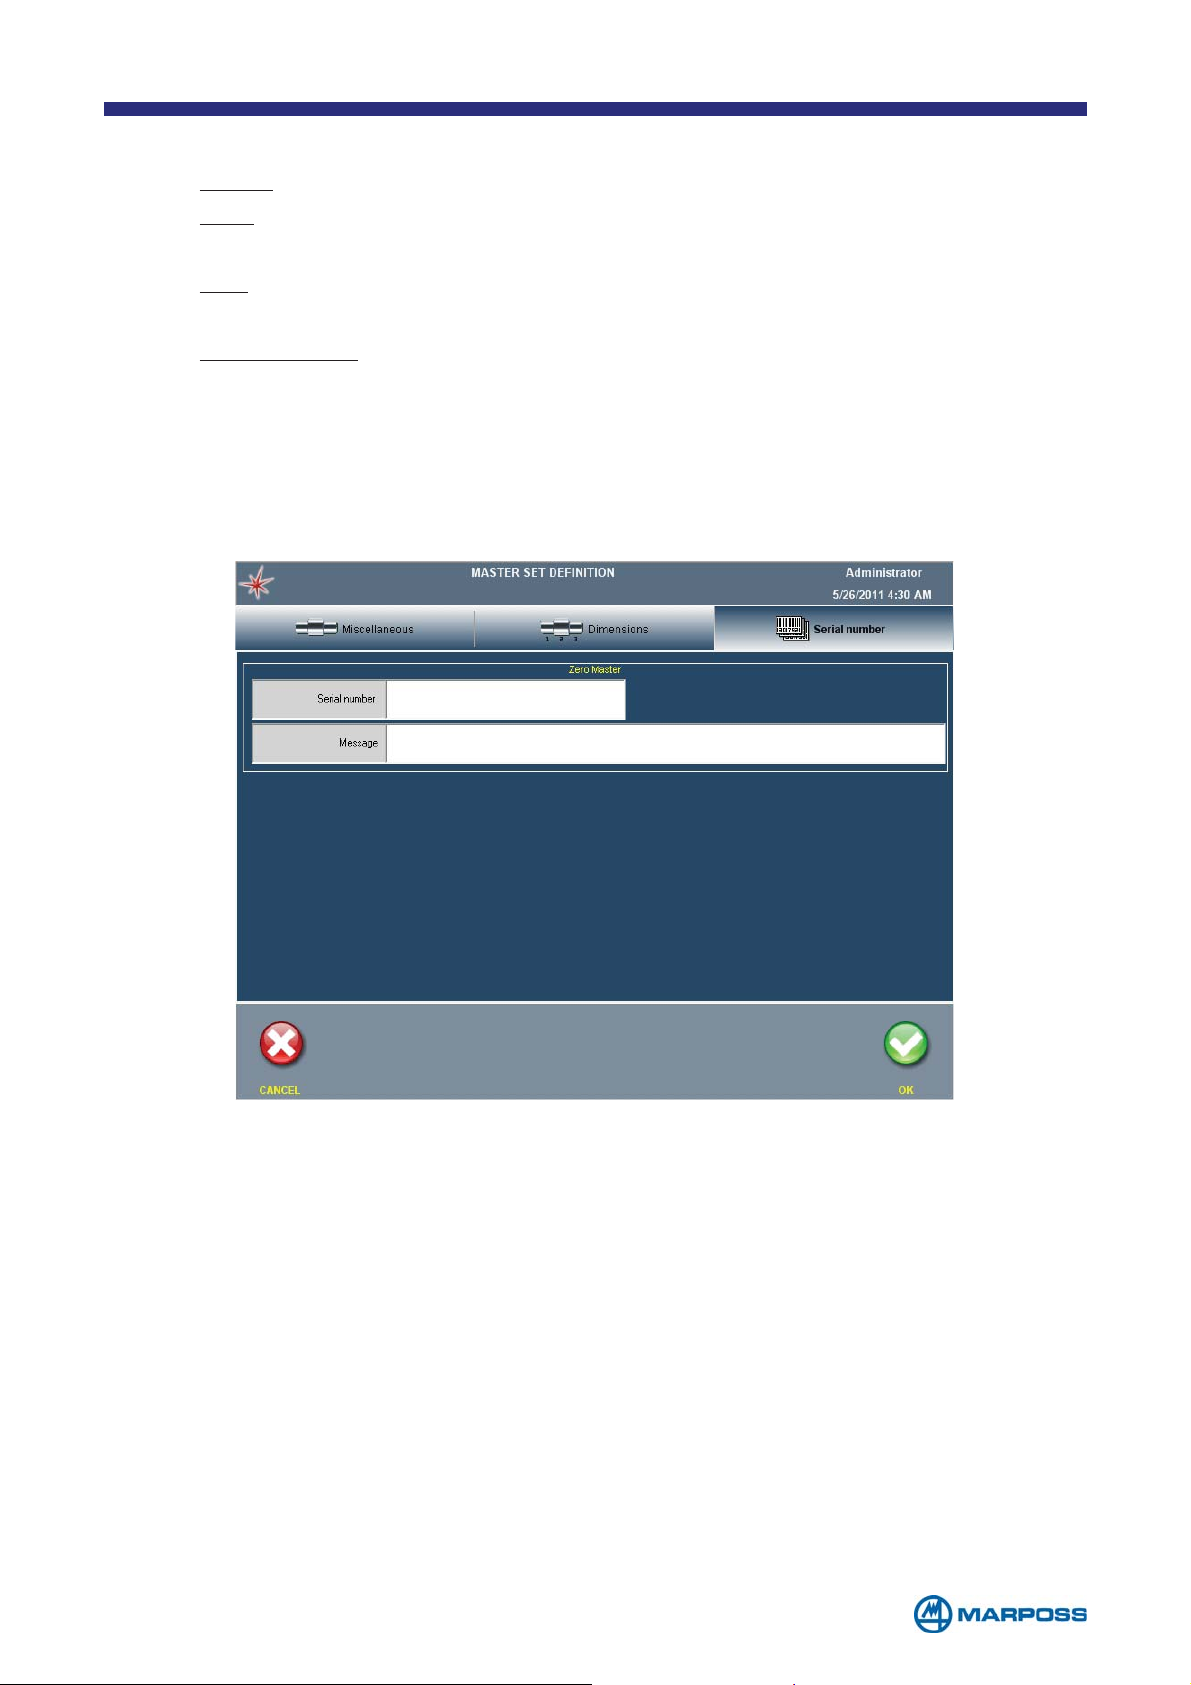
3.1.3 Serial number TAB
At last type in the SERIAL NUMBER of the master and, if it is necessary, a MESSAGE for
prompting the operator.
- 27 -
Page 28
3.2 Part program definition
To define a new PART PROGRAM proceed as follows:
Select PART PROGRAM from the PROGRAMS MENU in order to access the
PROGRAMMING PHASE. Tap ADD to create a new PART PROGRAM.
NOTE: Merlin can manage up to 200 P
NOTE: The P
ART PROGRAM name may not contain characters that Window
does not accept as part of file names (E.g. / \ : * ? “<>| ø...). If any of
these characters is used, the system will allocate the P
string containing the exportation date and time (YYYYMMDDhhmmss)
during the B
ATCH export phase.
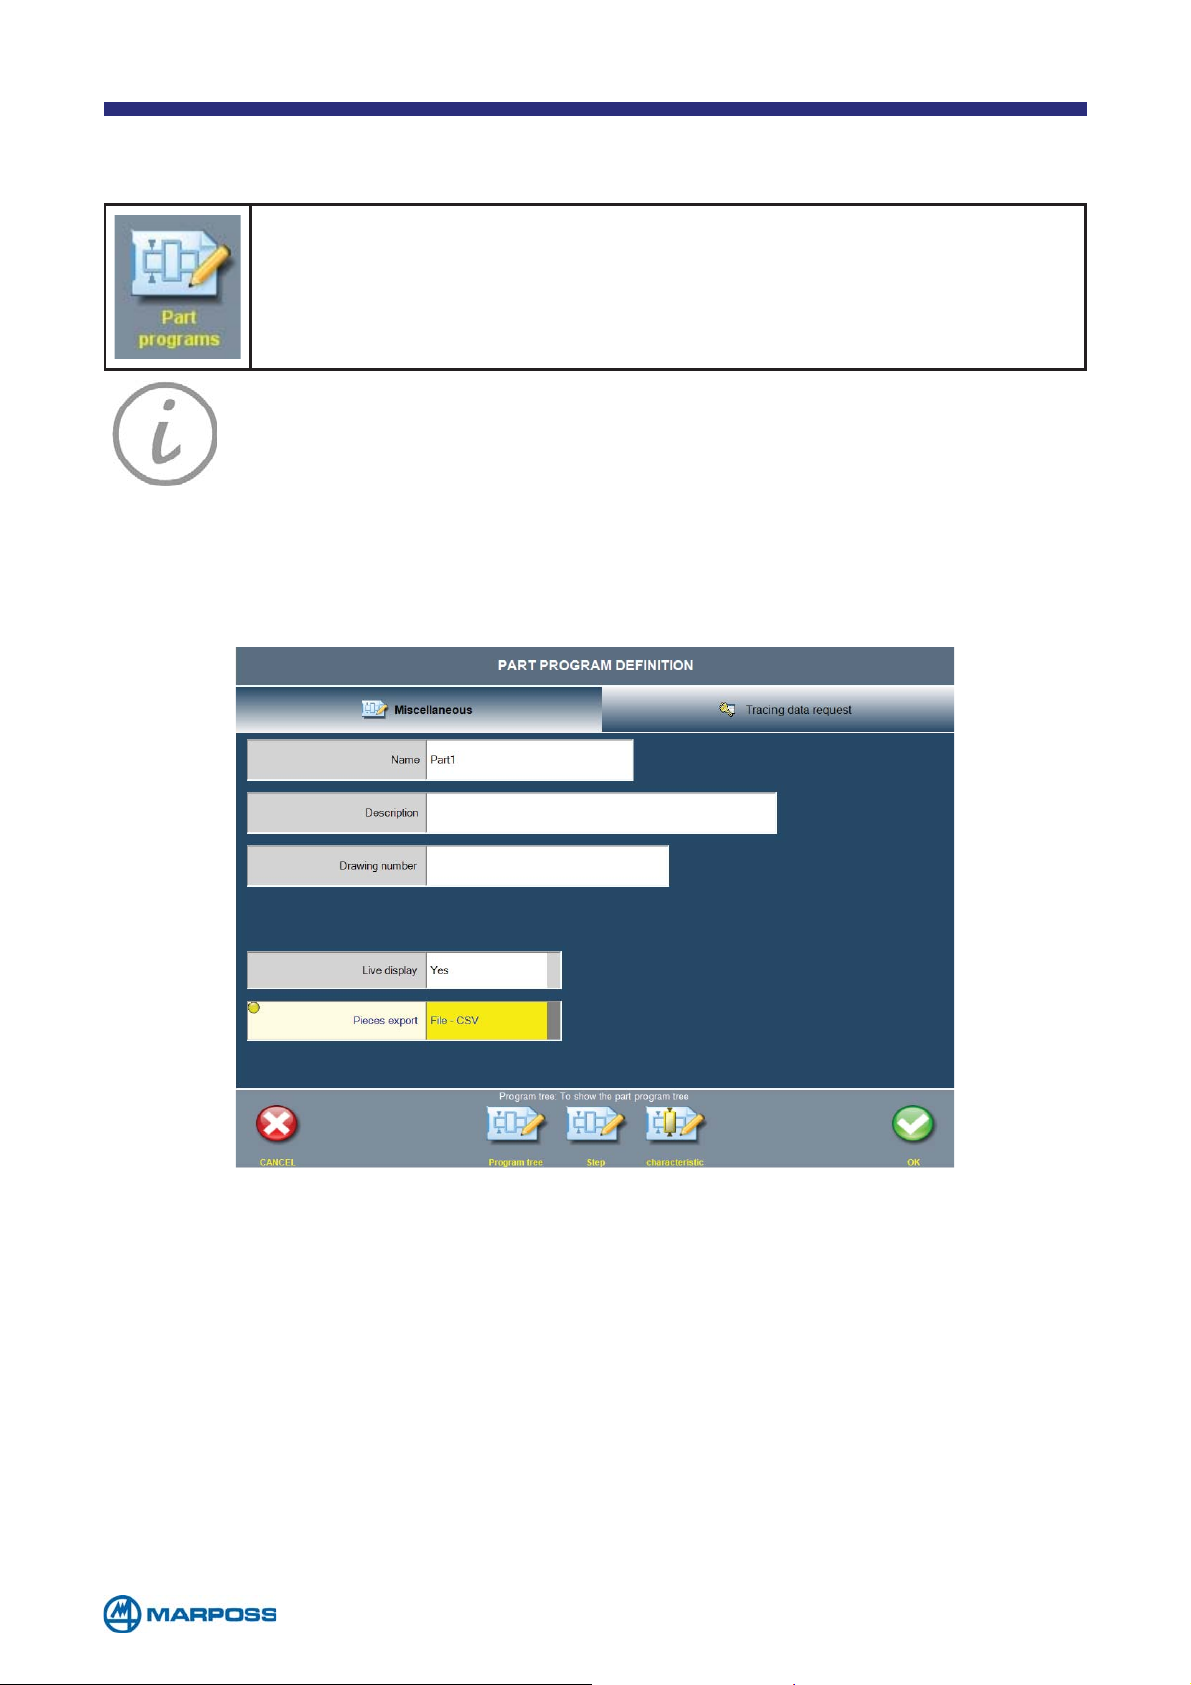
3.2.1 Miscellaneous TAB
ART PROGRAMS.
ART PROGRAM a
Tap on N
D
ESCRIPTION (if it is required) and DRAWING NUMBER to enter the drawing reference.
AME to enter the NAME of the part to be programmed, on DESCRIPTION to enter a
The configuration parameters are described below.
• N
• D
• D
• L
AME: name of the part to be programmed.
ESCRIPTION: description of the part to be programmed.
RAWING NUMBER: reference DRAWING NUMBER.
IVE DISPLAY: if this parameter is enabled, measurement values are updated conti-
nuously during the acquisition phase; if it is disabled, the C
HARACTERISTIc values are
displayed only once the measurement has been completed (options: Y
• P
IECES EXPORT: if this parameter is setted on FILE-CSV, at the end of each piece a
CSV file containing the last measured values will be exported.
- 28 -
ES/NO).
Page 29
Define the number of measurement steps by tapping STEP.
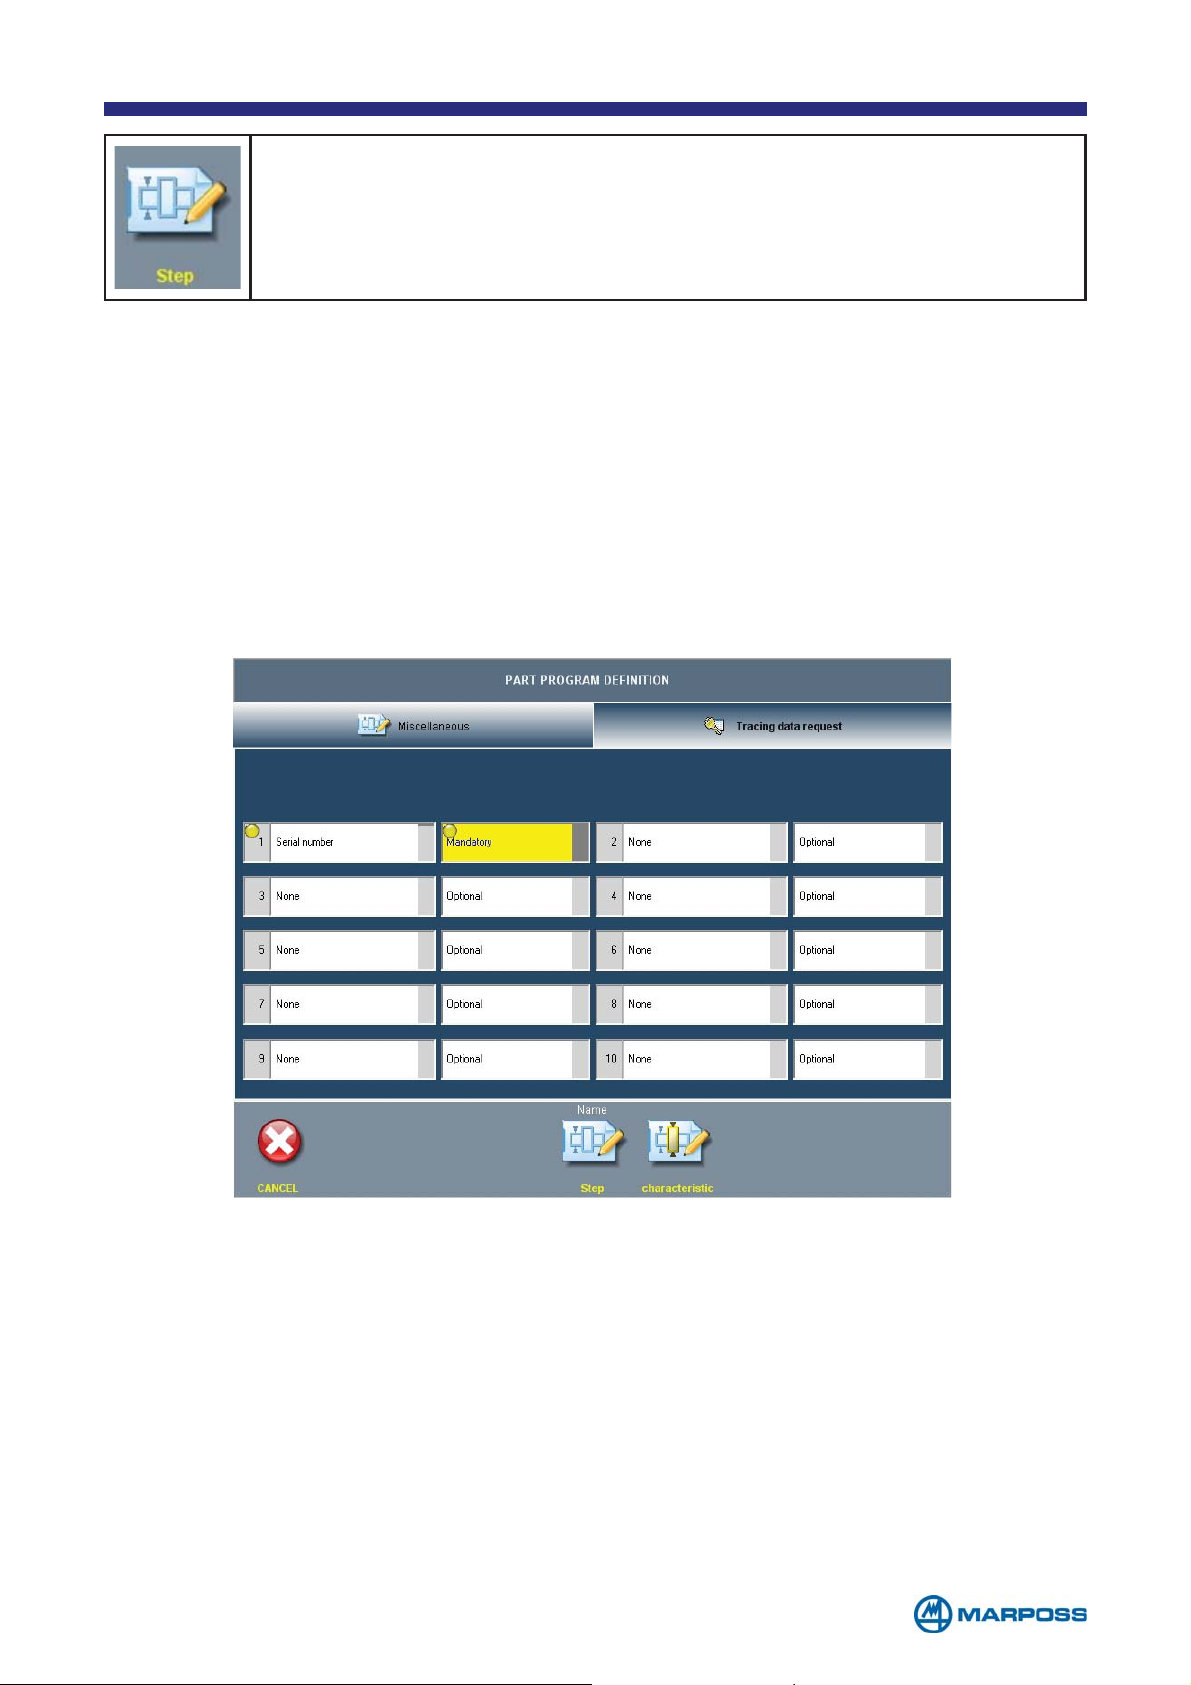
3.2.2 Tracing data request TAB
This programming page enables the tracing parameters, and defines the way for
requesting such information to the operator. T
runtime data that the operator can/has to input; these data are saved and linked
with the measurements acquired. Up to ten parameters can be enabled and for
each one must be defined if the operator is forced to input a value (M
can skip it (O
PTIONAL). The values can be input on operator request or at the end of
a measure sequence (after the last step).
RACING parameters are additional
ANDATORY) or
To insert the T
RACING DATA it is necessary that one BATCH is activated.
- 29 -
Page 30
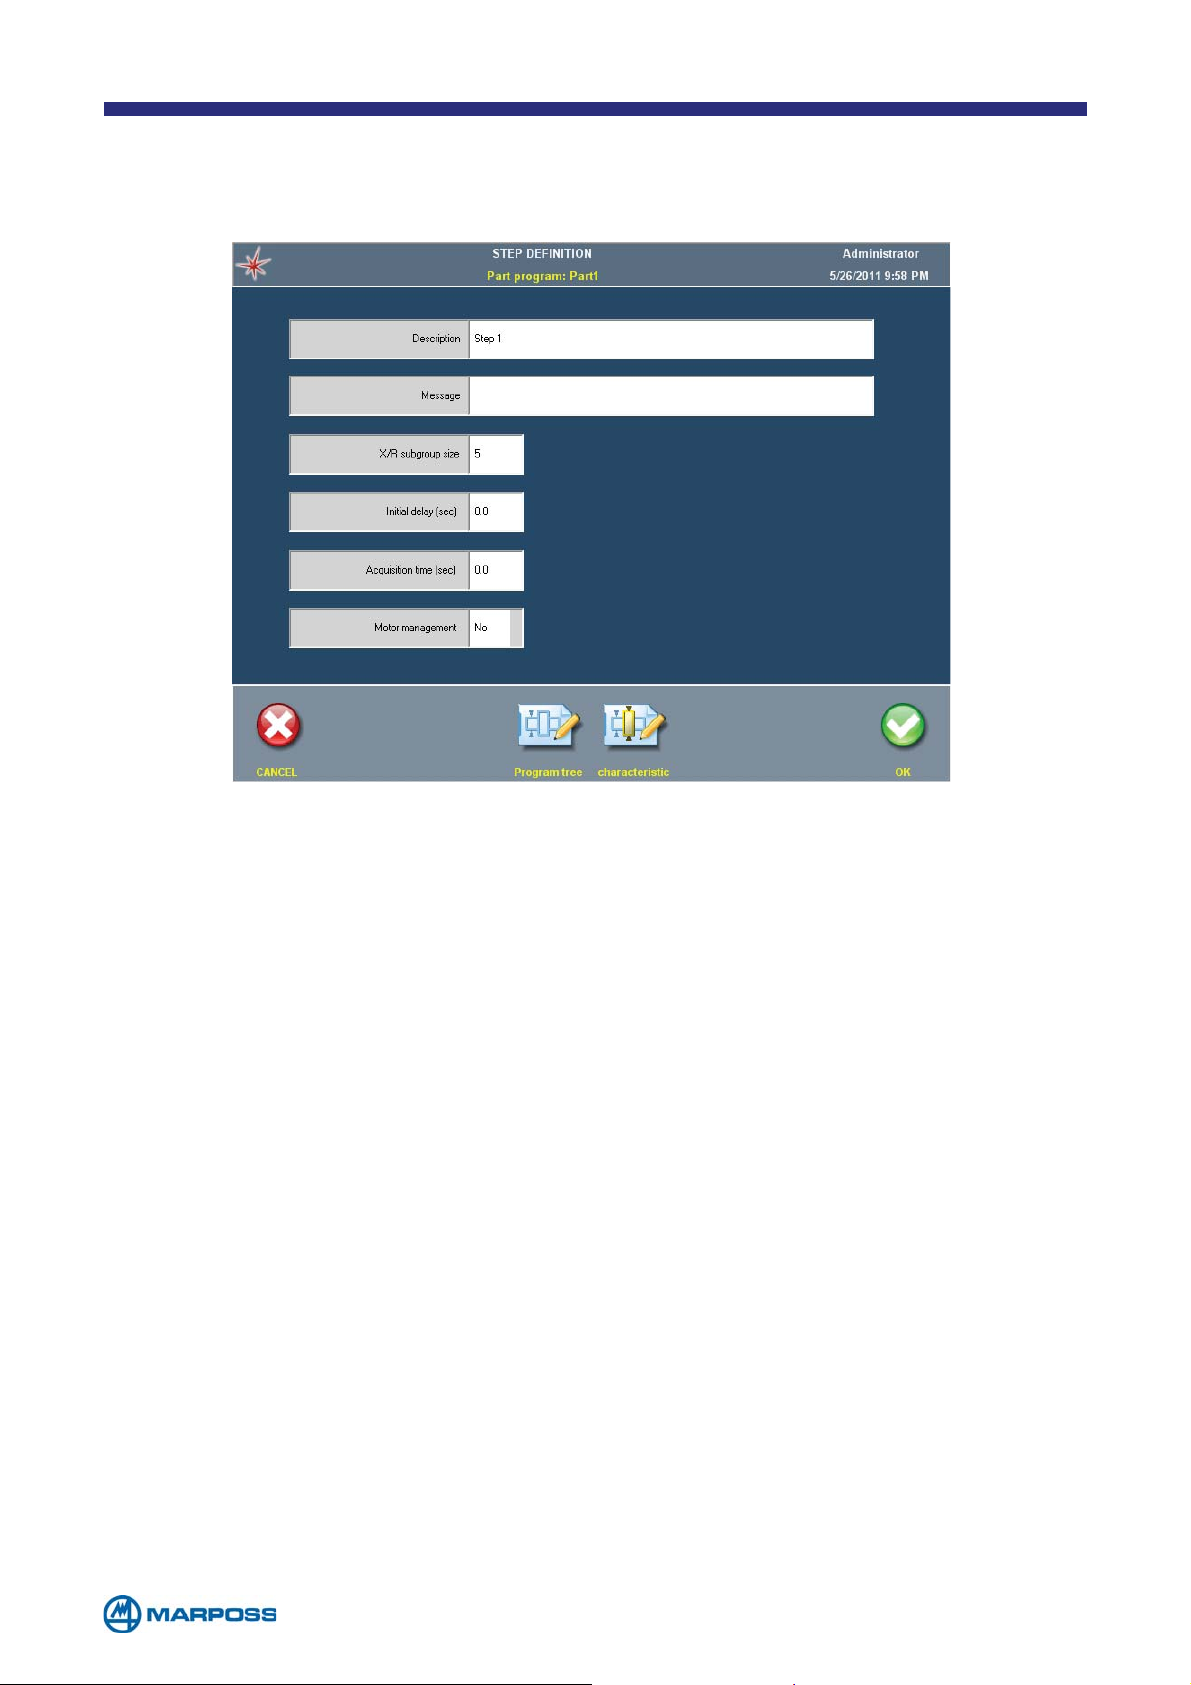
3.2.3 Step definition
Tap on DESCRIPTION to insert a STEP description.
The configuration parameters are described below.
• D
• M
ESCRIPTION: DESCRIPTION of the measurement STEP.
ESSAGE: measurement STEP MESSAGE; this message appears in the page hea-
der highlighted in yellow, and it can be used to provide assistance to the operator.
• X/R S
UBGROUP SIZE: this parameter defines the size of the subgroup used in the
control charts (permitted values: 2 to 15).
• I
• A
• M
NITIAL DELAY: initial measurement delay setting (in sec.).
CQUISITION TIME: data acquisition period (in sec.).
OTOR MANAGEMENT: Enables a signal that can be used to control a motor
used to rotate the piece while the measurement is being performed; it can only
be used in I/O layouts (10-13).
- 30 -
Page 31
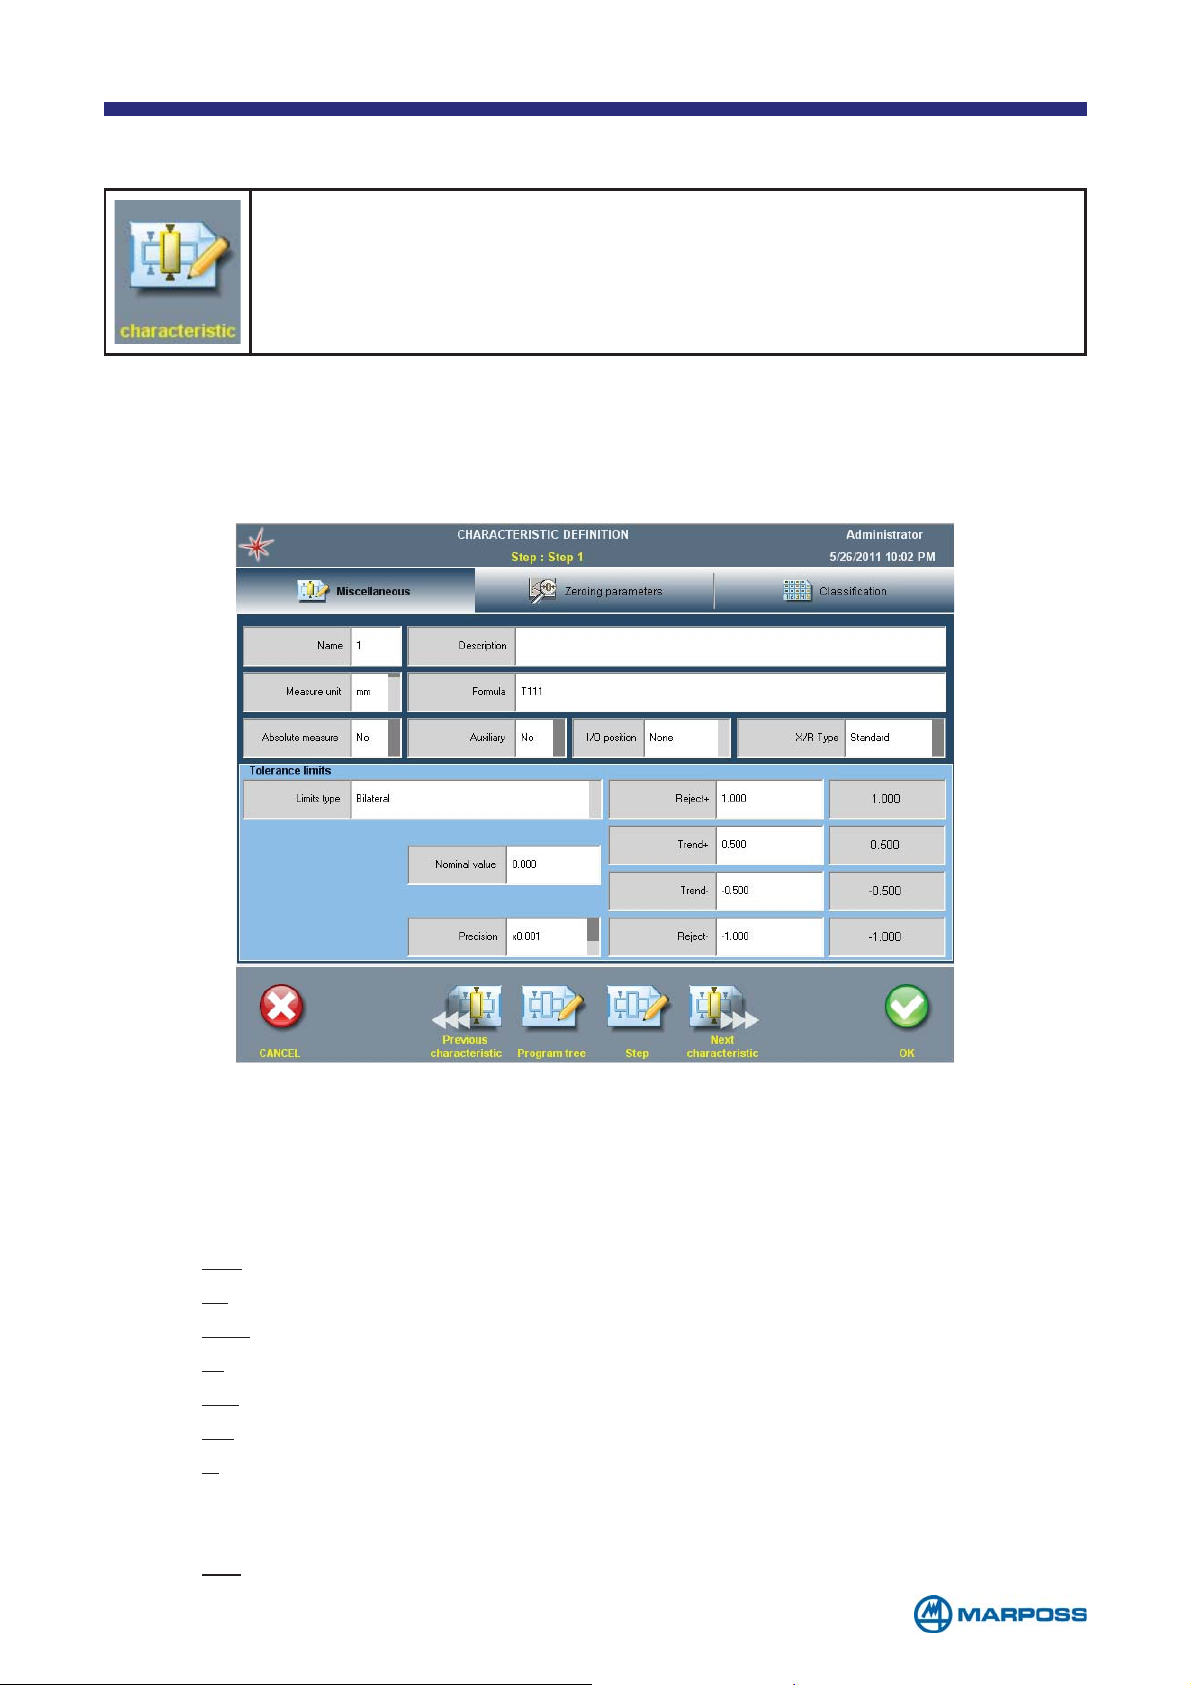
3.2.4 Defining the characteristic
Tap on CHARACTERISTIC to access the form used to define the CHA-
RACTERISTIC.
3.2.4.1 Miscellaneous TAB
This tab is used to enter the basic CHARACTERISTIC data, i.e. name, FORMULA and tolerance limits.
• NAME: to enter the FORMULA name
• D
• M
ESCRIPTION: full description of the characteristic.
EASURE UNIT: measurement unit used for the CHARACTERISTIC; the number of
places, displayed after the decimal point, depends on the value set up in the
P
RECISION field.
•
MM: millimetre
•
IN: inch
•
DEG: degrees and hundredths
G: gram
•
• °C: degrees Celsius
• °F: degrees Fahrenheit
• °: sexagesimal degrees; when the precision is set to x0.01 the value is displayed in degrees and minutes, e.g. 6°11’ ; when the precision is set to x0.0001
the value is displayed in degrees, minutes and seconds, e.g. 6°11’25”.
• μ
M: micron
- 31 -
Page 32
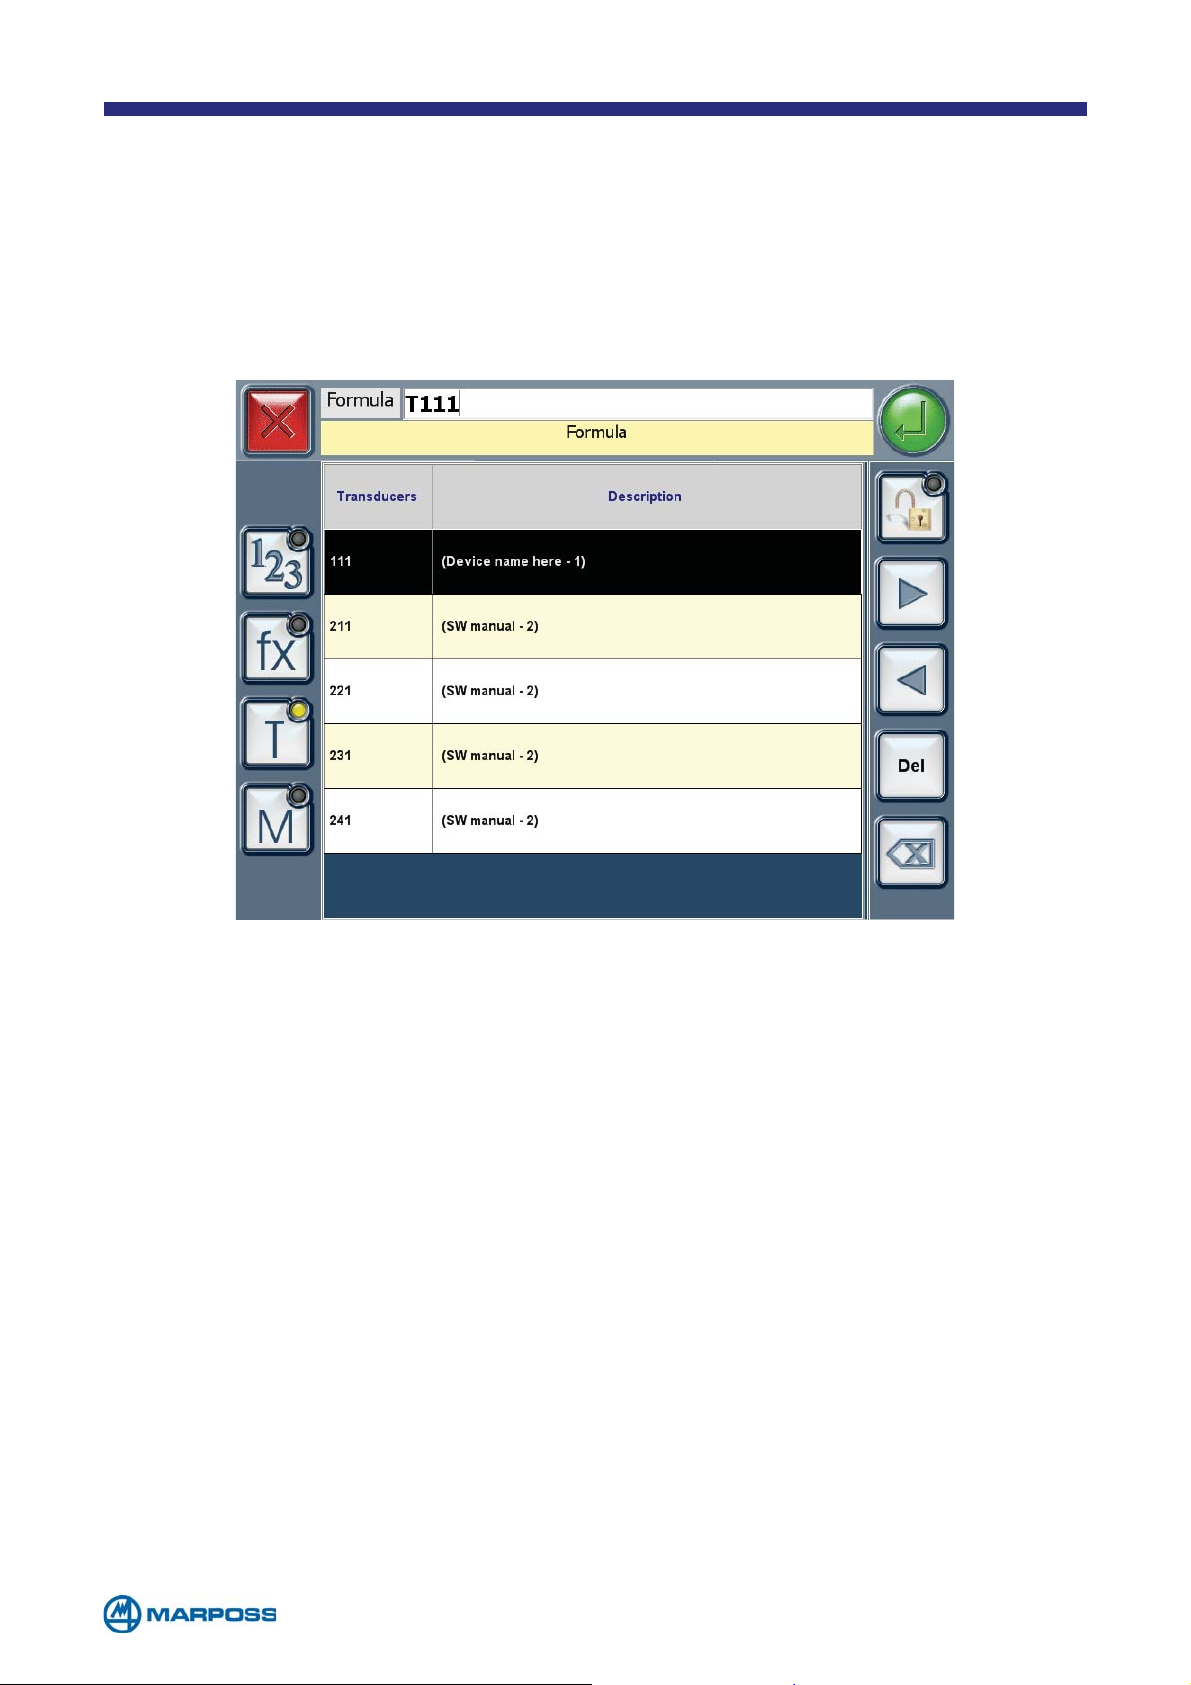
• FORMULA: The FORMULA may include TRANSDUCERS, mathematical functions or
previously acquired measurements, up to a maximum of 60 characters. Tap
the “T” button to select the transducer list. Tap a line to add the corresponding T
RISTIC list. Tap a line to ADD the corresponding CHARACTERISTIC to the FORMULA.
RANSDUCER to the FORMULA. Tap the “M” button to select the CHARACTE-
• ABSOLUTE MEASURE: it defines whether the measurement detected in the FOR-
MULA is absolute, or not. If so, the system subtracts the NOMINAL VALUE from the
processed value, whereas in the second case it adds the two values together.
• A
UXILIARY: very often applications use intermediate Characteristics to elaborate
another C
HARACTERISTIC. These “auxiliary characteristics” are not involved in the
part status evaluation, not stored in the batch and it is possible to exclude them
from the display too. It is possible to configure the measuring steps with auxiliary characteristics only (visible or not visible); the only limitation is that a P
P
ROGRAM must contain at least one not-auxiliary CHARACTERISTIC (ok/ng).
• X/R T
• T
YPE: it can be used to enable or disable the X/R control chart.
OLERANCE LIMITS: to set up the tolerance limit type and the corresponding
ART
values based on the part technical specifications, it is possible to enable the
prescrap (or “yellow”) limits by using the T
P
RECISION parameter defines the number of decimal figures to be used for the
C
HARACTERISTIC.
REND “+” and “-“ parameters. The
- 32 -
Page 33
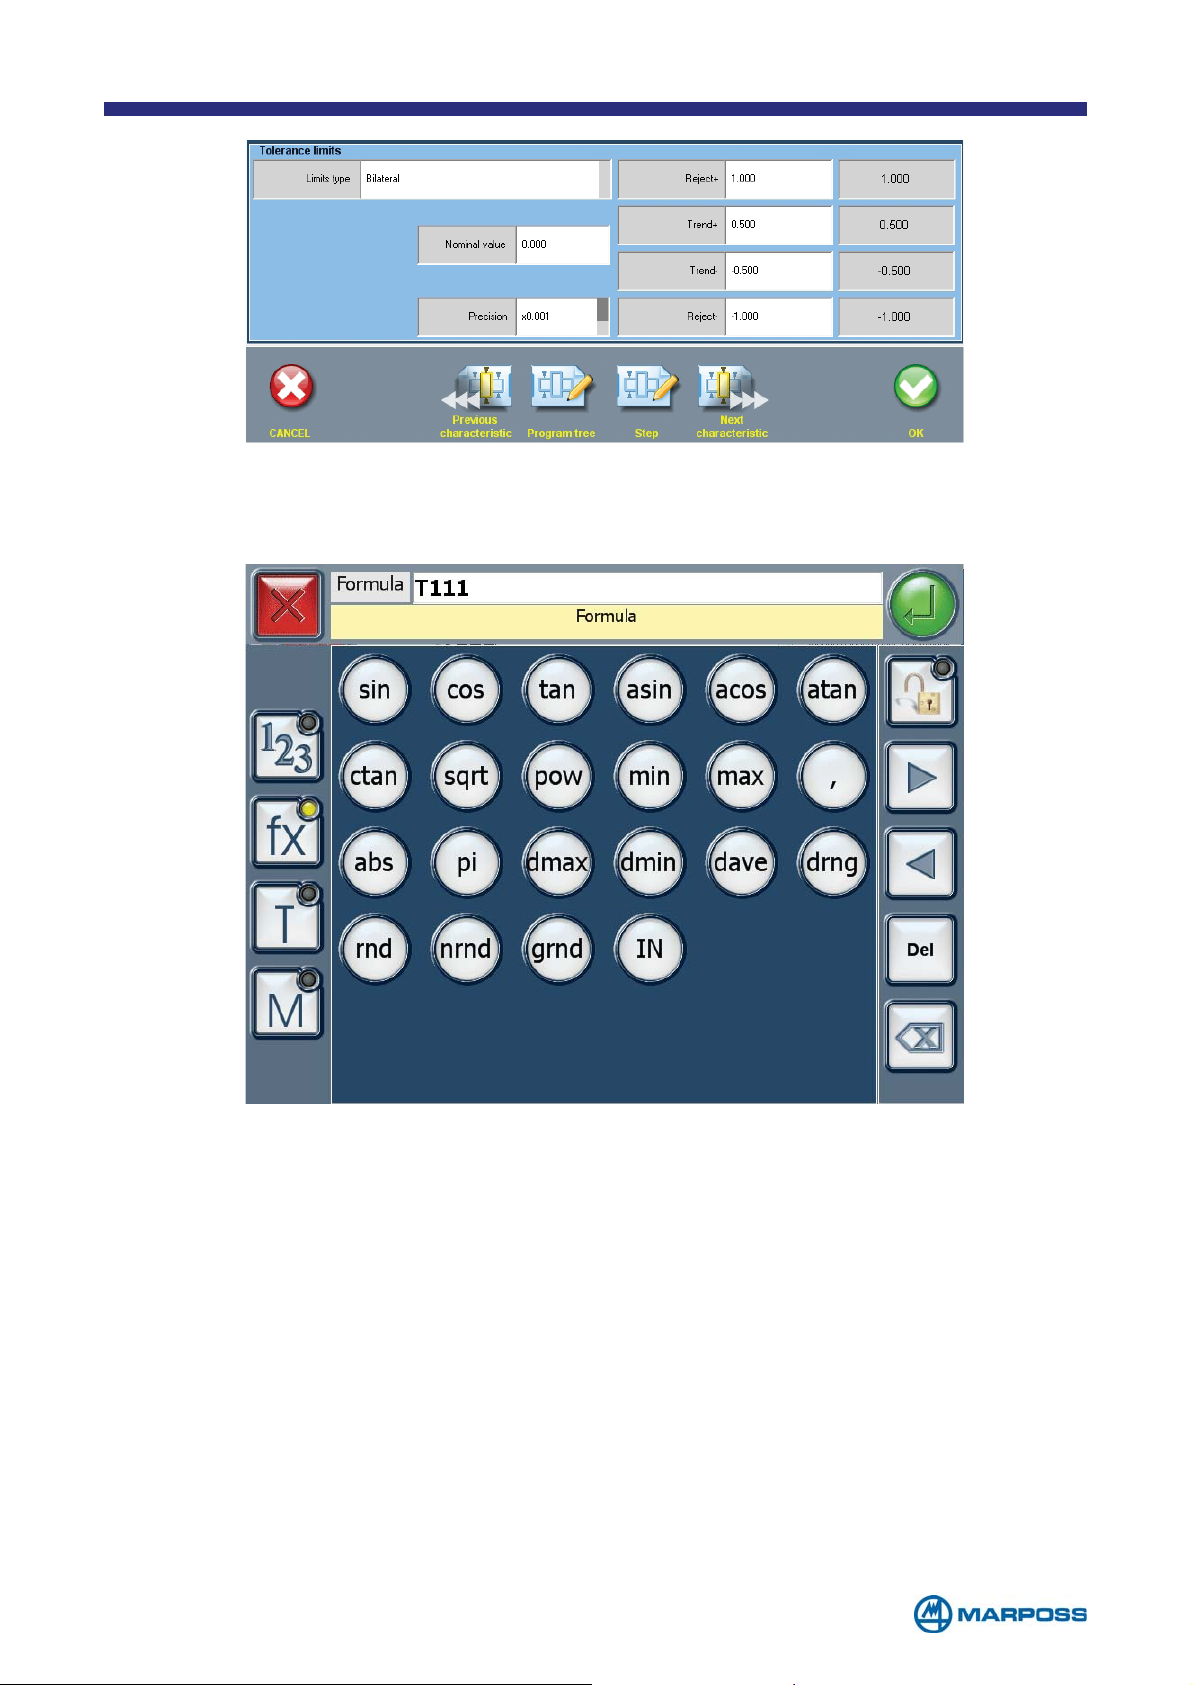
3.2.4.2 Using the formula
Tap on fx to access the keyboard with the list of complex functions.
The following mathematical and trigonometric functions are available:
• S
• C
• T
• A
• A
• A
• C
• P
• S
• A
• P
IN(): sine function
OS(): cosine function
AN(): tangent function
SIN(): arcsine function
COS(): arccosine function
TAN(): arctangent function
TAN(): cotangent function
I: high resolution pi function
QRT(): square root function
BS(): absolute value function
OW(X,Y): power function where x is the base and y the exponent
- 33 -
Page 34

The following functions for determining the minimum and maximum values between
operands are available (T
• M
IN: function for determining the minimum value among N operands; e.g. Min
RANSDUCERS and/or CHARACTERISTICS and/or constants):
(T1,T2,T3).
• M
AX: function for determining the maximum value among N operands; e.g.
Max (M1,M4).
Up to 10 comma separated values are permitted.
The following dynamic calculation functions are available for use on all the values
acquired during the measurement:
• D
• D
• D
• D
MAX: dynamic maximum function
MIN: dynamic minimum function
AVE: dynamic mean function for all the acquired values
RNG: dynamic range function (maximum - minimum).
These functions may be applied to individual transducers or measurements.
The following simulation functions are available:
• R
• N
• G
ND: function that generates random values.
RND: random function values with normal distribution.
RND: random function values with Gamma distribution; select the (>0) para-
meter to obtain exponential distributions (=1) that resemble more closely the
classic “bell curve” the more they increase.
The following manual input functions are available:
• IN: the operator can manually input a measurement for the C
HARACTERISTIC.
The following logic functions are available:
•
MMODE(): returns 1 during the measurement phase and 0 during the zeroing
phase.
•
ZMODE(): returns 1 during the zeroing phase and 0 during the measurement
phase.
NOTE: The Merlin can carry out manual dynamic acquisitions. The performances may change according to the number of the used channels.
- 34 -
Page 35
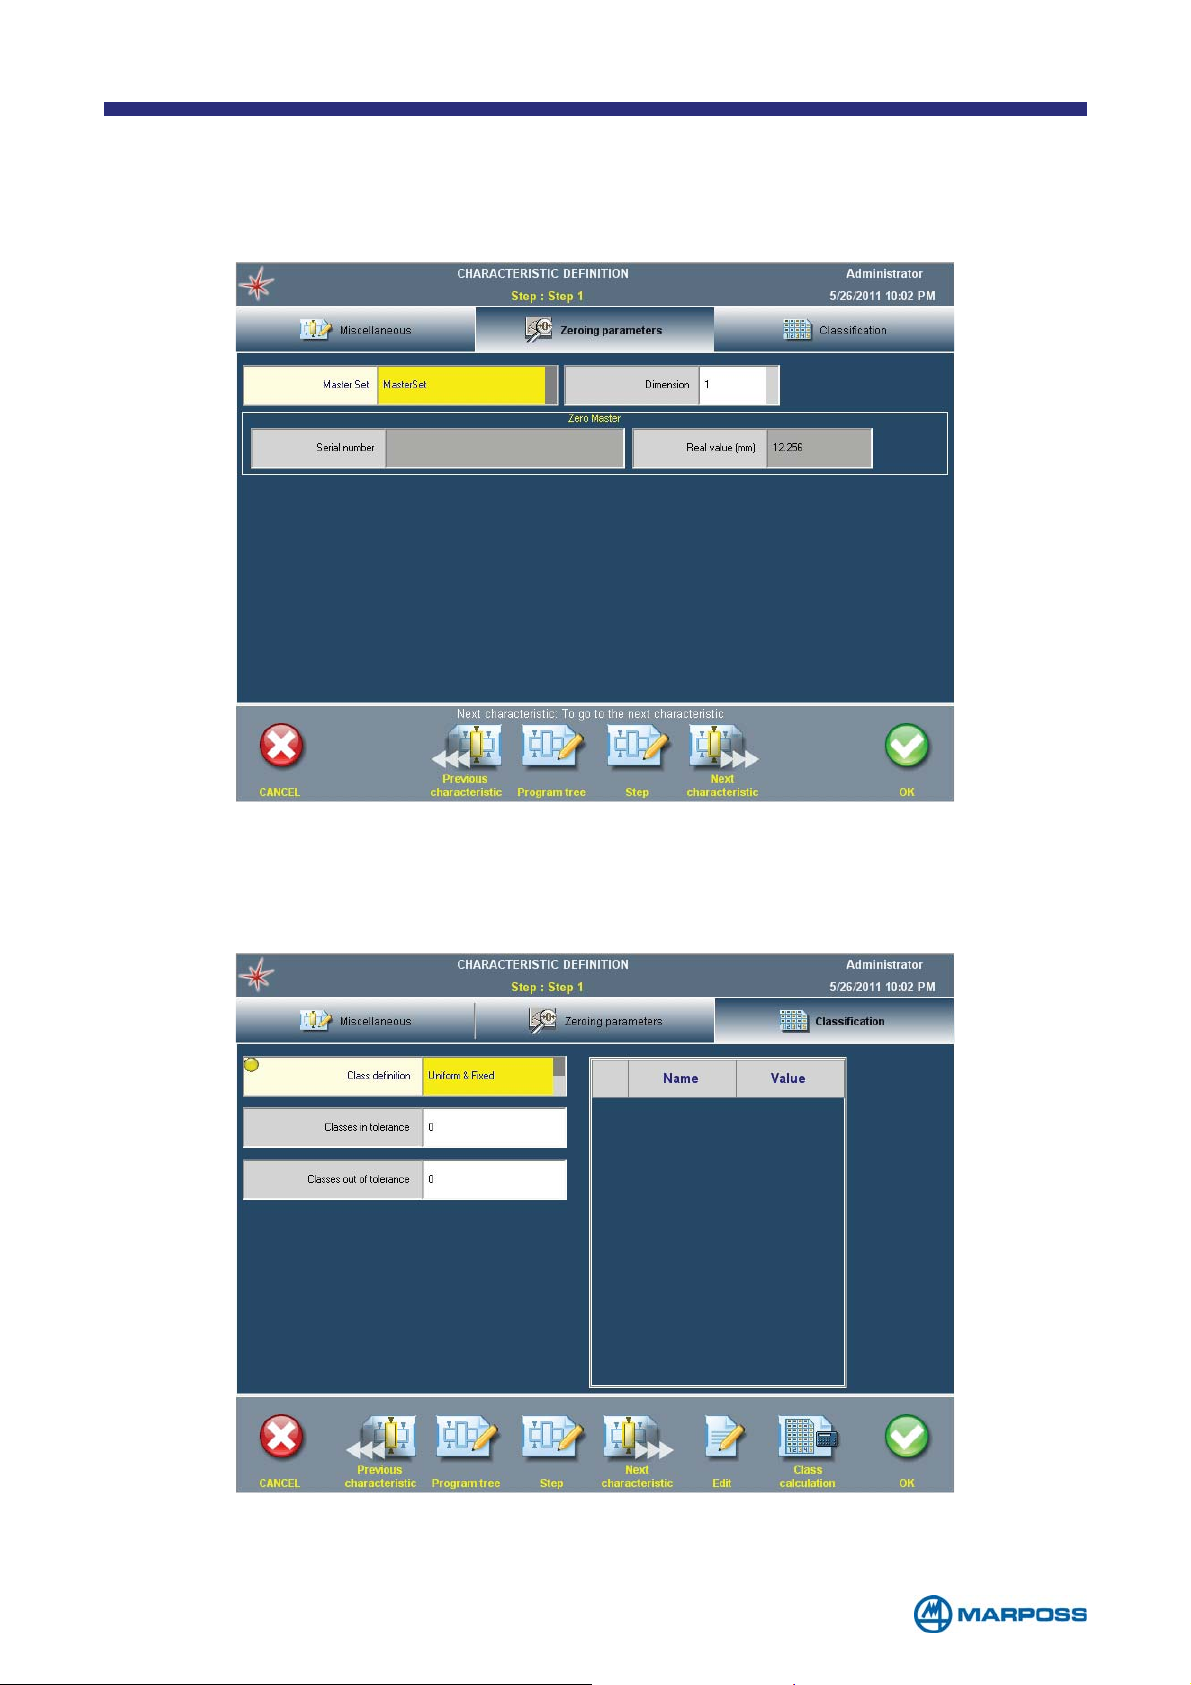
3.2.4.3 Zeroing parameters TAB
Tap on ZEROING PARAMETERS to assign a MASTER SET (previously configured) to the CHA-
RACTERISTIC.
3.2.4.4 Classification TAB
Once enabled in SETTINGS - GLOBAL SETUP - MISCELLANEOUS 1, the CLASS MANAGEMENT
function allows to create up to 32 classes for each C
HARACTERISTIC.
- 35 -
Page 36
Here is the list of parameters to program :
• C
LASS DEFINITION:
• D
• U
ISABLED: (Default)
NIFORM & FIXED: the system sets the classes programmed; only the class
name is left editable. All C
• F
REELY EDITABLE: name and value are freely editable. The CLASSES can have
LASSES are created with the same size.
different sizes.
• C
LASSES IN TOLERANCE & OUT OF TOLERANCES: the total amount of classes must
be
U32, and they can be inside or outside the tolerance limits.
Edit function allows to modify NAME and/or VALUE in the table.
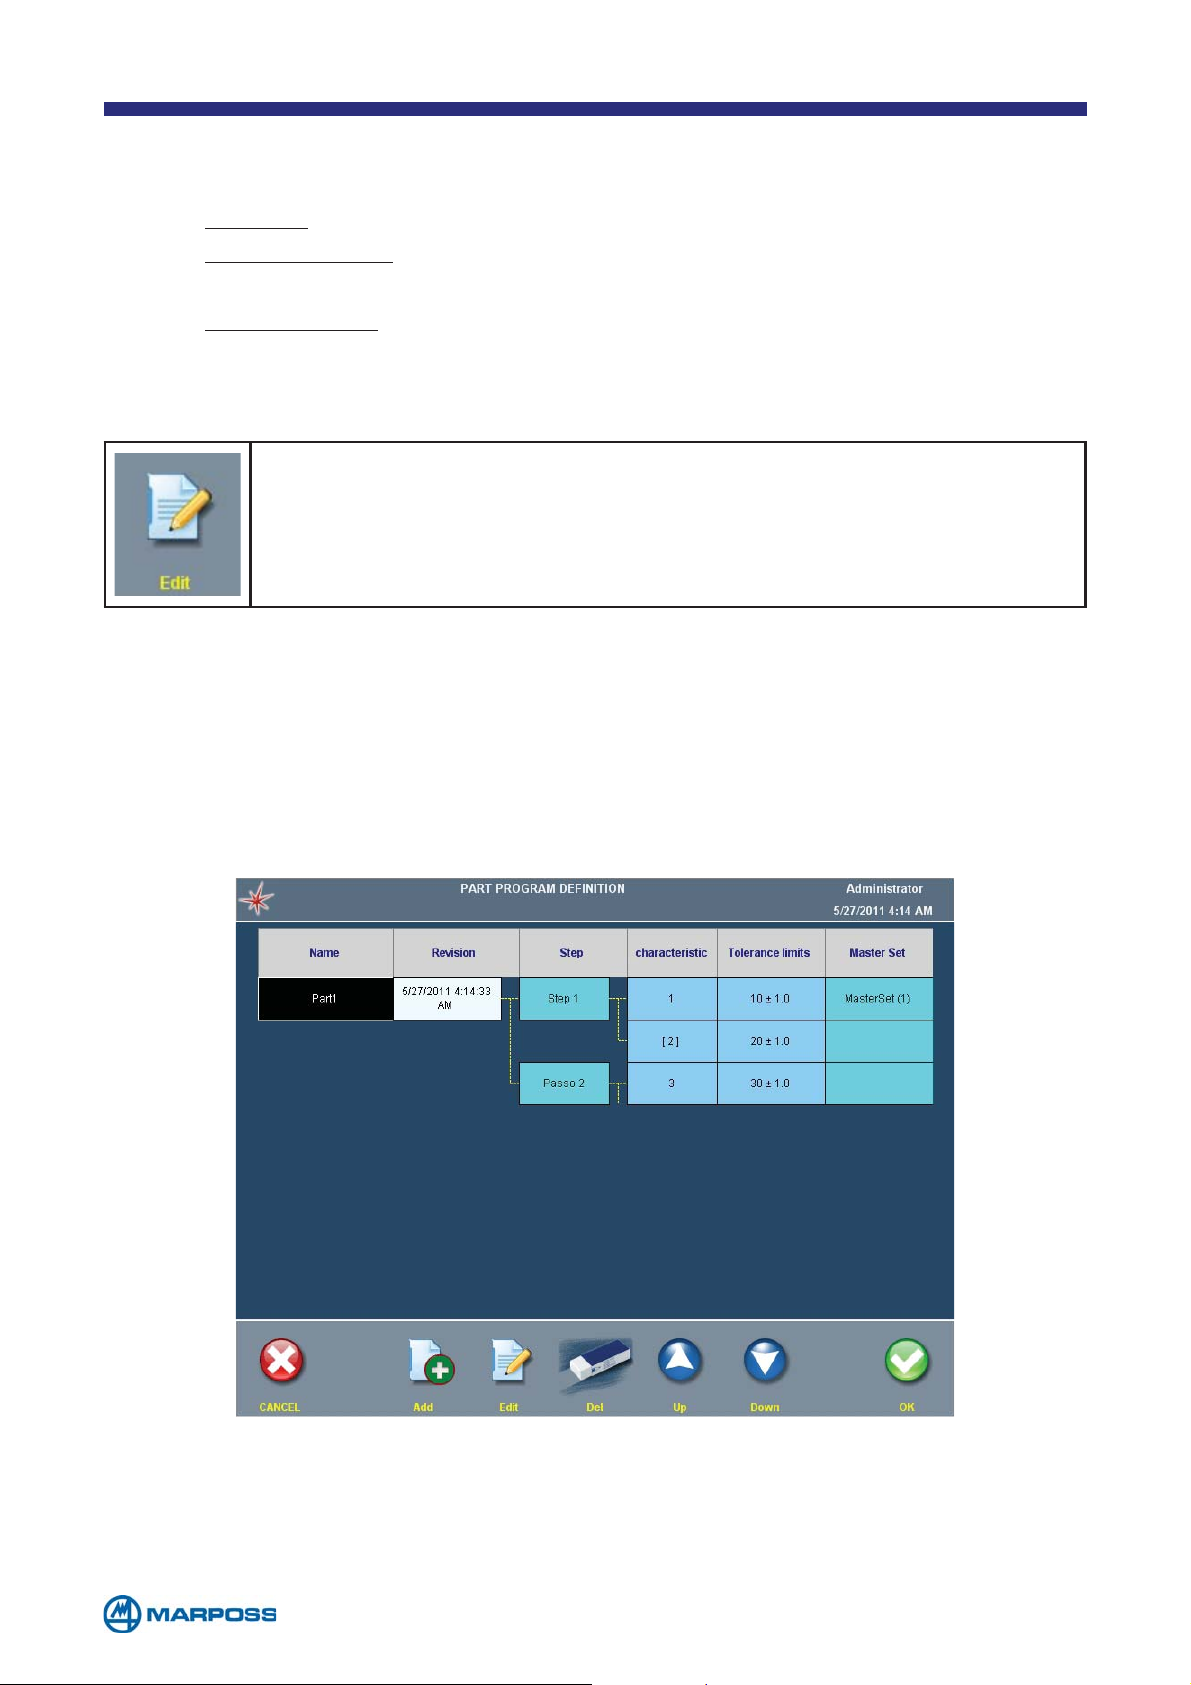
3.2.5 Part program structure
Once the CHARACTERISTIC has been defined it is possible to view the complete structure of the P
The following table includes all the information entered during the programming
phase: the P
and the M
been configured as A
ART PROGRAM that has been created.
ART NAME, the measurement STEP, the CHARACTERISTIC, the TOLLERANCE LIMITS
ASTER SET. The brackets in the CHARACTERISTIC “2” show that the measure has
UXILIARY.
This page enables the user to carry on adding new steps, new measurements and
new zeroing steps. To add a new element, select the element to be added by highlighting it in the display and then tap A
The U
P and DOWN functions allow the user to move the selected element around the
DD.
tree structure.
- 36 -
Page 37
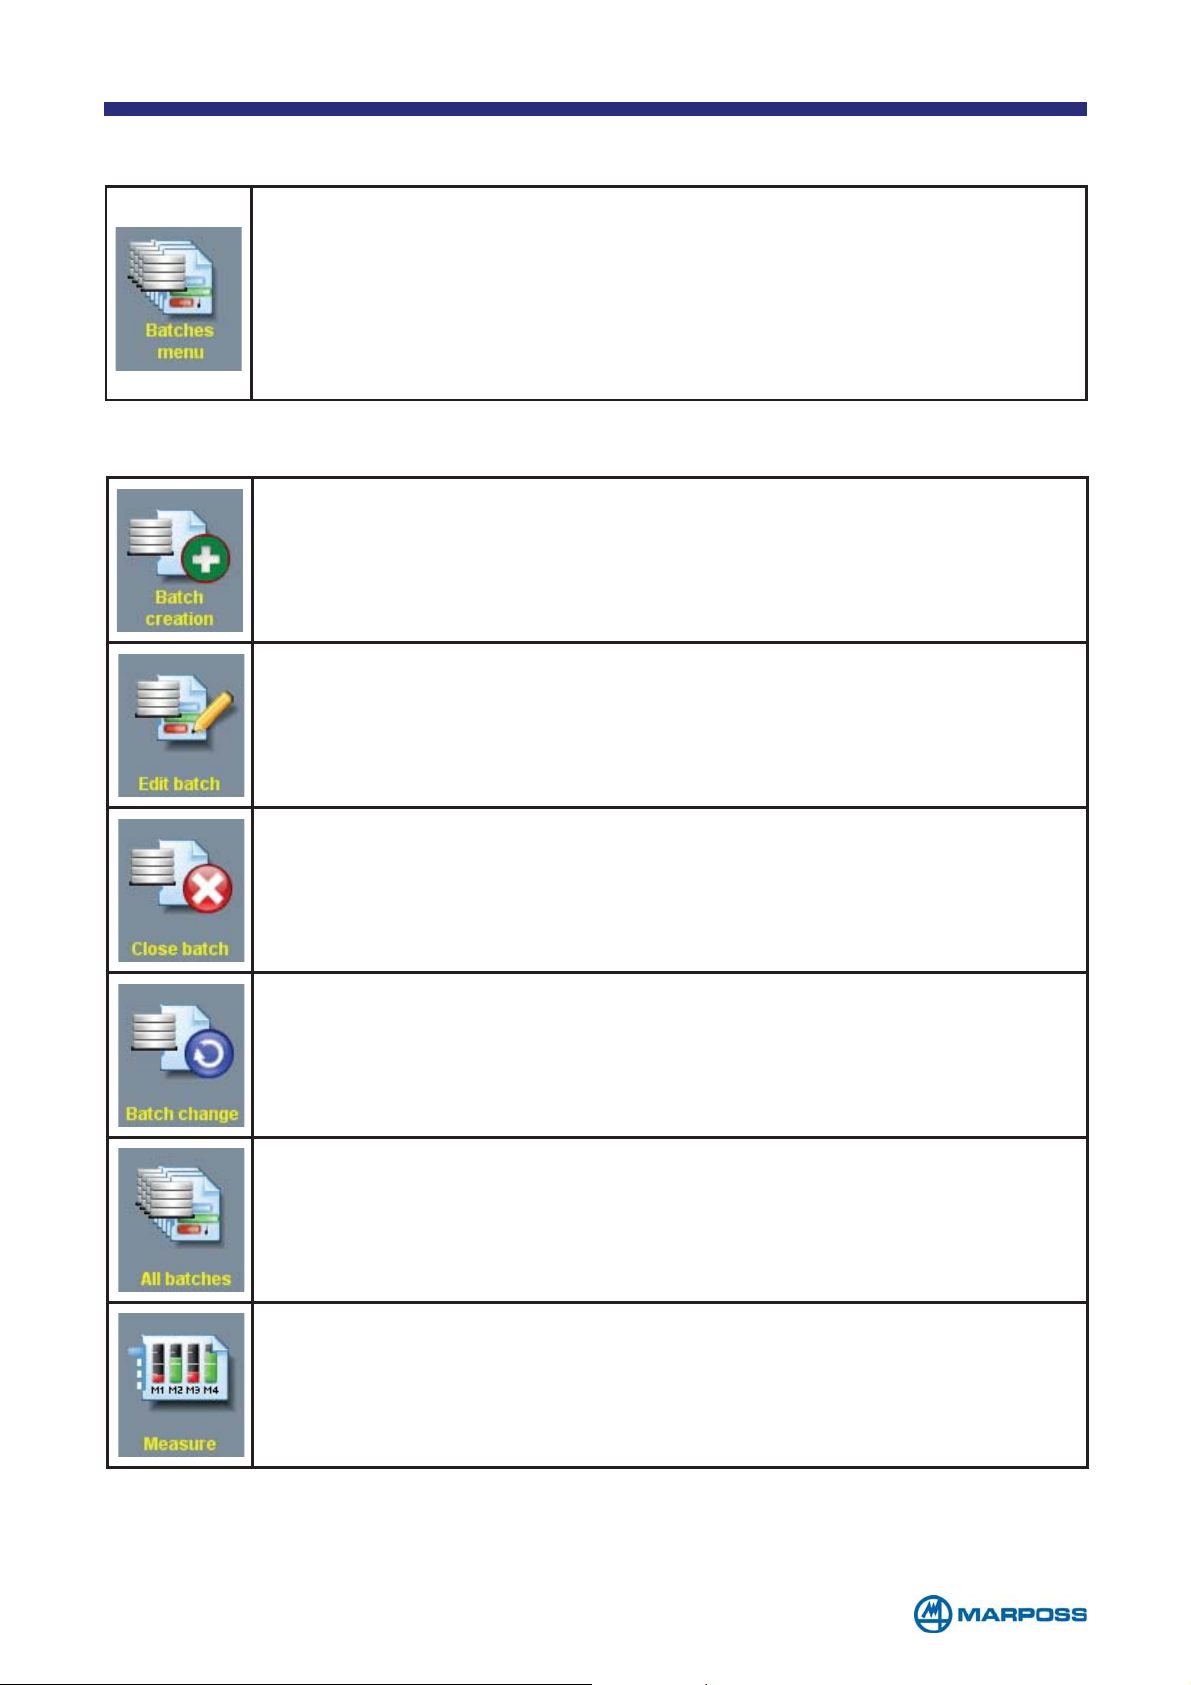
4 BATCHES
This menu contains the commands that are used to manage the BATCHES,
i.e. the data structures used for collecting the measurements. The B
are used primarily to store the data, but also to arrange the measurements
in layers according to the time they were collected in order to increase the
significance of the statistical analysis and to correlate the data collection
with the production B
The following commands are available:
BATCH CREATION: to create a new BATCH (see paragraph 4.1).
EDIT BATCH: to modify the parameters of the selected BATCH.
ATCHES. Merlin can handle up to 200 BATCHES.
ATCHES
CLOSE BATCH: to enable the operator to close an active BATCH, i.e.
setting it to a state where it is not possible to add measurements
and in which it can be deleted.
BATCH CHANGE: fast change of the selected BATCH; it enables the
operator to close the B
ATCH quickly, while simultaneously opening a
new one having the same parameters.
ALL BATCHES: to enable the operator to view all active and closed
B
ATCHES.
MEASURE: to enable the operator to activate the measurement phase
for the selected Batch (see chapter 5).
- 37 -
Page 38
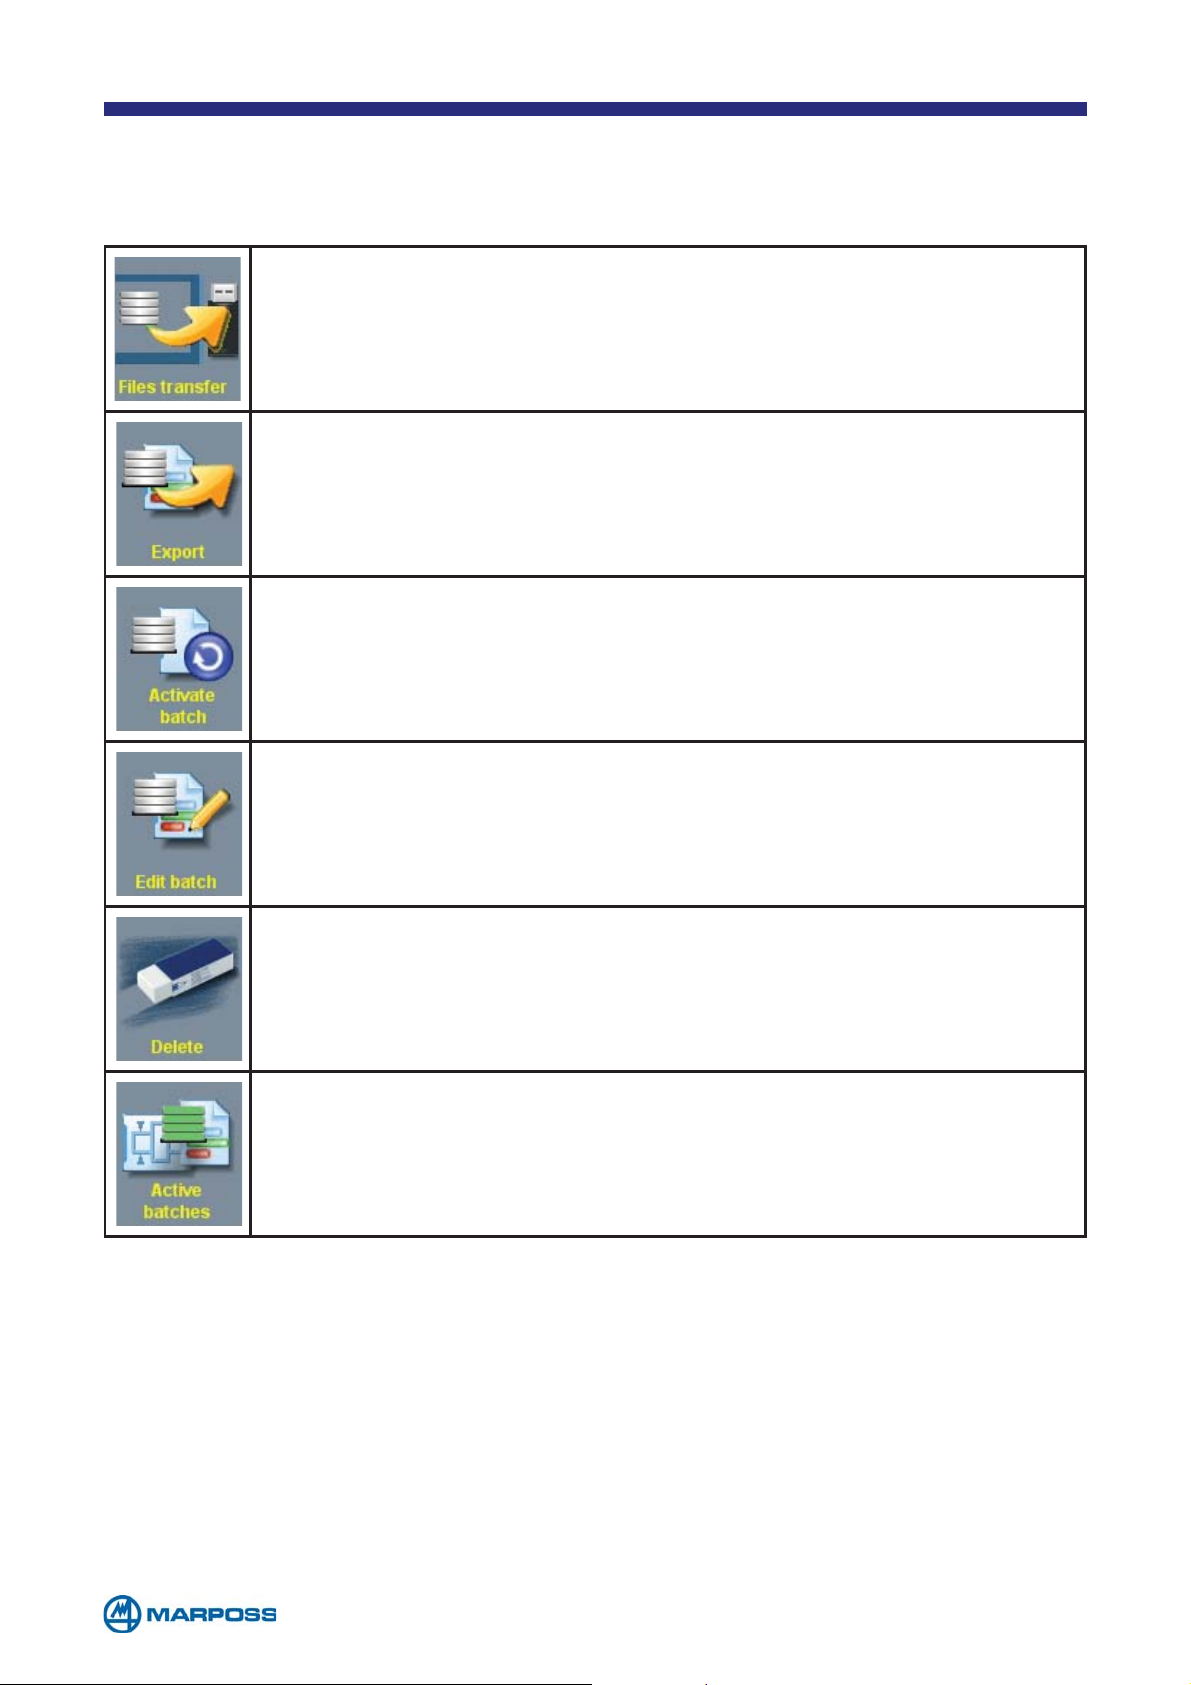
The ALL BATCHES function can be used to view all active and closed batches and
generate an alternative command list that enables the operator to work on closed
B
ATCHES, exporting and deleting them:
FILE TRANSFER: to enable the operator to transfer the exported
ATCHES to a specific destination defined in the General setup (see
B
chapter 6).
EXPORT: to export the selected BATCH to a file; the operator may de-
cide to export only the measurements, only the statistics, or the
measurements and the statistics.
ACTIVATE BATCH: to activate the selected BATCH.
EDIT BATCH: to modify the parameters of the selected BATCH.
DELETE: to delete the selected BATCH, it is possible only if it is already
closed.
ACTIVE BATCHES: to enable the operator to view the active BATCHES
only.
There are two ways to create a new B
• Tap on B
ATCHES MENU and than on BATCHES CREATION to create a new BATCH
ATCH:
• Select PART PROGRAM from the PROGRAMS MENU, access the PART PROGRAMS LIST page
and select the P
B
ATCH.
ART PROGRAM, the BATCH is to be associated with, then tap on
- 38 -
Page 39
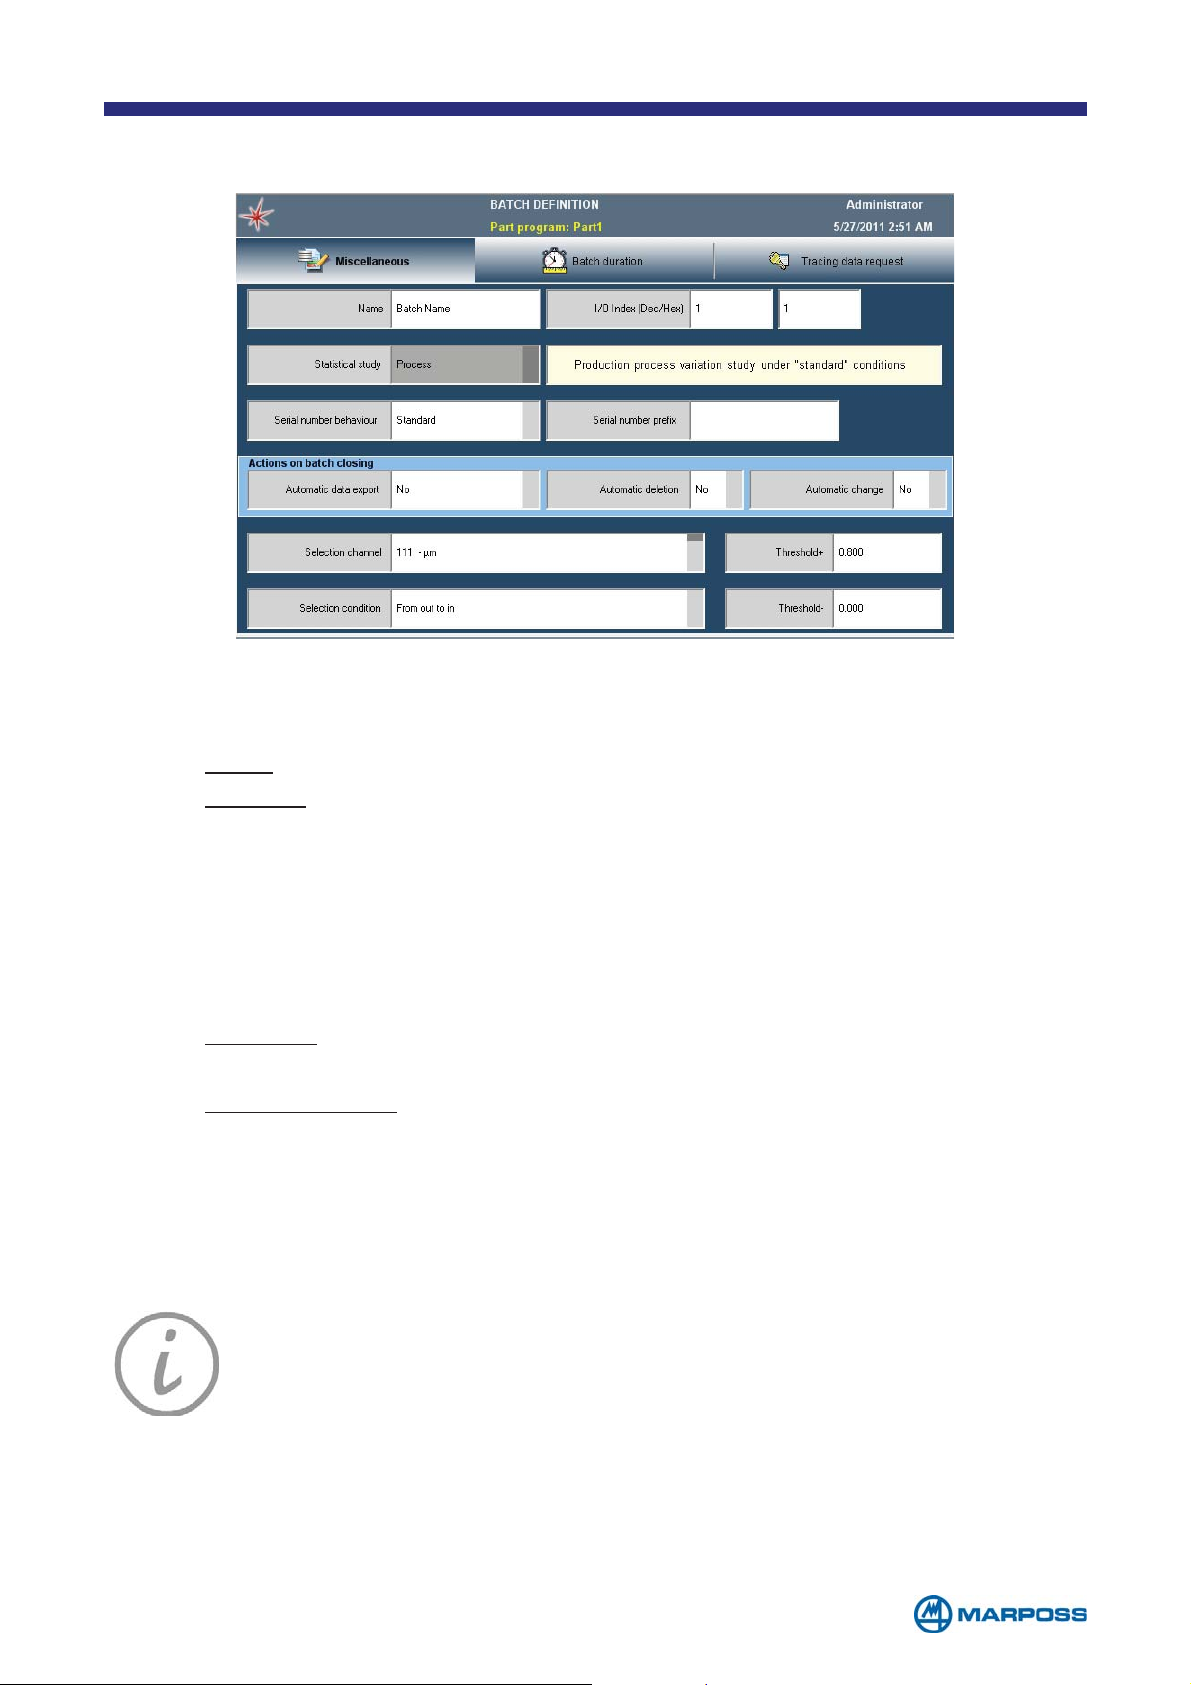
4.1 Miscellaneous TAB
• NAME: field to define a production BATCH name.
• S
• I/O I
• S
• S
TATISTICAL STUDY: to indicate if a statistical study on the data is required and
select the type.
• N
• P
B
ONE: Only the part counters are saved in the batch.
ROCESS: Each individual acquisition is stored.
NDEX (DEC/HEX): The I/O index function allows to automatically switch
ATCH, and relevant part program associated, through a digital input sent by
an external logic (PLC) or manually by a push button/rotary switch. The I/O
reference number of each batch can be entered either in decimal (Dec), or in a
hexadecimal form (Hex).
ERIAL NUMBER BEHAVIOUR:
• S
TANDARD: the operator may enter the serial number normally via the
keyboard by managing the keys.
• A
UTOINCREMENTAL: the serial number corresponds to the measurement
number, it is formed by 5 figures (e.g. 00001, 00002, etc.) and it is
incremented automatically each time a measurement is carried out.
ERIAL NUMBER PREFIX: if the previous field is set to “AUTOINCREMENT” it is possible
to define an alphanumerical prefix; for example, if the letter “A” is inserted in this
field, the serial number becomes A-00001, A-00002 etc.
NOTE: The B
ATCH name may not contain characters that Window does
not accept as part of file names (E.g. / \ : * ? “<>| ø...). If any of these
characters is used, the system will allocate the P
ART PROGRAM a string
containing the exportation date and time (YYYYMMDDhhmmss) during
the B
ATCH export phase.
NOTE: The SERIAL NUMBER BEHAVIOUR and SERIAL NUMBER PREFIX parameters may
be viewed in the Tab only if at least one traceability key has been set up.
- 39 -
Page 40
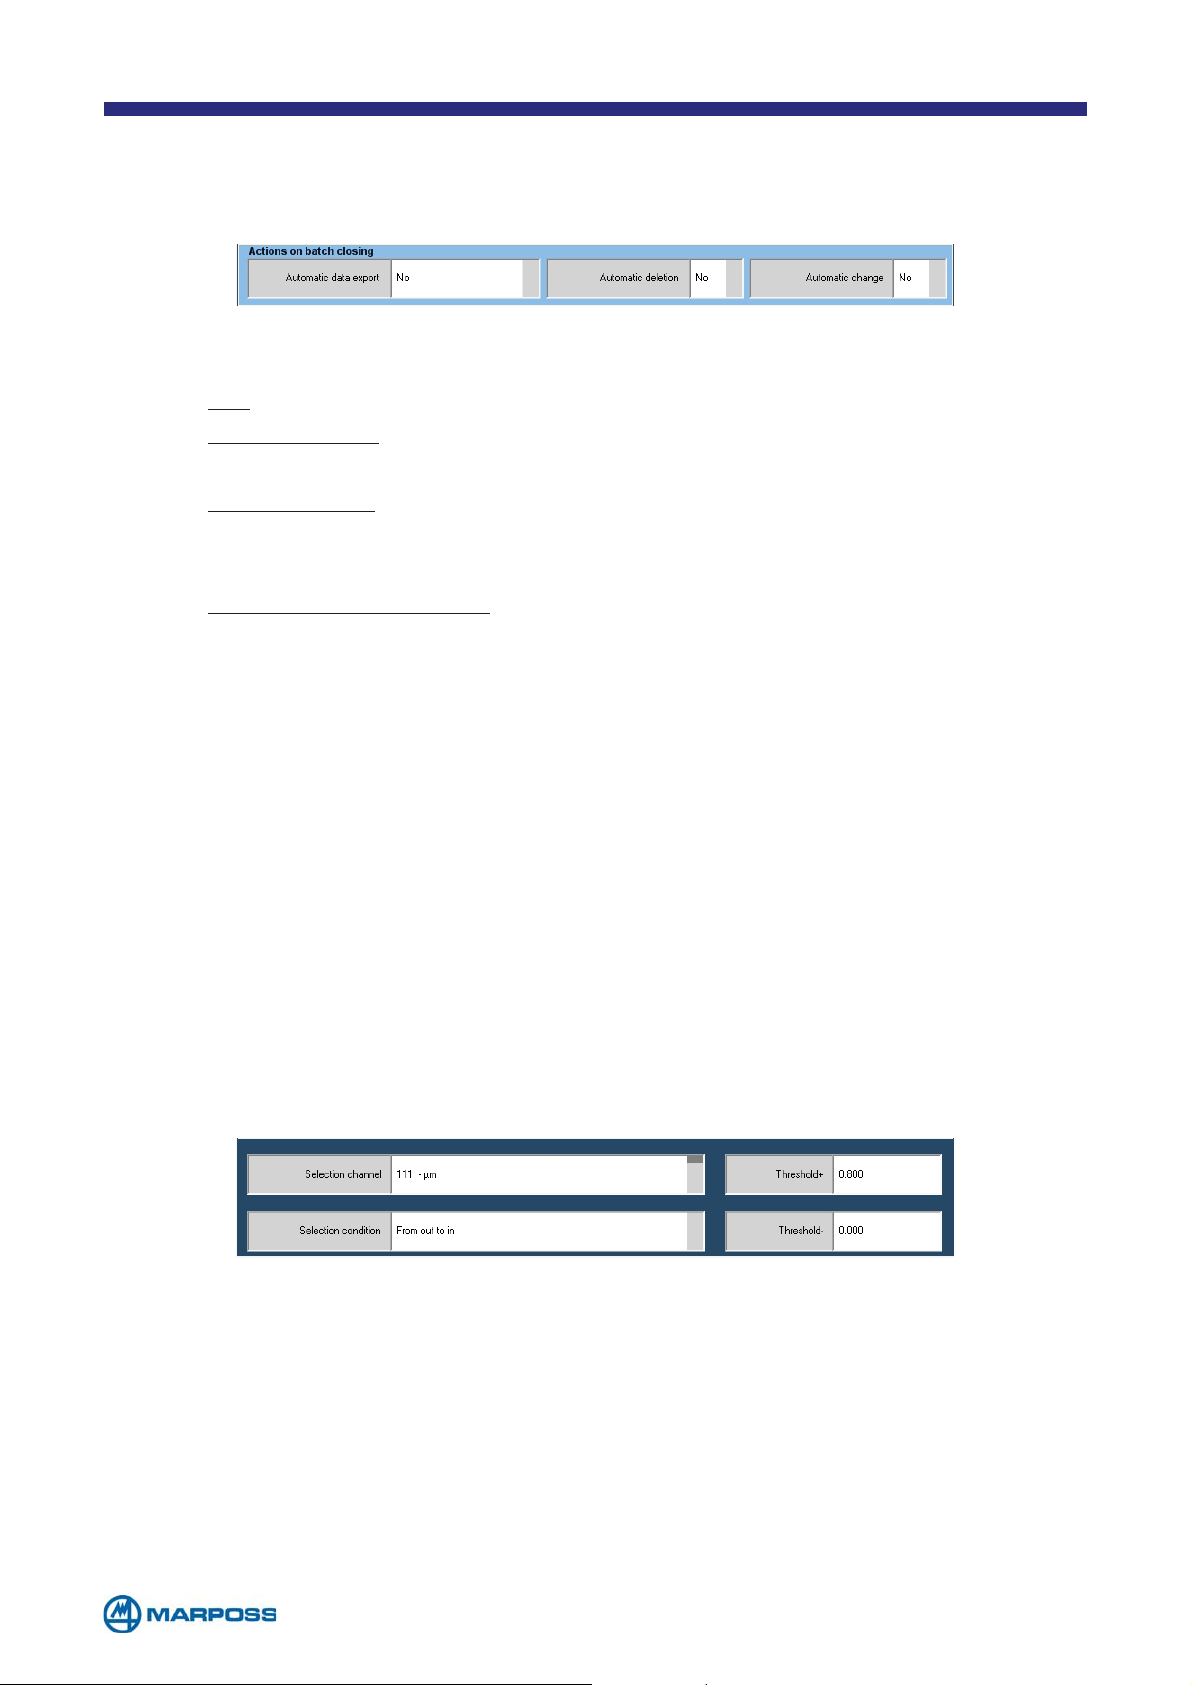
In the “A
CTIONS ON BATCH CLOSING” panel it is possible to select the operation to be
performed when closing a batch, as described below (these parameters may be
preset using the A
CTIONS ON BATCH CLOSING menu, see para. 6.7).
• AUTOMATIC DATA EXPORT: the function allows choosing which data has to be
exported on batch closing, the options are:
• N
• O
O: no automatic export.
NLY MEASURES: the software generates a file containing all the batch mea-
surement values and export it to the preselected path (see paragraph 6.6).
• O
NLY STATISTICS: the system creates and exports a file (.csv Microsoft Excel®
compatible format, .
DFQ Q-Das compatible format) containing the statisti-
cal data from the most significant.
• M
EASURES AND STATISTICS: the software creates and exports both types of
file: measurements in the programmed format and statistics in the Excel®
• A
compatible text format and .
UTOMATIC DELETION: if this parameter is set to YES, the system deletes the BATCH
DFQ Q-Das compatible format.
closed.
• A
UTOMATIC CHANGE: when it is enabled the software creates a new BATCH au-
tomatically after closing the current one. The new file will inherit the current
settings, but with a different name. The system creates the name as follows:
YYYMMDDhhmmss. The A
UTOMATIC CHANGE function works only when the batch
is closed inside the measure environment, with some automatic mechanism,
like the B
ATCH DURATION, it does not work closing the batch manually by the menu.
The user can select the batch manually from the list or through I/O signal, in the
latter case the selection numbering system in the I/O I
NDEX parameter is used.
The software is also able to select the B
ATCH automatically by exploiting a transducer
generated event. The following parameters must be programmed in order to define
the automatic batch change event:
• SELECTION CHANNEL: use this parameter to select the TRANSDUCER that triggers
the change. Each transducer may only be used to select a single B
sage appears next to the T
RANSDUCER name, indicating whether it is free or alre-
ATCH; a mes-
ady used for another selection.
• T
HRESHOLD ±: TRANSDUCER measurement field thresholds that are used to ena-
ble the selection.
• S
ELECTION CONDITION: this parameter defines the condition at which the selec-
tion is enabled: either as the value moves into (F
TO OUT) the range defined by the thresholds.
ROM OUT TO IN), or out of (FROM IN
- 40 -
Page 41
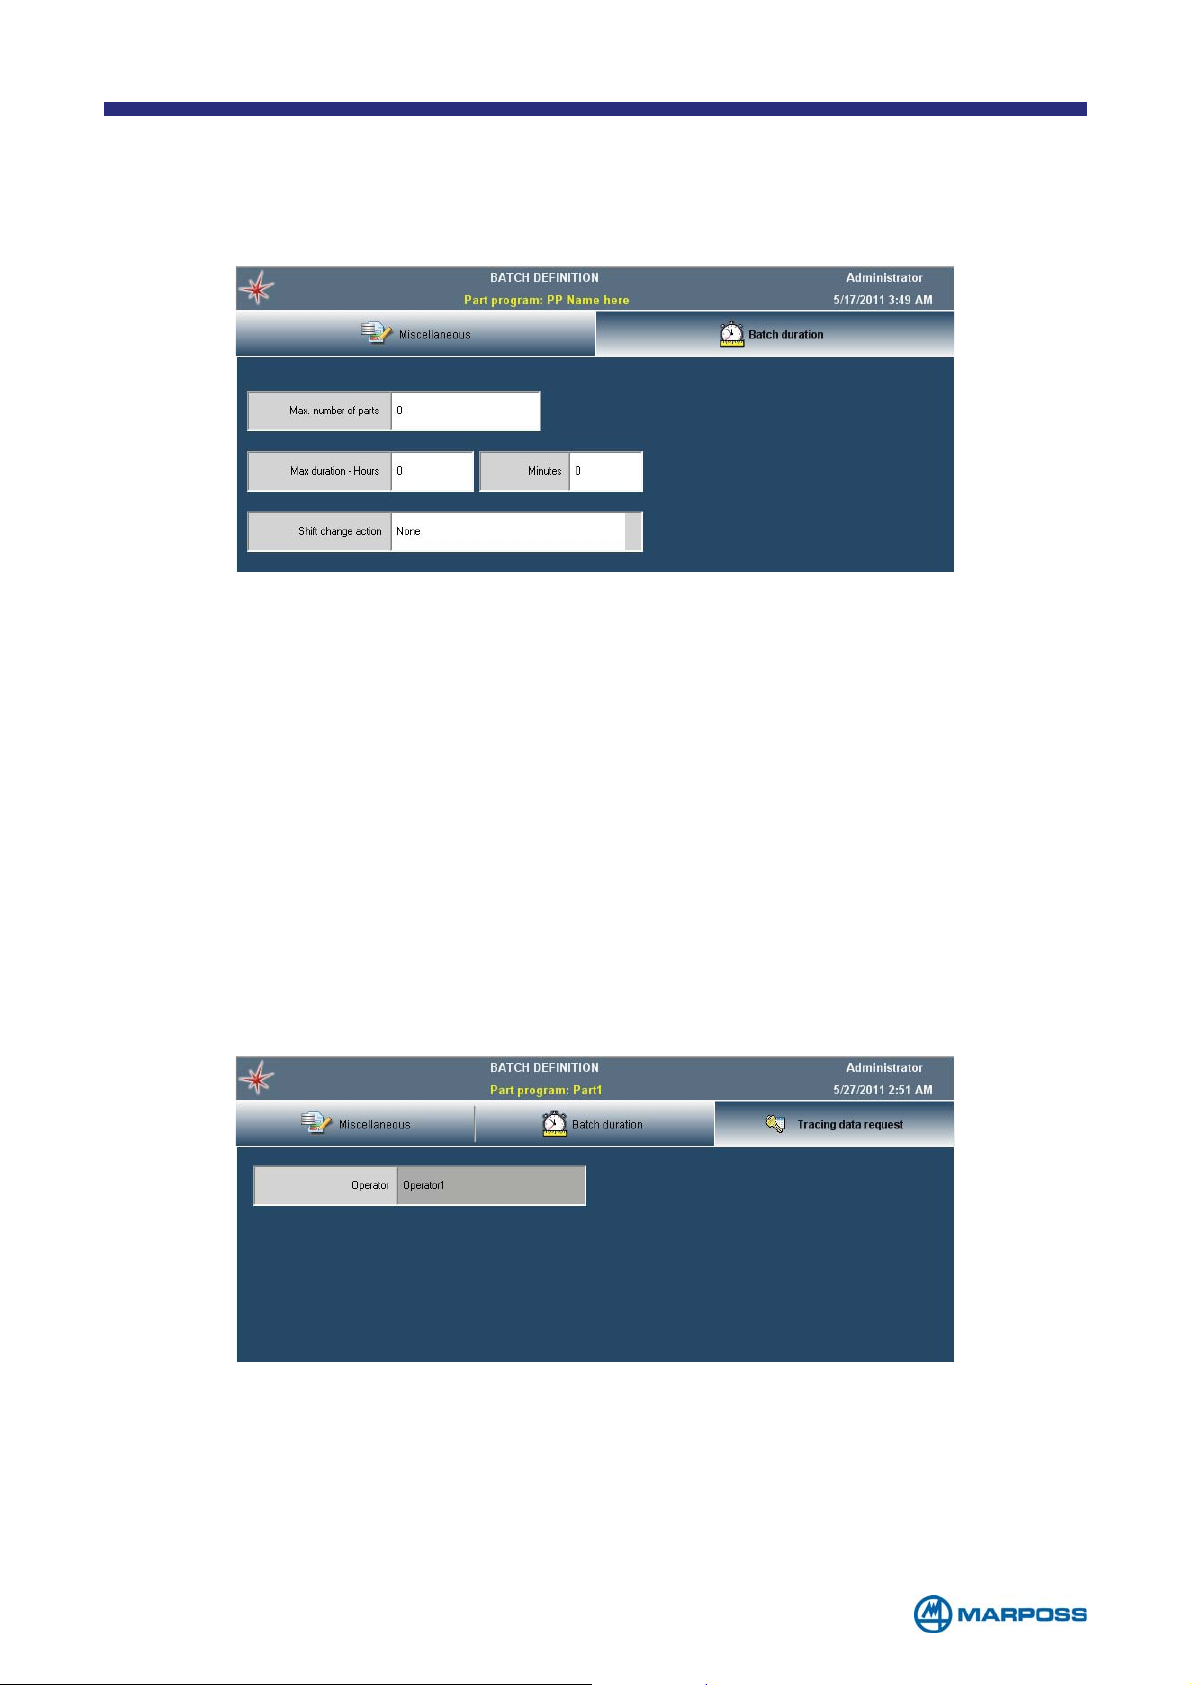
4.2 Duration TAB
In the BATCH DURATION window it is possible to choose between various conditions
under which the B
• MAX. NUMBER OF PARTS: the BATCH is automatically closed at the completion of
the number of parts.
• M
AX DURATION (HOURS / MINUTES): in this case the BATCH is closed when a span
of hours/minutes is elapsed.
• ACTION ON CHANGING SHIFT(NONE/ENABLE): this function can be used to close
the batch automatically at the end of each shift defined in the G
S
HIFTS menu (see para. 6.3). This function works for all active batches and not
just the current one.
ATCH closes automatically.
LOBAL SETUP -->
4.3 Tracing data request TAB
In the T
K-field parameters having B
dification).
RACING DATA REQUEST window the user has to insert the initial value only for
EHAVIOUR set on STATE (input data valid until the next mo-
- 41 -
Page 42
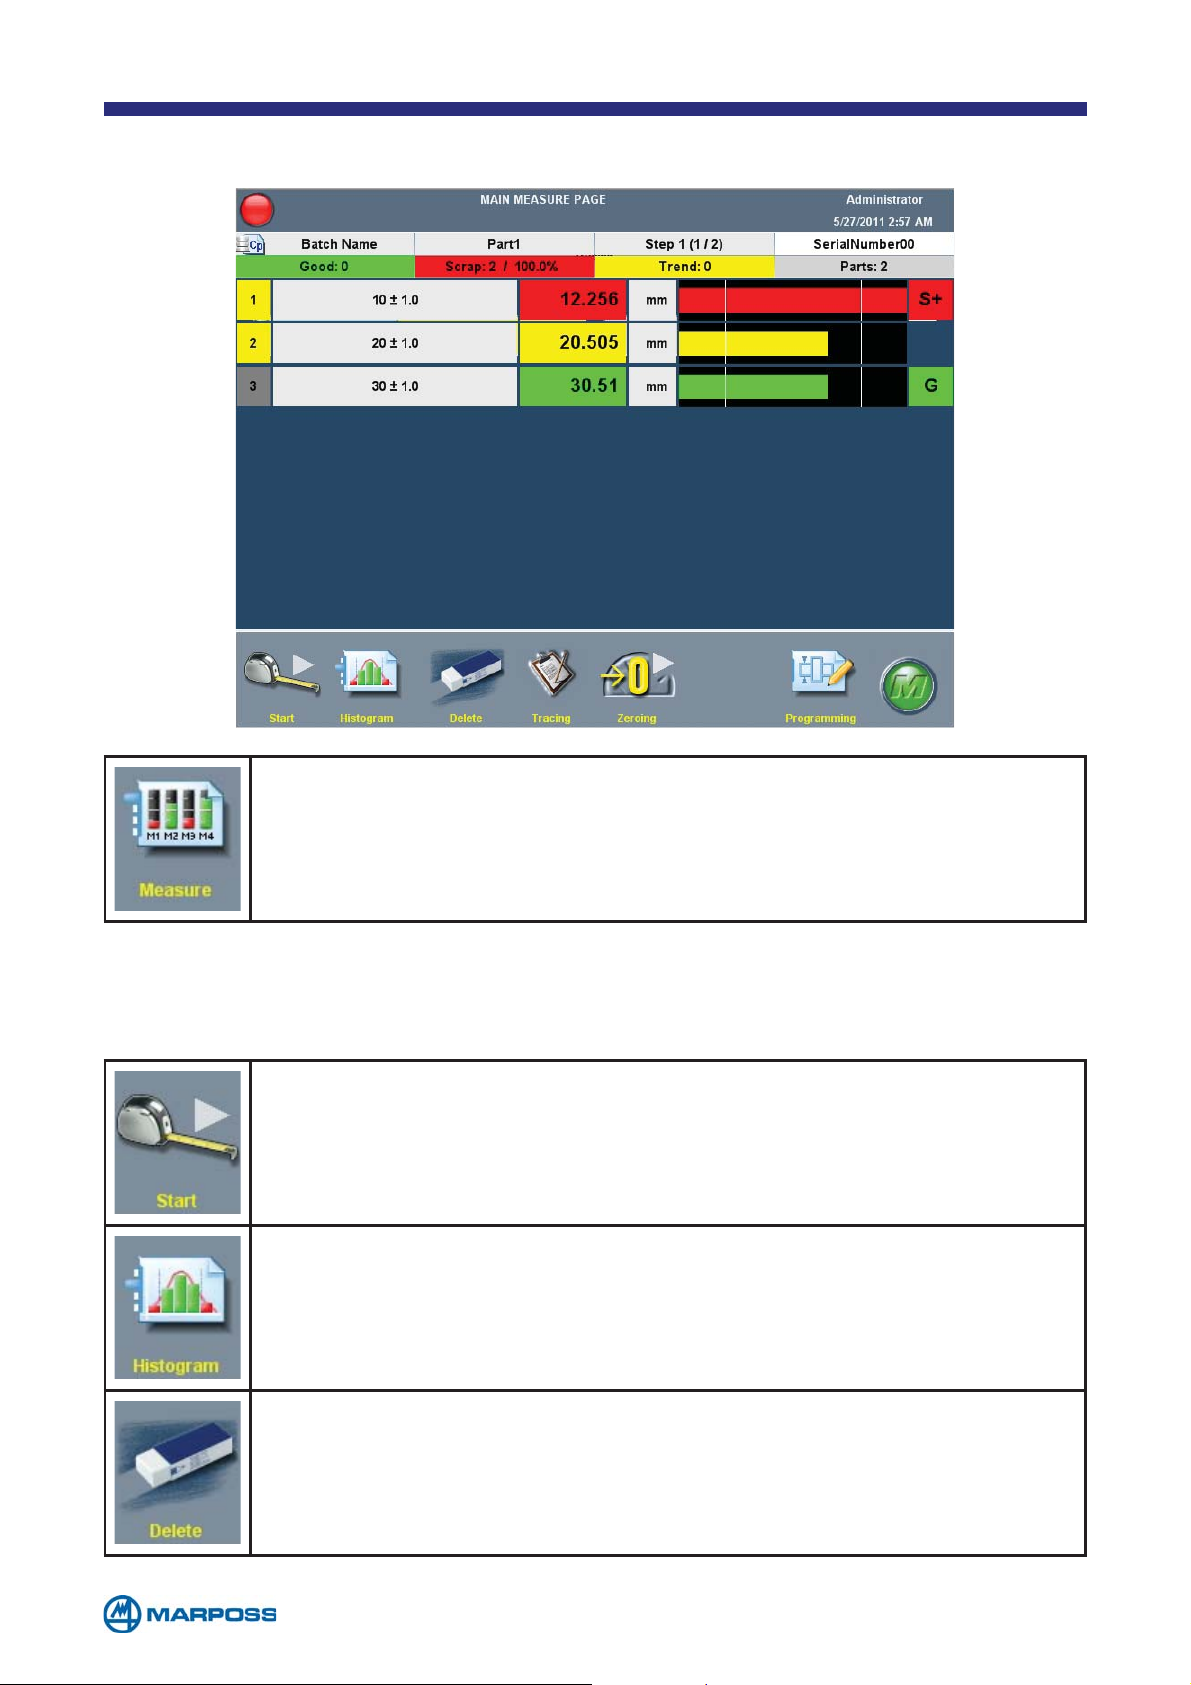
5 MEASUREMENT PAGE
Tap MEASURE to access the MAIN MEASURE PAGE. This page allows the
user to view the measurements acquired by the device connected
to the Merlin in real time.
Up to 16 measurements can be displayed simultaneously, if there are more than 8
measurements they are arranged in two columns.
Tap the START button to start a measurement sequence. If more than
one measurement step was set up during the programming phase,
tap the same button to proceed step-by-step.
Tap the HISTOGRAM button to modify the display by activating the histogram.
The DELETE function enables the user to delete the last acquisition.
If this button is tapped during a stepped acquisition, the operator
can decide whether to delete the last step only or all the preceding
ones, (limited to the steps associated with the last part).
- 42 -
Page 43
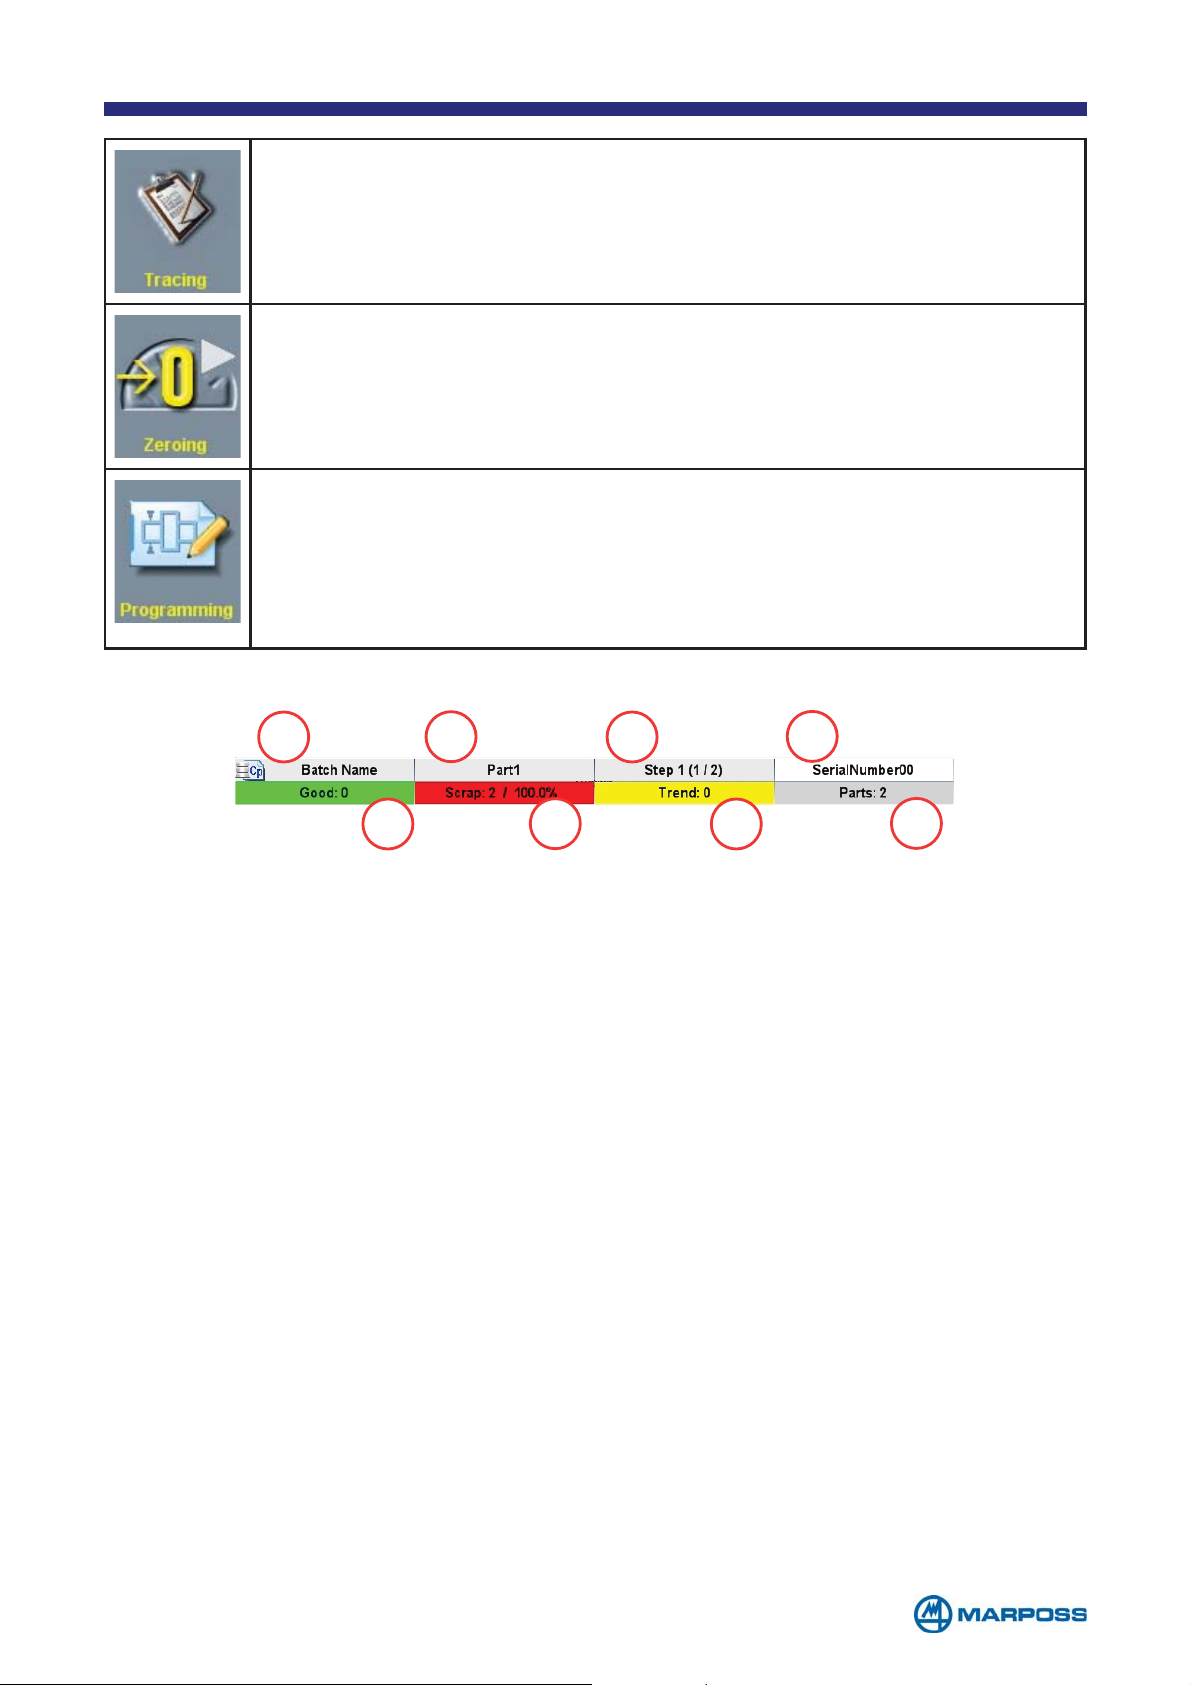
Tap the TRACING button to insert the TRACING DATA.
Tap on ZEROING to carry out the device electrical zeroing procedure.
Tap on PROGRAMMING to access the current PART PROGRAM programming
phase (see para. 3.2.5). Tap on the C
(yellow or grey) to access the programming phase for the corresponding
C
HARACTERISTIC directly. The modifications have an immediate effect on
the measurement process
HARACTERISTIC identification number
1
2
5
1. Name of active B
2. PART PROGRAM name
3. S
4. Last S
5. G
6. S
7. T
8. Total number of measured parts
TEP name (STEP 1 of 2)
ERIAL NUMBER inserted if it is programmed in the TRACING DATA page
OOD: Number of GOOD parts / percentage of GOOD parts
CRAPT: Number of SCRAPT parts / percentage of SCRAPT parts
REND: Number of TREND parts / percentage of TREND parts
ATCH
6
3
7
4
8
- 43 -
Page 44
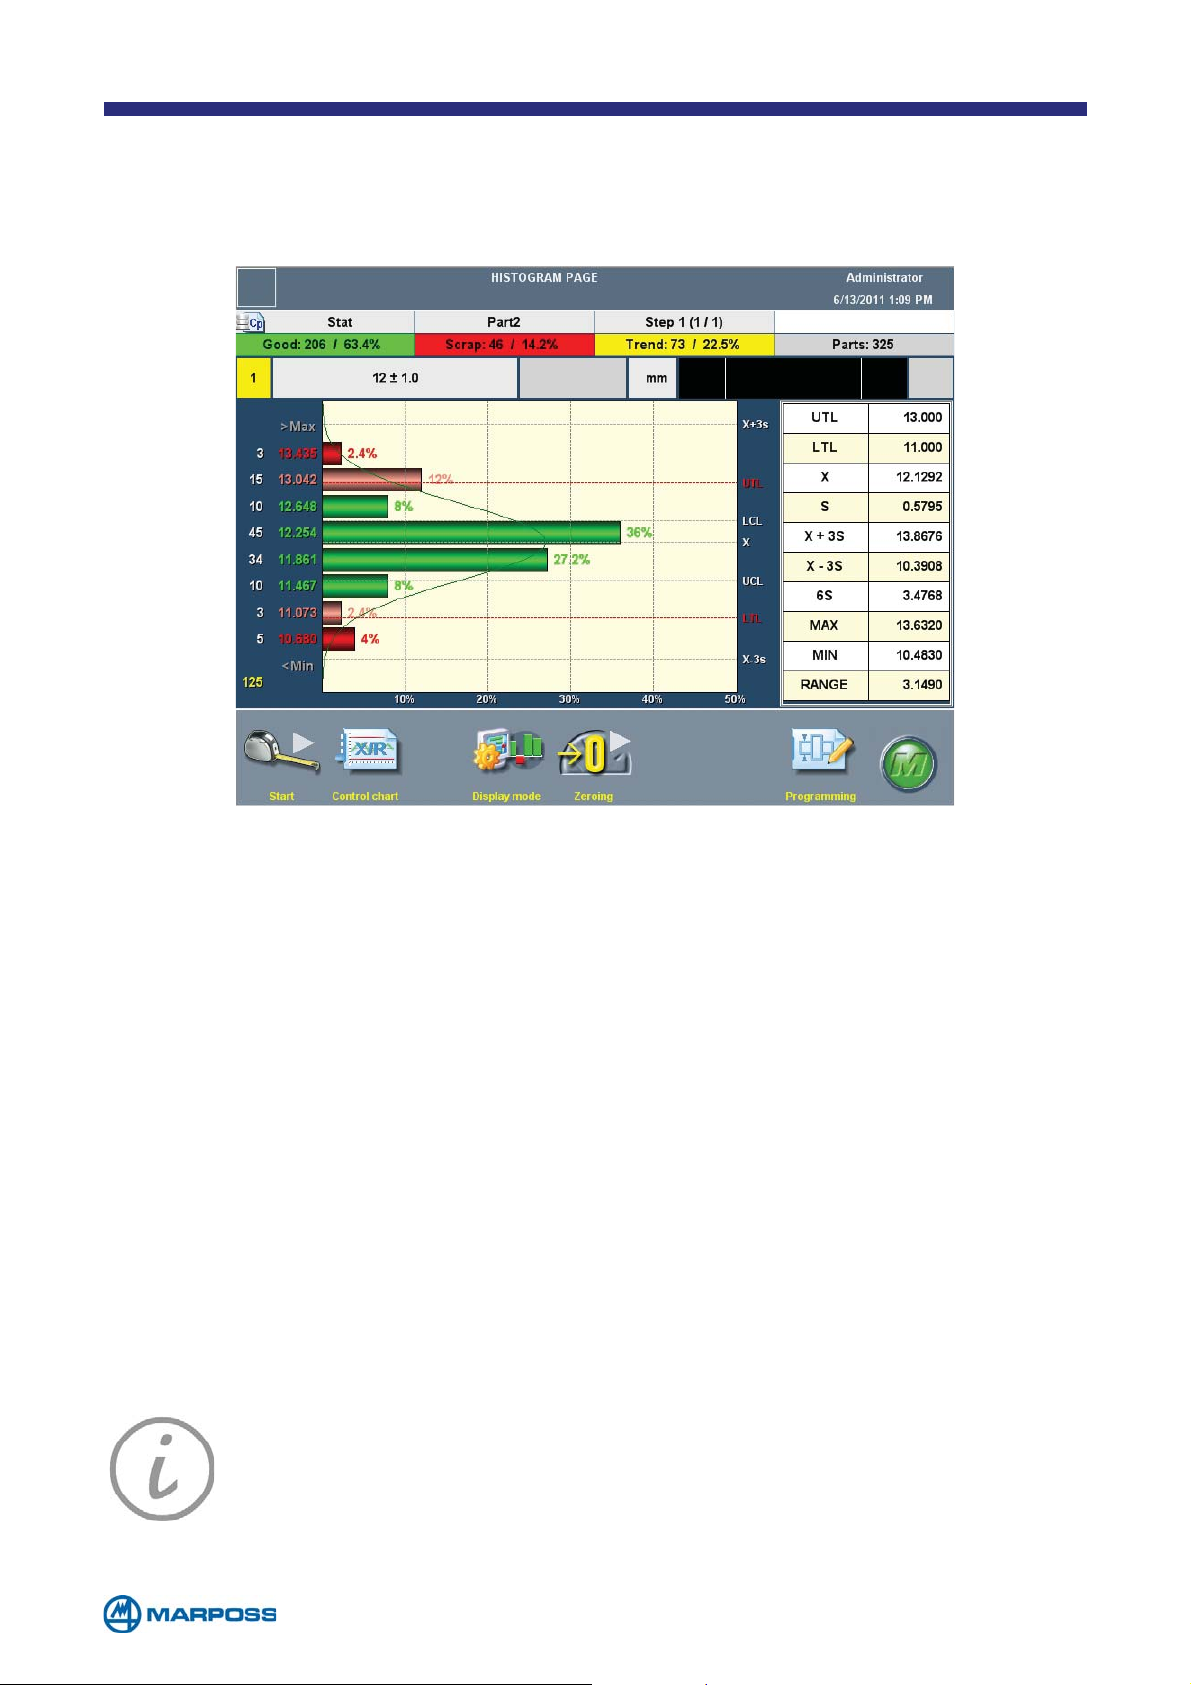
5.1 Histogram
The HISTOGRAM page allows the user to view the HISTOGRAM as well as executing acquisition cycles in the same way as on the M
AIN MEASURE PAGE.
In addition to the measurement bar and the H
ISTOGRAM graph, this page also in-
cludes summary table containing statistical parameters for the data stored in the
current B
The execute measurement S
same as on the M
• tap the C
• tap the T
• tap this button to display one or more C
ATCH.
AIN MEASURE PAGE.
ONTROL CHART button to display the page containing the BATCH in use.
RACING button to insert the TRACING DATA.
rement bar and H
TEP, delete and modify programming functions are the
HARACTERISTICS, complete with measu-
ISTOGRAM, on the same page. When you are using the dual
characteristic configuration, the table containing the statistical evaluations is
automatically hidden in order to simplify the display.
• it enables the O
RISTICS.
• Tap P
ROGRAMS to view the PART PROGRAM DEFINITION page and access the programming
PERATOR to navigate among the various programmed CHARACTE-
phase (see paragraph 3.2.5).
NOTE: Green: Measurement within tolerance
Red: Measurement outside tolerance
Pink: Measurement at tolerance limits
Grey: Invalid measurement
- 44 -
Page 45
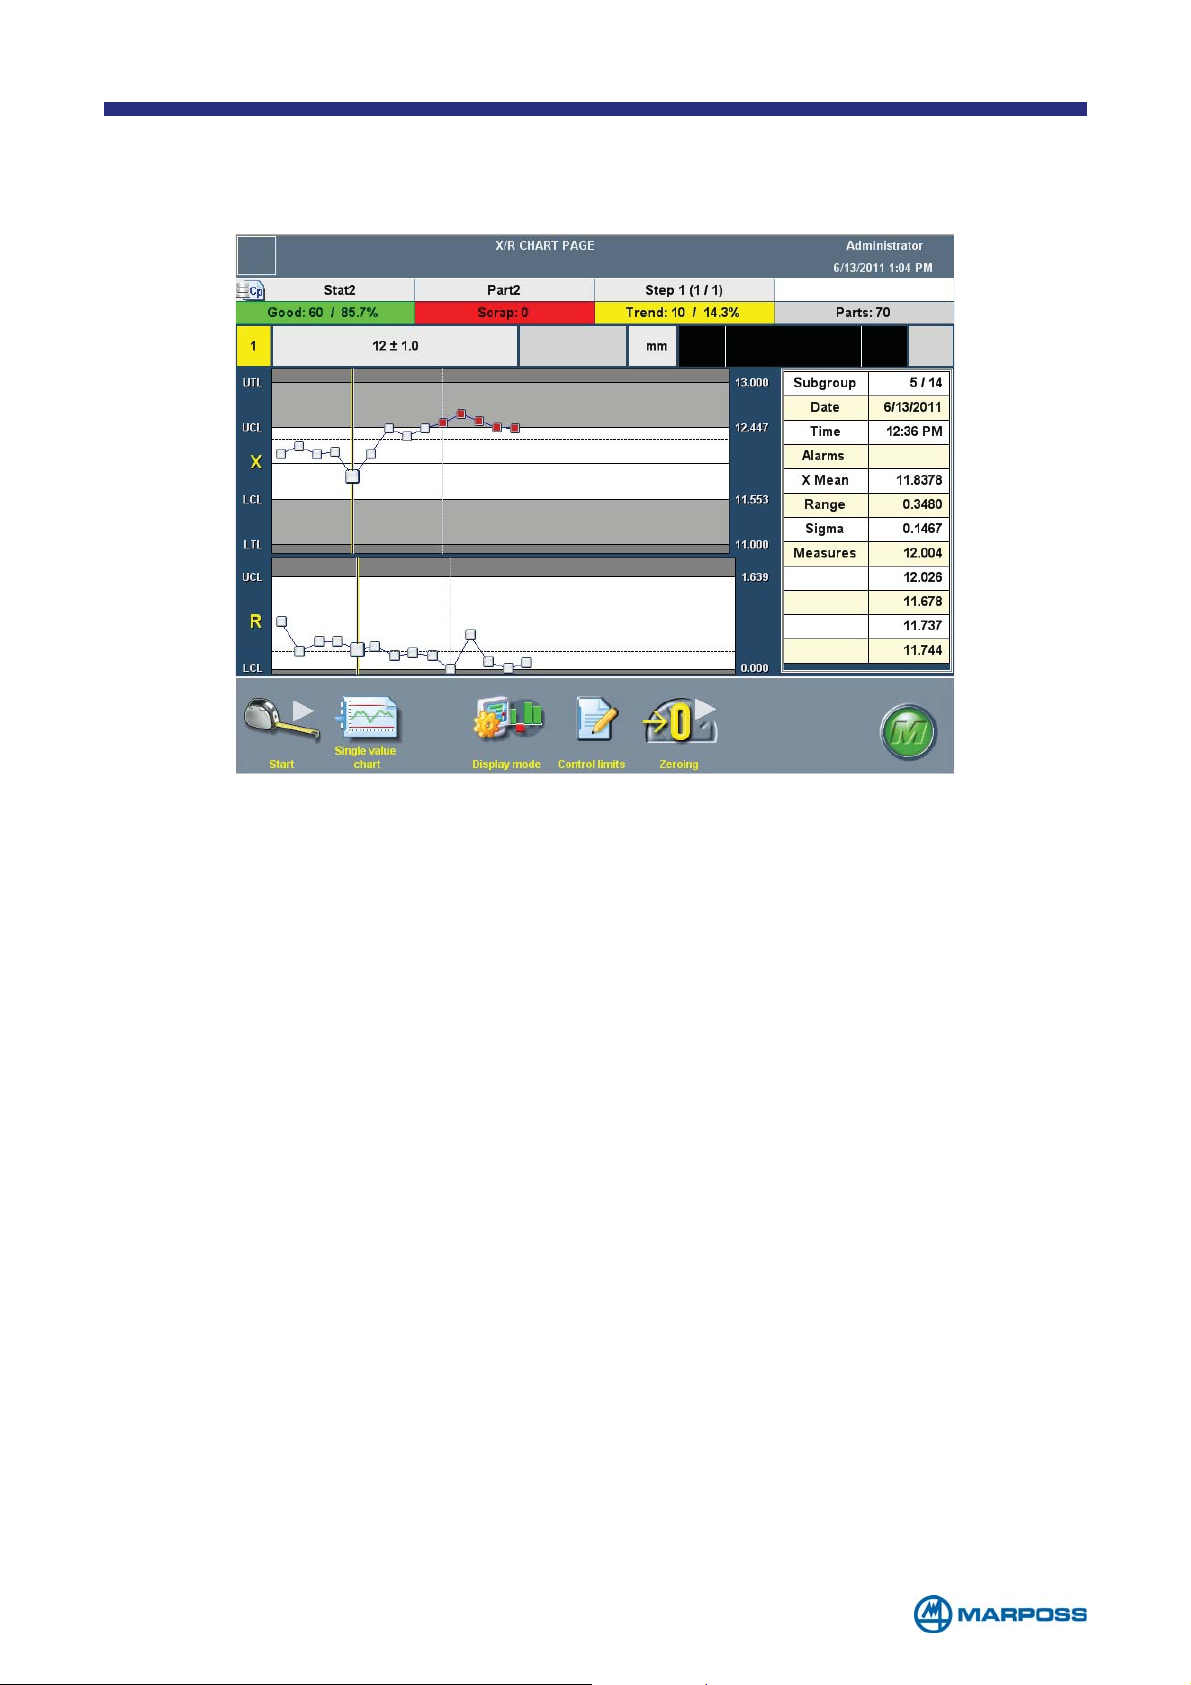
5.2 Control chart
Use the CONTROL CHART page to view the graph and carried out acquisition cycles.
The adjacent table contains the numerical statistical results corresponding to the
C
ONTROL CHART. The executed measurement STEP, delete and modify PROGRAMMING
functions are the same as on the M
• S
UBGROUP: tapping on any points of the chart, it is possible to get more informa-
AIN MEASURE PAGE.
tion on the subgroup represented. Information like samples value and alarms
are shown on the table available on the right side of the screen.
• S
• T
• D
• C
• Z
INGLE VALUE CHART: tap this button to display the page containing the SINGLE
VALUE CHART for the BATCH in use.
RACING: tap the TRACING button to insert the TRACING DATA.
ISPLAY MODE: tap this button to change the displayed charts from X/R to X/S.
ONTROL LIMITS: tap this button in order to modify the chart control limits.
EROING: tap on ZEROING to carry out the device electrical zeroing procedure.
- 45 -
Page 46
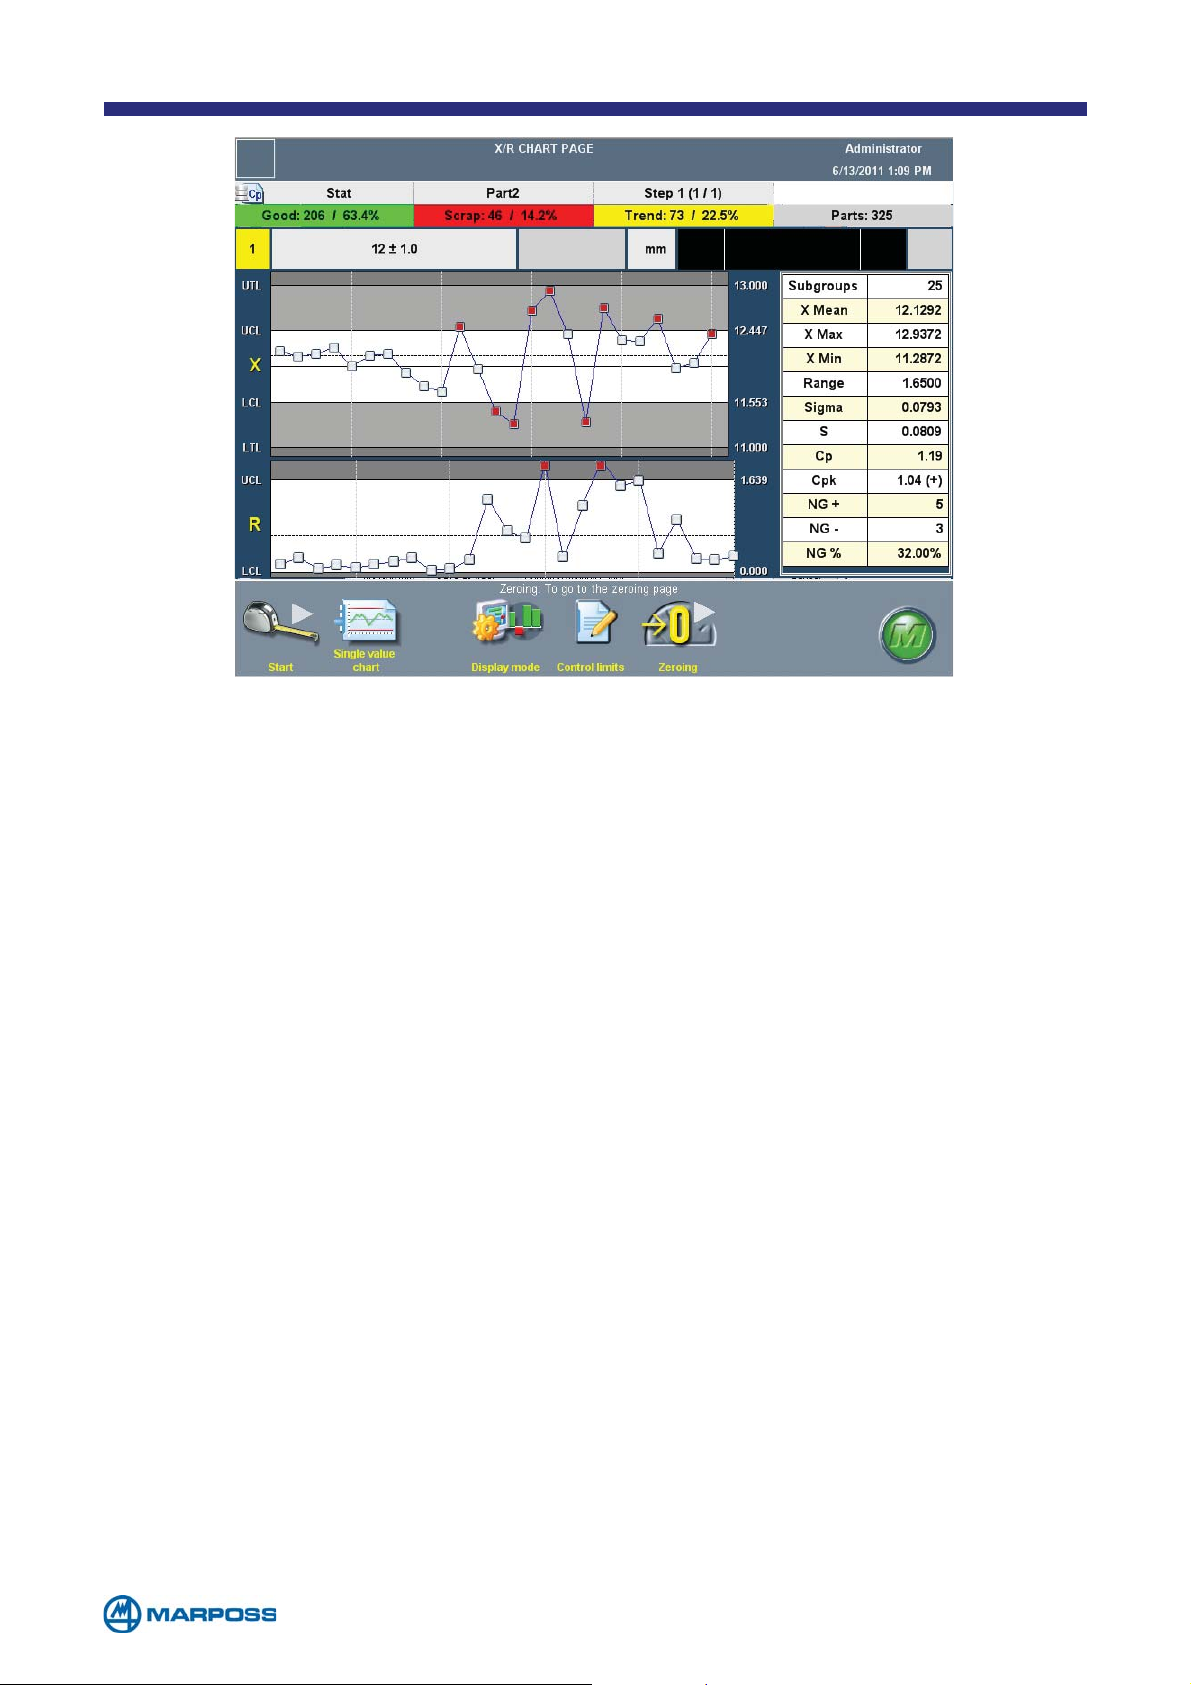
By means of the statistic alarms management the system notifies if there are unusual patterns or trends in C
ONTROL CHARTS, which could be evidence of wrong beha-
viour during the production.
The alarms refer to:
• Exceeding of C
ONTROL LIMITS
• RUNNING ALARM on XR/S chart (i.e. seven points in a row on one side of the middle
line between C
• T
REND ALARM on XR/S chart (i.e. seven points in a row that are consistently incre-
ONTROL LIMITS)
asing or decreasing)
• M
IDDLE THIRD ALARM on XR/S chart (i.e. normal distributions have generally about
2/3 of the points within the middle third of the region between the C
ONTROL LIMITS
and about 1/3 will be in the outer two/thirds of that region, if this does not happen there could be a problem on C
ONTROL LIMITS values).
- 46 -
Page 47
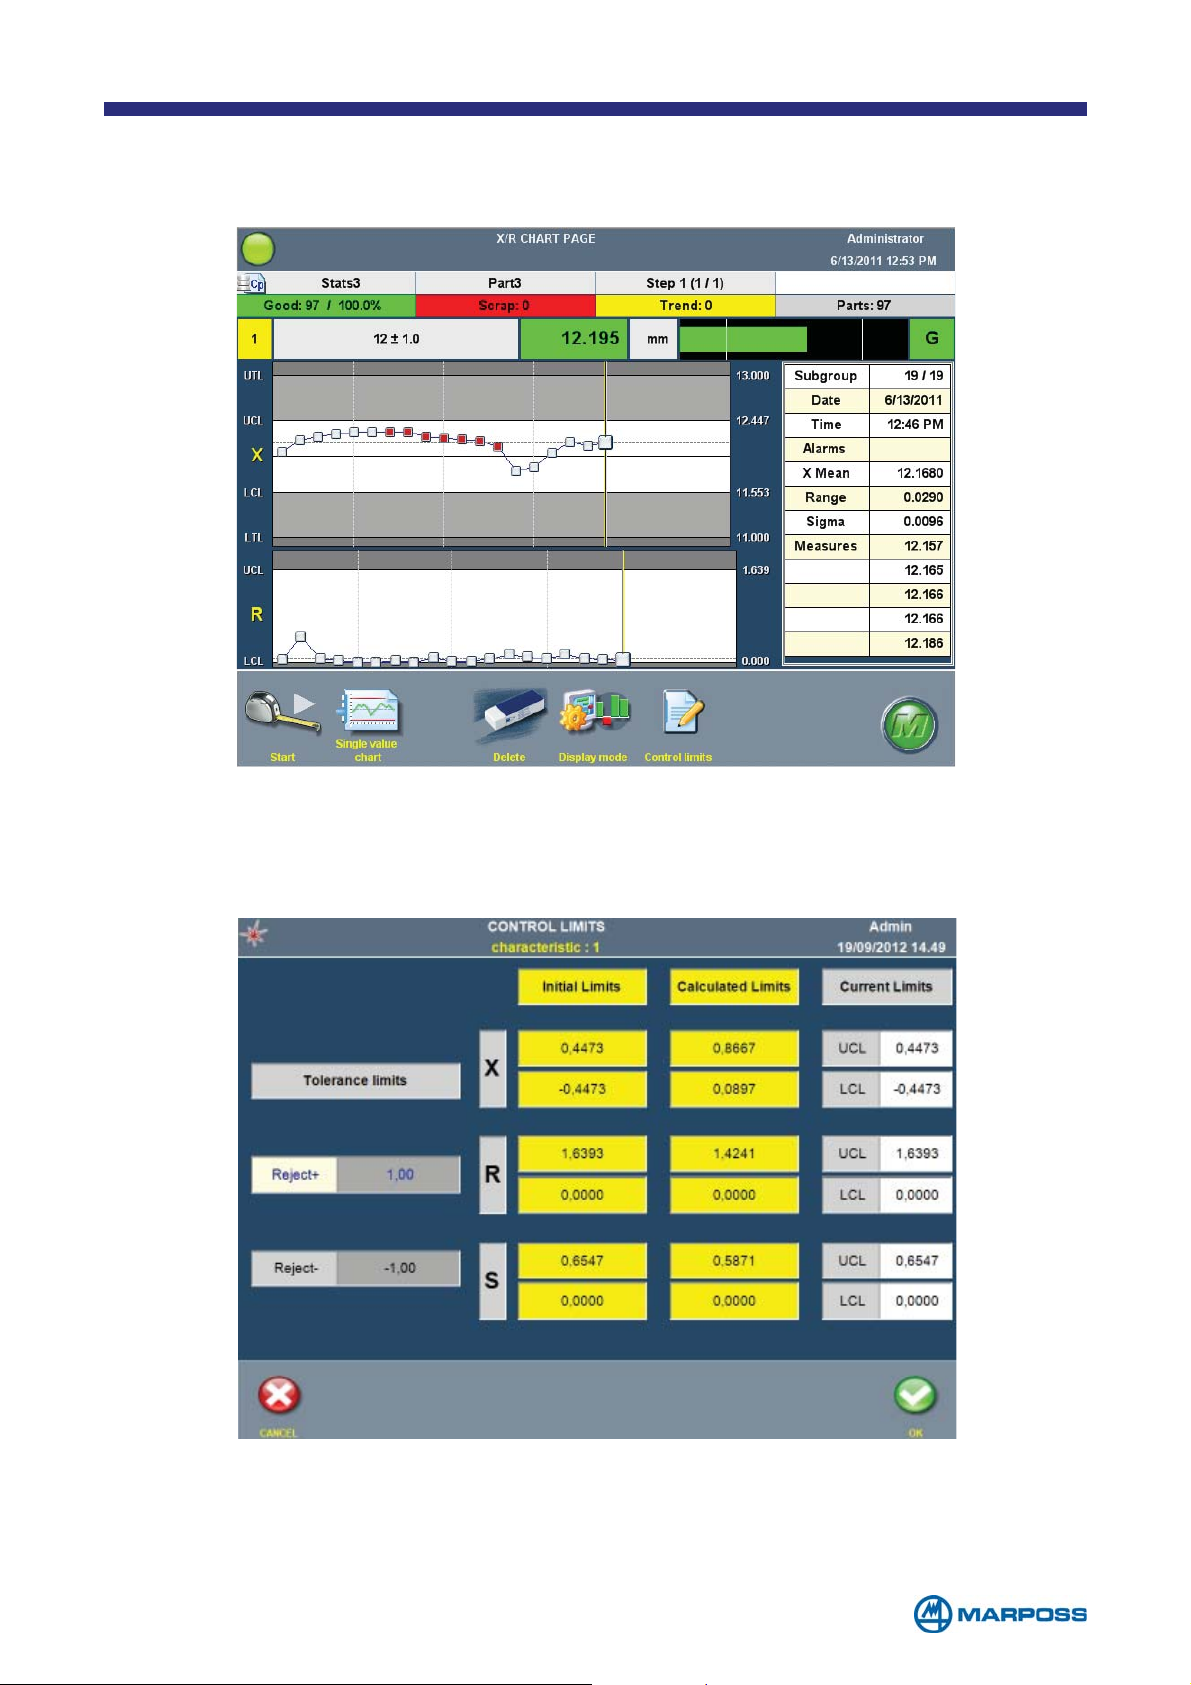
As soon as a subgroup causes an alarm condition, the CONTROL CHART is updated
with red dots in correspondence of the subgroup in alarm condition.
5.2.1 Control limits page
The control limits page may only be accessed when it is working with a batch and if the
X/R control chart has been enabled.
This table displays the pre-set control limits (these limits are calculated automatically by
the software depending on the programming that has been carried out, the tolerance
limits, etc.), the calculated limits (the software updates these limits at regular intervals,
- 47 -
Page 48
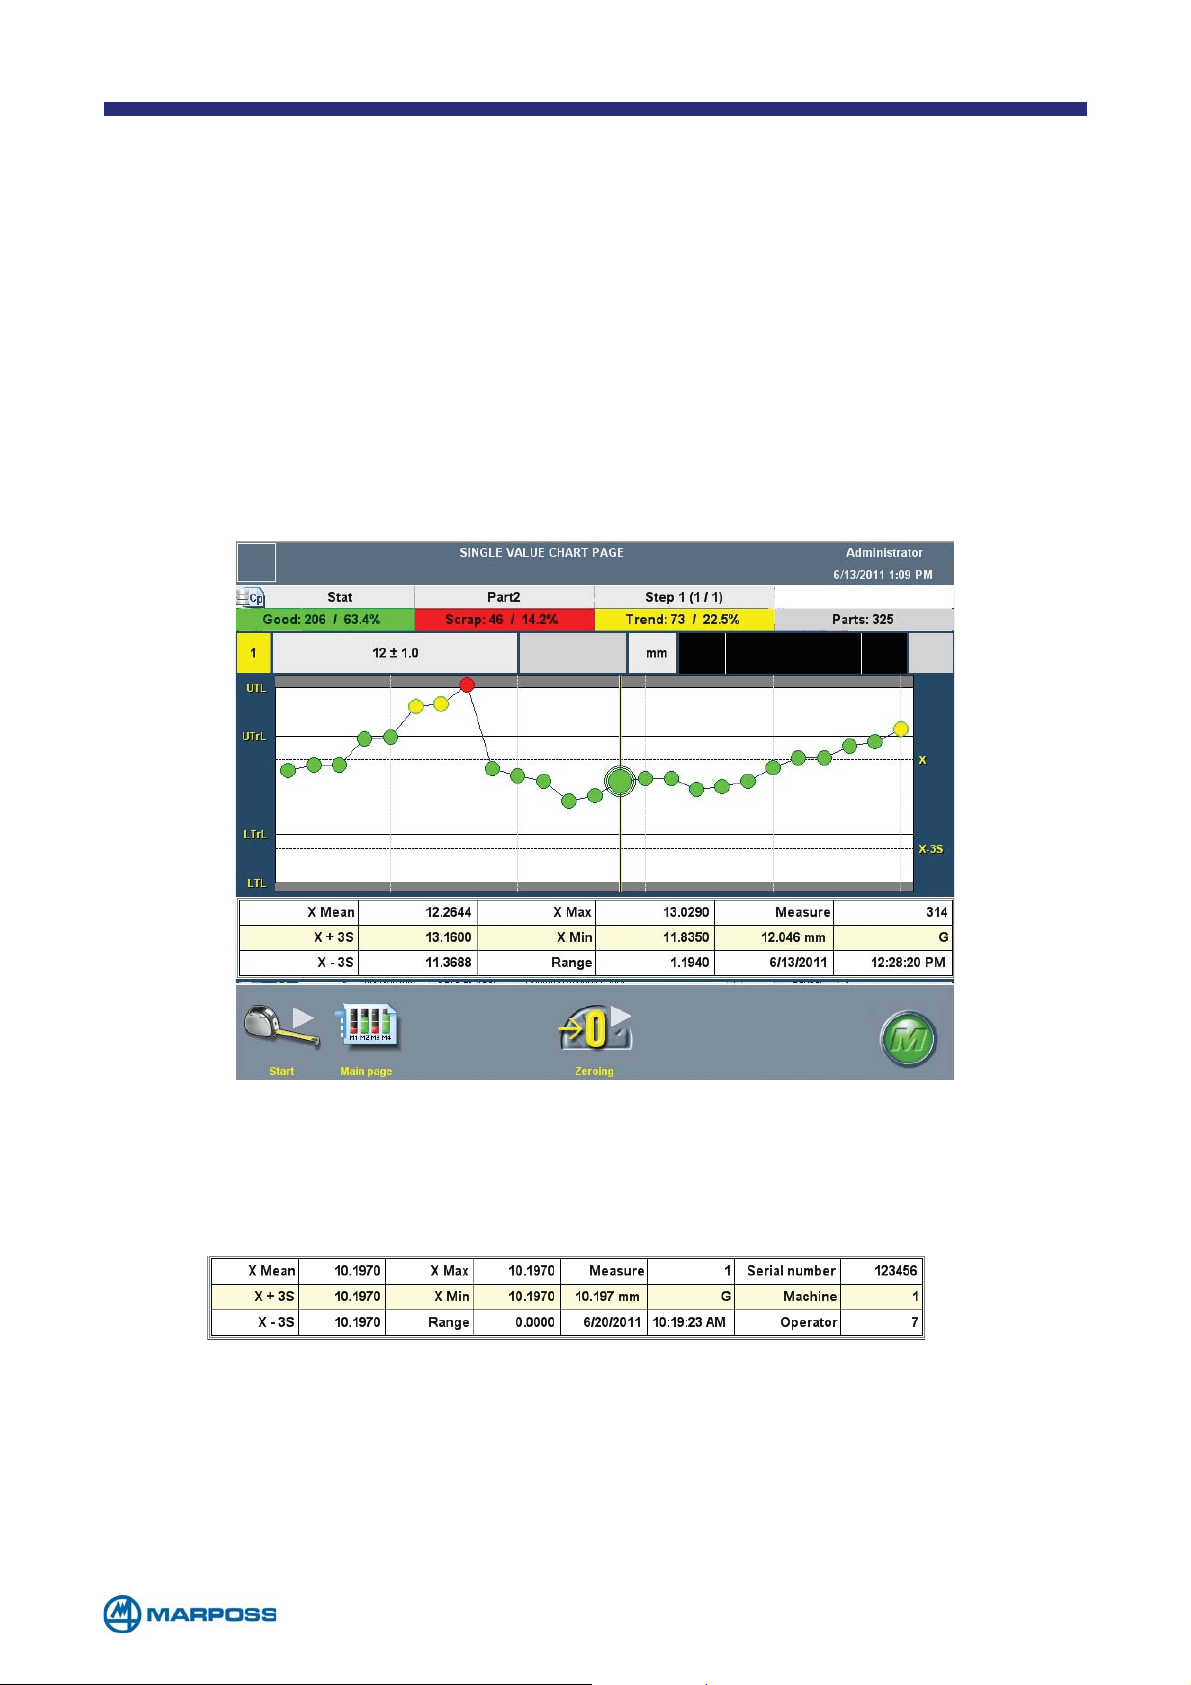
depending on the measurement results) and the current limits (the limits that are currently
in use). The latter limits can be set-up manually by tapping on the corresponding field.
To select the calculated limits as the current limits, simply tap on the field in the desired
calculated limits column.
5.3 Single value chart
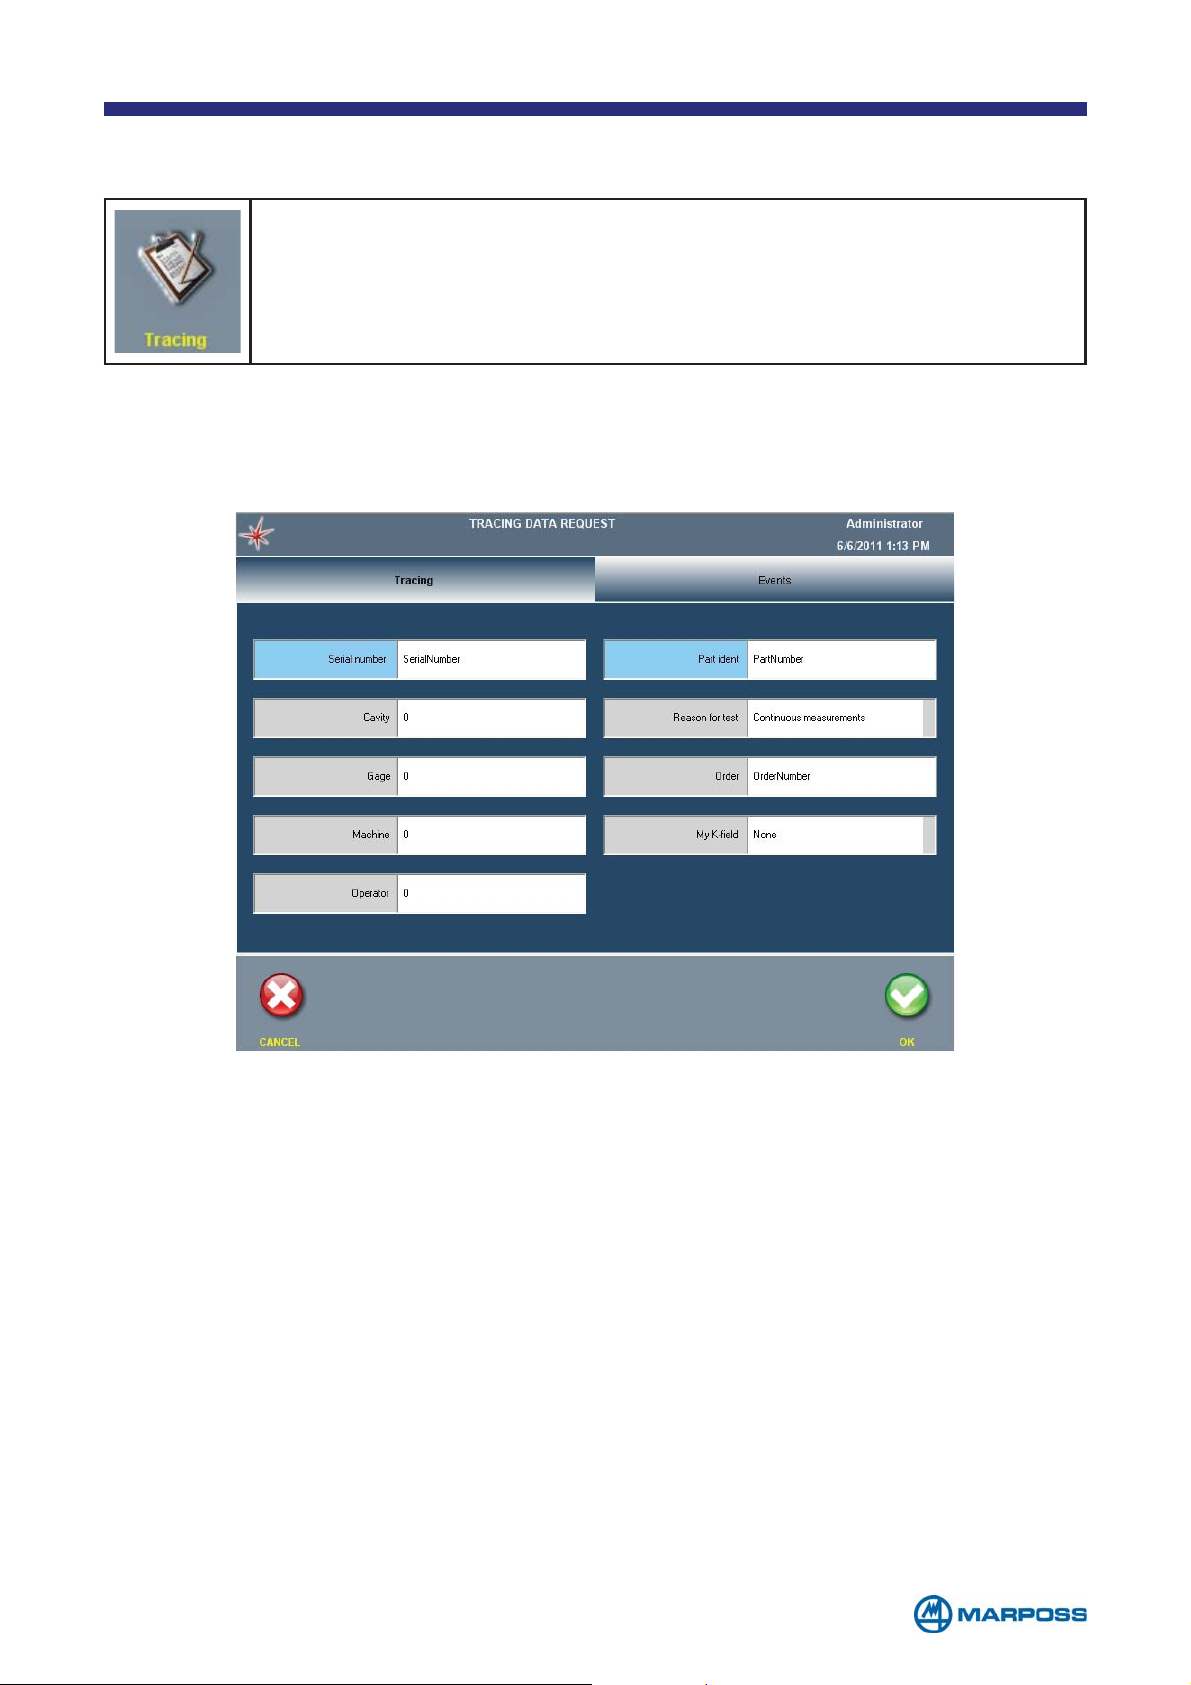
The SINGLE VALUE CHART PAGE displays information for each single acquisition. This can
be easily done by pointing and tapping directly on the chart; the data are reported
on a grid located underneath the chart itself. This chart must be enabled using the
G
LOBAL SETUP form, defining the number of measurements to be displayed (minimum
25, maximum 100).
If a Batch has been defined for data collection, the information displayed under the
chart includes the first three T
values of these data are entered by the T
RACING DATA defined for the PART PROGRAM in use. The
RACING DATA REQUEST window (see paragraph
4.3).
- 48 -
Page 49
5.4 Tracing data request
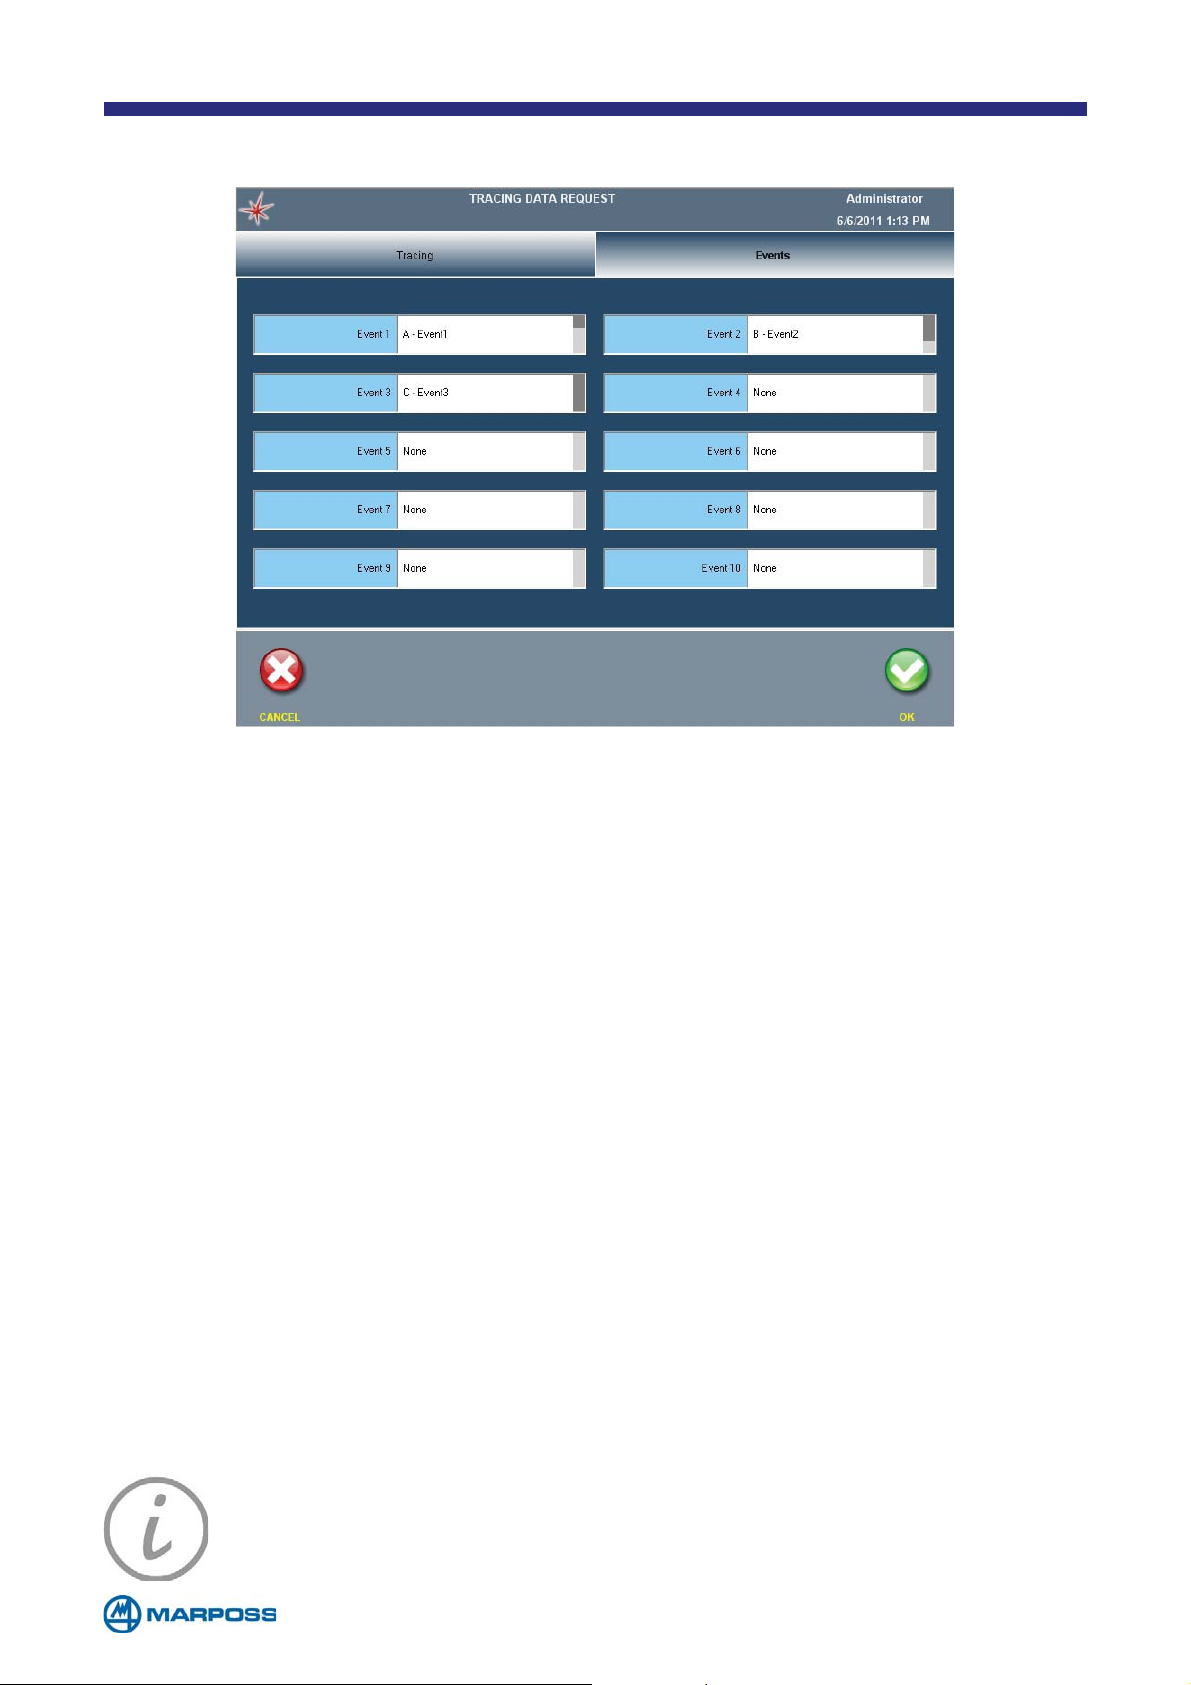
In order to trace production, the operator may append additional
information to the completed measurements by using the T
button; this button opens a request form that is split into two tabs:
T
RACING e EVENTS.
The first TAB contains all the data required for the current part-program, with the
exception of the N.9 Event datum.
The data defined with B
EHAVIOUR = EVENT are highlighted in blue.
RACING
- 49 -
Page 50
The EVENTS tab contains the list of possible values for the N.9 Event datum.
For both tabs, select the desired values and confirm by tapping the OK key.
The following paragraphs provide a detailed description of how it works the Tracing key functions for the various measurement pages.
The T
RACING button enables the operator to set up new tracing data and insert new
events associated with the measurement in progress. A message also appears
under the title of the T
RACING DATA REQUEST form indicating whether the information
that has been inserted is associated with a new measurement, or the last measurement to be completed.
NOTE: The EVENTS TAB is displayed only if the EVENT tracing datum has
been enabled with at least two programmed parameters.
- 50 -
Page 51
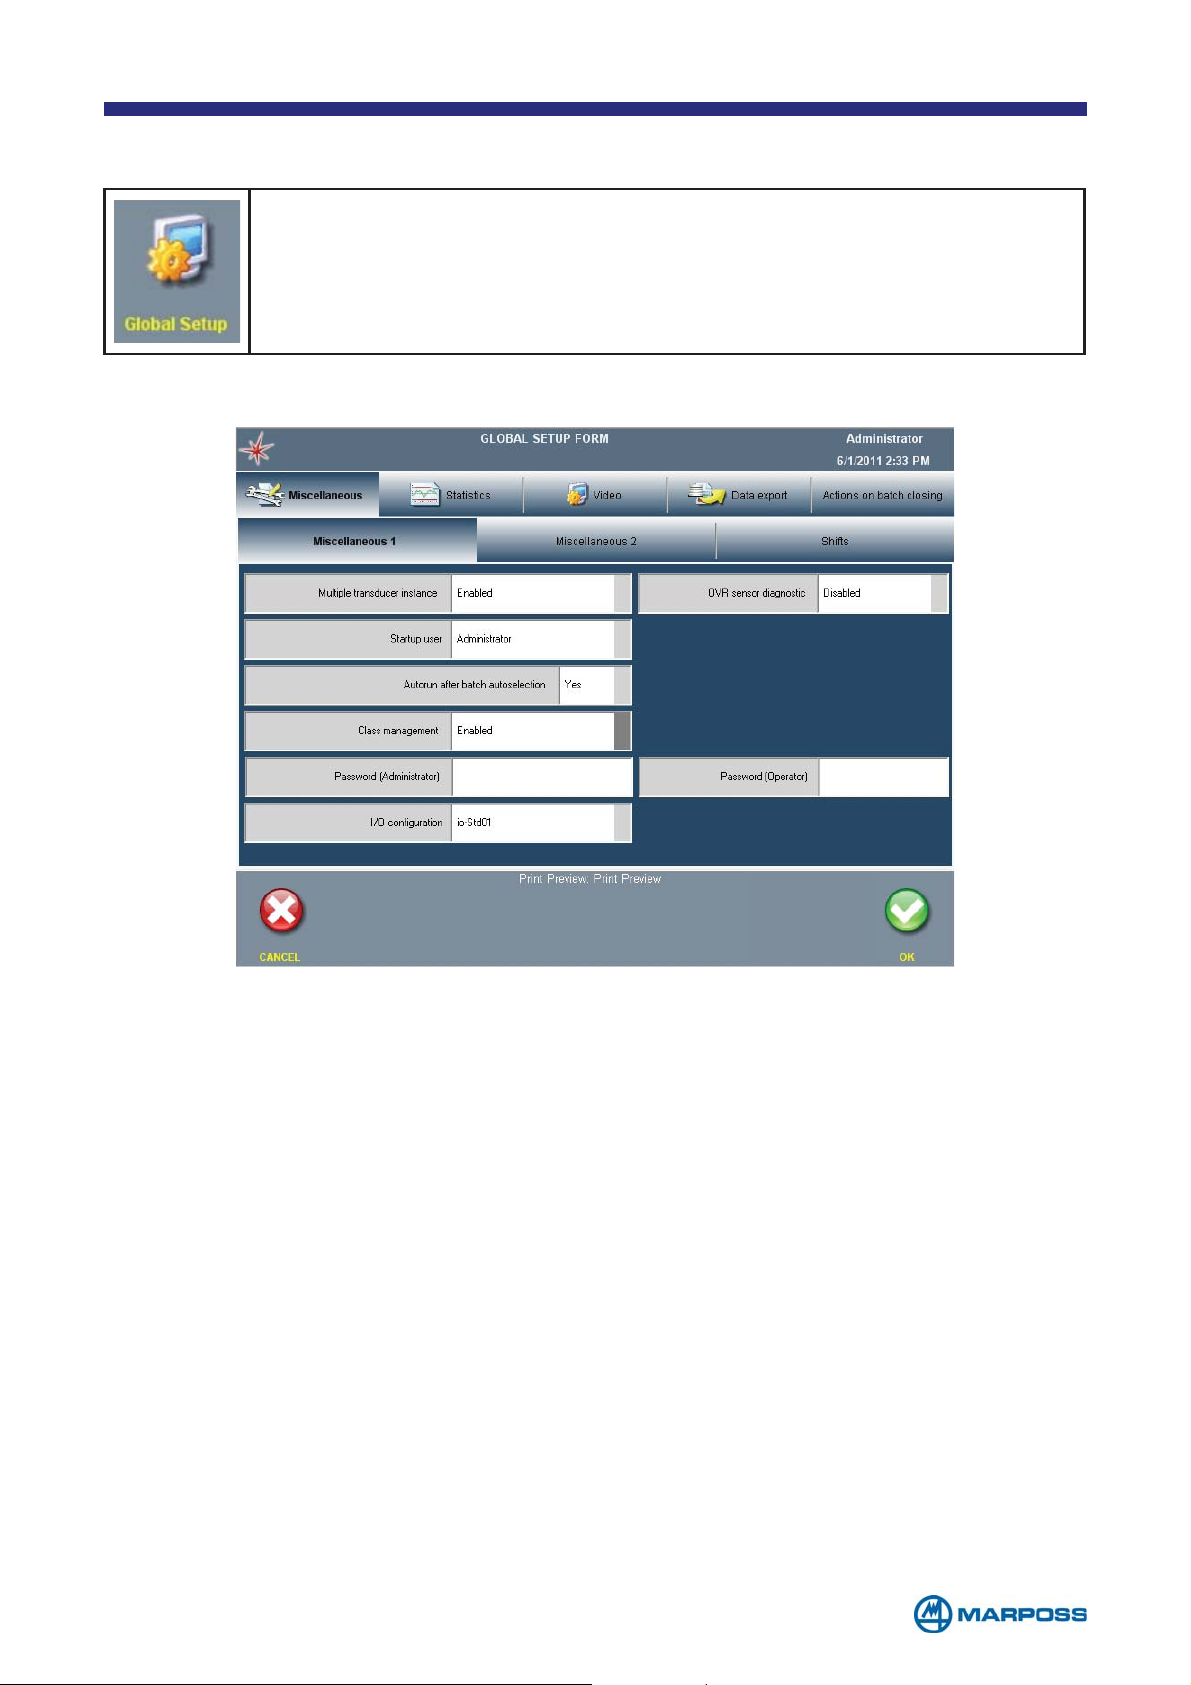
6 GLOBAL SETUP
Tap on the icon shown to access the GENERAL SETUP menu.
6.1 Miscellaneous 1 TAB
• M
ULTIPLE TRANSDUCER INSTANCE: ENABLED, DISABLED
• STARTUP USER: ADMINISTRATOR, OPERATOR
• AUTORUN AFTER BATCH AUTOSELECTION: if it is enabled, this option commands
the measurement cycle to start after the B
transducer (options: Y
• C
• P
• P
• I/O C
LASS MANAGEMENT: it enables the measurement classification (default: DISABLED).
ASSWORD (ADMINISTRATOR): to enter the numerical password for the administrator
ASSWORD (OPERATOR): to enter the numerical password for the operator user
ONFIGURATION: to set the layout regarding to the I/O signal behaviour.
ES, NO)
ATCH is selected automatically by the
- 51 -
Page 52
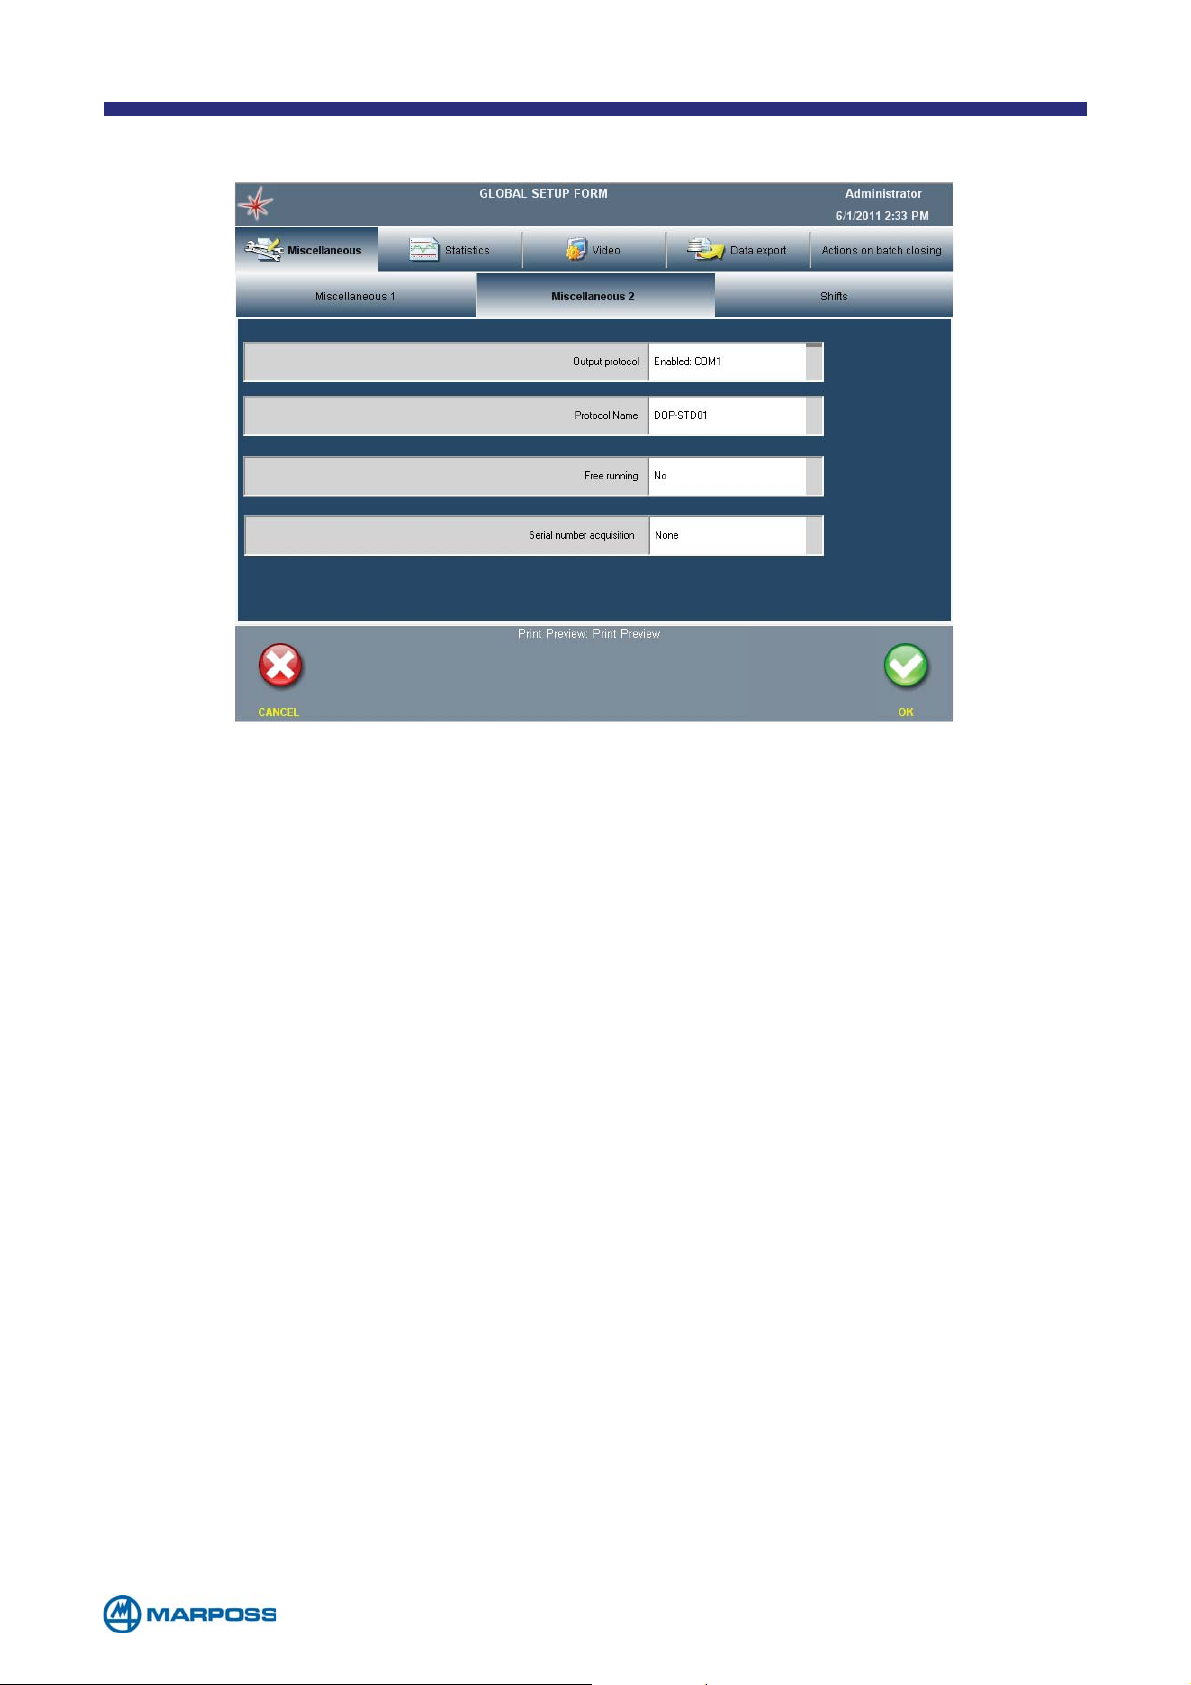
6.2 Miscellaneous 2 TAB
• OUTPUT PROTOCOL: it permits the operator to enable a communication protocol; upon
completion of each measurement, the system transmits the acquired data by a serial,
TCP or UDP port using the selected ASCII protocol. In the case of serial protocols, the
output may use the Merlin Plus serial port or any port on an Easy Box U4S.
• PROTOCOL NAME: name of the protocol in use.
• F
REE RUNNING: This operation mode may be set to YES, so that it is enabled for any
PART PROGRAM or “USER DEFINED” pin in order to enable it for the individual PART PROGRAMS.
The measurement is acquired continuously and registered in correspondence with
the “D
ATO OK” command. In FREE RUNNING it is possible to change the active page,
inserting traceability keys and deleting the current step. All the other functions are
available after activating the “Pause” command.
- 52 -
Page 53
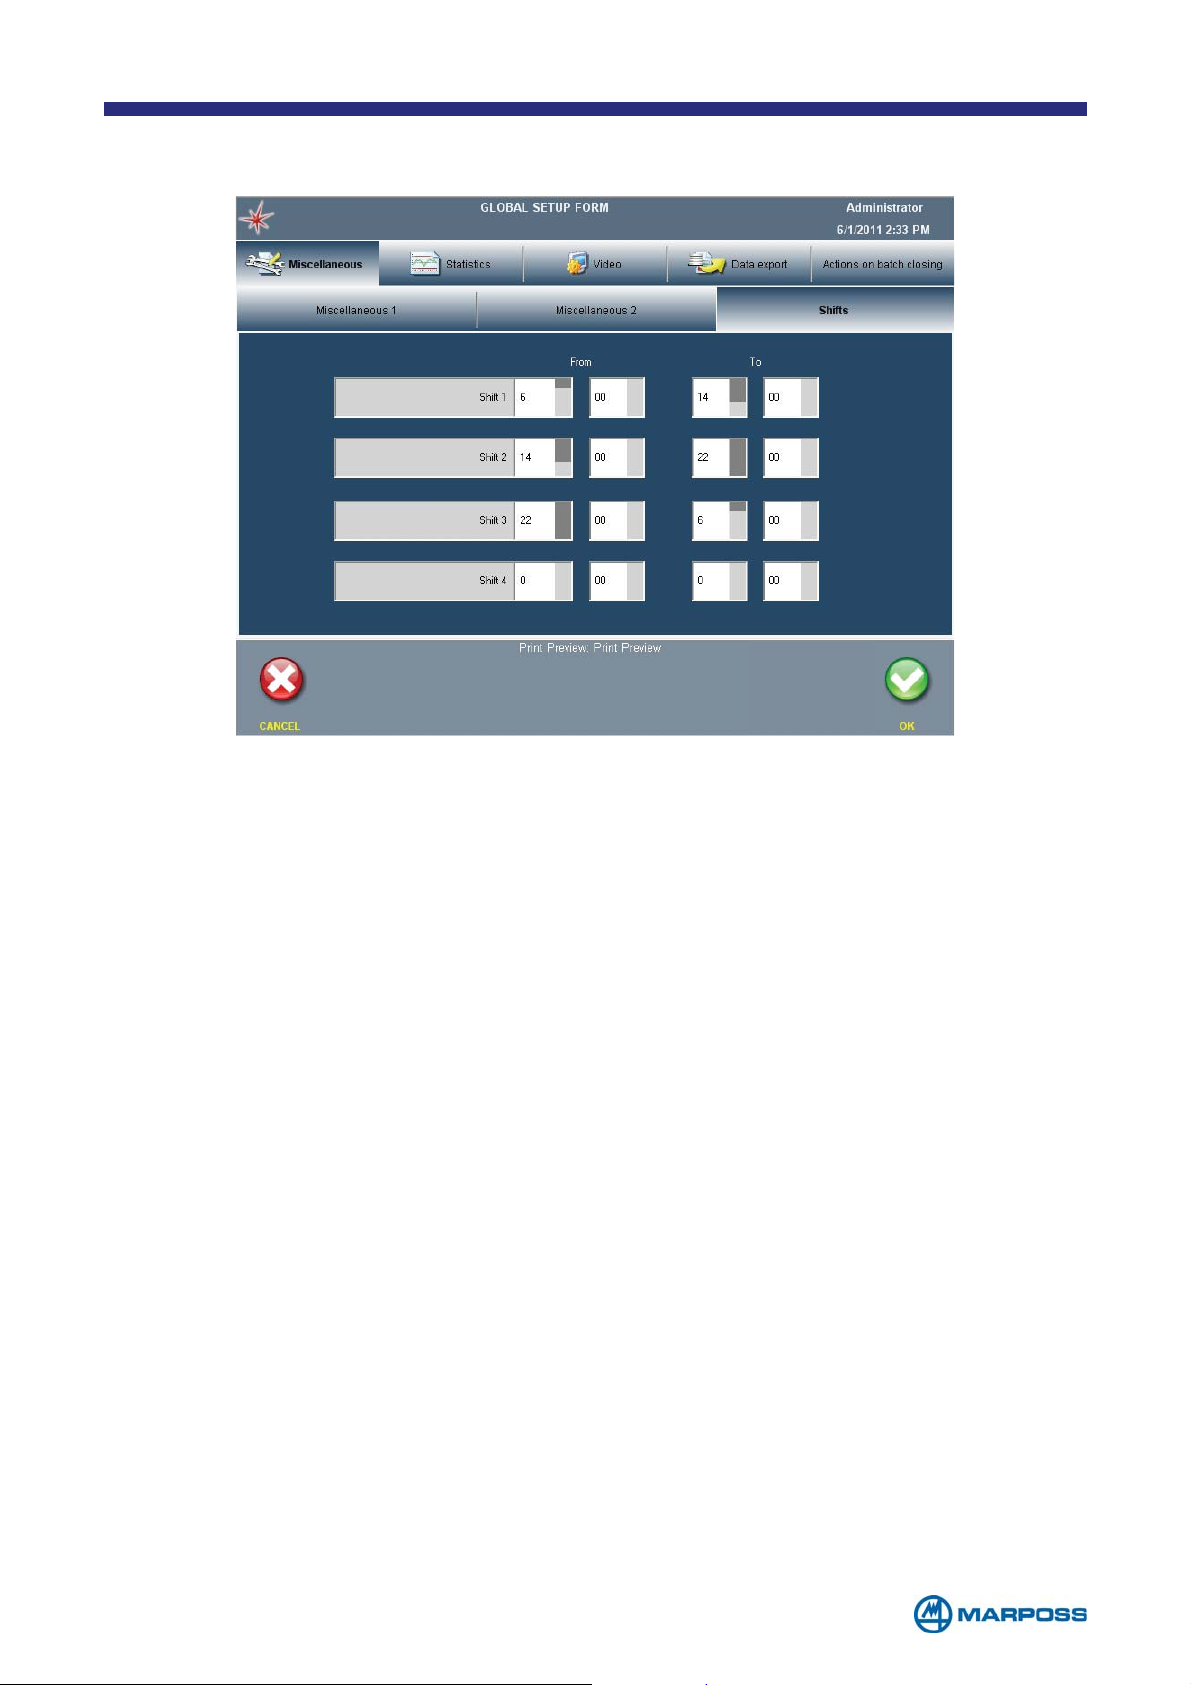
6.3 Shifts TAB
This page can be used to setup a maximum of four working shifts so the system can
perform the following functions when they expire:
• automatic batch closing (see chapter 4.2)
- 53 -
Page 54
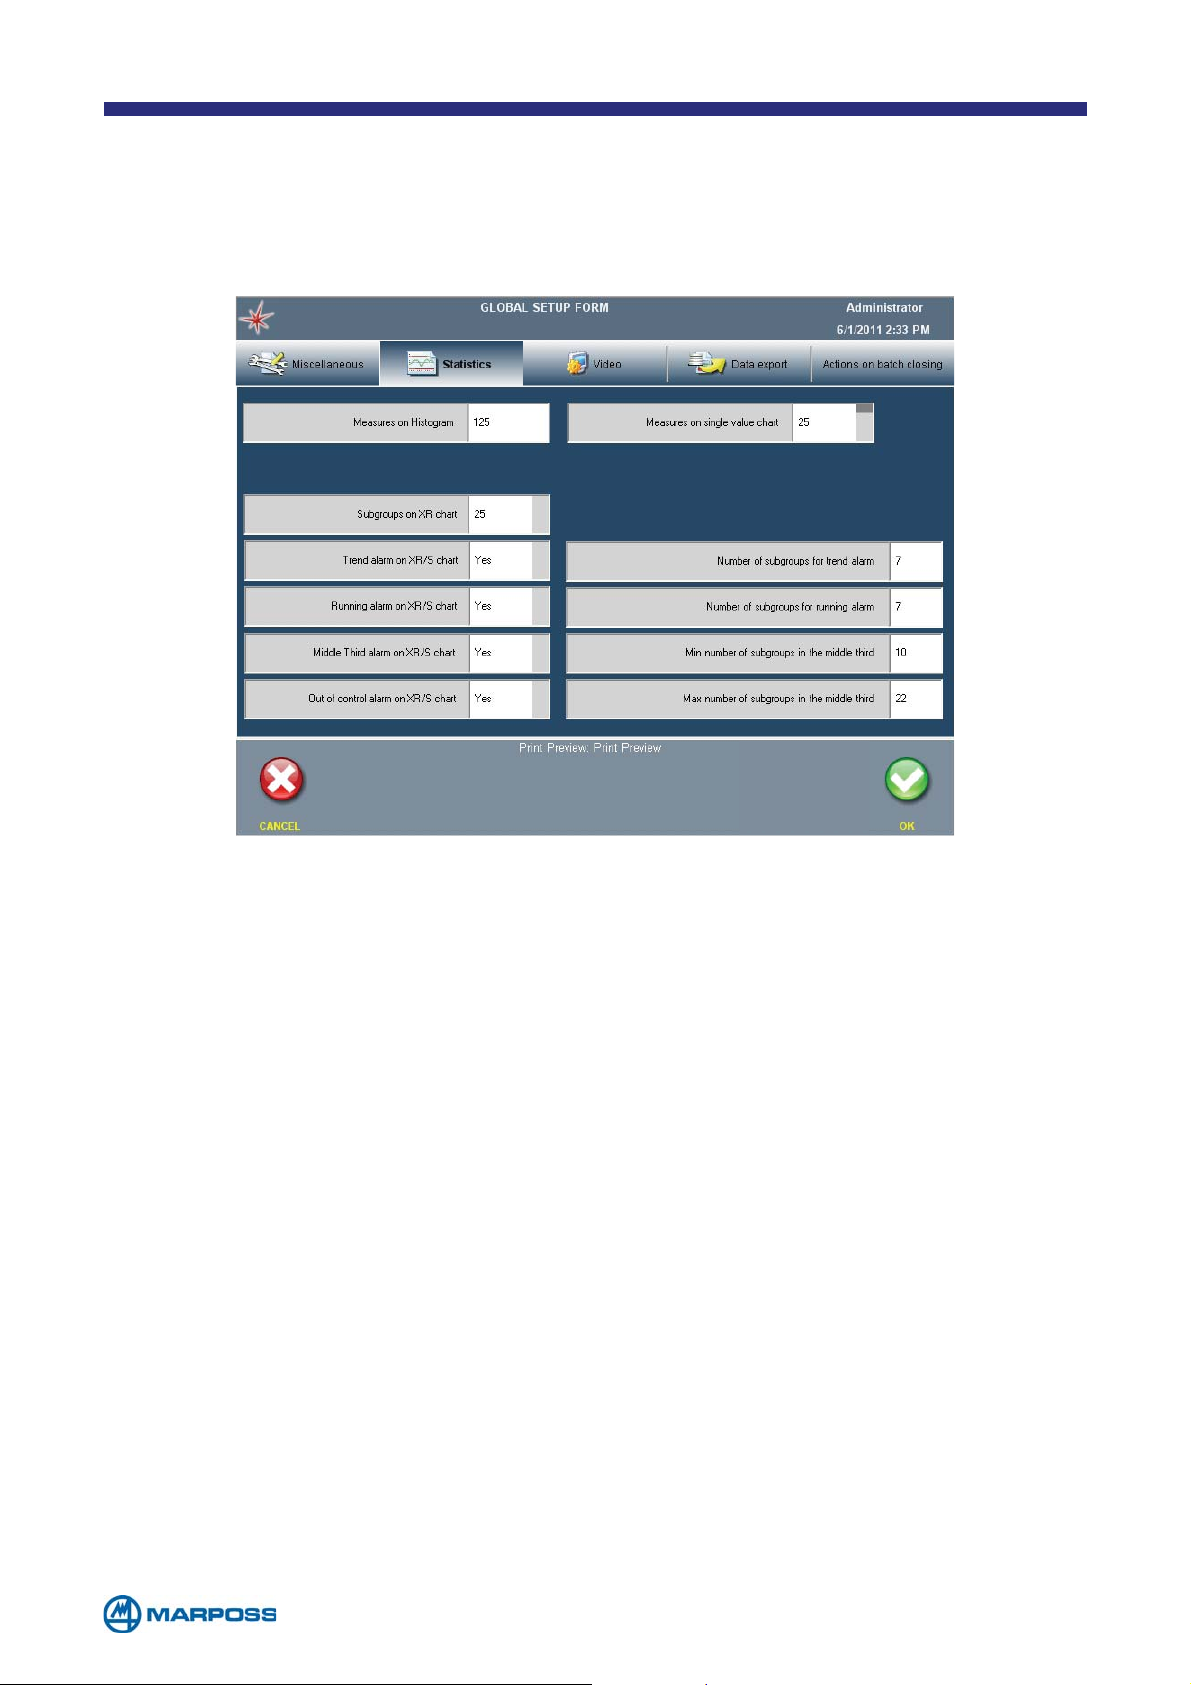
6.4 Statistics TAB
The statistics tab contains all the options that can be used to set-up the
measurement statistics calculation and handle the alarms. These parameters are
ignored unless the measurements are acquired within a batch.
• MEASURES ON HISTOGRAM: maximum number of measurements to be used when
calculating the histogram; maximum value allowed: 1000. This value will be ignored if
the control chart is enabled, and the maximum number of measurements is the same as
required to compile the X/R chart (number of chart subgroups x subgroup dimension).
• M
EASURES ON SINGLE VALUE CHART: number of measurements used to compile
the single values chart. Possible values: none (chart disabled), 25, 50, 75, 100.
• S
UBGROUPS ON X/R CHART: number of samples used to compile the X/R
chart; possible values : 25, 30, 50.
• M
IDDLE THIRD ALARM ON XR/S CHART: it enables the alarm that analyses the “middle third” of
the samples; when this function is enabled, two additional fields are displayed which permit
the operator to define the minimum and maximum values used when calculating this alarm.
• R
UNNING ALARM ON XR/S CHART: it enables the alarm which analyses the samples
“running”; when this function is enabled, an additional field is displayed whichpermits
the operator to define the number of samples used to calculate this alarm.
• T
REND ALARM ON XR/S CHART: it enables the alarm which analyses the samples
“trend”; when this function is enabled an additional field is displayed which permits
the operator to define the number of samples used to calculate this alarm.
• O
UT OF CONTROL ALARM ON XR/S CHART: it enables the alarm which indicates when a sample
is outside the chart control limits; when this function is enabled an additional option (“Sample
Correction”) permits the operator to open a window which displays the correction calculations;
these values represent the difference between the mean value of the sample and the mid-point
of the tolerance range for all of the characteristics which have generated an alarm condition.
- 54 -
Page 55
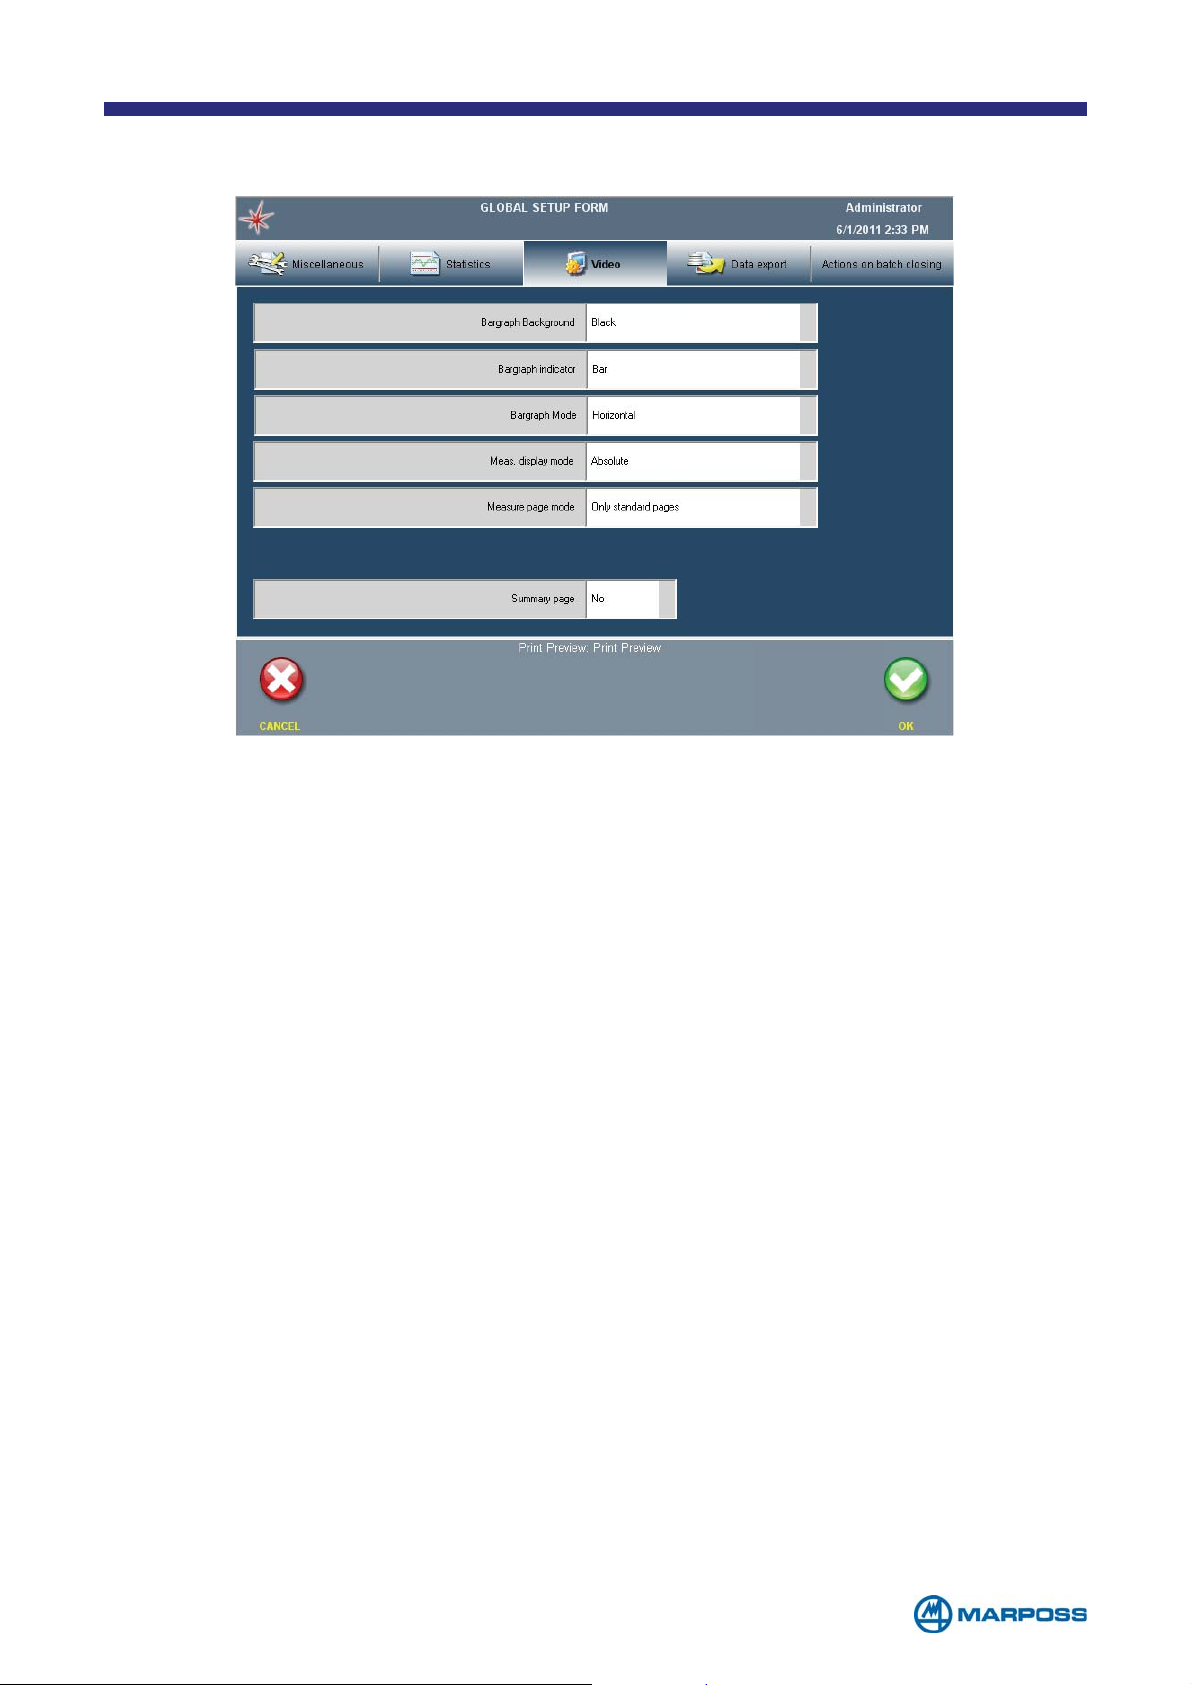
6.5 Video TAB
• BARGRAPH BACKGROUND: BLACK, COLOURED.
• B
ARGRAPH INDICATOR: BAR, CURSOR.
• ABSOLUTE/DISPLACEMENT MEASUREMENT DISPLAY MODE: The measurement is
displayed as an A
BSOLUTE value or DISPLACEMENT with respect to the centre of the
tolerance range.
• M
EASUREMENT PAGE TYPE (ONLY STANDARD PAGES/ALL PAGES): if the ALL PAGES option
is selected the system also displays the “led bars” page in vertical bars format.
• SUMMARY PAGE: YES, NO
- 55 -
Page 56
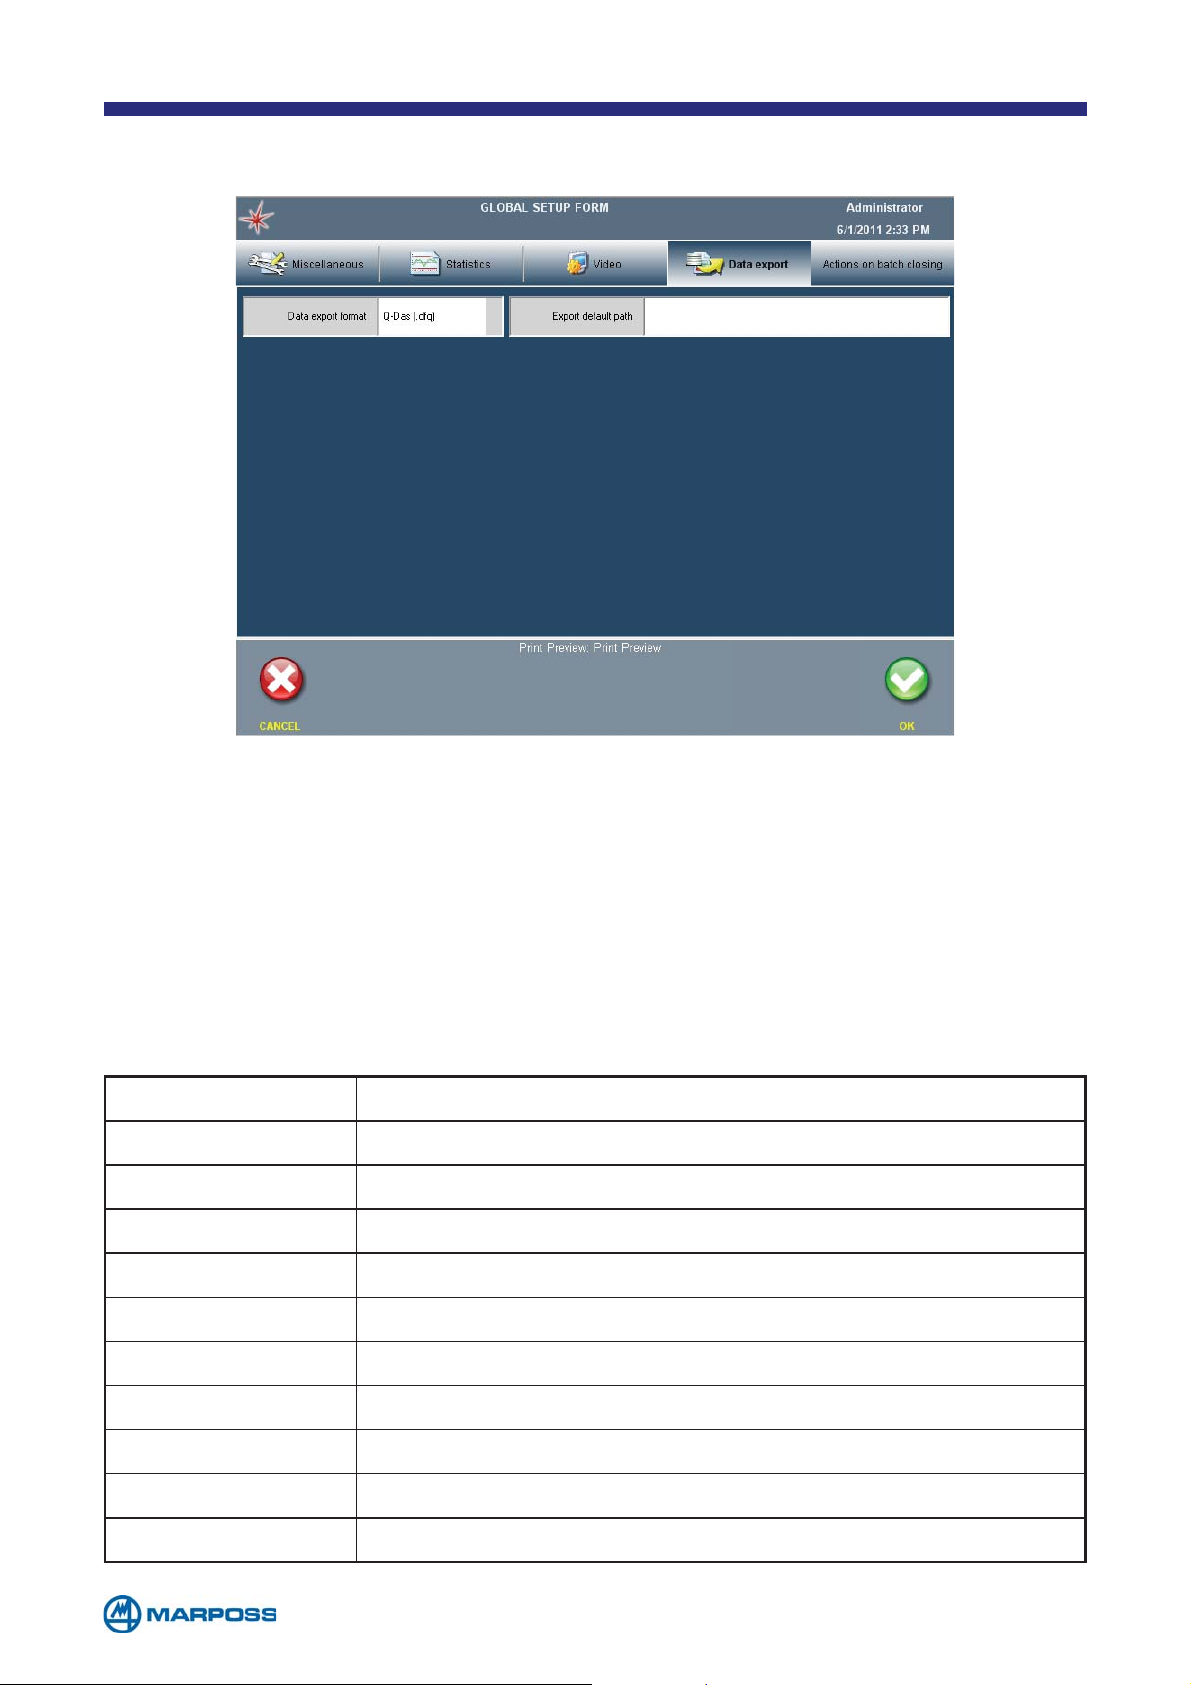
6.6 Data Export TAB
• DATA EXPORT FORMAT: Q-Das (File .DFQ)/ Text (File .CSV)/ SESAME (.txt). The
text file format is totally compatible with Microsoft® EXCEL.
• E
XPORT DEFAULT PATH : to enter the data saving path. Both local (Compact Flash
or USB memory) and remote (preconfigured Ethernet connection) paths may
be used. For example: C:\FolderName\ when saving to the internal Compact
Flash, or \USB HDD\FolderName when saving to the USB memory, or \\PCName\SharedFolder\ for the network connection.
CSV FORMAT
FIELDS DESCRIPTION
Date and time Date and time of the measure
* Separator (for characteristic)
Short Description Name of the characteristic
Value Value of the characteristic
UoM Measure unit of the characteristic
Absolute value Absolute value of the characteristic
Abs. value UoM Measure unit of the absolute value
Nominal value Nominal value of the characteristic
UTL Value Upper tolerance value of the characteristic
LTL Value Lower tolerance value of the characteristic
- 56 -
Page 57
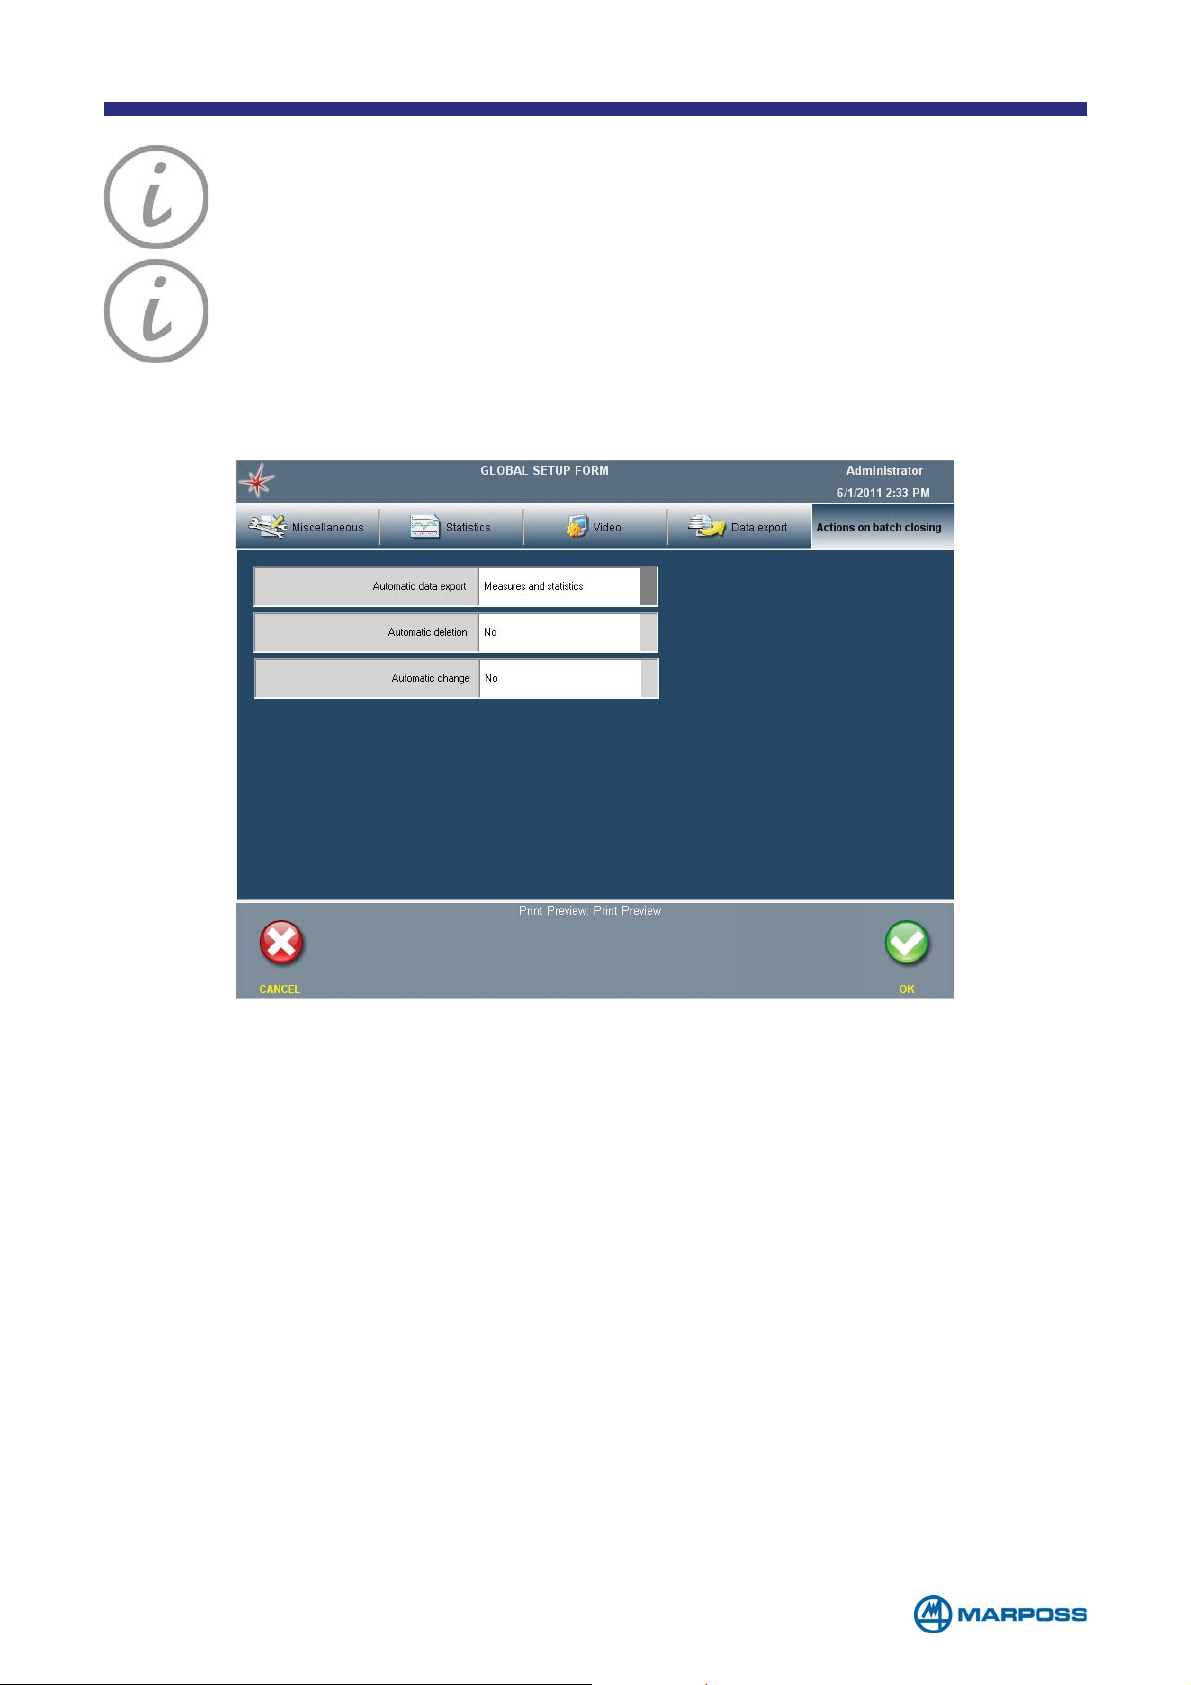
NOTE: To export any data it is necessary create a batch.
NOTA: The measurement data export is possible either when a batch is
complete but also after each piece (for this function please refer to the
page of part program definition).
6.7 Actions on batch closing TAB
• AUTOMATIC DATA EXPORT: NO, MEASUREMENT ONLY, STATISTICS ONLY, MEASUREMENTS
AND STATISTICS.
• A
• A
UTOMATIC DELETION: YES, NO.
UTOMATIC CHANGE: YES, NO
- 57 -
Page 58
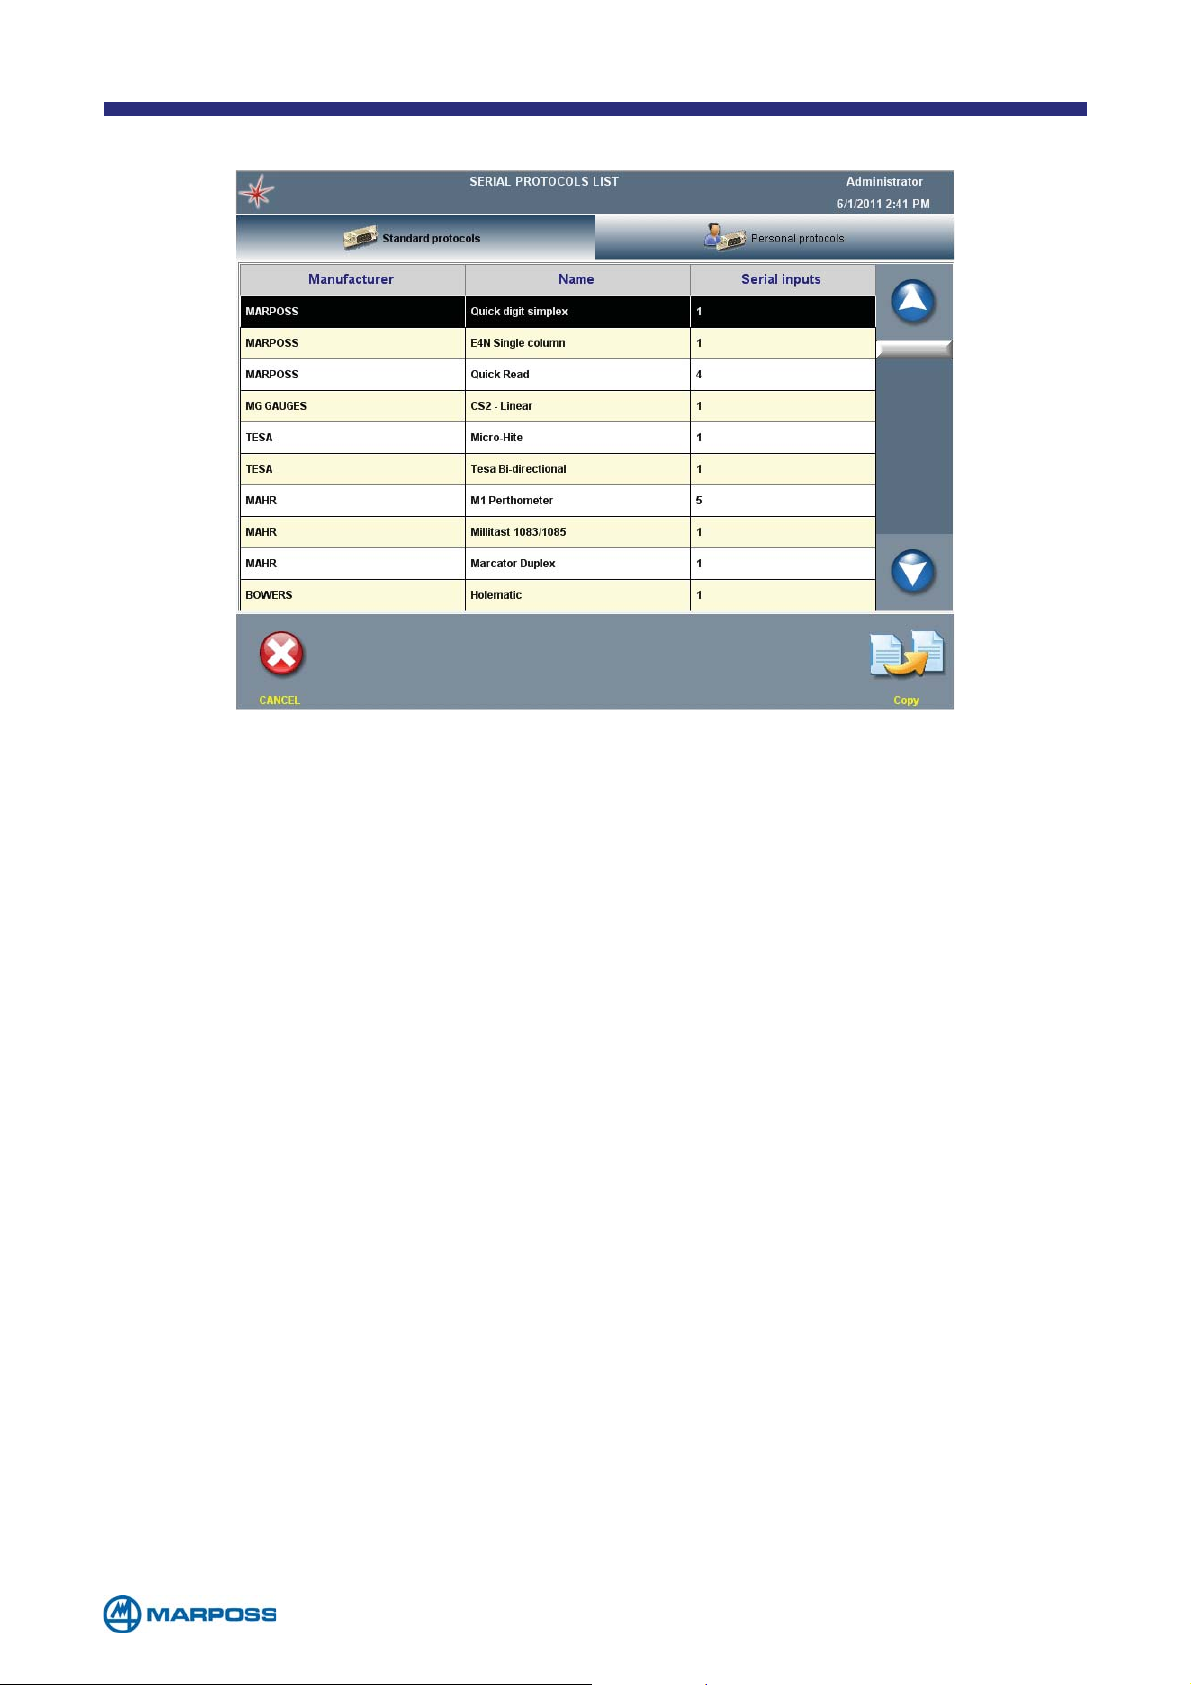
7 PROTOCOLS
The “Serial Inputs” column displays the number of parameters handled by the
protocol and therefore the number of inputs which will be made available by creating a device which uses that protocol. The system is now capable of acquiring
measurement information from the following external devices/protocols.
MARPOSS
• Quick Digit Simplex • Quick Digit Duplex
• E4N single column (configurations with daisy-chained columns are not allowed)
• Quick Read (up to four daisy-chained units)
MG
• CS2-Linear
TESA
• Micro-Hite • Tesa Bi-directional
MAHR
• M1 Perthometer • MILLITAST 1083/1085 • Marcator Duplex
BOWERS
• Holematic
TAYLOR HOBSON
• Surtronic 25 (manual) • Surtronic 25 (automatic)
MITUTOYO
• SJ-201P roughness • SJ-210 roughness
BOBE
• HF-MS-M systems on devices for 4 and 8 channels
- 58 -
Page 59
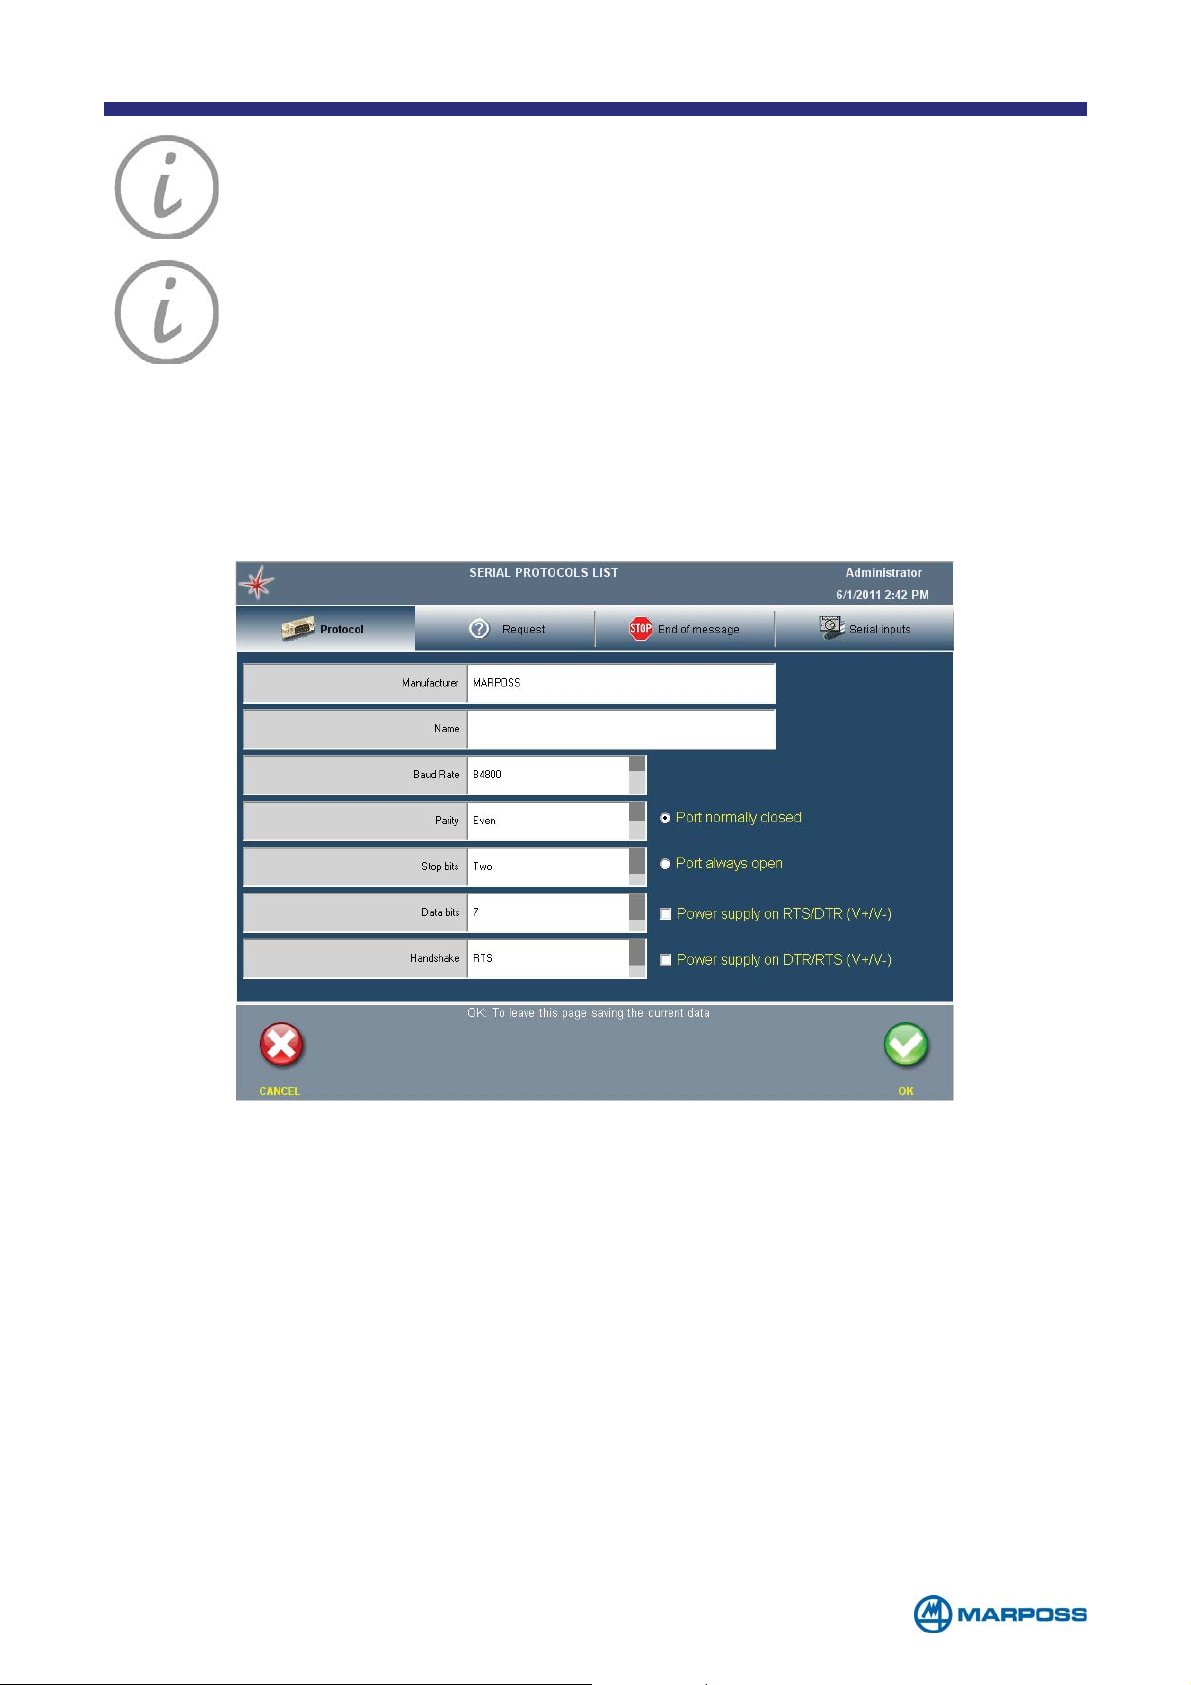
NOTE: in order to access the information about the inputs handled by
a given protocol, select it from the list, tap “Copy” and view the inputs in
the “Serial Inputs” tab”. Tap “Exit” to quit.
NOTE:
we cannot guarantee the complete compatibility of the protocols
developed, to comunicate with these devices, due the continuous developement performed by the manufactures of them. On demand we can
develop the protocol for a new serial device only if it is provided to us.
Please contact us for any other detail.
7.1 Personal Protocols
The C
an existing one .
OPY function enables the user to create a new PERSONAL PROTOCOL starting from
• MANUFACTURER: manufacturer’s name.
• N
• B
AME: name allocated to the protocol.
AUDRATE: communication speed expressed in bits per second (options: B300,
B600, B1200, B2400, B4800, B9600, B14400, B19200, B38400, B57600, B115200).
• P
• S
• D
• H
• P
• P
ARITY: protocol parity (options: NONE, ODD, EVEN, MARK, SPACE).
TOP BITS: NONE, ONE, ONE POINT FIVE, TWO.
ATA BITS: 5,6,7,8.
ANDSHAKE: NONE, XON/XOFF, RTS, RTS XON/XOFF.
ORT BEHAVIOUR: NORMALLY CLOSED, ALWAYS OPEN.
OWER SUPPLY ON RTS/DTR: if the box is ticked, the Merlin provides power
supply between RTS (-) and DTR (+) pins. A typical device that requires this
feature is the Mahr Millitast 1085.
- 59 -
Page 60
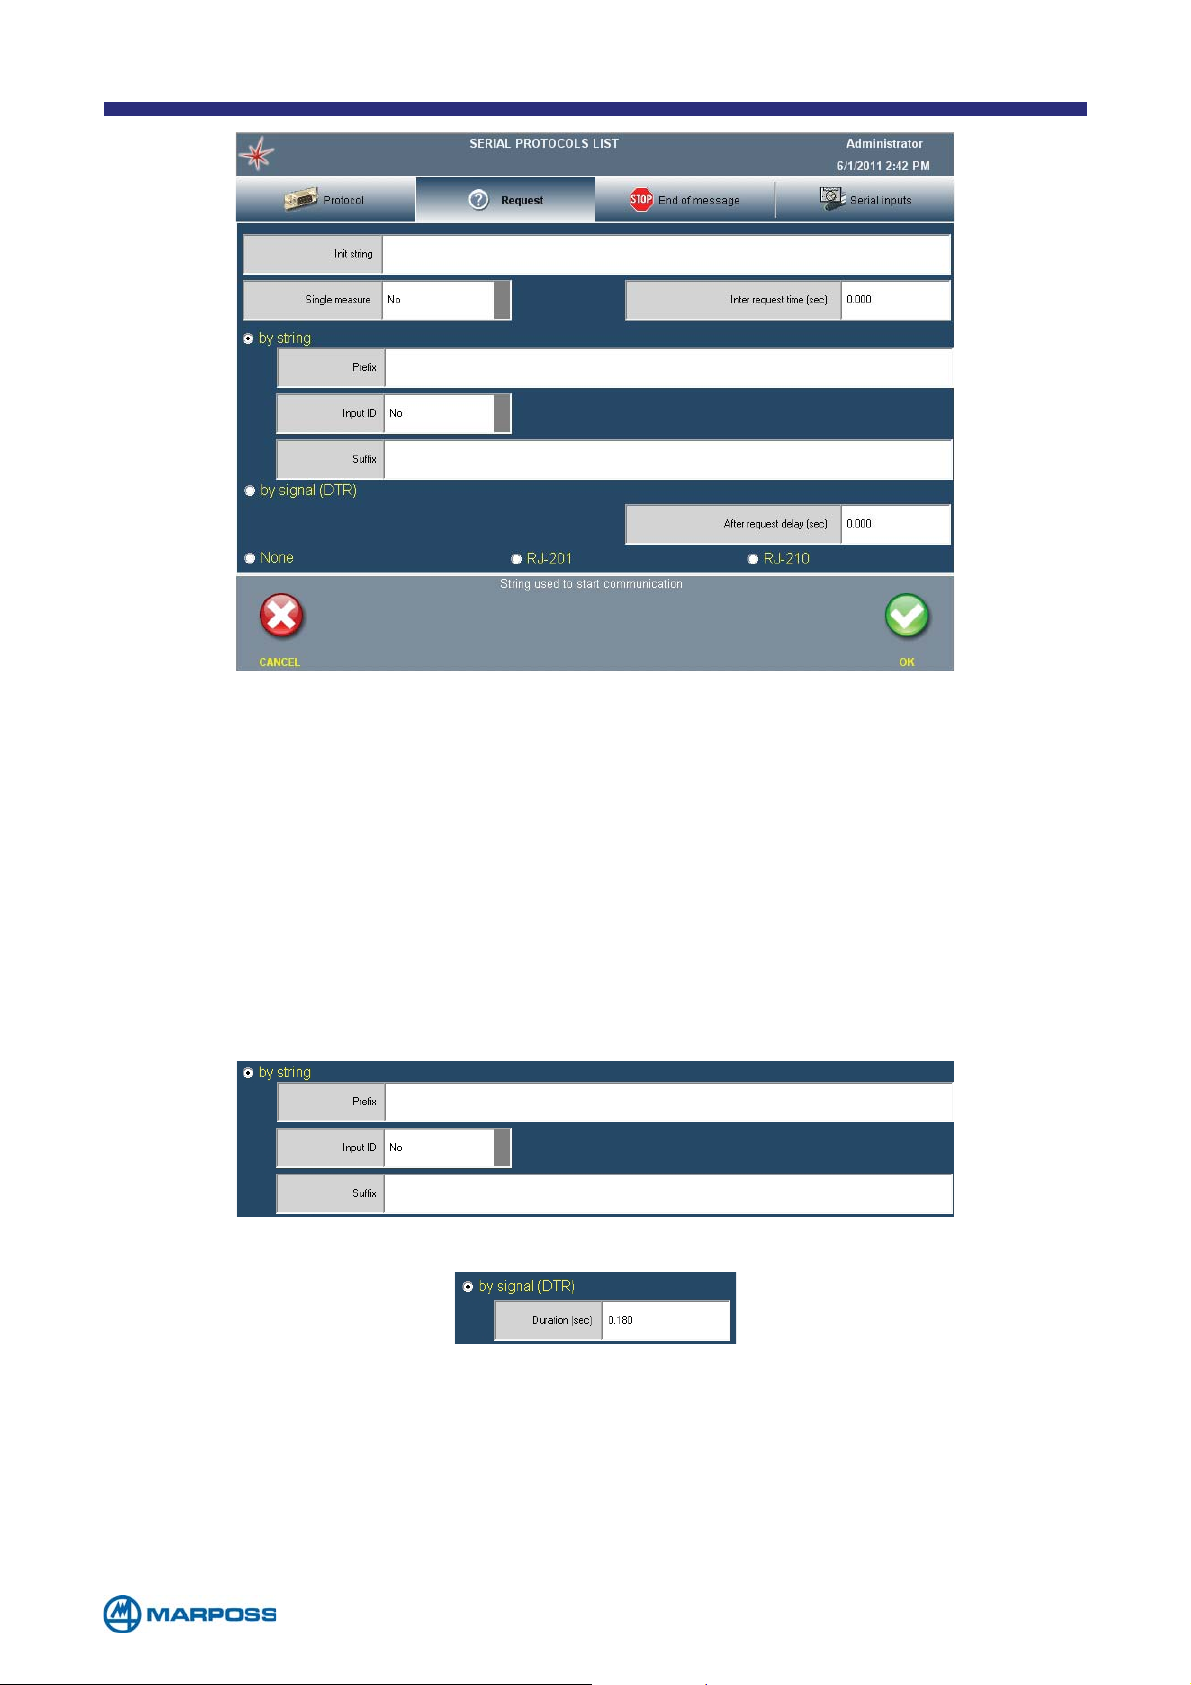
The REQUEST form defines the external device data request parameters.
• I
NIT. STRING: enter the initialising string required to activate communications with
the device. Merlin only sends the string, the first time it communicates, with the
device (each time the device is switched on); the virtual keyboard includes a
list of all ASCII characters, complete with control characters. Tap “fx” to access.
• S
INGLE MEASURE: option YES, NO. This feature optimizes the management of
serial devices with long acquisition time, avoiding to repeat the request more
than once.
• I
NTER REQUEST TIME: delay time between 2 measure requests to a serial gauge.
• B
Y STRING: specify the prefix, the suffix and, whether or not the ID input should
be sent
• B
• N
Y SIGNAL (DTR): protocol requests by DTR signal; specify the duration in second.
ONE: no request; in this case the device sends the measurement data auto-
nomously.
• RJ-201
AND RJ-210: For some devices, the request is too complex so it has
been developed a specific field, to be selected. The software will manage
automatically a configuration.
- 60 -
Page 61
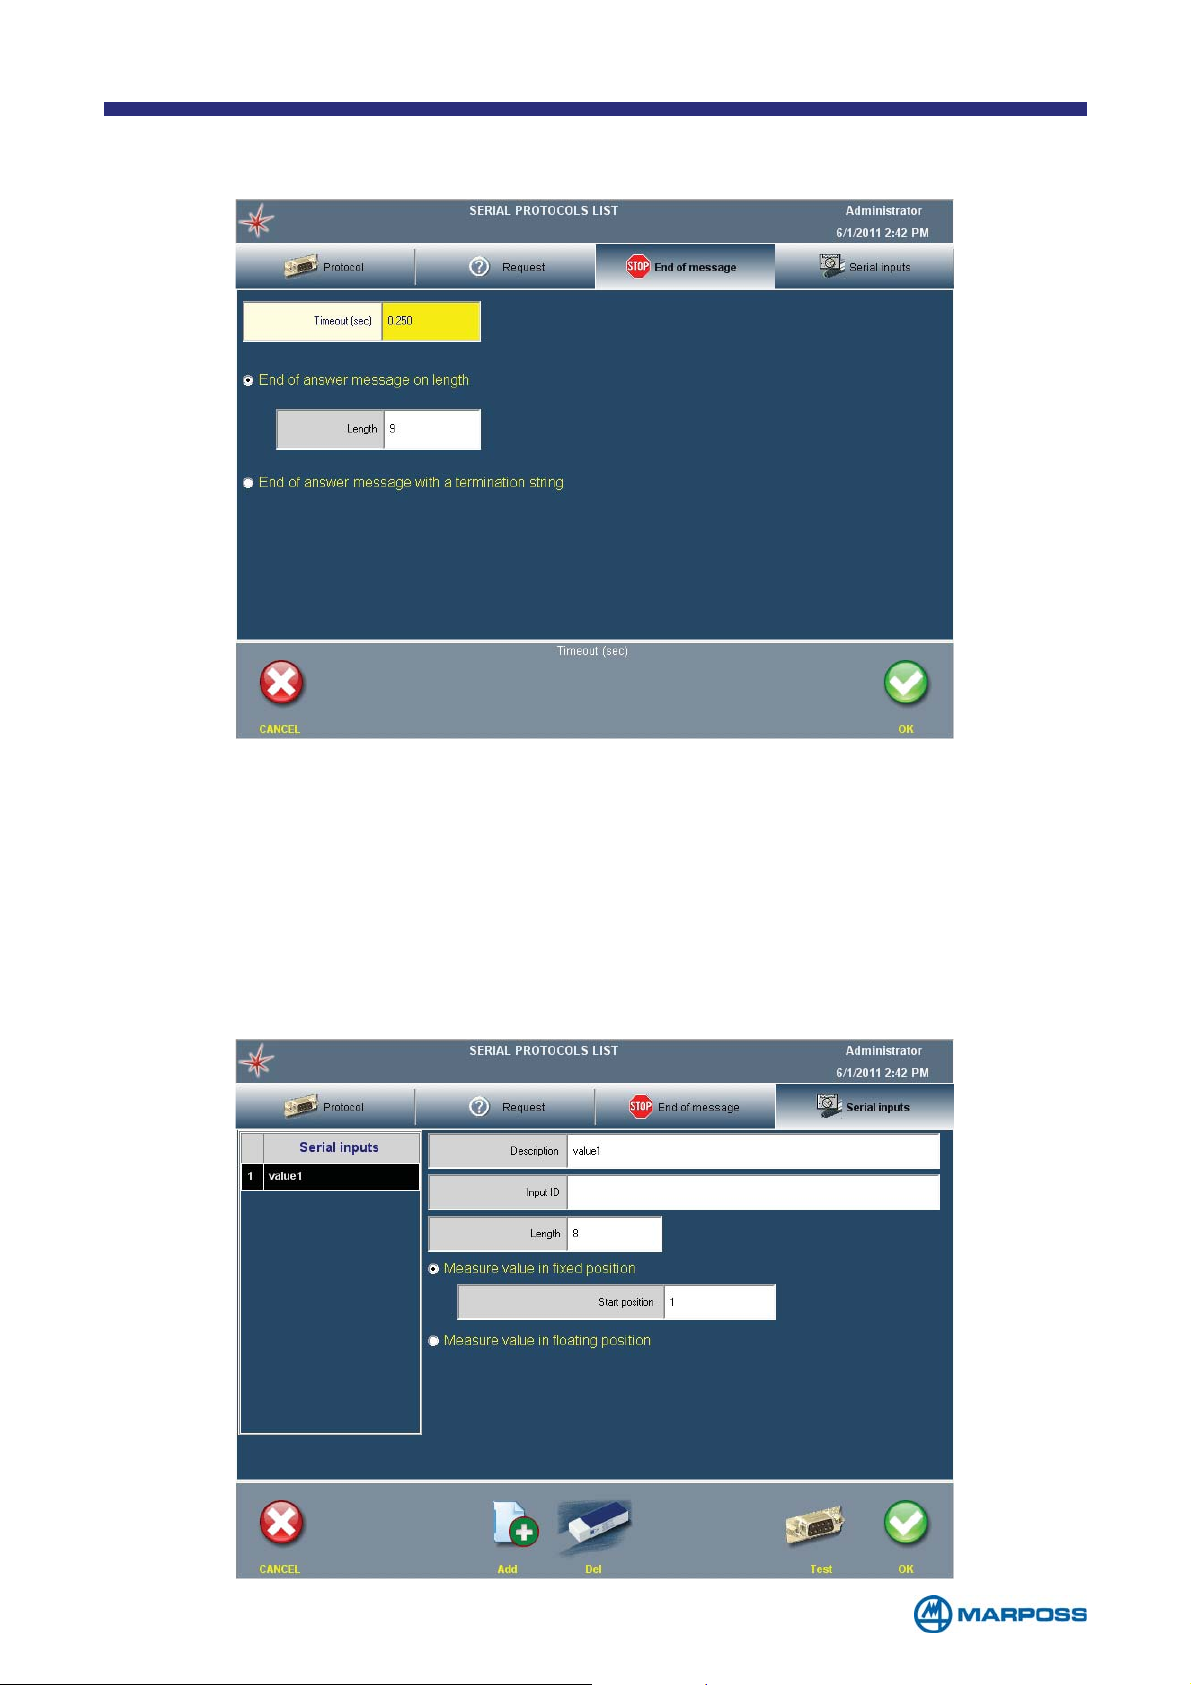
The E
ND OF MESSAGE TAB defines the external device, end of answer message,
recognition parameters.
• T
IMEOUT: to select the closing message maximum waiting time, expressed in se-
conds
• E
ND OF ANSWER MESSAGE ON LENGHT: end of message option based on length; it
states the number of characters in the answer message.
• E
ND OF ANSWER MESSAGE WITH A TERMINATION STRING: it states the character se-
quence used to end an answer.
The SERIAL INPUTS TAB allows to define how to identify each measurement signal
within the context of the answer message from the external device.
- 61 -
Page 62
By tapping the test button, Merlin sends a measure request to an
external serial unit and reads the feedback from the device. This
feature is especially useful to debug the protocol, in fact it is immediately clear if the request is sent in the proper way (if not, no
answer from the serial device will be received).
7.2 Data output protocols
The software allows the operator to select which of the released protocols to use during the
setting up phase, using the same method as used for the digital input/outputs management
cycles. If a data output protocol has been setup, upon completion of each measurement, the
Merlin software creates the message corresponding to the piece that has just been measured
and sends it automatically (without the need for confirmation on the part of the operator).
The protocols are managed on one of the available serial ports.
In general, a message is made up of the following sections:
• S
• G
• C
• C
TART: it contains the start communication characters
LOBAL DATA: it contains the general information about the piece that has just been me-
asured.
HARACTERISTICS DATA: it contains the information regarding the n characteristics that
transmission has been enabled for. This section consists of n sub-sections, one for each
characteristic.
LOSING: it contains the checksum and the closing character.
7.2.1 Optional handshaking
It is possible to enable a simple handshaking mechanism for a protocol that can be
used to monitor the connection to the remote partner and check whether it remains
open.
• If the message is received correctly, the remote unit returns the confirmation message: <STX><ACK><ETX> (ASCII characters 2-6-3)
• If the message is not received correctly, the remote unit either returns an error
message: <STX><NACK><ETX> (ASCII characters 2-21-3) or does not respond at all.
• After sending the message, Merlin software awaits the answer; there are three
possible outcomes:
1. positive response (ACK) -> message sent correctly
2. no response within the time limit (TimeOut) -> connection interrupted
3. negative response -> Merlin sends the message again (until it reaches the
preset maximum number of attempts) and awaits the response. No reply or
persistent negative response -> connection interrupted
When the connection interrupted status is diagnosed, a video message is displayed
indicating the type of error that has been detected.
• After sending the message, the Merlin software proceeds with its activities, regardless of the outcome.
- 62 -
Page 63

7.3 Standard protocol N°1 (DOP-STD01)
The following is a description of the standard data output protocol on a serial port
for the Merlin software, denominated DOP-STD01.
OUTPUT MESSAGE FORMAT
START
Name Characters Meaning
Start 1 Start message character: <STX>
2 <CR><LF>
GLOBAL DATA
Name Characters Meaning
Date 8 Date test was performed in “DD/MM/YY” format
Hour 8 Time test was performed in “HH:MM:SS” format
Program 20 Name of part program used
Serial number 20
Piece result 2
Number of
2
characteristics
2 <CR><LF>
The following information is sent for each characteristic
Name Characters Meaning
Name 3 Name of the characteristics.
Value 12
Serial number or progressive number of piece
within the active batch
Code that indicates the result of the measurement performed on the piece: G (good), T(trend),
R(eject), NV(not valid)
Number of characteristics sent (only non auxiliary
characters are sent)
CHARACTERISTIC DATA
Absolute or relative measurement value, as displayed. The value is formatted according to the
precision setup for the characteristic. The decimal
separator is always represented by a point. The
sign is always indicated.
Measurement
unit
Result 3
4
2 <CR><LF>
Measurement unit symbol, as displayed (μm,
mm, °C…)
Code that indicates the result of the measurement performed on the single characteristic: G,T+,T-,R+,R-,NV+,NV-
- 63 -
Page 64

CLOSING
Name Characters Meaning
Message checksum, defined as the low byte of the
Checksum 3
Stop 1 Stop message character: <ETX>
2 <CR><LF>
In the following example, the values of two measurements (OG1 and OG2) performed on good piece number 11 using the Biella program are transferred:
<STX><CR><LF>
10/01/0815:10:01biella______________11__________________G_2_<CR><LF>
OG1+24.1234____μm__G__<CR><LF>
OP1-12.123_____μm__G__<CR><LF>
xxx<ETX><CR><LF>
sum of the ASCII codes of all the characters in the
message (apart from the stop message ETX character and the final <CR> <LF>)
EXAMPLE OF DATA OUTPUT
Legend:
<STX>: character ASCII 2
<ETX>: character ASCII 3
<LF>: character ASCII 10
<CR>: character ASCII 13
_ : ASCII space character 32
xxx: it indicates the value calculated for the checksum
NOTE: The default parameters used by the standard protocols on
Merlin are:
Baudrate: 9600
Bit: 8
Parity: None
StopBit: 1
- 64 -
Page 65

7.4 Standard protocol N°2 (DOP-STD02)
The following is a description of the standard data output protocol on a serial port
for the Merlin software, denominated DOP-STD02.
OUTPUT MESSAGE FORMAT
START
Name Characters Meaning
Start 1 Start message character: <STX>
2 <CR><LF>
GLOBAL DATA
Name Characters Meaning
Date 8 Date test was performed in “DD/MM/YY” format
Hour 8 Time test was performed in “HH:MM:SS” format
Program 20 Name of part program used
Serial number 20
Piece result 2
Number of
2
characteristics
2 <CR><LF>
The following information is sent for each characteristic
Name Characters Meaning
Name 3 Name of the characteristics.
Value 12
Serial number or progressive number of piece
within the active batch
Code that indicates the result of the measurement performed on the piece: G (good), T(trend),
R(eject), NV(not valid)
Number of characteristics sent (only non auxiliary characters are sent)
CHARACTERISTIC DATA
Absolute or relative measurement value, as displayed. The value is formatted according to the
precision setup for the characteristic. The decimal separator is always represented by a point.
The sign is always indicated.
Measurement
4
unit
Result 3
Measurement unit symbol, as displayed (μm,
mm, °C…)
Code that indicates the result of the measurement performed on the single characteristic:
G,T+,T-,R+,R-,NV+,NV-
- 65 -
Page 66

Characteristic classification code, calculated
on the basis of the measurement value, in ac-
Class 5
2 <CR><LF>
Name Characters Meaning
Checksum 3
Stop 1 Stop message character: <ETX>
2 <CR><LF>
cordance with the table selected during the programming phase. If the classification code is not
required for the characteristic a series of space
characters is sent instead.
CLOSING
Message checksum, defined as the low byte of
the sum of the ASCII codes of all the characters
in the message (apart from the stop message
ETX character and the final <CR> <LF>)
EXAMPLE OF DATA OUTPUT
In the following example, the values of two measurements (OG1 and OG2) performed on good piece number 11 using the Biella program are transferred. The classification for the first measurement value is 02 for the second it is 05:
<STX><CR><LF>
10/01/0815:10:01biella______________11__________________G_2_<CR><LF>
OG1+24.1234____μm__G__02___<CR><LF>
OP1-12.123_____μm__G__05___<CR><LF>
xxx<ETX><CR><LF>
Legend
<STX> : character ASCII 2
<ETX> : character ASCII 3
<LF> : character ASCII 10
<CR> : character ASCII 13
_ : ASCII space character 32
xxx: it indicates the value calculated for the checksum
NOTE: the only difference between protocol DOP-STD01 and protocol
DOP-STD02 is that the latter also includes the characteristic class code
- 66 -
Page 67
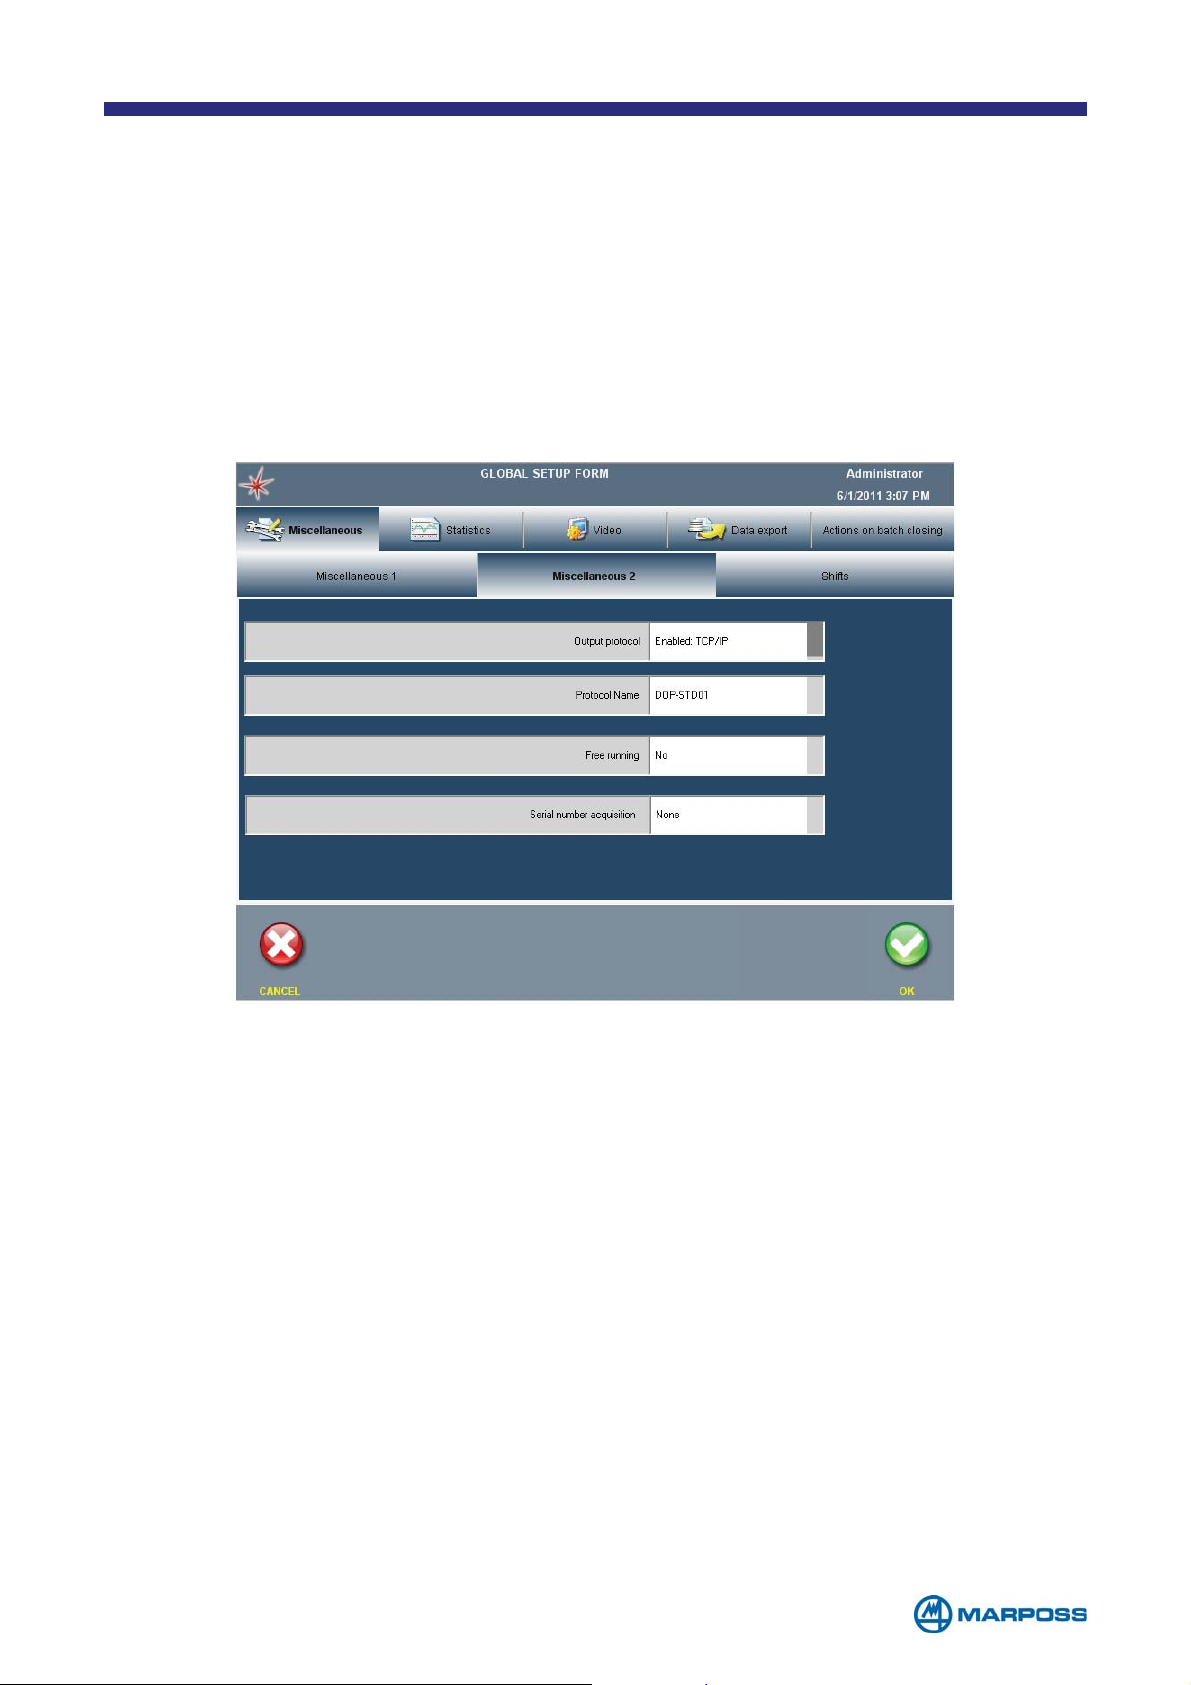
7.5 Protocol implementation method
The standard protocols, denominated DOP_STDxx, where xx is the id assigned to
the protocol, are distributed with the Merlin software installation packages. The type
of protocol to be used is selected in the M
page, using the following fields:
• O
• P
UTPUT PROTOCOL: where it is possible to activate the data output protocol
ROTOCOL NAME: protocol name
For example, to activate protocol N.3 on TCP/IP:
ISCELLANEOUS 2 TAB on the GENERAL SETUP
- 67 -
Page 68

8 TRACING DATA
This phase is used to define the data that can be used to trace the production by
tapping the T
RACING during the measurement phase.
8.1 Pre-defined data
The following table contains a list of pre-defined data, in text form if their value is free
or Catalog form if their value has to be selected from a pre-defined list (the Catalog
corresponding to the specific datum). Catalog type data must contain at least one
value before they can be used.
N° TRACING
D
ATA
PARAMETER
CORRESPONDING
Q-DAS
K-
FIELD
DEFAULT SETTINGS
TYPE BEHAVIOUR
1SERIAL NUMBER K 0006 TEXT EVENT
2CAVITY K 0007 CATALOG*STATE
3GAGE K 0012 CATALOG*STATE
4MACHINE K 0010 CATALOG*STATE
5OPERATOR K 0008 CATALOG*STATE
6PART IDENT. K 0009 TEXT EVENT
7REASON OF TEST K 0015 CATALOG*STATE
8ORDER K 0053 TEXT STATE
9EVENT K 0005 CATALOG*EVENT
10 CUSTOM TEXT K 0009 TEXT EVENT
P
11
RODUCTION
K 0016 TEXT STATE
NUMBER
W
12
ORK PIECE
K 0017 TEXT STATE
FIXTURE
During the measurement phase, the tracing information request is split into 2 tabs:
the N.9 Event datum is used automatically for the events tab, whereas all the other
data are used for the tracing tab.
NOTE: The Q-DAS catalogue may only contain the keys that are listed in
the above table, if it is necessary to use Q-Das keys that are not included
in the table, please contact the nearest Marposs office.
- 68 -
Page 69
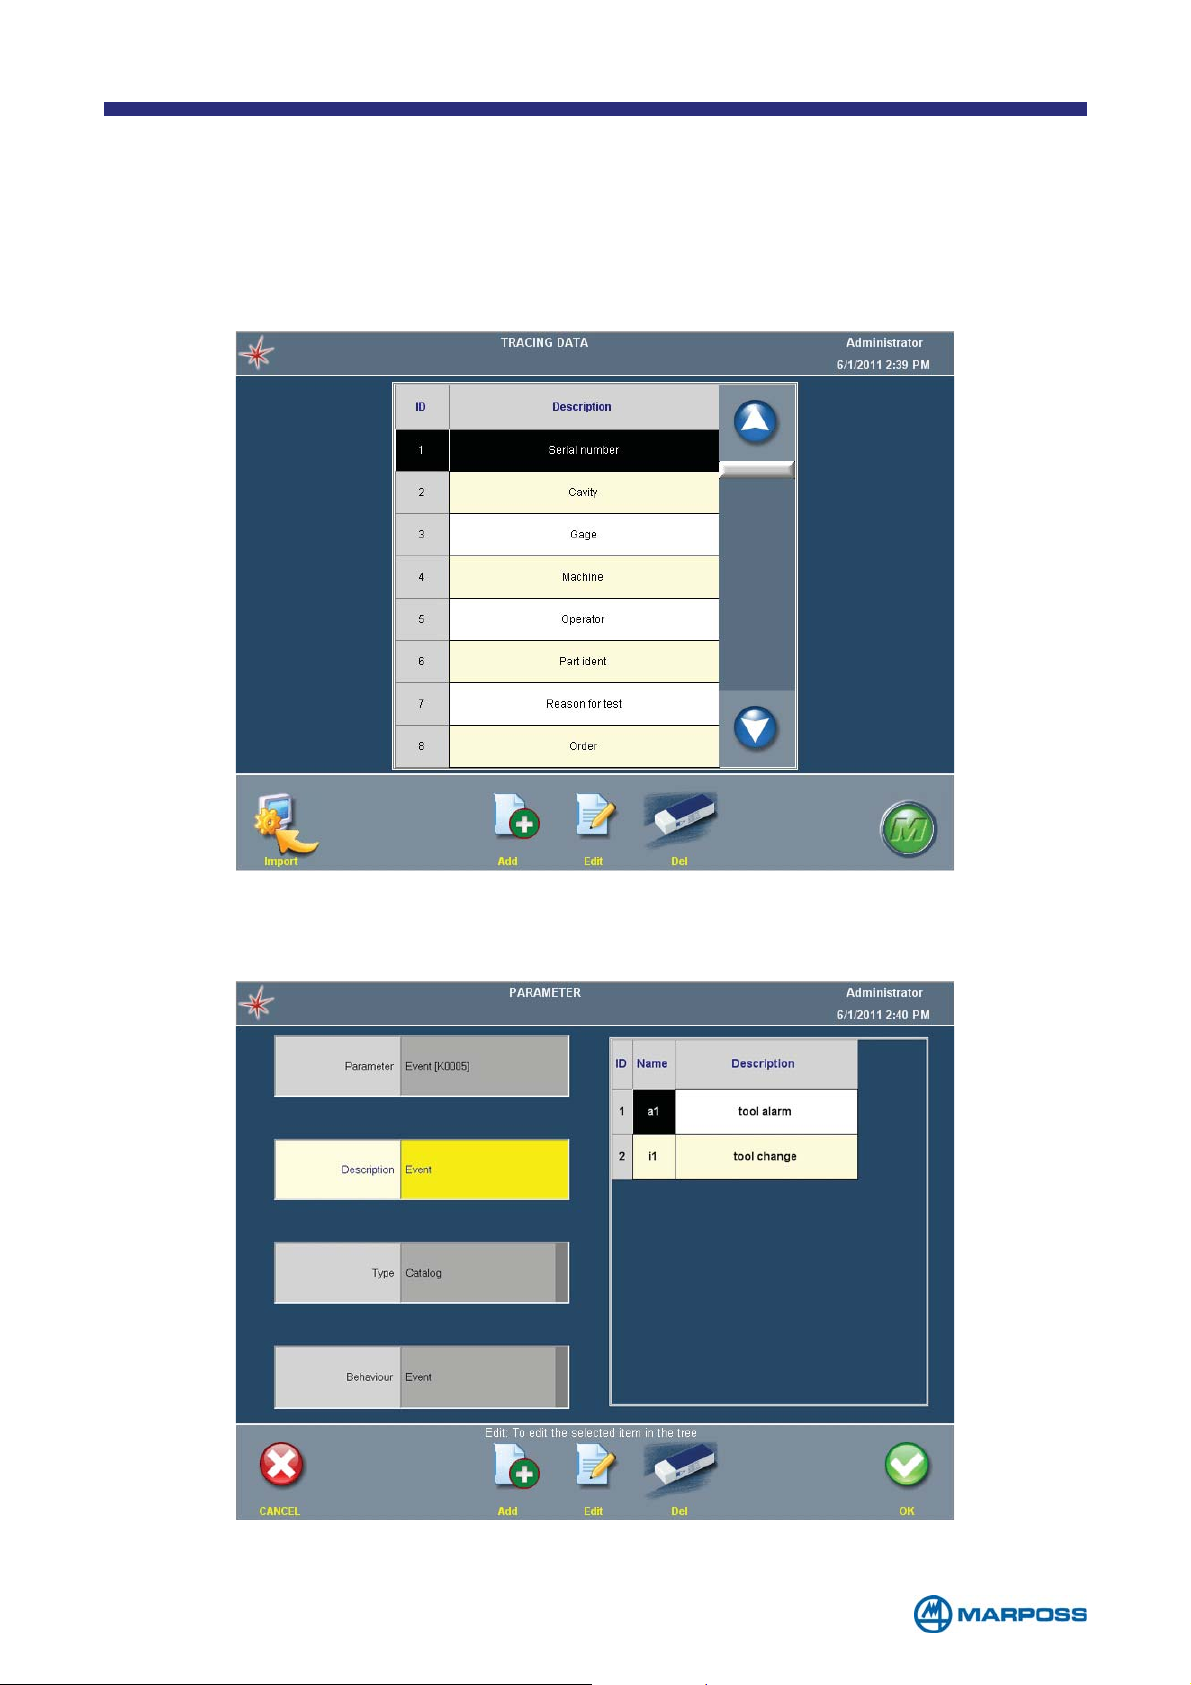
8.2 Customising the data
The list of data can be expanded by using the ADD command. It is possible to import
files from the Catalog using the I
The file import must be done through a USB memory stick, the Merlin software will
look for the “Kataloge.dfd” file in the USB memory root.
MPORT command.
Add a new datum or modify an existing one (using the EDIT command) to access
the following form.
- 69 -
Page 70

• DESCRIPTION: description that identifies the datum.
• T
YPE: the data may be in TEXT form if their value is free or CATALOG form if their
value has to be selected from a pre-defined list (the C
ATALOG corresponding to
the specific datum). It’s possible to input a list of values among which the operator has to choose, using the table on the right side of the form and commands
A
DD , DEL end EDIT.
B
EHAVIOUR: it defines how the data marks the measurements:
• S
TATE: if a certain data value is inserted, all the measurements will assume
that value until it is modified again.
• E
VENT: if a certain data value is inserted, it will be valid for the current mea-
surement only.
NOTE: It is not possible to enter the tracing data unless a batch is active.
NOTE: in case of catalog form, it is possible to insert a list of values,
shown to the operator by the concerning field. By A
DD, CANC and MODIFY is
possible values compounded by the following fields:
• ID: numeric code used as unique identificator during data exportation. This code is automatically suggested by the software during
the creation but it could be customized in a way to assure an unique
identification in case of many Merlin are used in the same plant and/
or company.
• C
ODE and DESCRIPTION: alphanumeric fields are shown stages of in-
serting and selecting keys.
- 70 -
Page 71

Q-DAS EXPORTATION
K-Field
Parameter
connected
K00005 Events
K00006 SerialNum
K00007 CavityNum
K00008 OperatorName
K00010 MachineNum
K00011 Process Parameter
K00012 GageNum
K00014 PartIdent
K00015 TestReason
K00053 Order
Number of characte-
K00100
ristics
K01001 Code number
K01002 Description of code
K01041 Drawing number
K02131 Upper plausibility limit
K02141
K02142
K02404
K04060 Machine Num
K04070 Gage
K04090 Operator name
K04220 Events
K04240 Process parameter
K04250 Cavity
K08010
K08110
Measurement unit
index
Description of measu-
rement unit
Measurement system
resolution (characteri-
stic accuracy)
Description of control
chart type (location)
Description of control
chart type (variation)
K01053 Batch number
K02001
K02002
K02004
K02022 Number of decimals
K02101 Nominal value
K02110 Lower limit
K02111 Upper limit
K02120 N. Char + Limit Type
K02121 N. Char + Limit Type
K02130 Lower plausibility limit
Name of characteristic
(mandatory)
Description of cha-
racteristic
(mandatory)
Type of characteristic
(variable)
Sample size (the size
is stored in the group
K08500
that this characteristic
belongs to)
- 71 -
Page 72

9 MERLIN DIGITAL SIGNALS MANAGEMENT
In order to minimize the programming performed by the user, the Merlin software
manages digital signals (Input and Output) using precompiled lists of signals. The
operator has only to choose the I/O layout according to his needs.
For more detailed information on the I/O Layout management, please contact the
nearest Marposs office.
SIGNAL LIST
LINE MEANING AND MANAGEMENT
START/STOP TYPE1: the same line is used to give both commands. On
IN
I
rising edge the S
available (and cannot be changed) in all the footswitch connected to
Easy Box.
START/STOP TYPE2: the same line is used to give both commands.
S
TART and STOP commands are active on rising edge, it means that two
N
pushes on the button are necessary to complete an acquisition. This
configuration is available (and cannot be changed) for all the M1 Wave
pushbuttons.
TART, on falling edge the stop. This configuration is
I
N START TYPE3: START command active on rising edge.
IN STOP TYPE3: STOP command active on rising edge.
ZERO MODE: when the input is high and it’s programmed at least one ze-
roing step, Merlin software shows the zeroing page. When the signal is
I
N
low the system shows the standard measuring page. This configuration
is available for: Easy Box U8IO, DigiCrown, GageBox.
NEXT ZERO STEP: active on rising edge. Merlin software skips to next ze-
I
roing step. The system must be in Z
N
EROING mode and more than one ze-
roing step has to be available. This configuration is available for: Easy
Box U8IO, DigiCrown, Gage Box.
BATCH SELECTION: active on high level. When activated the software
changes B
I
N
according to the binary code set on “Batch Code” signals (see next
ATCH (and as consequence could change PART PROGRAM too)
point). If the addressed batch is not valid, the system remains on the
current one and “Error status” output signal is enabled.
- 72 -
Page 73
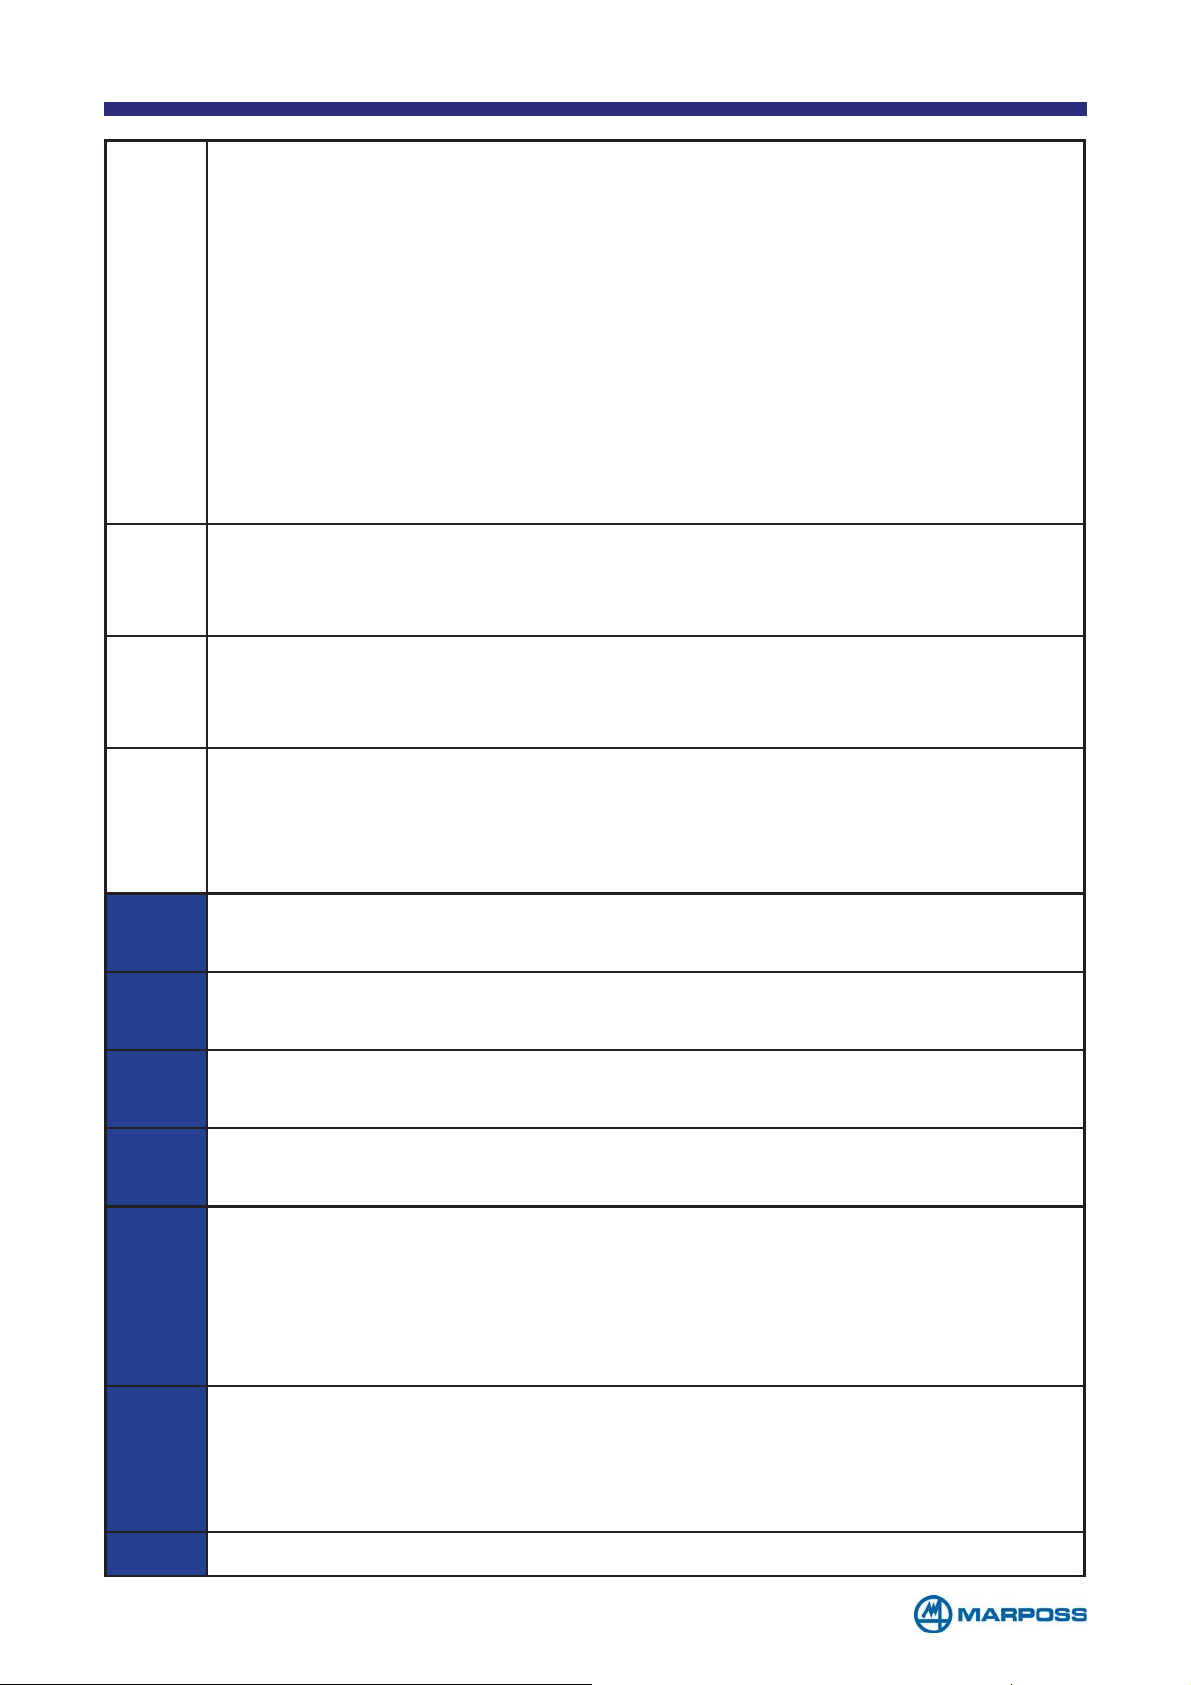
IN
(3B
I
I
B
ATCH CODE: binary code which identifies the active BATCH to use to
store acquired measures. The addressed B
SELECTION signal is high, or if BATCH SELECTION is not available, as soon as
ATCH is activated once BATCH
a bit changes in the code.It’s up to 4 bit binary code with a shift of one
unit, this means that addressed B
0000 → B
IT)
0001 → B
0010 → B
ATCH with I/O index 1
ATCH with I/O index 2
ATCH with I/O index 3
ATCHES are:
…
1110 → B
1111 → B
ATCH with I/O index 15
ATCH with I/O index 16
DISABLE STATISTIC: Disable temporarily the internal data storage and
N
counters. The status of this signal is checked just after the end of measurement during the first step and the status is frozen till the end of last S
TEP.
REDO STEP: Active on rising edge. The signal deletes the measure ac-
N
quired in last performed step allowing to repeat it. The function can be
used more times until the complete deletion of current part.
I
N
OUT
OUT
OUT
OUT
OUT
BATCH N: Direct BATCH selection, for each signal which goes high a
batch is activated. If the addressed B
ATCH is not valid (i.e. two signals
for direct selection active at the same time), the system remains on the
current one and “Error status” output signal is enabled.
READY TO START: The signal indicates that Merlin is available to receive measu-
ring or zeroing commands. This output is available for: Easy Box U8IO.
PIECE GOOD: the signal indicates that last gauged part is GOOD. This
output is available for: Easy Box U8IO.
PIECE REJECT: signal indicates that last gauged part is SCRAP. This output is available for: Easy Box U8IO.
PIECE TREND: signal indicates that last gauged part is in TREND range.
This output is available for: Easy Box U8IO.
ERROR STATUS: signal indicates an error during batch selection (the ad-
dressed B
ATCH is not available) or measure interrupted by error during
the sensor acquisition (sensor broken, disconnected, …). The measurement is interrupted abnormally if one of the inputs is in over-range
(programmed at sensor level) upon completion of the measurement.
ACQUISITION RUNNING: signal indicates that system is gauging. The signal goes high following the S
TART signal (beginning of measuring step)
OUT
and goes down on the end of measuring step. In zeroing mode the
signal is always high. This output is available for: Easy Box U8IO.
OUT END OF CYCLE: gauging sequence completed.
- 73 -
Page 74
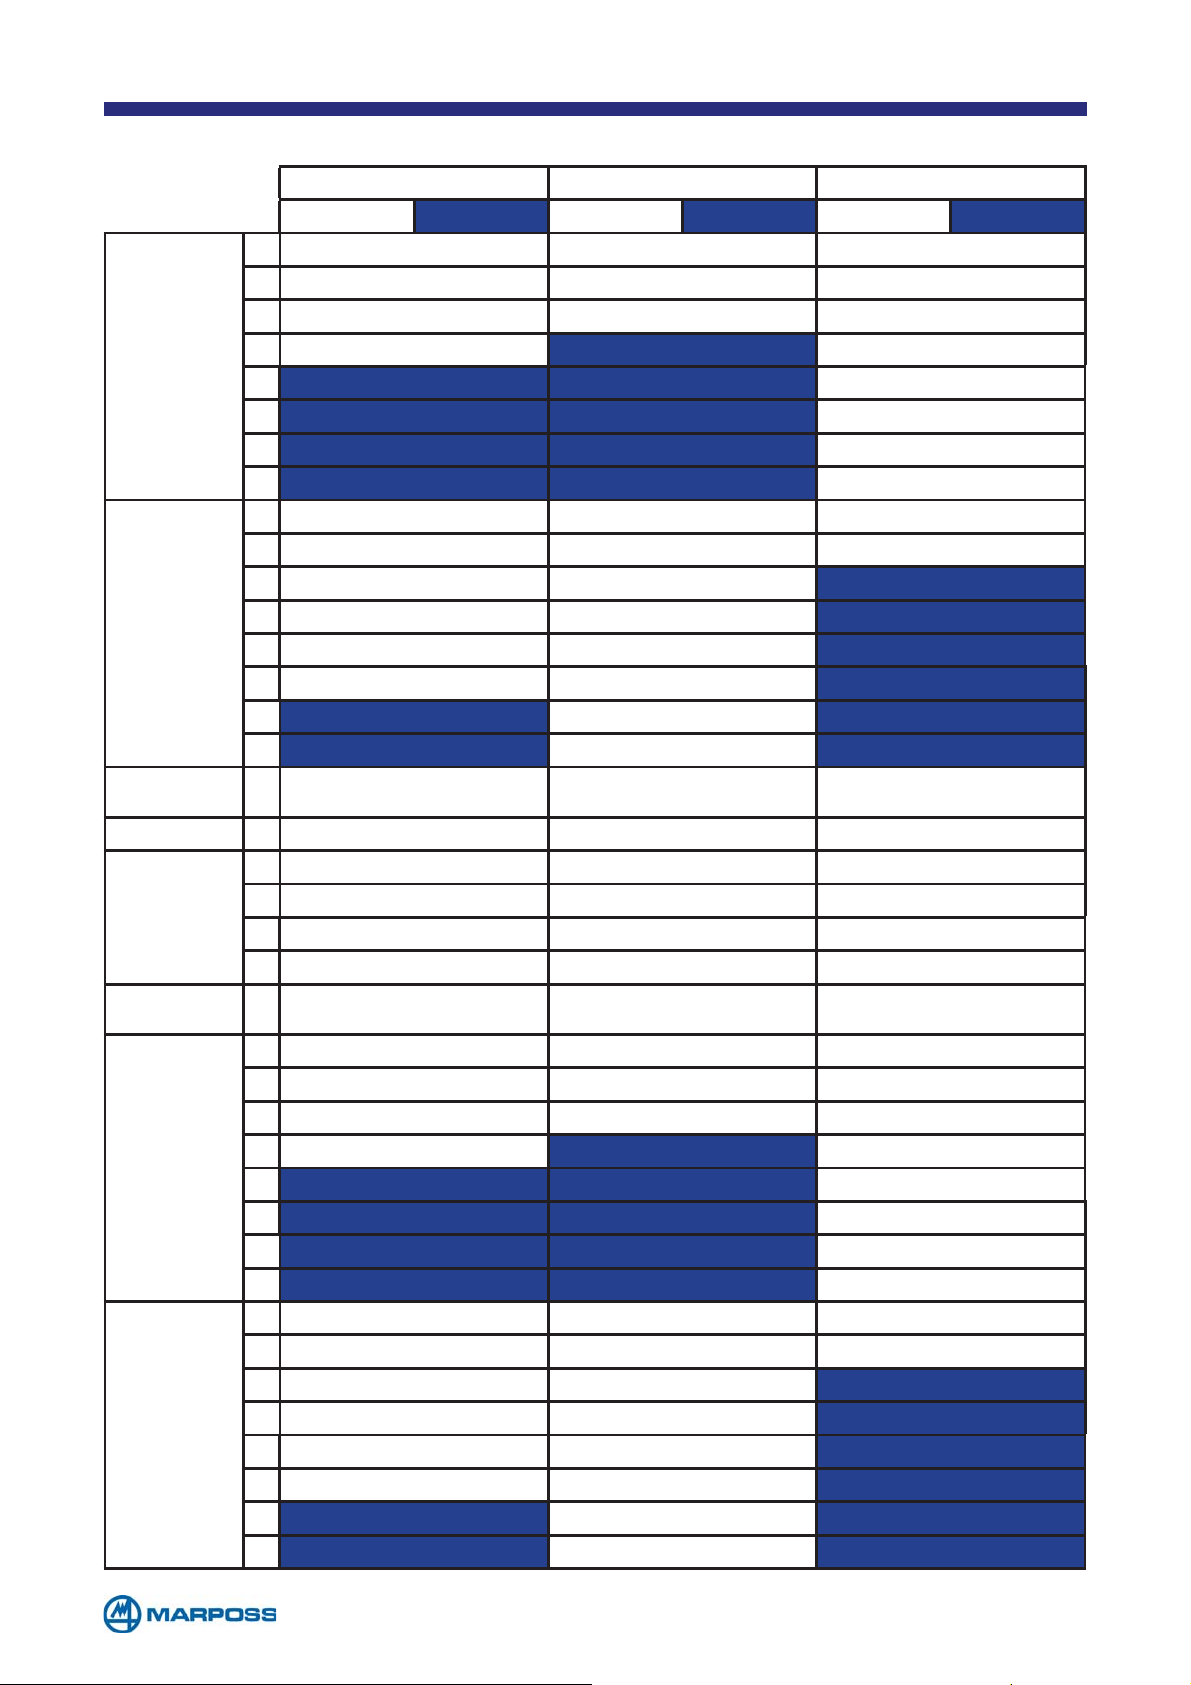
9.1 Available layouts
LAYOUT 1 [io-std01.iom] LAYOUT 2 [io-std02.iom] LAYOUT 3 [io-std03.iom]
IN
1 Start (T3) Start/Stop (T2) Batch code Bit4 (MSB)
2 Stop (T3) Batch code bit2 (MSB) Batch code Bit3
3 Zeroing mode Batch code bit1 (LSB) Batch code Bit2
Easy BOX U8IO
N°1
Easy BOX U8IO
N°2
Easy Box (NON
U8IO) N.1,2,3,4
Easy Box U4S 1 Start/Stop (T1) Start/Stop (T1) Start/Stop (T1)
Easy Box U4P
M1 Wave N.
1,2,3,..16
Digi Crown I/O N°1
Digi Crown I/O N°2
4 Next Zero Step
5
6
7 Part Reject Part Reject Disable Stat
8
1 Batch Selection - -
2 Batch code bit3 (MSB) - -
3 Batch code bit2 -
4 Batch code bit1 (LSB) - Part Good
5 Disable Stat - Part Reject
6 Redo Step - Error
7 Part Trend - Part Trend
8 Running - Running
1 Start/Stop (T1) Start/Stop (T1) Start/Stop (T1)
1 Start (T3) Start (T3) Start (T3)
2 Stop (T3) Stop (T3) Stop (T3)
3 Zeroing mode Zeroing mode Zeroing mode
4 Next Zero Step Next Zero Step Next Zero Step
1 Start/Stop (T2) Start/Stop (T2) Start/Stop (T2)
1 Start (T3) Start/Stop (T2) Batch code Bit4 (MSB)
2 Stop (T3) Batch code bit2 (MSB) Batch code Bit3
3 Zeroing mode Batch code bit1 (LSB) Batch code Bit2
4 Next Zero Step
5
6
7
8
1 Batch Selection - -
2 Batch code bit3 (MSB) - -
3 Batch code bit2 -
4 Batch code bit1 (LSB) - Part Good
5 Disable Stat - Part Reject
6 Redo Step - Error
7 Part Trend - Part Trend
8 Running - Running
Ready Part Good Zeroing mode
Part Good Part Trend Next Zero Step
Error Cycle End Redo Step
Ready Part Good Zeroing mode
Part Good Part Trend Next Zero Step
Part Reject Part Reject Disable Stat
Error Cycle End Redo Step
OUT IN OUT IN OUT
Ready Batch code Bit1 (LSB)
Ready Batch code Bit1 (LSB)
Ready
Ready
In the layout Nr.3 the batch changing is on the edge, in the layout Nr.26 the batch changing is on the level.
- 74 -
Page 75
LAYOUT 4 [io-std04.iom] LAYOUT 5 [io-std05.iom] LAYOUT 6/PBB [io-std06.iom]
IN
1 Start/Stop (T2) Start (T3) Start/Stop (T2)
2 Redo Step Stop (T3) Redo Step
3 Zeroing mode Zeroing mode Zero mode (on/off sul fronte)
Easy BOX U8IO
N°1
Easy BOX U8IO
N°2
Easy Box (NON
U8IO) N.1,2,3,4
Easy Box U4S 1 Start/Stop (T1) Start/Stop (T1) Start/Stop (T1)
Easy Box U4P
M1 Wave N.
1,2,3,..16
Digi Crown I/O N°1
Digi Crown I/O N°2
4 Next Zero Step Ready Next Zero Step
5 Disable Stat
6 Batch code Bit3 (MSB)
7 Batch code Bit2
8 Batch code Bit1 (LSB)
1- - -
2
3
4
5
6
7
8- - -
1 Start/Stop (T1) Start/Stop (T1) Start/Stop (T1)
1 Start (T3) Start (T3) Start (T3)
2 Stop (T3) Stop (T3) Stop (T3)
3 Zeroing mode Zeroing mode Zeroing mode
4 Next Zero Step Next Zero Step Next Zero Step
1 Start/Stop (T2) Start/Stop (T2) Start/Stop (T2)
1 Start/Stop (T2) Start (T3) Start/Stop (T2)
2 Redo Step Stop (T3) Redo Step
3 Zeroing mode Zeroing mode Zero mode (on/off sul fronte)
4 Next Zero Step
5 Disable Stat
6 Batch code Bit3 (MSB)
7 Batch code Bit2
8 Batch code Bit1 (LSB)
1- - -
2
3
4
5
6
7
8- - -
Ready --
Part Good --
Part Reject --
Error --
Part Trend --
Running --
Ready --
Part Good --
Part Reject --
Error --
Part Trend --
Running --
OUT IN OUT IN OUT
Part Good Batch D
Part Reject Batch C
Part Trend Batch B
Error Batch A
Ready Next Zero Step
Part Good Batch D
Part Reject Batch C
Part Trend Batch B
Error Batch A
- 75 -
Page 76
LAYOUT 7 [io-std07.iom] LAYOUT 8 [io-std08.iom] LAYOUT 9 [io-std09.iom]
IN
1 Start (T3) Start/Stop (T2) Redo Step
2 Stop (T3) Zeroing mode Zeroing mode
3 Redo Step Next Zero Step Next Zero Step
Easy BOX U8IO
N°1
Easy BOX U8IO
N°2
Easy Box (NON
U8IO) N.1,2,3,4
Easy Box U4S 1 Start/Stop (T1) Start/Stop (T1) Start/Stop (T1)
Easy Box U4P
M1 Wave N.
1,2,3,..16
Digi Crown I/O N°1
Digi Crown I/O N°2
4 Zeroing mode Ready Disable Stat
5 Next Zero Step
6 Ready Part Good Part Good
7 Part Good Part Reject Part Trend
8 Part Reject Error Part Reject
1 - Batch code bit3 (MSB) Batch code bit2 (MSB)
2 - Batch code bit2 Batch code bit1 (LSB)
3 - Batch code bit1 (LSB) -
4 - Disable Stat -
5 - Redo Step -
6-
7- - -
8- - -
1 Start/Stop (T1) Start/Stop (T1) Start/Stop (T1)
1 Start (T3) Start (T3) Start (T3)
2 Stop (T3) Stop (T3) Stop (T3)
3 Zeroing mode Zeroing mode Zeroing mode
4 Next Zero Step Next Zero Step Next Zero Step
1 Start/Stop (T2) Start/Stop (T2) Start/Stop (T2)
1 Start (T3) Start/Stop (T2) Redo Step
2 Stop (T3) Zeroing mode Zeroing mode
3 Redo Step Next Zero Step Next Zero Step
4 Zeroing mode
5 Next Zero Step
6 Ready Part Good Part Good
7 Part Good Part Reject Part Trend
8 Part Reject Error Part Reject
1 - Batch code bit3 (MSB) Batch code bit2 (MSB)
2 - Batch code bit2 Batch code bit1 (LSB)
3 - Batch code bit1 (LSB) -
4 - Disable Stat -
5 - Redo Step -
6-
7- - -
8- - -
OUT IN OUT IN OUT
Running Running
Part Trend -
Ready Disable Stat
Running Running
Part Trend -
- 76 -
Page 77
LAYOUT 10 [io-std10.iom] LAYOUT 11 [io-std11.iom] LAYOUT 12 [io-std12.iom]
IN
1 Redo Step - Zeroing mode
2 Zeroing mode - Measuring mode
3 Emergency (active low) - Next zero step
Easy BOX U8IO
N°1
Easy BOX U8IO
N°2
Easy Box (NON
U8IO) N.1,2,3,4
Easy Box U4S 1 Start/Stop (T1) - Start/Stop/Get Zero (T2)
Easy Box U4P
M1 Wave N.
1,2,3,..16
Digi Crown I/O N°1
Digi Crown I/O N°2
4 Motor out --
5
6
7
8
1 Batch code bit2 (MSB) - Batch code-Part Type bit1 (LSB)
2 Batch code bit1 (LSB) - Batch code - Part Type bit2
3 Next Zero Step - Batch code - Part Type bit3
4 Disable Statistics - Batch code - Part Type bit4 (MSB)
5- -
6 - - Batch code - Spindle Type bit 2
7 - - Batch code - Spindle Type bit 3
8 - - Batch code-Spindle Type bit 4 (MSB)
1 Start/Stop (T1) - Start/Stop/Get Zero (ottieni zero) (T2)
1 Start (T3) Start /Data OK (dati OK) (Type 2) -
2 Stop (T3) Get zero (one shot (unico tentativo)) -
3 Zeroing mode Redo Step / Redo Part (ripeti pezzo) -
4 Next Zero Step Next Page (prossima pagina) -
1 Start/Stop (T2) - Start/Stop/Get Zero (T2)
1 Redo Step - -
2 Zeroing mode - -
3 Next Zero Step - -
4 Disable Stat - -
5
6
7
8
1 Batch code bit2 (MSB) - -
2 Batch code bit1 (LSB) - -
3- - -
4- - -
5- - -
6- - -
7- - -
8- - -
Running --
Part Good --
Part Trend --
Part Reject --
Running --
Part Good --
Part Trend --
Part Reject --
OUT IN OUT IN OUT
Batch code - Spindle Type (tipo mandri-
no) bit 1 (LSB)
- 77 -
Page 78
LAYOUT 13 [io-std13.iom] LAYOUT 14 [io-std14.iom] LAYOUT 15 [io-std15.iom]
IN
1 Batch code bit 7 (MSB) Data OK Batch code bit 7 (MSB)
2 Batch code bit 6 Get Zero (one shot) Batch code bit 6
3 Batch code bit 5 Next Page Batch code bit 5
Easy BOX U8IO
N°1
Easy BOX U8IO
N°2
Easy Box (NON
U8IO) N.1,2,3,4
Easy Box U4S 1 Start/Stop/Get Zero (T2) - Start/Stop/Get Zero (T2)
Easy Box U4P
M1 Wave N.
1,2,3,..16
Digi Crown I/O N°1
Digi Crown I/O N°2
4 Batch code bit 4 Message OK Batch code bit 4
5 Batch code bit 3 Batch D Batch code bit 3
6 Batch code bit 2 Batch C Batch code bit 2
7 Batch code bit 1 (LSB) Batch B Batch code bit 1 (LSB)
8 Start /Stop/Get Zero (T2) Batch A Start /Stop/Get Zero (T2)
1 Redo Step - -
2 Zeroing mode - -
3 Emergenza (attivo “low”) - -
4
5
6
7
8
1 Start/Stop/Get Zero (T2) - Start/Stop/Get Zero (T2)
1 - Data OK -
2 - Get Zero (one shot) -
3 - Next Page -
4 - Message OK -
1 Start/Stop/Get Zero (T2) - Start/Stop/Get Zero (T2)
1- - -
2- - -
3- - -
4- - -
5- - -
6- - -
7- - -
8- - -
1- - -
2- - -
3- - -
4- - -
5- - -
6- - -
7- - -
8- - -
Motor out --
Running --
Part Good --
Part Trend --
Part Reject -
OUT IN OUT IN OUT
- 78 -
Page 79

LAYOUT 18 [io-std18.iom] LAYOUT 22 [io-std22.iom] LAYOUT 23 [io-std23.iom]
IN
1 Start /Stop/Get Zero (T2) - Start/Stop (T2)
2 Zeroing mode - Redo step
3 Batch code bit 1 (LSB)* - Batch F
Easy BOX U8IO
N°1
Easy BOX U8IO
N°2
Easy Box (NON
U8IO) N.1,2,3,4
Easy Box U4S 1 - Start/Stop (T1) Start/Stop (T1)
Easy Box U4P
M1 Wave N.
1,2,3,..16
Digi Crown I/O N°1
Digi Crown I/O N°2
4 Batch code bit 2 - Batch E
5 Batch code bit 3 - Batch D
6 Batch code bit 4 (MSB) - Batch C
7 - - Batch B
8 - - Batch A
1 - - Zeroing mode
2 - - Next Zero step
3- - -
4- - -
5- - -
6- - -
7--
8--
1 Start/Stop (T1) Start/Stop (T1) Start/Stop (T1)
1 - Start (T3) Start (T3)
2 - Stop (T3) Stop (T3)
3 - Batch A Zeroing mode
4 - Batch B Next Zero Step
1 - Start/Stop (T1) Start/Stop (T2)
1 - - Start/Stop (T2)
2 - - Redo step
3 - - Batch F
4 - - Batch E
5 - - Batch D
6 - - Batch C
7 - - Batch B
8 - - Batch A
1 - - Zeroing mode
2 - - Next Zero step
3- - -
4- - -
5- - -
6- - -
7- - -
8- - -
* Binary value (0=Batch 1, 15= Batch 16)
OUT IN OUT IN OUT
* Binary value (Batch A=Batch 1, Batch
B=Batch 2)
- 79 -
Page 80
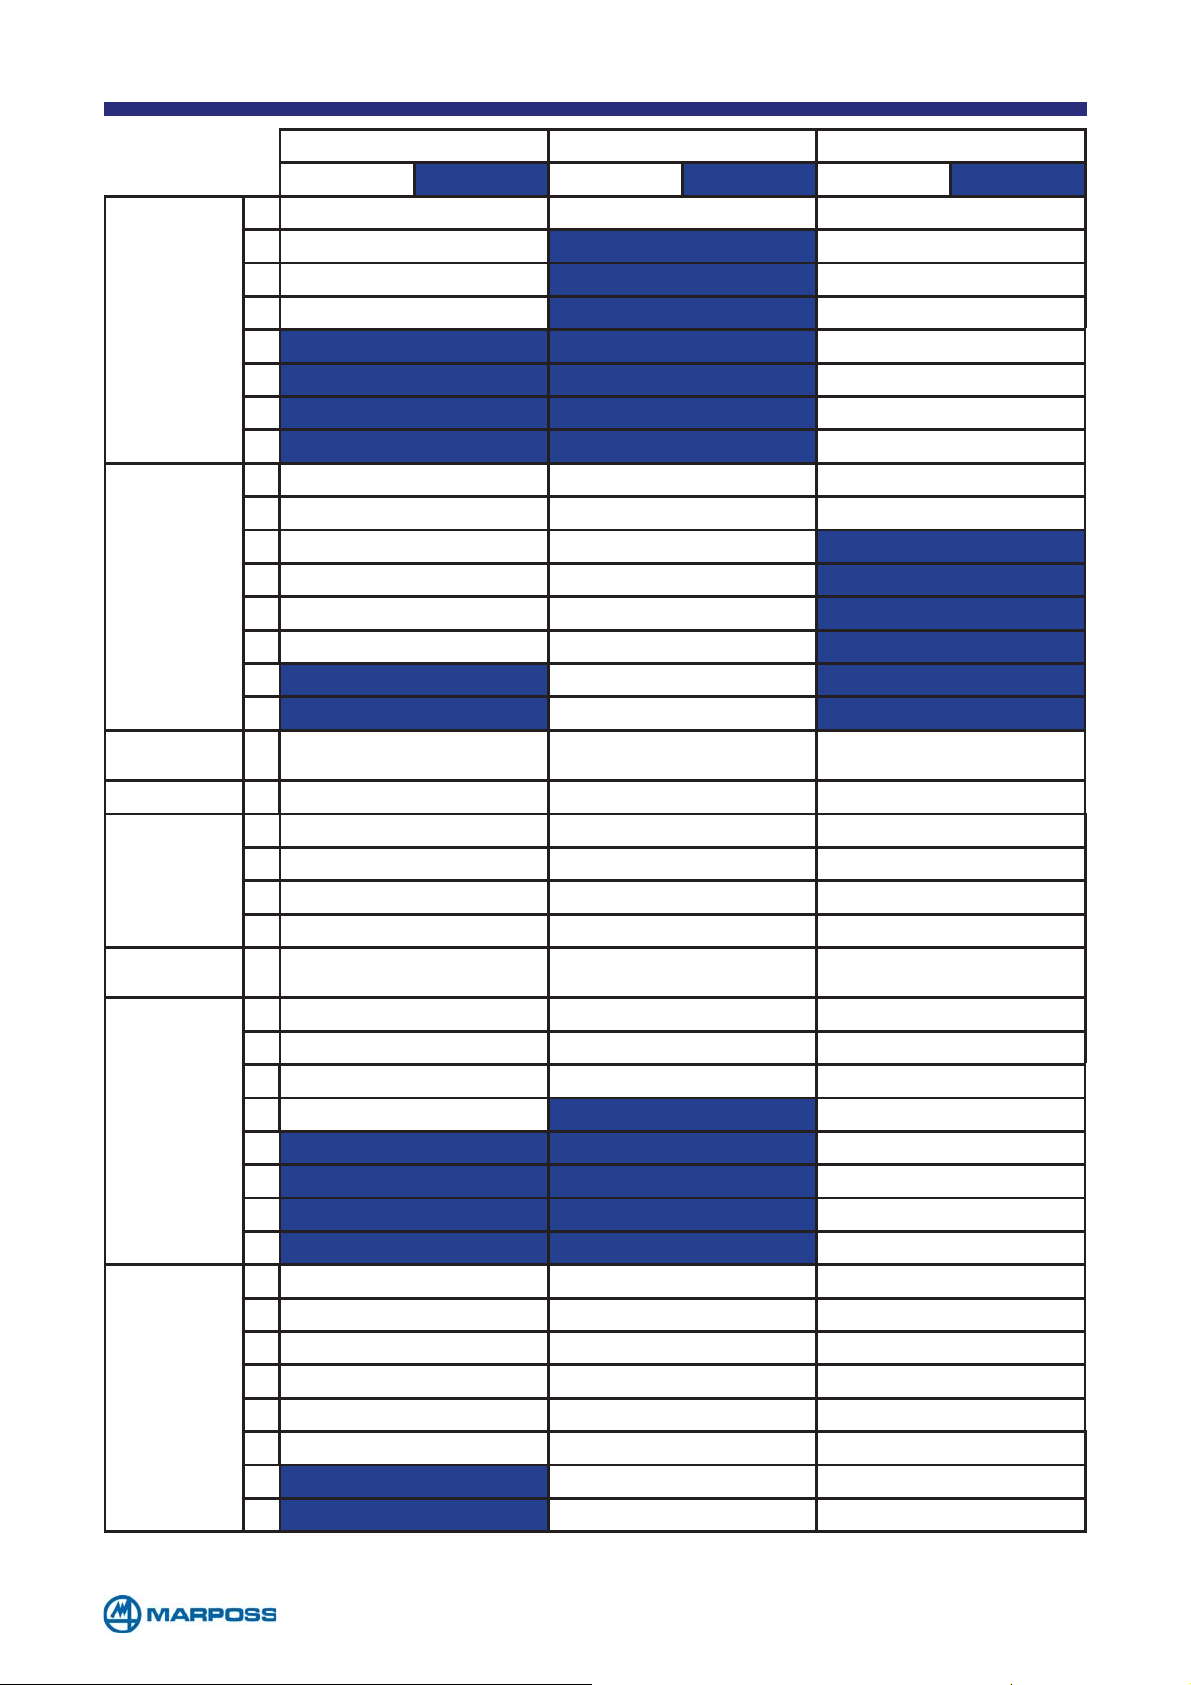
LAYOUT 24 [io-std24.iom] LAYOUT 25 [io-std25.iom] LAYOUT 26 [io-std26.iom]
IN
1 Start (T3) Start/Stop (T2) Batch code Bit4 (MSB)
2 Stop (T3)
3 Zeroing mode
Easy BOX U8IO
N°1
Easy BOX U8IO
N°2
Easy Box (NON
U8IO) N.1,2,3,4
Easy Box U4S 1 Start/Stop (T2) Start/Stop (T1) Start/Stop (T1)
Easy Box U4P
M1 Wave N.
1,2,3,..16
Digi Crown I/O N°1
Digi Crown I/O N°2
4 Next zero step Ready Batch code Bit1 (LSB)
5
6
7
8
1 Batch selection - -
2 Batch code bit3 (MSB) - -
3 Batch code bit2 -
4 Batch code bit1 (LSB) - Part Good
5 Disable stat - Part Reject
6 Redo Step - Error
7 Part trend - Part Trend
8 Running - Running
1 Start/Stop (T2) Start/Stop (T1) Start/Stop (T1)
1 Start (T3) Start (T3) Start (T3)
2 Stop (T3) Stop (T3) Stop (T3)
3 Zeroing mode Zeroing mode Zeroing mode
4 Next zero step Next zero step Next Zero Step
1 Start/Stop (T1) Start/Stop (T2) Start/Stop (T2)
1 Start (T3) Start/Stop (T2) -
2 Stop (T3) Batch code bit2 (MSB) -
3 Zeroing mode Batch code bit1 (LSB) -
4 Next zero step
5
6
7
8
1 Batch selection - -
2 Batch code bit3 (MSB) - -
3 Batch code bit2 - -
4 Batch code bit1 (LSB) - -
5 Disable stat - -
6 Redo Step - -
7
8 Running --
Ready Part good Zeroing mode
Part good Part trend Next Zero Step
Part reject Part reject Disable Stat
Error Cycle end Redo Step
Ready Part good -
Part good Part trend -
Part reject Part reject -
Error Cycle end -
Part trend --
OUT IN OUT IN OUT
Active batch code bit 2 (MSB) Batch code Bit3
Active batch code bit 1 (MSB) Batch code Bit2
Ready
Ready -
In the layout Nr.26 the batch changing is on
the level, in the layout Nr.3 the batch changing is on the edge
- 80 -
Page 81
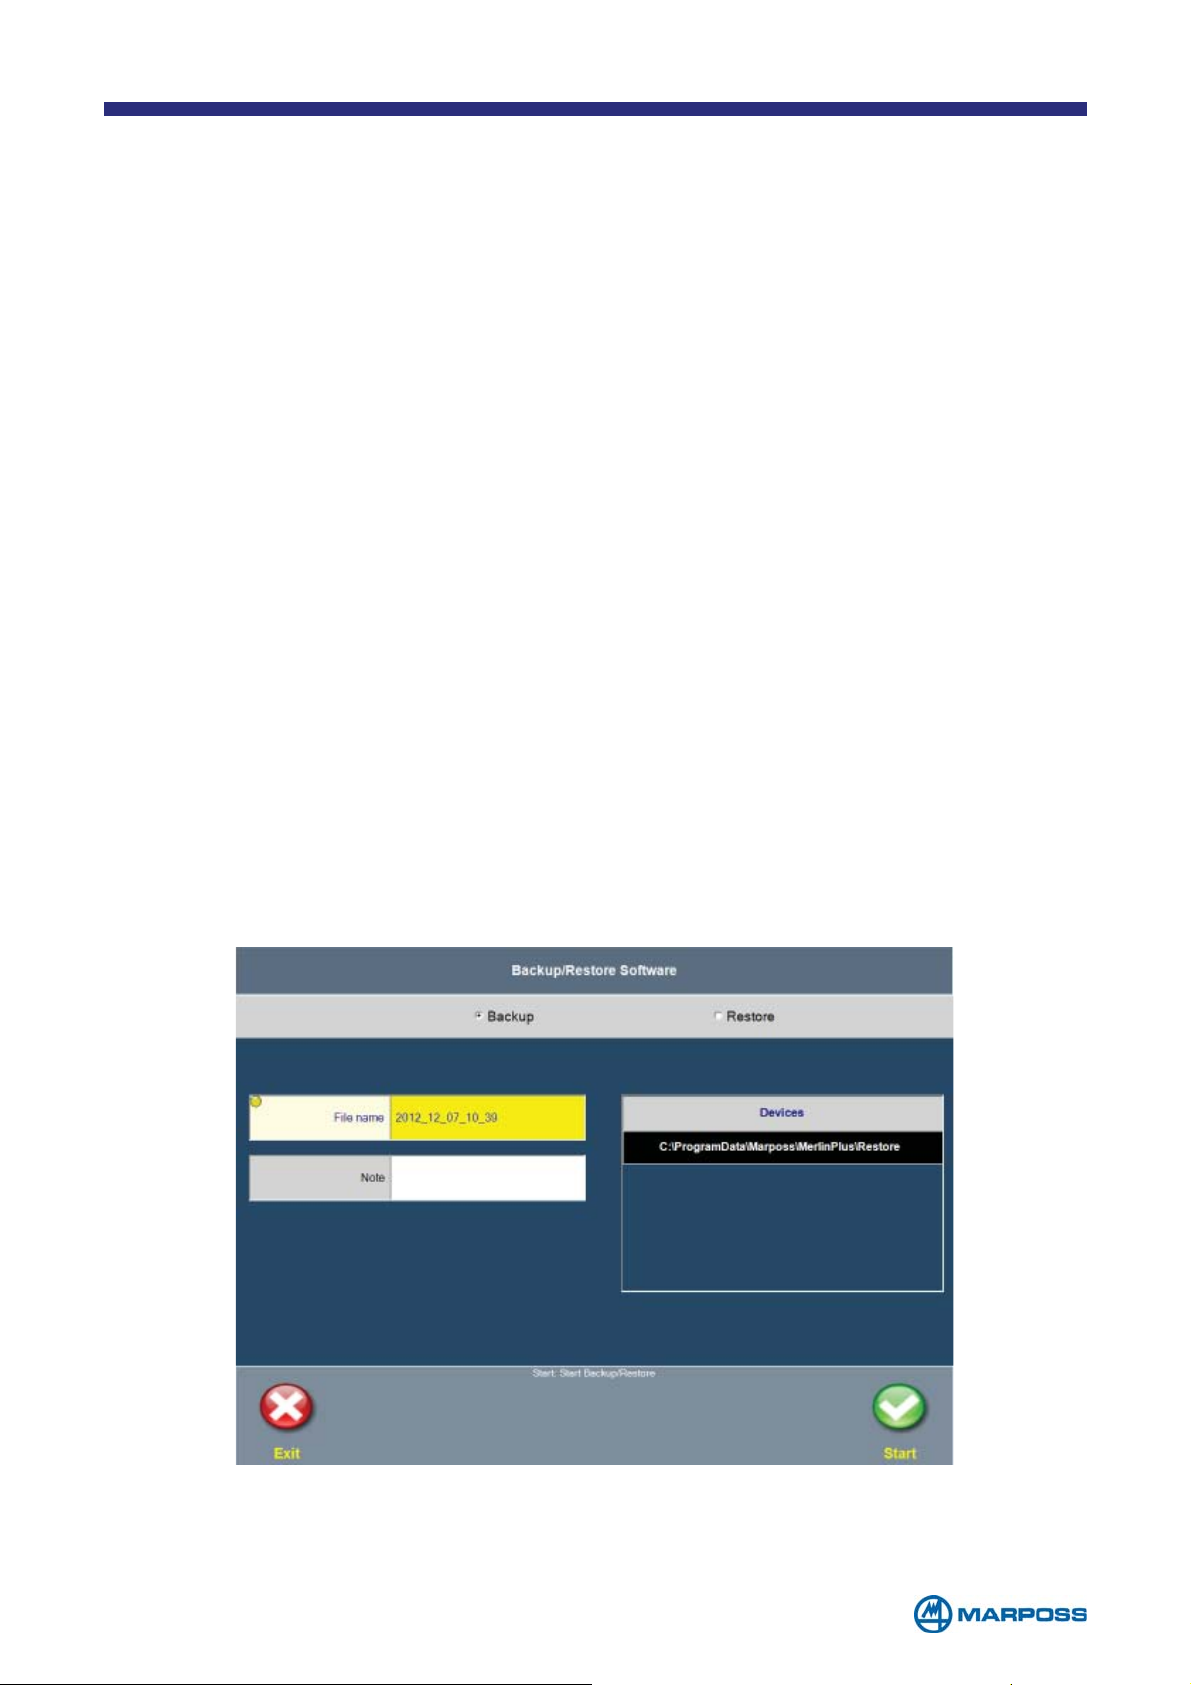
10 Backup & Restore
The ‘Backup and Restore’ included in Merlin enables the user to save a complete
copy of all programming, configuration and measurement data in a ZIP format file.
If necessary it is possible to restore the system using these data.
It is possible to run the Backup & Restore software either as a tool from the Merlin
software by tapping on an icon in the menu, or in stand-alone mode by running
the executable file in the Merlin installation path. Running the tool in stand-alone
mode should only be done as a precaution if Merlin fails to open properly. In such
cases, it is possible to create a backup of the archives and send it to customer
service in order to check the integrity.
The option may be accessed from the “Settings” menu and only if the user is
authorised to do so. In fact, it is possible to select between the following alternatives
during the user configuration phase:
• Do not authorise the user to access the tool
• Authorise Backup only
• Authorise Backup and Restore
10.1 Backup
When the tool is started, the following window appears, where the Backup is
normally selected:
- 81 -
Page 82
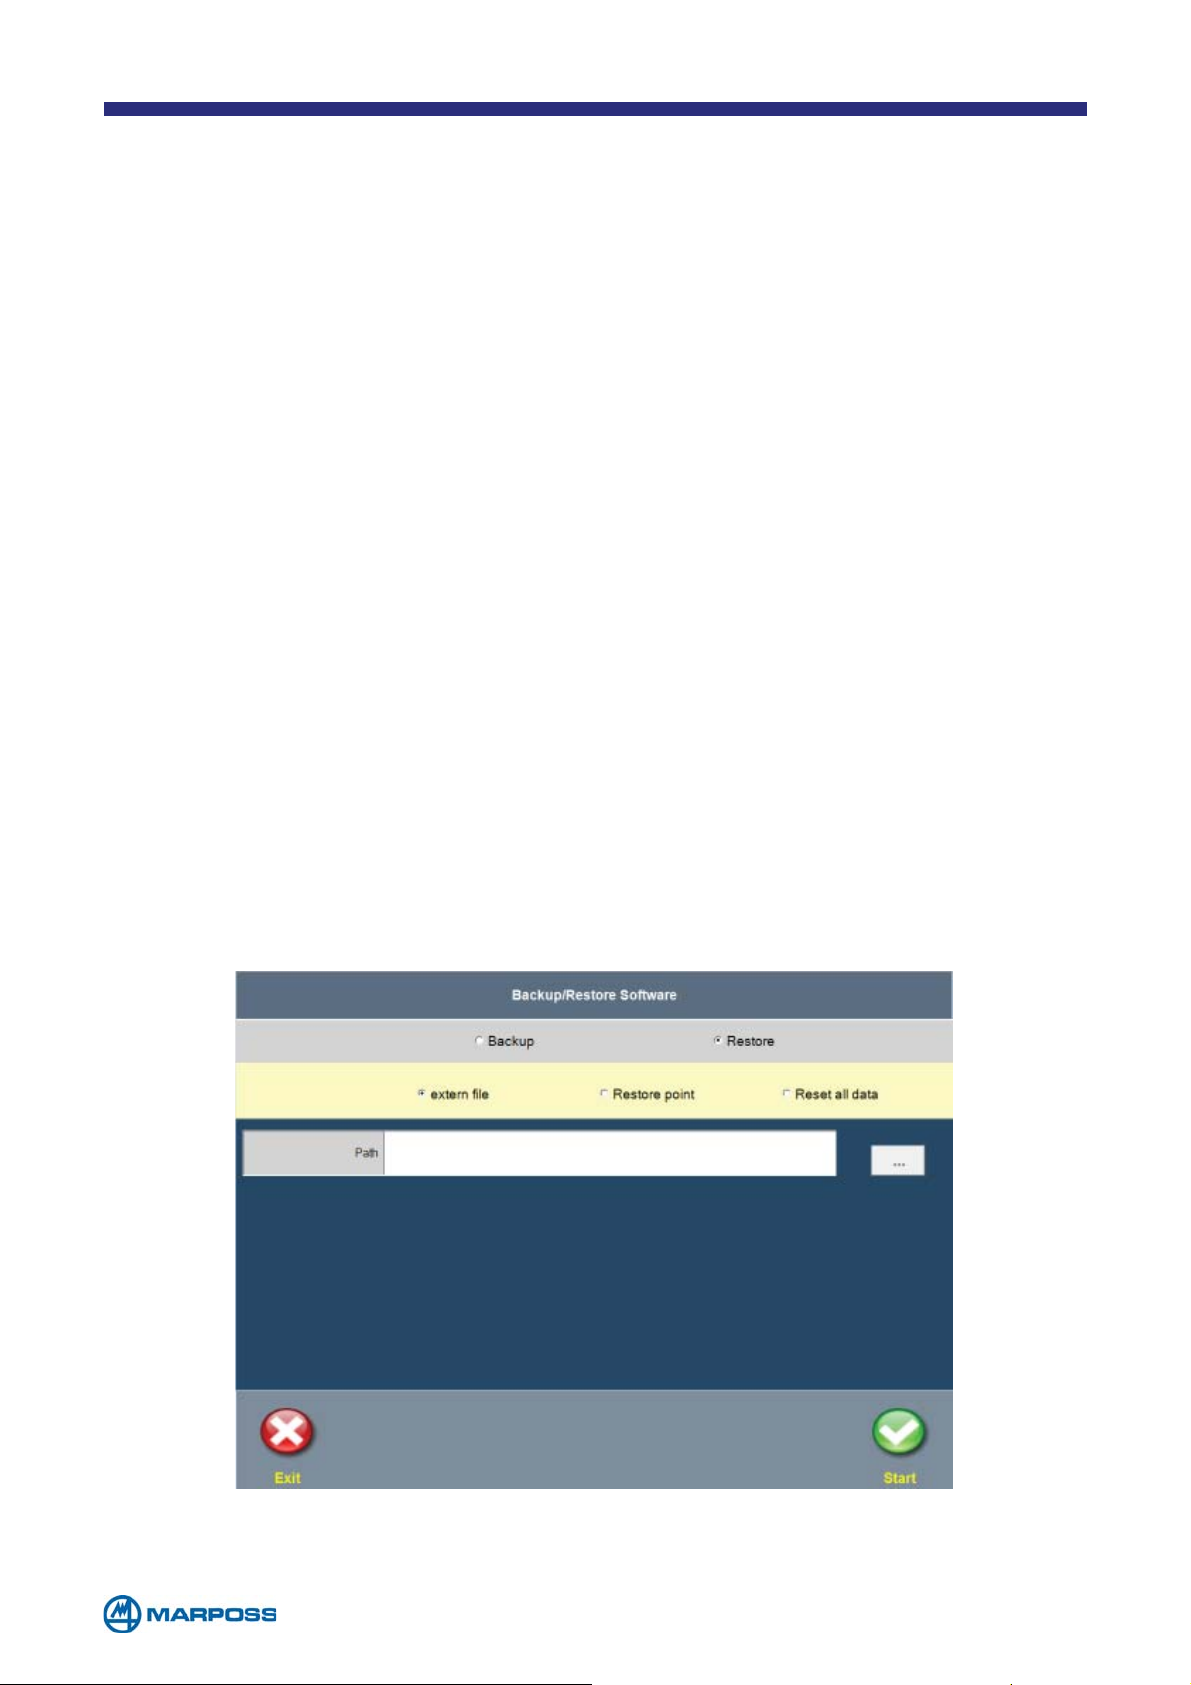
The default name of the file where the data backup will be saved appears,
consisting of the name of the computer and the current date and time, however
the user may modify it as desired. The N
OTES can be used to provide additional
information about the contents of the backup and are added to the comments in
the file.
The devices table on the right of the screen contains a list of the removable units
connected to the USB ports, which are updated in real time. If no devices are
present, the backup may be saved to a local folder, thereby creating a “restore
point”. To create the backup, tap on S
TART. Once the backup is complete, if an
external device is connected it will be disabled automatically so that it can be
removed safely.
10.2 Restore
Tap on the RESTORE option in the menu described above in order select one of the
following alternatives:
10.2.1 Restore from external file
To restore the system from a “ZIP” file on a device connected to a USB port,
select the path by tapping on the “…” button and choose the ZIP file containing
the desired backup.
Tap on the S
TART button to restore all the archives.
- 82 -
Page 83
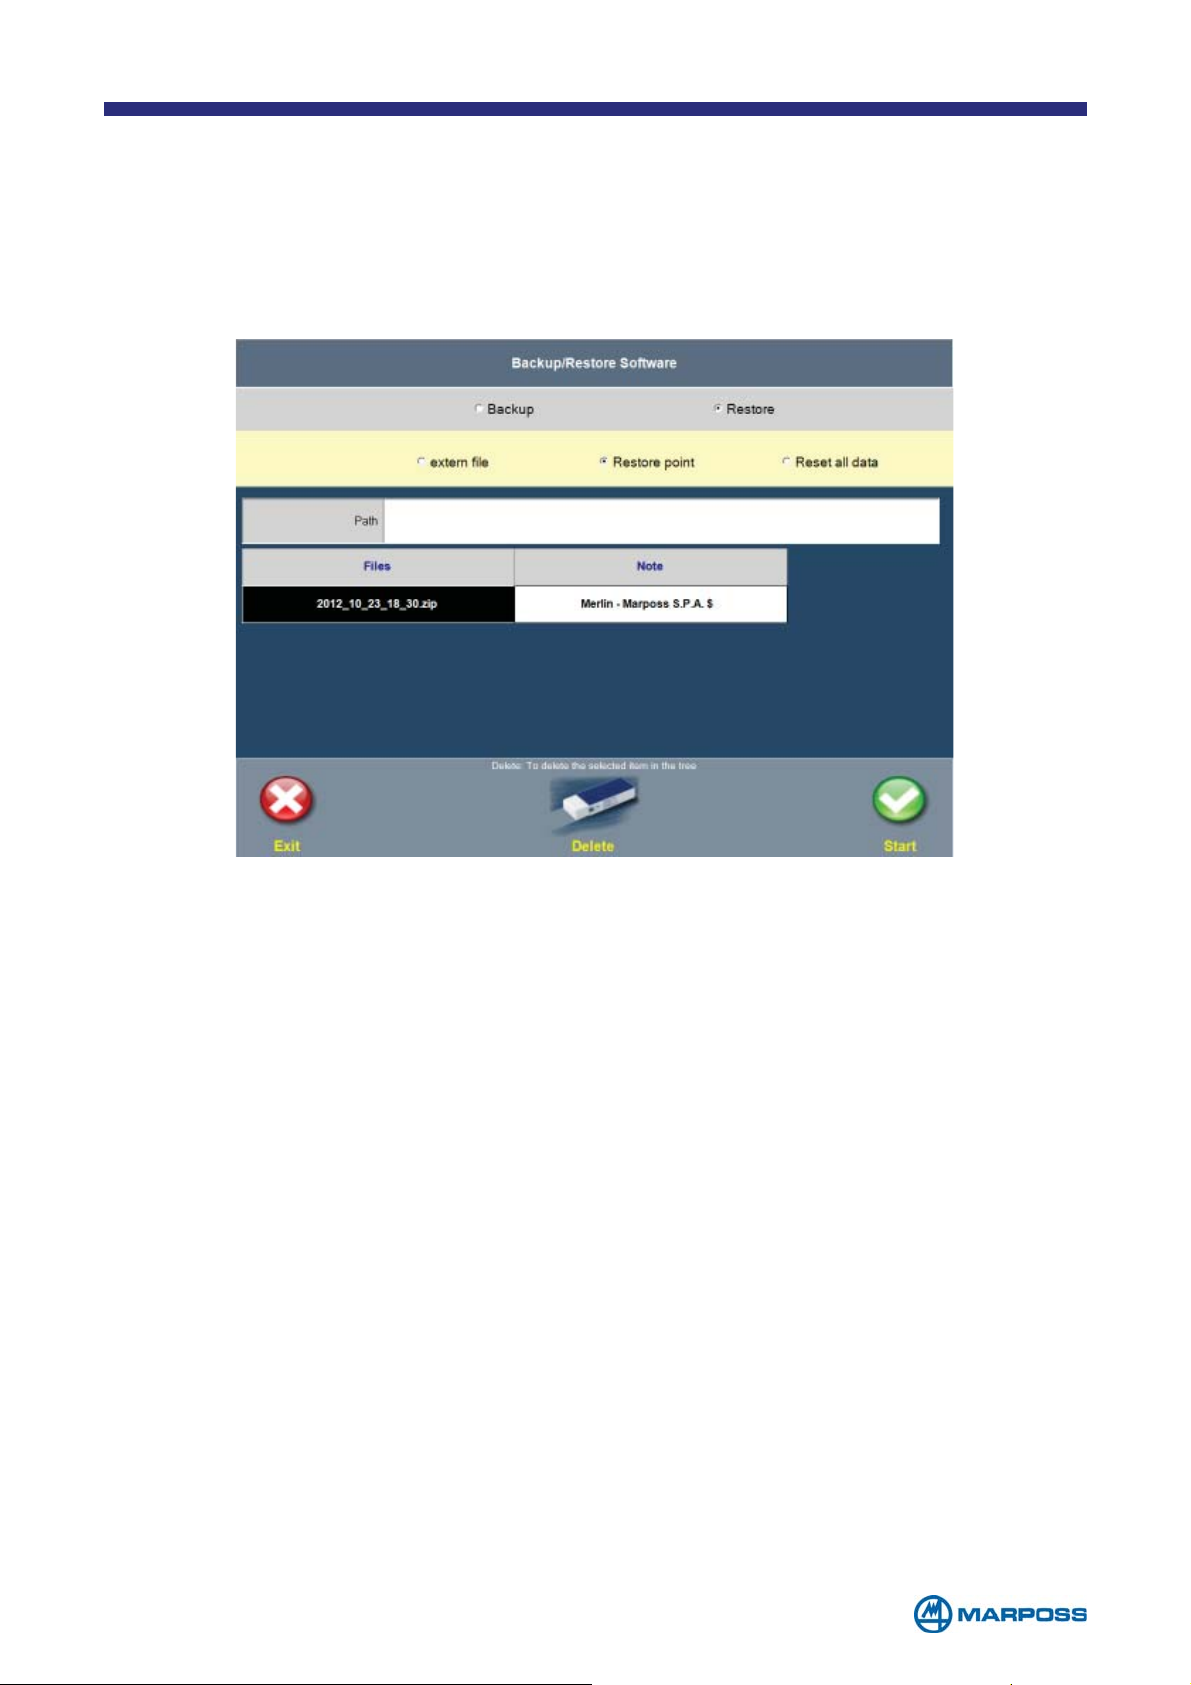
10.2.2 Restore from restore point
This option permits the user to restore the system from a restore point that has
been saved at some earlier date in the local folder.
Select a Backup from the list and the entire path will be displayed in the text box
above the grid, at this point, tap ‘S
TART’ to restore all the archives.
10.2.3 Reset all
The third option - ‘Reset all’ - deletes all the archives and restores the Merlin to its
initial state. After carrying out this procedure it is necessary to reconfigure all the
devices and re-enter all the programs.
- 83 -
Page 84

APPENDIX - Statistical analysis
General definition
BATCH
A set of similar measurements that are to be subjected to statistical analysis.
CHARACTERISTIC TYPE
Bilateral characteristic: this type of characteristic has no natural limits, therefore it is
necessary to indicate specification limits; e.g. a diameter that may have a dimension
greater or less than the design.
Single limit characteristic: this type of characteristic has a single limit indicating an
acceptability threshold, so only one specification limit need be indicated; e.g. a
breaking strain control, where the part is considered acceptable if the force required
to break it exceeds a certain level. This differs from a characteristic with a single,
upper limit if the acceptable threshold represents the maximum value that the
characteristic may assume.
Unilateral characteristic: this type of characteristic has a natural, “Insuperable” limit;
e.g. a parallelism that may not fall below 0. In this case, the specific limit is indicated,
as well as the physical limit, if other than zero.
TOLERANCE LIMITS
Two tolerance limits can be defined for a characteristic:
UTL - Upper Tolerance Limit: represents the upper specification limit
LTL - Lower Tolerance Limit: represents the lower specification limit.
TOLERANCE INTERVAL
Also know simply as tolerance, it represents the acceptable range of measurement
values for a given characteristic. It is determined using different methods, depending
on the characteristic type:
Bilateral characteristic: UTL - LTL
Unilateral characteristic: calculated as |TL - PL|, where TL is the tolerance limit and
PL is the physical limit (usually 0).
Single limit characteristic: cannot be calculated.
TOLERANCE MID-POINT
The mid-point of the tolerance interval.
It is determined using different methods, depending on the characteristic type:
Bilateral characteristic: (UTL – LTL) / 2
Unilateral characteristic: calculated as |TL - PL| / 2.
Single limit characteristic: cannot be calculated.
- 84 -
Page 85

Position indices
Mean - The sum of all the measurements carried out, divided by the number of
measurements.
Where:
x
is the ith measurement
i
N is the number of measurements
Dispersion indices
Range - The difference between the largest and the smallest value in a set of N
measurements
X
- X
Where
X
is the maximum value
max
X
is the minimum value
min
max
min
Standard deviation - Indicates the dispersion of the measurements. Given a set of
measurements:
Where
x
is the ith measurement
i
X is the mean measurement value
N is the number of measurements
NOTE: Standard deviation is also identified as SIGMA and represented
by the corresponding letter in the Greek alphabet (σ).
- 85 -
Page 86

Natural tolerance
Indicates the variability inherent in the measurements. It is determined using different
methods, depending on the characteristic type:
Bilateral or single limit characteristic
Natural Tolerance = 6*S
where S is the standard deviation of the measurements
Unilateral characteristic
with upper limit: Natural Tolerance = Minimum between (6*S) and (3*S + X)
with lower limit: Natural Tolerance = Minimum between (6*S) and (3*S - X)
Where:
S is the standard deviation of the measurements
X is the mean value of the measurements
In the case of the unilateral characteristics formula it is assumed that the natural
limit is 0. If the mean value X is closer to this 3*S limit, it means that, for this part of
the measurement, 3*S cannot be considered as dispersion, because, as the limit
is insuperable, the maximum dispersion value will be equivalent to the mean value.
Estimated process sigma (Sigma Hat)
When sample measurements are used to evaluate a process, instead of using the
standard deviation S to find its inherent variability, we use a formula and a series
of tables to estimate the process dispersion, taking into account the fact that the
measure-ments were obtained through a sampling method. The index calculated
in this way is known as Sigma Hat (σ). This dispersion index is based exclusively
on the variability within the samples, and does not take into account any variability between different samples that may have been taken at significantly different
periods. There are two formulas that can be used for estimating this dispersion:
the first is based on the Range of each sample, while the second is based on the
Standard Deviation of each sample.
Formula based on the sample ranges. In the above formulas, Ri represents the
range of the i
th
sample, Nc is the number of samples taken, and d2 refers to the
values in column of the same name in the tables found in the appendix, in the row
corresponding to number of measurements in the sample used.
^
^
- 86 -
Page 87

Process natural tollerance
Natural Tolerance is an attempt to express the variability inherent in a given process. The formula depends on how the measurements are distributed. As the aim
is to represent the variability of the process, we use the Sigma Hat, estimated
using the samples, rather than the Standard Deviation S used in the case of Natural Tolerance.
Bilateral or single limit characteristic
Process Natural Tolerance = 6 * σ
Where σ is the estimated process sigma
Unilateral characteristic
with upper limit: Process Natural Tolerance=Maximum between (6*σ) and (3*σ
+X)
^
with lower limit: Process Natural Tolerance=Minimum between (6*σ) and (3*σ-X)
Where: σ is the standard deviation of the measurements
X is the mean value of the measurements.
^
^
^
^^
^
^
Capability indices (Cp)
The process capacity is used as the reference index when Process is selected as the
statistical scope of the batch. It is only calculated in the case of bilateral characte-
ristics, using the following formula:
Where
LST – LIT = Tolerance interval
^
6*σ = Process natural tolerance
NOTE: The Cp index is calculated only if control charts are provided for the
characteristic.
CpK
This represents the process critical capacity. It is the reference index when the
statistical aim of the batch has been indicated as Process. It is calculated using
different methods, depending on the characteristic type:
Bilateral characteristic:
Cpk = Minimum value between:
(2 * (UTL – X)) / (6*σ)
(2 * (X – LTL)) / (6*σ)
where
UTL = Upper Tolerance Limit
LTL = Lower Tolerance Limit
X = mean measurement value
^
σ = estimated deviation of the measurements
^
^
- 87 -
Page 88

Unilateral or single limit characteristic:
upper limit only; Cpk = (2*(TL – X)) / (6*σ)
lower limit only Cpk =(2*(X – TL)) / (6*σ)
Where:
TL = Tolerance limit <> 0
X = mean measurement value
^
σ= estimated deviation of the measurements
^
^
Quality control chart
Standard XR and XS chart for bilateral or unilateral characteristics. The following table
lists the possible chart types. Consult the relevant paragraph for the formulas used to
calculate the control limits.
Chart name Dispersion index
Standard XR chart
Range
(Shewhart XR chart)
Standard XS chart
Sigma
(Shewhart XS chart)
The XR and XS charts are based on a series of values known as Control Limits that are
used to control the process trend; these limits can be calculated beforehand, based on
the characteristic specification limits.
The following formulas are used to calculate them: the values A, D1, D2, E7, E6, B5 and B6
indicate the values in the columns of the same name in the tables found in the appendix, in
the row corresponding to number of measurements in the sample used.
Vn is the bilateral characteristic tolerance mid-point; whereas, if the variable is unilateral, it
is assumed that Vn=0 and one of the two limits is null.
Cpo is the optimum capacity index to be achieved for the process. At the moment this is
equivalent to 1 in the case of bilateral characteristics, and 1.33 for unilateral characteristics.
Pre-set control limits for the X chart
LCL = Vn – (A x (UTL-LTL))/ (6*Cpo))
UCL = Vn + (A x (UTL-LTL))/ (6*Cpo))
Pre-set control limits for the R chart
LCL = D1 x (UTL-LTL)/ (6*Cpo)
UCL = D2 x (UTL-LTL)/ (6*Cpo)
Pre-set control limits for the R chart
LCL = B5 x (UTL-LTL)/(6*Cpo)
UCL = B6 x (UTL-LTL)/(6*Cpo)
Forming the samples
and notes
A consecutive number of
measurements between
2 and 15
A consecutive number of
measurements between
2 and 15
- 88 -
Page 89

Calculated control limits
The XR and XS charts are based on a series of values known as Control Limits that
are used to control the process trend; these limits can be calculated by using the
appropriate sample measurement formulas (if possible, after having completed a
chart consisting of 25 samples, with no out of control alarms).
In the following formulas, the values A, D1, D2, E7, E6, B5 and B6 indicate the values
in the columns of the same name in the tables found in the appendix, in the row
corresponding to number of measurements in the sample used. The value Xm
indicates the mean sample value, and Sm indicates the mean sigma value of the
samples.
Chart name X CHART R CHART S CHART
Standard XR chart
(Shewhart XR
chart)
Standard XS chart
(Shewhart XS
chart)
LCL: Xm – Rm*A2
UCL: Xm+Rm*A2
LCL: Xm – Sm*A3
UCL:Xm+ Sm*A3
LCL:Rm*D3
-
UCL:Rm*D4
LCL:Sm*B3
UCL:Sm*B4
- 89 -
Page 90

Table of coefficients
Sample
size
2 2.121 3.686 0.000 2.606 0.000 4.494 0.305 1.128 .7979
3 1.732 4.358 0.000 2.276 0.000 3.979 0.498 1.693 .8862
4 1.500 4.698 0.000 2.088 0.000 3.686 0.638 2.059 .9213
5 1.342 4.918 0.000 1.964 0.000 3.491 0.749 2.326 .9400
6 1.225 5.078 0.000 1.874 0.029 3.491 0.749 2.534 .9515
7 1.134 5.203 0.205 1.806 0.113 3.491 0.749 2.704 .9594
8 1.061 5.307 0.387 1.751 0.179 3.491 0.749 2.847 .9650
9 1.000 5.394 0.546 1.707 0.232 3.491 0.749 2.970 .9693
10 0.949 5.469 0.687 1.669 0.276 3.491 0.749 3.078 .9727
11 0.905 5.534 0.812 1.637 0.313 3.491 0.749 3.173 .9754
12 0.866 5.592 0.924 1.610 0.346 3.491 0.749 3.258 .9776
13 0.832 5.646 1.026 1.585 0.374 3.491 0.749 3.336 .9794
AD2D1B6B5E7E6D2C4
14 0.802 5.693 1.121 1.563 0.399 3.491 0.749 3.407 .9810
15 0.775 5.737 1.207 1.544 0.421 3.491 0.749 3.472 .9823
16 0.750 5.779 1.285 1.526 0.440 3.491 0.749 3.532 .9835
17 0.728 5.817 1.359 1.511 0.458 3.491 0.749 3.588 .9845
18 0.707 5.854 1.426 1.496 0.475 3.491 0.749 3.640 .9854
19 0.688 5.888 1.490 1.483 0.490 3.491 0.749 3.689 .9862
20 0.671 5.922 1.548 1.470 0.504 3.491 0.749 3.735 .9869
21 0.655 5.950 1.606 1.459 0.516 3.491 0.749 3.778 .9876
22 0.640 5.979 1.659 1.448 0.528 3.491 0.749 3.819 .9882
23 0.626 6.006 1.710 1.438 0.539 3.491 0.749 3.858 .9887
24 0.612 6.031 1.759 1.429 0.549 3.491 0.749 3.895 .9892
25 0.600 6.058 1.804 1.420 0.559 3.491 0.749 3.931 .9896
- 90 -
Page 91

Sample
A2 D4 D3 A3 B4 B3 E2 E3
size
2 1.880 3.267 .000 2.659 3.267 .000 2.660 3.760
3 1.023 2.575 .000 1.954 2.568 .000 1.772 3.385
4 0.729 2.282 .000 1.628 2.266 .000 1.457 3.256
5 0.577 2.115 .000 1.427 2.089 .000 1.290 3.191
6 0.483 2.004 .000 1.287 1.970 .030 1.184 3.153
7 0.419 1.924 .076 1.182 1.882 .118 1.109 3.129
8 0.373 1.864 .136 1.099 1.815 .185 1.054 3.109
9 0.337 1.816 .184 1.032 1.761 .239 1.010 3.095
10 0.308 1.777 .223 0.975 1.716 .284 0.975 3.084
11 0.285 1.744 .256 0.927 1.679 .321 0.946 3.076
12 0.266 1.716 .284 0.886 1.646 .354 0.921 3.069
13 0.249 1.692 .308 0.850 1.618 .382 0.899 .063
14 0.235 1.671 .329 0.817 1.594 .406 0.881 3.058
15 0.223 1.652 .348 0.789 1.572 .428 0.864 3.054
16 0.212 1.636 .364 0.763 1.552 .448 0.849 3.050
17 0.203 1.621 .379 0.739 1.534 .466 0.836 3.047
18 0.194 1.608 .392 0.718 1.518 .482 0.824 3.044
19 0.187 1.596 .404 0.698 1.503 .497 0.813 3.042
20 0.180 1.586 .414 0.680 1.490 .510 0.803 3.040
21 0.173 1.575 .425 0.663 1.477 .523 0.794 3.038
22 0.167 1.566 .434 0.647 1.466 .534 0.785 3.036
23 0.162 1.557 .443 0.633 1.455 .545 0.778 3.034
24 0.157 1.548 .452 0.619 1.445 .555 0.770 3.033
25 0.153 1.541 .459 0.606 1.435 .565 0.763 3.032
- 91 -
Page 92
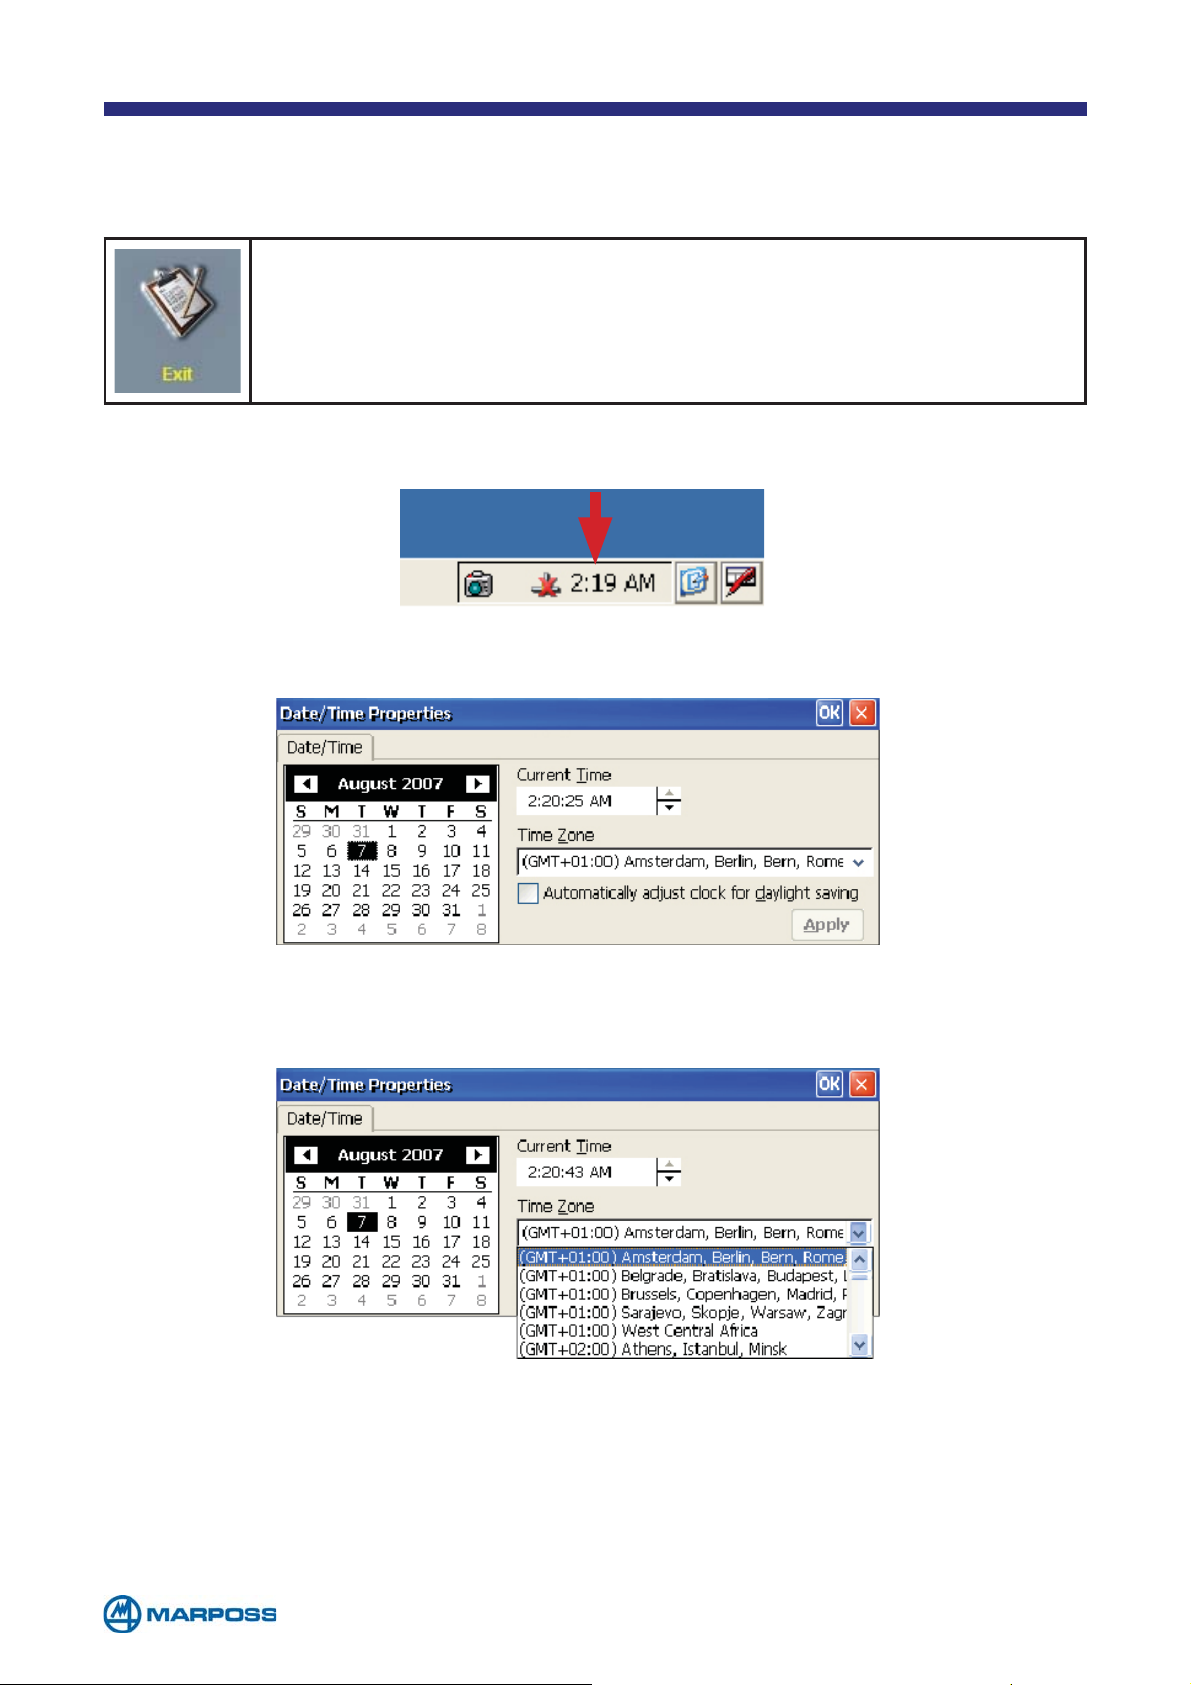
APPENDIX - Configuring the Windows® CE Operating System
Changing the Merlin date/time
From the menu tap on the EXIT button to exit the measurement software. Merlin enters the Windows® CE Operating System.
Double tap on the digital clock displayed in the bottom right hand corner of the screen.
The date/time setting Windows® is displayed.
Select the desired time zone from the drop down menu.
- 92 -
Page 93
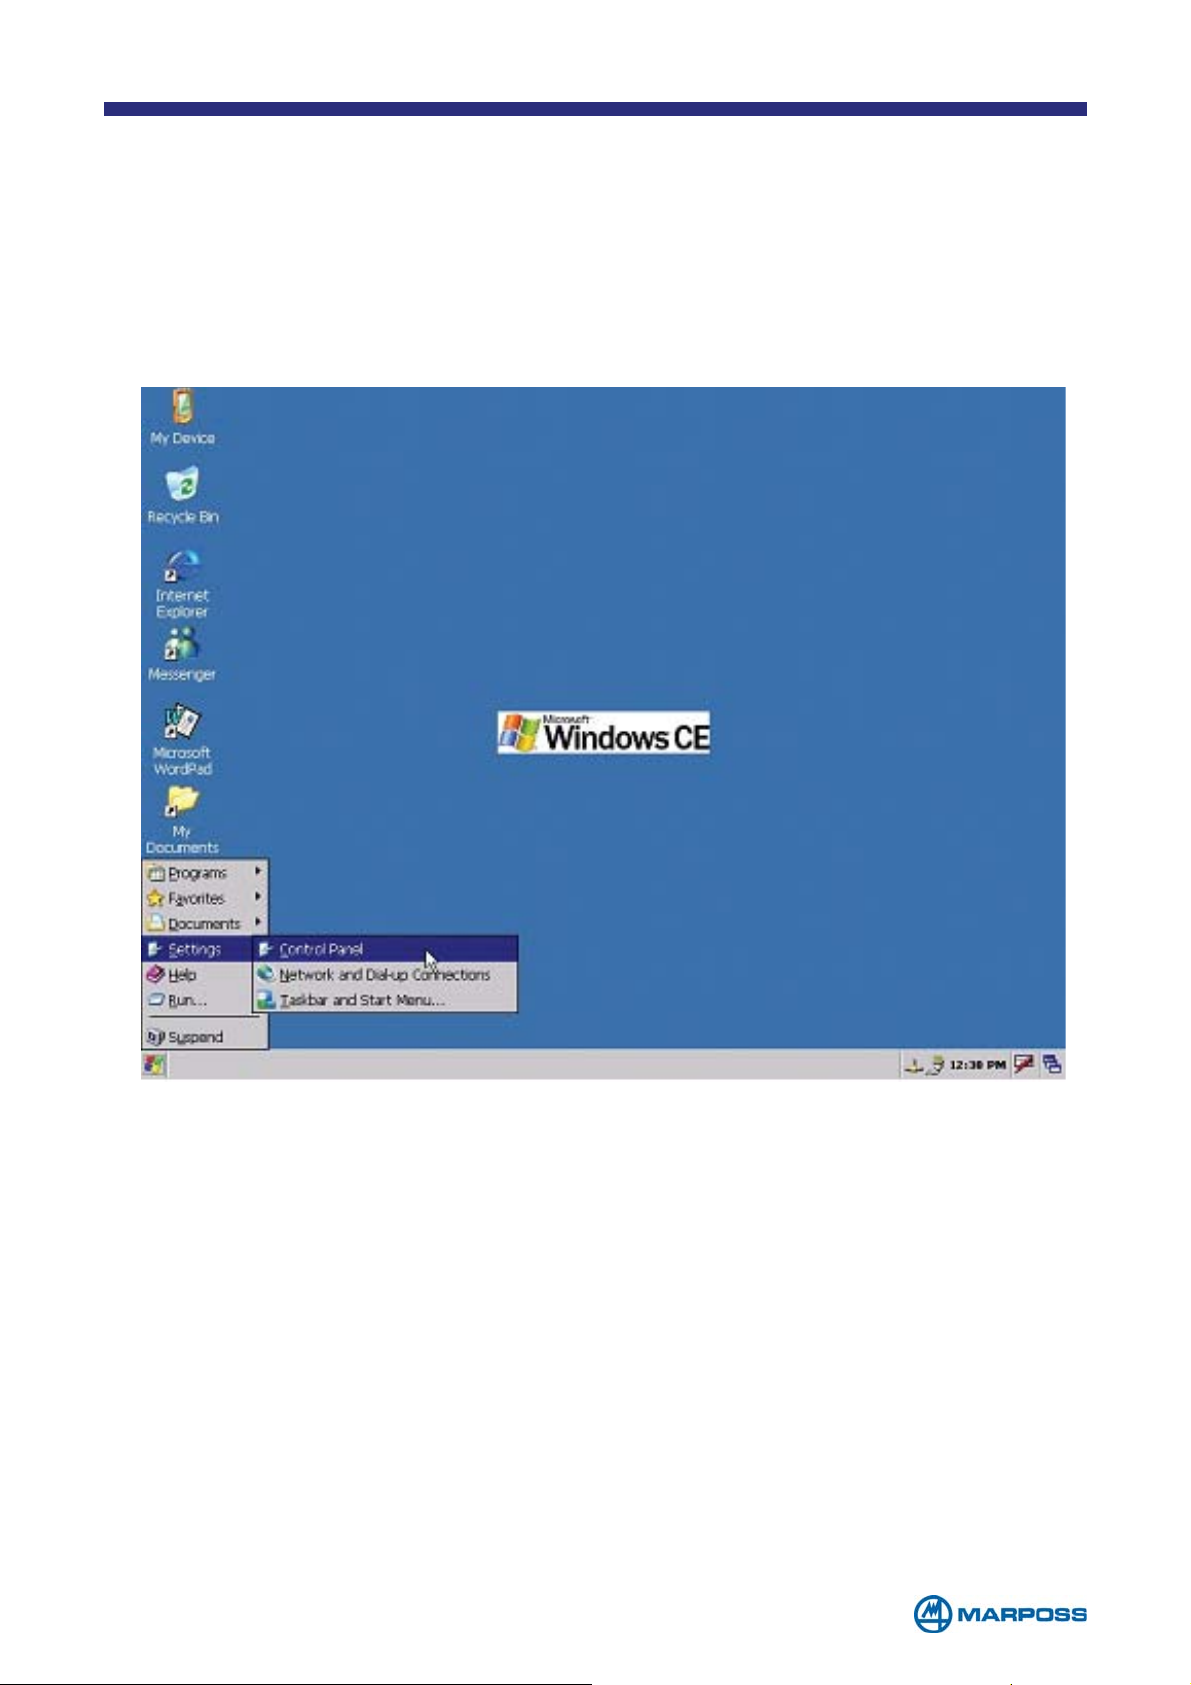
Calibrating the touch-screen
• Connect a USB keyboard to the system.
• Tap S
TART MENU on the operating system desktop.
• Select Settings\Control Panel.
• Select the Stylus function.
• Use the Calibrate function to activate the touch-screen calibration procedure.
• Tap and hold the cross displayed on the screen for a few seconds. After tapping
the cross five times, the procedure should be complete.
Tap Enter on the keyboard to store the settings.
- 93 -
Page 94

Creating a Merlin-to-PC Ethernet Link
The following procedure defines the steps necessary to link the Merlin to a PC. Specifically, we are creating a network with the PC as the “host” and Merlin as its “guest.” The
purpose of the connection is for simple file sharing of statistical and measurement data.
Interactivity other than basic file sharing is limited at this time.
Hardware Requirements
The hardware required to link Merlin to a PC is varied depending on the type of network
being set up. Wireless Cards, Routers, Bluetooth Adaptors, Internet Connectivity and
similar technologies offer a multitude of networking options. The configuration used in
this example details a basic ‘wired’ LAN/Ethernet connection. The minimum hardware
requirements to create such a connection should be a HUB, two (2) LAN/Ethernet cables and a USB keyboard.
Software
The perpetual software upgrades and releases of both Windows and of Mar-poss’ Merlin Gage Computer inherently create a ‘gap’ in uniformly defining a Network creation
procedure. In our example, we are using Windows XP and Merlin.
Hardware Set-up
1. Plug one end of the LAN/Ethernet cable into the back of the PC and the other end
into the HUB.
2. Plug one end of the second LAN/Ethernet cable into the HUB and the other end into
Merlin’s LAN jack.
3. Power up both systems.
Windows CE set-up (on MERLIN)
1. Plug the USB keyboard into Merlin and navigate to Windows CE desktop
2. From the Windows CE Start Up window, select “S
ETTINGS”->“NETWORK & DIAL-UP
CONNECTIONS”
3. Right-Click the pre-loaded LAN icon (SMSC911X1)
4. Select “S
PECIFY AN IP ADDRESS”
5. Enter the PC’s IP address and Subnet Mask here
NOTE: it is imperative that you have/obtain the PC’s IP number and Subnet Mask. The simplest way to acquire these numbers is to open “C
P
ROMPT” from the accessory menu, type in ipconfig and press Enter.
OMMAND
6. Click on “N
AME SERVERS” tab.
7. Enter the PC’s IP address in the Primary DNS line
8. Click OK
9. Return to Windows CE desktop
- 94 -
Page 95

Windows XP Set-up (Laptop, PC, etc)
1. Create and Name a folder on the PC’s main storage drive (C:/stats_meas)
2. Right-Click on the folder and select “
3. Place a check mark in the “S
4. Place a check mark in the “A
HARE THIS FOLDER ON THE NETWORK”
LLOW NETWORK USERS TO CHANGE MY FILES”
SHARING AND SECURITY” options
5. A file sharing folder icon now appears on the folder
Gauging Software Set-up (on the Merlin)
1. Boot up Merlin application
2. Enter Global Set-up Form
3. Click on the “E
XPORT DEFAULT PATH ” entry box”
Enter the following: \\computer name\created folder’s name\
4. Press Enter
5. Set Automatic data export to “M
EASUREMENTS AND STATISTICS”
6. Set Automatic Change, Data Export format and Statistical Study preferences
7. Press OK
8. Go to Batch Definition page and set Automatic Data Export to “M
S
TATISTICS” and choose Automatic preferences
EASUREMENTS AND
9. Press OK
10. The Merlin is now set up to send Measurement & Statistical information to the PC
NOTE: a “Computer Name” “User” “Password” screen may appear at the
first batch exchange. If this window appears, enter the name of the computer
(this can be found by right-clicking ‘My Computer’).
- 95 -
Page 96

Network connecting guidelines
Here are some guidelines, concerning the connection of a Merlin CE5 to a network
share in a server on a different subnet IP:
We have a Merlin device (with Windows CE v. 5 as operating system) from which we
need to access to a network share (1) on a Windows Server 2000 (or 2003).
The Windows server and Merlin are on different IP subnets separated by a router (you
can understand also that Merlin and server are in different VLANs (2) or, the server is in
a DMZ(3)).
With a default IP configuration on the Merlin, while trying to access the network share of
the server you receive an error message looks like ‘bad network path’.
To let the Merlin becomes able to reach that network share (typically trying to access
to something like \\servername\sharename) we have to modify the configuration of the
Merlin TCP/IP parameters adding a WINS server address which belongs to the same
IP subnet of the server (if a value is already present it has to be replaced with the new
one). Typically you can configure this value using the IP address of the Windows server
you need to access to.
Follows the Windows command to access a network share:
from Start / run you can type \\servername\sharename (or \\server_IP_address\sharename) if an authentication is required, a login menu (in which you have to type username
and password) will be prompted.
DOS commands to “map” and access a network share:
net use * \\servername\sharename /user:domain\username ---> this is the mapping
command (a password will be asked)
dir \\servername\sharename ---> this is the command to list the content of the share
‘net help use’ shows a help panel of the ‘net’ command
Glossary:
(1) Network share http://en.wikipedia.org/wiki/Shared_resource
(2) VLAN http://en.wikipedia.org/wiki/Vlan
(3) DMZ http://en.wikipedia.org/wiki/DMZ_(computing)
Windows CE http://en.wikipedia.org/wiki/Windows_ce
- 96 -
Page 97
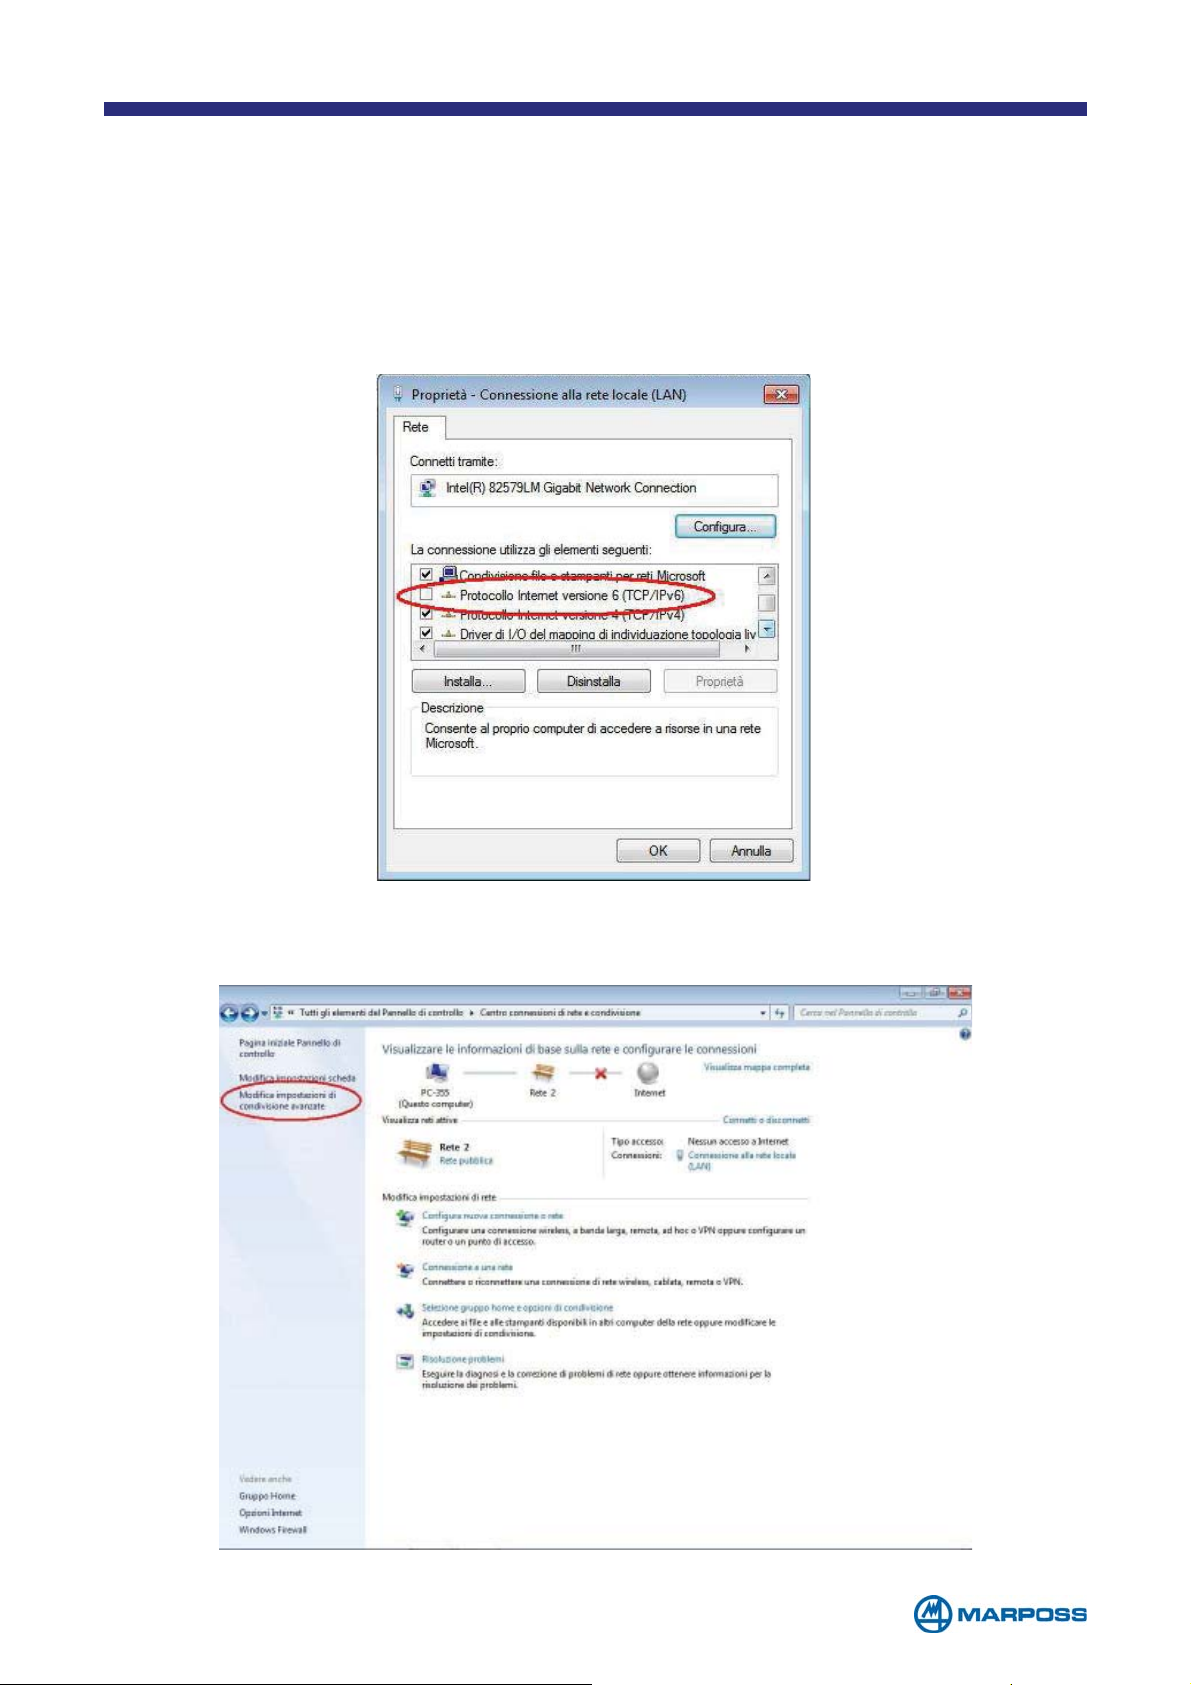
Network Connection Merlin Windows CE 5.0 – PC desktop
Windows 7
This document shows how to connect in a network a PC desktop (operating system Windows7) with a Merlin (operating system Windows CE 5.0)
Shows the settings of the network board inside the PC then disabling the option
“Internet Protocol version 6 (TCP/IPv6). See the picture 1 below.
Picture 1
Entering on the “Control Panel”->”Network Connection Center …” then select
“Modify advanced sharing settings” like in the picture 2 below.
- 97 -
Picture 2
Page 98
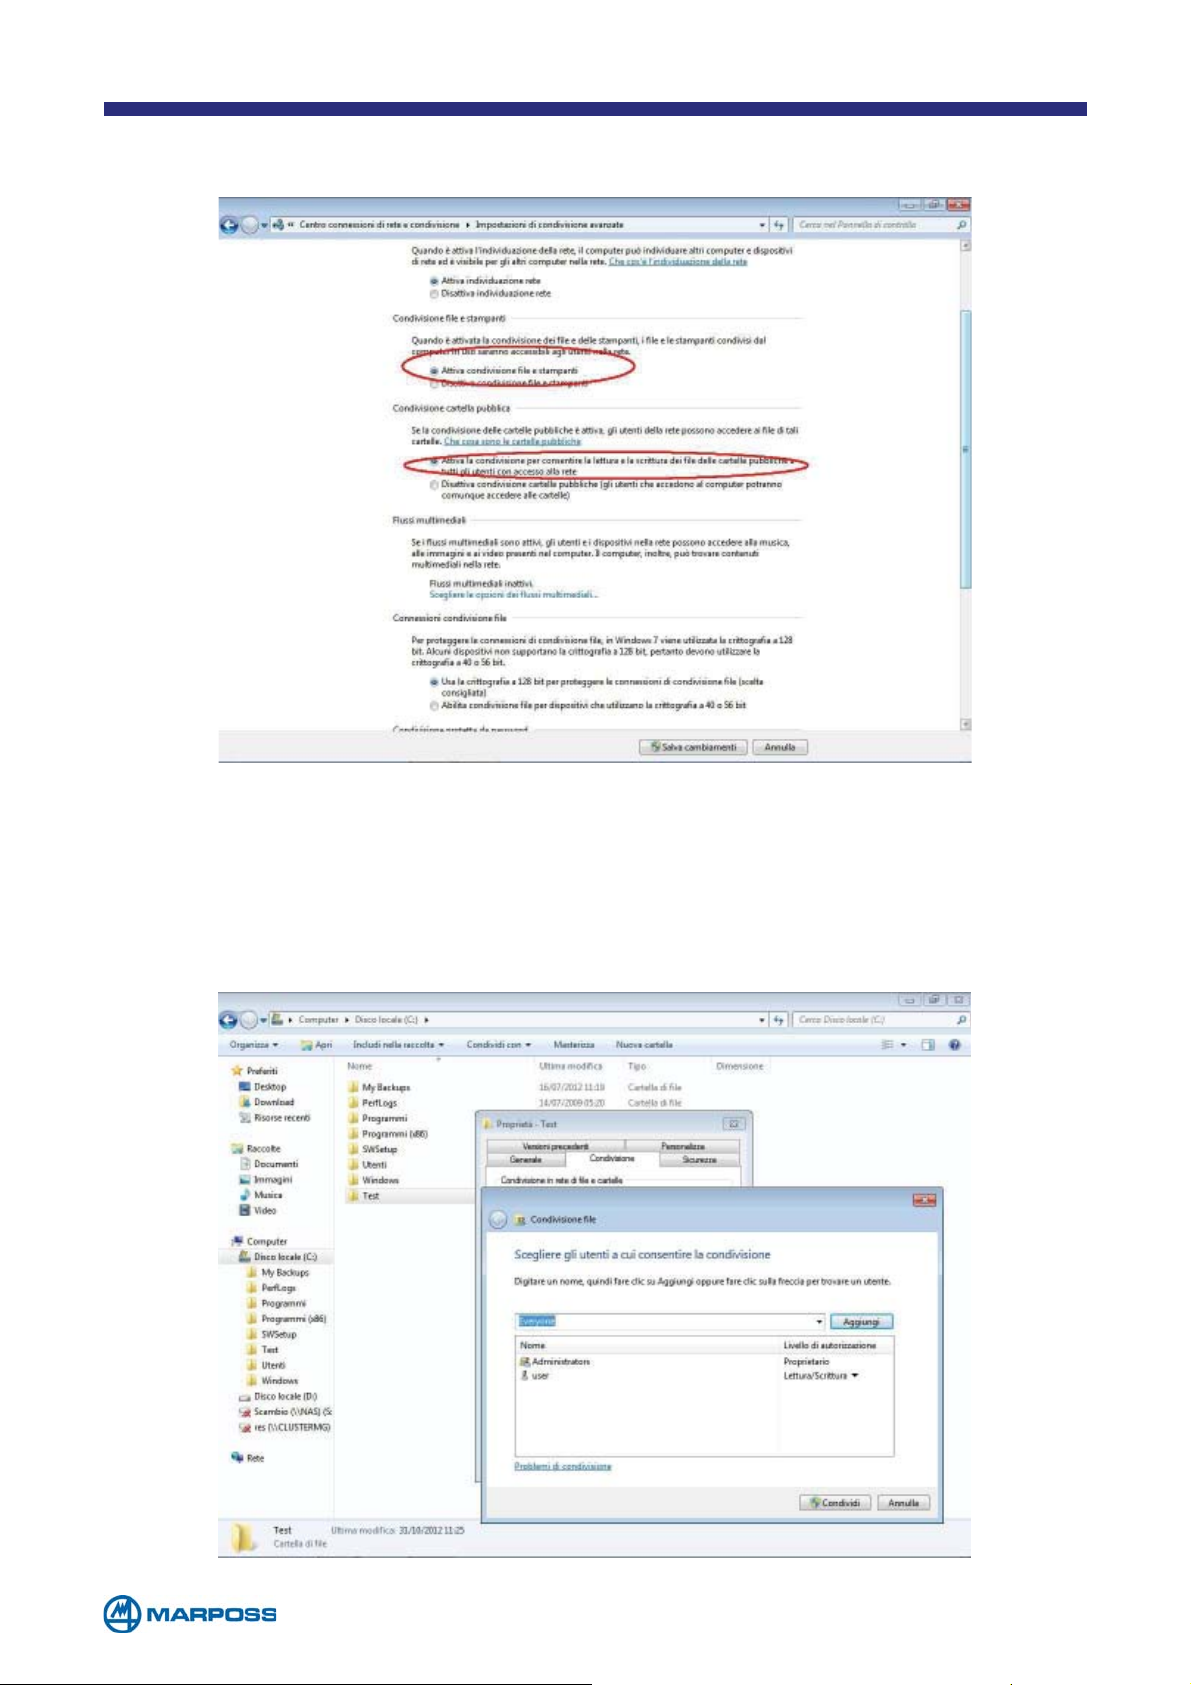
Tick the option of sharing files and printers then allow to the users any operation
on reading/writing and then save the changes. See the picture 3 below.
Picture 3
Create the folder for sharing. Picture 4 shows the folder “Test” created. Tap on the
right button of the mouse on the folder created and select “Properties”. Enter on
the Tab “Sharing”, then tap on the button “Share” and select “Everyone”
from the combo and then tap on “Add”. Modify the “Authorization level”, from “Reading” to “Reading/Writing”. Tap on “Share”.
- 98 -
Picture 4
Page 99
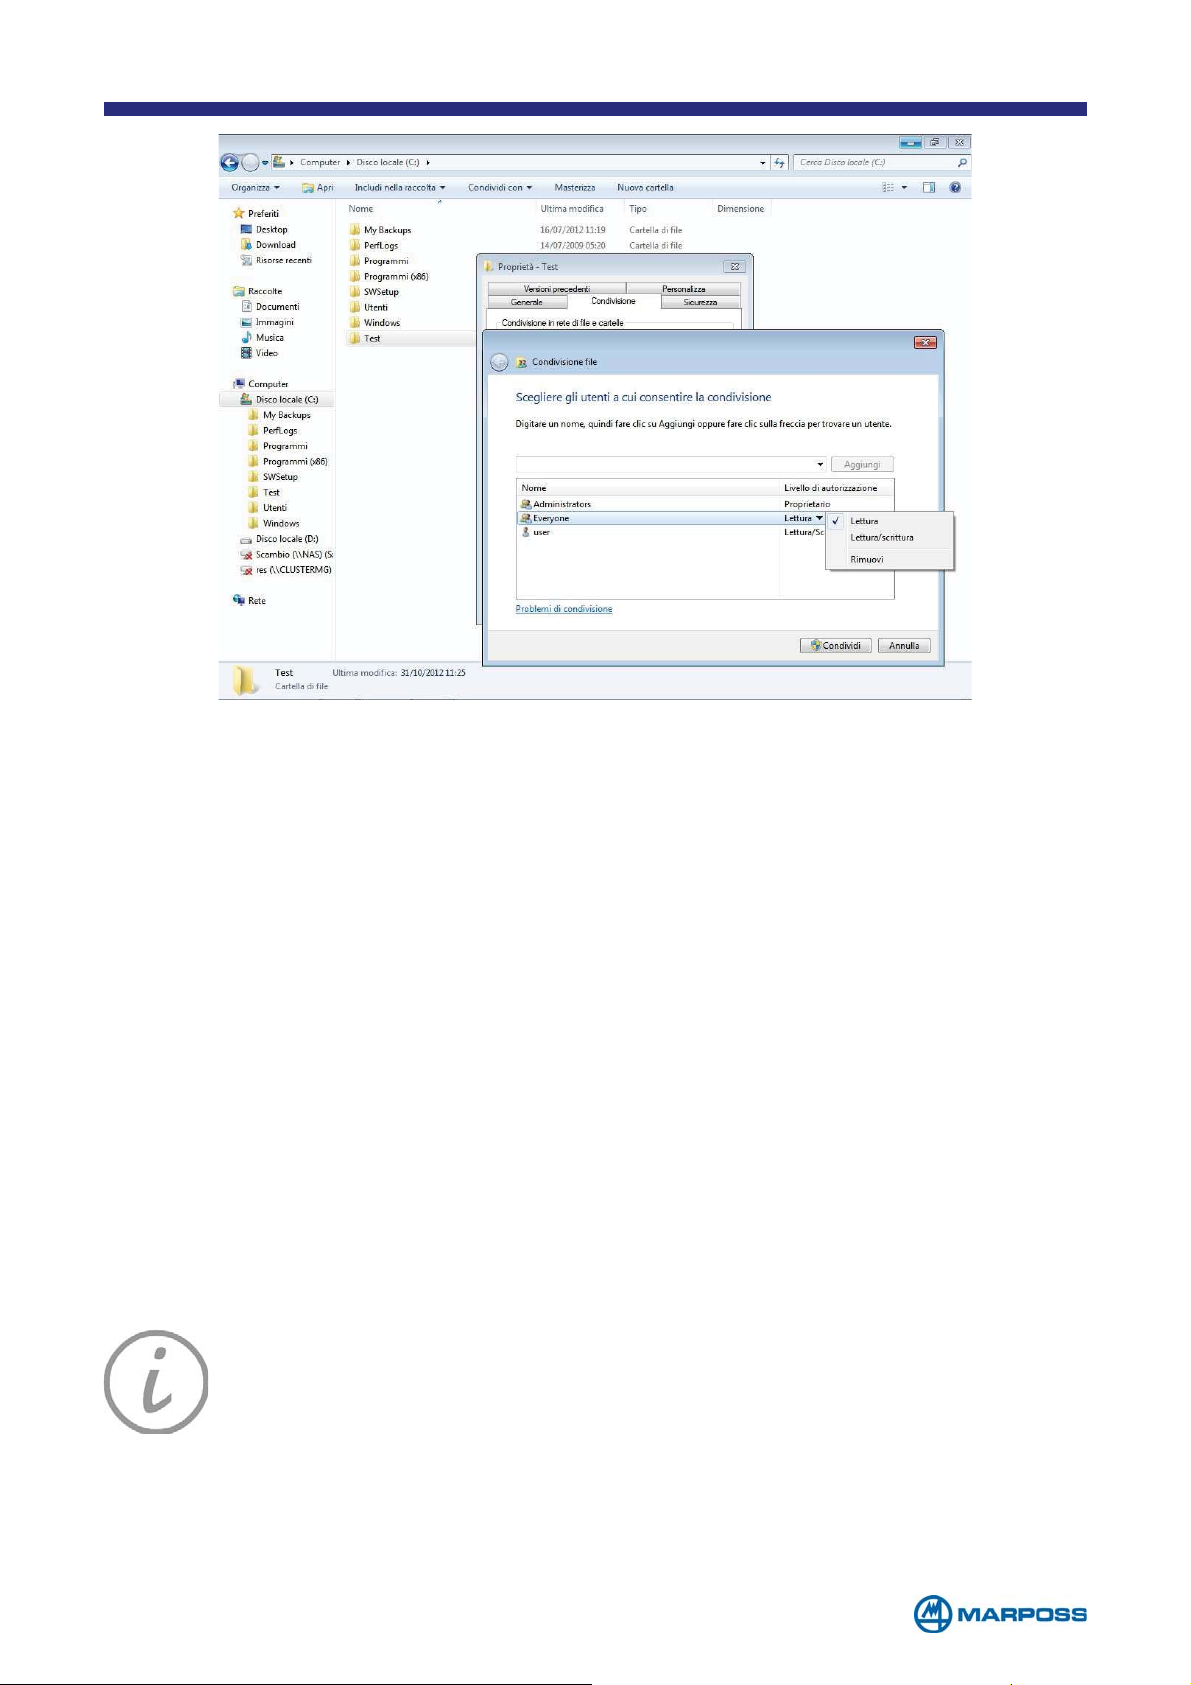
The configuration of the PC is ended.
Picture 5
NOTE: Before accessing from Merlin to the shared folder on the PC, it’s
essential to use a user profile with administrator rights. If it doesn’t exist
it’s necessary to create it.
From Merlin , select the path “\\NamePCW7\Name FolderShared”.
From now, the shared folder could be connected and accessible and
it’s possible to create, modify and delete files.
- 99 -
Page 100

- 100 -
 Loading...