

LXQQFY MR300 SWR User Manual
Revision 171215
- 0-
MR300 SWR Analyzer
www.lxqqfy.com lxqqfy@foxmail.com lxqqfy@qq.com
MR300 SWR Analyzer
User Manual
Revision 171215
This product is revised by SARK100, and the technology is from Melchor Varel(EA4FRB)

Revision 171215
- 1-
MR300 SWR Analyzer
www.lxqqfy.com lxqqfy@foxmail.com lxqqfy@qq.com
1 Specifications
Frequency Generation & Control:
o
1 - 60 Mhz
o
Source impedance: 50 Ohms
o
Stability: +/- 100 ppm
o
Spectral Purity: Harmonics down >- TBD dB beyond 60 MHz
o
Step Size: User configurable increments of 100 Hz, 1 kHz, 10 kHz, and 100 kHz
Usable Measurement Range:
o
SWR: 1.0 to 9.99
o
Impedance: approx. 5 to 2000 ohms
RF Output:
o
Adjustable: 2.0 Volts pp (typ)
Power supply:
o
External: 13.8 to 19 Volts DC, 500mA (Note:12V can be used but can not be
used for recharged)
o
Internal: 8xAAA 1000mAh NiMH cells
o
Charging time: 12 hours (charge rate 0.1C)
Controls:
o
Pushbuttons (5): "Mode", "Band", "Config", "Scan", "Up", "Down"
o
Switch: "Power On"
Connectors:
o
RF Out: M (SL16)
o
USB: Mini-B receptacle
o
External power: 2.1mm Power Jack (center pin positive)
Instrument Capabilities:
o
Measure antenna electrical parameters: SWR, impedance (resistance +
reactance), capacitance, inductance
o
Measure feed point impedance

Revision 171215
- 2-
MR300 SWR Analyzer
www.lxqqfy.com lxqqfy@foxmail.com lxqqfy@qq.com
o
Measure ground loss
o
Adjust antenna tuners and determine loss
o
Measure inductors and capacitors
o
Measure coax transmission line (SWR, length, velocity factor, approximate Q
and loss, resonant frequency, and impedance)
o
Measure and determine optimum settings for tuning stubs: SWR, approximate
Q, resonant frequency, bandwidth, impedance
o
Determine characteristic impedance of transmission line
o
Determine length of ¼ and ½ wave phasing lines
o
Coaxial Cable Loss
o
Determine antenna tuner loss
o
Measure balun loss
o
Measure inductor Q
o
Estimate quartz crystal parameters
Revision 171215
- 3-
MR300 SWR Analyzer
www.lxqqfy.com lxqqfy@foxmail.com lxqqfy@qq.com
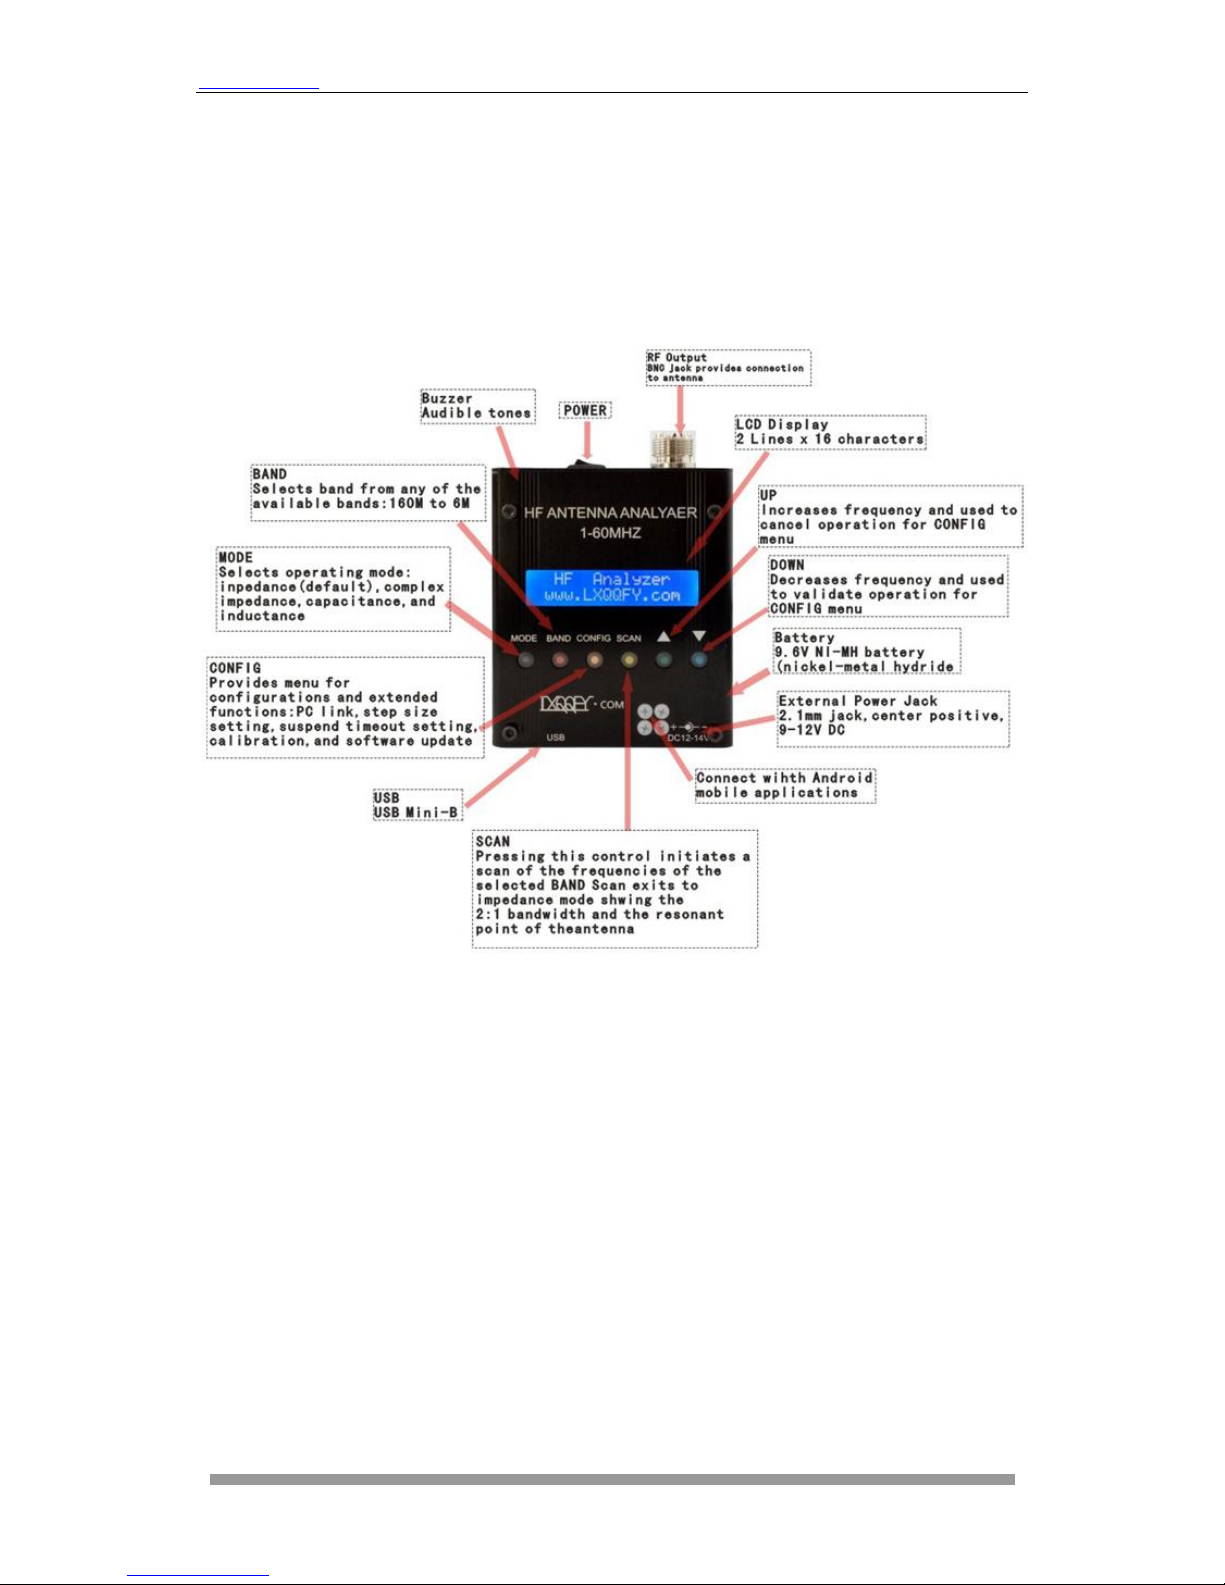
2 Connections and Controls

Revision 171215
- 4-
MR300 SWR Analyzer
www.lxqqfy.com lxqqfy@foxmail.com lxqqfy@qq.com
3 Antenna Analyzer Operation
Power-on
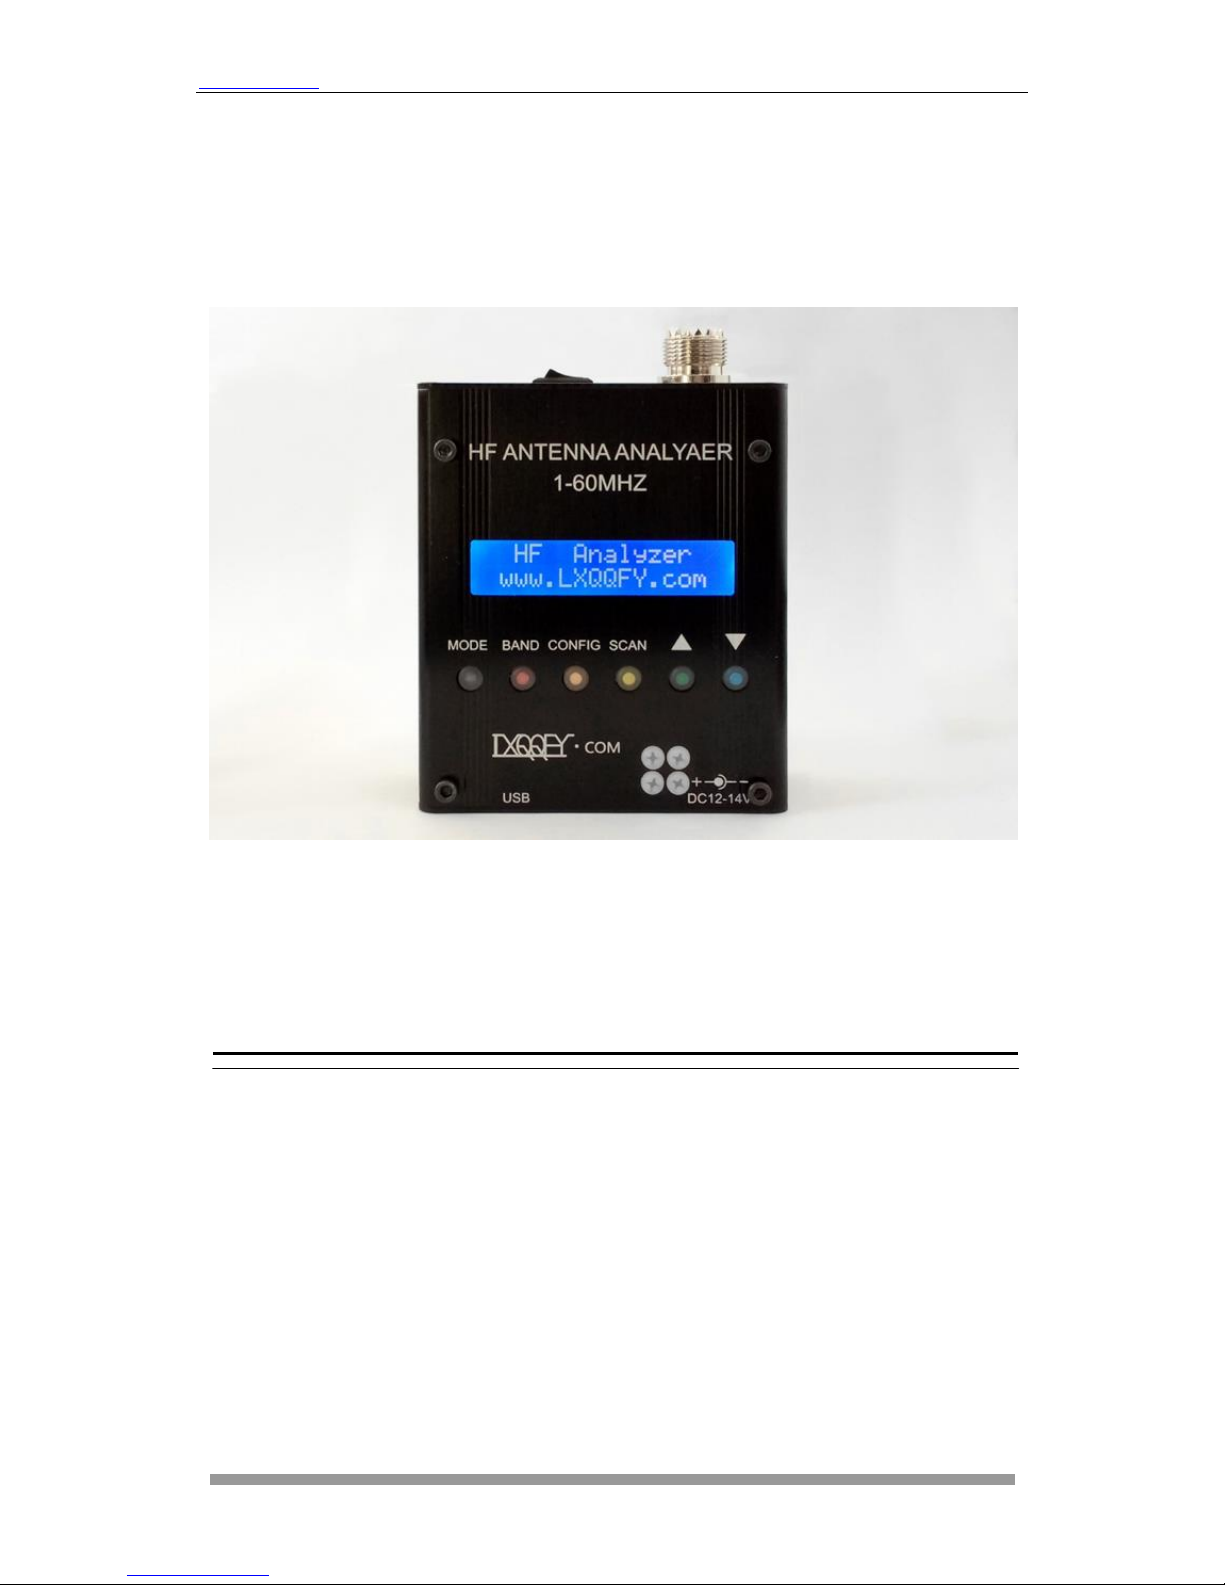
Power is turned on to the MR300 by sliding the switch located on the bottom panel. After
power-on the unit will display for half a second the following welcome message:
HR Antenna Analyzer
www.lxqqfy.com
Then the instrument automatically switches to impedance mode that is the default mode and
LCD shows frequency, SWR, and the magnitude of the impedance:
SWR 14,100.000
>10 Z=2000
The analyzer has an automatic power-save function. This function detects that no button was
pressed after a user programmable time and goes into a power saving state and which turns off
the display. In this state the press of any button will start immediately the unit returning to the
same state before the suspension, i.e. the same function and frequency selected. This function
can be disabled by the user.
It is important to note that this is an energy saving feature but not a full power-off, i.e. the
instrument continues to have a significant consumption so it is recommended shutting down
completely in the case it s not going to be used.
User Interface
The user interface consists of six buttons, four aimed at selecting the functions available and two
are used primarily to select the frequency but have the dual function of canceling and validate
respectively. All functions are summarized in the Appendix E:
Adjusting the Frequency
Frequency is changed by adjusting a single digit indicated at the point in the display where the
cursor ‘_’ is by pressing either frequency change button. Upon power-up of the instrument, the
10 kHz digit is the adjustment point, as shown by the digit with the cursor in the display below.
SWR 14,100.000
1.02 Z = 40Ω
To move the cursor to a different digit to be adjusted, press simultaneously the frequency
change buttons. The cursor will move to any of the seven available digits, allowing subsequent
up/down adjustment of that digit after pressing again the frequency change buttons. A blinking
cursor will be display during the digit adjustment mode.

Revision 171215
- 5-
MR300 SWR Analyzer
www.lxqqfy.com lxqqfy@foxmail.com lxqqfy@qq.com
SWR 14,10.000
1.02 Z = 40Ω
Pressing the left button will increase the digit value and, correspondingly, the signal generated
by the unit. Pressing the right button will decrease the digit and the generated signal.
When the digit is incremented past 9, or when it is decremented past 0, the digits above the
selected adjustment point are rolled up or down, respectively. Using this frequency adjustment
scheme, the user can conveniently pick an “increment” digit and manually scan frequencies with
the desired granularity. Rough scans can manually be done by positioning the cursor under the
100 kHz digit or the 1 MHz digit, giving a wide and course scan of the frequencies with a quick
twist of the dial.
The signal frequency can then be set to the area of interest and the cursor set to a lower
granular digit (e.g., 10 kHz or 1 kHz) in order to manually perform a detailed scan while watching
displayed results for SWR, impedance and reactance.
MODE
Successively pressing the MODE button you can select one of the MR300 operating modes:
impedance (magnitude), complex impedance, capacitance, inductance, and off.
Impedance Mode (magnitude)
This is the main mode of the instrument and measures the SWR and the magnitude of the
impedance. An example screen is the following:
SWR 14,100.000
1.02 Z = 40Ω
The top line indicates the mode and the frequency
The first number on the second line is the SWR, in this case 1.02:1
The second number is the impedance magnitude (modulus), in this case 40 Ω
In this mode the instrument can be used as a VFO as it keeps the signal in the selected
frequency continuously.
Complex Impedance Mode
In this mode it is measured the SWR and the complex impedance. An example screen is the
following:
IMP 14,100.000
1.02 45 + j 50
The top line indicates the mode and the frequency
The first number on the second line is the SWR, in this case 1.02:1

Revision 171215
- 6-
MR300 SWR Analyzer
www.lxqqfy.com lxqqfy@foxmail.com lxqqfy@qq.com
The middle value is the resistance, i.e. the real part of the impedance, in this case 45 Ω
Then it is shown the reactance sign, ‘+’ for inductive reactance and ‘-‘ for capacitive
reactance. If it is not shown, i.e. ‘ ‘ it means that it cannot be determined
Last term is the reactance, in this case it is 50 Ω inductive reactance
This mode can not be used as a VFO because the frequency is continuously dizzling in order to
determine the reactance sign.
Capacitance Mode
This mode allows the measurement of the capacitance. An example screen is the following:
CAP 14,100.000
C = 112.4 pF
The top line indicates the mode and the frequency
The bottom line indicates the capacitance in pF
Capacity values must be within the measurement range of the instrument. Given that the
maximum impedance specification for the analyzer is 2000 Ω, the display will show a numeric
value only when the reactance is less than this value. The formula to calculate the capacity is the
following:
XC
1
2 pi F C
Inductance Mode
This mode allows the measurement of the inductance. An example screen is the following:
IND 14,100.000
L = 7.8 uH
The top line indicates the mode and the frequency
The bottom line indicates the inductance in uH
Inductance values must be within the measurement range of the instrument. Given that the
maximum impedance specification for the analyzer is 2000 Ω, the display will show a numeric
value only when the reactance is less than this value. The formula to calculate the inductance is
the following:
XL 2 pi F L
Off Mode
In this mode it is disabled the DDS and the impedance measurements.It is provided a RF level
measurement mode where the measured signal level is displayed in the second line of the

Revision 171215
- 7-
MR300 SWR Analyzer
www.lxqqfy.com lxqqfy@foxmail.com lxqqfy@qq.com
display as a bar graph. This will be useful to know if the antenna is receiving a near RF field
which can interfere with the measurements.
OFF
BAND
The BAND button allows selecting the working frequency band within the bands available.
Pressing this button sequentially selects the next higher band which value is shown in the LCD,
and it is changed the frequency. If it is the first time accessing the band, the frequency will be set
to the middle value. Otherwise it will be set the previous frequency value, since this is stored
when changing the band.
Band
Lower
Frequency
Middle
Frequency
Upper
Frequency
160M
1,000.000
1,800.000
2,000.000
80M
2,000.000
3,700.000
5,000.000
40M
5,000.000
7,100.000
8,000.000
30M
8,000.000
10,100.000
11,000.000
25M
11,000.000
12,000.000
13,000.000
20M
13,000.000
14,100.000
17,000.000
17M
17,000.000
18,100.000
19,000.000
15M
19,000.000
21,000.000
23,000.000
12M
23,000.000
24,900.000
26,000.000
11M
26,000.000
27,000.000
28,000.000
10M
28,000.000
29,000.000
31,000.000
8M
31,000.000
40,000.000
49,000.000
6M
49,000.000
51,000.000
53,000.000
SCAN
Pressing the SCAN pushbutton will automatically sweep the antenna analyzer test signal across
the band range previously selected, incrementing from the lower frequency limit to the upper

Revision 171215
- 8-
MR300 SWR Analyzer
www.lxqqfy.com lxqqfy@foxmail.com lxqqfy@qq.com
frequency limit, in steps according the programmed step value. During the scan the SWR is
measured and updated on the screen as well as the current frequency value. Each SWR value
is compared to previous value in order to determine if a minima, or a “dip”, has occurred at this
point in the scan. If so, that data point is stored for later display. Besides the 2:1 points are
stored in order to determine the bandwidth. An example screen during the scan is the following
(frequency and SWR are updated continuously):
SCAN 14,100.200
1.30
Notice that when detected the 2:1 SWR points the buzzer is sounded to alert the user of the
event. After the scan process the instrument will show the bandwidth and after pressing any key
the instrument will switch to impedance mode with the frequency set to the frequency value
corresponding to the minimum SWR point.
BW 35.000
Press any key
In the case of not finding a resonance point the unit will display the following error message on
the screen.
Err No Matching
Press any key
CONFIG
Successively pressing the CONFIG button you can select one of the MR300 configuration
modes and extended funtions. To select either option you need to press the button VAL and for
exit you need pressing the button CAN.
PC Link
The PC Link function lets you control the MR300 from your PC using the USB connection.
The PC USB driver provides an emulation of a COM port and the MR300 provides a
command interface so you can be control the instrument from a terminal program such as
HyperTerminal or any other program designed for this purpose, e.g. PCC-SARK100.
To use this feature you must have installed the USB driver, see Appendix A: and connect the
USB cable. The COM port setting is 57600, 8, n, 1, with no hardware flow control. By entering
this function the analyzer will send the following text to the terminal and will display the command
prompt:
SARK SWR Analyzer V05
>>

Revision 171215
- 9-
MR300 SWR Analyzer
www.lxqqfy.com lxqqfy@foxmail.com lxqqfy@qq.com
The available commands are described in Appendix C: These can be typed from the
HyperTerminal window and the results will be returned to the terminal. The MR300 will show
the last processed command in the bottom line of the LCD.
Step Size
This function allows you to change the value of the frequency step for the SCAN and for the
increase/decrease frequency buttons for the impedance measurement modes. Successively
pressing the CONFIG button you can select one of the step values. To select either value you
need to press the button VAL and for exit you need pressing the button CAN.
The following values are available: 10Hz, 100Hz, 1kHz, 10kHz, and 100kHz.
Suspend Timeout
This feature allows you to program the user idle time for the automatic power-save feature.
Successively pressing the CONFIG button you can select one of the idle time values. To select
either value you need to press the button VAL and for exit you need pressing the button CAN.
The following values are available: Off (disabled), 30 seconds, 60 seconds, and 90 seconds.
Calibrate
This function allows calibrating the instrument in order to get better accuracy. By entering this
function the user is instructed to follow a series of steps which are described in detail in the
Appendix B:
Software Load
Don’t update software.
 Loading...