

Page 1
1
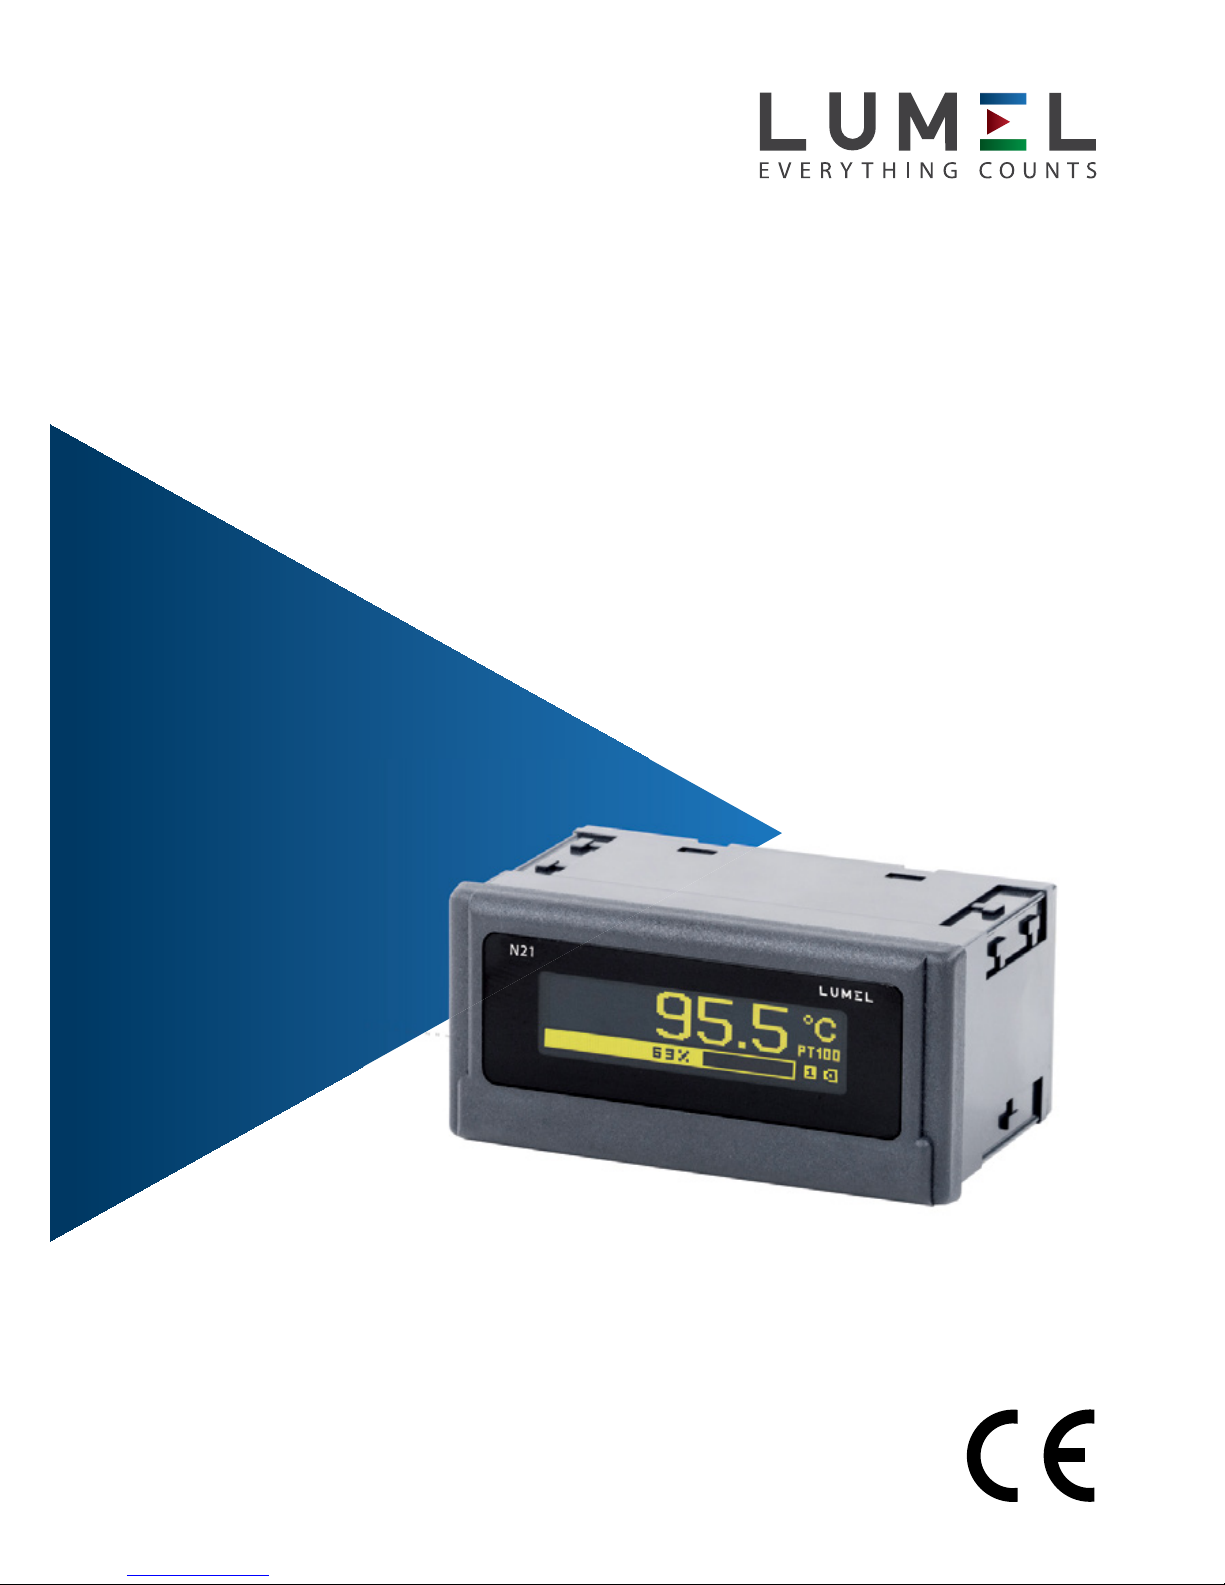
PANEL MOUNTED METER
N21
USER’S MANUAL
Page 2

2
Page 3

3
Contents
1. APPLICATION AND METER DESIGN .............................................. 5
2. METER SET .......................................................................... 6
3. BASIC REQUIREMENTS, OPERATIONAL SAFETY .............................. 6
4. INSTALLATION ...................................................................... 8
4.1. Mounting ....................................................................... 8
4.2. External Connection Diagrams ............................................. 9
5. SERVICE ............................................................................. 11
5.1 Display description ........................................................... 11
5.2 Power-on status indication .................................................. 11
5.3 Device configuration using e-Con program ............................... 12
5.3.1 Configuration parameters ................................................. 14
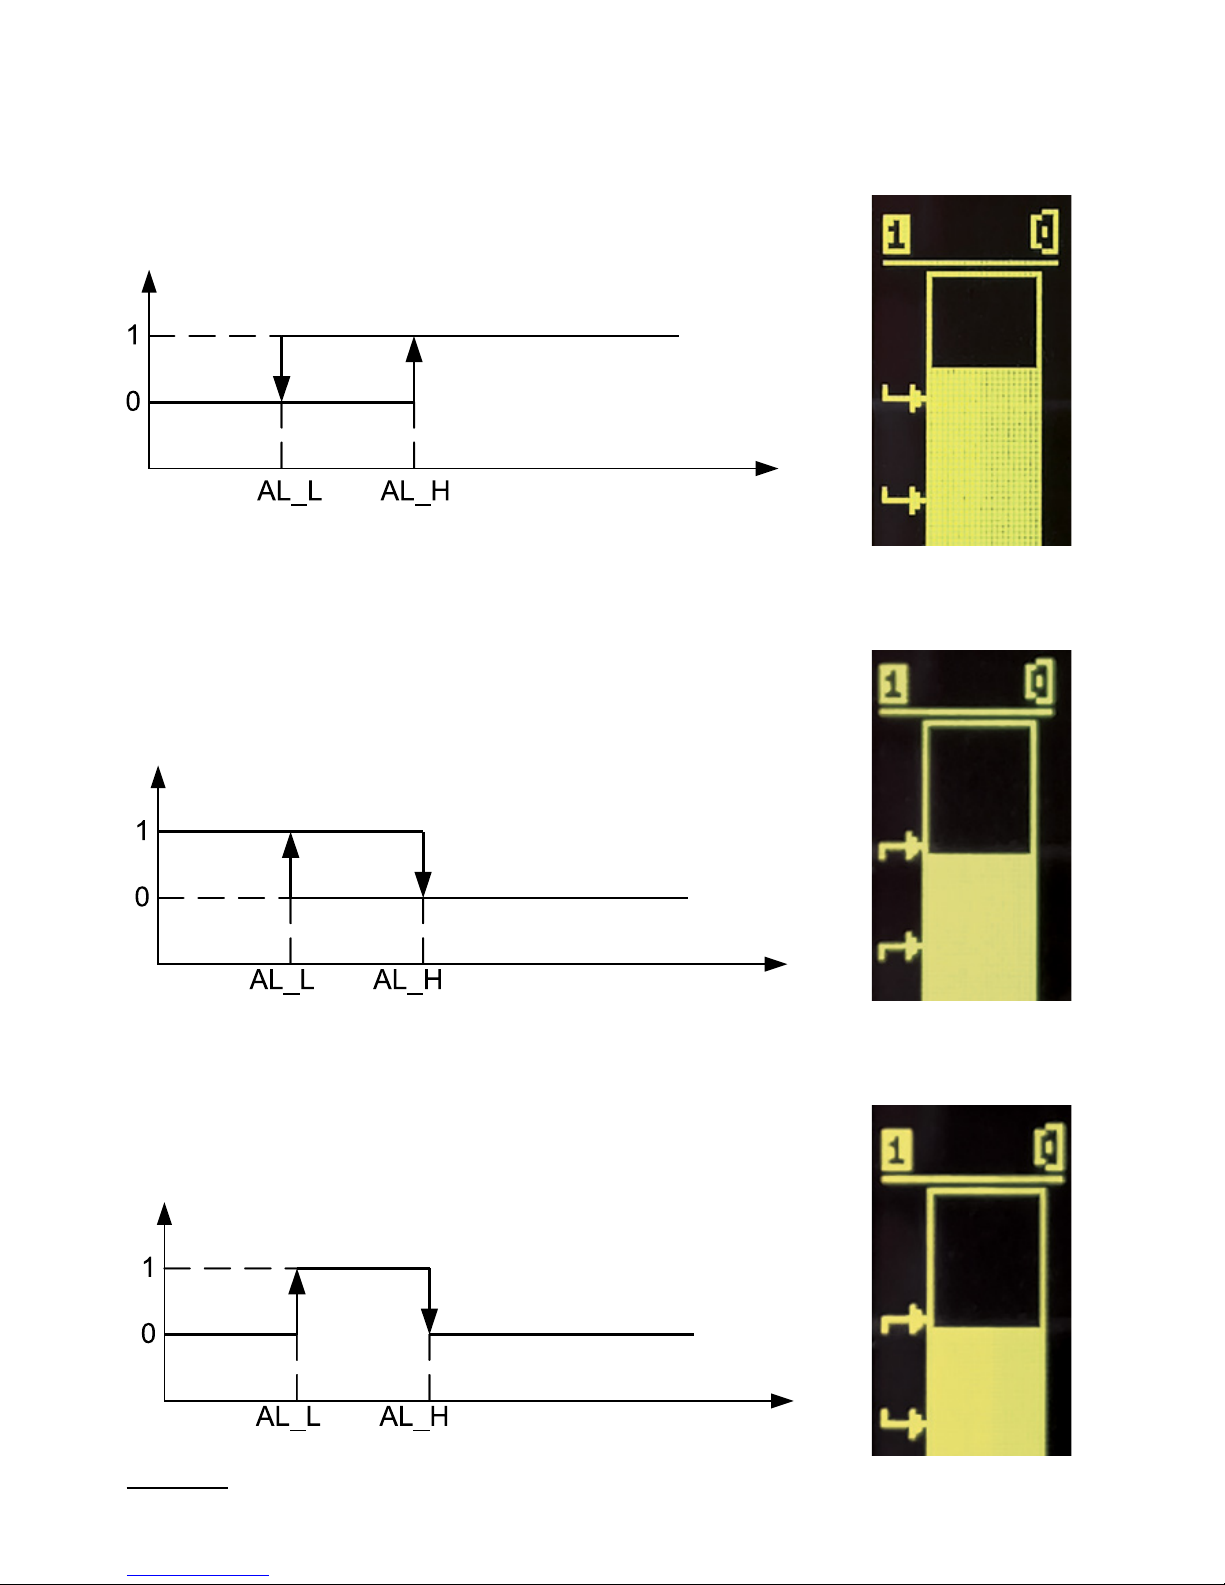
5.3.2 Alarm output operating modes ........................................... 18
5.3.3 Individual characteristic .................................................. 20
5.3.4 BArgraph configuration .................................................... 21
5.3.5 Preview of the measuring values ........................................ 23
5.3.6 Editor of the measuring unit .............................................. 23
6. CONFIGURATION INTERFACE .................................................... 25
6.1 USB Interface – list of parameters ......................................... 25
6.2 Map of N21 meter registers ................................................. 25
7. ERROR CODES ..................................................................... 32
8. SOFTWARE UPDATE .............................................................. 34
9. TECHNICAL DATA .................................................................. 36
10. ORDERING CODE ................................................................. 40
Page 4

4
Page 5
5
1. APPLICATION AND METER DESIGN
The N21 meter is a digital programmable panel mounted instrument
designed to measure d.c. voltages or d.c. currents: unipolar or bipolar,
temperature with use of thermocouples J (Fe-CuNi), K (NiCr-NiAl)
and Pt100 resistance thermometers. The readout field is an OLED
graphic display with a resolution of 32x128 points.
The eCon program is designed for the configuration of the N21 meter.
The meter should be connected to a PC via a miniUSB connector
located on the rear of the meter. Following parameters can be set:
• measuring input
• display precision of the result (decimal point)
• relay output operating mode
• thresholds triggering the relay output
• time delays of the relay output triggering
• individual characteristic for measuring signal
• automatic or manual temperature compensation of cold junctions
• averaging time of the measurement
• user-defined units of measured signal
• display language
• bargraph configuration.
Meter output signals are isolated from the input signals and power supply.
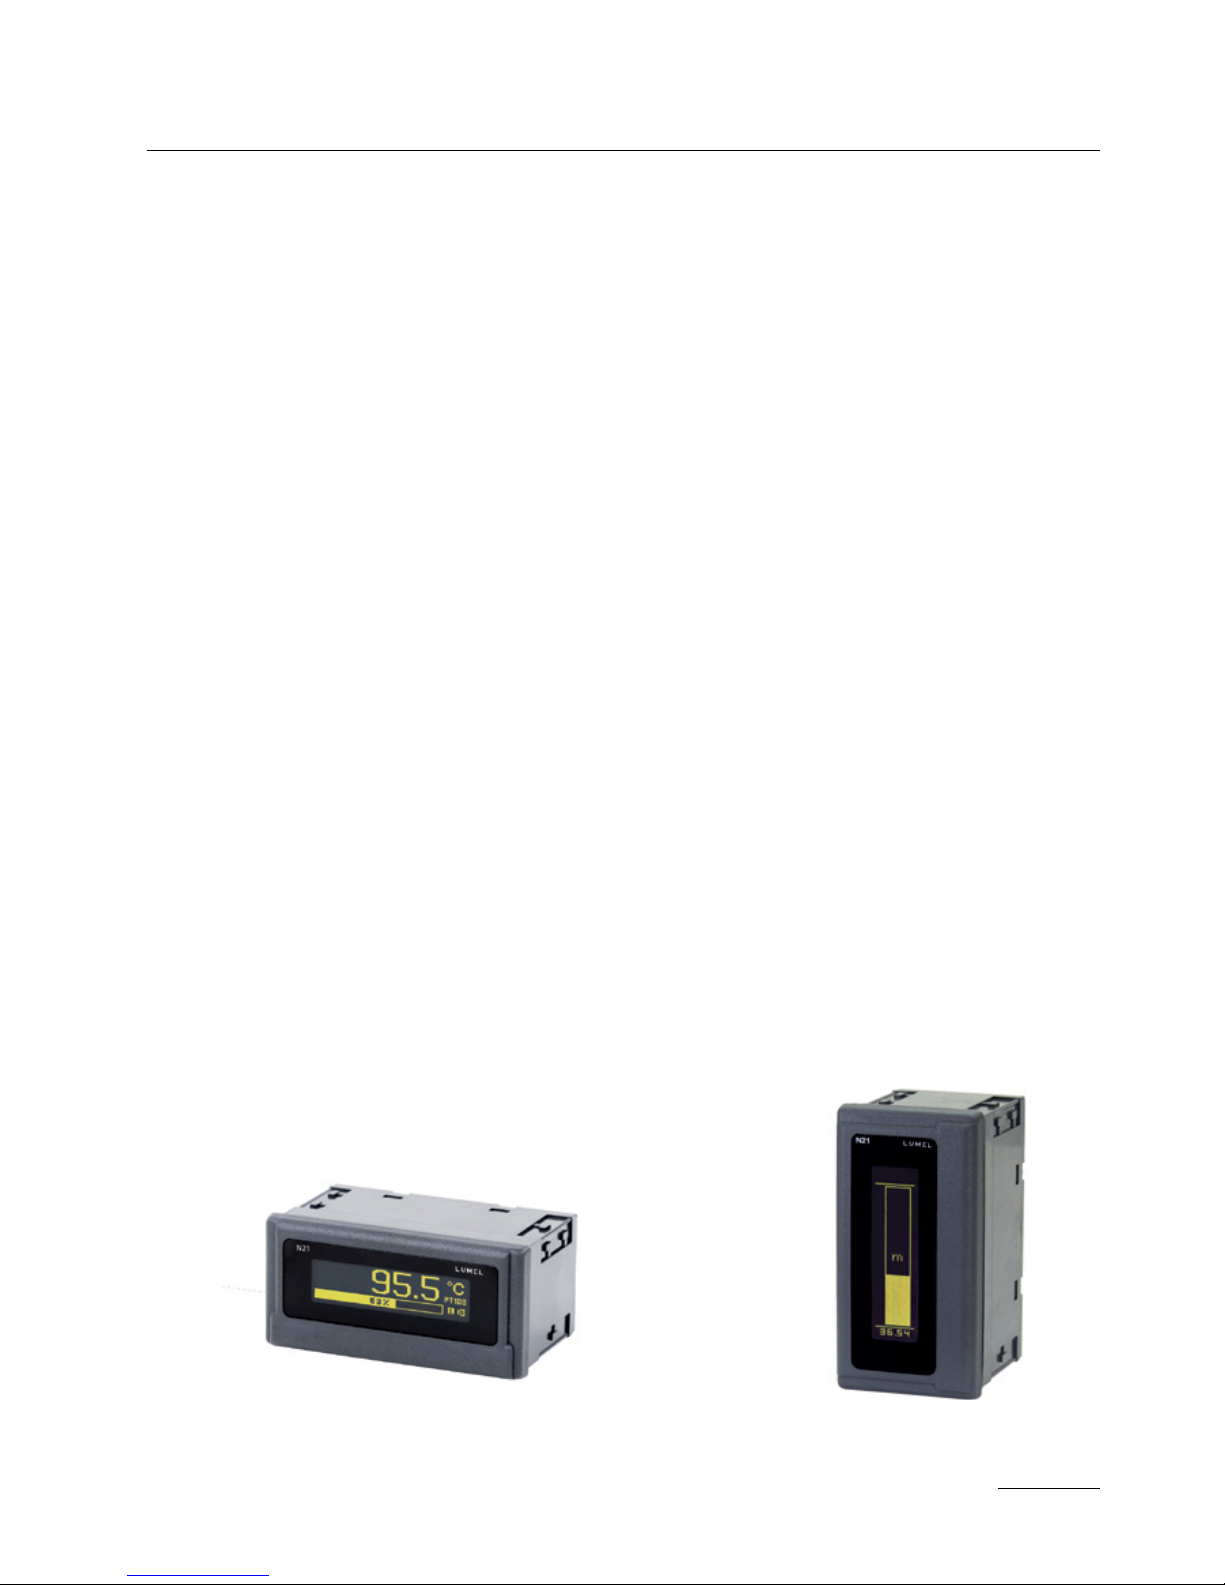
Figure 1. View of the meter
a) horizontal
b) vertical
Page 6
6
2. METER SET
Complete set of the meter includes:
- N21 meter.................................................. 1 pc
- clamps to fix in the panel ......................... 4 pcs
- seal ............................................................ 1 pc
- user’s manual ............................................ 1 pc
- guarantee card .......................................... 1 pc
3. BASIC REQUIREMENTS,
OPERATIONAL SAFETY
The symbols in the manual mean:
Warning!
Warning of potentially hazardous situations. Especially
important to be aware of before connecting the device.
Failure to follow the directions marked by this symbol
could result in serious injuries of the personnel and damage of the device.
Caution!
Useful notes. The notes should facilitate the operation
of the device. Should pay attention, if the device is not
working as expected.
Possible consequences in case of ignoring information!
Accessories:
For the N21 meter you can order:
– USB CABLE A/miniUSB-B - 1m BLACK; Order code 20-069-00-
00150.
Page 7

7
In terms of operational safety the meter meets the requirements
of the EN 61010-1 standard.
Comments concerning safety:
• Assembly and installation of the electrical connections should be
made only by people authorized to perform assembly of electric
devices.
• The person installing the meter is responsible for ensuring
the safety of the implemented system.
• Always check the connections before turning the meter on.
• Opening the meter housing gives access to the live parts.
The supply must be switched off and the measuring circuits disconnected before removing the meter housing.
• Removal of the meter housing cover during the warranty period
voids the warranty.
• The meter is designed to be installed and used in the industrial
electromagnetic environment conditions.
• The building installation should have a switch or a circuit-breaker
installed. This switch should be located near the device, easy
accessible by the operator and suitably marked.
• In case of damage, the meter can to repaired only by manufacturer’s
authorized service.
• Check the correct operation of the meter before it is used for measuring after a repair.
• Connection and/or using the meter in a way which is not compliant
with the user’s manual, may cause deterioration of the degree
of protection.
Page 8
8
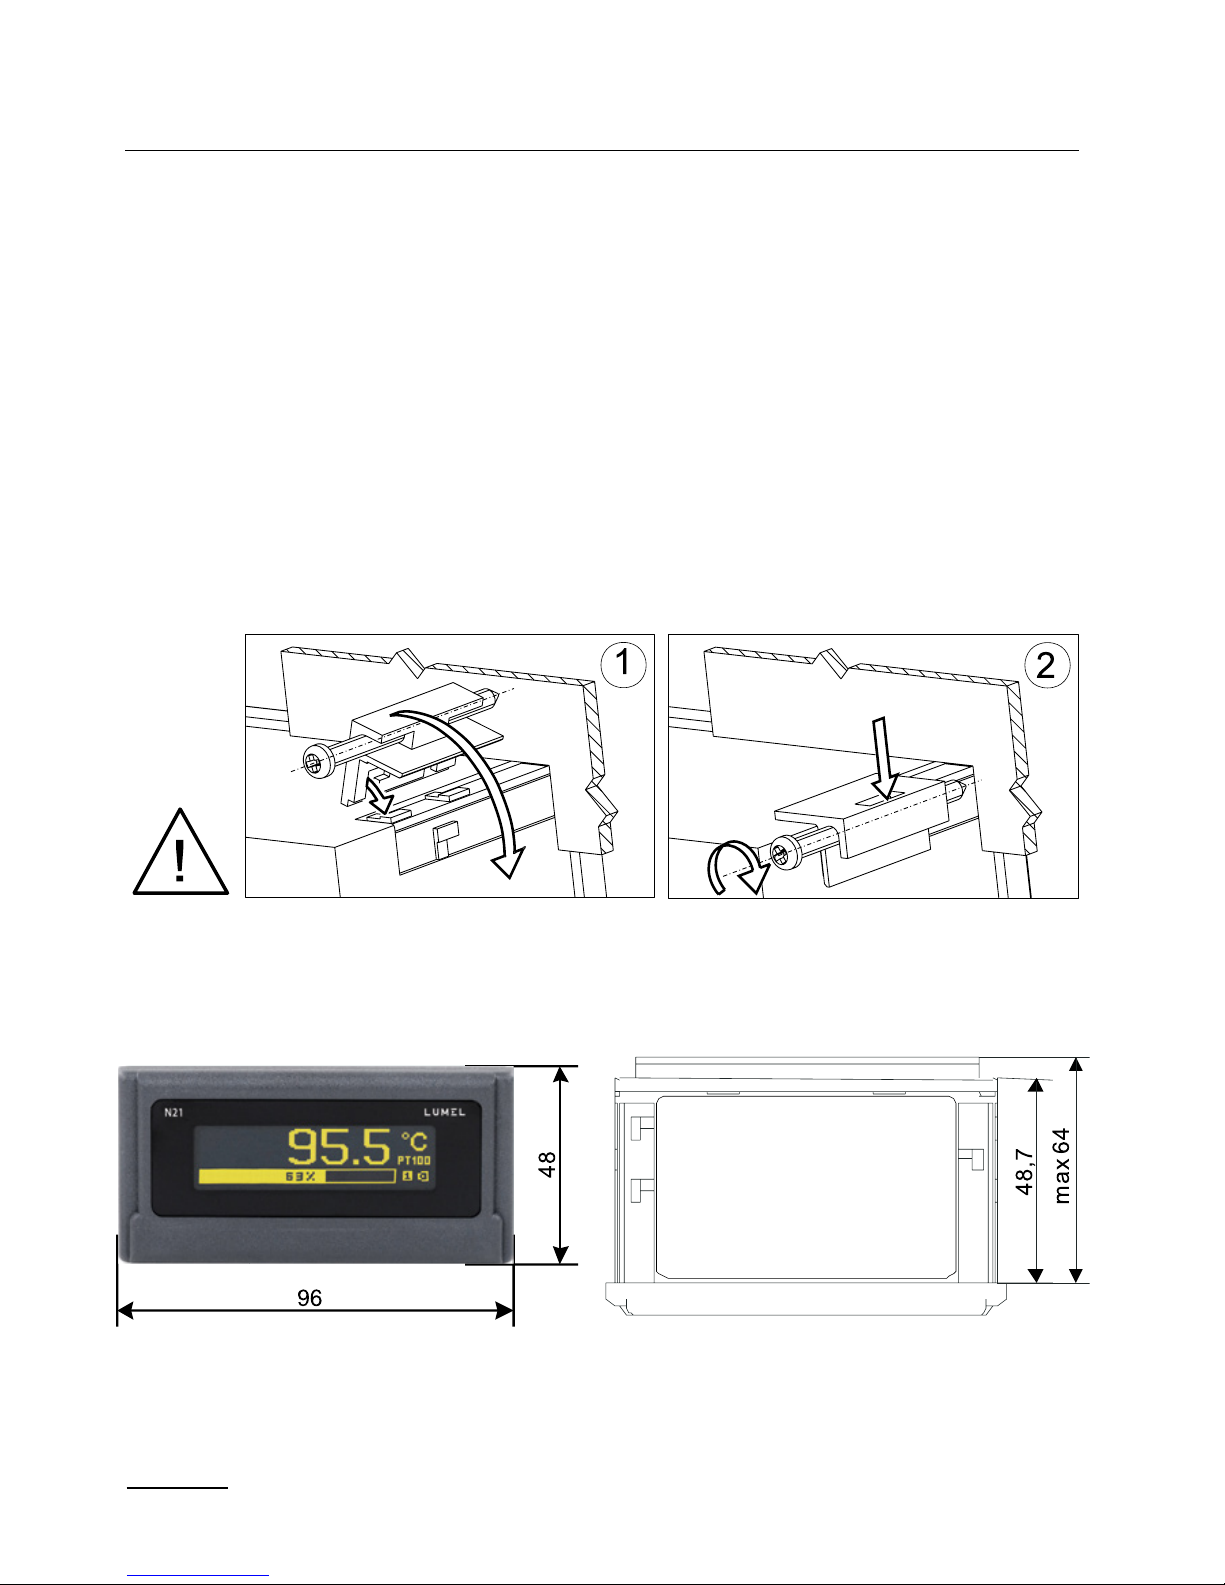
Figure 2. Meter fitting
Figure 3. Meter dimensions
4. INSTALLATION
4.1. Mounting
The N21 meter has separable strips with the screw terminals which
enable the connection of external supply wires of 2.5 mm2 and signal
wires of 1.5 mm2.
You must prepare a 92
+0,6
x 45
+0,6
mm cut-out in the panel. The thickness of the panel material should not exceed 6 mm. The meter
should be mounted from the panel front with disconnected supply voltage. Check the correct position of the seal before placing the meter into
the panel. When the panel is inserted in the slot, mount it in the panel
with the mounting brackets (Fig. 2).
Page 9
9
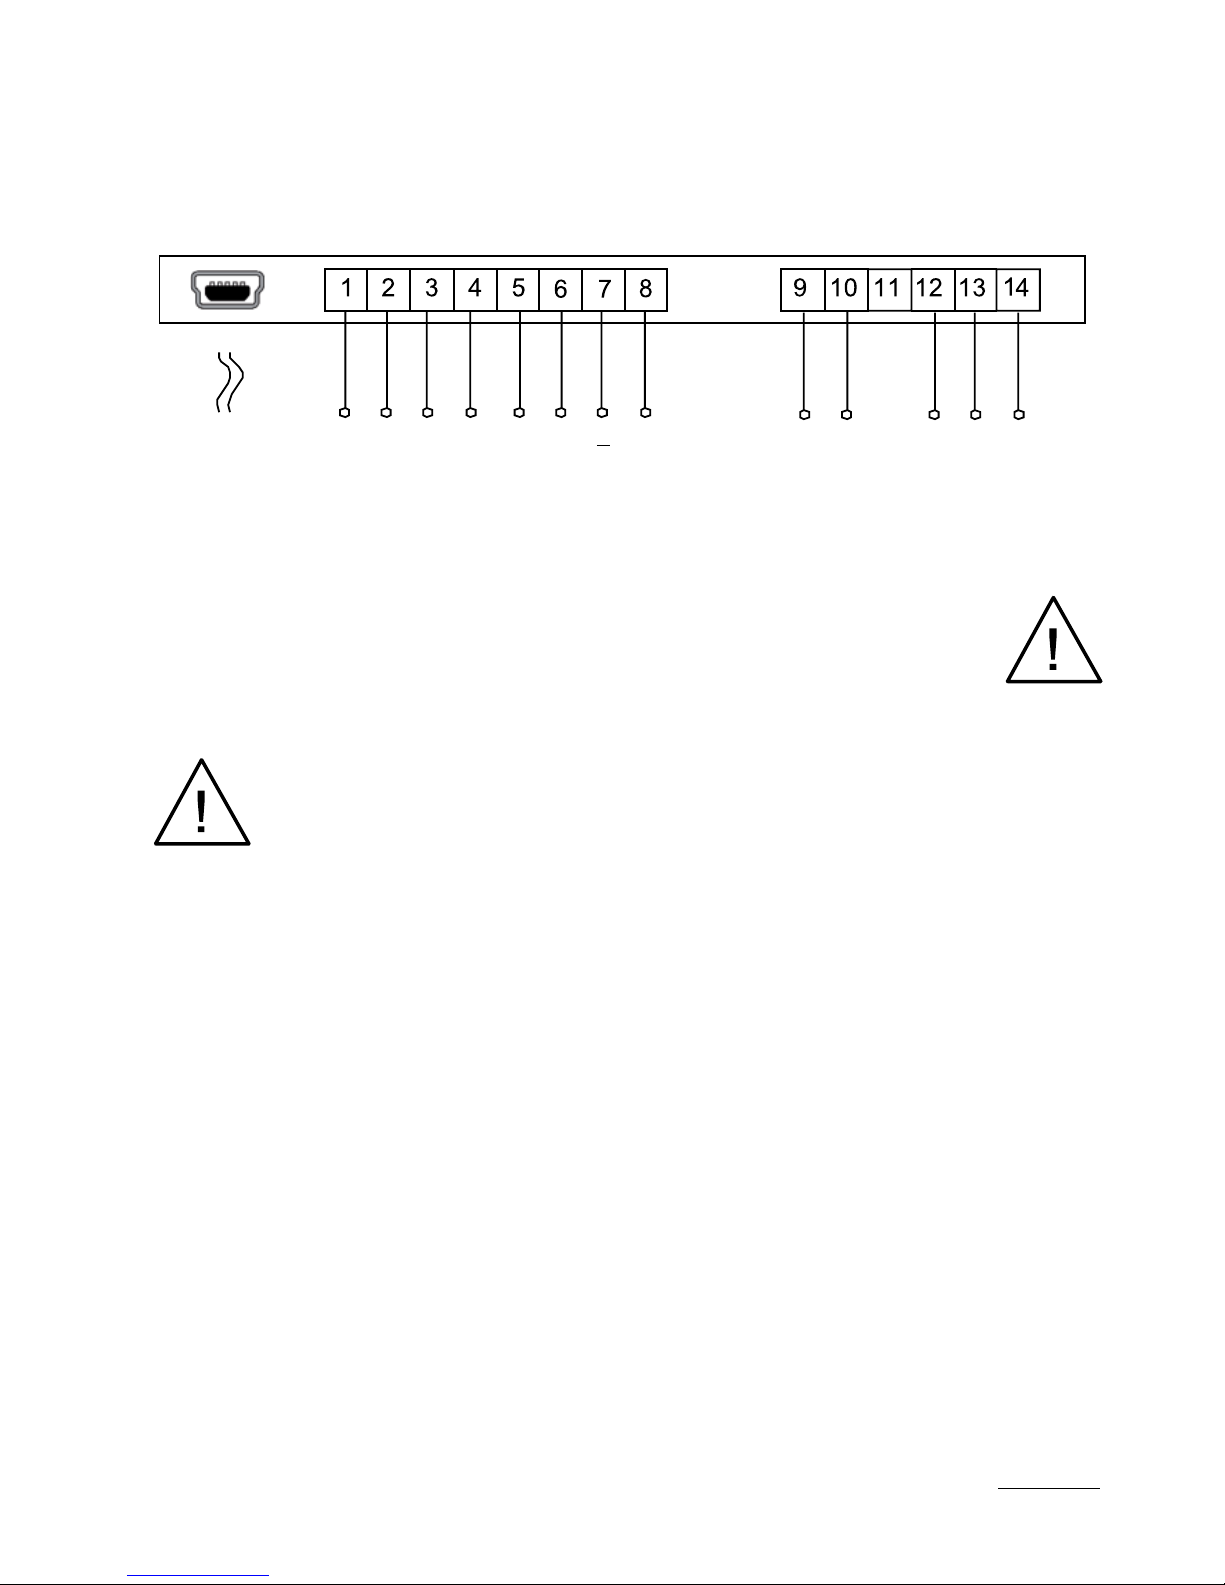
4.2.External Connection Diagrams
USB
conguration
+
measurement signals
24 V d.c.
30 mA max
(supply of object transducers)
alarm
24 V
N 230 V
supply
Figure 4. Electrical connections of the N21 meter
Comment concerning safety:
The meter is provided with a universal power supply that allows
operation in a wide range of input voltages 22..253V a.c / 20..300V d.c.
Life-threatening voltage also appears at the terminal 12 of the meter
in the case of the use of the input terminals 13-14.
Page 10
10
1
23
4
5
6
-
+
1
23
4
5
6
-
+
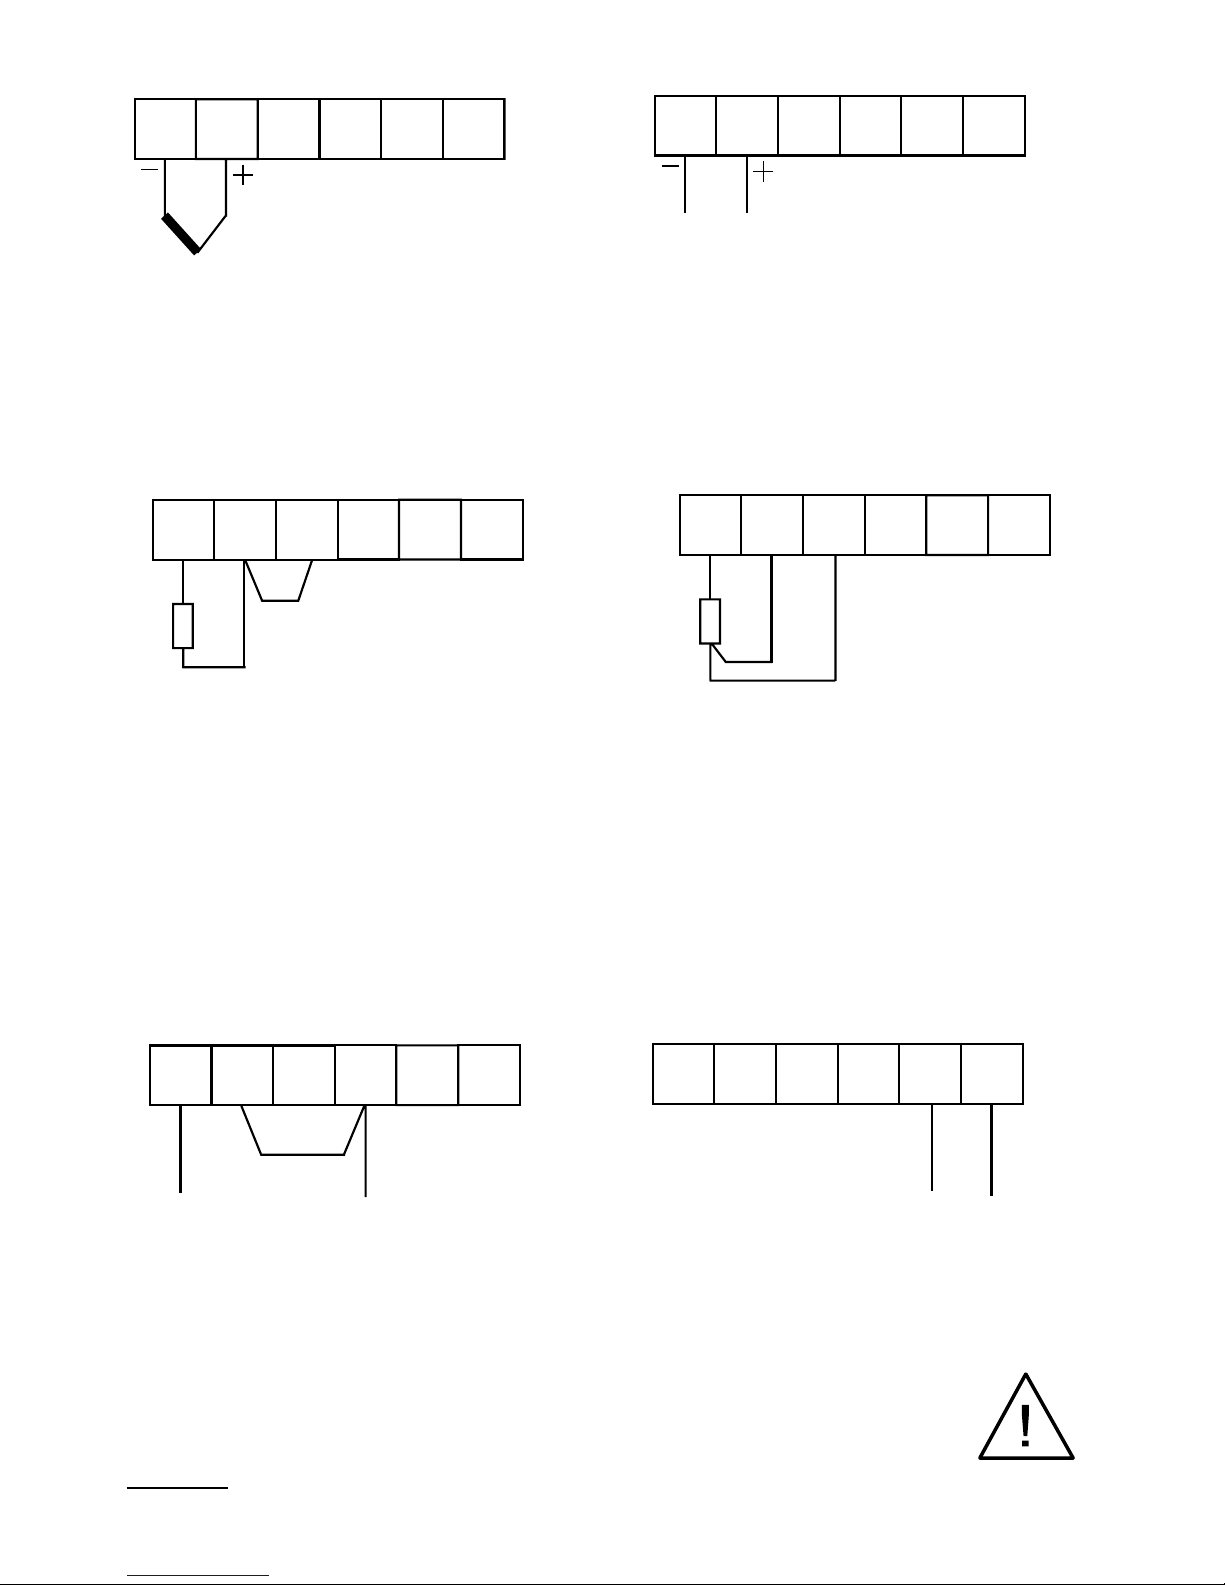
current input ±20mA
voltage input ±10V
Figure 5. Connections of measuring signals
1
23
4
5
6
1
23
4
5
6
Resistance thermometer
in a 2-wire system
Resistance thermometer
in a 3-wire system
1
23
4
5
6
1
23
4
5
6
thermocouple J,K
voltage input ±75mV
Page 11
11
5. OPERATION
5.1.Display description
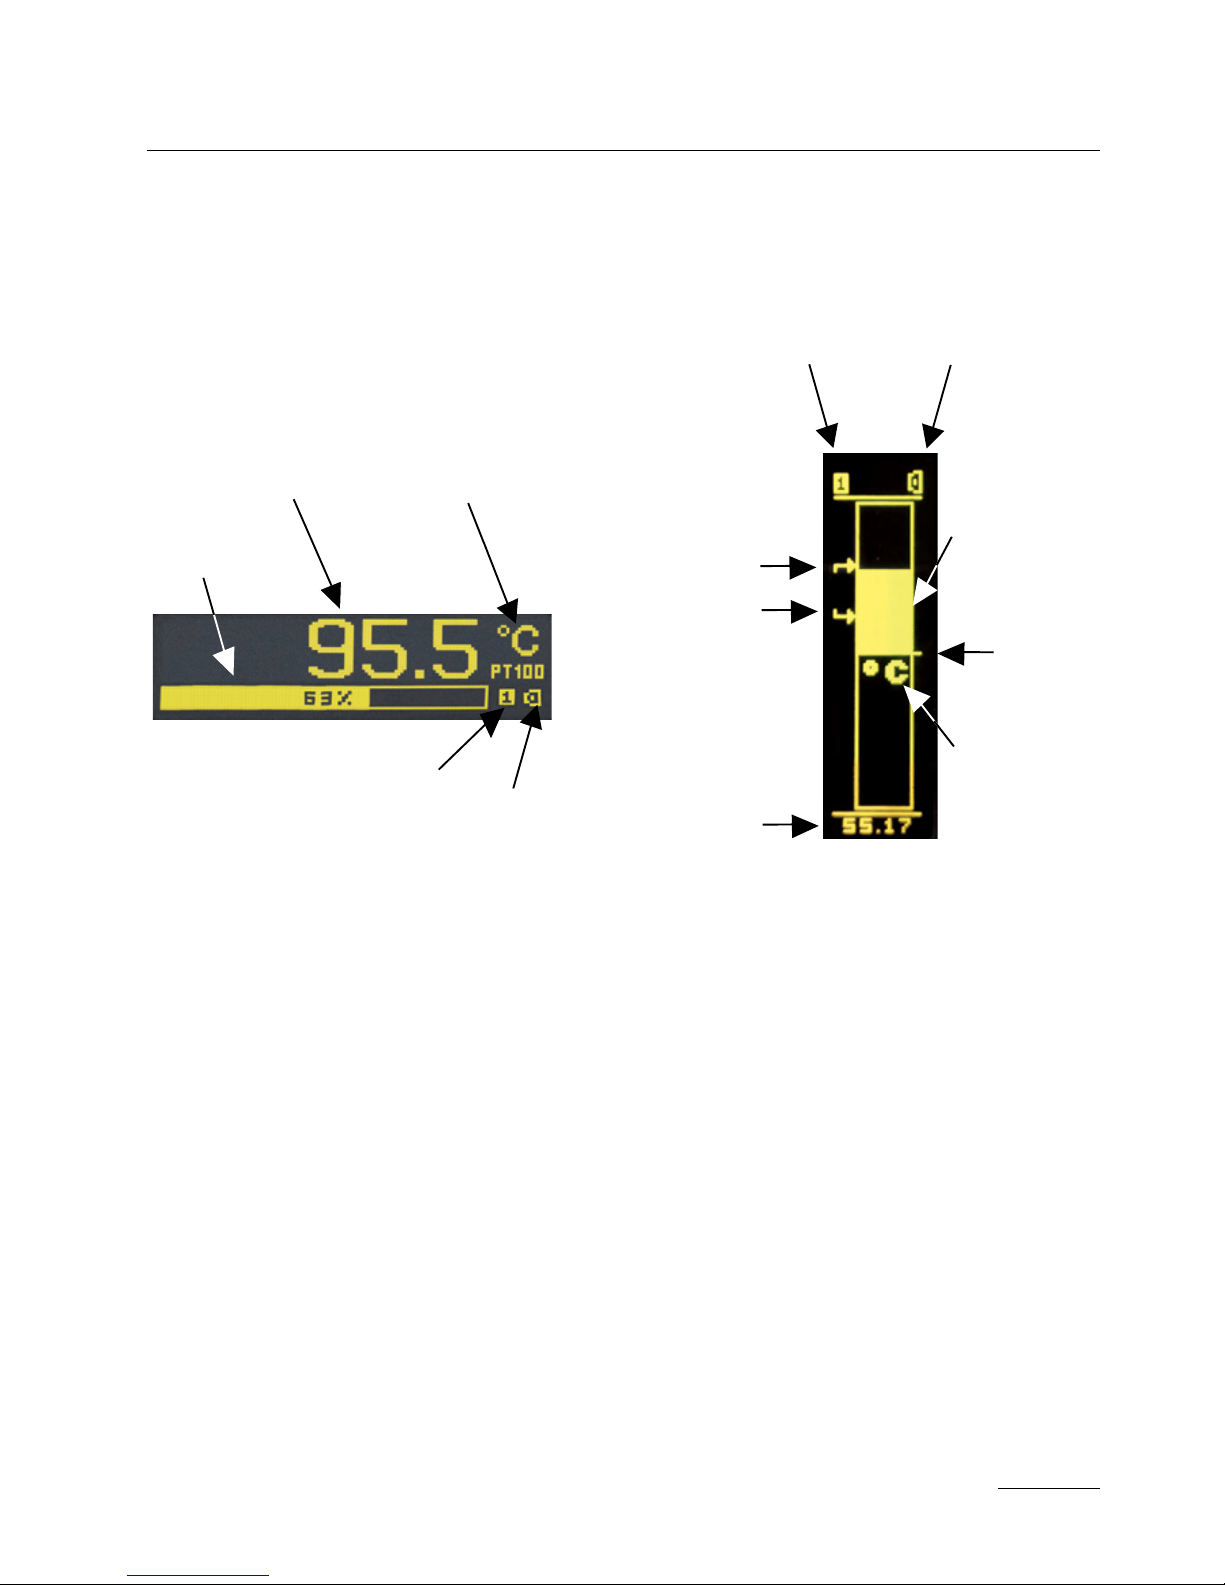
Figure 6. Front panel
5.2 Power-on status indication
The display shows information about the manufacturer, device type
and software version after switching the supply on. Then the meter starts
to show the measuring values according to the current configuration.
alarm
indicator
user-defined unit
measuring
value
bargraph
USB cable
connection
indicator
a) horizontal version b) vertical version
bargraph
zero
marker
USB cable
connection
indicator
alarm
indicator
indicator
of alarm
thresholds
measuring
value
user-defined
unit
Page 12
12
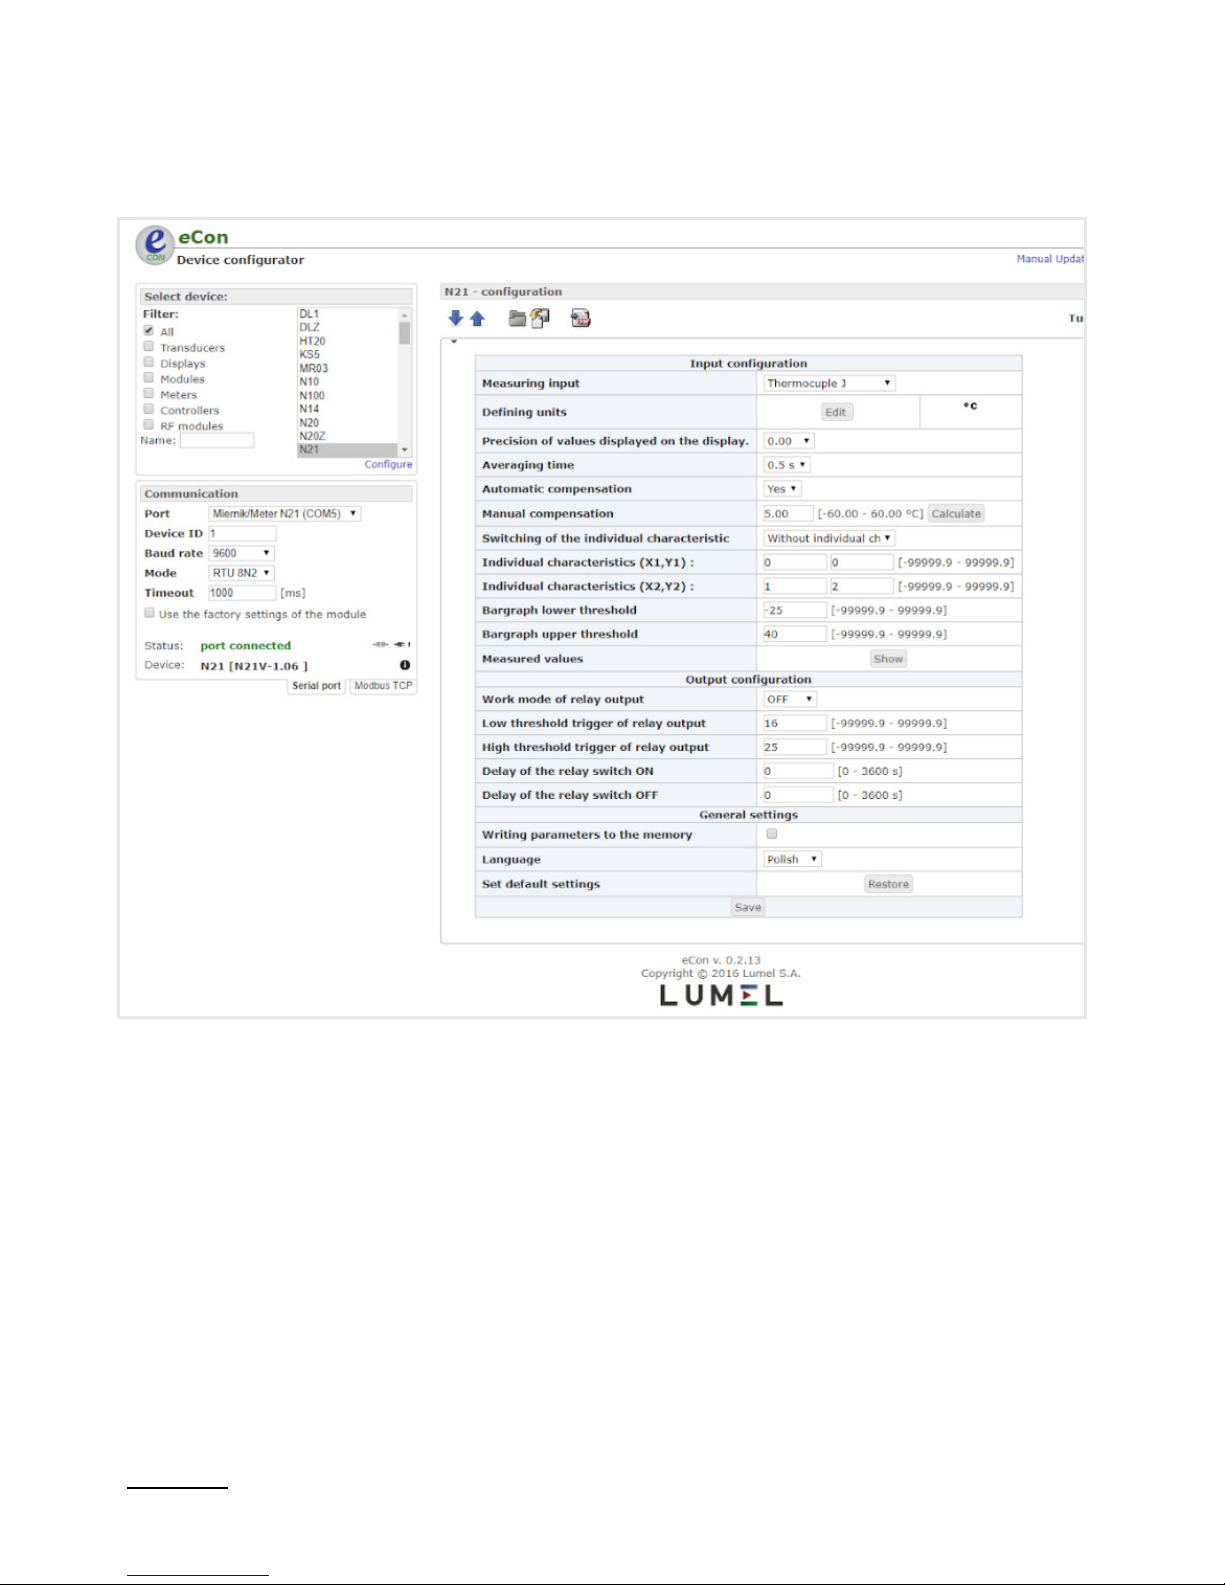
5.3. Device configuration using e-Con program
Figure 7. e-Con program window
Page 13
13
The eCon program designed for configuration of the N21 meter is
available at the manufacturer’s website (www.lumel.com.pl). The meter
should be connected to a PC via USB cable. The drivers are also
available on the manufacturer’s website. After drivers installation a new
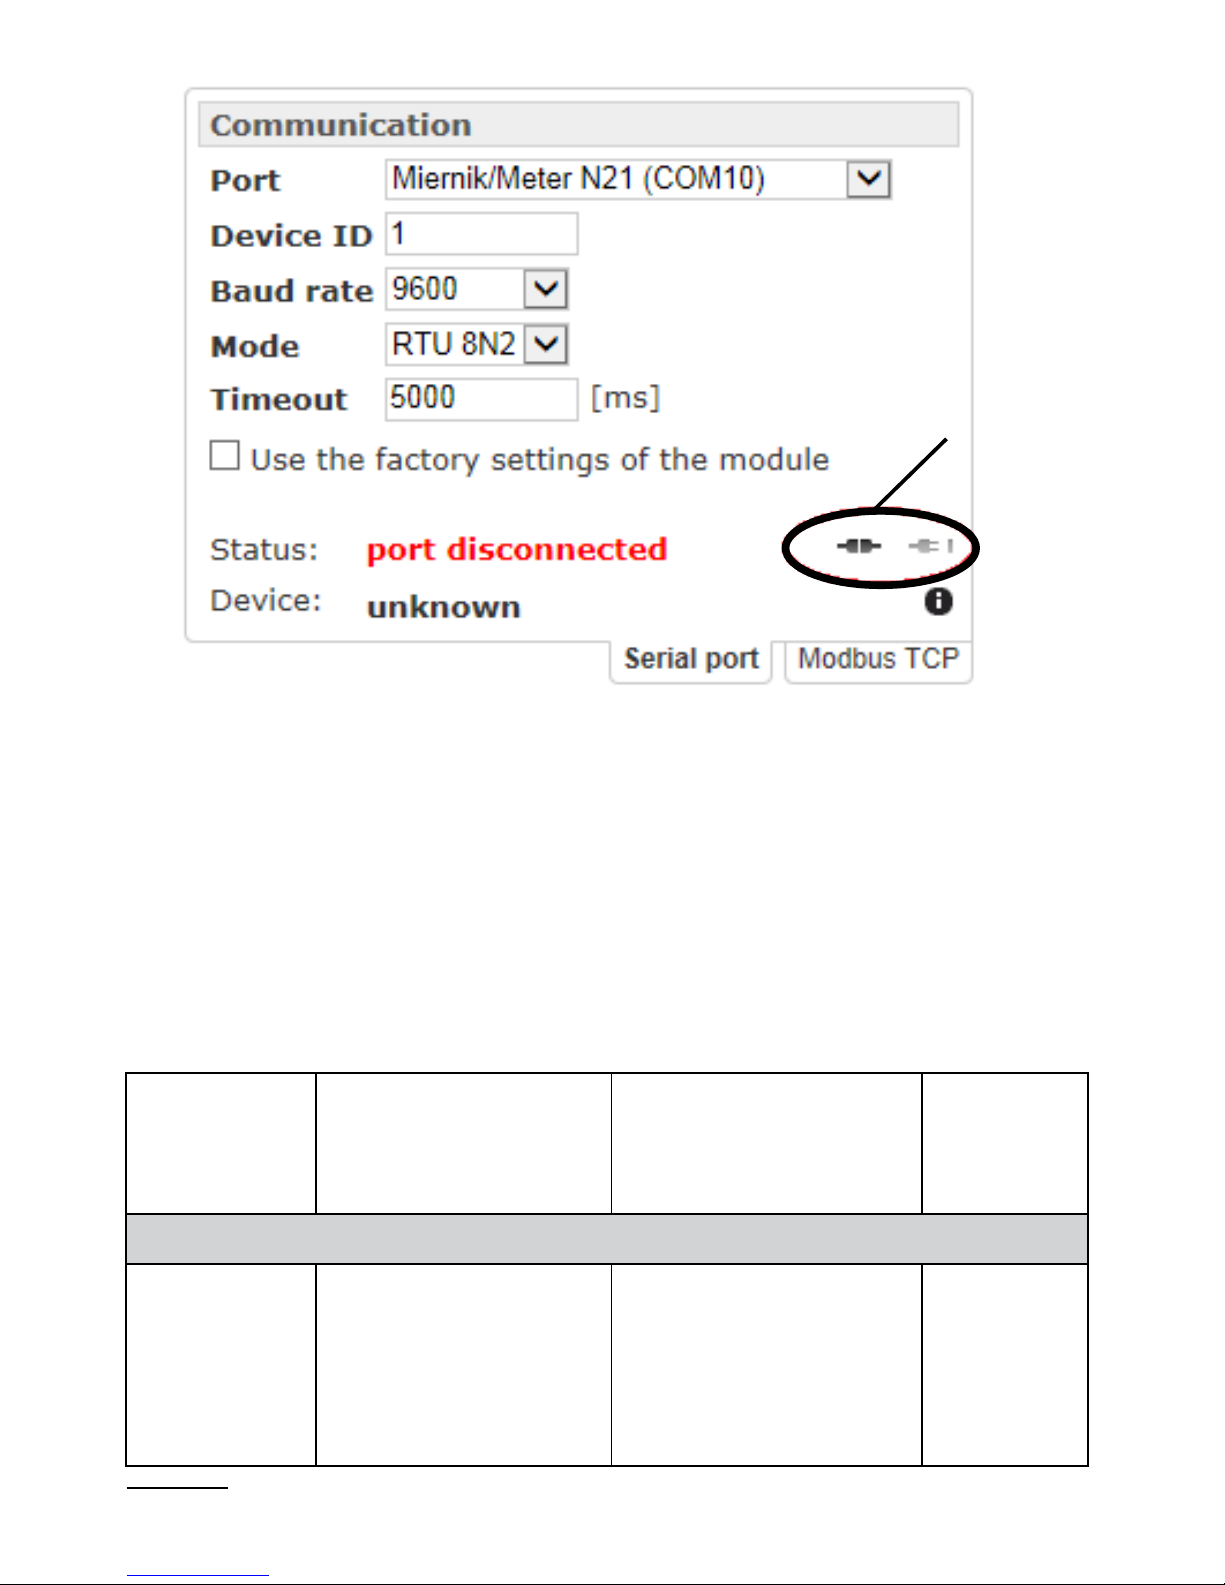
serial port appear. When the eCon program starts, select the port on
which the device is installed in the area “Communication”, set the transmission parameters (baud rate 9600, mode RTU 8N2), and then click the
icon “connect”.
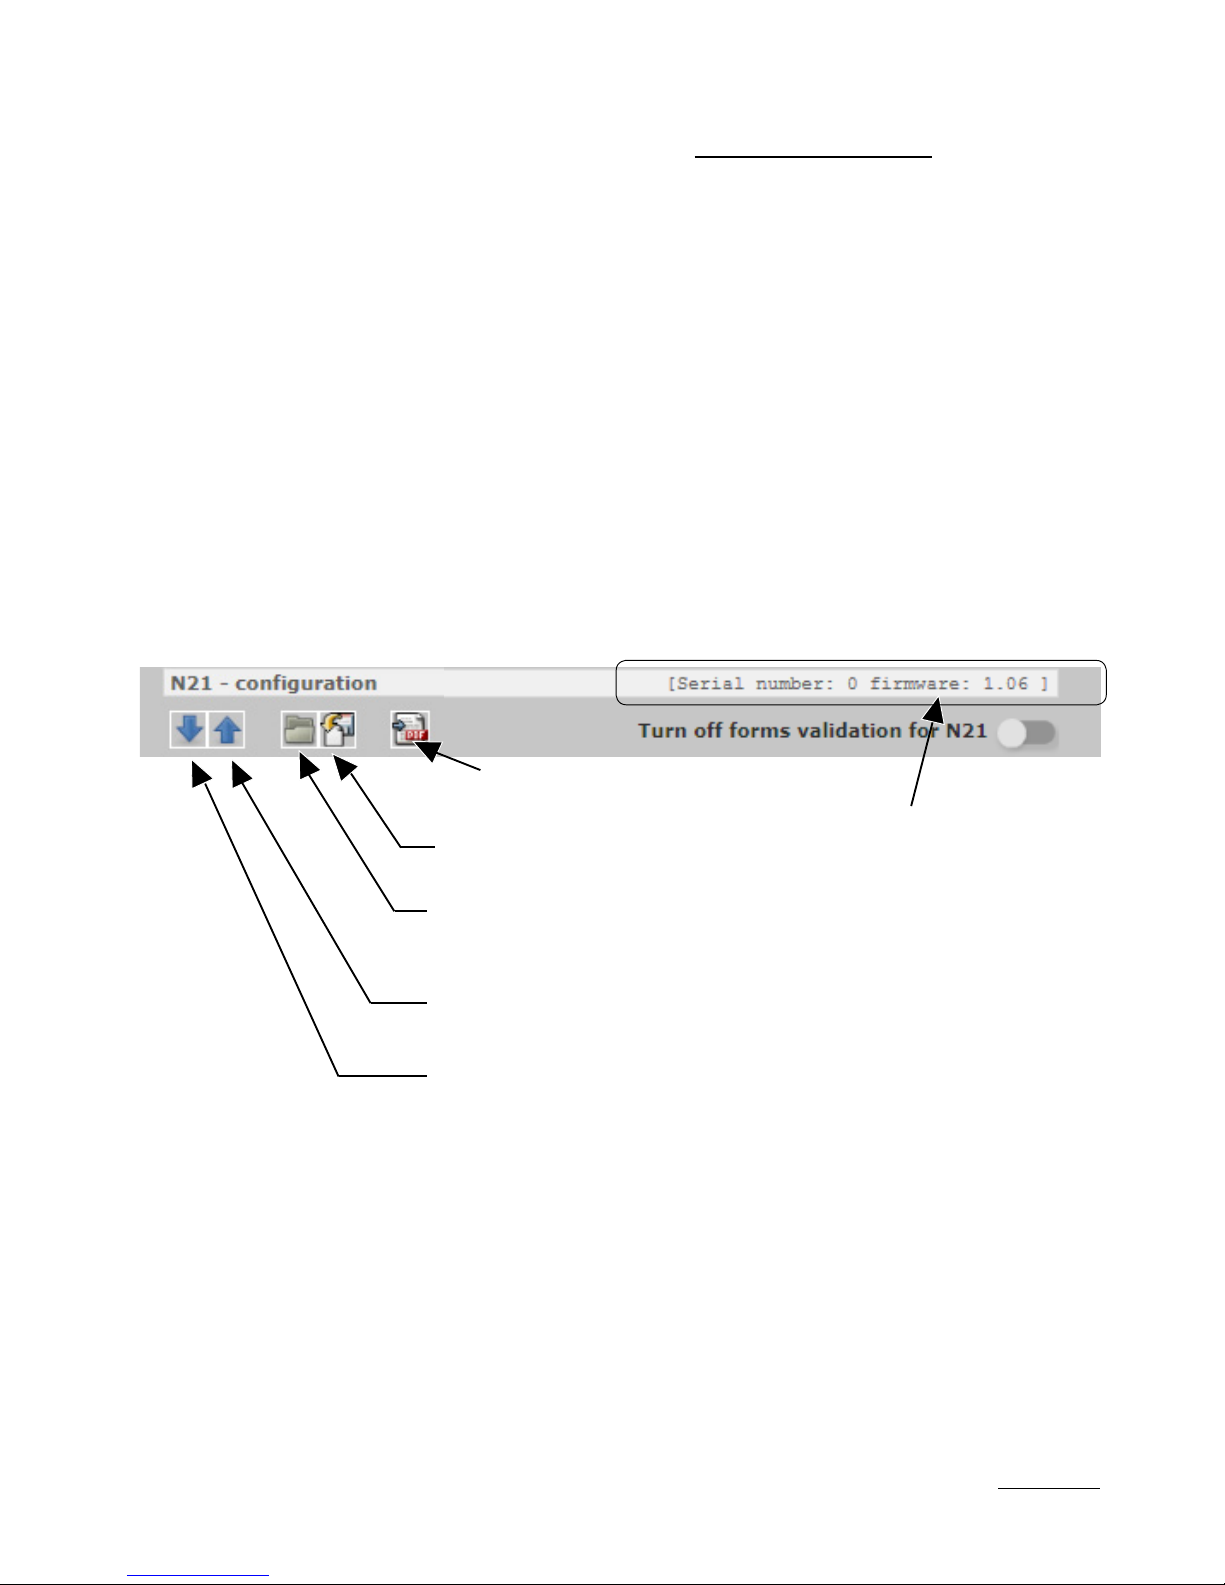
Before changing a configuration you should read and save the current
configuration for future restore the settings. You can save the parameters
to a file, read from a file, as well as export the configuration to a pdf file
using the eCon menu (Fig. 8).
Figure 8. Read, write and export settings
Information
about the meter
Export the configuration
to a pdf file
Saving the configuration
to a file
Reading the configuration
from file
Saving the configuration to a meter
Reading the configuration from a meter
Page 14
14
Figure 9. Establishing connection to N21 meter
5.3.1 Configuration parameters
After establishing a connection, there are configuration parameters
of the meter on the right side of the program window.
Table 1
Connect/
disconnect
Parameter
name
Parameter description
Range of parameter
change
Range
of
parameter
change
Input Configuration
Measuring
input
Type and range
of the input signal
Voltmeter +/- 10 V
Millivoltmeter +/- 75 mV
Milliammeter +/- 20 mA
Pt100
thermocouple J
thermocouple K
Voltmeter
+/- 10 V
Page 15

15
Defining
units
TDesigning
a pictogram
representing the
symbol of measuring
value unit using the
graphical editor.
Designed pictogram
can be uploaded to
the meter or saved to
a file. Figure 14.
Figure 14 V
Precision
of the
displayed
values
Choice of precision
of the displayed
values. Ranges:
0: -99999...99999
0.0: -9999.9...9999.9
0.00: -999.99...999.99
0.000: -99.999...99.999
0
0.0
0.00
0.000
0.0
Averaging
time
Averaging time
of the measurement
results.
0.2 s
0.5 s
1 s
3 s
5 s
10 s
15 s
20 s
0.5 s
Automatic
compensation
Automatic
temperature
compensation of the
thermocouple cold
junctions or a line
resistance for Pt100
sensor.
None
On
On
Manual
compensation
It is possible to set
a temperature value,
which will be corrected
by the measurement
result if an automatic
temperature
compensation
of the thermocouple
cold junction or a line
resistance is disabled.
-60.00 ... 60.00 °C 0.00
Page 16
16
Enabling
individual
characteristic
Enabling the value
of the input signal
conversion
to the displayed value
according to the linear
characteristic of user-
defined coefficients.
Without individual
characteristic
Characteristic enabled
Without
individual
characte-
ristic
Individual
characteristic
(X1,Y1)
User-defined first
point of the individual
characteristic.
Figure 11.
-99999.9..99999.9
X1 = 0,
Y1 = 0
Individual
characteristic
(X2,Y2)
User-defined second
point of the individual
characteristic.
Figure 11.
-99999.9..99999.9 X2 = 1,
Y2 = 1
The lower
bargraph
display range
The measured value
representing 0% of
bargraph display
indications. Point 5.3.4
-99999.9..99999.9 0
The upper
bargraph
display range
The measured value
representing 100%
of bargraph display
indications. Point 5.3.4
-99999.9..99999.9 0
Measuring
values
Preview of the current
measuring values
Figure 13 -
Output Configuration
Relay output
operating
mode
The method
of triggering the alarm
output depending
on the input signal
alarm thresholds.
The H-OFF mode
disables the output
permanently, H-ON
activates the output
permanently. Other
modes as shown in
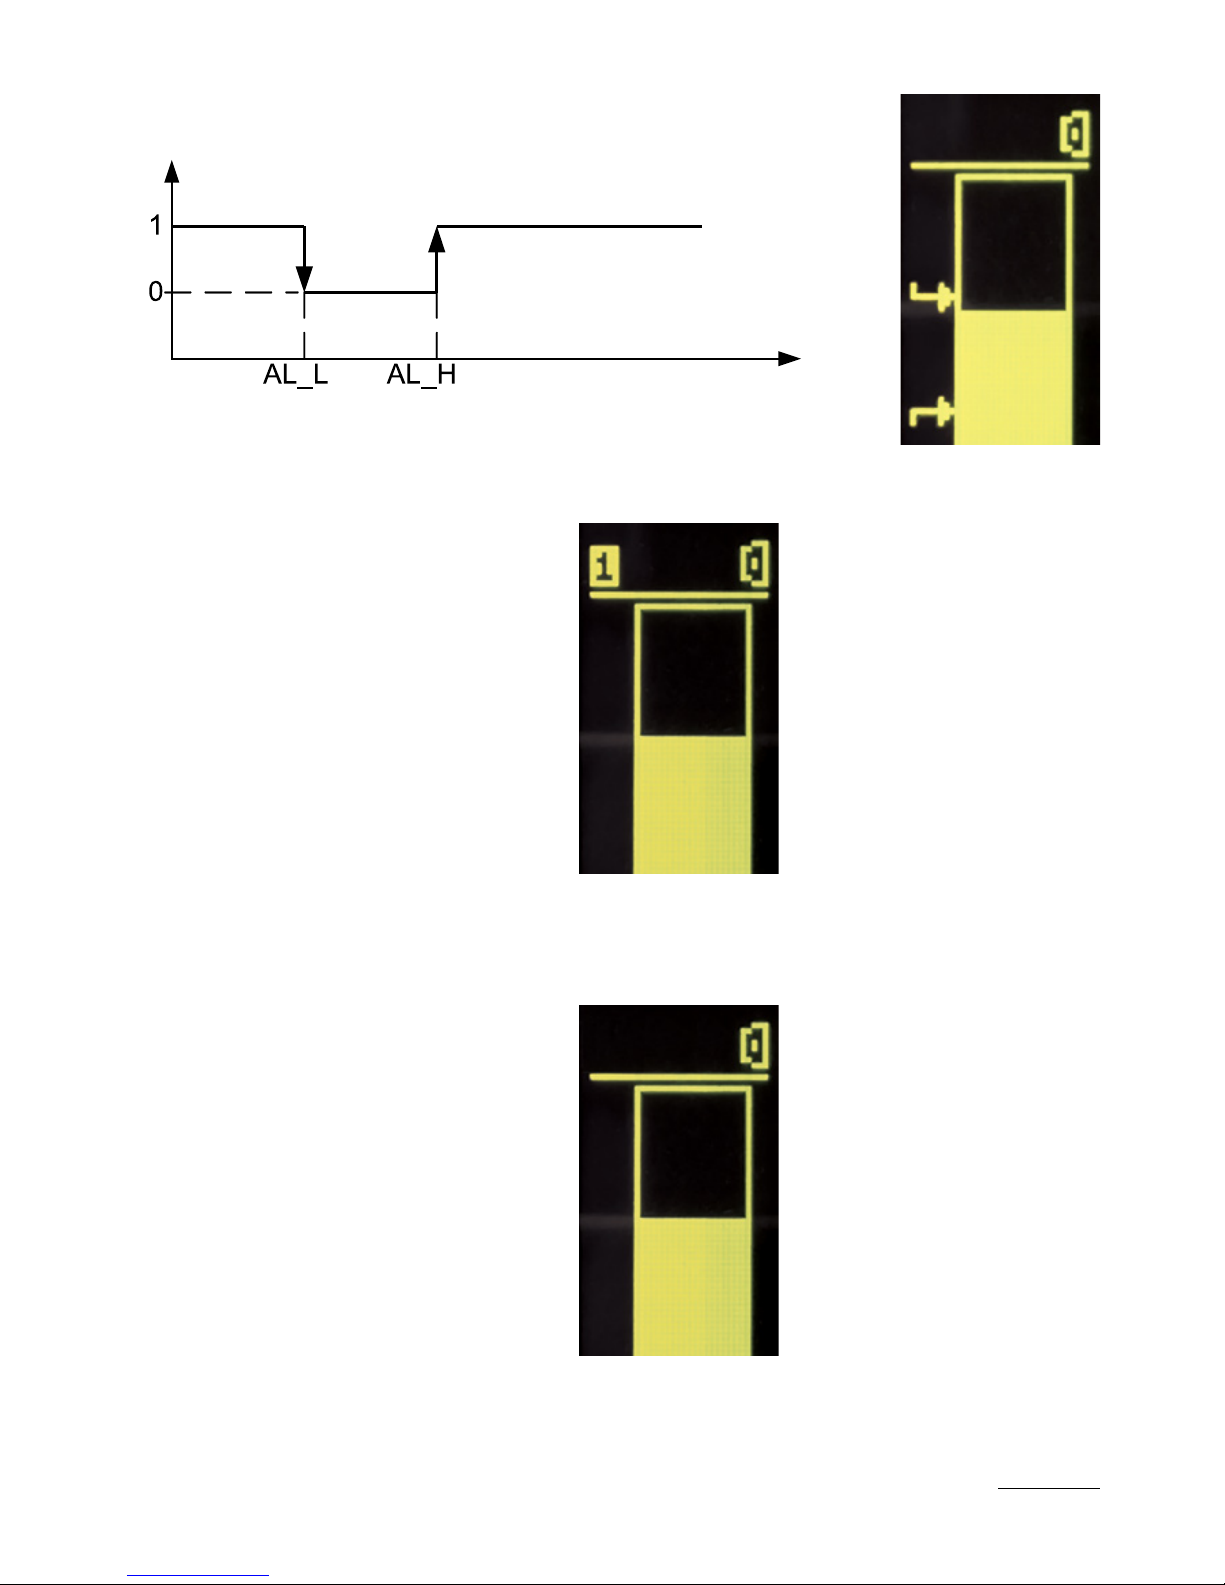
Figure 10.
H-OFF
H-ON
N-OFF
N-ON
OFF
ON
H-OFF
Page 17
17
Low
threshold
triggering
the relay
output
Lower threshold
of the input signal
causing the alarm
output reaction
(AL_L at Fig. 10)
-99999.9..99999.9 60.0
High
threshold
triggering
the relay
output
Upper threshold
of the input signal
causing the alarm
output reaction
(AL_H at Fig. 10)
-99999.9..99999.9 80.0
Relay
activation
delay
Relay activation delay
relating to changes
of the input signal
0 – 3600 s 0
Relay
deactivation
delay
Relay deactivation
delay relating to
changes of the input
signal
0 – 3600 s 0
General Settings
Saving
parameters
to the
memory
Saving actually set
parameters to the
internal non-volatile
memory.
Do not save
Save
Do not
save
Language Setting language for
dislpayed messages
Polish
English
Polish
Set
the default
parameters
Restoring the meter
default conguration
- -
NOTE: The button Save sends the current configuration
to the device N21 and save default settings to non-volatile memory.
In order to change not to apply after connecting and reconnecting the
supply, one needs to turn off the parameter Writing the parameters to
the memory.
Page 18
18
a) n-on
b) n-off
c) on
5.3.2 Alarm output operating modes
Measured value
Measured value
Alarm state
Alarm state
o
o
on
on
on
Measured value
Measured value
Measured value
Measured value
Alarm state
Alarm state
Alarm state
Alarm state
o
o
o
o
o
on
on
on
on
on
Measured value
Measured value
Alarm state
Alarm state
o
o
o
on
on
on
Page 19
19
d) off
Figure 10. Relay output operating modes
Measured value
Alarm state
o
on
on
e) H-on
always on
f) H-off
always off
Page 20
20
5.3.3 Individual characteristic
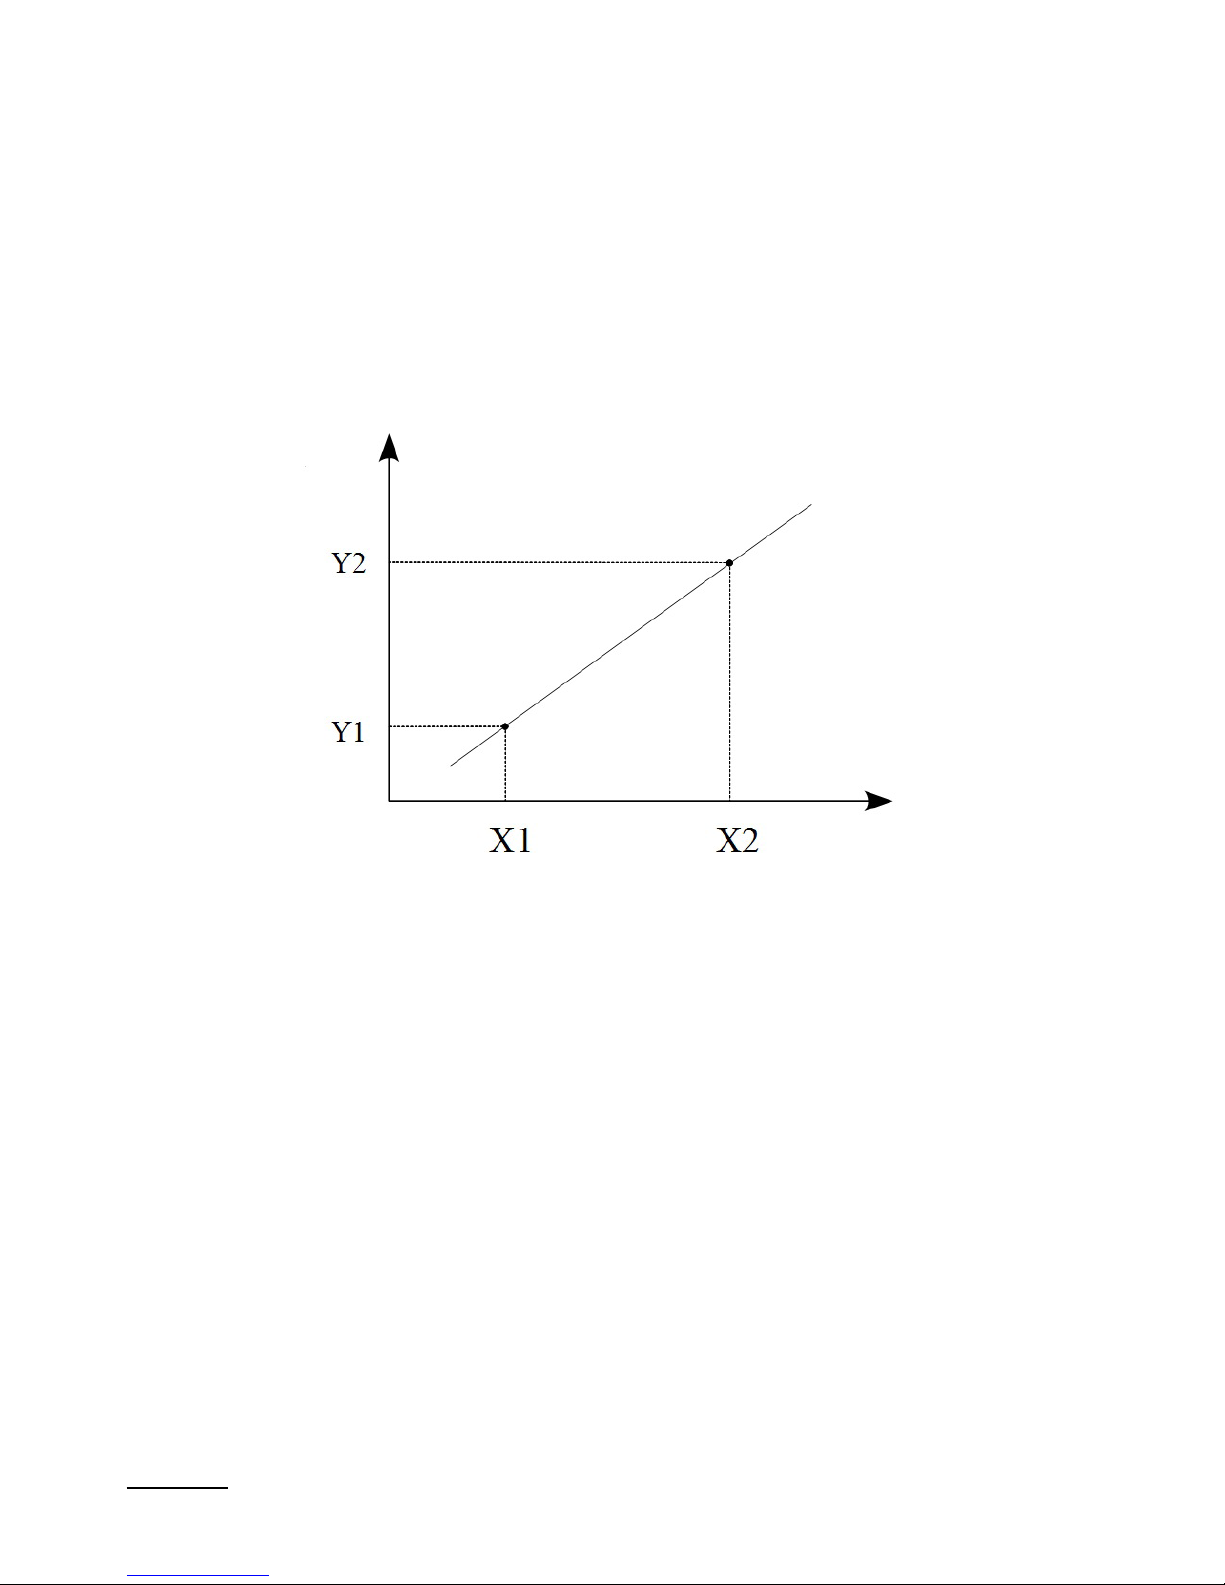
The individual characteristic allows the conversion of the measuring
value (converted by an optional activated individual characteristic) to the displayed value. It is used for imaging the measurements
of non-electrical quantities using non-electrical transducers
to the standard quantities. The conversion is done by an approximation
of a straight line passing through the characteristic parameters points (Fig. 11).
measuring value
value
displayed
Figure 11. Individual characteristic
Example: Pressure transducer with a range of 0-500 Pa and 0-10 V
voltage output is connected to the input voltage range of ± 10 V.
Set the individual characteristic as follows:
X1 – 0 (lower value of the measuring range of the N21 meter)
X2 – 10 (upper value of the measuring range of the N21 meter)
X1 – 0 (lower value of the measuring range of the pressure transducer)
X2 – 500 (upper value of the measuring range of the pressure
transducer)
After enabling the individual characteristic, the meter indicates directly
the value in Pa.
Page 21

21
5.3.4 Bargraph configuration
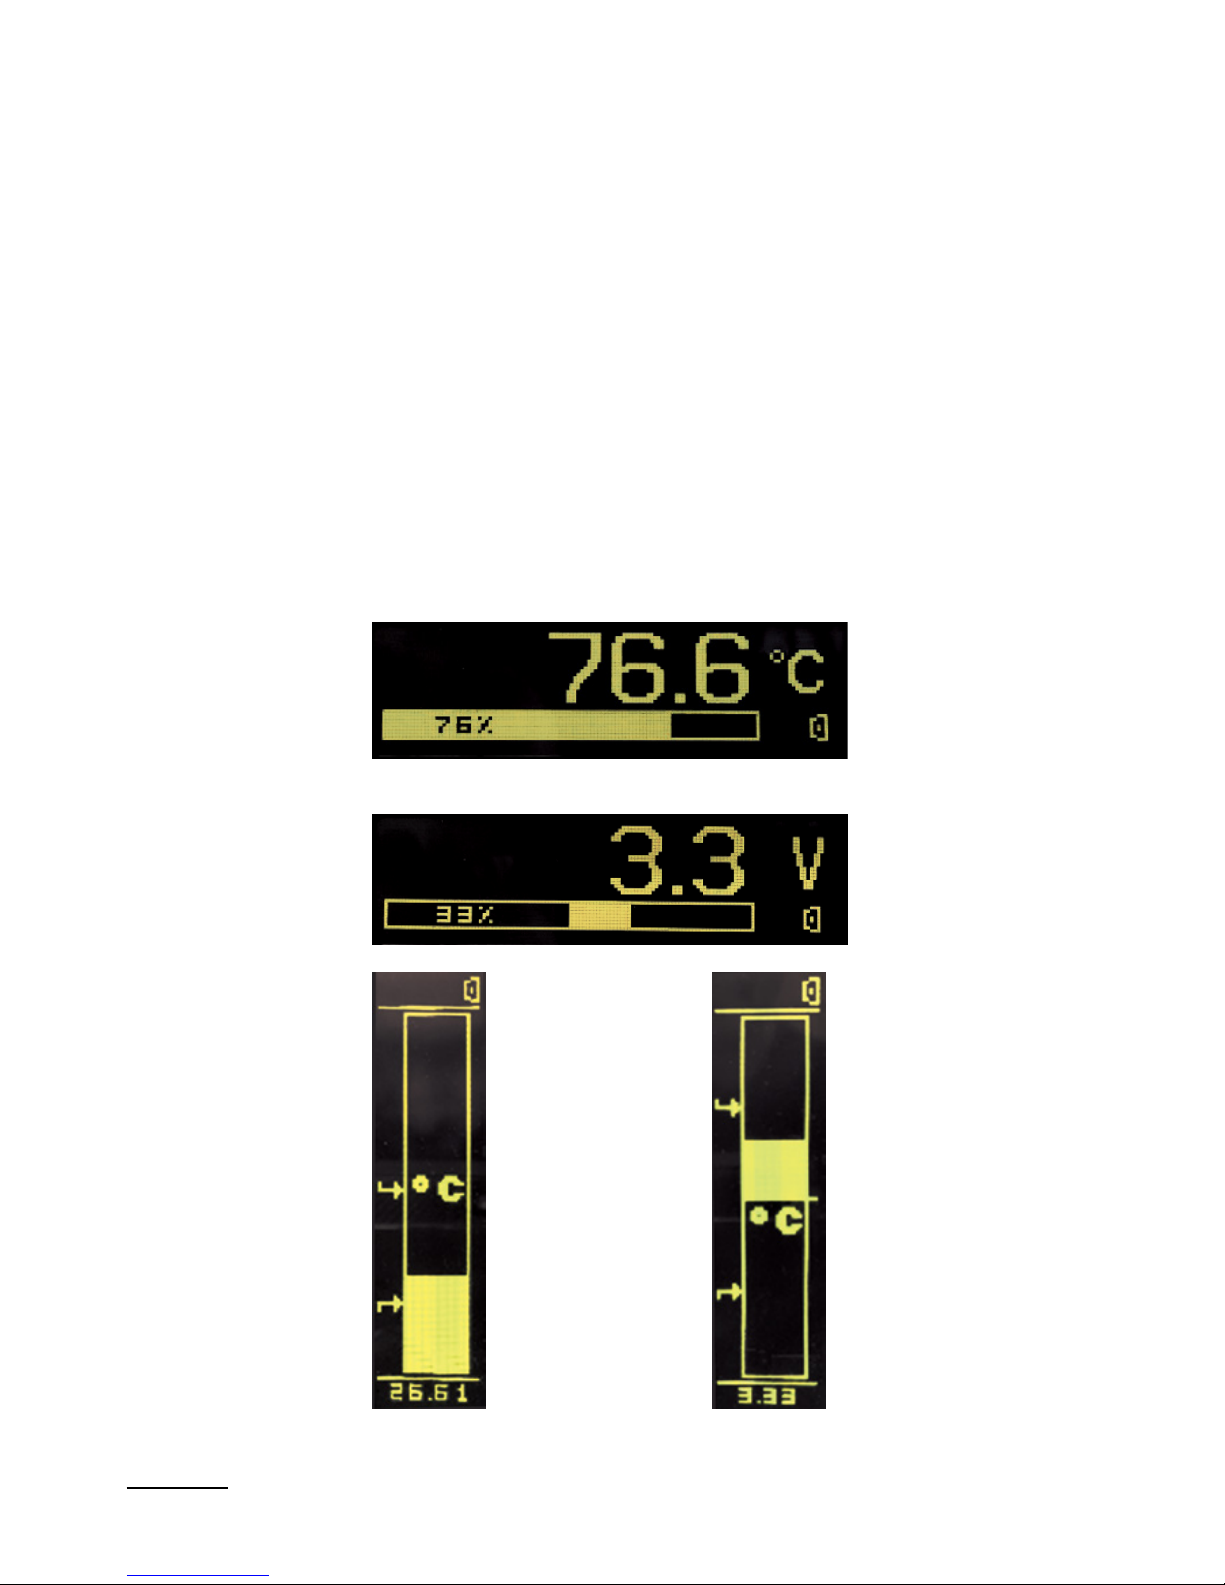
The conguration allows for the adjustment of the bargraph indications
to the user’s preferences. The bargraph is configured by setting
the measured values representing 0% of bargraph indications
and the measured values representing 100% of bargraph indications. Both
of these values can be positive and negative. Exceeding the bargraph
indications range is indicated by a flashing bargraph.
- Horizontal bargraph
When the display range is equal to zero (the same value for
upper and lower indication - default value), the bargraph takes
the symmetrical form and indicates positive and negative values.
The maximum displayed values are then dependent on the currently
selected measuring input and are as follows:
– input ±10 V -100 % for -10 V, 100 % for 10 V
– input ±75 mV -100 % for -75 mV, 100 % for 75 mV
– input ±20 mA -100 % for -20 mA, 100 % for 20 mA
– input PT100 -100 % for -200 °C, 100 % for 850 °C
– thermocouple input J -100 % for -210 °C, 100 % for 1200 °C
– thermocouple input K -100 % for -270 °C, 100 % for 1372 °C
It should be noted that in such arrangement of the temperature
inputs, the bargraph is not linear in it the entire range of its indications
and is only linear in sections of indications for both, positive and negative
indications.
Examples of settings:
a) PT100 temperature input, the measured value for 0% - 0, to 100% 100, we obtain the bargraph display range from 0 ° C to 100 ° C, excess
of 100 ° C is indicated by blinking of the bargraph. Figure 12a.
b) Input ± 10 V, the measured value for 0% - 0, for 100% - 0, we obtain
the symmetric bar graph indication of the range from -100% to -10 V
to 100% for 10 V. Fig. 12b.
Page 22
22
Figure 12. Bargraph configuration
- Vertical bargraph
For the vertical bar graph, its indication ranges should be defined for
the required values. The lower and upper values can be both positive
and negative, and the bar graph stays linear throughout its entire range
of indications. When the indication area contains a zero point, the zeroposition indicator is placed on the bar graph
Examples of settings:
c) temperature input PT100, the value measured for 0% - 0, for 100%
- 100, the obtained range of bar graph reading is from 0°C to 100°C,
exceeding the value of 100°C will be signaled by the pulsating bargraph.
Fig. 12c.
d) ±10 V input, measured value at 0%: - 10, for 100 %: 10, we obtain a
symmetric bar graph with an indication range of -100% for -10 V to 100%
for 10 V. Fig. 12d.
a)
b)
c) d)
Page 23
23
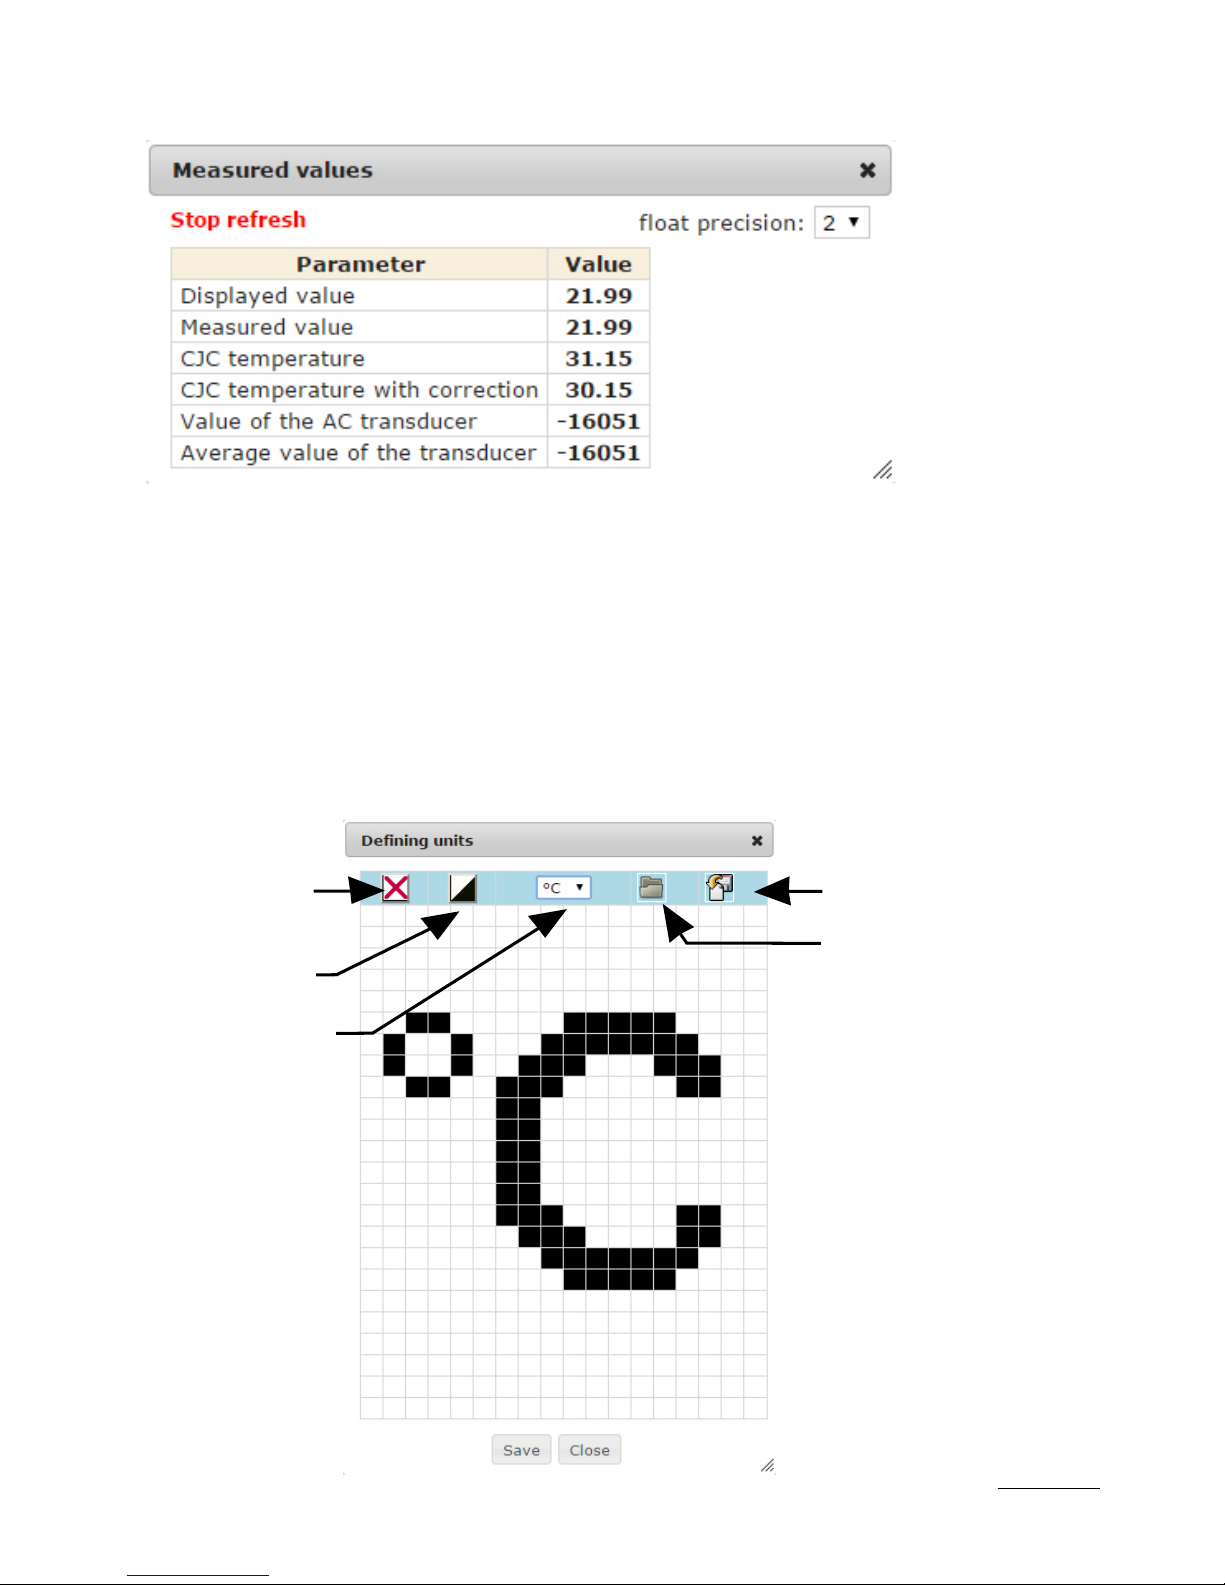
5.3.5 Preview of the measuring values
Figure 13.
Preview
of the
measuring
values
5.3.6 Editor of the measuring value unit
save to file
readout from file
Selection
of the
pre-defined
units
inversion
clearing
the editing
area
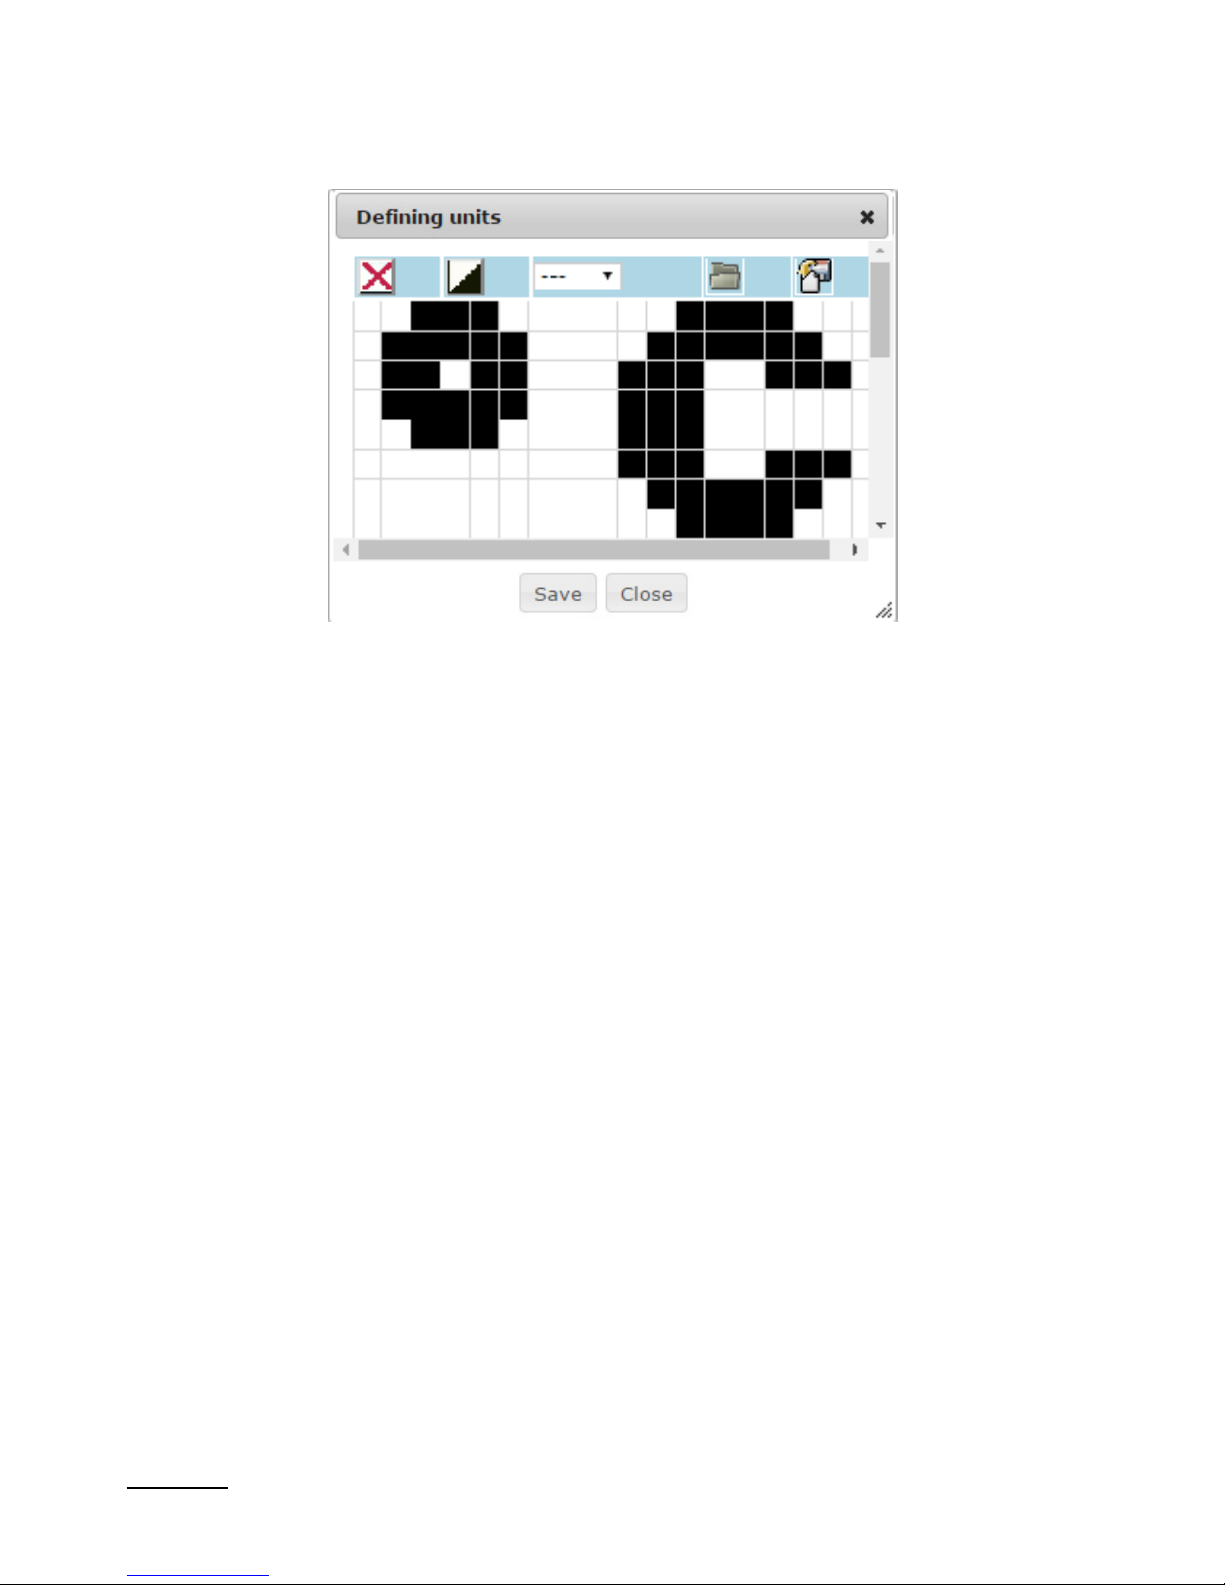
The unit of the measured value can be edited and stored in the nonvolatile memory of the meter. The edition takes place in the eCon program,
available free of charge on the manufacturer's website. For the horizontal
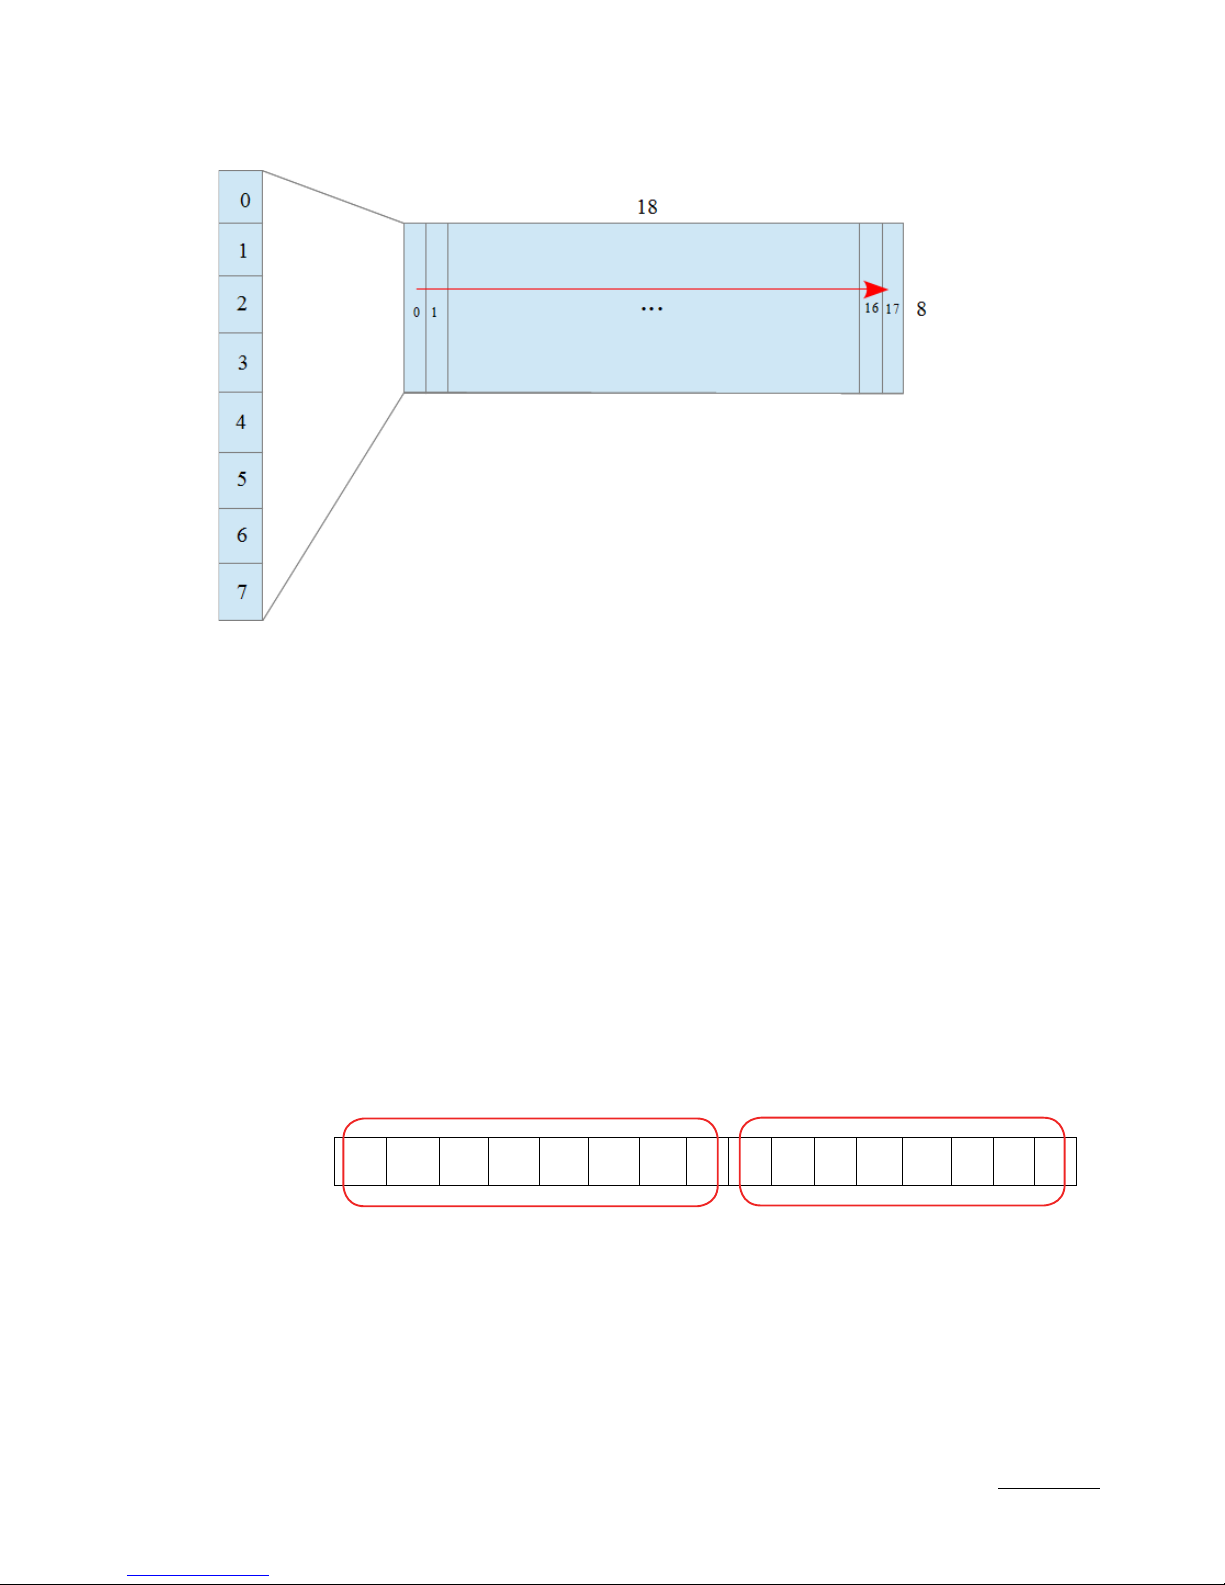
bargraph, you can define an image consisting of a maximum of 18x24
points. For the vertical bar graph, the area is reduced to 17x8 points.
a) horizontal bargraph
Page 24
24
Figure 14. Editor of the measuring value unit
b) vertical bargraph
Page 25

25
6. CONFIGURATION INTERFACE
6.1 USB Interface – list of parameters
The USB interface is intended only for the configuration of the meter.
• identifier 213 (0xD5)
• meter address 1
• baud rate 9.6 kbit/s
• operating mode Modbus RTU
• transmission mode 8N2
• maximum response time 100 ms
• implemented functions
- 03 readout of registers
- 04 readout of input registers
- 06 one register writing
- 16 registers writing
- 17 device identification
Broadcast address: 253
6.2 Map of N21 meter registers
In the N21 meter, data are placed in 16 and 32-bit registers. Process
variables and meter parameters are placed in the address area
of registers in a way depended on the variable value type. Bits in 16bit registers are numbered from the least significant to the most significant bit (b0-b15). The 32-bit registers contain float numbers compliant
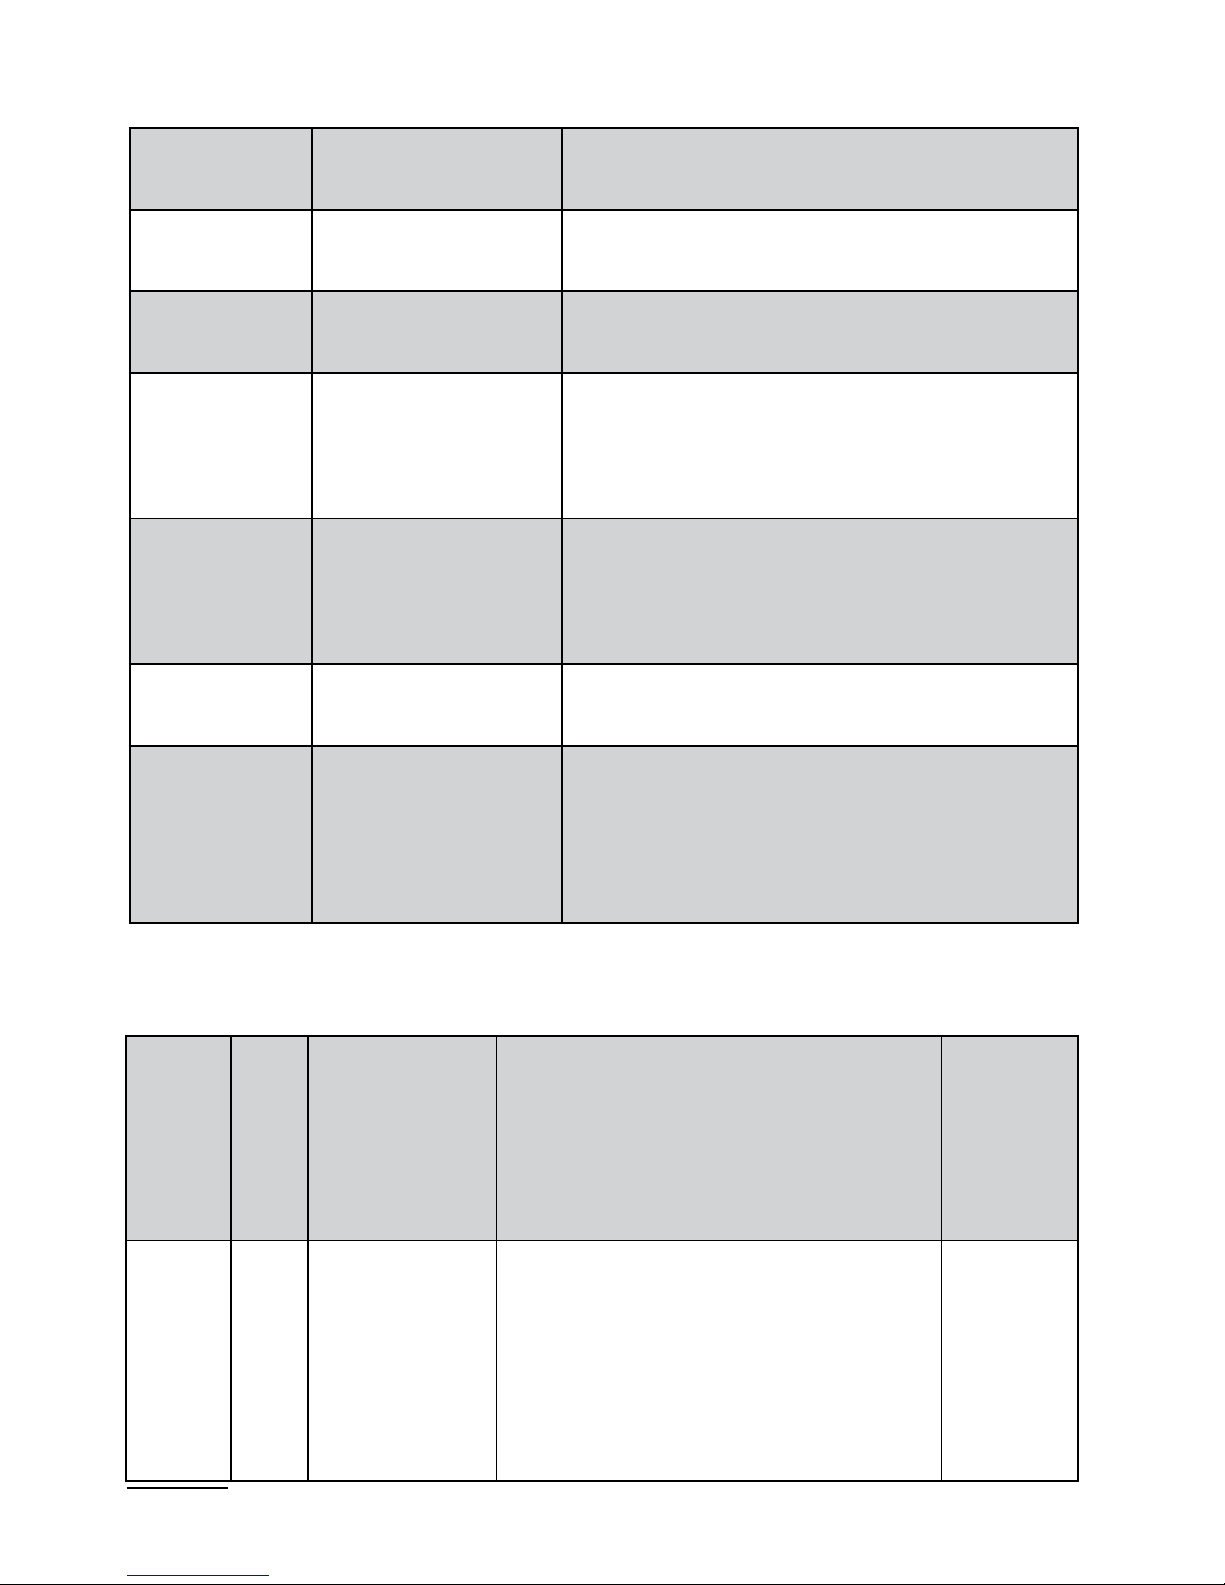
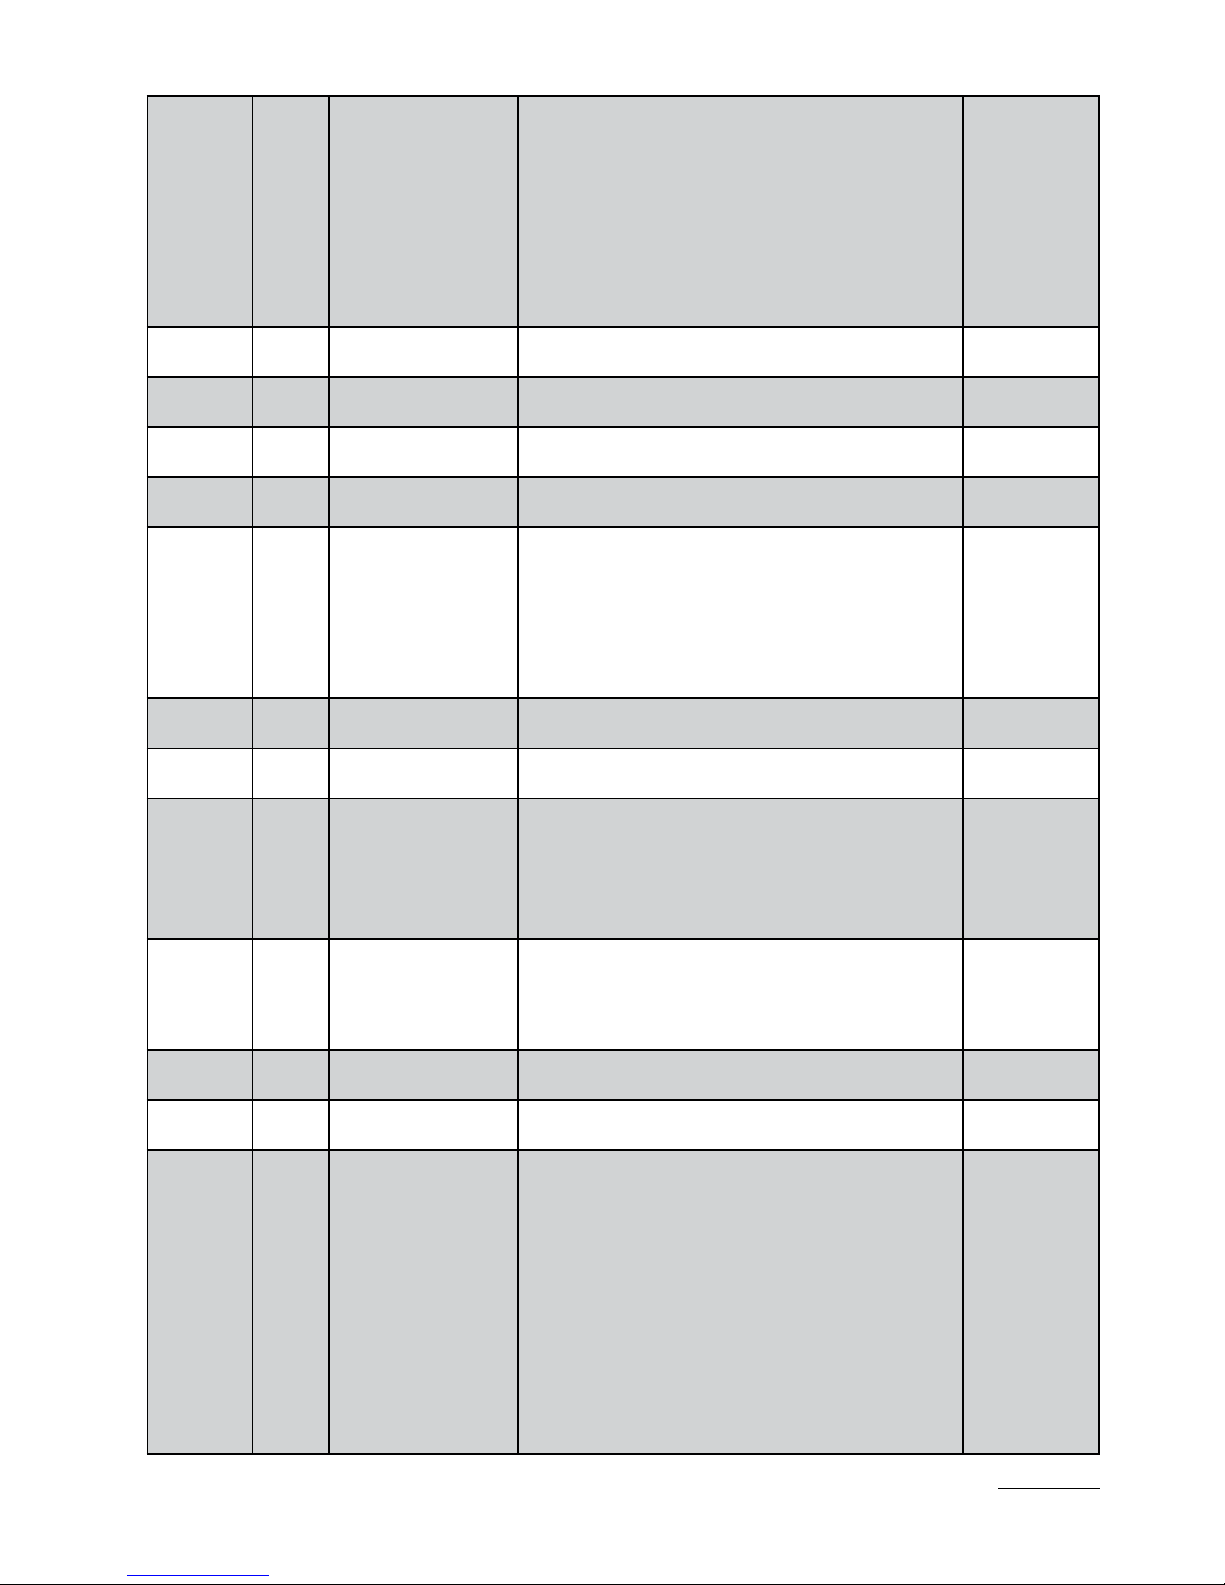
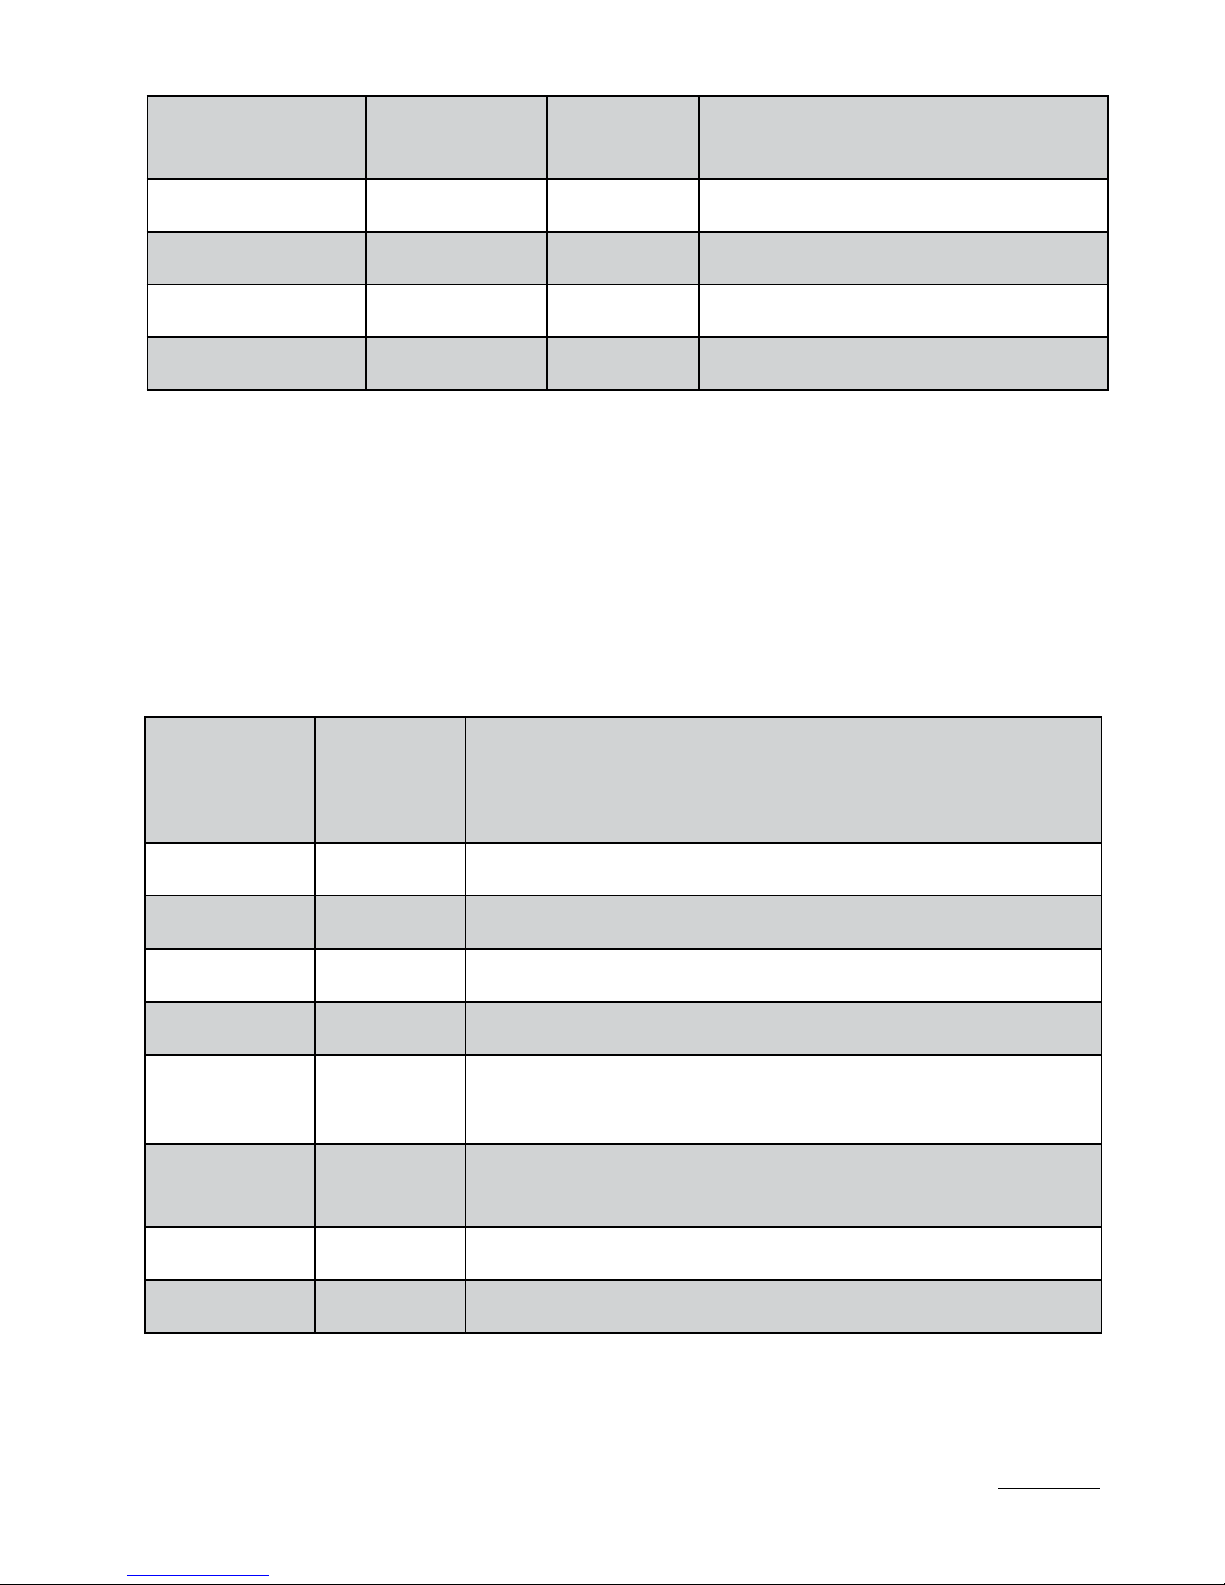
with IEEE-754 standard. Range of the registers is shown in Table 2. The
16-bit registers are shown in Table 3.
The 32-bit registers with their equivalent registers 2x16-bits are shown
in Table 4. The register addresses shown in the tables are their physical
addresses.
Page 26
26
Address
range
Value type Description
4000 - 4020 Integer
(16 bits)
Meter configuration. Value set in the 16-bit
register.
4500 - 4526 Integer
(16 bits)
User-defined graphical icon representing
the unit of the measuring value.
6000 - 6018 Float
(2x16 bits,
the byte order
of 3210)
Value is set in the two following 16-bit
registers. Registers contain exactly the
same data, as 32-bit registers of 7500
range. Read only registers.
7000 – 7018 Float
(2x16 bits,
the byte order
of 1032)
Value is set in the two following 16-bit
registers. Registers contain exactly
the same data, as 32-bit registers of 7500
range. Read only registers.
7500 – 7509 Float
(32 bits)
Value set in the 32-bit register. Read only
registers.
8012 - 8019 Float
(32 bits)
The coefficients of the individual
characteristic for the measuring value
conversion, configuration of the bargraph
indications range and triggering thresholds
of the alarm output.
Table 2
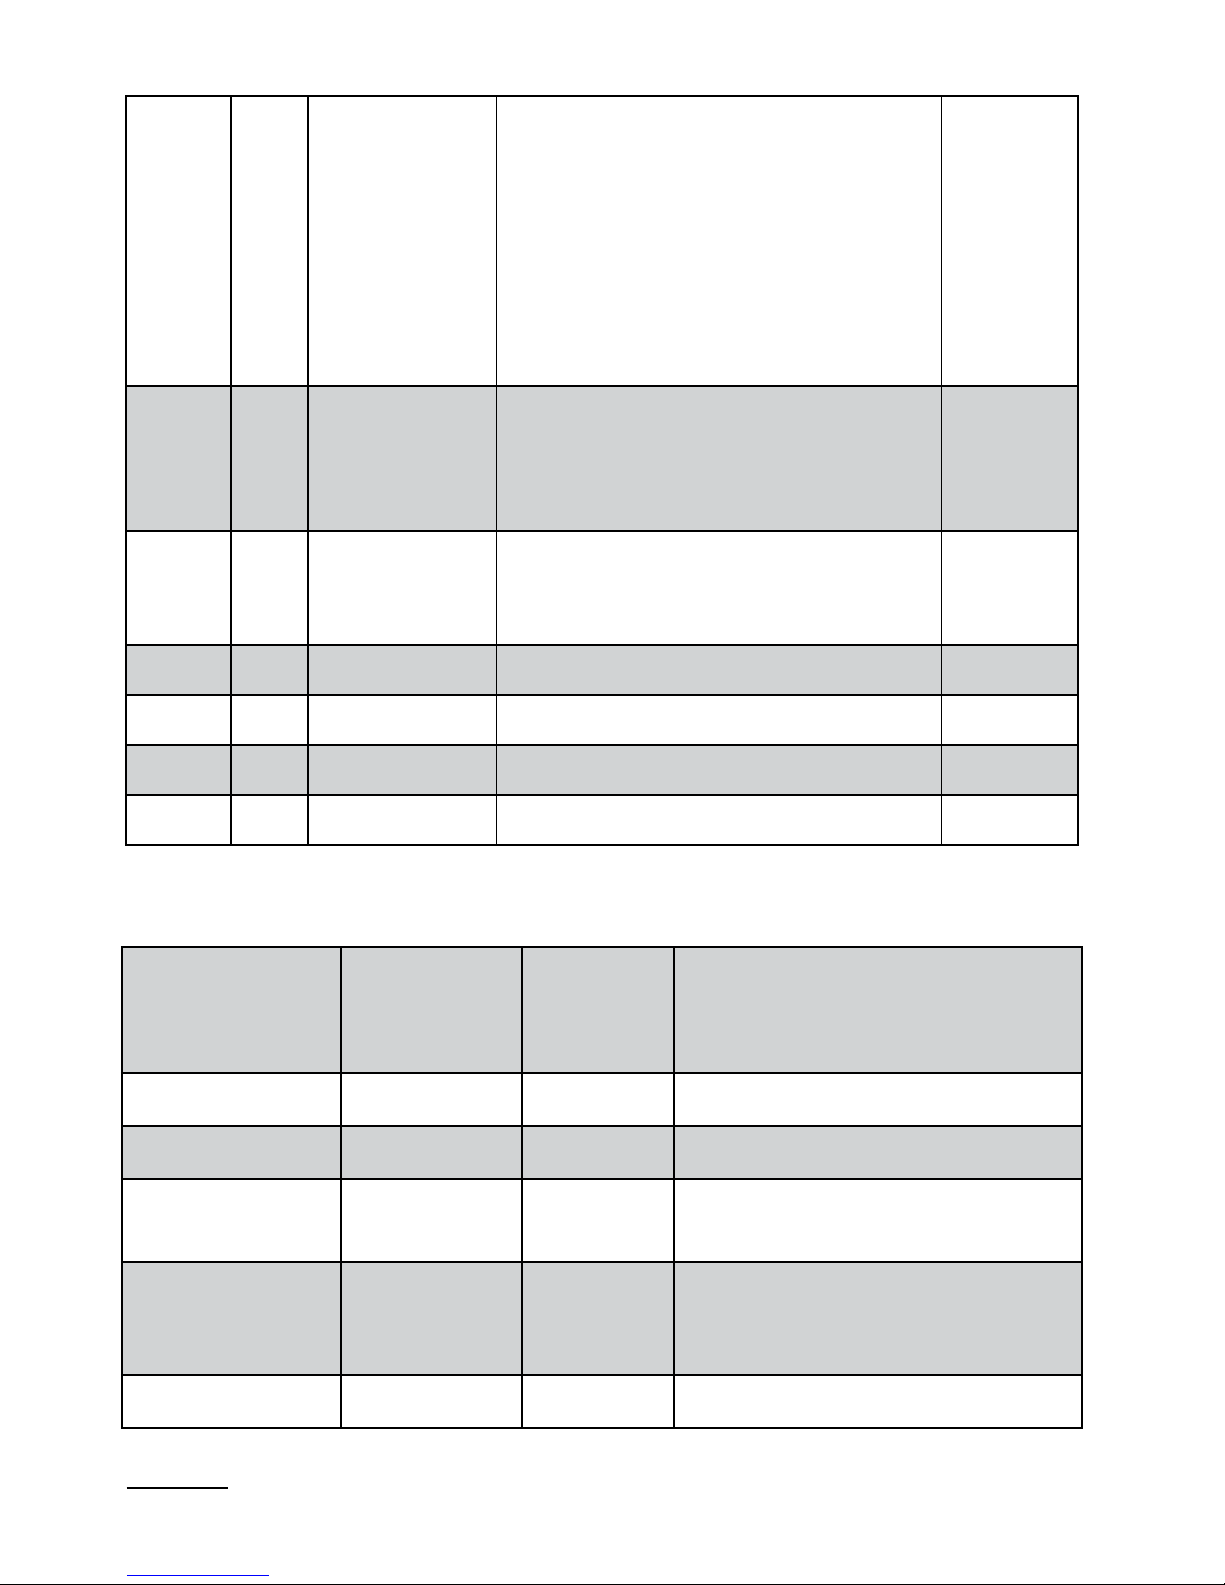
Table 3
Register
address
Operations
Range Description
Default
4000 RW 0..5 Selection of the measuring input:
0 – voltmeter ±10 V
1 – millivoltmeter ±75 mV
2 – milliammeter ±20 mA
3 – Pt100
4 – J thermocouple
5 – K thermocouple
0
Page 27
27
4001 RW 0..5 Relay output operating mode
0 – H-OFF (disabled permanently)
1- H-ON (enabled permanently)
2 – N-OFF
3 – N-ON
4 – OFF
5 – ON
0
4002 R - reserved 0
4003 R - reserved 0
4004 RW 0..3600 Relay activation delay 0
4005 RW 0..3600 Relay deactivation delay 0
4006 RW 0..3 Precision of the displayed values
0 – 0
1 – 0.0
2 – 0.00
3 – 0.000
1
4007 - - reserved
4008 - - reserved
4009 RW 0,1 Enabling individual characteristic
0 – without individual characteristic
1 – individual characteristic
enabled
0
4010 RW 0,1 Saving parameters to the memory:
0 – do not save
1 – save parameters
0
4011 RW 0,1 Restoring the default parameters 0
4012 reserved
4013 RW 0,1 Enabling the automatic
temperature compensation
of the thermocouple cold junction/
line resistance
0 – without automatic
compensation, a parameter
specified in the registry 4014 is
included in compensation
1 – automatic compensation
1
Page 28
28
4014 RW -6000..6000 The value of manual temperature
compensation of the thermocouple
cold junction or correction for the
resistance thermometer sensor.
Temperature range
-60.00
o
C...60.00 oC.
NOTE: The registry value contains
a temperature x100.
0
4015 RW 2, 5, 10, 30,
50, 100, 150,
200
Averaging time of the
measurement results:
NOTE: The registry value contains
time in seconds x10
0
4016 RW 0,1 Language of messages:
0 – POL
1 – ENG
0
4017 R - Serial number (MSB) -
4018 R - Serial number (LSB) -
4019 R - Software version -
4020 R - Custom-made version -
Table 4
16-bit
register
address
32-bit
register
address
Register
type
Description
6000/7000 7500 R Displayed value
6002/7002 7501 R Measuring value
6004/7004 7502 R Temperature of the
thermocouple cold junction
6006/7006 7503 R Temperature of the
thermocouple cold junction
with a correction
6008/7008 7504 R Value from AC converter
Page 29
29
When lower limit is exceeded, the value -99999 is set. Conversely,
when upper limit is exceeded, the value 99999 is set.
32-bit
register
address
Register
type
Description
8012 RW Individual characteristic, parameter X1
8013 RW Individual characteristic, parameter X2
8014 RW Individual characteristic, parameter Y1
8015 RW Individual characteristic, parameter Y2
8016 RW Measured value representing 0% of the bargraph
indication
8017 RW Measured value representing 100%
of the bargraph indication
8018 RW Lower threshold of alarm output triggering
8019 RW Upper threshold of alarm output triggering
Table 5
6010/7010 7505 R Averaged value from AD
converter
6012/7012 7506 R reserved
6014/7014 7507 R reserved
6016/7016 7508 R reserved
6018/7018 7509 R reserved
Page 30
30
32-bit
register
address
Register
type
Description
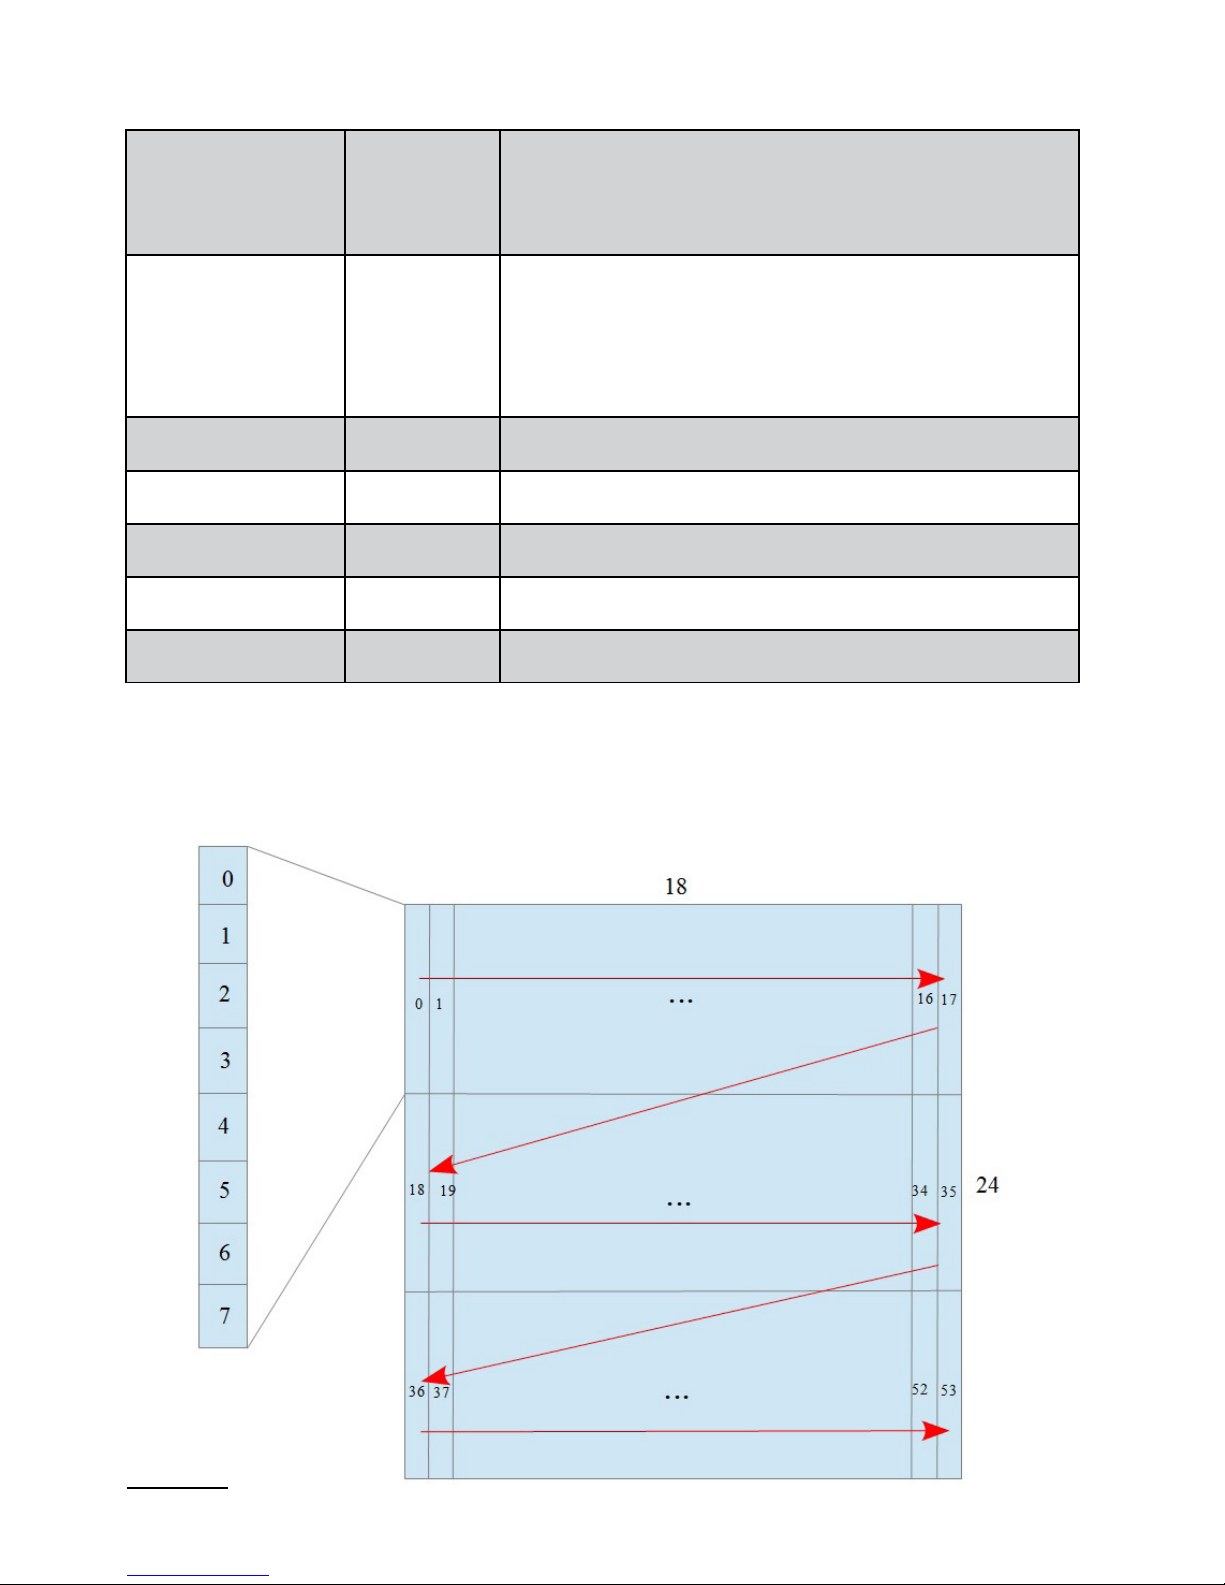
4500 RW Bit data of an image of the symbol
representing the unit of the measuring
value, as shown in Figure 14 and 15.
Lines 1, 0.
4501 RW Lines 3, 2
... RW
... RW
... RW
4526 RW Lines 53, 52
Table 6
Caution: In the case of the vertical bargraph, the image area ends on
register 4508, defining lines 17 and 16 (line 17 is empty = 0).
a) horizontal bargraph
Page 31
31
Figure 15. Designing an image of measuring value unit
b) vertical bargraph
The image of measured value unit takes a display area of 18x24 points
for the horizontal bargraph, or 17x8 for the vertical bar graph. The area is
divided into 3 or 1 row respectively, and each row in the 18 vertical lines
of 8 points each. Each line corresponds to one byte of data, in which the
value 1 in a given field corresponds to turning on a given point on the
display and the value 0 - turning off a given point. The definition of the
whole image forms a string of 54 or 18 bytes respectively in 16-bit 4500
registers of the meter. The values of the 8-bit lines in the 16-bit registers
are arranged as shown in Figure 16.
N = {0...26} for horizontal bargraph
N = {0...8} for vertical bargraph
Reg4500+N =
Line 1+N·2
Line 0+N·2
15 14 13 12 11 10 9 8 7 6 5 4 3 2 1 0
MSB
LSB
Figure 16. Setting a line value in the 16-bit register
Page 32
32
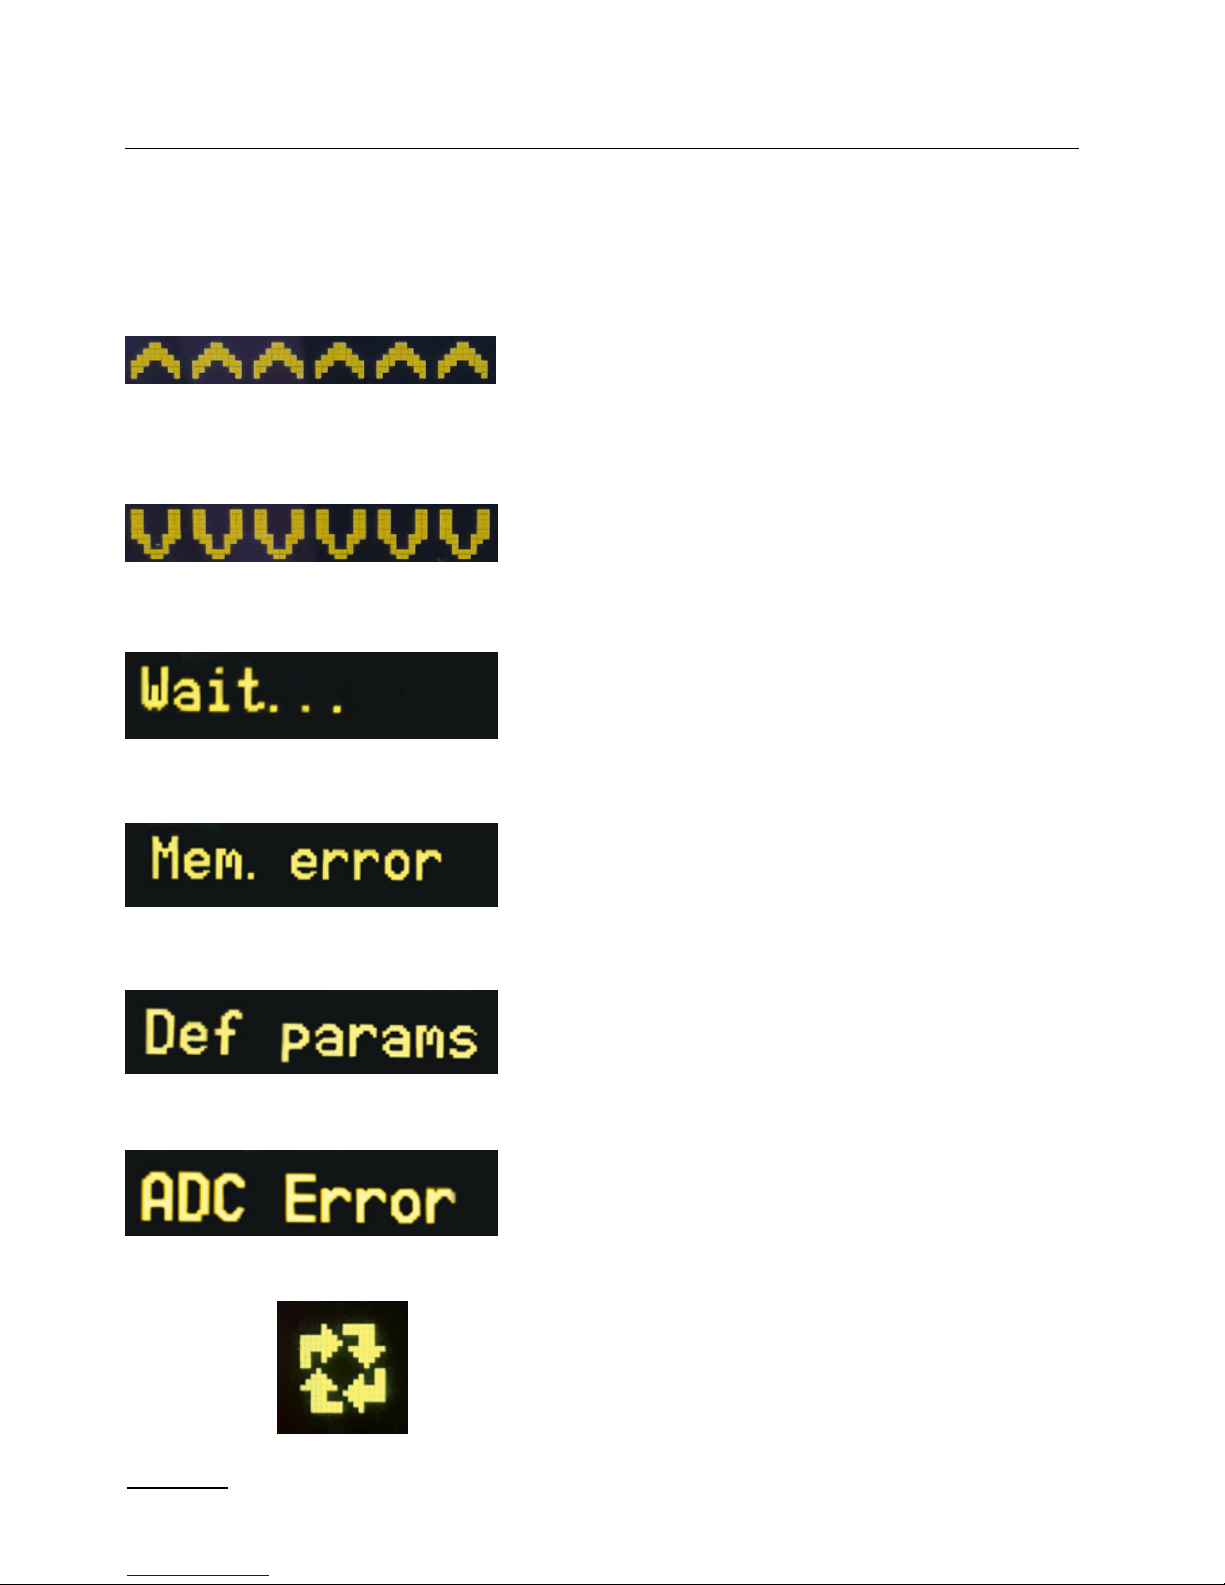
7. ERROR CODES
After switching the meter on the error messages may be displayed.
For the horizontal bargraph the list of messages is shortened and looks
as follows:
Overflow of the upper value range
or of the maximum number
of digits in the display field (too high display precision).
Overflow of the lower value range
or of the maximum number
of digits in the display field (too high display precision).
Saving the configuration to non-volatile
memory of the meter is in progress.
Failure of non-volatile memory of the meter.
Attempt to restore the default values.
Please contact the service on a recurrent
problem.
Restoring manufacturer settings.
Failure in communication with the measuring transducer of the meter. Please
contact the service.
Meter’s software update is in progress.
Page 33
33
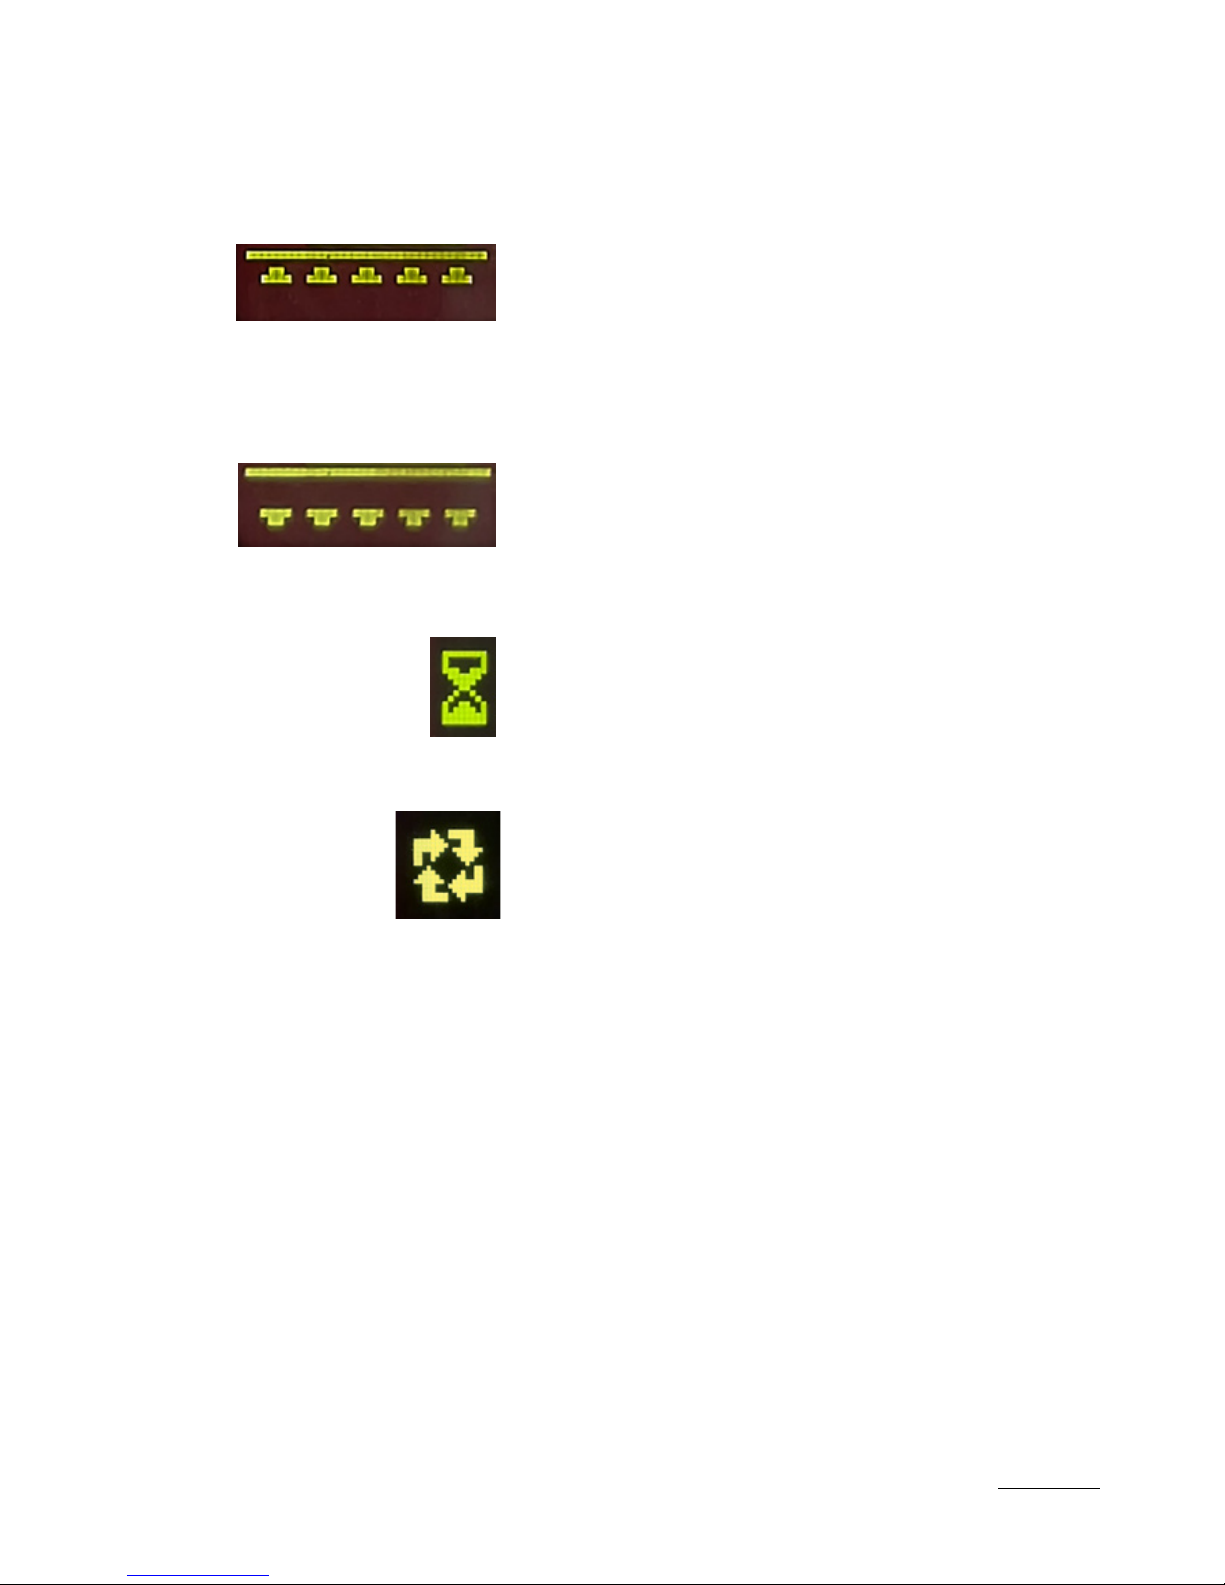
For the vertical bargraph the list of messages is shortened and looks
as follows:
Overflow of the upper value range
or of the maximum number
of digits in the display field (too high
display precision).
Overflow of the lower value range
or of the maximum number
of digits in the display field (too high
display precision).
Saving the configuration to non-volatile
memory of the meter is in progress.
Meter’s software update is in progress.
In the event of the meter malfunction, an ERR xx message may appear
on the display, where xx is the error number. In this case, please contact
the service and provide this number.
Page 34
34
8. SOFTWARE UPDATE
The features implemented in the N21 meter enable to upgrade its software using a PC with e-Con software installed. Free eCon software and
the update files are available at the website www.lumel.com.pl. Updating is done via the USB interface of the N21 meter.
CAUTION: Depending on the user’s preferences, a program version,
which is adapted to work horizontally or vertically can be downloaded to the N21 meter.
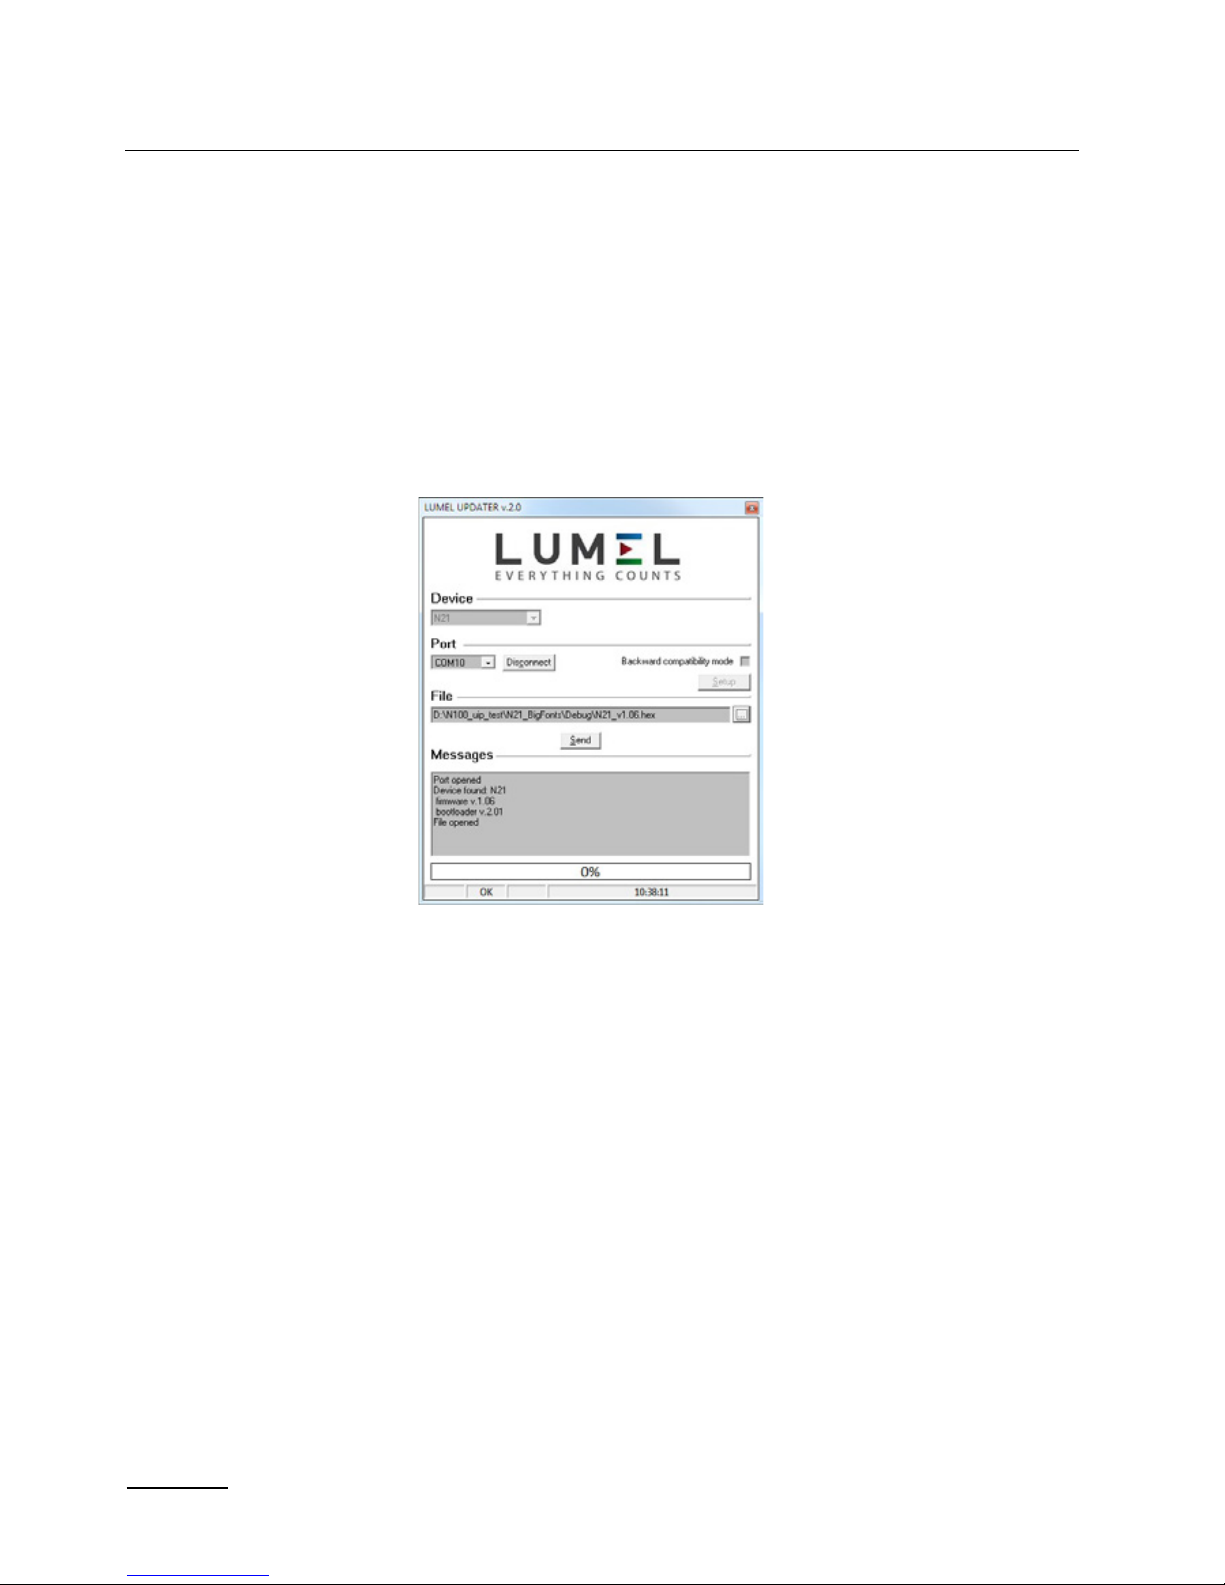
Figure 17. The program window for updating the software
Caution! Software update automatically resets meter settings to
manufacturer settings, so it is recommended to save meter settings using
e-Con software before upgrading.
When you start the e-Con program (Figure 7), set the communication
parameters in the Communication field at the left side of e-Con
window, and then click connect button. The meter will be automatically
recognized .
The parameters should be read and saved to a file for later restoration
Page 35
35
using the N21 – configuration field .
Next select Update firmware from the menu at the top. The window of
the LUMEL UPDATER (LU) program will open (Figure 17).
Using this program, select the correct port on which the N21 meter was
installed, select the device type from the drop-down list, select the correct
update file and press the Connect button. Information about the progress
of the update process is available in the Messages window. The message
Port opened is displayed when the port is opened properly. When the
meter is properly detected, information about the software version and
the bootloader version is displayed in the LU program. If the file is correct,
the LU program will display the information File opened. Press the Send
button. During the software update, the LU program shows the update
progress bar and the meter display shows the symbol
. After the update
process is successfully completed, the meter restarts, restores factory
values and proceeds to normal operation. Information Done and duration
of the update will appear in the LU program window. In the next step, you
can restore previously saved settings of the meter using e-Con software
Caution! Turning off the meter supply during the upgrade process may
result in permanent damage to the meter !
Page 36

36
9. TECHNICAL DATA
Measuring ranges:
Measuring ranges of Un voltage:
-90 mV…-75 mV…75 mV…90 mV input resistance > 200 k
-12 V…-10 V…10 V…12 V input resistance > 1 M
Measuring ranges of In current:
-24 mA … -20 mA … 20 mA … 24 mA input resistance < 50 1 %
Temperature measurement using Pt100:
-200 °C…850 °C current of the sensor
< 300 uA
max. resistance of wires < 20
Temperature measurement using thermocouple J: -50 °C…1200 °C
Temperature measurement using thermocouple K: -50 °C…1370 °C
Max. resistance the external measuring circuit:
- voltage input -75 mV...+75 mV < 100
- voltage input -10 V...+10 V < 100
- thermocouples < 100
Preheating time: 30 minutes
Basic error: ≤ (0.1 % of the range + 1 digit)
Page 37

37
Additional errors in rated operating conditions:
– compensationofcoldjunctiontemperaturechanges≤ 1 °C
– compensation of wire resistance changes
• when changing wire resistance,< 10 ≤ 0,5 °C
• when changing wire resistance,< 20 ≤ 1,0 °C
– fromambienttemperaturechanges ≤ (0.1 %
of the range /10 K)
Averaging time: ≤0.5s(default)
External transducers
supply output: 24 V 5 % 30 mA
Relay output:
NO
load 250 V~/0.5 A~
number of switching 1 x 10
5
Serial interfaces: USB for configuration: 1.1 / 2.0,
address 1;
8N2 mode;
baud rate 9.6 kbit/s,
max. USB cable lenght 3m
broadcast address: 253
transmission protocol: Modbus RTU
response time:100 ms
Test voltages:
• supply, alarm outputs 2.1 kV d.c.
• measuring inputs 3.2 kV d.c.
• USB interfaces 0.7 kV d.c.
Page 38

38
Protection grade IP:
from frontal side IP 65
for terminals IP 20
Protection grade IK IK 06
Power input in the supply circuit: ≤3VA
Weight < 0.2 kg
Overall dimensions 96 x 48 x 64 mm
Rated operating conditions:
- supply voltage 22..60 V a.c. 50..400 Hz / 20..60 V d.c.
(terminals 12-13)
60..253 V a.c. 40..400 Hz / 60..300 V d.c.
(terminals 13-14)
- ambient temperature -10 .. 23 .. +55 °C
- storage temperature - 25 .. +85 °C
- humidity < 95% (condensation
not permissible)
- external magnetic field 0..40 ..400 A/m
- sustained overload capacity: measurement of voltage,
current 110 %
- short-term overload (1 s)
sensor inputs 10 V
voltage inputs 2 Un
current inputs 10 In
- requirements for overcurrent
protection for supply circuit characteristic B
- working position any
Page 39

39
Readout field: OLED display, 32x128 points, amber
Electromagnetic compatibility:
– noise immunity acc. to EN 61000-6-2
– noise emission acc. to EN 61000-6-4
Safety requirements:
according to EN 61010-1 standard
• isolation between circuits: basic
• installation category III,
• pollution grade 2,
• maximum phase-to-earth operating voltage:
- for supply circuit 300 V
- for measuring input 50 V
- for remaining circuits 50 V
• altitude a.s.l. < 2000 m
Page 40
40
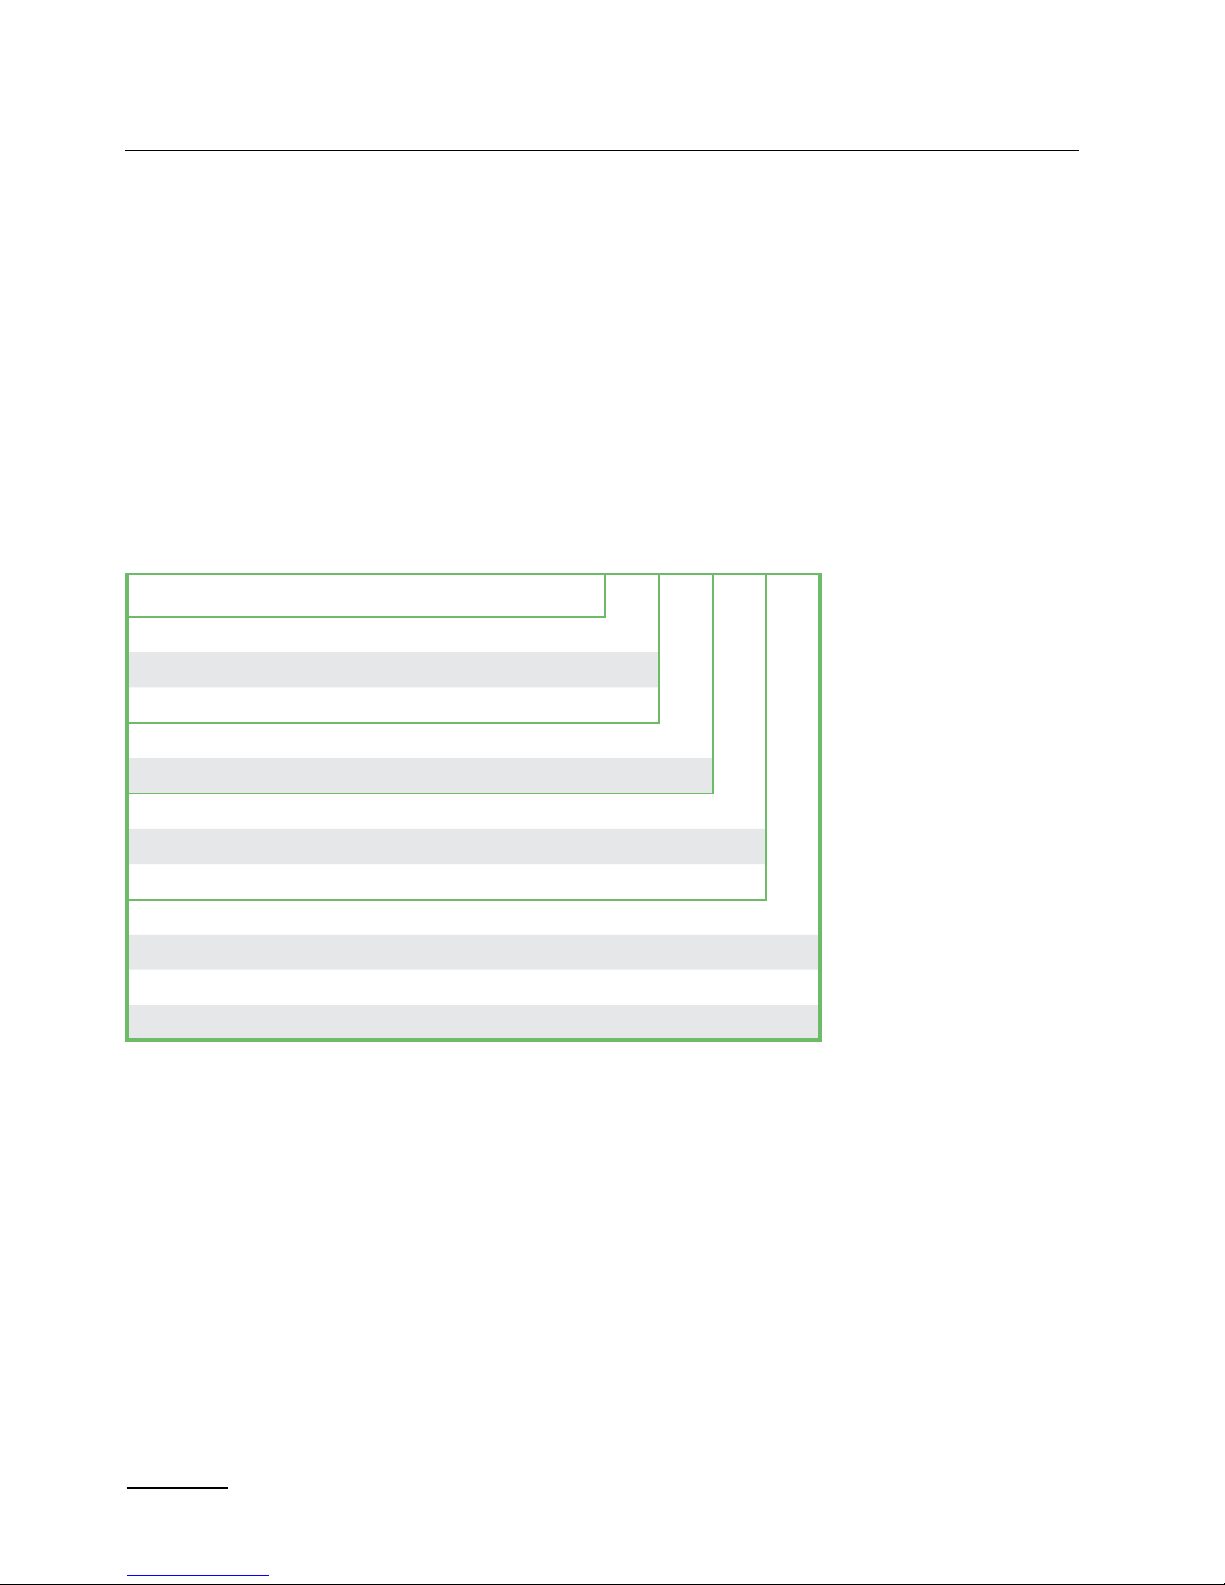
10. ORDERING CODE
The N21 meter comes standard with:
– universal input
– relay output
– power output 24 V d.c.
– supply voltage 24 V a.c./d.c., 230 V a.c./d.c.
– miniUSB port for programming
ORDERING CODE EXAMPLE:
The code N21-00E0 means:
N21 – N21 meter,
0 - display version: horizontal
0 - standard version,
E - English version,
0 - without extra quality requirements.
N21 - X X X X
Version (display):
horizontal 0
vertical V
Version:
standard 0
Language:
Polish P
English E
Acceptance tests:
without extra requirements 0
with an extra quality inspection certicate 1
with test certicate 2
Page 41

41
Page 42

42
Page 43

43
Page 44

44
Export department:
tel.: (+48 68) 45 75 139, 45 75 233, 45 75 321, 45 75 386
e-mail: [email protected]
N21-09C
LUMEL S.A.
ul. Sulechowska 1, 65-022 Zielona Góra, POLAND
tel.: +48 68 45 75 100
www.lumel.com.pl
 Loading...