

Page 1

BA-THI-01- GB
OPERATING MANUAL
DATA LOGGER THI/USB
Page 2
Operating manual THI/USB
A - 01
Table of contents
Foreword . . . . . . . . . . . . . . . . . . . . . . . . . . . . . . . . . . . . . . . . . . . . A - 01
1. Please read before putting into operation . . . . . . . . . . . . . . . . . . A - 01
2. Package contents . . . . . . . . . . . . . . . . . . . . . . . . . . . . . . . . . . . . . A - 02
3. What you will require . . . . . . . . . . . . . . . . . . . . . . . . . . . . . . . . . . A - 02
3.1. Installation of the required software . . . . . . . . . . . . . . . . . . . A - 02
3.1.1. Installation of the USB controller driver . . . . . . . . . . . . . . A - 02
3.1.2. Installation of the SmartGraph software . . . . . . . . . . . . . A - 03
4. Features . . . . . . . . . . . . . . . . . . . . . . . . . . . . . . . . . . . . . . . . . . . . A - 03
5. Operation . . . . . . . . . . . . . . . . . . . . . . . . . . . . . . . . . . . . . . . . . . . A - 04
5.1. Operating modes . . . . . . . . . . . . . . . . . . . . . . . . . . . . . . . . . . A - 04
5.2. Switching on and off . . . . . . . . . . . . . . . . . . . . . . . . . . . . . . . A - 04
5.3. Connecting external sensors . . . . . . . . . . . . . . . . . . . . . . . . A - 04
5.4. Displaying the measured values . . . . . . . . . . . . . . . . . . . . . . A - 04
5.5. Data recording options (logging) . . . . . . . . . . . . . . . . . . . . . A - 04
6. Notes on maintenance and operation . . . . . . . . . . . . . . . . . . . . . A - 05
7. Tips and tricks . . . . . . . . . . . . . . . . . . . . . . . . . . . . . . . . . . . . . . . A - 06
8. Technical data . . . . . . . . . . . . . . . . . . . . . . . . . . . . . . . . . . . . . . . . A - 07
This publication replaces all previous versions. No part of this publication may be reproduced or processed, copied or
distributed via electronic means in any form whatsoever except with our written permission. We reserve the right to make
technical changes. All rights are reserved. Trademarks names are used in the following without any guarantee of their
free usability and are basically as the manufacturer describes them. The trademarks used are registered and should be
treated as such. The right to make design alterations in the interests of continuous product improvement and alterations
to the shape or colour is reserved. The package contents may differ from the product illustrations. This document has
been prepared with the appropriate care. Nevertheless, we can accept no liability for any errors or omissions.
Foreword
In the THI/ USB, you have chosen a measuring instrument that offers you
a comprehensive range of possible uses.
The dual-channel data logger has two internal sensors to measure air temperature
and humidity.
Please study all the documentation for this device thoroughly, so that you can
exploit this measuring instrument’s range of functions to the full in practice.
This operating manual describes the hardware functions.
A separate operating manual for the corresponding software for configuring
the data logger, the software handbook, is included on the CD-ROM.
1. Please read before putting into operation
This measuring instrument has been constructed according to the current state of the
art and fulfils the requirements of the applicable European and national guidelines.
This conformity has been proven; the manufacturer is in possession of the relevant
declarations and documents. You as a user must follow these operating instructions
in order to maintain this condition and to ensure safe operation!
• Before using the device, this operating manual must be read carefully
and followed in all points.
• Never make measurements on live electrical parts.
• Observe the measurement range of the measured value recorder
(inappropriate use can lead to destruction).
• The determination of valid measuring results, conclusions and actions derived
from them are exclusively the responsibility of the user! Any liability or guarantee for the correctness of the results obtained is excluded. Under no circumstances will any liability be accepted for damage resulting from the use of the
measuring results that were obtained.
Appropriate
use:
• The measuring device may only be operated
within the specified technical parameters.
• The measuring device may only be used under the
conditions and for the purposes for which it was designed.
• Operational safety can no longer be ensured if modifications
or conversions have been made.
• Electronic equipment may not be disposed of in the domestic waste,
but must be correctly disposed of in accordance with the European
Parliament and European Council Guideline 2002/96/EG of 27th
January 2003 regarding used electrical and electronic equipment.
Please dispose of this equipment in accordance with the applicable legal
stipulations when its service life is ended.
Page 3

Operating manual THI/USB
A - 02
3.1.1. Installation of the USB controller driver
1. Place the CD-ROM in the CD-ROM drive of your PC.
2. Connect the data logger to your PC with the USB
cable provided.
After communication is established, a
message will be displayed on your PC,
stating that new hardware has been
found.
3. Hardware assistant
The hardware assistant will start
automatically. Select “Install the software automatically” and confirm
with “Next”.
The driver will be searched for.
A warning message will appear,
stating that the installed software has
no
t passed the W
indows logo t
est.
IMPORT ANT!
Ignore this warning message and
select “Continue Anyway”.
The USB driver will be installed.
Select “Finish”.
The f
irst required USB controller
is now available.
Note: Only the first required USB
controller will be installed!
2. Package contents
Your data logger is supplied
with the following components:
• Data logger
• USB cable, length 1 m
• CD-ROM with software and operating manuals
• Fixing kit for wall mounting
• Works certificate
3. What you will require
To configure your data logger and to read out the recorded measured values,
you will require a PC with the following minimum performance:
• 450 MHZ Pentium-compatible CPU or better
• CD-ROM drive
• USB connection
• Operating system Windows 98/2000/ME/XP
• Minimum 128 MB RAM
• Adobe Acrobat Reader software
• Approx. 5 MB free hard disk space for installation of the software
• An additional 10 bytes of hard disk space for each measured
value to be logged
3.1. Installation of the required software
Two prior steps are necessary in order to connect the data logger
to the PC and to configure it using the software:
• Installation of the USB controller driver
• Installation of the SmartGraph software
IMPORTANT : For the installation of the second required
USB controller driver, it is necessary to repeat the entire
procedure until the second required USB controller is
available, otherwise the SmartGraph software cannot recognise
the data logger!
Page 4

Operating manual THI/USB
A - 03
3.1.2. Installation of the SmartGraph software
1. Place the CD-ROM in the CD-ROM drive of your PC
Further and more detailed information on the use of the software can be found
in the software handbook, which is also included on the CD-ROM.
2. Install the software on your PC.
Follow the installation assistant’s
instructions.
3. After successful installation,
start the software.
4. In the “device” menu, select the menu
item “communication”.
5. Select the interface for your data
logger and confirm the selection.
6. Connect the data logger to your
PC with the USB cable provided.
Make sure that the USB driver
has already been installed.
7. The data logger can now be called
up via the software. To do this, select
the relevant item in the “device”
menu.
4. Features
Your data logger has the following features:
display for
the indication
of measured
values, operating mode,
date and time
USB B PC
interface
concealed operating mode button
• Two measurement channels for the recording
of various measured variables:
Measurement channel 1:
Internal air temperature sensor
Measurement channel 2:
Internal capacitive air humidity sensor
• One memory for 60,000 single measured values per measurement channel
• A separate alarm function for each measurement channel
Page 5
Operating manual THI/USB
A - 04
5. Operation
5.1. Operating modes
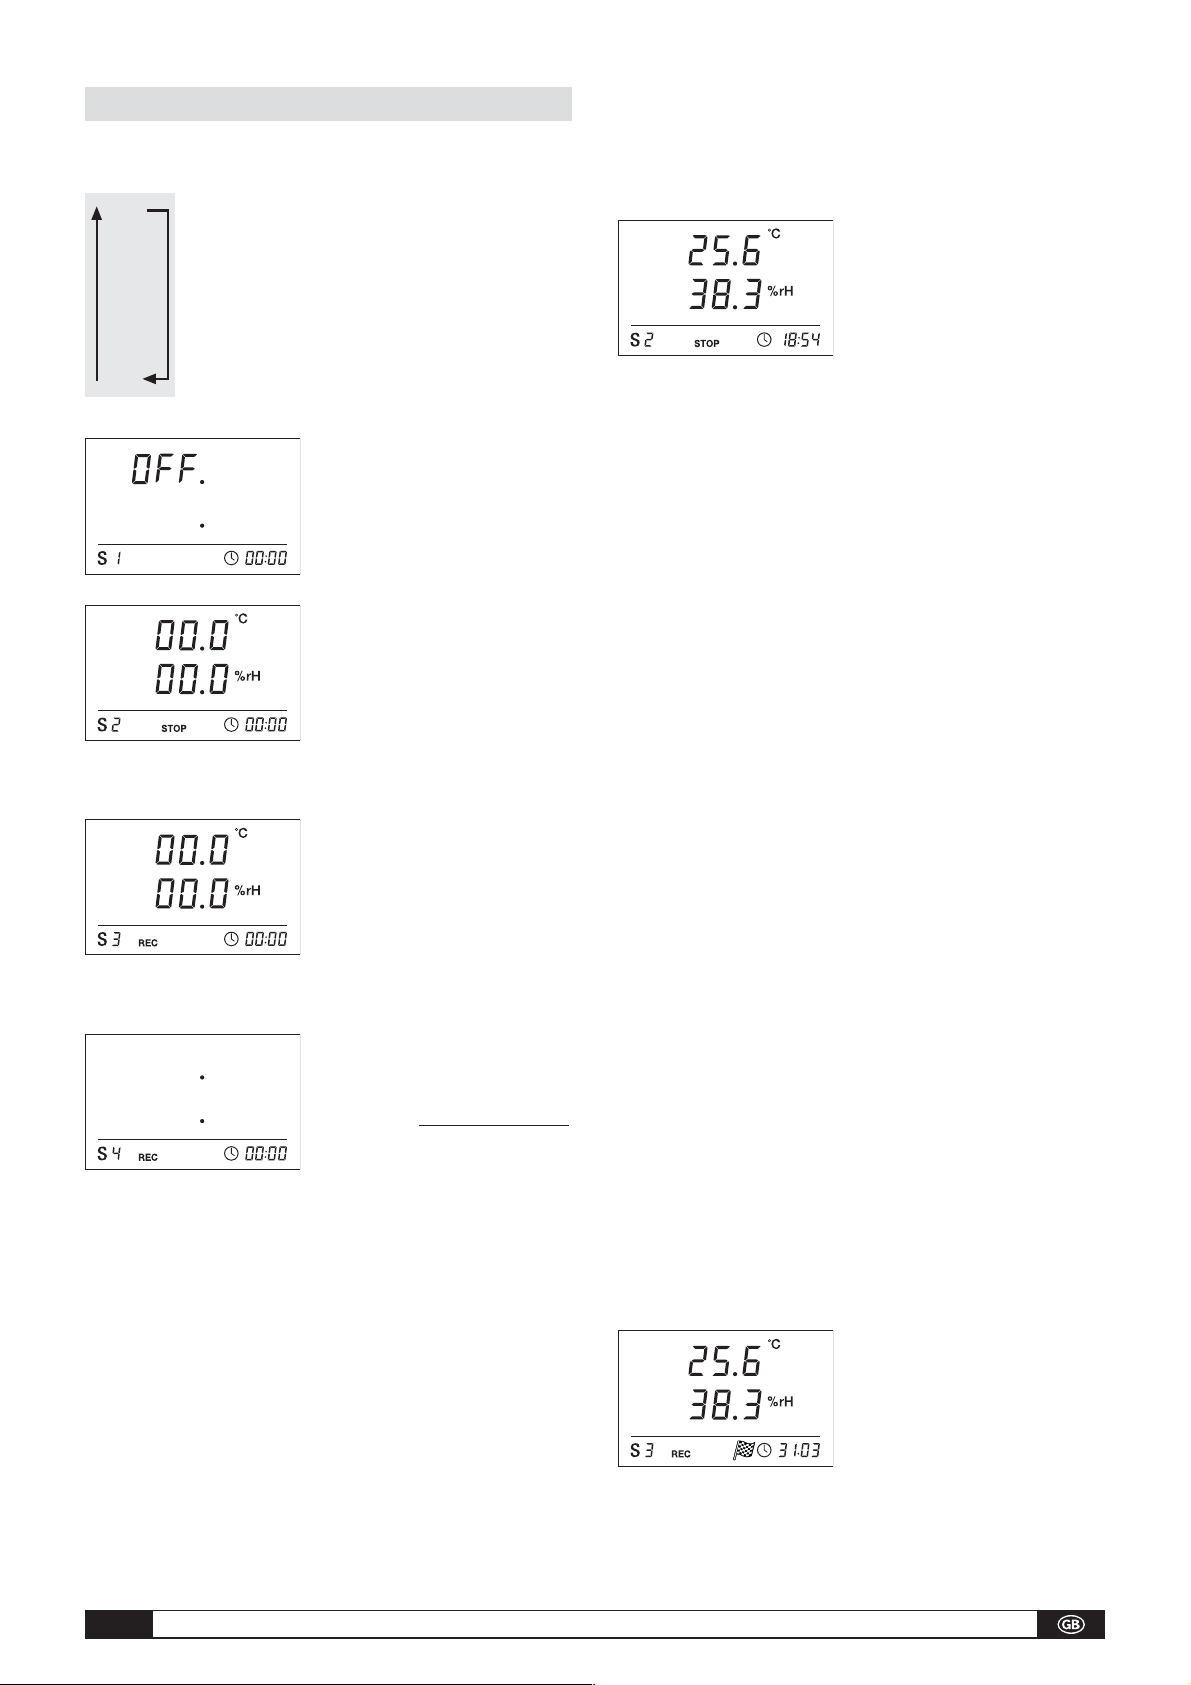
Four different operating modes can be selected for the data logger. The selected operating mode (selection) is indicated in the
bottom left-hand corner of the display with S1, S2, S3 or S4.
Switching between the various operating modes is effected via the
operating mode button.
To select the desired operating mode, press and hold down the
operating mode button with the aid of a blunt object, such as a
ballpoint pen, until the desired operating mode (S1, S2, S3, S4) is
indicated in the bottom left-hand corner of the display.
The four operating modes:
Operating mode 1 (S1)
The data logger is switched off. OFF appears
in the upper line.
Operating mode 2 (S2)
The data logger is switched on; it determines
the measured values of the individual measurement channels and displays them, as described in chapter 5.4. The logging mode is
not activated in this operating mode; the displayed values are not stored in the memory. The display indicator for the storage of
the measured values therefore displays STOP (no recording).
Operating mode 3 (S3)
The data logger is switched on; it determines
the measured values of the individual meas-
urement channels and displays them, as de-
scribed in chapter 5.4. The logging mode is
activated in this operating mode; the displayed
values are stored in the memory. The display indicator for the storage of the measured values therefore displays REC (recording of the measured values).
Operating mode 4 (S4)
The data logger is switched on; it determines
the measured values of the individual meas-
urement channels but does
not displa
y them.
The logging mode is activated in this operating mode; the displayed values are stored in
the memory. The display indicator for the storage of the measured values therefore
displays REC (recording of the measured values).
5.2. Switching on and off
The data logger is switched on and off via the operating mode button (see chapter
5.1). The equipment is delivered as standard in operating mode S1 (switched off).
Switching on
Press and hold down the operating mode button of the switched-off data logger with
the aid of a blunt object, such as a ballpoint pen, until the desired operating mode (S2,
S3, S4) is displayed. The device is now operating.
Switching off
Press and hold down the operating mode button of the switched-on data logger with
the aid of a blunt object, such as a ballpoint pen, until operating mode S1 and OFF
are displayed. The device is now switched off.
5.3. Connecting external sensors:
The connection of external sensors is not possible for this model.
5.4. Displaying the measured values
Two different measured values
are displayed simultaneously.
5.5. Data recording options (logging)
When operating mode S3 or S4 is selected, the data logger is in logging mode and
the measured values determined are stored in the device. The specifications for the
type, duration and scope of the data recording in logging mode can be individually
set via the software.
The following list of the various options serves only as a quick overview; more detailed
information on this subject may be found in the software handbook.
Selection possibilities for the logging mode:
The measuring instrument records the measured data continuously. Two possibilities
for the organisation of the memory are available for selection:
Start-stop mode
In start-stop mode, the measured data for each channel is recorded until the memory capacity of 60,000 values per channel is reached. Recording is then ended automatically.
Ring mode
Alternatively, ring recording mode may be selected in place of start-stop mode. In
this case, the recording does not stop when the memory capacity has been reached,
but continues indefinitely. To this end, the respective oldest values are continuously
overwritten by the newest measured values.
Further adjustable parameters for the logging mode:
Sampling rates
The measured value to be stored during sampling can be selected via the software
for each logging mode. The following measured values can be selected in any combination as desired: average value, minimum value and maximum value.
Additionally, the sampling rate for the sensor and the storage rate for recording the
measured values can also be set. Both rates can be set from 1 to 1440 minutes.
Preset operating mode
Besides the possibility of starting the recording of measured values immediately, the
data logger can also be used in the so-called preset operating mode. The starting date
and time for the measurement period are set and the recording of the measured values starts at this time.
If preset operating mode has been selected,
the starting flag symbol is displayed in the
lower display line and the starting date and
time for data recording will be displayed alternately in the date/time display.
When the preset starting time is reached, the
starting flag display disappears, the real time clock is displayed, the data logger
switches automatically from the previous operating mode (S1, S2, S3) to the logging
mode of operating mode S4 and data recording begins. It is therefore not neces-
sary to switch on the logger in preset operating mode.
S4
㒋
S3
㒋
S2
㒋
S1
Measurement
channel 1
Measurement
channel 2
Page 6

Operating manual THI/USB
A - 05
Even if the data logger had already been previously switched on, in preset operating mode it records exclusively the measured data for the defined period, but not the
measured data from the time of switching on.
Alarm function
A separate alarm function for each measurement channel can be configured via the
measuring instrument administration. A value corridor is specified, the so-called ‘good’
range, outside of which an alarm is triggered, via the definition of an upper and lower
alarm limit value.
If an alarm is triggered on one of the available
measurement channels, a continuously flashing alarm symbol appears alongside the measured value for this channel for as long as the
measured value lies outside the ‘good’ range.
If the measured values re-enters the defined
value corridor, i.e. the ‘good’ range, the alarm no longer flashes, but is displayed statically. This is intended to indicate that an alarm event has taken place. If the measured value once again moves outside the ‘good’ range, the alarm symbol flashes
again.
The alarm display is extinguished by reading out the measured value memory.
Additionally, a hysteresis can be set, by which value the measured value must
re-enter the valid range in order to switch off the alarm.
Further information on alarm hysteresis and its practical use can be found in the
chapter “Tips and tricks”.
Note: The visual illustration of the alarm function on the display is only available
in operating modes S2 and S3! The storage of alarm events in logging mode is,
however, independent of the select
ed type of display of the measured values,
i.e. the alarm events are recorded even in operating mode S4 with the display
deactivated.
upper alarm
limit value
lower alarm
limit value
valid value
corridor
(“good” range)
flashing
static
logging mode
read-out of the measured value memory
Alarm display
6. Notes on maintenance and operation
Positioning for mobile use
The data logger can be positioned as required for the mobile recording of measured
values. Please observe the permitted ambient conditions for operation (see
technical details) Due to its compact dimensions, the data logger can also be placed
out of sight for inconspicuous use.
Wall mounting
The data logger can also be mounted on a wall for the stationary recording of data.
A fixing kit for wall mounting is included in the package. Only the holding plate need
be mounted on the wall to install the data logger. The data logger can then be slid
onto the holding plate by means of the guide rail at the rear.
Change of location
In particular when moving from a cold to a warm environment, for example, when bring-
ing the device into a warm room after overnight storage in a car, water may con-
dense on the circuit board, depending on the relative humidity of the air in the room.
This physical effect, which cannot be prevented by structural means for any meas-
uring instrument, leads to false measurement values. In such cases, please wait
about 5 minutes until the measuring instrument has ‘acclimatised’ itself before com-
mencing with measurements.
Battery replacement
If BATT appears in the upper line of the display, the battery must be replaced.
In order to replace the battery, first separate the display module from the sensor module. Carefully lift the connecting tab at the rear of the data logger with the aid of a
suitable tool, such as a screwdriver.
The sensor module can now be detached from the display module.
Loosen the four screws at the rear of the display module with a suitable screwdriver.
Place the display module on a flat surface with the display facing upwards and carefully lift up the upper part of the plastic cover.
Please be sure to observe the correct polarity when inserting the battery and
read the safety instructions on the battery. Only use batteries which comply
with the technical data.
Other types of battery are not permitted and can cause faulty operation.
Do not use rechargeable batteries!
Finally, screw the upper and lower parts of the casing together again, fit the sensor
module onto the guide rail of the display module and carefully push the two modules
together until they latch.
Page 7

Operating manual THI/USB
A - 06
The battery should be replaced once per year. Frequent transfer of data to the PC
reduces the battery lifetime.
Do not throw the batteries into the domestic waste, into a fire or water, but
dispose of them correctly in accordance with applicable legal regulations.
“Set Clock” display
So that the clock setting is retained when changing the battery, it is recommended
to set the device to operating mode S1 (see 5.1, Operating modes). The power consumption is very low in this operating mode and the clock setting will be retained if
the battery is replaced quickly.
If the time setting is deleted (e.g. in case of a
longer power interruption) “SEt CLOC” appears in the display (note: due to the 4-digit
seven-segment display, the word “clock” cannot be fully displayed).
This indicates that the date and time should
be set, otherwise the clock will start with the default value (e.g. 1/12/2005). The
“Set clock” display remains visible until the time has been synchronised via the
SmartGraph software. No measured values will be displayed until the clock has been
set.
Care
Clean the device if necessary with a moist, soft, lint-free cloth. Take care that no
moisture enters the casing. Do not use sprays, solvents, cleaning agents containing
alcohol or scouring agents; use only clean water to moisten the cloth.
7. Tips and tricks
Use of alarm hysteresis
If the alarm function without hysteresis is used, an alarm will be triggered and recorded
each time the specified limit value is exceeded.
If your limit values are very tightly selected, this leads to a very frequent occurrence
of alarm situations.
For example, if a room temperature of 24 °C is entered as the upper alarm limit value
and a room temperature of 10 °C is entered as the lower alarm limit value and the
room temperature settles permanently in the range between 23.5 and 25 °C during
the measurement period, the result will be that numerous individual alarm signals
will be generated and recorded during the entire measurement period.
In order to avoid this, an alarm hysteresis can be defined. With this setting, you can
define a value by which the measurement value must re-enter the valid value corridor in order to switch off the alarm.
With a set value for the alarm hysteresis of 1 °C, the alarm in the above example
would only be triggered once when 24 °C was exceeded and would only be switched
off again when the value fell below 23 °C.
Battery replacement and lifetime
So that your measuring instrument is always ready for use, the battery should be
replaced once per year. Frequent reading out of the measured data reduces the
battery lifetime.
Measurement intervals and recording duration
The type of measured values to be recorded and the respective storage rates should
be adapted to the purpose of use.
If you are intending to create particularly detailed documentation and wish to use all
the software evaluation options, you can simultaneously record the average, minimum
and maximum values for each measurement channel.
Given a specified storage rate of 10 minutes, a maximum recording duration of around
183 days would be possible in this case. For recording at shorter intervals, the storage rate can be reduced to a value of one minute. However, this also reduces the maximum recording duration.
If the main object of your measurement is long-term documentation, you can just
record one value, for example, the average value. At a storage rate of 10 minutes,
the memory capacity for this configuration allows a recording duration of 416 days!
upper
alarm
limit value
lower alarm
limit value
valid value
corridor
(“good”
range)
static
logging mode
HYSTERESIS
x
x
x
x
upper
alarm
limit value
lower alarm
limit value
valid value
corridor
(“good”
range)
flashing
static
logging mode
Alarm display without hysteresisAlarm display without hysteresisAlarm display without hysteresis
Alarm display with hysteresisAlarm display with hysteresisAlarm display with hysteresis
flashing
Page 8

Operating manual THI/USB
A - 07
8. Technical data
Data Logger THI/ USB
Function and alarm indication Display
Measurement channels 2
Measured value memory (60,000 per channel) 120,000 measured values
Start/stop button yes
Operating mode button yes
Sensor elements Measurement channel 1 Internal sensor for air temperature; NTC
Measurement channel 2 Internal sensor for relative humidity; capacitive, HC series
PC interface USB B
Storage conditions Permissible ambient temperature -30 °C to +60 °C
Permissible relative humidity < 95 % R.H., non-condensing
Operating conditions Permissible operating temperature -20 °C to +50 °C
Permissible relative humidity < 95 % R.H. or < 20 g/m3(the smaller value applies), non-condensing
Temperature (internal sensors) Measurement range -20 °C to +50 °C
Resolution 0.1 °C for T: 0 to 40 °C, otherwise 0.2 °C
Accuracy 0.3 °C for T: 0 to 40 °C, otherwise 0.5 °C
Relative humidity (internal sensors) Measurement range R.H. 0 to 95 % R.H. or < 30 g/m
3
(the smaller value applies), non-condensing
Resolution R.H. 0.5 % R.H.
Accuracy R.H. 3.0 % R.H.
Electrical data Power supply / battery 3.0 to 3.7 V / LS14500C (Saft)
Battery lifetime Approx. 1 year at a query interval ≥ 1 min.
Features Standard package contents Measuring instrument, USB cable 1 m, CD with software and manuals,
fixing kit for wall mounting, works certificate.
Page 9

Manual
SmartGraph2
Date: Feb. 2007
Version: V3.7
1
Page 10

1 INTRODUCTION TO SMARTGRAPH................................................................. 4
1.1 Manage, Configure ...................................................................................................................4
1.2 The program interface..............................................................................................................4
1.2.1 Diagrams.............................................................................................................................5
1.2.2 Table ...................................................................................................................................7
1.2.3 Auto Monitor........................................................................................................................8
1.2.4 Monitor page for Tables and Diagrams .............................................................................10
1.3 Measurement device ..............................................................................................................11
1.3.1 read data ...........................................................................................................................11
1.3.2 recorder.............................................................................................................................11
1.3.3 clear memory ....................................................................................................................13
1.3.4 read configuration..............................................................................................................13
1.3.5 synchronize clock..............................................................................................................13
1.4 Display and analyze data .......................................................................................................14
1.5 Documentation .......................................................................................................................15
1.6 Organization of measurement data ......................................................................................15
1.7 Upgrade to Extended Functions ...........................................................................................16
2 MENU COMMANDS .......................................................................................... 17
2.1 “file” menu ..............................................................................................................................17
2.1.1 device................................................................................................................................17
2.1.2 print ...................................................................................................................................17
2.1.3 print setup .........................................................................................................................17
2.1.4 page setup ........................................................................................................................17
2.1.5 exit.....................................................................................................................................18
2.2 “edit” menu.............................................................................................................................18
2.2.1 large interval backward .....................................................................................................18
2.2.2 short interval backward .....................................................................................................18
2.2.3 zoom in..............................................................................................................................18
2.2.4 zoom out ...........................................................................................................................18
2.2.5 short interval forward.........................................................................................................18
2.2.6 large interval forward.........................................................................................................18
2.2.7 last record .........................................................................................................................18
2.2.8 edit date / time range.........................................................................................................19
2.2.9 Yt diagram or table............................................................................................................19
2.2.9.1 edit title.......................................................................................................................19
2.2.9.2 hide/show column (for tables only).............................................................................19
2.2.9.3 edit curve (for diagrams only).....................................................................................20
2.2.9.4 range of left/right Y-Axis (for diagrams only)..............................................................21
2.2.10 monitor ..............................................................................................................................21
2.3 “view” menu ...........................................................................................................................22
2.3.1 monitor ..............................................................................................................................22
2.3.2 Yt diagram.........................................................................................................................22
2.3.3 table ..................................................................................................................................22
2.4 “device” menu ........................................................................................................................23
2.4.1 communication ..................................................................................................................23
2.4.2 configure devices ..............................................................................................................23
2.4.2.1 edit device..................................................................................................................25
2.4.2.2 edit channel................................................................................................................27
2.4.3 delete device .....................................................................................................................28
2
Page 11

2.4.4
read configuration..............................................................................................................28
2.4.5 read data ...........................................................................................................................28
2.4.6 clear memory ....................................................................................................................28
2.4.7 synchronize clock..............................................................................................................28
2.4.6 recorder.............................................................................................................................28
2.5 Options Menu .........................................................................................................................28
2.5.1 auto monitor ......................................................................................................................28
2.5.2 protocol .............................................................................................................................28
2.5.3 export ................................................................................................................................30
2.5.3.1 setup channels...........................................................................................................31
2.5.3 Language ..........................................................................................................................31
2.5.4 Upgrade ............................................................................................................................31
2.6 Help Menu ...............................................................................................................................32
2.6.1 Additions to the manual.....................................................................................................32
2.6.2 Contents............................................................................................................................32
2.6.3 Using Help.........................................................................................................................32
2.6.4 Info ....................................................................................................................................32
3 APPENDIX......................................................................................................... 33
3.1 Keyboard Shortcuts ...............................................................................................................33
3
Page 12

1 Introduction to SmartGraph
1.1 Manage, Configure
SmartGraph enables the flexible management of several data logger devices by means of identifiers.
Devices can be added at any time. A unique description can be assigned to every device.
The measurement data is archived in files organized on a “calendar week” basis, stored in a separate
folder (within the folder where SmartGraph was installed) for each device, named DlXXX, where XXX
is a unique number assigned to each device.
Access to the data stored for each device is provided via the name of the device. A device can be
selected via the File Menu item “selected device” or via the device list box in the toolbar.
For protection against data loss, e.g. because of a hard disk error, it is recommended to back up the
data files (all DLXXX folders in the installation folder of SmartGraph) on a regular basis.
See also: 2.4.2 configure devices
1.2 The program interface
The program interface provides display and management of the information and data for a device, in
particular the measurement data.
Measurement data can be viewed as diagrams or in a table. The program creates diagrams and tables
for the selected device. Please see section 3.5.2 Auto Monitor
device/data to be displayed and how to configure/customize the display.
In order to be able to present a large number of measurement channels and devices the interface is
sub-divided where necessary into pages lying on top of each another. These pages are called monitor
pages. Switching between different monitor pages takes place by selecting the label of the monitor
page to be displayed from the label list on the lower frame. The list disappears if only one monitor
page is in use.
Basically, there are two different monitor page types:
- Protocol Monitor: displays log entries, depending on protocol settings (see 2.5.1 Protocol
- Monitor pages for tables and diagrams
for information on how to select the
).
4
Page 13

1.2.1 Diagrams
Diagrams display the measurement data as curves on a date/time based x-axis. Up to 12 curves with
measurement values from different sources, i.e. channels of a device can be displayed.
In order to present measurement values in different units on a single diagram (like temperature and
humidity), 2 Y-axes are used (left and right). The dots in the colors of the curves plotted beside the unit
of the relevant Y-Axis show the mapping between curves and y-axis.
Every channel of a device is always represented as 3 curves (for min/max/average values) – even if
only one of these values is configured for the device.
In order to display all channels of a device in a single diagram (if not more than 2 different units are
reported by the device), the “maximum count of curves per diagram” settings in “options/auto-monitor”
has to be set to 6 (for devices with 2 channels) or 12 (for devices with 4 channels).
This way one can show e.g. the dewpoint (instead of humidity) and temperature curves of a 4 channel
device in a single diagram.
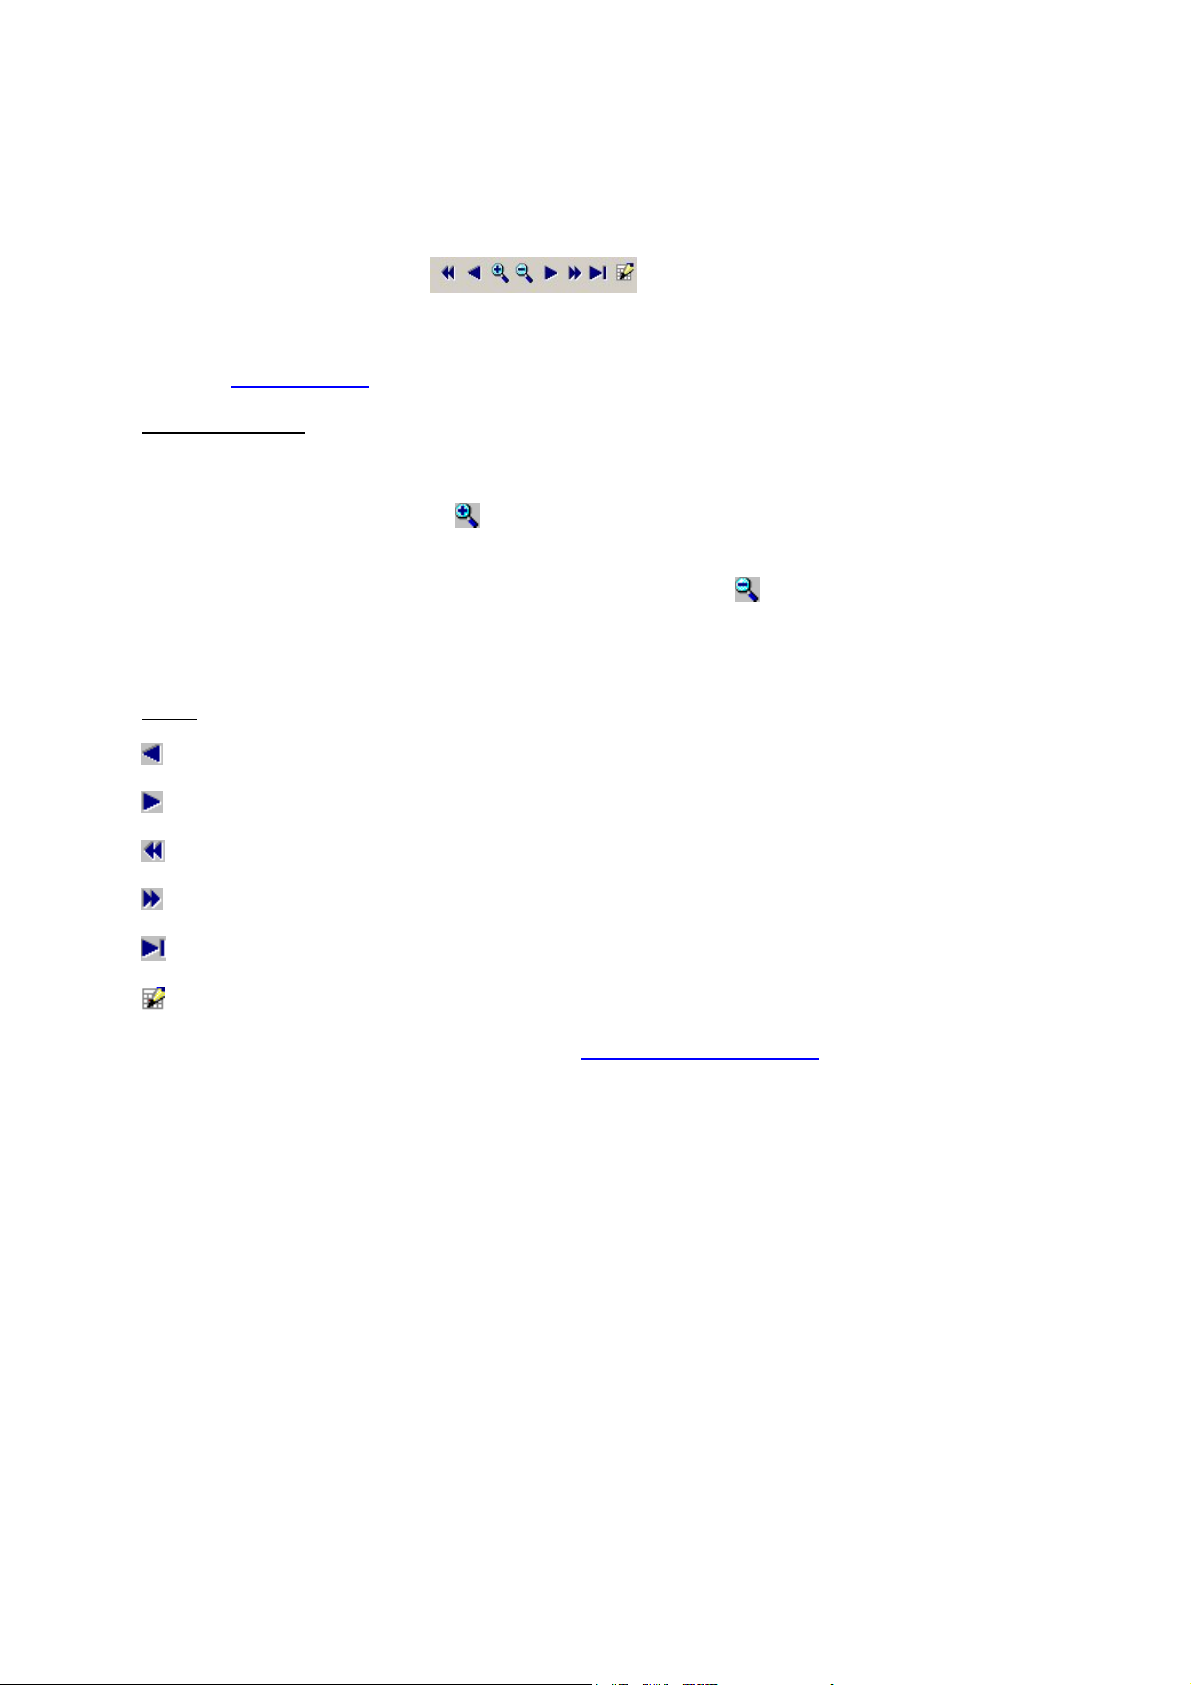
Navigation within the Date/Time Range
These buttons in the toolbar control the selected Date/Time range (X-axis).
You can move short or long distances forward or backward in time, or zoom in /zoom out the screen
section along the X-axis. Zoom in/out can also be done by double-clicking with the mouse in the area
of the diagrams. The mouse pointer appears as a magnifying glass here. Double-clicking with the left
mouse button stretches the time range to the mouse position (zoom in), double-clicking with the right
mouse button switches from the current time period to the next larger time range (zoom out).
Context Menu
For quick and easy changes to diagram contents and settings, a context menu is available.
This menu pops up when the right mouse button is activated on the diagram. The same menu items
are available under the Edit and View menus (under item Yt-Diagram), when a diagram is selected
(the blue border around the diagram or table indicates the selected object).
The following items can be selected here:
Edit title
Edit curve
Range of left/right Y-Axis
Grid for left/right Y-Axis
reference
If the reference for the diagram is not required this can be un-selected in order to provide more space
for the diagram.
Print Yt diagram
Print diagram on one page. This can also be selected via menu "File -> Print -> Yt-diagram" or by
clicking the print button
The professional version of SmartGraph (see 1.7 Upgrade to Extended Functions
printing functions like printing of up to 4 diagrams from a device on a single page, or printing
all/selected diagrams from all/selected devices with a single command.
, see 2.2.9.1 edit title
, see 2.2.9.3 edit curve
, see 2.2.9.4 range of left/right Y-Axis
:
.from the toolbar.
) supports extended
5
Page 14

6
Page 15

1.2.2 Table
The table displays the measurement values of one day. The time is presented in the right column.
Measurement values that exceed the alarm limits are highlighted in bold and in red text.
To preserve space on the display, the short description for the device and channel names are used to
label the columns.
The long description is shown in a pop-up help window when the mouse moves over the appropriate
column label.
Navigation within the Time Range
The vertical scroll bar is used to navigate within the data of the displayed day. The same can be done
via the Cursor Keys (Cursor up, Cursor down, Page up, Page down) (See chapter 3.1 Keyboard
Shortcuts).
Navigation within the Date Range:
The buttons
combination Ctrl Cursor Up or Ctrl Cursor Down.
The time ranges of the tables and the diagrams are synchronized. The day presented in the Table is
always within the time range selected for the diagrams.
Context Menu:
For quick and easy changes to the table contents and settings a context menu is available.
and switch to the previous or next day. This can also be done via the key
:
This menu pops up when the right mouse button is pressed while the mouse cursor is above the table.
The same menu items are also available via the menu item “table” of the Edit Menu and View Menu, if
the table has been selected.
The following settings can be changed here:
Edit title
hide column
show column
horizontal grid lines
vertical grid lines
print table
See also:
3.1 Keyboard
: change the title of the table
: hide a column
: show a column
: show/hide horizontal grid
: show/hide vertical grid
: The table is printed with the data of the selected day. This can also be done via the button
in the tools panel and via the menu item file -> print -> print table.
7
Page 16

1.2.3 Auto Monitor
Data for every device is displayed on one or more monitor pages (depending on the auto monitor
settings for the device) within the “auto monitor”.
Select the device:
The device for which data is displayed can be selected in two ways:
- select the device from the selection list in the toolbar
- select the device from the menu item file - selected device
The name and identifier of the selected device are displayed in the caption of the main window.
Auto Monitor options:
Diagrams and table for the selected device are displayed based on the options set for the auto monitor
for this device.
The settings can be viewed and changed selecting menu item options - auto monitor:
- Maximum number of curves per diagram:
a single diagram can be limited. Valid values are between 1 and 10. If more channels than the
maximum for one diagram are present in a data source, an additional diagram is displayed.
- Maximum number of diagrams per monitor page:
data source determine how many diagrams are necessary for presentation. If more diagrams
are needed than the maximum number allowed per monitor page, additional monitor pages
are displayed, and can be selected by the tab on the bottom of the window.
- Use both axes in diagrams:
and right Y-axis if necessary, so that channels with data in two different units can be
displayed. If the option is deactivated, only the left Y-axis is used.
- Place table on separate monitor:
separate monitor page without diagrams. Otherwise diagrams and table are arranged together
on one (the first) monitor page.
- Use as default for new devices:
monitor will be used as default values for new devices that are added later to SmartGraph.
- Apply to all devices:
page/device will be applied to all configured devices.
when this option is selected, the values set for the current monitor
When this option is activated, each diagram is provided with a left
When this option is activated, the table is displayed on a
when this option is selected, the values set for the current
With this the number of curves that are displayed in
The number and units of the channels of a
8
Page 17

After the settings have been changed, diagrams and table will be formatted for the selected device
according to the new settings.
The labels of the monitor pages are created from the device name and a serial number and cannot be
changed by the user.
9
Page 18

1.2.4 Monitor page for Tables and Diagrams
The monitor page is divided into two parts (if a table is present on the page). On the left side up to 9
diagrams are presented, on the right side a table. The border between the two sides can be moved
using the mouse. The diagrams are arranged on the left side so that the space is filled as completely
as possible. The arrangement of diagrams can be horizontal or vertical (see menu item View>Monitor).
Selection:
Whenever a diagram or table is selected, various menu items and buttons like the “Print” button, are
related to the selected object. The selected object (diagram or table) is marked with a blue border. An
object can be selected by clicking with the mouse on the object. The next object can be selected by
using the tab key.
Full Screen/Normal Screen:
Each object (diagram or table) can be expanded to full screen size. The diagram or table then fills the
entire monitor page. Switching to full screen and back to normal screen size can be done in 4 ways:
The menu items always relate to the selected object.
hide/show object:
Each object (table or diagram) can be hidden, i.e. it disappears from the screen, but is not lost and can
be shown again. The remaining objects on the monitor page are re-arranged.
Hiding an object can be done via:
The menu items always relate to the selected object.
Showing an object that has been hidden can be done via the context menu of the monitor page or the
menu items in the “monitor” menu of the “Edit” menu. The object to be shown is selected form a list of
hidden objects in a dialog box that pops up, and the position of the object in reference to the other
visible objects can be specified.
Note: The mechanism can be used to change the sequence of the objects on a monitor page by hiding
an object and showing the object at a different position.
Monitor page context menu:
All functions that concern the monitor page are found on the context menu for the monitor page. This
appears when the right mouse button is activated and the mouse is positioned over the tab panel of
the Monitor or over the border between the diagrams and the table. The menu items also appear on
the “edit -> monitor” menu (maximize/minimize object, hide/show object) or in the “view->monitor”
menu (arrange diagrams horizontally/vertically)
- clicking on the button
- Using the key combination <Ctrl> + and <Ctrl> -
- Selecting the desired function from the monitor page context menu.
- selecting the desired function from the menu item “Monitor” in the “Edit” menu.
- the button
- the context menu of the monitor page.
- the menu item “Monitor” from the “Edit” menu.
in the upper right corner of the object.
or on the upper right in the object.
10
Page 19

1.3 Measurement device
1.3.1 read data
The content of the data logger/device that is connected to the PC via the serial interface is read and
stored. This function can be started by selecting menu item “device -> read data” or by clicking the
button on the toolbar.
Requirement: The correct communication port must be configured.
The communication port can be configured via menu item “device->communication”.
Messages:
The date and time from where data is to be read from the device memory can be specified here.
Default is the date and time of the last read out of the device memory. With the "read complete
memory" option all data stored in the device will be read.
While the data is read from the device the message "transmission of data" is shown with an indication
of the progress of the transmission (percentage reading).
If the communication port has not been set up correctly, a message “interface already open” may be
displayed indicating the configured interface is already in use, e.g. the mouse could be connected to
that port, or a message “device does not respond” may be displayed if no device is attached to the
configured port. Please check the configured communication port if such an error message is
displayed.
1.3.2 recorder
With the recorder function measurement data from the attached device is read in intervals. Unlike the
data read by “read data”, the data read via the recorder function is not obtained from the device
memory, but the measured values are read directly.
While the recorder is active, the connection to the attached device is permanently open.
Note : using the recorder function reduces battery life !
The recorder is started or stopped via the menu item 'device - recorder - start/stop recorder' or via the
corresponding button
the status bar.
In recording mode, the following menu items under menu “device” are disabled:
- communication
- read configuration
- read data
- clear memory
- synchronize clock
The device internal clock is synchronized to the PC clock during the recording process.
The following actions stop the recording mode:
- changing device or channel settings ("configure devices")
- "delete device"
The time interval for data collection in recording mode is determined from the device’s “sample
interval” setting.
If “auto scroll” is checked (menu device-> recorder or toolbar button
device is displayed on the auto monitor page(s) for the device, and diagrams are scrolled to show the
new data.
in the toolbar. When recording is active, the recorder symbol is displayed in
) new data read from the
11
Page 20

When the recorder function is active, the time range for neither the diagrams (curves) or nor the table
can be changed, and the selected device cannot be changed either.
12
Page 21

1.3.3 clear memory
This function clears the memory of the attached device, i.e. the data stored in the device is deleted.
1.3.4 read configuration
The configuration of the connected device is read.
If no corresponding auto monitor page for the attached device has yet been set up, it is created.
SmartGraph offers to switch to the appropriate auto monitor page for the device.
1.3.5 synchronize clock
The clock of the connected device is synchronized to the PC clock.
13
Page 22
1.4 Display and analyze data
Measurement data can be displayed in diagrams covering time ranges from 10 seconds to 1 year.
To navigate within the time range of the diagrams use the buttons on the navigation toolbar on the
upper left under the main menu:
The same functions are available via menu “edit”. Zoom in/out can also be done using mouse clicks.
See also: 3.1 Keyboard
zoom in, zoom out
As soon as you move the mouse pointer over a diagram it changes into a magnifying glass.
To zoom in hold the magnifying glass over the required position and click twice with the left mouse
button (double click) or click on the
smaller time range, with the clicked position centered on the diagram.
To zoom out click twice with the right mouse button or click on the
The possible time ranges are:
Year-Month-Week-Day-6Hours-1Hour-10Minutes-1Minute-10Seconds
Scroll:
scroll small interval backward
scroll small interval forward
scroll large interval backward
scroll large interval forward
scroll to the end of the data
edit date / time range
A dialog box to enter the date/time range to be used is displayed. The minimum time range is 10
seconds, the maximum time range is 1 year. See 2.2.8 edit date / time range
The selected date/time range applies to all diagrams (and all devices).
:
button on the toolbar. The diagram now switches to the next
button on the toolbar.
.
14
Page 23

1.5 Documentation
Printing of tables and diagrams:
The selected table or diagram can be printed via the context menu of the selected object, or the menu
item file - print, or the print button
(See chapters 2.1.2 print and 2.1.3 print setup).
from the toolbar.
1.6 Organization of measurement data
The measurement data for each device is kept in a different folder within the SmartGraph installation
folder.
The data folders are named “DLxxx”, where xxx is the unique number assigned to each device by
SmartGraph.
The measurement data is saved in files on a “calendar week” basis (i.e. one file per week) named
"KWjjnn.sgr", where “jj” stands for the year and nn stands for the week number.
When a device is deleted the subdirectory DLxxx for the data of this device is renamed to DLxxxBAK.
The files are not deleted. If a device has been inadvertently deleted, the procedure can be reversed as
follows: quit SmartGraph and rename the folder DLxxxBAK to the DLxxx (e.g. using the File Manager).
The next time SmartGraph is started the data for the device will be displayed again.
15
Page 24

1.7 Upgrade to Extended Functions
In the professional edition of SmartGraph the following functions are available:
- Beside the standard measurement units (e.g. temperature in °C and humidity in %RH) other
units (e.g. temperature in °F or dew point temperature, etc.) can be assigned to the
channels/sensors of a device.
- Measurement data can be exported to text files (with several options for formatting).
- Extended functions for printing of diagrams are available (e.g. print all diagrams of a device,
print all/selected diagrams of all/selected devices, print up to 4 diagrams on a single page).
Unlocking via key-code
The upgrade to the professional version is done by aquiring a key code.
To do this, select the menu item options -> upgrade -> order. Fill out the fields in the dialog box
"offer/order for unlock code". Select print to print out the order form. Fax the order to the given fax
number / your distributor and you will shortly receive the Key-Code for the requested version.
If you are in agreement with the License conditions select the menu item options -> upgrade ->
unlocking. Enter the key-code. The additional functions can now be used.
If the number of managed devices does exceed the number matching the professional version you
have orderer, the additional functions are deactivated.
Test-Upgrade
Upgrade to professional or pharma version for testing - limited to 4 weeks.
16
Page 25

2 Menu Commands
2.1 “file” menu
The File menu contains the following items:
2.1.1 device
Select the device to be displayed on auto monitor
2.1.2 print
Print diagram or table
The selected object (diagram or table) or a screenshot (complete visible monitor page) can be printed.
In the professional version of Smartgraph extended printing functions (like printing all diagrams of a
device or selected/all diagrams from selected/all devices) are available.
Tip: the logo saved in the file LOGO.BMP in the folder “support” is printed in the right upper corner. If
you replace this file you can use your own logo.
2.1.3 print setup
Select printer and configure printer options.
With most printers you have the choice between various graphic resolutions. A higher resolution
increases quality, however the time required for printing is longer. Try various resolutions to find the
best solution.
Tip: For printing diagrams on a single page "landscape" orientation is best suited, for printing tables
“portrait” orientation may be suited better, depending on the number of columns.
2.1.4 page setup
Set up title and page borders
The dialog box 'page setup' appears:
17
Page 26

title, subtitle
Title and subtitle will be printed on every page.
Page margins
Specify the margins (in cm) to be used (the paper size and page orientation is configured via print
setup for the printer)
Print lines dotted:
If this option is checked, the diagram curves are printed dotted (as configured for the diagram - see
2.2.9.3 Edit curve
effect.
Tip: A logo appears in the top right corner of every printed page. This logo is read from the file
Logo.bmp, which is located in the folder “support”. This file can be replaced (or supplied) if a logo is
required. If no logo is required the file can be renamed or deleted.
), if printing to a black and white printer. For color printers, this option does not take
2.1.5 exit
Exit SmartGraph (end the program).
2.2 “edit” menu
The Edit menu contains the following items:
2.2.1 large interval backward
scroll selected time range one (displayed) time interval backward.
2.2.2 short interval backward
scroll selected time range one (next shorter) time interval backward.
2.2.3 zoom in
Use the next smaller time interval in diagrams (double click left mouse button over diagram).
Possible time intervals are: Year-Month-Week-Day-6Hours-1Hour-10Minutes-1Minute-10Seconds.
2.2.4 zoom out
Use the next lager time interval in diagrams (double click right mouse button over diagram).
Possible time intervals are: Year-Month-Week-Day-6Hours-1Hour-10Minutes-1Minute-10Seconds.
2.2.5 short interval forward
scroll selected time range one (next shorter) time interval forward.
2.2.6 large interval forward
scroll selected time range one (displayed) time interval forward.
2.2.7 last record
scroll to the end of the data (to last data record).
18
Page 27

2.2.8 edit date / time range
A dialog box to enter the date/time range to be used is displayed. The minimum time range is 10
seconds, the maximum time range is 1 year.
The other menu items depend on selected object:
When a monitor page or object is selected, to which these functions are not applicable (e.g. Protocol
monitor), these menu items do not appear or are deactivated.
2.2.9 Yt diagram or table
These menu items are also available in the context menu that pops up when the right mouse button is
clicked over the surface of a diagram or table.
The following settings can be specified here:
2.2.9.1 edit title
Whenever a table or diagram object is created, a standard title (consisting of the object name and a
number) is assigned to the object.
“edit title” opens a dialog box to enter a user defined title for the object. To use the user assigned title,
the checkbox “special title” has to be marked. End the dialog with OK. An empty title is not allowed.
The standard title can be reactivated by marking the “stanrad title” checkbox.
2.2.9.2 hide/show column (for tables only)
hide column:
A dialog box appears in which the column to be hidden can be selected. The selected column is
hidden, but not deleted, and can be made visible again using “show column”.
show column:
This menu item is only available if columns have been hidden. A dialog box appears in which the
column to be shown can be selected. The position of the column can be specified.
Note: The mechanism can be used to change the sequence of the columns in a table.
19
Page 28
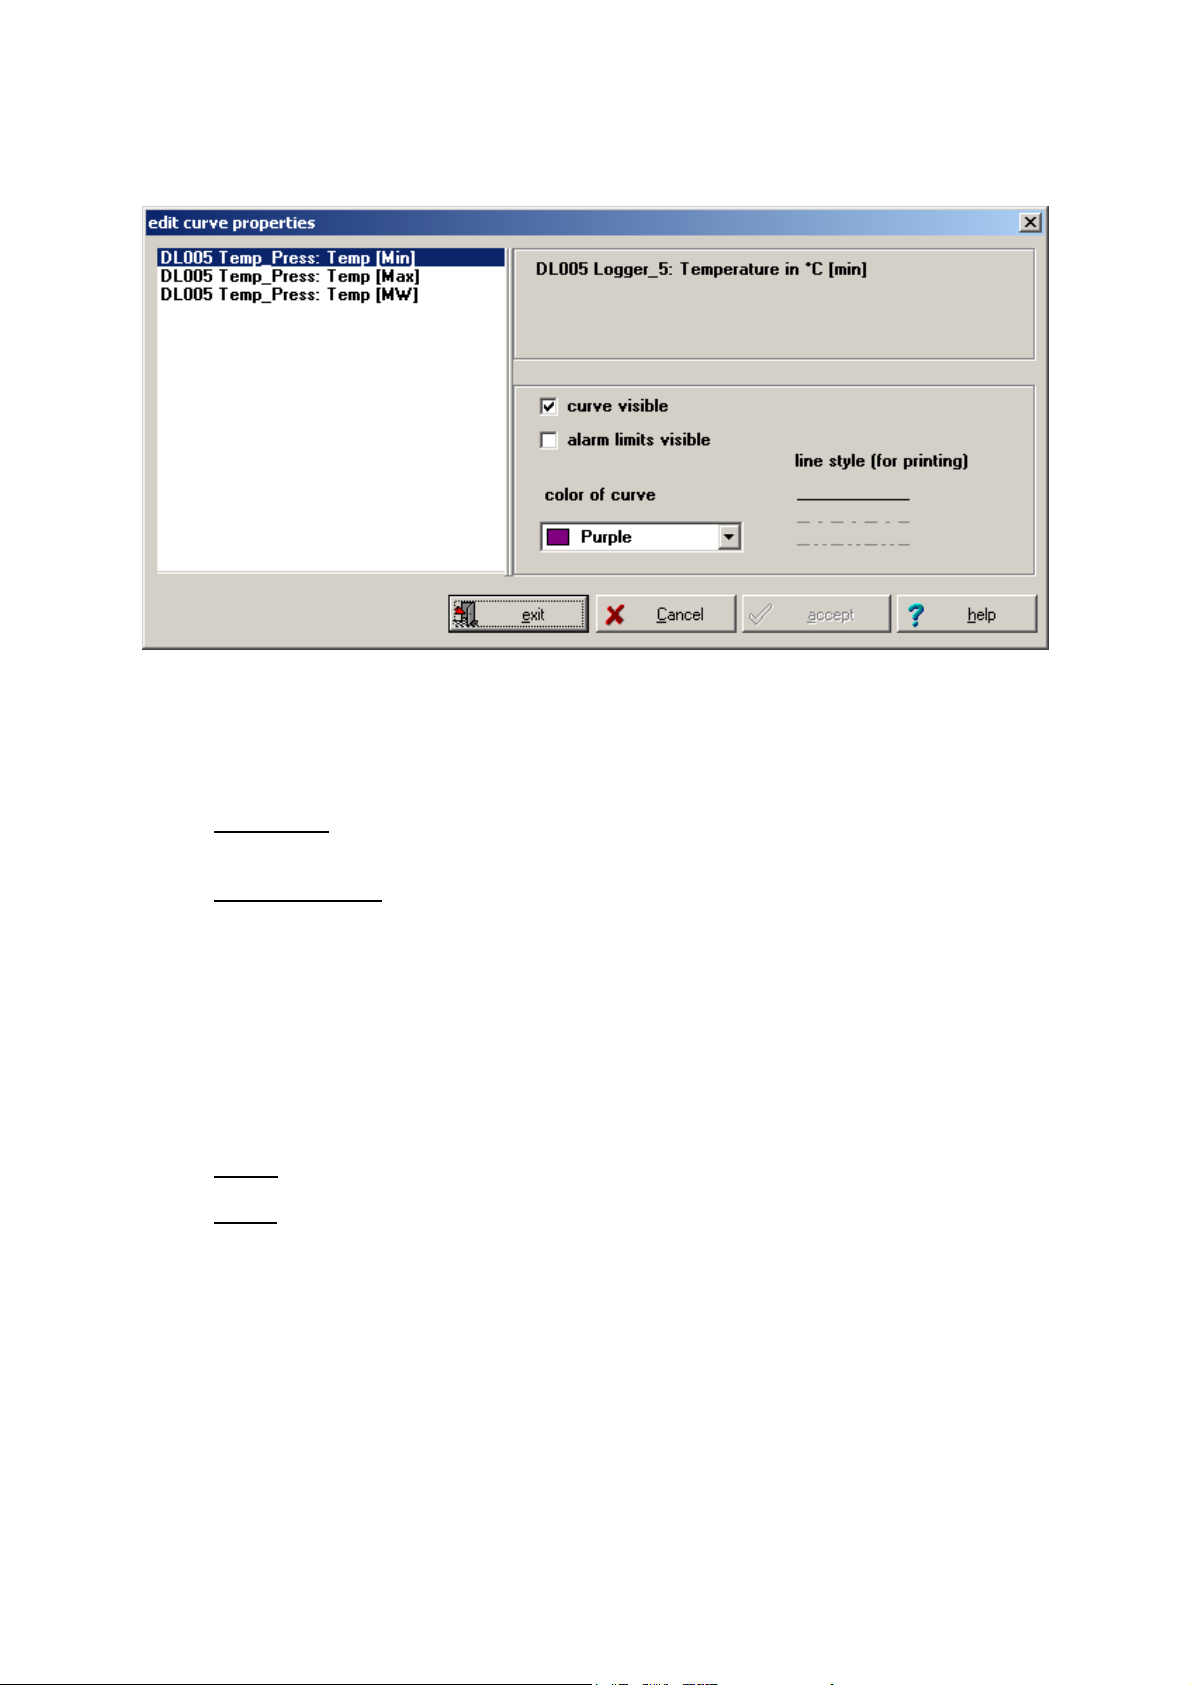
2.2.9.3 edit curve (for diagrams only)
View/edit curve settings for selected diagram.
The available curves are shown in a list on the left side of the dialog. The entry in the list that belongs
to the current curve is highlighted, i.e. selected. To edit the settings of a specific curve select the curve
from the list on the left.
The parameters that can be set on the selected curve are shown on the right side of the dialog:
- curve visible:
otherwise the curve is hidden.
- alarm limits visible:
channel) appear on the diagram in the color of this curve. This option is only available when
the curve is visible.
- color of curve: by clicking with the left mouse button a list with the 16 standard colors is
displayed. A color for the curve can be selected by clicking on the corresponding entry. If a
different color (not in the standard colors) is desired, clicking with the right mouse button on
the selection element starts a color selection dialog. The curve and the corresponding
reference entry are then shown in the selected color.
buttons:
- accept:
- cancel:
of the dialog.
- exit: the changes are saved (see “accept”) and the dialog is ended.
If this setting is activated the curve appears in the diagram and in the reference,
If this option is checked the alarm limits of the selected curve (device
with "accept" all changes specified since the start of the dialog, are saved.
the dialog is ended without saving the changes that were specified since the beginning
20
Page 29

2.2.9.4 range of left/right Y-Axis (for diagrams only)
The dialog enables setting of the value range for the Y-axis for a given diagram (vertical zoom).
automatic:
The automatic setting is selected by activating the relevant upper option field. The corresponding
value is shown on the right. The value for maximum/minimum in automatic setting are taken from the
sensor settings (see 2.4.2.2 Edit Channel
the maximum/minimum “view range” configured for all channels associated to this axis.
Manual:
The manual setting is effective when the relevant lower option field is activated and the requested
value is entered in the input field.
Buttons:
) - the automatic maximum/minumum value for the axis is
- OK: With "OK" all changes are saved. The dialog is closed.
- Cancel: The dialog is closed without saving the changes.
2.2.10 monitor
This menu item is visible (as an item on the “edit” menu) if a monitor page for diagrams and tables is
selected – or are displayed as part of the monior page context menu.
maximize object
The selected object is maximized to full screen size
normal view of object
The maximized object is returned to its normal size
hide / show object
The selected object is hidden, but not deleted. With 'show object' a dialog box with all hidden objects is
displayed.
When a monitor is in use, to which these functionss are not applicable (e.g. Protocol monitor), these
menu items are not shown.
21
Page 30

2.3 “view” menu
The menu item View shows the appropriate sub menu items depending on the selected object:
2.3.1 monitor
This menu item is displayed when a monitor page for diagrams and tables is selected.
Diagrams on the monitor page can be arranged horizontally or vertically by selecting
- arrange diagrams horizontally
or
- arrange diagrams vertically
2.3.2 Yt diagram
This menu item appears if a diagram is selected.
grid for left y-axis:
Show or hide the grid lines for the left y-axis
grid for right y-axis:
Show or hide the grid lines for the right y-axis (only available if both axis are used on the selected
diagram).
reference:
Show or hide the reference on the selected diagram.
These menu items are also available in the context menu for the diagram, which pops up when the
right mouse button is clicked over the surface of the diagram.
2.3.3 table
This menu item appears if a table is selected.
horizontal grid lines:
Show/hide horizontal grid lines.
vertical grid lines:
Show/hide vertical grid lines.
22
Page 31

2.4 “device” menu
2.4.1 communication
The communication port (serial port) on which the device(s) are attached can be configured here.
Mark the interface to which you wish to connect the device and close the dialog box with 'OK'.
Note:
If an error message 'Interface already open' is displayed when connecting to a device, make sure the
proper serial port is configured and not used by another application.
If an error message ‘device does not respond (Timeout)’ is displayed make sure the device is
connected to the selected interface, and the proper cable (supplied with the device) is used.
2.4.2 configure devices
This command opens the dialog box “configure devices”:
The device and channel configuration can be changed here.
The available devices that can be configured are presented in a tree diagram in the left part of the
dialog.
The device (or channel) to be configured can be selected by clicking on the corresponding entry in the
tree view.
23
Page 32

By double-clicking a device entry the associated list of the subordinate elements (the channels for this
device) can be expanded or hidden.
The selected entry is highlighted.
On the right side of the dialog the settings for the selected entry (device or channel) can be edited.
For further information please refer to chapters:
- edit device
- edit channel
Buttons:
- OK: With "OK" all changes that were made since the beginning of the dialog are saved. The
dialog is ended.
- Cancel: The dialog is ended without the changes being saved. All changes made since the
beginning of the dialog are discarded.
- Print: the configuration data of the currently selected device is printed. A dialog to enter a
comment is displayed. The comment will be shown on the printout.
24
Page 33

2.4.2.1 edit device
Following configuration items for a device can be viewed/edited:
Information:
- SmartGraph-Id:
- designation:
- short name:
- Further internal information from the device like hardware and software versions are
logging mode:
The logging mode parameters for the device can be configured here.
- storing mode:
- sorting of:
- Sample interval : time difference between samples (times when measurement values are read
- Storage interval : time interval for data logging
preselection:
When preselection is enabled data logging only occurs at the preselected time. The selected date/time
must be set to a time in the future.
Note for devices of the DL-series: preselection does work for devices of the DL-series in start/stop
and ring mode. For the DL 100M the device must be switched to mode S3 or S4 in order to activate
preselection. A flag symbol in the display of the devices indicates that preselection is enabled. A clock
symbol in the display indicates that preselection was activated (i.e. data is recorded). Other devices of
the DL-series, i.e. all two- and four-channel devices with and without display, need to be switched on
in order for preselection to work!
Attention: For the DL 100M the symbol for enabled preselection is displayed even if the device is in
mode S1 or S2 – but in those modes no data is recorded by the device!
sensors:
The sensors attached to the two logger channels are displayed here.
Settings: Using the buttons the edit dialog for the corresponding channel can be accessed (see edit
channel).
modify sensors
channel is stored can be changed here. The dialog box “modify sensors” appears.
The (physical) unit in which the data for a device channel is stored and presented can be modified
here.
This identifies a device uniquely within the SmartGraph software. It correlates to the name of
the folder where the data for this device is stored (e.g. DL005)
The identifier can not be changed
The designation of a device. Any name/description can be assigned. This name (and the
assigned ID) is used in SmartGraph to identify the device.
The short name for a device is used where showing the designation would use too much
space. Therefore only a short string should be assigned here.
displayed, but cannot be edited.
In “start/stop” mode data logging (recording) stops when all available memory
has been used to store data. In “circular” mode the recording is continuous, but if all available
memory has been used, oldest data entries are overwritten with new values
The following measurement values can be logged/recorded:
o average: average measurement value over “storage interval”
o maximum : maximum measurement value in “storage interval”
o minimum : minimum measurement value in “storage interval”
At least one value must be selected.
from the sensor)
(professional version only): the measurement units in which the data for a device
25
Page 34

Depending on the sensor circuit board installed in the device the following measurement units are
available:
Temperature in °C or °F, relative humidity in %RH, absolute humidity in g/m³,
dew point in °C or °F
Not all measurement unit configurations are possible. The following limitations apply:
- With the internal sensor circuit board and the external circuit board with one probe the
measurement units in the two channels must be different.
- With the external sensor circuit board with two probes the measurement units in the two
channels must originate from different probes.
When the measurement unit for a channel for which data has already been stored by Smartgraph is
changed, a new channel for the new unit is created.
The old data stored with the old unit setting can still be viewed. The device appears in SmartGraph
now with more than two channels. The channel with the old unit settings no longer corresponds to any
physical device channel. Accordingly, some parameters for this now “virtual” channel cannot be
modified
For detailed instructions on the device settings please refer to the device manual.
26
Page 35

2.4.2.2 edit channel
The following parameters of a channel can be viewed/edited:
information:
- SmartGraph-ID: The SmartGraph Identifier for this device. Cannot be changed.
- sensortype, sensor PCB, assigned device channel : additional information about the attached
- offset : offset (calibration) for the attached sensor.
- designation : descriptive name for the channel (up to 79 characters). Used to refer to this
- short name: short name for the channel (up to 20 characters). Used within SmartGraph where
alarms:
- alarm at: if set to “storing data”, alarms are triggered when data exceeding the given alarm
- alarm limits: maximum and minimum boundaries for the alarm. An alarm is triggered if the
- Alarm hyteresis: the hysteresis for the alarm.
display:
- decimal places : number of decimal digits used in data representation for this channel
- view range in diagrams : the default range assigned to the y-axis of a curve in a diagram
Notes:
- If (device or channel) parameters are modified that are stored in the device, clicking the 'OK'
- If the device or channel configuration has been changed outside this SmartGraph installation
sensor, can not be modified.
channel within SmartGraph
the descriptive name would be too long (use too much space).
limits is stored, if set to “sampling of data” alarms are triggered when data exceeding the given
alarm limits is sampled.
(stored or sampled) value is below the minimum or above the maximum value configured.
where data for this channel is displayed. (See 2.2.9.4 Range of left/right Y-Axis (for diagrams
only))
button will cause SmartGraph to connect to the device and transfer the configuration changes.
The device needs to be connected to the configured serial port.
(e.g. with SmartGraph on a different PC, or through a firmware update or a change in the
sensor hardware), the configuration needs to be read first (device -> read configuration)
before changes can be applied.
27
Page 36

2.4.3 delete device
With this command a device can be deleted. After removal the device is not displayed in SmartGraph
anymore.
A selection box to select the device to be deleted is shown.
Select the desired device from the list. 'OK' deletes the device, ‘Cancel’ aborts the action.
If a device is deleted, the data stored for this device is not really removed from the hard disc, but the
folder is renamed from DLxxx to DLxxxBAK.
Instructions regarding recovery of the data can be found in chapter 1.6 Organization of measurement
data.
2.4.4 read configuration
Read the device configuration.
See also: 1.3.4 read configuration
2.4.5 read data
The data stored in the logger device is read and stored.
See also: 1.3.1 read data
2.4.6 clear memory
delete the data stored in the device memory.
See also: 1.3.3 clear memory
2.4.7 synchronize clock
The internal clock of the connected device is synchronized with the PC clock.
See also: 1.3.5 synchronize clock
2.4.6 recorder
The recorder function reads data from the device “online” and displays this data.
See also: 1.3.2 recorder
2.5 Options Menu
2.5.1 auto monitor
Set auto monitor options.
See also: 1.2.3 Auto Monitor
2.5.2 protocol
Set protocol options:
28
Page 37

short protocol
only errors are logged in the protocol.
limit size of protocol file
the maximum size of the protocol file is limited to the given size. If the size is exceeded the old file is
renamed. The new file name consists of the date of the last entry.
maximum size:
The maximum size of the protocol file can be selected between 10 Kbytes and 9999 Kbytes. This
setting is only available when the option “limit size of protocol file” is set.
protocol only during Auto Mode:
Messages are only written to the protocol file in Auto Modus.
When the current protocol file contains messages, an additional monitor page “protocol” is displayed.
Auto Mode is only active when the recorder is active.
29
Page 38

2.5.3 export
The “export” function is only available with the professional version of SmartGraph.
Export data to a text file. Data from devices controlled by SmartGraph can be exported to a text file for
further processing with other applications (e.g. for import in a database, word processing or
spreadsheet application). The formatting of the text file can be customized.
The function is available from the menu topic 'options -> export' or the corresponding button
toolbar.
The export dialog consists of several steps:
Step 1:
Begin and end date/time for the data export is specified here. The end date/time must be at least 1
second later then the begin date/time. If “export without date” is selected, the time column will not be
part of the exported data rows (e.g. if data from one day only is exported).
Step 2:
The channels to be exported are specified here.
Selected channels are shown in the list (device name and channel name).
Channels to be exported can be selected by
Step 3:
In addition to the measurement data, information about the device(s) and channel(s) can be included
in the export output file. This information will be included as “header” information in the export output.
This header and the rows containing the measurement data are separated by the word 'data'.
The following information is available and can be selected via the checkbox in the selection list.
Step 4:
The file name (including its path) can be changed in the input field or via a “file selection dialog, which
is shown when the 'browse' button is clicked. If an existing file is selected, the option 'append to
existing file' will append the new data records to an existing text file. In this case, channel information
(header, step 3) is not exported. If the option is not active an existing file will be overwritten. If a new
file name is selected, this option field does not apply.
Step 5:
The following settings can be customized:
time period for export
channels to be exported
- clicking the button 'channels of selected device' : all channels of the selected device
(displayed in AutoMonitor) will be added to the export
- clicking the button “setup channels” : a dialog to select channels from all configured devices is
displayed. See 2.5.5.1 setup channels
channel information to be exported
- channel no: serial number for the channels in the corresponding column
- data source: long name (description) of the device
- data source short: short name of the device
- channel: long name (description) of the channel
- channel short: short name of the channel
- sensor type: identification code for the sensor type
- unit: measurement unit
- min: minimum value of sensor measurement range
- max: maximum value of sensor measurement range
- alarm min: lower alarm limit
- alarm max: upper alarm limit
- logger ID: unique (internal) identifier for data logger device
export to file
Format settings
- date format: date separator, order, year (2 or 4 digits)
- time format: separator character between hours and minutes
- decimal seperator: (“.” or “,”) for measurement values
- columns delimiter: delimiter between data columns (e.g. channels). May not be the same as
the separator for date and time.
- line end : character to separate lines (rows) (e.g. CR LF)
on the
30
Page 39

- Character string to be entered for erroneous or invalid/nonexistent measurement values e.g. "-
--" or "MISSING". The character string must not contain the column separator. An empty
character string is permitted.
The export is executed using the button ‘finish'.
2.5.3.1 setup channels
The dialog allows the selection of several channels from any device managed by SmartGraph.
The available devices are displayed in a list on the left hand side of the dialog. The device can be
selected by clicking on the corresponding entry. The selected entry then appears highlighted.
All available channels of the selected device are displayed in the list next to the device list. Channels
that have been selected are moved to the list on the right side.
Channels can be selected (moved to the list on the right) with the buttons
selected) and
mouse button together with the 'Shift' and 'Control' keys. To select all channels use the button 'Select
All'.
The sequence of the selected channels can be changed with the buttons
channel will be moved up/down in the list. The channels will appear in the export file in the order
specified here.
A channel can be removed from the list of selected channels with the button
With 'OK' the selected channels are passed back to the export dialog.
With ‘cancel’ the dialog is ended without transferring the selection.
(if more then one channel is selected). To select multiple channels use the left
(if a single channel is
and . The selected
.
2.5.3 Language
Change the current language. This function can be selected by clicking the corresponding button on
the tool bar.
2.5.4 Upgrade
Order/unlock key code for professional version.
See also: 1.7 Upgrade to Extended Functions
31
Page 40

2.6 Help Menu
2.6.1 Additions to the manual
Show recent changes and additions to the manual that have been implemented after the manual has
been printed.
2.6.2 Contents
Start the online help and show the contents index of the help topics.
2.6.3 Using Help
Show introduction to the Windows Help system.
2.6.4 Info
Show version number and copyright information for SmartGraph.
32
Page 41

3 Appendix
3.1 Keyboard Shortcuts
For all scroll and zoom functions keyboard shortcuts are available. Depending on the selected
device/object, the following key shortcuts are defined:
diagrams and tables :
- Ctrl+ Object Full Screen
- Ctrl- Reverse Object Full Screen
- TAB Change to Next Object
diagrams:
tables:
- + zoom in
- - zoom out
- -> Scroll Right
- <- Scroll Left
- Ctrl -> Page Right
- Ctrl <- Page Left
- End Data End
- Cursor Up Scroll Up
- Cursor Down Scroll Down
- Page Up Large Step Back
- Page Down Large Step Forwards
- Ctrl + Cursor Up Scroll Back by 1 Day/Month/Year
- Ctrl + Cursor Down Scroll Forward by 1 Day/Month/Year
- <- Scroll Left
- -> Scroll Right
- Ctrl -> Large Step to Right
- Ctrl <- Large Step to Left
- Pos1 Go To Beginning of Table
- End Go To End of Table
33
 Loading...