

Page 1

Operating Instructions
OPUS20E
For external sensors
BA-OP20E-01-EN
Page 2

Table of Contents
Please read this manual carefully. These instructions are designed to ensure
that your data logger is used for the purpose for which it was intended and to
guarantee that you get the maximum benefit from your product.
Contents Page
1. Safety Instructions 2
2. Intended Purpose and Use 2
3. Features 3
4. Scope of Delivery 4
5. Preparations Prior to Use 4
5.1. Software . . . . . . . . . . . . . . . . . . . . . . . . . . . . . . . . . . . . . . . . . . . .4
5.1.1. Installation Requirements . . . . . . . . . . . . . . . . . . . . . . . . .4
5.1.2. Installing the SmartGraph Software . . . . . . . . . . . . . . . . .4
5.1.3 Preparing the Data Logger Configuration . . . . . . . . . . . . .4
6. Operating the Data Logger 4
6.1. Powering ON / OFF . . . . . . . . . . . . . . . . . . . . . . . . . . . . . . . . . . . .4
6.2. Basic Settings and Operating Modes . . . . . . . . . . . . . . . . . . . . . . .4
6.2.1. The Four Operating Modes . . . . . . . . . . . . . . . . . . . . . . . .5
6.2.2. Network Function (M51) . . . . . . . . . . . . . . . . . . . . . . . . . .5
6.2.3. Factory Setting (M52) . . . . . . . . . . . . . . . . . . . . . . . . . . . .5
6.2.4. Acoustic Function (M53) . . . . . . . . . . . . . . . . . . . . . . . . . .5
7. Connecting and Configuring External Sensors 6
7.1 BUS Sensors . . . . . . . . . . . . . . . . . . . . . . . . . . . . . . . . . . . . . . . . .6
7.1.1 Connecting BUS Sensors . . . . . . . . . . . . . . . . . . . . . . . . .6
7.1.2 Configuring BUS Sensors (M6x) . . . . . . . . . . . . . . . . . . . .6
7.1.3 Logging off BUS Sensors (M7x) . . . . . . . . . . . . . . . . . . . .6
7.2 Connecting Analog Sensors . . . . . . . . . . . . . . . . . . . . . . . . . . . . . .6
7.2.1 Voltage Measurement Sensors: 0 - 1V . . . . . . . . . . . . . . .7
7.2.2 Voltage Measurement Sensors:
2-wire 4 - 20 mA and 3-wire 0 - 20 mA . . . . . . . . . . . . . .7
7.2.3 Pt100 Sensors in 3-wire and 4-wire Circuit . . . . . . . . . . .7
7.2.3 Thermocouples . . . . . . . . . . . . . . . . . . . . . . . . . . . . . . . .7
7.3 Configuring Analog Sensors (M81) . . . . . . . . . . . . . . . . . . . . . . . .7
8. Measurement Value Display and Data Logging 8
8.1. Channel Groups and Measurement Channels . . . . . . . . . . . . . . . .8
8.2 Calculation Channels for Measurement Conversion . . . . . . . . . . .10
8.3. Displaying Measurement Values . . . . . . . . . . . . . . . . . . . . . . . . .10
8.4. Data Logging . . . . . . . . . . . . . . . . . . . . . . . . . . . . . . . . . . . . . . .10
9. Alarm Function 10
9.1. Alarm Configuration . . . . . . . . . . . . . . . . . . . . . . . . . . . . . . . . . .10
9.2. Alarm Symbol on the Display . . . . . . . . . . . . . . . . . . . . . . . . . . .10
9.3. Acoustic Alarm . . . . . . . . . . . . . . . . . . . . . . . . . . . . . . . . . . . . . .10
9.4. Using the Alarm Hysteresis . . . . . . . . . . . . . . . . . . . . . . . . . . . . .11
10. Cleaning and Maintenance Instructions 11
10.1. Replacing the Batteries . . . . . . . . . . . . . . . . . . . . . . . . . . . . . . . .11
10.2. Installation During Mobile Operation . . . . . . . . . . . . . . . . . . . . . .11
10.3. Mounting the Logger on a Wall . . . . . . . . . . . . . . . . . . . . . . . . . .11
10.4. Changing Locations . . . . . . . . . . . . . . . . . . . . . . . . . . . . . . . . . .11
11. Technical Data 12
12. Error Codes 13
These operating instructions describe the functions of the hardware.
There is also a separate software manual available. This manual shows you
how to configure your data logger and how to use the software. The manual
can be accessed using the Help function as soon as it has been installed.
Your new data logger was designed and manufactured in line with the latest
technological advancements and complies with the requirements as laid down
in existing European and national guidelines. Conformity has been certified. The
relevant declarations and documents are in the possession of the manufacturer.
As the user you must read and adhere to the following safety instructions in
order to ensure that this condition is maintained and that no danger results
from the use of this device:
1. Safety Instructions
We do not accept any liability for any damages which might occur as a result of
improper use or the non-observance of these instructions. The guarantee expires
with immediate effect in any such case.
These instructions must be read in full before this measuring
device is put into operation for the first time.
For reasons of safety and CE compliance you may on no account carry out any
changes or modifications on either the device itself or any other components
which may be used in connection with this measuring device.
The following instructions must be adhered to before
the device is taken into use :
• Do NOT carry out measurements on live components.
• Please observe the sensor measuring range.
• Please observe the operating and storage conditions.
• The user is solely responsible for determining whether he or she
considers the measurement results to be valid and for any conclusions that
are reached or any measures that are taken as a result thereof. We can
neither guarantee the validity of any measurement results nor can we
accept liability for any such results. We are on no account able to accept
liability for any damage which may be caused as a consequence of
the use of these measurement results.
2. Intended Purpose and Use
Data logger OPUS20E is used to detect and log various measurement variables
which the measuring instrument collects using connected external sensors.
The measurement data can be logged, called up or saved to a connected PC at
randomly selectable intervals.
This measuring device may only be used within the specified technical specifications for the purpose for which it was intended.
Any other use is considered to be improper and constitutes a violation of these
conditions.
This product should not be disposed of in your general waste. Please
ensure that it is disposed of in an orderly manner in accordance with
existing regulations.
This publication replaces all previous publications. No part of this publication may be reproduced, processed using
electronic systems, replicated or distributed in any way without our prior written authorisation. Subject to technical
modifications. All rights reserved. Names of goods are used without guarantee of free usage and used for the most part
according to the manufacturers syntax. The names of goods used are registered and should be considered as such.
We reserve the right to modify the design in the interest of ongoing product improvement, such as shape and colour
modifications. The scope of delivery may vary from that in the product description. All due care has been taken
in compiling this document. We accept no liability for any errors or omissions.
EN
Operating Instructions OPUS20E For external sensors
2
Page 3

3. Features
Battery compartment
Battery compartment lid
USB micro B port
RJ45 network connection
Mounting rail
LCD display :
Measurement value line 1
Measurement value line 2
Measurement value line 3
Display symbol acoustic signal active
Display symbol network connection active
Display symbol USB connection active
Display symbol power supply via mains
Display symbol power supply via USB
Display symbol battery capacity
Display symbol mode marker
Display symbol logging active
Display symbol logging inactive
Date display
Time display
Mode selection key
Data logger for connecting external sensors
5-pin circular connector M12 for connecting up to
four digital bus-compatible sensors:
Pin 1: Sensor power supply (output)
Pin 2: Data 1
Pin 3: Data 2
Pin 4: GND (reference potential)
Pin 5: n.c. (not connected)
10-pin connector with two independent input channels
for connecting up to two analog sensors:
Pin 1: Terminal +24V (input, external power supply OPUS20E (24 V)
for stationary operation)
Pin 2: Terminal GND (supply voltage GND)
Pin 3: Terminal A1
Pin 4: Terminal B1
Pin 5: Terminal C1
Pin 6: Terminal D1
Pin 7: Terminal A0
Pin 8: Terminal B0
Pin 9: Terminal C0
Pin 10: Terminal D0
EN
Operating Instructions OPUS20E For external sensors
3
Page 4
4. Scope of Delivery
he following components are contained in the standard scope of delivery:
T
• Data logger
• USB cable
• CD-ROM with operating instructions, SmartGraph software
and software manual
• 4 x AA batteries
• Factory certificate
5. Preparations Prior to Use
5.1. Software
Start the SmartGraph software. The program recognises the connected data
logger automatically and adds the data logger to the existing data logger list.
The data logger can now be configured using the software.
You will find more detailed information on the software in the software
manual which you can call up using the Help function of your
SmartGraph software.
Functions of the Professional Version
You will find information on the possibility of upgrading your SmartGraph software
o the professional version (Device Licence Upgrade) in the software manual.
t
6. Operating the Data Logger
The SmartGraph PC software forms the central configuration interface for your
data logger. All further changes to the configuration or display can only be
carried out using the software.
5.1.1. Installation Requirements
Your SmartGraph software has to be installed on to a PC that fulfils the following
requirements in order for you to be able to configure your data logger and read
out the measurement results that have been recorded.
Supported operating systems:
• Windows XP from Service Pack 3 (32 bit or 64 bit version)
• Windows Vista (32 bit or 64 bit version)
• Windows 7 (32 bit or 64 bit version)
Hardware requirements:
• Processor speed: at least 1.0 GHz
• CD ROM drive
• USB or RJ45 network connection
• At least 512 MB main storage
• At least 4 GB free hard disk storage
• Adobe Acrobat Reader software
5.1.2. Installing the SmartGraph Software
Place the CD ROM in the drive of your PC and follow the instructions of the
installation assistant to install the software.
5.1.3 Preparing the Data Logger Configuration
First of all, connect the external sensors as required for measurement purposes
to the external connections on your data logger.
You will find information about connecting and configuring appropriate
sensors in chapters 7 and 11. To connect external sensors, first follow
the instructions in chapter 7 and then return to this section to continue
commissioning.
The next step is to connect the data logger to your PC using the USB cable provided as part of the delivery. The SmartGraph software detects the measuring
instrument automatically.
Alternatively, if a network function is enabled you can also configure your data
logger via a LAN connection on your local network. You will find more information
about the network function in chapter 6.2.2.
You can use the mode selection keys on your data logger
to carry out basic settings directly.
You can also use the software to lock the mode selection keys. In such a case
the data logger cannot be configured via the mode selection keys.
6.1. Powering ON / OFF
The data logger cannot be switched off completely when connected to a functioning power supply. It can, however, be switched to a low-energy power mode
(M1) which allows it to consume as little power as possible. The data logger is
inactive in this mode and therefore unable to carry out measuring or logging or
display any values. You will find an overview of the four different modes in the
following chapter.
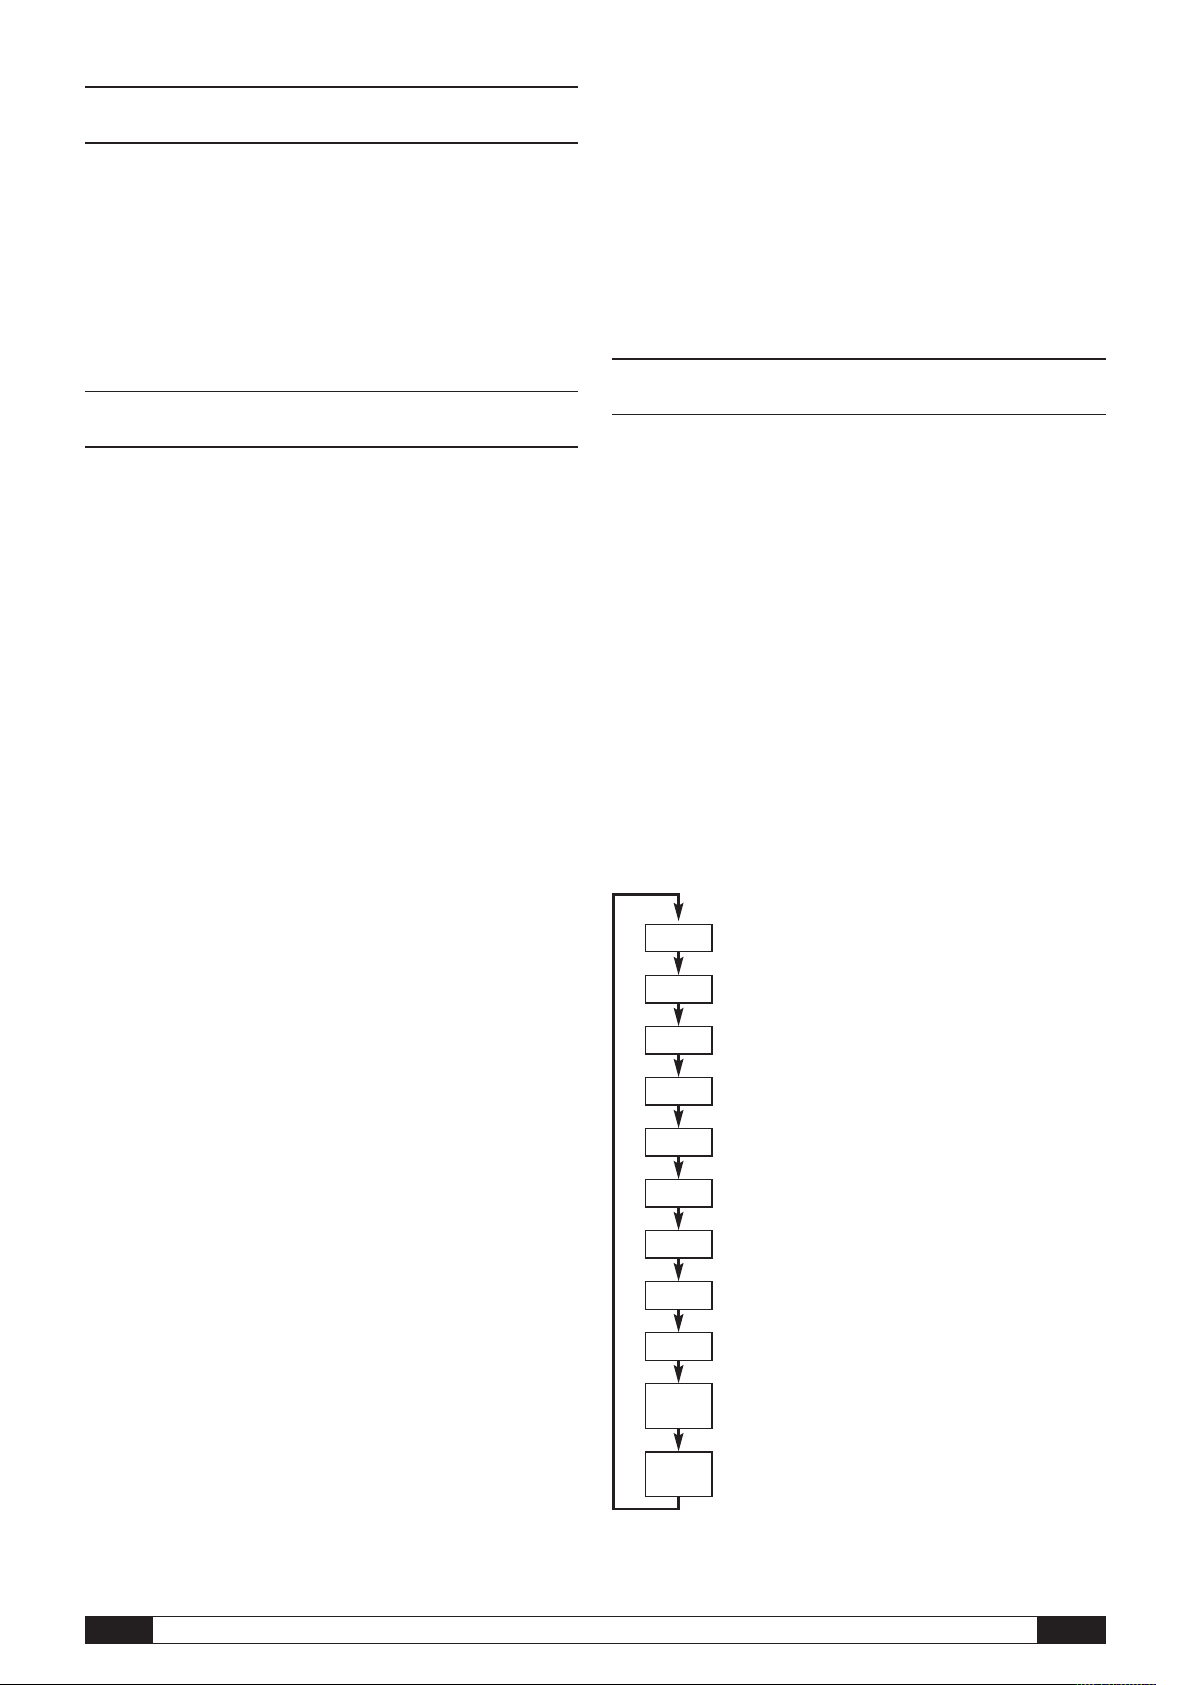
6.2. Basic Settings and Operating Modes
The mode selection key on the data logger can be used to
M1
M2
M3
M4
M51
M52
M53
M6x
M7x*
M81
An 0
M81
An 1
configure eleven basic settings as follows: four basic operating
modes, network function, global settings reset, acoustic function and various settings for configuring external sensors.
Press the mode selection key briefly to access the settings
level which you have currently selected.
Press the mode selection key again to navigate from one setting mode to another.
The selected mode will appear on the display for a maximum
of four seconds. During this time the mode can be selected.
During this time, the mode marker (M1, M2, M3, M4, M51,
M52, M53, M6x, M7x, M81 (An0), M81 (An1)) flashes in the
lower left corner of the display.
Press the mode selection key longer (approx. 1 second) to
confirm your selection.
The data logger will then change into the selected mode.
If you do not confirm your selection within this four-second
period, then the device will leave the settings level and return
to the mode that had previously been selected.
* The function is only available if a BUS sensor
is logged on before (M61)
EN
Operating Instructions OPUS20E For external sensors
4
Page 5

.2.1. The Four Operating Modes
6
Operating mode M1
Select operating mode M1 Display operating mode M1
The logging function is inactive. The word “OFF” appears in measurement value
line 1. The “STOP” symbol is active.
In this mode (data logger factory setting), the energy consumption is low, because
there are not yet any measurement values which could be called up or displayed.
Operating Mode M2
No values are displayed in any of the three lines that normally display measurements. Up to a total of 20 measurement channels, which have all been previously
selected using the SmartGraph software, can be saved into the measurement
memory. The message “REC” (data logging active) appears where the saved
easurement values are normally displayed.
m
6.2.2. Network Function (M51)
Select network function M51 Display example of the network function M51
If the data logger is connected to a local network and the network function is active, then the software can be configured and the data can be read out from the
data logger via this network.
A signal transmitted by the data logger via UDP enables the SmartGraph software to find the data logger in the local network automatically.
When the data logger is connected to the network for the first time (add network
device), you may have to use the SmartGraph software to adapt the data logger
network settings to conform with the existing network configuration. The factory
setting is DHCP.
Select operating mode M2 Display example for operating mode M2
The measuring function is active. The measurement values that were configured
using the SmartGraph software are displayed in all three measurement value
lines together with the previously selected sampling rate.
The logging function is not active in this operating mode. The displayed values
are not saved into the memory. The word “STOP” (data logging inactive) appears
where the saved measurement values are normally displayed.
Operating Mode M3
Select operating mode M3 Display example for operating mode M3
The measuring and logging functions are active. The measurement values that
were configured using the SmartGraph software are displayed in all three measurement value lines together with the previously selected sampling rate.
In addition a total of 20 measurement channels that have all been previously selected using the SmartGraph software can be saved into the measurement
memory. The message “REC” (data logging active) appears where the saved
measurement values are normally displayed.
You will find more detailed information on the software in the software
manual which you can call up using the Help function of your SmartGraph
software.
The professional version of the SmartGraph software also allows you to call up
and log current measurements and measurement values that have been saved
in the data logger at random intervals via the network.
Use and Power Supply in Network Operation
If you intend to use the network card over a longer period, the data logger must
be mounted on a wall.
The data logger consumes more power when the integrated network card is used.
When the network function has been activated, the data logger checks the network status automatically at regular intervals.
If an active local network cannot be identified, the data logger deactivates the
network function independently after 12 minutes.
There is also an optionally available PoE model. This model can be powered
directly from the mains.
6.2.3. Factory Setting (M52)
This function allows you to reset all
the settings of your device to the factory settings.
Operating Mode M4
Select operating mode M4 Display operating mode M4
The measuring and logging functions are active.
The display is deactivated.
EN
Operating Instructions OPUS20E For external sensors
Select reset function M52
6.2.4. Acoustic Function (M53)
The data logger has an acoustic signal which can be turned on or off by
activating or deactivating the acoustic function. A symbol appears on the display
when the acoustic function is activated.
5
Page 6

When the acoustic function is activated, an alarm signal alerts the user when
an alarm incident occurs. The alarm for one or more than one measurement
must have been previously set using the SmartGraph software.
elect acoustic function M53 Display example of the acoustic function M53
S
When the acoustic function is activated, the data logger also emits a tone each
time the mode selection key is pressed while navigating through the individual
levels or when a specific mode is selected.
The data logger also emits a tone when you leave the settings level without a
previous selection having been made.
7. Connecting and Configuring
External Sensors
The data logger has a 5-pin, circular connector (M12) for connecting digital,
bus-compatible sensors (BUS sensors) and a 10-pin connector with two independent input channels for connecting up to two analog sensors.
7.1 BUS Sensors
7.1.1 Connecting BUS Sensors
Attach the BUS sensor to the 5-pin circular connector on the data logger (see
, chapter 3). The sensor is powered via the connector.
The last two digits represent the sensor number and are assigned automatically
according to the log on sequence - from 01 for the first logged on sensor to 04
for the fourth logged on sensor.
Once the sensor has been logged on, a message indicating the BUS ID is also
shown for your information – the message symbol flashes in the lower right corner of the display. You can close this message display by briefly pressing the
mode selection key.
Tip: For future measurements, make a note of the
R
BUS ID directly on the sensor.
isplay example: Select log on function
D
M61 to log on the first BUS sensor (n1).
If several sensors are to be used, in accordance with this procedure each individual sensor must first be connected to the data logger, logged on and registered
with a BUS ID.
Alternatively, you can also configure the BUS sensors directly
using the SmartGraph software.
You will find more detailed information on the software-related aspects
concerning the configuration of BUS sensors in the software manual which
you can call up using the Help function of your SmartGraph software.
isplay example: Message display
D
indicating the BUS ID (71.01) for the first
ogged on BUS sensor.
l
7.1.3 Logging off BUS Sensors (M7x)
By using up to three Y-junctions (option), up to four digital
BUS sensors can be connected to the data logger.
You will find more information about the BUS sensors
that are currently available in the technical data
in chapter 11.
7.1.2 Configuring BUS Sensors (M6x)
In order to use BUS sensors with the data logger, each BUS sensor first has to
be individually logged on to the data logger.
The configuration process is only available when the data logger is not
in the logging mode (M3 or M4).
You can configure BUS sensors on the data logger as described below. Alternatively, you can also do this directly using the SmartGraph software. You will
find more detailed information about configuring sensors using the software
in the software manual, which you can call up using the Help function of
your SmartGraph software.
To configure on the data logger, connect the first BUS sensor to be logged on to
the 5-pin circular connector of the data logger and then - as described in
chapter 6.2 - use the mode selection key to navigate to configuration mode
M6x. The option to register the BUS sensor is shown on the display (n1 for the
first sensor to n4 for the fourth sensor).
You can initiate the registration of the BUS sensor by briefly pressing the mode
selection key. The display then switches to the scan mode and the connected
BUS sensor is automatically detected and identified.
Display example: Select log off function
M70 to log off the first logged on sensor.
To log off a BUS sensor that was previously logged on to the data logger, use
the mode selection key to navigate to configuration mode M7x. The option to remove the first BUS sensor is displayed.
It is not necessary to connect the sensor to the device in order to log off.
If several BUS sensors were logged on earlier and you want to remove a sensor
other than the first one, press the mode selection key repeatedly until the
BUS ID of the sensor to be removed is displayed.
You can now initiate the logging off of the BUS sensor by briefly pressing the
mode selection key. Once the sensor has been logged off, a message indicating
the BUS ID is also shown for your information – the message symbol flashes in
the lower right corner of the display. You can close this message display by
briefly pressing the mode selection key.
Display example: Message display
indicating the BUS ID (71.01) of the
logged off BUS sensor.
7.2 Connecting Analog Sensors
The data logger has a 10-pin connector with two independent input channels
for connecting up to two analog sensors. Input channel 1 with pins 1, 3, 5, 7
and 9 and input channel 2 with pins 2, 4, 6, 8 and 10 (see , chapter 3).
On identification the sensor is given a four digit BUS ID. The first two digits of
this ID represent the sensor type (for example 71 for TFF sensors).
EN
Operating Instructions OPUS20E For external sensors
Each of the two input channels supports the sensor configurations detailed
in the following sub-sections.
6
Page 7

D0 / D1
B0 / B1
C0 / C1
Pt100
D0 / D1
B0 / B1
A0 / A1
C0 / C1
Pt100
TC+
TC(-)
B0 / B1
A0 / A1
Sensor
.2.1 Voltage Measurement Sensors: 0 - 1V
Ri
+-
S
ensor
B
0/B1
A0 / A1
GND
Sensor: 4 … 20 mA
External voltage source
A0 / A1
+24V
Sensor
GND
Sensor: 0/ 4 … 20 mA
External voltage source
A0 / A1
+24V
Sensor
7
The positive pole of the voltage source is connected to terminal B and the
negative pole is connected to terminal A, as shown in the diagram:
Important: The voltage input is a true differential input. If the sensor
is connected to the data logger by means of cables of excessive
length, it may be necessary to connect the sensor using shielded cables.
The cable shield must be connected to the GND terminal.
To log on and configure voltage measurement sensors on the data logger,
follow the instructions in chapter 7.3.
7.2.2 Voltage Measurement Sensors:
2-wire 4 - 20 mA and 3-wire 0 - 20 mA
The circuit supports voltage measurements in 2-wire and 3-wire operation.
The prerequisite for 2-wire operation is that the reference potential of the
power supply to the sensor and the power supply to the OPUS20E must be identical. In 2-wire and 3-wire operation, the power supply to the sensor is fed
via terminal A0/A1.
.2.3 Pt100 Sensors in 3-wire and 4-wire Circuit
7
In the case of the 3-wire circuit, the Pt100 sensor is connected to the measurement circuit using 3 wires. The measuring current is fed into the sensor via line
D0/D1. The resistance of the Pt100 sensor is determined from the terminal voltages B0/B1, C0/C1 and D0/D1:
mportant: The OPUS20E is capable of compensating line
I
resistances of up to 10 Ω. Compensation typically reduces the
effect of the line resistance by a factor of 100.
In the case of the 4-wire circuit, the Pt100 sensor is connected to the measurement circuit using 4 wires. The measuring current is fed into the sensor via
lines D0/D1 and C0/C1. The resistance of the Pt100 sensor is determined from
the terminal voltages B0/B1 and A0/A1:
Connection diagram for voltage measurement
using the 2-wire technique:
The sensor current is converted into a voltage at a burden resistor in the
OPUS20E. The burden resistor has a resistance of <50 Ω. Both the sensor and
the OPUS20E can be powered via an external voltage source.
Connection diagram for voltage measurement
using the 3-wire technique:
For precise temperature measurement, the 4-wire circuit is preferable.
To log on and configure Pt sensors on the data logger,
follow the instructions in chapter 7.3.
7.2.3 Thermocouples
The data logger supports the connection of type J, K and S thermocouples. The
positive pole of the thermocouple is connected to terminal B and the negative
pole is connected to terminal A:
Important: Pay attention to polarity when
connecting thermocouples.
To log on and configure thermocouples on the data logger,
follow the instructions in chapter 7.3.
This circuit is used for sensors with power consumption greater than 4 mA,
for example heated gas sensors.
To log on and configure voltage measurement sensors on the data logger, follow
the instructions in chapter 7.3.
EN
Operating Instructions OPUS20E For external sensors
7.3 Configuring Analog Sensors (M81)
In order to use analog sensors with the data logger, the specification of the
analog sensors must be correctly configured on the data logger.
The configuration process is only available when the data logger is not in
the logging mode (M3 or M4).
To configure the specification of a sensor for the first input channel, use the
mode selection key as described in chapter 6.2 to navigate to configuration
mode M81 (AN0); or to configure the specification of a sensor for the second
input channel, use the mode selection key to navigate to configuration mode
M81 (AN1). The option to configure the first analog sensor is shown on the
display.
7
Page 8

No sensor assignment is pre-set during initial commissioning at the factory. In
the case of subsequent configurations, the last pre-set specification is assigned.
By holding down the mode selection key, you can now switch to the configuration
menu for the analog sensor specification.
Press the mode selection key repeatedly until the desired sensor specification
is displayed. Finally, confirm the desired sensor specification by holding down
the mode selection key.
Once the sensor has been logged on, a message indicating the selected
sensor configuration is also shown for your information – the message
symbol flashes in the lower right corner of the display. You can close
this message display by briefly pressing the mode selection key.
Sample LCD displays: Sensor specification for logging on an analog
sensor to the first input channel (AN0):
election of a Pt100 sensor using the
S
4-wire technique.
Selection of a type K thermocouple. Status display showing that a type K
tatus display showing that a Pt100
S
sensor using the 4-wire technique is
ogged on to the first input channel.
l
hermocouple is logged on to the first
t
input channel.
Selection to specify no sensor assignment
n the first input channel.
o
Selection of a voltage measurement
sensor 0 - 1 V.
Selection of a current measurement
sensor using the 2-wire technique.
Status display showing that no sensor is
ogged on to the first input channel.
l
Status display showing that a voltage
measurement sensor 0 - 1 V is logged on
to the first input channel.
Status display showing that a current
measuring sensor using the 2-wire technique is logged on to the first input channel.
election of a type J thermocouple
S
on the first input channel.
Selection of a type S thermocouple
on the first input channel.
tatus display showing that a type J
S
thermocouple is logged on to the first
nput channel.
i
Status display showing that a type S
thermocouple is logged on to the first
input channel.
8. Measurement Value Display and
Data Logging
8.1. Channel Groups and Measurement Channels
Each measurement variable captured by a connected sensor - in the defined
unit of measurement - represents one channel group.
Selection of a current measurement
sensor using the 3-wire technique.
Selection of a Pt100 sensor using the
3-wire technique.
EN
Status display showing that a current
measuring sensor using the 3-wire technique is logged on to the first input channel.
Status display showing that a Pt100
sensor using the 3-wire technique is
logged on to the first input channel.
Operating Instructions OPUS20E For external sensors
For example, a temperature sensor with defined units of measurement in °C or
°F represents two channel groups (temperature in °C and temperature in °F).
The number of channel groups which a BUS sensor can measure depends on
the sensor type. For example, the type TFF BUS sensor can measure seven different channel groups.
Analog sensors for measuring voltage or current can only measure one channel
group; analog sensors for measuring temperature can measure two channel
groups (°C and °F).
Again, four measurement channels are available for each channel group for the
purpose of data logging: current measurement (curr), minimum measurement
(min), maximum measurement (max) and mean measurement (mean).
With full sensor assignment and a total of four connected type TFF BUS sensors
and two connected analog Pt100 sensors, the data logger is capable of capturing
measurements from a total of 32 channel groups and 128 measurement channels, as shown in Table 1.
8
Page 9

Table 1: Summary of Channel Groups (Measurement Variables) and Measurement Channels available on the Data Logger
Sensor
assignment
Sensor type Channel group
(measurement
variable)
Unit Calculation
channels
available for
measurement
conversion
Temperature °C – curr min max mean
Temperature °F – curr min max mean
BUS
sensor 1
For example
TFF sensor BUS class 71
Dew point °C – curr min max mean
Dew point °F – curr min max mean
Relative humidity % – curr min max mean
Absolute humidity g/m³ – curr min max mean
Mixing ratio g/kg – curr min max mean
Temperature °C – curr min max mean
Temperature °F – curr min max mean
BUS
sensor 2
(with Yjunction)
For example
TFF sensor BUS class 71
Dew point °C – curr min max mean
Dew point °F – curr min max mean
Relative humidity % – curr min max mean
Absolute humidity g/m³ – curr min max mean
Mixing ratio g/kg – curr min max mean
Temperature °C – curr min max mean
Temperature °F – curr min max mean
BUS
sensor 3
(with Yjunction)
For example
TFF sensor BUS class 71
Dew point °C – curr min max mean
Dew point °F – curr min max mean
Relative humidity % – curr min max mean
Absolute humidity g/m³ – curr min max mean
Mixing ratio g/kg – curr min max mean
Temperature °C – curr min max mean
Temperature °F – curr min max mean
BUS
sensor 4
(with Yjunction)
For example
TFF sensor BUS class 71
Dew point °C – curr min max mean
Dew point °F – curr min max mean
Relative humidity % – curr min max mean
Absolute humidity g/m³ – curr min max mean
Mixing ratio g/kg – curr min max mean
Analog
sensor 1
on input
channel 1
(An0)
Analog
sensor 2
on input
channel 2
(An1)
Voltage measurement 0 - 1 V Voltage V V
Current measurement using 2-wire technique 4 - 20 mA Current strength mA curr min max mean
Current measurement using 3-wire technique 0 - 20 mA Current strength mA curr min max mean
Pt100 temperature measurement using 3-wire technique Temperature °C – curr min max mean
Pt100 temperature measurement using 3-wire technique Temperature °F – curr min max mean
Pt100 temperature measurement using 4-wire technique Temperature °C – curr min max mean
Pt100 temperature measurement using 4-wire technique Temperature °F – curr min max mean
Temperature measurement using type K thermocouple Temperature °C – curr min max mean
Temperature measurement using type K thermocouple Temperature °F – curr min max mean
Temperature measurement using type J thermocouple Temperature °C – curr min max mean
Temperature measurement using type J thermocouple Temperature °F – curr min max mean
Temperature measurement using type S thermocouple Temperature °C – curr min max mean
Temperature measurement using type S thermocouple Temperature °F – curr min max mean
Yes,
see
Table 2
Yes,
see
Table 2
Measurement channels
available for data logging
(max. 20 channels storable)
and display (max. 3 channels
displayable)
curr min max mean
curr min max mean
EN
Operating Instructions OPUS20E For external sensors
9
Page 10

Table 2: Available Calculation Channels for Measurement Conversion
Assignable units:
Assignable sensor types:
counts, logic, digits, °C, °F, K, °Cdp, °Fdp, %rH, g/kg, g/m³, µm, mm, cm, dm, m, km, in, mil, ft, mi, m/s, km/h, kts, ppm,
mV, V, mA, A, Hz, kHz, bar, mbar, Pa, mPa, hPa, kPa, m³, l, s, ms, µs, %, °, mm/h, m³/h, l/m², in/h, mil/h, g, kg
Temperature, relative humidity, absolute humidity, dew point, battery voltage, voltage, current, absolute air pressure, relative air pressure,
building moisture, flow velocity, mixing ratio, CO2 concentration, particle 0.1 µm, particle 0.2 µm,
particle 0.3 µm, particle 0.5 µm, particle 1 µm, particle 5 µm, particle 10 µm, particle x µm, particle y µm, particle z µm,
unknown, inactive, cooling limit temperature, global radiation, daylight, precipitation amount, wind speed,
wind direction, analog/digital input, soil moisture, leaf wetness
8.2 Calculation Channels for
Measurement Conversion
Using the SmartGraph software, analog sensors that deliver a current or voltage
value can be used as calculation channels for measurement conversion. Calculation channels allow input variables from analog sensors that deliver a current
or voltage value to be converted into the actual measurement variable. Units of
measurement, conversion parameters and decimal place settings can be specified and assigned to a sensor type (see Table 2).
You will find more detailed information on how to use the software to
configure calculation channels in the software manual which you can call up
via the Help function of your SmartGraph software.
8.3. Displaying Measurement Values
One of the channel groups specified in Table 1 can be configured to display
measurement values on each of the three lines provided on the display for this
purpose. The current measurement is always displayed.
8.4. Data Logging
When you select operating mode M3 or M4, the data logger is in the logging
mode (REC) and the measurement values of the measurement channels pre-selected for logging are stored in the device.
Up to 20 of the measurement channels specified in Table 1 can be logged in parallel and stored in the memory of the measuring device.
Logging begins immediately as soon as operating mode M3 or M4 is selected
and is executed in the ring mode. This means that logging does not end when
the memory is full but is permanently ongoing. For this purpose, the oldest
values are continuously overwritten with the most recent data.
Tip: The current, minimum, maximum and mean measurement values
R
of a channel group represent an individual measurement channel in
each case. If you want these measurements to be available for subsequent
documentation and analysis, each of these measurement channels must be
pre-selected for logging at the memory organization level, as subsequent
computation of these measurements is not available on the software side.
Using the software, you can set up the individual specifications for the type,
duration and scope of data logging in the logging mode. You will find detailed
information about this in the software manual.
9. Alarm Function
Please note: The alarm function will only be displayed for the channel groups
of the three measurement channels which have been previously selected to
be displayed and only in the operating modes M2 and M3.
Alarm incidents of further selected measurement channels in logging mode are
saved regardless of whether they have been selected to be displayed or not.
This means that alarm incidents of measurement channels that have not been
selected for display but which have been selected for logging will be saved.
All selected alarm incidents are also recorded when the display has been deactivated in operating mode M4.
9.2. Alarm Symbol on the Display
The alarm will only appear on the display for measurement values which
have been selected to be displayed and
which have been configured with an active alarm function. When an alarm has
been triggered on one of these meas-
Display example for an alarm incident
of the measurement channel displayed
in the first measurement line.
The alarm symbol stops flashing as soon as the measured value is within the selected thresholds. The alarm symbol remains on the display.
This is to show the user that an alarm has been triggered and that an alarm incident has occurred. If the threshold values are exceeded again, then the alarm
symbol starts to blink again.
The alarm symbol disappears when the memory is read out.
Alarm display
Upper alarm
threshold value
Set value
corridor –
“Good sector”
Lower alarm
threshold
value
Flashing
Static
urement channels, an alarm symbol appears next to the measurement value
for this specific channel. The symbol continues to flash until the measurement
value returns to the preset corridor.
Logging mode
Reading out the value memory
9.1. Alarm Configuration
The data logger management can be used to configure an alarm for each individual measuring channel which has been selected for display or logging.
First you must define both an upper and a lower alarm threshold so as to set a
corridor within which the values are deemed to be good. The data logger triggers the alarm as soon as the measured value is outside this corridor, i.e. one
of the thresholds has been exceeded.
EN
Operating Instructions OPUS20E For external sensors
A hysteresis can also be set which switches off the alarm when the measured
value is once again within the corridor.
9.3. Acoustic Alarm
When an alarm is triggered when the acoustic function is active (see chapter
6.2.4. Acoustic Function), an alarm tone sounds in addition to the alarm symbol
on the display. The logger stops emitting the tone when the measured value is
within the corridor.
10
Page 11

.4. Using the Alarm Hysteresis
9
If you use the alarm function with an alarm hysteresis, the alarm will be trig-
ered and recorded every time the alarm thresholds are exceeded.
g
If the corridor between the selected alarm thresholds is very narrow, the alarm
will be triggered more often.
Only use batteries which are permissible according to the technical specifications.
Other battery types can cause faults. Do NOT use rechargeable batteries.
Do NOT dispose of used batteries in your household waste. Do NOT throw into
an open fire or water. Please dispose of these batteries in a proper manner in
accordance with existing regulations.
If, for example, you have selected 24°C as your upper alarm threshold for the
room temperature and 10°C for your lower alarm threshold and the room temperature fluctuates between 23.5 and 25°C during the entire measuring period,
then this would lead to the alarm being triggered and recorded much more often
than would perhaps otherwise be the case during a normal measuring period.
In order to prevent this from happening, you can set an alarm hysteresis. By
doing so you are defining a value which has to be reached in the selected value
corridor, the so-called “good sector” to switch off the alarm.
The alarm hysteresis is set to 1°C in the previous example. This means that the
alarm will be triggered when the measured value has exceeded 24°C and then
switched off again when it reaches 23°C.
pper alarm
U
threshold value
et value
S
orridor –
c
“Good sector”
Lower alarm
threshold
value
Flashing
Static
Upper alarm
threshold value
Alarm display without hysteresis
Logging mode
10.2. Installation During Mobile Operation
The data logger can be placed at any random position during mobile operation.
Please make sure that the permissible ambient conditions are observed
(see Technical Data). Because of its compact size, the data logger can be easily
concealed during mobile operation.
10.3. Mounting the Logger on a Wall
If stationary logging is to be carried out, the data logger can be mounted on a
wall or fixed to a mounting rail. A mounting rail is included in the scope of
delivery.
The wall mount must be used if the logger is being used in
network operation. You will find more information on
network operation in chapter 6.2.2.
10.4. Changing Locations
A change of location, i.e. from a cold to a warm place (for example when the device has been left in a car overnight before being brought into a warm room for
measuring), can lead to condensation forming on the printed circuit board.
This physical phenomenon, which cannot be avoided through any change in the
construction of such a measuring device, will invariably lead to incorrect readings.
Please wait approximately 5 minutes to give the device enough time to adapt to
its new surroundings before carrying out measuring.
Set value
corridor –
“Good sector”
Lower alarm
threshold
value
Flashing
Static
Alarm display with hysteresis
Logging mode
10. Cleaning and Maintenance
Instructions
10.1. Replacing the Batteries
When the message “LO bAtt” appears on the display,
the batteries have to be replaced.
The data logger cannot log data while the batteries are being
replaced. If you have to interrupt a logging process, please ensure
that the data logger is set to operating mode M1 or M2 before the
batteries are replaced.
Open the battery compartment and remove the used batteries. Place the new
batteries in the battery compartment. Make sure that the poles are properly
aligned.
HYSTERESIS
The clock continues to give the correct time for at least a minute while the
batteries are being replaced.
EN
Operating Instructions OPUS20E For external sensors
11
Page 12

11. Technical Data
Data logger OPUS20E for external sensors
Measuring range 0 … 1 V
Voltage Input
0 - 1 V
Accuracy ±200 µV ± 0.1% of measurement
Resolution < 500 µV
Measuring range 2-wire operation: 4 … 20 mA, 3-wire operation: 0 … 20 mA
Current Measurement
K-type Thermocouple
J-type Thermocouple
S-type Thermocouple
Pt100
Accuracy ± 4 µA ± 0.1% of measurement
Resolution < 5 µA
Burden resistor approx. 50 Ω
Measuring range -200°C … 1,200°C
Accuracy
Resolution < 0.2 °C
Measuring range -200°C … 1,200°C
Accuracy
Resolution < 0.2 °C
Measuring range -50°C … 1,700°C
Accuracy
Resolution < 0.2 °C
Measuring range -200°C … 500°C
Accuracy ± 0.2°C ± 0.1% of measurement
Resolution < 0.02°C
Sampling interval 10 / 30 s, 1 / 10 / 12 / 15 / 30 min, 1 / 3 / 6 / 12 / 24 h
± 1°C ± 0.5% of measurement at -200°C … 0°C,
± 1°C ± 0.2% of measurement at 0°C … 1,200°C
± 1°C ± 0.5% of measurement at -200°C … 0°C,
± 1°C ± 0.2% of measurement at 0°C … 1,200°C
± 1°C ± 0.5% of measurement at -50°C … 0°C,
± 1°C ± 0.2% of measurement at 0°C … 1,700°C
Memory Organization
Equipment and
Dimensions
Power Supply
Permissible Operating/
Ambient Conditions
Scope of Delivery
Storage interval 1 / 10 / 12 / 15 / 30 min, 1 / 3 / 6 / 12 / 24 h
Data storage 16 MB, approx. 3,200,000 measurements
Data logging up to 20 parallel measurement channels
LC display W 90 x H 64 mm
Housing Plastic
Dimensions L 180 x W 32 x H 78 mm
Weight approx. 250 g
Interfaces USB, LAN, RS485 (sensor BUS)
Internal
External
Air temperature -20°C to +50°C
Relative humidity 0 to 95% RH, < 20 g / m³ (non-condensing)
Altitude 10,000 m above sea level
Standard
battery service life > 1 year (dependent on connected sensors and configuration)
connectors for external voltage source for power supply to sensors
Measuring instrument, CD ROM containing SmartGraph 3
PC software for graphic and numeric representation of the measurement data analysis
and operating manual, USB connection cable and batteries
4 x LR6 AA batteries,
USB, LAN (PoE version),
EN
Optional Measuring instrument in PoE version, TFF sensors
Operating Instructions OPUS20E For external sensors
12
Page 13

12. Error Codes
Sensor Status Measuring range Code
Negative polarity approx. < -0.024 V 0x53 (CHANNEL_UNDERRANGE)
Threshold range -0.024 V … 0.000 V Displayed: 0.000V
… 1 V
0
4 … 20 mA
0 … 20 mA
Normal operation 0.000 V … 1.000 V
Threshold range 1.000 V … 1.024 V Displayed: 1.000V
Overvoltage approx. > 1.024 V 0x52 (CHANNEL_OVERRANGE)
Special case: open
Negative polarity approx. < -0.48 mA 0x53 (CHANNEL_UNDERRANGE)
Sensor failure approx. -0.48 mA … 0.30 mA 0x55 (MEAS_UNABLE)
Residual current 0.30 mA … 3.00 mA 0x51 (VALUE_UNDERFLOW)
Threshold range 3.00 mA … 4.00 mA Displayed: 04.00mA
Normal operation 4.00 mA … 20.00 mA
Threshold range 20.00 mA … 20.48 mA Displayed: 20.00mA
Over current approx > 20.48 mA
Negative polarity approx. < -0.48 mA 0x53 (CHANNEL_UNDERRANGE)
Threshold range -0.48 mA … 0.00 mA Displayed: 0.00mA
Normal operation 0.00 mA … 20.00 mA
Threshold range 20.00 mA … 20.48 mA Displayed: 20.00mA
Over current approx > 20.48 mA 0x52 (CHANNEL_OVERRANGE)
Floating input, e.g. CHANNEL_OVERRRANGE, also 0x52
0x52 (CHANNEL_OVERRANGE)
EN
Operating Instructions OPUS20E For external sensors
13
 Loading...