

Page 1

MARINE ELECTRONICS
One Touch To Choose Your World
FISH PRO HD
Dual Frequency 50 & 200kHz Black Box Fish Finder
CODE: A-150609
+
USER MANUAL
Copyright 2009 LORENZ ELECTRONICS Italia
All rights reserved. Printed in Italy. No part of this publication may be reproduced or distributed in any form
or by any means, or stored in a database or retrieval system, without prior written permission of the
publisher.
Page 2

Important Information
CAUTION
♦ Please read through this manual before the first operation. If you have
any questions, please contact the Company's customer service or your
local dealer.
♦ The FISH PRO HD
water intrusion into the unit. Water damage is not covered by the warranty.
♦ Extensive exposure to heat may result in damage to the FISH PRO HD
♦ Connection to the power source with reversed polarity will damage the
FISH PRO HD+ severely. This damage is not covered by the warranty.
♦ The FISH PRO HD
experienced technicians MUST handle.
+
is not built water proof. Please make sure to avoid
+
contains dangerous high voltage circuits which only
+
.
WARNING
♦ When plugging in or unplugging a transducer to the FISH PRO HD
sure power is turned off.
NOTE We will not be liable for errors contained herein, or for incidental or consequential
damages in connection with the performance or use of this material.
+
make
4 User Manual
Page 3

Contents
Important Information ................................................................................. 4
CAUTION .................................................................................4
WARNING ................................................................................. 4
About this User Manual ................................................................................. 7
INTRODUCTION .................................................................................7
CONVENTIONS USED .................................................................................7
HOW THIS USER MANUAL IS ORGANIZED .......................................................8
IF YOU NEED ASSISTANCE..............................................................................8
1. Overview ................................................................................. 9
1.1 FISH FINDER .................................................................................9
Features & Functions .................................................................................9
1. 2 Selecting the Fish Finder port.....................................................................1 0
2. Fish Finder ............................................................................... 11
2.1 UNDERSTANDING THE FISH FINDER PAGE .............................................1 1
2.1.1 Understanding the Echogram display...............................................1 2
2.2 DISPLAYING THE FISH FINDER PAGE .....................................................1 3
2.2.1 How to select the Fish Finder page .................................................. 1 3
2.2.2 Fish Finder Full Display page .......................................................... 1 4
2.2.3 50/200 kHz Full Display page.........................................................1 5
2.2.4 Zoom Full Display page .................................................................. 1 5
2.2.5 Chart/Fish Display page .................................................................1 6
2.2.6 Fish Finder and Radar pages O
COLOR-PRO SUN-PRO SUN VD-PRO COLOR VD-PRO HD/
STARLIGHT PLUS-PRO/MAGNUM PLUS-PRO/PANORAMICCOMPACT 8 SUN/PANORAMIC-COMPACT 8 XL/PANORAMIC-
COMPACT 8 HD............................................................................1 6
2.3 ZOOM MODES ...............................................................................17
2.3.1 The Bottom Lock Zoom ...................................................................1 7
2.3.2 The Marker Zoom ...........................................................................1 7
2.4 INFO ON FISH FINDER: SYSTEM INFORMATION.....................................17
2.4.1 The System Update menu ............................................................... 1 8
3 . Setup your Fish Finder ............................................................................... 19
3.1 FISH FINDER SETUP MENU......................................................................1 9
3.1.1 Preset Mode ...............................................................................19
3.1.2 Gain Mode ...............................................................................19
3.1.3 Range Mode ...............................................................................1 9
3.1.4 Bottom Range ...............................................................................19
3.1.5 Depth ...............................................................................2 0
3.1.6 Shift ...............................................................................20
3.1.7 Frequency ...............................................................................2 0
3.1.8 Interference Rejection ....................................................................2 0
3.1.9 Sensitivity ...............................................................................20
3.1.9.1 Frequency ........................................................................2 0
3.1.9.2 Gain ...............................................................................20
3.1.9.3 S TC ...............................................................................20
3.1.9.4 STC Length ......................................................................2 0
3.1.9.5 STC Strength ...................................................................2 1
3.1.9.6 Surface Noise Filter ..........................................................2 1
NLY FOR WORLD MAP -LCD 11-PRO
User Manual
5
Page 4

3.1.10 Display Setup ...............................................................................2 1
3.1.10.1Color Settings ONLY FOR COLOR CHART PLOTTER ........................ 2 1
3.1.10.2Scrolling Speed ................................................................2 1
3.1.10.3White Line ........................................................................ 21
3.1.10.4Fish Symbols....................................................................2 1
3.1.10.5Water Temperature ........................................................... 2 1
3.1.11 Transducer Setup...........................................................................2 2
3.1.11.1Keel Offset .......................................................................22
3.1.11.2Calibrate Sound Speed ......................................................2 2
3.1.11.3Calibrate Water Speed ...................................................... 2 2
3.1.11.4Calibrate Water Temperature ............................................. 2 2
3.1.11.5Calibrate Aux Temperature ...............................................2 2
3.1.12 Alarms ...............................................................................2 2
3.1.12.1Shallow Water ................................................................... 2 2
3.1.12.2Depth Water ..................................................................... 2 2
3.1.12.3Temperature Upper ...........................................................23
3.1.12.4Temperature Lower ........................................................... 2 3
3.1.12.5Temperature Rate .............................................................2 3
3.1.12.6Fish Alarm ........................................................................2 3
3.1.13 Load Settings from User C-CARD ...................................................23
3.1.14 Save Settings to User C-CARD .......................................................2 3
3.1.15 Restore Current Preset Defaults .....................................................2 3
4. SD-FISH PRO ............................................................................... 25
4.1 TECHNICAL SPECIFICATIONS ...............................................................25
4.2 DIMENSIONS ............................................................................... 2 6
4.3 MOUNTING THE FISH FINDER .................................................................2 6
4.3.1 Installation ...............................................................................2 6
4.3.2 Installing Optional Devices ............................................................27
4.4 STATUS LED ...............................................................................27
4.5 EXTERNAL CONNECTIONS...................................................................... 2 8
4.6 POWER SUPPLY WIRING DIAGRAM .........................................................2 9
4.7 SUGGESTED PLOTTER CONNECTIONS ...................................................3 0
5. Transducers ............................................................................... 31
5.1 DEDICATED AVAILABLE TRANSDUCERS
5.1.1 FISH PRO HD
+
...............................................................................31
5.1.2 Optional Devices FOR FISH PRO HD
...........................................31
+
...................................................................................
33
6 . Frequently Asked Questions ............................................................................. 35
Analytical Index ............................................................................... 39
6 User Manual
Page 5

About this User Manual
INTRODUCTION
The chart plotter combined with the sonar performance of the Fish Finder is
one of the most advanced marine navigation system available.
Please read carefully this User Manual to learn the operating features for
your unit. Refer to your chart plotter User Manual for all other unit operating
instructions.
CONVENTIONS USED
Throughout this User Manual, the labelled keys are shown in capital letters
enclosed in square brackets, for example [ENTER].
Menu operations are in bold characters listed by keys sequence with the
menu names enclosed between inverted commas, for example [MENU] +
"ALARMS" + [ENTER] means: press the [MENU] key, using the cursor key
select the Alarms menu and then press [ENTER].
Any menu operation and function activation in this User Manual is related to
the following chart plotter LCD models (see the following table). Whenever it
is necessary, a note has been inserted for those models with differences.
Chart Plotter Name Software Name Available from Software Version
SKY X5 S4egLZ5vx 11.00
COMPACT X5 S4igLZ5vx 11.00
EXCALIBUR 7 Speed S3egLZ7m 10.00
COMPACT 7 Plus S3igLZ7m 10.00
EXCALIBUR 7 Speed SunColor S3egLZ7c 10.00
COMPACT 7 Sun S3igLZ7c 10.00
SKY X7 S3egLZ7cx 10.00
COMPACT X7 S3igLZ7cx 10.00
PANORAMIC 8 SUN S3egLZ7wc 10.00
COMPACT 8 SUN S3igLZ7wc 10.00
PANORAMIC 8 SUN S4egLZ7wc 11.00
COMPACT 8 SUN S4igLZ7wc 11.00
PANORAMIC 8 XL S4egLZ7wcx 11.00
COMPACT 8 XL S4igLZ7wcx 11.00
PANORAMIC 8 HD S4egLZ8wc 11.00
COMPACT 8 HD S4igLZ8wc 11.00
STARLIGHT PLUS S3egLZctcs 10.00
STARLIGHT PRO S3egLZctcp 10.00
MAGNUM PLUS S3egLZctcms 11.00
MAGNUM PRO S3egLZctcmp 11.00
WORLD MAP LCD 11 XSegLZ11m 10.00
WORLD MAP PRO COLOR S3egLZ11c 10.00
WORLD MAP PRO SUN S3egLZ11c 10.00
WORLD MAP PRO SUN VD S3egLZ11c 10.00
WORLD MAP PRO COLOR VD S3egLZ11c 10.00
WORLD MAP PRO HD S5egLZ11c 11.00
User Manual
7
Page 6

HOW THIS USER MANUAL IS ORGANIZED
♦ CHAPTER 1: Overview
Introduction to the basic information on the Fish Finder, its features
and use.
♦ CHAPTER 2: Fish Finder
Helps you understand how the chart plotter is connected to the Fish
Finder and how to operate to improve your fishing.
♦♦
♦ CHAPTER 3: Setup your Fish Finder
♦♦
Description of the Fish Finder Setup menu.
♦♦
♦ CHAPTER 4: FISH PRO HD
♦♦
+
Technical specification, dimension and installation of the FISH PRO
HD+ and set up of the hardware configuration.
♦♦
♦ CHAPTER 5: Transducers
♦♦
Introduction to the basic information on the transducer (device that
transmits and receives sound waves into the water).
♦♦
♦ CHAPTER 6: Frequently Asked Questions
♦♦
The Analytical Index is at the end of this User Manual.
IF YOU NEED ASSISTANCE
If your chart plotter does not operate properly, please refer to the chart
plotter User Manual.
8 User Manual
Page 7
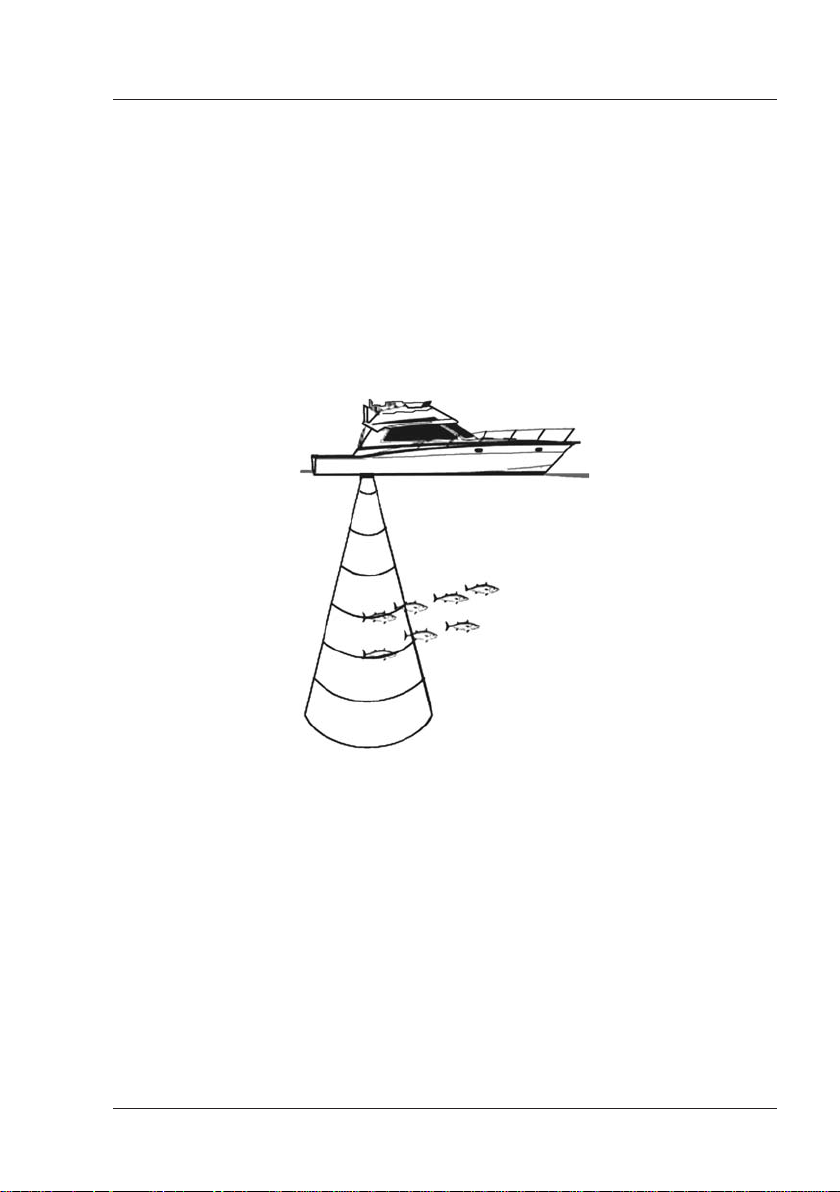
1. Overview
The Fish Finder consists of a high power transmitter, sensitive receiver and a
transducer. The Fish Finder sends an electrical pulse to the transducer which
contains an element that converts the pulse into acoustic (sound) wave which
is sent through the water. As this wave travels from the transducer to the
bottom, it may strike fish, structures, thermoclines (temperature changes in
the water). When the wave strikes an object(s) a certain amount of the wave
is reflected back to the transducer depending on the composition and shape
of the object. When the reflected wave is returned to the transducer it is
converted into an voltage and is amplified by the receiver, processed and
sent to the display. The speed of sound in water is roughly 4800 ft./sec, so
the time lapse between the transmitted signal and the received echo can be
measured and the distance to the object determined.
Fig. 1 - Fish Finder working principle
1.1 FISH FINDER
Features & Functions
♦ A-Scope (displays Sonar Echo in real time)
♦ 2X and 4X Zoom (capability to magnify any part of the Echogram
image of a fixed rate)
♦ Full auto to manual, working preset modes (Fish, Cruise)
♦ Bottom Lock (capability to magnify a user defined range around the
bottom)
♦ White Line (help distinguish between fish and bottom, when fish are
swimming close to the bottom)
♦ STC (allows reducing or eliminating the surface clutter)
♦ Interference Rejection (allows reducing interference from other
boats/Fish Finders)
User Manual
9
Page 8

♦ Noise Filter
♦ Fish Symbol feature (*)
♦ Automatic Transducer Setup. Recognition for devices (automatic
trasducer identification and parameters setup for best performance)
♦ Alarms Handling (Shallow Alarm, Depth Alarm, Fish alarm, Tem-
perature Upper, Temperature Lower)
NOTE* On specific software version available.
1.2 SELECTING THE FISH FINDER PORT
If the Fish Finder is connected to the Port 2 (see Par. 4.7), follow the procedure:
This is the default setting if the connecting cable supplied with the Fish Finder
is used.
[MENU] + "BASIC SETTINGS" + [ENTER] + "INPUT/OUTPUT" + [ENTER] + "PORT
2 INPUT" + [ENTER] + "BBFF 50/200" + [ENTER]
10 User Manual
Page 9
2. Fish Finder
This chapter is intended to help you understand how the chart plotter with the
Fish Finder connected operates to improve your fishing.
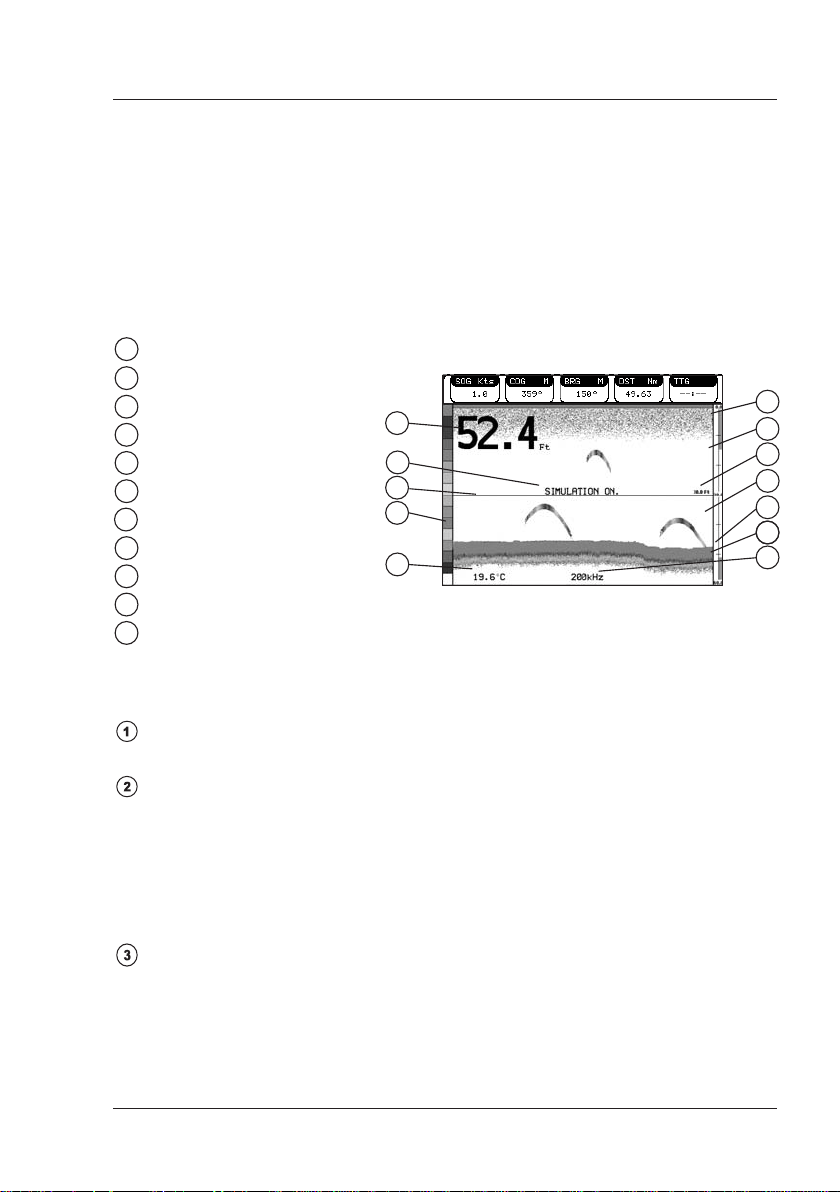
2.1 UNDERSTANDING THE FISH FINDER PAGE
The display on chart plotters shows a history of time of the echoes received
by the transducer. The chart plotters have a menu that allows adjustments to
receiver sensitivity, depth range and scrolling speed of the Fish Finder display.
1
Warning message
Echogram window
2
Color Bar
3
4
Digital Depth
5
Water temperature
6
Alarm Bar
Depth ruler
7
8
Variable Depth Marker (VDM)
Zoom Bar
9
A-Scope
10
Operating Frequency
11
4
1
2
3
5
Fig. 2.1 - The Fish Finder page
10
11
6
7
8
9
6
The following is a short description of terms listed in the previous Fig. 2.1:
Warning Message
Flashing label "Simulation" when the echo sounder is in Simulation mode.
Echogram window
Graphic presentation of sonar soundings recorded as a continuous profile
scrolling across the screen from right to left. Such recordings represent
the image of the water beneath your boat, items appear as they pass
under your transducer; the items on the right side of the screen are
closer to you than those on the left. The correct interpretation of the
Echogram allows retrieving useful information about what is under the
boat. See the following Par. 2.1.1 for more information.
Color Bar
Colored scale located on the left side of the screen that shows the colors
used in the Echogram to represent the echoes strength. The color on the
top of the bar represents the maximum sonar strength, while the color on
the bottom of the bar represents the minimum sonar strength.
User Manual
11
Page 10
Digital Depth
Readout of the current bottom depth.
Water Temperature
Readout of the current water temperature returned by the TEMP 1 sensor
included into specific transducers.
Alarm Bar
Bars showing the shallow water and deep water alarm values. The alarm
is triggered when depth is outside the range.
Depth ruler
Vertical graduated bar. It is a scale which reflects the depth of the area
being displayed.
Variable Depth Marker (VDM)
Horizontal line on to the Echogram window with a depth label. The up/
down cursor keys can move it up and down. The label displays the depth
of the cursor position. It can be moved to any location pinpointing the
depth of a target.
Zoom Bar
Bar showing the portion of the Echogram currently represented in the
zoomed window (on the left part of the screen). It is turned on selecting
Echo Sounder display page.
A-Scope
A real time representation of fish and bottom features passing through
the beam of the transducer. It is drawn as horizontal lines whose length
and hue is proportional to the sonar strength returned. When the default
palette is selected, the strongest sonar returns will be shown as the color
displayed of the top of Color Bar while the weakest as the bottom color.
Operating Frequency
Readout of the selected operating frequency.
2.1.1 Understanding the Echogram display
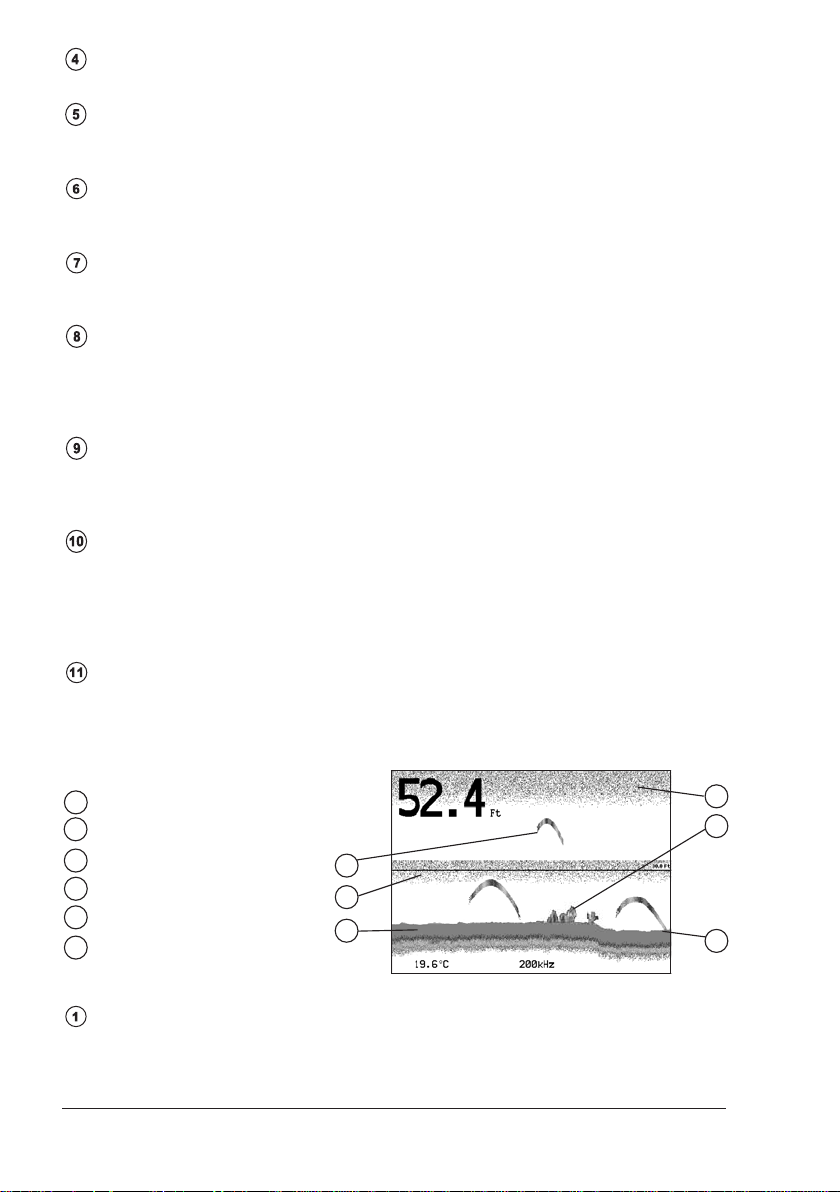
The main elements that can be easily distinguished into an Echogram are:
1
Fishes
Thermoclines
2
White Line
3
4
Surface Clutter
Structures
5
Bottom Echo Profile
6
Fig. 2.1.1 - The Fish Finder Echogram
Fishes
Fishes are represented as arcs because of the cone angle of the transducer. In fact as the boat passes over the fish the leading edge of the
12 User Manual
1
2
3
4
5
6
Page 11

cone strikes the fish, causing a display pixel to be turned on. As the boat
passes over the fish, the distance to the fish decreases turning each pixel
on at a shallower depth on the display. When the boat is directly over the
fish, the first half of the arch is formed and since the fish is closer to the
boat, the signal is stronger and the arch is thicker. As the boat moves
away from the fish, the distance increases and the pixels appear at progressively deeper depths forming the remaining half of the arch.
Thermoclines
Are the zones where two layers of different water temperatures meet.
The greater the temperature differential, the thicker the thermocline is
shown on the screen. Thermoclines are represented as horizontal stripes
of noise. They are very important for fishing since often many species of
game fish like to suspend in, just above, or just below the thermoclines.
White Line
The White Line shows the difference between hard, soft bottoms and even
distinguishes between fishes and structures located near the bottom. In
this way it is easier to tell the difference between a hard and soft bottom
and even to distinguish fishes and structures located nearby the bottom.
For example, a soft, muddy or weedy bottom returns a weaker echo that
is shown with a narrow white line while a hard bottom returns a strong
echo that causes a wide white bottom line.
Surface Clutter
Appears like noise at the top of the screen extending many feet below the
surface. It’s caused by many things, including air bubbles, bait fish, plankton
and algae.
Structures
Generally, the term “structure” is used to identify objects like wrecks and
weeds rising from the bottom.
Bottom Echo Profile
Bottom profile recorded by the Fish Finder. When the echo sounder is set
in auto-range mode it is automatically kept in the lower half of the screen.
Other Elements
Large anchoring cables are returned by the echo sounder as very long and
narrow arcs on the screen.
2.2 DISPLAYING THE FISH FINDER PAGE
This section will take you through the frequently used operations and assist
you to customize the look of the chart plotter using the Fish Finder.
NOTE The Fish Finder display page is available only if the Fish Finder is connected
2.2.1 How to select the Fish Finder page
To change the Fish Finder page use the [PAGE] key.
NOTE On SKY/COMPACT X7, SKY/COMPACT X5, PANORAMIC/COMPACT 8 XL, PANO-
User Manual
and powered On.
RAMIC/COMPACT 8 HD, MAGNUM PLUS/MAGNUM PRO chart plotters use the
[ECHO] key for displaying the Fish Finder pages. So in the following
paragraphs please substitute the [PAGE] key with the [ECHO] key.
13
Page 12
You can select the Fish Finder page you wish, among the four available pages:
Full Display, 50/200kHz Full Display, Zoom Full Display and Chart/
Fish display.
NOTE When the Radar* is connected, two other displaying pages are available too,
(*) ONLY FOR WORLD MAP -LCD 11-PRO COLOR-PRO SUN-PRO SUN VD-PRO COLOR VD - PRO HD/
STARLIGHT PLUS-PRO/MAGNUM PLUS-PRO/PANORAMIC-COMPACT 8 SUN/PANORAMIC-COMPACT
8 XL/PANORAMIC-COMPACT 8 HD
Radar/FF and Radar/FF/Chart/Nav Data. See the Radar* User Manual
for more information.
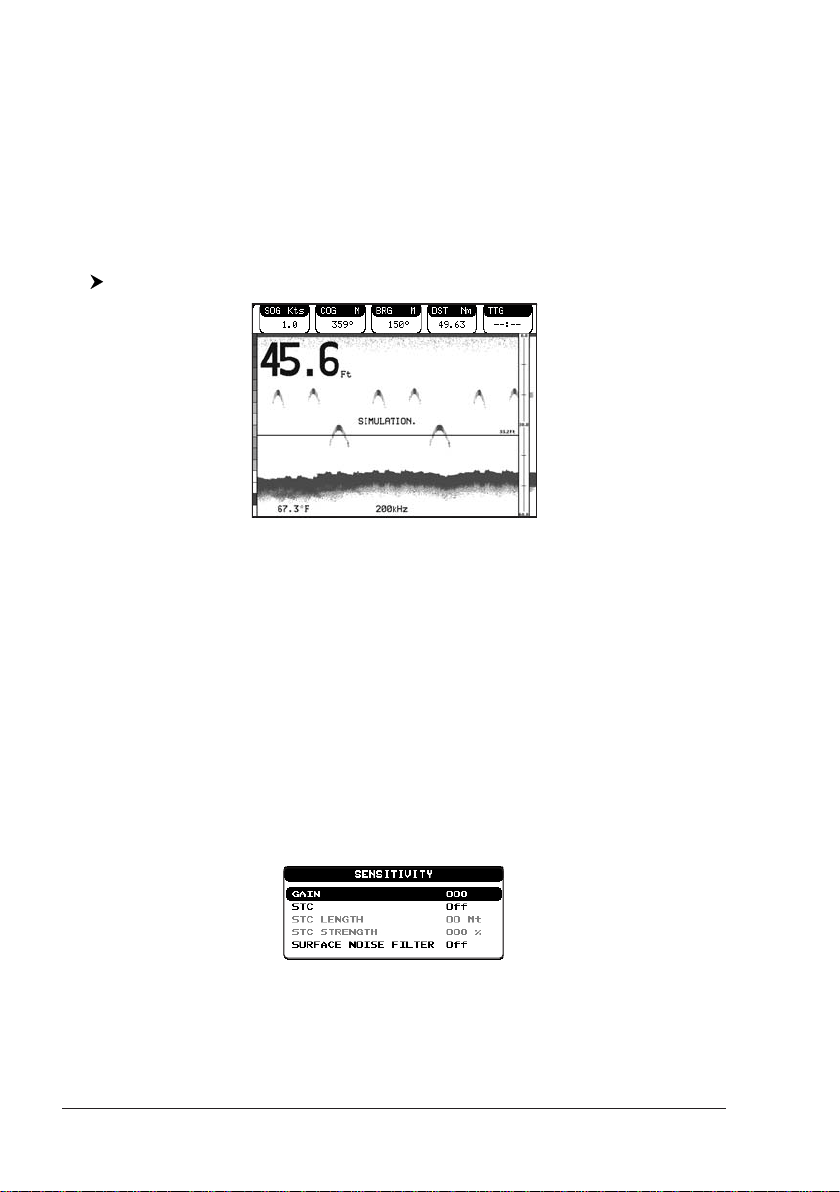
2.2.2 Fish Finder Full Display page
To display the Fish Finder Full Page Echogram, follow this procedure:
[PAGE] to select the Full Display page
Fig. 2.2.2 - The 200kHz Fish Finder Full Display
NOTE The frequency displayed depends on the selection done in the Frequency item
(see Par 3.1.10).
The MENU key
Pressing [MENU] activates the Fish Finder Setup menu (see Par. 3.1). Pressing [MENU] subsequent times toggles between the Fish Finder Setup menu
and the Main menu.
The Cursor key
Moving the Cursor key up/down adjusts the Variable Depth Marker (VDM) up
or down on the screen.
The ENTER key
Pressing [ENTER] activates the Sensitivity menu (see Par. 3.1.1) that allows
tuning the Gain, the Noise Threshold and the STC.
Fig. 2.2.2a - Sensitivity sub-menu
Pressing [CLEAR] turns off the Sensitivity menu.
The CLEAR key
By pressing [CLEAR] the Variable Depth Marker (VDM) is hidden.
14 User Manual
Page 13
The ZOOM IN and ZOOM OUT keys
From this page pressing [ZOOM IN] once changes to Zoom 2X, pressing
[ZOOM IN] twice changes to Zoom 4X, while pressing [ZOOM OUT] reverts
to Zoom 2X and no zoom.
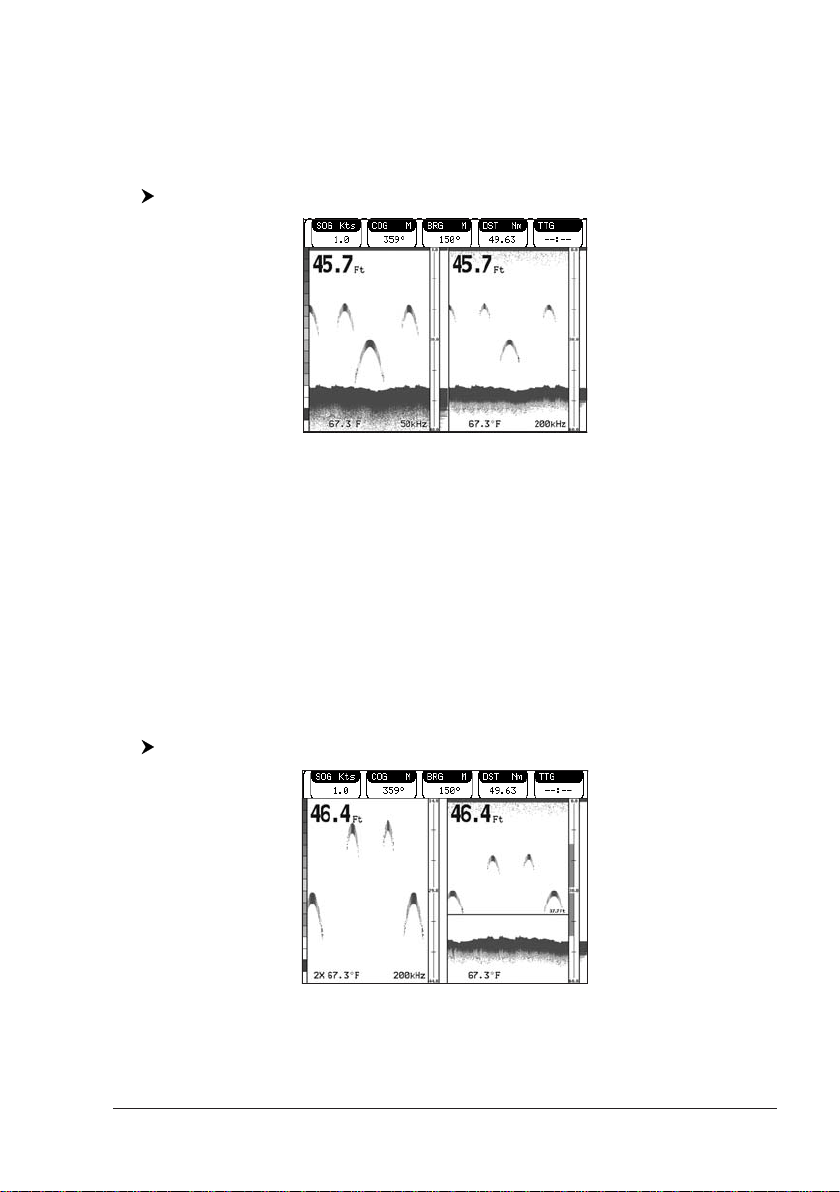
2.2.3 50/200 kHz Full Display page
To display the Fish Finder Dual Echogram, follow this procedure:
The Cursor key
Moving the cursor to the right or the left moves the Variable Depth Marker
(VDM) between the 50 and 200kHz displays. Moving the cursor up or down
will move the VDM up and down. Press [CLEAR] to hide the VDM.
The ZOOM IN and ZOOM OUT keys
From this page pressing [ZOOM IN] once changes to Zoom 2X, pressing
[ZOOM IN] twice changes to Zoom 4X, while pressing [ZOOM OUT] reverts
to Zoom 2X and no zoom.
[PAGE] to select the 50/200 kHz Full Display page
Fig. 2.2.3 - Fish Finder Dual Frequency mode
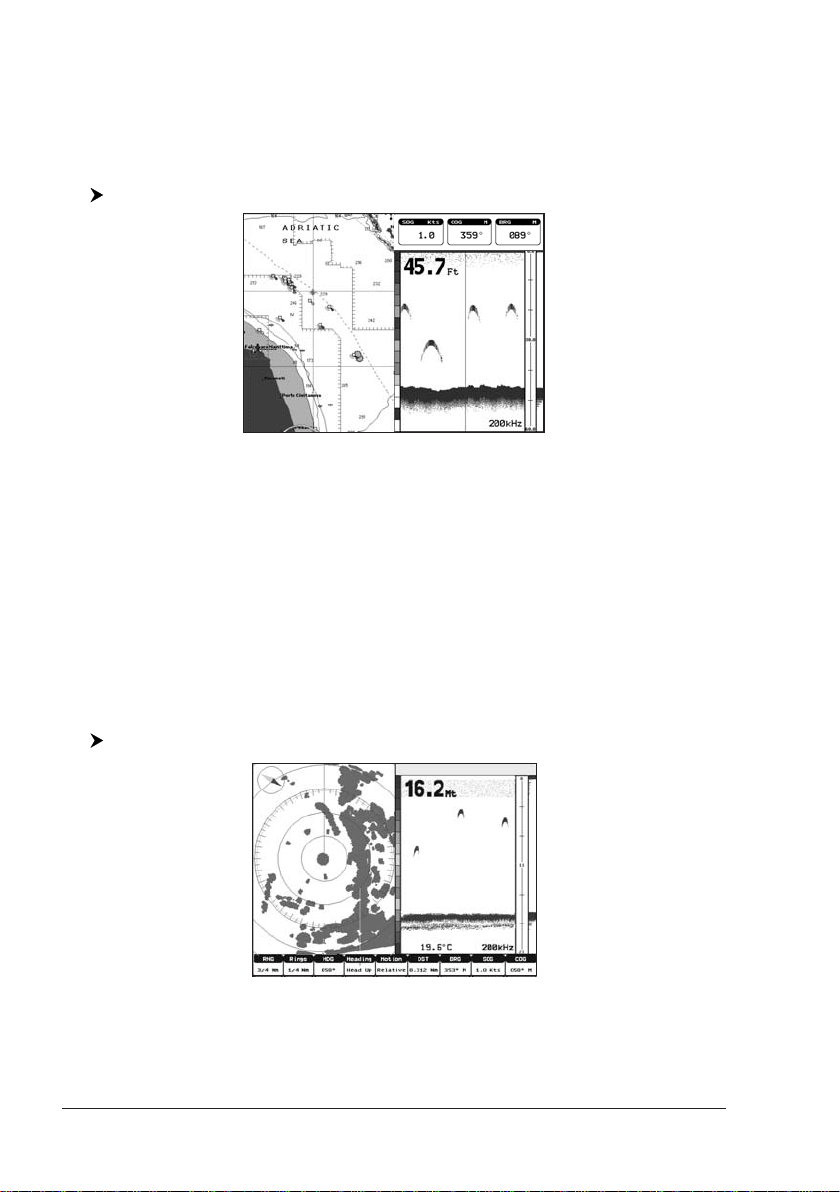
2.2.4 Zoom Full Display page
To display the zoomed Fish Finder page on the left half of the screen and the
unzoomed Fish Finder Echogram on the right half of the screen, follow this procedure:
The Depth Cursor is shown only on the unzoomed Fish Finder Echogram.
User Manual
[PAGE] to select the Zoom Full Display page
Fig. 2.2.4 - Fish Finder Zoom Page
15
Page 14
The ZOOM IN and ZOOM OUT keys
From this page pressing [ZOOM IN] changes to Zoom 4X, pressing [ZOOM
OUT] changes to Zoom 2X.
2.2.5 Chart/Fish Display page
To display the Chart page on the left half of the screen and the Fish Finder
Echogram on the right half of the screen, follow this procedure:
The MENU key (to change the active window)
[PAGE] to select the Chart/Fish Display page
Fig. 2.2.5 - Fish Finder Chart/Fish page
♦ if the active window is the Chart, press [MENU] (the Main menu is
shown), press [MENU] again (the Fish Finder Setup menu is shown),
then pressing [CLEAR] the active window is now the Fish Finder.
♦ if the active window is the Fish Finder, press [MENU] (the Fish Finder
Setup menu is shown), press [MENU] again (the Main menu is
shown), then pressing [CLEAR] the active window is now the Chart.
2.2.6 Fish Finder and Radar pages ONLY FOR WORLD MAP -LCD 11-PRO COLOR-
PRO SUN-PRO SUN VD-PRO COLOR VD-PRO HD/STARLIGHT PLUS-PRO/MAGNUM PLUSPRO/PANORAMIC-COMPACT 8 SUN/PANORAMIC-COMPACT 8 XL/PANORAMIC-COMPACT
8 HD
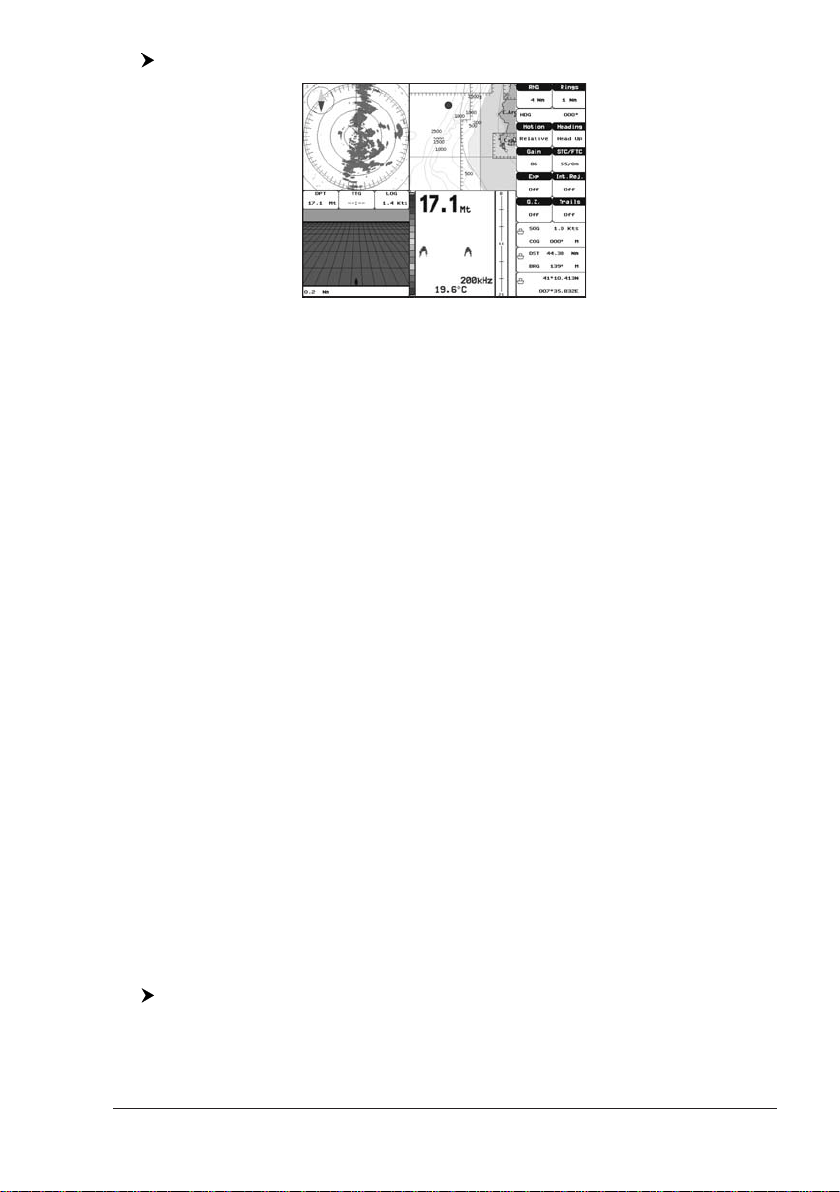
To display the Radar page on the left half of the screen and the Fish Finder
Echogram on the right half of the screen, follow this procedure:
Otherwise to display the Radar and Fish Finder Combo pages, follow this
procedure:
16 User Manual
[PAGE] to select the Radar/FF page
Fig. 2.2.6 - Radar/FF page
Page 15
[PAGE] to select the Radar/FF/Chart/Nav Data page
Fig. 2.2.6a - Combo page
When in Split/Combo pages, the active view is highlighted by a focus (Yellow
frame). The keyboard commands are related to that focused view. To move
the focus press [MENU] twice.
2.3 ZOOM MODES
2.3.1 The Bottom Lock Zoom
The Bottom Lock Zoom mode is activated when the Fish Finder is in Auto
Range or Bottom Lock mode (see Par. 3.1.3) and the Variable Depth Marker
(VDM) is not displayed on the screen.
In Bottom Lock Zoom mode the Fish Finder Echogram is automatically moved
up/down as to keep the Bottom Line always visible in the lower half of the
screen.
NOTE Moving the Cursor key up/down displays the Variable Depth Marker (VDM)
switching the Fish Finder in Marker Zoom mode.
2.3.2 The Marker Zoom
The Marker Zoom mode is activated either when the Fish Finder is in Manual
Range mode (see Par. 3.1) or the Depth Cursor is displayed on the screen.
In Marker Zoom mode the Fish Finder Echogram position is controlled by
moving the Variable Depth Marker (VDM) and pressing and holding [ENTER]
for 1 second on the selected position. Moving the Variable Depth Marker (VDM)
over the top or below the bottom of the screen, automatically moves up/
down the current zoomed Echogram view and re-position the Variable Depth
Marker (VDM) at the center of the screen.
NOTE Pressing [CLEAR] hides the Depth Cursor and if the Fish Finder is in Auto
Range or Bottom Lock mode switches into Bottom Lock Zoom mode.
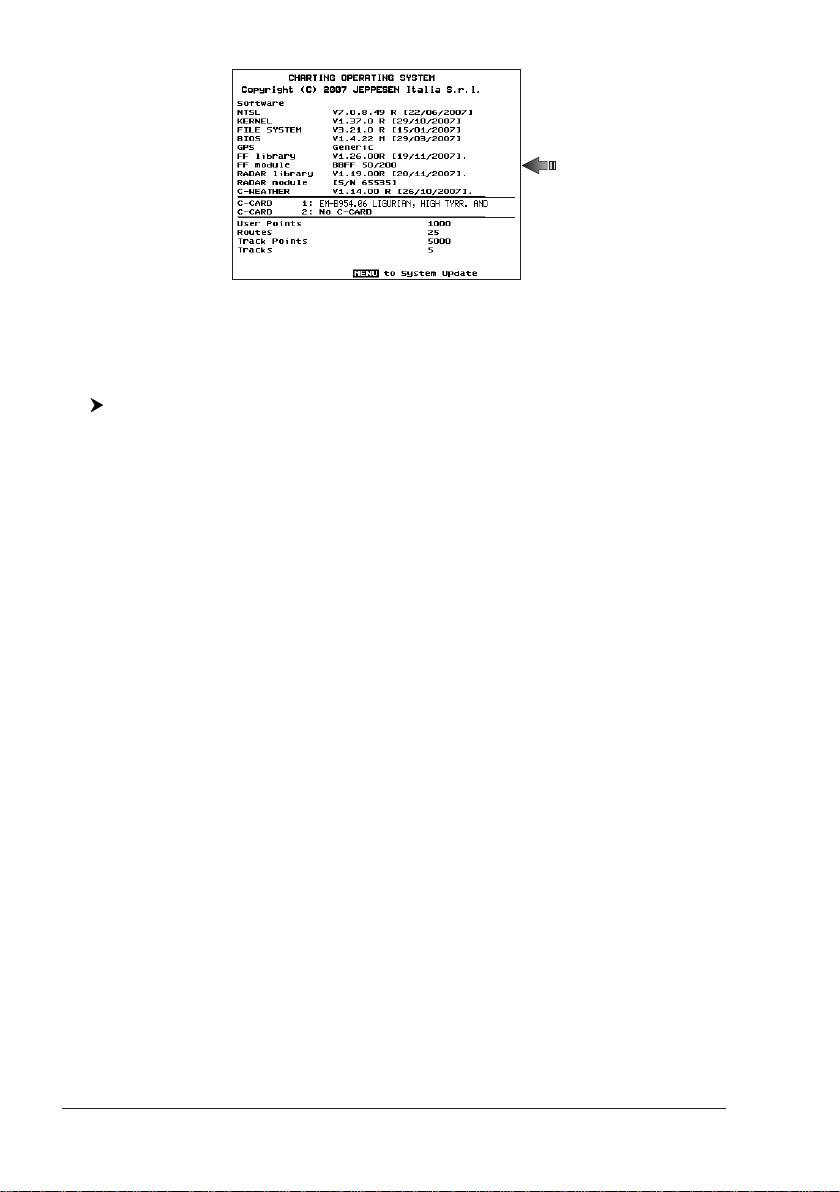
2.4 INFO ON FISH FINDER: SYSTEM INFORMATION
If you want to know information about the Fish Finder connected, follow the
procedure:
A window will be shown with the desired information on the Fish Finder Library
row and on the Fish Finder module row.
User Manual
[MENU] + "About..." + [ENTER]
17
Page 16
XXXX V. X.yy R [GG/MM/YYYY]
Fig. 2.4 - System Information page
2.4.1 The System Update menu
The System Update menu allows downloading the Fish Finder firmware into
the Fish Finder device. To select this menu follow the procedure:
The current Fish Finder firmware version is shown in the System Update window that appears on the screen.
Insert the C-CARD with the firmware in one of the chart plotter available
slots, and the press [ENTER] to update. Now select "YES" and press [ENTER]
to confirm.
[MENU] + "About..." + [ENTER] + [MENU] + "Update BBFF Firmware" + [ENTER]
Turn Off and after a few seconds turn On the FISH PRO HD
firmware upload.
WARNING
+
in case of failed
18 User Manual
Page 17
3. Setup your Fish Finder
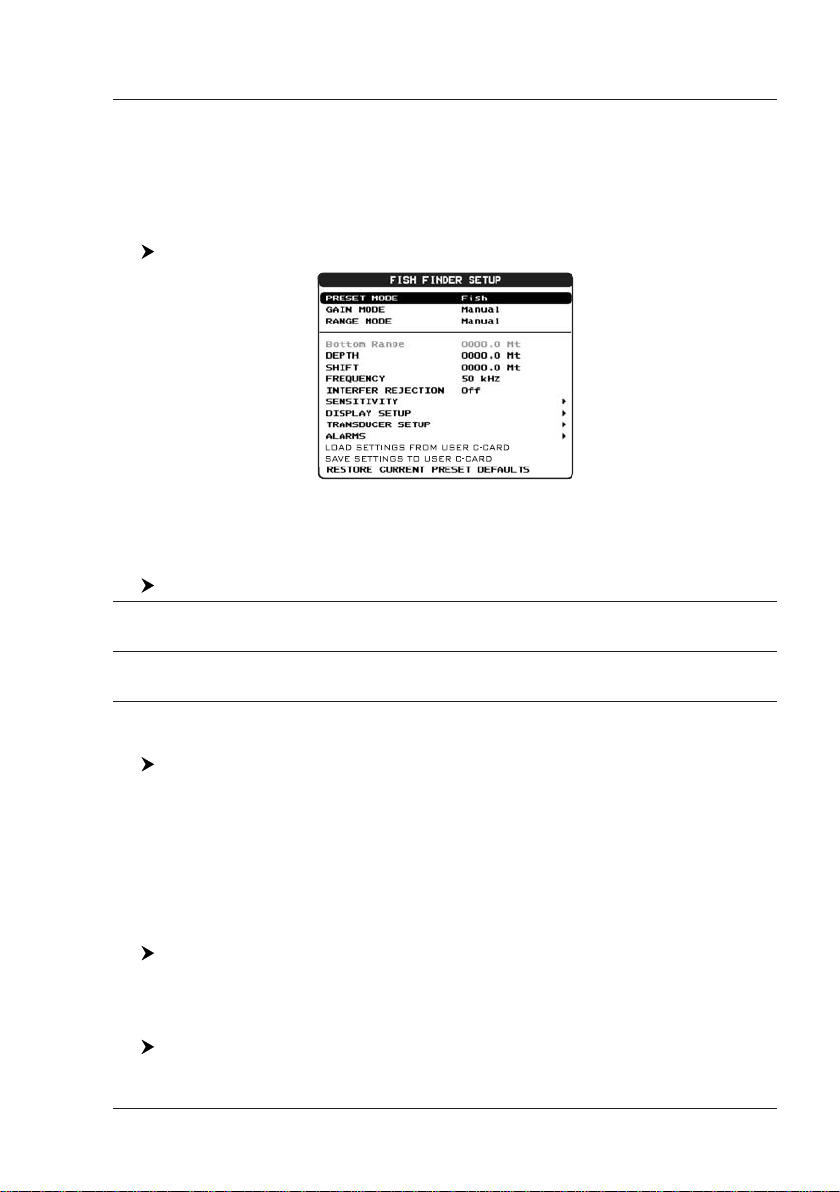
3.1 FISH FINDER SETUP MENU
The Fish Finder Setup menu provides access to additional functions, setup
and layout/data field options.
From the Fish Finder page, access this menu by pressing:
3.1.1 Preset Mode
Allows applying the following Fish Finder operating mode presets Fish and
Cruise. See the following table.
Fish : Gain Mode = Auto, Range Mode = Auto, Frequency = do not change, Shift = 0, STC = Short
Cruise : Gain Mode = Auto, Range Mode = Auto, Frequency = do not change, Shift = 0, STC = Short
[MENU]
Fig. 3.1 - Fish Finder Setup menu
[MENU] + "PRESET MODE" + [ENTER]
if Freq=200kHz and Mid if Freq=50kHz, Scrolling Speed = 10, Fish Symbols = Echo, AScope = On, Surface Noise Filter = Off.
if Freq=200kHz and Mid if Freq=50kHz, Scrolling Speed = 10, Fish Symbols = Echo, AScope = On., Surface Noise Filter = 4..
3.1.2 Gain Mode
Selects Auto or Manual.
[MENU] + "GAIN MODE" + [ENTER]
3.1.3 Range Mode
Selects among Manual, Auto Range and Bottom Lock. When in Manual Range
Mode it is possible to set Shift (the offset from the surface) (see Par. 3.1.6)
and Depth (see Par. 3.1.5) on which the Fish Finder shall operate. When in
Auto Range Mode the Fish Finder determines automatically the range as to
keep the bottom visible in the lower left of the screen. In this mode, Shift is
always set to 0. In Bottom Lock Mode the Fish Finder automatically tracks
the range around the bottom specified by the Bottom Range value.
[MENU] + "RANGE MODE" + [ENTER]
3.1.4 Bottom Range
Shows the max depth to reach. This option is available when Range Mode is
Bottom Lock.
User Manual
[MENU] + "BOTTOM RANGE" + [ENTER]
19
Page 18
3.1.5 Depth
This option is available only when Range Mode is Manual and it is disabled in
Auto Range and Bottom Lock Mode.
[MENU] + "DEPTH" + [ENTER]
3.1.6 Shift
Shows the depth from which start the bottom scanning. This option is available
only when Range Mode is Manual and it is disabled in Auto Range and Bottom
Lock Mode.
[MENU] + "SHIFT" + [ENTER]
NOTE The Bottom Range, Depth, Shift will apply to the currently selected frequency.
3.1.7 Frequency
Allows you to choose the frequency among Auto, 50 kHz or 200 kHz when
single frequency page is selected.
[MENU] + "FREQUENCY" + [ENTER]
3.1.8 Interference Rejection
elects a filter to remove interference from other Fish Finders.
[MENU] + "INTERFER REJECT" + [ENTER]
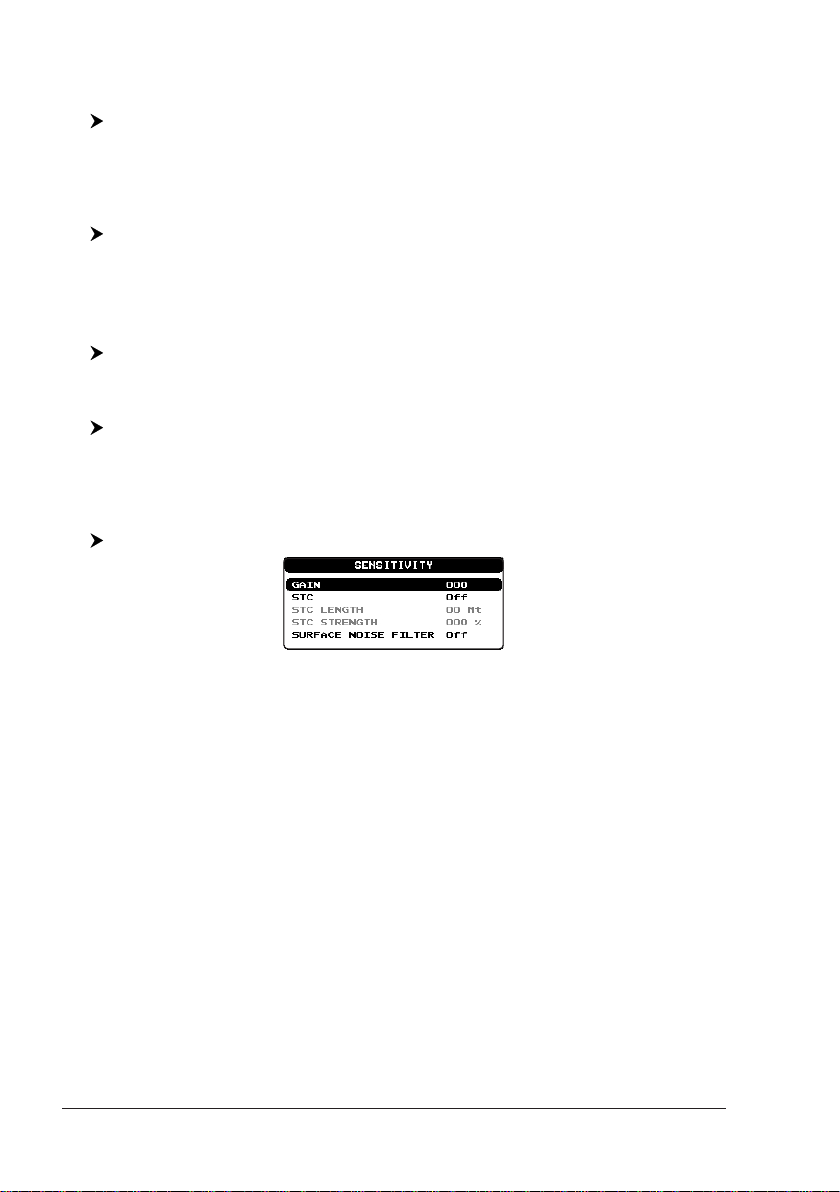
3.1.9 Sensitivity
The Sensitivity menu is accessible both from the Fish Finder Setup menu and
by pressing [ENTER] when in Fish Finder pages. All settings in the Sensitivity
menu are related to the Frequency selected.
[MENU] + "SENSITIVITY" + [ENTER]
Fig. 3.1.9 - Fish Finder Sensitivity menu
NOTE The Frequency value is only displayed: to select the desired frequency see
the previous Par. 3.1.7.
3.1.9.1 Frequency
This option is available only in the Dual Frequency page. It allows you to
select the Frequency to which the Sensitivity parameters are applied.
3.1.9.2 Gain
Allows you to control the Gain of the unit's receiver. To see more details on
the screen, increase the receiver sensitivity by selecting a higher gain percentage. If there is too much detail or if the screen is cluttered, lowering the
sensitivity may increase the clarity of the display.
3.1.9.3 STC
Sensitivity Time Constant: it is a time varying gain curve which attenuates
the sonar receiver gain in shallow water, increasing the gain gradually as the
depth increases. This is for the purpose of filtering out surface clutter.
3.1.9.4 STC Length
If STC is Custom, it is possible to change the Length of the Sensitivity Time
Constant.
20 User Manual
Page 19
3.1.9.5 STC Strength
If STC is Custom, it is possible to change the Strength of the Sensitivity Time
Constant.
3.1.9.6 Surface Noise Filter
This function implements an advanced time varying filter that allows suppressing the surface clutter efficiently while leaving fish targets visible.
NOTE Thus imposing the capability of the Fish Finder to correctly detect the weakest
echoes coming from a very deep bottom.
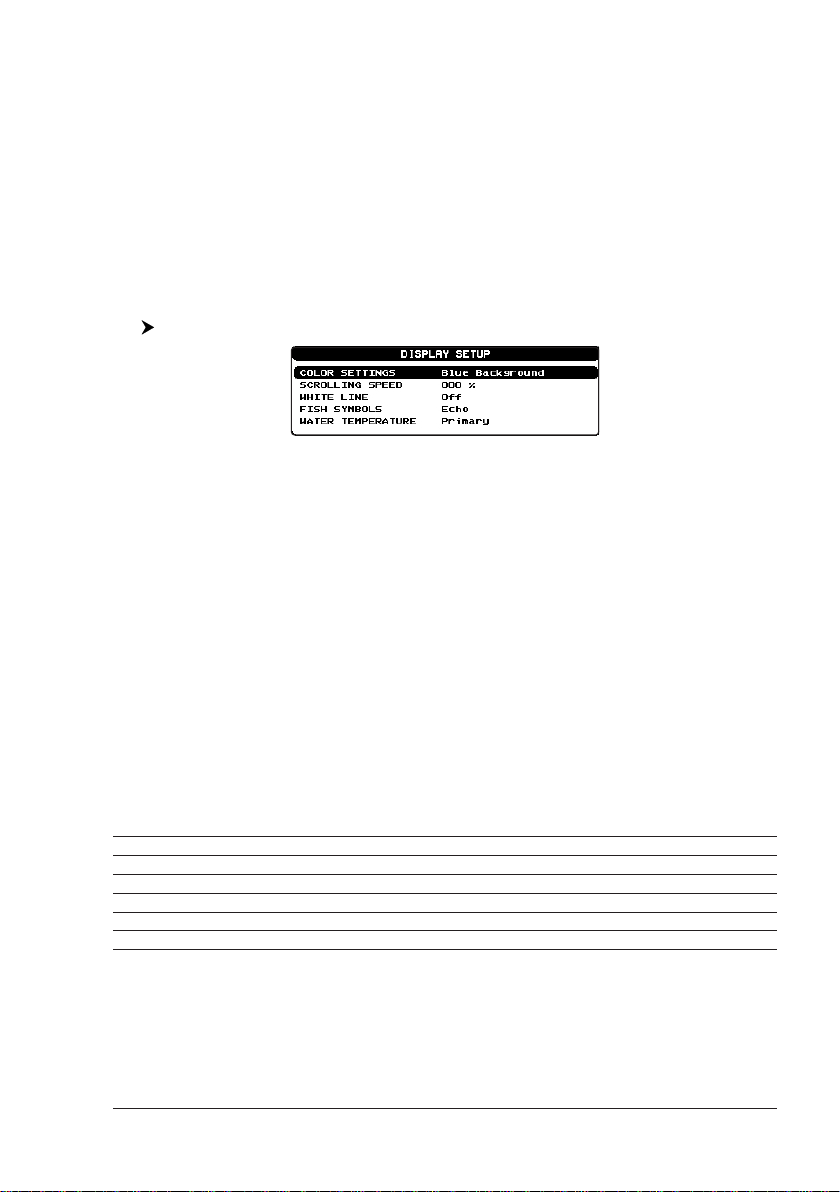
3.1.10 Display Setup
The Display Setup Menu allows you to change the color scheme of the Fish
Finder display, adjusts the chart scrolling rate, enables or disables the White
Line and allows determining the graphical representation of fishes.
3.1.10.1 Color Settings ONLY FOR COLOR CHART PLOTTER
Allows you to change the color scheme of the Fish Finder display. The available colors are Blue Background, White Background, Black Background, Gray
Scale and Reversed Gray Scale.
NOTE Only Gray Scale and Reversed Gray Scale are available on the 11" Gray Levels
3.1.10.2 Scrolling Speed
Adjusts the chart scrolling rate. Note that the scrolling rate is limited by the
sound speed and the depth according with the following relation: the deeper
the setting, the slower the scrolling rate. 100% is the maximum possible.
[MENU] + "DISPLAY SETUP" + [ENTER]
Fig. 3.1.10 - Fish Finder Display Setup menu
chart plotters.
3.1.10.3 White Line
Controls how the chart plotter displays information about the bottom type
(hard or soft).
3.1.10.4 Fish Symbols
This selection allows determining the graphical representation of underwater
suspended targets. See the following table.
Echo : shows echoes
Echo + Icon : shows the Fish icon and echoes
Echo + Icon + Depth: shows the Fish icon, depth values and the fish echoes
Echo + Depth : shows depth values
Icon : shows Fish icons
Icon + Depth : shows Fish icons and their depth (accordingly to currently selected depth unit)
The Fish icons displayed are among four different shapes depending on the
size of the Target (Small, Med, Big, Huge).
3.1.10.5 Water Temperature
Allows you to choose the Water Temperature label displayed over the echogram
User Manual
21
Page 20
between Primary and External.
[MENU] + "WATER TEMPERATURE" + [ENTER]
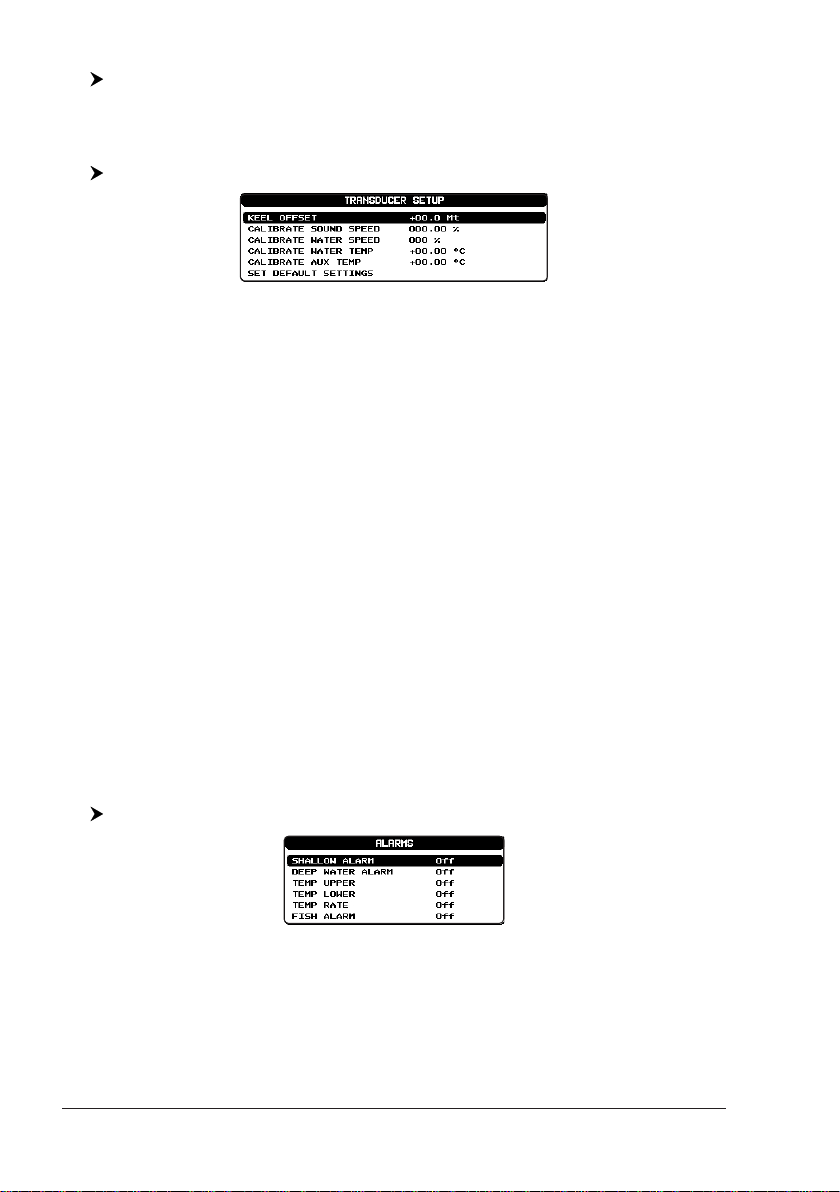
3.1.11 Transducer Setup
The Transducer Setup menu contains settings that does not require frequent
changes.
3.1.11.1 Keel Offset
It is the transducer depth offset from the surface. This makes it possible to
measure depth from the surface instead of from the trasducer's location.
3.1.11.2 Calibrate Sound Speed
Allows calibrating the value of Sound Speed in the water, depending on the
water temperature and salinity.
3.1.11.3 Calibrate Water Speed
Allows calibrating the value of Water Speed sensor. The calibration value, in
the range between -10% to +10%, will be applied to the water speed from
the transducer.
3.1.11.4 Calibrate Water Temperature
Allows the calibration on the Water Temperature sensor. Using the readings
from a precise temperature measuring device, insert here a positive/negative offset to display right value on Fish Finder screens.
[MENU] + "TRANSDUCER SETUP" + [ENTER]
Fig. 3.1.11 - Fish Finder Transducer menu
3.1.11.5 Calibrate Aux Temperature
Allows the calibration of the Aux Temperature sensor. Using the readings
from a precise temperature measuring device, insert here a positive/negative offset to display right value on FF screens.
3.1.12 Alarms
The Alarms menu allows you to define additional sonar alarm settings for Fish
Alarm, Shallow Alarm, Depth Alarm and Temperature Upper/Lower/Rate.
3.1.12.1 Shallow Water
Triggers an alarm when depth becomes shallower than the value set.
3.1.12.2 Depth Water
Triggers an alarm when depth becomes deeper than the value set.
22 User Manual
[MENU] + "ALARM" + [ENTER]
Fig. 3.1.12 - Fish Finder Alarms menu
Page 21

3.1.12.3 Temperature Upper
Triggers an alarm when the transducer reports a temperature (from TEMP 1
sensor) above the value set.
3.1.12.4 Temperature Lower
Triggers an alarm when the transducer reports a temperature (from TEMP 1
sensor) below the value set.
3.1.12.5 Temperature Rate
Triggers an alarm when the transducer reports a temperature (from TEMP 1
sensor) variation rate above the value set.
3.1.12.6 Fish Alarm
The options for Fish Alarm set the size of the fishes that, if detected by the
unit, switches an alarm to sound. These options are: Off, Small, Medium, Big
and Huge. The alarm sounds if the set size (or bigger) is detected.
3.1.13 Load Settings from User C-CARD
Load the complete settings from the User C-CARD and changes the active
menu settings.
Insert the User C-CARD into the slot, then follow the procedure:
[MENU] + "LOAD SETTINGS FROM USER C-CARD" + [ENTER]
3.1.14 Save Settings to User C-CARD
This is useful to avoid the user having to retune up Radar after a Clear RAM
operation or a software update.
Insert the User C-CARD into the slot, then follow the procedure:
[MENU] + "SAVE SETTINGS TO USER C-CARD" + [ENTER]
3.1.15 Restore Current Preset Defaults
This option restores the default values only for the current presets (see Par.
3.1.1, Preset Mode) and does not affect the other presets. Follow the procedure:
A confirmation window is shown. Select "YES" and press [ENTER] again.
[MENU] + "RESTORE CURRENT PRESET DEFAULTS" + [ENTER]
User Manual
23
Page 22

24 User Manual
Page 23

4. FISH PRO HD
+
This chapter provides instructions to assist in planning the installation of the
FISH PRO HD+.
4.1 TECHNICAL SPECIFICATIONS
♦ Display Colors : 16 colors on color chart plotter or 16
♦ Display Vertical Resolution : up to 400 pixels (depending on chart
♦ Power Requirements : 10 - 35 Volt dc
♦ Over Voltage protection
♦ Reverse Polarity protection
♦ Power Consumption - operating:17W max
♦ Power Consumption - stand by: 1.7W max
♦ Operating Frequency : Dual 50 and 200kHz
♦ Output Power : 600/1000W (4000/8000Wpp)
♦ Depth Range*
1KW /200 kHz : 2.5Ft (0.76m) to 1200Ft (366m)
1KW/50kHz :5Ft (1.52m) to 4000Ft (1219m)
600W/200kHz: 2.5Ft (0.76m) to 700Ft (213m)
600W/50kHz : 5Ft (1.52m) to 1500Ft (457m)
NOTE* This is not a guaranteed specification. The actual maximum depth capability
of the system depends on the type of transducer fitted, the reflectivity of the
bottom, water condition, etc.
♦ Status LED
♦ External Buzzer : 12VDC, 400mA
♦ Speed Sensor : if available on transducer
♦ Temperature Sensor :one channel TEMP1 (if available on
♦ NMEA Output sentences : Depth: $SDDPT, $SDDBT
♦ Operating temperature range: 0°C to +50°C
♦ Storage temperature range : -20°C to +70°C
♦ Weight : 1 kg (2,20 LBS)
♦ Water Proof Specification : IP 54
♦ Case Size :7.73" (196.4mm) x 6.5"(164.96mm)
gray levels on gray levels chart plotter
plotter screen resolution)
Max Typical = 980Ft (299m)
Max Typical = 2700Ft (823m)
Max Typical = 600 Ft (183m)
Max Typical = 1350 Ft (411m)
transducer), optional second channel TEMP2
Speed: $VWVHW
Trip Log: $VWVLW
Water Temperature: $YXMTW
TEMP2 Temperature: $YXXDR
x 1.96" (50mm)
When the package containing the FISH PRO HD+ is first opened, please check
it for the following contents (if any parts are missing contact the dealer the
FISH PRO HD+ was purchased from):
User Manual
25
Page 24
♦ FISH PRO HD
+
(with Power Serial and optional devices cables al-
ready connected)
♦ Fuse 5 Amp. + fuseholder
♦ User Manual
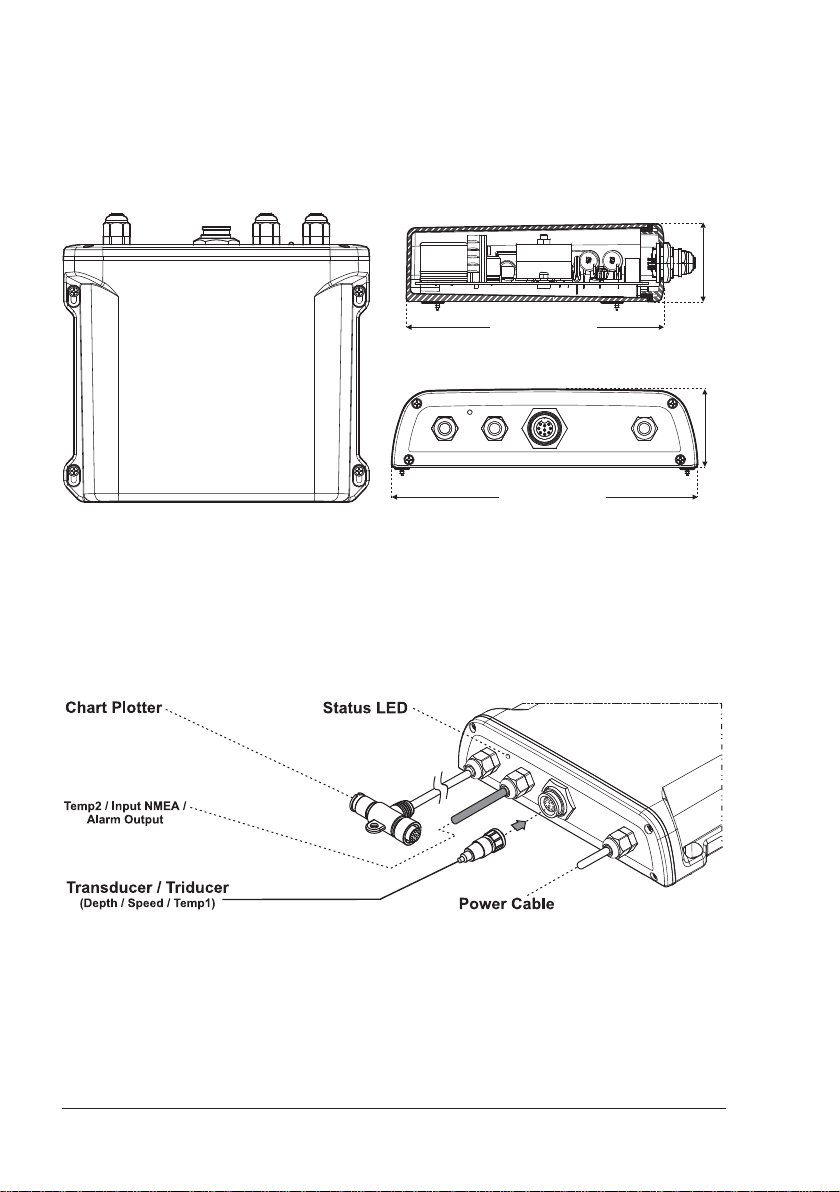
4.2 DIMENSIONS
164.96mm [6.5”]
196.4mm [7.73”]
Fig. 4.2 - FISH PRO HD+ Dimensions
4.3 MOUNTING THE FISH FINDER
The FISH PRO HD+ should be preferably mounted in a dry and well ventilated
location. Do not mount it where it will be submerged in liquids or exposed to
high temperature.
50mm [1.96”]
50mm [1.96”]
Fig. 4.3 - The FISH PRO HD
+
4.3.1 Installation
Picture showing actual example of the FISH PRO HD+ installation.
26 User Manual
Page 25
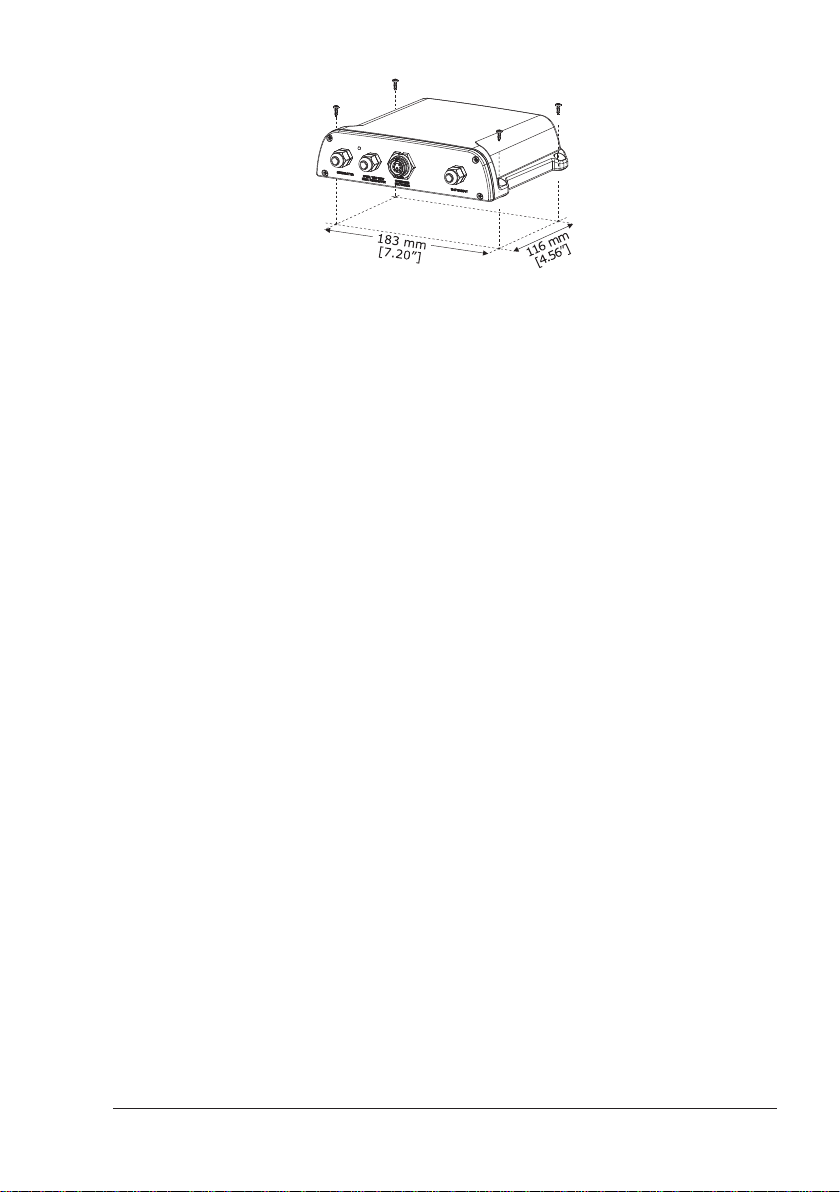
Fig. 4.3.1 - The FISH PRO HD+ Installation
♦ Fix the FISH PRO HD
+
to the mounting location using the four screws
(holes diameter 4 mm), see Fig. 4.3.1.
♦ Route the CHART PLOTTER cable to the chart plotter.
♦ Mount the transducer according to the instructions provided with it.
♦ Connect the POWER cable to the battery. Please be advised that the
FISH PRO HD+ when not operating will remain in Stand-By mode.
4.3.2 Installing Optional Devices
See the External Connection diagram.
4.4 STATUS LED
There are seven different LED behaviors, representing seven different diagnostic conditions. These are described below.
♦ OFF
The FISH PRO HD+ is not powered or maintenance/update routines
are running.
♦♦
♦ ON, CONTINUOUSLY
♦♦
There is not communication with the chart plotter, and no transducer is connected.
♦♦
♦ 1 long flash every 2 seconds
♦♦
A transducer is connected properly, but there is no communication
with the chart plotter.
♦♦
♦ 2 short flashes every 2 seconds or 1 short flash every 2
♦♦
seconds
The FISH PRO HD+ and the transducer are operating properly. This
is the normal behavior when everything is working.
♦♦
♦ 3 short flashes every 2 seconds
♦♦
The FISH PRO HD+ has detected a transducer without transducer ID.
On the chart plotter a warning window is shown, select "IGNORE" and
press [ENTER]: the FISH PRO HD+ is working at low power.
♦♦
♦ 4 short flashes every 2 seconds
♦♦
The FISH PRO HD+ has detected a transducer without transducer ID.
On the chart plotter a warning window is shown, select "CANCEL" and
press [ENTER]: the FISH PRO HD+ is not sending any signal.
User Manual
27
Page 26
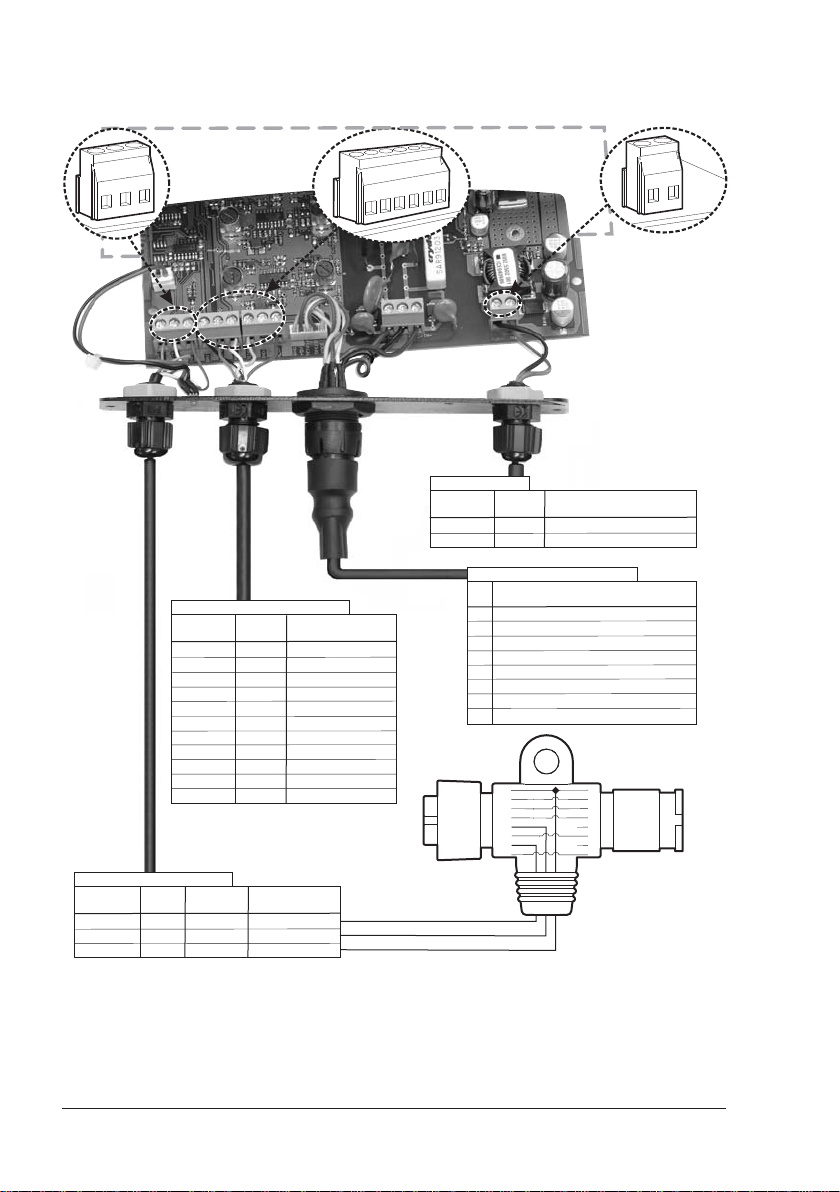
4.5 EXTERNAL CONNECTIONS
C
B
A
OPTIONAL DEVICES Cable
Terminal
strip
F
G
H
I
L
M
CHART PLOTTER Cable
Terminal
strip
A
B
C
Cable
color
Brown
Gray
Black
Function
FF TX+
FF RX+
FF GND
Cable
Function
color
Black
GND
Green
NMEA B(-)
White
NMEA A(+)
Yellow
TEMP 2(+)
Black
GND
Blue
ALARM Output(+)
Red
Not connected
Gray
Not connected
Brown
Not connected
Orange
Not connected
Pink
Not connected
Chart Plotter
Function
Input2+
Output2+
GND
G
F
M
L
I
H
POWER Cable
Terminal
Female 8 Pin
Chart Plotter
Cable
strip
D
E
Function
color
GND
Black
Power supply 10-35 VDC
Red
TRANSDUCER Connector
Function
Pin
DEPTH +
1
GND
2
TEMP1 +
3
POWER SUPPLY+5Vdc, 1Amax
4
SENSE +
5
DEPTH SHIELD
6
DEPTH -
7
SPEED +
8
1
2
3
4
5
6
7
8
1
2
3
4
5
X
6
7
X
8
Power &
I/O cable
Chart Plotter
E
D
Male 8 Pin
of
Fig. 4.5 - FISH PRO HD+ External Wiring
28 User Manual
Page 27
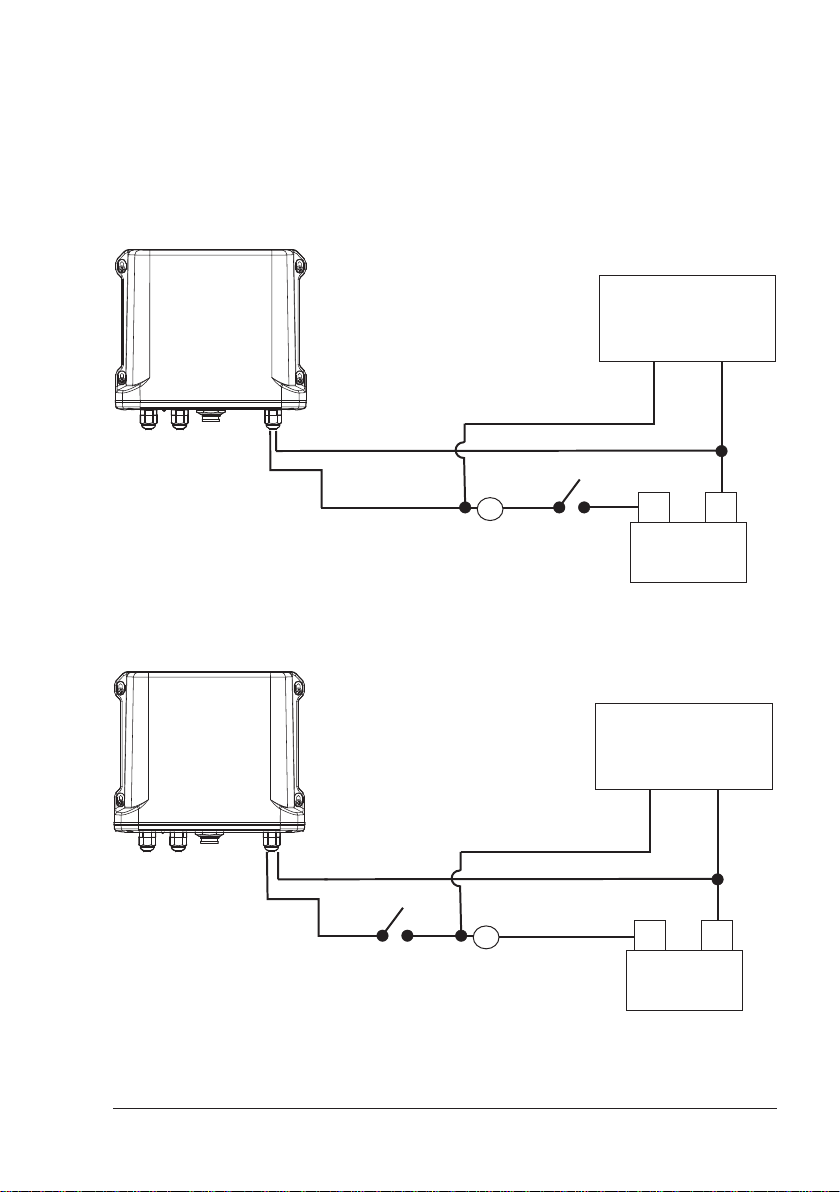
4.6 POWER SUPPLY WIRING DIAGRAM
We recommended the installation of a switch and a (5A) fuse in the positive
DC supply to the FISH PRO HD+. The FISH PRO HD+ is active sending the
digital depth through the NMEA interface even when the power (chart plotter)
is turned off, thus the need for a switch.
In the example below you will notice the positive DC power connection is run
through a switch and a fuse before connecting it to the FISH PRO HD+ and the
chart plotter.
Chart Plotter
-
+
Fuse
F
Fig.4.6 - The FISH PRO HD+ and the chart plotter could be turned Off
-
+
Fuse
Switch
F
Switch
+
Chart Plotter
+
+
12V DC
Battery
+
12V DC
Battery
-
-
-
-
Fig.4.6a - The FISH PRO HD+ could be turned Off without turning Off the chart plotter
User Manual
29
Page 28
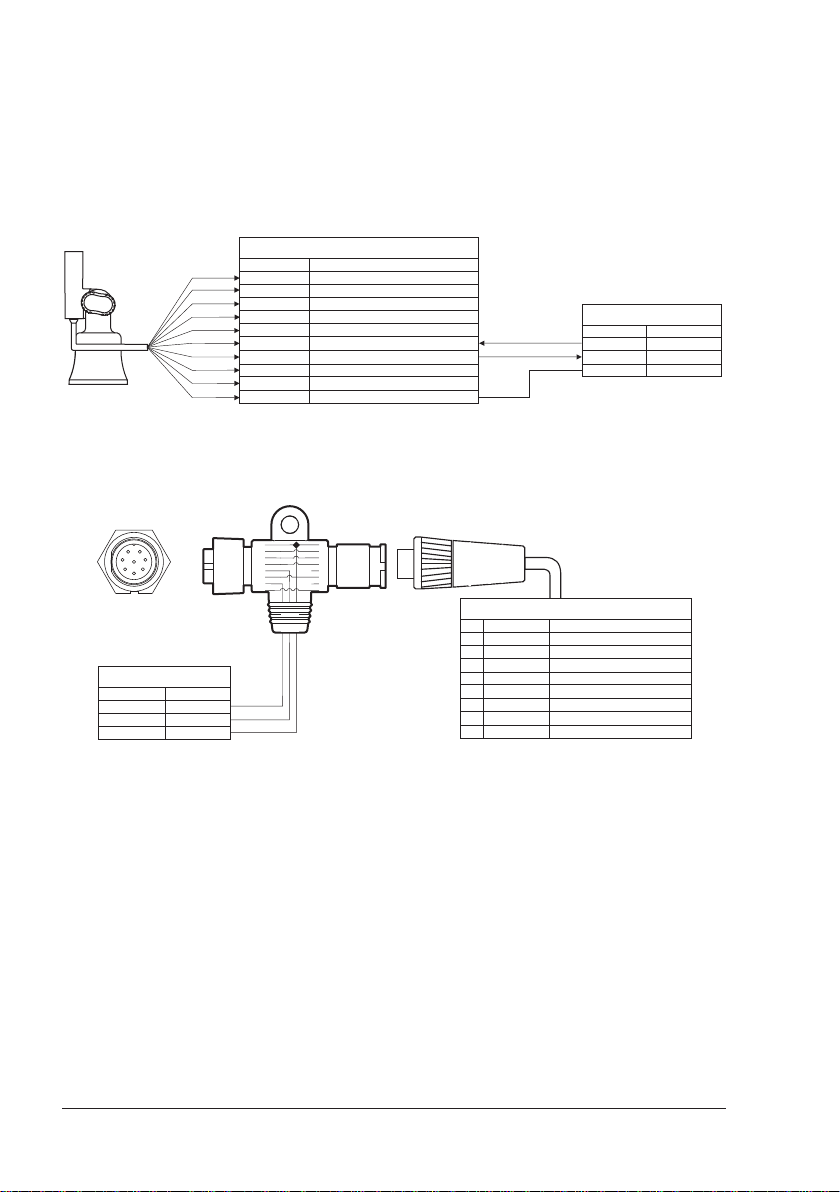
4.7 SUGGESTED PLOTTER CONNECTIONS
The following are suggested "Fish Finder - chart plotter" connections.
NOTE On the chart plotter with software "S3" the Port 1 is optoisolated, so the Pin
If the chart plotter has a quick disconnect bracket (see the chart plotter User
Manual) see the following picture to make the connection to the chart plotter:
If the chart plotter has a 8 pin Power & I/O connector see the following picture:
4 - Green is the Input 1- and it is not the GND COMMON for the Port 2. The
described connections are valid too.
QUICK DISCONNECT BRACKET CABLE
WIRE COLOR
RED
BLACK
WHITE
GREEN
YELLOW
BROWN
GRAY
ORANGE
PINK
BLU
FUNCTION
+10-35 Vdc
GND/COMMON
INPUT 1+
GND
OUTPUT 1+
INPUT 2+
OUTPUT 2+
INPUT 3+
OUTPUT 3+
GND
BBFF PLOTTER CABLE
WIRE COLOR
BROWN
GRAY
BLACK
Fig.4.7 - Connection to the Fish Finder for chart plotter with quick disconnect bracket
1
POWER & I/O
BBFF Plotter Cable
CABLE COLOR
BROWN
GRAY
BLACK
FUNCTION
FF TX+
FF RX+
FF GND
8 Pin
Female
Chart Plotter
1
2
2
3
3
4
4
5
5
X
6
6
7
7
X
8
8
Power &
I/O cable
of
Chart Plotter
Male 8 Pin
POWER & I/O CONNECTOR
PIN
WIRE COLOR
1
BLACK
2
RED
3
WHITE
4
GREEN
5
GREY
6
YELLOW
7
BROWN
8
BLUE
FUNCTION
GND/COMMON
PWR+ (10-35 Vdc)
INPUT 1+
COMMON
OUTPUT 2+
OUTPUT 1+
INPUT 2+
OUTPUT EXTERNAL ALARM+
FUNCTION
BBFF TX+
BBFF RX+
BBFF GND
Fig.4.7a - Connection to the Fish Finder for chart plotter with 8 pin Power & I/O connector
30 User Manual
Page 29
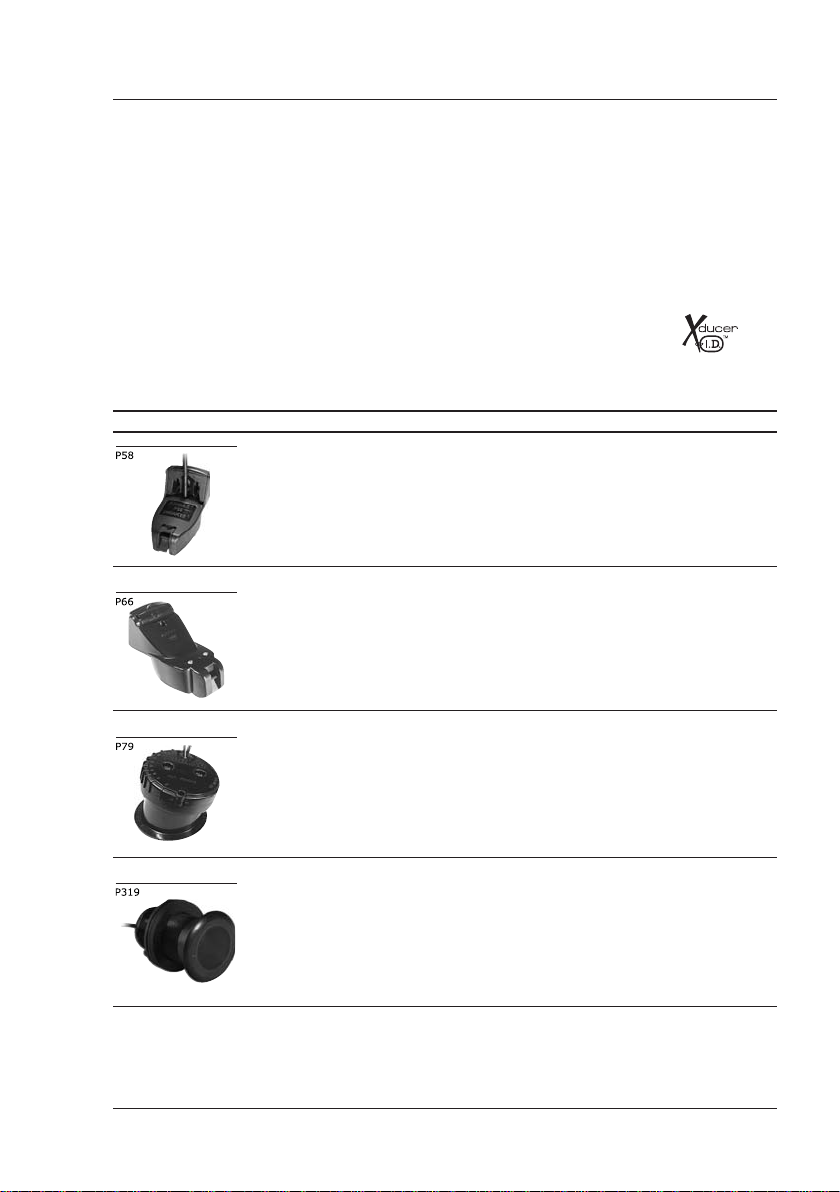
5. Transducers
The transducer is a device that transmits and receives sound waves into the
water. The active component inside the transducer is commonly referred to
as an element but actually is a piezoelectric ceramic material.
Please refer to installing instructions of the transducer manufacturer.
NOTE In the following tables, related to the transducer functions in the "Funct."
5.1 DEDICATED AVAILABLE TRANSDUCERS
column, these abbreviations are used: D = Depth, S = Speed and T = Temperature.
5.1.1 FISH PRO HD
AIRMAR # Model Designation Housing Mount Funct. Power
31-492-1-01 P58 Transom Mount Plastic Transom D/S/T 600W
31-680-1-01 P66 Hi Performance Plastic Transom D/S/T 600W
31-494-2-01 P79 Plastic Plastic In-hull D 600W
+
User Manual
31-495-2-01 P319 Plastic Plastic Thru-hull D 600W
31
Page 30
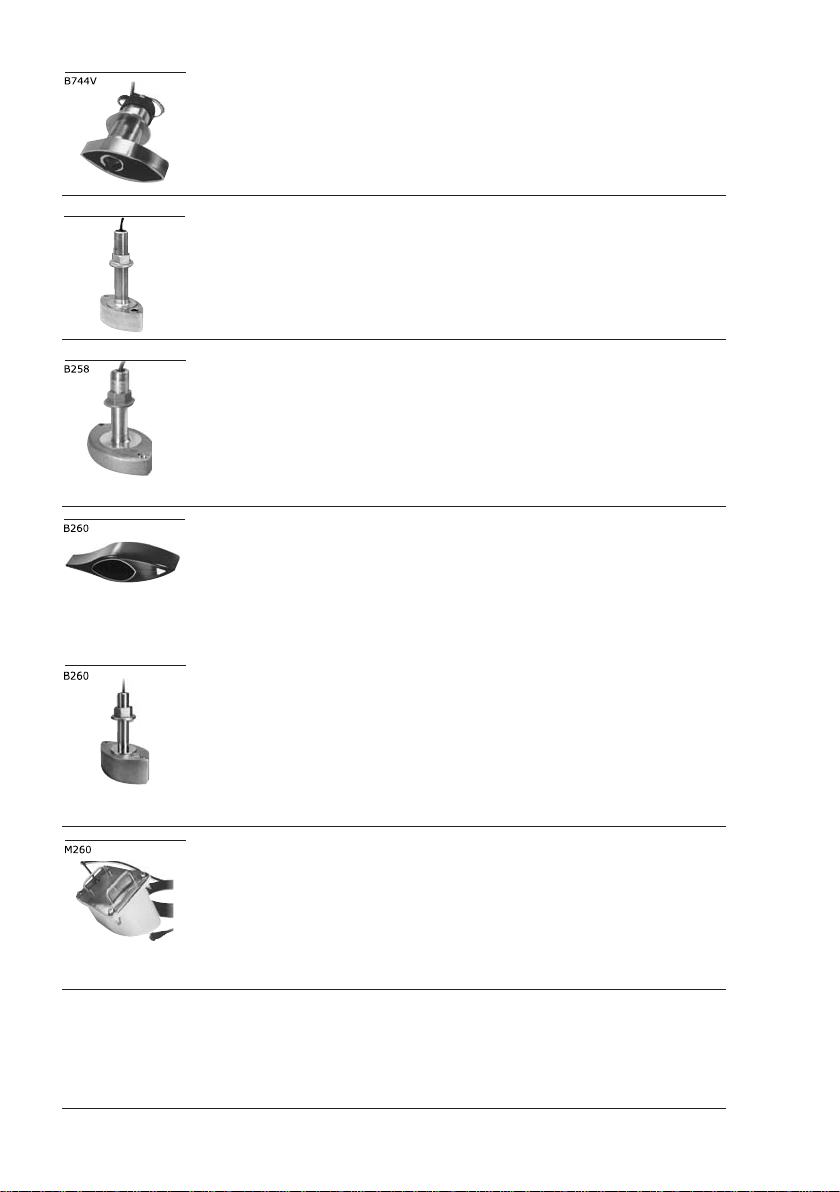
B45
31-658-2-02 B744V W/ Hi Performance Fairing Bronze Thru-hull D/S/T 600W
31-696-1-01 B45 W/ Hi Performance Fairing Bronze Thru-hull D/T 600W
41-191-1-01 B258 W/ Hi Performance Fairing Bronze Thru-hull D/T
1000W
41-226-2-01 B260 W/ Hi Performance Fairing Bronze Thru-hull D/T
1000W
41-225-2-01 M260 W/ In-Hull Tank Kit Urethane In Hull D
1000W
32 User Manual
Page 31
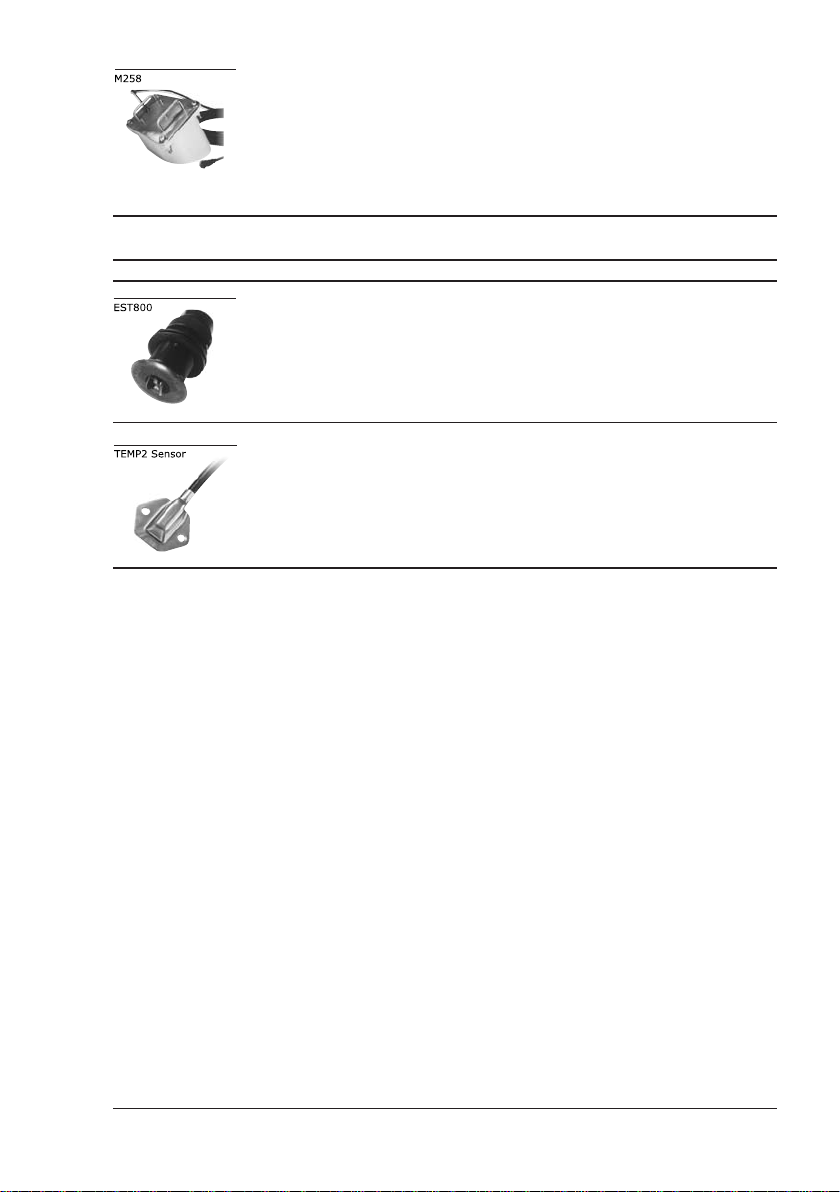
41-192-1-01 M258 W/ Transom Bracket Urethane Transom D
1000W
5.1.2 Optional Devices for FISH PRO HD
AIRMAR # Model Designation Housing Mount Funct. Power
35-005-2-01 EST800 Speed/Temp Sensor Plastic Thru-hull S/T N/A
31-039-9-01 TEMP2 Sensor, Transom Mounted Stainless Surface T N/A
NOTE Please contact your local dealer for more information on transducers.
+
User Manual
33
Page 32

34 User Manual
Page 33
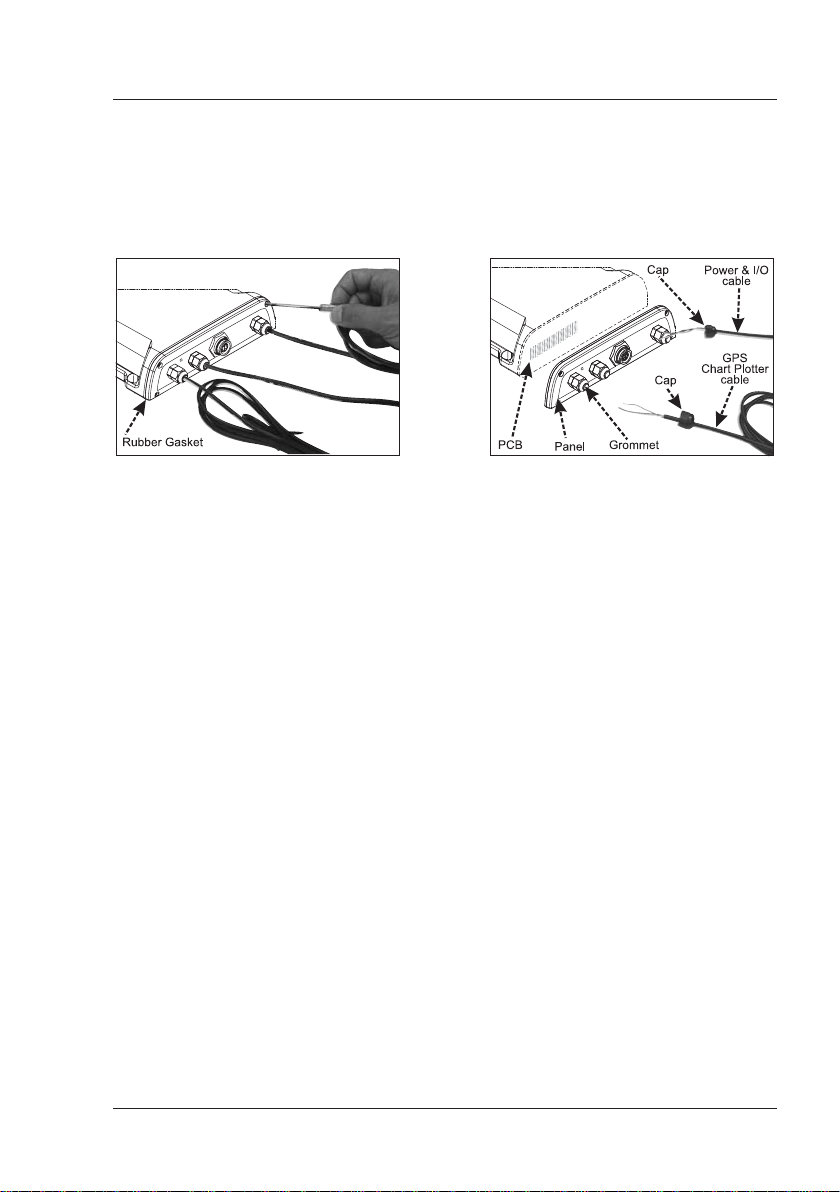
6. Frequently Asked Questions
6.1 How can I disconnect the cables from the FISH PRO HD
in case I need to do so for the installation?
♦ Open the FISH PRO HD
following figure).
♦ Once the screws are removed, pull out the panel and the Printed
Circuit Board (PCB). Unscrew the cables from the PCB.
♦ Wire the cables as needed.
♦ Reconnect the cables to the PCB (see the Fig. 4.5 for reference).
♦ Push the panel towards the case (be sure to have well positioned
the rubber gasket). Close the FISH PRO HD+ box screwing the four
screws.
+
box unscrewing the four screws (see the
Fig. 6.1 - The FISH PRO HD
+
6.2 How can I set optimal operating parameters.
Optimal operating parameters can be set accordingly with the intended use of
the Fish Finder, anyway to quickly get optimal operational parameters for
fishing it is possible to select the FISH preset from the Fish Finder Setup
menu, while for cruising it is possible to select the CRUISE preset.
+
6.3 What are preset modes?
Preset modes are pre-defined settings of the Fish Finder operating parameters. You can use them to quickly set the Fish Finder in the most commonly
used operating modes. These are:
♦ CRUISE: sets the Fish Finder in full auto mode with the sensitivity
settings (GAIN OFFSET, NOISE level and STC) optimized for displaying at best the bottom.
♦ FISH: sets the Fish Finder in full auto mode with the sensitivity set-
ting optimized for target searching.
6.4 How can I restore the Fish Finder default operating
parameters?
Simply select the CRUISE or the FISH preset. This will restore optimal operating parameters for either cruising or fishing.
User Manual
35
Page 34

6.5 Can I always leave the Fish Finder in Full Auto/(auto
gain and auto range) mode?
Yes, but note that the full auto mode suits the 90% of the cases, however in
extreme situations the auto modes mail fail and thus it is necessary to switch
to the Manual mode.
6.6 What are extreme situations in which auto modes may
fail?
When the bottom is very deep, at high boat speed, when the bottom is very
shallow (< 5 feet), when the water is full of materials in suspension, with bad
sea conditions.
6.7 What should I do if the auto modes fail?
Failure of auto modes can happen for various reasons. Hereafter you can find
a range of possibilities.
6.8 Auto-range fails in very shallow waters displaying a
digital depth readout deeper than the actual value.
What should I do?
This usually happens if the STC is set to LONG or MID and the bottom is
shallow or SHORT if the bottom is very shallow causing the auto-range to
hook to the second or third echo from the bottom (since in shallow waters the
sound bounces more times back and forth the surface to the bottom). Try
decreasing the STC value to SHORT in shallow waters or to switch it to VERY
SHORT or OFF.
6.9 Auto range fails, and the digital depth readout displays
a very shallow reading. What should I do?
This usually happens if the STC is off or is set to a low value causing disturbs
from surface clutter to be stronger than bottom echoes. Try increasing the
STC value. As general rule STC has to be set as in shallow waters and LONG
in depth waters.
6.10 Auto-range fails in very deep waters displaying a digital
very shallow depth readout. What should I do?
The Fish Finder capability to detect the bottom decreases as the bottom depth
increase. If the bottom composition is soft as mud, if the sea conditions are
bad, if there are thermoclines or the water is full of materials in suspension it
can further decrease thus causing the digital depth readout to fail. When this
happens the auto-range algorithm also fails. To recover from this situation it
is necessary to switch to manual range mode and to set the manual depth
mode. When manual depth mode is selected the algorithm that calculates the
digital depth readout searches for the bottom within the range manually selected by the user. At this point it is necessary to increase manually the range
until the bottom becomes graphically visible. If the echoes from the bottom
are strong enough, the Fish Finder shall look to the bottom giving a correct
depth reading and shall be possible to return in auto range mode. Please note
that if one or more of the conditions that reduce the echoes from the bottom
listed above is true the bottom may be not visible at all, in this situation a
36 User Manual
Page 35

strong thermocline or surface clutter may be interpreted by the Fish Finder as
the bottom.
6.11 At a very shallow range upper half of the screen appears
almost completely filled by the surface clutter. How can
I eliminate it?
This is normal in shallow waters. To clean up the surface clutter without degrading the digital depth readout algorithm functionality there are two modes:
1) if Surface Declutter = OFF, it is possible to set the STC value to custom
setting the STC length to the same size of the surface clutter, and increasing
the STC strength until the image on the screen cleans up. Please note that in
very shallow waters it is usually better to switch to manual gain mode to
reduce gain fluctuation due to rapidly changing bottom conditions. 2) Using
Surface Declutter, increase the SD value until the surface declutter disappears completely.
6.12 Why do I never see fishes in the range between 0 to 0.7
meters?
The minimum range of the Fish Finder is 0.7 meters. In this interval the Fish
Finder can detect neither the bottom nor any target.
6.13 How can I reduce the surface clutter?
You can act by: properly setting the STC as described at 6.11 and also by
increasing the NOISE LEVEL and reducing the GAIN or the GAIN OFFSET (if
you are in auto gain mode). However please note that a strong attenuation of
surface clutter may also reduce the capability to detect targets.
6.14 The Fish Finder is in auto gain mode but the picture
display too many small targets, what shall I do to
reduce the screen clutter?
Try increasing the NOISE LEVEL or decreasing the GAIN OFFSET.
6.15 In very shallow waters when the AUTO GAIN mode is
selected there are fluctuations in the bottom profile
width and its color representation. What should I do?
In very shallow waters the environment situation (bottom/water condition)
vary very quickly thus causing the auto gain algorithm to create oscillations
while trying to set optimal GAIN value for each situation. To avoid this it is
advisable to switch to MANUAL GAIN mode and fine tune the GAIN to a fixed
setting.
6.16 In very deep waters even setting the GAIN to its maximum value I cannot see the bottom what shall I do?
Try decreasing the NOISE LEVEL. If still the bottom is not visible there is
nothing you can do, the bottom echo is simply too weak to be detected.
User Manual
37
Page 36

38 User Manual
Page 37

Analytical Index
50/200kHz Full Display .............................. 14
A
A-Scope ............................................... 9, 12
Alarm ..................................... 10, 12, 22, 23
Alarm Bar ................................................. 12
B
Bottom Echo Profile ................................... 13
Bottom Lock ............................................... 9
C
C-CARD ................................................... 23
Calibrate Aux Temperature ......................... 22
Case Size ................................................. 25
Chart/Fish Display ..................................... 14
CLEAR key ............................................... 14
Color Bar ................................................. 11
Colors...................................................... 25
connection ............................................... 30
Cursor key ......................................... 14, 15
D
Depth ................................................ 20, 22
Depth Alarm ............................................. 10
Depth Range ............................................ 25
Depth ruler ............................................... 12
Digital Depth ............................................ 12
Dimensions ........................................ 26, 35
Display Colors........................................... 25
Display Setup ........................................... 21
E
Echogram ................................................ 11
ENTER key ............................................... 14
F
Features .................................................... 9
Fish Finder port......................................... 10
Fish Finder Setup menu ............................. 19
Fishes...................................................... 12
focus ....................................................... 17
Frequency .......................................... 12, 21
Full Display .............................................. 14
G
Gain ........................................................ 20
Gain Mode ............................................... 19
I
Image Speed ............................................ 25
Input Format ............................................ 25
Installation .................................... 25, 31, 35
Interference Rejection ........................... 9, 20
K
Keel Offset ............................................... 22
L
Load Settings from User C-CARD ................. 23
M
MENU key .......................................... 14, 16
Mounting ................................................. 26
N
Noise Filter ......................................... 10, 35
O
Operating Frequency ........................... 12, 25
Output Power ........................................... 25
P
Power Connection ..................................... 29
Power Consumption .................................. 25
Power Requirements ................................. 25
Preset Mode ....................................... 19, 21
R
Range Mode ............................ 19, 20, 21, 22
Resolution ................................................ 25
S
Save Settings to User C-CARD .................... 23
Scrolling Speed ......................................... 21
Sensitivity menu ................................. 14, 20
Sensitivity Time Constant ........................... 20
Shallow Alarm........................................... 10
Shallow Water .................................... 22, 23
Shift ........................................................ 20
STC............................................... 9, 20, 21
STC Length .............................................. 20
STC Strengh ............................................. 21
Structure .................................................. 13
Surface Clutter.......................................... 13
Surface Noise Filter ................................... 21
T
temperature ............................................. 25
Temperature Lower ................................... 10
Temperature Rate ..................................... 23
Temperature Upper ............................. 10, 23
Thermoclines ............................................ 13
transducer ...................................... 9, 22, 31
Transducer Setup ...................................... 22
U
User C-CARD ............................................ 23
V
Variable Depth Marker ......................... 12, 14
VDM .................................................. 12, 14
Vertical Resolution ..................................... 25
W
Warning Message ...................................... 11
Water Temperature ............................. 12, 21
Weight .................................................... 25
White Line ...................................... 9, 13, 21
Z
Zoom ...................................................... 12
Zoom Bar ................................................. 12
Zoom Full Display ..................................... 14
ZOOM IN/OUT keys ............................. 15, 16
User Manual
39
 Loading...