

Page 1
O R E NZ
OPERATING MANUAL
Page 2
O R E NZ
2
Declaration of conformity /
EMC directive
The following metal detector
LORENZ DEEPMAX Z1
Correspond to the following EC requirements:
EC-EMC-directive version 89/336/EEC
The LORENZ DEEPMAX Z1 series are found to meet the
specification requirements detailed, when tested to the
customers/ specification requirements.
Compatible norms are in particular
Test Specifications & Categories
Emissions EN55022:2006
Immunity EN61000-6-1:2007
FCC Part 15.107/15.109, RSS 210
Refer to certificate of testing No: F 132633 E1
If any changes are made to the above mentioned appliances without
consulting Lorenz Detecting Systems GmbH & Co. KG this declaration becomes invalid.
Date: 18. 07.2013 Signed: ___________________________________
Lorenz Detecting Systems GmbH & Co. KG
General Management
Lorenz Detecting Systems GmbH & Co. KG · Röpkestr. 12 · 30173 Hannover · Germany
Page 3
O R E NZ
Introduction
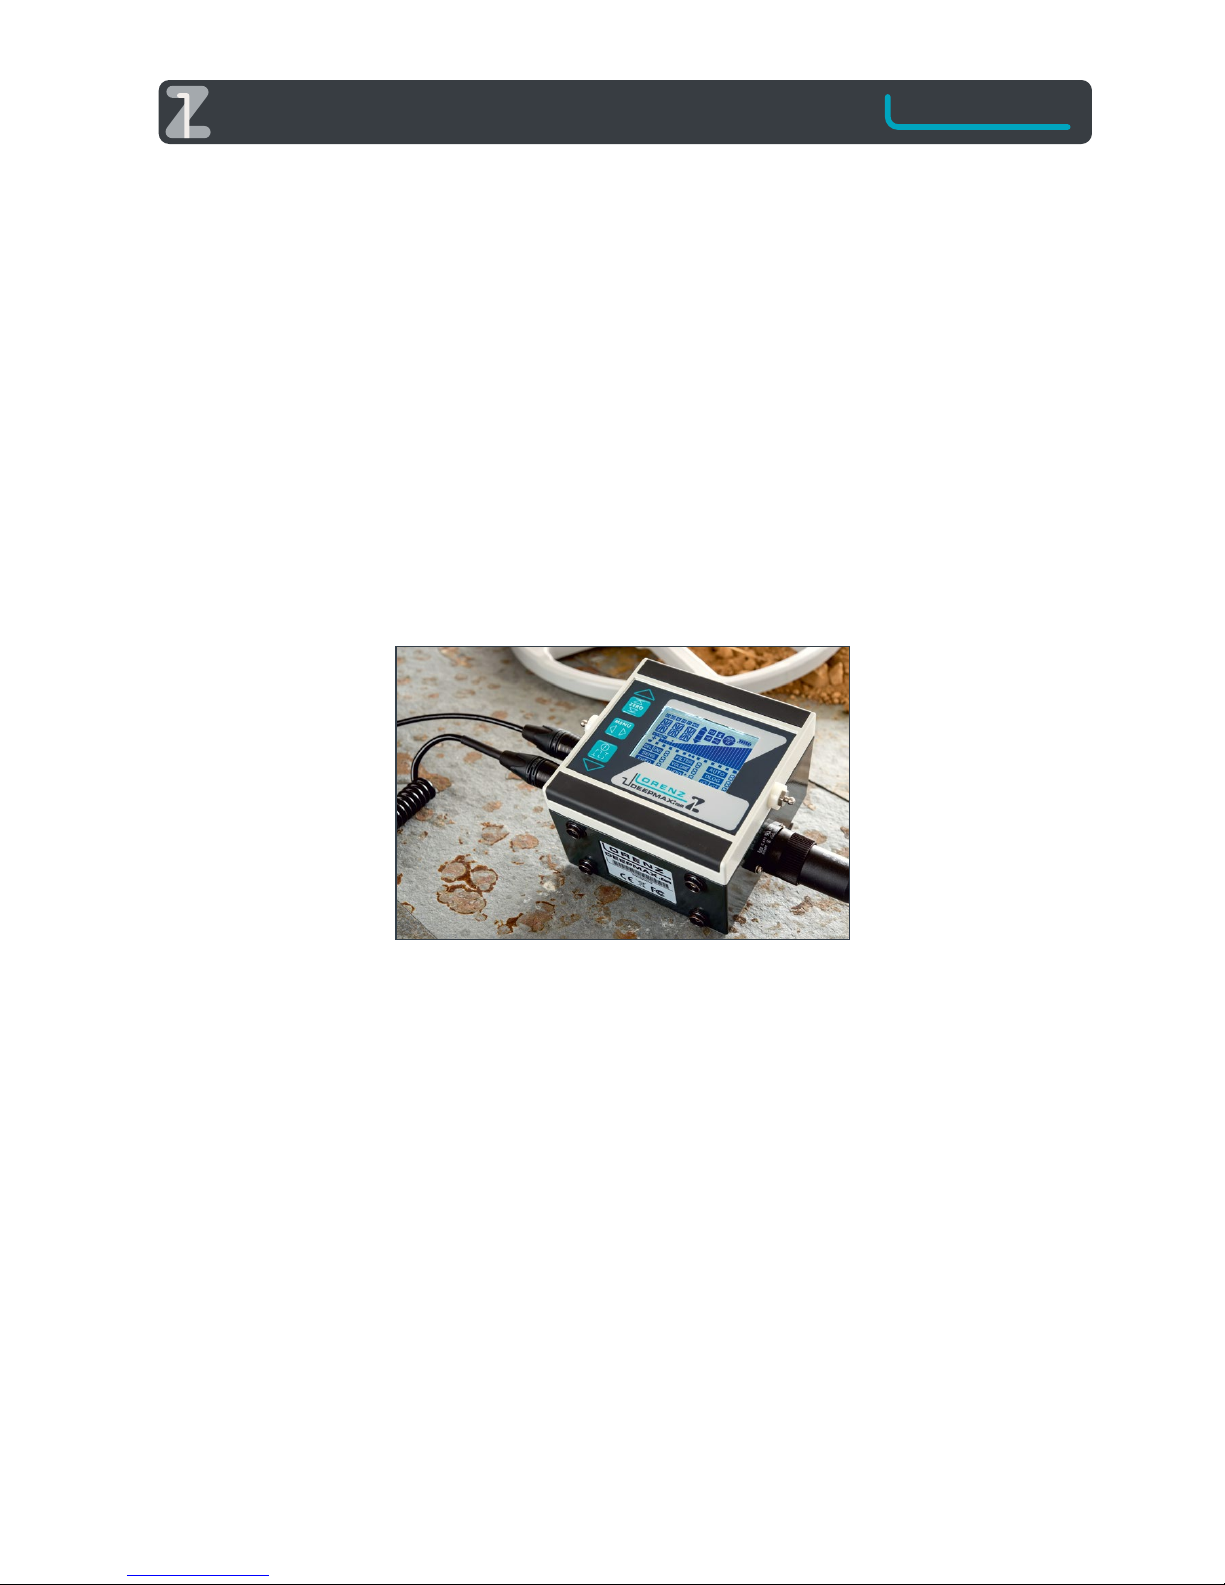
The LORENZ DEEPMAX Z1 series detectors are some of the
newest developments in the field of Pulse GBS metal
detectors. It is probably one of the most sensitive and stable
metal detecting devices of its kind presently available. The
LORENZ DEEPMAX Z1 is the result of many years of research
and development. A lot of efforts have been put into
making this new product and especially in the new improved metal classifications and automatic ground balancing
facilities.
The Pulse GBS (Pulse Ground Balancing System) is especially
suitable for searching at depth. The performance of this
electronic device is almost unaffected by salt water, most
types of mineralized grounds or temperature changes.
Specially designed electronics cancel out signals from the
ground while offering stable signals from the metal objects.
The DEEPMAX Z1 is therefore a reliable tool to locate at
great depths even under the worst environmental conditions. A new improved circuit design suppresses interference from power lines and a power pulse technique produces
very accurate signals to
obtain very high detection
depths.
The LORENZ DEEPMAX Z1 is a
high quality specialist
Detector and it is designed to
be used with both, small or
large coils. Large coils offer
extreme depth capabilities for
big metal objects because of
the strong and deep going
magnetic field produced.
Small coils are preferably used
while searching for small
objects like single coins or
gold nuggets.
This model offers a great range on non-ferrous metal
objects in general. A very simple operation is guaranteed by
a specially developed LC Display and a minimum amount of
controls. At the same time this detector model offers a
number of features which are new for a pulse metal
detector. Quality electronics and very special designed
electronic - circuitry produce benefits in terms of ease of
use as well as sensitivity.
The DEEPMAX metal detectors are often recognized as
representing some of the highest quality and newest
developments in professional metal detecting equipment.
We as a manufacturing company always try to keep the
highest standard on our products, therefore alternations of
the design, specifications as well as the availability subject
to change without notice.
1. Safety information
For reasons of safety it is advisable to read this operating
Introduction manual first before turning the LORENZ
DEEPMAX Z1 on. Special attention should be paid to the
following notes.
Check out, if the fast charger supplied with the DEEPMAX Z1
fits with the AC mains of your country. See chapter 12 for
more detailed information. The supplied recharger will work
at AC voltages of 90-264 VAC.
Damaged connecting cables or search coils should no
longer be used, because of possible electrical shock.
To avoid short circuits, wrong polarity or electrical shock, only
spare parts and accessories offered by the manufacturer of
the LORENZ DEEPMAX Z1 should be used. When headphones are in use please reduce volume to protect your ears.
When digging for metal objects war material could also be
found. Precautions should be taken in advance especially
when big objects have been located.
Special kinds of mines could be triggered by the strong DC
magnetic field produced by the search coil. Persons with
implanted pacemaker or other sensitive device should not
approach to the field of the search coil. Please understand
that we as the manufacturer of the LORENZ DEEPMAX Z1
cannot be made liable for any
kind of damage caused by or in
conjunction with our products.
Design and specifications
subject to change without
notice!
2. Function
The LORENZ DEEPMAX Z1 is
based on the non- motion;
Pulse GBS (Pulse Ground
Balancing System). Short and
intensive magnetic pulses are emitted by means of a search
coil first. Those magnetic pulses produce eddy currents in
conducting materials like metal objects for example. Said
eddy currents will be kept in a metal object and will die away
after the magnetic pulse emitted by the search coil has
turned off. This is the reason why it is possible to detect those
eddy currents during the time delayed receiving phase by
means of the same search coil which now acts as a receiving
coil. A rather complicated electronic circuitry is necessary to
detect those tiny voltage changes and has to separate that
particular signal from interference also received. The signal
has to be amplified to drive an audio stage with voltage
controlled oscillator (VCO), which emits an audible signal
either by headphones or built-in loudspeaker when a metal
is in the near of the field of the search coil.
Eddy currents produced in a metal object by means of a
pulsed primary field, will die away differently depending on
the conductivity of the metal object. The classification circuit
therefore gives a visual time delay reading for the eddy
currents received over a certain period of time. In addition a
ferrous/ non- ferrous indication for a metal being detected is
working when a double D coil is in use. This gives further
information on the probable kind of metal being located as
well as the audio sound emitted, which makes it easy to
predetermine the exact place and the size of the buried
metal object.
3
Page 4

2.1 Advantages
The Pulse GBS principle has got the advantage of using
large diameter coils and high transmitting power. This is
especially necessary when searching at depth. Frame
mounted cable coils of different size and shape can be
connected to the LORENZ DEEPMAX Z1 without any
adjustments.
A special adaptation circuit has been added to the Detector
to suit with different coil systems automatically. This ensures
extreme depth capabilities with any coil connected. When
enlarging the search coil diameter the sensitivity to bigger
objects will also rise. At the same time smaller objects will
be located less sensitive. This is particularly desirable when
locating large objects while ignoring small bits. Large coils
offer very high detection ranges. Even in difficult soils
where magnetic iron oxides are present the LORENZ
DEEPMAX Z1 will offer extreme depth capabilities for both
ferrous and non-ferrous metal objects when the Ground
Balancing System is in use. Other systems often suffer from
ground effects which reduce the depth range in the
ground. The LORENZ DEEPMAX Z1 will be able to locate
objects at almost the same depths either in most types of
ground or »in air tests«. The high sensitivity of the DEEPMAX
Z1 to non- ferrous metal objects like gold, silver and copper
together with the new metal analysis make this detector an
outstanding device for many different locating purposes.
The DEEPMAX Z1 gives a visual indication on the LC Display
for every metal being located. This time delay reading
producing a number between 000 and 099 helps to classify
metal objects. The metal classification circuitry is only in
some cases affected by the size of a metal object and
therefore identifies small coins as well as large pieces of
metal. The LORENZ DEEPMAX Z1 also offers a sophisticated
and refined ferrous / non- ferrous metal analysis which
works more stable on difficult soils in conjunction with the
26cm or 35cm double D search coil. The Detector also emits
an audible sound by way of either a speaker or headphones. Detection depths achieved (in air tests) are almost
the same in many types of soils and therefore considerably
higher than those possible with standard pulse induction or
sine wave VLF - TR Detectors.
The DEEPMAX Z1 was developed to provide a number of
features including high sensitivity and stability together
with easy operation. The amount of controls was therefore
reduced and a calibration of the detector to our factory
settings was also made to guarantee best results in the
field:
• Highly sensitive to all kinds of metal
• Stable operation on mineralized ground or salt water with
Pulse Ground Balancing System
• Reliable / simple operation with few controls and
customized LC Display
• Exact pinpointing with large coils
• Very easy and effective detection of large areas
• Rugged, refined mechanical construction with water
and dust protected electronics unit
• A variety of search coils are available for different
detection purposes
• Automatic adaptation of different coil sizes and coil
designs to the electronics
• Small unwanted metal objects can either be identified or
eliminated
• Fast audio response speed with different audio settings
• Logarithmic audio response and intensity bar graph
reading for easy pinpointing
• Battery check with audio alarm tone
• Calibrated static (non-motion) metal classification with
visual conductivity/ time delay reading
• Improved ferrous/ non-ferrous identification
• Precisely adjustable audio-threshold
• Stable static response (acoustical and visual)
• Waterproof search coils
• Interchangeable rechargeable NIMH Battery pack for
worldwide operation, declared as dry cells!
• Fast charge electronics for worldwide operation
90-265 V AC/50-60 Hz
• Car charger for 10-30V DC supplies available as accessory
• Frequency and Filter function for low frequency
EMI interference elimination
• Automatic ground calibration retuning facility
• Different Delay and Sensitivity settings to eliminate small
objects or for easy pinpointing
• Extreme detection depths for very large metal objects
• Specialized on gold and improved detection range on
low conducting metal pieces
• Low frequency interference elimination circuitry for
less interference in urban areas.
• High dynamic range for extreme ground signals and
easy pinpointing
• Optimal performance for the detection of small objects
like coins or other non-ferrous objects
• Single or dual, induction balanced or differential
coil designs can be used
• Multi sensor trigger detection (MST) with several search
coils working at the same time without interfering each
other. Please ask for details.
• Easy to use data logger function works with additional
Hard- and Software kit to generate six 2D image and six
3D surface maps from the scans being taken. Each map is
different depending on the electronic analysis method
and therefore can be the key to the probable kind of
metal buried in the ground.
• GPS based Meter and Compass Heading
information, makes it easy to work with the data logger.
• New search system circuitry with all new functions.
• Signal strength bar graph, time delay reading, ferrous/
non-ferrous icons, battery condition and all the mode
settings are displayed simultaneously on a large LC
Display.
2.2 Applications
The LORENZ DEEPMA Z1 was developed for professional
search and locating applications.
A variety of search coils can be connected to this metal
detector. Large areas can be detected effectively especially
with frame coils. Saltwater, most types of ground or
temperature changes will only slightly affect the detection
range of the DEEPMAX Z1. It is possible to eliminate some
unwanted objects like nails and foils or to identify them as
being small unwanted objects while searching for bigger
and deeper objects. In conjunction with small coils the
DEEPMAX Z1 is a great tool when searching for small objects
deep in the ground.
O R E NZ
4
Page 5
O R E NZ
3. Z1 instructions
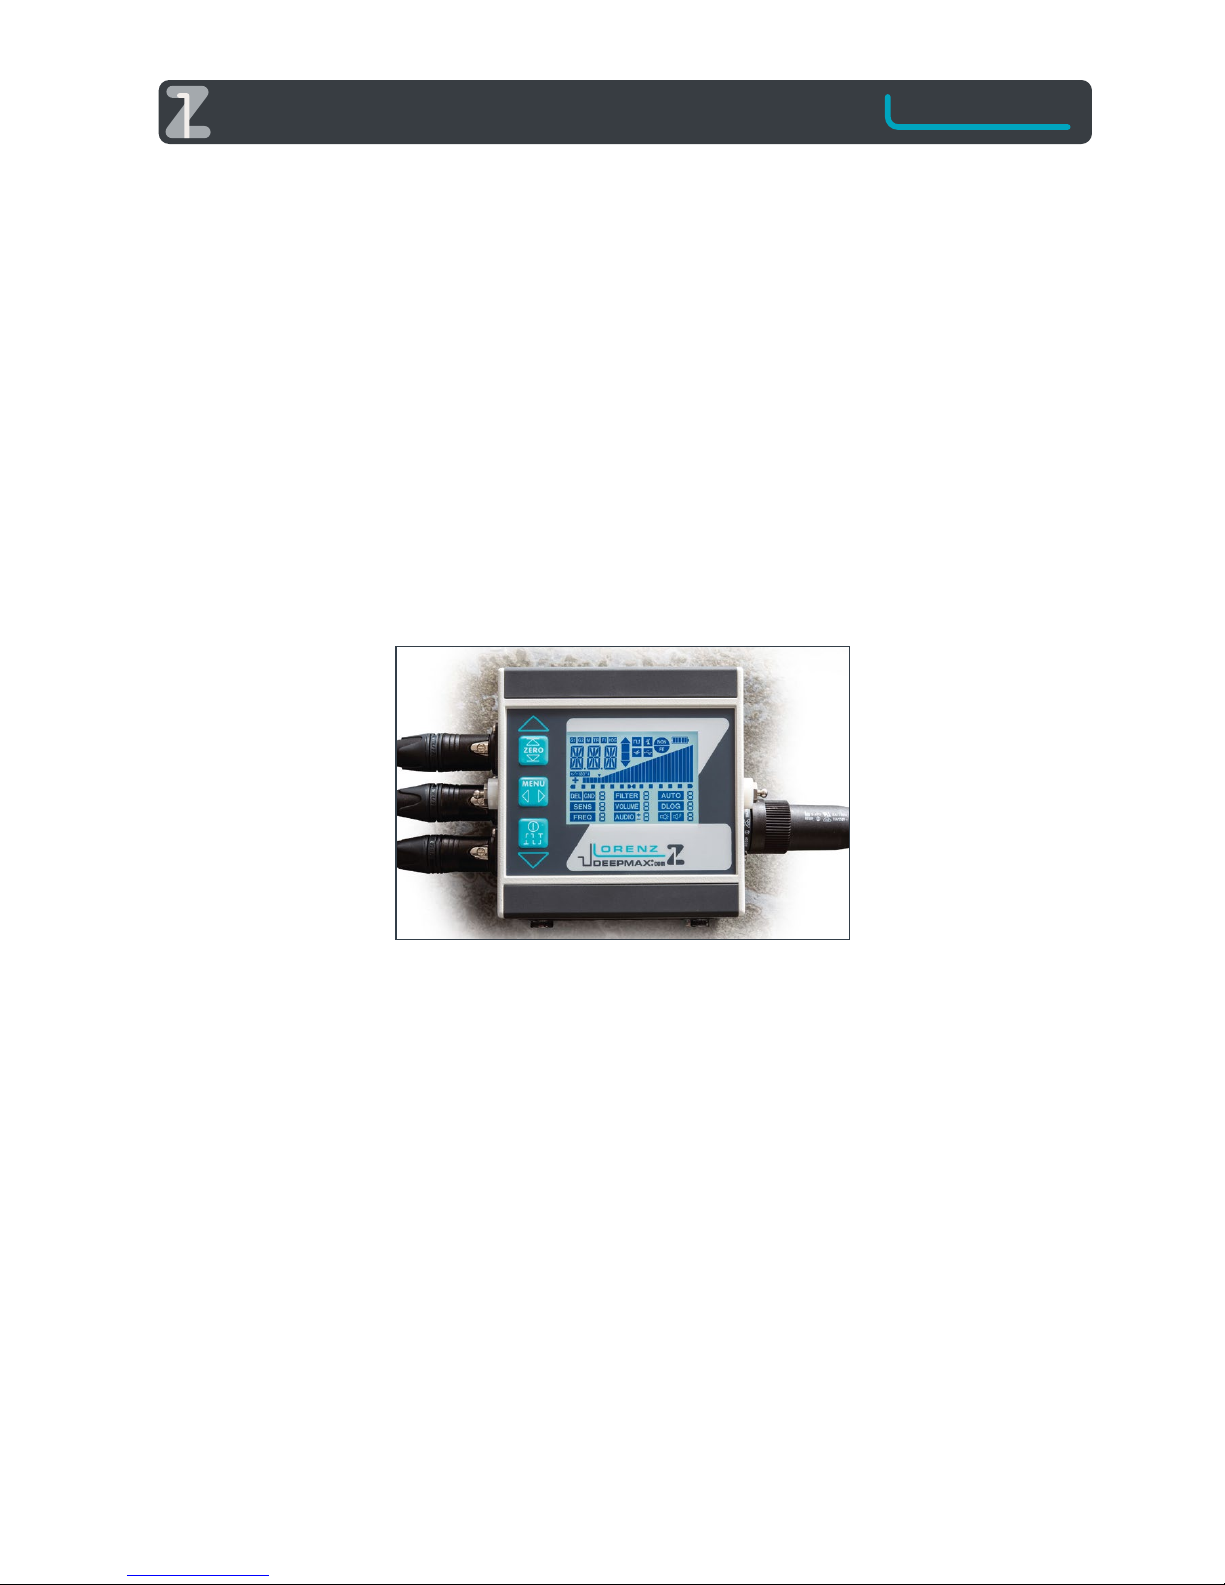
On the front panel of the DEEPMAX Z1 there are three push
buttons namely ZERO, MENU, and POWER . The data logger
function can also be operated by means of the same controls
when the data logger function is turned on.
1. Assemble the coil with the telescopic pole and put on the
carrying strap with the battery and electronics unit
2. Connect the battery and coil to the Z1 electronics unit
3. Press POWER shortly, when LOW BAT appears charge the
battery first
4. To start the automatic two steps Ground Balance hold the
coil in the air and press ZERO until a high beep sound is
coming
5. Afterwards lower the coil to the ground without moving at
a place with no metal and press ZERO again until a second
low beep sound appears. Arrows pointing up- and downwards indicate the position of the coil.
6. Select the functions by pressing MENU shortly jumping to
the next function or going backwards while pressing MENU
for a longer duration
7. Select the values with ZERO
upwards and with POWER
downwards quickly pressing
the same button repeatedly.
8. After three seconds the
Icons will stop to flash
automatically. Press MENU
again in order to change
functions
9. Most functions have a lower
sensitivity/ intensity in
position 1 as a higher setting
like 4, 5 or 9 will result in a
higher sensitivity/ intensity/
brightness/ loudness/
frequency…
From time to time ZERO has to be pushed shortly to recall
the audio threshold setting during operation.
When a search coil has been exchanged, the unit has been
turned off, or the automatic two steps Ground Balance (steps
4 and 5) has not been activated a PRE SET Ground balance
corresponding to the various coils and standard magnetic
soil conditions will be always active in the GND modes!
During operation the automatic Ground Balance can be
performed from time to time on the ground at different
places or on single magnetic stones.
Functions/ settings
• DEL 1- 4 All metals and ground mineralization will be
indicated in this DELAY mode. 1 and 2 indicate large metal
objects only while 3 and 4 will also provide a good sensitivity
range for small coins/ foils.
• GND 1-4 All metals are indicated while mineralized soils
are eliminated in this GROUND mode. Setting 3 and 4
provide the highest sensitivity range while ignoring the
ground.
GND1 High conductivity objects (bigger nuggets and coins)
GND2 Low conductivity objects (small nuggets, foils)
GND3 Low and high conductivity objects
GND4 High sensitivity mode for all metals but only for use
with double D coils on low/ medium mineralized soils. For
highly mineralized soils refer to GND1,2,3
It is possible to choose either from the DEL (DELAY) or GND
(GROUND) settings.
• FILTER reduces the amount of interferences produced by
power lines radio transmitters, 0 gives a very fast response
speed but no filter at all and 5 will offer a low interference
but slow response speed. Use low settings with small coils
and higher settings with large coils. Before using a higher
Filter setting adjust the FREQ (FREQUENCY) first, in order to
reduce the amount of interference.
• AUTO in position 5 the detector will automatically retune
the audio threshold to changing ground or temperature
conditions quickly. In position 1 the detector very slowly
adjusts itself and in position 0 this automatic tuning is off
which is recommended especially with large coils to achieve
high detection ranges. In some cases at position 0 the ZERO
control has to be pressed more frequently to achieve an
audio threshold.
• SENS sensitivity adjustment setting: 1 low and 5 high
sensitivity
• VOLUME settings: 0 no audio and 9 very loud
• DLOG 1 turns on the built in data logger function in order
to collect field data to produce color maps with the optional
Hardware/Software kit
• FREQ Operating Frequency
can be altered to any position
in order to provide steady
audio sound when electro-
magnetic interferences from
power lines or radio transmit-
ters are present
• AUDIO the initial ticking rate
or threshold sound can be
adjusted from -9 no sound to
+9 slow ticking/ weak thresh-
old sound. In most cases it is
left in 0 mid- position in order
to have a very weak audio
sound even when no metal is
located.
• LIGHT the backlight of the LCD can be altered from
0 off to 9 bright
• TONE
1 provides a VCO ticking sound with increasing frequency for
all metals (useful with frame coils in the DELAY
modes)
2 increases volume and frequency simultaneously for all
metals (works well in all DELAY or GROUND
modes)
3 will give a high sound for small non-ferrous metals like
many gold Nuggets and a low sound with bigger non-
ferrous and ferrous metal objects (only in GND 1,2,3
mode). In GND 4 or all DELAY modes a low sound will
appear for all metals.
4 provides a low sound with ferrous and high sound for non-
ferrous or large (hand sized or bigger) ferrous metal objects
(operates with DD- coils only)
3.1 Other indicators on LCD
Above the function icons there is an intensity bar graph, a
battery indicator, a FErrous/ NON- FErrous icon (works
with double D coil only) and a conductivity number for the
time duration of the eddy currents produced in a metal
object, possible examples:
000-035 low conductivity like small coins nuggets foils
5
Page 6

040-060 medium conductivity like ferrous metal objects
065-099 high conductivity like large non- ferrous metal
objects made of copper, brass, silver for example.
Possible settings for small coils (26cm to 45cm diameter)
Nuggets/ Coins/ Relics
• Nuggets/ High mineral: GND 2 or 3, FILTER 1, AUTO 0,
SENS 4, VOLUME 5, DLOG 0, FREQ 5, AUDIO 0, LIGHT 8,
TONE 3
• Coin/ Relic single coil: GND 2 or 3, FILTER 1, AUTO 0- 2,
SENS 4, VOLUME 5, DLOG 0, FREQ 5, AUDIO 0, LIGHT 8,
TONE 2 or 3
• Coin/ Relic double D coil: GND 3 (high mineral) or 4
(low mineral), FILTER 1, AUTO 0- 2, SENS 4, VOLUME 5,
DLOG 0, FREQ 5, AUDIO 0, LIGHT 8, TONE 2 or 4
Possible settings for large frame coils (1m x 1m to 3m x 3m)
Cache/ Relics
• Low/ Medium mineral: DEL 3 or 4, Filter 2, AUTO 0,
SENS 4, VOLUME 5, DLOG 0, FREQ 5, AUDIO 0, LIGHT 8,
TONE 1
• High mineral: GND 2 or 3, FILTER 3, AUTO 0, SENS 4,
VOLUME 5, DLOG 0, FREQ 5, AUDIO 0, LIGHT 8, TONE 1
3.2 Data Logger
function DLOG
In order to generate color maps with the DEEPMAX Z1 an
additional hardware/ software kit and a computer is
necessary.
To start the data logger and collect field data proceed as
described in chapter 3 and go on as follows:
1. Mark a field in the four corners and start in the left corner
X/Y with a frame coil 1m x 1m in size for example
2. Turn on the DLOG function with 1. In this mode only a
few functions can be altered or displayed
3. Keep the coil at the left starting point and press ZERO
shortly and immediately start to walk the first track while
keeping the coil at constant height over the ground.
4. Press ZERO at the end of the first track
5. Turn around 180 degrees and start the next track
backwards for example 1m next to the first one pressing
ZERO to start
6. In order to delete the last track press ZERO for a longer
duration and repeat the same track
7. Stop the last track with ZERO and store the same as a
new field while pressing POWER shortly. When turning off
the detector forgetting to store the actual field, the field data will
be lost!
8. Leave the DEEPMAX Z1 on and connect the USB data
transfer cable to the DEEPMAX Z1 and read the data with
your computer and installed Surfer 11 and Lorenz Data
Converter Software
9. Compare the six different color maps generated with
Surfer 11 to distinguish between different kinds of metals,
objects sizes, orientation and ground minerals.
In addition there are different indication icons above the
number and in the middle of the display to make the
operation of the data logger even simpler as follows:
• M Meter displays the meters already passed in the first
track and counts backwards in the following tracks to zero in
order to find the starting and finishing line of each track.
• TR Track indicates the currently active track and the
amount of tracks already being stored.
• FI Field indicates the field currently in use and jumps to a
higher number when storing the last track with the Power
button shortly.
• HDG Heading information of the compass function to
display the direction of the tracks.
While being in the process of recording field data it is possible to
press MENU in order to choose between Meter, Track, Field and
Heading information on the display
• +/-180°comes on when walking backwards a track in
order to show that this amount of degrees has to be added
or deducted from the displayed Heading to achieve the
compass heading.
• GPS has to come on when a GPS is connected and DLOG is
1 (on) and starts to flash when no accurate GPS data can be
received. The Z1 will work without GPS as well but does not
provide the compass heading and meter function in this case.
• Data logger operation icon comes on when DLOG is on.
• Bar graph dot for compass heading information shows
the operator how to go in straight line each track. For
example the operator has to go to the left when the dot
goes to the left or to the right when the dot drifts to the
right. This has to be performed as long until the dot comes
back to the middle. The operator will notice some delay
until this indication reacts. It is absolutely necessary that the
operator walks to make a valid GPS indication possible.
Therefore at least ten meters should be passed until the
indicated GPS data is tolerable accurate.
For further information on how to analyze field data please
refer to chapter 14.
All mentioned functions, settings, specifications and
indication examples subject to change without notice.
• USB icon comes on when USB data transfer cable is
connected with the computer and data tranfer is in process.
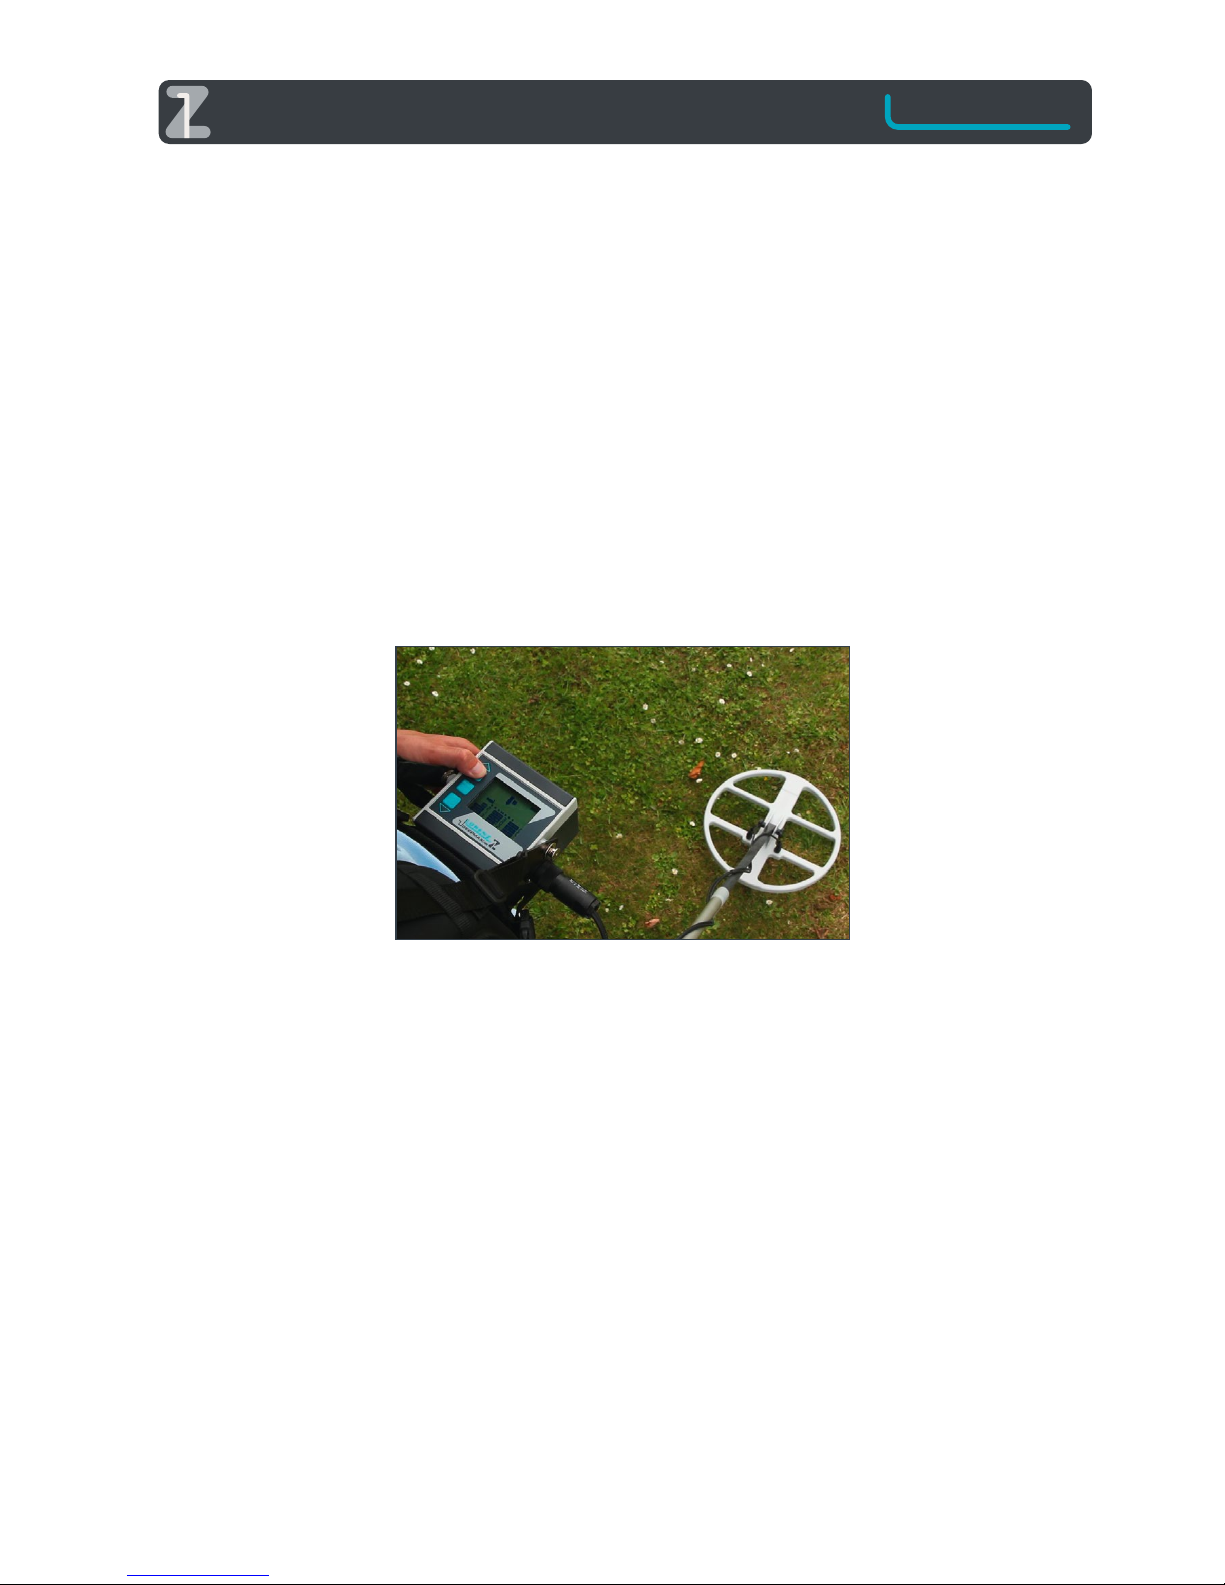
4. Indicators/ front panel
LCD
000-099 Conductivity/ Time delay reading
The Number for the time delay measurement is static and
will come on when certain intensity is reached and stays on
as long as the coil is over the metal. A time delay reading
which is mainly derived from the conductivity, permeability
and the object’s size is displayed with a specific number on
the LC Display. Possible examples: (000-035 coin or piece of
foil, 040-060 iron, 065-099 large copper or silver objects).
Any metal object detected will give a specific number (000
to 099). Therefore a certain intensity of the metal signal is
necessary for a time delay reading. The number simply
appears when a reading was possible. The indication will be
stored as long as the search coil is over the metal and turns
off when the search coil passes the same.
FERROUS / NON-FERROUS icons
This function does only work with the 26cm or 35cm double
D coil. Ferrous metal objects like iron for example produce a
FE indication at the top of the display and Non-ferrous metal
objects like gold silver or copper will result in a NON- FE icon
indication when the search coil is over the metal. The two
icons will turn off if no metal is present or no double D coil is
connected.
This identification facility is tuned to the ground with the
automatic ground balance.
O R E NZ
6
Page 7
O R E NZ
INTENSITY / signal intensity bar graph icons
The signal strength will be indicated by the way of a large
bar graph in the middle of the LC Display and an audio
response from the speaker or headphones.
ARROW; AERIAL, USB icons
These icons will work together with the built-in data logger
function. For further information please refer to the instructions for use the LORENZ DEEPMAX Z1, six channel data
logger, Surfer and Scripter Software chapter 3.2
BATTERY icon
The battery condition will be displayed on the bar graph
with 5 bars located on the top of the display. Note: The
battery condition should be checked with a search coil
connected and after a few minutes of operation.
BATTERY alarm LOW BAT
Low battery condition will be indicated by a pulsed beep
sound every few seconds. The LORENZ DEEPMAX Z1 will
turn OFF automatically a short time after this sound appears
to avoid damage from the batteries. The pulse circuit is
automatically turned off at low battery for safety reasons.
5. Connectors
BATTERY jack
This jack is located on the side
of the control housing.
The plug of the supplied
battery pack has to be
connected with this three way
jack. The operation time of the
LORENZ DEEPMAX Z1 on a
fully charged battery pack at
normal temperature range is
approximately 7 to 14 hours
depending on the coil
connected.
HEADPHONE- jack
The supplied stereo headphones can be connected to this
jack. Headphones with coded 4 way plug should be used
from the manufacturer. The built- in loudspeaker will be
automatically turned off when headphones are connected.
Loudspeaker
The LORENZ DEEPMAX Z1 has got a built-in loud-speaker
on the front which gives an audible signal when the
search coil approaches to a metal object. The audio
frequency and volume intensity will change with the
distance between the search coil and metal for better
pinpointing. Especially with two persons operation and
large diameter coils the signal from the loudspeaker is of
great help for both persons.
GPS Module / data transfer jack
The LORENZ DEEPMAX Z1 has a built-in data logger. In
order to support the same withpositioning data a GPS
Module can be connected to this five way jack. An
optional Data Logger Hard and Software kit would be
necessary doing this. After collecting field data the same
can be transferred via the same connection to the computer with an USB data transfer cable using the same jack.
COIL jack
Search coils of different size and shape can be connected to
this jack. The search coils available for the LORENZ DEEPMAX
Z1 have got coded connectors to adapt the electronics to
the coil automatically. To connect a coil plug to the electronics make sure that it is fully pushed in the jack and that the
sleeve is fastened by rotating it clockwise.
Note: Any connectors should be disconnected when
planning to store the equipment.
6. Operating procedures
Do connect the two shoulder straps to the main belt at both
sides in the front and one large strap above the battery pack
on the back. Adjust all the belts to comfortable length and
fasten the main electronics unit in front of the operator.
Connect the search coil-connector to the COIL jack on the
right hand side of the electronics unit, and fasten the plastic
sleeve of the connector by rotating it clockwise. Do connect
the battery connector to the BATTERY jack which is located
on the left side of the detector by pushing it gently. Hold
the connected search coil horizontally and far away from
metal objects about one
meter above the ground. Set
the POWER button to turn the
LORENZ DEEPMAX Z1 on. Press
again for a longer duration in
order to turn “OFF”. At switch
ON the detector runs through
a display check sequence since
all the icons com on and
indicate the retuning process
is performed by the electro-
nics at the same time. If the
BAT icon displays less than one
bar afterwards or if the
BATTERY alarm gives a beep
sound every few seconds, the
detector should be turned off again and the battery should
immediately be recharged with the supplied charger. The
battery condition is displayed with five bars on the top of
the Display continuously during operation.
Afterwards the Detector will automatically turn to the
positions which were selected the last time the detector
was in use. While pushing the ZERO, MENU, POWER push
buttons different settings will be selected and will be
displayed on the bottom of the LC Display at the same time.
See chapter 3 for details.
During operation no metal buckles or shoes containing
metal parts should be worn. The same with keys, coins, rings
and watches. Every metal carried by the operator can cause
false signals, especially when they are located near the field
of the search coil. Therefore the electronics control box has
to be carried far away from the search coil, this is especially
important while searching with the large frame mounted
coils but also with the smaller coils. Never use any metal
screws when building frames for the cable coils.
The loudspeaker will give a ticking or threshold sound after
having retuned the detector correctly with the ZERO control.
The sound can be individually tuned from silent to a low
frequency threshold tone with the AUDIO settings. This
pre-set audio tone will be recalled every time the ZERO
control is pushed. This has to be done during the first
7
Page 8

minutes of operation due to warming up.
As the LORENZ DEEPMAX Z1 offers highest sensitivity with
correctly tuned electronics, one should check the threshold
tone from time to time during operation. Although a
constant ticking sound is not always achievable, a threshold
tone will give the operator the information that the detector works with its highest sensitivity.
Especially for metal classification and ground balancing
purposes the electronics need to be tuned for best results
(see chapter 3).
The detector is now ready for use and will indicate a metal
object immediately with an audio sound emitted by the
way of loudspeaker or headphones. The audio frequency
will rapidly rise and attains its highest frequency when the
search coil is directly over the metal. The centre of the
search coil is the part with the highest sensitivity. Even in
the direct near of the metal frequency changes make
pinpointing possible in some tone modes.
When changing the search coil the electronics need always
to be retuned via the ZERO control shortly. When lowering
the search coil to the ground an audio sound may appear,
this can be canceled out by pressing the ZERO control
again. The distance between the search coil and the ground
has to be kept at a constant height when searching
afterwards. When working with small search coils of up to
45cm diameter it is also possible to select the AUTO
function with AUTO 1 for slow and 5 for very fast automatic
tuning in order to retune the electronics to changing
ground conditions automatically during operation. The
search coil therefore has to be moved at constant speed to
achieve a signal from metal objects. When resting the coil
over the metal the AUTO function will cancel out the signal
after a certain time.
In the DEL modes large diameter coils like the frame
mounted cable coils should be hold at heights of (10 to 60
cm) over the ground to ignore magnetic mineralized
ground or small unwanted metal objects. Those coils should
be moved slowly without any up and down movements,
parallel to the ground and at constant height.
When many small unwanted bits and pieces and very
strong wanted signals are expected at the same time it may
be advisable to select a lower delay setting like DEL 3 or 2
for example.
In the DEL 2 mode and especially while using large
diameter frame coils the sensitivity to very small objects
decreases. This is in many cases desirable, although the
general sensitivity will be less. The simplest way to ignore
small metal objects is to increase the distance between the
search coil and the ground. Simply raise the loop and it will
still be possible to locate those deeper and bigger metal
objects.
Be always sure that there is a sufficient distance between
the detector or battery and the frame coil when raising the
loop.
Note: The LORENZ DEEPMAX Z1 metal detector has to be
retuned with the ZERO control every time a different coil
has been connected. During operation only a few threshold corrections are necessary.
DEL 4, GND 2, 3, 4 with DD coil offers the greatest sensitivity especially for very small non-ferrous metal objects like
coins and nuggets. To record the conductivity (derived from
the time delay of the eddy currents produced by the metal
objects) or to distinguish between a ferrous and non-ferrous
metal please refer to the next chapter.
7. Identifying metal objects
This chapter is a summary how to proceed with the
LORENZ DEEPMAX Z1, when locating metal, while using
the two metal classifications, intensity reading and the
audio signal.
It is therefore in some cases possible to predetermine the
exact position, the probable detection depth as well as
the kind of metal located. A specially developed electronic
circuit makes time delay readings possible which are
directly displayed on a scale of 000 to 099. Those so called
conductivity readings are only known from VLF TRMachines but not from metal detectors based on the
Pulse-GBS principle. In general these readings are based
on object’s size, conductivity and permeability of the
metal and therefore named time delay readings for
simplicity.
Please proceed as described in chapter 3 and 4 and follow
these additional instructions listed below.
When lowering the search coil to the ground an increasing ticking-rate of the audio can be audible in some
cases, especially when DEL 1, 2, 3, 4 is selected.
This can either be generated by a metal object or mineralized ground. When expecting mineralized grounds with
high iron oxide content the search coil can simply be
raised again, (10 to 50 cm) depending on the coil and the
LORENZ DEEPMAX Z1 can simply be tuned to the ground
conditions while holding the coil at a constant height and
pressing the ZERO button shortly. Pay special attention to
metal objects in the near of the search coil which may
cause false signals and therefore a false retuning process.
The search coil should be held at a constant height while
searching. In many cases it is advisable to search in a
systematically manner with a certain grid which can be
marked on the ground for example.
The small (26cm; 35cm; 45cm) diameter search coils can
be supplied with a telescopic S- pole which is held at
constant height and in parallel to the ground. The coils
have to be moved from side to side with overlapping
tracks to detect even the smallest metal pieces which can
sometimes only be detected in the centre of the search
coil as this is the most sensitive part. Although the
response speed of the LORENZ DEEPMAX Z1 is very high,
the search speed should not exceed 2 meters per second.
When a metal object is located try to find the place with
the strongest signal which means highest indication on
the INTENSITY bar graph and highest audio frequency.
Size, shape and depth information can be derived from
the audio sound in some cases with some experience.
Small objects like single coins will be indicated with a
short and intensive signal when a small coil is used.
Coins and nails and very small pieces of metal will cause
two indications when passing them with a frame mounted search coil (1 m x 1m) for example. This is mainly
because those small objects are out of the range of the
large coils
O R E NZ
8
Page 9
èè èè èè èè èè èè
small object at the surface
large object buried deep
medium size object
O R E NZ
and therefore will only be indicated at the edges of the
frame coils and only when they are very close to it. Large
metal objects will give an extensive signal with a longer
duration, and therefore can easily be identified.
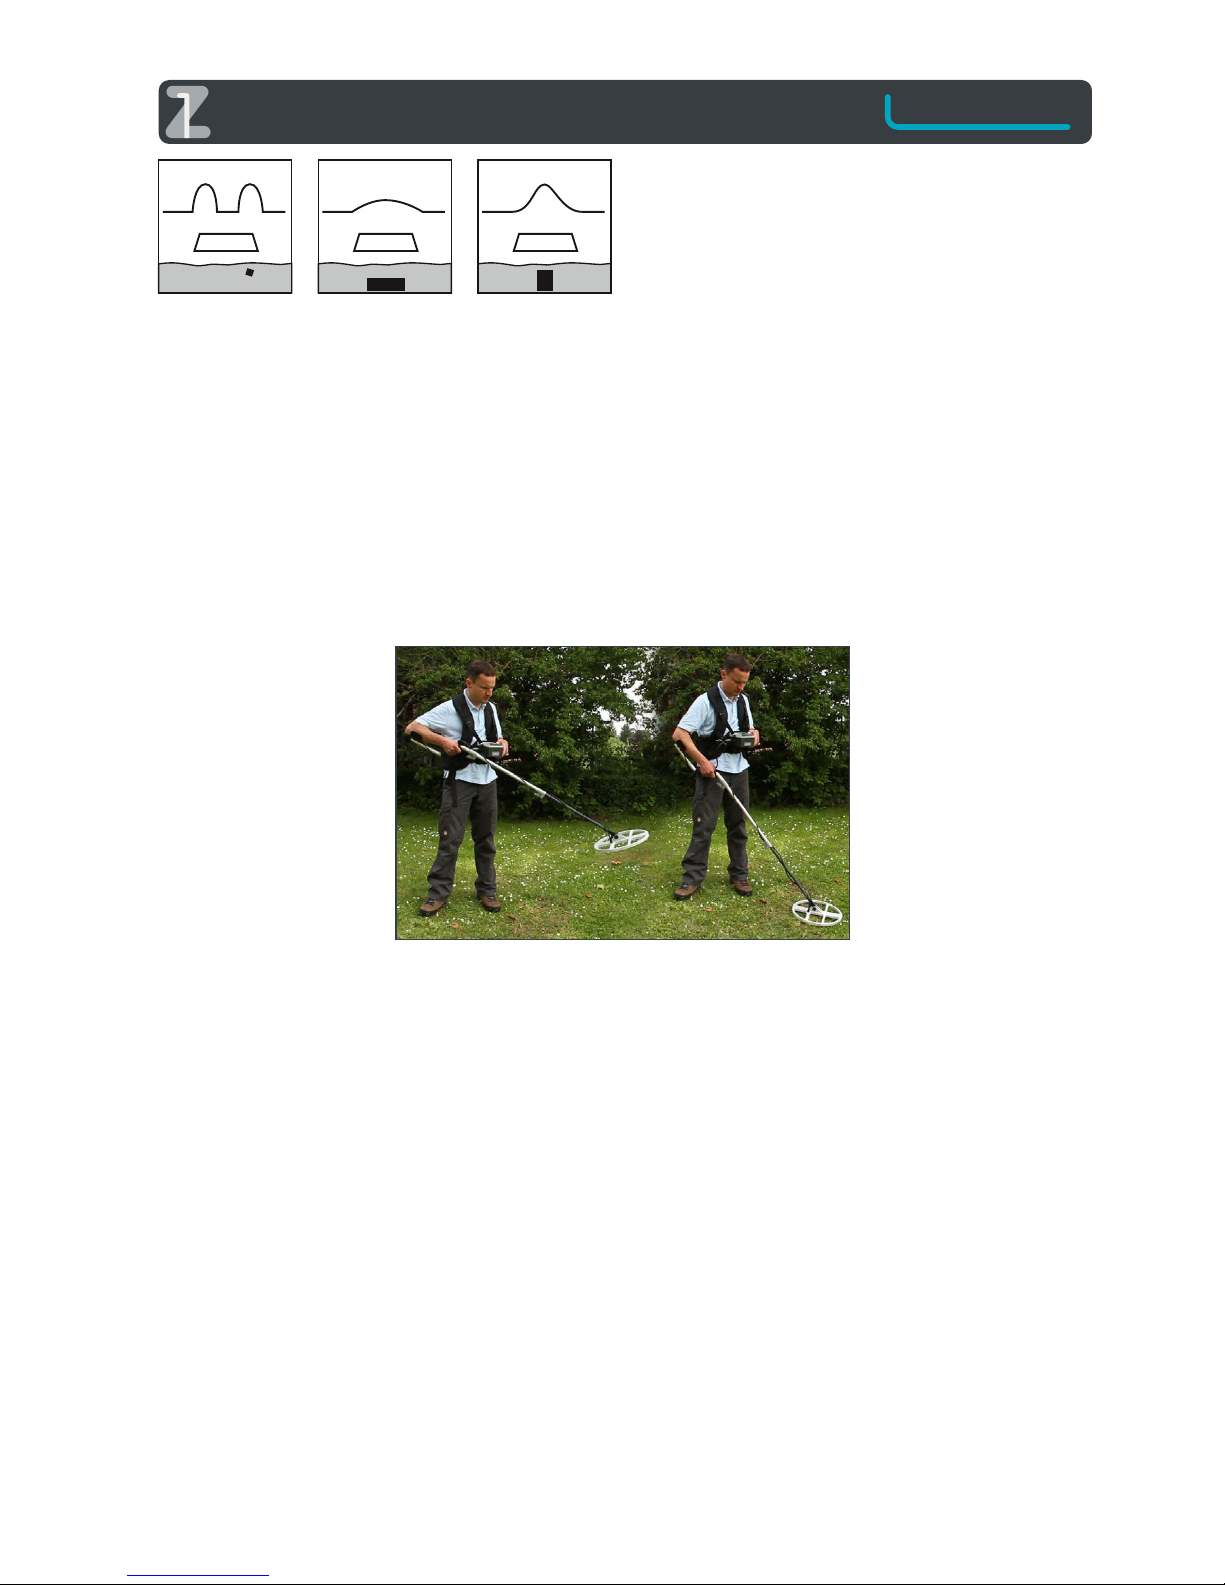
Deeply buried metal objects will generate a weak and slowly
increasing audio sound and intensity meter reading. Objects
which are close to the surface generate a strong and rapidly
increasing signal.
Large objects will cause a signal with a long duration
especially when located with large frame mounted cable
coils. For example a metal box 20cmx20cm can give a signal
of up to 6 m in length when passing with a (2 m x 2 m) coil
for example. It is therefore necessary to find the center of a
buried object by the way of the audio and INTENSITY bar
graph. This is achieved by moving the coil from different
directions slowly towards the
strongest indication. In many
cases it is of great help to use
an additional smaller coil
when pinpointing a metal. The
centre of the search coil is
always the most sensitive part.
When having found the place
with the strongest indication
the time delay indication will
come on with a number when
the signal is strong enough.
When double D coils are in
use an additional FE ferrous /
NON-FE non-ferrous indication
will appear on the LC Display.
Therefore the DEEPMAX Z1 has to be ground balanced first
as shown in the chapter 3 to avoid false indications
produced by the ground. Larger ferrous metal pieces will also
be indicated as being non-ferrous.
8. Automatic Ground
balancing GND 1/2/3/4
Ground signals which are mainly derived from magnetic
iron oxides will be indicated with an increasing audio
response when lowering the search coil to the ground
although no metal is below the search coil. This kind of
ground indication can be simply eliminated by simultaneously holding the search coil at constant height over the
ground and pressing the ZERO push button for a second. As
long as the coil is hold at the same height during searching
there will be no loss in sensitivity. When expecting highly
mineralized ground however it is always advisable to turn
on the built- in ground balancing System (GBS) with the
GND function turned on.
These different functions can be selected with MENU and
GND flashing, in order to cancel out signals from magnetic
soils or single stones with high iron oxide contents. Even
some iron objects can be discriminated/ eliminated by the
way of the same functions.
For automatic tuning purposes please go on as follows. Hold
the search coil horizontally about 1m over the ground
where there is no metal. Press the ZERO control for several
seconds and wait until the first tuning process is finished in
the air. Lower the coil to the ground and press the same
ZERO control again for several seconds while keeping the
coil close to the ground. When pressing the ZERO control
the arrow on the display points up and down as long as the
tuning proceeds. High and low beep sounds will indicate
the same. During that time no movements of the coil
should be done. Afterwards the detector is ready for use and
there should be no or only weak indications of the ground
when changing the distance between the coil and the soil
in GND1/2/3/4.
During operation it might be necessary to retune the
ground settings from time to time.
The LORENZ DEEPMAX Z1 should now be almost silent even
if the coil is raised in the air or lowered to the ground again.
If still indications occur it may be possible that the Detector
has been tuned to a piece of metal in the ground. In this
case simply repeat the same procedure at a metal free place.
GND 1 and GND 2 could be
selected at the same time to
achieve highest sensitivity for
most types of metal objects
when GND 3 is selected. The
Detector will distinguish
automatically between the
two signals and will use the
stronger signal of the two. In
most cases however the GND
2 function will be sufficient. In
the case of a connected DD
coil GND 4 will also be
available. It is not necessary to
run through the whole tuning
process every time the ground
properties changes but when changing the coil the ground
compensation has to be tuned again. If changing ground
conditions are expected the 35cm double D-coil and GND 2
or 3 positions will be the best choice. When Double D coils
are in use, the GND 4 function works differently compared
to the previous explained. The detection depth to many
non- ferrous metal objects will significantly increase when
GND 4 is in use with that coil. In some cases however
temperature changes might cause a drift of the audio and
the detector therefore has to be retuned with the ZERO
control from time to time or the AUTO function has to be
selected to cope with this matter.
With turned on GND function the LORENZ DEEPMAX Z1
works with either reduced or higher sensitivity compared to
DEL Delay functions. Some iron objects and very few
non-ferrous metals with a similar signal response as iron will
be indicated less sensitive. It is even possible to eliminate
large or small iron objects when selecting a special GND
setting like 1, 2 or 3. Signals will still occur when the distance
between the coil and the metal is too small because of
signal overload. However most metal objects will be
detected with almost the same or even higher sensitivity as
without ground balancing circuit. An increase in interferences with turned on GND function due to power lines and
radio transmitters will be realized. The amount of interferen-
9
Page 10

Conductivity Possible
reading metal object
0-10 coin, ring, ringpull, aluminium-
foil, gold-coin
10-20 bronze-coins, silver-coins, nickel
20-30 soft drink-can, small pieces of
iron
30-50 ferrous metal objects, nails
50-60 iron-box, bigger objects made of iron
60-80 medium sized bronze, copper,
silver-objects
80-99 big bronze, copper, silver, aluminum,
gold-objects
ces could only be reduced by the way of changing search
coils, setting the FREQ Frequency control to a different
position, reducing the AUDIO threshold to -1, -2… or
adding a higher Filter setting with some expense of response speed.
9. Metal classification
In order to get further information from the buried metal
object the metal classification can be used. The two metal
classification features offered with the LORENZ DEEPMAX Z1
are based on different working principles. The time delay/conductivity reading is static therefore no motion of the coil
is required to make a reading 000 to 099 possible. This is
especially of great advantage when identifying deeply buried
metal objects with the highest sensitivity possible. The
calibrated metal classification will directly display the time
delay with all coils connected. This conductivity reading is
very precise. It will be stored as long as the coil is over the
metal and will disappear when passing the metal with the
coil. The FERROUS / NON-FERROUS indication will only
appear with the 26 cm or 35cm double D coil connected.
Weak signals which are out of the range of the metal
classifications can’t be identified.
When having located a metal object proceed as described in
the following steps:
• Slowly move the search coil from the side at constant
height towards the located metal. Try to find the centre of
the metal object with the audio signal. As soon as a
certain intensity of the audible signal is reached a time
delay reading will be performed by the LORENZ DEEPMAX
Z1 automatically. This will be indicated with a number
between 000 and 099 on the screen.
• Compare the displayed number with the following table.
Therefore the search coil has to be held over the metal in
order to store the conductivity value. For better accuracy
the conductivity reading can be repeated. Therefore the
coil has to be raised in the air or moved to the side until
the first reading disappears. Afterwards the coil can be
lowered to the ground towards the metal until another
meter reading is performed by the LORENZ DEEPMAX Z1.
Note: The conductivity indication can also be locked near
000 when very small coins, foils or gold nuggets are
indicated. This metal classification will work in any
position and with any search coil connected.
Note: Especially when expecting very strong signals and
mineralized soils at the same time it is often advisable to
hold the coil at a higher distance over the ground. This will
help to ignore magnetic soils, because the coil is out of the
range of the ground. This will increase the performance
and accuracy of the classification circuit and makes it
easier to locate and identify these metal objects. In most
cases however a special circuit will suppress the false
readings derived from magnetic soils effectively, even if
the coil is close to the ground.
When expecting very deep metal objects it will sometimes
not be possible to perform a reading because the indication
is always about 30 to 50 % less sensitive than the audio signal
or the intensity bar graph.
Some smaller pieces of bronze may be indicated with a time
delay reading between 50 and 60 namely the same as some
ferrous metal objects. At the same time the LORENZ DEEPMAX Z1 does not suffer from anomalous effects like VLF-TRsine wave detectors do. Therefore very big ferrous metal
objects will not cause a higher reading than 60 in most cases.
If ferrous and non-ferrous metal objects are simultaneously
located by the search coil the metal classification circuitry will
display the conductivity of the larger metal object on the
screen. The reading may also lie between the two different
kinds of metal.
The time delay/ conductivity metal classification of the
LORENZ DEEPMAX Z1 will work with all available coils. It is
capable to identify deeply buried big metal objects and small
objects near the surface. It is often helpful to start with “in- air”
tests in order to see how the detector responds to different
metals. Highly mineralized soils, electromagnetic interference
from power lines or transmitters can cause inaccurate
conductivity meter readings especially in urban areas.
Some nails or longer ferrous objects produce different signals
when passing them with the coil.
Note: When expecting heavily mineralized soils it is necessary
to tune the detector to the ground first as described before.
The FE/ NON FE, Ferrous / Non- ferrous metal identification
is of great help when classifying smaller objects in weakly or
medium mineralized soils. With magnetic ground however
this indication is less accurate and will only work with strong
signals. The coil therefore has to be hold at a constant height
a few centimeters over the ground while passing the object
from the side.
10. Search coils/accessories
Different search coils can be connected to the LORENZ
DEEPMAX Z1 for special search and location purposes. In
general small search coils offer great detection depths on
small metal objects while large search coils offer the highest
possible detection depths on big objects. The possible
detection depths also depend on the setting of the detector, the kind of metal and the shape of the metal object and
slightly on the type of ground below the search coil. The low
sensitivity for small metal pieces in conjunction with the
O R E NZ
10
Page 11
O R E NZ
very high sensitivity for bigger and deeper metal objects
make the DEEPMAX Z1 especially useful when using it with
large frame mounted search coils. The maximum detection
depths achievable with a 1m x 1m frame mounted search
coil are very high and can be increased when enlarging the
search coil to 1,5m x 1,5m, 2m x 2m or 3m x 3m. Of course it
will no longer be possible to detect single coins or nails with
those large frame mounted search coils. In this chapter
different search coils available with the LORENZ DEEPMAX
Z1 are described. (Please refer to chapter 11 for detection
depths)
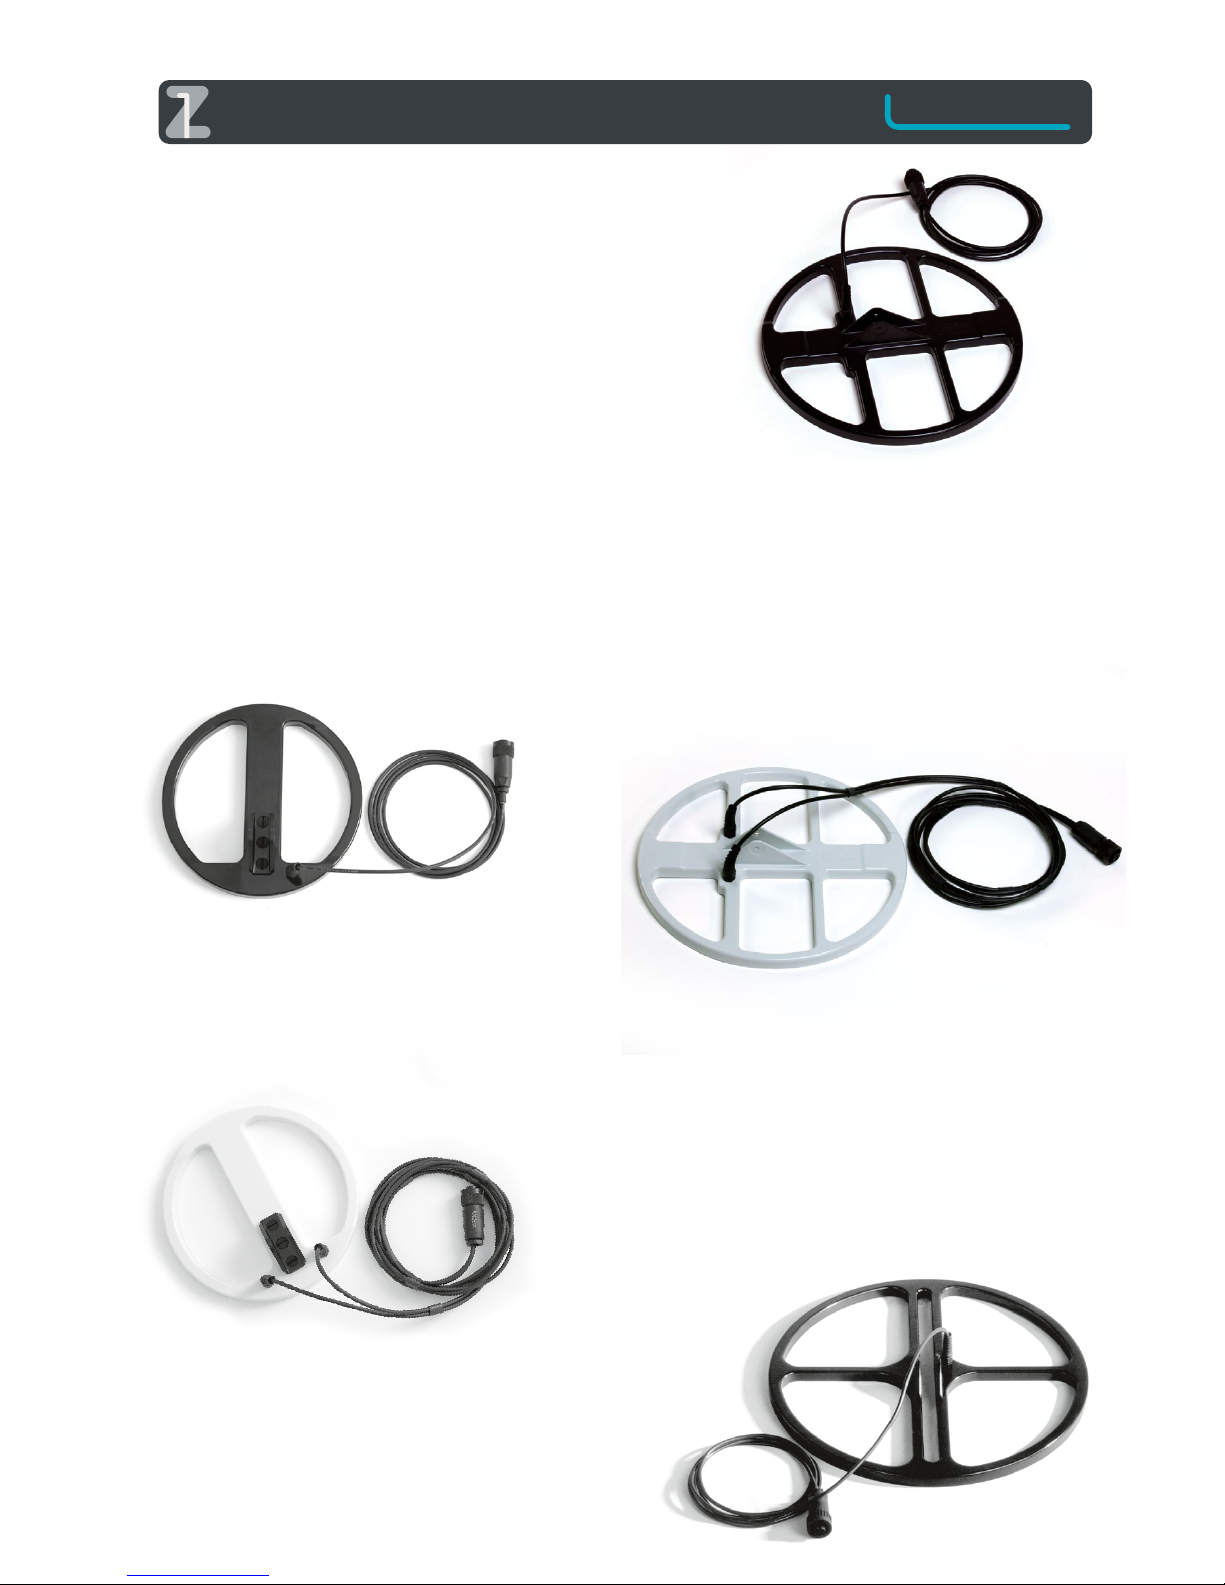
26 cm search coil
This search coil was mainly developed for the location of
very small metal objects like small nuggets or coin sized
metal objects for example. The maximum detection depth is
limited by the object size and the coil. In some cases it is
easier to pinpoint very small metal fragments with this coil
rather than with a double D- coil.
This search coil can be useful while pinpointing large metal
objects which have been located with a frame mounted
search coil before. Deeply buried metal objects can be out
of the range of the small 26 cm search coil and therefore can
only be detected with frame mounted search coils. The 26
cm search coil is waterproof and therefore can be used in
saltwater for example.
26cm double D search coil
A special double D version of this coil with separate
transmitting and receiving windings is also available. This
coil makes FERROUS / NON-FERROUS indications on the
display of the DEEPMAX Z1 possible.
Depending on the type of ground sometimes DD- coils are
less affected by extremely mineralized soils but pinpointing
will be more difficult than with a single loop coil.
35 cm - search coil
This highly sensitive search coil has got very good depth
capabilities on single coins and medium sized objects.
Nuggets smaller than 5mm in diameter should rather be
detected with a 26cm search coil than with this coil due to
poor sensitivity to very small metal bits and pieces. A
elescopic pole with armrest is
necessary for any of
the small search
coils
(26 / 35 / 45 cm).
35cm double D search coil
Separate transmitting and receiving windings offer more
stable operation on soils with changing contents of iron
oxides (minerals) in some cases. This coil can be used for
most search applications. The FERROUS / NON-FERROUS
metal identification does work with these 26cm and 35cm
double D search coils.
Note: The electrical properties of the double D search coils
may change when mechanical tension is produced in the
coil when being used not properly. Search coils therefore
are not covered by warranty for that reason. The same
with the connecting cable which should be fastened with
the belt strap first before connecting to the electronics
unit to protect the same and to avoid broken cables.
45cm search coil
This search coil can be operated by a single person with the
S-rod-handle. It offers extreme depth ranges on either single
coins or bigger objects buried deep in the ground. Depth
ranges of more than 1 m for a metal object of the size of a
soft drink can (0,33 l) or up to 50cm on a single gold coin
with 25mm diameter make this coil interesting for a lot of
different search and locating purposes.
Those extreme depth ranges on medium sized and bigger
metal objects make frame mounted search coils unnecessary in some cases. Small items can be eliminated by
increasing the distance between the coil and the ground.
This 45 cm coil covers much more ground than a 26cm coil
does and therefore makes very effective searching possible.
Coins
with a diameter of
less than 15mm
should rather
be detected
with smaller
search coils.
11
Page 12
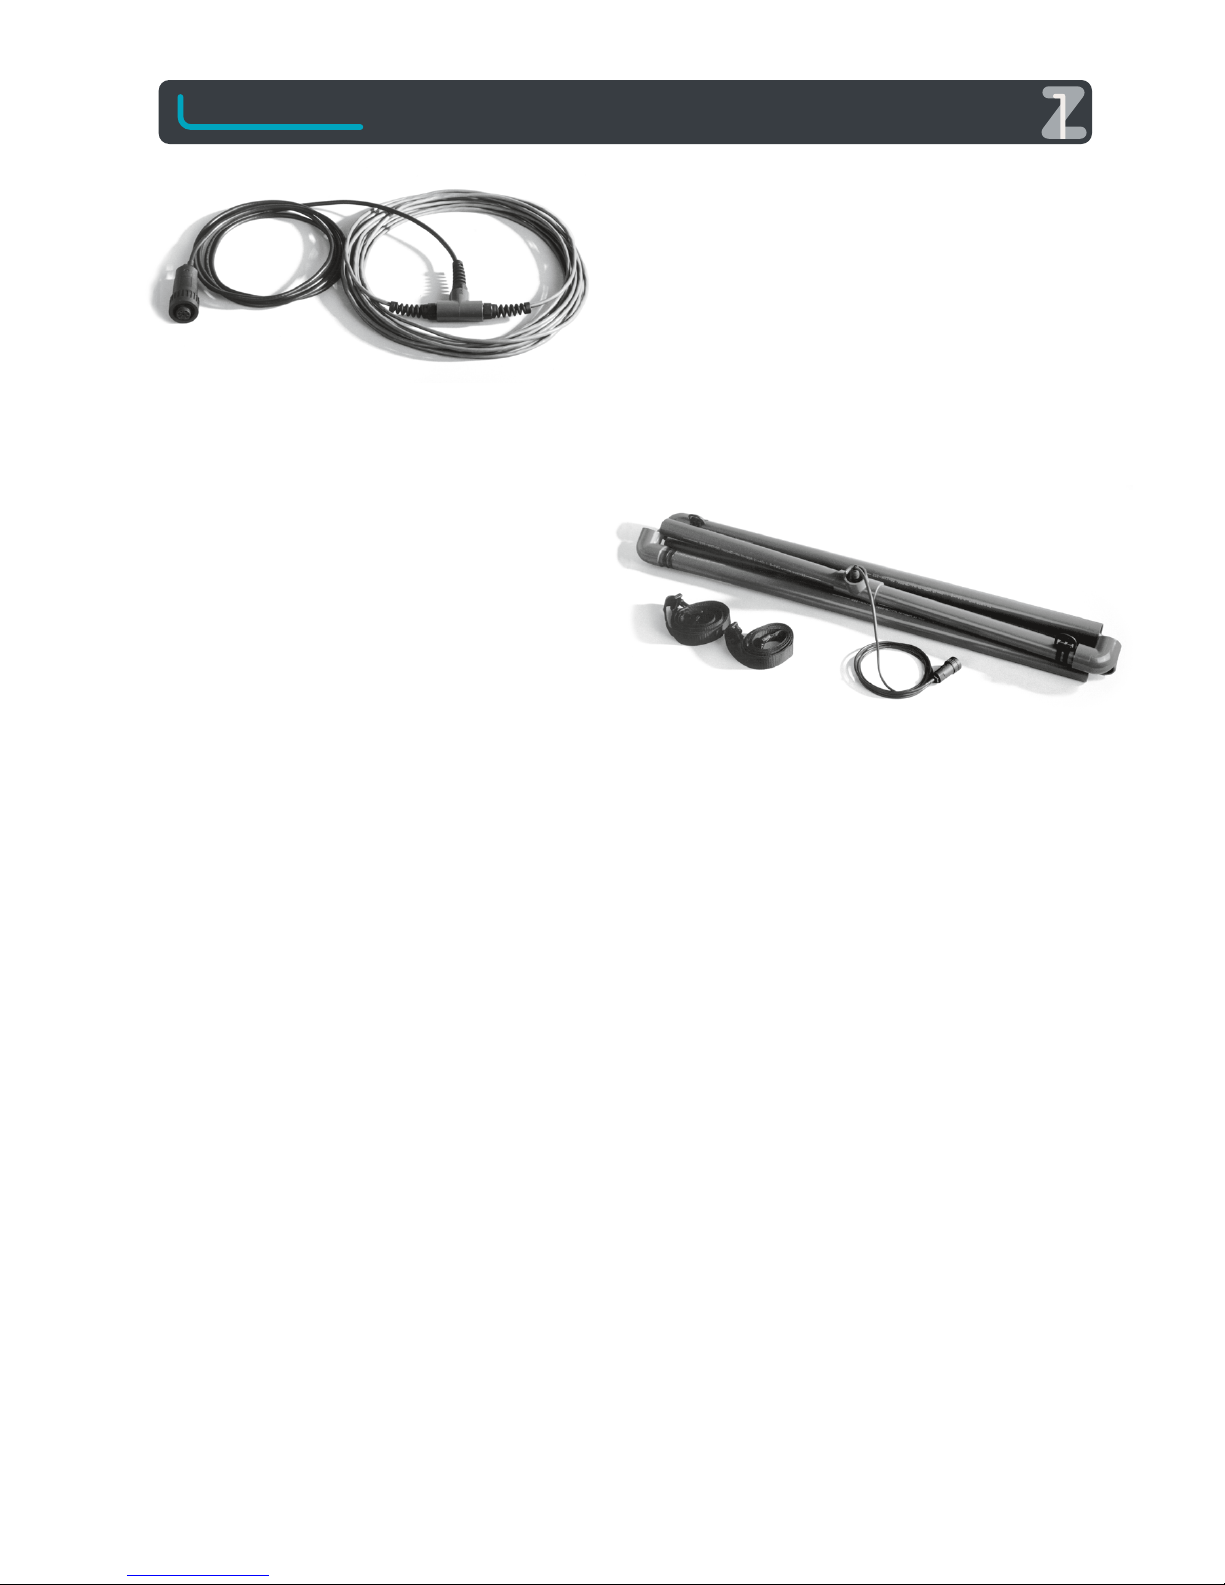
Universal cable coil 8 m perimeter
This extremely lightweight and easy to transport universal
cable offers a variety of different search coils for different
search applications. The cable coil has to be fixed with tape
on a frame which can be made of PVC-tubes for example.
The following search coil configurations are mainly useful for
the location of metal objects with a surface of at least 6cm x
6cm or hand sized metal objects for example. Small metal
pieces like single coins or nails will be indicated with poor
sensitivity or will even be eliminated in some cases because
they are out of the range of these frame coils. It is very easy
to cover a large area with frame coils in a short time. This is
especially useful when looking for bigger deeply buried
metal objects while ignoring those smaller metal pieces at
the surface.
The following frame mounted search coils have to be carried
by two persons with adjustable carrying straps. The search
coil should be hold in parallel to the ground at a constant
distance of 10 to 60 cm. The electronics control box should
always be carried far away from the field of the search coil. It
is also necessary not to wear any clothes, belts or shoes with
metal when operating the LORENZ DEEPMAX Z1 to avoid
false signals.
0,67 m x 0,67 m (3 windings) universal cable coil 8 m
perimeter
The 8m universal cable coil has to be arranged to a 3 winding
search coil and has to be fixed on a 0,67m x 0,67m frame
made of PVC-tubes for example.
Never use any metal screws for the construction of a frame!
This is the smallest frame mounted search coil which offers
extreme detection depths for smaller and medium sized
objects. Metal fragments and some coins will still be indicated. The maximum detection depth is limited below the
bigger frames but higher than with a 45cm diameter coil.
1m x 1m (2 windings) universal cable coil 8 m
perimeter
The universal cable coil has to be arranged to a 2 winding
search coil and has to be fixed on a 1m x 1m PVC- tube frame
for example.
Searching with the 1m x 1m frame coil is mainly advisable
when looking for hand sized or bigger metal objects buried
deep while ignoring small coins, nails and pieces of foil at the
surface of the ground. The possible detection depths with
this particular frame coil are very high compared with
standard sine wave VLF-TR-detectors (see chapter 11). This is
one of the reasons why this particular search coil is used for
most professional applications. Large areas can be covered in
a short time. Best results are achieved with metal objects
having a surface of at least 10cm x 10cm. Because of the size
of the coil most of the small metal fragments will be ignored.
However bigger nails can be identified with the conductivi-
ty/ time delay metal identification. Most of the nails and
other metal fragments can be easily eliminated by increasing
the distance between the search coil and the ground. Even at
distances of 50 cm or more there will only be negligible
detection depth losses when locating large metal objects.
This frame coil has to be carried by two persons with carrying
straps.
The high depth range of the 1mx1m frame coil is achieved
with intense and therefore deep going magnetic field
transmitted. The detection depths listed in chapter 11 have
been recorded with different DEL Delay and GND Ground
settings. In some cases detection depths in wet, conducting
ground are slightly higher or lower than listed.
For even higher detection depths use the 12m cable coil
which can be arranged similarly to the 8m cable coil to
1m x 1m, 1,5m x 1,5m or 3m x 3m.
1m x 1m frame coil with cable inside tubes
This is a very user friendly 1m x 1m coil with the same
electrical properties as the 8m universal cable coil with two
windings as described before. The main advantage of this
particular search coil is its simple assembly, which can be
performed in a few steps. The disassembled coil is easy to
transport and will always be ready for use.
The coil cable is protected inside the tubes and therefore can
be used even under the worst environmental conditions.
Two adjustable carrying straps are supplied with every frame
coil.
2m x 2m (1 winding) universal cable coil 8 m perimeter
The 8m universal cable coil has to be laid to a single turn on a
metal free frame and has to be fixed with tape for example.
This particular search coil covers four times as much ground
as a 1m x 1m frame coil does. It should only be used when
searching for metal objects with a surface of at least 20cm x
20cm pointing towards the coil. Smaller metal objects will be
located less effectively than with a 1m x 1m frame. This is
mainly because it will become more difficult to pinpoint
those smaller objects with the large coil. The maximum
detection depth is very high and can only be increased with
the 12m cable coil arranged to a 1,5m x 1,5m or 3m x 3m
frame. The 2 m x 2 m frame coil can be carried by two
persons without any carrying straps at a distance of about
80cm above the ground. This is particularly useful when
trying to ignore medium sized metal objects which are
smaller than a horseshoe for example. Coins and nails will no
longer be detected when doing this.
The 2m x 2m coil acts as a large aerial for medium wave
transmitters. Therefore smaller frames like the 1m x 1m coil
will be of better choice when working in urban areas. The
next coil described will be less sensitive in general but won't
suffer from electromagnetic interference of transmitters or
power lines.
O R E NZ
12
Page 13
O R E NZ
1m x 2m compensated coil (two separate windings)
universal cable coil 8 m perimeter
In order to construct this compensated coil the 8m coil cable
has to be laid to the figure of the shape of an eight (8) first.
The coil cable has to be fixed on a 1m x 2m frame with a
center part which divides the frame into two 1m x 1m frames.
The cable has to be laid and fixed twice on the centre part as
this is the middle of the eight (8). This type of frame mounted
search coil is about 30% less sensitive than a 1m x 1m search
coil. This is because of the opposite directions of the transmitted magnetic field. During the receiving phase the two
windings of the eight do also work in opposite. Therefore
interference and some ground indications are subtracted
from each other and therefore eliminated. Interference from
radio transmitters or power lines will be almost completely
cancelled. This compensated 1m x 2m frame mounted search
coil is of great advantage when locating metal objects in
urban areas where interferences are often expected. This type
of coil has a very poor sensitivity for small metal objects. The
minimum surface of a metal plate should be 10cm x 10cm to
ensure good results when working with this coil. The LORENZ
DEEPMAX Z1 will work very stable with this particular coil.
The following described 1m x 1m double frame coil will give
much higher detection depths namely almost the same
sensitivity range as a single 1m x 1m frame but is also capable
to cancel out said EMI (electromagnetic interferences).
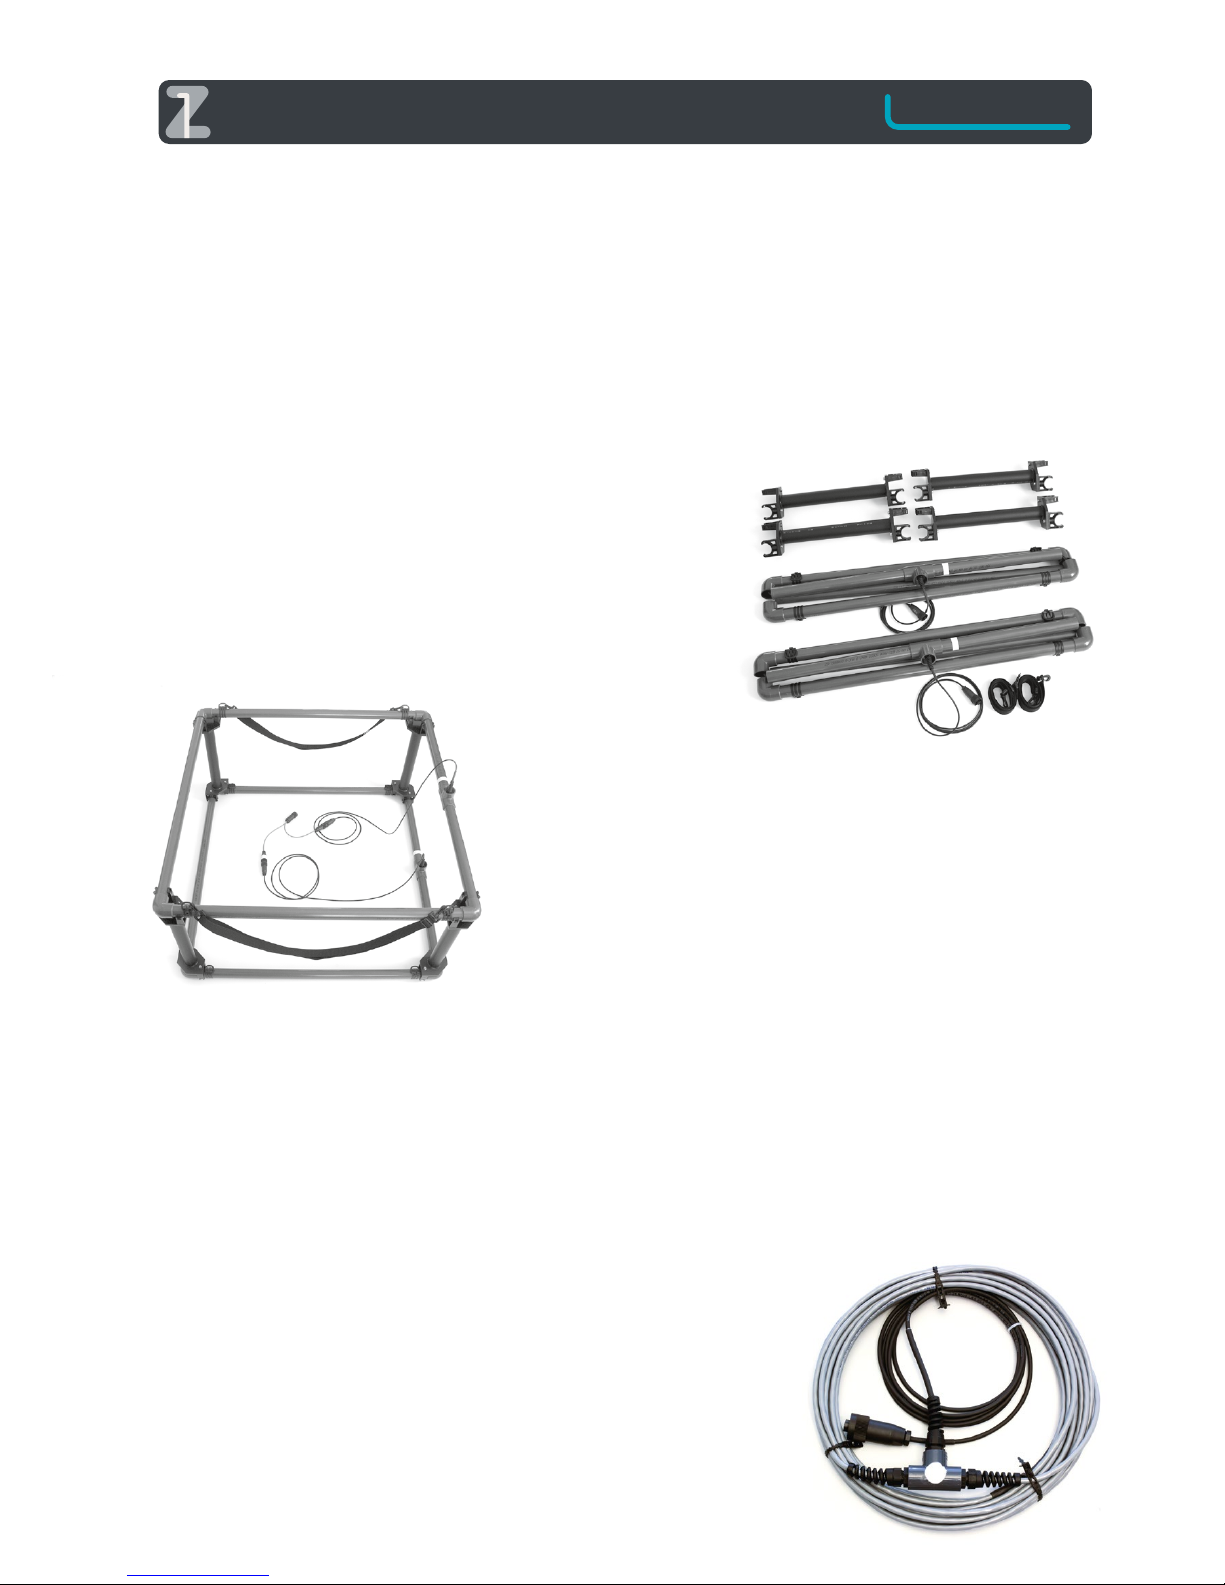
1m x 1m double frame coil kit
This specially designed double frame coil kit basically consists
of two 1m x 1m frame coils mounted on each other at a
distance of approximately 60 cm. Because of its ability to
cancel out interferences from power lines or radio transmitters it can be used in urban areas where single loop coils will
suffer from false signals and poor sensitivity when electromagnetic interferences are present.
The two coils receive the same amount of interference but
work in opposite directions. Therefore almost any interference
is subtracted from each other while signals from the ground
or metal objects will pass to the electronics. It is important
that the components of the double frame kit are put together
in the right order as described below. The available kit
consists of the following components: two 1m x 1m frame
coils; four black mounting devices 0,6m length; one Y adapter
cable with three connectors; two carrying straps.
The two 1m x 1m frames have to be mounted on each other
via the four mounting devices. They will automatically lock
when pressing them together.
Please make sure that both frames go in the same direction,
so that the two yellow marks are pointing to each other the
same way! Afterwards the marked Y adapter plug has to be
connected to the lower frame which points to the ground.
The second frame has to be connected to the other adapter
plug. The third connector has to be connected to the
electronics control box.
Note: It is advisable to make an operating test where the
lower search coil pointing to the ground gives a signal
when approaching to a metal piece located on the ground
and the upper coil will cause a decay of the signal when a
metal piece is approaching from the top towards the coil.
This could only be tested with DEL Delay settings and
turned off AUTO 0.
The sensitivity of this double frame coil is almost the same as
with the 1m x 1m single loop frame coil. This coil does only
suffer from a very weak sensitivity reduction of less than 10 %
for very deep and large metal objects. Especially when
working in the GND Ground mode it is very useful to work
with this particular search coil
due to very stable
and therefore
sensitive
operation.
Cable coil
12 meters perimeter1m x 1m (three windings), 1,5m x
1,5m (two windings) or 3m x 3m (one winding)
Similar to the 8m universal cable coil this large cable coil can be
arranged to three different frame coils by simply mounting one
two or three windings on a metal free frame with tape for
example. With the largest 3m x 3m frame coil the highest
possible detection depths can be achieved. This is mainly
possible because of specially developed electronics to
eliminate low frequency interference and a power pulse circuit
built-in the LORENZ DEEPMAX Z1. The high sensitivity for large
and deeply buried metal objects and the simple elimination of
smaller metal fragments make these three coils interesting. The
shape of these large coils should be the same as with the other
coils namely round or square. It is also possible to build
elliptical or different shapes but this is only achieved at the
expense of sensitivity. Anyway it is advisable to keep a distance
of at least 20 to 80 cm constantly between the coil and the
ground to reduce the amount of ground effects to a minimum
when using these very large coils. In urban areas the amount of
interferences produced from power lines will be higher than
with smaller coils and therefore again the sensitivity might be
reduced. The ground balancing system GND 1, 2, 3 should be
changed to DEL 1-4 in some cases using these large coils
because of the same reason. Some customers use these large
frame coils with two similar coils mounted on each
other at a distance of about 60
to 80 cm the same way as
the differential double
frame coil described
before. A Y- adapter
cable would be
necessary doing this.
A test making sure
that both coils work in
the same direction as
described before would
also be necessary.
13
Page 14
11. Detection depths I
11.1. Detection depths II
O R E NZ
14
26cm- 35cm 35cm- 45cm- 1m double
1,5m double
coil DD-coil DD-coil GND4* coil frame square frame square
Gold nugget d = 5 mm 22 cm 23 cm 28 cm (30 cm) X X X
Silver coin d = 1,3 cm 30 cm 30 cm 34 cm (30 cm) X X X
Gold coin d = 2 cm 40 cm 40 cm 45 cm 50 cm (50 cm) X X
Silver coin d = 2,5 cm 45 cm 46 cm 50 cm 55 cm (50 cm) X X
Brass plate 10 x 10 cm 80 cm 90 cm 100 cm 110 cm 145 cm 170 cm
Softdrink can 0,33 l 100 cm 110 cm 120 cm 130 cm 165 cm 200 cm
Brass plate 20 x 20 cm 105 cm 118 cm 130 cm 125 cm 185 cm 240 cm
iron box 30x18x15 cm 150 cm 160 cm 170 cm 200 cm 280 cm 340 cm
Fuel tank 20 l 160 cm 175 cm 185 cm 210 cm 300 cm 380 cm
Detection depths recorded in medium air; Function: DELAY 4 / *GND 4
X = outside the range of the coil.
Used Searchcoil
Metal object
26cm- 35cm 45cm- 1m double
1,5m double
coil DD-coil coil frame square frame square
Gold nugget d = 5 mm 15 cm 15 cm X X X
Silver coin d = 1,3 cm 22 cm 22 cm (20 cm) X X X
Gold coin d = 2 cm 29 cm 33 cm 31 cm X X
Silver coin d = 2,5 cm 35 cm 40 cm 42 cm X X
Brass plate 10 x 10 cm 75 cm 85 cm 95 cm 135 cm 160 cm
Softdrink can 0,33 l 80 cm 90 cm 100 cm 130 cm 160 cm
Brass plate 20 x 20 cm 100 cm 110 cm 125 cm 180 cm 230 cm
iron box 30x18x15 cm 130 cm 145 cm 165 cm 240 cm 320 cm
Fuel tank 20 l 150 cm 165 cm 190 cm 280 cm 370 cm
Detection depths recorded in medium air; Function: DELAY 3
X = outside the range of the coil.
Used Searchcoil
Metal object
Page 15
O R E NZ
12. Battery / charger
The LORENZ DEEPMAX Z1 is supplied with an external
rechargeable battery which will power the electronics 7 to
14 hours depending on the coil connected and the environmental temperature conditions. The usage time will be 10
hours under average conditions.
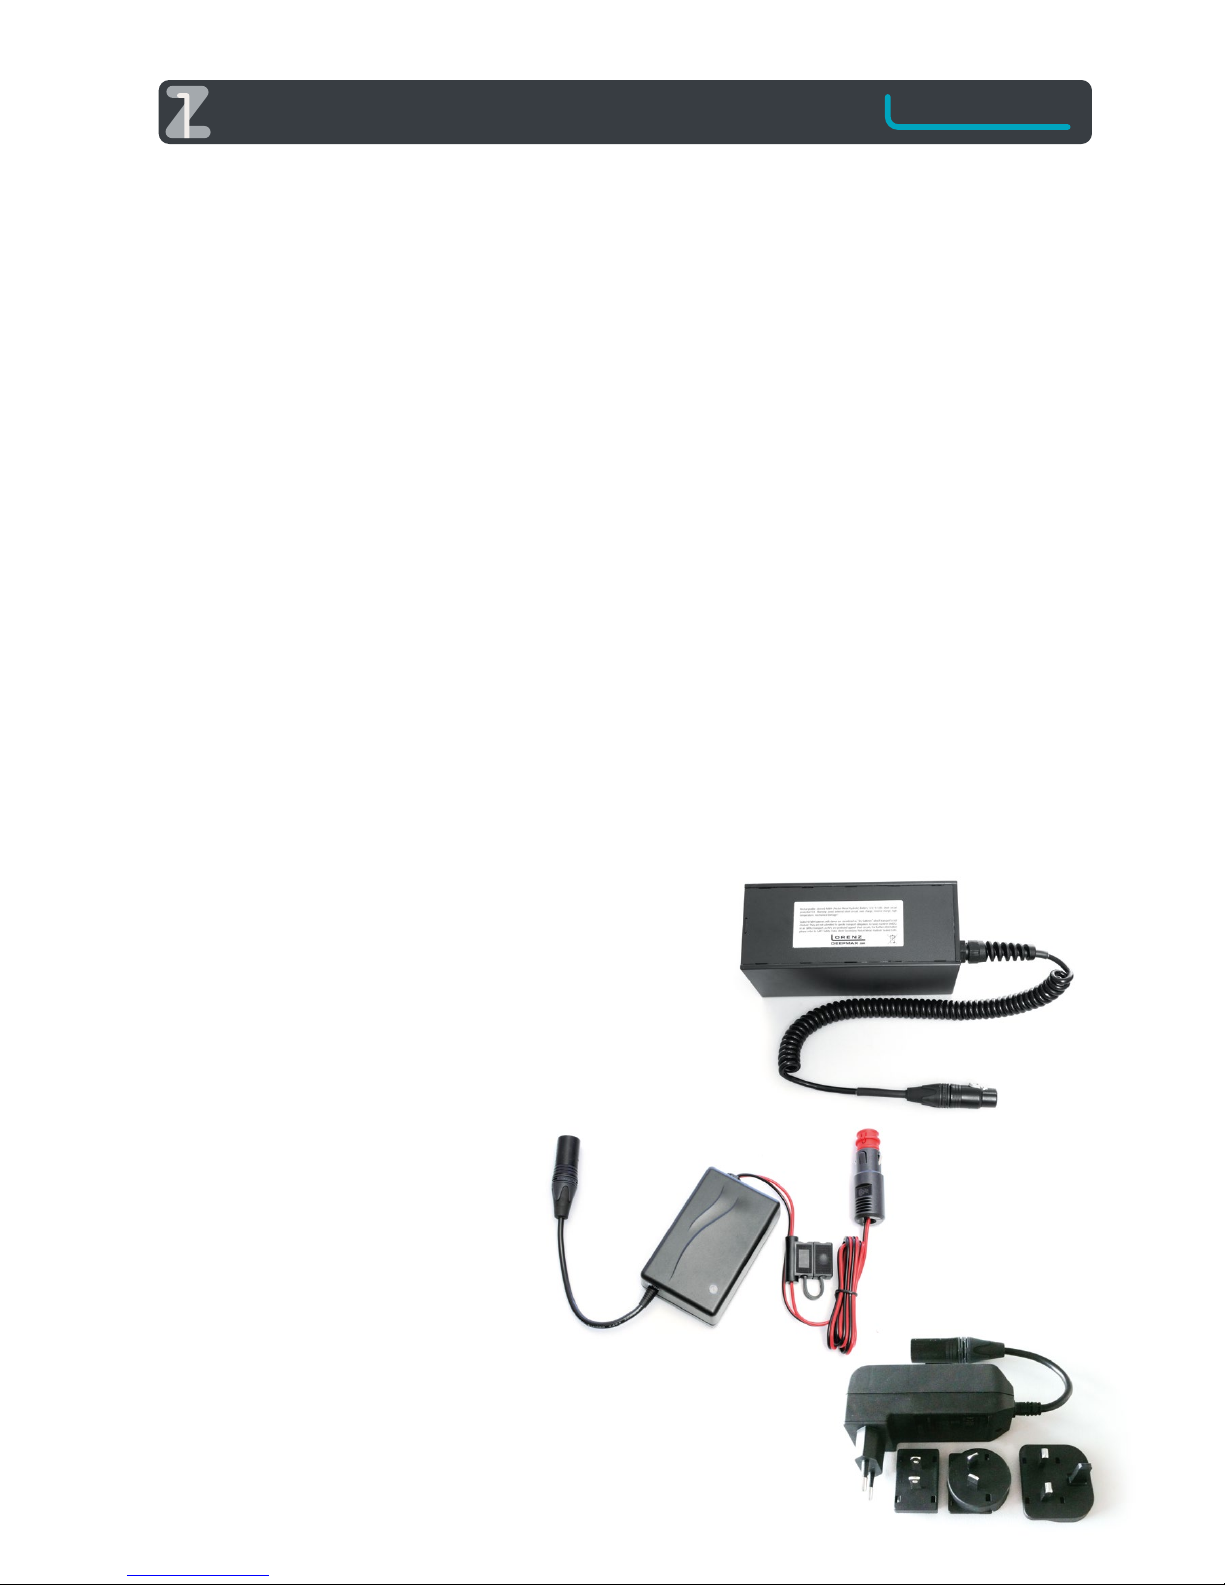
A discharged battery should be recharged with the supplied
fast charger. Therefore the plug of the charger has to be
connected to the plug of the external battery pack and the
AC- plug of the charger to the mains. The fast charge
electronics will automatically change to a trickle charge
mode or turns off when the battery is full. The battery is
therefore protected and can't be overcharged.
1 Lorenz Deepmax Charger
• Precharge = Flashing Amber
• Rapid charge = Amber
• Charge complete = Green
• Temperature Battery or ambient Temp. too high = Flashing
Red (After the Batteries have cooled down the charger
automaticly continious with charging the Batteries)
• Charge failure = Red
2 Optional Car Charger
• The different charge modes are indicated via the red/
orange / green light on the charger:
• Fast charge = Red
• Top of charge = Green with short yellow flashes
• Trickle charge = Green
• High Temeratute = Red and green flashes
The maximum recharge time is limited at approx. 6 hours on
an empty battery depending on ambient temp. and Battery
condition. The rechargeable battery pack can be recharged
at any time even if it is only used for a few minutes and the
capacity is still very high. The Battery is protected and can’t
be overcharged due to -delta U and temperature detection
of the charger.
The detector will automatically turn off when the battery is
low for safety reasons. When trying to turn on the detector
with low battery the display shows LOW BAT and turns off
automatically.
The following safety information must be read before using
the charger supplied with every DEEPMAX Z1 detector:
• Please read the user instructions before using the
charger
• For indoor use only (protect against moisture)
• Never try to charge ordinary non-rechargeable
batteries!
• Do only use to recharge 12V/ 9,5Ah NiMH battery
available from the manufacturer of the LORENZ
DEEPMAX Z1
• Rechargeable batteries supplied with the LORENZ
DEEPMAX Z1 contain chemical substances they are
subject to special waste disposal.
Charger Input data: UE = 90-264 V AC / 50-60 Hz
Car Charger Input Data: UE = 10-30 V DC
When disconnecting the charger from the mains it is
important to disconnect the plug from the battery pack as
well to avoid a slow discharge of the batteries. The supplied
charger has got a wide range of input voltages in order to fit
with any country mains. In conjunction with the NiMH
batteries which are considered as dry batteries with no
specific transport obligations for land maritime or air, this
battery/ charge system is therefore designed for worldwide
operation.
Note: Only spare parts and accessories available from the
manufacturer of the LORENZ DEEPMAX Z1 should be used.
To guarantee a long lifetime of the battery pack it should
never be completely discharged, as this can result in a loss
of capacity or complete damage of the battery.
Note: Do never forget to turn off the LORENZ DEEPMAX Z1
when it is not in use or when planning to store it. Disconnect all plugs from the control box when transporting or
storing it.
The capacity of the battery can always be checked when
turning the LORENZ DEEPMAX Z1 on with the Battery icon
on the top of the LC Display. If it is lower than 2 bars the
battery is nearly empty and less than 1 hour usage time can
be expected. Recharging of low batteries would be essential. Resulting damages of low discharged batteries can’t be
covered by warranty.
The life time of the supplied battery pack is limited to five
years. After this period of time the capacity of the battery
will constantly decrease, which makes an exchange necessary.
Note: Please make sure that the connector of the rechargeable battery is always kept dry and clean and that no
conducting material is in the near of the connector when
storing it. It is always necessary to take special precautions of avoiding short circuits when handling with
batteries!
15
Page 16

13. Interference
The LORENZ DEEPMAX Z1 was developed to ignore most
electromagnetic interference EMI received by the search
coil. In some cases however there are very strong interferences produced by power lines, railroad tracks or transmitters which are very difficult to suppress with electronic
circuitry as they are many times more intense than a signal
received from a metal object for example. Several filter
circuits have been added to the LORENZ DEEPMAX Z1 to
suppress most low frequency interference. Especially in the
near of power lines interference can be noticed with false
signals or rhythmic signals which cause indications on the
screen or an audio response.
In urban areas, near transmitters or when other metal
detectors are working close to the DEEPMAX Z1 interferences could also be expected. In general interference will
increase with the size of the search coil. Interference
received with large coils is often accepted in respect of the
high sensitivity still offered with those particular coils. In
some cases interference can be so intense that it is simply
impossible to work with the DEEPMAX Z1. Therefore it will
sometimes be necessary to change the frequency FREQ to
suppress some interference. The FREQ Frequency function
can therefore be turned to a lower or higher setting, until
the audio sound is clear and without any rhythmic pulses.
The sensitivity or the metal classification will not be
affected when doing this.
For further reduction of any pulsed interferences put
FILTER to a higher setting but this will also result in a
slower response speed which makes only sense with frame
coils but not with smaller coils.
If it is not possible to reduce interference by changing the
frequency and filter of the LORENZ DEEPMAX Z1 it is either
possible to put the AUDIO or SENS Sensitivity to a lower
setting until the noise disappears. When setting the
AUDIO setting to - the sensitivity of the LORENZ DEEPMAX
Z1 will be slightly reduced, but the amount of false signals
will also be greatly reduced. When connecting a smaller
search coil the amount of interference can also be
reduced. The compensated 1m x 2m frame mounted
search coil or the double frame coil do not suffer from
interferences, false indications are simply reduced when
using these coils. This will always guarantee a very stable
operation of the LORENZ DEEPMAX Z1. For the detection
of smaller objects the available 1m x1m double frame coil
should be rather used than the compensated 2m x 1m
(eight 8 shaped) coil. This specially designed frame coil is
capable to eliminate interference while offering detection
depths similar to a single loop 1m x 1m frame coil.
Especially when working in the GND mode this coil is the
best choice, as the electronics need a signal free of
interference to be able to cancel out the ground and to
distinguish between different metals.
Note: Low interference with clear audio response and
correctly tuned (zeroed) electronics is absolutely necessary to make exact metal classifications and ground
excluding functions possible. The LORENZ DEEPMAX Z1
has to be tuned and the right coil has to be chosen first
before starting to identify metal objects.
The electronics unit of the LORENZ DEEPMAX Z1 does not
suffer from any drift in general. That means only in case of
extreme temperature changes the electronics have to be
retuned with the ZERO button shortly. The same should
be done after the very first five minutes of operation since
many components inside the LORENZ DEEPMAX Z1
control box need to warm up to their working temperature. When working with small handheld search coils the
AUTO function can also be used to make the detector
work more stable.
14. Data Logger/
analyzing field data
To generate color, image, surface or contour maps with
the Lorenz DEEPMAX Z1, additional Hard- and Software is
necessary. A very sophisticated 6 channel data logger
function of the DEEPMAX Z1 metal detector will take
simultaneously six channels of data when you go over the
ground and stores the information into memory when this
function is selected (see chapter 3.2 for instructions).
After recording field data the Surfer Software easily and
accurately transforms the stored data into color, contour,
surface, image or vector maps on a computer in minutes.
An additional Scripter Software will therefore automatically generate twelve maps with each field. Six are two-dimensional and six three-dimensional. The operator can
therefore choose between different gridding and
mapping methods.
The LORENZ DEEPMAX Z1 Data Logger Hard/Software kit
developed by Lorenz Detecting Systems is first of all easy
to use, very accurately working and affordable. Only three
controls of the DEEPMAX Z1 will make data acquisition a
pleasure for both beginners and professionals like
engineers, geologists, archaeologists, scientists and many
more. The users will investigate mainly for waste disposal,
meteorites, or lost aircrafts.
No non- sense functions will confuse the operator. Six
different maps will be generated simultaneously when
covering the ground with multiple tracks. Each scan/ map
is different depending on the electronic analysis method
and therefore will not only give different sensitivity ranges
but can be the key to the probable kind of metal buried in
the ground. There is clearly a difference in the signature
metal objects and ground conditions will give for example.
Areas of disturbances in the scans will directly lead to the
different metals or ground signals and therefore can be
classified in some ways. The operator therefore can use
the different scans to his advantage in order to choose
between the metal objects of most interest only by
comparing the different scans/ maps. Three delay channels will produce maps with different sensitivity to small
and large metal objects. Two ground channels will enable
the operator to generate maps with no ground response
but Z dimensions and directions for different decay curves
of the eddy currents produced in a metal object. In
addition the metal classification channel will display the
delay of the eddy currents of each signal with a specific
color to give further information on the probable kind of
metal in the ground. No matter how strong the ground is
mineralized or how many different metals are located in
close proximity, this new device will ensure very good
O R E NZ
16
Page 17
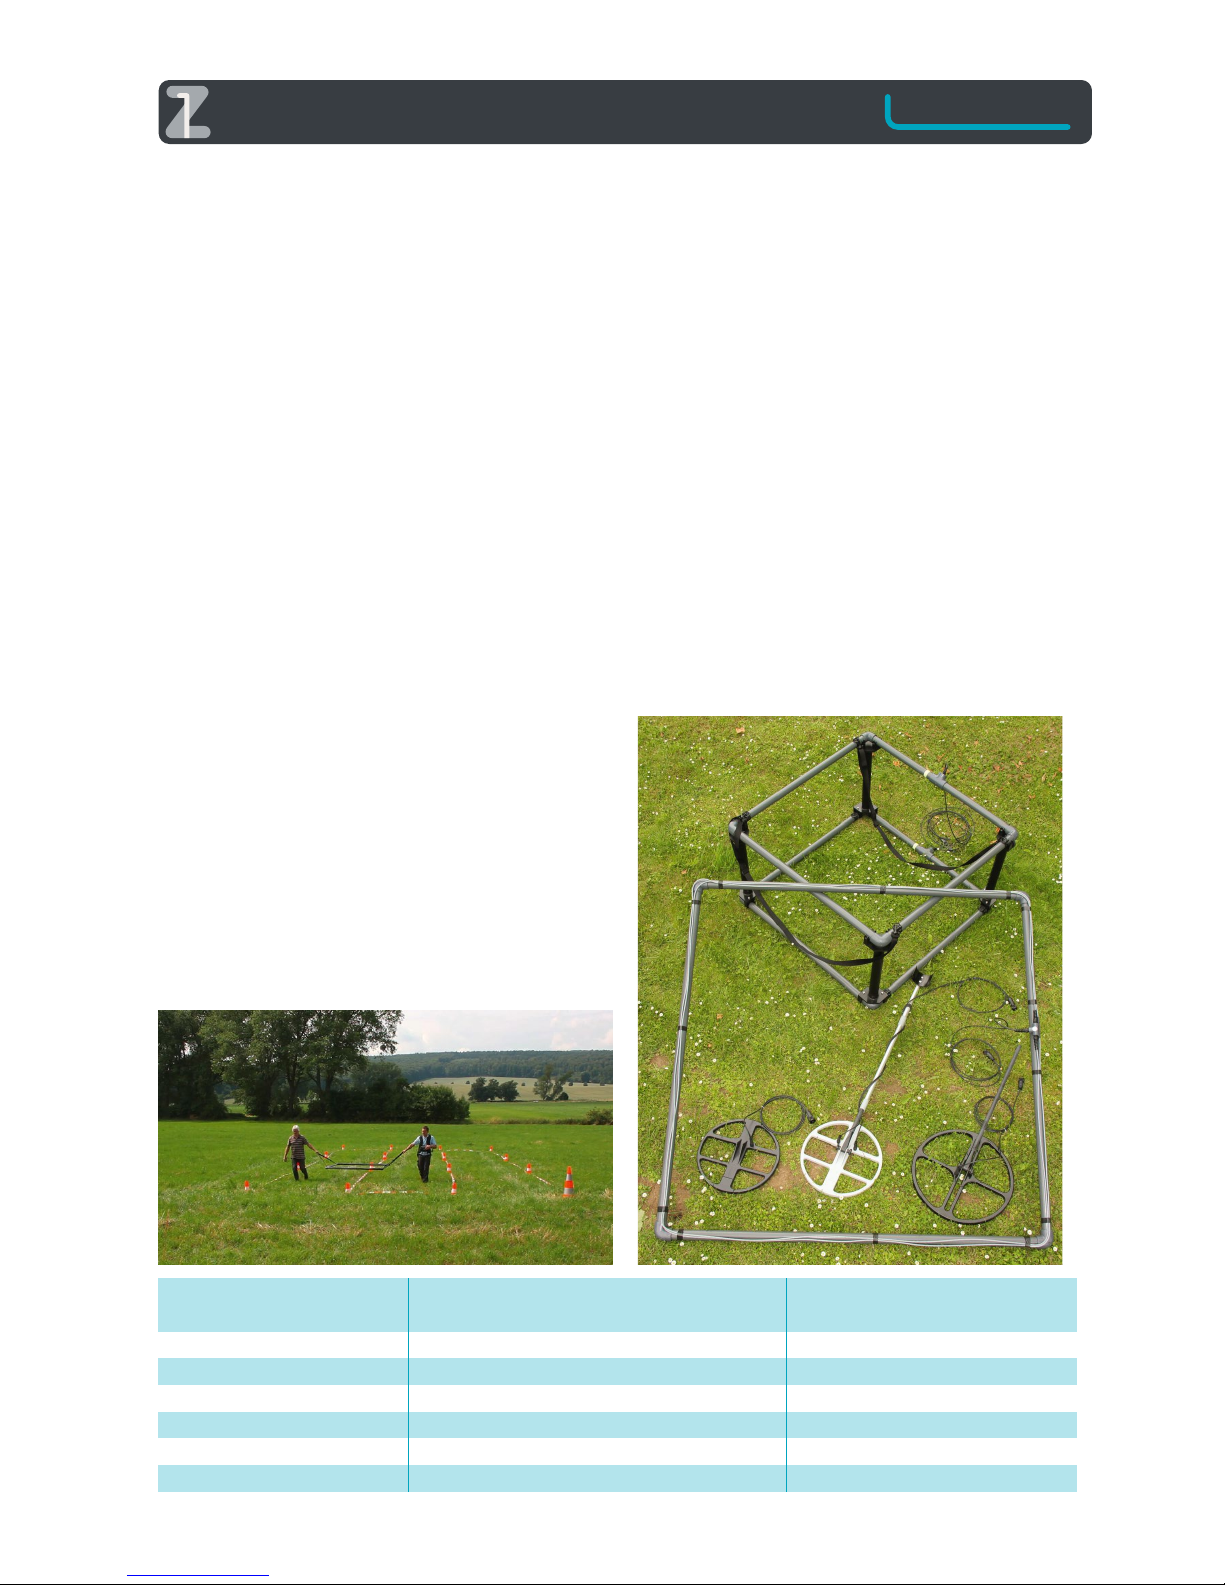
O R E NZ
results even with difficult surrounding conditions. Faults
produced by the operator or the environmental conditions like overload signals from nearby metal objects for
example will be immediately seen when comparing the
six channels. In addition GPS data is also recorded from a
supplied GPS module to support the user with a compass
function or to find the different fields after recording
again.
For the professional users additional Hard- and Software
will be available for storing positioning data from GPS and
several DEEPMAX Z1 detectors.
Although the detector can be used with smaller search
heads the data logger function is mainly developed for
larger metal objects being at least 6cm x 6cm in size.
Therefore frames of 1m x 1m or even bigger should be in
use to achieve best results.
To analyze the different pictures generated with the
software refer to the following instructions. Compared to
many other systems the Lorenz DEEPMAX Z1 will not only
generate one or several graphic representations with
different sensitivity ranges for the same metal objects but
also gives additional information on the probable kind of
metal being located. The advantages of the six channel
data logger are as follows:
• False or overload data will be easily recognized on one
or two of the maps. At the same time you will find
useful data on at least one or two channels. When
looking at the different maps/pictures select only
these with no ground signals or with the stronger
indications to avoid investigating on the small junk
objects like foils, nails, magnetic soils or littered
ground near the surface.
• Some signals appear on one scan and disappear on
others to give the operator more advanced informtion
on the kind of metal (decay of the eddy currents)
or the surrounding ground conditions.
• It is possible to separate two or more different metal
objects which give only one large indication in the
Delay channels but two on the metal classification or
Ground channels.
• Some ferrous metal objects lying horizontally in the
ground will cause a special triple signal with two high
and a low indication when looking at the Ground
channels.
• Signals with a fast decay of the eddy current like foils,
thin plates small nails will generate a negative peak in
the vertical Z direction in Ground 1 and 2 channels, At
the same time Metal objects with a long decay of the
eddy currents like massive copper, bronze, aluminum or
silver will cause a positive peak in Z direction. Ferrous
metal objects will only give weaker signals and there
fore a small indication in Z direction (in the three
dimensional surface maps only)
• When looking at the Ground channels most of the
ground and some of the smaller ferrous items will no
longer be displayed comparing them to the Delay
channels.
• On the metal classification pictures stronger signals
which generate a conductivity reading will produce
mainly a single color dot corresponding to the delay
reading on the display of the DEEPMAX Z1. Neutral
ground will cause a purple indication. Different nearby
metal objects lying in close proximity will give different
colors in most cases for better selection. See table of
metal classification indications with a 1m x 1m frame
coil:
17
Colour on metal Reading on the Lorenz Deepmax Z1 Corresponding
classification channel without data logger (00-99) possible metal object
Purple No Reading/ neutral No metal or signal to weak
Blue 00 - 10 Thin foil non-ferrous
Green 15 - 40 Small ferrous nail
Yellow 45 - 60 Ferrous metal object
Orange 65 - 75 non-ferrous metal object
Red 80 - 99 Large non-ferrous metal object
Page 18
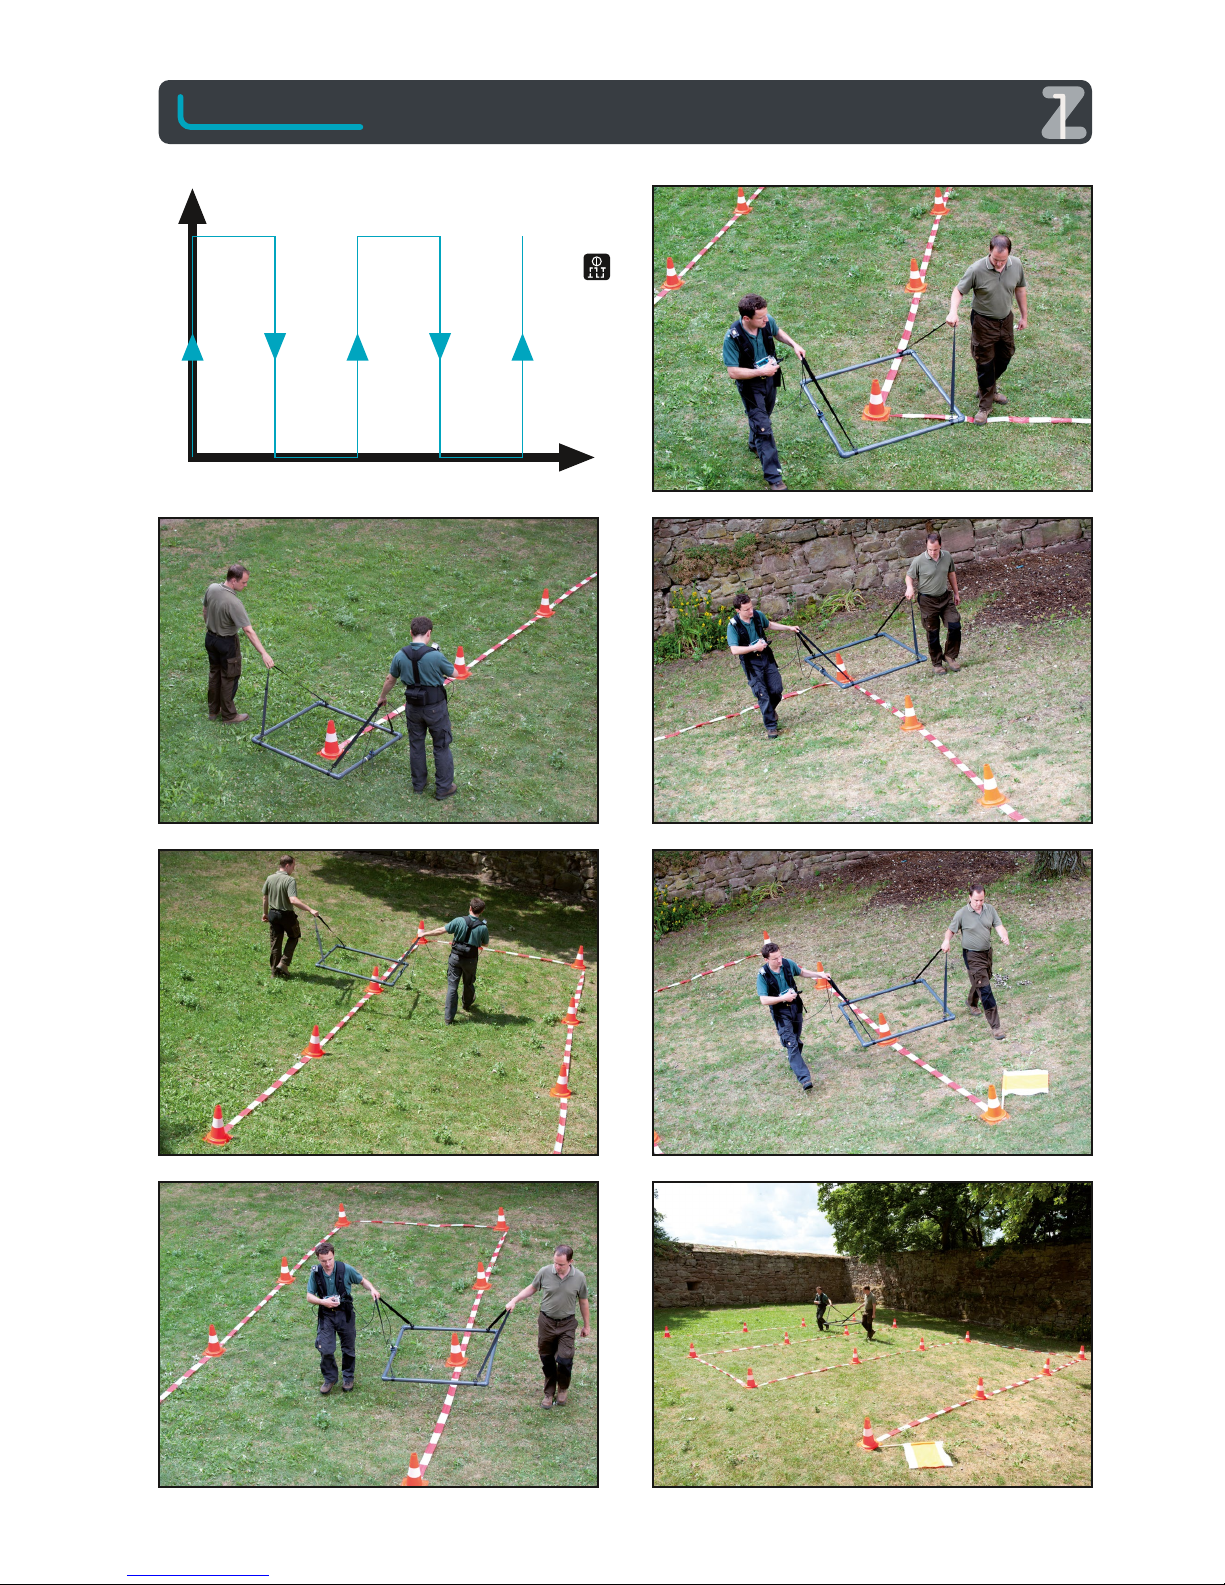
O R E NZ
18
Start/Stop
Line
Constant
Speed!
Start/Stop
Line
Start Sto p Start Sto p Start
Stop
Start
Stop
Start
Stop
End of field
press
to save
data
> further tracks
Beginning first track, starting point
>
Y
X
Start and Stop
will be triggered
with the ZERO
button.
Recording field data with the Lorenz Deepmax Z1
datalogger
Page 19

O R E NZ
15. Maintenance/service
The LORENZ DEEPMAX Z1 is practically service free. The
electronics control box and the other components should
always be kept clean and dry. This is particularly important
for the plugs and sockets, which should never be stored
when being wet. The electronics control box is water and
dust protected but it should be avoided to immerse the unit
in water. All search coils available for the LORENZ DEEPMAX
Z1 are waterproof up to the connector. All the connectors
should be kept dry.
The LORENZ DEEPMAX Z1 is ruggedly designed. All necessary electronic components are placed on two printed
circuit boards. The main circuit board is covered with a
special plastic to protect it from rapid temperature changes
and humidity.
Different components like the front panel, circuit boards and
connectors can easily be exchanged if necessary.
Guarantee
This Detector is guaranteed against defects in materials and
workmanship for two years within European Community
and one year outside the EC, with the exception of batteries
and accessories. The guarantee is not valid when disregarding following
• Non-observation of our guidelines in the operating
instructions
• Use outside the described applications
• Alteration to or opening of the device
• Mechanical damage caused by media, liquids, natural
wear and tear
• Electric installation
• Overloading of the detecting equipment
All of the components can be cleaned from dust with a soft
cloth if necessary. In case of false signals or any kind of
unstable operation please check the capacity of the battery
the condition of the connectors and cables/ search coils
first.
In the case of any false functions or problems occurring with
your LORENZ DEEPMAX Z1 detector do contact your dealer
where you have purchased your detector first before you
contact us at:
Lorenz Detecting Systems GmbH & Co. KG
Röpkestrasse 12 · 30173 Hannover Germany
Telephone: +49 (0)5 11 55 106 70
Fax: +49 (0)5 11 55 106 71
eMail: [email protected]
Internet: www.metaldetectors.de
www.deepmax.com
16. LORENZ DEEPMAX Z1
equipment/accessories:
LORENZ DEEPMAX Z1 detector only (without coils)
• Plastic carrying case with foam padding
• LORENZ DEEPMAX Z1 electronics control box
• Adjustable shoulder and belt strap with detachable
rechargeable battery pack
• Fast charger with wide range AC-input (90-264V)
• Euro AC- adapter
• Operating manual (English/ German)
• Stereo headphones with four way connector
LORENZ DEEPMAX Z1 Detecting kit includes in addition
• 1m x 1m frame coil with carrying straps
• Carrying bag for 1m x 1m frame coil
• Telescopic S pole, consisting of three rods
• 35cm DD- coil
LORENZ DEEPMAX Z1 Data Logger Hardware/Software kit
• Golden Software SURFER single license
• GPS- Module
• USB adapter cable for data transfer
• USB-Stick with Lorenz Data Converter Software
This kit was made for use with the DEEPMAX Z1 built-in data
logger function. To generate colour maps an additional
computer with following system requirements would also
be necessary, but not included with this kit: Windows XP SP2
or higher; Vista; 7; (Trade Mark of Microsoft), 1GB RAM,
100MB free hard disk space, 1024x768 or higher monitor
resolution with a minimum 16-bit colour depth
17. Specifications weight/
dimensions:
Electronics control box: 120x122x85mm
Carrying case for LORENZ DEEPMAX Z1: 400x300x220mm
1m x 1m frame coil (collapsed): 1080x150x150mm
Extended S-rod length: 1550mm
Collapsed S-rod length: 1030mm
Disassembled S-rod length: 690mm
LORENZ DEEPMAX Z1 electronics control box:
approx. 1300 g
Shoulder and belt strap with mounted external battery
pack: approx. 3000 g
Carrying case with LORENZ DEEPMAX Z1 inside: approx.
7000 g
Telescopic S pole: approx. 600 g
26cm single coil: Weight approx. 500 g*
26cm double D coil: Weight approx. 600 g*
35cm single coil: Weight approx. 600 g*
35cm double D coil: Weight approx. 800g*
45cm single coil: Weight approx. 700 g*
1m x 1m frame coil with cable inside tubes: Weight approx.
2600 g*
Universal cable coil 8m perimeter (can be used for
0,7mx0,7m; 1mx1m; 2mx2m and compensated 1m x 2m
frame mounted search coil): Weight approx. 600g*
Universal cable coil 12m perimeter (can be used for 1mx1m;
1,5mx1,5m; 3mx3m frame mounted search coil): Weight
approx. 900g*
1mx1m double frame coil kit: Weight approx. 7300 g*
Y-Adaptor cable: Weight approx. 100 g*
*all weights taken with connecting cable and connector!
The coils ranging from 26cm to 45cm diameter need a
telescopic S pole for operation.
Electrical data:
Search-frequency with small/large search coils connected:
approx. 2000 / 1000 pulses per second
Audio metal response voltage controlled oscillator VCO and
volume/ threshold control: 0 - 4000 Hz
19
Page 20
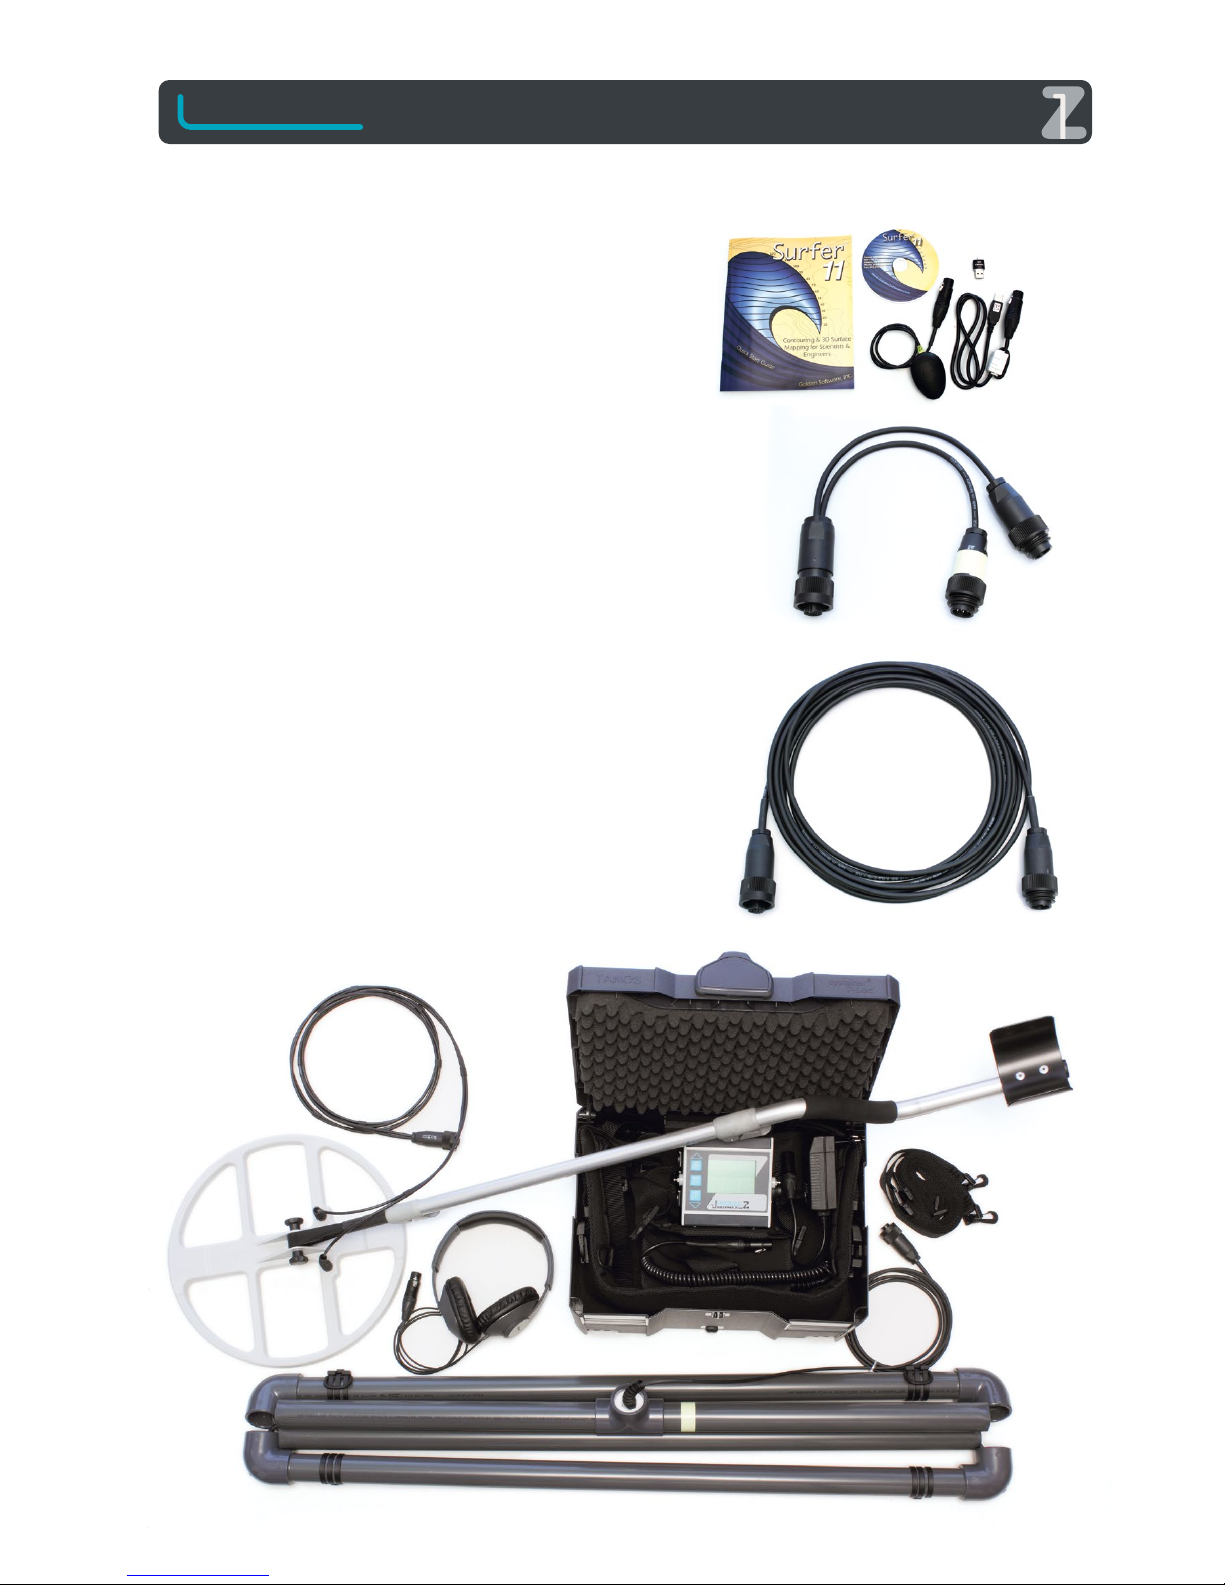
Power source: external rechargeable NiMH battery 12V/
9,5Ah (declared as dry battery)
Usage time: approx. 7 to 14 hours depending on temperature and connected coil
Battery charger: rapid charger with 90-264V AC/ 50-60Hz for
world-wide operation
Operating temperature: - 5°C to + 50°C
Detection depths: see chapter 11
Data logger:
six channel data acquisition, supported by GPS
Storage media: internal memory
Number of fields: 99
Sampling rate: 12 per second
Resolution: 24 bit
GPS Module:
Channels: 50 channels
Sensitivity -162 dBm
Frequency L1, 1575.42 MHz
C/A Code 1.023 MHz chip rate
Precisions: Position Horizontal 2.5m CEP, 2.0m SEP with SBAS
Date: WGS-84
Protocol: NMEA-0183 V3.01 GGA, GSA, GSV, RMC, VTG
Performance: Operating temperature: -20°C to +60°C
Dimensions: 65 x 45 x 22 mm
Search coils (interchangeable) electrostatic insulated/
shielded and waterproof up to the connector. The connectors themselves are not waterproof!
Design and specifications subject to change without notice!
Disposal Notice
In accordance with directive 2002/96/EC of European
Parliament and the council of January 27, 2003 on Waste
Electrical and Electronic Equipment (WEEE), products
labeled with the symbol of a crossed waste bin must not be
disposed of with unsorted municipal waste. For this purpose
please check for certain collecting points for electronics
equipment.
O R E NZ
20
 Loading...