

Page 1

MARINE ELECTRONICS
One Touch To Choose Your World
PANORAMIC 8 SUN
Sunlight Readable Display Color Chartplotter with external GPS Receiver
CODE: S3egLZ7wc 1100e805/110406
COMPACT 8 SUN
Sunlight Readable Display Color Chartplotter with internal GPS Receiver
CODE: S3igLZ7wc 1100e805/110406
USER MANUAL
Copyright 2006 LORENZ ELECTRONICS Italia.
All rights reserved. Printed in Italy. No part of this publication may be reproduced or distributed in any form or by any
means, or stored in a database or retrieval system, without prior written permission of the publisher.
Page 2

Warning!
Electronic charts displayed by the chartplotter are believed to be accurate and reliable, but they are not
intended to substitute for the official charts which should remain your main reference for all the matters related to the execution of a safe navigation.
For this reason we would like to remind you that you are required to carry on board and use the
officially published and approved nautical charts.
Caution
Please read through this manual before the first operation. If you have any questions, please contact
the Company customer service or your local dealer.
The chartplotter is not built water proof. Please give attention to avoid water intrusion into the
chartplotter. Water damage is not covered by the warranty.
Extensive exposure to heat may result in damage to the chartplotter.
Connection to the power source with reversed polarity will damage the chartplotter severely. This
damage may not be covered by the warranty.
The chartplotter contains dangerous high voltage circuits which only experienced technicians can
handle.
The C-MAP C-CARD are available from your local dealer.
We will not be liable for errors contained herein, or for incidental or consequential damages in
connection with the performance or use of this material.
Exposure of display to UV rays may shorten life of the liquid crystals used in your plotter. This
limitation is due to the current technology of the LCD displays.
Avoid overheating which may cause loss of contrast and, in extreme cases, a darkening of the screen.
Problems which occur from overheating are reversible when temperature decreases.
Cleaning procedure for the plotter screen
Cleaning of the plotter screen is a very important operation and must be done carefully. Since the
surface is covered by a antireflective coating, the procedure for cleaning all the surfaces can be performed using the following procedure: You need a tissue or lens tissue and a cleaning spray containing
Isopropanol (a normal spray cleaner sold for the PC screen, for example PolaClear by Polaroid). Fold
the tissue or lens tissue into a triangular shape, moisten the tip and use the index finger behind a corner
to move the tissue across the surface, in overlapping side to side strokes. If the tissue is too wet, a
noticeable wet film will be left in its path and you will need to repeat the process. If too dry, the tissue
won’t glide easily, and may damage the surface.
4
User Manual
Page 3

Table of Content
1 Introduction ........................................................................................... 11
2 Before You Begin ........................................................................................... 17
3 For the New User ........................................................................................... 27
1.1 CONVENTIONS ........................................................................................ 11
1.2 FEATURES ........................................................................................... 11
1.2.1 Specifications ................................................................................. 12
1.2.1.1 Main Characteristics .......................................................... 12
1.2.1.2 Physical Characteristics ..................................................... 14
1.3 BASICS ........................................................................................... 15
2.1 THE KEYBOARD ...................................................................................... 17
2.2 TURNING THE CHARTPLOTTER ON AND OFF .................................... 18
2.2.1 Turning On ...................................................................................... 19
2.2.2 Turning Off ...................................................................................... 19
2.3 CHANGING BACKLIGHT AND CONTRAST ........................................... 19
2.4 SELECTING THE LANGUAGE ................................................................ 19
2.5 EXTERNAL CONNECTIONS ................................................................... 20
2.5.1 GPS Connection ONLY FOR PANORAMIC 8 SUN ........................... 20
2.5.2 Autopilot Connection ...................................................................... 20
2.5.3 External NMEA Connection ............................................................ 21
2.5.4 C-COM GSM Plus Connection ....................................................... 21
2.5.5 Beacon Receiver Connection ......................................................... 22
2.6 ADDITIONAL C-CARDS ........................................................................... 23
2.6.1 Inserting C-CARD ........................................................................... 23
2.6.2 Removing C-CARD ......................................................................... 24
2.7 MENU OPTIONS ...................................................................................... 25
2.8 DATA ENTRY ........................................................................................... 25
3.1 SCREEN DISPLAY CONFIGURATION ................................................... 27
3.1.1 Charts and Text Area ..................................................................... 27
3.1.2 Depth Graph ................................................................................... 29
3.1.3 GPS Data Page .............................................................................. 29
3.1.4 Navigation Data Page ..................................................................... 30
3.1.5 Graphic Data (Rolling Road) Page ................................................. 30
3.1.6 The Wind Data Page ...................................................................... 31
3.2 BASIC SETTINGS .................................................................................... 31
3.2.1 Course Vector ................................................................................. 31
3.2.2 Screen Amplifier ............................................................................. 31
3.2.3 Advanced Functions ....................................................................... 31
3.2.4 User Points ..................................................................................... 32
3.2.5 Depth Window ................................................................................ 32
3.2.6 Units Selection ................................................................................ 32
3.2.7 Nav Aids Presentation .................................................................... 32
User Manual
5
Page 4

3.2.8 Input/Output Menu .......................................................................... 33
3.2.8.1 Port 1/Port 2/Port 3 Input ................................................... 33
3.2.8.2 Port 1/Port 2/Port 3 Output ................................................ 33
3.2.8.3 Port 1/Port 2/Port 3 NMEA Output Messages Selection ... 33
3.2.8.4 GPS Setup Menu ............................................................... 33
Internal GPS ONLY FOR COMPACT 8 SUN ......................... 34
Restart GPS ....................................................................... 34
Differential Correction Source ........................................... 34
Navigation Speed .............................................................. 34
3.2.8.5 Send & Receive Marks/Routes .......................................... 34
3.2.8.6 C-Link ................................................................................. 34
3.2.8.7 Cable Wiring Page ............................................................. 34
3.2.9 C-Voice Menu ................................................................................. 35
3.2.9.1 Navigation ........................................................................... 35
3.2.9.2 Echosounder ...................................................................... 35
3.3 A-B-C-D FUNCTION ................................................................................. 35
3.4 NAVIGATING TO A SINGLE DESTINATION .......................................... 36
3.5 C-MAP NT MAX INFORMATION ............................................................. 37
3.2.9.3 Output Port ......................................................................... 35
3.3.1 Inserting the A-B-C-D points .......................................................... 35
3.3.2 Deleting the A-B-C-D points ........................................................... 36
3.3.3 Navigating on the A-B-C-D points .................................................. 36
3.4.1 Distance and Bearing to Target (Destination) ................................ 36
3.4.2 Time To Go ..................................................................................... 37
3.4.3 Deleting Target ............................................................................... 37
3.5.1 Map Menu ....................................................................................... 38
3.5.1.1 Perspective View ............................................................... 38
3.5.1.2 Palette ................................................................................ 39
3.5.1.3 Map Orientation ................................................................. 39
3.5.1.4 Zoom Type ........................................................................ 39
3.5.1.5 Fonts & Symbols ............................................................... 40
3.5.1.6 Dynamic Nav-Aids ............................................................. 40
3.5.1.7 Mixing Levels ..................................................................... 40
3.5.1.8 Safety Status Bar (DSI - Data Safety Indicator) ............... 41
3.5.1.9 Currents Prediction ............................................................ 42
3.5.1.10Other Map Configurations ................................................. 42
3.5.2 Getting Automatic Info .................................................................... 46
3.5.2.1 Info on objects with Pictures ............................................. 46
Change Picture Size .......................................................... 47
3.5.2.2 Quick Info on Lakes ........................................................... 47
3.5.2.3 Full Info on Lakes .............................................................. 48
3.5.3 Info Tree and Expanded Info page ................................................. 48
3.5.4 Info Function ................................................................................... 49
3.5.5 Getting Port Info ............................................................................. 49
3.5.6 Getting Tide Info ............................................................................. 50
3.5.7 Find Function .................................................................................. 51
3.5.7.1 Finding Port Services ........................................................ 51
3.5.7.2 Finding Ports By Name ...................................................... 51
3.5.7.3 Finding Ports By Distance ................................................. 52
3.5.7.4 Finding Tide Stations ......................................................... 52
3.5.7.5 Finding Wrecks .................................................................. 52
3.5.7.6 Finding Obstructions .......................................................... 52
3.5.7.7 Finding POIs ...................................................................... 52
6
User Manual
Page 5

3.5.7.8 Finding Lakes By Names .................................................. 52
3.6 MAN OVERBOARD (MOB) ...................................................................... 53
3.5.7.9 Finding Lakes Information ................................................. 52
3.6.1 Inserting MOB .................................................................................. 53
3.6.2 Deleting MOB .................................................................................. 54
4 For the Experienced User .............................................................................. 55
4.1 MORE ABOUT CREATING AND USING ROUTES ................................ 55
4.1.1 Waypoint ......................................................................................... 55
4.1.1.1 Adding Waypoint ............................................................... 55
4.1.1.2 Creating a route ................................................................. 56
4.1.1.3 Deleting Waypoint ............................................................. 56
4.1.1.4 Deleting route .................................................................... 57
4.1.1.5 Distance and Bearing to Target ......................................... 57
Time To Go ........................................................................ 58
Deleting Target .................................................................. 58
4.1.1.6 Moving Waypoint ............................................................... 58
4.1.1.7 Inserting Waypoint ............................................................. 59
4.1.1.8 Editing Waypoint ................................................................ 60
4.1.1.9 Finding info about Waypoints: User Points List page ....... 61
Finding User Points ........................................................... 61
Deleting selected User Point ............................................. 61
Deleting all User Points with the same symbol ................. 61
Deleting all User Points with the same type ..................... 61
Deleting all stored User Points .......................................... 62
Send/Receive User Points ................................................ 62
4.1.2 Routes ........................................................................................... 62
4.1.2.1 Selecting Route ................................................................. 62
4.1.2.2 Deleting route .................................................................... 62
4.1.2.3 Reversing route ................................................................. 63
4.1.2.4 Route Color ........................................................................ 63
4.1.2.5 Finding information about a route: Route Report .............. 63
Selecting route ................................................................... 63
Changing Speed & Fuel values ......................................... 64
Reversing route ................................................................. 64
Deleting route .................................................................... 64
4.1.2.6 Route Name ....................................................................... 64
4.1.2.7 Send/Receive Route .......................................................... 64
4.2 MARK & EVENT ....................................................................................... 64
4.2.1 Marks ........................................................................................... 65
4.2.1.1 Adding Mark ....................................................................... 65
4.2.1.2 Deleting Mark ..................................................................... 65
4.2.1.3 Goto ................................................................................... 65
4.2.1.4 Moving Mark ...................................................................... 65
4.2.1.5 Editing Mark ....................................................................... 66
4.2.1.6 Finding information about Marks: User Points List page .. 67
4.2.1.7 Add to Route ..................................................................... 67
4.2.2 Events ........................................................................................... 67
4.2.2.1 Adding Event ..................................................................... 67
4.2.2.2 Deleting Event ................................................................... 67
4.2.2.3 Goto ................................................................................... 67
4.2.2.4 Editing Event ...................................................................... 68
4.2.2.5 Finding info about Events: User Points List page ............. 68
User Manual
7
Page 6

4.3 MORE ABOUT A-B-C-D FUNCTION ....................................................... 69
4.4 USING THE TRACK FUNCTIONS ........................................................... 70
4.5 USER C-CARD MENU ............................................................................. 72
4.6 C-LINK ........................................................................................... 73
4.7 C-LINK NAVIGATION DATA TRANSFER ............................................... 73
4.2.2.6 Add to Route ...................................................................... 68
4.3.1 Inserting the A-B-C-D points .......................................................... 69
4.3.2 Deleting the A-B-C-D Points ........................................................... 69
4.3.3 Deleting the A-B-C-D Segment ...................................................... 69
4.3.4 Moving the A-B-C-D points ............................................................. 69
4.3.5 Inserting the A-B-C-D points .......................................................... 70
4.3.6 Navigating on the A-B-C-D points .................................................. 70
4.4.1 Selecting active Track .................................................................... 70
4.4.2 Enabling Track storing .................................................................... 70
4.4.3 Displaying Track ............................................................................. 70
4.4.4 Selecting track Color ...................................................................... 71
4.4.5 Deleting Track ................................................................................ 71
4.4.6 Deleting Selected Track ................................................................. 71
4.4.7 Selecting Track memorizing type ................................................... 71
4.4.8 Selecting distance .......................................................................... 71
4.4.9 Selecting time ................................................................................. 72
4.5.1 Saving File ...................................................................................... 72
4.5.2 Loading File .................................................................................... 72
4.5.3 Deleting File .................................................................................... 72
4.5.4 Formatting User C-CARD ............................................................... 73
4.6.1 How C-Link system works .............................................................. 73
4.7.1 Operations ...................................................................................... 74
4.7.1.1 Introductive elements ........................................................ 74
4.7.1.2 C-Link serial connection .................................................... 75
4.7.1.3 Master Chart Plotter .......................................................... 75
Operating mode ................................................................ 75
4.7.1.4 Slave Chart Plotter ............................................................ 75
Operating mode ................................................................. 75
Stop current navigation ...................................................... 76
Inhibit Navigation operation ............................................... 76
Inhibit Route following ....................................................... 76
MOB handling .................................................................... 76
Notes .................................................................................. 76
4.7.1.5 C-Link navigation data: Acquisition and Display ............... 76
4.7.1.6 Graphical representation on Map Display ......................... 77
4.7.1.7 Route Data Report ............................................................. 77
4.7.1.8 Quick Info ........................................................................... 78
Route Navigation: Quick Info on the Destination .............. 78
Quick info on Single Destination ....................................... 78
5 Advanced Settings ......................................................................................... 79
8
5.1 SETUP ........................................................................................... 79
5.1.1 Time Reference ............................................................................... 79
5.1.2 Time Format .................................................................................... 79
5.1.3 Date Format ..................................................................................... 80
5.1.4 Wind Speed ..................................................................................... 80
5.1.5 Beeper ........................................................................................... 80
5.1.6 External Wpt .................................................................................... 80
User Manual
Page 7

5.1.7 Backlight Timeout ............................................................................ 80
5.2 FIX ........................................................................................... 80
5.2.1 Fix Correction ................................................................................... 81
5.2.2 Compute Correction ........................................................................ 81
5.2.3 Correction Offset ............................................................................. 81
5.2.4 Position Filter ................................................................................... 81
5.2.5 Speed Filter ..................................................................................... 81
5.2.6 Filter Dump ...................................................................................... 81
5.2.7 Dead Reckoning .............................................................................. 82
5.2.8 Static Navigation .............................................................................. 82
5.3 NAVIGATE ........................................................................................... 82
5.3.1 Coordinate System .......................................................................... 82
5.3.2 Fix Datum ......................................................................................... 82
5.3.3 Map Datum ...................................................................................... 83
5.3.4 Map Orientation Resolution ............................................................. 83
5.3.5 Roll Road Scale ............................................................................... 83
5.3.6 Reset Partial and Total Trip ............................................................. 83
5.4 COMPASS ........................................................................................... 83
5.4.1 Bearings ........................................................................................... 84
5.4.2 Variation ........................................................................................... 84
5.4.3 Calibration ........................................................................................ 84
5.5 ALARMS ........................................................................................... 84
5.5.1 Arrival Alarm .................................................................................... 84
5.5.2 XTE Alarm ........................................................................................ 85
5.5.3 Anchor Alarm ................................................................................... 85
5.5.4 Depth Alarm .................................................................................... 85
5.5.5 Grounding Alarm (Guardian Technology) ...................................... 85
5.5.6 Grounding Alarm Range ................................................................. 86
5.5.7 Grounding Alarm Report ................................................................ 86
5.6 SIMULATION ........................................................................................... 86
5.6.1 Activate Simulation .......................................................................... 86
5.6.2 Speed ........................................................................................... 86
5.6.3 Heading ........................................................................................... 86
5.6.4 Date and Time ................................................................................. 87
5.6.5 Cursor Control ................................................................................. 87
5.7 AIS MENU ........................................................................................... 87
5.7.1 AIS SYSTEM DEFINITIONS .......................................................... 87
5.7.2 AIS MENU ...................................................................................... 89
5.7.2.1 Display ............................................................................... 89
5.7.2.2 Activation range ................................................................. 89
5.7.2.3 CPA Alarm ......................................................................... 89
5.7.2.4 CPA Limit ........................................................................... 89
5.7.2.5 TCPA Alarm ....................................................................... 89
5.7.2.6 TCPA Limit ......................................................................... 90
5.7.3 TO SET THE CHART PLOTTER FOR RECEIVING AIS .............. 90
5.7.4 QUICK INFO ON AIS TARGET ..................................................... 90
5.8 C-STAFF ........................................................................................... 90
5.9 C-WEATHER SERVICE ........................................................................... 91
5.9.1 C-WEATHER SERVICE MENU ..................................................... 91
5.9.1.1 Download ........................................................................... 91
Select Country to Call ........................................................ 92
SIM PIN .............................................................................. 92
Download Area .................................................................. 92
User Manual
9
Page 8

5.9.1.2 Copy from USER C-CARD ................................................ 92
5.9.1.3 Weather Forecast .............................................................. 92
5.9.1.4 Real Time View ................................................... 93
5.10 FISH FINDER MENU .................................................................... 93
5.11 RADAR SETUP MENU ................................................................. 93
5.9.1.5 Type of Data ........................................................ 93
6 For the Technician .......................................................................................... 95
A Terms ......................................................................................... 105
B Smart DGPS WAAS Receiver ...................................................................... 111
Analytical Index ......................................................................................... 113
6.1 DIMENSIONS ........................................................................................... 95
6.2 INSTALLATION AND REMOVING ........................................................... 96
6.3 EXTERNAL WIRING ................................................................................ 97
6.4 TYPICAL CONNECTIONS ....................................................................... 98
6.5 TROUBLESHOOTING .............................................................................. 99
6.5.1 Problems and Solutions .................................................................. 99
6.5.2 Quick Reference Guide ................................................................. 100
6.5.3 If you need assistance .................................................................. 100
6.5.3.1 World Background Charts ............................................... 100
Worldwide Background Update ....................................... 100
6.6 SYSTEM TEST ....................................................................................... 101
6.6.1 RAM Menu .................................................................................... 101
6.6.2 Dim Menu ..................................................................................... 102
6.6.3 Cartridges ..................................................................................... 102
6.6.4 Serial Ports ................................................................................... 102
6.6.5 Modem Test .................................................................................. 103
B.1 INSTALLING ......................................................................................... 111
B.2 DIMENSIONS ......................................................................................... 112
10
User Manual
Page 9

1
Introduction
Congratulations on your purchase of the chartplotter!
If you have not used a position-finding instrument before and intend to use
your chartplotter for navigating, we suggest you should read this User Manual and
make sure you are familiar with its contents.
The User Manual is divided into three main parts. Chapter "Before You
Begin" introduces you to the basic information to get you start using the chartplotter. Chapter "For the New User" should be read first to become familiar with your
new instrument. Chapter "For the Experienced User" introduces the advanced features of the chartplotter.
1.1 CONVENTIONS
Throughout this User Manual, the labelled keys are shown in capitals letters
enclosed between single inverted commas, for example 'MENU'.
Menu operations are in bold characters listed by keys sequence with the
menu names enclosed between inverted commas, for example 'MENU' + "BASIC
SETTINGS" + 'ENTER' + "INPUT/OUTPUT" + 'ENTER' means: press the
'MENU' key, using the cursor key select the Basic Settings menu and press 'ENTER',
using the cursor key select the Input/Output menu and press 'ENTER'.
Terms underlined, for example Mark, are explained in the Appendix "Terms".
1.2 FEATURES
The chartplotter is a computer specifically designed for nautical use but, more
User Manual
11
Page 10

precisely, to ease and speed up all calculations, which so far have been done manually. If connected to a positioning instrument, the chartplotter displays the current
position, the speed, and the heading of the boat and its Track. The user information
like Waypoints, Marks and Tracks can then be stored on a User C-CARD and can be
recalled at any time. On the screen are shown navigation data and cartographic information obtained from electronic charts of C-MAP C-CARD.
When the package containing the chartplotter is first opened, please check it
for the following contents (if any parts are missing contact the dealer the chartplotter was purchased from):
• External quick disconnect bracket and I/O cable 1,5 mt/5.9"
• Chartplotter's protective cover
• Fuse 2 Amp. + fuseholder
• User Manual
Note ONLY FOR PANORAMIC 8 SUN
The package contains the following parts too: Flush mounting kit; Smart DGPS WAAS Receiver
with cable 15 mt/45 feet.
C-MAP C-CARD (cartography data cards) are available through your local
dealer. For additional information on C-MAP Cartography visit web site at www.cmap.com.
1.2.1 SPECIFICATIONS
1.2.1.1 Main Characteristics
Recordable Individual points
• User Points : 500
• Type of User Points : 16
Routes
• Routes : 25
• Max User Points per Route : 100
Tracking
• Tracks : 2
• Points per Track : 1000
• Step by Distance : 0.01, 0.05, 0.1, 0.5, 1, 2, 5, 10 Nm
• Step by Time : 1, 5, 10, 30 Sec, 1, 5, 10 Min
Cartographic Functions
• Detailed Map by using C-MAP C-CARD
• Coordinates System (ddd mm ss, ddd mm.mm, ddd mm.mmm, UTM, OSGB, TD)
12
User Manual
Page 11

• Map Datum
• Display Mode (Full, Simple, Fishing, Low, Custom)
• Marine
Place Names, Name Tags, Nav-Aids & Light Sectors, Attention Areas, Tides &
Currents, Seabed Type, Ports & Services, Tracks & Route
• Depth
Depth Range Min/Max
• Land
Land Elevation, Land Elevation Values, Roads, Points Of Interest
• Chart
Lat/Lon Grid, Chart Boundaries, Value-Added data, Chart Lock
• Underwater Objects
Underwater Objects Limit, Obstructions, Diffusers, Rocks, Wrecks
Map Menu
• Zoom Type
• Fonts & Symbols
• Perspective View
• Dynamic Nav-Aids
• Map Orientation (North, Head, Course)
• Mixing Levels
• Safety Status Bar
• Palette
• Currents Prediction
Fix Functions
• Fix Correction (manual and automatic)
• Position Filter
• Speed Filter
• Dead Reckoning
• Screen Amplifier
• Reset Total and Partial Trip
• Rolling Road Scale
• Fix Datum
• Compass Calibration
• Bearings True and Magnetic
• Variation user selectable
• Course Vector
• Static Navigation
• A-B-C-D Function
User Manual
13
Page 12

Report Functions
• GPS Data Page
• Navigation Data Page
• Graphic Data Page
• Depth Graph Page (1/2 screen and 1/3 screen)
• Wind Data page
• About Page
Special Functions
• C-Link, C-Weather Service and C-Staff
• AIS Menu
• Fish Finder capability if connected to Fish Finder Black Box
• Radar functions display if connected to Radar scanner
• Automatic Info
• Find (Nearest Service, Tide Stations, Wrecks, Obstructions, Port By Name, Port
By Distance, Lakes By Name, Lakes Information, POIs)
• Navigation to Destination
• Speed Unit (Mph, Kts, Kph)
• Distance Unit (Km, Nm, Sm)
• Depth Unit (Ft, FM, Mt)
• Altitude Unit (Ft, FL, Mt)
• Temperature Unit (°C, °F)
• Alarms Handling
Arrival Alarm, XTE Alarm, Anchor Alarm, Depth Alarm, Grounding Alarm,
Grounding Alarm Range, Grounding Alarm Report
• MOB Function
• Simulation
Speed, Heading, Date, Time, Cursor Control, Activate Simulation
Auxiliary Memory
• User C-CARD 1/2/4 MB
Interface
• Three I/O ports
1.2.1.2 Physical Characteristics
Chartplotter size (inch/mm)
• 9.5" x 5.9" x 1.6" (241 mm x 151 mm x 41.5 mm)
Chartplotter weight
• 1,1 Kg
Display
• Sun Light Viewable (active area 7")
14
User Manual
Page 13
• Resolution 480 x 234 pixels
Power consumption
• 630mA max @ 10V
Power supply
• 10 - 35 Volt dc, 7.5 Watt max
Operating Temperature Range
• from 0°C to 55°C (from 32°F to 131°F)
Memory
• Non volatile with battery back-up
Keyboard
• Backlighted, silicon rubber
1.3 BASICS
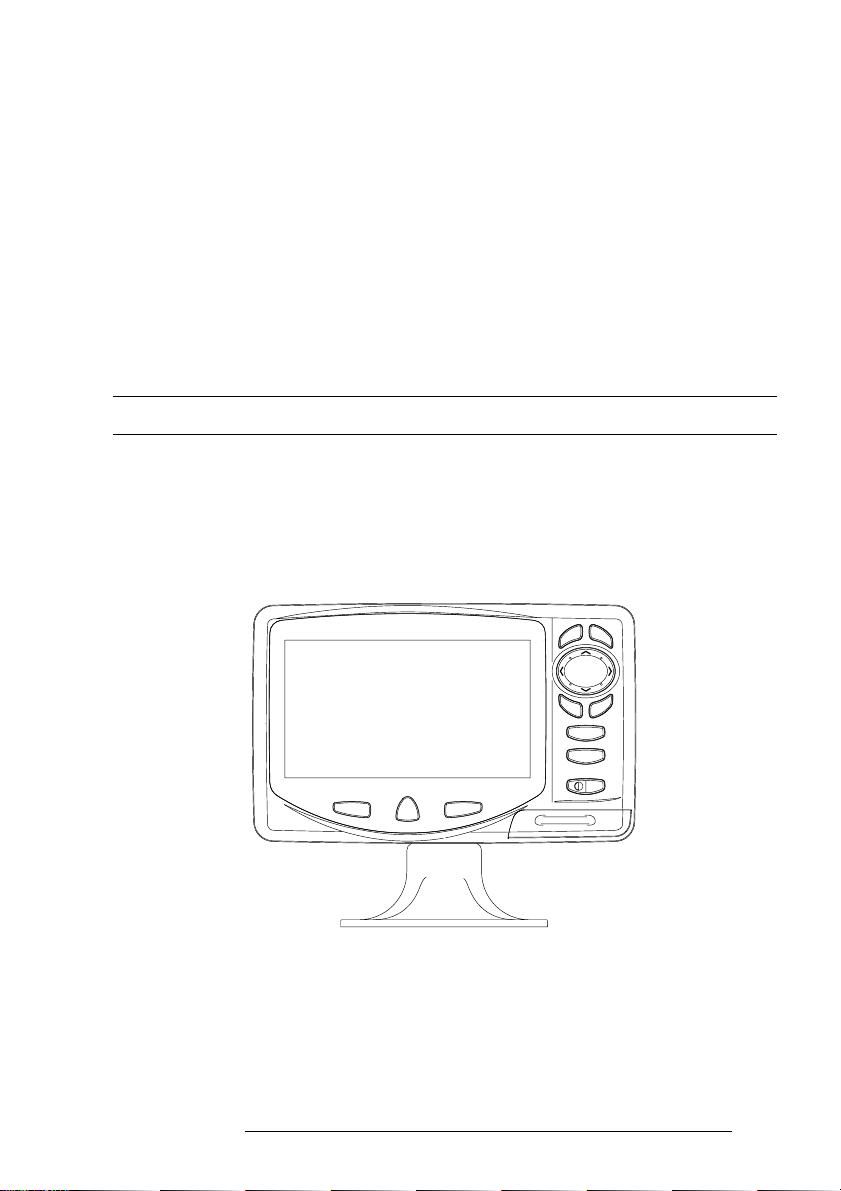
The chartplotter is controlled by using ten keys. There is also a cursor key to
move a cursor across the screen. As you press a key, a single audio beep confirms the
key action; every time the key pressed is not valid, three rapid beeps sound indicates
that no response is available.
User Manual
Fig. 1.3 - The chartplotter
15
Page 14

16
User Manual
Page 15
2
Before You Begin
This chapter provides basic information to get you start using the chartplotter; it will help you to become familiar with the chart display and the functions of
the controls before you start using the chartplotter.
2.1 THE KEYBOARD
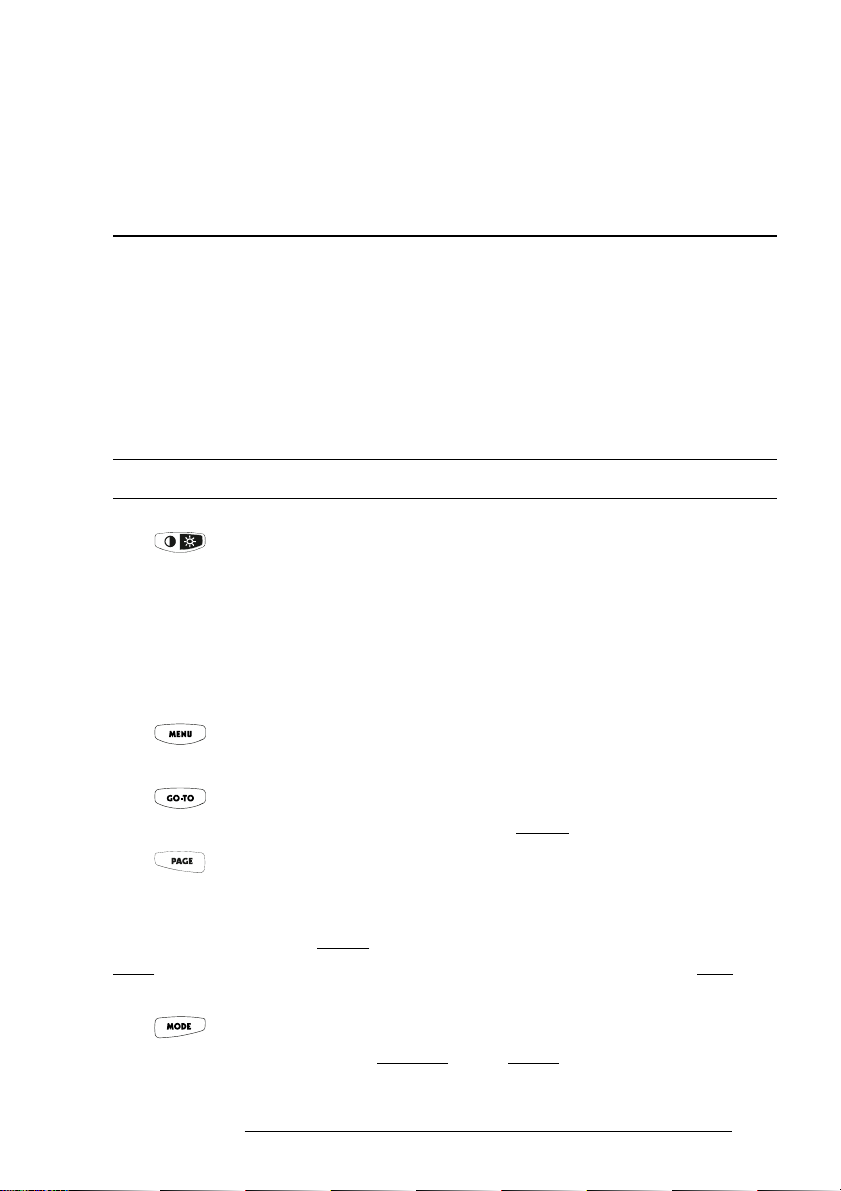
The 'CONTRAST'/'BACKLIGHT'/'POWER' key
Press and hold for 1 second the right side of 'POWER' to turn the chartplotter On. Press and hold the right side of 'POWER' down (once the chartplotter has
been turned On) for 3 seconds turns the chartplotter Off.
Press and immediately release the right side of 'POWER' to adjust the backlight, press and immediately release the left side of 'POWER' to adjust the contrast
of the display.
The key
Press 'MENU' to select the Functions Menu.
The key
Place the cursor and press 'GO-TO' to set Target.
The key
Press 'PAGE' to select the configuration our wish among cartography and
text area in two different modes (text area on the right side or on the bottom line of
the screen, full screen if Target has been inserted or with partial information on
SOG), only cartography, Depth Graph 1/2 screen and 1/3 screen pages, GPS Data
page, Navigation Data page, Graphic Data page, Wind Data page.
The key
Press 'MODE' to set the Navigate mode (Home).
User Manual
17
Page 16
The key
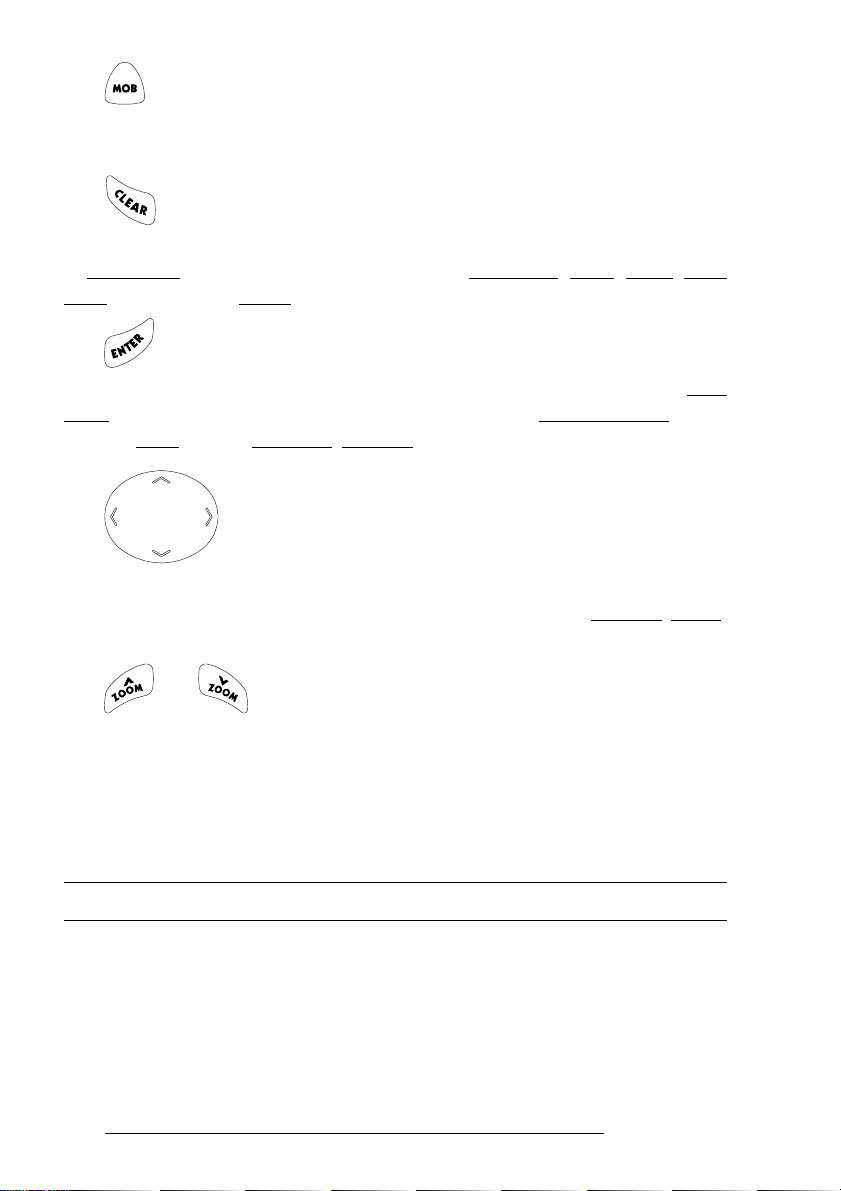
Press 'MOB' to set MOB (Man OverBoard). When MOB is activated, press
'MOB' to delete it.
The key
Press 'CLEAR' to exit from menu or to leave a menu without making changes.
In Basic Mode deletes the A, B, C, D points, the User Point (Mark, Event, Waypoint), the MOB, the Target identified by the cursor.
The key
Press 'ENTER' to select the desired option, to confirm selection; in Basic
Mode places A, B, C, D points on the cursor coordinates, in Advanced Mode creates
Objects (Mark,, Event, Waypoint, A-B-C-D).
The cursor key
The cursor key moves the cursor about on the display screen, quickly and
accurately. It also scrolls the desired option in the menu page(s). If in Navigate (Home)
mode, it allows to exit from navigate mode.
The and keys
Press 'ZOOM IN' shows more details of a smaller area, by changing the
chart scale and zooming in on your display. Press 'ZOOM OUT' to operate similarly to the 'ZOOM IN', except in reverse, changing the scale and showing a wider,
otherwise less detailed view.
2.2 TURNING THE CHARTPLOTTER ON AND OFF
Before powering On the chartplotter, check for the correct voltage (10-35
volt dc, see Par. 6.3) and the correct connections with the positioning instrument
(see Par. 2.5).
18
User Manual
Page 17

2.2.1 TURNING ON
Press and hold the right side of 'POWER' for 1 second. The chartplotter
emits one rapid beep sound and a title page is opened.
After a few seconds, the first of the two Caution Notice pages is displayed,
reminding you that the chartplotter is only an aid to navigation, and should be used
with appropriate prudence. The electronic charts are not intended to substitute for
the official charts. Then the cartographic screen is displayed.
2.2.2 TURNING OFF
Press the right side of 'POWER' and hold for 3 seconds: a countdown timer
appears on the screen, if you release the key before the countdown timer reaches
zero, the chart plotter will remain On.
2.3 CHANGING BACKLIGHT AND CONTRAST
Press and immediately release the right side of 'POWER' (do not press and
hold the key, or the "power-off" message will be displayed!): the backlight increases.
Repeat this operation the backlight decreases.
Press and immediately release the left side of 'POWER': the contrast increases.
Press and immediately release the left side of 'POWER' the contrast decreases. In
other words, first pressure of the key will increase the value till you keep it pressed,
next pressure of the key will decrease the value till you keep it pressed.
WARNING !!!
At very low temperatures the CCFL backlight may not glow properly. Allow a few minutes for
it to warm up.
2.4 SELECTING THE LANGUAGE
It is possible to select the language in which you wish information to be
displayed (for screen labels, menus and options, but it is not affect the map information). The default setting is Italian.
'MENU' + "BASIC SETTINGS" + 'ENTER' + "LANGUAGE" + 'ENTER'
Choose the language you prefer and press 'ENTER' to confirm.
User Manual
19
Page 18
2.5 EXTERNAL CONNECTIONS
2.5.1 GPS CONNECTION O
NLY FOR
PANORAMIC 8 S
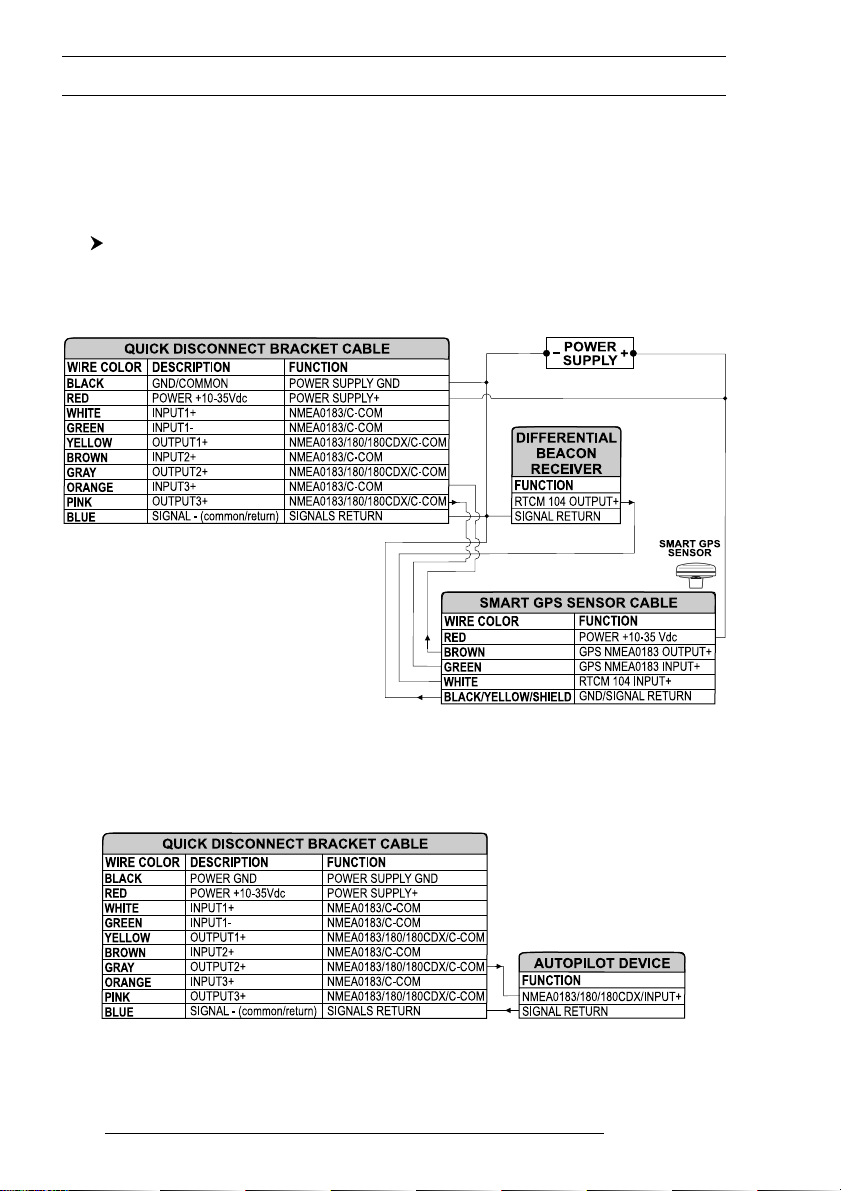
Connect the GPS to the Port 3: see the picture in Fig. 2.5.1.
Control the input setting following the procedure:
'MENU' + "BASIC SETTINGS" + 'ENTER' + "INPUT/OUTPUT" + 'ENTER' +
"PORT 3 INPUT" + 'ENTER' + "NMEA-4800-N81-N" + 'ENTER'
The GPS can be connected also to the Port 1 and 2, in this case select
NMEA0183-4800-N81-N on the used port.
UN
Fig. 2.5.1 - GPS Connection on Port 3
2.5.2 AUTOPILOT CONNECTION
To connect the Autopilot to the Port 2 see the following picture:
Fig. 2.5.2a - Autopilot Connections on Port 2
20
User Manual
Page 19
To choose your preferred setting follow the procedure:
'MENU' + "BASIC SETTINGS" + 'ENTER' + "INPUT/OUTPUT" + 'ENTER' +
"PORT 2 OUTPUT" + 'ENTER'
Then choose your preferred setting among the NMEA available settings
NMEA 0183 4800-N81-N, NMEA 0180, NMEA 0180/CDX (the default setting is
NMEA 0183 4800-N81-N) and press 'ENTER' to confirm.
The autopilot can be connected also to the Port 1 and 3, in this case select the
output format on the used port.
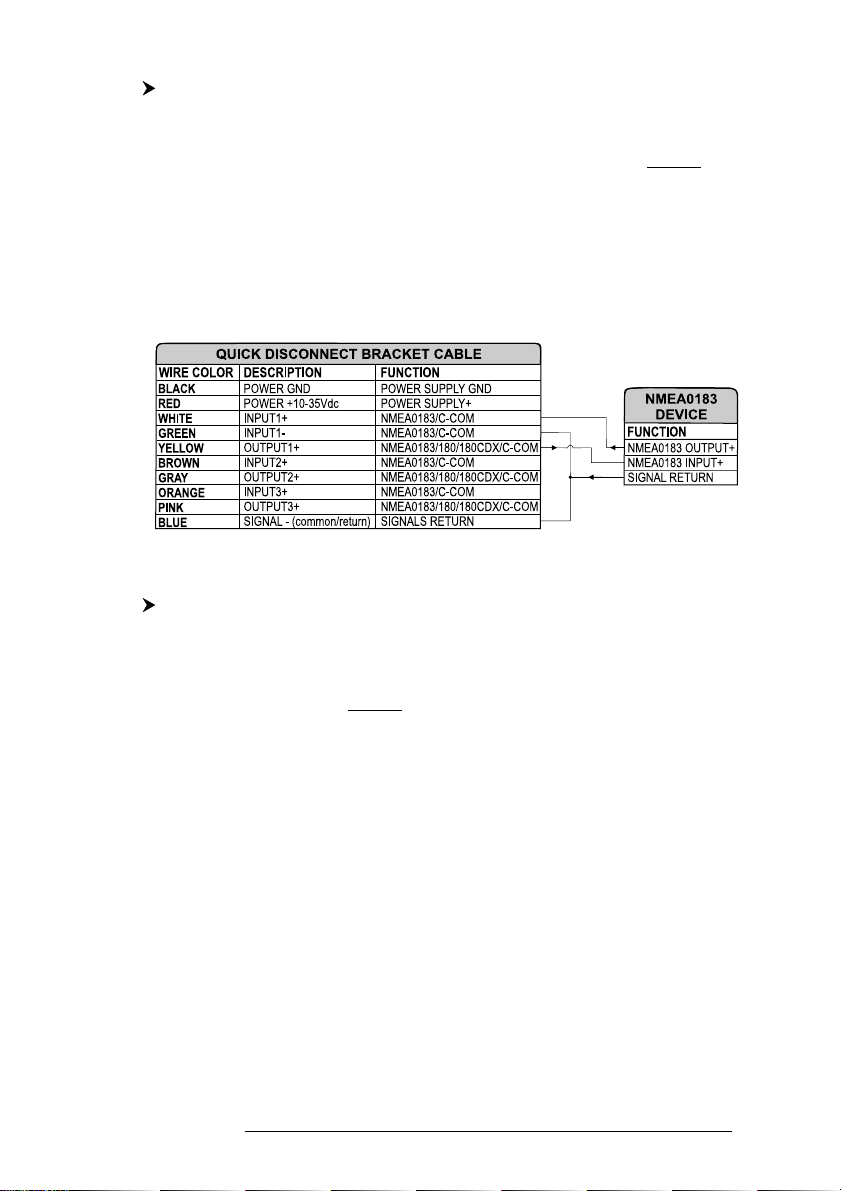
2.5.3 EXTERNAL NMEA CONNECTION
To connect the External NMEA to the Port 1 see the following picture:
Fig. 2.5.3 - External NMEA Connections on Port 1
To choose your preferred setting follow the procedure:
'MENU' + "BASIC SETTINGS" + 'ENTER' + "INPUT/OUTPUT" + 'ENTER' +
"PORT 1 INPUT" + 'ENTER'
Then choose your preferred setting among the NMEA available settings
NMEA 1200-N81-N, NMEA 4800-N81-N, NMEA 4800-N82-N, NMEA 9600-O81N, NMEA 9600-N81-N (the default setting is 4800-N81-N) and press 'ENTER' to
confirm.
An NMEA device can be connected also to the Port 2 and 3, in this case
select the format on the used port. Doing connection remember that only the Port 1
is optoisolated in input.
2.5.4 C-COM GSM PLUS CONNECTION
To connect the modem C-COM to the chart plotter with quick disconnect
bracket follow the procedure:
1. Cut the C-COM cable about 5 cm from the "T" connector:
User Manual
21
Page 20
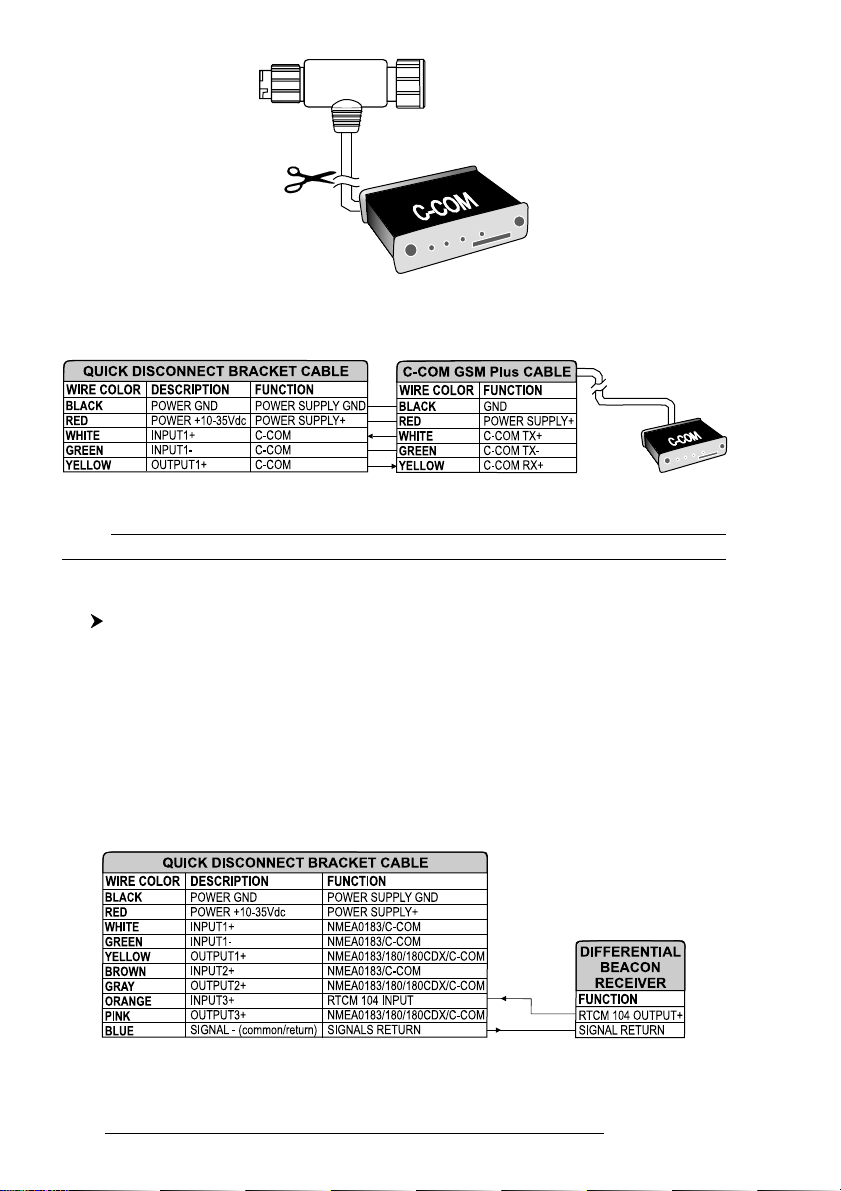
Fig. 2.5.4 - C-COM cable
2. Connect the wires to the quick disconnect bracket cable as follows:
Fig. 2.5.4a - Connection for the Port 1
Note
The connection is valid for the C-COM IR and C-COM RS232 too.
3. Set the C-COM for Port 1 as follows:
'MENU' + "BASIC SETTINGS" + 'ENTER' + "INPUT/OUTPUT" + 'ENTER' +
"PORT 1 INPUT" + 'ENTER' + "C-COM" + 'ENTER'
The C-COM can be connected also to the Port 2 and 3, in this case select the
format on the used port.
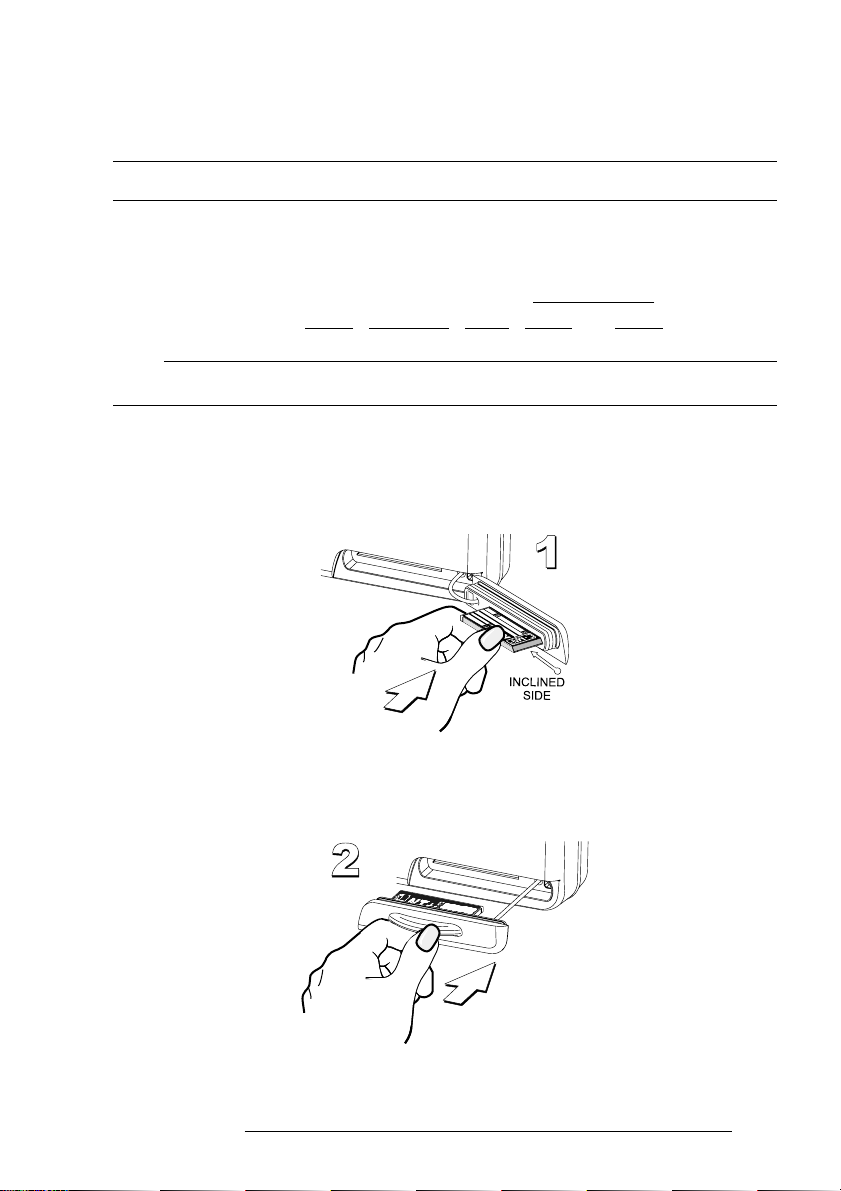
2.5.5 BEACON RECEIVER CONNECTION
O
NLY FOR
COMPACT 8 S
To connect a Differential Beacon Receiver see the following picture:
UN
22
Fig. 2.5.5 - Beacon Receiver Connection
User Manual
Page 21
O
NLY FOR
PANORAMIC 8 SUN:
To connect a Differential Beacon Receiver see Fig. 2.5.1.
2.6 ADDITIONAL C-CARDS
The chartplotter uses two types of C-MAP cartridges: either a chart cartridge
or a data storage cartridge. A chart cartridge, called C-CARD, contains detailed charts
of the area covered. A data storage cartridge, called User C-CARD can be used to
permanently store your Routes, Waypoints, Marks, Events and Tracks (see Par. 4.6).
Note
During normal operations the C-CARD should not be removed since the chart plotter may lock
up.
2.6.1 INSERTING C-CARD
Open the door, hold the C-CARD by the long side and gently push the
C-CARD into the door slot, as shown in the following picture:
Close the door pushing the C-CARD in as far as it will go to hold fixed into
the chart plotter slot:
User Manual
Fig. 2.6.1 - Inserting C-CARD (I)
Fig. 2.6.1a - Inserting C-CARD (II)
23
Page 22
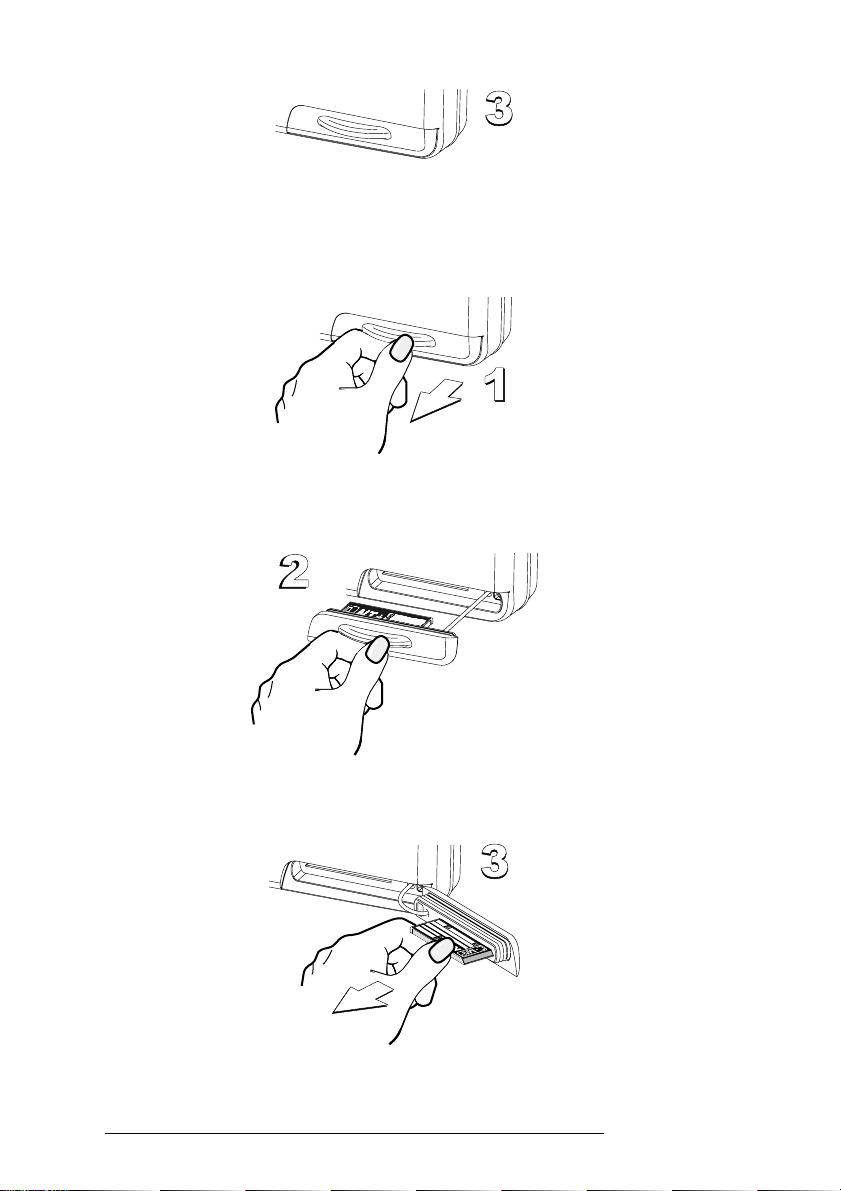
When finished the door must be right closed as shown in the following picture:
Fig. 2.6.1b - Inserting C-CARD (III)
2.6.2 REMOVING C-CARD
To remove the C-CARD inserted in the chart plotter open the door:
Fig. 2.6.2 - Removing C-CARD (I)
the C-CARD will eject out of the chart plotter slot remaining fixed into the door:
24
Fig. 2.6.2a - Removing C-CARD (II)
then remove the C-CARD from the slot:
Fig. 2.6.2b - Removing C-CARD (III)
User Manual
Page 23

Warning!
THIS IS THE RECOMMENDED WAY TO REMOVE THE C-CARD FROM THE
CHART PLOTTER. If opening the door the C-CARD remains fixed into the chart plotter slot,
do not try to remove it, but close the door again pressing it a lot so the C-CARD remains fixed
into the door. When you try to open the door again, the C-CARD will eject out of the slot.
Note
C-MAP is continuously creating new charts and revising old ones. If you wish to receive
information on the newest available charts, you can write for the catalog of available C-MAP
C-CARD at your dealer.
2.7 MENU OPTIONS
You may select how the chartplotter displays primary information (such as
how time is displayed) from the Functions Menu.
'MENU'
Refer to Chapter 5 for more information on Main Menu.
2.8 DATA ENTRY
Information is keyed into the chartplotter when editing a Waypoint, entering a Route or using the Fix Correction functions. When the field is highlighted:
- Enter or edit data by pressing up/down cursor key to step through the
available characters until the preferred character is displayed.
- Press right cursor key to move the cursor to the right.
- Use left cursor key to move the cursor to the left.
User Manual
25
Page 24

26
User Manual
Page 25

3
For the New User
In order to get started using your chartplotter, you must do the following
things:
1) Your chartplotter must have been installed properly according to the in-
stallation instruction on Par. 6.2.
2) You must have performed the proper settings for use with your position-
ing instrument (see Par. 2.5) and inserting the C-CARD for navigating in area you
wish (see Par. 2.6).
3) You must have turned on the chartplotter and adjust the brightness and
contrast of the display (see Par. 2.2 and 2.3).
Once this is done, you can use your chartplotter for navigation.
3.1 SCREEN DISPLAY CONFIGURATION
The screen display can be shown in different modes (wrap around) among
cartography and text area in two different modes (text area on the right side or on
the bottom line of the screen, complete if Target has been inserted or with partial
information on SOG), only cartography, Depth Graph 1/2 screen and 1/3 screen
pages, GPS Data page, Navigation Data page, Graphic Data page, Wind Data page.
To select the configuration you wish:
'PAGE' more times
3.1.1 CHARTS AND TEXT AREA
The charts and text area can be shown in two different modes. The first is
with text area on the right side of the screen:
User Manual
27
Page 26
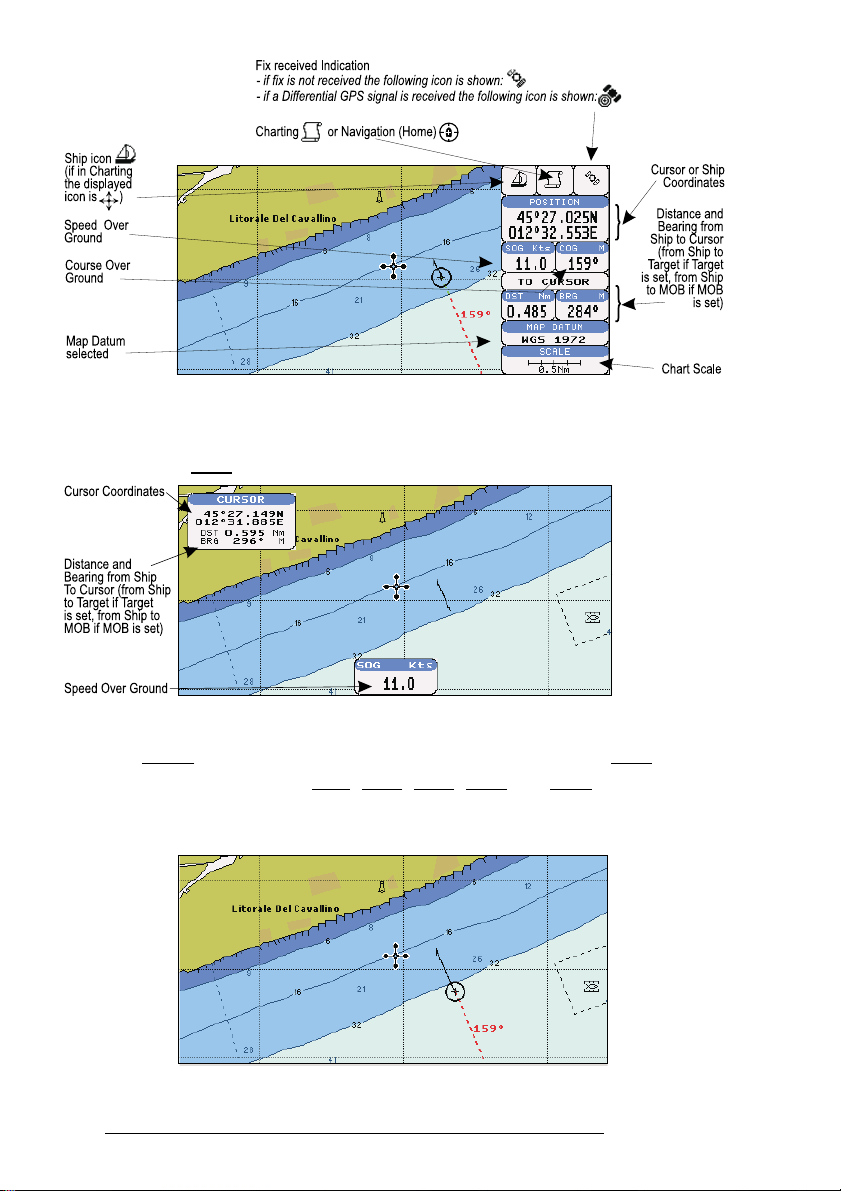
Fig. 3.1.1 - Charts and text area
The second is with text area on the bottom line of the screen (with partial
information on SOG):
Fig. 3.1.1a - Charts and text windows
If Target is set, in the previous Fig. 3.1.1a instead of the only SOG information window, a text line with DST, BRG, XTE, SOG and TTG information appears.
Then it is possible to see on the screen only charts:
28
Fig. 3.1.1b - Full charts
User Manual
Page 27
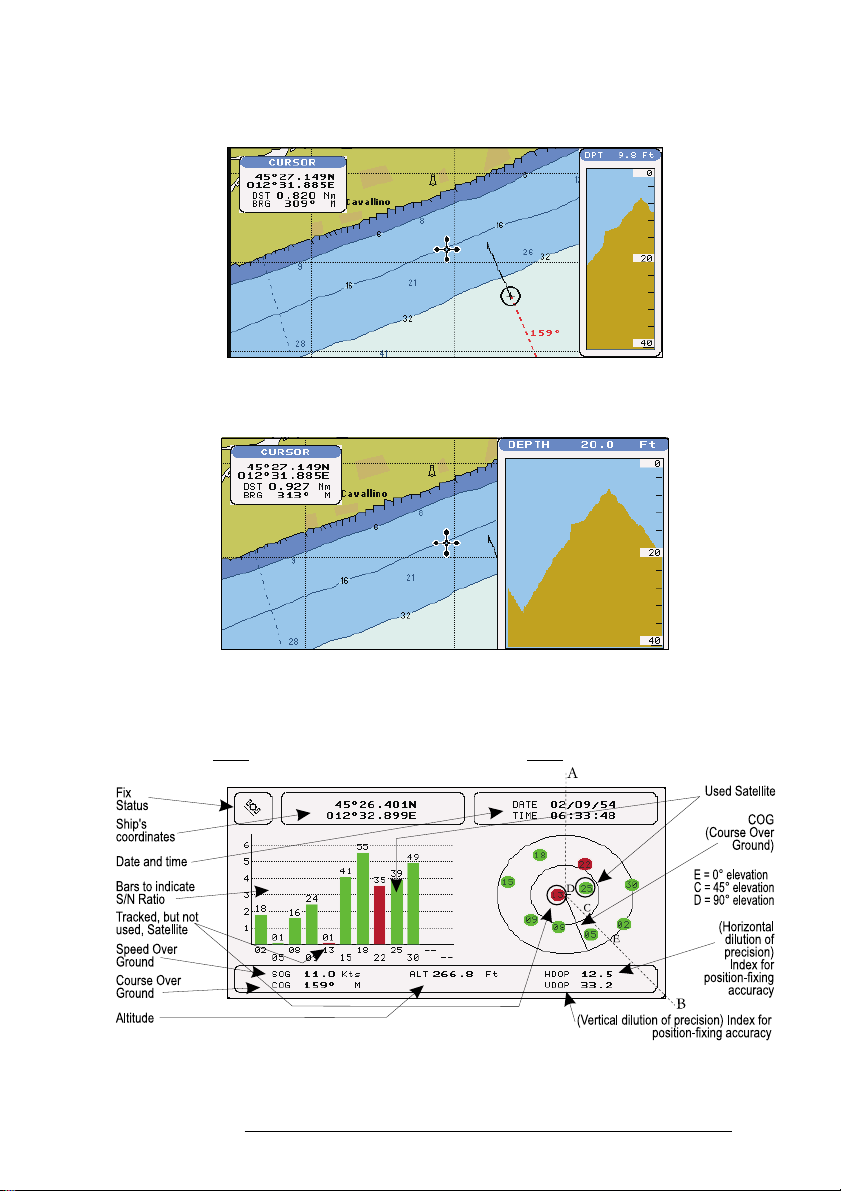
3.1.2 DEPTH GRAPH
The depth graph can be shown in two different modes. Depth graph dis-
played only on 1/3 of the screen:
Fig. 3.1.2 - The Depth Graph 1/3 of the screen
or Depth graph displayed on 1/2 of the screen:
Fig. 3.1.2a - The Depth Graph 1/2 of the screen
3.1.3 GPS DATA PAGE
The GPS Data page shows in graphic mode GPS data.
User Manual
Fig. 3.1.3 - GPS Data Page
29
Page 28
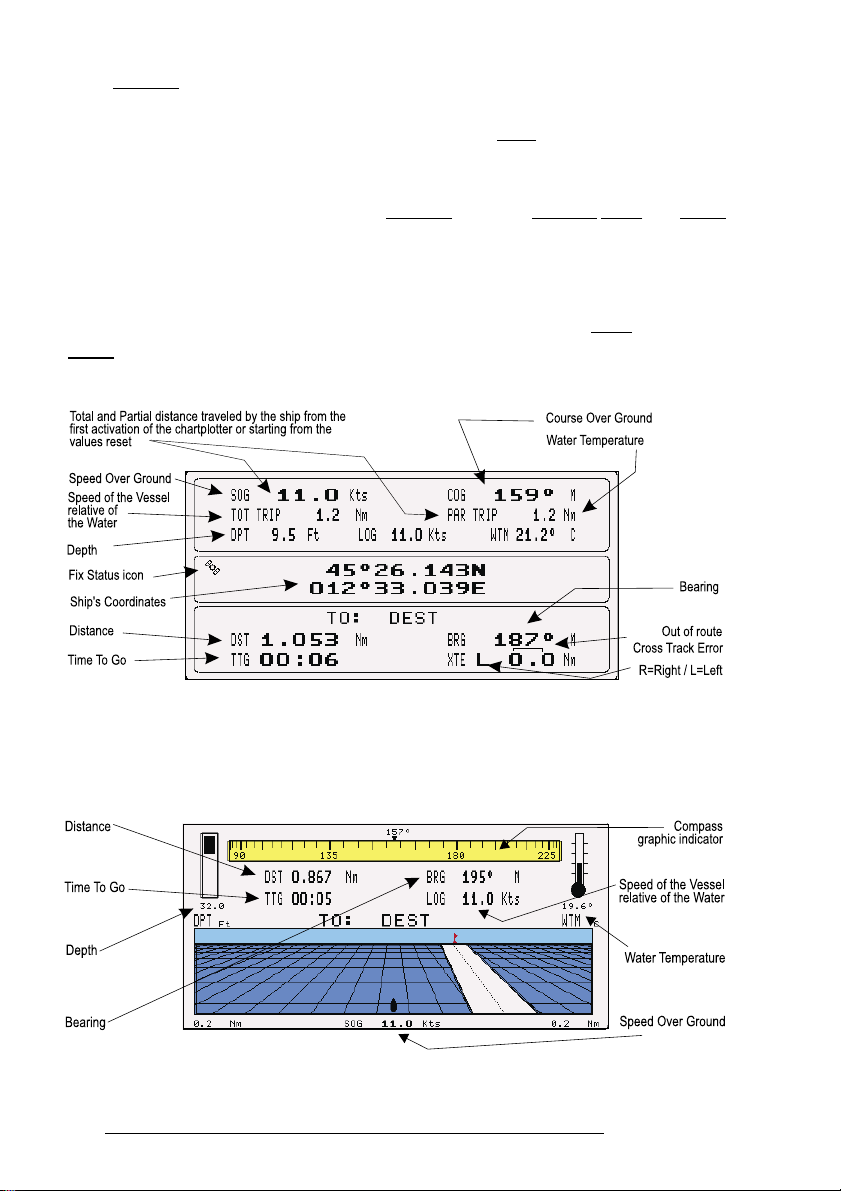
On the right side of the screen (see Fig. 3.1.3), there is a polar representation
of the azimuth and elevation of each satellites. The circle contains a number indicating the PRN of the satellite and it is filled when it is used for the fix solution. On the
left side there are histograms indicating the S/N ratio (SNR). The bar is filled when
the satellite is used for solution. As example, the satellite with PRN=10 is used for
solution with S/N=44, Azimuth=127degree and Elevation=70degree. When a valid
fix is received, the Lat/Lon, Date, Time, Altitude, VDOP, HDOP, SOG and COG
are shown in the page.
3.1.4 NAVIGATION DATA PAGE
The Navigation Data page shows information about speed (SOG) and course
(COG) of the ship, status of the received signal, ship's coordinate and other general
information.
Fig. 3.1.4 - Navigation Data Page
3.1.5 GRAPHIC DATA (ROLLING ROAD) PAGE
The Graphic Data Page shows in graphic mode navigation data.
Fig. 3.1.5 - Graphic Data Page
30
User Manual
Page 29
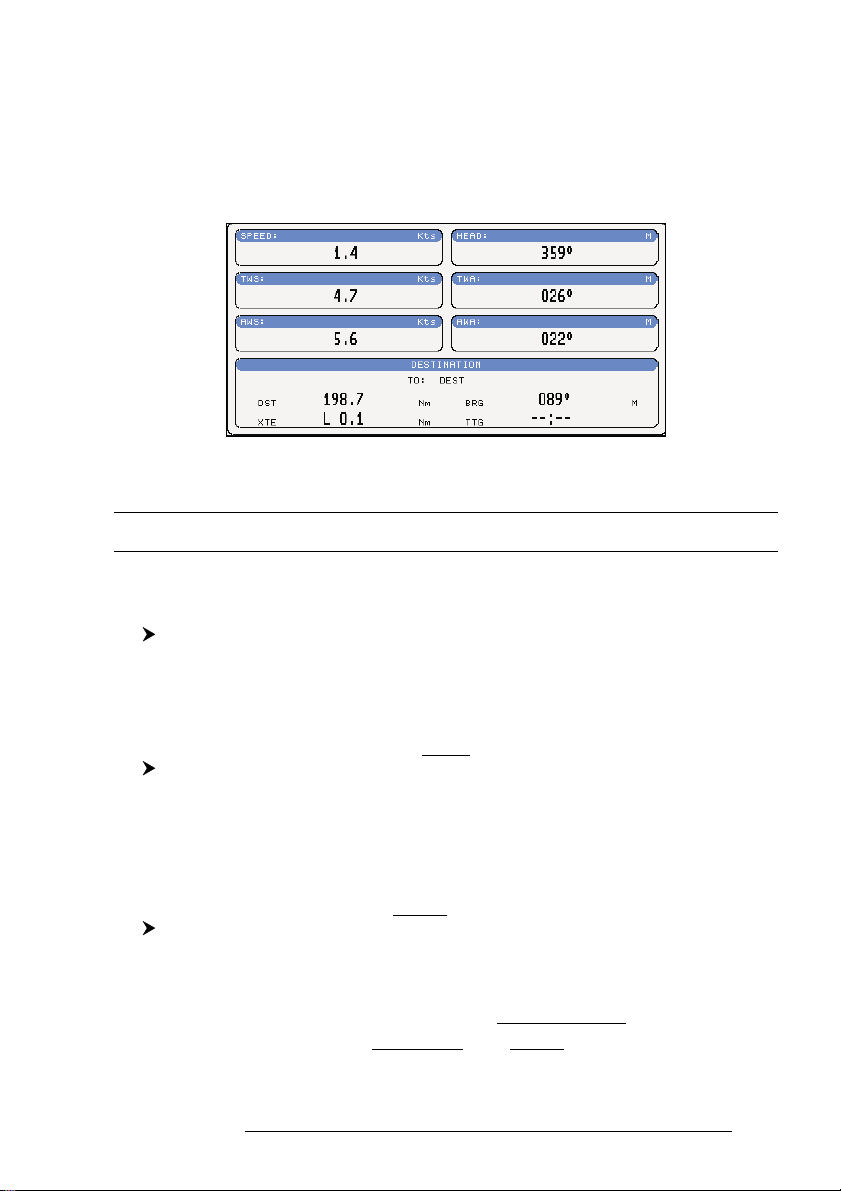
3.1.6 THE WIND DATA PAGE
The Wind Data page shows data related to the wind: TWS (True Wind Speed:
Velocity of the Wind relative to a fixed point on the earth), AWS (Apparent Wind
Speed: the Speed at which the Wind appears to blow relative to a moving point, also
called Relative Wind Speed), TWA (True Wind Angle) and AWA (Apparent Wind
Angle). Also SPEED (Ship Speed) and HEAD (Ship Heading) are shown.
Fig. 3.1.6 - The example of Wind Data page
3.2 BASIC SETTINGS
The Basic Settings menu provides access to the set up functions. Here you
can choose the language you want (see Par. 2.4).
'MENU' + "BASIC SETTINGS" + 'ENTER'
3.2.1 COURSE VECTOR
Disables (Off) the Course Vector or selects the preferred time among: 2, 10,
30 Min, 1 hour, 2 hours, Infinite. The default setting is Infinite.
'MENU' + "BASIC SETTINGS" + 'ENTER' + "COURSE VECTOR" + 'ENTER'
3.2.2 SCREEN AMPLIFIER
The Screen Amplifier function allows, when it is On and Home mode is set,
to place map on the screen related to the fix position and direction, so the map
shown is that before the ship. The default setting is On.
'MENU' + "BASIC SETTINGS" + 'ENTER' + "SCREEN AMPLIFIER" + 'ENTER'
3.2.3 ADVANCED FUNCTIONS
When it is On the chartplotter works in Advanced Mode, otherwise when it
is Off the chartplotter works in Basic Mode. The default setting is Off.
User Manual
31
Page 30

'MENU' + "BASIC SETTINGS" + 'ENTER' + "ADVANCED FUNCTIONS" +
'ENTER'
3.2.4 USER POINTS
Selects the User Point display among On, Off or Icon. The default setting is On.
'MENU' + "BASIC SETTINGS" + 'ENTER' + "USER POINTS" + 'ENTER'
3.2.5 DEPTH WINDOW
Enables/Disables the display on the Depth Window on the screen. The de-
fault setting is Off.
'MENU' + "BASIC SETTINGS" + 'ENTER' + "DEPTH WINDOW" + 'ENTER'
3.2.6 UNITS SELECTION
Allows to select the preferred unit for Distance, Speed, Depth and Altitude
(altitude of GPS Antenna on the medium sea level).
Speed: Kts(knots)/Mph(miles per hour)Kph(chilometres per hour). The default setting is Kts.
'MENU' + "BASIC SETTINGS" + 'ENTER' + "SPEED" + 'ENTER'
Distance: Nm(Nautical Miles)/Sm(statute miles)Km(chilometres). The default set-
ting is Nm.
'MENU' + "BASIC SETTINGS" + 'ENTER' + "DISTANCE" + 'ENTER'
Depth: Ft(Feet)/FM(Fathoms)/Mt(Meter). The default setting is Ft.
'MENU' + "BASIC SETTINGS" + 'ENTER' + "DEPTH" + 'ENTER'
Altitude: Ft(Feet)/FL(Flight Level)/Mt(Meter). The default setting is Ft.
'MENU' + "BASIC SETTINGS" + 'ENTER' + "ALTITUDE" + 'ENTER'
Temperature: C/F. The default setting is C.
'MENU' + "BASIC SETTINGS" + 'ENTER' + "TEMPERATURE" + 'ENTER'
3.2.7 NAV AIDS PRESENTATION
Allows to set the Nav Aids presentation as US or INTERNATIONAL. The
default setting is INTERNATIONAL. When selected it affects Lights, Signals, Buoys
& Beacons display.
- INT(International): Draws Nav-Aids using international symbology. All
components of Complex Objects are shown.
32
User Manual
Page 31

- US: Draw Nav-Aids using NOAA symbology. All components of Com-
plex Objects are shown.
'MENU' + "BASIC SETTINGS" + 'ENTER' + "NAV AIDS PRESENTATION" +
'ENTER'
3.2.8 INPUT/OUTPUT MENU
3.2.8.1 Port 1/Port 2/Port 3 Input
Sets or disables the format for the navigation data input serial Port1/2/3.
The default setting is NMEA-0183 4800-N81-N. For example to set the Port 2 as
NMEA-0183 (4800 Baud Rate, Parity None, 8 Bits Number, 1 Stop Bit and Normal
Polarity) you must select:
'MENU' + "BASIC SETTINGS" + 'ENTER' + "INPUT/OUTPUT" + 'ENTER' +
"PORT 2 INPUT" + 'ENTER'+ "NMEA-0183 4800-N81-N" + 'ENTER'
Note
The port selection for C-COM or BBFF (Fish Finder) system defines on which Port (in Input or
Output) are to be connected the two systems. It is important to remark that this setting affects the
Input and the Output of the selected Port. If the C-COM or BBFF (Fish Finder) was already
assigned to one Port and the user tries to set the C-COM or BBFF (Fish Finder) to another port,
the chart plotter will show a message that warns the user about the current settings and asks if the
new settings should overwrite the previous ones.
3.2.8.2 Port 1/Port 2/Port 3 Output
Sets or disables the output interface. The default setting is NMEA-0183 4800N81-N. For example to set the Port 2 as NMEA-0180 you must select:
'MENU' + "BASIC SETTINGS" + 'ENTER' + "INPUT/OUTPUT" + 'ENTER' +
"PORT 2 OUTPUT" + 'ENTER'+ "NMEA-0180" + 'ENTER'
Note
Selecting NMEA-0180 or NMEA-0180CDX the chart plotter shows a message to advise the user
that the related input will be disabled.
3.2.8.3 Port 1/Port 2/Port 3 NMEA Output Messages Selection
The chart plotter allows customizing the NMEA-0183 sentence transmitted
on each port. The default setting is GLL, VTG, XTE, RMB, RMC, APB On and
BOD, BWC, RMA, WCV, GGA, HSL , HDG Off.
'MENU' + "BASIC SETTINGS" + 'ENTER' + "INPUT/OUTPUT" + 'ENTER' +
"PORT 1/2/3 OUTPUT SENTENCES" + 'ENTER'
3.2.8.4 GPS Setup Menu
It is possible to set the your preferred configuration for the connected GPS.
'MENU' + "BASIC SETTINGS" + 'ENTER' + "INPUT/OUTPUT" + 'ENTER' +
"GPS SETUP" + 'ENTER'
User Manual
33
Page 32

Note
This item is shown alternately to the selection of the output messages when to the related port is
connected a GPS identificable by the chart plotter.
Internal GPS O
NLY FOR
COMPACT 8 S
UN
Enables (On) or disables (Off) the Internal GPS. The default setting is On.
'MENU' + "BASIC SETTINGS" + 'ENTER' + "INPUT/OUTPUT" + 'ENTER' +
"GPS SETUP" + 'ENTER' + "INTERNAL GPS" + 'ENTER'
Restart GPS
Restarts all GPS processes. Once executed, the message "Done" is shown.
'MENU' + "BASIC SETTINGS" + 'ENTER' + "INPUT/OUTPUT" + 'ENTER' +
"GPS SETUP" + 'ENTER' + "RESTART GPS" + 'ENTER'
Differential Correction Source
Allows setting what kind of Differential Correction will be used by the GPS between WAAS-EGNOS and RTCM (beacon correction). The default setting is WAASEGNOS.
'MENU' + "BASIC SETTINGS" + 'ENTER' + "INPUT/OUTPUT" + 'ENTER' +
"GPS SETUP" + 'ENTER' + "DIFF CORRECTION SOURCE" + 'ENTER'
Navigation Speed
Allows setting the Navigation Speed among Low Speed, Medium Speed and High
Speed.
'MENU' + "BASIC SETTINGS" + 'ENTER' + "INPUT/OUTPUT" + 'ENTER' +
"GPS SETUP" + 'ENTER' + "NAVIGATION SPEED" + 'ENTER'
3.2.8.5 Send & Receive Marks/Routes
Sets the desired port used for transferring User Points and Routes functions:
'MENU' + "BASIC SETTINGS" + 'ENTER' + "INPUT/OUTPUT" + 'ENTER' +
"SEND/REC ROUTES & MARKS" + 'ENTER' + "Port1/Port2" + 'ENTER'
3.2.8.6 C-Link
Selects the Master unit (Primary Station) or the Slave unit (Secondary Station):
'MENU' + "BASIC SETTINGS" + 'ENTER' + "INPUT/OUTPUT" + 'ENTER' +
"C-LINK" + 'ENTER' + "Secondary Station/Primary Station" + 'ENTER'
3.2.8.7 Cable Wiring Page
Shows a window containing the inteface cable wiring. See Par. 6.3 and 6.4.
'MENU' + "BASIC SETTINGS" + 'ENTER' + "INPUT/OUTPUT" + 'ENTER' +
"CABLE WIRING" + 'ENTER'
34
User Manual
Page 33

3.2.9 C-VOICE MENU
AVAILABLE ONLY IF THE CHARTPLOTTER IS CONNECTED TO VOICE NAVIGATION SYSTEM
The chartplotter has two different vocal modes, Navigation and Echosounder.
According to what mode is selected the messages spoken from the chartplotter are
different.
'MENU' + "BASIC SETTINGS" + 'ENTER' + "C-VOICE" + 'ENTER'
3.2.9.1 Navigation
Enables (On), disables (Off) or insert the time (2, 5, 10, 15 minutes) for the
Navigation Voice mode. If it is On, the message is always sent, as fast as possible.
Instead if it is one among the available values, for example 2 minutes, the message is
sent related to the selected time, in the previous example every two minutes.
'MENU' + "BASIC SETTINGS" + 'ENTER' + "C-VOICE" + 'ENTER' +
"NAVIGATION" + 'ENTER'
3.2.9.2 Echosounder
Enables (On) or disables (Off) the Echosounder Voice mode. If it is On, the
Depth message is spoken. The message is spoken if a valid depth data is received by
the chartplotter or if it is in Simulation mode. The default setting is Off.
'MENU' + "BASIC SETTINGS" + 'ENTER' + "C-VOICE" + 'ENTER' +
"ECHOSOUNDER" + 'ENTER'
3.2.9.3 Output Port
Selects the Output Port for the Voice function. The default setting is Port 1.
'MENU' + "BASIC SETTINGS" + 'ENTER' + "C- VOICE" + 'ENTER' + "OUTPUT
PORT" + 'ENTER'
3.3 A-B-C-D FUNCTION
The A-B-C-D function allows you to create the A, B, C, D points and to
delete them.
3.3.1 INSERTING THE A-B-C-D POINTS
Place the cursor on the desired position and press 'ENTER': the A point and
an information window on A appear. Move the cursor and press 'ENTER' again: the
B point appears, connected to A with a straight segment; an information window on
A-B segment (distance (DST), bearing (BRG) and total distance from the first point)
appears. Moving the cursor and pressing 'ENTER' places the C and D points:
User Manual
35
Page 34
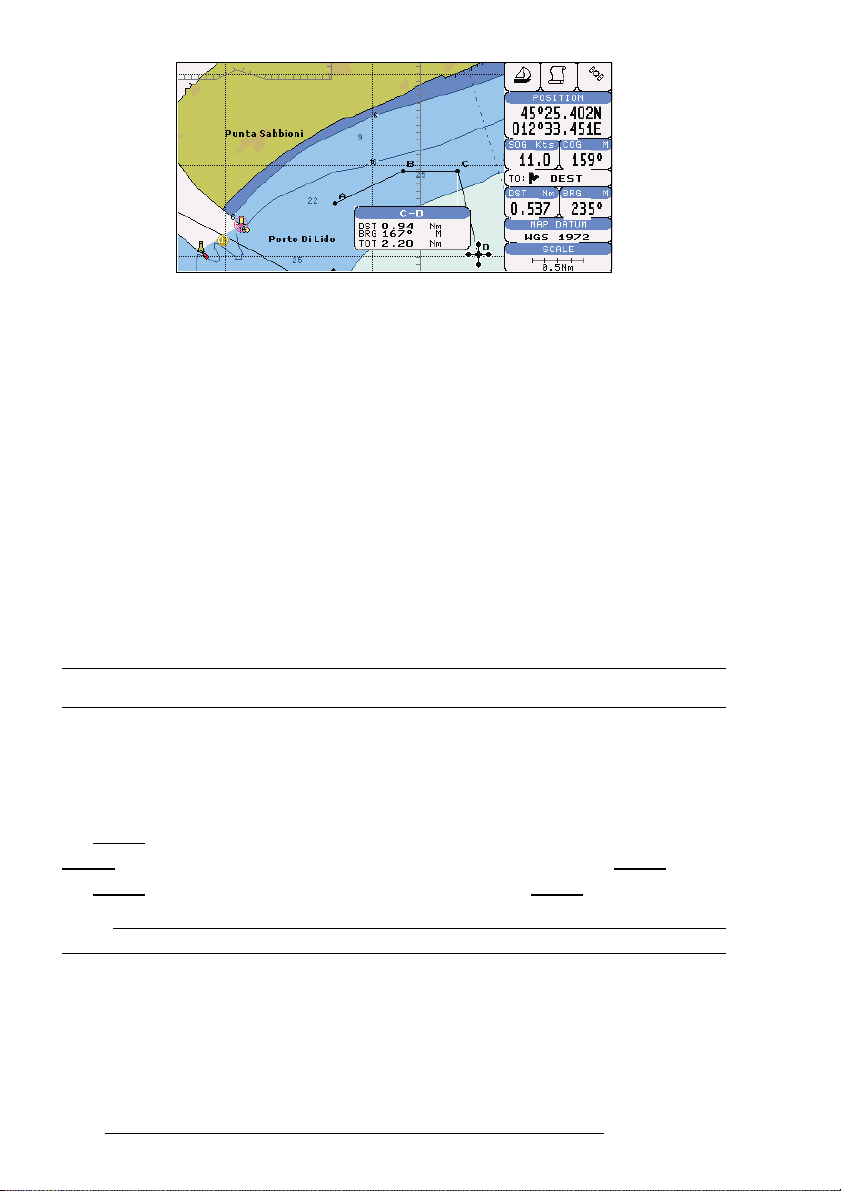
Fig. 3.3.1 - A-B-C-D points
3.3.2 DELETING THE A-B-C-D POINTS
Place the cursor on the desired point (A, B, C or D) and press 'CLEAR': the
point is deleted. When the point is deleted, the cursor is placed on the previous
point, if existed. The labels of the next points are renamed.
3.3.3 NAVIGATING ON THE A-B-C-D POINTS
If fix received is good, place the cursor on the desired point A, B, C or D and
press 'GO-TO'. When the ship arrives to the Destination point, navigation follows
to the next point (if existed).
3.4 NAVIGATING TO A SINGLE DESTINATION
3.4.1 DISTANCE AND BEARING TO TARGET (DESTINATION)
Once you have positioned the cursor on your desired location (a generic
point on the map) press 'GO-TO'. On the screen is shown a straight line connecting
the Target (called DEST) with the ship's position and an information window with
Target position, that disappears when the cursor is moved from the Target. When
the Target is placed, all navigation data are referred to this Target.
Note
When the chartplotter is turned Off, the Target does not remain in memory.
36
User Manual
Page 35
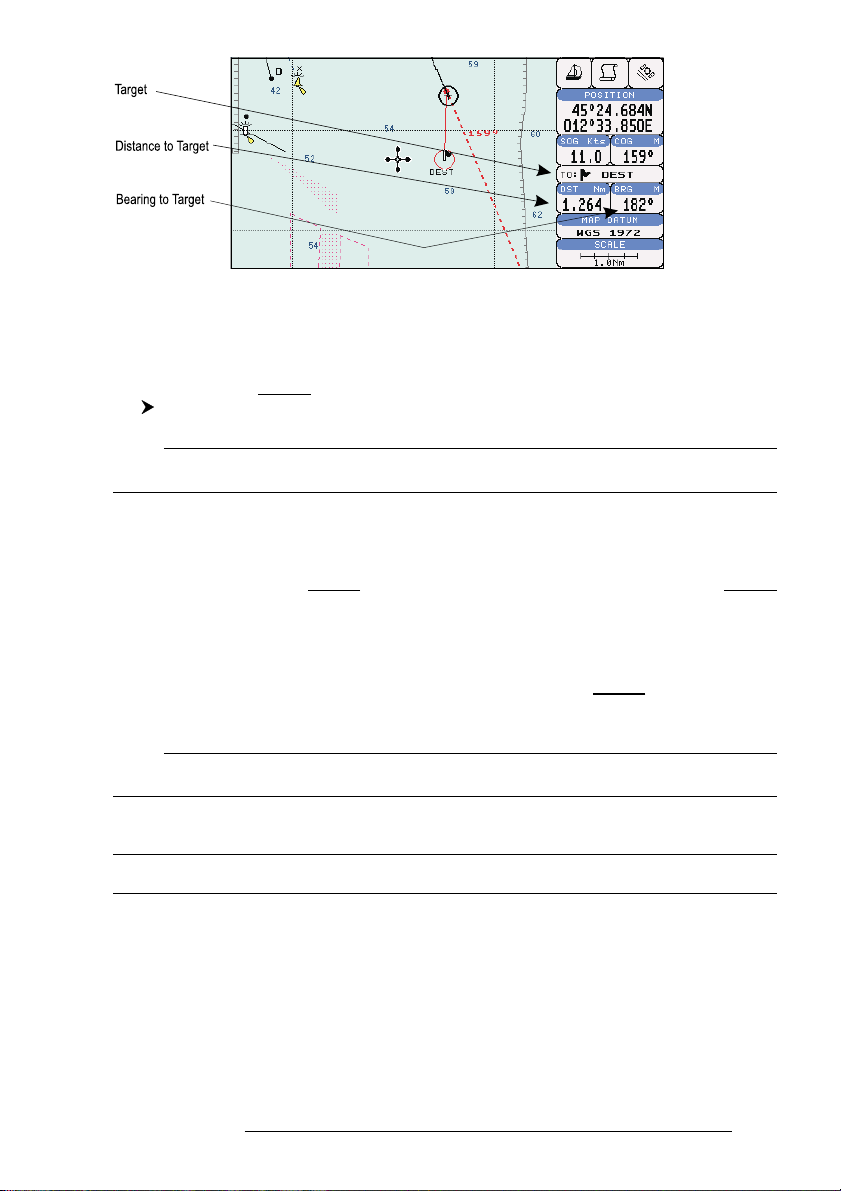
Fig. 3.4.1 - Navigation to a single destination
3.4.2 TIME TO GO
When the Target is set the TTG value is displayed in the Graphic Data page:
'PAGE' more times to select the Graphic Data page
Note
If SOG value is less than 1.0 knots or the BRG is greater than 90 degrees, the TTG value is not
displayed.
3.4.3 DELETING TARGET
Press cursor on Target icon, press 'CLEAR': the symbol identifies Target
disappears from the screen.
Otherwise (when the cursor is placed in a generic position on the chart)
press 'GO-TO'. A window appears to advise that the Destination is present: select
the item "STOP" and press 'ENTER', the symbol identifies Target disappears from
the screen.
Note
If you select the "START" item and press 'ENTER', the Target icon is moved on the new cursor
position.
3.5 C-MAP NT MAX INFORMATION
MAX is a major evolution of the NT/NT
New Data Features
- Tides and Currents (intuitive arrows show direction and strength)
- World Background Charts with terrestrial data
User Manual
+
product technology. Key points are:
37
Page 36

- Value Added Data (Pictures and Diagrams, Land Data)
- Enhanced Port Info
New Presentation Features
- Clear View (advanced legibility techniques providing more chart data on the screen)
- Clear Info (sophisticated "Human Dictionary" to translate Nav-Aid abbreviations
found on paper charts)
- Dynamic Fonts and Symbols
- Dynamic Nav-Aids (an innovative and dynamic presentation mode)
- Flexi-Zoom (increased Under and Over Zoom between chart levels, resulting in
optimal scale display for any situation)
- Dynamic Elevation Data (optimized palettes for chart plotters with 256 or more
colors; includes new NOAA palette for US market)
- Perspective View ("Real World" perspective view of the chart, updated real-time
during navigation)
MAX and NT/NT+ C-CARD coexistence
- When NT+ data and MAX data cover different areas, the chart plotter gets data
from both charts (depending on the current position).
- When NT+ data and MAX data cover the same area, the chart plotter gets data only
from MAX chart.
3.5.1 MAP MENU
It is possible to select the Map Menu following the procedure:
'MENU' + "MAP SETTINGS" +'ENTER'
3.5.1.1 Perspective View
'MENU' + "MAP SETTINGS" +'ENTER' + "Perspective View" + 'ENTER'
Chart data may be projected in perspective mode during navigation. This
function allows setting the panoramic View of the chart.
As the upper side of the map is more compressed than the lower side, a wider map
area is visible. The perspective view allows showing more chart information immediately ahead and around the cursor.
38
User Manual
Page 37
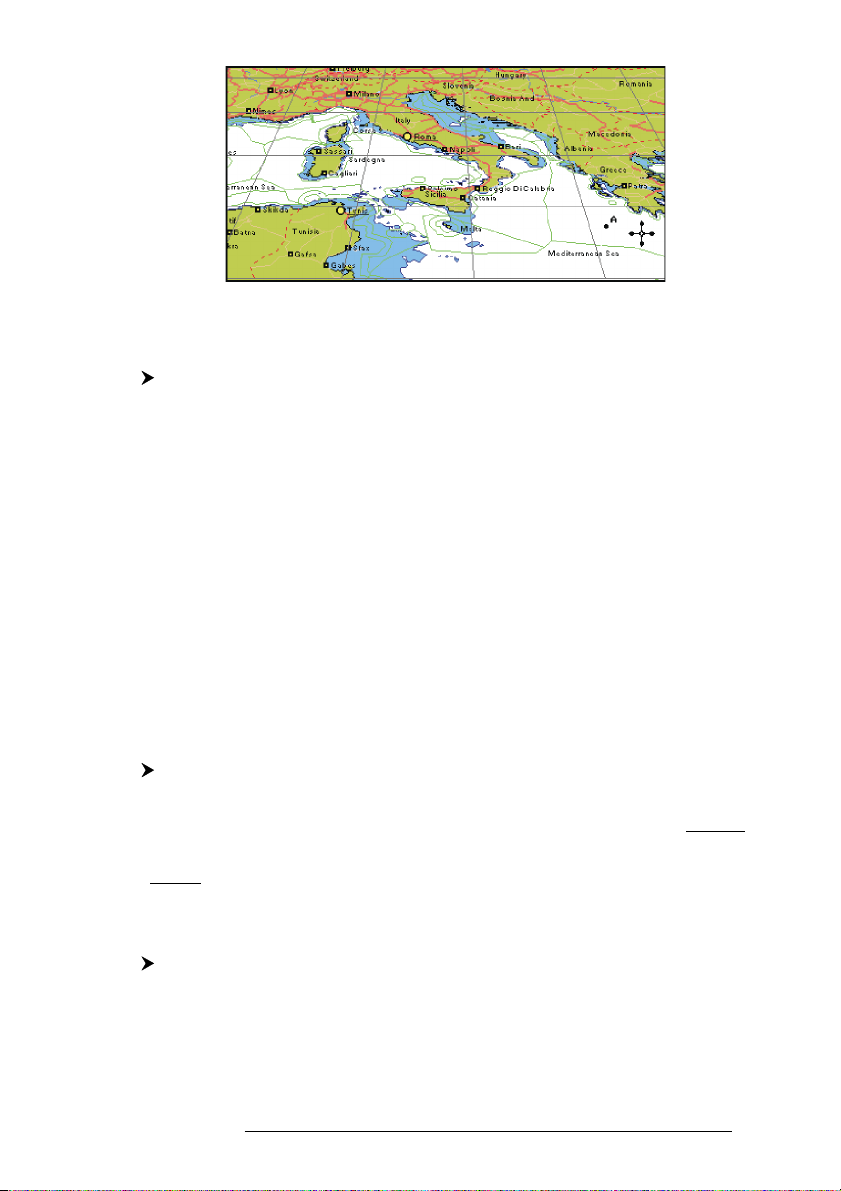
Fig. 3.5.1.1 - Perspective View
3.5.1.2 Palette
'MENU' + "MAP SETTINGS" +'ENTER' + "Palette" + 'ENTER'
It is possible to set the palette used to enhance the visibility of the screen
depending on the surrounding light condition. The possible choices are Normal,
Classic, NOAA, Night Vision and Sunlight. The default setting is Classic. Normal
is recommended when the chartplotter is not exposed to the direct sunlight. When
this mode is set the maps are displayed in order to use colors as similar as possible to
the ones used in the original paper charts. Classic uses more vivid colors. Night
Vision is recommended when the environment is dark in order to reduce the glare
of the display. The chartplotter displays maps and screen in darker colors. Sunlight
is designed to enhance the visibility of the screen when the chartplotter is exposed to
the sunlight. The maps are much brighter than in the other modes and the depth
areas are filled with white color so different depth areas are not easily distinguishable. NOAA allows setting NOAA paper chart colors presentation.
3.5.1.3 Map Orientation
'MENU' + "MAP SETTINGS" +'ENTER' + "Map Orientation" + 'ENTER'
Selects the orientation of your chart according to: North (the map is shown
with North upwards), Head (the map is shown with the ship's current heading upwards), Course (the map is displayed with the currently selected course leg upwards).
The default setting is North.
It is possible to select the resolution angle for the Map Orientation.
3.5.1.4 Zoom Type
'MENU' + "MAP SETTINGS" +'ENTER' + " Zoom Type" + 'ENTER'
This feature allows more expansions or compression of the chart scale while
zooming in or out. Zoom Mode has two options; STANDARD (default) or FLEXIZOOM. When in FLEXI-ZOOM mode, a short 'ZOOM...' push causes a change of
User Manual
39
Page 38
chart, whilst a long 'ZOOM...' push (press and hold) causes a pop-up window to be
displayed on a corner of the screen. The window shows the current Zoom Factor.
By pressing 'ZOOM IN'/'ZOOM OUT' the map is expanded or compressed
according to the zoom factor selected.
The Window is automatically closed if 'ZOOM...' is not pressed for 2 sec-
onds and the selected zoom factor will be used at the next zoom in/out.
3.5.1.5 Fonts & Symbols
'MENU' + "MAP SETTINGS" +'ENTER' + "Fonts & Symbols" + 'ENTER'
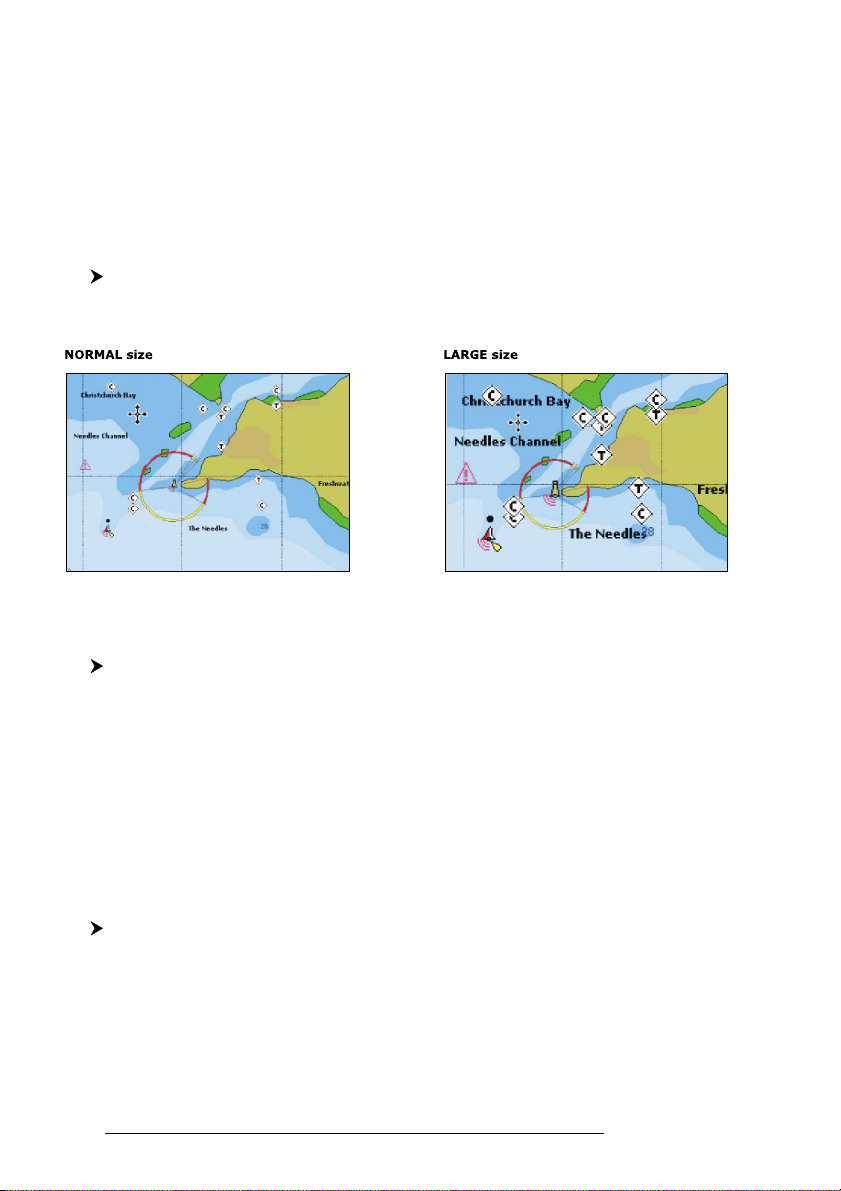
On MAX charts it is possible to set the size of all names and symbols drawn on
the charts, selecting between Normal size (the regular characters size) and Large size.
Fig. 3.5.1.5 - Example of Normal size (on the left side) and Large side (on the right side) settings
3.5.1.6 Dynamic Nav-Aids
'MENU' + "MAP SETTINGS" +'ENTER' + "Dynamic Nav-Aids" + 'ENTER'
This function allows settings blinking lights on Nav-Aids. The blink period
and color of each Nav-aid is read from the Nav-Aid attributes available on the data
cartridge. When the ship is inside the Nav-Aid nominal range, the light of the NavAid will start blinking.
When Dynamic Nav-Aids option is set to On, when the flashing light is Off,
or when fix position is out of the sector, the light color is displayed by using a faint
light color.
3.5.1.7 Mixing Levels
'MENU' + "MAP SETTINGS" +'ENTER' + "Mixing Levels" + 'ENTER'
When the map coverage at the current zoom level does not fill the entire
screen, the chartplotter draws the rest of the map expanding the cartographic information read from, at most, two zoom levels above the current zoom level. For this
reason the map is drawn three times: firstly it draws the two levels before the current
level and then the current level. The area covered by the cartographic data read from
40
User Manual
Page 39
the previous levels is identified by a dotted pattern. When the cursor is moved on an
area not covered by data of the current level the chartplotter zooms out to the first
level covered by cartographic data. The default setting is Off.
Note
The Mixing Levels function works only with the new C-CARDs. It also affects the speed of the
redraw of the screen. If this function is not used it maybe disabled.
3.5.1.8 Safety Status Bar (DSI - Data Safety Indicator)
'MENU' + "MAP SETTINGS" +'ENTER' + "Safety Status Bar" + 'ENTER'
It is possible to choose between the three following options:
• ON : the Safety Status Bar is shown
• OFF : the Safety Status Bar is not shown
• ICON : the Safety Status Bar is not shown, but a warning alarm icon
is shown on the corner of the map screen as soon as any item
controlled by the DSI function returns an alarm condition.
The Warning Icon remains displayed until the alarm condition persists. Placing the cursor over it, a quick help message
is shown next to the DSI icon, allowing to show the DSI bar.
In this case - when the DSI bar is opened via DSI alarm icon it is allowed to obtain information about each “active” DSI
box (the red ones): it is possible to select them by cursor movement left/right, and a list of active alarms is shown underneath the selected box. By pressing 'CLEAR', the DSI bar is
removed from the screen.
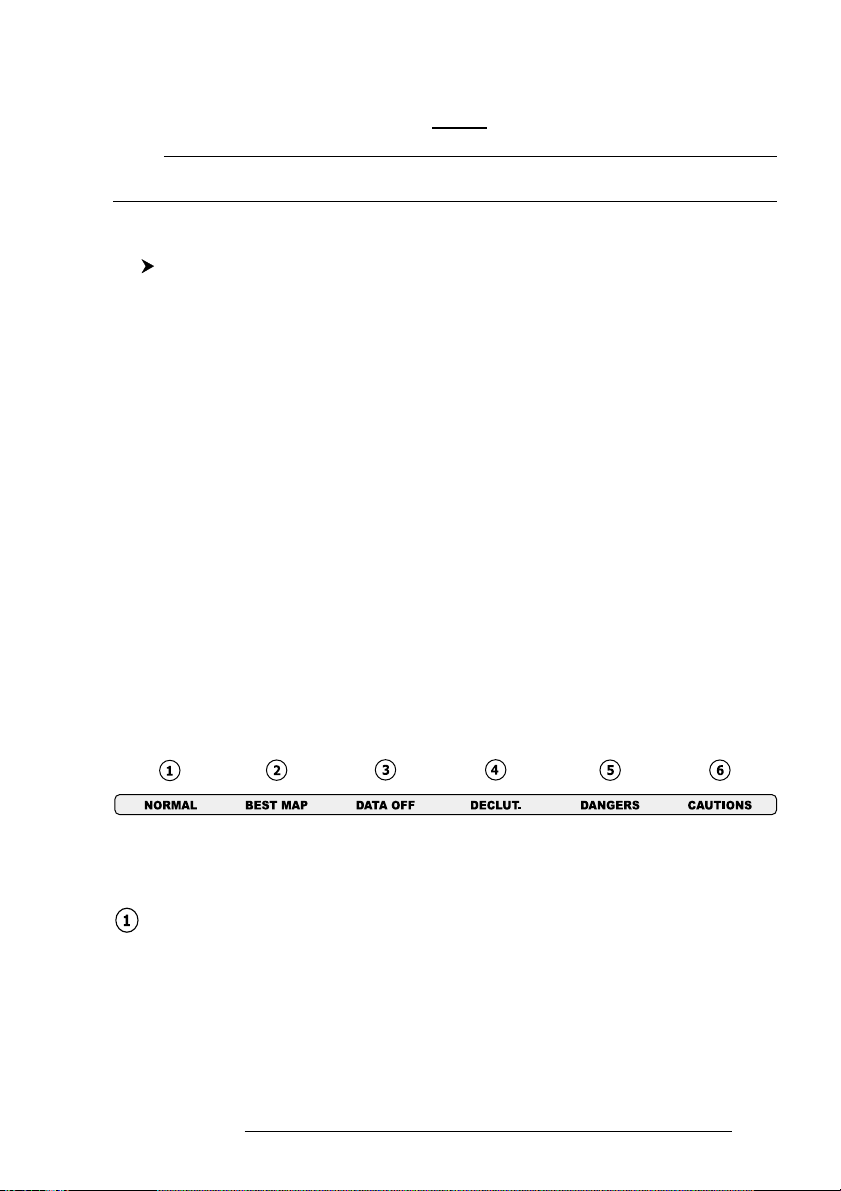
When Safety Status Bar is On, this feature displays a status bar with six boxes
showing the status of certain functions. Any warning or alarm condition is identified
by the red color to indicate possible risk.
Fig. 3.5.1.8 - Safety Status Bar
Boxes definition is as follows:
Zoom
- Normal: when the chart is displayed at normal scale.
- U. Zoom: red when the chart is under-zoomed out more than twice normal scale, gray otherwise.
- O. Zoom: red when the chart is over-zoomed in more than twice normal
scale, gray otherwise.
User Manual
41
Page 40
- Chart Lock: red when the chart is zoomed in more than twice normal
scale, gray otherwise.
Best Scale
Red when a more detailed chart is available under the cursor position.
Data Off
Red when at least one of the following objects or layers is turned off (by the
user): Depths/soundings; Wrecks/obstructions; Tracks/routes; Attention
areas; Nav-Aids.
Clear View
Displays when Clear View function is On.
Dangers
Red when “Guardian Technology” detects one of the following objects: Land,
Intertidal, Depth Area, Rocks, Obstructions, Shoreline Constructions, Fishing Facility, Wrecks, Dragged area, Diffusion area, Mooring facilities, Pingos
and Production installations.
Caution
Red when “Guardian Technology” detects cautionary or restricted area.
3.5.1.9 Currents Prediction
'MENU' + "MAP SETTINGS" +'ENTER' + "Currents Prediction" + 'ENTER'
It is possible to see the variation of the Tidal arrows on the selected area at
any given time. A window is shown on the low-left side of the chart, press 'ENTER'
to set the date and time manually, 'MENU' to decrease time and 'GOTO' to increase time.
3.5.1.10 Other Map Configurations
'MENU' + "MAP SETTINGS" +'ENTER' + "Other Map Configurations" + 'ENTER'
This function allows the user to customize the following selections and is
divided into the following setting: Marine Settings, Depth Settings, Land Settings,
Underwater Objects Settings and Chart Settings.
Display Mode: To simplify the customization of the chart display, the map settings
are now re-organized in modes allowing the user to choose the preferred setting. Preprogrammed settings are user selectable from Full, Medium, Low, Radar, Tides,
Custom. The default setting is Custom.
42
User Manual
Page 41

'MENU' + "MAP SETTINGS" +'ENTER' + "Other Map Configurations" + 'ENTER'
+ "Display Mode" + 'ENTER'
The table below shows the selections for each mode:
Setting Full Medium Low Radar Tides Custom
Place Names On On On On On On
Name Tags On Off Off Off Off Off
Nav-Aids & Light Sectors On No Sector No Sector No Sector Off On
Attention Areas On On Off Off Off On
Tides & Currents On Off Off Off On On
Seabed Type On Off Off Off Off On
Ports & Services On On Off On Off On
Tracks & Routes On Off Off Off Off On
Depth Range Min 3 Mt 3 Mt 3 Mt 3 Mt 3 Mt 3 Mt
Depth Range Max 10 Mt 10 Mt 10 Mt 10 Mt 10 Mt 10 Mt
Land Elevations On Off Off Off Off On
Land Elevation Data On Off Off Off Off On
Roads On Off Off Off Off On
POIs On Off Off Off Off On
Lat/Lon Grid On Off Off Off Off On
Chart Boundaries On Auto Off Off Off Auto
Mixing Levels On Off Off Off Off Off
Value Added Data On Off Off Off Off On
Chart Lock On On On On On On
Und. Objects Limit 9999Mt 10Mt 10Mt 10Mt 10Mt 10Mt
Rocks Icon+Depth Icon Icon Icon Icon Icon
Obstructions Icon+Depth Icon Icon Icon Icon Icon
Diffusers Icon+Depth Icon Icon Icon Icon Icon
Wrecks Icon+Depth Icon Icon Icon Icon Icon
(Default values)
Place Names: On/Off. The default setting is On.
'MENU' + "MAP SETTINGS" +'ENTER' + "Other Map Configurations" + 'ENTER'
+ "Place Names" + 'ENTER'
Name Tags: On/Off. The default setting is On.
'MENU' + "MAP SETTINGS" +'ENTER' + "Other Map Configurations" + 'ENTER'
+ "Name Tags" + 'ENTER"
Nav-Aids & Light Sectors : On (Nav-Aids & Light Sectors are shown)/Off (Nav-
Aids & Light Sectors are not shown)/No Sector (Nav-Aids are shown, Light Sectors
are hidden). The default setting is On.
'MENU' + "MAP SETTINGS" +'ENTER' + "Other Map Configurations" + 'ENTER'
+ "Nav-Aids & Light Sectors" + 'ENTER'
Attention Areas: On/Off. The default setting is On. The Attention Areas will al-
ways be contour only when On.
'MENU' + "MAP SETTINGS" +'ENTER' + "Other Map Configurations" + 'ENTER'
+ "Attention Areas" + 'ENTER'
User Manual
43
Page 42
Tides & Currents: On/Off. The default setting is On.
'MENU' + "MAP SETTINGS" +'ENTER' + "Other Map Configurations" + 'ENTER'
+ "Tides & Currents" + 'ENTER'
Seabed Type: On/Off. The default setting is On.
'MENU' + "MAP SETTINGS" +'ENTER' + "Other Map Configurations" + 'ENTER'
+"Seabed Type" + 'ENTER'
Ports & Services: On/Off. The default setting is On.
'MENU' + "MAP SETTINGS" +'ENTER' + "Other Map Configurations" + 'ENTER'
+"Ports & Services" + 'ENTER'
Tracks & Routes: On/Off. The default setting is On.
'MENU' + "MAP SETTINGS" +'ENTER' + "Other Map Configurations" + 'ENTER'
+ "Tracks & Routes" + 'ENTER'
Depth Range Min: Sets a min reference depth value. The default setting is 3 Mt.
'MENU' + "MAP SETTINGS" +'ENTER' + "Other Map Configurations" + 'ENTER'
+ "Depth Range Min" + 'ENTER'
Depth Range Max: Sets a max reference depth value. The default setting is 10 Mt.
'MENU' + "MAP SETTINGS" +'ENTER' + "Other Map Configurations" + 'ENTER'
+"Depth Range Max" + 'ENTER'
Land Elevations: On/Off. The default setting is On.
'MENU' + "MAP SETTINGS" +'ENTER' + "Other Map Configurations" + 'ENTER'
+ "Lan Elevations" + 'ENTER'
Land Elevation Values: On/Off. The default setting is On.
'MENU' + "MAP SETTINGS" +'ENTER' + "Other Map Configurations" + 'ENTER'
+ "Lan Elevation Values" + 'ENTER'
Roads: On/Off. The default setting is On.
'MENU' + "MAP SETTINGS" +'ENTER' + "Other Map Configurations" + 'ENTER'
+ "Roads" + 'ENTER'
POIs (Points Of Information): On/Off. The default setting is On.
'MENU' + "MAP SETTINGS" +'ENTER' + "Other Map Configurations" + 'ENTER'
+ "POIs" + 'ENTER'
Lat/Lon Grid: On/Off. The default setting is On.
'MENU' + "MAP SETTINGS" +'ENTER' + "Other Map Configurations" + 'ENTER'
+ "Lat/Lon Grid" + 'ENTER'
Chart Boundaries: On/Off/Auto. The default setting is On.
44
User Manual
Page 43
'MENU' + "MAP SETTINGS" +'ENTER' + "Other Map Configurations" + 'ENTER'
+ "Chart Boundaries" + 'ENTER'
Value Added Data: On/Off. The default setting is On.
'MENU' + "MAP SETTINGS" +'ENTER' + "Other Map Configurations" + 'ENTER'
+ "Value Added data" + 'ENTER'
Chart Lock: On/Off. The default setting is On.
'MENU' + "MAP SETTINGS" +'ENTER' + "Other Map Configurations" + 'ENTER'
+ "Chart Lock" + 'ENTER'
Underwater Object Limit: Selects the max depth value to display Underwater Ob-
jects. The default setting is 10 Mt.
'MENU' + "MAP SETTINGS" +'ENTER' + "Other Map Configurations" + 'ENTER'
+ "Underwater Object Limit" + 'ENTER'
• If value is set to 0 Mt, the Underwater Objects are not shown on the charts.
Menu options are grayed out.
• If value is more than 0 Mt (i.e. 10 Mt), in the Range from 0 Mt to the selected
value the Underwater Objects are displayed according to their setting below.
Rocks: Off/Icon/Icon+Depth (*). The default setting is Icon.
'MENU' + "MAP SETTINGS" +'ENTER' + "Other Map Configurations" + 'ENTER'
+ "Rocks" + 'ENTER'
Obstructions: Off/Icon/Icon+Depth (*). The default setting is Icon.
'MENU' + "MAP SETTINGS" +'ENTER' + "Other Map Configurations" + 'ENTER'
+ "Obstructions" + 'ENTER'
Diffusers: Off/Icon/Icon+Depth (*). The default setting is Icon.
'MENU' + "MAP SETTINGS" +'ENTER' + "Other Map Configurations" + 'ENTER'
+ "Diffusers" + 'ENTER'
Wrecks: Off/Icon/Icon+Depth (*). The default setting is Icon.
'MENU' + "MAP SETTINGS" +'ENTER' + "Other Map Configurations" + 'ENTER'
+ "Wrecks" + 'ENTER'
Note (*)
Choose the option:
• OFF : the object is not visible independently of the selected “Underwater
Object Depth Value”
• ICON : the object icon is visible without tags, in the range selected from
“Underwater Object Depth Value” option
• ICON+DEPTH : the object icon and tag is visible, in the range selected from “Under-
water Object Depth Value” option
User Manual
45
Page 44
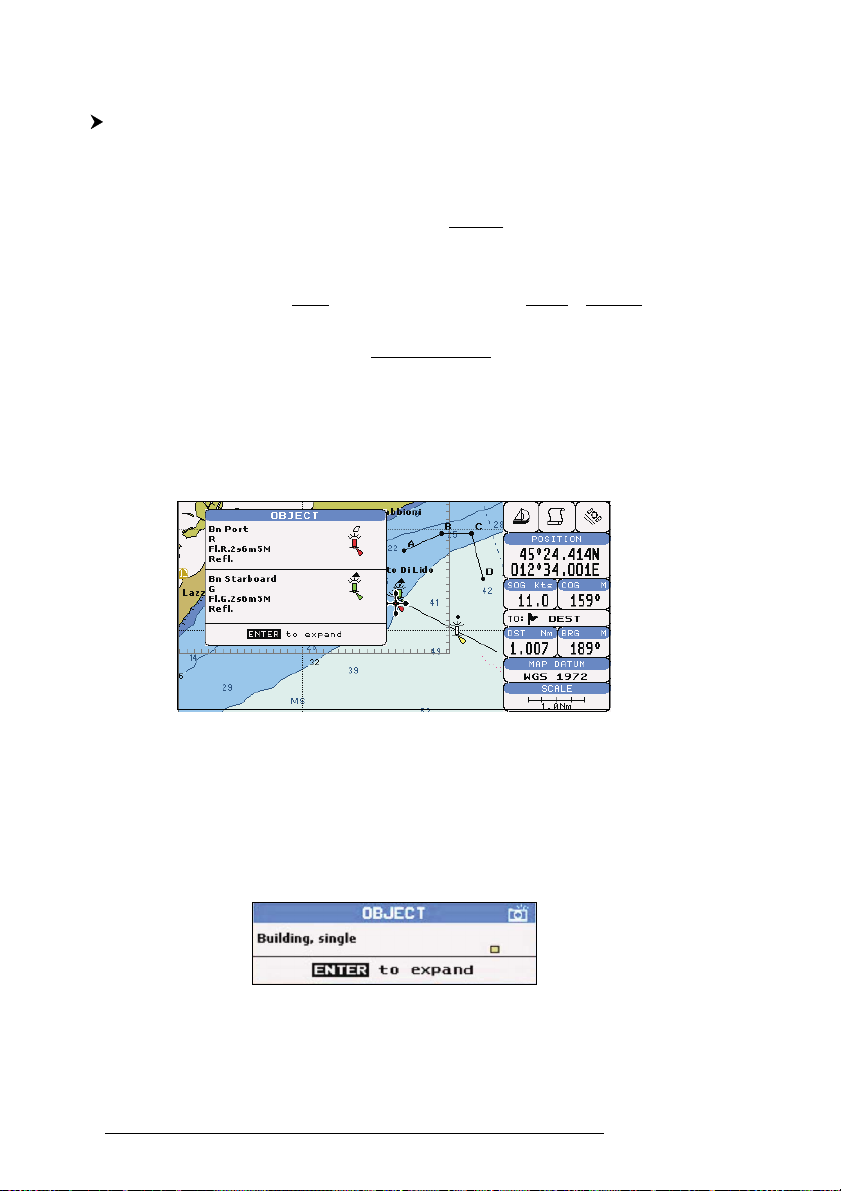
3.5.2 GETTING AUTOMATIC INFO
The type of Automatic Info is user selectable.
'MENU' + "ADVANCED SETTINGS" + 'ENTER' + "SETUP" + 'ENTER' +"AUTO
INFO" + 'ENTER'
The possible settings are:
- Off: disabled, no automatic info shown at all.
- On Points: only on points. This is the default setting.
- On All: on all objects (points, lines and areas).
The Automatic Info On Points shows information when the cursor is placed
on points (as Port Services, Tides, lights, wrecks, rocks, buoys, beacons, obstructions, land markers, etc.). The Automatic Info On All shows information when the
cursor is placed on points, on lines (as Depth contours, Traffic Separation, Territorial Sea, Cartographic Lines etc.) on areas (Depth, Built-up, Sea, Attention, Restricted
etc.) and on names (on the beginning of the text -hot spot- or on any of the characters
of the name -name message box-).
The details on Land, Source of Data, Cartographic Area and Spot Soundings
are not shown.
Fig. 3.5.2 -Automatic Info on Points window
If you press 'ENTER' you get the information about that object.
3.5.2.1 Info on objects with Pictures
On the Quick Info, there will be the camera icon on the top bar of the window if at
least one of the objects found has one or more pictures associated.
Fig. 3.5.2.1 - Example of Quick Info on objects with picture
On the Full Info, there will be the small camera icon on a corner of the square
46
User Manual
Page 45
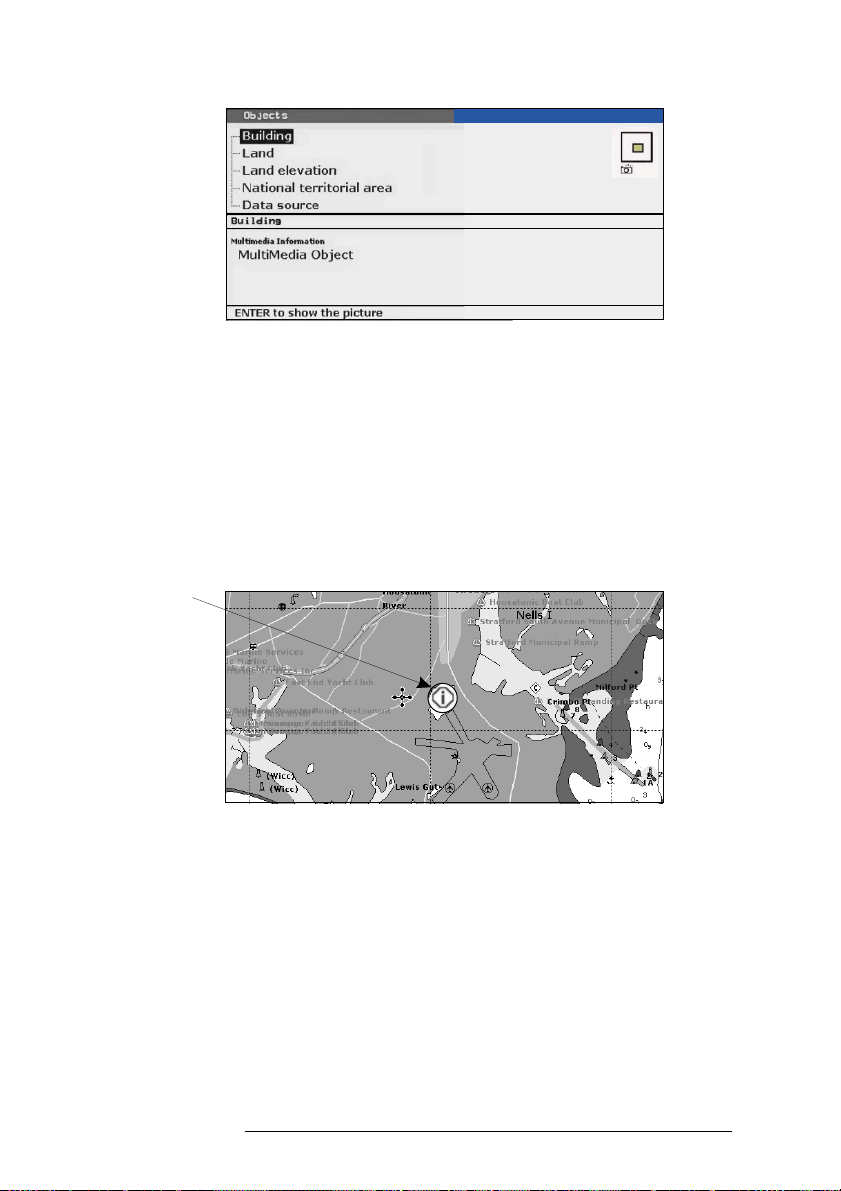
containing the object icon or a big photo icon centered on the square for the object
without icon.
Fig. 3.5.2.1a - Example of Full Info on objects with picture
To see the picture press 'ENTER' when the object with a picture is highlighted.
Change Picture Size
When the picture is shown, it is possible to fit it to screen by pressing 'ENTER'.
3.5.2.2 Quick Info on Lakes
Upon viewing the chart of a lake, you will click on to query the available infor-
mation immediately displayed with many details. For example, see the following picture:
Lakes Info icon
When the cursor is placed over the icon, the icons of the available services are shown:
User Manual
Fig. 3.5.2.2 - Example of Lakes info
47
Page 46
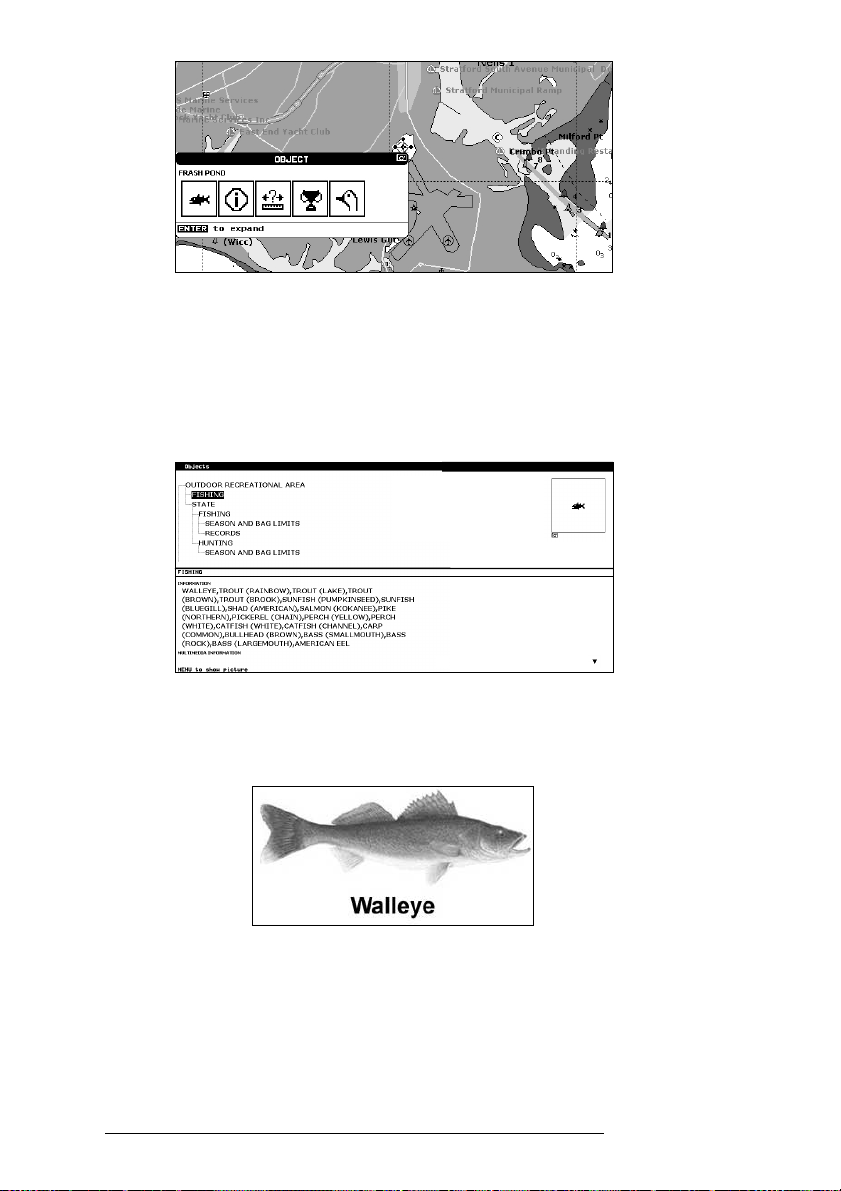
Fig. 3.5.2.2a - Quick Info: available services
If you press 'ENTER' all available information about the cartographic point
under the cursor will be shown. See the next paragraph.
3.5.2.3 Full Info on Lakes
The following is an example of Full Info on Lakes:
Fig. 3.5.2.3 - Example of Full Info page
To see the "Fishing" object press 'MENU' (when the "Fishing" object is
highlighted). On the screen appears:
Fig. 3.5.2.3a - Example of picture associated to the Fishing object
3.5.3 INFO TREE AND EXPANDED INFO PAGE
This page combines the Info Tree and the Expanded Info pages; this gives the
48
User Manual
Page 47
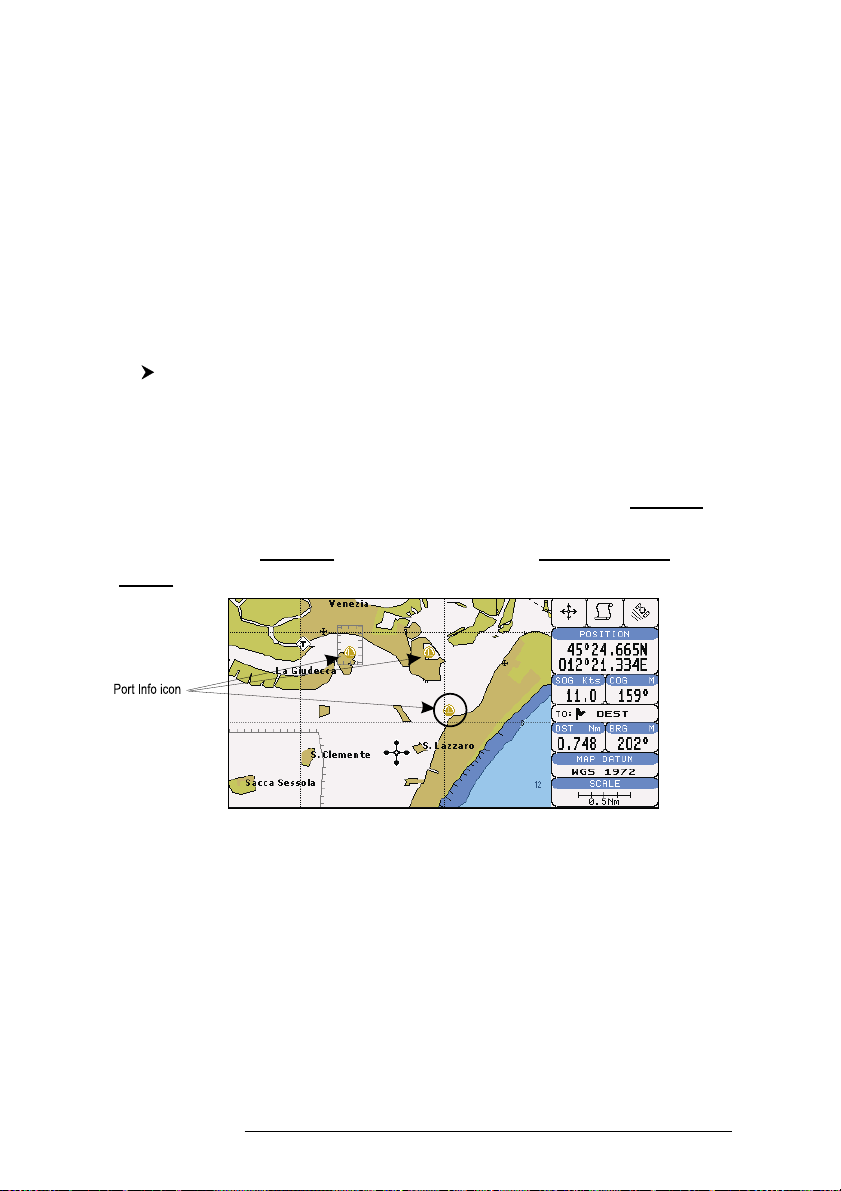
advantage of showing the details of the object selected on the Info Tree while the
cursor is moving through the Info Tree’s items.
The upper side of the page contains the Info Tree and the Lower side contains the expanded information. While moving the cursor through the Info Tree, all
the relevant information of the selected object is shown on the lower part of the
page.
When the selected object is a Tide Height, pressing 'ENTER' the Tide page
is shown. Pressing 'CLEAR' the page is closed.
3.5.4 INFO FUNCTION
Place the cursor in any place you want and press:
'MENU' + 'INFO'
to show the Info Tree and Expanded Info page (see Par. 3.5.4).
3.5.5 GETTING PORT INFO
Upon viewing the chart of a port or harbor, you will see a Port Info icon that
can be clicked on to query the available information immediately displayed with
many details. The Port Info icon is visible only if the Ports & Services option is On
(default setting).
Fig. 3.5.5 - Port Info icon
The available information is shown in the Automatic Info window where
icons of the available services are shown:
User Manual
49
Page 48
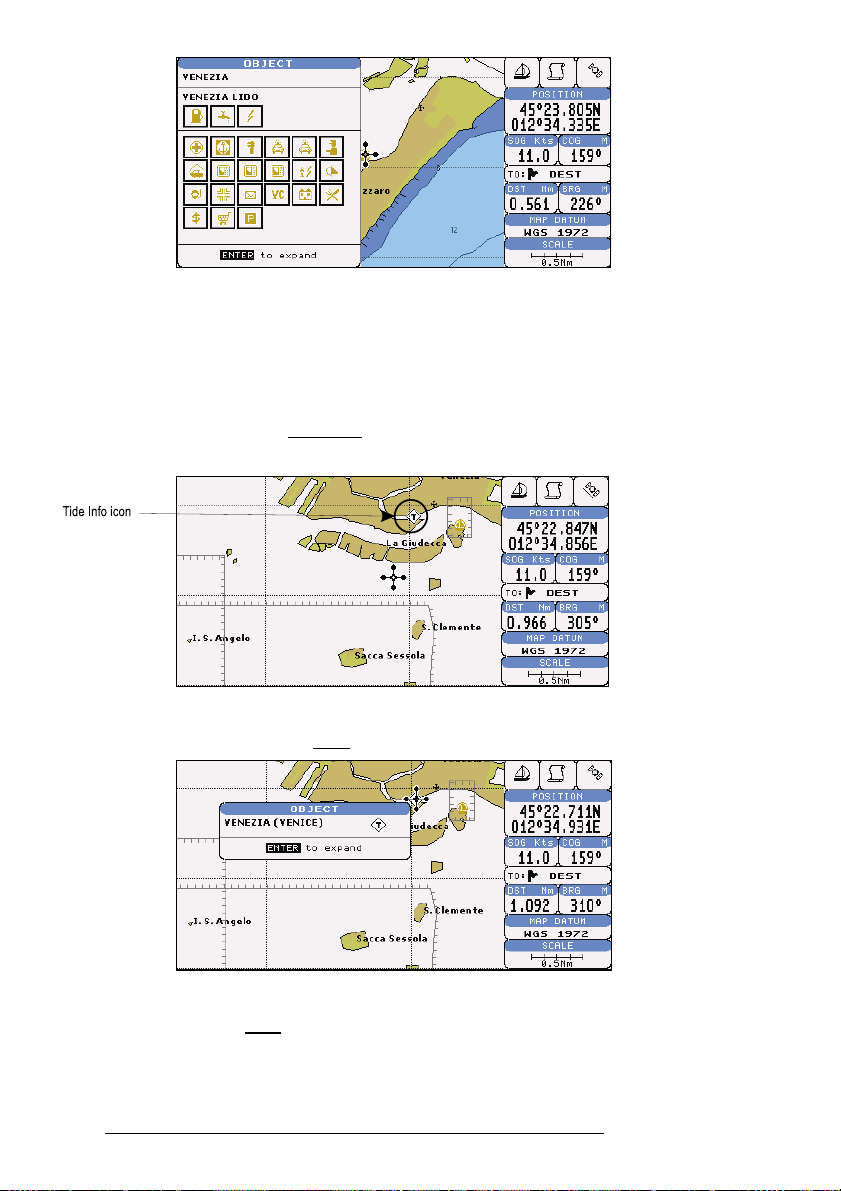
Fig. 3.5.5a - Automatic Info window
To expand information about that object press 'ENTER'.
3.5.6 GETTING TIDE INFO
When you will see a Tide Info icon you can click on it to query the available
information that will immediately be displayed.
Fig. 3.5.6 - Tide Info icon
Place the cursor on the Tide symbol, a Automatic Info window is opened:
50
Fig. 3.5.6a - Automatic Info on Tide
To display the Tide Graph page, press 'ENTER':
User Manual
Page 49
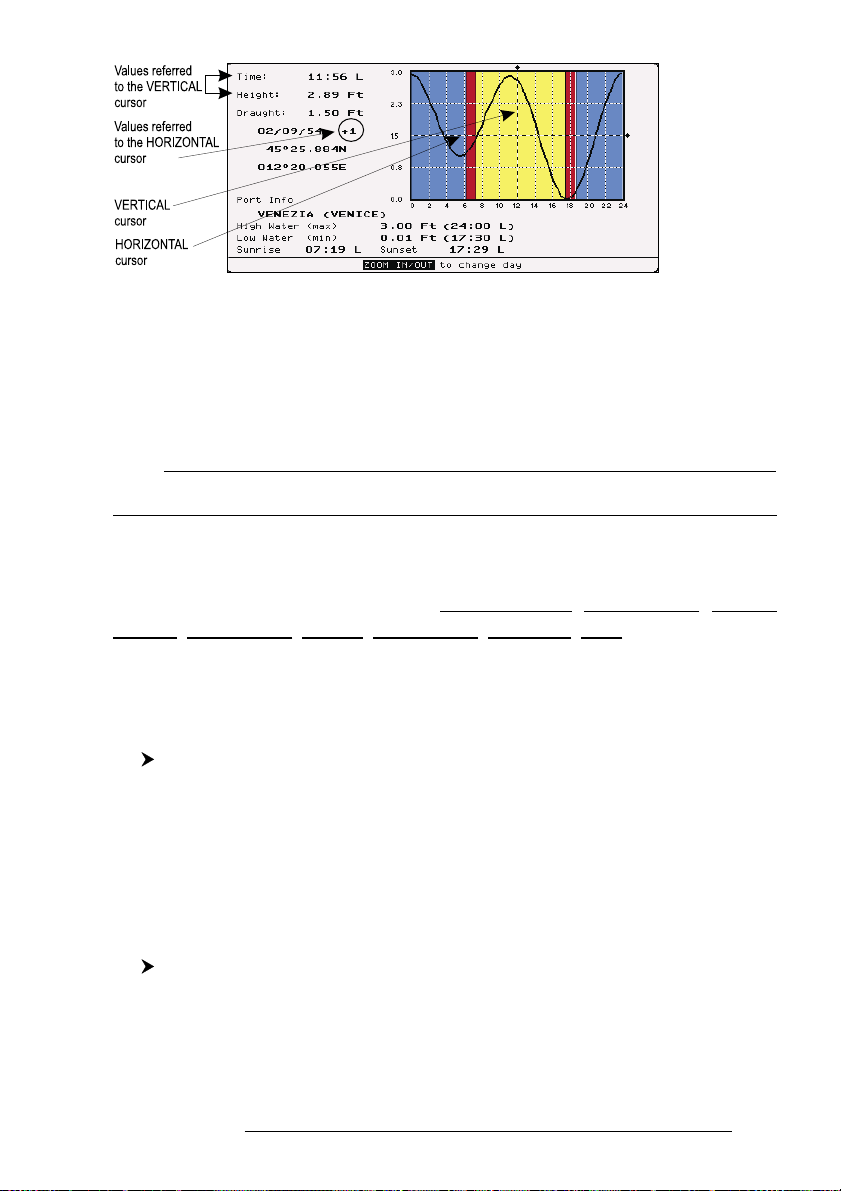
Fig. 3.5.6b - Tide Graph
Using the cursor key, it is possible to move the cursor anywhere on the
graph and display the time, height (vertical cursor) and draught (horizontal cursor)
on a particular graph point. Also use 'ZOOM IN' or 'ZOOM OUT' to go to previous or next day and 'ENTER' to set date (move the cursor key up/down to insert
the preferred number and use it left/right to move cursor to left/right).
Note
Tide graphs are an approximation of the tide and they should be used in conjunction with
traditional tide tables and navigational methods.
3.5.7 FIND FUNCTION
The chartplotter allows finding Nearest Services, Port By name, Port By
distance, Tide Stations, Wrecks, Obstructions, Lakes info, POIs.
3.5.7.1 Finding Port Services
To locate and display the nearest available facilities of a particular type (i.e.
the nearest Hospital, sailmaker, bank, etc.).
'MENU' + " FIND" + 'ENTER' + "NEAREST SERVICES" + 'ENTER'
The icons of the available services are shown. Use the cursor key to select
any facility and press 'ENTER'. The list of the nearest ports (up to 10) containing
the facility will be shown on the screen. Then choose the port you want and press
'ENTER'.
3.5.7.2 Finding Ports By Name
To select the Ports By Name function following the procedure:
'MENU' + "FIND" + 'ENTER' + "PORTS BY NAME" + 'ENTER'
Shows the list of all ports stored on the C-CARD in alphabetical order and
allows to search ports by name to locate the ports on the map.
User Manual
51
Page 50

3.5.7.3 Finding Ports By Distance
To select the Ports By Distance function following the procedure:
'MENU' + "FIND" + 'ENTER' + "PORTS BY DISTANCE" + 'ENTER'
Shows the list of all ports stored on the C-CARD in closest distance order
and allows to locate the ports on the map.
3.5.7.4 Finding Tide Stations
Finds the nearest Tide Stations (up to 10) on the map, from the boat position
- if a valid fix is received - or from the cursor position - if the received fix position is
not good.
'MENU' +"FIND" + 'ENTER" + "TIDE STATIONS" + 'ENTER'
A new window will appear in few seconds. Choose the Tide Stations you
want and press 'ENTER' or 'F
IND
' to display the Tide Graph page (see Par. 3.5.4).
Press 'CLEAR' to display the Tide Station chosen.
3.5.7.5 Finding Wrecks
Searches for Nearest Wrecks:
'MENU' +"FIND" + 'ENTER' + "WRECKS" + 'ENTER'
Use the cursor key to select the port and 'ZOOM IN'/'ZOOM OUT' to
select next/previous page. Press 'ENTER' to locate the selected Wreck on the map.
3.5.7.6 Finding Obstructions
Searches for Nearest Obstructions:
'MENU' +"FIND" + 'ENTER' + "OBSTRUCTIONS" + 'ENTER'
Use the cursor key to select the port and 'ZOOM IN'/'ZOOM OUT' to
select next/previous page. Press 'ENTER' to locate the selected Obstruction.
3.5.7.7 Finding POIs
Searches for Nearest Points Of Interest:
'MENU' + "FIND" + 'ENTER' + "POINTS OF INTEREST" + 'ENTER'
A sub-menu is opened to find different categories of POIs.
3.5.7.8 Finding Lakes By Names
Selects the Lakes By Names function:
'MENU' + "FIND" + 'ENTER' + "LAKES BY NAME" + 'ENTER'
Shows the list of all lakes stored on the C-CARD in alphabetic order. Press-
ing 'MENU' to insert the Lake name.
3.5.7.9 Finding Lakes Information
Searches for Nearest Lakes Info:
52
User Manual
Page 51
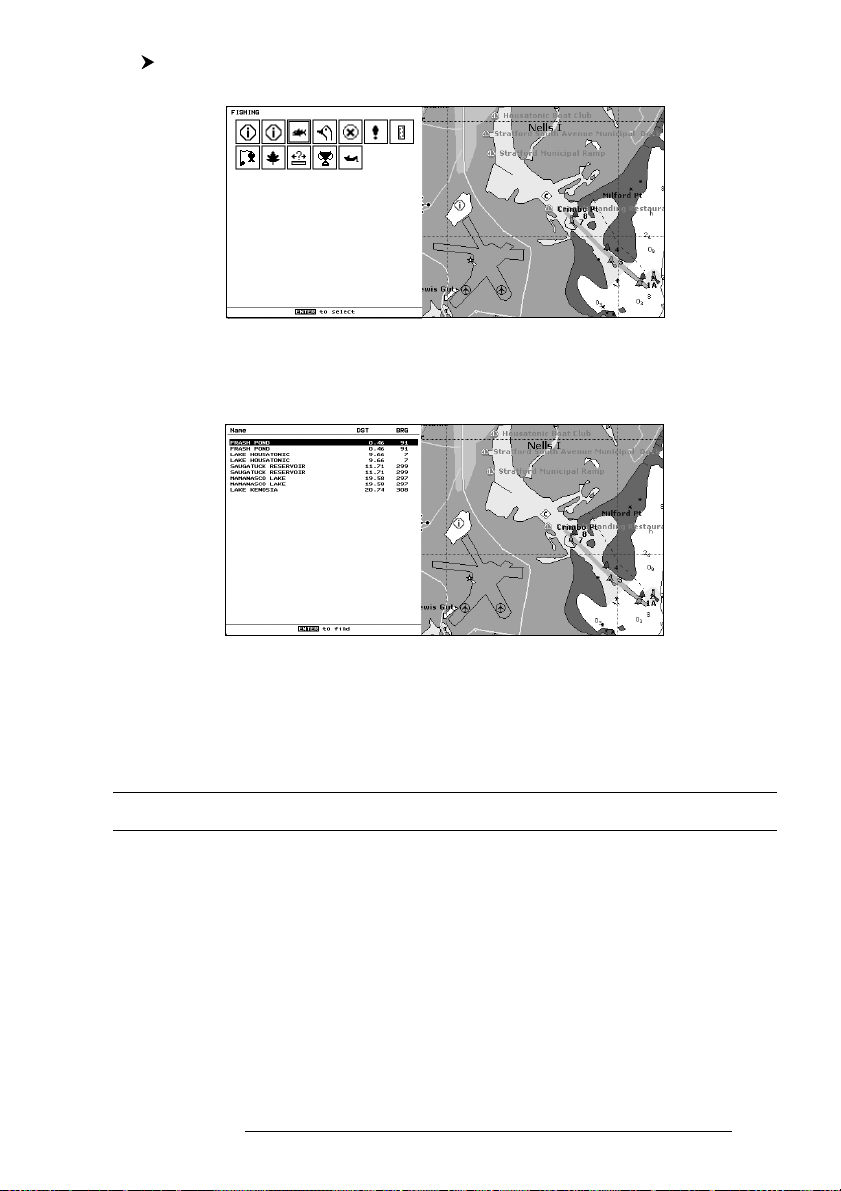
'MENU' + "FIND" + 'ENTER' + "LAKES INFORMATION" + 'ENTER'
It founds the Outdoor Recreational Area objects. See the following picture:
Fig. 3.5.7.9 - Outdoor Recreational Area objects
Use the cursor key to select any objects and press 'ENTER'. The list of the
nearest lakes containing the facility will be shown on the screen.
Fig. 3.5.7.9a - Nearest Lakes list
Then choose the lake you want and press 'ENTER': the Full Info page is
shown.
3.6 MAN OVERBOARD (MOB)
It is an important function useful in the case someone or something falls
overboard.
3.6.1 INSERTING MOB
Press 'MOB' to place MOB symbol at ship's coordinates. On the screen the
MOB symbol and a window to advise the MOB is activated appear, press 'CLEAR'
to delete this window. Data displayed in Text Area are related to MOB. Placing the
User Manual
53
Page 52
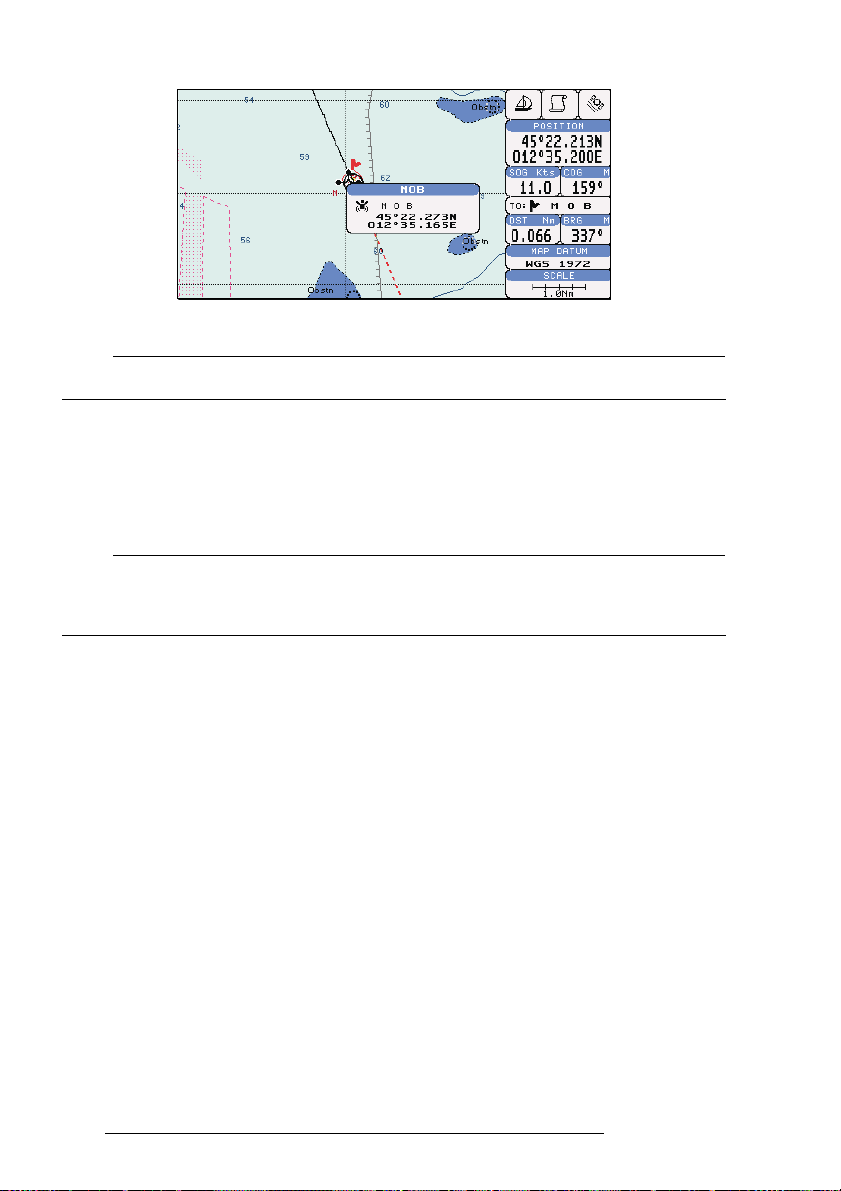
cursor on the MOB symbol an information window appears:
Fig. 3.6.1 - Man Overboard
Note
In the information window the bottom side "ENTER for Options" appears only if the "Advanced
Functions" item in the "Basic Settings" menu is activated (On), see Par. 3.2.4.
3.6.2 DELETING MOB
Press 'MOB', select 'CANCEL" and press 'ENTER' again. The MOB sym-
bol remains on the screen shaded until the next screen redraws.
Note
If the "Advanced Settings" item in the menu "Basic Settings" is activated (On), see Par. 3.2.4,
placing the cursor on MOB the information window appears as shown in the previous Fig. 3.6.1.
Press 'ENTER', select "CANCEL" and press 'ENTER' again: the MOB symbol remains on the
screen shaded until the next screen redraws.
54
User Manual
Page 53

4
For the Experienced User
Now you have had a chance to became familiar with your new chartplotter,
there are a great number of advanced features that you will find helpful. First of all
the use of the Advanced Mode.
The chartplotter can operate in two different modes: Basic Mode and Advanced Mode. In the first mode there is a restricted number of functions, while in
Advanced Mode it is possible to have more available functions, for example it is
possible to handle Waypoints. To select the Advanced Mode:
'MENU' + "BASIC SETTINGS" + 'ENTER' + "ADVANCED FUNCTIONS" +
'ENTER' + "ON" + 'ENTER'
When Advanced Functions is Off the chartplotter operates in Basic Mode.
4.1 MORE ABOUT CREATING AND USING ROUTES
At anytime, you may add or delete Waypoints, see a route summary, reverse
the direction of the route or erase the entire route.
4.1.1 WAYPOINT
You may add Waypoints, delete Waypoints from a route, move any Waypoint in the route to another location, insert a Waypoint between two existing ones,
find any Waypoint at anytime. Every time you place the cursor on a Waypoint the
following functions are available.
4.1.1.1 Adding Waypoint
Select Advanced Mode + 'ENTER' + "WAYPOINT" + 'ENTER'
The Waypoint appears on the cursor position. An info window is shown
containing route number, Waypoint name, symbol and Latitude/Longitude.
User Manual
55
Page 54
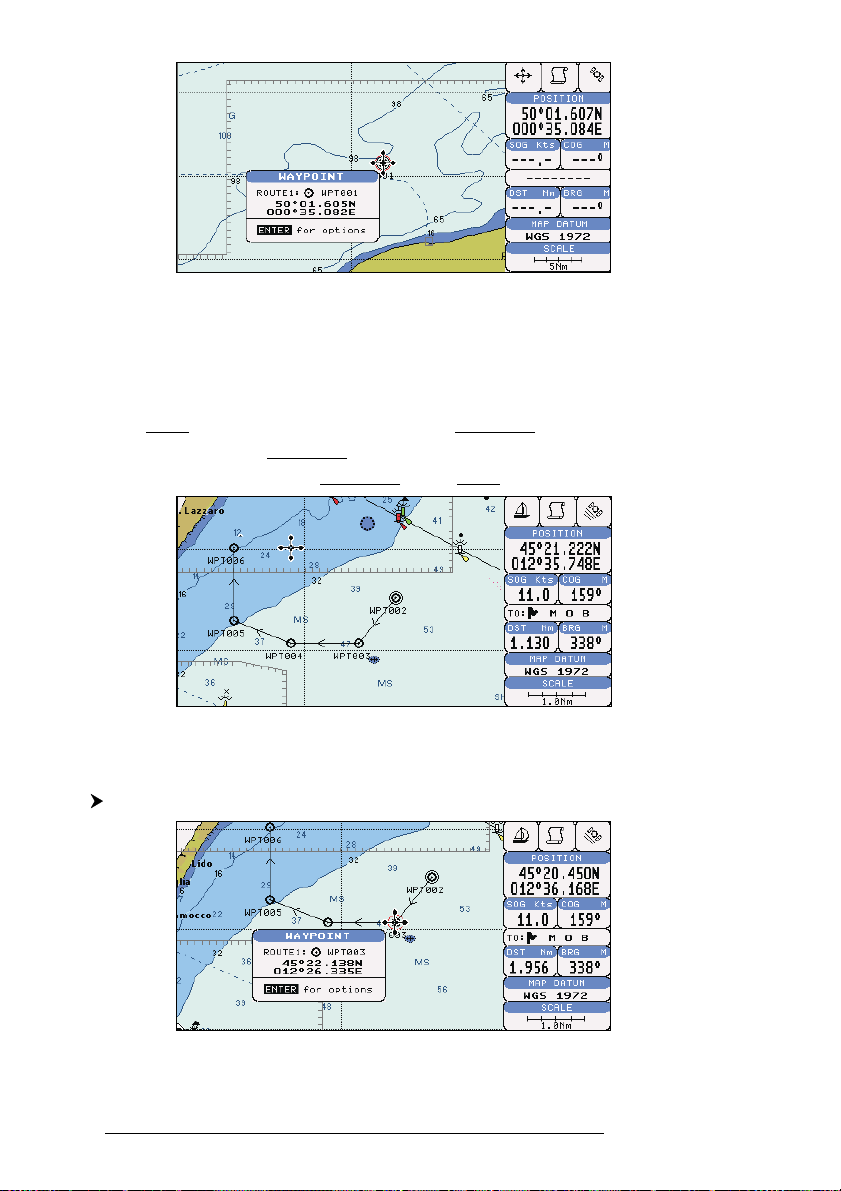
Fig. 4.1.1.1 - Waypoint placing
4.1.1.2 Creating a route
Repeat the "Adding Waypoint" procedure described in the previous Par.
4.1.1.1. The sequence of moving the cursor and pressing 'ENTER' is continued to
create the route, until you have reached the last Waypoint, your final destination.
Segments connecting the Waypoints are shown, and the starting point is identified
by a circle surrounding the first Waypoint of the route:
Fig. 4.1.1.2 - Route planning
4.1.1.3 Deleting Waypoint
Select Advanced Mode + Place cursor on Waypoint
56
Fig. 4.1.1.3 - Deleting Waypoint (I)
User Manual
Page 55
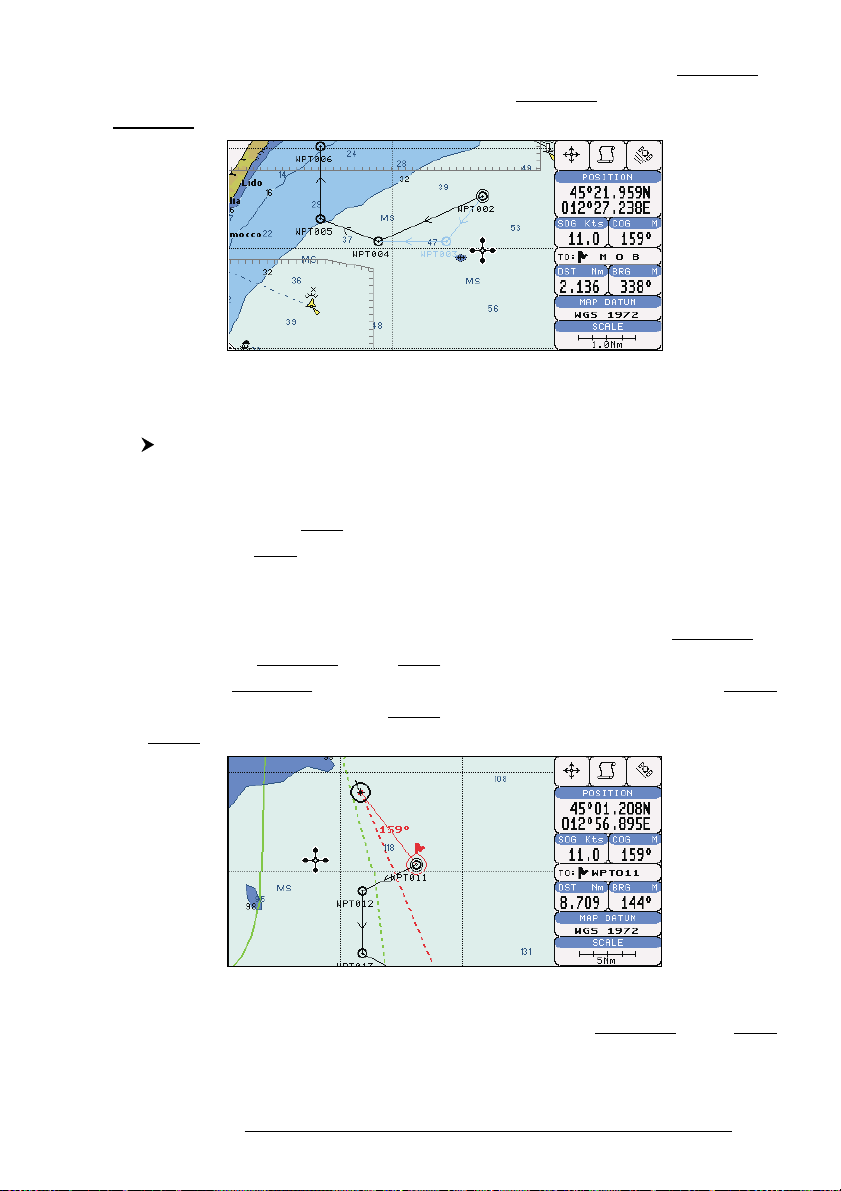
Press 'ENTER'. Select "DELETE" and press 'ENTER'. The Waypoint is
deleted and a new line between previous and next Waypoint is shown. The deleted
Waypoint remains shaded until the screen is redrawn.
Fig. 4.1.1.3a - Deleting Waypoint (II)
4.1.1.4 Deleting route
Select Advanced Mode + Place cursor on Waypoint
Press 'ENTER'. Select "DELETE ROUTE" and press 'ENTER'. A window
is opened: select "YES" and press 'ENTER' to confirm (select "NO" and press 'ENTER' otherwise). The route remains on the screen shaded until the screen is redrawn. To delete route see also Par. 4.1.2.2 and 4.1.2.4.
4.1.1.5 Distance and Bearing to Target
Once you have positioned the cursor on the desired starting Waypoint (it
could be the first Waypoint of the route or another one) press 'GO-TO'. A circle
surrounds the Waypoint symbol. A straight line is shown, connecting the Target
with the ship's position. When the Target is placed, all navigation data are referred to
this Target.
Fig. 4.1.1.5 - Selecting destination (Target)
The destination will automatically switch to the next Waypoint on the route
when you reach or pass the present destination.
User Manual
57
Page 56
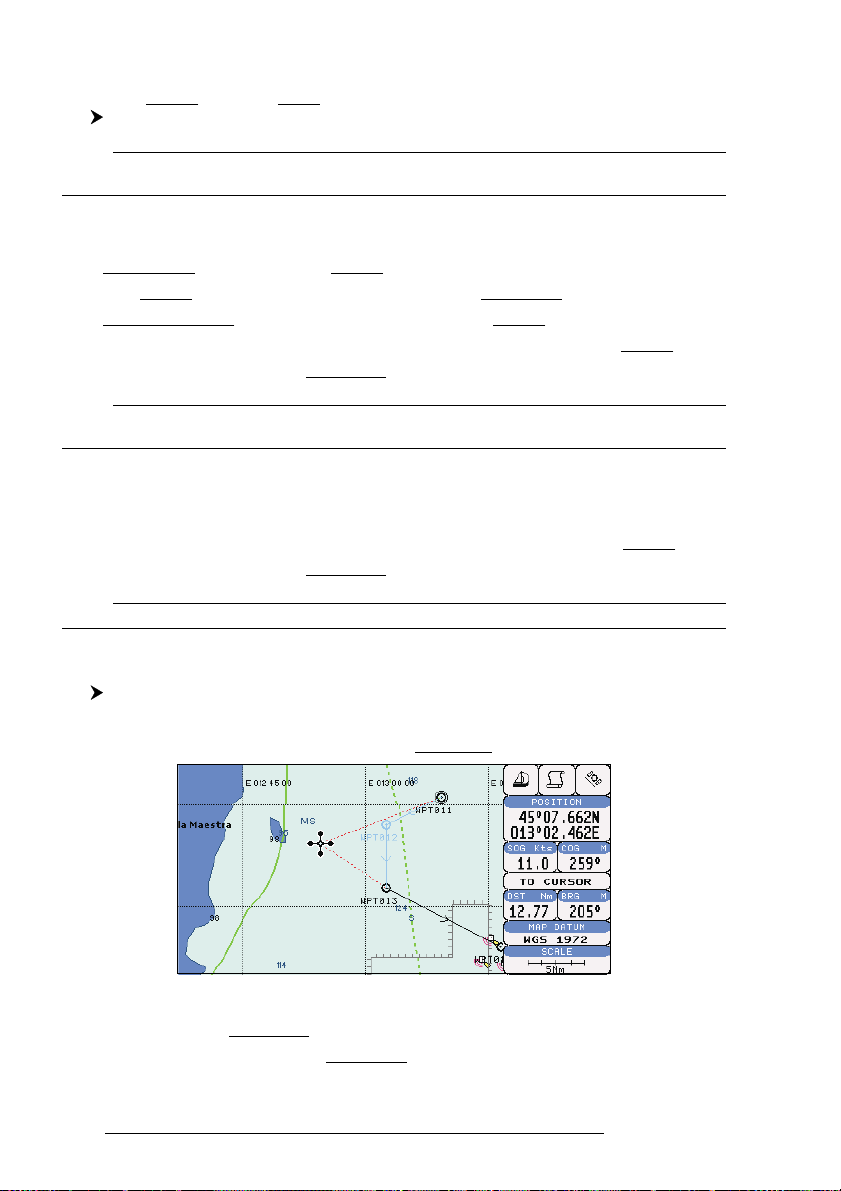
Time To Go
When the Target is set the TTG value is displayed in the Graphic Data page:
'PAGE' more times to select Graphic Data page
Note
If SOG value is less than 1.0 knots or the BRG is greater than 90 degrees, the TTg value is not
displayed.
Deleting Target
If in Basic Mode place cursor on Target icon and press 'CLEAR': the symbol that
identifies Target disappears from the screen, but the Waypoint remains.
If in Advanced Mode (see Par. 3.4.3) place cursor on Target icon, press 'ENTER',
select "STOP NAV" and press 'ENTER': the symbol that identifies Target disappears from the screen, but the Waypoint remains.
Note
If you select "NEXT"/"PREV" and press 'ENTER', the Target icon is moved on the next/
previous Waypoint in the route.
Otherwise in both Modes (when the cursor is placed in a generic position on the
chart) press 'GO-TO'. A window appears to advice that the Destination point is
present: select "STOP" and press 'ENTER', the symbol that identifies Target disappears from the screen, but the Waypoint remains.
Note
If you select "START" and press 'ENTER', the Target icon is moved on the new cursor position.
4.1.1.6 Moving Waypoint
Select Advanced Mode + Place cursor on Waypoint
Press 'ENTER'. Select "MOVE" and press 'ENTER'. Use the cursor key to
move the cursor: a dotted line, connecting the Waypoint to the new position, is shown:
Fig. 4.1.1.6 - Moving Waypoint function (I)
To place the Waypoint in the new position, choose the new place and press
'ENTER' ('CLEAR' otherwise), Waypoint appears in the new position:
58
User Manual
Page 57
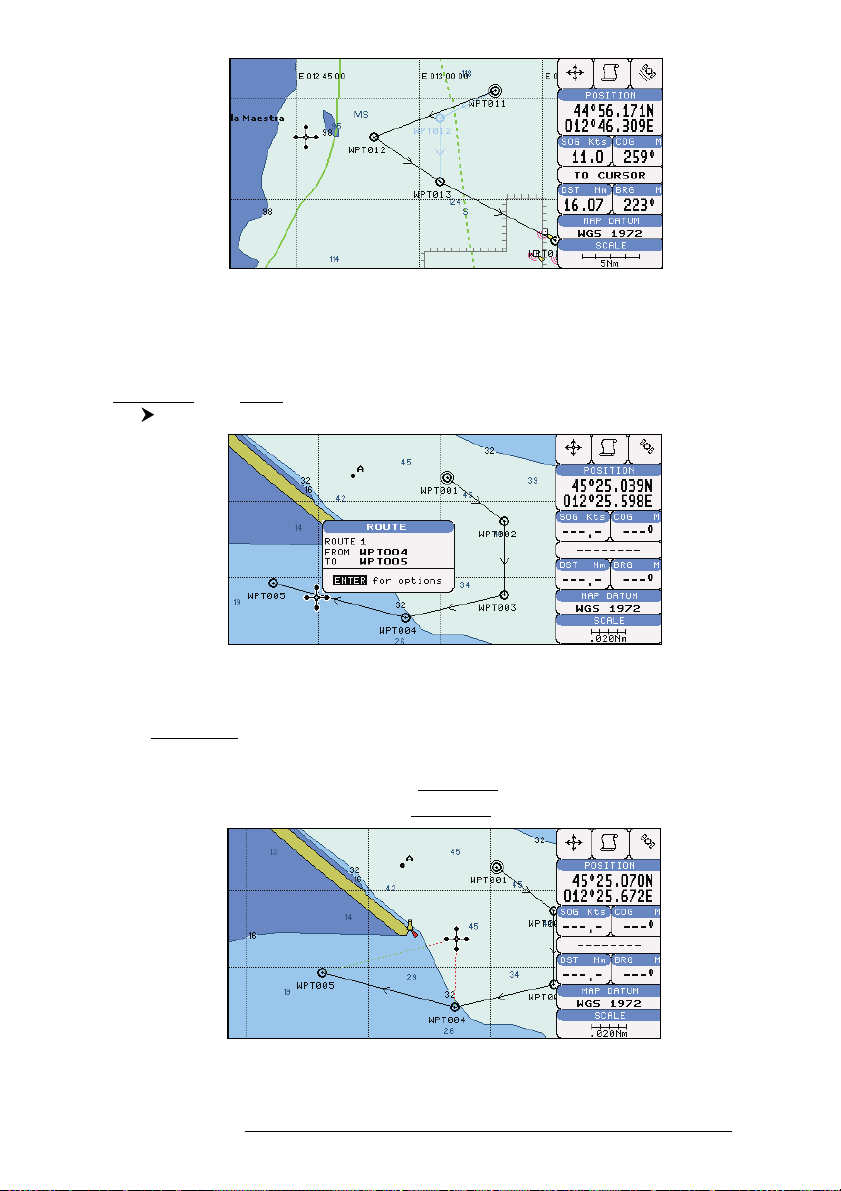
Fig. 4.1.1.6a - Moving Waypoint function (II)
4.1.1.7 Inserting Waypoint
Every time you place the cursor on the segment connecting two existing
Waypoints of a route the following function is available.
Place cursor on route leg
Fig. 4.1.1.7 - Placing Waypoint between two existing ones (I)
Press 'ENTER'. Select "INSERT" and press 'ENTER'. The line between the
two Waypoints is turned into a dotted line: move the cursor to the new position.
When the cursor is stationary for one second or two, the line will "rubber-band",
drawing a dotted line between the last Waypoint and the cursor, and another dotted
line between the cursor and the next Waypoint:
User Manual
Fig. 4.1.1.7a - Placing Waypoint between two existing ones (II)
59
Page 58
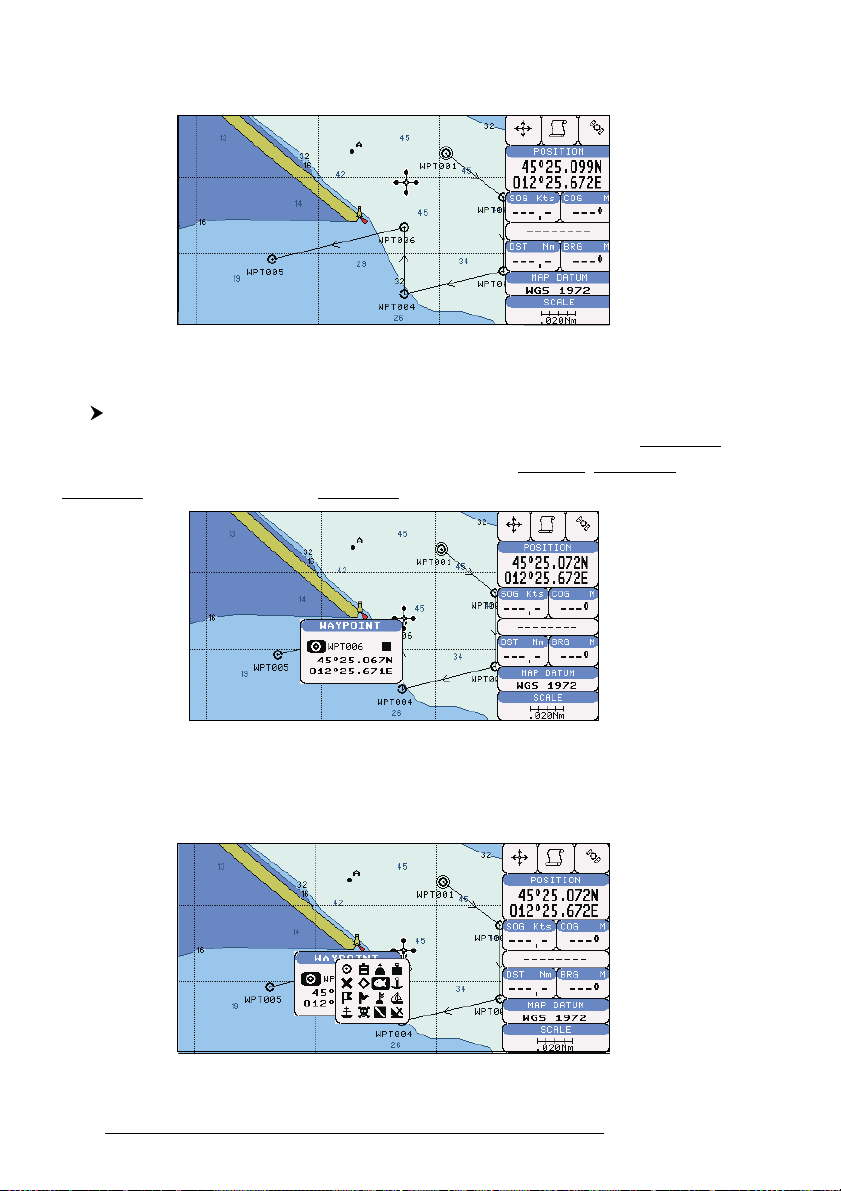
Once you have positioned the cursor at new location, press 'ENTER' (press
'CLEAR' to abort operation):
Fig. 4.1.1.7b - Placing Waypoint between two existing ones (III)
4.1.1.8 Editing Waypoint
Select Advanced Mode + Place cursor on Waypoint
Press 'ENTER'. Select "EDIT" and press 'ENTER' to modify a Waypoint.
A window will be shown with Name, Symbol, Color and Latitude/Longitude of the
Waypoint, advising about what Waypoint data are modifiable.
Fig. 4.1.1.8 - Edit Waypoint (I)
Use the cursor key to select the field. If you have selected Name field, press
'ENTER': use the cursor key to insert the character (8 characters max), press 'ENTER'.
If Symbol field is selected press 'ENTER': a window with 16 different symbols appears:
Fig. 4.1.1.8a - Edit Waypoint (II): Waypoint symbols
60
User Manual
Page 59
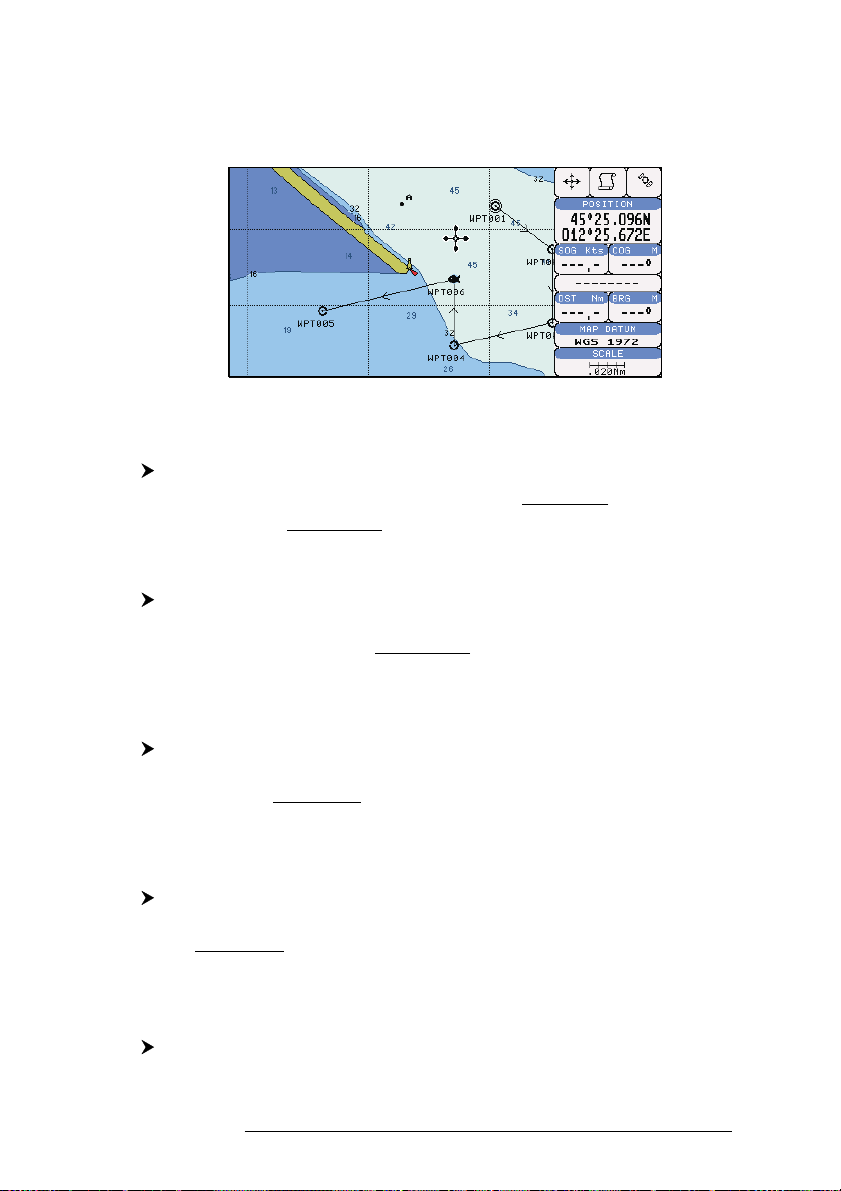
Use the cursor key to select the symbol and press 'ENTER'. If select Coordinates field, press 'ENTER' and then use the cursor key to insert the value. If Color
field is selected press 'ENTER': a window with 8 different colors appears, use the
cursor key to select the desired color and press 'ENTER'. Then press 'CLEAR'.
Fig. 4.1.1.8b - Edit Waypoint (III)
4.1.1.9 Finding information about Waypoints: User Points List page
'MENU' + "ADVANCED SETTINGS" + 'ENTER' + "USER POINTS" + 'ENTER'
Move up/down the cursor key to select the User Point you wish. If the page
contains more than 8 User Points, the list continues in the next pages.
Finding User Points
'MENU' + "ADVANCED SETTINGS" + 'ENTER' + "USER POINTS" + 'ENTER' +
"FIND' + 'ENTER'
The chartplotter exits from the User Points List page and redraws the chart. The
selected point appears, with the cursor placed on it.
Deleting selected User Point
'MENU' + "ADVANCED SETTINGS" + 'ENTER' + "USER POINTS" + 'ENTER' +
"CLR-ONE' + 'ENTER'
Deletes the selected User Point. A warning message appears, select "YES" and press
'ENTER' ('CLEAR' otherwise).
Deleting all User Points with the same symbol
'MENU' + "ADVANCED SETTINGS" + 'ENTER' + "USER POINTS" + 'ENTER' +
"CLR-SYM' + 'ENTER'
Deletes all User Points which have the same identifier of that shown in the selected row.
A warning message appears, select "YES" and press 'ENTER' ('CLEAR' otherwise).
Deleting all User Points with the same type
'MENU' + "ADVANCED SETTINGS" + 'ENTER' + "USER POINTS" + 'ENTER' +
"CLR-TYP' + 'ENTER'
User Manual
61
Page 60

Deletes all User Points which have the same type of that shown in the selected row.
A warning message appears, select "YES" and press 'ENTER' ('CLEAR' otherwise).
Deleting all stored User Points
'MENU' + "ADVANCED SETTINGS" + 'ENTER' + "USER POINTS" + 'ENTER' +
"CLR-ALL' + 'ENTER'
A warning message appears, select "YES" and press 'ENTER' ('CLEAR' otherwise)
to delete all stored User Points.
Send/Receive User Points
Sends all User Points to an external device using the serial port:
'MENU' + "ADVANCED SETTINGS" + 'ENTER' + "USER POINTS" + 'ENTER' +
"SEND"
Reads all User Points from NMEA Input port:
'MENU' + "ADVANCED SETTINGS" + 'ENTER' + "USER POINTS" + 'ENTER' +
"RECEIVE"
4.1.2 ROUTES
The following functions are used for the route management. The chartplotter handles routes from 1-25, which are permanently stored in the memory as they
are created. Only one route can be selected for work at any one time.
4.1.2.1 Selecting Route
'MENU' + "ADVANCED SETTINGS" + 'ENTER' + "ROUTE" + 'ENTER' +
"CURRENT ROUTE" + 'ENTER'
A window appears with the route number list and the related route name.
Use the cursor key to scroll the list up/down. Pressing 'ENTER' the selected route
becomes the current route.
Note
If there is the Target in the current route, it is not possible to change the current route. So if the
"Current Route" item is selected, a Warning window appears because Go-To is placed in the
current route.
4.1.2.2 Deleting route
'MENU' + "ADVANCED SETTINGS" + 'ENTER' + "ROUTE" + 'ENTER' +
"DELETE ROUTE" + 'ENTER'
A window is opened: select "YES" and press 'ENTER' to confirm (select
"NO" and press 'ENTER' otherwise). The route remains on the screen shaded until
the screen is redrawn. To delete route see also Par. 4.1.1.4 and 4.1.2.4).
62
User Manual
Page 61
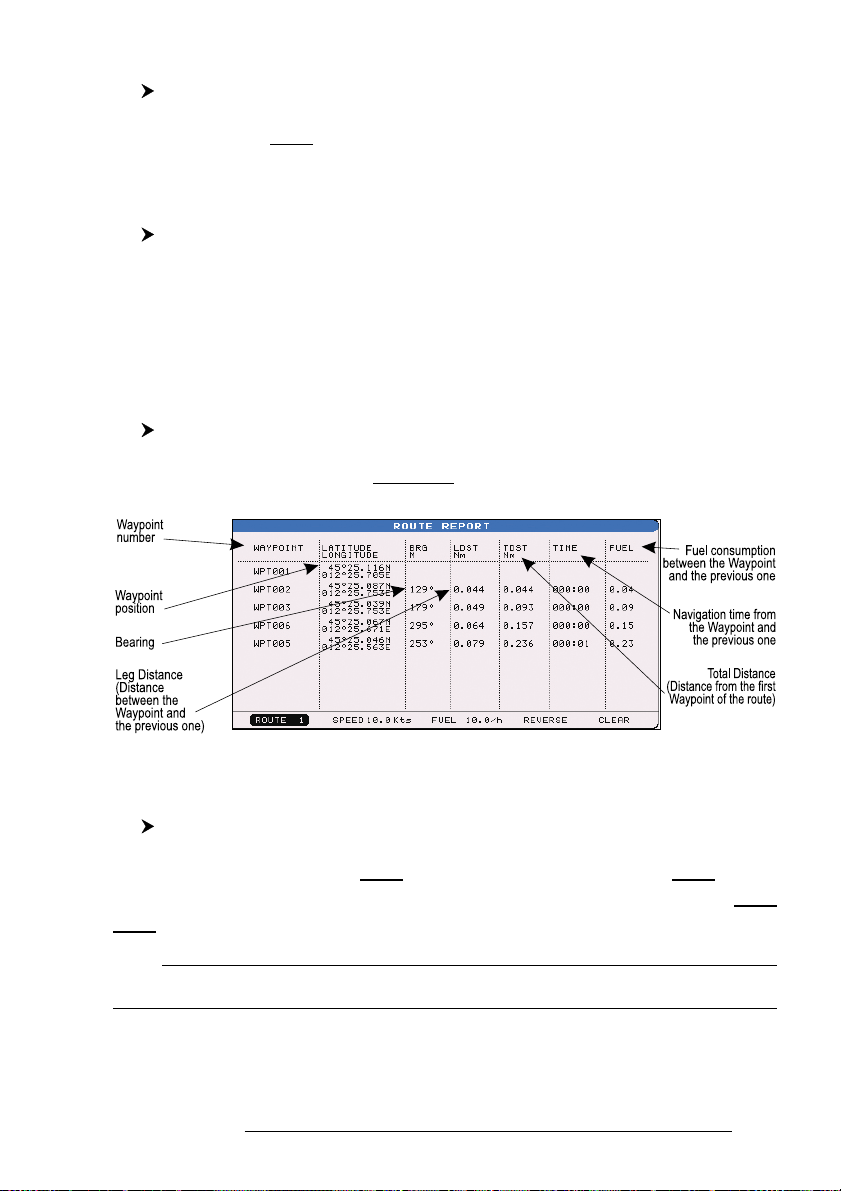
4.1.2.3 Reversing route
'MENU' + "ADVANCED SETTINGS" + 'ENTER' + "ROUTE" + 'ENTER' +
"ROUTE REVERSE" + 'ENTER'
Reversing a route plan is most typically used to return to the point where the
route originally started.
4.1.2.4 Route Color
'MENU' + "ADVANCED SETTINGS" + 'ENTER' + "ROUTE" + 'ENTER' +
"ROUTE COLOR" + 'ENTER'
A window is opened: use the cursor keys to select the route color you want
among the eight colors available. Press 'ENTER' to confirm. The route appears on
the screen colored by the selected color. It is possible to select a different color for
any route.
4.1.2.5 Finding information about a route: Route Report
'MENU' + "ADVANCED SETTINGS" + 'ENTER' + "ROUTE" + 'ENTER' +
"ROUTE REPORT" + 'ENTER'
If there are more than 8 Waypoints shown, use the cursor key to select another page.
Fig. 4.1.2.5 - Route Data Report page
Selecting route
'MENU' + "ADVANCED SETTINGS" + 'ENTER' + "ROUTE" + 'ENTER' +
"ROUTE REPORT" + 'ENTER' + "ROUTE #" + 'ENTER'
Use the cursor key to select the route number and press 'ENTER'. The route, shown
by straight segments, is centered on the screen, with the cursor on the central Waypoint. See also Par. 4.1.2.1.
Note
If there is the Target in the current route, it is not possible to change the current route. So if the
"Route #" item is selected, the chart plotter emits three beeps.
User Manual
63
Page 62

Changing Speed & Fuel values
'MENU' + "ADVANCED SETTINGS" + 'ENTER' + "ROUTE" + 'ENTER' +
"ROUTE REPORT" + 'ENTER'
It is possible to modify the Speed and Fuel consumption values, respectively by selecting "SPEED" and "FUEL". Insert value by using the cursor key and pressing
'ENTER'.
Reversing route
'MENU' + "ADVANCED SETTINGS" + 'ENTER' + "ROUTE" + 'ENTER' +
"ROUTE REPORT" + 'ENTER' + "REVERSE" + 'ENTER'
Reversing a route plan is most typically used to return to the point where the route
originally started. See also Par. 4.1.2.3.
Deleting route
'MENU' + "ADVANCED SETTINGS" + 'ENTER' + "ROUTE" + 'ENTER' +
"CLEAR" + 'ENTER'
A window is opened: select "YES" and press 'ENTER' to confirm (select "NO" and
press 'ENTER' otherwise). The route remains on the screen shaded until the screen
is redrawn. To delete the route see also Par. 4.1.1.4 and 4.1.2.2.
4.1.2.6 Route Name
'MENU' + "ADVANCED SETTINGS" + 'ENTER' + "ROUTE" + 'ENTER' +
"ROUTE NAME" + 'ENTER'
Use the cursor key to insert the route name (max 16 alphanumeric char.).
4.1.2.7 Send/Receive Route
To transmit the Active Route information onto the NMEA output port.
'MENU' + "ADVANCED SETTINGS" + 'ENTER' + "ROUTE" + 'ENTER' + "SEND"
The NMEA WPL & RTE messages are sent to the output port.
To save Route information received from the NMEA input port.
'MENU' + "ADVANCED SETTINGS" + 'ENTER' + "ROUTE" + 'ENTER' +
"RECEIVE"
The received route is saved on the Active route, overwriting it. The NMEA
WPL & RTE messages are sent to the input port.
4.2 MARK & EVENT
You may place a Mark, as it is called, at your cursor position, while Event is
created at your vessel position.
64
User Manual
Page 63
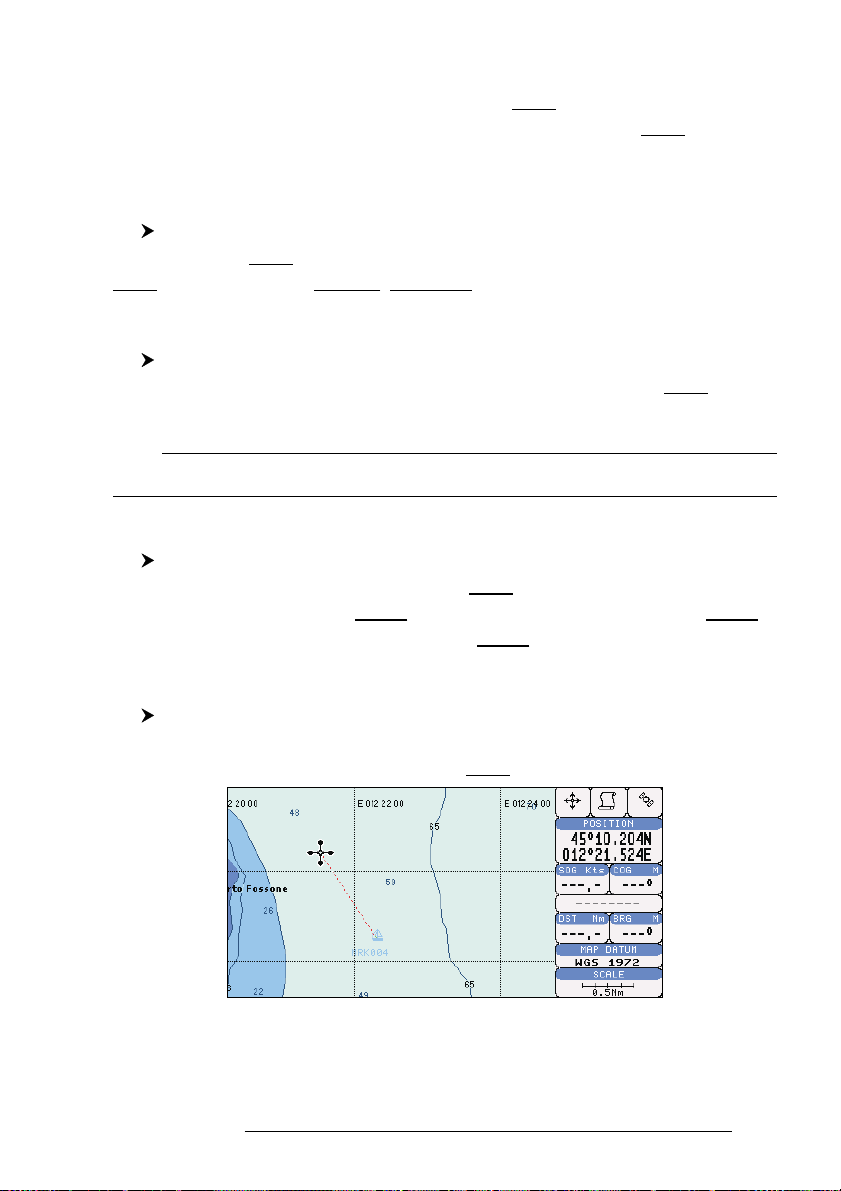
4.2.1 MARKS
You may tag a location on the chart with a Mark symbol and number, which
you can record for later use. Every time you place the cursor on a Mark the following functions are available.
4.2.1.1Adding Mark
Select Advanced Mode + 'ENTER' + "MARK" + 'ENTER'
The new Mark appears on your cursor position. An info window containing
Mark name, symbol and Latitude/Longitude is shown.
4.2.1.2 Deleting Mark
Select Advanced Mode + Place cursor on Mark
Press 'ENTER'. Select "DELETE" and press 'ENTER': the Mark remains
on the screen shaded until the next screen is redrawn.
Note
If you try to delete a Mark that belongs to many routes, the chart plotter emits three beeps and on
the screen a Warning message appears. If you want to delete the Mark, press 'ENTER'.
4.2.1.3 Goto
Place cursor on Mark
Press 'GO-TO': a circle encloses the Mark symbol. A straight line is shown
on the screen connecting the Target with the ship's position. When the Target is
placed, all navigation data are referred to this Target.
4.2.1.4 Moving Mark
Select Advanced Mode + Place cursor on Mark
Press 'ENTER'. Select "MOVE" and press 'ENTER'. Move the cursor by
the cursor key, a dotted line connecting the Mark with the new position is shown:
Fig. 4.2.1.4 - Moving Mark function (I)
User Manual
65
Page 64
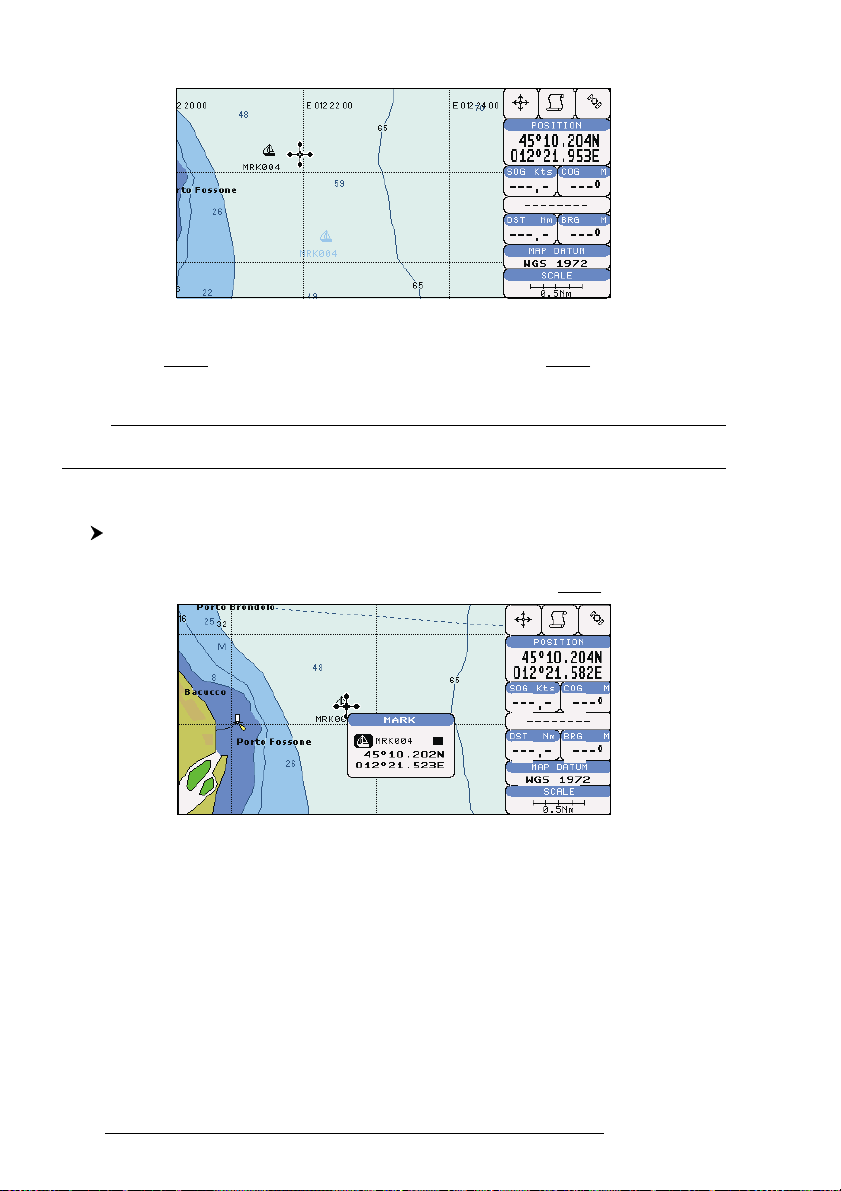
Press 'ENTER':
Fig. 4.2.1.4a - Moving Mark function (II)
The Mark is placed in the new position, the "old" Mark, remains on the
screen shaded until the screen is redrawn.
Note
If you try to move a Mark that belongs to many routes, the chart plotter emits three beeps and on
the screen a Warning message appears. If you want to move the Mark, press 'ENTER'.
4.2.1.5 Editing Mark
Select Advanced Mode + Place cursor on Mark
Press 'ENTER'. Select "EDIT" and press 'ENTER'. A window appears to
modify Name, Symbol, Color and coordinates of the existing Mark.
Fig. 4.2.1.5 - Edit Mark
Use the cursor key to select the field. If you have selected Name field, press
'ENTER': use the cursor key to insert the character (8 characters max), then press
'ENTER'. If Symbol field is selected press 'ENTER': a window with 16 different
symbols appears. Use the cursor key to select the symbol and press 'ENTER'. If
Coordinates field is selected, press 'ENTER' and then use the cursor key to insert the
value. If Color field is selected press 'ENTER': a window with 8 different colors
appears, use the cursor key to select the desired color and press 'ENTER'. Then press
'CLEAR'.
66
User Manual
Page 65

4.2.1.6 Finding information about Marks: User Points List page
'MENU' + "ADVANCED SETTINGS" + 'ENTER' + "USER POINTS" + 'ENTER'
A full window is opened showing information about all stored User Points
(Marks, Events and Waypoints). Move up/down the cursor key to select the User
Point you wish. If the page contains more than 8 User Points, the list continues in
the next pages. See Par. 4.1.1.9.
4.2.1.7 Add to Route
Select Advanced Mode + Place cursor on Mark
Press 'ENTER'. Select "ADD TO ROUTE" and press 'ENTER': the selected Mark is connected to the current route. The same Mark can be added in many
routes.
Note
An existing Mark can be connected to the current route in another mode too. Place cursor on
Mark, the information window related to the Mark appears, press 'CLEAR' to close the window
and then press 'ENTER', select the Waypoint option and press 'ENTER'. The Mark is connected
to the current route.
4.2.2 EVENTS
In Navigate mode you may place a location with an Event symbol and number, directly on the ship's position. Move the cursor to exit from Navigate mode;
place the cursor on an Event to access the following functions.
4.2.2.1 Adding Event
Select Advanced Mode + 'MODE', then 'ENTER' + "EVENT" + 'ENTER'
An Event is placed directly on the ship's position.
4.2.2.2 Deleting Event
Place cursor on Event
Press 'ENTER'. Select "DELETE" and press 'ENTER': the Event remains
on the screen shaded until the next screen is redrawn.
Note
If you try to delete a Event that belongs to many routes, the chart plotter emits three beeps and
on the screen a Warning message appears. If you want to delete the Event, press 'ENTER'.
4.2.2.3 Goto
Place cursor on Event
Press 'GO-TO': a circle encloses the Event symbol. A straight line is shown
on the screen connecting the Target with the ship's position. When the Target is
placed, all navigation data are referred to this Target.
User Manual
67
Page 66
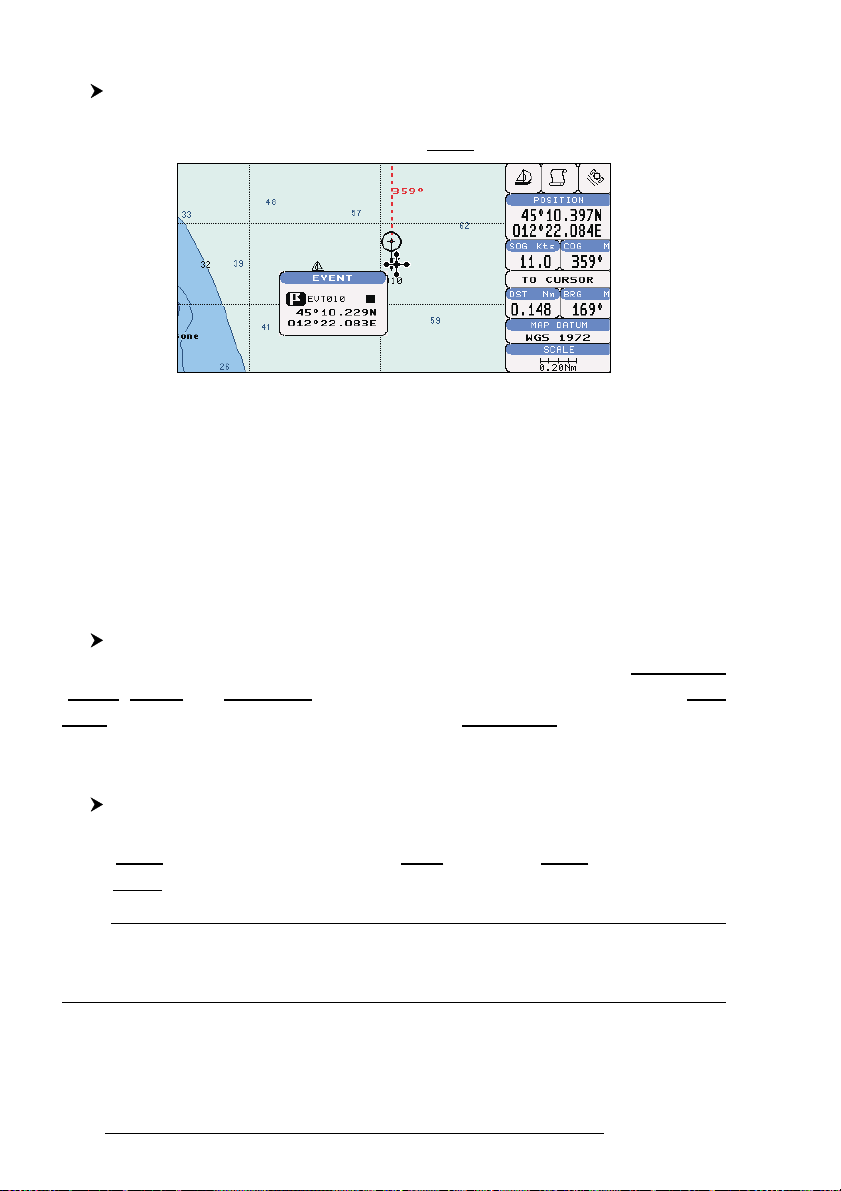
4.2.2.4 Editing Event
Place cursor on Event
Press 'ENTER'. Select "EDIT" and press 'ENTER'. A window appears to
modify Name, Symbol, Color of the existing Event.
Fig. 4.2.2.4 - Edit Event
Use the cursor key to select the field. If you have selected Name field, press
'ENTER': use the cursor key to insert the character (8 characters max), then press
'ENTER'. If Symbol field is selected press 'ENTER': a window with 16 different
symbols appears. Use the cursor key to select the symbol and press 'ENTER'. If
Color field is selected press 'ENTER': a window with 8 different colors appears, use
the cursor key to select the desired color and press 'ENTER'. Then press 'CLEAR'.
4.2.2.5 Finding information about Events: User Points List page
'MENU' + "ADVANCED SETTINGS" + 'ENTER' + "USER POINTS" + 'ENTER'
A full window is opened showing information about all stored User Points
(Marks, Events and Waypoints). Move up/down the cursor key to select the User
Point you wish. If the page contains more than 8 User Points, the list continues in
the next pages. See Par. 4.1.1.9.
4.2.2.6 Add to Route
Place cursor on Event
Press 'ENTER'. Select "ADD TO ROUTE" and press 'ENTER': the selected Event is connected to the current route. The same Event can be added in
many routes.
Note
An existing Event can be connected to the current route in another mode too. Place cursor on
Event, the information window related to the Event appears, press 'CLEAR' to close the window
and then press 'ENTER', select the Waypoint option and press 'ENTER'. The Event is connected
to the current route.
68
User Manual
Page 67

4.3 MORE ABOUT A-B-C-D FUNCTION
The A-B-C-D function, explained in the previous Par. 3.2, if Advanced Mode
is selected, allows you not only to create the A, B, C, D points and to delete them,
but also to modify and move them.
4.3.1 INSERTING THE A-B-C-D POINTS
Place the cursor on the desired position and press 'ENTER'. On the screen
the Create window appears, by using the cursor key select "A-B-C-D" and press
'ENTER': the A point and an information window on A appear. Move the cursor,
press 'ENTER', select "A-B-C-D" and press 'ENTER' again: the B point appears,
connected to A with a straight segment; an information window on A-B segment
(distance (DST), bearing (BRG) and total distance from the first point) appears. Moving
the cursor, pressing 'ENTER', selecting "A-B-C-D" and pressing 'ENTER' places
the C and D points (see previous Fig. 3.3.1).
4.3.2 DELETING THE A-B-C-D POINTS
When placing the cursor on the desired point (A, B, C or D) the information
window appears. Press 'ENTER', select "DELETE" and press 'ENTER' again: the
point is deleted. When the point is deleted, the cursor is placed on the previous
point, if existed. The labels of the next points are renamed.
4.3.3 DELETING THE A-B-C-D SEGMENT
When placing the cursor on the desired point (A, B, C or D) or on segment
between two points the information window appears. Press 'ENTER', select "DELETE ALL" and press 'ENTER' again: all points and connecting segments are deleted.
4.3.4 MOVING THE A-B-C-D POINTS
When placing the cursor on the desired point (A, B, C or D) the information
window appears. Press 'ENTER', select "MOVE" and press 'ENTER': by the cursor
key move the cursor, on the screen a dotted line connecting the point to move with the
new position appears. By pressing 'ENTER' the point is placing in the new position.
User Manual
69
Page 68

4.3.5 INSERTING THE A-B-C-D POINTS
Placing cursor on the segment connecting two points, the information window appears. Select "INSERT" and press 'ENTER': by the cursor key move the
cursor, on the screen a dotted line appears. By pressing 'ENTER' the new point is
placing between the two existed points which are renamed.
4.3.6 NAVIGATING ON THE A-B-C-D POINTS
If fix received is good, place the cursor on the desired point A, B, C or D and
press 'GO-TO'. When ship reaches the Destination point, navigation follows the
next point (if exists). When Target is set, three options are available: STOP NAV,
NEXT and PREV.
4.4 USING THE TRACK FUNCTIONS
As long as the chartplotter is connected to a positioning instrument, it stores
all points in its memory. The chartplotter can store a fix when the distance from its
last stored position is greater than a defined distance or after a defined time. A line
connects such points and represents the past course, called the track of the ship.
'MENU' + "ADVANCED SETTINGS" + 'ENTER' + "TRACK" + 'ENTER'
4.4.1 SELECTING ACTIVE TRACK
'MENU' + "ADVANCED SETTINGS" + 'ENTER' + "TRACK" + 'ENTER' +
"ACTIVE TRK" + 'ENTER'
Select the number of the active track. The default setting is 1.
4.4.2 ENABLING TRACK STORING
'MENU' + "ADVANCED SETTINGS" + 'ENTER' + "TRACK" + 'ENTER' +
"TRACCIA" + 'ENTER'
To enable (On) or disable (Off) the track storing. It is not possible to use the
track storing if you are not receiving a valid fix. The default setting is On.
4.4.3 DISPLAYING TRACK
'MENU' + "ADVANCED SETTINGS" + 'ENTER' + "TRACK" + 'ENTER' +
"VISIBILE" + 'ENTER'
To enable (On) or disable (Off) the displaying of track. The default setting is On.
70
User Manual
Page 69

4.4.4 SELECTING TRACK COLOR
'MENU' + "ADVANCED SETTINGS" + 'ENTER' + "TRACK" + 'ENTER' +
"COLOR" + 'ENTER'
Select the desired color among the eight colors available for the selected track.
4.4.5 DELETING TRACK
'MENU' + "ADVANCED SETTINGS" + 'ENTER' + "TRACK" + 'ENTER' +
"DELETE" + 'ENTER'
Deletes the all track storing. After pressing 'ENTER' a warning window
appears: select "Yes" and press 'ENTER' to confirm (select "No" otherwise).
4.4.6 DELETING SELECTED TRACK
'MENU' + "ADVANCED SETTINGS" + 'ENTER' + "TRACK" + 'ENTER' +
"DELETE SELECTION" + 'ENTER'
Deletes the track selected. After pressing 'ENTER' a window appears: press
'ENTER' to set the first point , then press 'ENTER' to set the second point. A
warning window appears: select "Yes" and press 'ENTER' to confirm the deletion
(select "No" otherwise).
4.4.7 SELECTING TRACK MEMORIZING TYPE
'MENU' + "ADVANCED SETTINGS" + 'ENTER' + "TRACK" + 'ENTER' + "STEP
UNIT" + 'ENTER'
Choose Distance (Dist) - the chartplotter can store a fix when the distance
from its last stored position is greater than a defined distance; Time - the chartplotter
can store a fix after a defined time; Auto - the software decides when storing a position, on the basis of the straight or curved track. The default setting is Time.
4.4.8 SELECTING DISTANCE
'MENU' + "ADVANCED SETTINGS" + 'ENTER' + "TRACK" + 'ENTER' +
"DISTANCE" + 'ENTER'
When the tracking function is On and the type of track storing is Distance,
you can store a fix when the distance from its last stored position is greater than a
defined distance. Choose in the range 0.01, 0.05, 0.1, 0.5, 1.0, 2.0, 5.0, 10.0 Nm (the
distance unit is selected by the user, see Cap. 5). The default setting is 0.01 Nm.
User Manual
71
Page 70

4.4.9 SELECTING TIME
'MENU' + "ADVANCED SETTINGS" + 'ENTER' + "TRACK" + 'ENTER' + "TIME"
+ 'ENTER'
When the tracking function is On and the type of track storing is Time, the
chartplotter can store a fix after a defined time. Choose among 1, 5, 10, 30 sec, 1, 5,
10 min. The default setting is 1 sec.
4.5 USER C-CARD MENU
The chartplotter allows to copy information to an User C-CARD. You can
also return the information to internal memory at a later time. This allows virtually
unlimited storage.
'MENU' + "ADVANCED SETTINGS" + 'ENTER' + "USER C-CARD" + 'ENTER'
4.5.1 SAVING FILE
'MENU' + "ADVANCED SETTINGS" + 'ENTER' + "USER C-CARD" + 'ENTER'
+ "SAVE" + 'ENTER'
A window is opened to insert the file name and the type of data to save.
Select the file name. At first a default name is shown: use the cursor key to insert the
name. Press 'ENTER'. Select the data type to save among "MARK", "EVENT",
"ROUTE" or "TRACK". Press 'CLEAR'.
Note
When naming a file, you may have trouble finding a name that uniquely identifies the file's
contents. Dates, for example, are often used in filenames; however, they take up several characters,
leaving you with little flexibility. The secret is to find a compromise, a point where you can
combine a date with a word, creating a unique filename. The maximum length of the filename
is 8 characters. The characters may be numbers (0, ..., 9), letters (A, ..., Z) and spaces (for example
legal identifiers are "ABC", "AA", "12121212", "A B C", "1 A 1", and so on.
4.5.2 LOADING FILE
'MENU' + "ADVANCED SETTINGS" + 'ENTER' + "USER C-CARD" + 'ENTER'
+ "LOAD" + 'ENTER'
Before pressing 'ENTER', choose file name in the list shown on the screen
using the cursor key.
4.5.3 DELETING FILE
'MENU' + "ADVANCED SETTINGS" + 'ENTER' + "USER C-CARD" + 'ENTER'
+ "DELETE" + 'ENTER'
A warning window is shown, select "YES" and press 'ENTER' to confirm deletion (select "NO" otherwise). This operation remove old or unnecessary files to clean up
your User C-CARD. Remember that this option permanently erases the file.
72
User Manual
Page 71

4.5.4 FORMATTING USER C-CARD
'MENU' + "ADVANCED SETTINGS" + 'ENTER' + "USER C-CARD" + 'ENTER'
+ "FORMAT" + 'ENTER'
A warning window is shown, select "YES" and press 'ENTER' to confirm
the formatting (select "NO" otherwise). The format of User C-CARD must be done
before using a new User C-CARD: this operation prepares the User C-CARD to
receive and store information.
4.6 C-LINK
C-Link system is a feature which allows to sharing the same cartographic
data between two chart plotter units (CP) linked via serial I/O port.
In order to activate C-Link function, a “MAX data C-CARD” (called REGULAR C-CARD) must be inserted into one of the two chart plotters and a special
MAX data C-CARD (called MIRROR C-CARD) must be inserted on the other
chart plotter.
The two MAX data C-CARDs must have the same code and revision. So, the
MIRROR C-CARD can be utilized only on a chart plotter linked to another chart
plotter provided with the equivalent REGULAR C-CARD.
It is important to point out that the two chart plotters must have the update
s/w versions that allow C-Link function.
4.6.1 HOW C-LINK SYSTEM WORKS
When the CP is powered up, it switches into the “Stand-Alone Mode”. In
this work mode, the CP unit periodically scans all the available C-CARD slots searching for MIRROR C-CARDs.
When one or more MIRROR C-CARD is found (in one or both CPs) a
special connection is established between the CPs to abilitate the MIRROR C-CARDs.
If a regular C-CARD which has previously activated a MIRROR C-CARD is removed, even the MIRROR card will be not read anymore on the other unit.
4.7 C-LINK NAVIGATION DATA TRANSFER
This function allows transferring C-Link navigation data (Route Name, Destination ID & Position, Next Waypoint ID & Position, Total Route length, Fuel
Consumption Rate, ETA, TTG etc.) (Hereinafter “C-Link navigation data”) between
two chart plotters linked through the C-Link system.
User Manual
73
Page 72

The chart plotters can be set to operate in two modes:
- MASTER mode (Primary Chart Plotter that sends data)
- SLAVE mode (Secondary Chart Plotter that receives data)
When the navigation is activated on the Master chart plotter, the C-Link
navigation data will be continuously sent to the Slave until the navigation is active.
If the Master is navigating to a Single Destination, the Slave will show the
Destination position and activate the navigation to it. If the Master is navigating to a
Route, the Slave will show the Route Leg composed by the Destination and the
Waypoint after the Destination (Next Waypoint) and activate the navigation to it.
Any variation to the current C-Link navigation data will be transferred from the
Master to the Slave. The Slave will be provided with a few dedicated pages to show
the C-Link navigation data received from the Master.
4.7.1 OPERATIONS
4.7.1.1 Introductive elements
It is important remark, once more, that this function does not transfer the
whole route but just the information relative to the navigation. Such information
will be removed from the Slave Chart Plotter as soon as the navigation is terminated.
C-Link navigation data is exchanged by using two NMEA-0183 C-MAP proprietary sentences: $PCMPN,1 and $PCMPN,2. When the navigation is activated
on the Master, it starts outputting the C-Link navigation data. If the Slave is connected, all c-link navigation data received are stored in its memory and the navigation is started. The information sent by the Master consists of the following values:
- Navigation mode (To Single Destination / to a Route )
- Route Name (*)
- Destination ID
- Destination Position
- Next Waypoint ID (*)
- Range from Destination to next Waypoint (*)
- Bearing from Destination to next Waypoint (*)
- Route Length (*)
- Distance from Destination to Last Route Waypoint (*)
- Remaining Route Legs (*)
- Planned Cruising Speed
- Average Fuel Consumption
- Initial Fuel Load
74
User Manual
Page 73

C-Link navigation data can refer to:
- Single Destination navigation
- Route Following navigation.
Values identified by (*) are sent only for Route Following navigation.
The Destination Icon, Navigation leg (Fix Position to Destination), the Next
Waypoint Icon and all other relevant C-Link navigation data will be shown on the
Slave chart plotter. Any variation of the C-Link navigation data on the Master will
be communicated to the Slave so to keep data aligned on both devices.
4.7.1.2 C-Link serial connection
The two chart plotters should be connected via serial ports. Any of the avail-
able ports can be used, the software will recognize automatically the serial ports
used. A typical connection is as follows:
CP1 CP2
TX —————> RX
RX <————— TX
GND <————> GND
4.7.1.3 Master Chart Plotter
Operating mode
To select the Master mode (Primary Station) follow the procedure:
'MENU' + "BASIC SETTINGS" + 'ENTER' + "INPUT/OUTPUT" + 'ENTER' +
"C-LINK" + 'ENTER' + "Primary Station" + 'ENTER'
Master mode is the default factory setting. All regular chart plotters func-
tions are allowed. As soon as the Destination is placed, the master chart plotter will
start transmitting all C-Link navigation data. In Master mode the C-Link navigation
data received from the NMEA port is ignored. So, if the two chart plotters are both
operating in Master mode, the C-Link navigation data sent by the other chart plotter
never processed. Under such condition if the navigation is activated on one of the
two chart plotters, a warning message will be shown to notify that the C-Link navigation data will be ignored by the other chart plotter.
4.7.1.4 Slave Chart Plotter
Operating mode
To select the Slave mode (Secondary Station) follow the procedure:
'MENU' + "BASIC SETTINGS" + 'ENTER' + "INPUT/OUTPUT" + 'ENTER' +
"C-LINK" + 'ENTER' + "Secondary Station" + 'ENTER'
User Manual
75
Page 74

When Slave mode is set, the chart plotter cannot manipulate the C-Link
navigation data anymore.
Stop current navigation
If the navigation was already active, it will be disabled as soon as Slave mode is set.
An appropriate warning message will be shown to notify that the Navigation is
already active and to confirm whether Slave mode can be set.
Inhibit Navigation operation
As soon as Slave mode is set, the destination cannot be placed anymore either the
C-Link navigation data is received from the Master or not. Also, when the C-Link
navigation data is received from the Master, it will not be allowed to deactivate the
Navigation.
Inhibit Route following
While navigating to the route received from the Master the destination is reached
(either applying distance or perpendicular criteria), the destination will not be moved
to the next Waypoint on the route.
MOB handling
If the Navigation to the external destination is active and the MOB key is pressed on
the Slave Chart Plotter, the MOB is placed but the navigation to the MOB is not
activated.
Notes
While navigating to the external destination the Operating Mode is switched to Master
mode, the navigation to the external destination will be terminated. An appropriate
warning message will be shown to notify that the Navigation to the external destination is active and to confirm whether Slave mode can be set. Setting Slave mode,
the C-Link navigation data will be deleted.
The C-Link navigation data are deleted at Power Off.
4.7.1.5 C-Link navigation data: Acquisition and Display
As soon as the C-Link navigation data is received, the Slave parses the informa-
tion received and executes the relative actions depending on its current working status.
Important
When the Navigation to the external Destination is activated, the Slave Chart Plotter will show all
relevant C-Link navigation data exactly like when the destination is not the external one:
(Destination Name, DST and BRG to Destination, calculate XTE, calculate TTG etc). These values
will be displayed all places where required and they will be used to format NMEA-0183 output data.
76
User Manual
Page 75
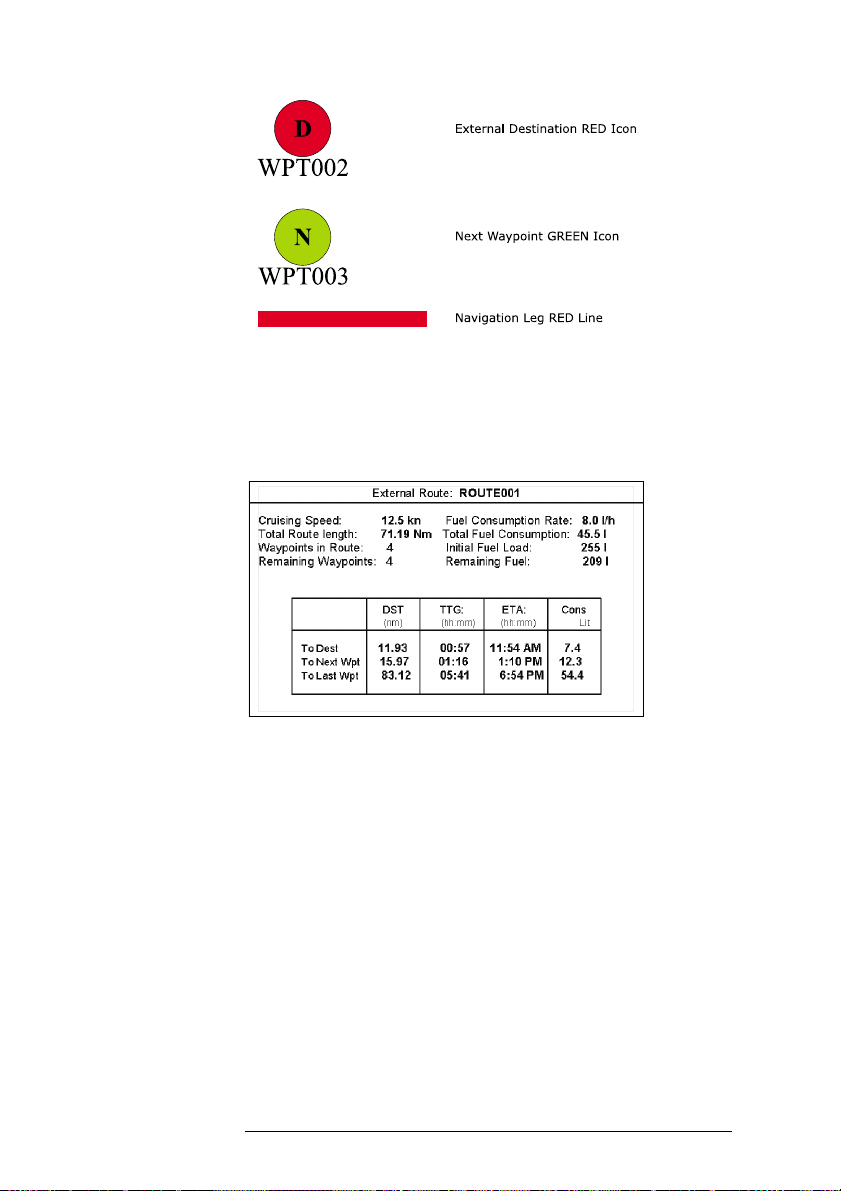
4.7.1.6 Graphical representation on Map Display
Fig. 4.7.1.6 - Graphical Displaying
4.7.1.7 Route Data Report
When the Navigation to the External Route is received, it will be possible to display the
information related to the External Route by entering the Route Data Report.
Fig. 4.7.1.7 - External route on Route Data Report
- External Route : Name of the External Route (from PCMPN,0)
- Cruising Speed : Planned Cruising Speed (from PCMPN,1)
- Fuel Consumption Rate : Planned Fuel Consumption Rate (from PCMPN,1)
- Total Route length Route: Length from First to Last Wpt. (from PCMPN,1)
- Initial Fuel Load : Volume of Fuel available before the navigation was
started (Liters)
- Total Fuel Consumption : Calculated Fuel consumption to navigate the whole
route.
- Waypoints in Route : No. of Wpts in the Route (from PCMPN,1)
- Remaining Waypoints : No. of Wpts from Dest to Last Wpt (from PCMPN,1)
- Distance to Destination : Distance from Ship to Destination (Calculated)
- Distance to Next Wpt : Distance to travel from ship to the Wpt after the Des-
User Manual
77
Page 76
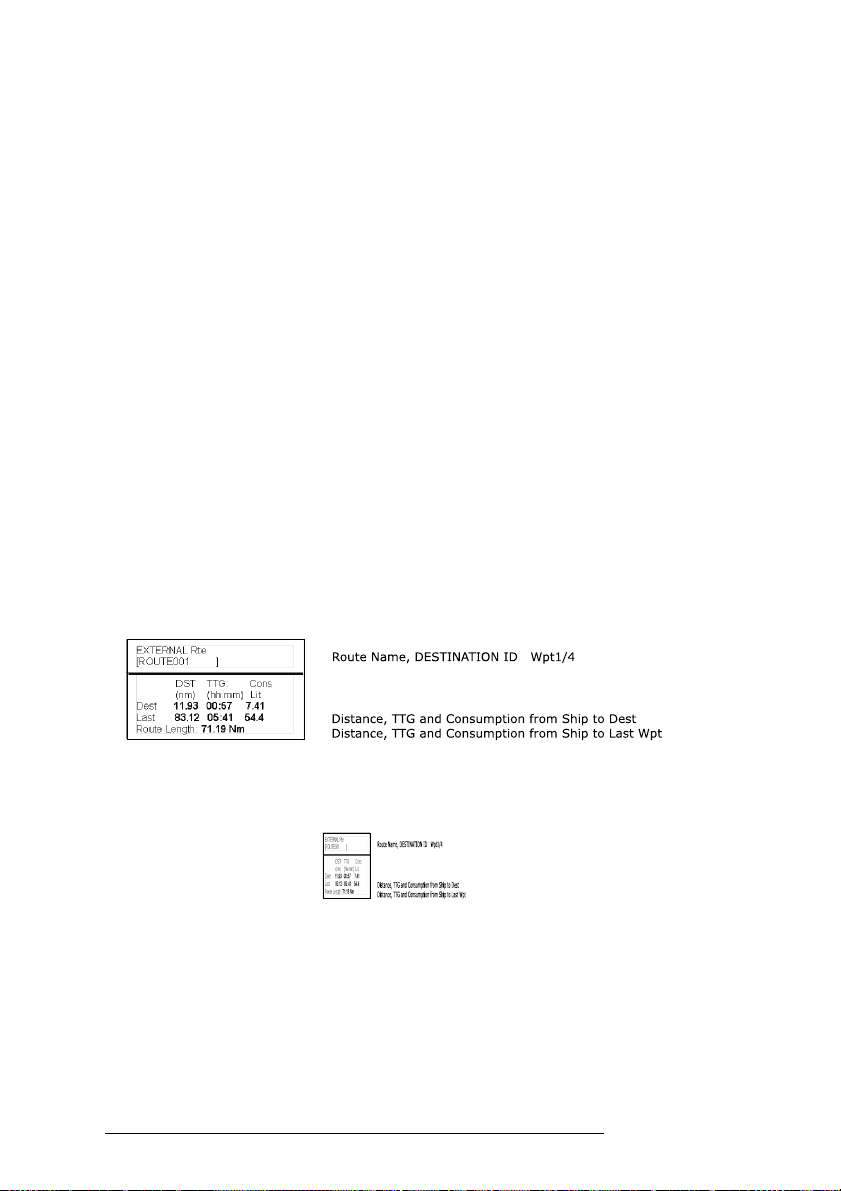
tination (calculated: Distance to Dest + Next
Route Leg length)
- Distance to Last Wpt : Distance to travel from ship to the End of the Route
(Calculated: Distance to Dest +Distance From Dest
to last Wpt received from PCMPN,1)
- TTG To Destination : Estimated Time to travel the “Distance to Last Wpt”.
Calculated using Cruising Speed.
- TTG To Next Wpt : Estimated Time to travel the “Distance to Next Way-
point” Calculated using Cruising Speed.
- TTG to Last Wpt : Estimated Time to travel the “Distance to Last Wpt”.
Calculated using Cruising Speed
- ETA to Destination : Estimate Time of Arrival to the Destination Point.
Calculated: Current Time + “TTG To Destination”
- ETA to Next Waypoint : Estimate Time of Arrival to the Waypoint after the
Destination. Calculated: Current Time + “TTG To
Next Waypoint”
- ETA to Last Wpt : Estimate Time of Arrival to the End of the Route.
Calculated: Current Time + “TTG To Last Wpt”
4.7.1.8 Quick Info
Route Navigation: Quick Info on the Destination
Fig. 4.7.1.8 - Quick Info on Destination
Quick info on Single Destination
Fig. 4.7.1.8a - Quick Info on Single Destination
78
User Manual
Page 77

5
Advanced Settings
The Advanced Settings menu allows to handle the chartplotter functions.
The menu options are arranged in sub-menus. For example, all options that relate to
the Fix functions are in Fix sub-menu. See Par. 3.5 for informations about Map
Setting menu, see Par. 4.4 about Track menu, see par. 4.1.2 about Route menu, see
Par. 4.1.1.9 about User Points menu and Par. 4.5 about User C-CARD menu.
'MENU' + "ADVANCED SETTINGS" + 'ENTER'
Once you are in the Menu, use your cursor key to highlight the item and
press 'ENTER' to activate or to proceed to the next selection menu.
5.1 SETUP
The Setup menu allows to enable or disable general options in the chartplotter handling. See Par. 3.5.3 about Auto Info option.
'MENU' + "ADVANCED SETTINGS" + 'ENTER' + "SETUP" + 'ENTER'
5.1.1 TIME REFERENCE
Sets UTC or Local Time. The default setting is UTC.
'MENU' + "ADVANCED SETTINGS" + 'ENTER' + "SETUP" + 'ENTER' + "TIME
REFERENCE" + 'ENTER'
5.1.2 TIME FORMAT
Sets you preferred time between 12 hour and 24 hour. The default setting is
24 hour.
'MENU' + "ADVANCED SETTINGS" + 'ENTER' + "SETUP" + 'ENTER' + "TIME
FORMAT" + 'ENTER'
User Manual
79
Page 78

5.1.3 DATE FORMAT
Sets you preferred date between MM-DD-YY (month-day-year) and DD-
MM-YY (day-month-year). The default setting is MM-DD-YY.
'MENU' + "ADVANCED SETTINGS" + 'ENTER' + "SETUP" + 'ENTER' + "DATE
FORMAT" + 'ENTER'
5.1.4 WIND SPEED
Selects the Wind Speed unit among Kts = Knots, m/s and Kmh = kilome-
ters per hour. The default setting is Kts.
'MENU' + "ADVANCED SETTINGS" + 'ENTER' + "SETUP" + 'ENTER' + "WIND
SPEED" + 'ENTER'
5.1.5 BEEPER
Turns On/Off the sound after pressing a key ("beep"). The default setting is On.
'MENU' + "ADVANCED SETTINGS" + 'ENTER' + "SETUP" + 'ENTER' +
"BEEPER" + 'ENTER'
5.1.6 EXTERNAL WPT
The coordinates of a Waypoint, received from a GPS connected to the chartplotter, can be stored into the chartplotter, if the GPS is NMEA-0183 protocol compatible and support the $BWC sentence (this symbol remains on the screen for 30
seconds). You may save it by placing a Waypoint or a Mark onto that symbol. As
soon as the chartplotter receives another $BWC sentence with the coordinates of a
new Waypoint, the symbol moves to the new point. The default setting is Off.
'MENU' + "ADVANCED SETTINGS" + 'ENTER' + "SETUP" + 'ENTER' +
"EXTERN WPT" + 'ENTER'
5.1.7 BACKLIGHT TIMEOUT
Disables (Off) or sets the desired value (among 1, 3, 5, 10 minutes) for the
backlight timeout of the chartplotter. The default setting is Off.
'MENU' + "ADVANCED SETTINGS" + 'ENTER' + "SETUP" + 'ENTER' +
"B. LIGHT TIMEOUT" + 'ENTER'
5.2 FIX
The Fix menu handles functions related to the Fix.
'MENU' + "ADVANCED SETTINGS" + 'ENTER' + "FIX" + 'ENTER'
80
User Manual
Page 79

5.2.1 FIX CORRECTION
Turns On/Off the Correction from the positioning system. If the new Correction is calculated, but the Correction is not enabled, the ship's position is not
changed. The default setting is Off.
'MENU' + "ADVANCED SETTINGS" + 'ENTER' + "FIX" + 'ENTER' + "FIX
CORRECTION" + 'ENTER'
5.2.2 COMPUTE CORRECTION
Corrects fixes from the positioning instrument. By placing the cursor on the
ship's real position and selecting this option, the error is calculated and internally
memorized for appropriate correction, but not applied.
'MENU' + "ADVANCED SETTINGS" + 'ENTER' + "FIX" + 'ENTER' +
"COMPUTE CORRECTION" + 'ENTER'
5.2.3 CORRECTION OFFSET
Manual correction of fix position.
'MENU' + "ADVANCED SETTINGS" + 'ENTER' + "FIX" + 'ENTER' +
"CORRECTION OFFSET" + 'ENTER'
Insert the preferred value and press 'ENTER'.
5.2.4 POSITION FILTER
Turns On/Off the Position Filter. In case of a jittering fix this option makes
the ship' position more stable and the track smoother. The default setting is Off.
'MENU' + "ADVANCED SETTINGS" + 'ENTER' + "FIX" + 'ENTER' + "POSITION
FILTER" + 'ENTER'
5.2.5 SPEED FILTER
Turns On/Off the Speed Filter. When it is On, you can filter the speed of
the ship, to optimize it. The default setting is Off.
'MENU' + "ADVANCED SETTINGS" + 'ENTER' + "FIX" + 'ENTER' + "SPEED
FILTER" + 'ENTER'
5.2.6 FILTER DUMP
Inserts the value for the Filter in the range [500 - 12000]. The default setting
is 500.
'MENU' + "ADVANCED SETTINGS" + 'ENTER' + "FIX" + 'ENTER' + "FILTER
DUMP" + 'ENTER'
User Manual
81
Page 80

5.2.7 DEAD RECKONING
Enables (On) or disables (Off0 the Dead Reckoning. The default setting is Off.
'MENU' + "ADVANCED SETTINGS" + 'ENTER' + "FIX" + 'ENTER' + "DEAD
RECKONING" + 'ENTER'
5.2.8 STATIC NAVIGATION
Sets up a threshold for the speed. When the speed received from the positioning device is under that threshold, the chartplotter displays zero speed. The default
value is 0.0 Knots.
'MENU' + "ADVANCED SETTINGS" + 'ENTER' + "FIX" + 'ENTER' + "STATIC
NAVIGATION" + 'ENTER'
5.3 NAVIGATE
The Navigate menu allows to handle functions related to navigation.
'MENU' + "ADVANCED SETTINGS" + 'ENTER' + "NAVIGATE" + 'ENTER'
5.3.1 COORDINATE SYSTEM
Sets your preferred Coordinate System among ddd mm ss, ddd mm.mm,
ddd mm.mmm, UTM, OSGB, TD. The default setting is ddd mm.mmm.
'MENU' + "ADVANCED SETTINGS" + 'ENTER' + "NAVIGATE" + 'ENTER' +
"COORDINATE SYSTEM" + 'ENTER'
If TD has been selected a new menu is shown on the screen:
'MENU' + "ADVANCED SETTINGS" + 'ENTER' + "NAVIGATE" + 'ENTER' +
"COORDINATE SYSTEM" + 'ENTER' + "TD" + 'ENTER'
Chain: Selects the preferred chain. The default setting is 9970.
Pair: Selects the pair of stations in the selected chain. The default setting is W X.
ASF 1/2: Sets the ASF (Additional Second Factor) for the slave in the selected chain.
The default setting is 0.
Alter: Turns On/Off the Alternate Solution in the chain. The default setting is Off.
5.3.2 FIX DATUM
Selects the Fix Datum among 130 items. WGS 1984 is the default Fix Datum.
'MENU' + "ADVANCED SETTINGS" + 'ENTER' + "NAVIGATE" + 'ENTER' +
"FIX DATUM" + 'ENTER'
82
User Manual
Page 81
5.3.3 MAP DATUM
Selects the Map Datum among 130 items. WGS 1984 is the default Map Da-
tum.
'MENU' + "ADVANCED SETTINGS" + 'ENTER' + "NAVIGATE" + 'ENTER' +
"MAP DATUM" + 'ENTER'
5.3.4 MAP ORIENTATION RESOLUTION
Selects the orientation of your chart according to your personal needs (see
Par. 3.2.2 for more information).
The Orientation Resolution is the resolution angle for the Map Orientation,
range [5, 60] degrees. The default setting is 30°.
'MENU' + "ADVANCED SETTINGS" + 'ENTER' + "NAVIGATE" + 'ENTER' +
"ORIENT. RESOLUTION" + 'ENTER'
5.3.5 ROLL ROAD SCALE
Sets you preferred Rolling Road Scale among 0.2, 0.5, 1.0, 2.0, 4.0, 10.0. The
default setting is 0.2.
'MENU' + "ADVANCED SETTINGS" + 'ENTER' + "NAVIGATE" + 'ENTER' +
"ROLL ROAD SCALE" + 'ENTER'
5.3.6 RESET PARTIAL AND TOTAL TRIP
Resets the partial and total distance traveled by the ship from the first activation of the chartplotter or starting from the values reset. The partial and total trip
value is shown on the top of the Navigation Page.
'MENU' + "ADVANCED SETTINGS" + 'ENTER' + "NAVIGATE" + 'ENTER' +
"RESET PARTIAL TRIP" + 'ENTER'
'MENU' + "ADVANCED SETTINGS" + 'ENTER' + "NAVIGATE" + 'ENTER' +
"RESET TOTAL TRIP" + 'ENTER'
5.4 COMPASS
The Compass menu sets the desired value for Bearing and Magnetic Variation, and selects the Calibration page.
'MENU' + "ADVANCED SETTINGS" + 'ENTER' + "COMPASS" + 'ENTER'
User Manual
83
Page 82

5.4.1 BEARINGS
Selects either degrees Auto Magnetic or True. If magnetic readings are selected the variation is computed automatically for every zone as soon as the chart is
displayed. The default setting is Mag.
'MENU' + "ADVANCED SETTINGS" + 'ENTER' + "COMPASS" + 'ENTER' +
"BEARINGS" + 'ENTER'
5.4.2 VARIATION
It is possible to calculate the Magnetic Variation in an Automatic or manual
mode, by inserting the step for calculation of Magnetic Variation. The default setting is Auto.
'MENU' + "ADVANCED SETTINGS" + 'ENTER' + "COMPASS" + 'ENTER' +
"VARIATION" + 'ENTER'
5.4.3 CALIBRATION
The variation table is used to match magnetic value readout on the chartplotter comparable with the value given by the compass of the boat. In other words,
since the compass of the boat must be compensated (due to the iron masses, ...), we
use the same values given by the chartplotter. This means that, for example, if the
BRG to the next Waypoint readout in the chartplotter display is "X" Mag degree, if
you steer the boat reading "X" Mag degree from the compass, you are driving well
toward the next Waypoint.
'MENU' + "ADVANCED SETTINGS" + 'ENTER' + "COMPASS" + 'ENTER' +
"CALIBRATION" + 'ENTER'
5.5 ALARMS
The chartplotter provides alarm settings for various functions. Here you can
set the system for your navigational requirements.
'MENU' + "ADVANCED SETTINGS" + 'ENTER' + "ALARMS" + 'ENTER'
5.5.1 ARRIVAL ALARM
Disables (Off) or specifies the radius of a circle around the Waypoint of a Route:
when your vessel reaches this circle the alarm sounds. The default setting is Off.
'MENU' + "ADVANCED SETTINGS" + 'ENTER' + "ALARMS" + 'ENTER' + "AR-
RIVAL ALARM" + 'ENTER'
84
User Manual
Page 83

5.5.2 XTE ALARM
Disables (Off) or specifies the distance your Cross Track Error (XTE) can
vary before the sound of an alarm or disables the XTE Alarm (Off). The default
setting is Off.
'MENU' + "ADVANCED SETTINGS" + 'ENTER' + "ALARMS" + 'ENTER' + "XTE
ALARM" + 'ENTER'
5.5.3 ANCHOR ALARM
This function allows inserting of the limit of anchor dragging: beyond that,
the alarm is activated. The chartplotter computes the distance between the current
GPS position and the GPS position saved at the activation of the anchor alarm in the
menu. If the computed distance exceeds the value set in the menu, the chartplotter
shows the alarm message and starts the acoustic alarm. The default setting is Off.
'MENU' + "ADVANCED SETTINGS" + 'ENTER' + "ALARMS" + 'ENTER' + "AN-
CHOR ALARM" + 'ENTER'
5.5.4 DEPTH ALARM
Specifies the depth or disables the Depth Alarm. The default setting is Off.
'MENU' + "ADVANCED SETTINGS" + 'ENTER' + "ALARMS" + 'ENTER' +
"DEPTH ALARM" + 'ENTER'
5.5.5 GROUNDING ALARM (GUARDIAN TECHNOLOGY)
The chartplotter is provided with a function that, by querying the map's data,
verifies potential danger to navigation due to shallow water, land, rocks, obstructions
and shoreline constructions. The maps are scanned periodically (every 10 seconds).
When the Grounding Alarm is active, the chartplotter scans an area in front
of the boat. This area is identified by a triangle drawn in front of the boat icon whose
direction is determined by the current boat heading. The length of the triangle is
user selectable and its angle is 30 degrees. If any of the above objects are found, the
chartplotter notifies the danger on a dedicated warning message box in the Grounding Alarm Report page (see Par. 5.5.7).
The Grounding Alarm is switched Off by default after a Master Reset. Once
the Grounding Alarm has been activated, a warning message is shown.
'MENU' + "ADVANCED SETTINGS" + 'ENTER' + "ALARMS" + 'ENTER' +
"GROUNDING ALARM" + 'ENTER'
Note
The Grounding Alarm function only operates with the new C-CARDs. It also affects the speed
of the redraw of the screen. If this function is not used it maybe disabled.
User Manual
85
Page 84

5.5.6 GROUNDING ALARM RANGE
Allows setting the length of the sector to be detected among 0.25, 0.5, 1.0
Nm. The default setting is 0.25 Nm. When any of the searched objects is found in the
scanned area, a tick marker is printed on the relative box in the Grounding Alarm
Report page (see Par. 5.5.7) to identify which dangerous objects have been currently
detected.
'MENU' + "ADVANCED SETTINGS" + 'ENTER' + "ALARMS" + 'ENTER' +
"GROUNDING ALARM RANGE" + 'ENTER'
5.5.7 GROUNDING ALARM REPORT
Allows displaying the report of the dangerous objects currently detected.
'MENU' + "ADVANCED SETTINGS" + 'ENTER' + "ALARMS" + 'ENTER' +
"GROUNDING ALARM REPORT" + 'ENTER'
5.6 SIMULATION
The built-in Simulator function allows you to become proficient in the use
of the chartplotter. No current position fix is required because the chartplotter simulates position data internally.
'MENU' + "ADVANCED SETTINGS" + 'ENTER' + "SIMULATION" + 'ENTER'
5.6.1 ACTIVATE SIMULATION
Once the settings are selected, turn on the Simulator:
'MENU' + "ADVANCED SETTINGS" + 'ENTER' + "SIMULATION" + 'ENTER' +
"ACTIVATE SIMULATION" + 'ENTER'
To turn On the Simulation select Off. The default setting is Off.
5.6.2 SPEED
To start the simulator you can insert the Speed value. Using the cursor key
select the preferred Speed and press 'ENTER'. The default setting is 01.0 Kts.
'MENU' + "ADVANCED SETTINGS" + 'ENTER' + "SIMULATION" + 'ENTER' +
"SPEED" + 'ENTER'
5.6.3 HEADING
To start the simulator you can insert the Heading value. Using the cursor
key select the preferred Heading and press 'ENTER'. The default setting is 000° M.
86
User Manual
Page 85

'MENU' + "ADVANCED SETTINGS" + 'ENTER' + "SIMULATION" + 'ENTER' +
"HEADING" + 'ENTER'
5.6.4 DATE AND TIME
'MENU' + "ADVANCED SETTINGS" + 'ENTER' + "SIMULATION" + 'ENTER' +
"DATE" + 'ENTER'
'MENU' + "ADVANCED SETTINGS" + 'ENTER' + "SIMULATION" + 'ENTER' +
"TIME" + 'ENTER'
Using the cursor key insert the preferred Date and Time and press 'ENTER'.
5.6.5 CURSOR CONTROL
Enables (On)/disables (Off) the cursor control. The default setting is Off.
'MENU' + "ADVANCED SETTINGS" + 'ENTER' + "SIMULATION" + 'ENTER' +
"CURSOR CONTROL" + 'ENTER'
5.7 AIS MENU
AIS is an Automatic Identification System. It has been introduced to improve the safety of navigation by assisting in the efficient operation of ship-to ship,
ship reporting and VTS applications. The system should enable operators to obtain
information from the ship automatically, requiring a minimum of involvement of
ship’s personnel, and should have a high level of availability. AIS transponders installed on IMO vessels use VHF frequencies to:
• Transmit details of their own vessel
• Receive details from other vessels or navigation aids within VHF range.
Information being transmitted from vessels over 300 tons that, due to recent
worldwide legislation, are required to fit Class “A” AIS transponders.
Connecting to the chart plotter an AIS receiver (please contact your local
dealer), vessels with AIS transponder within VHF range are displayed on screen
giving the skipper or navigator a visual interpretation of the data of nearby vessels.
This improves safety, and specifically for collision avoidance reasons.
5.7.1 AIS SYSTEM DEFINITIONS
• Target
It is a vessel equipped with AIS. Information about the targets is being re-
User Manual
87
Page 86

ceived by AIS Receiver and displayed on the screen.
• CPA
Closest Point of Approach is the closest distance that will be achieved between your vessel and the tracked target, based on your vessel’s speed and
direction and the target’s speed and direction.
• CPA Limit
This is the distance from your vessel that a target may reach before a target is
deemed a threat.
• CPA Alarm
Occurs if CPA is less or equal to CPA Limit. This test is done for active
targets only.
• TCPA
Time to closest Point of Approach is the time remaining until the CPA will
occur.
• TCPA Limit
This is the time remaining before the CPA is reached.
• TCPA Alarm
Occurs if TCPA is less or equal to TCPA Limit. This test is done for active
targets only and if CPA value is less or equal to CPA Limit.
• Radio Call Sign
International call sign assigned to vessel, often used on voice radio.
• Name
Name of ship, 20 characters.
• MMSI
Maritime Mobile Service Identity.
• MMSI number
A unique 9 digit number that is assigned to a DSC radio station. It primarily
registers the boat information in the U.S. Coast Guard’s national distress
database for use in emergency situations.
• Active Target
Target located within the Activation Range. Active target is represented by
oriented triangle with COG and Heading vectors. Rate of turn may also be
displayed.
• Dangerous Target
Target detected by CPA or TCPA Alarm. Dangerous target is Active Target
by definition. For better visibility Dangerous Target symbol is flashing.
• Sleeping Target
Target located outside the Activation Range. Sleeping target is represented by
a small oriented triangle.
88
User Manual
Page 87

• Lost Target
When the AIS info is not received from that vessel for 3.5 minutes. The
presentation will be a flashing black triangle with a cross through.
• Activation Range
Range around your boat where targets become active. AIS target become
active within this range. Activation Range should be greater than CPA Limit
by definition.
Note
A target is removed from the screen if data is not received for 10 minutes.
The maximum number of tracked targets is 100.
Depending on the scale the presentation of the targets change to remove clutter on the screen.
This information is updated every 3 seconds to 6 minutes depending on speed and rate of turn,
enabling the track of the vessels in range to be plotted.
5.7.2 AIS MENU
To configure the chart plotter to receive AIS data, follow the procedure:
'MENU' + "AIS SETUP" + 'ENTER'
The AIS menu is shown on the screen, the items are described in the following paragraphs.
5.7.2.1 Display
''MENU' + "AIS SETUP" + 'ENTER' + "DISPLAY" + 'ENTER'
Turns the display of AIS targets overlay on the cartography ON or OFF.
The default setting is ON.
5.7.2.2 Activation range
'MENU' + "AIS SETUP" + 'ENTER' + "ACTIVATION RANGE" + 'ENTER'
Defines the range from the fix within which the AIS Target becomes active.
The values allowed are from 0.1 to 20 Nm. The default setting is 5 Nm.
5.7.2.3 CPA Alarm
'MENU' + "AIS SETUP" + 'ENTER'+ "CPA ALARM" + 'ENTER'
Turns ON or OFF the alarm. The default setting is ON.
5.7.2.4 CPA Limit
'MENU' + "AIS SETUP" + 'ENTER' + "CPA LIMIT" + 'ENTER'
The values allowed are from 0.1 to 10 Nm. The default setting is 0.5 Nm.
5.7.2.5 TCPA Alarm
'MENU' + "AIS SETUP" + 'ENTER' + "TCPA ALARM" + 'ENTER'
User Manual
89
Page 88

Turns ON or OFF the alarm. The default setting is ON.
5.7.2.6 TCPA Limit
'MENU' + "AIS SETUP" + 'ENTER' + "TCPA LIMIT" + 'ENTER'
The values allowed are from 1 to 30 min. The default setting is 10 min.
5.7.3 TO SET THE CHART PLOTTER FOR RECEIVING AIS
Make sure that the AIS receiver is properly connected to the chart plotter.
The chart plotter reads the AIS NMEA message VMD, type 1, 2, 3 and 5.
Select the used serial port and transmission speed by following the proce-
dure:
'MENU' + "BASIC SETTINGS" + 'ENTER' + "INPUT/OUTPUT" + 'ENTER' +
"PORT n INPUT" + 'ENTER' + "m" + 'ENTER'
Where: n = Port 1/Port 2/Port 3
m = NMEA-0183 4800-N81-N
NMEA-0183 38400-N81-N
according to the transmission speed of your AIS receiver.
5.7.4 QUICK INFO ON AIS TARGET
By placing the cursor over a AIS target icon, the following information is
displayed:
• Vessel Name
• MMSI number
• Radio Call Sign
• SOG
• COG
• CPA and TCPA values
Note
The selected AIS target icon is surrounded by a square frame when user places the cursor over the icon.
5.8 C-STAFF
The C-Staff functions are based on STAFF Concept ® (Satellite Tracking
Aided Fleet Fishing). The STAFF Concept ® is designed for professional fishing
purpose to allow monitoring the position of the vessels of a fleet from each vessel
(the fleet may have until 20 vessels max).
90
User Manual
Page 89
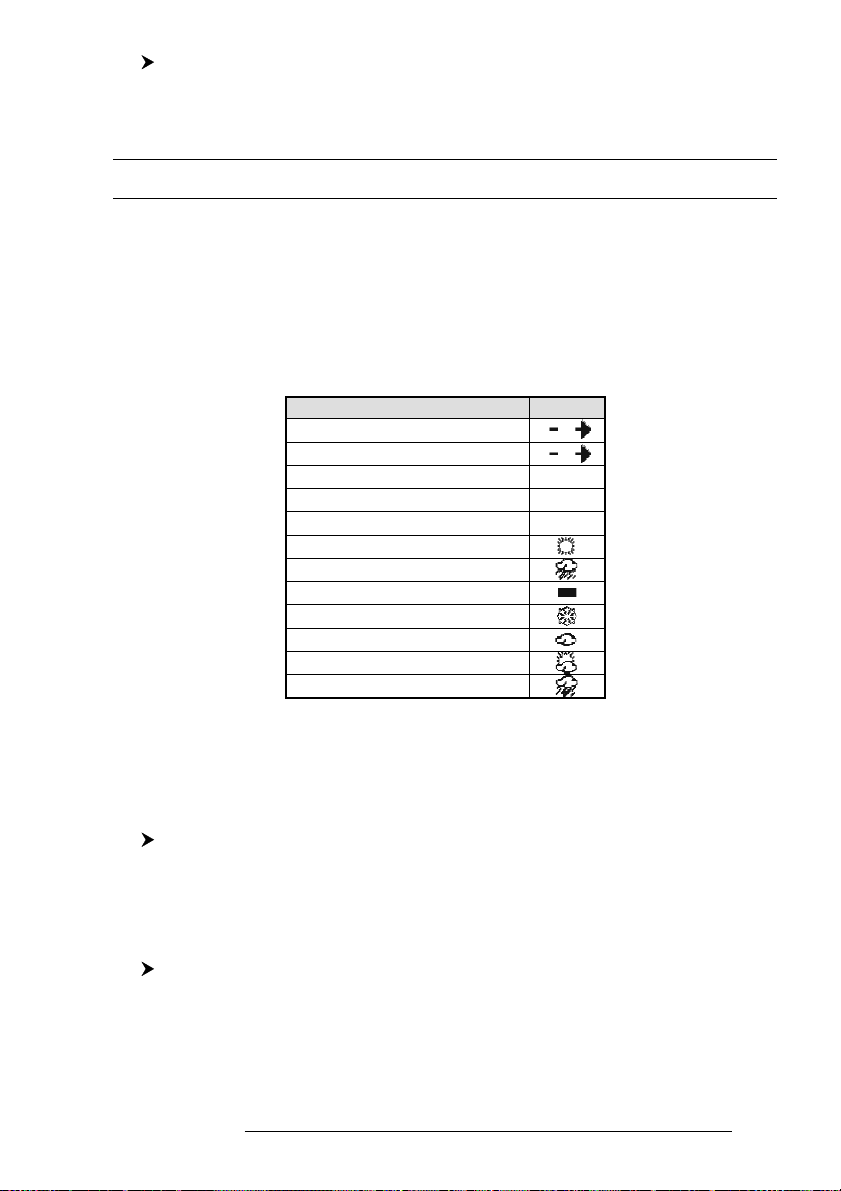
'MENU' + "ADVANCED SETTINGS" + 'ENTER' + "C-STAFF" + 'ENTER'
For more information see the specific User Manual.
5.9 C-WEATHER SERVICE
C-Weather Service is an innovative meteorological forecasting system with the
ability to visualize the weather forecast, overlaying it on cartography. The weather data
is held on C-MAP’s weather server, which can be accessed via a C-COM modem connected to the chart plotter or by using the C-MAP personal Suite (or the DPS - Dealer
Programming System) saving the weather data on a User C-CARD. The weather data
are overlaid on a map page as layers. The Weather format data available are:
Data Type Display
WIND (Speed & Dir) 0
WAVE (Height & Dir) 1
TEMPERATURE (C°) 18°
HUMIDITY (%) 30
VISIBILITY (m) 20
WEATHER TYPE: Sun
WEATHER TYPE: Rain
WEATHER TYPE: Fog
WEATHER TYPE: Snow
WEATHER TYPE: Clouds
WEATHER TYPE: Partly Cloudy
WEATHER TYPE: Thunderstorm
Fig. 5.9 - Weather data package
5.9.1 C-WEATHER SERVICE MENU
To select the menu:
'MENU' + "C-WEATHER" + 'ENTER'
The C-Weather menu is shown on the screen, the items are described in the
following paragraphs.
5.9.1.1 Download
''MENU' + "C-WEATHER" + 'ENTER' + "DOWNLOAD" + 'ENTER'
Allows to connect the software to the C-MAP weather server and to download C-MAP weather data directly via C-COM.
User Manual
91
Page 90
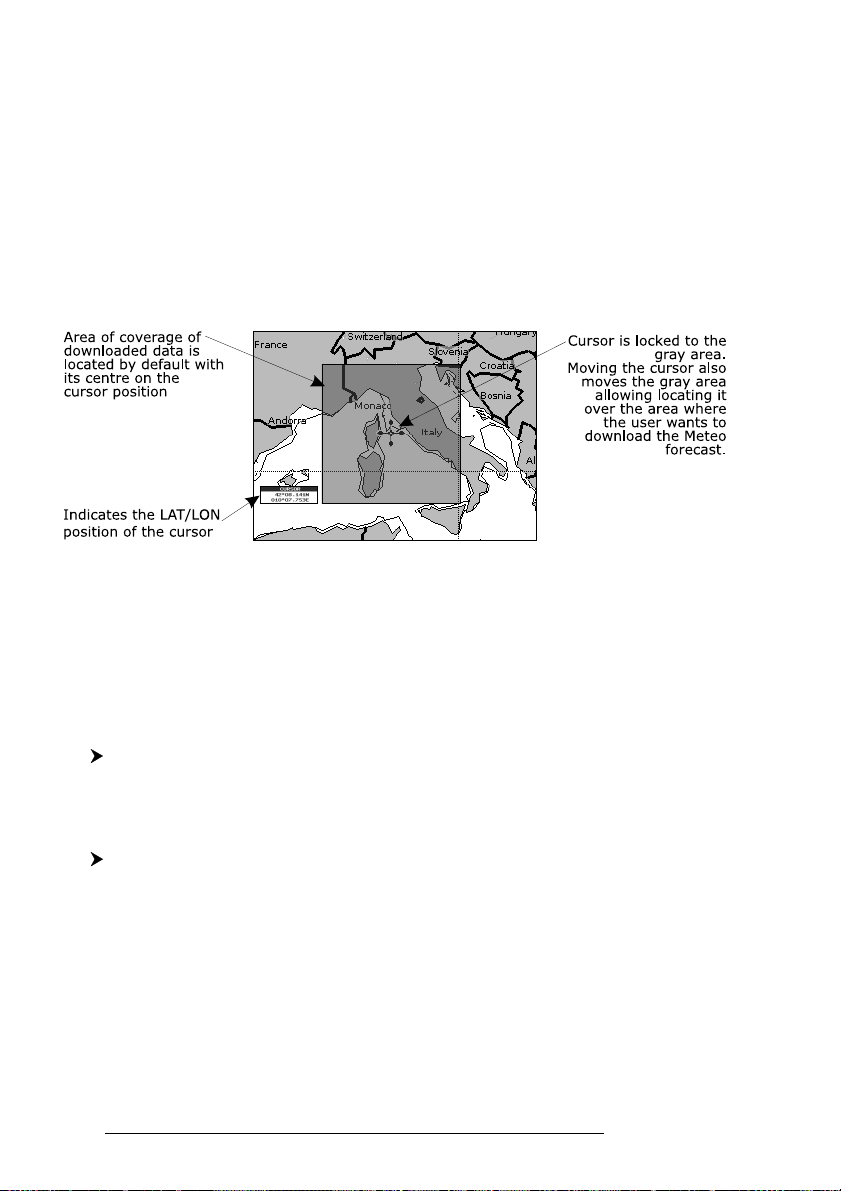
Select Country to Call
Allows the selection of the country to call. The whole telephone number set
is automatically updated after every download.
SIM PIN
Allows inserting of the PIN of the SIM.
Download Area
Allows the weather download: a squared grey area, where the weather data
will be downloaded, is centered on cursor position. See the following picture.
Fig.5.9.1.1 - Download Area
Press 'ENTER' to activate the C-Weather Download: the whole data package (see the previous "Weather data package" table) are downloaded. 'CLEAR' allows to interrupt the data download. At the end of the operation press 'CLEAR' to
close the window.
5.9.1.2 Copy from USER C-CARD
''MENU' + "C-WEATHER" + 'ENTER' + "COPY FROM USER C-CARD" + 'ENTER'
Allows the C-MAP WEATHER DATA loading from the User-CARD.
5.9.1.3 Weather Forecast
''MENU' + "C-WEATHER" + 'ENTER' + "FORECAST" + 'ENTER'
Allows selecting the Layer of specific weather data to be displayed on the
screen and to change date and time of the forecast preview.
The following functions are available:
• Panning
Default usage of the cursor key is the normal panning function.
• Zoom In/Out
Zoom in/out functions are allowed as usual by using 'ZOOM IN'/'ZOOM
OUT'.
92
User Manual
Page 91

• Set Date and Time
'ENTER' to modify date and time values.
• Layer Selection
'PAGE' to cycle the weather layers.
• Exit
'CLEAR' to close the weather prediction page.
5.9.1.4 Real Time View
''MENU' + "C-WEATHER" + 'ENTER' + "REAL TIME VIEW" + 'ENTER'
The following selections are available:
• Real Time View On
The data is shown (the area of the download) at the current date and time
(received from the GPS)
• Real Time View Off
The Weather data is not displayed.
The layer displayed is the one selected into the previous menu item.
5.9.1.5 Type of Data
''MENU' + "C-WEATHER" + 'ENTER' + "TYPE OF DATA" + 'ENTER'
Allows selecting the type of data, see the previous Fig. 5.9.
5.10 FISH FINDER MENU
The chart plotter combined with the sonar performance of the Fish Finder is
one of the most advanced marine navigation system available.
'MENU' + "FISH FINDER" + 'ENTER'
For more information see the specific User Manual.
5.11 RADAR SETUP MENU
The Radar consists of a scanner unit which illuminates targets with microwave energy and then collects the echoes from those targets. The scanner unit includes the Radar antenna, transmitter, receiver and necessary electronics. The scanner unit is connected to a chart plotter equipped with software capable of displaying
the Radar functions. To select the Radar menu, first select one of the four page related to the Radar:
User Manual
93
Page 92

'MENU' + "RADAR SETUP" + 'ENTER'
Once the Radar page is selected, access the Radar menu by pressing 'MENU'.
For more information see the specific User Manual.
Note
The Radar display page is available only if the Radar is connected and powered On.
94
User Manual
Page 93
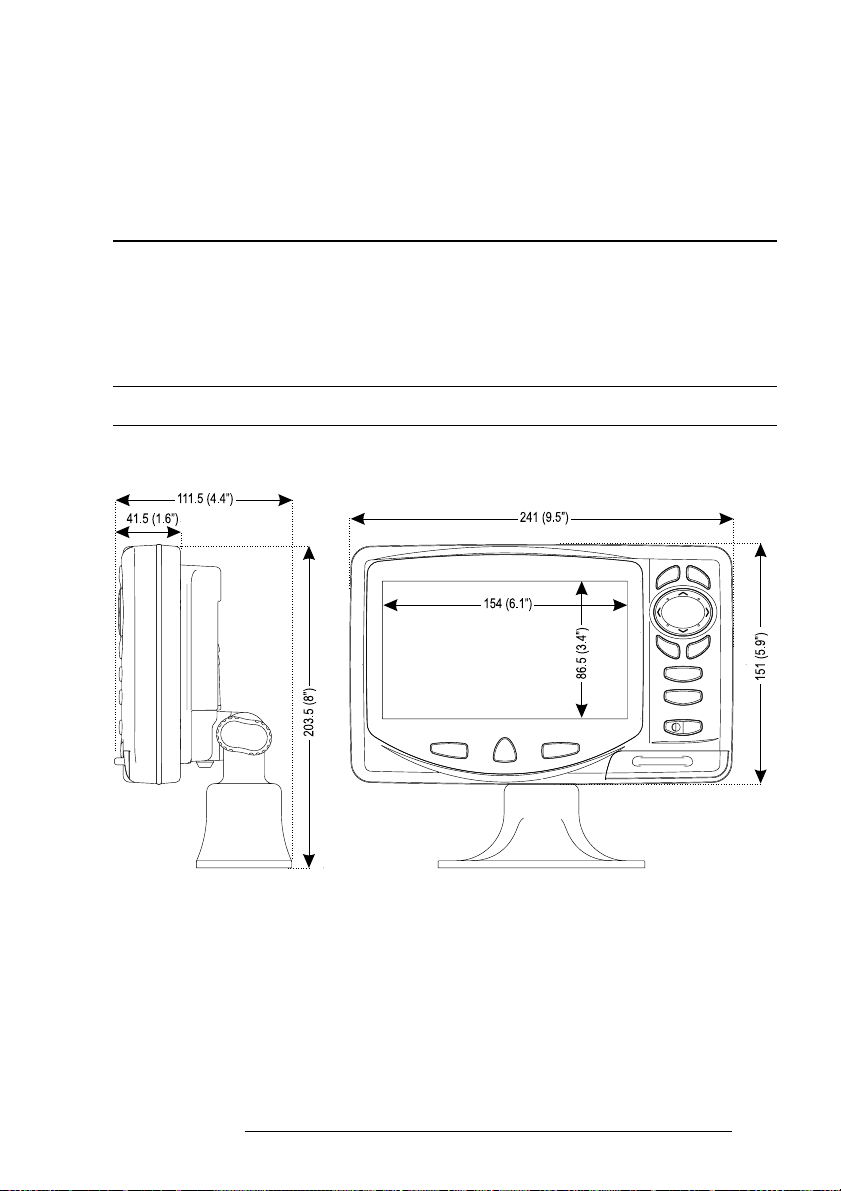
6
For the Technician
6.1 DIMENSIONS
User Manual
Fig. 6.1 - PANORAMIC 8 Sun Dimensions
95
Page 94
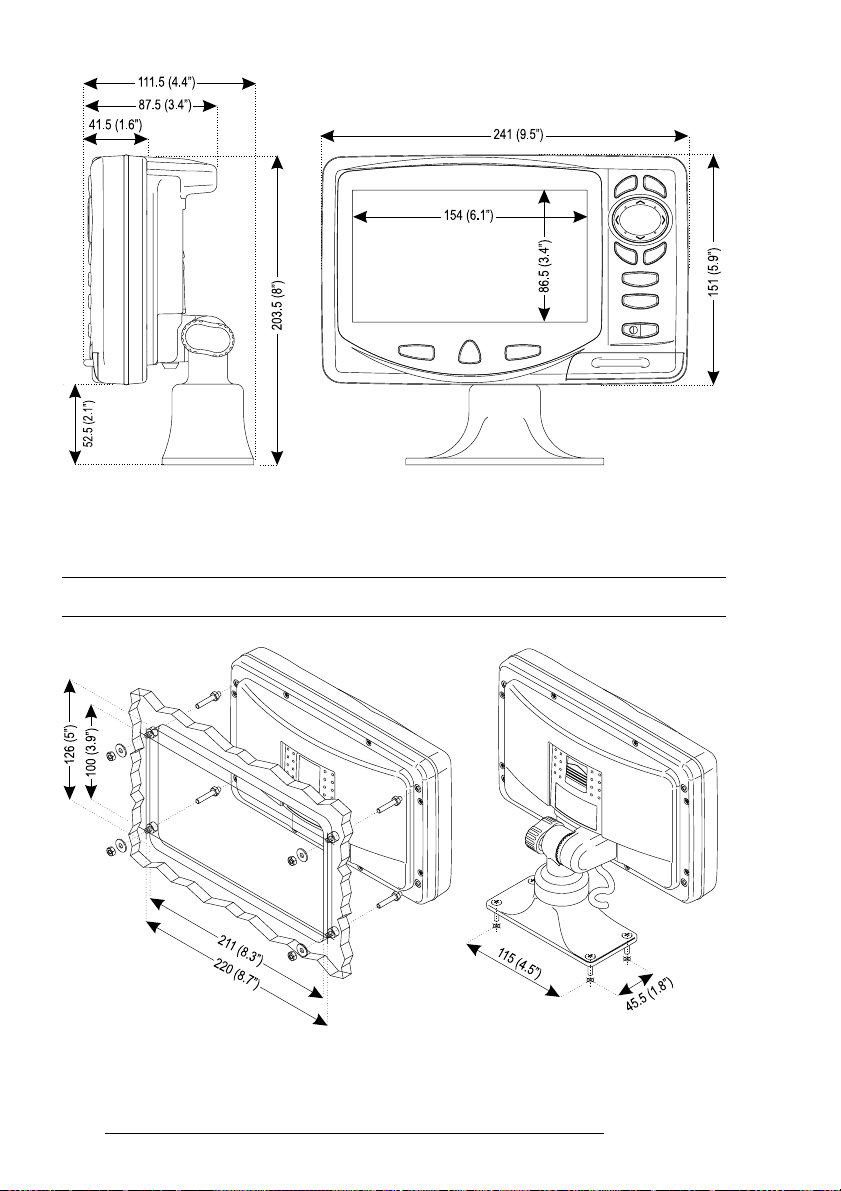
Fig. 6.1a - COMPACT 8 Sun Dimensions
6.2 INSTALLATION AND REMOVING
Fig. 6.2 - PANORAMIC 8 Sun installation and removing
96
User Manual
Page 95
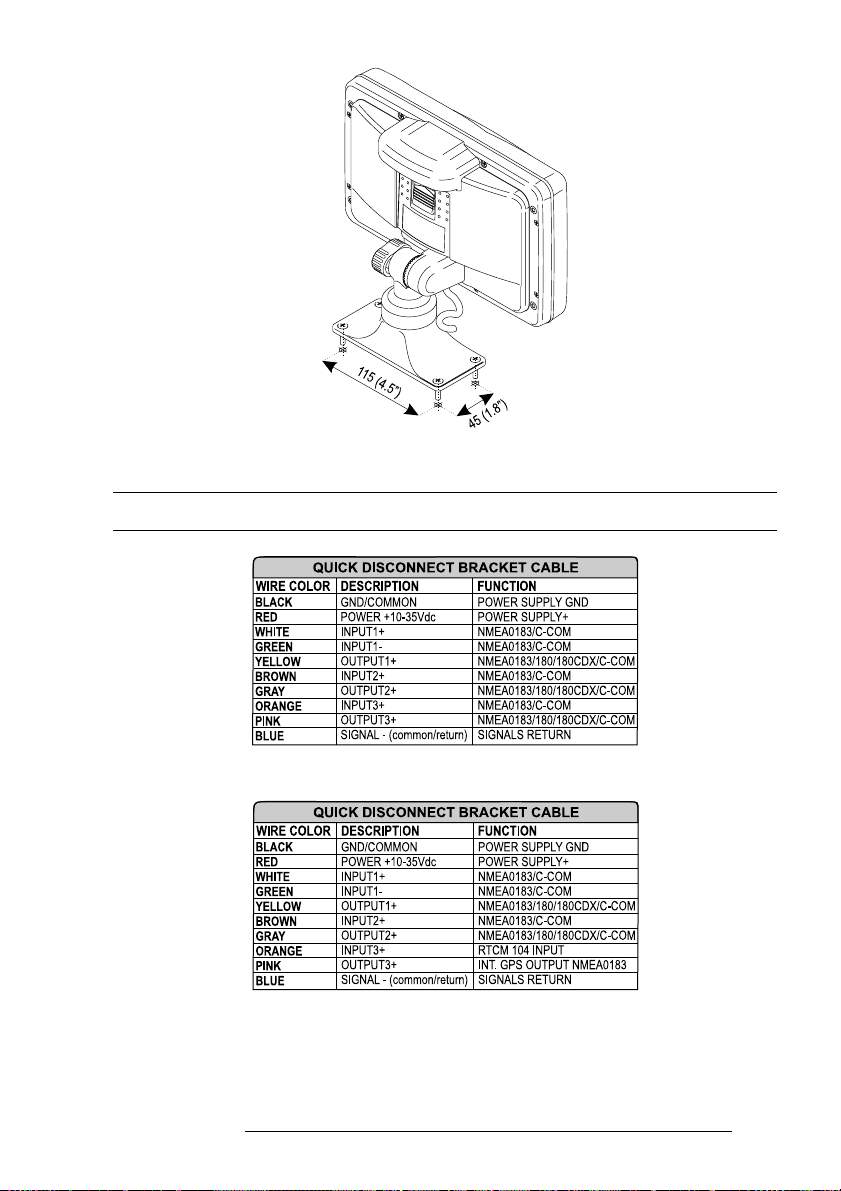
Fig. 6.2a - COMPACT 8 Sun installation and removing
6.3 EXTERNAL WIRING
Fig. 6.3 - External Wiring for PANORAMIC 8 Sun
Fig. 6.3a - External Wiring for COMPACT 8 Sun
User Manual
97
Page 96
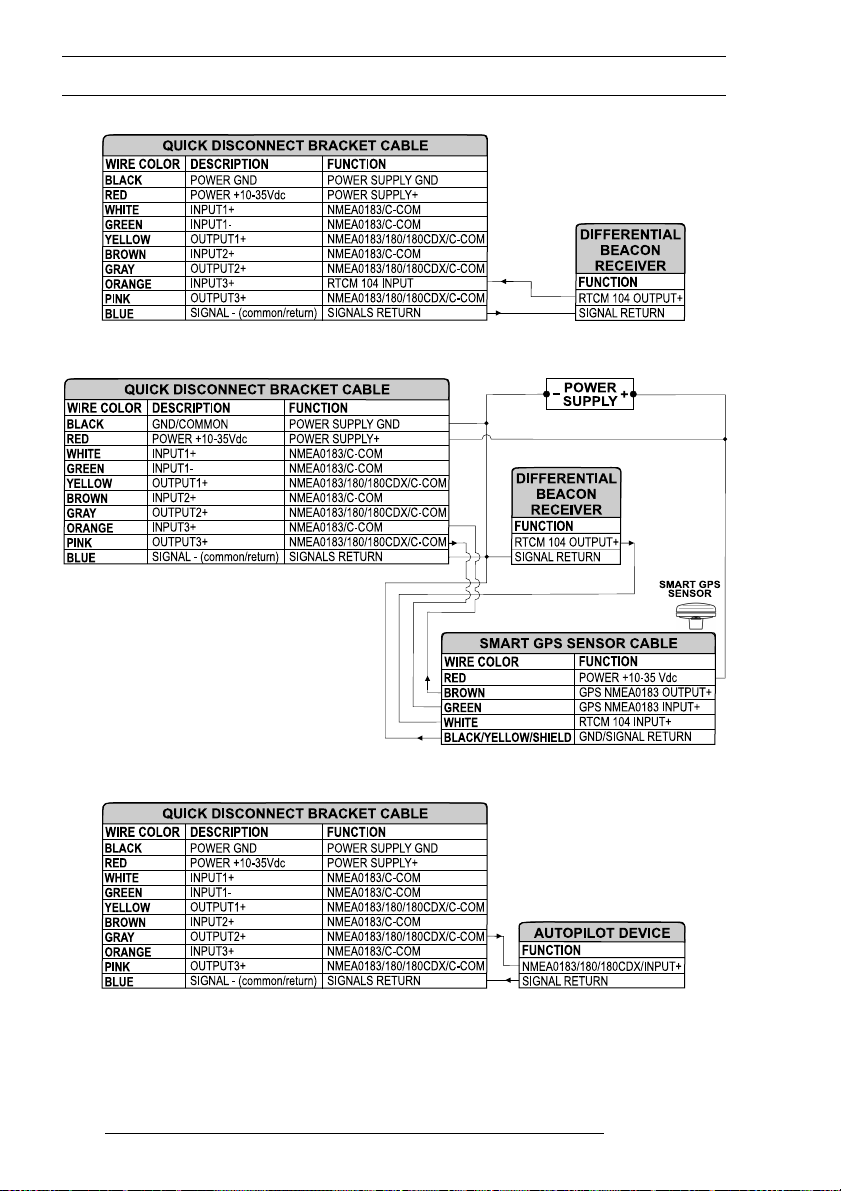
6.4 TYPICAL CONNECTIONS
Fig. 6.4 - Beacon Receive Connection for COMPACT 8 Sun
98
Fig. 6.4a - GPS Connection on Port 3 for PANORAMIC 8 Sun
Fig. 6.4b - Autopilot Connection on Port 2
User Manual
Page 97
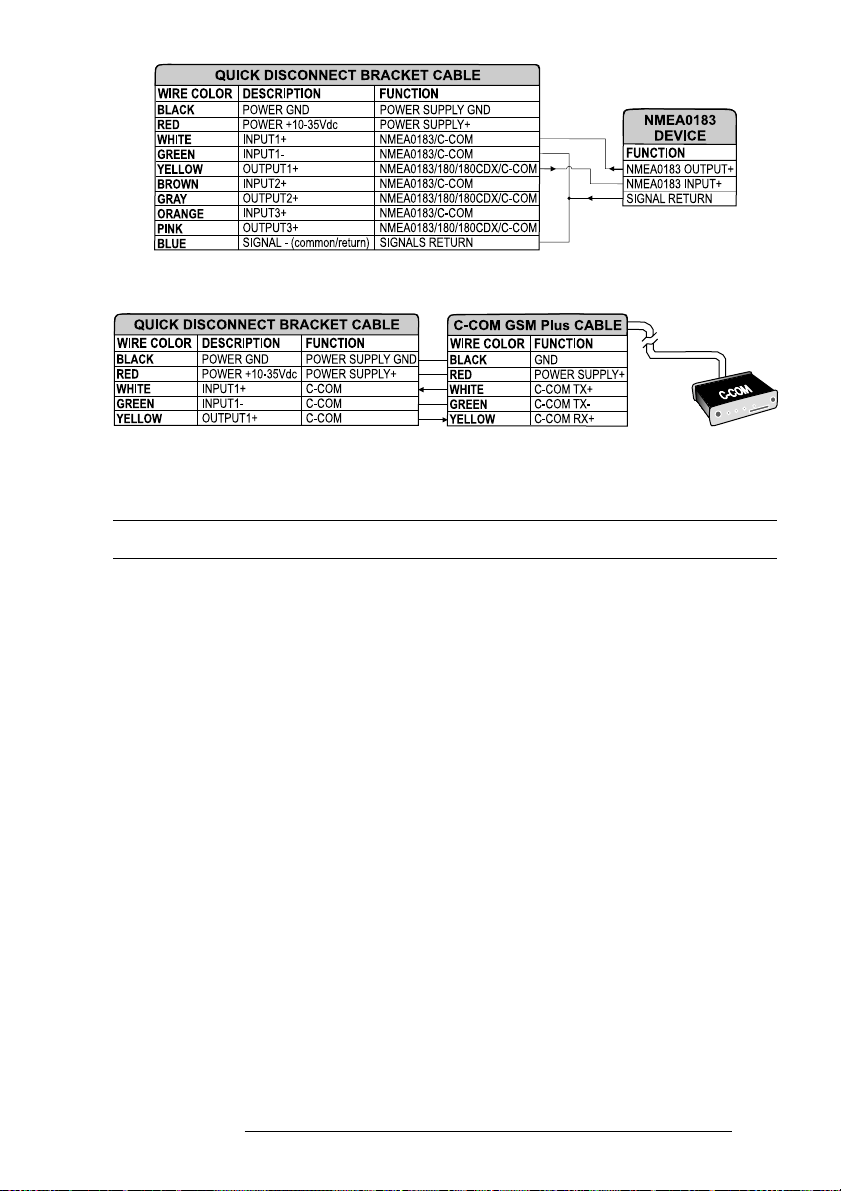
Fig. 6.4c - External NMEA Connection on Port 1
Fig. 6.4d - C-COM Connection on Port 1
6.5 TROUBLESHOOTING
The following is a brief guide to some of the problems you may experience
while using the chartplotter with common solutions.
6.5.1 PROBLEMS AND SOLUTIONS
The chartplotter does not turn On — Make sure that the correct voltage (10-35
volt dc) is present. Check also that the polarity is correct. Refer to the Par. 2.2.
The chartplotter does not turn Off — If, after a 'POWER' pressure (for at least 3
seconds) the chartplotter does not turn Off, then turn Off the voltage.
The chartplotter does not respond to any command — Try to turn Off, and then
turn On. If the problem persists, erase the memory (see Par. 6.6.1).
The chartplotter does not get a valid fix — Make sure that no metal obstacle is
placed around the chartplotter acting as a shield for the antenna. If, after 15 minutes,
the chartplotter does not get the fix, turn it Off and On again.
User Manual
99
Page 98

The chartplotter screen becomes very dark after a long exposure to direct sunlight — Control the contrast (see Par. 2.3).
6.5.2 QUICK REFERENCE GUIDE
It is available an help on line to explain as the chartplotter works:
'MENU' + "HELP" + 'ENTER'
Using 'ZOOM IN' and 'ZOOM OUT' select previous and next page respectly.
6.5.3 IF YOU NEED ASSISTANCE
The list above should allow you to solve most of the operating problems you
are likely to encounter. Simply disconnecting the chartplotter from power for a
moment may solve your problem as well.
If this does not help, you can try one additional memory clear option. This
is a factory default RAM Clear that should only be tried after all other attempts have
been made. When using the RAM Clear feature, you will loose all user stored information and the chartplotter will default to factory settings. Before this step, you
have the option of saving user Marks, Track history and Routes to a User C-CARD
(this is an optional purchase from your dealer). To perform a RAM Clear see Par.
6.6.1.
If you still need assistance, call your local dealer, reporting the Software Release and Cartography information available in the About page.
'MENU' + "About..." + 'ENTER'
6.5.3.1 World Background Charts
The internal background charts can be updated to include the MAX A and
B level charts which provide improved marine data, rivers, lakes, terrestrial data
(major streets , highways , railways, etc...), Nav-Aids, depth areas, territorial water
areas, etc... by reading them from a special data C-CARDs (contact your local dealer).
All units must have the WorldWide Background upload function that is activated
from the system.
Worldwide Background Update
The System Update menu is entered from the About page. To select this menu follow the procedure:
Plug the special data C-CARD + 'MENU' + "About..." + 'ENTER' + 'MENU' +
"UPDATE WORLDWIDE CHARTS" + 'ENTER'
100
User Manual
Page 99
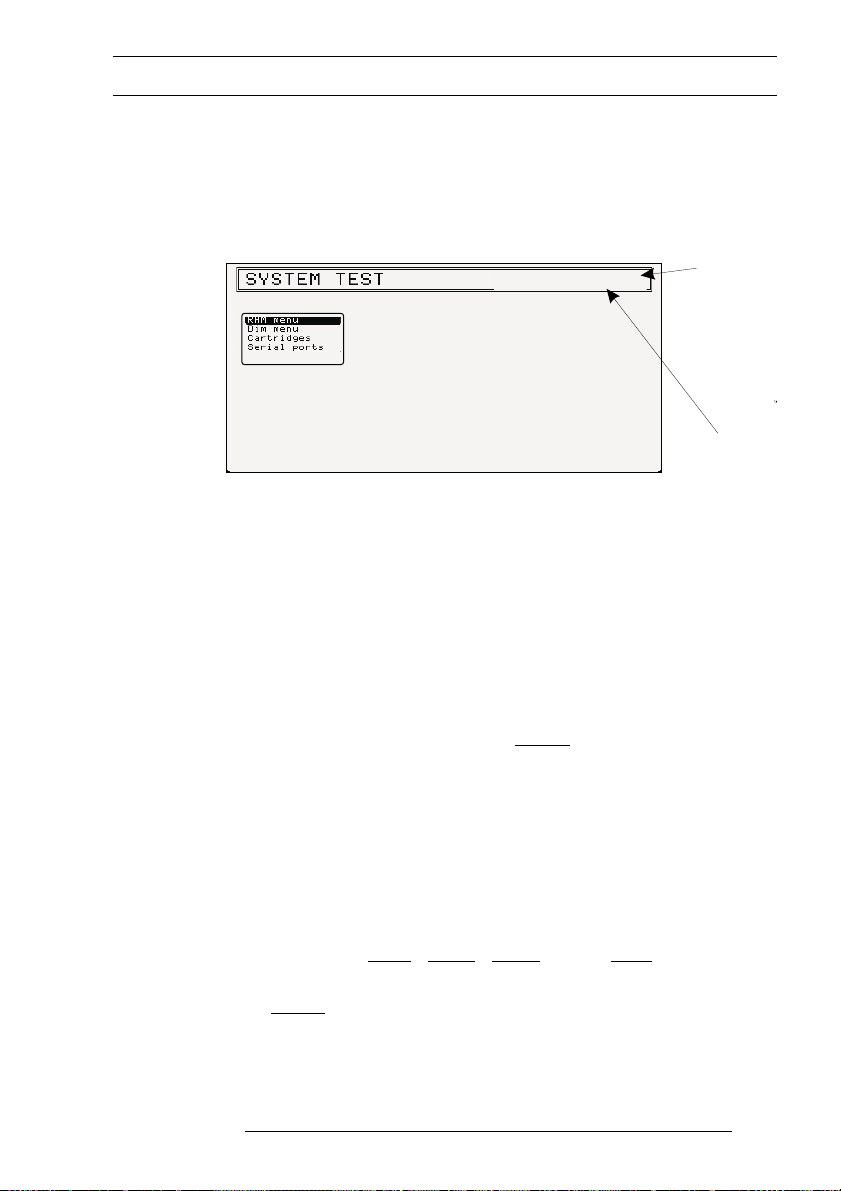
6.6 SYSTEM TEST
Software name
and version
NT Software
Library version
and date
XXXX V. x.yy
NTSL V.x.yy.zzR [gg/mm/yyy]
Modem Test
If you have connected your position-finding device according to the instructions, and chosen the proper menu selection for your device, and are still having
problems with your chartplotter, the extended auto-test should help determine the
problem. Make sure the chartplotter is turned Off. While pressing and holding any
other key, turn the chartplotter On. A new menu will appear on the display:
Softwarename
XXXXV.x.yy
NTSLV.x.yy.zzR[gg/mm/yyy]
andversion
ModemTest
NTSoftware
Libraryversion
anddate
Fig. 6.6 - System Test
Use the cursor key to select the preferred test: this will display in reverse
video and with the relative menu window. To choice the test press 'ENTER'. To
exit from any submenu press 'CLEAR'. To exit from the System Test turn Off the
chartplotter.
6.6.1 RAM MENU
This test verifies the integrity of the memories and if preferred during this
test all the internal memory can be erased and the default setting restored.
RAM Test
To verify the integrity of the RAM. If on the screen the message "ERROR"
appears, the RAM is physically damaged.
RAM Clear
To clear internal memory. If the chartplotter exhibits unusual behavior, or appears
to be malfunctioning, it may be possible to correct the problem by clearing RAM.
This operation will erase all Marks, Events, Routes, stored track plots and destinations. It will also return all selections (Input Data Format, Autopilot selection,
etc.) to original default values. To confirm to clear RAM press 'ENTER' again
(but if at this time you do not wish to clear RAM press 'CLEAR').
User Manual
101
Page 100

6.6.2 DIM MENU
To select the preferred value for contrast and backlight.
Contrast
Each time you pressed the cursor key to right, the screen will decrease brightness,
instead of to left it will increase brightness.
Backlight
To set the backlight. Operates in similar mode as Contrast.
6.6.3 CARTRIDGES
To check the C-CARD and its connector.
Background ROM
To test the WorldWideBackground. If there is not a malfunction, the code of the
Background and the message "OK" are shown.
C-CARD Test
To test the C-CARD. There are three possible situations:
1. if there is a C-CARD inserted in the slot and there is not a malfunction, the
name of the C-CARD zone and the message "OK" are shown.
2. if there is a C-CARD inserted in the slot, but it is a damaged C-CARD, the
name of the C-CARD zone and the message "Faulty" are shown.
3. if there is not any C-CARD inserted in the slot, the message "not present" is
shown.
4. if there is an User C-CARD inserted in the slot, the message "USER C-CARD"
is shown.
C-CARD Connector
Indicates if there is a malfunction in the connector. It is used only in production.
6.6.4 SERIAL PORTS
If you are having problems receiving data from the position-finding instru-
ment, this test should help determine the problem.
Change Parameters
Allows to change the parameters of the serial interface. This menu allows to
select the Port (Signal Source) between Port 1, Port 2 or Port 3 , the Baud Rate
between 4800 or 9600, the Data Bits (Word Length) between 7 or 8, the Parity
102
User Manual
 Loading...