


USER MANUAL
LBSM-MD-ML-CLX-001
VC1812-01
www.logosbio.com

DISCLAIMER
The contents of this document are subject to change without notice.
The CELENA® X High Content Imaging System is a set of electrical laboratory instruments for scientific research use only.
It is not a medical, therapeutic, or in vitro diagnostics device.
Do not disassemble the device on any occasion as this will invalidate your warranty.
TRADEMARKS
The trademarks used in this document are the property of Logos Biosystems, Inc. unless otherwise specified.
LED Filter Cubes are LTC Licensed Products provided under an intellectual property license from Life Technologies Corporation.
CellProfiler is provided under the BSD 3-Clause License.
© 2018 Logos Biosystems, Inc. All rights reserved.

Table of Contents
1. Getting Started ................................................................................................................................................................................................... 4
1.1 Product contents 4
1.2 Product description 5
CELENA® X High Content Imaging System 5
CELENA® X Controller 5
Software 5
1.3 Setting up 6
Unpacking 6
Connections 6
Shipping guard/restraints 7
Turn on the CELENA® X 7
Install filter cubes and objectives 7
Shut down the CELENA® X 7
2. CELENA® X Explorer ....................................................................................................................................................................................... 8
2.1 User interface 8
Channels 9
Vessel 12
Z-stack 13
Time lapse 14
Project 15
Toolbar 16
Messages 16
Settings 17
2.2 Workflow 19
Create a project protocol 19
Save a project protocol 21
Load a project protocol 21
Run a project protocol 21
Pause/stop a project protocol 21
View project results 21
3. CELENA® X Cell Analyzer ............................................................................................................................................................................ 22
3.1 Overview 22
Project 22
View 23
Image control 24
Analysis 25
Toolbar 25
Messages 26
3.2 Workflow 27
Set up project analysis 27
Load previously analyzed images 28
Annotate images and make simple measurements 28
Edit images 29
3.3 Pipeline module reference 30
Overview 30
Image processing 30
Object identification 33
Measurements 35
2

4. Maintenance .................................................................................................................................................................................................... 37
4.1 General care 37
4.2 Change filter cubes 37
4.3 Change objectives 38
4.4 Adjust objective correction collars 39
Appendix A: Troubleshooting ................................................................................................................................................................................ 40
Image quality 40
Explorer 40
Mechanical 40
Appendix B: Specifications ...................................................................................................................................................................................... 41
CELENA® X High Content Imaging System 41
Appendix C: Safety Information ............................................................................................................................................................................. 42
Instrument safety 42
Personal safety 43
Instrument symbols 43
Safety standards 43
Appendix D: Ordering Information ...................................................................................................................................................................... 44
Instruments 44
Objectives 44
LED filter cubes 45
Accessories 45
Appendix E: Purchaser Notification ..................................................................................................................................................................... 46
Limited use label license 46
LTC licensed products 46
BSD licensed products 46
Instrument warranty 47
3

1. Getting Started
Your CELENA® X is shipped with the following components:
CELENA® X High Content Imaging System
Camera module (installed as ordered)
Condenser (installed as ordered)
Laser autofocus module (installed as ordered)
Filter cubes (installed as ordered)
Objectives (installed as ordered)
CELENA® X Controller
PC
CELENA® X Explorer (installed)
CELENA® X Cell Analyzer (installed)
Accessories
Universal Vessel Holder
Microplate Holder
Single Slide Holder
Power Cord
Cable PS-1
Cable PS-2
Cable SIG
Cable USB 2.0
Cable USB 3.0
(Optional) Cable Laser AF (included with the Laser autofocus module)
Flathead Screwdriver
CELENA® X Cell Analyzer Verification Key
USB drive, 64 GB (includes the user manual and installation guide)
Keyboard
Mouse
Inspect the product package upon delivery to ensure that all components have been
included. If anything is missing, contact your local sales representative. Damage that may
occur during shipping and handling is not covered by warranty and must be filed with the
carrier.
1.1 Product contents
4

1.2 Product description
Your CELENA® X High Content Imaging System is an integrated imaging system designed for
rapid, high content image acquisition and analysis. Customizable imaging protocols, imagebased and laser autofocusing modules, and a motorized XYZ stage simplify well plate
imaging and slide scanning. The integrated CELENA® X Cell Analyzer software processes
images and data for quantitative analysis. Analysis pipelines can be created and used to
identify cellular or subcellular objects, process images for optimal data collection, and make
various measurements.
① Door
② Condenser
③ Motorized X/Y stage
④ Power button
CELENA® X High Content Imaging System
CAUTION! This instrument uses Class 3B ultraviolet LEDs that are in accordance with
IEC/EN 60825-1. Make the CELENA® X door is closed when imaging to protect
your eyes. Direct exposure to and diffuse reflections of the laser can be
hazardous to the eye.
The CELENA® X Controller controls the power supply to and mechanical stages of the
CELENA® X.
CELENA® X Explorer
The CELENA® X is controlled by the integrated CELENA® X Explorer software. CELENA® X
Explorer is pre-installed to the computer supplied with the instrument.
CELENA® X Explorer
CELENA® X Cell Analyzer
CELENA® X Cell Analyzer is used to process and analyze images to quantify numerous
cellular phenotypes simultaneously. CELENA® X Cell Analyzer also provides tools to edit
and annotate images as well as create videos.
CELENA® X Cell Analyzer
1
2
3
4
CELENA® X High Content Imaging System
CELENA® X Controller
Software
5

1.3 Setting up
Move the unpacked boxes to the site of operation.
CELENA® X
CAUTION! When moving the CELENA® X, do not attempt to lift or move the instrument
without assistance. It is recommended that two or more people lift the
instrument together while taking the proper safety measures to avoid injury.
IMPORTANT!
Do not subject the CELENA® X to sudden impact or excessive vibration.
Handle the instrument with care to prevent damage.
IMPORTANT!
Wiping the computer supplied with the CELENA® X (i.e., erasing the hard
drive to remove programs, etc.) voids the product warranty.
Open the CELENA® X box and remove the Styrofoam top and sides. Lift the CELENA® X out
of its box by grasping its base firmly.
Place the CELENA® X on a flat, level surface that is free of vibration. Anti-vibration tables are
recommended for optimal use. Leave sufficient space around the instrument for proper
ventilation and to prevent overheating.
IMPORTANT!
Do not expose the instrument to intense ultraviolet light.
CELENA® X Controller
Place the Controller near the CELENA® X. A separate surface is recommended for optimal
use but is not necessary.
Unpack the cables from the accessories box and attach as specified below:
CELENA® X & Controller
CELENA® X & PC
Cable PS-1 (I10331)
USB 2.0 (I10335)**
Cable PS-2 (I10332)
USB 3.0 (I10336)**
Cable SIG (I10333)
Cable AF (I10334)*
*Included if the laser AF module was purchased and installed
**Make sure to plug into the blue USB 3.0 ports at the back of the PC, not the front
Back of the CELENA® X
The CELENA® X is compatible with 4K Ultra HD (UHD) monitors. Use a DisplayPort (DP)
cable to connect a 4K UHD monitor to the provided PC.
The CELENA® X Cell Analyzer Verification Key is a parallel or USB port hardware dongle
that unlocks Cell Analyzer functionality. Attach to the provided PC.
Controller
PC
Unpacking
Connections
6

Shipping guard/restraints
Your CELENA® X is shipped with two shipping restraints installed (X/Y stage, LED filter
cube stage) to prevent damage to the instrument from shock and vibration during transport.
IMPORTANT!
The shipping restraints must be removed before the CELENA® X is turned on.
Remove shipping restraints
1. Unscrew screw A and pull it up to remove it from the LED filter cube stage cover.
2. Unscrew screw B and pull it up to remove it from the X/Y stage.
Note: Store the screws in the accessories box for future use. Make sure they are accessible in
case you need to pack up for maintenance and servicing purposes.
IMPORTANT!
The shipping restraints must be removed before the CELENA® X is turned on.
Turn on in this order:
CELENA® X Controller
CELENA® X
Run CELENA® X Explorer
IMPORTANT!
Using both Explorer & Cell Analyzer at the same time can affect both imaging
and analysis time. Use just one program at a time.
IMPORTANT!
CELENA® X Explorer must be on to install filter cubes and objectives.
For detailed instructions on how to install filter cubes, go to 4.2 Change filter cubes.
For detailed instructions on how to install objectives, go to 4.3 Change objectives.
Make sure the installed filter cubes and objectives match what is set in the CHANNELS panel.
IMPORTANT!
Explorer must be shut down before the instrument to allow the stages to dock
for safety.
Turn off in this order:
CELENA® X Explorer
CELENA® X
CELENA® X Controller
Turn on the CELENA® X
Install filter cubes and objectives
Shut down the CELENA® X
7

2. CELENA® X Explorer
The CELENA® X Explorer is the graphical user interface for the CELENA® X High Content
Imaging System.
CELENA® X Explorer
① CHANNELS: Gives control over light, camera, and focus settings.
② VESSEL: Allows you to select the appropriate vessel, wells, and fields to capture.
③ Z-STACK: Allows you to capture multiple planes along the Z-axis.
④ TIME LAPSE: Allows you to set up time lapse sequences.
⑤ PROJECT: Allows you to run, load, save, and edit automated imaging projects.
⑥ Toolbar: Has tools for capturing and visualizing the current field of view.
⑦ Viewing area: Shows the current field of view.
⑧ System messages: Displays system messages.
⑨ Settings: Allows you to set system options and perform calibration procedures.
1
3 2 4
7 6 5
8
9
2.1 User interface
8

Channels
This panel is used to set light, camera, and focus parameters for a project.
① Add: Adds the CHANNELS settings to the project protocol.
② Objectives: Allows you to select from the currently installed objectives.
③ Channels: Allows you to select from the currently installed filter cubes and adjust
light and camera settings.
④ Focus: Allows you to find focus and set up autofocusing.
Objectives
This panel is used to select from the currently installed objectives.
The magnification and label on each objective reflects its profile, which can be modified in
Settings > Objectives.
Click the desired objective to select the corresponding magnification. You can select only one
objective at a time. The selected objective is highlighted in blue.
Channels
This panel is used to set the light and camera settings.
① ON/OFF: Use to turn the light source on and off. When the light is on, the viewing
area shows the sample illuminated with the selected light source.
CAUTION! This instrument uses Class 3B ultraviolet LEDs that are in accordance with
IEC/EN 60825-1. Make the CELENA® X door is closed when imaging to protect
your eyes. Direct exposure to and diffuse reflections of the laser can be
hazardous to the eye.
1 2 4
3
1 3 25 4
9

IMPORTANT!
Minimize the time that the sample is being exposed to light to prevent
photobleaching and/or phototoxicity.
② Condenser: Is installed at the time of purchase (BF: brightfield, PH: phase
condenser). Click the condenser (BF or PH) button for transmitted light.
The dropdown menu allows you to control the condenser’s iris diaphragm.
AUTO Automatically adjusts to accommodate the selected objective
100% Used for objectives with high magnification
66% Used for objectives with medium magnification
33% Used for objectives with low magnification
0% Used for fluorescence imaging
③ Light: Controls the brightness of the selected channel. To adjust, move the slider in
the desired direction or enter the desired value in the text box. Light intensity is
controlled as a single parameter and expressed as a value between 1-1000.
④ Filter cubes: Represents the fluorescence channels available for imaging. Up to
four interchangeable filter cubes may be installed at once for multichannel
fluorescence imaging. Click the desired channel to select the corresponding light
source. The selected filter cube is highlighted in blue. You can select only one
channel at a time. Each filter cube can be renamed and its pseudocolor selected in
Settings Filter Cubes.
⑤ Gain and exposure: Controls the camera capture settings. To adjust, move the
slider in the desired direction or enter the desired value in the text box. Gain is the
camera’s amplification of the signal.
Gain is the camera’s amplification of the signal.
8-bit: 0-36 dB
12-bit: 0-24 dB
Exposure is the amount of time that the camera shutter is open to allow
light into the sensor.
Exposure range: 0-10,000 ms
Focus
The focus panel is used to find focus and to set up autofocusing for batch processing in the
currently selected channel.
① Focus slider: Used to adjust focus. The focus slider represents the full focal range.
Adjust focus by moving the slider in the desired direction.
② Z-stage speed: Used to adjust the speed at which the Z-stage moves with each
action. For fine focusing at high magnifications, set the focus speed to Slow. When
Step is selected, the Z-stage moves the distance of the selected objective’s depth of
focus with each click.
③ Z-position: Shows the position of the Z-stage and used to adjust focus. The focus
position is expressed in mm along the Z-axis. Adjust focus by entering the desired
value in the text box.
④ Find focus: Used for instant autofocusing.
⑤ Multiscan AF: Used to set repeated autofocusing during an experiment.
The CELENA® X has two autofocus options: Find Focus for instant autofocusing and
Multiscan AF for repeated autofocusing during an experiment.
Find Focus
Find Focus is used to have the CELENA® X find the optimal focal plane based on the image.
Set the range to scan from the current focal position.
A long search range is useful when finding the focal plane of an unknown object.
A short search range is useful for fine focusing.
1
2
3
4
5
10

Note: The speed of the image-based autofocus is entirely dependent on the set exposure.
Reducing the exposure will increase focusing speed.
Multiscan AF
Multiscan AF is used to set up autofocusing for demanding batch image acquisitions such as
multi-well plate imaging, slide scanning, and time-lapse imaging.
Prior to setting up Multiscan AF, make sure to bring the current field into sharp focus. The
field must be focused sharply to setup subsequent autofocusing correctly.
IMPORTANT!
If using this feature, Multiscan AF must be set up for each channel used.
① Autofocus frequency: Used to set the autofocus frequency to use during an
automated scan.
First field of each selected location
Every field
Every _ fields
Optimal AF frequency and range settings in Multiscan AF mode
Optimal AF frequency
Optimal AF range
Multi-well plates
at least 1 field/well
±100 µm
Slides
every 10-20 fields
±10 µm
*Optimal AF frequency is also affected by objective magnification. Adjust accordingly.
*Optimal AF range is also dependent on vessel bottom flatness. Adjust accordingly.
When setting up Multiscan AF, you can select to use either the image-based or laser
autofocus (optional; installed upon purchase).
A comparison of the CELENA® X autofocusing modes
Image-based AF
Laser AF
Imaging speed
Moderate
Fast
6 minutes
1 color, 10 ms exposure,
96-well plate
2 minutes
1 color, 10 ms exposure,
96-well plate
9.5 minutes
3 colors, 10 ms exposure,
96-well plate
3.5 minutes
3 colors, 10 ms exposure,
96-well plate
Applicable magnifications
All
10X-60X
Photobleaching
Yes
No
Scratches, particles in sample
Affected
Not affected
Scratches, particles, and/or
fingerprints on bottom surface
Not affected
Affected
Cell number,
illumination conditions
Affected
Not affected
1
2
3
11

② Image AF: Select to set up image-based autofocusing.
Make sure the current field is focused sharply.
Autofocus range: Use to set the range to scan from the current focal
position.
Focus offset: Choose to turn the focus offset on or off. The CELENA® X
will calculate the difference between what the system defines as the
optimal focal plane and what you define as the focal plane of interest and
automatically calibrate the focus accordingly.
③ Laser AF: Select to set up laser-based autofocusing.
Make sure the current field is focused sharply and the correct vessel is selected.
Pre-scan: Use to have the CELENA configure the laser autofocus settings.
Test AF: Use to test the accuracy of the configured laser autofocus.
IMPORTANT!
Laser AF is not compatible with the following:
! Objectives with magnifications below 10X.
! PHC phase contrast objectives.
! LED filter cubes with an emission wavelength exceeding 750 nm.
! LED filter cubes with an excitation wavelength less than 350 nm.
Vessel
This section allows you to select the appropriate vessel, area, and fields to image.
① Current vessel: Shows the currently selected vessel.
② Select vessel: Allows you to select a vessel. Use the dropdown menus to select the
vessel category and type. If the vessel you need is not available, go to Settings >
Vessels to create a vessel.
③ Vessel map: Represents the currently selected vessel.
④ Well map: Represents the currently selected well. The field size within each well
changes with the selected magnification.
⑤ Acquisition order: Allows you to specify the order in which selected areas are to
be captured.
IMPORTANT!
If using an objective with a correction collar, adjust the correction collar as
necessary according to the bottom thickness of the selected vessel.
View a specific area/well: Double-click the desired area/well in the vessel map to move the
stage to its respective location. The currently displayed area/well is rimmed in blue and
indicated by red crosshairs.
Select a specific area/well for imaging: Click and drag to select multiple areas/wells in the
vessel map. Otherwise, click each area/well. Selected areas/wells are filled in with yellow.
Select a specific field for imaging: Click and drag to select multiple fields in the well map.
Otherwise, click each field. Selected fields are filled in with yellow.
Select the acquisition order: Click one of the following buttons to specify the order in
which selected areas are to be captured.
Horizontal, zigzag
Horizontal, rightward
Vertical, zigzag
Vertical, downward
1
23 4
5
12

Z-stack
This panel allows you to set up Z-stack imaging. These settings apply to each added channel.
① Add: Adds the Z-STACK settings to the project protocol.
② Method: Allows you to select from three Z-stack imaging methods.
③ Z-stack settings: Allows you to set the Z-stack imaging parameters.
There are three methods of operation:
Z-stack methods
Start/End: Set the start and end positions of the Z-stack.
o Set start: Use to set the current focal plane as the start position.
o Set end: Use to set the current focal plane as the end position.
o Once the start and end positions have been set, the Z-stack distance is
automatically calculated.
Range (Current): Set the distance above and below the current Z-position.
o Above (+): Use to set how far above the current focal plane to capture.
o Below (-): Use to set how far below the current focal plane to capture.
Range (AF): Set the distance above and below the autofocused position for each
well. This method should be used when well-to-well focal variations are extreme.
Multiscan AF must be set up first.
o Above (+): Use to set how far above the autofocused position to capture.
o Below (-): Use to set how far below the autofocused position to capture.
Distance: The total distance between the start and end positions of the Z-stack.
This is automatically calculated.
Steps: The number of planes to capture along the Z-axis.
Interval: The distance in µm between each focal plane captured.
Well 1
AF position
Well 2
Well 3
Range (AF)
Start/End
Well 3
Well 2
Well 1
End
Start
Range (current)
Current position
Well 3
Well 2
Well 1
1
2
3
13

Time lapse
This panel allows you to set up time lapse imaging for the project protocol. This applies to
each channel. Selected fields are captured at set intervals over an allotted period of time.
① Add: Adds the TIME LAPSE settings to the project protocol.
② Total time: Allows you to set the total imaging time.
③ Interval: Allows you to set the time period that must elapse before a new set of
images are captured.
The interval can be set manually or one of the two options below can be used to capture a
new set of images immediately after capturing the previous set with no delay.
As fast as possible: Can be used when imaging in multiple channels to capture the
maximum number of images possible without stopping.
Maximum frame rate: Can only be used when imaging a single field in a single
focal plane with one channel to capture up to 30 frames per second. This option can
be used for high-speed experiments such as calcium imaging.
Note: The interval will take into account other protocol settings such as the autofocus
settings and exposure time.
1 2 3
14

Project
The project control panel is used to:
Create and run a project
Open or save a project protocol
① Create project: Allows you to start a project to image. This creates a project folder
where all generated data will be stored.
Project file (.cxproj): Stores project information, images, and associated
metadata. This file can be opened in Cell Analyzer for analysis.
Captured images
Image thumbnails
Note: Save projects on the computer from which you are running Explorer.
Do not save the project to an external hard drive or a USB drive as this can affect
imaging time.
② Project details: Shows you the file path and name of a created project.
③ Open protocol: Allows you to open a previously saved protocol. This opens a
previously saved protocol file (.cxprotocol). When you open a protocol, make the
appropriate adjustments to each parameter as needed.
1 2 3
4
5
15

④ Save protocol as: Allows you to save a protocol. This saves a protocol file
(.cxprotocol) for future use.
⑤ Protocol details: Shows you the protocol details.
Toolbar
The toolbar has tools for capturing and visualizing the current field of view.
Capture
Save Pseudocolor
Highlight saturated pixels
Live histogram
Center lines
Gridlines
① Capture: Click once to capture an image in the viewing area and turn off the light.
Click again to clear the image from the viewing area and turn on the light.
② Save: Saves the captured image in the viewing area.
③ Pseudocolor: Shows the sample illuminated with the selected light source in
pseudocolor. Go to Settings > Filter cubes to change the pseudocolor for each
channel.
④ Highlight saturated pixels: Displays the pixels in saturated areas on an image. Go
to Settings > Camera to change the color to label saturated pixels.
⑤ Live histogram: Shows a graphical representation of tonal values in real time.
⑥ Center lines: Shows center lines in the viewing area.
⑦ Gridlines: Shows gridlines in the viewing area.
This panel is used to display system messages. You can resize the message panel by dragging
the top border.
Not all system messages indicate problems with your system.
The message text can be copied for troubleshooting.
To copy all the messages, right-click inside the message panel and click Select All
from the context menu. Right-click the selection and select Copy from the context
menu. The selection is copied and can be pasted as desired.
To copy a specific message, select the desired message and right-click the selection.
Select Copy from the context menu. The selection is copied and can be pasted as
desired.
Messages
16

Settings
Settings allows you to set system options and perform calibration procedures. To access the
Settings window, click the Settings wheel above the tool bar.
Camera
The camera settings allows you to select the camera, bit depth, saturated pixel color, as well
as auto white balance the color camera.
① Camera:
o Mono: Selects a monochrome camera.
o Color: Selects a color camera,
② Bit depth: Can select to capture images in 8-bit or 16-bit with the monochrome
camera (the actual bit depth of 16-bit images is 12-bit).
③ Saturated pixel color: Can select to color saturated pixels in red, green, or blue.
④ Auto white balance: Adjusts color intensities to render colors correctly when
using the color camera.
IMPORTANT!
Images captured with the color camera cannot be analyzed with CELENA® X
Cell Analyzer.
Objectives
The objectives settings allows you to change objectives, adjust objective correction collars,
and set the description for each installed objective. See 4.3 Change objectives to learn how to
change objectives.
① Change objectives: Can be used to install and remove objectives.
② Adjust correction collars: Can be used to adjust the correction collar of objectives.
③ Objective information: Can be used to set the installed objectives and label them.
Filter cubes
The filter cubes settings allows you to change filter cubes and set the pseudocolor and
description for each installed filter cube. See 4.2 Change filter cubes to learn how to change
filter cubes.
① Change filter cubes: Can be used to install and remove filter cubes.
② Filter cube information: Can be used to set the installed filter cubes, assign their
associated pseudocolors, and label them.
17
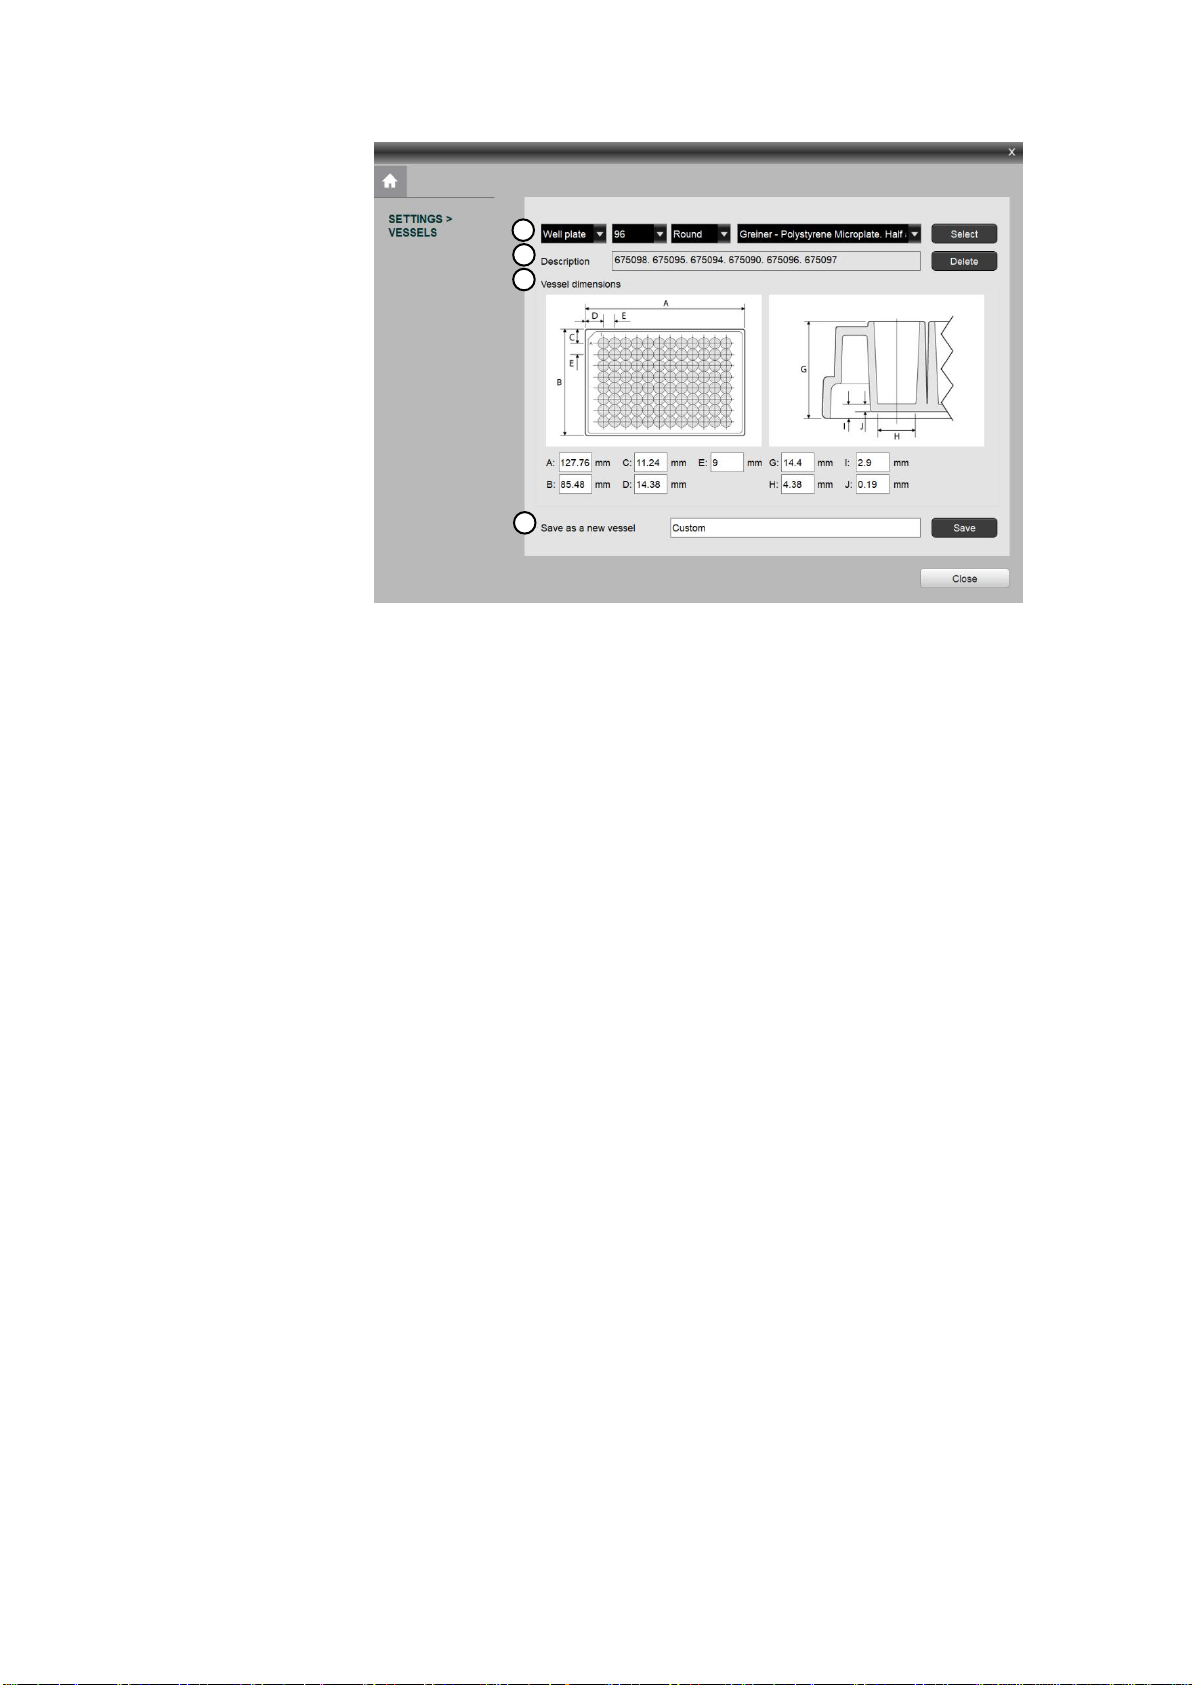
Vessels
The vessels settings allows you to create and edit custom vessels.
① Vessel details: Can be used to select the vessel type, number of wells, well shape,
and vessel name.
② Vessel description: Shows the associated catalog numbers of the selected vessel.
③ Vessel dimensions: Shows the dimensions of the selected vessel.
④ Save as a new vessel: Allows you to create a new vessel.
Create a vessel
Select the vessel type.
Select the number of wells.
Select the well shape.
Input the vessel dimensions: plate length (A), plate width (B), A1 row offset (C), A1 column
offset (D), well spacing from center to center (E), plate height (G), well diameter bottom (H),
flange/skirt height (I), well bottom thickness (J).
Name the vessel in Save as a new vessel.
Click Save.
Information
This section contains information about hardware, software, and the end user license
agreement (EULA).
1
2
3
4
18

2.2 Workflow
Overview
Upon starting Explorer, you will create a new project protocol to capture images.
Select vessel.
▼
Select objective.
▼
Select a channel.
▼
Set light and camera parameters.
▼
Focus on the sample.
▼
Adjust light.
▼
Set Multiscan AF options.
▼
Click Add [CHANNELS].
▼
Repeat for all necessary channels.
▼
Select areas and fields to be captured.
▼
(Optional) Set up Z-stack imaging.
▼
Click Add [Z-STACK].
▼
(Optional) Set up time lapse imaging.
▼
Click Add [TIME LAPSE].
▼
Create a project.
▼
Run the automated scan.
In the VESSEL panel, click Select to bring up the vessel selection window.
Use the dropdown menus to select the vessel category and type.
Available vessel types are well plates, slides, dishes, and flasks.
It is crucial that you select the correct vessel to ensure proper focusing and vessel
navigation. If the vessel you need is not available, go to Settings > Vessels to create a vessel.
IMPORTANT!
Make sure the vessel doesn’t fall into the CELENA® X.
In the CHANNELS panel, click the desired objective to select the corresponding
magnification.
You can select only one objective for each project/protocol. If the objective you need is not
available, go to Settings > Objectives to install a different objective.
In the CHANNELS panel, set up channels as needed.
CAUTION! This instrument uses Class 3B ultraviolet LEDs that are in accordance with
IEC/EN 60825-1. Make the CELENA® X door is closed when imaging to protect
your eyes. Direct exposure to and diffuse reflections of the laser can be
hazardous to the eye.
IMPORTANT!
Minimize the time that the sample is being exposed to light to prevent
photobleaching and/or phototoxicity.
Select a channel
Click the desired channel and adjust the condenser’s iris diaphragm.
For brightfield imaging, click BF or PH for transmitted light. Use the dropdown
menu to control the condenser’s iris diaphragm as desired.
Create a project protocol
19

For fluorescence imaging, click the desired fluorescence channel to select the
corresponding light source. If the channel you need is not available, go to Settings
> Filter cubes to install a different filter cube.
Tips:
When searching for a sample, increase gain and decrease exposure for a faster
frame rate.
Decrease gain to reduce background noise and increase exposure to improve signal
intensity for imaging.
Adjust light intensity
Move the slider in the desired direction or enter the desired value in the text box.
Adjust camera gain and exposure
Move the slider in the desired direction or enter the desired value in the text box.
Focus sharply.
Move the focus slider in the desired direction or enter the desired value in the Z-position
box. Alternatively, click Find Focus to have the CELENA® X find the optimal focal plane. Set
the range to scan from the current focal position. A long search range is useful when finding
the focal plane of an unknown object. A short search range is useful for fine focusing.
Note: The speed of the image-based autofocus is entirely dependent on the set exposure.
Reducing the exposure (< 10 ms) will increase focusing speed.
Set up Multiscan AF.
Click Multiscan AF to set up autofocusing for demanding batch image acquisitions such as
multi-well plate imaging, slide scanning, and time-lapse imaging. Select how often to
autofocus during an automated scan. Select whether to use the image-based or laser
autofocus.
Image-based: Make sure the current field is focused sharply. Set the range to scan
from the current focal position. You can choose to turn the user-defined focus offset
on or off. The user-defined focus offset means that the system will calculate the
difference between what the system defines as the optimal focal plane and what
the user defines as the focal plane of interest and automatically calibrate the focus
accordingly.
Laser AF: Make sure the current field is focused sharply. The vessel information
must be correct. Click Pre-Scan to have the CELENA® X configure the laser
autofocus settings. Click Test AF to test the accuracy of the configured laser
autofocus. Laser AF cannot be used with magnifications below 10X.
Note: When using this feature for imaging in multiple channels, Multiscan AF must be set for
each channel. This is especially important when the fluorescent markers in different
channels are in different focal planes.
Add to the project protocol.
Click Add.
Repeat for all necessary channels.
captured
In the VESSEL panel, select the well(s) to image in the vessel map.
Click individual wells or drag and drop to select multiple wells. Wells selected for imaging
will be filled with yellow.
Select the field(s) to image within each well in the well map.
Click individual fields or drag and drop to select multiple fields. Fields selected for imaging
will be field with yellow.
Set up Z-stack imaging
In the Z-STACK panel, select a Z-stack method and set appropriately.
Start/End: Move the focal plane to the desired start Z-position and click Set Start.
Move the focal plane to the desired end Z-position and click Set End. Select to
capture images at specific intervals (µm) or to capture a specific amount of images
(steps) and enter the desired value.
20

Range (current): Move the to the desired start position. To set the imaging range,
enter how far above (+) and below (-) the current position to set the imaging range.
Select to capture images at specific intervals (µm) or to capture a specific amount
of images (steps) and enter the desired value.
Range (AF): Make sure Multiscan AF has been set. To set the imaging range, enter
how far above (+) and below (-) the autofocused position. Select to capture images
at specific intervals (µm) or to capture a specific amount of images (steps) and
enter the desired value.
Click Add.
Set up time lapse imaging
In the TIME LAPSE panel, set the total imaging time and imaging interval.
IMPORTANT!
Set up time lapse imaging last so that the CELENA® X can account for the
other imaging options you have set, which affect the time required to capture
one image.
Click Add.
In the PROJECT panel, click Create Project.
Name the project and designate where to save the project folder.
IMPORTANT!
Save projects on the computer from which you are running Explorer.
Do not save the project to an external hard drive or a USB drive as this can
affect imaging time.
Save a project protocol
To save the set protocol for future use, click Save Protocol As in the PROJECT panel.
Name the protocol and designate the file path.
To load a previously saved protocol, click Open Protocol in the PROJECT panel.
Make the appropriate adjustments to each parameter as needed. This is especially important
for the Multiscan AF feature and Z-stack imaging. Make sure to adjust Multiscan AF settings
for each channel being imaged. To apply each change, click the Add button above each panel.
Once a protocol has been set and project has been created, click RUN at the bottom of the
PROJECT panel.
IMPORTANT!
Make sure the CELENA® X door is closed for fluorescence imaging
applications to block ambient light and improve fluorescence image quality.
To pause a running project, click PAUSE at the bottom of the PROJECT panel.
To stop a running project, click STOP at the bottom of the PROJECT panel.
When a project is complete, you can scroll through the captured images using the vessel and
well maps.
The project file (.cxproj) can be opened in CELENA® X Cell Analyzer for analysis.
Load a project protocol
Run a project protocol
Pause/stop a project protocol
View project results
21

3. CELENA® X Cell Analyzer
CELENA® X Cell Analyzer can be used to set up automated image analysis sequences to
batch process images captured on the CELENA® X. Cell Analyzer also provides tools to edit
and annotate images as well as create videos. The CELENA® X Cell Analyzer Verification Key
must be plugged into use Cell Analyzer.
CELENA® X Cell Analyzer
① PROJECT: Allows you to load a project for analysis and see project details.
② VIEW: Allows you view captured images and select wells for analysis.
③ IMAGE CONTROL: Allows you to edit images, add annotations, and make simple
measurements.
④ ANALYSIS: Allows you to set up, edit, and run analysis pipelines.
⑤ Toolbar: Has tools to export images, create videos, and visualize images.
⑥ Viewing area: Shows captured and analyzed images.
⑦ Messages: Displays system messages, annotation measurement data, module
details, and analysis results.
At the bottom of the window, there is a PROJECT tab and INFORMATION tab.
PROJECT: Shows the PROJECT, VIEW, and IMAGE CONTROL panels.
INFORMATION: Shows a detailed description of the project imaging details.
This panel is used to load a project for analysis and displays project details.
① Project path: Shows where the project file and images are located.
② Folder icon: Allows you to load a project for analysis.
③ Date: Displays the date and time the project was captured.
④ Magnification: Displays the objective magnification used for imaging.
⑤ Vessel: Displays the sample vessel used.
1
2
3
4 5 6
7
123
5
4
3.1 Overview
Project
22

View
This panel allows you to view the captured images and select wells to analyze.
Figure 1 VIEW panel\\\\\\\\\\\\\\\\\\\\\\\\
① Channel: Allows you to select which channels to display.
② Well: Allows you to select which well to view.
③ Field: Allows you to select the field in the selected well to view.
④ Acquisition order: Shows the images in the order they were captured.
⑤ Z-stack: Allows you to go through the captured Z-planes (if applicable).
⑥ Time: Allows you to go through the sequence of time lapse images (if applicable).
⑦ Loop: Sets the images in a loop so images can be cycled through continuously
without stopping at the end of the sequence.
⑧ Vessel map: Represents the imaged vessel.
⑨ Well map: Shows the imaged fields within each well.
⑩ Analysis buttons: Allows you to select wells for analysis.
Click wells and fields to view their corresponding images. The currently displayed well is
rimmed in blue and the displayed field is filled with blue.
Analysis buttons
Analysis +: Adds wells to the list of wells to be analyzed.
Wells to be analyzed will be filled with yellow.
Analysis –: Removes wells from the list of wells to be analyzed.
Imaged wells that are not set to be analyzed will be filled with white.
Select All: Selects all imaged wells. Selected wells will be rimmed in blue.
This only selects the wells. To add to the analysis list, you must click Analysis +.
Deselect All: Deselects all wells. This only deselects wells. To remove from the
analysis list, you must select the desired well(s) and click Analysis -.
Reset: Clears the list of wells to be analyzed.
12356
4
7
8
9
10
23
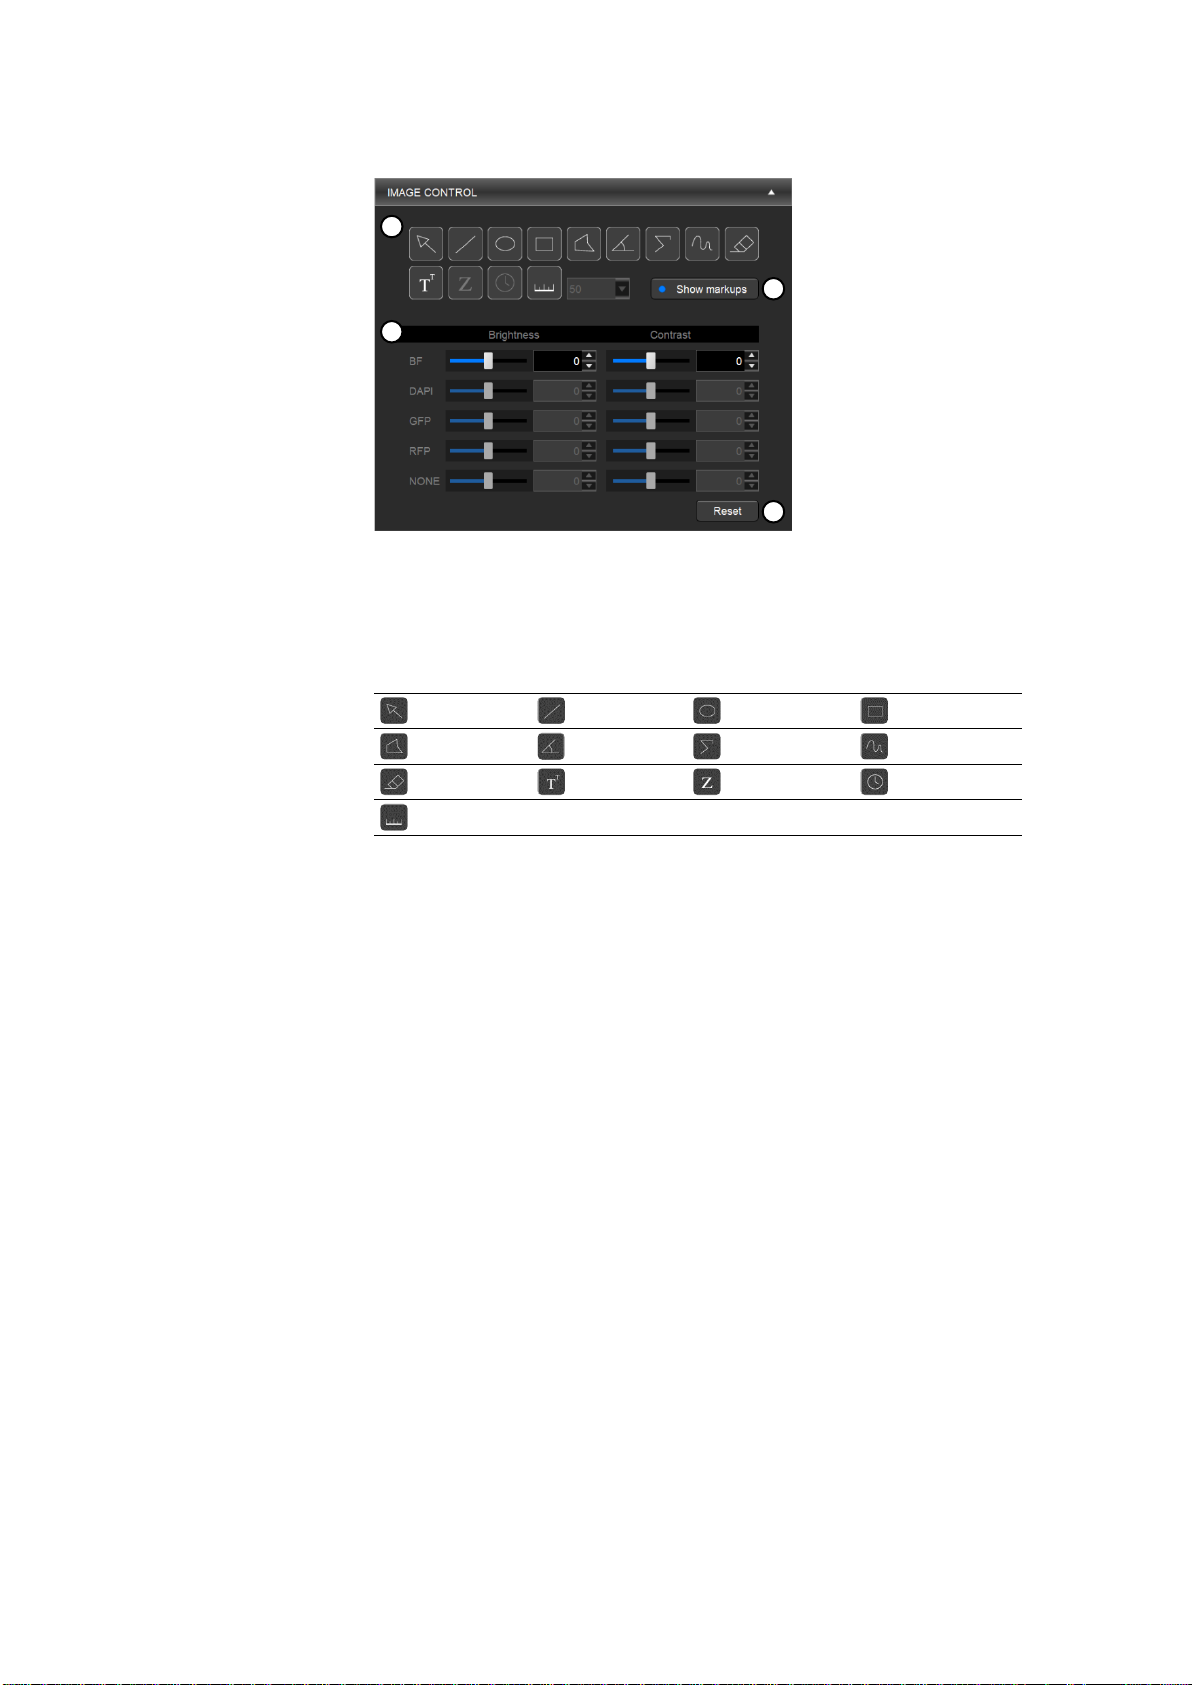
Image control
This panel allows you to edit images, add annotations, and make simple measurements.
① Annotation tools: Allows you to mark and measure specific areas of interest.
② Show markups: Shows or hides annotations.
③ Editing tools: Allows you to adjust the brightness and contrast of each channel
④ Reset: Resets all image adjustments.
Annotation tools
Select
Line Ellipse
Rectangle
Polygon
Angle Segmented line
Freehand
Eraser
Text Z-position
Time Scale bar
Use the select tool to select and manipulate annotations.
Right-click on an annotation to change properties such as color and size as well as to copy,
paste, and delete the annotation.
Double-click to deselect the annotation.
Editing tools
Adjust the brightness and contrast of each channel using the respective sliders or text boxes.
To select or deselect channels, use the channel buttons in the VIEW panel.
1
2
3
4
24

Analysis
This panel allows you to set up, edit, and run analysis pipelines.
① Open analyzed results: Allows you open a previously analyzed project (.cxasis).
② Analysis name: Shows you the analysis name.
③ Pipeline modules: Shows you the modules in the pipeline.
④ Module buttons: Allows you to add, delete, or rearrange pipeline modules.
⑤ Open pipeline: Allows you to select a previously saved pipeline.
⑥ Save pipeline: Allows you to save a newly created or edited pipeline.
The toolbar has tools to export images, create videos, and visualize images
Export images
Create a video
Pseudocolor
Histogram / line profile
Field view
Plate view
Export images: Allows the export of annotated or edited images.
Create a video: Allows the creation of a video of time lapse or Z-stack images.
Pseudocolor: Shows each channel in its designated pseudocolor.
Histogram/line profile: Displays tonal values of the whole image or a specific
annotation.
Field view: Shows a single field in the viewing area.
Plate view: Shows the captured fields laid out according to their location in the
vessel in the viewing area.
123
456
Toolbar
25

Messages
This panel is used to display system messages, annotation measurement data, module
details, and analysis results. You can resize the message panel by dragging the top border.
There are four tabs: Messages, Data, Modules, and Results. Upon analysis, additional tabs will
appear for each analyzed object.
Messages
This tab shows the analysis process.
The text can be copied for troubleshooting.
To copy all the messages, right-click inside the message panel and click Select All
from the context menu. Right-click the selection and select Copy from the context
menu. The selection is copied and can be pasted as desired.
To copy a specific message, select the desired message and right-click the selection.
Select Copy from the context menu. The selection is copied and can be pasted as
desired.
Data
This tab shows the values for measurements made with the annotation tools in the IMAGE
CONTROL panel.
Data will appear in this tab as you mark specific areas of interest with the annotation tools.
To see the location of an annotation, select the annotation from the list.
To delete a specific measurement, select it and right-click to select Clear.
To delete all data, right-click and select Clear All.
To export measurement data as a CSV file, select the data to export and right-click
to select Export CSV.
Modules
This tab allows you to adjust pipeline modules as needed.
Select a module in the pipeline module list in the ANALAYSIS panel to show module
parameters.
For a complete list of available modules, go to 3.3 Pipeline module reference.
Results
This tab allows you to examine analysis results.
26

3.2 Workflow
Overview
Using Cell Analyzer, users can create an image analysis pipeline, which is a sequence of
modules that each perform a specific image processing task. This allows the quantitative
analysis of multiple cellular features from images. Modules can be mixed, matched, and
adjusted to measure phenotypes of interest quantitatively. Once a pipeline has been
established, it can be used to analyze subsequent projects.
Open project.
▼
Select wells to analyze.
▼
Open/create/modify pipeline.
▼
Analyze images.
Make sure the project folder created by CELENA® Explorer is on your computer.
Click the folder icon next to Project path.
Select a .cxproj file. This loads the project file, which contains a list of the project image files,
the file locations, and the associated metadata. The project images and metadata will be
loaded.
Note: Make sure the images were captured with the monochrome camera. Pipelines require
images to be in grayscale.
Use the VIEW panel to go through images captured.
Select the wells to be analyzed and click Analysis +. Wells programmed for analysis will be
filled in yellow.
Select a previously saved pipeline or create a new pipeline by using the modules located in
the pipeline window.
Open a pipeline
Click Open Pipeline in the ANALYSIS panel.
Select a .cxpipe file. This loads the pipeline file and the pipeline modules with the
saved settings will appear.
Select a module in the pipeline to see its settings in the Modules tab. Adjust the
settings for each module as needed.
Project
.cxproj
Results
.cxasis
1st Module
2nd Module
3rd Module
Analysis Pipeline
.cxpipe
Set up project analysis
27

Create a pipeline
Click ADD MODULE in the ANALYSIS panel.
Select the module(s) you want to use from the modules box and click Add to
Pipeline. When finished, click Close.
Modules are processed in the order specified. Adjust the sequence by dragging and
dropping modules or by using the ▲ and ▼ buttons. Delete selected module(s)
from the pipeline using the DEL button.
Adjust the settings for each module as needed. Click a module in the pipeline to see
its settings in the module pane.
(Optional) Click Save Pipeline to save.
Note: Pipelines are automatically saved to the analysis folder once analysis is run.
For more detailed information on pipeline modules, see 3.3 Pipeline module reference.
Click ANALYZE at the bottom of the ANALAYSIS panel.
Name the analysis to create a .cxasis file and begin image analysis.
The following files will be saved to the project folder:
Analyzed images (.tif)
Analysis results (.csv)
Analysis file (.cxasis)
Pipeline file (.cxpipe)
Once analysis is complete, you can see a summary of the analysis results onscreen.
Click the Results tab in the messages panel to show the results pane. There will be a table
that displays the results of all analyzed wells and fields.
Additional tabs will appear for each analyzed object. Click on these tabs to view object
measurements.
Click wells and fields in the VIEW panel to view their corresponding images.
Load previously analyzed images
Previously analyzed projects can be reviewed in Cell Analyzer.
Click Open Analyzed Results in the ANALYSIS panel.
Select a .cxasis file. This will load the analyzed images, applied pipeline, measurement data,
analysis results, and respective metadata.
Click the Results tab in the messages panel to show the results pane. There will be a table
that displays the results of all analyzed wells and fields. Additional tabs will appear for each
analyzed object. Click on these tabs to view object measurements.
Click wells and fields in the VIEW panel to view their corresponding images.
Make sure the project folder created by CELENA® Explorer is on your computer.
Click the folder icon next to Project path.
Select a .cxproj file. This loads the project file, which contains a list of the project image files,
the file locations, and the associated metadata.
Use the VIEW panel to go through images captured.
Select the desired image.
Use the annotation tools in the IMAGE CONTROL panel to add annotations and make simple
measurements.
Click the Data tab in the messages panel to show the data pane. There will be a table that
displays all the measurements related to each annotation.
Annotate images and make simple measurements
28

(Optional) To export measurement data, select the desired measurement(s), right-click, and
click Export CSV.
(Optional) To save the annotated image, click the export images icon in the toolbar.
Edit images
Make sure the project folder created by CELENA® Explorer is on your computer.
Click the folder icon next to Project path.
Select a .cxproj file. This loads the project file, which contains a list of the project image files,
the file locations, and the associated metadata. The project images and metadata will be
loaded.
Use the VIEW panel to go through images captured.
Select the desired image.
Use the IMAGE CONTROL panel to adjust the brightness and contrast of each channel.
In the VIEW panel, select the desired channels to display.
Adjust the brightness and contrast of each channel using the respective sliders or the text
boxes.
To undo image adjustments, click Reset.
To save the edited images, click the export images icon in the toolbar.
(Optional) To save the annotated image, click the export images icon in the toolbar.
29

3.3 Pipeline module reference
Pipeline modules can be divided into the following categories:
1) Image processing
a. ColorToGray
b. EnhanceEdges
c. EnhanceOrSuppressFeatures
d. FilterObjects
e. GrayToColor
f. ImageMathOverlay
g. Invert
h. MaskImage
i. OverlayOutlines
j. Smooth
2) Object identification
a. IdentifyPrimaryObject
b. IdentifySecondaryObject
c. IdentifyTertiaryObject
3) Measurements
a. MeasureImageAreaOccupied
b. MeasureObjectIntensity
c. MeasureObjectSizeShape
ColorToGray
The ColorToGray module converts RGB color images to grayscale images. Multiple channels
can be merged into one grayscale image or converted into individual grayscale images.
Module settings:
1. Select the input image.
2. Select to:
a. Combine multiple channels into one grayscale image or
b. Split each channel to create individual grayscale images.
3. If 3a, name the output image.
If 3b, select which channels to convert to gray and name the output image(s).
4. If 3a, the relative weights will adjust the contribution of the colors relative to each
other. If necessary, adjust as needed.
EnhanceEdges
The EnhanceEdges module enhances or identifies edges in an image for downstream image
processing and/or object identification. This can be used to enhance cell boundaries for
effective determination of cell areas.
Module settings:
1. Select the input channel.
2. Name the output image.
3. Select an edge-finding method. Choose from the following:
a. Sobel
b. Prewitt
c. Roberts
d. LoG
e. Canny
f. Kirsch
4. If 3a or 3b, select edge direction to enhance.
If 3d or 3e, select whether or not to calculate Gaussian’s sigma automatically. If not,
enter the Guassian’s sigma value.
If 3e, select whether or not to automatically calculate the threshold. If not, enter the
absolute threshold value.
If 3e, select whether or not to automatically calculate the value for low threshold. If
not, enter the low threshold value.
If 3e, enter the threshold adjustment factor.
Tips:
All edge-finding methods besides Canny produce grayscale images on which
Identify modules can be used downstream. The Canny method produces a black
and white mask image of the edge pixels.
Overview
Image processing
30

EnhanceOrSuppressFeatures
The EnhanceOrSuppressFeatures module enhances or suppress specific features in an image
to improve downstream object identification.
Module settings:
1. Select the input channel.
2. Name the output image.
3. Select to:
a. Enhance or
b. Suppress features.
4. If 3a, select a feature type to enhance. Choose from the following:
a. Speckles
b. Neurites
c. Dark holes
d. Circles
e. Texture
f. DIC
If 3b, select the feature size.
5. If 4a, select the speed and accuracy, and enter the feature size.
If 4b, select the enhancement method and smoothing scale.
If 4c, enter the range of hole sizes.
If 4d, enter the feature size.
If 4e, enter the smoothing scale.
If 4f, enter the smoothing scale, shear angle, and decay.
FilterObjects
The FilterObjects module eliminates select identified objects based on certain measurements
produced by another module. Objects can be also be filtered based on whether or not they
touch image borders.
Module settings:
1. Select objects to filter.
2. Name the output objects.
3. Select the filtering mode. Choose from the following:
a. Measurements: Specify a per-object measurement made by an upstream
module in the pipeline.
b. Image or mask border: Remove objects touching the border of the image
and/or the edges of an image mask.
4. If 3a, select the filtering method. Choose from the following:
a. Minimal: Keep the object with the minimum value for the measurement of
interest. If multiple objects share a minimal value, retain one object
selected arbitrarily per image.
b. Maximal: Keep the object with the maximum value for the measurement
of interest. If multiple objects share a maximal value, retain one object
selected arbitrarily per image.
c. Minimal per object: This option requires you to choose a parent object.
The parent object might contain several child objects of choice. Only the
child object whose measurements equal the minimal child-measurement
value among that set of child objects will be kept.
d. Maximal per object: Same as Maximal per object, except filtering is based
on the maximum value.
e. Limits: Keep an object if its measurement value falls within a range you
specify.
5. If 4c or 4d, child object can overlap two parent objects and can have the
maximal/minimal measurement of all child objects in both parents. Select to which
parent to assign the overlapping child. Choose from the following:
a. Both parents: The child will be assigned to both parents and all other
children of both parents will be filtered.
b. Parent with most overlap: The child will be assigned to the parent with the
most overlap and a child with a less maximal/minimal measurement, if
available, will be assigned to other parents.
6. If 5b, select the objects that contain the filtered objects.
7. Select whether or not to retain outlines of the identified objects.
o Yes: Will retain the outlines of new objects for downstream modules.
o No: Will not retain the outlines of new objects for downstream modules.
Tips:
Any objects that are filtered are considered a new object, so the measurements
associated with the original objects do not carry over to the new objects. For
measurements on the new objects, make the measurements downstream.
31

Generated measurements:
Count: The number of objects remaining after filtering.
Parent: The identity of the input object associated with each filtered (remaining)
object.
Location_Center_X: The X coordinate of the center of mass of the filtered object.
Location_Center_Y: The Y coordinate of the center of mass of the filtered object.
GrayToColor
The GrayToColor module converts grayscale images to color images.
Module settings:
1. Name the output image.
2. Select the images to convert.
3. Assign their respective colors.
4. Adjust the brightness of each color by using relative weights.
ImageMathOverlay
The ImageMathOverlay module multiplies image intensities.
Module settings:
1. Name the output image.
2. Select the image(s) to convert.
3. Enter how much to multiply each selected image by.
Invert
The Invert module inverts images.
Module settings:
1. Select the input channel.
2. Name the output image.
MaskImage
The MaskImage module hides specific areas in an image (based on objects identified
upstream or a binary image) so they are ignored by downstream mask-respecting modules
in the pipeline.
This module masks an image so you can use the mask downstream in the pipeline. The
masked image is based on the original image and the masking object or image that is
selected. If using a masking image, the mask is composed of the foreground (white portions);
if using a masking object, the mask is composed of the area within the object. Note that the
image created by this module for further processing downstream is grayscale. If a binary
mask is desired in subsequent modules, use the Threshold module instead of MaskImage.
Module settings:
1. Select the input image.
2. Name the output image.
3. Select to:
a. Use objects or
b. An image as a mask.
4. If 3b, select the image.
5. Select whether or not to invert the mask.
OverlayOutlines
The OverlayOutlines module outlines objects in images.
Module settings:
1. Select the channel on which to display outlines.
2. Name the output image.
3. Enter the width of outlines.
4. Select objects to display.
5. Select outlines to display.
Smooth
The Smooth module smooths or blurs images to remove small artifacts.
Module settings:
1. Select the input channel.
2. Name the output image.
32

Object identification
Pipelines will depend on identifying the objects in the image. In Cell Analyzer, you will
identify primary, secondary, or tertiary objects.
IdentifyPrimaryObject
The IdentifyPrimaryObject module identifies primary objects from grayscale images.
A primary object is an object that can be identified in an image without needing another
object or image as a reference. Nuclei are good candidates for primary object identification
as they are uniform in shape, have a high contrast relative to its background once stained,
and are well-spaced apart from adjacent nuclei.
Module settings:
1. Select the input channel.
2. Name the primary objects to be identified.
Tips:
Images must be grayscale.
The regions of interest must be lighter than the background – if they are dark on a
light background, invert the images using the Invert module upstream.
If the images are phase or brightfield images, process the images using the
EnhanceOrSuppressFeatures module upstream.
Generated measurements:
Count: The number of primary objects identified.
Location_Center_X: The X coordinate of the center of mass of the primary object.
Location_Center_Y: The Y coordinate of the center of mass of the primary object.
IdentifySecondaryObject
The IdentifySecondaryObject module identifies secondary objects from grayscale images by
using the primary object as a reference.
A secondary object is an object that can be identified in an image using another as a
reference. Cells are challenging to identify without a reference as their borders are usually
overlapping especially in the case of a confluent monolayer and are lower contrast due to
diffuse staining. Cells are good candidates for secondary object identification as they need a
previously identified primary object such as nuclei as a reference to detect cell borders.
Module settings:
1. Select the input channel.
2. Select the input objects. The input objects will be identified from a prior module.
Although it is usually from the IdentifyPrimaryObjects module, it can be any an
object identified by any other module.
3. Name the primary objects to be identified.
Tips
Images must be grayscale. .
Primary objects must be completely contained within a secondary object.
Secondary objects must be larger than or equal in size to primary objects.
Generated measurements:
Count: The number of secondary objects identified.
Location_Center_X: The X coordinate of the center of mass of the secondary object.
Location_Center_Y: The Y coordinate of the center of mass of the secondary object.
IdentifyTertiaryObject
The IdentifyTertiaryObject module identifies tertiary objects from grayscale images by using
the primary and secondary object as a reference.
A tertiary object is an object that can be identified in an image by removing primary objects
from the larger secondary objects. For example, cytoplasm is an object that is outside the
nuclei but contained within the cell boundaries. This means that it can be identified by
subtracting nuclei (smaller identified objects) from cells (larger identified objects).
Module settings:
1. Select the larger identified objects. This will be identified from a prior module.
Although it is usually from the IdentifySecondaryObjects module, it can be any
object identified by any other module.
2. Select the smaller identified objects. This will be identified from a prior module.
Although it is usually from the IdentifyPrimaryObjects module, it can be any
object identified by any other module.
3. Name the objects to be identified.
33

Tips:
Images must be grayscale.
The regions of interest must be lighter than the background – if they are dark on a
light background, invert the images using the Invert module upstream.
Primary objects must be completely contained within a secondary object.
Secondary objects must be larger than or equal in size to primary objects.
Generated measurements:
Count: The number of tertiary objects identified.
Location_Center_X: The X coordinate of the center of mass of the tertiary object.
Location_Center_Y: The Y coordinate of the center of mass of the tertiary object.
34

Measurements
MeasureImageAreaOccupied
The MeasureImageAreaOccupied module measures the total area occupied by identified
objects within an image.
Module settings
1. Select objects to measure.
Generated measurements:
AreaOccupied: The total area occupied by the input objects.
MeasureObjectIntensity
The MeasureObjectIntensity module measures the intensity of identified objects.
Module settings:
1. Select a channel.
2. Select objects to measure.
3. Select measurements to export.
Tips:
Microscopes are not calibrated to an absolute scale, so when using intensity
measurements in publications, the units of intensity can be called, “intensity units”
or “arbitrary intensity units”. Moreover, specify which intensity unit you are
referring to (e.g. integrated intensity units, mean intensity units, etc.).
Generated measurements:
IntegratedIntensity: The sum of the pixel intensities within an object.
IntegratedIntensityEdge: The sum of the edge pixel intensities of an object.
LowerQuartileIntensity: The intensity value of the pixel for which 25% of the pixels
in the object have lower values.
MADIntensity: The median absolute deviation (MAD) value of the intensities within
the object. The MAD is defined as the median(|xi - median(x)|).
MassDisplacement: The distance between the centers of gravity in the gray-level
representation of the object and the binary representation of the object.
MaxIntensity: The maximal pixel intensity within an object.
MaxIntensityEdge: The maximal edge pixel intensity of an object.
MeanIntensity: The average pixel intensity within an object.
MeanIntensityEdge: The average edge pixel intensity of an object.
MedianIntensity: The median intensity value within the object.
MinIntensity: The minimal pixel intensity within an object.
MinIntensityEdge: The minimal edge pixel intensity of an object.
StdIntensity: The standard deviation of the pixel intensities within an object.
StdIntensityEdge: The standard deviation of the edge pixel intensities of an object.
UpperQuartileIntensity: The intensity value of the pixel for which 75% of the pixels
in the object have lower values.
MeasureObjectSizeShape
The MeasureObjectSizeShape module measures the area and shape of identified objects.
Module settings:
1. Select objects to measure.
2. Select measurements to export.
Tips:
This module is only reliable for objects that are completely inside an image. If there
are objects that touch the image borders, process images using the
IdentifyPrimaryObjects module advanced settings upstream or the FilterObjects
module downstream.
Generated measurements:
Area: The number of pixels in the region.
Center: The X, Y coordinates of the point farthest away from any object edge (the
centroid). This is not the same as the Location-X and -Y measurements produced by
the Identify modules.
Compactness: The mean squared distance of the object’s pixels from the centroid
divided by the area. A filled circle will have a compactness of 1, with irregular
objects or objects with holes having a value greater than 1.
35

Eccentricity: The eccentricity of the ellipse that has the same second-moments as
the region. The eccentricity is the ratio of the distance between the foci of the
ellipse and its major axis length. The value is between 0 and 1. (0 and 1 are
degenerate cases; an ellipse with an eccentricity of 0 is a circle, while an ellipse
with an eccentricity of 1 is a line.)
EulerNumber: The number of objects in the region minus the number of holes in
those objects, assuming 8-connectivity.
Extent: The proportion of the in the bounding box that are also in the region.
Computed as the area/volume of the object divided by the area/volume of the
bounding box.
FormFactor: Calculated as 4*π*Area/Perimeter2. Equals 1 for a perfectly circular
object.
MajorAxisLength: The length (in pixels) of the major axis of the ellipse that has the
same normalized second central moments as the region.
MinFeretDiameter, MaxFeretDiameter: The Feret diameter is the distance between
two parallel lines tangent on either side of the object (imagine taking a caliper and
measuring the object at various angles). The minimum and maximum Feret
diameters are the smallest and largest possible diameters, rotating the calipers
along all possible angles.
MaximumRadius: The maximum distance of any pixel in the object to the closest
pixel outside of the object. For skinny objects, this is 1/2 of the maximum width of
the object.
MeanRadius: The mean distance of any pixel in the object to the closest pixel
outside of the object.
MedianRadius: The median distance of any pixel in the object to the closest pixel
outside of the object.
MinorAxisLength: The length (in pixels) of the minor axis of the ellipse that has the
same normalized second central moments as the region.
Orientation: The angle (in degrees ranging from -90° to 90°) between the x-axis
and the major axis of the ellipse that has the same second-moments as the region.
Perimeter: The total number of pixels around the boundary of each region in the
image.
Solidity: The proportion of the pixels in the convex hull that are also in the object.
36

4. Maintenance
Clean surfaces with a soft cloth dampened with distilled water or 70% ethanol. Immediately
wipe dry with a clean cloth.
Do not pour or spray liquids directly onto the instrument.
To avoid electrical shock or damage, do not wet electrical wires or connections.
If liquid is spilled on the instrument, turn off the power and wipe dry immediately.
Use only optical-grade cleaning materials to clean optical components.
Do not exchange components between instruments unless they have been provided or
authorized by Logos Biosystems.
Procedure
Go to Settings > Filter Cubes.
Click Change filter cubes.
Click Start.
Remove the vessel holder from the stage.
Remove the filter cube stage cover.
Click Next.
Click the filter cube you want to change. The filter cube stage will move to that position.
Unplug the connector (A) of the filter cube. Loosen the screw (B) in the cube with a flat-head
screwdriver.
A A B
B
4.1 General care
4.2 Change filter cubes
37

Gently pull out the filter cube.
Insert the desired LED filter cube, fasten the screw, and plug in its connector.
Repeat as necessary.
Click Finish when complete. This will return you to the original filter cubes settings window.
Select the installed filter cube from the registered filter cubes list. Select the post in which it
was installed from the installed filter cubes list and click >>.
Double-click the label box to change how it shows up in the CHANNELS panel.
Use the Color drop-down menu to assign the filter cube a pseudocolor.
Use the DEL, and buttons to edit the list of installed filter cubes as needed.
Click Apply.
4.3 Change objectives
Procedure
Go to Settings > Objectives.
Select Change objectives.
Click Start.
Remove the vessel holder from the stage.
Click Next.
Click the objective you want to change. The turret will turn to that position.
Grasp the objective at its base and unscrew it from the turret.
Replace it with the desired objective and screw it in securely.
If applicable, set the correction collar (A) as needed.
Repeat as necessary.
A
A
38

Click Finish when complete. This will return you to the original objectives settings window.
Select the installed objective from the compatible objectives list. Select the post in which it
was installed from the installed objectives list and click >>.
Double-click the label box to change how it shows up in the CHANNELS panel.
Use the DEL, buttons to edit the list of installed objectives as needed.
Click Apply.
4.4 Adjust objective correction collars
Procedure
Go to Settings > Objectives.
Click Adjust correction collars.
To adjust correction collars on applicable objectives, click Start.
Remove the vessel holder from the stage.
Click Next.
Click the desired objective. The turret will turn to that position.
Grasp the objective at its base and unscrew it from the turret.
Set the correction collar (A) as needed.
Reinstall the objective with care.
Repeat as necessary.
Click Finish to complete.
A
A
39

Appendix A: Troubleshooting
Uneven focus
Make sure the vessel bottom is clean and free of fingerprints.
Place the vessel in the appropriate vessel holder. Make sure it fits snugly and lies flat.
Make sure you focus sharply on a sample before setting up the autofocus for Multiscan AF.
Make sure you have selected the correct vessel.
Make sure the objective correction collar (if available) is set to the correct vessel thickness.
Difficulty focusing on a
coverslipped sample
Make sure the coverslip is facing up if using an objective corrected for 1.0 mm.
Make sure the coverslip is facing down if using an objective corrected for 0.17 mm.
If using an objective with a correction collar, make sure the objective correction is set to the
desired vessel thickness and place the coverslipped sample accordingly.
Dim image
Set the iris diaphragm according to the objective and condenser used.
Increase light intensity.
Spots or blurs on image
Clean the objective lens carefully and appropriately.
Make sure the vessel bottom is clean and free of fingerprints.
Black viewing area
Turn on the light on in the CHANNELS panel.
Center the sample over the objective.
Red viewing area, or red
patches on image
Decrease light intensity until the red highlights disappear.
Click to deactivate the Highlight Saturated Pixels button in the toolbar.
Image irresponsive to changes
in focus or stage position
Turn on the light in the CHANNELS panel.
Inactive buttons
Some of the buttons are contextual and only the controls relevant for the task at hand will be
available.
Inactive save button
Click the Capture button in the toolbar first.
Inactive RUN button
Make sure channels have been added to the project protocol.
Stage does not move
Remove the shipping restraint.
Filter cube stage does not move
Remove the shipping restraint.
Vessel does not fit correctly
Use the appropriate vessel holder.
Image quality
Explorer
Mechanical
40

Appendix B: Specifications
Supported labware
Slides, multi-well plates (6 to 1536 wells), petri dishes, culture flasks
Imaging modes
4-channel fluorescence, brightfield, phase contrast, color brightfield
Light source
High power LED filter cubes with adjustable intensity (>50,000 hours per filter cube)
Filter cube stage
Motorized; 4 interchangeable fluorescence filter cubes and 1 brightfield filter cube
Available filters
DAPI, EGFP, RFP, mCherry, ECFP, EYFP, DSRed, Cy5, Cy7, Cy3/TRITC Long Pass, GFP Long
Pass, Cy5 Long Pass, custom filters
Objective turret
Motorized; 5 interchangeable objectives
Compatible objectives
1.25-100X; Olympus, Zeiss, and Logos Biosystems objectives
Condenser
Motorized; basic or phase contrast condenser
Basic: 60 mm LWD condenser, 4-positions
Phase contrast: 60 mm LWD condenser, 4-positions with 3 phase annuli
Camera
Single or dual camera module(s)
Monochrome: CMOS, 1.92 MP
(optional) Color: CMOS, 1.92 MP
Image outputs
Monochrome: 16‐bit (12‐bit dynamic range) TIF, PNG, or JPG
Color: 24-bit color TIF, PNG, or JPG
Movies: MP4
Autofocus method
Image-based autofocus
(optional) Laser autofocus
Stage
Motorized X/Y-stage (120 mm x 80 mm); motorized Z-stage (10 mm)
Stage control
CELENA® X Explorer
(optional) Joystick
Computer
External PC running Windows™ 10 Pro
Monitor
4K UHD monitor
Power
100-240 VAC, 250 W, 50/60 Hz
Dimensions
Main body: 39 x 46 x 50 cm (15.4 x 18.1 x 19.7 in)
Controller: 17 x 30 x 23 cm (6.7 x 11.8 x 9.1 in)
Weight
Main body: 33 kg (72.8 lbs)
Controller: 7 kg (15.4 lbs)
CELENA® X High Content Imaging System
41

Appendix C: Safety Information
General safety
Operate the instrument in the conditions described in the Operating Conditions.
Install the instrument on a level and sturdy surface. Avoid vibrations from other devices. The
instrument can withstand light shock and vibration. However, excessive shock and/or
vibration may damage the instrument. Leave sufficient space around the instrument for air
circulation and cooling. Take care that the instrument does not overheat during long and
continuous operation.
Do not touch the instrument or its components with wet hands.
Use components provided or authorized by Logos Biosystems. If the proper combination of
components is not used, product safety cannot be guaranteed.
Use only the provided power cord and AC adapter. If the proper components are not used,
electrical safety of the product cannot be guaranteed.
Ensure that the input voltage is compatible with the power supply voltage of the product.
Connect the grounding terminal of the instrument and electrical outlet properly. If the
instrument is not grounded, electrical safety of the product cannot be guaranteed.
Turn on the instrument only after connecting the power cord and AC adapter to both the
power source and the instrument. Turn off the instrument before disconnecting the power
cord and/or moving the instrument.
Do not expose the instrument to intense ultraviolet light.
This instrument uses Class 3B ultraviolet LEDs that are in accordance with IEC/EN 60825-1.
Always turn off the light before changing LED filter cubes or objectives.
Disconnect the power cord in the case of abnormalities.
Protect the computer from being infected with viruses and malware.
Operating conditions
Operating Power
100 - 240 VAC, 1.5 A
Electrical Input
12 VDC, 5.0 A
Frequency
50/60 Hz
Installation Site
Indoor use only
Operating Temperature
10 - 35°C
Maximum Relative Humidity
20 - 80%
Altitude
≤ 2,000 m
Pollution Degree
2
Instrument disassembly
Do not disassemble the instruments or wipe the supplied computer in any event as this will
invalidate your warranty. If the instrument is damaged or malfunctioning, contact your local
sales representative.
Instrument safety
42

Personal safety
Safety guidelines
Read all user manuals thoroughly before using the instrument.
Keep all user manuals in a safe and accessible place for future reference.
Wear appropriate personal protective equipment (PPE) when handling reagents and samples
to avoid exposure.
When using toxic agents, radioactive materials, or pathogenic microorganisms belonging to
WHO Risk Groups 2-4, follow national laws and regulations for biosafety level requirements.
Electrical symbols
Symbol
Description
Power symbol
Protective earth (ground) terminal
Safety symbol
Symbol
Description
WARNING! UV radiation hazard. Avoid looking directly at UV light.
Environmental symbol
Symbol
Description
Waste Electrical and Electronic Equipment (WEEE). Do not dispose of this
product as unsorted municipal waste. Follow local waste ordinances for proper
disposal provisions to reduce the environmental impact of WEEE.
European standards
Symbol
Description
The CE mark indicates that this instrument conforms to all applicable European
Community provisions for which this marking is required. Users must be aware
of and follow the conditions described in this manual for operating the
instrument. The protection provided by the instrument may be impaired if the
instrument is used in a manner not specified by Logos Biosystems.
Korean standards
Symbol
Description
The KC certification mark indicates that this instrument conforms with Korea’s
product safety requirements for electrical and electronic equipment and
components for which this marking is required.
United States standards
Type
Description
FCC Part 18
This device complies with Part 18 of the FCC Rules.
Instrument symbols
Safety standards
43

Appendix D: Ordering Information
Cat #
Product
CX30000
CELENA® X High Content Imaging System
CELENA® X Controller
HP Z240 Workstation
CELENA® X Cell Analyzer Verification Key
Universal Vessel Holder
Microplate Holder
Single Slide Holder
Options:
Camera
CX30200
CX30201
Monochrome Camera Module
Dual Camera Module
Condenser
CX30300
CX30301
Phase Condenser
Brightfield Condenser
AF module
CX30400
CX30401
Image-based AF
Laser AF Module
Olympus
High resolution fluorescence
Cat #
Objective
NA
WD (mm)
Correction (mm)
I10030
UPLFLN 4X
0.13
17 - I10031
UPLFLN 10X2
0.3
10 - I10034
LUCPLFLN 20X
0.45
6.6-7.8
0-2
I10035
LUCPLFLN 40X
0.6
2.7-4.0
0-2
Fluorescence and phase contrast
Cat #
Objective
NA
WD (mm)
Correction (mm)
I10038
UPLFLN 4XPH
0.13
17
-
I10039
UPLFLN 10X2PH
0.3
10 1 I10042
LUCPLFLN 20XPH
0.45
6.6-7.8
0-2
I10043
LUCPLFLN 40XPH
0.6
3.0-4.2
0-2
Low and high magnification
Cat #
Objective
NA
WD (mm)
Correction (mm)
I10046
PLAPON 1.25X
0.04 5 -
I10047
PLAPON 2X
0.08
6.2 - I10050
UPLSAPO 60XO
1.35
0.15
0.17
I10051
UPLSAPO 100XO
1.4
0.13
0.17
Logos Biosystems
Plan fluorite
Cat #
Objective
NA
WD (mm)
Correction (mm)
I10005
TC PlanFluor 4X
0.13
17.5 1 I10006
TC PlanFluor 10X
0.3
7.5 1 I10007
TC PlanFluor 20X
0.4
7.5
1
I10008
TC PlanFluor 40X
0.6
2.9
1
Plan apochromatic
Cat #
Objective
NA
WD (mm)
Correction (mm)
I10013
Plan Apochromat Fluor 1.25X
0.04
3.7 - I10014
Plan Apochromat Fluor 4X
0.13
17.2 - I10009
Plan Apochromat Fluor 10X
0.3
8.6
0.17
I10010
Plan Apochromat Fluor 20X
0.65
0.7
0.17
I10011
Plan Apochromat Fluor 40X
0.8
0.2
0.17
I10015
Plan Apochromat Fluor Oil 40X
0.85
0.2
0.17
I10012
Plan Apochromat Fluor Oil
100X
1.25
0.19
0.17
Instruments
Objectives
44

LED filter cubes
Cat #
Filter cube
Excitation (nm)
Emission (nm)
I10130
DAPI
375/28
460/50
I10131
EGFP
470/30
530/50
I10132
RFP
530/40
605/55
I10133
mCherry
580/25
645/75
I10134
ECFP
436/20
480/40
I10135
EYFP
500/20
535/30
I10136
DSRed
530/40
620/60
I10137
Cy5
620/60
700/75
I10138
Cy7
710/75
810/90
I10139
Cy3/TRITC Long Pass
530/40
570lp
I10140
GFP Long Pass
470/40
500lp
I10141
Cy5 Long Pass
620/60
665lp
I10142
Custom - -
Cat #
Product
CX31002
CELENA® X Cell Analyzer Verification Key
I10410
Joystick
I10411
Microscope Calibration Slide #1
Accessories
45

Appendix E: Purchaser Notification
Research use only
The purchaser of this product should use this product only for research for the sole benefit of the purchaser. By
use of this product, the purchaser agrees to be bounded by the terms of this limited use statement whether the
purchaser is a for-profit or a not-for-profit entity.
If the purchaser is not willing to accept the conditions of this limited use statement and this product is unused,
the Company will accept return of the product with a full refund.
The purchaser cannot resell or otherwise transfer (a) this product (b) its components or (c) materials made
using this product or its components to a third party for Commercial Purposes.
Commercial Purposes mean any and all uses of this product and its components by a party for monetary or
other consideration, including but not limited to, (a) product manufacture, (b) providing a service, information,
or data, (c) therapeutic, diagnostic, or prophylactic purposes, or (d) resale of this product or its components
whether or not such product and its components are resold for use in research.
Logos Biosystems, Inc. (“Company”) will not claim any consideration against the purchaser of infringement of
patents owned or controlled by the Company which cover the product based on the manufacture, use or sale of
a therapeutic, clinical diagnostic, vaccine, or prophylactic product developed in research by the purchaser in
which this product or its components was employed, provided that neither this product nor any of its
components was used in the manufacture of such product.
For any use other than this limited use label license of research use only, please contact the Company or email
info@logosbio.com for more information.
LED filter cubes
LED Filter Cubes are LTC Licensed Products provided under an intellectual property license from Life
Technologies Corporation. The transfer of this product is conditioned on the buyer using the purchased
product solely in research conducted by the buyer, and the buyer must not (1) use this product or its
components for (a) diagnostic, therapeutic or prophylactic purposes; or (b) manufacturing, and/or (2) sell or
transfer this product or its components for resale, whether or not resold for use in research. For information on
purchasing a license to this product for purposes other than as described above, contact Life Technologies
Corporation, 5791 Van Allen Way, Carlsbad, CA 92008 USA or outlicensing@lifetech.com.
CellProfiler
Copyright © 2003 - 2018 Broad Institute, Inc. All rights reserved.
Redistribution and use in source and binary forms, with or without modification, are permitted provided that
the following conditions are met:
1. Redistributions of source code must retain the above copyright notice, this list of conditions and the
following disclaimer.
2. Redistributions in binary form must reproduce the above copyright notice, this list of conditions
and the following disclaimer in the documentation and/or other materials provided with the
distribution.
3. Neither the name of the Broad Institute, Inc. nor the names of its contributors may be used to
endorse or promote products derived from this software without specific prior written permission
THIS SOFTWARE IS PROVIDED “AS IS.” BROAD MAKES NO EXPRESS OR IMPLIED REPRESENTATIONS OR
WARRANTIES OF ANY KIND REGARDING THE SOFTWARE AND COPYRIGHT, INCLUDING, BUT NOT LIMITED
TO, WARRANTIES OF MERCHANTABILITY, FITNESS FOR A PARTICULAR PURPOSE, CONFORMITY WITH ANY
DOCUMENTATION, NON-INFRINGEMENT, OR THE ABSENCE OF LATENT OR OTHER DEFECTS, WHETHER OR
NOT DISCOVERABLE. IN NO EVENT SHALL BROAD, THE COPYRIGHT HOLDERS, OR CONTRIBUTORS BE
LIABLE FOR ANY DIRECT, INDIRECT, INCIDENTAL, SPECIAL, EXEMPLARY, OR CONSEQUENTIAL DAMAGES
(INCLUDING, BUT NOT LIMITED TO PROCUREMENT OF SUBSTITUTE GOODS OR SERVICES; LOSS OF USE,
DATA, OR PROFITS; OR BUSINESS INTERRUPTION) HOWEVER CAUSED AND ON ANY THEORY OF LIABILITY,
WHETHER IN CONTRACT, STRICT LIABILITY, OR TORT (INCLUDING NEGLIGENCE OR OTHERWISE) ARISING
IN ANY WAY OUT OF THE USE OF THIS SOFTWARE, EVEN IF ADVISED OF, HAVE REASON TO KNOW, OR IN
FACT SHALL KNOW OF THE POSSIBILITY OF SUCH DAMAGE.
If, by operation of law or otherwise, any of the aforementioned warranty disclaimers are determined
inapplicable, your sole remedy, regardless of the form of action, including, but not limited to, negligence and
strict liability, shall be replacement of the software with an updated version if one exists.
Development of CellProfiler has been funded in whole or in part with federal funds from the National Institutes
of Health, the National Science Foundation, and the Human Frontier Science Program.
Limited use label license
LTC licensed products
BSD licensed products
46

Instrument warranty
Warranty
Logos Biosystems, Inc. (“Company”) warrants to the original purchaser (“Purchaser”) that the instrument
(“Instrument”), if properly used and installed, will be free from defects in materials and workmanship and will
conform to the product specifications for a period of one (1) year (“Warranty Period”) from the date of
purchase. If the Instrument under this limited warranty fails during the Warranty Period, the Company, at its
sole responsibility, will: within and up to 30 calendar days of purchase, refund the purchase price of the
Instrument to the Purchaser if the Instrument is in original conditions; or, after 30 calendar days of purchase,
only replace or repair the Instrument for up to the Warranty Period without issuing a credit.
In no event shall the Company accept any returned instrument (including its components) that might have
been used or contaminated in some labs, including but not limited to, HIV or other infectious disease or bloodhandling labs. This limited warranty does not cover refund, replacement, and repair incurred by accident,
abuse, misuse, neglect, unauthorized repair, or modification of the Instrument. This limited warranty will be
invalid if the Instrument is disassembled or repaired by the Purchaser.
In case that the Company decides to repair the Instrument, not to replace, this limited warranty includes
replacement parts and labor for the Instrument. This limited warranty does not include shipment of the
Instrument to and from service location or travel cost of service engineer, the costs of which shall be borne by
the Purchaser. Every effort has been made to ensure that all the information contained in this document is
correct at its publication. However, the Company makes no warranty of any kind regarding the contents of any
publications or documentation as unintended or unexpected errors including occasional typographies or other
kinds are inevitable. In addition, the Company reserves the right to make any changes necessary without notice
as part of ongoing product development. If you discover an error in any of our publications, please report it to
your local supplier or the Company. The Company shall have no responsibility or liability for any special,
incidental, indirect or consequential loss or damage resulting from the use or malfunction of the Instrument.
This limited warranty is sole and exclusive. The Company makes no other representations or warranties of any
kind, either express or implied, including for merchantability or fitness for a particular purpose with regards to
this Instrument. To obtain service during the Warranty Period, contact your local supplier or the Company’s
Technical Support team.
Out of warranty service
Please contact your local supplier or the Company’s technical support team in order to obtain out-of-warranty
service. If necessary, repair service will be charged for replacement parts and labor hours incurred to repair
the Instrument. In addition, the Purchaser is responsible for the cost of shipping the Instrument to and from the
service facility and, if necessary, the travel cost of a service engineer after 30 calendar days of purchase, only
replace or repair the Instrument for up to the Warranty Period without issuing a credit.
47

Logos Biosystems
HEADQUARTERS
FL 2 & 3
28 Simindaero 327beon-gil, Dongan-gu
Anyang-si, Gyeonggi-do 14055
SOUTH KOREA
Tel: +82 31 478 4185
Fax: +82 31 360 4277
Email: info@logosbio.com
USA
7700 Little River Turnpike STE 207
Annandale, VA 22003
USA
Tel: +1 703 622 4660
Tel: +1 703 942 8867
Fax: +1 571 266 3925
Email: info-usa@logosbio.com
EUROPE
11B avenue de l’Harmonie
59650 Villeneuve d’Ascq
FRANCE
Tel: +33 (0)3 74 09 44 35
Fax: +33 (0)3 59 35 01 98
Email: info-france@logosbio.com
www.logosbio.com
 Loading...