

Page 1

WDReportCom
User Manual
Version 1.5
2009-08
Copyright© 2007-2009 LJZsoft Corporation
All rights reserved
Page 2

Contents
CHAPTER 1 INTRODUCTION...........................................................................................................1
1.1 OVERVIEW......................................................................................................................................1
1.2 FEATURES.......................................................................................................................................1
CHAPTER 2 INSTALLATION AND STARTUP...............................................................................3
2.1 SOFTWARE REQUIREMENTS............................................................................................................3
2.2 INSTALLING WDREPORTCOM ........................................................................................................3
2.3 UNINSTALLING WDREPORTCOM ...................................................................................................4
2.4 WDREPORTCOM.DLL .....................................................................................................................4
2.5 WORDREPORT.EXE.........................................................................................................................5
2.6 RUN-TIME FILES.............................................................................................................................6
CHAPTER 3 QUICK START...............................................................................................................7
3.1 LEARNING HOW TO USE WDREPORTCOM.......................................................................................7
3.2 SAMPLE DATABASE ........................................................................................................................7
3.3 SAMPLES.........................................................................................................................................8
3.4 CREATING A REPORT PROGRAMMATICALLY...................................................................................9
3.5 CREATING A REPORT WITH WORDREPORT.EXE............................................................................10
CHAPTER 4 REPORT TEMPLATES ..............................................................................................12
4.1 ABOUT REPORTS ..........................................................................................................................12
4.2 ABOUT REPORT TEMPLATES.........................................................................................................12
4.3 WORD BASIC CONCEPTS...............................................................................................................12
4.3.1 Documents............................................................................................................................13
4.3.2 Headers and Footers............................................................................................................13
4.3.3 Tables...................................................................................................................................13
4.3.4 Bookmarks............................................................................................................................13
- I -
Page 3

4.3.5 Page Breaks.........................................................................................................................13
4.3.6 Graphics and Diagrams.......................................................................................................14
4.3.7 Inline Pictures and Floating Pictures..................................................................................14
4.3.8 Charts...................................................................................................................................14
4.3.9 Formatting...........................................................................................................................15
4.3.10 Fields .................................................................................................................................16
4.4 TABLE REPORTS ...........................................................................................................................17
4.4.1 About Table Reports.............................................................................................................17
4.4.2 Creating a Table for a Fixed Table Report..........................................................................17
4.4.3 Creating a Table for a Variable Table Report.....................................................................18
4.4.4 Formatting Cells..................................................................................................................19
4.4.5 Irregular Tables...................................................................................................................20
4.4.6 Referencing Cells.................................................................................................................21
4.4.7 Referencing Tables...............................................................................................................22
4.4.8 Formatting Cells for Pictures..............................................................................................23
4.5 FORM REPORTS.............................................................................................................................24
4.5.1 About Form Reports.............................................................................................................24
4.5.2 Creating Merge Fields or Quote Fields...............................................................................25
4.5.3 Defining Ranges...................................................................................................................26
4.5.4 Formatting Fields for Pictures.............................................................................................27
4.6 CHARTS ........................................................................................................................................28
4.6.1 About Charts........................................................................................................................28
4.6.2 Creating a Blank Chart using Microsoft Graph ..................................................................29
4.6.3 Creating a Blank Chart using Microsoft Excel....................................................................29
4.6.4 Referencing Charts ..............................................................................................................31
CHAPTER 5 API REFERENCE........................................................................................................33
5.1 OBJECTS .......................................................................................................................................33
5.1.1 WDReport Object.................................................................................................................33
- II -
Page 4

5.2 METHODS.....................................................................................................................................33
5.2.1 FixTableReport Method.......................................................................................................33
5.2.2 VarTableReport Method ......................................................................................................36
5.2.3 GroupTableReport Method..................................................................................................39
5.2.4 FormReport Method.............................................................................................................43
5.2.5 MSGraphChart Method.......................................................................................................47
5.2.6 ExcelChart Method..............................................................................................................49
5.2.7 SetDocVariable Method.......................................................................................................52
5.2.8 WordReport Method.............................................................................................................54
5.2.9 GetTableByIndex Method.....................................................................................................55
5.2.10 GetTableByBookmark Method...........................................................................................56
5.2.11 GetChartByIndex Method..................................................................................................56
5.2.12 GetChartByBookmark Method...........................................................................................57
5.3 EVENTS ........................................................................................................................................58
5.3.1 BeforeConnect Event............................................................................................................58
5.3.2 TemplateOpen Event............................................................................................................59
5.3.3 ReportComplete Event.........................................................................................................60
5.3.4 FunctionBeforeExectue Event..............................................................................................60
5.3.5 FunctionAfterExectue Event.................................................................................................61
5.3.6 FunctionProgress Event.......................................................................................................62
5.4 ERROR MESSAGES........................................................................................................................63
CHAPTER 6 WRF FILES...................................................................................................................65
6.1 USING WRF FILES........................................................................................................................65
6.1.1 About WRF files...................................................................................................................65
6.1.2 Using a WRF file with WDReport Object ............................................................................65
6.1.3 Using a WRF file in command line......................................................................................66
6.1.4 Creating a WRF file.............................................................................................................66
6.1.5 Using parameters.................................................................................................................67
- III -
Page 5

6.1.6 Converting files....................................................................................................................70
6.2 WRF FILE REFERENCE.................................................................................................................72
6.2.1 WRF File Format.................................................................................................................72
6.2.2 [Data Source] Section..........................................................................................................74
6.2.3 [FILE] Section.....................................................................................................................76
6.2.4 [PARAMETER] Section.......................................................................................................77
6.3 FUNCTION REFERENCE .................................................................................................................78
6.3.1 Fixed Table Report...............................................................................................................78
6.3.2 Variable Table Report..........................................................................................................81
6.3.3 Group Table Report.............................................................................................................84
6.3.4 Form Report.........................................................................................................................88
6.3.5 MSGraph Chart ...................................................................................................................91
6.3.6 Excel Chart ..........................................................................................................................93
6.3.7 DocVariable.........................................................................................................................95
6.3.8 ExecSQL...............................................................................................................................97
CHAPTER 7 ADVANCED REPORTS..............................................................................................99
7.1 EXECUTING MULTIPLE SQL STATEMENTS ....................................................................................99
7.2 USING FORMULA FIELDS ............................................................................................................102
7.3 SORTING, GROUPING AND TOTALING.........................................................................................104
7.3.1 Sorting data........................................................................................................................104
7.3.2 Totaling..............................................................................................................................105
7.3.3 Grouping data and Subreports...........................................................................................105
7.3.4 Subtotaling.........................................................................................................................106
7.4 PICTURES....................................................................................................................................107
7.4.1 Inserting pictures into a report template............................................................................107
7.4.2 Inserting pictures into a report..........................................................................................107
CHAPTER 8 HINTS AND TIPS.......................................................................................................109
- IV -
Page 6

CHAPTER 9 FORMAT EXPRESSIONS IN DATA CELLS.........................................................115
A.1 FORMATS FOR NUMERIC VALUES..............................................................................................115
A.2 FORMATS FOR STRING VALUES .................................................................................................119
A.3 FORMATS FOR DATE/TIME VALUES...........................................................................................120
CHAPTER 10 LICENSE AND SUPPORT ......................................................................................123
10.1 LICENSE....................................................................................................................................123
10.2 TECHNICAL SUPPORT................................................................................................................124
- V -
Page 7

Chapter 1 Introduction
1.1 Overview
WDReportCom is a solution that generates reports using Microsoft Word.
Using Microsoft Word and WDReportCom, you can create all kinds of reports
quickly and easily. WDReportCom includes an ActiveX DLL and an
executable file that can be used to develop your applications. It will
significantly accelerate your application development.
WDReportCom is a template-based solution. To create a report, you need to
create a report template file first. The report template file is a Microsoft Word
document that defines the layouts and formats of a report. WDReportCom
retrieves data from data source and fills data into Word documents.
1.2 Features
WDReportCom includes the following features:
Using Microsoft Word as your reporting tool
Just use Microsoft Word as your reporting tool. You design reports like layouts,
formats and styles directly using Microsoft Word. And you will get reports in
Microsoft Word spreadsheet format as a result. Microsoft Word is powerful,
flexible and familiar. You do not need to buy and learn extra reporting tools.
Making report template directly using Microsoft Word
The main advantage of using WDReportCom is based on the fact that all
formatting is done directly in Microsoft Word. You can take full advantage of
Microsoft Word including text formatting, tables, fields, pictures and graphics,
drawing, page setup, headers and footers, preview and printing, VBA, macros,
- 1 -
Page 8

and more.
Accessing to databases using SQL
WDReportCom executes SQL statements to extract data from database.
Supports all type SQL: DML, DDL and DCL. Multiple SQL statements can be
executed in one report building process. You can perform queries on
databases, insert data into databases, and create database objects like tables.
The power of SQL can be harnessed for maximum efficiency in reporting.
Using ADO to access and manipulate data sources
Using ADO, WDReportCom can access and manipulate a wide variety of data
sources such as Oracle, DB2, Sybase, Informix, Microsoft SQL Server,
Teradata, MySQL, Microsoft Access, dBase.
Integrating Microsoft Word into your application
WDReportCom includes an ActiveX DLL for building application. Developers
can save time and meet their users’ needs by integrating the report
processing power of WDReportCom into their applications.
Command line program
WDReportCom includes a command line program WordReport.exe. You can
use the program to create reports too. It does not require programming. It is
enough if you know how to use Microsoft Word and how to write SQL.
Various reporting capabilities
WDReportCom provides various reporting capabilities including sorting data,
grouping data, subreports, totaling and summarizing data, formatting, charting
and pictures. It is easy to create simple reports, and, you can create complex
reports.
- 2 -
Page 9

Chapter 2 Installation and Startup
2.1 Software Requirements
Microsoft Windows 95, Windows 98, Windows NT, Windows 2000, Windows
XP, Windows 2003, Windows Vista or later.
Microsoft Office 97/98, Office 2000, Office XP, Office 2003 or later.
2.2 Installing WDReportCom
Run the installation program, and follow the instructions to complete
WDReportCom installation. For Windows Vista, the data folder should be
different from the application folder.
If you don’t have Microsoft Office installed, please install it first.
If your environment is Windows 95/98 and Office 97, and you don’t have
VB6.0 run-time files installed, please install it. For Windows 2000, Windows
XP, Windows 2003 and Office 2000 or later, you do not need to install VB6.0
run-time files because they are included in OS and Office. To install VB6.0
run-time files, just run vbrun60sp5.exe, and follow the instructions.
If you don’t have ODBC Driver installed for the database you want to access,
please install it.
If your OS is Windows 95/98 and you don’t have Microsoft Data Access
Components 2.0 (MDAC_TYP) or later installed, please install it. For Windows
2000, Windows XP and Windows 2003, you do not need to install MDAC_TYP
because it is preinstalled in OS. To install MDAC_TYP, just run mdac_typ.exe,
and follow the instructions.
- 3 -
Page 10

2.3 Uninstalling WDReportCom
1. Double-click the Add/Remove Programs icon in the Windows Control
Panel.
2. Do one of the following:
For Windows 2000, Windows XP and Windows 2003 Edition:
Click WDReportCom in the Currently installed programs box, and then
click the Change/Remove button.
For Windows 98 and Windows NT 4.0:
Click WDReportCom on the Install/Uninstall tab, and then click the
Add/Remove button.
3. Follow the instructions on the screen to complete uninstalling the program.
2.4 WDReportCom.dll
WDReportCom.dll is an ActiveX DLL that provides WDReport object. You can
write a program to work with the object. Before you can use the WDReport
object, you must create a reference to the object. And you should create
references to Microsoft Word and Microsoft Graph Object Library too.
To create a reference to the WDReport object
1. Do one of the following:
For Visual Basic 6.0
From the Project menu, choose References.
For Microsoft Word Visual Basic For Application
From the Tools menu, choose References.
2. In the References dialog box, select WDReportCom.
3. You can use the Browse button to search for WDReportCom.dll.
4. In the References dialog box, Select Microsoft Word and Microsoft Graph
Object Library to create their references.
- 4 -
Page 11

5. Declare an object variable of the object's class.
Dim wdrpt As WDReport
6. Assign an object reference to the variable by using the New keyword in a
Set statement.
Set wdrpt = New WDReport
2.5 WordReport.exe
WordReport.exe is an executable program that developed using
WDReportCom.dll. It likes WDReportGen command line and can read a WRF
file to create a Word report. The syntax of command is:
wordreport <wrf file name> [-D] [-U1 user1] [-P1 pwd1] … [-U10 user10]
[-P10 pwd10] [pa1 pa2 … pa10]
wrf file name Specifying a WRF (.wrf) file that tells WDReportCom how to
get data from data sources and how to put data into a report.
-D Display the generated report with Microsoft Word.
-U1 user1 …
-U10 user10
-P1 pwd1 ...
-P10 pwd10
pa1 … pa10 The values of the parameters defined in the WRF file. You can
Specify the user names. user1 is the user name of the first
data source. user2 is the user name of the second data
source……
Specify the passwords. pwd1 is the password of the first data
source. pwd2 is the password of the second data source……
use parameters in SQL statements. WDReportCom will
replace the names of the parameters in a SQL statement with
the actual values before it executes the SQL statement. You
can use no more than 10 parameters in one report.
For example, you have defined two parameters in your WRF file. The first
parameter is the sales date, and the second is the category of the product.
You can run WordReport.exe as follows:
wordreport c:\wordreport\myreport.wrf 1996-05-01 “Dairy Products”
- 5 -
Page 12

2.6 Run-Time Files
You can distribute royalty-free the run-time files of WDReportCom with your
applications. The run-time files are files your application must have in order to
work correctly after installation. The following are the run-time files you need
to distribute:
File Description
wdreportcom.dll The WDReportCom ActiveX DLL. It must be registered.
wconv.cfg The file contains the information of the file format. If you
are using WordReport method to convert files, you should
include it and copy it to the same directory as
wdreportcom.dll.
scrrun.dll Microsoft script runtime. WDReportCom used some
functions in this file. It should be copied to Windows
System directory, and must be registered.
To register a DLL file, use regsvr32.exe. For example,
regsvr32.exe /s “C:\Program Files\LJZsoft\WDReportCom\WDReportCom.dll”
- 6 -
Page 13

Chapter 3 Quick Start
3.1 Learning how to use WDReportCom
You can teach yourself how to use WDReportCom by choosing from the
methods available in this section:
You can study the samples included with WDReportCom.
You can use the detailed descriptions and instructions in this document.
3.2 Sample Database
WDReportCom comes with Sample.mdb, a sample database you can use
when learning the program. Sample.mdb is a Microsoft Access database.
Virtually all of the examples in this manual are based on Sample.mdb data.
The sample reports access the sample database through the ODBC data
source name “Report Sample”. When you install WDReportCom, you can
choose to add the ODBC data source name. And you also can add the ODBC
data source name manually.
To create the System DSN “Report Sample”, do as follows:
1. Click the Windows Start button, choose Settings, and then click Control
Panel.
2. On computers running Microsoft Windows 2000 or later, double-click
Administrative Tools, and then double-click Data Sources (ODBC). The
ODBC Data Source Administrator dialog box appears. On computers
running previous versions of Microsoft Windows, double-click 32-bit ODBC or
ODBC.
3. Select the System DSN tab, and then press Add button.
4. Choose Microsoft Access Driver (*.mdb), then press Finish button.
- 7 -
Page 14

5. In the ODBC Microsoft Access Setup dialog box, type Report Sample in
the Data Source Name box.
6. Press the Select button, and browse to select Sample.mdb.
7. Press OK button to close the ODBC Microsoft Access Setup dialog box.
8. Press OK button to close the ODBC Data Source Administrator dialog
box.
3.3 Samples
After WDReportCom is installed, some samples are installed too. Use these
samples to learn WDReportCom.
The samples include a sample database, VB sample programs, VBA sample
programs and sample reports. They are located in the Application
Data\LJZsoft under All Users or your profile folder. WDReportCom was tested
with Microsoft Office 2007. Please download the sample reports for Microsoft
Office 2007 from our website.
Directory Description
{data}\Common\SampleDatabase Contains the sample database
“Sample.mdb”.
{data}\WDReportCom\Samples\WordReport Contains the report template
files (.doc) and the WRF files
(.wrf).
{data}\WDReportCom\Samples\VB Contains the sample programs
for VB6.0.
{data}\WDReportCom\Samples\VBA Contains the sample programs
for Microsoft Word VBA.
{data} is the path of the data folder. You can select the data folder when you
install WDReportCom. By default, the data folder is the Application
Data\LJZsoft folder under All Users. If you install WDReportCom without
administrative privileges, the data folder is the Application Data\LJZsoft folder
under the current user. The data folder is usually at:
- 8 -
Page 15
Windows 95/98: C:\windows\All Users\Application Data\LJZsoft
Windows NT: C:\WinNT\Profiles\All Users\Application Data\LJZsoft
Windows 2000/XP: C:\Documents and Settings\All Users\Application
Data\LJZsoft
Windows Vista: C:\ProgramData\LJZsoft
3.4 Creating a Report Programmatically
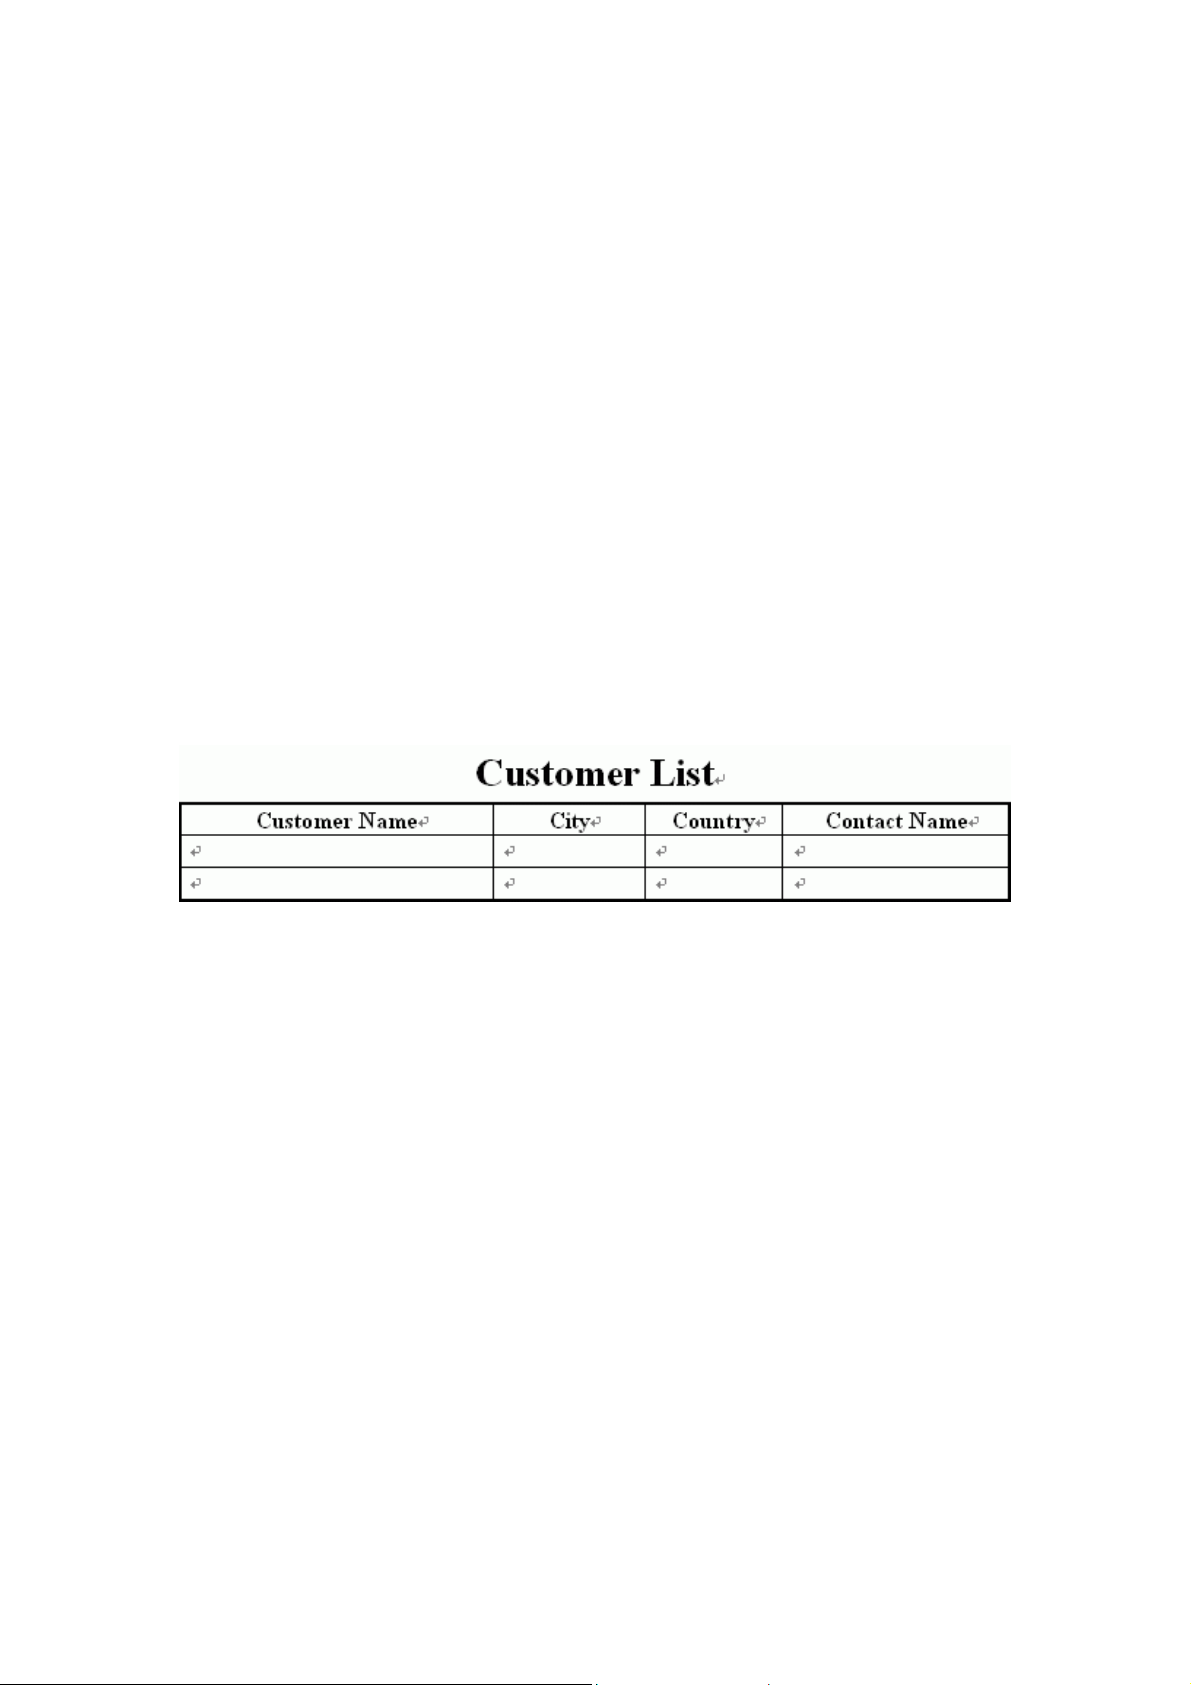
1. Create a template
In Microsoft Word, create a report template file named “custlist.doc”. Static
values and any Word features included in the template will be included in the
generated report. The template file you have created as follows:
2. Write the code in your application.
Set con = New ADODB.Connection
Set rec = New ADODB.Recordset
con.ConnectionString = "Data Source=Report Sample"
con.Open
strSQL = "SELECT CompanyName, CityName, CountryName,
ContactName FROM Customers, Cities, Countries WHERE
Customers.CityCode = Cities.CityCode AND Customers.CountryCode =
Cities.CountryCode AND Customers.CountryCode = Countries.CountryCode
ORDER BY CompanyName, CityName, CountryName"
rec.Open strSQL, con
wdrpt.VarTableReport Recordset:=rec, Table:=wdTable, CellList:="A2",
Reserve:=2
- 9 -
Page 16
rec.Close
3.5 Creating a Report with WordReport.exe
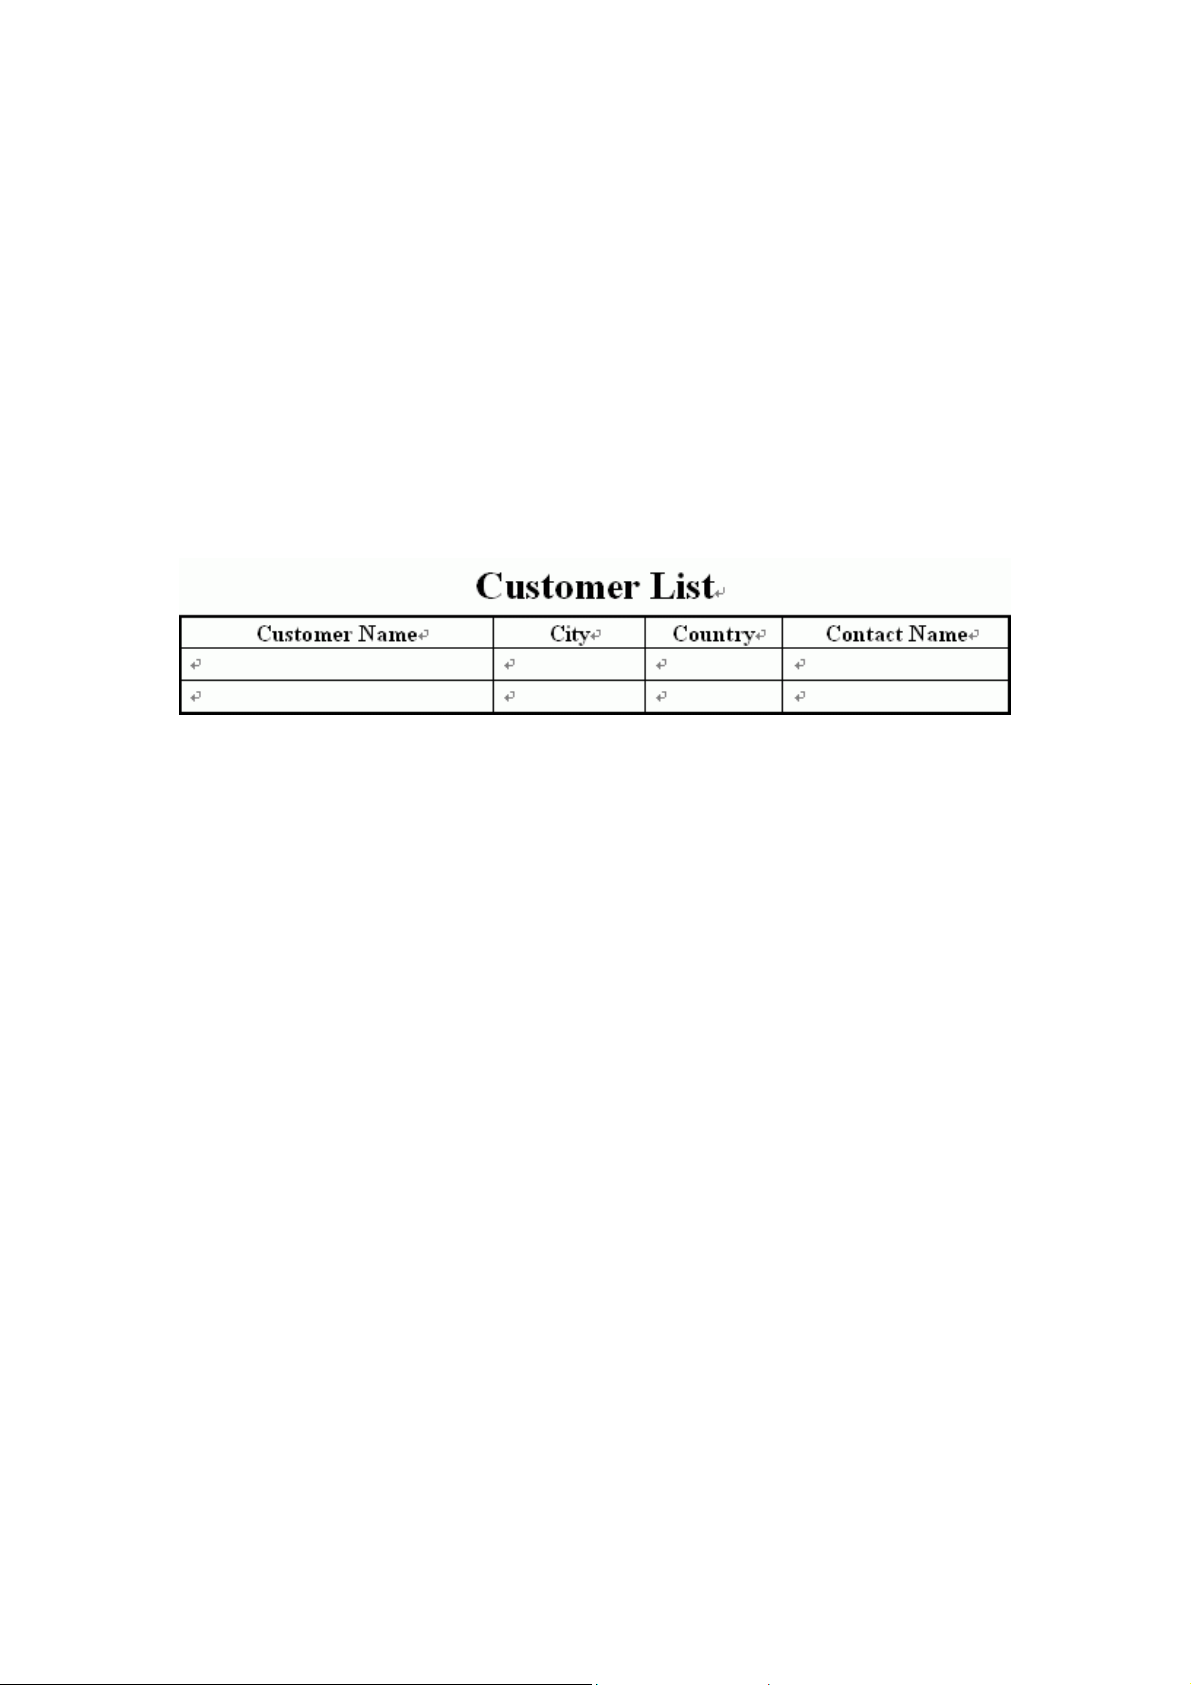
1. Create a template
In Microsoft Word, create a report template file named “custlist.doc”. Static
values and any Word features included in the template will be included in the
generated report. The template file you have created as follows:
2. Create a WRF file
Create a WRF file named “custlist.wrf” using WDReportGen or a text editor.
The following is the content of the WRF file.
WordReport Version 2.0
[Data Source]
Name1=Report Sample
[File]
ReportTemplateFileName=custlist.doc
ReportFileName=Report\custlist.doc
LogFileName=Log\custlist.log
[SQL]
@F1=Report(table=1 cell=A2 reserve=2)
SELECT CompanyName
,CityName
- 10 -
Page 17

,CountryName
,ContactName
FROM Customers, Cities, Countries
WHERE Customers.CityCode = Cities.CityCode
AND Customers.CountryCode = Cities.CountryCode
AND Customers.CountryCode = Countries.CountryCode
ORDER BY CompanyName,CityName,CountryName
3. Run WordReport.exe
wordreport c:\report\custlist.wrf
- 11 -
Page 18

Chapter 4 Report Templates
4.1 About Reports
The report generated by WDReportCom is a Microsoft Word document. The
layouts, formats and styles of the report are defined by a report template, and
the data of the report are got from databases such as Oracle, DB2.
4.2 About Report Templates
To make a report using WDReportCom, you should create a report template
first. The report template is a Microsoft Word document that defines the
layouts, formats and styles of the report. In the Microsoft Word report template,
you can input static content such as titles, descriptions, comments, a cover, a
company logo, format the static content, and define the format of the data you
will get from databases.
WDReportCom will generate the report based on the report template file. All
static contents and the layouts, formats and styles defined in the report
template file will be brought to the final report file.
4.3 Word Basic Concepts
If you have known these concepts of Microsoft Word, please skip this section.
For more detail information about Microsoft Word, refer to Microsoft Word
Help.
- 12 -
Page 19

4.3.1 Documents
A document is a Microsoft Word file with extension .doc. You can open and
save it using Microsoft Word. Microsoft Word documents may contain a
combination of text, formatting and graphics.
4.3.2 Headers and Footers
Headers and footers are areas in the top and bottom margins of each page in
a document. You can insert text or graphics in headers and footers - for
example, page numbers, the date, a company logo, the document's title or file
name, or the author's name - that are printed at the top or bottom of each
page in a document.
4.3.3 Tables
A table is made up of rows and columns of cells that you can fill with text and
graphics. Tables are often used to organize and present information. You can
set borders, shading, alignment and fonts in tables.
4.3.4 Bookmarks
A bookmark identifies a location or selection of text that you name and identify
for future reference. For example, you might use a bookmark to identify text
that you want to revise at a later time.
4.3.5 Page Breaks
When you fill a page with text or graphics, Microsoft Word inserts an
automatic page break and starts a new page. To force a page break at a
specific location, you can insert a manual page break.
- 13 -
Page 20

4.3.6 Graphics and Diagrams
There are two basic types of graphics that you can use to enhance your
Microsoft Word documents: drawing objects and pictures.
Drawing objects include AutoShapes, diagrams, curves, lines, and WordArt
drawing objects. These objects are part of your Word document. Use the
Drawing toolbar to change and enhance these objects with colors, patterns,
borders, and other effects.
Pictures are graphics that were created from another file. They include
bitmaps, scanned pictures and photographs, and clip art. You can change and
enhance pictures by using the options on the Picture toolbar and a limited
number of options on the Drawing toolbar. In some cases, you must ungroup
and convert a picture to a drawing object before you can use the Drawing
toolbar options.
4.3.7 Inline Pictures and Floating Pictures
Inline picture: A graphic or other object that is positioned directly in the text of
a Microsoft Word document at the insertion point.
Floating picture: A graphic or other object that is inserted in the drawing layer
so that you can position it precisely on the page or in front of or behind text or
other objects.
4.3.8 Charts
Charts are visually appealing and make it easy for users to see comparisons,
patterns, and trends in data. You can create a chart in a Microsoft Word
document using Microsoft Graph or Microsoft Excel. When you create a new
chart in Word, Microsoft Graph or Microsoft Excel opens and a chart is
displayed with its associated data in a data sheet or worksheet.
- 14 -
Page 21

4.3.9 Formatting
You can use these formatting features of Microsoft Word to effectively display
your data.
Characters formatting
To make text stand out, you can format the text in selected characters. You
can set font, color, size of text, bold and italic formats, animate or highlight the
text.
Paragraphs formatting
You can set text alignment, tab stops, line spacing, spacing before or after
paragraphs, and borders.
Bulleted and numbered lists
Bulleted and numbered lists in Microsoft Word are easy to create. You can
quickly add bullets or numbers to existing lines of text, or Microsoft Word can
automatically create lists as you type.
Borders, Shading, and Graphic Fills
Borders, shading, and graphic fills can add interest and emphasis to various
parts of your document. You can add borders to pages, text, tables and table
cells, graphic objects, pictures, and Web frames. You can shade paragraphs
and text. You can apply colored or textured fills to your graphic objects.
Automatic formatting
By using AutoFormat, you can quickly apply formatting such as headings,
bulleted and numbered lists, borders, numbers, symbols, and fractions to your
text. You can automatically format a document either as you type or after
you've written it. In both cases, you can control which automatic changes
Microsoft Word makes. You can also turn off automatic formatting.
Style
A style is a set of formatting characteristics that you can apply to text, tables,
- 15 -
Page 22

and lists in your document to quickly change their appearance. When you
apply a style, you apply a whole group of formats in one simple task.
For example, instead of taking three separate steps to format your title as 16
pt, Arial, and center-aligned, you can achieve the same result in one step by
applying the Title style.
4.3.10 Fields
Fields
Fields are used as placeholders for data that might change in a document and
for creating form letters and labels in mail-merge documents. Microsoft Word
inserts fields when you use particular commands, such as the Date and Time
command on the Insert menu. You can also manually insert your own fields by
using the Field command on the Insert menu. Field codes appear between
curly brackets, or braces ( { } ). Fields are somewhat like formulas in Microsoft
Excel — the field code is like the formula, and the field result is like the value
that the formula produces. You can switch between displaying field codes and
results in your document.
(Formula) fields
(Formula) field calculates a number by using a mathematical formula. You can
insert an (Formula) field in a table or in regular text. Computation in tables can
be completed using (Formula) fields, such as add, subtract, multiply, divide,
sum. Syntax:
{ = Formula [Bookmark ] [\# Numeric Picture ] }
DocVariable field
DocVariable field defines a document variable. Each document has a
collection of variables, which can be added and referenced by the Microsoft
Visual Basic for Applications programming language. This field provides a way
to display the contents of the document variables in the document. Syntax:
- 16 -
Page 23

{ DOCVARIABLE "Name" }
Inserts the string assigned to a document variable. “Name” is the name of the
document variable.
4.4 Table Reports
4.4.1 About Table Reports
A table is made up of rows and columns of cells that you can fill with text and
graphics. Tables are often used to make reports, and organize and present
information.
WDReportCom supports two types of table reports: fixed table report, variable
table report.
Fixed table report: The number of rows and columns in the table is fixed.
When WDReportCom executes a SQL statement, directly puts the result data
into cells in the table.
Variable table report: The number of rows or columns in the table is unfixed,
and it is variable as the number of result records. When WDReportCom
executes a SQL statement, it repeats the table rows or columns for each
record or group, and then puts data into cells of the table.
4.4.2 Creating a Table for a Fixed Table Report
For a fixed table report, you need to create a table in the report template file
according to the report. The format of the table is the same as the format in
the report, but cells that should be filled data into are blank. When
WDReportCom executes a SQL statement, the data values from data source
will be filled into these cells.
- 17 -
Page 24

BA
BA
1
1
2
2
3
3
BA
BA
3.4141
3.4141
5.2202
5.2202
2.783
2.783
The fixed table defined
in the report template file
The fixed table filled data
by rows in the re port file
4.4.3 Creating a Table for a Variable Table Report
For a variable table report, you also need to create a table in the report
template file according to the report. But you just need to reserve some
rows/columns in the table for one or two records. WDReportCom will add
some rows/columns according to the number of the records returned from
data source.
SalesItem IdDate
SalesItem IdDate SalesItem IdDate
SalesItem IdDate
1503 1998-01-01
1503 1998-01-01
2003 1998-01-02
2003 1998-01-02
2503 1998-01-03
2503 1998-01-03
3503 1998-01-05
3503 1998-01-05
5503 1998-01-10
5503 1998-01-10
1503 1998-01-21
1503 1998-01-21
2003 1998-01-25
2003 1998-01-25
1003 1998-01-31
1003 1998-01-31
The variable-rows tab le defined
in the report template file
One record from data source can be put into two or more rows/columns. To
do this, you need to create a repeat range that includes two or more
rows/columns.
The format of the last row/column border can be different from the others. For
- 18 -
The variable-rows table filled data
by rows in the report file
Page 25

example, the outside borders used double lines, and the inside borders used
single lines. To do this, you should reserve the blank rows/columns for 2
records. When WDReportCom inserts some blank rows/columns, the new
rows/columns will inherit the format of the first row/column in the reserved
rows/columns.
WDReportCom will repeat the range for each record. Ranges can be nested.
The inside range is the detail range for detail record, and the external range is
the group range for group. WDReportCom will repeat the inside range for
each record, and repeat the group range for each group.
4.4.4 Formatting Cells
To format cells that contain static contents, use “Format” menu in Microsoft
Word. To format cells that contain (Formula) fields, use the switches of fields
in Microsoft Word. For more detail information, refer to Microsoft Word Help.
For cells in which data are got from database, you can set font, color,
alignment using Microsoft Word. But to display values in formatting string, you
should use other way.
You should write formatting expressions into data cells in the report template
file. WDReportCom will get the text of the cell as a format expression before it
puts a value into a cell, and output the value using the format expression. In
fact, WDReportCom calls the format function in Visual Basic. The text got
from a cell is used as the format expression in format function. For a variable
table report, WDReportCom will use the format expressions in the reserved
rows/columns. For more information about format expression, refer to “Format
Expression in Data Cells”.
- 19 -
Page 26

AmountQuantityDate
AmountQuantityDate
#,##0.00#,##0yyyy-mm-dd
#,##0.00#,##0yyyy-mm-dd
#,##0.00#,##0yyyy-mm-dd
#,##0.00#,##0yyyy-mm-dd
#,##0.00#,##0yyyy-mm-dd
#,##0.00#,##0yyyy-mm-dd
AmountQuantityDate
AmountQuantityDate
827.795601999-02-18
827.795601999-02-18
1,113.058901999-06-14
1,113.058901999-06-14
1,552.251,2402000-01-21
1,552.251,2402000-01-21
The table defined in the report template file The table generated in the report file
A format expression for numbers can have from one to four sections
separated by semicolons. You can define the different formats and colors for
positive values, negative values and zeros.
For example, the format "$#,##0;($#,##0)" has two sections: the first defines
the format and color (black) for positive values and zeros; the second section
defines the format and color (red) for negative values. It displays “2345.12” as
“$2,345”, displays “-5432” as “($5,432)”.
The format “#,##0.00;;” has three sections: the first defines the format and
color (black) for positive values, the second defines the format and color (red)
for negative values, the third section defines the format and color (blue) for
zeros. Note, the first semicolon “;” is red, the second semicolon “;” is blue.
The negative values and zeros are printed using the format of the positive
value. But the color for negative values is red, the color for zeros is blue. It
displays “8.9” as “8.90”, displays “-123” as “-123.00”, and displays “0” as
“0.00”.
4.4.5 Irregular Tables
Tables don't have to consist of simple grids. Not every row has to have the
same number of columns. You can merge and split cells to create irregular
tables. An irregular table is the table that contains split cells or merge cells,
and it does not have the same number of cells for each row or column. While
an irregular table provides for an attractive way to display data, but it does
make it harder to process the document. You have some difficulty to reference
- 20 -
Page 27

a cell in an irregular table. For example in the following table, for most Office
version, cell1 is in column 3 and row 2, cell2 is in column 3 and row 3. But for
some lower Office version, cell2 is in column 2 and row 3. Moreover, an error
may occur when you try to work with some rows or columns in an irregular
table.
CBA
CBA
Cell1
Cell1
Cell2
Cell2
Irregular table
To simplify your work and ensure that report function can be executed
correctly, you should regularize the irregular tables. Split the merge cells, and
remove the border in these cells. For example, the following table is a
regularized table, cell1 is in column 3 and row 2, and cell2 is in column 3 and
row 3.
CBA
CBA
Cell1
Cell1
Cell2
Cell2
Regularized table
4.4.6 Referencing Cells
You can reference table cells as A1, A2, B1, B2, and so on, with the letter
representing a column and the number representing a row. Cell references in
Microsoft Word are always absolute references and are not shown with dollar
signs. You can reference an entire row or column in a calculation in the
following ways:
Use a range that includes only the letter or number that represents it - for
example, 1:1 to reference the first row in the table. This designation allows
the calculation to automatically include all the cells in the row if you decide
- 21 -
Page 28

to add other cells later.
Use a range that includes the specific cells - for example, a1:a3 to
reference a column with three rows. This designation allows the
calculation to include only those particular cells. If you add other cells later
and you want the calculation to include them, you need to edit the
calculation.
Unfortunately, there is no inherent capability of Microsoft Word to inform you
of the reference of a cell you have selected. You can get around this problem
by using a macro. In the sample file “monthly_sales.doc”, there is a macro
called “CellRef”. The macro can tell you the table number and the cell
reference. When you position the insertion pointer in a table cell and then run
the macro, it displays a message box that shows the table number and the
cell reference of the current cell. You can copy the macro “CellRef” into your
documents. It is easy for you to reference a cell.
4.4.7 Referencing Tables
You can reference a table by an index number or a bookmark. The index
number represents the position of the table in a document. The index number
starts at 1. So table 1 is the first table in a document, table 2 is the second
table, and so on. You can reference a nested table inside a table by an index
number like 2-1-2. Table 2-1 is the first table inside table 2, and table 2-1-2 is
the second table inside table 2-1. The max nested level WDReportCom
supports is 3. In the sample file “monthly_sales.doc”, there is a macro called
“CellRef”. The macro can tell you the index number of a table. When you
position the insertion pointer in a table cell and then run the macro, it displays
a message box that shows the table number and the cell reference of the
current cell.
You can reference a table by the bookmark too. If you add a bookmark in a
- 22 -
Page 29

table, you can reference the table using the bookmark. If you want to
reference a nested table inside a table, you must add the bookmark in the
nested table. It is very useful if you do not know the number of tables. To add
a bookmark in a table, do as follows:
1. Click in the upper-left cell in the first row of the table, and place the insertion
point before the text.
2. On the Insert menu, click Bookmark.
3. Under Bookmark name, type or select a name.
Bookmark names must begin with a letter and can contain numbers. You can't
include spaces in a bookmark name.
4. Click Add.
Note: Microsoft Word 97 or lower does not support the nested tables.
4.4.8 Formatting Cells for Pictures
To enhance the visual impact of your report, you can insert pictures into your
report. WDReportCom supports many popular graphics file formats: bitmap,
JPG, GIF, PNG, TIFF and so on. For the graphics file formats WDReportCom
supports, refer to Microsoft Word Help.
You should store the path and name of the graphics files in the database, and
identify the image fields in the report function. WDReportCom will read the
graphics files, and insert them into the cells in the report file. You can adjust
the position of the pictures by changing the cell margins.
To specify the inserted way, text wrapping style and size, you should write a
formatting expression into the cell in the report template file. WDReportCom
will get the text of the cell, and insert a picture into the cell according to the
instruction in the format expression. The format expression for pictures as
follows:
[wrapstyle] [size]
- 23 -
Page 30

The wrapstyle specifies the inserted way and text wrapping style, and can be
one of the following values. The default value is NONE. “NONE” means
floating pictures.
Values Description
INLINE Inline picture
NONE Floating picture, none text-wrapping style
SQUARE Square text-wrapping style
THROUGH Through text-wrapping style
TIGHT Tight text-wrapping style
TOPBOTTOM TopBottom text-wrapping style
The size specifies the size of a picture. Possible values are STRETCH, Wnnn
or / and Hnnn. "STRETCH" means that the picture is resized to fit within the
cell. “W100” means that the width of the picture is set to 100 points. “H50”
means that the height of the picture is set to 50 points. The default means the
original size. If you just specify the width or height of the picture, not both,
WDReportCom will retain the original proportions of the picture when
WDReportCom resize it.
Example
inline w120 h90
Remarks
WDReportCom will insert an inline picture, and set the width of the picture to
120 points, the height to 90 points.
Note: On Microsoft Word 97 or lower version, it may not work correctly if you
insert a floating picture into a table. And it will split the table under some text
wrapping style. You should insert inline pictures into a table.
4.5 Form Reports
4.5.1 About Form Reports
Beside table reports, WDReportCom supports form reports too. For a form
- 24 -
Page 31

report, you can get data from data sources, and put data as text, list, title and
table in the report file. So you can make a form report as follows:
4.5.2 Creating Merge Fields or Quote Fields
The report template file of a form report must contain merge fields or quote
fields where data values will be inserted. A field can be created in text, list,
title, table or other. When WDReportCom is run, it will replace the merge fields
or quote fields with values from data source.
To create a merge field or quote field:
1. Click where you want to insert a field.
2. On the Insert menu, click Field.
3. From the Field names list, select MergeField or Quote.
4. In the Field name text box, enter a name for the merge field or quote field.
For example, enter ProductName. Remember the field name, you will use it in
the report function.
You can show field codes, and edit the field codes. To switch between field
codes and results, do one of the following:
To show or hide the field code for a specific field, click the field or the field
results, and then press SHIFT+F9.
To show or hide field codes for all fields in the document, press ALT+F9.
If the data value is a number, date or time, and you want to display it in a
- 25 -
Page 32

custom format, use the switches of fields like “\#” or “\@”. For more detail
information, refer to Microsoft Word Help.
4.5.3 Defining Ranges
A range represents a contiguous area in a document, and contains text, lists,
tables, table rows or paragraphs. When WDReportCom generates a report, it
will repeat the range for each record or group.
A range can be defined by a Word bookmark. Or the entire document will be
defined as the default range.
To define a range with a bookmark:
1. Create a document as your report template. For example, you create a
template as follows:
2. Select the range that you want to define as a repeat block. For example,
you select a table row.
3. On the Insert menu, click Bookmark.
4. Under Bookmark name, enter a bookmark name and click Add. For
example, enter Product.
In Microsoft Word, bookmarks are hidden by default. To show bookmarks:
1. On the Tools menu, click Options, and then click the View tab.
2. Select the Bookmarks check box.
3. The bookmark appears in brackets ([…]) on the screen.
Ranges can be nested. The inside range is for detail record, and the external
- 26 -
Page 33

range is for group. For example, you defines a bookmark Category for the
group of product category, and a bookmark Product for the detail record of
product.
4.5.4 Formatting Fields for Pictures
To enhance the visual impact of your report, you can insert pictures into your
report. WDReportCom supports many popular graphics file formats: bitmap,
JPG, GIF, PNG, TIFF and so on. For the graphics file formats WDReportCom
supports, refer to Microsoft Word Help.
You should store the path and name of the graphics files in the database, and
identify the image fields in the report function. WDReportCom will read the
graphics files, and insert them into the fields in the report file.
To specify the inserted way, text wrapping style and the size, you should write
a formatting expression in the field switch “\#” in the report template file.
WDReportCom will get the format string in the field switch “\#”, and insert a
picture according to the instruction in the format expression. The format
expression for pictures as follows:
[wrapstyle] [size]
The wrapstyle specifies the inserted way and text wrapping style, and can be
one of the following values. The default value is INLINE. “INLINE” means
inline pictures.
Values Description
- 27 -
Page 34

INLINE Inline picture
NONE Floating picture, none text-wrapping style
SQUARE Square text-wrapping style
THROUGH Through text-wrapping style
TIGHT Tight text-wrapping style
TOPBOTTOM TopBottom text-wrapping style
The size specifies the size of a picture. Possible values are Wnnn or / and
Hnnn. “W100” means that the width of the picture is set to 100 points. “H50”
means that the height of the picture is set to 50 points. The default means the
original size. If you just specify the width or height of the picture, not both,
WDReportCom will retain the original proportions of the picture when
WDReportCom resize it.
Example
/# “square w84”
Remarks
On the supposition that the original picture is size 144 x 168 points.
WDReportCom will insert a floating picture, apply the square text-wrapping
style, set the height of the picture to 72 points, and the width to 84 points.
4.6 Charts
4.6.1 About Charts
You can create many different types of charts in Microsoft Word. The chart
software may be Microsoft Graph or Microsoft Excel. It is depended on the
version of your Microsoft Word. For Microsoft Word 2003 or earlier, the default
chart software is Microsoft Graph. For Microsoft Word 2007 or later, the
default chart software is Microsoft Excel.
WDReportCom supports two kinds of charts created by Microsoft Graph or
Excel. It executes a SQL statement, and puts the result data into the
datasheet or worksheet of the chart. To work with charts created in Graph or
- 28 -
Page 35

Excel, you must have Graph or Excel installed.
4.6.2 Creating a Blank Chart using Microsoft Graph
To create a Graph chart in the report using WDReportCom, you need to add a
Graph chart in the report template file first. The chart will be brought into the
report file with the same chart type, display option, data format, label format
and other chart item
If your Microsoft Office is earlier than Office 2007, or Microsoft Excel 2007 is
not installed, when you create a new chart in Microsoft Word, Microsoft Graph
opens.
To add a Graph chart in the template file:
1. Open the report template file using Microsoft Word.
2. On the Insert menu, click Chart.
3. Change the sample data on the datasheet as you need.
4. Modify the chart. For example, you want to change the chart type, make the
text larger, or change colors, patterns, lines, fills, and borders in charts.
5. After you have finished the modification, delete data from the chart. You
should keep a blank chart in the report template file. WDReportCom will put
data into the datasheet of the chart.
6. Change the chart to an inline shape if it is a floating shape. On the Format
menu, click Object, click the Layout tab, and then click In Line text-wrapping
style.
For more detail information, refer to Microsoft Word Help and Microsoft Graph
Help.
4.6.3 Creating a Blank Chart using Microsoft Excel
To create an Excel chart in the report using WDReportCom, you need to add
an Excel chart object in the report template file first. The chart will be brought
- 29 -
Page 36

into the report file with the same chart type, display option, data format, label
format and other chart item.
To add an Excel chart in the template file:
1. Open the report template file using Microsoft Word.
2. Insert a chart with a chart sheet and a worksheet. For more information to
insert an Excel chart object in Microsoft Word, please refer to the following
part.
3. Change the sample data on the worksheet as you need.
4. Modify the chart. For example, you want to change the chart type, make the
text larger, or change colors, patterns, lines, fills, and borders in charts.
If the report type is fix, the data range of the chart should be all
rows/columns for the returned records.
If the report type is var, the data range of the chart should be 2
rows/columns.
5. After you have finished the modification, delete data from the chart. You
should keep a blank chart in the report template file, and make the chart sheet
active. WDReportCom will put data into the worksheet of the chart.
6. Change the chart to an inline shape if it is a floating shape. On the Format
menu, click Object, click the Layout tab, and then click In Line text-wrapping
style.
By default, Microsoft Word 2007 uses Microsoft Excel to create charts, but
doesn't expose the chart as a normal Excel object. There are two ways to
create Excel chart object.
The first way for Microsoft Word 2007: Create a chart in Microsoft Excel, and
copy it into Microsoft Word as an Excel chart object.
1. Open Microsoft Word and Microsoft Excel.
2. In Microsoft Excel, create a chart, and move the chart to a new worksheet.
3. In Microsoft Excel, click on the chart, and copy the chart.
- 30 -
Page 37

4. Switch to Microsoft Word, place the insertion point where you want to
create the chart.
5. On the Home tab, in the Clipboard group, click Paste Special and choose
Microsoft Office Excel Chart Object. And click OK button.
The second way for Microsoft Word 2007: Insert an Excel worksheet in
Microsoft Word, and create a chart in the Excel worksheet object.
1. In Microsoft Word, place the insertion point where you want to create the
chart.
2. On the Insert tab, in the Tables group, click Table, and then click Excel
Spreadsheet. You will see an Excel worksheet object.
3. Right-click the object, point to Worksheet Object on the shortcut menu,
and choose Open from the submenu. Microsoft Excel will appear.
4. Create a chart in Microsoft Excel, and move the chart to a new worksheet.
5. When you've finished, choose Close & Return from the File menu.
For Microsoft Word 2003 or earlier, you can import Excel charts object.
1. In Microsoft Word, place the insertion point where you want to create the
chart.
2. Click Object on the Insert menu, and then select the Microsoft Excel
Chart.
3. You can work the Excel chart object by right-clicking the object, and
pointing to Worksheet Object on the shortcut menu, and choosing Open
from the submenu.
4. When you've finished, choose Close & Return from the File menu.
For more detail information, refer to Microsoft Word Help and Microsoft Excel
Help.
4.6.4 Referencing Charts
You can reference a chart by an index number or a bookmark. The index
- 31 -
Page 38

number represents the position of the chart in a document. The index number
starts at 1. So chart 1 is the first chart in a document, chart 2 is the second
chart, and so on.
You can reference a chart by the bookmark too. You might use a bookmark to
identify a chart if you assigned the bookmark to the chart. To add a bookmark,
do as follows:
1. Create a chart in the report template.
2. Select the chart you want a bookmark assigned to.
3. On the Insert menu, click Bookmark.
4. Under Bookmark name, enter a bookmark name and click Add. For
example, enter Chart1.
In Microsoft Word, bookmarks are hidden by default. To show bookmarks:
1. On the Tools menu, click Options, and then click the View tab.
2. Select the Bookmarks check box.
3. The bookmark appears in brackets ([…]) on the screen.
- 32 -
Page 39

Chapter 5 API Reference
5.1 Objects
5.1.1 WDReport Object
Represents the WDReportCom. WDReport is the main class for report
generation using WDReportCom.
Using the WDReport Object
The following example creates a WDReport object in another application and
then generates a report using a WRF file.
Dim wdrpt As WDReport
Set wdrpt = New WDReport
wdrpt.WordReport wdApp, “customer_list.wrf"
5.2 Methods
5.2.1 FixTableReport Method
Generates a fixed table report based on a template. In a fixed table report, the
number of rows and columns is fixed. WDReportCom gets data from a
recordset object, and directly fills data into the cells of a table.
Syntax
object.FixTableReport(Recordset, Table, CellList, Range, FillOrder,
ImageList, PageBreak)
- 33 -
Page 40

object Required. The object is the WDReport object.
Recordset Required. An object variable that represents the
ADODB.Recordset object to provides data. Before calling this method, please
keep the current record position to the first record.
Table Required. An object variable that represents the Word.Table object to
be filled data.
CellList Required. A string that represents the list of cells separated by the
“,” character. For example, “A2,B2,B3,D2,D3”. The cells in the CellList should
correspond to the data source fields in the recordset. The value of the first
field is put into the first cell, and the value of the second field is put into the
second cell ……
Range Optional. A string that indicates the range in the table to be used for
the records. WDReportCom will skip or repeat the range for each record. A
range is composed of some rows or columns. You can reference a range of
cells like “2:4” or “B:D”. The default range is the area that includes all cells for
the records.
FillOrder Optional. An integer that indicates the order in which
WDReportCom fills data. If the value is zero, fills data by rows. Otherwise fills
data by columns. Default is 0.
ImageList Optional. A string that indicates which data source fields are the
picture files. The ImageList is the list of data source fields separated by the “,”
character. You can identify a field using the name of field or the index number
of field, but not simultaneously. In data source, you stored the path and file
name of the picture, not the picture. The file path can be a relative path, an
absolute path or a URL. If it is a relative path, the base path is the path of the
document.
PageBreak Optional. A string that indicates the page breaks. The unit of page
- 34 -
Page 41

length is r that means record. For example, “6r” or “6” means that
WDReportCom will insert a page break per 6 records. Default is “” that means
no page break.
Example
This example uses FixTableReport method to make the report “Top 5
Employees for Sales”.
1. Create the template in Microsoft Word.
2. Write the code in your application.
Set con = New ADODB.Connection
Set rec = New ADODB.Recordset
con.ConnectionString = "Data Source=Report Sample"
con.Open
strSQL = "SELECT TOP 5 e.FirstName + ' ' + e.LastName,
SUM(d.Quantity), Sum(d.UnitPrice * d.Quantity * (1-d.Discount)) AS
SalesAmount, SalesAmount / (SELECT amount FROM tmp_amount) FROM
Orders o, OrderDetails d, Products p, Employees e WHERE o.OrderID =
d.OrderID AND d.ProductID = p.ProductID AND o.EmployeeID =
e.EmployeeID AND YEAR(o.OrderDate) = 1996 AND MONTH(o.OrderDate) =
04 GROUP BY e.FirstName, e.LastName ORDER BY 3 DESC"
rec.Open strSQL, con
wdrpt.FixTableReport Recordset:=rec, Table:=wdTable, CellList:="B2"
rec.Close
- 35 -
Page 42

3. Generate the report.
5.2.2 VarTableReport Method
Generates a variable table report based on a template. In a variable table
report, the number of rows or columns in the table is unfixed, and it is variable
as the number of the result records. WDReportCom gets data from a
recordset object, inserts some blank rows/columns or copy a range for each
record, then fills data into the cells of a table.
Syntax
object.VarTableReport(Recordset, Table, CellList, Range, Copy, Reserve,
FillOrder, ImageList, PageBreak, NoData)
object Required. The object is the WDReport object.
Recordset Required. An object variable that represents the
ADODB.Recordset object to provides data. Before calling this method, please
keep the current record position to the first record.
Table Required. An object variable that represents the Word.Table object to
be filled data.
CellList Required. A string that represents the list of cells separated by the
“,” character. For example, “A2,B2,B3,D2,D3”. The cells in the CellList should
correspond to the data source fields in the recordset. The value of the first
- 36 -
Page 43

field is put into the first cell, and the value of the second field is put into the
second cell ……
Range Optional. A string that indicates the range in the table to be used for
the records. WDReportCom will repeat the range for each record. A range is
composed of some rows or columns. You can reference a range of cells like
“2:4” or “B:D”. The default range is the area that includes all cells for the
records.
Copy Optional. An integer that indicates whether WDReportCom will copy
the range for each record. If the value is zero, WDReportCom will insert the
blank rows/columns of the range for each record. Otherwise it will copy the
source range and insert the copied range for each record. Note:
WDReportCom will use clipboard. You can not copy and paste during report
generating.
Reserve Optional. An integer that indicates the number of records for which
you reserved some rows/columns in the report template for the report.
Possible values are 1 or 2. One means you reserve some rows/columns for
one record, and two means some rows/columns for two records. Default is 1.
FillOrder Optional. An integer that indicates the order in which
WDReportCom fills data. If the value is zero, fills data by rows. Otherwise fills
data by columns. Default is 0.
ImageList Optional. A string that indicates which data source fields are the
picture files. The ImageList is the list of data source fields separated by the “,”
character. You can identify a field using the name of field or the index number
of field, but not simultaneously. In data source, you stored the path and file
name of the picture, not the picture. The file path can be a relative path, an
absolute path or a URL. If it is a relative path, the base path is the path of the
document.
PageBreak Optional. A string that indicates the page breaks. The unit of page
- 37 -
Page 44

length is r that means record. For example, “6r” or “6” means that
WDReportCom will insert a page break per 6 records. Default is “” that means
no page break.
NoDataOptional. An integer that represents an option when no data are
returned from data source. If the value is 1, WDReportCom will delete the
range when no data are returned. If the value is 2, it will delete the table.
Default is 0. It means to do nothing.
Example
This example uses VarTableReport method to make the report “Mail Label”.
1. Create the template in Microsoft Word.
2. Write the code in your application.
Set con = New ADODB.Connection
Set rec = New ADODB.Recordset
con.ConnectionString = "Data Source=Report Sample"
con.Open
strSQL = "SELECT CompanyName, Address, CityName & ', ' &
CountryName, PostalCode FROM Customers, Cities, Countries WHERE
Customers.CityCode = Cities.CityCode AND Customers.CountryCode =
Cities.CountryCode AND Customers.CountryCode = Countries.CountryCode
- 38 -
Page 45

ORDER BY CompanyName"
rec.Open strSQL, con
wdrpt.VarTableReport Recordset:=rec, Table:=wdTable,
CellList:="B7,B8,B9,B10", Range:=”1:11”, Copy:=1, PageBreak:=”4r”
rec.Close
3. Generate the report.
5.2.3 GroupTableReport Method
Generates a variable table report based on a template, and groups data in the
report. In a variable table report, the number of rows or columns in the table is
unfixed, and it is variable as the number of the result records. WDReportCom
gets data from a recordset object, copy the group range for each group, and
copy the detail range for each record.
- 39 -
Page 46

Syntax
object.GroupTableReport(Recordset, Table, CellList, Range, Copy,
FillOrder, ImageList, PageBreak, NoData, Group1, GroupRange1, …
Group10, GroupRange10)
object Required. The object is the WDReport object.
Recordset Required. An object variable that represents the
ADODB.Recordset object to provides data. Before calling this method, please
keep the current record position to the first record.
Table Required. An object variable that represents the Word.Table object to
be filled data.
CellList Required. A string that represents the list of cells separated by the
“,” character. For example, “A2,B2,B3,D2,D3”. The cells in the CellList should
correspond to the data source fields in the recordset. The value of the first
field is put into the first cell, and the value of the second field is put into the
second cell ……
Range Optional. A string that indicates the range in the table to be used for
the records. WDReportCom will repeat the range for each record. A range is
composed of some rows or columns. You can reference a range of cells like
“2:4” or “B:D”. The default range is the area that includes all cells for the
records.
Copy Optional. An integer that indicates whether WDReportCom will copy
the range for each record. If the value is zero, WDReportCom will insert the
blank rows/columns of the range for each record. Otherwise it will copy the
source range and insert the copied range for each record. In general, inserting
rows/columns is faster than copying range.
FillOrder Optional. An integer that indicates the order in which
WDReportCom fills data. If the value is zero, fills data by rows. Otherwise fills
- 40 -
Page 47

data by columns. Default is 0.
ImageList Optional. A string that indicates which data source fields are the
picture files. The ImageList is the list of data source fields separated by the “,”
character. You can identify a field using the name of field or the index number
of field, but not simultaneously. In data source, you stored the path and file
name of the picture, not the picture. The file path can be a relative path, an
absolute path or a URL. If it is a relative path, the base path is the path of the
document.
PageBreak Optional. A string that indicates the page breaks. The unit of page
length is r or g. "r" means record, "g1" means group one, "g2" means group
two...... For example, “6r” or “6” means that WDReportCom will insert a page
break per 6 records, “1g1” or “1g” means a page break per group one, and
“1g1,6r” means a page break per group one or 6 records. Default is “” that
means no page break.
NoDataOptional. An integer that represents an option when no data are
returned from data source. If the value is 1, WDReportCom will delete the
range when no data are returned. If the value is 2, it will delete the table.
Default is 0. It means to do nothing.
Group1…Group10 Optional. A string that indicates the group that is the list of
data source fields separated by the “,” character. You can identify a field using
the name of field or the index number of field, but not simultaneously. In one
report, there may be up to 10 groups. Notes: the order of groups should be in
accordance with the order of ORDER BY clause in the SQL statement.
GroupRange1…GroupRange10 Optional. A string that indicates the range
of the group in the table. WDReportCom will repeat the range for each group.
The range of the group should contain the range of the details and the area
that includes all cells for this group. You reference a group range like “2:4” or
“B:D”. For example, there are two groups, the range of the group one contains
- 41 -
Page 48

all cells for the group one and the range of the group two, and the range of the
group two contains all cells for the group two and the range of the details. The
default range is the area that includes all cells for this group and the range or
the group range for the lower level group.
Remarks
GroupTableReport method will use clipboard. You can not copy and paste
during report generating.
Example
This example uses GroupTableReport method to make the report “Customer
Profile”.
1. Create the template in Microsoft Word.
2. Write the code in your application.
Set con = New ADODB.Connection
Set rec = New ADODB.Recordset
con.ConnectionString = "Data Source=Report Sample"
con.Open
strSQL = "SELECT LEFT(CompanyName,1), CompanyName,
ContactName, 'Phone: ' & Phone, 'Fax: ' & Fax, Address, CityName & ', ' &
CountryName, PostalCode FROM Customers, Cities, Countries WHERE
Customers.CityCode = Cities.CityCode AND Customers.CountryCode =
Cities.CountryCode AND Customers.CountryCode = Countries.CountryCode
ORDER BY CompanyName"
rec.Open strSQL, con
- 42 -
Page 49

wdrpt.GroupTableReport Recordset:=rec, Table:=wdTable,
CellList:="A2,B3,C3,D3,D4,E3,E4,E5", Copy:=1, Range:="2:5", Group1:="1",
PageBreak:="5r"
rec.Close
3. Generate the report.
5.2.4 FormReport Method
Generates a form report based on a template, and groups data in the report.
For a form report, you can put data from data source as text, list, title and
table in the report file. WDReportCom gets data from a recordset object, copy
the group range for each group, and copy the detail range for each record.
Syntax
object.FormReport(Recordset, Document, CellList, Range, ImageList,
PageBreak, NoData, Group1, GroupRange1, … Group10, GroupRange10)
Recordset Required. An object variable that represents the
ADODB.Recordset object to provides data. Before calling this method, please
- 43 -
Page 50

keep the current record position to the first record.
Document Required. An object variable that represents the Word.Document
object to be filled data.
CellList Required. A string that represents the list of merge fields or quote
fields separated by the “,” character. For example,
“ProductName,ProductID,QuantityPerUnit,UnitPrice”. The merge fields or
quote fields in the celllist should correspond to the data source fields in the
SQL statement. The value of the first data source field is put into the first
merge field or quote field, and the value of the second data source field is put
into the second merge field or quote field ……
Range Optional. A string that indicates the range to be used for the records.
WDReportCom will repeat the range for each record. A range is defined by a
bookmark. You reference a range using a bookmark name. The default range
is the group range or the entire document.
ImageList Optional. A string that indicates which data source fields are the
picture files. The ImageList is the list of data source fields separated by the “,”
character. You can identify a field using the name of field or the index number
of field, but not simultaneously. In data source, you stored the path and file
name of the picture, not the picture. The file path can be a relative path, an
absolute path or a URL. If it is a relative path, the base path is the path of the
table.
PageBreak Optional. A string that indicates the page breaks. The unit of page
length is r or g. "r" means record, "g1" means group one, "g2" means group
two...... For example, “6r” or “6” means that WDReportCom will insert a page
break per 6 records, “1g1” or “1g” means a page break per group one, and
“1g1,6r” means a page break per group one or 6 records. Default is “” that
means no page break.
NoDataOptional. An integer that represents an option when no data are
- 44 -
Page 51

returned from data source. If the value is not zero, WDReportCom will delete
the range when no data are returned. Default is 0.
Group1…Group10 Optional. A string that indicates the group that is the list of
data source fields separated by the “,” character. You can identify a field using
the name of field or the index number of field, but not simultaneously. In one
report, there may be up to 10 groups. Notes: the order of groups should be in
accordance with the order of ORDER BY clause in the SQL statement.
GroupRange1…GroupRange10 Optional. A string that indicates the range
of the group. WDReportCom will repeat the range for each group. A range is
defined by a bookmark. You reference a range using a bookmark name. The
range of the group should contain the range of the details and the area that
includes all merge fields or quote fields for this group. For example, there are
two groups, the range of the group one contains all merge fields or quote
fields for the group one and the range of the group two, and the range of the
group two contains all merge fields or quote fields for the group two and the
range of the details. The default range is the range of the upper level group or
the entire document.
Remarks
FormReport method will use clipboard. You can not copy and paste during
report generating.
Example
This example uses FormReport method to make the report “Product Catalog”.
1. Create the template in Microsoft Word.
- 45 -
Page 52

2. Write the code in your application.
Set con = New ADODB.Connection
Set rec = New ADODB.Recordset
con.ConnectionString = "Data Source=Report Sample"
con.Open
strSQL = " SELECT CategoryName, Description, ProductName,
ProductID, QuantityPerUnit, UnitPrice FROM Products, Categories WHERE
Products.CategoryID = Categories.CategoryID ORDER BY 1,3"
rec.Open strSQL, con
wdrpt.FormReport Recordset:=rec, Document:=wdDoc,
CellList:="CategoryName, Description, ProductName, ProductID,
QuantityPerUnit, UnitPrice", Range:="Product", Group1:="1,2",
GroupRange1:=”Category”
rec.Close
3. Generate the report.
- 46 -
Page 53

5.2.5 MSGraphChart Method
Generates a chart based on a template using Microsoft Graph.
WDReportCom gets data from a recordset object, and fills data into the
datasheet of a chart in the report file.
Syntax
object. MSGraphChart(Recordset, Chart, CellList, Range, FillOrder)
Recordset Required. An object variable that represents the
ADODB.Recordset object to provides data. Before calling this method, please
keep the current record position to the first record.
Chart Required. An object variable that represents the Graph.Chart object.
CellList Required. A string that represents the list of cells separated by the
“,” character. For example, “A2,B2,B3,D2,D3”. The cells in the CellList should
correspond to the data source fields in the recordset. The value of the first
field is put into the first cell, and the value of the second field is put into the
second cell ……Note: On the datasheet, the leftmost column and the top row,
- 47 -
Page 54

which are commonly used for legend text or axis labels, are referred to as
column 0 (zero) and row 0 (zero).
Range Optional. A string that indicates the range in the datasheet to be used
for the records. WDReportCom will skip the rows/columns of the range for
each record. A range is composed of some rows or columns. You can
reference a range of cells like “2:4” or “B:D”. The default range is the area that
includes all cells for the records.
FillOrder Optional. An integer that indicates the order in which
WDReportCom fills data. If the value is zero, fills data by rows. Otherwise fills
data by columns. Default is 1.
Example
This example uses MSGraphChart method to make the report “Sales by
Categories”.
1. Create the template in Microsoft Word.
The datasheet of the chart defined in the report template:
2. Write the code in your application.
Set con = New ADODB.Connection
Set rec = New ADODB.Recordset
con.ConnectionString = "Data Source=Report Sample"
con.Open
strSQL = " SELECT c.CategoryName, Sum(d.UnitPrice * d.Quantity *
(1-d.Discount)) FROM Orders o, OrderDetails d, Products p, Categories c
WHERE o.OrderID = d.OrderID AND d.ProductID = p.ProductID AND
- 48 -
Page 55

p.CategoryID = c.CategoryID AND YEAR(o.OrderDate) = 1996 AND
MONTH(o.OrderDate) = 04 GROUP BY c.CategoryName ORDER BY
c.CategoryName"
rec.Open strSQL, con
wdrpt.Chart Recordset:=rec, Chart:=wdChart, CellList:="A0"
rec.Close
3. Generate the chart.
The datasheet of the chart generated in the report:
The chart generated in the report:
5.2.6 ExcelChart Method
Generates a chart based on a template using Microsoft Excel. WDReportCom
gets data from a recordset object, and fills data into the worksheet of a chart
in the report file.
Syntax
object. ExcelChart(Recordset, Workbook, CellList, ReportType, Range,
- 49 -
Page 56

FillOrder)
Recordset Required. An object variable that represents the
ADODB.Recordset object to provides data. Before calling this method, please
keep the current record position to the first record.
Workbook Required. An object variable that represents the Excel.Workbook
object.
CellList Required. A string that represents the list of cells separated by the
“,” character. For example, “A2,B2,B3,D2,D3”. The cells in the CellList should
correspond to the data source fields in the recordset. The value of the first
field is put into the first cell, and the value of the second field is put into the
second cell ……
ReportType Optional. An integer that indicates the report type. If the value
is zero, WDReportCom will add some blank rows/columns before filling data
values into the worksheet of the chart. If the value is one, WDReportCom will
directly fill data vales into the worksheet of the chart. Default is 0. When it is a
variable table report, you should reserve two rows/columns in the worksheet
in the report template, and set the data range of the chart to 2 rows/columns.
Range Optional. A string that indicates the range in the worksheet to be used
for the records. WDReportCom will skip the rows/columns of the range for
each record. A range is composed of some rows or columns. You can
reference a range of cells like “2:4” or “B:D”. The default range is the area that
includes all cells for the records.
FillOrder Optional. An integer that indicates the order in which
WDReportCom fills data. If the value is zero, fills data by rows. Otherwise fills
data by columns. Default is 0.
Example
- 50 -
Page 57

This example uses ExcelChart method to make the report “Sales by
Categories”.
1. Create the template in Microsoft Word.
The worksheet of the chart defined in the report template:
2. Write the code in your application.
Set con = New ADODB.Connection
Set rec = New ADODB.Recordset
con.ConnectionString = "Data Source=Report Sample"
con.Open
strSQL = " SELECT c.CategoryName, Sum(d.UnitPrice * d.Quantity *
(1-d.Discount)) FROM Orders o, OrderDetails d, Products p, Categories c
WHERE o.OrderID = d.OrderID AND d.ProductID = p.ProductID AND
p.CategoryID = c.CategoryID AND YEAR(o.OrderDate) = 1996 AND
MONTH(o.OrderDate) = 04 GROUP BY c.CategoryName ORDER BY
c.CategoryName"
rec.Open strSQL, con
wdrpt.Chart Recordset:=rec, Workbook:=wdWorkbook, CellList:="A2"
rec.Close
3. Generate the chart.
The worksheet of the chart generated in the report:
- 51 -
Page 58

The chart generated in the report:
5.2.7 SetDocVariable Method
Gets data from a recordset object, and assigns the values to the names
defined in the Word document. WDReportCom will just fetch the first record,
no matter how many records are returned from data source.
Syntax
object.SetDocVariable(Recordset, Document, NameList)
object Required. The object is the WDReport object.
Recordset Required. An object variable that represents the
ADODB.Recordset object to provides data.
Document Required. An object variable that represents the Word.Document
object to be filled data.
- 52 -
Page 59

NameList Required. A string that represents the name of the document
variables you want assign values to. The NameList is the list of variable
names separated by the “,” character. For example, “BeginDate, EndDate”
means two document variables: BeginDate and EndDate that should be
defined in the report template. The variables in the list should correspond to
the fields in the SQL statement. The value of the first field is put into the first
variable, and the value of the second field is put into the second variable…
Remarks
SetDocVariable method supports headers and footers. You can use it to put
data into headers or footers.
WDReportCom can not update the docvariable fields automatically. To show
the results, you should update the fields. For example,
‘ Update all fields in the document
wdDoc.Fields.Update
‘ Update all fields in the primary header of section 1.
wdDoc.Sections(1).Headers(wdHeaderFooterPrimary).Range.Fields.Update
Example
This example uses SetDocVariable method to assign the values of fields to
document variables.
1. Define the document variables BeginDate and EndDate in the report
template in Microsoft Word.
2. Write the code in your application.
Set con = New ADODB.Connection
Set rec = New ADODB.Recordset
con.ConnectionString = "Data Source=Report Sample"
con.Open
strSQL = " SELECT min_date, max_date FROM tmp0"
- 53 -
Page 60

rec.Open strSQL, con
wdrpt.SetDocVariable Recordset:=rec, Document:=wdDoc,
NameList:="BeginDate,EndDate"
rec.Close
wdDoc.Fields.Update
5.2.8 WordReport Method
Generates the reports based on the templates and a WRF file. The WRF file
tells WDReportCom how to get data from data sources and how to put data
into the reports.
Syntax
object.WordReport(Application, WrfFile, Param1 … Param10)
object Required. The object is the WDReport object.
Application Required. An object variable that represents the
Word.Application object.
WrfFile Required. A string that represents the WRF file. You can include a full
path.
Param1 … Param10 Optional. A string that represents the paramters.
These parameters have been defined in the WRF file.
Example
This example uses WordReport method to make the report “Customer List”.
1. Create the template customer_list.doc using Microsoft Word.
2. Create the WRF file customer_list.wrf using a text editor.
3. Write the code in your application.
- 54 -
Page 61

Set wdApp = New Word.Application
Set wdrpt = New WDReport
Call wdrpt.WordReport(wdApp, “customer_list.wrf”)
5.2.9 GetTableByIndex Method
Returns a Word.Table object by using the table index.
Syntax
object.GetTableByIndex(Document, Index)
object Required. The object is the WDReport object.
Document Required. An object variable that represents the Word.Document
object.
Index Required. A string that represents the index of the table. The index
number starts at 1. For examples, table 2 is the second table in the document.
The index number of a nested table likes 2-1-2. For examples, table 2-1 is the
first table inside table 2, and table 2-1-2 is the second table inside table 2-1.
The max nested level WDReportCom supports is 3.
Example
This example uses GetTableByIndex method to get the first table in the
document.
Dim wdDoc As Word.Document
Dim wdTable As Word.Table
……
Set wdTable = mwdrpt.GetTableByIndex(wdDoc, "1")
- 55 -
Page 62

5.2.10 GetTableByBookmark Method
Returns a Word.Table object by using the bookmark.
Syntax
object.GetTableByBookmark(Document, Bookmark)
object Required. The object is the WDReport object.
Document Required. An object variable that represents the Word.Document
object.
Bookmark Required. A string that represents the name of the bookmark that
is in the table. You can reference a nested table. The max nested level
WDReportCom supports is 3.
Example
This example uses GetTableByBookmark method to get the table in the
document.
Dim wdDoc As Word.Document
Dim wdTable As Word.Table
……
Set wdTable = mwdrpt.GetTableByBookmark (wdDoc, "MyTable")
5.2.11 GetChartByIndex Method
Returns a Word.OLEFormat object that represents the Microsoft Graph chart
or Microsoft Excel chart OLE object.
Syntax
object.GetChartByIndex(Document, Index)
- 56 -
Page 63

object Required. The object is the WDReport object.
Document Required. An object variable that represents the Word.Document
object.
Index Required. A string that represents the index of the chart. The index
number starts at 1. For examples, chart 2 is the second chart in the document.
Example
This example uses GetChartByIndex method to get the object of the first chart
in the document.
Dim wdDoc As Word.Document
Dim wdChartOLE As Word.OLEFormat
Dim graChart As Graph.Chart
Dim xlWorkbook As Excel.Workbook
……
Set wdChartOLE = mwdrpt.GetChartByIndex(wdDoc, "1")
If Left(wdChartOLE.ProgId, 11) = "Excel.Chart" Then
Set xlWorkbook = wdChartOLE.object
Else
Set graChart = wdChartOLE.object
End If
5.2.12 GetChartByBookmark Method
Returns a Word.OLEFormat object that represents the Microsoft Graph chart
or Microsoft Excel chart OLE object.
Syntax
object.GetChartByIndex(Document, Bookmark)
- 57 -
Page 64

object Required. The object is the WDReport object.
Document Required. An object variable that represents the Word.Document
object.
Bookmark Required. A string that represents the name of the bookmark that
includes the chart.
Example
This example uses GetChartByBookmark method to get the object of the chart
in the document.
Dim wdDoc As Word.Document
Dim wdChartOLE As Word.OLEFormat
Dim graChart As Graph.Chart
Dim xlWorkbook As Excel.Workbook
……
Set wdChartOLE = mwdrpt.GetChartByBookmark(wdDoc, "Chart1")
If Left(wdChartOLE.ProgId, 11) = "Excel.Chart" Then
Set xlWorkbook = wdChartOLE.object
Else
Set graChart = wdChartOLE.object
End If
5.3 Events
5.3.1 BeforeConnect Event
Occurs before a connection starts.
Syntax
- 58 -
Page 65

Private Sub object_BeforeConnect(UserID As String, Password As String,
DataSource As String, Connection As ADODB.Connection)
object The object is the WDReport object.
UserID A string that represents a user name for the connection.
Password A string that represents a password for the connection.
DataSource A string that represents a data source name for the
connection.
Connection The ADODB.Connection object.
Example
Private Sub mwdrpt_BeforeConnect(UserID As String, Password As String,
DataSource As String, Connection As ADODB.Connection)
Connection.ConnectionTimeout = 15
Connection.CursorLocation = adUseClient
End Sub
5.3.2 TemplateOpen Event
Occurs when a template document is opened.
Syntax
Private Sub object_TemplateOpen(ByVal Document As Word.Document)
object The object is the WDReport object.
Document An object variable that represents the Word.Document object to
be opened.
Example
- 59 -
Page 66

Private Sub mwdrpt_TemplateOpen(ByVal Document As Word.Document)
gstrFileName = Document.FullName
End Sub
5.3.3 ReportComplete Event
Occurs when all report generating process is completed.
Syntax
Private Sub object_ReportComplete(ByVal Document As Word.Document)
object The object is the WDReport object.
Document An object variable that represents the Word.Document object.
Example
Private Sub mwdrpt_ReportComplete(ByVal Document As Word.Document)
' Close the document and do not display the report when get errors
If mintErrCount > 0 Then
Document.Close
End If
End Sub
5.3.4 FunctionBeforeExectue Event
Occurs before a function is executed.
Syntax
Private Sub object_FunctionBeforeExectue(ByVal FunctionNo As String,
ByVal FunctionType As Integer, ByVal SQLNo As Long, ByVal SQLText As
String)
- 60 -
Page 67

object The object is the WDReport object.
FunctionNo A string that represents the label of the function.
FunctionTyp An integer that represents the type of the function. 0 means
ExecSQL function. 1 means DocVariable function. 2 means Report function. 3
means Chart function.
SQLNo A long that represents the number of SQL statements.
SQLText A string that contains the SQL statement.
Example
Private Sub mwdrpt_FunctionBeforeExectue(ByVal FunctionNo As String,
ByVal FunctionType As Integer, ByVal SQLNo As Long, ByVal SQLText As
String)
frmWait.lblFunctionNo = FunctionNo
frmWait.lblSQLCount = SQLNo
End Sub
5.3.5 FunctionAfterExectue Event
Occurs after a function is executed.
Syntax
Private Sub object_FunctionAfterExectue(ByVal FunctionNo As String,
ByVal FunctionType As Integer, ByVal SQLNo As Long, ByVal ErrObj As
ErrObject)
object The object is the WDReport object.
FunctionNo A string that represents the label of the function.
FunctionTyp An integer that represents the type of the function. 0 means
- 61 -
Page 68

ExecSQL function. 1 means DocVariable function. 2 means Report function. 3
means Chart function.
SQLNo A long that represents the number of SQL statements.
ErrObj The Err object.
Example
Private Sub mwdrpt_FunctionAfterExectue(ByVal FunctionNo As String,
ByVal FunctionType As Integer, ByVal SQLNo As Long, ByVal ErrObj As
ErrObject)
If ErrObj.Number <> 0 Then
If FunctionType <> 0 Then 'Ignore errors of EXECSQL
MsgBox ErrObj.Description, vbExclamation, App.ProductName
mintErrCount = mintErrCount + 1
End If
End If
End Sub
5.3.6 FunctionProgress Event
Occurs periodically during a function processing.
Syntax
Private Sub object_FunctionProgress(ByVal Progress As Long, ByVal
RecordCount As Long)
object The object is the WDReport object.
Progress A long that indicates the number of records that have currently
been processed.
RecordCount A long that indicates the total number of records.
- 62 -
Page 69

Example
Private Sub mwdrpt_FunctionProgress(ByVal Progress As Long, ByVal
RecordCount As Long)
frmWait.lblRecordCnt.Caption = Format(Progress, "#,##0") & " / " &
Format(RecordCount, "#,##0")
End Sub
5.4 Error Messages
The following table lists the trappable errors for the WDReport Object.
Value Description
-2147221493 The file WrfFileName does not exist.
-2147221492 The file WrfFileName is not a WordReport file.
-2147221491 Error in reading the file WrfFileName."
-2147221490 Report template file TemplateFileName does not exist.
-2147221489 The report file is not named correctly.
-2147221488 Failed to create the report file ReportFileName.
-2147221487 Failed to open the template file TemplateFileName.
-2147221486 Failed to save the report file.
-2147221485 Failed to save the report file. Not support the file format: FileFormat.
-2147221484 Failed to update Word fields.
-2147221473 The ADODB.Recordset object is closed.
-2147221453 Syntax error. The table Table does not exist.
-2147221452 Syntax error. The chart Chart does not exist.
-2147221451 The Word.Document object is not set.
-2147221450 The Word.Table object is not set.
-2147221449 The Graph.Chart object is not set.
-2147221448 The Excel.Workbook object is not set.
-2147221447 Unable to find the Word document.
-2147221446 Unable to find the Excel chart.
-2147221445 Unable to find the source data worksheet.
-2147221403 Syntax error. There is a lack of the parameter "NAME".
-2147221393 Syntax error. There is a lack of the parameter "CELL".
-2147221392 Syntax error. It is not a valid cell "" for the parameter "CELL".
-2147221391 Syntax error. Failed to parse cell list.
-2147221390 Syntax error. Failed to parse cell Cell.
-2147221389 Can not find the field Field in the range Range.
-2147221383 The range or copyrange should be Range.
- 63 -
Page 70

-2147221382 Syntax error. Failed to parse range Range.
-2147221373
Syntax error. Failed to parse image. Can not find field ImageField in
the image list.
-2147221372 Syntax error. Failed to parse image.
-2147221363 Syntax error. Failed to parse group Group. Can not find field Field.
-2147221362 Syntax error. Failed to parse group.
-2147221361 The grouprange of group N should be Range.
-2147221360 Syntax error. Failed to parse grouprange.
- 64 -
Page 71

Chapter 6 WRF Files
6.1 Using WRF files
6.1.1 About WRF files
Like WDReportGen, WDReportCom also can read a WRF file to generate a
report. The WRF file is a text file with a .wrf extension. It contains information
such as the name of the report template file, the name of the report file, the
name of the log file, data sources, parameters and functions. The WRF file
tells WDReportCom how to get data from data sources and how to put data
into a report. Using the WRF file, it will simplify your development.
6.1.2 Using a WRF file with WDReport Object
WDReport object provides the WordReport method to generate a report
based on a WRF file. For example, you have created the WRF file
“myreport.wrf” and the template file. In the WRF file, there are two parameters.
The first parameter is the sales date “$SalesDate”, and the second is the
category of the products “$Category”. You can call WordReport method to
generate the report.
Set wdApp = New Word.Application
Set wdrpt = New WDReport
Call wdrpt.WordReport(wdApp, “c:\wordreport\myreport.wrf”,
“1996-05-01”, “Dairy Products”)
WDReportCom will replace “$SalesDate” in SQL statements with
“1996-05-01”, replace “$Category” with “Dairy Products”, and then submit
- 65 -
Page 72

SQL statements to data sources.
6.1.3 Using a WRF file in command line
In the WDReportCom, there is an executable file WordReport.exe that can
read a WRF file to generate a report. It is the same as WDReportGen
command line. For example, you have created the WRF file “myreport.wrf”
and the template file. In the WRF file, there are two parameters. The first
parameter is the sales date “$SalesDate”, and the second is the category of
the products “$Category”. You can run WordReport.exe in command line
mode as follows:
wordreport c:\wordreport\myreport.wrf 1996-05-01 “Dairy Products”
WDReportCom will replace “$SalesDate” in SQL statements with
“1996-05-01”, replace “$Category” with “Dairy Products”, and then submit
SQL statements to data sources.
6.1.4 Creating a WRF file
The WRF file is a text file. You can create and modify a WRF file in
WDReportGen or a text editor.
Sometimes you want to make a WRF file programmatically. You can write a
program to create a WRF file using C, perl or DOS shell, and then run
WDReportCom to generate report. The two steps can be written into a batch
file.
1. Write a program to make the WRF file as you need.
2. Write a batch file to call the program and WordReport.exe.
For example, you write a batch file runrpt.bat as follows. changewrf is an
executable file that reads template.txt and output template.wrf. First runrpt.bat
call changewrf to make the WRF file, and then call WordReport.exe to
generate the report.
- 66 -
Page 73

@echo off
if "%1"=="" goto usage
goto process
:usage
echo Usage: runrpt ReportDate
echo ReportDate Date format 'YYYY-MM-DD'
goto :EOF
:process
changewrf %1 <"template.txt" >"template.wrf"
WordReport "template.wrf" %1
6.1.5 Using parameters
You can use parameters in the WRF file. You can pass values to
WDReportCom when it processes a WRF file. WDReportCom will replace the
parameter names with the actual values. You can use the parameters in the
SQL statements and the paths and names of the files.
To use a parameter, you must define it first. If you have defined a parameter
name, you can use it in SQL statements. In fact, WDReportCom will replace
all strings that are the same as the names of the parameters. You should be
careful to define a unique name for each parameter. It is a good choice a
name begins with the “$” character.
Example
Input an order id to get the order information. The field OrderID is numeric
type.
1. Defining a parameter
Define a parameter as follows:
Name: $OrderID
Title: Order ID (>=10248)
- 67 -
Page 74

Default: 10360
2. Using a parameter
You can use the parameter “$OrderID” in SQL statements. For example:
SELECT o.OrderID
,o.OrderDate
,SUM(d.UnitPrice * d.Quantity * (1-d.Discount)) AS Amount
FROM Orders o, OrderDetails d
WHERE o.OrderID = d.OrderID
AND o.OrderID = $OrderID
GROUP BY o.OrderID, o.OrderDate
;
Example
Define two parameters. The first parameter is the sales date, and the second
is the category of the products. The field OrderDate is date type, and
CategoryName is char type.
1. Defining parameters
Define parameters as follows:
Name1: $SalesDate
Title1: Sales Date
Default1: 1996-05-01
Name2: $Category
Title2: Category of Products
Default2:
2. Using parameters
You can use the parameters “$SalesDate”, “$Category” in SQL statements.
For example:
SELECT ……
FROM Orders, OrderDetails, Products, Categories
- 68 -
Page 75

WHERE ……
AND OrderDate = ‘$SalesDate’
AND CategoryName LIKE '$Category%'
;
/* For Microsoft Jet SQL, LIKE '$Category*' */
Example
Get the information from the database, table and column that you identify
when the report is generated.
1. Defining parameters
Define parameters as follows:
Name1: $Database
Title1: Database Name
Default1:
Name2: $Table
Title2: Table Name
Default2:
Name3: $Column
Title3: Column Name
Default3:
2. Using parameters
You can use the parameters “$Database”, “$Table” and “$Column” in SQL
statements. For example:
USE $Database;
or
DATABASE $Database;
SELECT $Column
FROM $Table
;
- 69 -
Page 76

Example
Use parameters in the path and name of the report file and the log file.
1. Defining a parameter
Define a parameter as follows:
Name: $CustomerID
Title: Customer ID
Default: C000001
2. Using a parameter
ReportFileName=report\report_$CustomerID.doc
LogFileName=log\report_$CustomerID.log
or
ReportFileName=report\$CustomerID\report.doc
LogFileName=log\$CustomerID\report.log
6.1.6 Converting files
You can convert a file from Microsoft Word document to and from another file
format. For example, the template file is a RTF file with a .rtf extension, and
the report file is a HTML file with a .htm extension. Microsoft Word uses file
format converters to open and save documents in different formats. The most
commonly used converters are installed with Microsoft Word by default. If you
want to open or save in a format that's not installed by default, you may need
to install additional converters.
The file formats WDReportCom supports can be one of these. What file
format WDReportCom supports is dependent on your Microsoft Word and
converters installed. For example, Microsoft Word 2003 supports XML, but
Microsoft Word 97/2000 does not support it. For more information about
converting files, please refer to Microsoft Word Help. The file “wconv.cfg”
located in the WDReportCom directory contains the information of file formats.
- 70 -
Page 77

You can expand it if your Microsoft Word supports more file formats.
File Format Name Value Description Extension Converter
WdFormatDocument 0 Word Document doc Office97
WdFormatTemplate 1 Word Template dot Office97
WdFormatRTF 6 Rich Text Format rtf Office97
WdFormatHTML 8
WdFormatFilteredHTML 10
WdFormatWebArchive 9
WdFormatXML 11 XML Document xml Office2003
WdFormatText 2 Text txt Office97
WdFormatTextLineBreaks 3 Text (Line Breaks) txt Office97
WdFormatDOSText 4 Text (DOS) txt Office97
WdFormatDOSTextLineBreak
s
WdFormatUnicodeText 7 Unicode Text txt Office97
MSWordWin2 Word 2.x for Windows doc External
MSWordWin5 Word 5.0 for Windows doc External
MSWord6RTFExp Word 97-2003 & 6.0/95
wks632 Works 6.0 & 7.0 wps External
MSWorksWin6 Works 6.0 & 7.0 wtf External
Works2001 Works 7.0 wps External
WrdPrfctDos WordPerfect 5.x doc External
WordPerfect6x WordPerfect 6.x wpd doc External
Web Page
Web Page Filtered
Single File Web Page
5 Text (DOS Line Breaks) txt Office97
– RTF
htm html Office2000
htm html Office2003
mht mhtml Office2003
doc External
For Microsoft Word 2007, please copy “wconv2007.cfg” to “wconv.cfg”. This
file contains the information of file formats for Microsoft Word 2007.
File Format Name Value Description Extension
WdFormatXMLDocument 12Word Document Docx
Word Macro-enabled
WdFormatXMLDocumentMacroEnabled 13
WdFormatDocument 0Word 97-2003 Document Doc
WdFormatXMLTemplate 14Word Template Dotx
WdFormatXMLTemplateMacroEnabled 15
WdFormatTemplate 1Word 97-2003 Template Dot
WdFormatRTF 6Rich Text Format Rtf
WdFormatHTML 8Web Page htm html
WdFormatFilteredHTML 10Web Page Filtered htm html
WdFormatWebArchive 9Single File Web Page mht mhtml
WdFormatPDF 17PDF Pdf
WdFormatXPS 18XPS Document Xps
WdFormatFlatXML 19Word XML Document Xml
WdFormatFlatXMLMacroEnabled 20Word XML Macro-enabled Xml
Document
Word Macro-enabled
Document Template
- 71 -
Docm
Dotm
Page 78

Document
WdFormatXML 11Word 2003 XML Document Xml
WdFormatText 2Text Txt
WdFormatTextLineBreaks 3Text (Line Breaks) Txt
WdFormatDOSText 4Text (DOS) Txt
WdFormatDOSTextLineBreaks 5Text (DOS Line Breaks) Txt
WdFormatUnicodeText 7Unicode Text Txt
MSWorksWin6 Works 6.0 - 9.0 Wtf
wks632 Works 6.0 - 9.0 Wps
Works2001 Works 7.0 Wps
WrdPrfctDos WordPerfect 5.x Doc
WordPerfect6x WordPerfect 6.x wpd doc
Note: For an external converter, the file format name is the class name of the
file converter, and the format value may not be the same on another computer.
So do not assign a number to the format value.
6.2 WRF File Reference
6.2.1 WRF File Format
The layout of a WRF file is as the following:
WordReport Version 2.0
[Data Source]
……
[File]
……
[Parameter]
……
[SQL]
……
“WordReport” is the flag of the WRF file. “Version 2.0” is the version of the
WRF file.
A WRF file contains several sections. The sections of [Data Source], [File],
- 72 -
Page 79

and [Parameter] consist of a group of related settings. The sections and
settings are listed in the WRF file in the following format:
[section name]
keyname=value
In this example, [section name] is the name of a section. The enclosing
brackets ([]) are required, and the left bracket must be in the leftmost column
on the screen.
The keyname=value statement defines the value of each setting. A keyname
is the name of a setting. It can consist of any combination of letters and digits,
and must be followed immediately by an equal sign (=). The value can be an
integer, a string, or a quoted string, depending on the setting.
You can include comments in these sections. You must begin each line of a
comment with a semicolon (;).
The [SQL] section consists of functions. Each function is begin with the “@”
character. Syntax:
@functionno=functionname(arguments)
sqlstatement
The functionno is the label of the function.
The functionname represents a function.
The arguments define various properties for the function. An argument takes
the form Name="Value". The argument value can be delimited by single or
double quotes.
The sqlstatement is a SQL statement.
You can use comments in [SQL] section. A comment is the “/*” characters,
followed by any sequence of characters (including new lines), followed by the
“*/” characters. You cannot nest comments.
- 73 -
Page 80

6.2.2 [Data Source] Section
The [Data Source] section contains information how to connect to data
sources.
Name1=<name1>
Name2=<name2>
……
Name10=<name10>
These settings specify the names of data sources you want to connect to.
Name1 specifies the name of the first data source. Name2 specifies the name
of the second data source…… You can define up to 10 data sources in one
WRF file. You can make a connection to a data source using an ODBC data
source name or a connection string. Even if you use a connection string to
make a connection, you should define a name that you can reference in
functions.
User1=<username1>
User2=<username2>
……
User10=<username10>
These settings specify the user names. If you use an ODBC data source
name to make a connection, you should define user name and password. If
you use a connection string to make a connection, WDReportCom will ignore
the setting. User1 specifies the user name of the first data source. User2
specifies the user name of the second data source…… They are optional
settings. If defined default user and password in ODBC data source, you may
not define them.
- 74 -
Page 81

Password1=<password1>
Password2=<password2>
……
Password10=<password10>
These settings specify the user passwords. If you use an ODBC data source
name to make a connection, you should define user name and password. If
you use a connection string to make a connection, WDReportCom will ignore
the setting. Password1 specifies the password of the first data source.
Password2 specifies the password of the second data source…… They are
optional settings. If defined default user and password in ODBC data source,
you may not define them.
ConnectionString1=<connectionstring1>
ConnectionString2=<connectionstring2>
……
ConnectionString10=<connectionstring10>
These settings specify the connection strings. If you defined a connection
string, WDReportCom will make a connection to the data source using the
connection string, and ignore the settings of the name, user and password.
But you must define a name that you can reference in functions.
ConnectionString1 specifies the connection string of the first data source.
ConnectionString2 specifies the connection string of the second data
source…… They are optional settings. If no connection string, WDReportCom
will make a connection to data source using the ODBC data source name.
EncryptPassword =Y/N
This setting specifies how to save the passwords of the data sources. If the
- 75 -
Page 82

value is Y, passwords will be saved in an encrypted format. If the value is N,
the passwords will be saved in plain text.
6.2.3 [FILE] Section
[FILE] section contains information about files.
ReportTemplateFileName=<templatefilename>
This setting specifies the name of the report template file. <templatefilename>
value is the name and path of the report template file. The file path can be a
relative path or an absolute path. If it is a relative path, the base path is the
path of the WRF file.
ReportFileName=<reportfilename>
This setting specifies the name of the report file. <reportfilename> value is the
name and path of the report file. The file path can be a relative path or an
absolute path. If it is a relative path, the base path is the path of the WRF file.
In <reportfilename>, you can use parameters.
ReportFileType=<reportfiletype>
This setting specifies the type of the report file. <reportfiletype> value is the
name or value of the file format. For example, wdFormatRTF or 6. What file
format WDReportCom supports is dependent on your Microsoft Word and
converters installed.
ProtectReport=Y/N
This setting specifies whether the report generated is protected. If the value is
Y, the report is protected, and can not be modified. If the value is N, the report
is not protected. Default is N.
- 76 -
Page 83

ProtectionPassword=<protectionpassword>
This setting specifies the password that is used to protect the report.
<protectionpassword> value is the password. This setting is valid when
ProtectReport is Y. If there is not this setting and ProtectReport is Y, a random
password will be created.
LogFileName=<logfilename>
This setting specifies the name of the log file. <logfilename> value is the name
and path of the log file. The file path can be a relative path or an absolute path.
If it is a relative path, the base path is the path of the WRF file. In
<logfilename>, you can use parameters.
6.2.4 [PARAMETER] Section
[PARAMETER] section contains information about parameters.
Name1=<name1>
Name2=<name2>
……
Name10=<name10>
These settings specify the names of the parameters. Name1 specify the name
of the first parameter, Name2 specifies the name of the second parameter.…..
You can define up to 10 parameters in one WRF file.
Title1=<title1>
Title2=<title2>
……
- 77 -
Page 84

Title10=<title10>
These settings specify the titles of the parameters. Title1 specifies the title of
the first parameter. Title2 specifies the title of the second parameter……
Default1=<default1>
Default2=<default2>
……
Default10=<default10>
These settings specify the default values of the parameters. Default1 specifies
the default value of the first parameter. Default2 specifies the default value of
the second parameter.…..
6.3 Function Reference
6.3.1 Fixed Table Report
Uses FixTableReport method to generate a fixed table report. In a fixed table
report, the number of rows and columns is fixed. WDReportCom executes a
SQL statement to get data from data source, and directly fills data into the
cells of a table.
Syntax
Report(…)
sqlstatement
Arguments
TYPE = “fix”
TABLE = table
FILLORDER = fillorder
CELL= celllist
RANGE = range
- 78 -
Page 85

IMAGE = fieldlist
PAGEBREAK = pagelength
CONNECT = datasource
The TYPE argument specifies the report type. "fix" means a fixed table report.
The TABLE argument identifies a table in the report template. The table is the
index number of the table or the bookmark name in the table. The index
number starts at 1. For examples, table 2 is the second table in the document.
The index number of a nested table likes 2-1-2. For examples, table 2-1 is the
first table inside table 2, and table 2-1-2 is the second table inside table 2-1.
The max nested level WDReportCom supports is 3.
The FILLORDER argument specifies the order in which WDReportCom fill
data. Possible values are row or col. "row" means to fill data by rows, and
"col" means to fill data by columns. Default is row.
The CELL argument specifies the positions where data values will be inserted.
The celllist is the list of cells separated by the “,” character. For example,
“A2,B2,B3,D2,D3”. The cells in the celllist should correspond to the data
source fields in the SQL statement. The value of the first field is put into the
first cell, and the value of the second field is put into the second cell ……
WDReportCom will use the next cell if you omit a cell except the first cell. If
FILLORDER=“row”, the next cell is the right cell. If FILLORDER=“col”, the
next cell is the below cell.
The RANGE argument specifies the range in the table to be used for the
records. WDReportCom will skip the range for each record. You can reference
a range of cells like “2:4” or “B:D”. The default range is the area that includes
all cells for the records.
The IMAGE argument specifies the data source fields are picture files. The
fieldlist is the list of data source fields separated by the “,” character. You can
identify a field using the name of field or the index number of field, but not
- 79 -
Page 86

simultaneously. In data source, you stored the path and file name of the
picture, not the picture. The file path can be a relative path, an absolute path
or a URL. If it is a relative path, the base path is the path of the report
template file.
The PAGEBREAK argument specifies the page breaks. The unit of page
length is r that means record. For example, “6r” or “6” means that
WDReportCom will insert a page break per 6 records. Default is no page
break.
The CONNECT argument specifies the connection to a data source. The
CONNECT can takes a string that expresses a data source name or a number
that expresses a data source index. The index number of data source is the
sequential number defined in the WRF file, and starts at 1. The default implies
the first data source.
The sqlstatement is a SQL statement such as a SELECT statement.
Example
This example uses Fixed Table Report function to make the report “Top 5
Employees for Sales”.
@F1=REPORT(type=fix table=6 cell=B2)
SELECT TOP 5 e.FirstName + ' ' + e.LastName
, SUM(d.Quantity)
, Sum(d.UnitPrice * d.Quantity * (1-d.Discount)) AS SalesAmount
FROM Orders o
,OrderDetails d
,Products p
,Employees e
WHERE o.OrderID = d.OrderID
AND d.ProductID = p.ProductID
- 80 -
Page 87

AND o.EmployeeID = e.EmployeeID
AND YEAR(o.OrderDate) = 1996
AND MONTH(o.OrderDate) = 04
GROUP BY e.FirstName, e.LastName
ORDER BY 3 DESC
6.3.2 Variable Table Report
Uses VarTableReport method to generate a variable table report. In a variable
table report, the number of rows or columns in the table is unfixed, and it is
variable as the number of the result records. WDReportCom executes a SQL
statement to get data from data source, inserts some blank rows/columns or
copy a range for each record, then fills data into the cells of a table.
Syntax
Report(…)
sqlstatement
Arguments
TYPE = “var”
TABLE = table
FILLORDER = fillorder
CELL= celllist
RANGE = range
IMAGE = fieldlist
RESERVE = reserverecords
PAGEBREAK = pagelength
NODATA = nodataoption
CONNECT = datasource
- 81 -
Page 88

The TYPE argument specifies the report type. "var" means a variable table
report. Default is var.
The TABLE argument identifies a table in the report template. The table is the
index number of the table or the bookmark name in the table. The index
number starts at 1. For examples, table 2 is the second table in the document.
The index number of a nested table likes 2-1-2. For examples, table 2-1 is the
first table inside table 2, and table 2-1-2 is the second table inside table 2-1.
The max nested level WDReportCom supports is 3.
The FILLORDER argument specifies the order in which WDReportCom fill
data. Possible values are row or col. "row" means to fill data by rows, and
"col" means to fill data by columns. Default is row.
The CELL argument specifies the positions where data values will be inserted.
The celllist is the list of cells separated by the “,” character. For example,
“A2,B2,B3,D2,D3”. The cells in the celllist should correspond to the data
source fields in the SQL statement. The value of the first field is put into the
first cell, and the value of the second field is put into the second cell ……
WDReportCom will use the next cell if you omit a cell except the first cell. If
FILLORDER=“row”, the next cell is the right cell. If FILLORDER=“col”, the
next cell is the below cell.
The RANGE or COPYRANGE argument specifies the range in the table to be
used for the records. WDReportCom will skip or repeat the range for each
record. You can reference a range of cells like “2:4” or “B:D”. The default
range is the area that includes all cells for the records. For Range argument,
WDReportCom will insert the blank rows/columns of the range for each record.
For COPYRANGE argument, it will copy the original range and insert the
copied range for each record.
The IMAGE argument specifies the fields are picture files. The fieldlist is the
list of data source fields separated by the “,” character. You can identify a field
- 82 -
Page 89

using the name of field or the index number of field, but not simultaneously. In
data source, you stored the path and file name of the picture, not the picture.
The file path can be a relative path, an absolute path or a URL. If it is a
relative path, the base path is the path of the report template file.
The RESERVE argument specifies the number of the records for which you
reserved some rows/columns in the report template for the report. The
reserverecords represents the number of the records you reserved in the
report template. Possible values are 1 or 2. One means you reserved some
rows/columns for one record, and two means some rows/columns for two
records. Default is 1.
The PAGEBREAK argument specifies the page breaks. The unit of page
length is r that means record. For example, “6r” or “6” means that
WDReportCom will insert a page break per 6 records. Default is no page
break.
The NODATA argument specifies an option when no data are returned from
data source. If the value is "delrange", WDReportCom will delete the range
when no data are returned. "deltable" means to delete the table. Default is to
do nothing.
The CONNECT argument specifies the connection to a data source. The
CONNECT can takes a string that expresses a data source name or a number
that expresses a data source index. The index number of data source is the
sequential number defined in the WRF file, and starts at 1. The default implies
the first data source.
The sqlstatement is a SQL statement such as a SELECT statement.
Example
This example uses Variable Table Report function to make the report “Mail
Label”.
- 83 -
Page 90

@F1=Report(type=var table=1 cell=B7,B8,B9,B10 copyrange=1:11
pagebreak = 4r)
SELECT CompanyName
,Address
,CityName & ', ' & CountryName
,PostalCode
FROM Customers, Cities, Countries
WHERE Customers.CityCode = Cities.CityCode
AND Customers.CountryCode = Cities.CountryCode
AND Customers.CountryCode = Countries.CountryCode
ORDER BY CompanyName
6.3.3 Group Table Report
Uses GroupTableReport method to generate a variable table report and group
data. In a variable table report, the number of rows or columns in the table is
unfixed, and it is variable as the number of the result records. WDReportCom
executes a SQL statement to get data from data source, copy the group range
for each group, copy the detail range for each record, then fills data into the
table.
Syntax
Report(…)
sqlstatement
Arguments
TYPE = “var”
TABLE = table
FILLORDER = fillorder
CELL= celllist
RANGE = range
- 84 -
Page 91

GROUP= grouplist
GROUPRANGE = grouprange
IMAGE = fieldlist
PAGEBREAK = pagelength
NODATA = nodataoption
CONNECT = datasource
The TYPE argument specifies the report type. "var" means a variable table
report. Default is var.
The TABLE argument identifies a table in the report template. The table is the
index number of the table or the bookmark name in the table. The index
number starts at 1. For examples, table 2 is the second table in the document.
The index number of a nested table likes 2-1-2. For examples, table 2-1 is the
first table inside table 2, and table 2-1-2 is the second table inside table 2-1.
The max nested level WDReportCom supports is 3.
The FILLORDER argument specifies the order in which WDReportCom fill
data. Possible values are row or col. "row" means to fill data by rows, and
"col" means to fill data by columns. Default is row.
The CELL argument specifies the positions where data values will be inserted.
The celllist is the list of cells separated by the “,” character. For example,
“A2,B2,B3,D2,D3”. The cells in the celllist should correspond to the data
source fields in the SQL statement. The value of the first field is put into the
first cell, and the value of the second field is put into the second cell ……
WDReportCom will use the next cell if you omit a cell except the first cell. If
FILLORDER=“row”, the next cell is the right cell. If FILLORDER=“col”, the
next cell is the below cell.
The RANGE or COPYRANGE argument specifies the range in the table to be
used for the details. WDReportCom will skip or repeat the range for each
record. You can reference a range of cells like “2:4” or “B:D”. The default
- 85 -
Page 92

range is the area that includes all cells for the details. For Range argument,
WDReportCom will insert the blank rows/columns of the range for each record.
For COPYRANGE argument, it will copy the original range and insert the
copied range for each record. But if the range of any group is not same as the
range of the details, RANGE is same as COPYRANGE.
The GROUP argument specifies the group of the report. The grouplist is the
list of data source fields separated by the “,” character. You can identify a field
using the name or index number of the field, but not simultaneously. In one
report, there may be up to 10 groups. Notes: the order of the groups should
be in accordance with the order of the ORDER BY clause in the SQL
statement.
The GROUPRANGE argument follows the GROUP argument, and specifies
the range of the group in the table. For example, the grouprange of level 1
must follow the group of level 1, and the grouprange of level 2 must follow the
group of level 2. WDReportCom will repeat the group range for each group.
The range of the group should contain the range of the details and the area
that includes all cells for this group. You reference a group range like “2:4” or
“B:D”. For example, there are two groups, the range of the group one contains
all cells for the group one and the range of the group two, and the range of the
group two contains all cells for the group two and the range of the details. The
default range is the area that includes all cells for this group and the range or
group range for the lower level group.
The IMAGE argument specifies the fields are picture files. The fieldlist is the
list of data source fields separated by the “,” character. You can identify a field
using the name of field or the index number of field, but not simultaneously. In
data source, you stored the path and file name of the picture, not the picture.
The file path can be a relative path, an absolute path or a URL. If it is a
relative path, the base path is the path of the report template file.
- 86 -
Page 93

The PAGEBREAK argument specifies the page breaks. The unit of page
length is r or g. "r" means record, "g1" means group one, "g2" means group
two...... For example, “6r” or “6” means that WDReportCom will insert a page
break per 6 records, “1g1” or “1g” means a page break per group one, and
“1g1,6r” means a page break per group one or 6 records. Default is “” that
means no page break.
The NODATA argument specifies an option when no data are returned from
data source. If the value is "delrange", WDReportCom will delete the range
when no data are returned. "deltable" means to delete the table. Default is to
do nothing.
The CONNECT argument specifies the connection to a data source. The
CONNECT can takes a string that expresses a data source name or a number
that expresses a data source index. The index number of data source is the
sequential number defined in the WRF file, and starts at 1. The default implies
the first data source.
The sqlstatement is a SQL statement such as a SELECT statement.
Example
This example uses Group Table Report function to make the report “Customer
Profile”.
@F1= Report(table=1 cell=A2,B3,C3,D3,D4,E3,E4,E5
copyrange=2:5 group=1 pagebreak = 5r)
SELECT LEFT(CompanyName,1)
,CompanyName
,ContactName
,'Phone: ' & Phone
,'Fax: ' & Fax
,Address
- 87 -
Page 94

,CityName & ', ' & CountryName
,PostalCode
FROM Customers, Cities, Countries
WHERE Customers.CityCode = Cities.CityCode
AND Customers.CountryCode = Cities.CountryCode
AND Customers.CountryCode = Countries.CountryCode
ORDER BY CompanyName
6.3.4 Form Report
Uses FormReport method to generate a form report and group data. For a
form report, you can put data from data source as text, list, title and table in
the report file. WDReportCom gets data from a recordset object, copy the
group range for each group, and copy the detail range for each record.
Syntax
Report(…)
sqlstatement
Arguments
TYPE = “form”
CELL= celllist
RANGE = range
GROUP= grouplist
GROUPRANGE = grouprange
IMAGE = fieldlist
PAGEBREAK = pagelength
NODATA = nodataoption
CONNECT = datasource
The TYPE argument specifies the report type. "form" means a form report.
The CELL argument specifies the positions where data values will be inserted.
- 88 -
Page 95

The celllist is the list of merge fields or quote fields separated by the “,”
character. For example, “ProductName,ProductID,QuantityPerUnit,UnitPrice”.
The merge fields or quote fields in the celllist should correspond to the data
source fields in the SQL statement. The value of the first data source field is
put into the first merge field or quote field, and the value of the second data
source field is put into the second merge field or quote field ……
The RANGE argument specifies the range to be used for the records.
WDReportCom will repeat the range for each record. A range is defined by a
bookmark. You reference a range using a bookmark name. The default range
is the group range or the entire document.
The GROUP argument specifies the group of the report. The grouplist is the
list of data source fields separated by the “,” character. You can identify a field
using the name of field or the index number of field, but not simultaneously. In
one report, there may be up to 10 groups. The first GROUP is group one, the
second is group two...... Notes: the order of groups should be in accordance
with the order of ORDER BY clause in the SQL statement.
The GROUPRANGE argument follows the GROUP argument, and specifies
the range of the group in the table. For example, the grouprange of level 1
must follow the group of level 1, and the grouprange of level 2 must follow the
group of level 2. WDReportCom will repeat the range for each group. A range
is defined by a bookmark. You reference a range using a bookmark name.
The range of the group should contain the range of the details and the area
that includes all merge fields or quote fields for this group. For example, there
are two groups, the range of the group one contains all merge fields or quote
fields for the group one and the range of the group two, and the range of the
group two contains all merge fields or quote fields for the group two and the
range of the details. The default range is the range of the upper level group or
the entire document.
- 89 -
Page 96

The IMAGE argument specifies the fields are picture files. The fieldlist is the
list of data source fields separated by the “,” character. You can identify a field
using the name of field or the index number of field, but not simultaneously. In
data source, you stored the path and file name of the picture, not the picture.
The file path can be a relative path, an absolute path or a URL. If it is a
relative path, the base path is the path of the report template file.
The PAGEBREAK argument specifies the page breaks. The unit of page
length is r or g. "r" means record, "g1" means group one, "g2" means group
two...... For example, “6r” or “6” means that WDReportCom will insert a page
break per 6 records, “1g1” or “1g” means a page break per group one, and
“1g1,6r” means a page break per group one or 6 records. Default is “” that
means no page break.
The NODATA argument specifies an option when no data are returned from
data source. If the value is "delrange", WDReportCom will delete the range
when no data are returned. Default is to do nothing.
The CONNECT argument specifies the connection to a data source. The
CONNECT can takes a string that expresses a data source name or a number
that expresses a data source index. The index number of data source is the
sequential number defined in the WRF file, and starts at 1. The default implies
the first data source.
The sqlstatement is a SQL statement such as a SELECT statement.
Example
This example uses Form Report function to make the report “Product
Catalog”.
@F1=Report(type=form cell=CategoryName,Description
,ProductName,ProductID,QuantityPerUnit,UnitPrice
range=Product group=1,2 grouprange=Category)
- 90 -
Page 97

SELECT CategoryName
,Description
,ProductName
,ProductID
,QuantityPerUnit
,UnitPrice
FROM Products, Categories
WHERE Products.CategoryID = Categories.CategoryID
ORDER BY 1,3
6.3.5 MSGraph Chart
Uses MSGraphChart method to generate a chart. WDReportCom gets data
from a recordset object, and fills data into the datasheet of a chart in the
report file.
Syntax
Chart(…)
sqlstatement
Arguments
CHART = chart
FILLORDER = fillorder
CELL= celllist
RANGE = range
CONNECT = datasource
The CHART argument identifies a chart in the report template. The chart is
the index number or the bookmark name of the chart. The index number starts
at 1. For examples, chart 2 is the second chart in the document. You can
reference a chart by a bookmark. For examples, chart=”Chart1”. “Chart1” is
the bookmark of a chart.
- 91 -
Page 98

The FILLORDER argument specifies the order in which WDReportCom fill
data. Possible values are row or col. "row" means to fill data by rows, and
"col" means to fill data by columns. Default is col.
The CELL argument specifies the positions where data values will be inserted.
The celllist is the list of cells separated by the “,” character. For example,
“A2,B2,B3,D2,D3”. The cells in the celllist should correspond to the data
source fields in the SQL statement. The value of the first field is put into the
first cell, and the value of the second field is put into the second cell ……
WDReportCom will use the next cell if you omit a cell except the first cell. If
FILLORDER=“row”, the next cell is the right cell. If FILLORDER=“col”, the
next cell is the below cell. Note: On the datasheet, the leftmost column and
the top row, which are commonly used for legend text or axis labels, are
referred to as column 0 (zero) and row 0 (zero).
The RANGE argument specifies the range in the datasheet of the chart to be
used for the records. WDReportCom will skip the range for each record. You
can reference a range of cells like “2:4” or “B:D”. The default range is the area
that includes all cells for the records.
The CONNECT argument specifies the connection to a data source. The
CONNECT can takes a string that expresses a data source name or a number
that expresses a data source index. The index number of data source is the
sequential number defined in the WRF file, and starts at 1. The default implies
the first data source.
The sqlstatement is a SQL statement such as a SELECT statement.
Example
This example uses Chart function to make the chart “Sales by Categories”.
@F3_2=CHART(chart=Chart3 cell=A0)
SELECT c.CategoryName
, Sum(d.UnitPrice * d.Quantity * (1-d.Discount))
- 92 -
Page 99

FROM Orders o
,OrderDetails d
,Products p
,Categories c
WHERE o.OrderID = d.OrderID
AND d.ProductID = p.ProductID
AND p.CategoryID = c.CategoryID
AND YEAR(o.OrderDate) = 1996
AND MONTH(o.OrderDate) = 04
GROUP BY c.CategoryName
ORDER BY c.CategoryName
6.3.6 Excel Chart
Uses ExcelChart method to generate a chart. WDReportCom gets data from a
recordset object, and fills data into the worksheet of a chart in the report file.
Syntax
Chart(…)
sqlstatement
Arguments
CHART = chart
TYPE = type
FILLORDER = fillorder
CELL= celllist
RANGE = range
CONNECT = datasource
The CHART argument identifies a chart in the report template. The chart is
the index number or the bookmark name of the chart. The index number starts
at 1. For examples, chart 2 is the second chart in the document. You can
- 93 -
Page 100

reference a chart by a bookmark. For examples, chart=”Chart1”. “Chart1” is
the bookmark of a chart.
The TYPE argument specifies the report type. Possible values are fix or var.
"fix" means that WDReportCom will directly fill data vales into the worksheet
of the chart. "var" means that WDReportCom will add some blank
rows/columns before filling data values into the worksheet of the chart. Default
is var. When the report type is “var”, you should reserve two rows/columns in
the worksheet in the report template, and set the data range of the chart to 2
rows/columns. The RESERVE must be 2.
The FILLORDER argument specifies the order in which WDReportCom fill
data. Possible values are row or col. "row" means to fill data by rows, and
"col" means to fill data by columns. Default is row.
The CELL argument specifies the positions where data values will be inserted.
The celllist is the list of cells or fields separated by the “,” character. The
celllist identifies the cells in a worksheet. For example, “A2,B2,B3,D2,D3”. The
cells in the celllist should correspond to the data source fields in the SQL
statement. The value of the first field is put into the first cell, and the value of
the second field is put into the second cell …… WDReportCom will use the
next cell if you omit a cell except the first cell. If FILLORDER=”row”, the next
cell is the right cell. If FILLORDER=”col”, the next cell is the below cell.
The RANGE argument specifies the range in the worksheet of the chart to be
used for the records. WDReportCom will skip the rows/columns of the range
for each record. A range is composed of some rows or columns. You can
reference a range of cells like “2:4” or “B:D”. The default range is the area that
includes all cells for details. For a variable table report, WDReportCom will
insert the blank rows/columns of the range for each record.
The CONNECT argument specifies the connection to a data source. The
CONNECT can takes a string that expresses a data source name or a number
- 94 -
 Loading...