

Page 1
Varistor Testing
Application Note January 1998
Introduction
This note details the common tests of varistor parameters and
describes suitable test methods using simplied test circuits.
All tests are performed at 25
The test circuits and methods given herein are intended as
a general guide. Since the tests frequently entail high
voltages and currents, the user must exercise appropriate
safety precautions.
Engineering Evaluation
It is important to focus on the key characteristics and
ratings to determine if the component can perform as
expected. Typically, for a varistor, its nominal voltage,
clamping voltage, standby current, insulation resistance,
and capacitance are measured. The surge current, or
energy, and waveshape available in the circuit together with
its frequency of occurrence should be measured or
computed. The characteristics of these expected transients
should then be checked against the pulse ratings and the
power dissipation ratings of the selected varistor type.
Where suitable equipment is available, these ratings may
be veried.
Product Qualication
A product qualication plan often will be used to detail the
electrical and environmental tests to which sample
components may be subjected. The suggested electrical
characteristics tests could include (with appropriate
conditions and limits): nominal varistor voltage, V
maximum clamping voltage,
(optional, especially for AC applications); insulation
resistance; and capacitance. A test to ensure surge current
withstand capability may be included in the qualication
plan. This test must be carefully performed and specied (by
using either 8/20µs or 10/1000µs waveshapes) consistent
with the pulse lifetime rating chart of the varistor selected.
Other qualication tests may be used to ensure mechanical
integrity, humidity resistance, solderability, and terminal/lead
strength.
Incoming Inspection
The equipment maker may wish to verify that shipments
received consist of correct parts at the expected quality
level. For incoming inspection of Littelfuse Varistors, it is
recommended that sample testing include nominal varistor
voltage (V
voltages specied on the purchase drawing/specication.
Other electrical sampling tests frequently performed can
include insulation resistance and capacitance. Tests such as
maximum clamping voltage, V
are usually checked only on a periodic audit basis.
) tested against the minimum and maximum
N
o
C, unless otherwise specied.
;
N
VC; DC standby current, ID
, and DC standby current, ID,
C
AN9773
Field Maintenance
Field maintenance testing is done to verify that the varistor is
still providing the intended protection function.
The nominal varistor voltage should be tested against the
minimum limits for the model using the method described in
the Nominal Varistor Voltage V
section. If the varistor is
N
open, short, or more than 10% outside either limit, it should
be replaced. The DC standby current may also be measured.
Measurement of Varistor Characteristics [1]
Nominal Varistor Voltage V
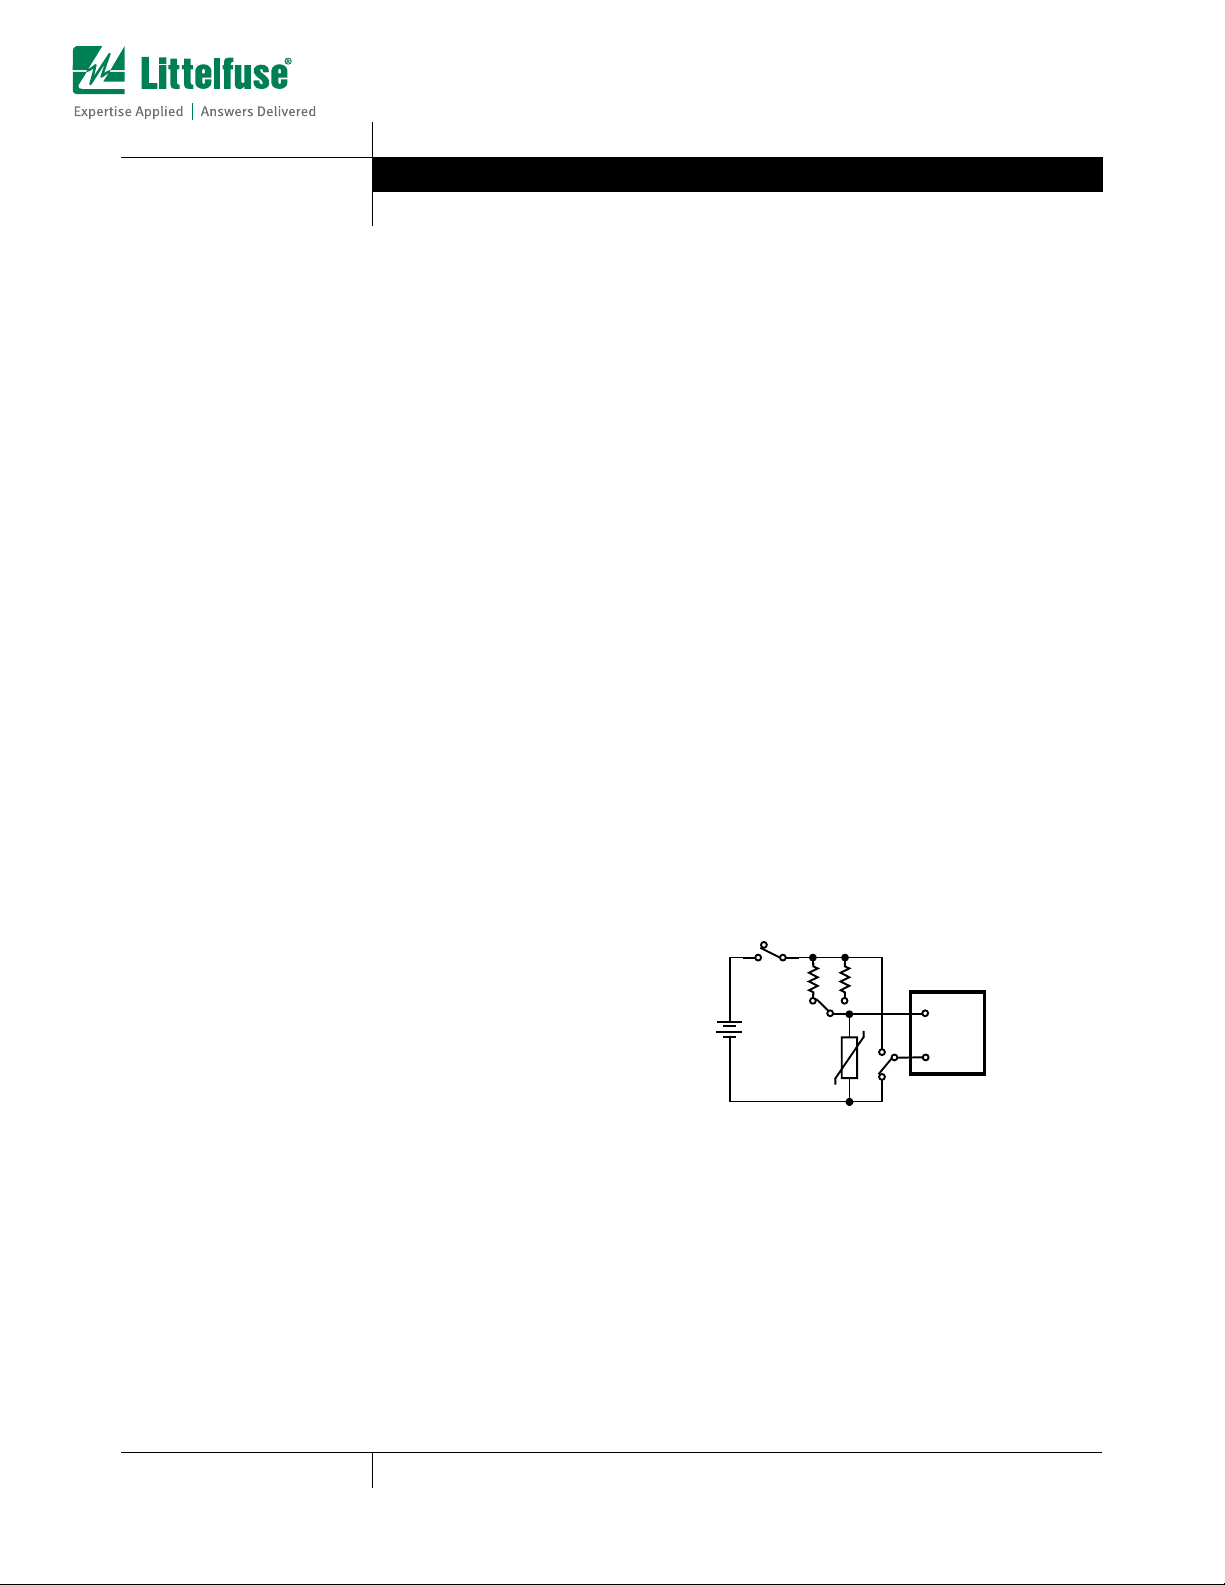
This is measured at a DC test current, I
models. A simplied circuit for instrumenting this test, shown
in Figure 1, is suitable for varistors up through a rating of
300V
voltage will be needed. Resistor R1 has a dual purpose. In
conjunction with the variable voltage supply, E1, it forms a
quasi-current source providing up to 6mA when switch S1 is
closed. Also, R1 is used as a current sensor to measure
current owing through the varistor-under-test. To use the
circuit, the operator places switch S2 in position I and S3 into
position V
S1 is closed. E1 is then adjusted to obtain a reading of 100V
±5V on the digital voltmeter. Approximately 1mA of current
will be owing in R1. When switch S2 is placed in position V,
the varistor voltage will be indicated on the voltmeter. The
values of R1 and E1 supply voltage can be scaled
appropriately for other voltage-current test points.
If the varistor voltage test is implemented on automatic test
equipment, a “soak” time of 20ms minimum should be
allowed after application of test current before voltage
measurement. This is necessary to allow varistor voltage to
settle toward a steady-state value. Figure 2 illustrates the
time response of a specimen varistor with a constant 1.0mA
current applied. As can be seen, the varistor voltage initially
may rise to a value up to 6% greater than nal. With a 20ms
or greater soak time, the measured value will differ by less
than 2% from the steady-state value.
. Above the 300V
RMS
. A test device is then inserted into the socket and
N
S1
R1
S3
V
0V-600V
E1
FIGURE 1. SIMPLIFIED CIRCUIT FOR VARISTOR VOLTAGE
AND DC STANDBY CURRENT TESTS
N
N
of 1mA for product
N
rating, a higher supply
RMS
R2
I
D
+
I
DVM
S2
-
V
R1 = 100kΩ, 1%, 1W(V
R2 = 1kΩ, 1%, 1/2W(I
TEST)
N
TEST)
D
10-141
1-800-999-9445 or 1-847-824-1188 | Copyright © Littelfuse, Inc. 1998
Page 2
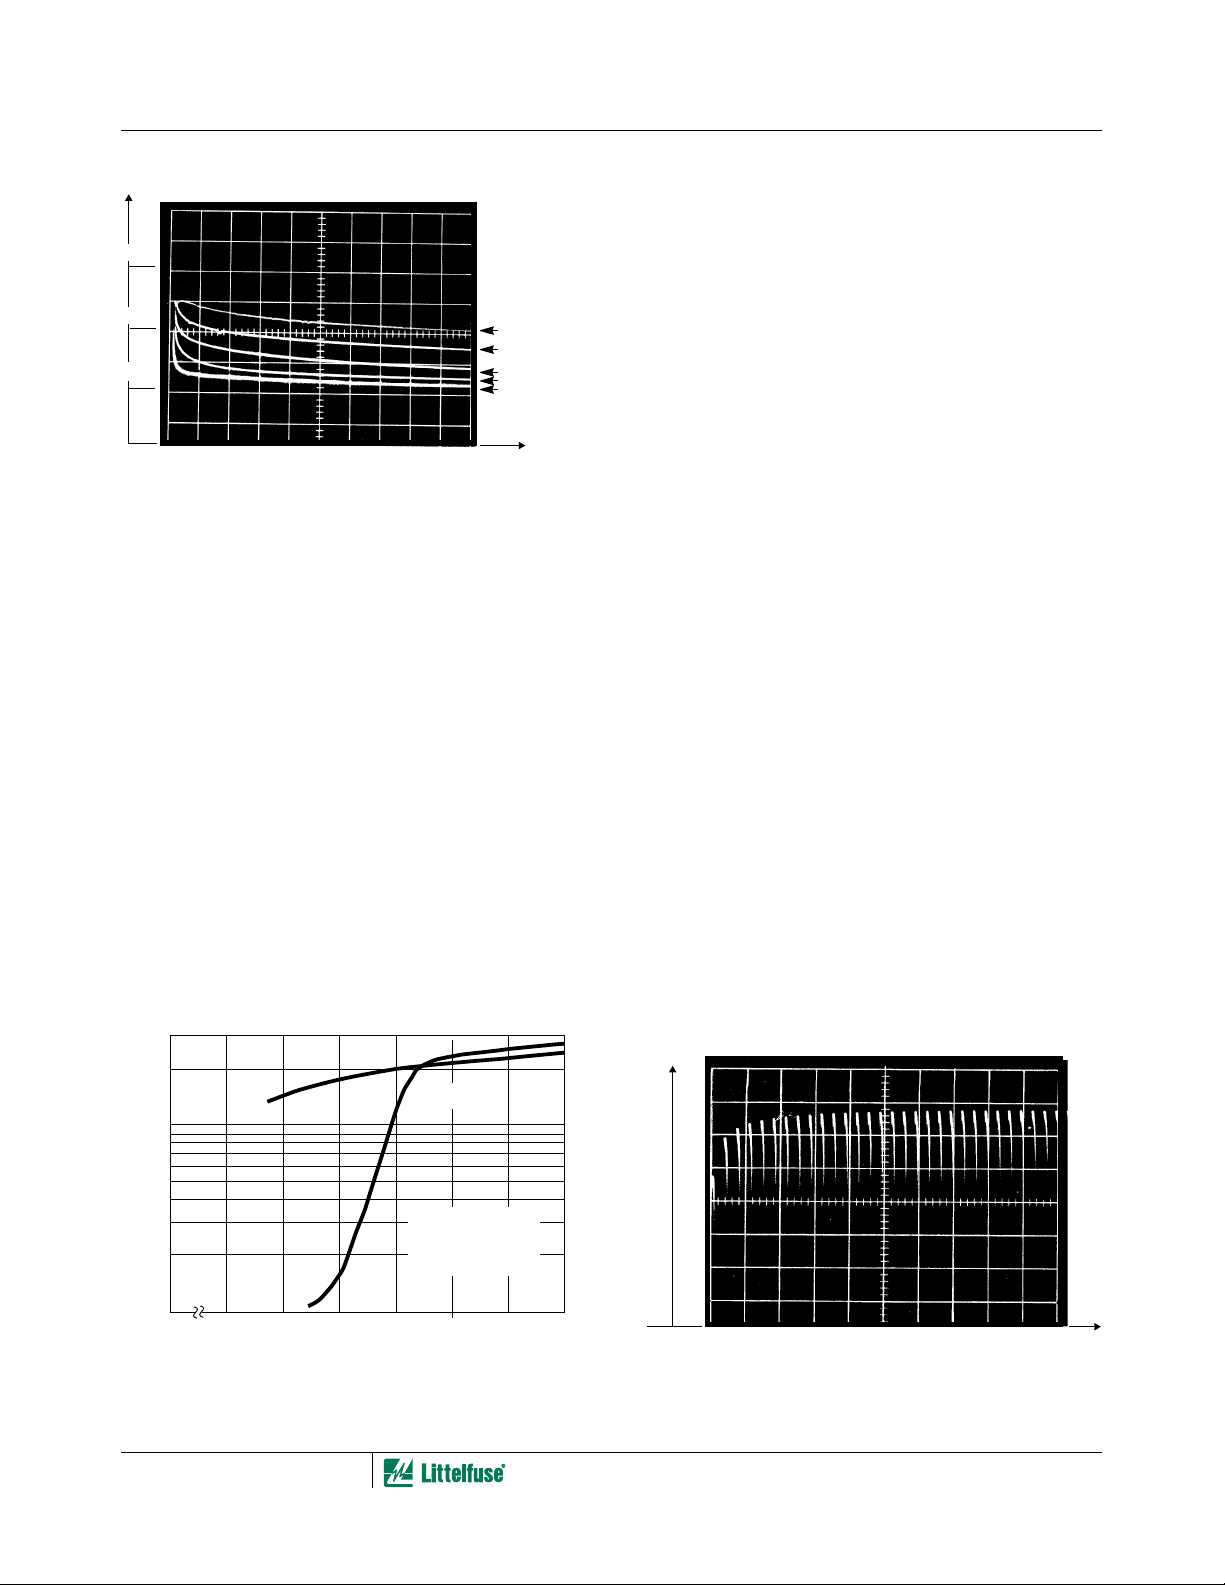
C
Application Note 9773
V (T)
5V/DIV
250V
240V
230V
FIGURE 2. VOLTAGE-TIME V(T) CHARACTERISTICS OF A
LITTELFUSE VARISTOR (V130LA10A)
OPERATING AT A CONSTANT DC CURRENT OF
0.1ms/DIV
1ms/DIV
10ms/DIV
100ms/DIV
1000ms/DIV
T
For varistor models that are commonly used on 60Hz power
lines, the V
limits may be specified for a 1.0mA peak AC
N
current applied. If an AC test is preferred by the user, a
schematic approach similar to that shown in Figure 1 is used,
except an AC VARIAC™ is substituted for the DC power supply,
and an oscilloscope is substituted for the voltmeter. This circuit
is equivalent to that of a typical curve tracer instrument.
To avoid unnecessary concern over minor measurement
anomalies, three behavioral phenomena of metal-oxide
varistors should be noted. First, it is normal for the peak
varistor voltage measured with AC current to be about 2% to
5% higher than the DC value, as illustrated by Figure 3. This
“AC-DC difference” is to be expected, since the one-quarter
cycle period of a 60Hz wave is much less than the 20ms
minimum settling time required for DC readout.
Second, it is normal for the varistor voltage to increase
slightly when first subjected to electrical current, as shown in
Figure 4. This might be considered a “break-in” stabilization
of the varistor characteristics. During normal measurement
the voltage shift typically is less than 1%. This voltage shift is
of little consequence for most measurement purposes but
might be noticeable when viewing a DVM as in the test
method of Figure 1. The visual DVM observation should be
made shortly after power is applied, with measurement to
not more than three significant figures.
Third, it is normal for the varistor voltage-current
characteristic to become slightly asymmetrical in polarity
under application of DC electrical stress over time. The
varistor voltage will increase in the same direction as the
polarity of stress, while it will be constant or will decrease in
the opposite polarity. This effect will be most noticeable for a
varistor that has been subjected to unipolar pulse stresses
or accelerated DC life tests. Therefore, to obtain consistent
results during unipolar pulse or operating life tests, it is
essential to provide a polarity identification for the test
specimens. However, for initial readout purposes, this effect
usually is insignificant.
Maximum Clamping Voltage, V
Two typical current impulses that may be used to define the
varistor clamping voltage are the 8/20 µ s and the 10/1000 µ s
pulses. Figure 5 shows typical varistor test waveforms for
these two impulses.
The clamping voltage of a given model varistor at a defined
current is related by a factor of the varistor voltage.
Therefore, a test of the nominal varistor voltage against
specifications may be sufficient to provide reasonable
assurance that the maximum clamping voltage specification
is also satisfied. When it is necessary to perform the V
special surge generators are required. For shorter impulses
than 8/20 µ s, precautions must be observed to avoid an
erroneous “overshoot” in the measurement of the clamping
voltage. The Equipment for Varistor Electrical Testing section
gives general information on surge generators; a brief
description of the “overshoot” effect follows.
test,
C
V(T)
5V/DIV
DC
100
VOLTAGE (V)
10
10
FIGURE 3. AC AND DC CHARACTERISTIC CURVES FIGURE 4. V130LA10A) VARISTOR VOLTAGE FOR THE
-6
-7
10
-5
10
I, CURRENT (A)
10-142
AC 60Hz
130V
RMS
PRODUCT
MEDIUM VOLTAGE
MATERIAL
-4
10
10-310-210
RATED
-1
INITIAL CYCLES OF 60Hz OPERATION AT A
PEAK CURRENT OF 1.0mA
VARIAC™ is a trademark of Glen Rad, Inc.
T, 50ms/DIV
Page 3
Application Note 9773
10A/DIV
100V/DIV
0
FIGURE 5A. 8/20 µ s, WAVE I
OUTPUT LEAD
FROM
TRANSIENT
GENERATOR
AREA ≈
0.5cm
10µs/DIV
= 50A, V
P
= 315V
P
FIGURE 5B. 10/1000 µ s, WAVE I
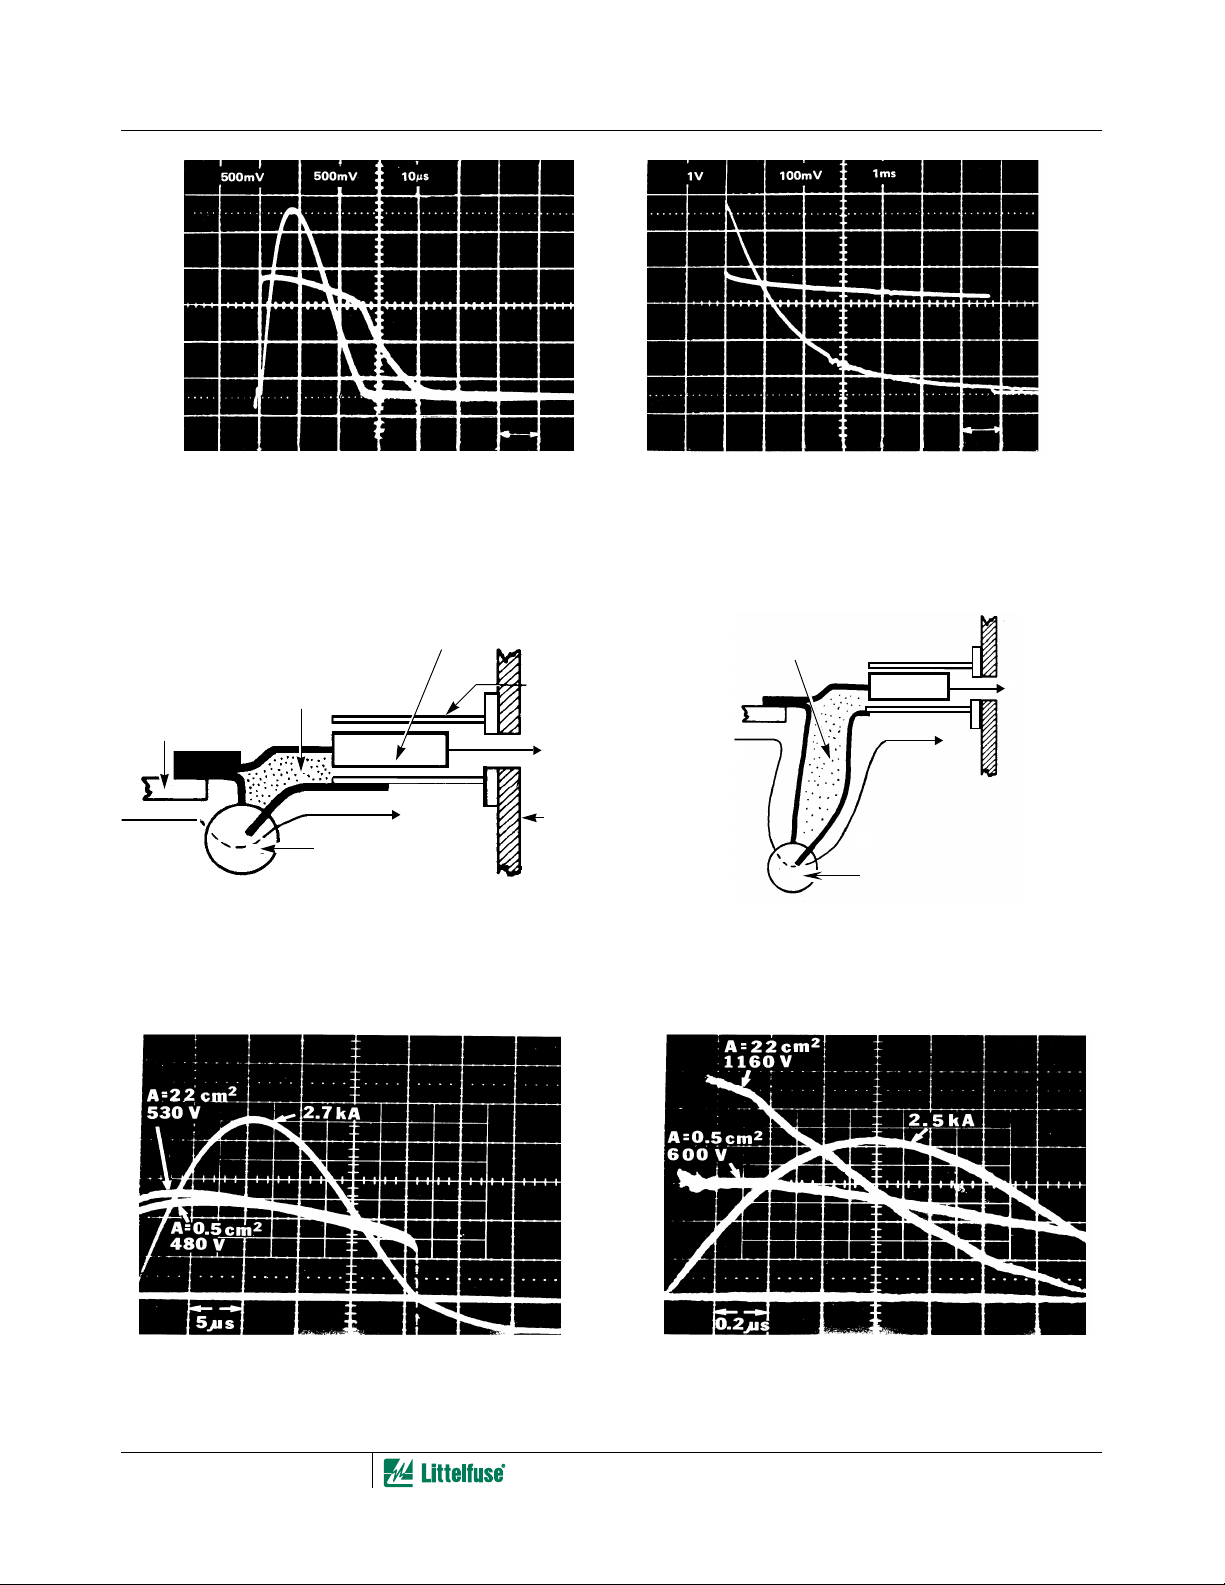
FIGURE 5. TYPICAL CLAMPING VOLTAGE TEST WAVEFORMS (LITTELFUSE
FIGURE 6. VARISTOR TYPE V130LA10A)
VOLTAGE PROBE
2
COPPER TUBE
SURROUNDING
VOLTAGE PROBE
CURRENT
PATH
AREA
22cm
≈
2
1ms/DIV
= 50A, V
P
= 315V
C
10A/DIV
100V/DIV
0
CURRENT
PAT H
VARISTOR
FIGURE 7A. MINIMAL LOOP AREA
GROUND
VARISTOR
FIGURE 7B. EXCESSIVE LOOP AREA TYPICAL
“OVERSHOOT” OF LEAD-MOUNTED VARISTOR
WITH STEEP CURRENT IMPULSES
FIGURE 7C. CURRENT RISE OF 8 µ s FIGURE 7D. CURRENT RISE OF 0.5 µ s
FIGURE 7. EFFECT OF LEAD LENGTH ON “OVERSHOOT”
10-143
Page 4

Application Note 9773
D
The Littelfuse Varistor specification sheets show the VI
characteristic of the devices on the basis of maximum voltage
appearing across the device during a current pulse of 8/20 µ s. If
current impulses of equal magnitude but faster rise are applied
to the varistor, higher voltages will appear across the device.
These higher voltages, described as “overshoot,” are partially
the result of an intrinsic increase in the varistor voltage, but
mostly of the inductive effect of the unavoidable lead length.
Therefore, as some applications may require current impulses
of shorter rise time than the conventional 8 µ s, careful attention
is required to recognize the contribution of the voltage
associated with lead inductance [1].
The varistor voltage, because of its nonlinearity, increases only
slightly as the current amplitude of the impulse increases. The
voltage from the lead inductance is strictly linear and therefore
becomes large as high current amplitudes with steep fronts are
applied. For that reason, it is impractical to specify clamping
voltages achieved by lead-mounted devices with current
impulses having rise times shorter than 0.5 µ s, unless circuit
geometry is very accurately controlled and described.
To illustrate the effect of lead length on the “overshoot,” two
measurement arrangements were used. As shown in Figures
6A and 6B, respectively, 0.5cm2 and 22cm2 of area were
enclosed by the leads of the varistor and of the voltage probe.
The corresponding voltage measurements are shown in the
oscillograms of Figures 6C and 6D. With a slow current front
of 8 µ s, there is little difference in the voltages occurring with
a small or large loop area, even with a peak current of 2.7kA.
With the steep front of 0.5 µ s, the peak voltage recorded with
the large loop is nearly twice the voltage of the small loop.
(Note on Figure 6D that at the current peak, L di/dt = 0, and
the two voltage readings are equal; before the peak, L di/dt
is positive, and after, it is negative.)
Hence, when making measurements as well as when
designing a circuit for a protection scheme, it is essential to
be alert to the effects of lead length (or more accurately of
loop area) for connecting the varistors. This is especially
important when the currents are in excess of a few amperes
with rise times of less than 1 µ s.
With reasonable care in maintaining short leads, as shown in
Figure 6A, it is possible to describe the “overshoot” effect as an
increase in clamping voltage relative to the value observed with
a 8/20 µ s impulse. Figure 7 shows a family of curves indicating
the effect between 8 µ s and 0.5 µ s rise times, at current peaks
ranging from 20A to 2000A. Any increase in the lead length, or
area enclosed by the leads, would produce an increase in the
voltage appearing across the varistor terminals - that is, the
voltage applied to the protected load.
DC Standby Current, I
This current is measured with a voltage equal to the rated
continuous DC voltage, V
The circuit of Figure 1 is applicable where current sensing
resistor R2 has a value of 1000 Ω . The test method is to set
the voltage supply, E1, to the specified value with switch S1
closed and S2 in the V position. Then S2 is placed in position
I and S3 in position, I
. S1 is then opened, the test device is
D
inserted in the test socket, and S1 is closed. The DVM
reading must be converted into current. For example, if a
maximum standby current of 200 µ A is specified, the
maximum acceptable DVM reading would be 0.200V.
The measurement of DC standby current can be sensitive to
the device behavioral phenomena of “break-in” stabilization
and polarization of the VI characteristics, as described in the
Nominal Varistor Voltage V
has prior unipolar electrical history, polarity indicators should
be observed and test values interpreted accordingly.
, applied across the varistor.
M(DC)
section. If the device under test
N
DEVICE: V130LA20A
LEAD AREA <1cm
1000
800
600
400
200
CLAMPING VOLTAGE (V)
10
FIGURE 8. TYPICAL “OVERSHOOT” OF LEAD-MOUNTED
VARISTOR WITH STEEP CURRENT IMPULSES
2
WAVESHAPE
0.5/1.5µs
1/3µs
8/20µs
604020
80100 200 400 600 800 1000 2000
PEAK CURRENT (A)
10-144
100
80
60
50
C (%)
o
40
30
20
VALUE AT 25
N
V
VARISTOR VOLTAGE IN PERCENT OF
10
-9
10
FIGURE 9. TYPICAL TEMPERATURE DEPENDENCE OF DC
C
o
o
50
25
-8
10
STANDBY CURRENT VARISTOR TYPE
V130LA10A
C
C
o
5
7
-7
10
VARISTOR CURRENT (ADC)
C
C
o
o
5
2
100
1
SPECIMEN: V130LA10A
-5
-6
10
10
-3
-4
10
10
-2
10
Page 5

Application Note 9773
1400
1200
1000
CAPACITANCE (pF)
800
600
10
FIGURE 10. CAPACITANCE VARIATION WITH FREQUENCY FIGURE 11. DISSIPATION FACTOR VARIATION WITH
2
3
10
10
10410
FREQUENCY (Hz)
X
X
XX
X
X
X
X
X
X
X
X
X
X
X
X
X
X
X
5
10610710
X
X
X
X
X
X
X
X
X
X
X
X
X
8
The value of DC standby current also can be sensitive to
ambient temperature. This is unlike varistor characteristics
measured at currents of 1mA or greater, which are relatively
insensitive to ambient temperatures. With V
85% of V
, Figure 8 shows the typical DC standby current of
N
a model V130LA10A varistor in the order of 10 µ A or 20 µ A at
room temperature. I
increases to about 80 µ A at 85
D
M(DC)
around
o
C, the
0.12
x
x
0.10
0.08
0.06
0.04
DISSIPATION FACTOR, D
0.02
0
10210
10
FREQUENCY
3
4
10
FREQUENCY (Hz)
x
x
x
x
x
x
x
10
x
5
6
10
may be obtained by measurement methods similar to those
already given for nominal varistor voltage and maximum
clamping voltage. These miscellaneous characteristics may
be useful in some cases to enable comparison of Littelfuse
Varistors with other types of nonlinear devices, such as those
based on silicon carbide, selenium rectifier or zener diode
technologies.
maximum operating temperature without derating.
Capacitance
Since the bulk region of a Littelfuse Varistor acts as a
dielectric, the device has a capacitance that depends
directly on its area and varies inversely with its thickness.
Therefore, the capacitance of a Littelfuse Varistor is a
function of its voltage and energy ratings. The voltage
rating is determined by device thickness, and the energy
rating is directly proportional to volume.
Littelfuse Varistor capacitance can be measured through use
of a conventional capacitance bridge and is found to vary
with frequency, as shown in Figure 9. Typically, capacitance
measurements are made at 1MHz. Dissipation factor also is
frequency-dependent, as shown in Figure 10.
When measured with a DC bias, the capacitance and
dissipation factor show little change until the bias approaches
or exceeds the V
value. Furthermore, the capacitance change
N
caused by an applied voltage (either DC or AC) may persist
when the voltage is removed, with the capacitance gradually
returning to the prebias value. Because of this phenomenon, it
is important that the electrical history of a Littelfuse Varistor be
known when measuring capacitance.
Miscellaneous Characteristics
A number of characteristic measurements can be derived
from the basic measurements already described, including
the nonlinear exponent (alpha), static resistance, dynamic
impedance, and voltage clamping ratio. The data, however,
Varistor Rating Assurance Tests
Continuous Rated RMS and DC Voltage [V
and V
These are established on the basis of operating life tests
conducted at the maximum rated voltage for the product
model. These tests usually are conducted at the maximum
rated ambient operating temperature, or higher, so as to
accelerate device aging. Unless otherwise specified,
end-of-lifetime is defined as a degradation failure equivalent
to a V
point the device is still continuing to function. However, the
varistor will no longer meet the original specifications.
A typical operating life test circuit is shown in Figure 11. If
the varistor is intended principally for a DC voltage
application, then the AC power source should be changed to
DC. It is desirable to fuse the varistors individually so testing
is not interrupted on other devices if a fuse should blow. The
voltage sources should be regulated to an accuracy of ± 2%
and the test chamber temperature should be regulated to
within ± 3
fan to assure a uniform temperature throughout its interior.
The varistors should receive an initial readout of
characteristics at room ambient temperature i.e., 25 ± 3
They should then be removed from the chamber for
subsequent readout at 168,500, and 1000 hours. A minimum
of 20 minutes should be allowed before readout to ensure
that the devices have cooled off to the room ambient
temperature.
]
M(DC)
shift in excess of ± 10% of the initial value. At this
N
o
C. The chamber should contain an air circulation
x
x
x
x
x
x
x
x
7
10
M(AC)
8
10
o
C.
10-145
Page 6

Application Note 9773
FUSE
1/4A
130V
AC
±2%
V130LA10A
TEST CHAMBER
FIGURE 12. SIMPLIFIED OPERATING LIFE TEST CIRCUIT
Transient Peak Current, Energy, Pulse Rating, and
Power Dissipation Ratings
Special surge generator equipment is required for testing.
Since high energy must be stored at high voltages to
perform these tests, especially on larger sizes of Littelfuse
Varistors, the equipment must be operated using adequate
safety precautions.
The peak current rating, I
on an 8/20µs test impulse waveshape. The specifications
include a maximum single value in the ratings table. A pulse
rating graph defines the peak current rating for longer
impulse duration as well, such as for a 10/1000µs wave. A
family of curves defines the rated number of impulses with a
given impulse duration and peak current.
Energy rating, W
, is defined for a 10/1000µs current impulse
TM
test wave. This waveshape has been chosen as being the best
standard wave for tests where impulse energy, rather than peak
current, is of application concern. A direct determination of
energy dissipated requires that the user integrate over time the
product of instantaneous voltage and current.
Peak voltage and current are readily measured with
available equipment. Therefore, the energy rating can be
tested indirectly by applying the rated peak impulse current
of a 10/1000µs waveshape to the test specimen. Then, the
energy dissipated in the varistor can be estimated from the
known pulse waveshape. For a 10/1000µs waveshape the
approximate energy is given by the expression E = 1.4V
For example, a model V130LA10A varistor has a single pulse
rating for a 10/1000µs impulse waveshape of about 75A peak,
and a maximum clamping voltage at 75A of about 360V. Thus,
the computation of estimated energy dissipation is 38J.
The transient power dissipation rating, P
maximum average power of test impulses occurring at a
specified periodic rate. It is computed as the estimated energy
dissipation divided by the test pulse period. Therefore, varistors
can be tested against this rating by applying two or more
impulses at rated current with a specified period between
pulses. For example, a model V130LA10A varistor has a pulse
rating of two 10/1000µs test impulses with a peak current of
about 65A. The estimated energy dissipation per pulse
computed as per the preceding example is about 30J. If a
period of 50s is allowed after the first test pulse, the estimated
of Littelfuse Varistors is based
TM
, is defined as the
TA M
Iτ.
C
average power dissipation can be computed as about 0.6W,
which is the specification rating. It should be noted that
Littelfuse Varistors are not rated for continuous operation with
high-level transients applied. The transient power dissipation
rating is based on a finite number of pulses, and the pulse
rating of the varistor must be observed. See Figure 12.
1V
100mV
10/1000µs WAVEFORM
FIGURE 13. SURGE TEST WAVEFORMS
1ms
10A/DIV
100V/DIV
0
1ms/DIV
Table 1 outlines a suggested program of testing to verify
varistor transient and pulse ratings with a minimum of
expensive, time-consuming testing. New specimens should
be used for each test level and failure judged according to
the specification criteria.
TABLE 1. TESTING OF TRANSIENT CURRENT, ENERGY,
PARAMETER
Maximum Peak
Current
Pulse/Energy
Rating, Power
Dissipation
Pulse Rating 10 8/20 25
Pulse Rating 100 8/20 12
PULSE RATING, AND POWER DISSIPATION
RATINGS
NO. PULSES AT
RATED
TEST
CURRENT
(ALTERNATING
POLARITY)
1 (Same Polarity
as Readout)
2 10/1000 or
TEST
WAVESHAPE
2ms Square
Wave
MINIMUM
PULSE
(µs)
8/20 NA
PERIOD
(s)
50
Continuous Power Dissipation
Since Littelfuse Varistors are used primarily for transient
suppression purposes, their power dissipation rating has
been defined and tested under transient impulse conditions.
If the devices are to be applied as threshold sensors or
coarse voltage regulators in low power circuits, then a
dissipation test under continuous power is more appropriate.
This continuous power test will aid the user in determining if
the device is suitable for his specific application.
10-146
Page 7

Application Note 9773
A circuit for continuous power dissipation testing is shown
in Figure 13. The DC power supply voltage should be set to
a value of approximately twice the nominal varistor voltage
of the product model under test. In that case, nearly
constant power dissipation is maintained in the varistor.
Since the circuit transfers nearly equal power to the series
resistor and varistor-under-test, the series resistor value is
simply chosen to achieve the test design value of power
dissipation. In Figure 13 a nearly constant power
dissipation of about 0.6W is obtained.
68kΩ
1W
400V
DC
±2%
FIGURE 14. CONSTANT POWER LIFE TEST CIRCUIT
5%
V130LA10A
TEST CHAMBER
Mechanical and Environmental Testing of
Varistors
Introduction
Many tests have been devised to check the reliability of
electronic components when subjected to mechanical and
environmental stresses. Although individual equipment
makers may specify their own tests on component purchase
documents, these tests are often based on an equivalent
MIL-STD specification. Therefore, it is convenient to
summarize these tests in MIL-STD terms. Since the ratings
of Littelfuse Varistors may vary with product series and
model, the test conditions and limits should be as specified
on the applicable detail specification.
Littelfuse Varistors are available in a high reliability series.
This series incorporated most standard mechanical and
environmental tests, including 100% pre-screening and
100% process conditioning.
UL Recognition Tests
The standards of Underwriters Laboratories, Inc. (UL) under
which applicable Littelfuse Varistors have been tested and
recognized are:
• UL-1449 Transient Voltage Surge Suppressors, File E75961
• UL-1414 Across the Line Components, File E56529
• UL-497B Protectors for Data Communications, File E135010
The tests were designed by UL and included discharge
(withstand of charged capacitor dump), expulsion (of
complete materials), life, extended life, and flammability
(UL94V0) tests, etc.
Equipment for Varistor Electrical Testing
Impulse Generators
A convenient method of generating current or voltage surges
consists of slowly storing energy in a capacitor network and
abruptly discharging it into the test varistor. Possible energy
storage elements that can be used for this purpose include
lines (lumped or distributed) and simple capacitors,
depending on the waveshape desired for the test. Figure 14
shows a simplified schematic for the basic elements of an
impulse generator.
R1
R2
VARISTOR
UNDER
TEST
R3
OSCILLOSCOPE
V
COM
I
S2S1
L
E1
FIGURE 15. SIMPLIFIED CIRCUIT OF SURGE IMPULSE
C
GENERATOR
The circuit is representative of the type used to generate
exponentially decaying waves. The voltage supply, E1, is
used to charge the energy storage capacitor, C, to the
specified open-circuit voltage when switch S1 is closed.
When switch S2 (an ignition or a triggered gap) is closed, the
capacitor, C, discharges through the waveshaping elements
of the circuit into the suppressor device under test. With
capacitances in the order of 1µF to 10µF and charging
voltages of 10kV to 20kV, the typical 8/20µs or 10/1000µs
impulses can be obtained by suitable adjustment to the
waveshaping components L, R1, and R2, according to
conventional surge generator design [2, 3, 4, 5].
Measurement Instrumentation
Transient measurements include two aspects of varistor
application: (1) detection of transients to determine the need
for protection, and (2) laboratory measurements to evaluate
varistor performance. Transient detection can be limited to
recording the occurrence of transient overvoltages in a
particular system or involve comprehensive measurements
of all the parameters which can be identified. Simple
detection can be performed with peak-indicating or peakrecording instruments, either commercial or custom-made.
Test Waves and Standards
The varistor test procedures described in this section have
been established to ensure conformity with applicable
standards [6], as well as to reflect the electromagnetic
environment of actual circuits [7] which need transient
protection.
10-147
Page 8

Application Note 9773
Test Waves
A number of test waves have been proposed, in order to
demonstrate capability of survival or unimpeded
performance in the environment. A proposal also has been
made to promote a transient control level concept [7]
whereby a few selected test waves could be chosen by
common agreement between users and manufacturers. The
intent being that standard test waves would establish certain
performance criteria for electronic circuits.
Source Impedance
The effective impedance of the circuit which introduces the
transient is an extremely important parameter in designing a
protective scheme. Impedance determines the energy and
current-handling requirements of the protective device.
When a transient suppressor is applied, especially a
suppressor of the energy-absorbing type, such as a varistor,
the transient energy is then shared by the suppressor and
the rest of the circuit, which can be described as the
“source”.
As in the case of waveshapes, various proposals have been
made for standardizing source impedances. The following list
summarizes the various proposals intended for AC power lines:
1. The Surge Withstand Capability (SWC) standard
specified a 150Ω source.
2. The Ground Fault (UL-GFCI) standard is 50Ω source [8].
3. The Transient Control Level (TCL) proposals of Martzloff
et. al. [7] include a 50Ω resistor in parallel with a 50µH
inductor.
4. The installation category concept of ANSI/IEEE Standard
C62.41-1980 implies a range of impedances from 1Ω to
50Ω as the location goes from outside to inside.
5. The FCC regulation for line-connected telecommunication
equipment implies a 2.5Ω source impedance [9]. However,
the requirement of the FCC is aimed at ensuring a
permanent “burning” of a dielectric puncture and does not
necessarily imply that the actual source impedance in the
real circuits is 2.5Ω.
6. Reported measurements [10] indicate the preponderance
of the inductance in branch circuits. Typical values are µH
per meter of conductors.
7. There is no agreement among the above proposals on a
specific source impedance. Examining the numbers
closer, one can observe that there is a variance between
2.5Ω to about 50Ω. Going back to ANSI/IEEE Standard
C62.41-1980 by using the Open Circuit voltage (OCV)
and SCI (short circuit current) for the different location
categories, one can calculate a source impedance.
Any practical power circuit will always have some finite
impedance due to the resistance and inductance of the
power line and distribution transformer. Table 2 shows
representations of the surge source impedance implied in
the environment description of ANSI/IEEE C62.41-1980.
TABLE 2. SOURCE IMPEDANCE AT DIFFERENT LOCATION
CATEGORIES IN LOW VOLTAGE AC SYSTEMS (UP
TO 1000V)
Category A Ring Wave 6kV/200A = 30Ω
Category B Ring Wave 6kV/500A = 12Ω
Category B Impulse 6kV/3kA = 2Ω
Category C Impulse 10kV/10kA = 1Ω
The impedance of industrial or commercial systems
generally supplied by underground entrances, or a separate
substation of relatively large kVA rating, tends to be low, and
the injection of any lightning transients occurs at a remote
point. This results in lower transient peaks than those that
can be expected in residential circuits, but the energy
involved may be, in fact, greater. Therefore, transient
suppressors intended for industrial use should have greater
energy-handling capability than the suppressors
recommended for line-cord-powered appliances.
References
For Littelfuse documents available on the web, see
http://www.littelfuse.com/
[1] Fisher, F.A., “Overshoot - A Lead Effect in Varistor
Characteristics,” Report 78CRD, General Electric,
Schenectady, N.Y., 1978.
[2] Heller, B. and A. Veverka, “Surge Phenomena in
Electrical Machine”, ILIFFE Books Ltd., London, 1968.
[3] Greenwood, Allen, “Electrical Transients in Power
Systems”, Wiley Interscience, New York, 1971.
[4] Craggs, J.D. and J.M. Meek, “High Voltage Laboratory
Techniques”, Buttersworth Scientific Publications,
London, 1954.
[5] Martzloff, F.D., “Transient Control Level Test
Generators”, Report 77CRD241, General Electric,
Schenectady, N.Y., 1977.
[6] “Test Specifications for Varistor Surge-Protective
Devices”, ANSI/IEEE Std. C62.33, 1982.
[7] Martzloff, F.D., and F.A. Fisher, “Transient Control Level
Philosophy and Implementation - The Reasoning
Behind the Philosophy,” 77CH1224-5EMC,
“Proceedings of the 2nd Symposium on EMC”,
Montreux, June 1977.
[8] “Standard for Safety: Ground Fault Circuit Interrupters,”
UL943, Underwriters Laboratories, May 12,1976.
[9] “Longitudinal Voltage Surge Test #3,” Code of Federal
Regulations, Section 68.302(e), Title 47,
Telecommunications.
[10] F.D. Martzloff, “The Propagation and Attenuation of
Surge Voltages and Surge Currents in Low-Voltage AC
Circuits,” IEEE Transactions on Power Apparatus and
Systems, PAS-102, pp. 1163-1170, May 1983.
10-148
 Loading...