

Reliable Precision Voltage Reference
OUTPUT VOLTAGE (V)
2.4985
0
NUMBER OF UNITS
40
60
80
180
140
2.5005
20
160
120
2.4995 2.5015
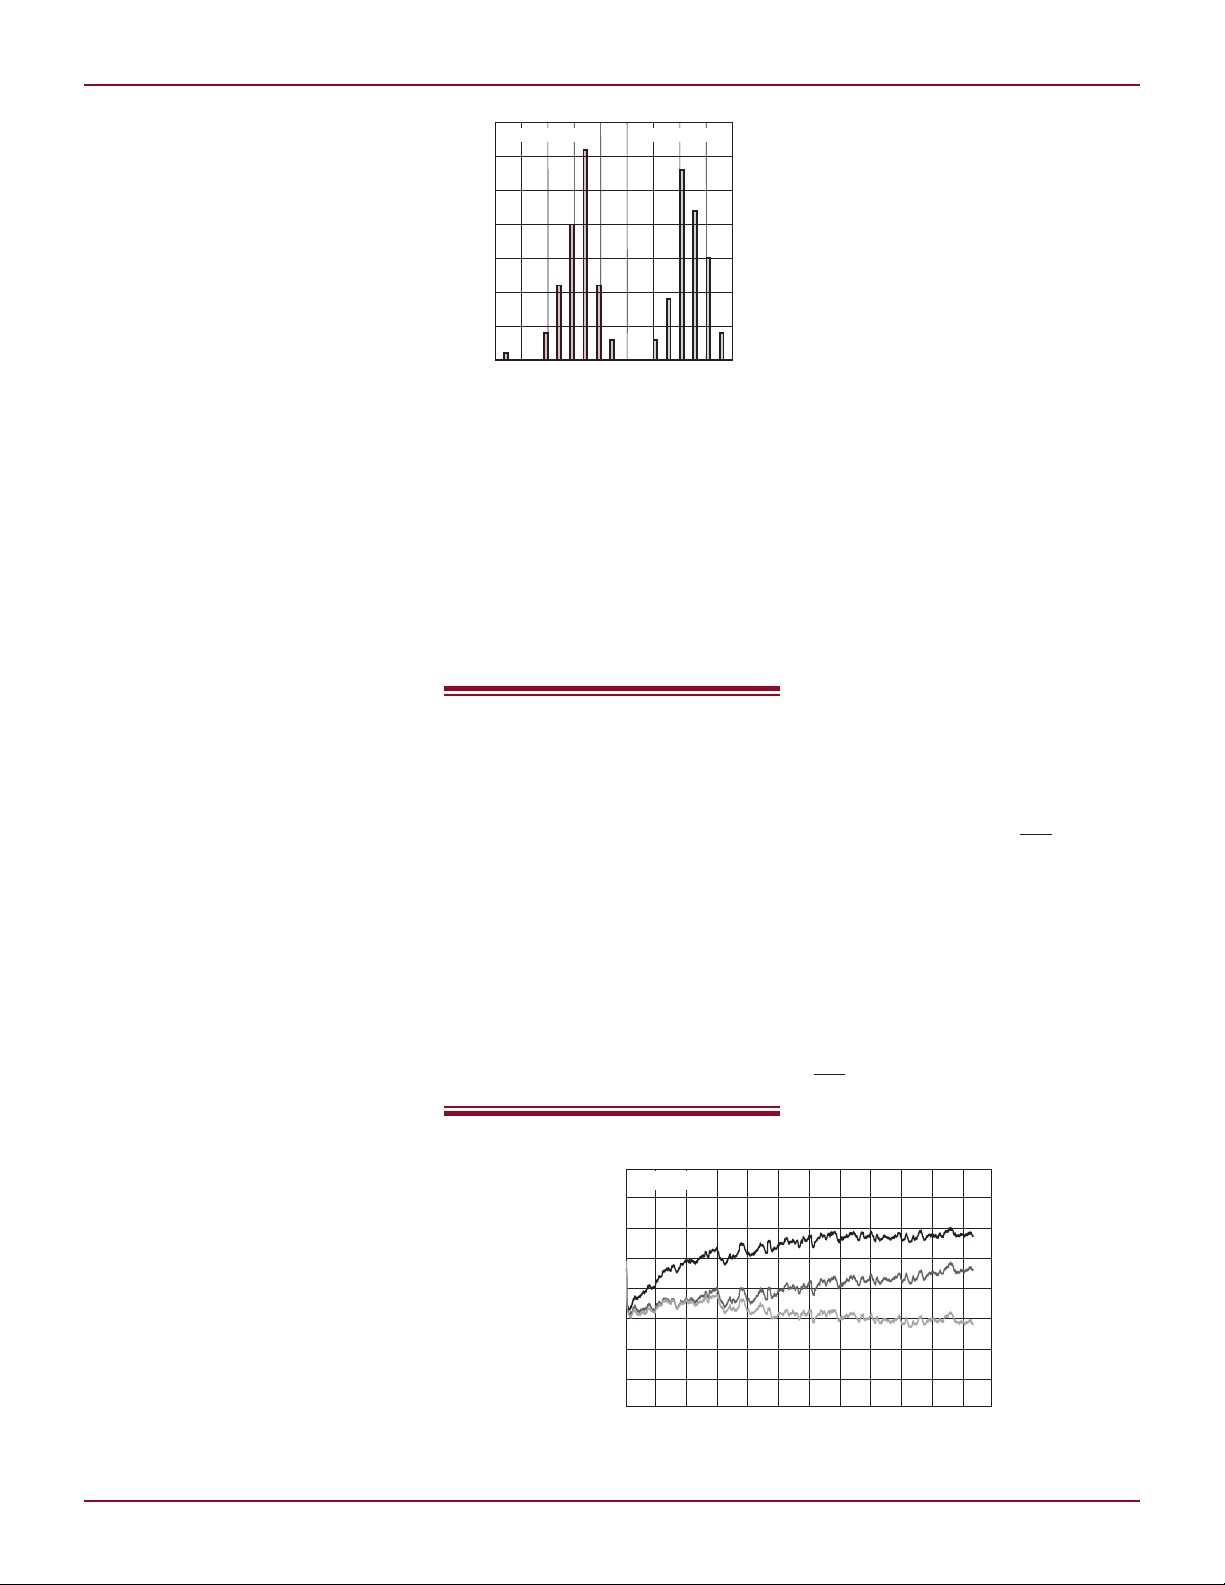
LTC6652A LIMITS
1004 UNITS
DRIFT (ppm/°C)
0 0.5 1.5 2.5 3.5
0
NUMBER OF UNITS
15
20
5
10
30
25
1.0
2.0 3.0
TEMPERATURE (°C)
–50
2.496
V
OUT
(V)
2.500
2.498
2.504
2.502
0
50 100 150
GUARANTEED
with 5ppm/°C Drift is Factory Trimmed
and Tested at –40°C, 25°C and 125°C
Introduction
High precision requirements are no
longer limited to the most exotic and
expensive measurement equipment.
Designers of industrial monitors
and automotive monitor and control
circuits are using precision circuits
to maximize the performance and
uninterrupted operating times of their
products. Improved precision allows
for more accurate assessment of sensor outputs that measure ambient
conditions, equipment position, battery condition, component wear and
many other system indicators. Precise
and consistent measurements are the
key to managing system elements that
change very little over their operating
lives. Recognizing these slight changes
can allow estimation of the remaining
lifetime of lamps, motors, and other
components, or allow control of battery charge and discharge to maximize
operating life. These applications not
only require high accuracy, low drift
and low noise, but also a wide operating temperature range and reasonable
cost.
Factory Calibration Means
Dependable Precision
The LTC6652 reference is a precision
low drift voltage reference that includes
advanced curvature compensation
circuitry and post-package trim. To
guarantee reliable performance, these
parts are tested at –40°C, 25°C and
125°C to verify they meet specification
across the entire temperature range.
This comprehensive testing ensures
that the LTC6652 can be used with
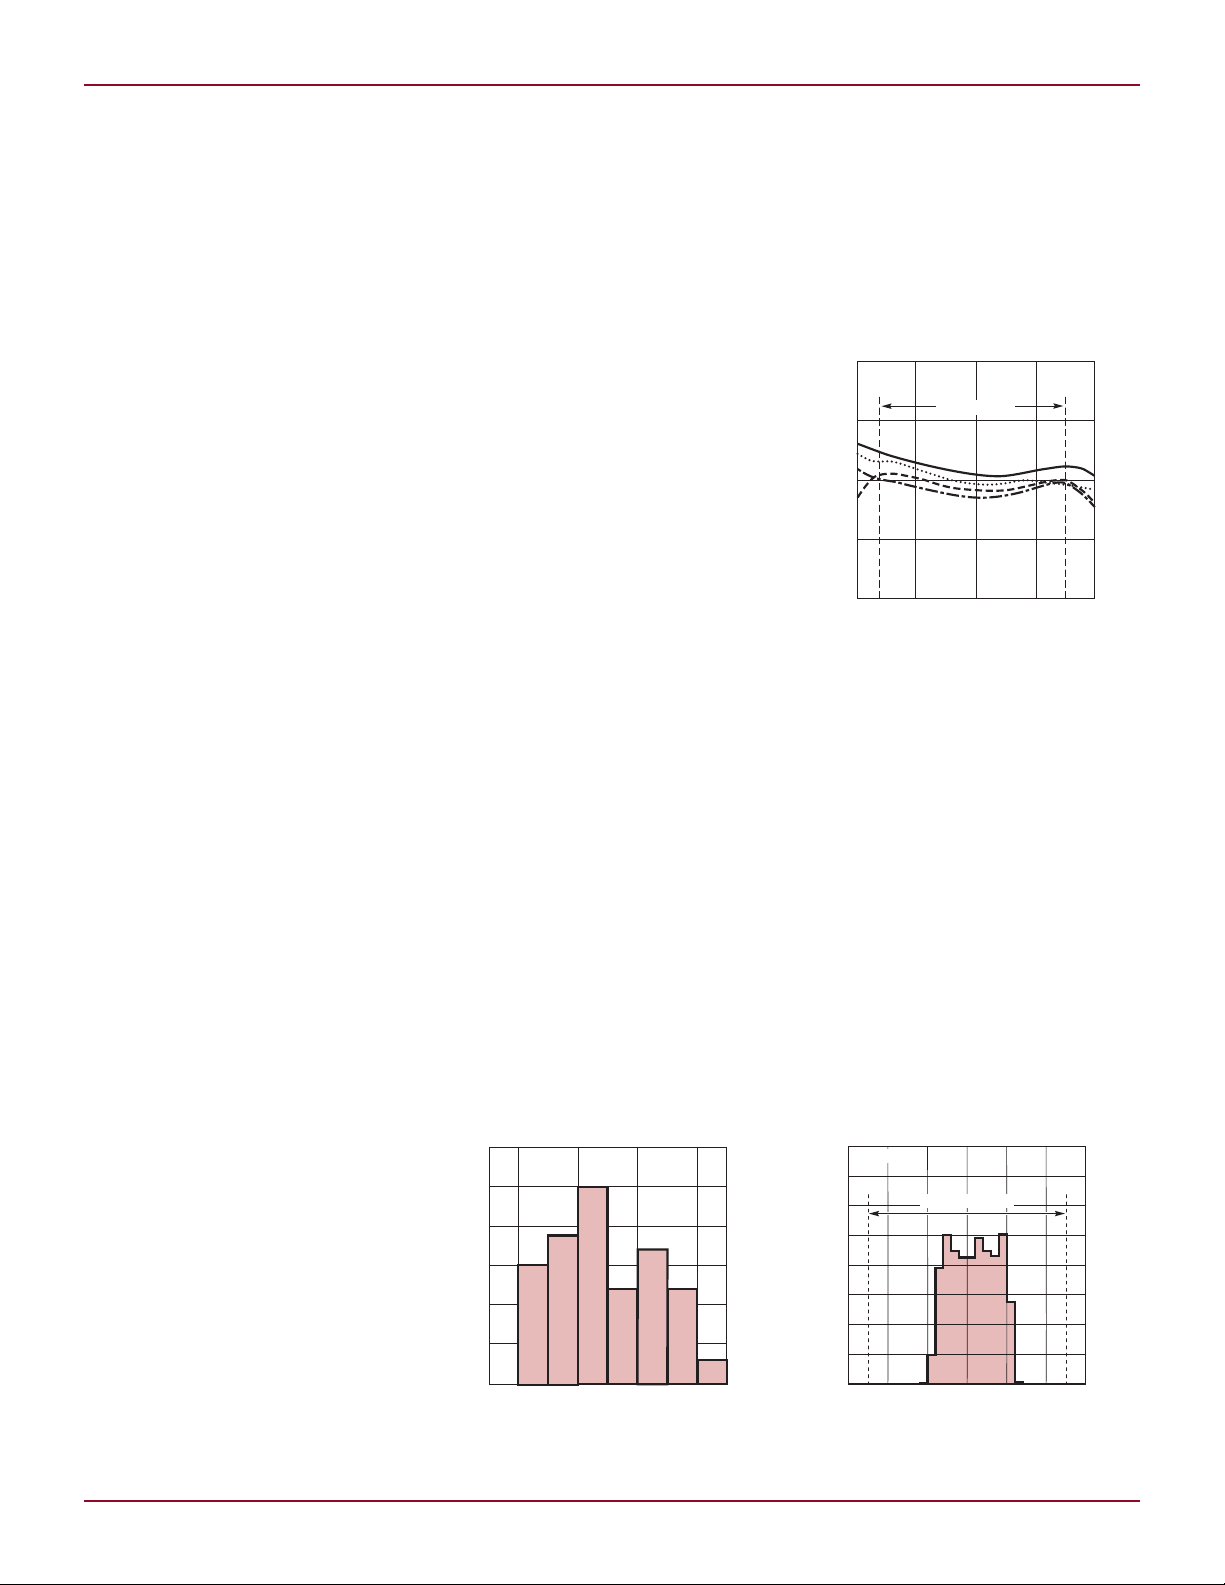
confidence in demanding applications. One result of this testing is
demonstrated in Figure 1. The output
voltage versus temperature for several
randomly chosen parts shows a drift
characteristic that is consistent from
part to part. This is a result of a propri-
Linear Technology Magazine • January 2009
DESIGN FEATURES L
by Michael B. Anderson and Brendan Whelan
etary curvature compensation circuit
that tracks the operating conditions
and the manufacturing process, yielding consistent results. Figure 2 shows
a typical temperature drift distribution of randomly selected production
tested LTC6652s, illustrating how well
the design and testing methodology
works. Finally, the initial accuracy
distribution is tightly controlled, as
shown in Figure 3.
Compare the Real Specs:
Is the Temperature Range
Operating or Functional?
When comparing voltage references for
use in demanding environments, it is
important to know, with confidence,
how the voltage reference performs at
the extremes. When it is important for
the reference to provide precision (not
just survive) in a harsh environment,
the LTC6655 leaves most competing
voltage references behind.
For example, many applications
requiring a precision reference are
designed to work over the industrial
temperature range (–40°C to 85°C).
If the ambient temperature reaches
85°C, the interior of the enclosure and
the temperature of the reference will
Figure 2. Drift distribution (–40°C to 125°C)
Figure 1. Typical drift characteristics of
production trimmed and tested parts
likely exceed 85°C. It is not uncommon in this case for the interior of a
circuit enclosure to climb above 100°C
due to the thermal dissipation of its
components. In addition, any comparable voltage reference fully loaded at
5mA with a 13.2V input voltage would
self-heat an additional 18°C, raising its
own internal junction temperature to
118°C. This temperature is well outside the useful range of most voltage
references. The LTC6652, however,
maintains exceptional performance in
these conditions, despite the extreme
environment. By comparison, the drift
of a reference specified only to 85°C will
Figure 3. Typical V
for LTC6652-2.5
distribution
OUT
7
L DESIGN FEATURES
DISTRIBUTION (ppm)
–250 –150 –50
0
NUMBER OF UNITS
5
10
15
35
25
30
20
15050
125°C TO 25°C –40°C TO 25°C
TIME (HOURS)
0
LONG TERM DRIFT (ppm)
160
3000
80
120
–120
–80
40
1000 2000 50004000 6000
–160
–40
0
LTC6652-2.5
likely exhibit substantial additional
error, or it may even fail to operate.
Other references that claim similar
performance to the LTC6652 often are
only “functional”, meaning they don’t
fail, but they don’t meet specification
either at temperatures exceeding 85°C
or below 0°C. These competing parts
are rarely tested across their entire
specified temperature range. The reality of industrial circuit design is that
in many cases, component specifications over “industrial” temperatures
are woefully inadequate.
In contrast, every LTC6652 is fully
tested at 25°C, –40°C and again at
125°C for every device, not just a
small sample. This extensive testing
proves the consistently high quality
of the LTC6652 over its entire wide
temperature range.
Further, the LTC6652 was designed
from the ground up to accommodate
a wide temperature range. Figure 1
clearly illustrates its consistent performance over the entire range. There
is no need to question or derate the
performance of a system that uses
the LTC6652 at its temperature extremes. The consistent, guaranteed
performance makes it easy to design,
specify and calibrate a high performance system. This is not the case
with some competing products.
Eliminate Field Calibration
After any precision reference is soldered onto a printed circuit board,
thermal hysteresis will likely shift the
output from its factory trimmed value.
Further temperature cycling will also
contribute to a shift in the output voltage. Over time, the output will tend to
drift slightly as well due to aging of the
circuit. The circuit design, fabrication
process and mechanical design of the
LTC6652 is optimized for low thermal
hysteresis and excellent long-term
stability, reducing the need for field
calibration. Thermal hysteresis is
caused by differing rates of expansion
and contraction of materials within
a packaged semiconductor device as
the device experiences temperature
changes. As the package material and
the semiconductor die expand and
contract at different rates, mechani-
8
Figure 4. Hysteresis plot (–40°C to 125°C)
cal force changes device parameters
(ever so slightly) and cause the output
voltage to change. This change is
measured in parts per million (ppm)
and is shown in Figure 4.
The LTC6652 boasts a typical
thermal hysteresis value of 105ppm
over its full temperature range. What
this means is that when a device goes
The LTC6652 reference
family is designed and
factory trimmed to yield
exceptional drift and
accuracy performance. The
entire family is guaranteed
and production tested at
–40°C, 25°C and 125°C
to ensure dependable
performance in demanding
applications. Low thermal
hysteresis and low long-term
drift reduce or eliminate the
need for field calibration.
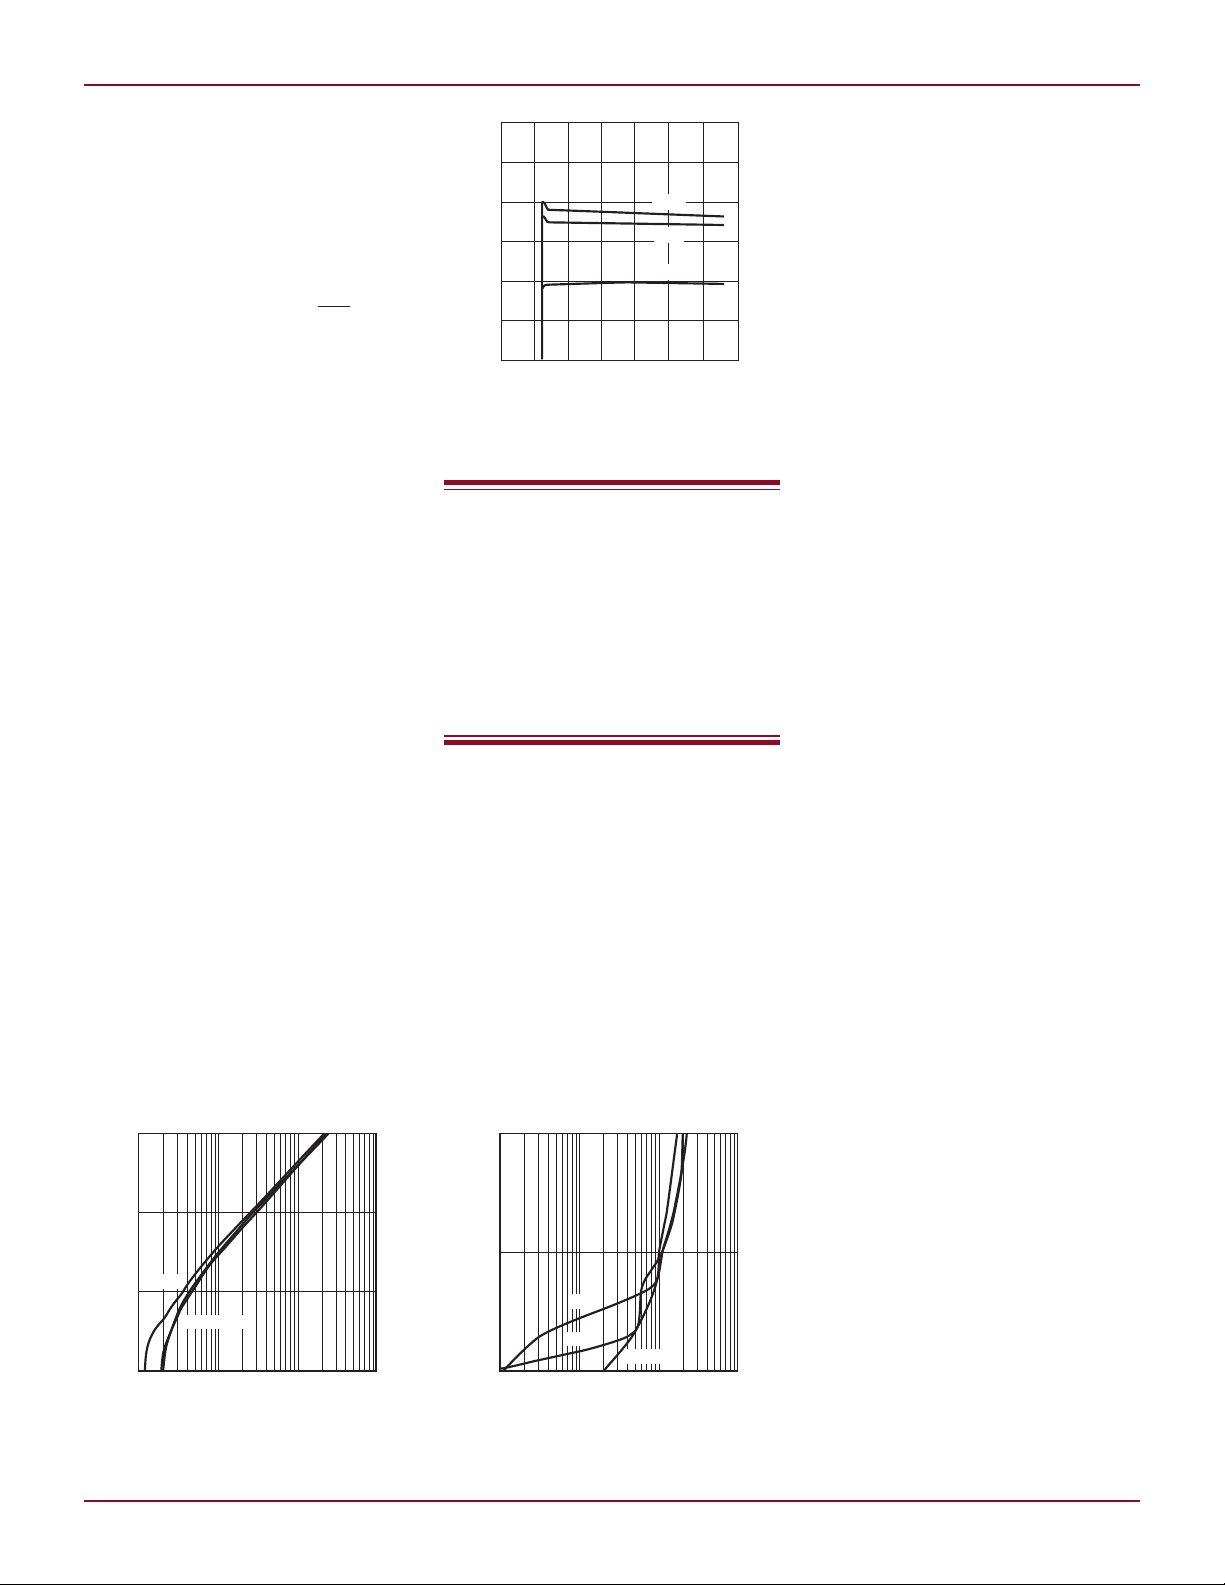
Figure 5. Example of long-term drift
from room temperature to 125° and
back again to room temperature, the
output will typically shift 105ppm.
For a 2.5V voltage option, the output
would shift –260µV. A cold excursion
would shift the most recent room temperature measurement +260µ. Typical
hysteresis of 105ppm is equivalent to
0.0105%; just a small fraction of the
initial accuracy.
It may be convenient to compare
typical values for thermal hysteresis
when choosing a voltage reference.
It is important to remember that
these numbers do not tell the whole
story. It is the distribution of expected
hysteresis that must be used to determine the expected error caused
by temperature cycling. Referring to
Figure 4, some parts will have better
or worse hysteresis. This chart helps
to estimate a realistic error budget.
This is something our competitors
don’t always include, yet is critically
important when specifying precision
systems.
Over time a reference is likely to
shift on its own even if it’s kept at a
constant temperature. This is known
as long-term drift. Long-term drift
is measured in ppm/√khr and has
a logarithmic characteristic where
the change in output voltage decays
as time passes. Figure 5 shows the
long-term drift of the LTC6652. Note
that most of the drift occurs within
the first 1,000 or 2,000 hours as the
PCB and package settle. Afterward
the drift tends to settle, and the slope
is reduced over time as a function of
khr. Direct measurement on soldered
√
down parts is the only way to determine
Linear Technology Magazine • January 2009
DESIGN FEATURES L
INPUT VOLTAGE (V)
0
OUTPUT VOLTAGE (V)
2.5000
2.5005
2.5010
6 10
2.4995
2.4990
2 4
8 12 14
2.4985
2.4980
125°C
–40°C
25°C
OUTPUT-INPUT VOLTAGE (V)
0.001
OUTPUT CURRENT (mA)
10
0.01 0.1 1
1
0.1
25°C
–40°C
125°C
INPUT-OUTPUT VOLTAGE (V)
0.001
0.01
OUTPUT CURRENT (mA)
1
10
0.01 0.1 1
0.1
25°C
125°C, –40°C
long-term drift. Accelerated testing
does not work. Some users burn in
their boards, which helps eliminate
this initial slope, further reducing the
effect of long-term drift.
The three curves shown in Figure 5
give a general indication of how much
long-term drift to expect. The typical
specification is 60ppm/√khr, which
translates into 150µV drift. Combining the typical thermal hysteresis
and long-term drift numbers yields
165ppm. To put this in perspective,
the LTC6652 temperature coefficient
is typically 2ppm/°C over 165°C temperature range, which yields 330ppm
due to drift alone. The combined thermal hysteresis and long-term drift is
half this number (or just 20% of the
maximum drift specification). The
superior thermal hysteresis and longterm drift performance of the LTC6652
ensures accuracy and reliability over
the product lifetime, virtually eliminating the need for field calibration.
Small Footprint and
Output Capacitor Optional
The performance of the LTC6652
is often only found in larger packages such as an SOIC. However,
the LTC6652 is packaged in a small
8-lead MSOP and does not require
an input or output capacitor. This
minimizes required board space, thus
simplifying the design of applications
with tight PCB constraints such as
small sensor enclosure applications.
Another advantage of not using capacitors is eliminating energy storage
devices tied to sensitive circuits. This
Figure 6. Line regulation
The LTC6652 reference
family has seven output
voltage options, making
it suitable for a variety
of today’s demanding
applications. These options
are 1.25V, 2.048V, 2.5V, 3V,
3.3V, 4.096V, and 5V.
is a useful feature in safety critical
systems, where energy storage must
be minimized. If, however, low noise
is a priority, an input capacitor may
be added to suppress high frequency
transients on the supply line, while an
output capacitor will reduce wideband
noise and improve AC PSRR. Either
way, the LTC6652 offers stable operation. Small size and a range of useful
input and output capacitors allows
the LTC6652 to satisfy the requirements of many different applications.
This includes everything from small,
tight-fitting portable applications to
high precision, low noise measurement
applications.
Output Can Source
and Sink Current
The LTC6652 is a series voltage reference that can source current, but it can
also sink current like a shunt reference. Some series voltage references
can only source output current and
rely on a resistor divider for feedback
and to sink a small amount of current.
These types of devices can experience
long settling times, especially when
charge is kicked back from a switched
capacitor circuit causing the output
voltage to rise. The sink (overvoltage)
settling time on a source only reference is dominated by the RC time
constant of the output capacitor and
the resistive divider. For example, a
2.2µF output capacitor and a 125kΩ
resistive divider will have a 275ms
time constant. Depending on the size
of the perturbation and the system
precision, a source only reference
may not settle in a timely fashion.
The LTC6652 current sink capacity
is 5mA and will dynamically respond
for faster settling.
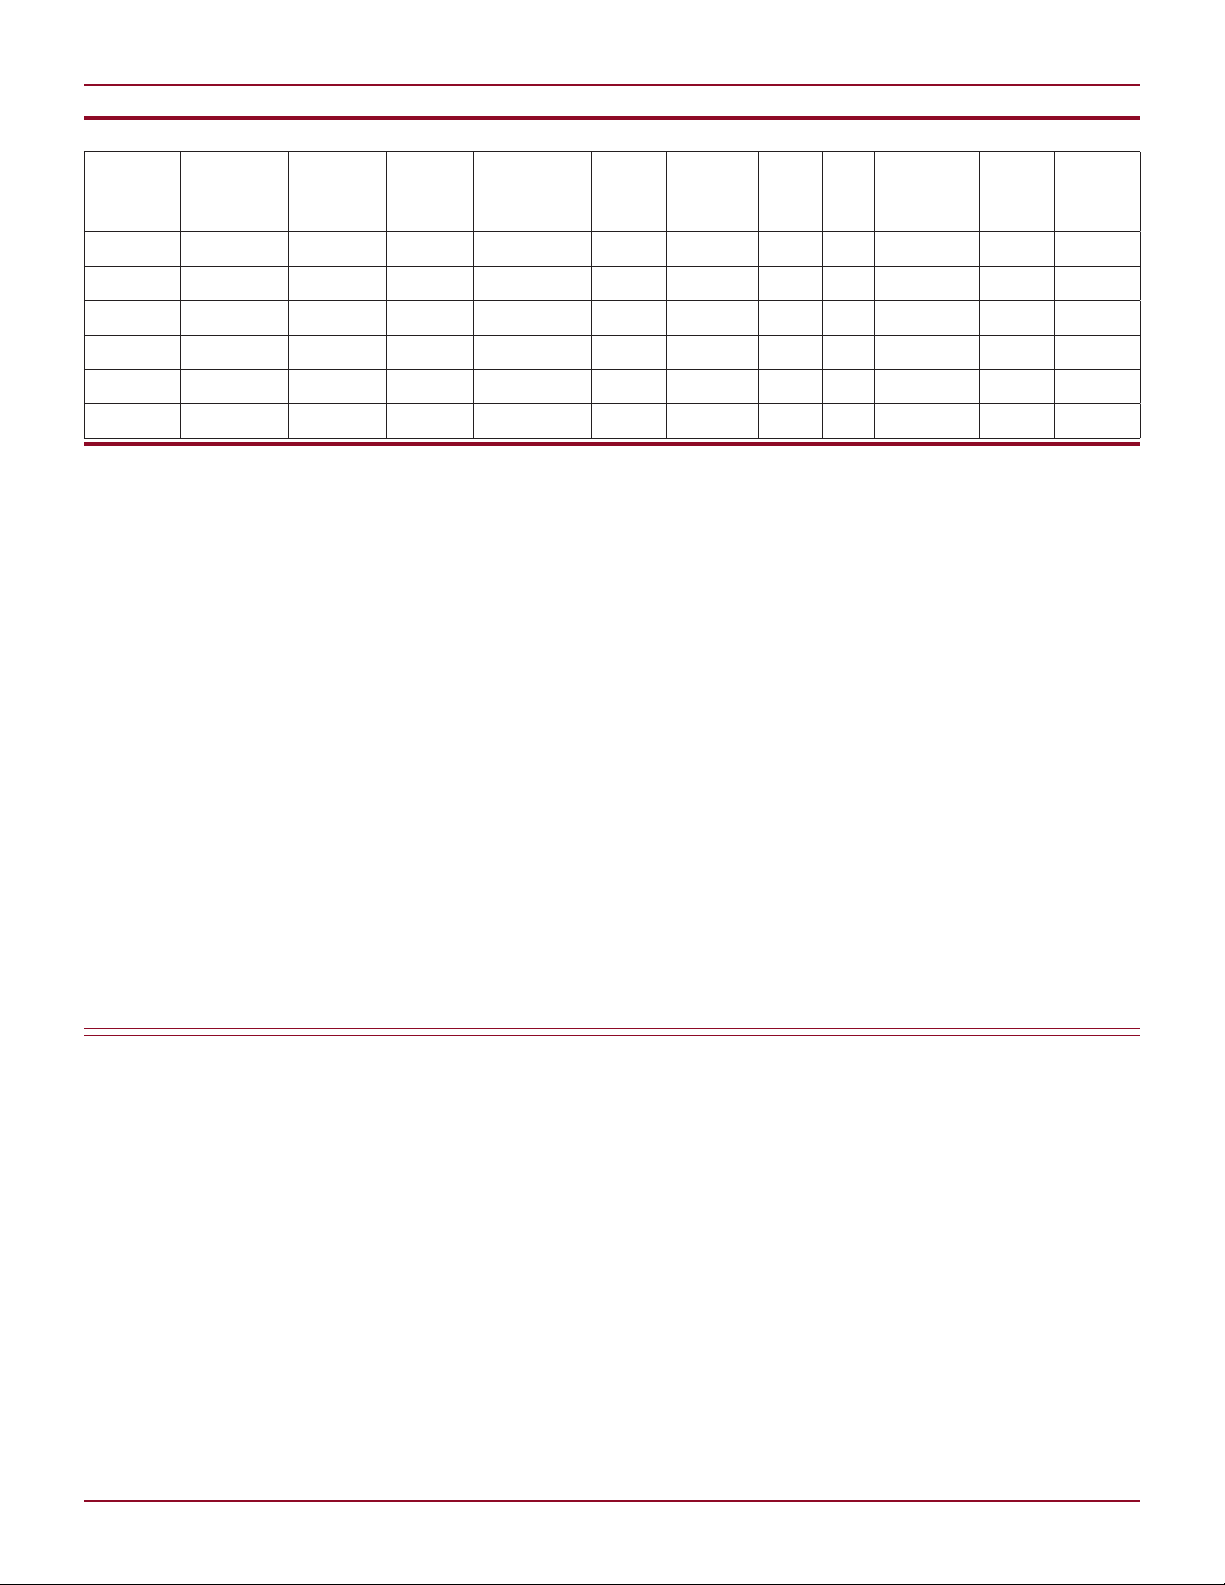
Shunt references are two terminal
devices that maintain the output voltage by sinking more or less current.
The sinking ability of the LTC6652
allows it to operate in a similar, but
more efficient manner. In fact, for
voltage options of 3V or higher, the
VIN pin can actually go below the V
pin while sinking currents of 100µA
and higher and still maintain good
regulation.
OUT
Linear Technology Magazine • January 2009
a. Sourcing current b. Sinking current
Figure 7. Dropout voltage sourcing and sinking current
Wide Input Range,
Low Dropout, and
Seven Voltage Options
The LTC6652 reference family has
seven output voltage options to choose
from, making it suitable for a variety
of today’s demanding applications.
These options are 1.25V, 2.048V, 2.5V,
3V, 3.3V, 4.096V, and 5V. For low
input voltage requirements, the 1.25V
and 2.048V options work with input
voltages down to 2.7V. The other five
options require only 300mV input-to-
continued on page 14
9
L DESIGN FEATURES
Table 2. Noise margins are good for radiated emission results shown in Figure 13
EUT
Frequency
(MHz)
134.31 H 354 364 1.3 11.428 0 1.532 0 14.26 30 15.74
119.96 V 184 110 3.5 12.694 0 1.456 0 17.65 30 12.35
160.02 H 0 354 0.5 10.499 0 1.793 0 12.792 30 17.208
174.37 H 0 100 1.2 9.638 0 1.944 0 12.782 30 17.218
224.28 V 0 100 –1.87 10.586 0 2.044 0 10.76 30 19.24
263.63 H 0 371 –4.72 12.6 0 2.385 0 10.265 37 26.735
Antenna
Polarization
Azimuth
(Degrees)
a linear DC power supply is used
for the input, and a resistive load is
employed on the output. The baseline
noise is checked with the power supply
providing a DC current directly to the
resistive load. The baseline emission
scan results are shown in Figure 11.
There are two traces in the plot, one
for the vertical and horizontal orientations of the receiver antenna.
Figure 12 shows the peak scan re
sults of a µModule buck regulator—not
the LTM4606 or LTM4612—without
the integrated low noise feature. The
scan results show that the noise below
350MHz is produced by the µModule
switching regulator, when compared
to the baseline noise level. Radiated
EMI here does not meet the Class B
of CISPR 22 (quasi-peak) radiated
emission limit.
Antenna
Height
(cm)
Uncorrected
Amplitude
(dBµV)
Pre-Amp
ACF
(dB/m)
In contrast, Figure 13 shows the
peak scan results of the low noise
LTM4606 module. To ensure enough
margin to the quasi-peak limit for
different operation conditions, the
six highest noise points are checked
as shown in the table of Figure 13
using the quasi-peak measurement.
The results show that it has more
than 12dBµV margin below the Class
-
B of CISPR 22(quasi-peak) radiated
emission limit.
Figure 14 shows the results for the
LTM4612 meeting the Class B of CISPR
22 radiated emission limit at 24V VIN,
12V/5A V
OUT
.
Conclusion
The LTM4606 and LTM4612 µModule
regulators offer all of the high performance benefits of switching regulators
minus the noise issues. The ultralow
Gain
(dB)
Corrected
CBL
DCF
(dB)
(dB)
Amplitude
(dBµV)
Limit
(dBµV)
Margin
noise optimized design produces radiated EMI performance with enough
margin below the Class B of CISPR 22
limit to simplify application in noisesensitive environments.
Design is further simplified by
exceptional thermal performance,
which allows them to achieve high
efficiency and a compact form factor. A low profile 15mm × 15mm ×
2.8mm package contains almost all
of the support components—only a
few input and output capacitors are
required to complete a design. Several
µModule regulators can be easily run
in parallel for more output power. The
versatility of these parts is rounded out
by optional features such as soft-start,
RUN pin control, output voltage tracking and margining, PGOOD indicator,
frequency adjustment and external
clock synchronization.
L
(dB)
LTC6652, continued from page 9
output headroom while fully loaded,
and they require less headroom with a
reduced load or while sinking current.
Popular application requirements,
such as a 2.5V reference operating
on a 3V supply, or a 4.096V reference
operating on a 5V supply, are easily
accommodated. For high input voltage requirements, all voltage options
work up to 13.2V. Regardless of input
voltage the LTC6652 maintains its
excellent accuracy as shown in the
line regulation plot in Figure 6. A plot
of the dropout voltage for both sourcing and sinking current is shown in
Figures 7a and 7b, respectively.
14
Superior Performance
While many references share some
features of the LTC6652, it’s difficult
to find any that include all the features
at the same level of performance and
reliability. Additional features include
low noise, good AC PSRR, and excellent load regulation (both sourcing and
sinking current). Low power consumption and a shutdown mode round out
the feature list.
Conclusion
The LTC6652 reference family is
designed and factory trimmed to
yield exceptional drift and accuracy
performance. The entire family is
guaranteed and production tested at
–40°C, 25°C and 125°C to ensure dependable performance in demanding
applications. Low thermal hysteresis
and low long-term drift reduce or
eliminate the need for field calibration. The small 8-lead MSOP package
and sparse capacitor requirements
minimize required board space. The
wide input range from 2.7V to 13.2V
and seven output voltage options will
tackle the needs of most precision
reference users.
Linear Technology Magazine • January 2009
L
 Loading...