

FEATURES
z
LTC6244
Dual 50MHz, Low Noise,
Rail-to-Rail, CMOS Op Amp
U
DESCRIPTIO
■
Input Bias Current: 1pA (Typ at 25°C)
■
Low Offset Voltage: 100µV Max
■
Low Offset Drift: 2.5µV/°C Max
■
0.1Hz to 10Hz Noise: 1.5µV
■
Slew Rate: 40V/µs
■
Gain Bandwidth Product: 50MHz
■
Output Swings Rail-to-Rail
■
Supply Operation:
P-P
2.8V to 6V LTC6244
2.8V to ±5.25V LTC6244HV
■
Low Input Capacitance: 2.1pF
■
Available in 8-Pin MSOP and Tiny DFN Packages
U
APPLICATIO S
■
Photodiode Amplifi ers
■
Charge Coupled Amplifi ers
■
Low Noise Signal Processing
■
Active Filters
■
Medical Instrumentation
■
High Impedance Transducer Amplifi er
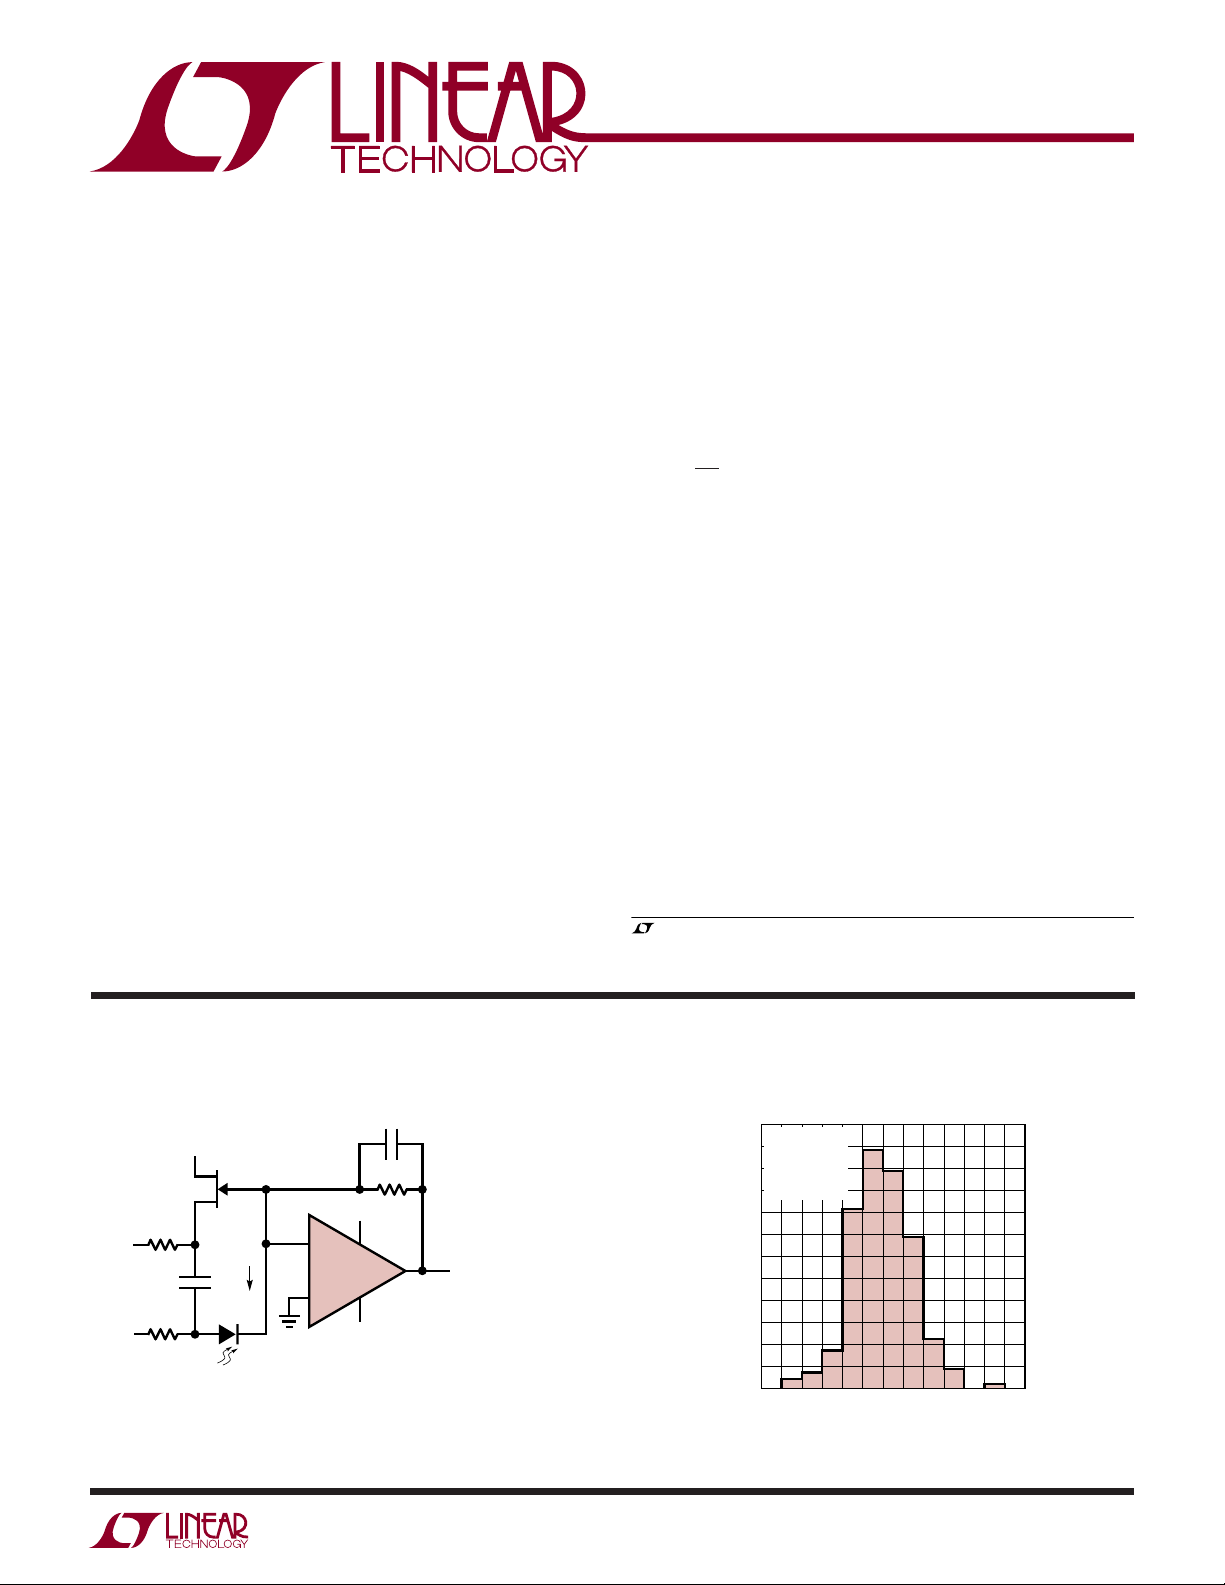
The LTC®6244 is a dual high speed, unity-gain stable CMOS
op amp that features a 50MHz gain bandwidth, 40V/µs slew
rate, 1pA of input bias current, low input capacitance and
rail-to-rail output swing. The 0.1Hz to 10Hz noise is just
1.5µV
and 1kHz noise is guaranteed to be less than
P-P
12nV/√Hz. This excellent AC and noise performance is
combined with wide supply range operation, a maximum
offset voltage of just 100µV and drift of only 2.5µV/°C,
making it suitable for use in many fast signal processing
applications, such as photodiode amplifi ers.
This op amp has an output stage that swings within 35mV
of either supply rail to maximize the signal dynamic range
in low supply applications. The input common mode
range extends to the negative supply. It is fully specifi ed
on 3V and 5V, and an HV version guarantees operation
on supplies of ±5V.
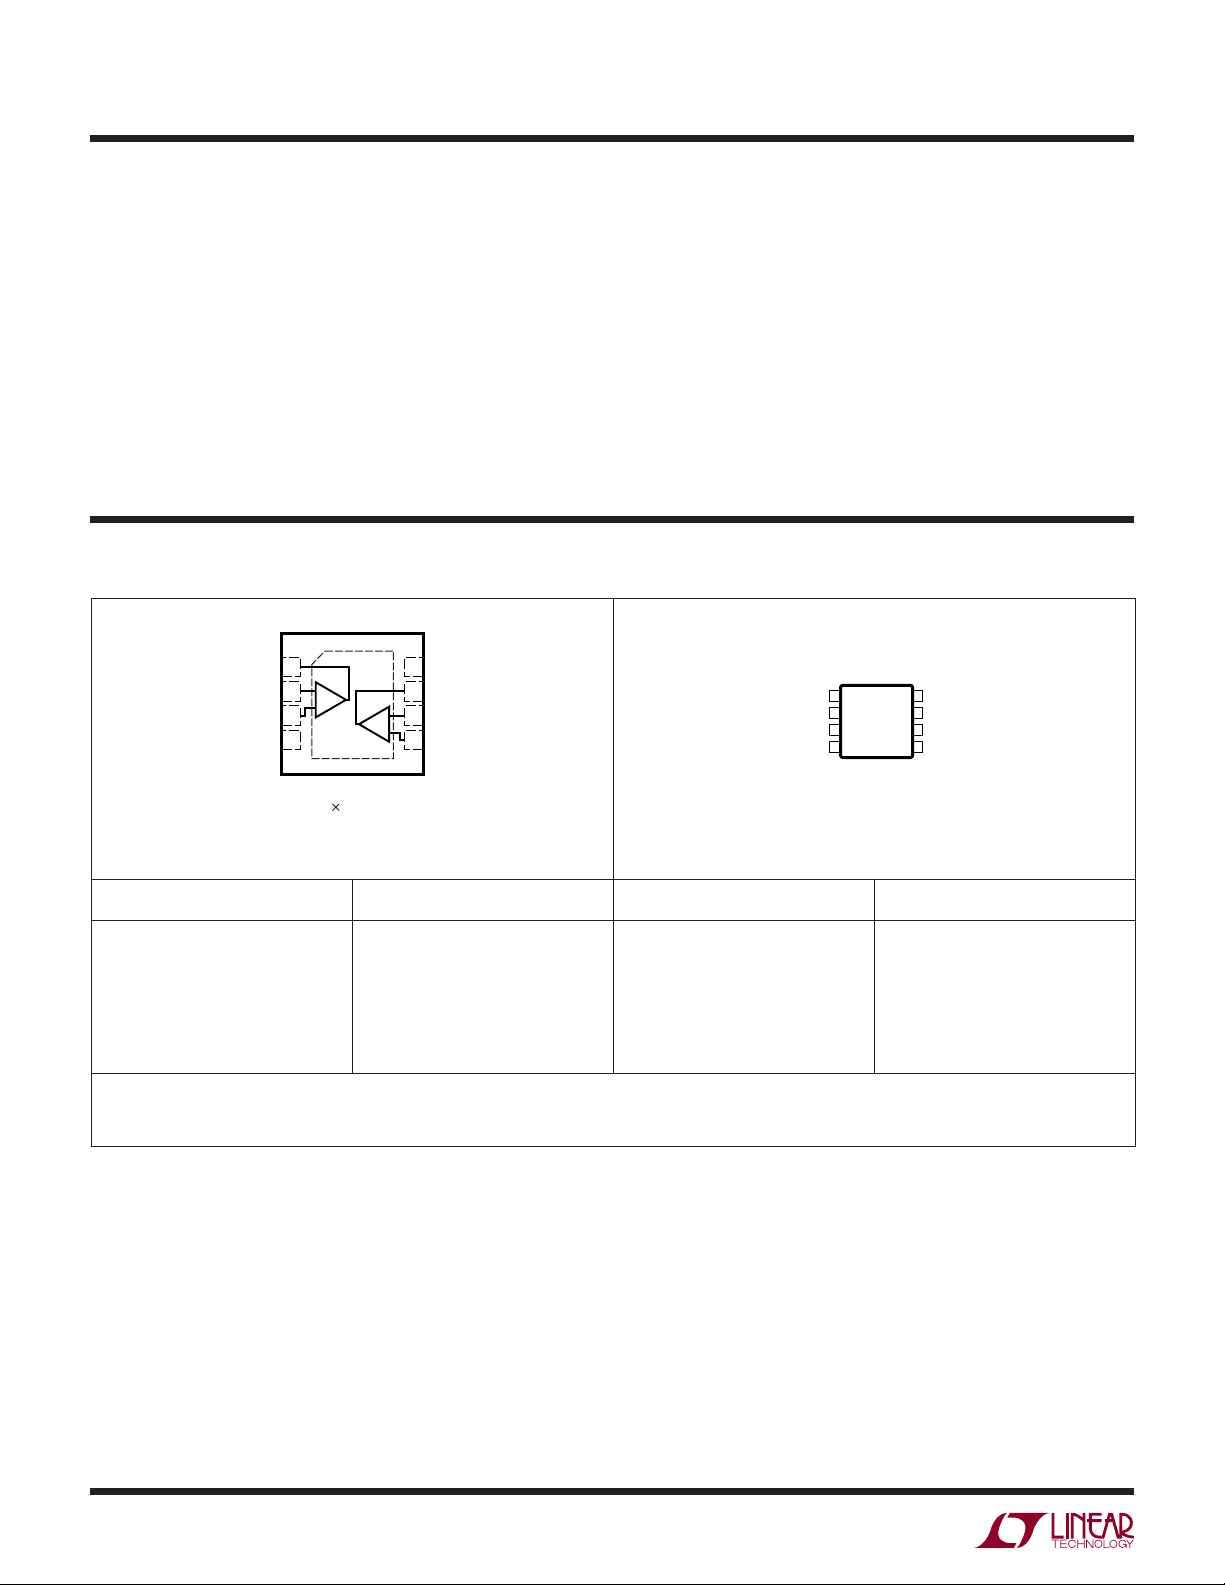
The LTC6244 is available in the 8-pin MSOP, and for compact designs, it is packaged in the tiny dual fi ne pitch lead
free (DFN) package.
TYPICAL APPLICATIO
Very Low Noise Large Area Photodiode
0.25pF
5V
PHILIPS
BF862
JFET
4.99k
–5V
I
4.7µF*
4.99k
V
BB
HAMAMATSU LARGE AREA
* CAN BE MICROPHONIC, FILM, X7R, IF NEEDED.
PD
PHOTODIODE
S1227-1010BQ
= 3000pF
C
PD
5V
–
1/2
LTC6244HV
+
–5V
6244 TA01a
U
1M
V
OUT
BW = 350kHz
NOISE = 291nV AT 10kH
= 1M • I
V
OUT
, LT, LTC and LTM are registered trademarks of Linear Technology Corporation.
All other trademarks are the property of their respective owners.
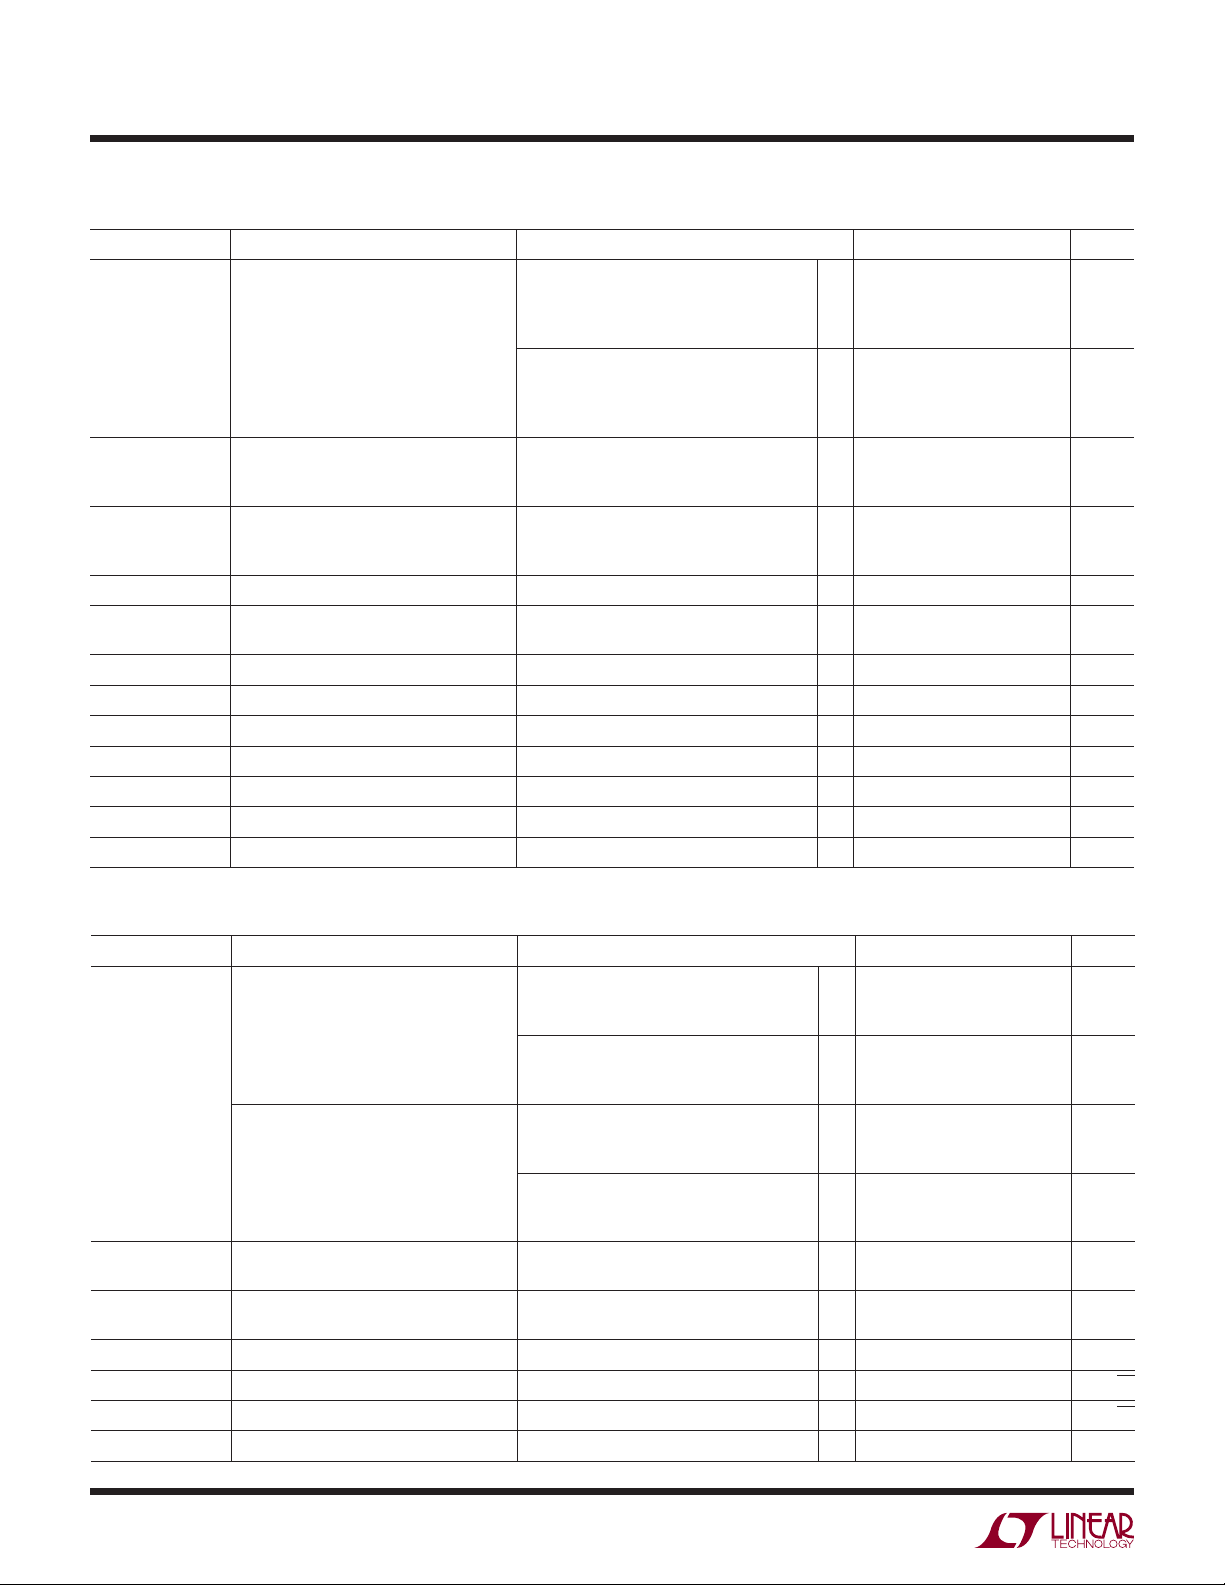
VOS Distribution
120
LTC6244MS8
110
= 5V, 0V
V
S
100
= 2.5V
V
CM
= 25°C
T
A
90
PD
80
70
60
50
40
NUMBER OF UNITS
30
20
10
0
–60 –40
INPUT OFFSET VOLTAGE (µV)
–20
0
20 40
60
6244 G01
6244f
1
LTC6244
WW
W
ABSOLUTE AXI U RATI GS
U
(Note 1)
Total Supply Voltage (V+ to V–)
LTC6244 .................................................................7V
LTC6244HV ...........................................................12V
+
Input Voltage .......................... (V
+ 0.3V) to (V– – 0.3V)
Input Current ........................................................±10mA
Output Short Circuit Duration (Note 2) ............ Indefi nite
Operating Temperature Range
LTC6244C ............................................–40°C to 85°C
LTC6244I ............................................. –40°C to 85°C
LTC6244H .......................................... –40°C to 125°C
UUW
PACKAGE/ORDER I FOR ATIO
TOP VIEW
+
9
1OUT A
–IN A
2
+IN A
V
8-LEAD (3mm ´ 3mm) PLASTIC DFN
EXPOSED PAD (PIN 9) CONNECTED TO V
A
3
–
4
DD PACKAGE
T
= 125°C, θJA = 43°C/W
JMAX
(PCB CONNECTION OPTIONAL)
8
V
OUT B
7
–IN B
6
B
+IN B
5
–
Specifi ed Temperature Range (Note 3)
LTC6244C ................................................0°C to 70°C
LTC6244I ............................................. –40°C to 85°C
LTC6244H .......................................... –40°C to 125°C
Junction Temperature ........................................... 150°C
DD Package ...................................................... 125°C
Storage Temperature Range ................... –65°C to 150°C
DD Package ....................................... –65°C to 125°C
Lead Temperature (Soldering, 10 sec) .................. 300°C
TOP VIEW
OUT A
1
–IN A
2
+IN A
3
–
V
4
MS8 PACKAGE
8-LEAD PLASTIC MSOP
T
= 150°C, θJA = 250°C/W
JMAX
8
7
6
5
+
V
OUT B
–IN B
+IN B
ORDER PART NUMBER DD PART MARKING* ORDER PART NUMBER MS8 PART MARKING*
LTC6244CDD
LTC6244HVCDD
LTC6244IDD
LTC6244HVIDD
Order Options Tape and Reel: Add #TR
Lead Free: Add #PBF Lead Free Tape and Reel: Add #TRPBF
Lead Free Part Marking: http://www.linear.com/leadfree/
Consult LTC Marketing for parts specifi ed with wider operating temperature ranges. *The temperature grade is identifed by a label on the shipping container.
LCCF
LCGD
LCCF
LCGD
LTC6244CMS8
LTC6244HVCMS8
LTC6244IMS8
LTC6244HVIMS8
LTC6244HMS8
LTCCM
LTCGF
LTCCM
LTCGF
LTCCM
6244f
2

LTC6244
U
AVAILABLE OPTIO S
PART NUMBER SPECIFIED TEMP RANGE SPECIFIED SUPPLY VOLTAGE PACKAGE PART MARKING
LTC6244CMS8 0°C to 70°C 3V, 5V MS8 LTCCM
LTC6244CDD 0°C to 70°C 3V, 5V DD LCCF
LTC6244HVCMS8 0°C to 70°C 3V, 5V, ±5V MS8 LTCGF
LTC6244HVCDD 0°C to 70°C 3V, 5V, ±5V DD LCGD
LTC6244IMS8 –40°C to 85°C 3V, 5V MS8 LTCCM
LTC6244IDD –40°C to 85°C 3V, 5V DD LCCF
LTC6244HVIMS8 –40°C to 85°C 3V, 5V, ±5V MS8 LTCGF
LTC6244HVIDD –40°C to 85°C 3V, 5V, ±5V DD LCGD
LTC6244HMS8 –40°C to 125°C 3V, 5V MS8 LTCCM
(LTC6244C/I, LTC6244HVC/I) The ● denotes the specifi cations which apply
ELECTRICAL CHARACTERISTICS
over the specifi ed temperature range, otherwise specifi cations are at T
SYMBOL PARAMETER CONDITIONS MIN TYP MAX UNITS
V
OS
TC V
OS
I
B
I
OS
e
n
i
n
R
IN
C
IN
V
CM
CMRR Common Mode Rejection 0V ≤ V
Input Offset Voltage (Note 4) MS8 Package
V
Match Channel-to-Channel (Note 5) MS8 Package
OS
Input Offset Voltage Drift, MS8 (Note 6)
Input Bias Current (Notes 4, 7)
Input Offset Current (Notes 4, 7)
Input Noise Voltage 0.1Hz to 10Hz 1.5 µV
Input Noise Voltage Density f = 1kHz 8 12 nV/√Hz
Input Noise Current Density (Note 8) 0.56 fA/√Hz
Input Resistance Common Mode 10
Input Capacitance
Differential Mode
Common Mode
Input Voltage Range Guaranteed by CMRR
CMRR Match
Channel-to-Channel (Note 5)
0°C to 70°C
–40°C to 85°C
DD Package
0°C to 70°C
–40°C to 85°C
0°C to 70°C
–40°C to 85°C
DD Package
0°C to 70°C
–40°C to 85°C
f = 100kHz
≤ 3.5V
CM
= 25°C. VS = 5V, 0V, VCM = 2.5V unless otherwise noted.
A
●
●
●
●
●
●
●
●
●
●
●
●
0 3.5 V
●
74 105 dB
●
72 100 dB
40 100
225
300
100 650
800
950
40 160
275
325
150 800
900
1.1
0.7 2.5 µV/°C
1
75
0.5
75
12
3.5
2.1
mV
µV
µV
µV
µV
µV
µV
µV
µV
µV
µV
µV
pA
pA
pA
pA
P-P
Ω
pF
pF
6244f
3
LTC6244
(LTC6244C/I, LTC6244HVC/I) The ● denotes the specifi cations which apply
ELECTRICAL CHARACTERISTICS
over the specifi ed temperature range, otherwise specifi cations are at T
SYMBOL PARAMETER CONDITIONS MIN TYP MAX UNITS
A
VOL
V
OL
V
OH
PSRR Power Supply Rejection VS = 2.8V to 6V, VCM = 0.2V
I
SC
I
S
GBW Gain Bandwidth Product Frequency = 20kHz, R
SR Slew Rate (Note 11) A
FPBW Full Power Bandwidth (Note 12) V
t
s
Large Signal Voltage Gain VO = 1V to 4V
R
= 10k to VS/2
L
0°C to 70°C
–40°C to 85°C
V
= 1.5V to 3.5V
O
R
= 1k to VS/2
L
0°C to 70°C
–40°C to 85°C
Output Voltage Swing Low (Note 9) No Load
I
= 1mA
SINK
I
= 5mA
SINK
Output Voltage Swing High (Note 9) No Load
I
= 1mA
SOURCE
I
= 5mA
SOURCE
PSRR Match
Channel-to-Channel (Note 5)
Minimum Supply Voltage (Note 10)
Short-Circuit Current
Supply Current per Amplifi er
= –2, RL = 1kΩ
V
= 3V
OUT
Settling Time V
= 2V, AV = –1, RL = 1kΩ, 0.1% 535 ns
STEP
= 25°C. VS = 5V, 0V, VCM = 2.5V unless otherwise noted.
A
, RL = 1kΩ
P-P
= 1kΩ
L
1000
●
600
●
450
300
●
200
●
150
●
●
●
●
●
●
●
75 105 dB
●
73 100 dB
●
2.8 V
●
25 35 mA
●
●
35 50 MHz
●
18 35 V/µs
●
1.9 3.7 MHz
2500 V/mV
1000 V/mV
15
40
150
15
45
175
6.25 7.4 mA
35
75
300
35
75
325
V/mV
V/mV
V/mV
V/mV
mV
mV
mV
mV
mV
mV
(LTC6244C/I, LTC6244HVC/I) The ● denotes the specifi cations which apply over the specifi ed temperature range, otherwise
specifi cations are at T
SYMBOL PARAMETER CONDITIONS MIN TYP MAX UNITS
V
OS
I
B
I
OS
e
n
i
n
V
CM
= 25°C. VS = 3V, 0V, VCM = 1.5V unless otherwise noted.
A
Input Offset Voltage (Note 4) MS8 Package
0°C to 70°C
–40°C to 85°C
DD Package
0°C to 70°C
–40°C to 85°C
V
Match Channel-to-Channel (Note 5) MS8 Package
OS
0°C to 70°C
–40°C to 85°C
DD Package
0°C to 70°C
–40°C to 85°C
Input Bias Current (Notes 4, 7)
Input Offset Current (Notes 4, 7)
●
●
●
●
●
●
●
●
●
●
40 175
250
325
100 650
800
950
40 200
300
350
150 800
900
1.1
1
75
0.5
75
Input Noise Voltage 0.1Hz to 10Hz 1.5 µV
µV
µV
µV
µV
µV
µV
µV
µV
µV
µV
µV
mV
pA
pA
pA
pA
P-P
Input Noise Voltage Density f = 1kHz 8 12 nV/√Hz
Input Noise Current Density (Note 8) 0.56 fA/√Hz
Input Voltage Range Guaranteed by CMRR
●
0 1.5 V
6244f
4

LTC6244
(LTC6244C/I, LTC6244HVC/I) The ● denotes the specifi cations which apply
ELECTRICAL CHARACTERISTICS
over the specifi ed temperature range, otherwise specifi cations are at T
SYMBOL PARAMETER CONDITIONS MIN TYP MAX UNITS
CMRR Common Mode Rejection 0V ≤ V
CMRR Match
Channel-to-Channel (Note 5)
A
V
V
VOL
OL
OH
Large Signal Voltage Gain VO = 1V to 2V
Output Voltage Swing Low (Note 9) No Load
Output Voltage Swing High (Note 9) No Load
PSRR Power Supply Rejection V
PSRR Match
Channel-to-Channel (Note 5)
Minimum Supply Voltage (Note 10)
I
SC
I
S
Short-Circuit Current
Supply Current per Amplifi er
GBW Gain Bandwidth Product Frequency = 20kHz, R
CM
R
= 10k to VS/2
L
0°C to 70°C
–40°C to 85°C
I
= 1mA
SINK
I
= 1mA
SOURCE
= 2.8V to 6V, VCM = 0.2V
S
= 25°C. VS = 3V, 0V, VCM = 1.5V unless otherwise noted.
A
≤ 1.5V
= 1kΩ
L
●
70 105 dB
●
68 100 dB
200
●
100
●
85
●
●
●
●
●
75 105 dB
●
73 100 dB
●
2.8 V
●
815 mA
●
●
35 50 MHz
800 V/mV
12
45
12
50
4.8 5.8 mA
30
110
30
110
V/mV
V/mV
mV
mV
mV
mV
(LTC6244HVC/I) The ● denotes the specifi cations which apply over the specifi ed temperature range, otherwise specifi cations are at
= 25°C. VS = ±5V, 0V, VCM = 0V unless otherwise noted.
T
A
SYMBOL PARAMETER CONDITIONS MIN TYP MAX UNITS
V
OS
TC V
I
B
I
OS
e
n
i
n
R
IN
C
IN
OS
Input Offset Voltage (Note 4) MS8 Package
0°C to 70°C
–40°C to 85°C
●
●
DD Package
0°C to 70°C
–40°C to 85°C
V
Match Channel-to-Channel (Note 5) MS8 Package
OS
0°C to 70°C
–40°C to 85°C
●
●
●
●
DD Package
0°C to 70°C
–40°C to 85°C
Input Offset Voltage Drift, MS8 (Note 6)
●
●
●
Input Bias Current (Notes 4, 7)
●
Input Offset Current (Notes 4, 7)
●
Input Noise Voltage 0.1Hz to 10Hz 1.5 µV
Input Noise Voltage Density f = 1kHz 8 12 nV/√Hz
Input Noise Current Density (Note 8) 0.56 fA/√Hz
Input Resistance Common Mode 10
Input Capacitance
f = 100kHz
Differential Mode
Common Mode
50 220
275
375
100 700
800
1050
50 250
325
400
150 900
1000
1100
µV
µV
µV
µV
µV
µV
µV
µV
µV
µV
µV
µV
0.7 2.5 µV/°C
1
75
0.5
75
12
3.5
2.1
pA
pA
pA
pA
P-P
pF
pF
Ω
6244f
5
LTC6244
ELECTRICAL CHARACTERISTICS
(LTC6244HVC/I) The
specifi ed temperature range, otherwise specifi cations are at T
SYMBOL PARAMETER CONDITIONS MIN TYP MAX UNITS
V
CM
CMRR Common Mode Rejection –5V ≤ V
A
VOL
V
OL
V
OH
PSRR Power Supply Rejection V
I
SC
I
S
GBW Gain Bandwidth Product Frequency = 20kHz, R
SR Slew Rate (Note 11) A
FPBW Full Power Bandwidth (Note 12) V
t
s
Input Voltage Range Guaranteed by CMRR
CMRR Match
Channel-to-Channel (Note 5)
Large Signal Voltage Gain VO = –3.5V to 3.5V
Output Voltage Swing Low (Note 9) No Load
Output Voltage Swing High (Note 9) No Load
PSRR Match
Channel-to-Channel (Note 5)
Minimum Supply Voltage (Note 10)
Short-Circuit Current
Supply Current per Amplifi er
Settling Time V
= 25°C. VS = ±5V, 0V, VCM = 0V unless otherwise noted.
A
≤ 3.5V
CM
R
= 10k
L
0°C to 70°C
–40°C to 85°C
R
= 1k
L
0°C to 70°C
–40°C to 85°C
I
= 1mA
SINK
I
= 10mA
SINK
I
= 1mA
SOURCE
I
= 10mA
SOURCE
= 2.8V to 10.5V, VCM = 0.2V
S
= –2, RL = 1kΩ
V
= 3V
OUT
STEP
, RL = 1kΩ
P-P
= 2V, AV = –1, RL = 1kΩ, 0.1% 330 ns
●
denotes the specifi cations which apply over the
●
–5 3.5 V
●
80 105 dB
78 95 dB
●
= 1kΩ
L
2500
●
1500
●
1200
700
●
400
●
300
●
●
●
●
●
●
●
75 110 dB
●
73 106 dB
●
2.8 V
●
40 55 mA
●
●
35 50 MHz
●
18 40 V/µs
●
1.9 4.25 MHz
6000 V/mV
3500 V/mV
15
45
360
15
45
360
78.8 mA
40
75
550
40
75
550
V/mV
V/mV
V/mV
V/mV
mV
mV
mV
mV
mV
mV
●
(LTC6244H) The
= 2.5V unless otherwise noted.
V
CM
denotes the specifi cations which apply from –40°C to 125°C, otherwise specifi cations are at TA = 25°C. VS = 5V, 0V,
SYMBOL PARAMETER CONDITIONS MIN TYP MAX UNITS
V
OS
TC V
I
B
I
OS
V
CM
OS
Input Offset Voltage (Note 4) MS8 Package
V
Match Channel-to-Channel (Note 5) MS8 Package
OS
Input Offset Voltage Drift, MS8 (Note 6)
Input Bias Current (Notes 4, 7)
Input Offset Current (Notes 4, 7)
Input Voltage Range Guaranteed by CMRR
CMRR Common Mode Rejection 0V ≤ V
CM
≤ 3.5V
●
●
●
●
●
●
0 3.5 V
●
74 dB
40 125
400
40 160
400
µV
µV
µV
µV
0.7 2.5 µV/°C
1
2
0.5
250
pA
nA
pA
pA
CMRR Match
Channel-to-Channel (Note 5)
●
72 dB
6244f
6
LTC6244
ELECTRICAL CHARACTERISTICS
(LTC6244H) The
125°C, otherwise specifi cations are at T
SYMBOL PARAMETER CONDITIONS MIN TYP MAX UNITS
A
VOL
V
OL
V
OH
PSRR Power Supply Rejection VS = 2.8V to 6V, VCM = 0.2V
I
SC
I
S
GBW Gain Bandwidth Product Frequency = 20kHz, R
SR Slew Rate (Note 11) A
FPBW Full Power Bandwidth (Note 12) V
Large Signal Voltage Gain VO = 1V to 4V
Output Voltage Swing Low (Note 9) No Load
Output Voltage Swing High (Note 9) No Load
PSRR Match
Channel-to-Channel (Note 5)
Minimum Supply Voltage (Note 10)
Short-Circuit Current
Supply Current per Amplifi er
= 25°C. VS = 5V, 0V, VCM = 2.5V unless otherwise noted.
A
R
= 10k to VS/2
L
= 1.5V to 3.5V
V
O
R
= 1k to VS/2
L
I
= 1mA
SINK
I
= 5mA
SINK
I
= 1mA
SOURCE
I
= 5mA
SOURCE
= –2, RL = 1kΩ
V
= 3V
OUT
, RL = 1kΩ
P-P
●
denotes the specifi cations which apply from –40°C to
●
350 V/mV
●
125 V/mV
= 1kΩ
L
●
●
●
●
●
●
●
75 dB
●
73 dB
●
2.8 V
●
20 mA
●
●
30 MHz
●
17 V/µs
●
1.8 MHz
6.25 7.4 mA
40
85
325
40
85
325
mV
mV
mV
mV
mV
mV
(LTC6244H) The ● denotes the specifi cations which apply from –40°C to 125°C, otherwise specifi cations are at TA = 25°C. VS = 3V, 0V,
= 1.5V unless otherwise noted.
V
CM
SYMBOL PARAMETER CONDITIONS MIN TYP MAX UNITS
V
OS
I
B
I
OS
V
CM
Input Offset Voltage (Note 4) MS8 Package
Match Channel-to-Channel (Note 5) MS8 Package
V
OS
Input Bias Current (Notes 4, 7)
Input Offset Current (Notes 4, 7)
Input Voltage Range Guaranteed by CMRR
CMRR Common Mode Rejection 0V ≤ V
CMRR Match
Channel-to-Channel (Note 5)
A
VOL
V
OL
V
OH
PSRR Power Supply Rejection V
Large Signal Voltage Gain VO = 1V to 2V
= 10k to VS/2
R
L
Output Voltage Swing Low (Note 9) No Load
I
SINK
Output Voltage Swing High (Note 9) No Load
I
SOURCE
= 2.8V to 6V, VCM = 0.2V
S
≤ 1.5V
CM
= 1mA
= 1mA
●
●
●
●
●
0 1.5 V
●
70 dB
●
68 dB
●
75 V/mV
●
●
●
●
●
75 dB
40 175
400
40 200
420
1
0.5
250
30
110
30
110
µV
µV
µV
µV
pA
2
nA
pA
pA
mV
mV
mV
mV
6244f
7
LTC6244
ELECTRICAL CHARACTERISTICS
(LTC6244H) The
125°C, otherwise specifi cations are at T
SYMBOL PARAMETER CONDITIONS MIN TYP MAX UNITS
PSRR Match Channel-to-Channel
(Note 5)
Minimum Supply Voltage (Note 10)
I
SC
I
S
GBW Gain Bandwidth Product Frequency = 20kHz, R
Note 1: Stresses beyond those listed under Absolute Maximum Ratings
may cause permanent damage to the device. Exposure to any Absolute
Maximum Rating condition for extended periods may affect device
reliability and lifetime.
Note 2: A heat sink may be required to keep the junction temperature
below the absolute maximum rating when the output is shorted
indefi nitely.
Note 3: The LTC6244C/LTC6244HVC are guaranteed to meet specifi ed
performance from 0°C to 70°C. They are designed, characterized and
expected to meet specifi ed performance from –40°C to 85°C, but are not
tested or QA sampled at these temperatures. The LTC6244I/LTC6244HVI,
are guaranteed to meet specifi ed performance from –40°C to 85°C. The
LTC6244H is guaranteed to meet specifi ed performance from –40°C to
125°C.
Note 4: ESD (Electrostatic Discharge) sensitive device. ESD protection
devices are used extensively internal to the LTC6244; however, high
electrostatic discharge can damage or degrade the device. Use proper ESD
handling precautions.
Note 5: Matching parameters are the difference between the two amplifi ers
of the LTC6244. CMRR and PSRR match are defi ned as follows: CMRR
and PSRR are measured in µV/V on the amplifi ers. The difference is
calculated between the sides in µV/V. The result is converted to dB.
Short-Circuit Current
Supply Current per Amplifi er
= 25°C. VS = 3V, 0V, VCM = 1.5V unless otherwise noted.
A
●
denotes the specifi cations which apply from –40°C to
●
73 dB
●
2.8 V
●
5mA
●
= 1kΩ
L
Note 6: This parameter is not 100% tested.
Note 7: This specifi cation is limited by high speed automated test
capability. See Typical Characteristics curves for actual typical
performance.
Note 8: Current noise is calculated from the formula: i
where q = 1.6 × 10
50GΩ dominates the contribution of current noise. See also Typical
Characteristics curve Noise Current vs Frequency.
Note 9: Output voltage swings are measured between the output and
power supply rails.
Note 10: Minimum supply voltage is guaranteed by the power supply
rejection ratio test.
Note 11: Slew rate is measured in a gain of –2 with R
500Ω. V
IN
+1V. On the LTC6244HV/LTC6245HV, V
measured between –2V and +2V.
Note 12: Full-power bandwidth is calculated from the slew rate:
FPBW = SR/2πV
–19
is ±1V and V
.
P
●
28 MHz
coulomb. The noise of source resistors up to
slew rate is measured between –1V and
OUT
4.8 5.8 mA
= (2qIB)
n
= 1k and RG =
F
is ±2V and V
IN
OUT
1/2
slew rate is
8
6244f
UW
TYPICAL PERFOR A CE CHARACTERISTICS
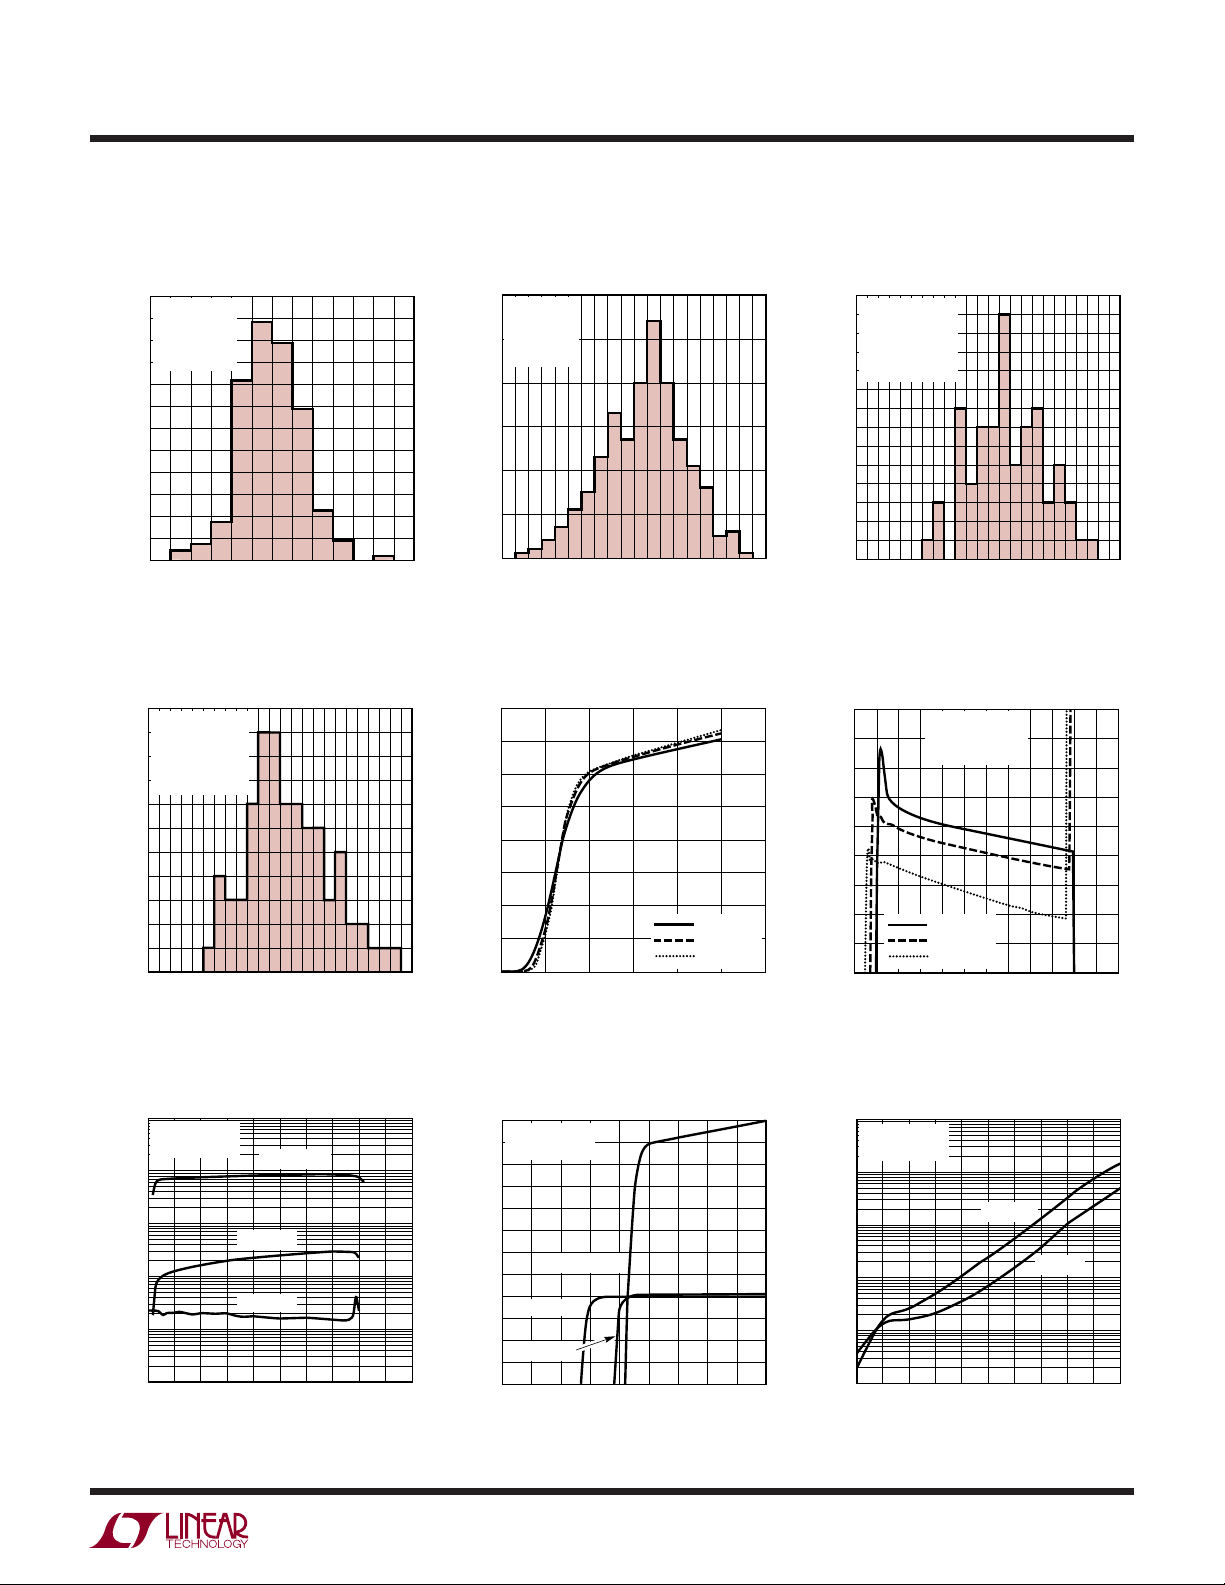
VOS Distribution VOS Distribution
120
LTC6244MS8
110
V
= 5V, 0V
S
100
= 2.5V
V
CM
= 25°C
T
A
90
80
70
60
50
40
NUMBER OF UNITS
30
20
10
0
–60 –40
INPUT OFFSET VOLTAGE (µV)
–20
0
20 40
60
6244 G01
60
LTC6244DD
= 5V, 0V
V
S
50
= 2.5V
V
CM
= 25°C
T
A
40
30
20
NUMBER OF UNITS
10
0
–500
–350 –200 –50 100 250 400
INPUT OFFSET VOLTAGE (µV)
6244 G02
LTC6244
V
Temperature Coeffi cient
OS
Distribution
14
LTC6244MS8
13
= 5V, 0V
V
S
12
= 2.5V
V
CM
11
2 LOTS
10
–55°C TO 125°C
9
8
7
6
5
NUMBER OF UNITS
4
3
2
1
0
–2.4 –1.6 –0.8 0 0.8 1.6 2.4
DISTRIBUTION (µV/°C)
6422 G03
VOS Temperature Coeffi cient
Distribution
11
LTC6244DD
10
= 5V, 0V
V
S
= 2.5V
V
9
CM
2 LOTS
8
–55°C TO 125°C
7
6
5
4
NUMBER OF UNITS
3
2
1
0
–6 6–5 5–4 4–3 3–2 2–1 10
DISTRIBUTION (µV/°C)
Input Bias Current vs Common
Mode Voltage
10000
MS8 PACKAGE
= 5V, 0V
V
S
1000
100
10
INPUT BIAS CURRENT (pA)
1
0.1
0 0.5 1
COMMON MODE VOLTAGE (V)
TA = 125°C
TA = 85°C
TA = 25°C
1.5 2 2.5 3 3.5 4 4.5 5
6422 G19
6244 G06
Supply Current vs Supply Voltage
(Per Amplifi er)
8
7
6
5
4
3
SUPPLY CURRENT (mA)
2
1
0
24 8
0
TOTAL SUPPLY VOLTAGE (V)
6
Input Bias Current vs
Common Mode Voltage
800
MS8 PACKAGE
700
= 5V, 0V
V
S
600
500
400
300
200
100
0
–100
INPUT BIAS CURRENT (pA)
–200
–300
–400
–0.8
TA = 125°C
TA = 25°C
TA = 85°C
–0.6
–0.2
0
–0.4
COMMON MODE VOLTAGE (V)
0.2 0.4 0.6 0.8 1.0
TA = 125°C
= 25°C
T
A
= –55°C
T
A
10
6244 G04
6244 G07
500
400
300
200
100
–100
OFFSET VOLTAGE (µV)
–200
–300
–400
12
10000
1000
100
10
INPUT BIAS CURRENT (pA)
0.1
Offset Voltage vs Input Common
Mode Voltage
VS = 5V, 0V
NORMALIZED TO
VALUE
25°C V
OS
0
TA = 125°C
= 25°C
T
A
= –55°C
T
A
–1
1
INPUT COMMON MODE VOLTAGE (V)
0.5
0
–0.5 3.5
1.5
2.5
2
3
4
Input Bias Current vs Temperature
MS8 PACKAGE
= VS/2
V
CM
VS = 10V
VS = 5V
1
25 35 45
55 65 75 85 95 105 115 125
TEMPERATURE (°C)
4.5
6244 G05
6244 G08
5
6244f
9

LTC6244
UW
TYPICAL PERFOR A CE CHARACTERISTICS
Output Saturation Voltage
vs Load Current (Output Low)
10
VS = 5V, 0V
1
0.1
TA = 125°C
= 25°C
T
OUTPUT LOW SATURATION VOLTAGE (V)
0.01
0.1
1 10 100
LOAD CURRENT (mA)
A
= –55°C
T
A
Open Loop Gain vs Frequency
100
90
80
70
60
50
40
30
GAIN (dB)
20
10
0
–10
–20
10k 1M 10M 100M
PHASE
GAIN
VS = ±5V
= ±1.5V
V
S
100k
FREQUENCY (Hz)
CL = 5pF
= 1k
R
L
= VS/2
V
CM
6244 G09
6244 G12
Output Saturation Voltage
vs Load Current (Output High)
10
VS = 5V, 0V
1
0.1
OUTPUT HIGH SATURATION VOLTAGE (V)
0.01
0.1
1 10 100
LOAD CURRENT (mA)
Gain Bandwidth and Phase
Margin vs Supply Voltage Slew Rate vs Temperature
120
100
80
60
40
PHASE (DEG)
20
0
–20
–40
–60
–80
–100
–120
TA = 25°C
= 5pF
C
L
= 1k
R
L
70
60
GAIN BANDWIDTH (MHz)
50
40
0
468
2
TOTAL SUPPLY VOLTAGE (V)
PHASE MARGIN
GAIN BANDWIDTH
TA = 125°C
= 25°C
T
A
T
= –55°C
A
6244 G10
10 12
6244 G13
Gain Bandwidth and Phase
Margin vs Temperature
PHASE
MARGIN
70
60
GAIN BANDWIDTH (MHz)
50
CL = 5pF
40
= 1k
R
L
30
–55 –35 –15
60
50
40
30
50
48
46
PHASE MARGIN (DEG)
44
42
40
38
36
SLEW RATE (V/µs)
34
32
30
28
5 25 45 125
TEMPERATURE (°C)
AV = –2
= 1k, RG = 500Ω
R
F
CONDITIONS: SEE NOTE 11
VS = ±5V
V
S
–50
–25
GAIN
BANDWIDTH
65 85 105
= ±2.5V
50
25
0
TEMPERATURE (°C)
VS = ±5V
VS = ±1.5V
VS = ±5V
VS = ±1.5V
6244 G11
FALLING
RISING
75
80
60
40
PHASE MARGIN (DEG)
20
0
–20
125
100
6244 G14
Output Impedance vs Frequency
1000
TA = 25°C
= ±2.5V
V
S
100
10
AV = 10
1
0.1
OUTPUT IMPEDANCE (Ω)
0.01
0.001
10k 1M 10M 100M
100k
FREQUENCY (Hz)
AV = 2
AV = 1
10
6244 G15
Common Mode Rejection Ratio
vs Frequency
110
100
90
80
70
60
50
40
30
20
10
0
COMMON MODE REJECTION RATIO (dB)
–10
10k 1M 10M 100M
100k
FREQUENCY (Hz)
TA = 25°C
V
S
= ±2.5V
6244 G16
Channel Separation vs Frequency
0
TA = 25°C
–10
= ±2.5V
V
S
= 1
A
–20
V
–30
–40
–50
–60
–70
–80
–90
CHANNEL SEPARATION (dB)
–100
–110
–120
10k 1M 10M 100M
100
FREQUENCY (Hz)
6244 G17
6244f

UW
TYPICAL PERFOR A CE CHARACTERISTICS
LTC6244
Power Supply Rejection Ratio
vs Frequency
100
90
80
70
POSITIVE
60
SUPPLY
50
40
30
20
10
0
POWER SUPPLY REJECTION RATIO (dB)
–10
1k
NEGATIVE
SUPPLY
10k 1M100k 10M 100M
FREQUENCY (Hz)
TA = 25°C
V
= ±2.5V
S
6244 G18
Minimum Supply Voltage
300
VCM = VS/2
250
200
150
100
50
0
–50
–100
–150
–200
CHANGE IN OFFSET VOLTAGE (µV)
–250
–300
2
0
3
19
4
TOTAL SUPPLY VOLTAGE (V)
TA = 125°C
= 25°C
T
A
= –55°C
T
A
6
7
8
5
10
6244 G20
Output Short-Circuit Current
vs Power Supply Voltage
50
40
30
20
10
0
–10
–20
–30
–40
OUTPUT SHORT-CIRCUIT CURRENT (mA)
–50
1.5
2
POWER SUPPLY VOLTAGE (±V)
Open-Loop Gain Open-Loop Gain Open-Loop Gain
–40
–50
–60
–70
–80
–90
INPUT VOLTAGE (µV)
RL = 10k
RL = 1k
TA = 25°C
= ±5V
V
S
–40
–50
–60
–70
–80
–90
INPUT VOLTAGE (µV)
RL = 10k
RL = 1k
TA = 25°C
= 5V, 0V
V
S
–40
–50
–60
–70
–80
INPUT VOLTAGE (µV)
–90
TA = 125°C
= 25°C
T
A
= –55°C
T
A
2.5
SINKING
SOURCING
3.5
3
RL = 100k
RL = 10k
4
TA = 25°C
= 3V, 0V
V
S
4.5
5
6244 G21
–100
–110
4
6244 G22
5
–5
–2
–3
–4
OUTPUT VOLTAGE (V)
–1
2
0
13
–100
–110
0
1.5
1
0.5
OUTPUT VOLTAGE (V)
Offset Voltage vs Output Current Warm-Up Drift vs Time
200
150
100
–50
OFFSET VOLTAGE (µV)
–100
–150
– 200
50
0
VS = ±5V
TA = 125°C
–50
–30 –10 10 5020–40 –20 0 40
OUTPUT CURRENT (mA)
TA = 25°C
TA = –55°C
30
6244 G25
–5
–10
–15
–20
–25
–30
–35
CHANGE IN OFFSET VOLTAGE (µV)
–40
–45
5
0
10 20
15 25
TIME AFTER POWER UP (SEC)
2.5
2
VS = ±1.5V
VS = ±5V
VS = ±2.5V
30
3.5
34
35
40 50
4.5
6244 G22
TA = 25°C
45 55
6244 G26
–100
–110
0
5
0.5 1
OUTPUT VOLTAGE (V)
23
1.5 2.5
6244 G23
Noise Voltage vs Frequency
40
35
30
25
20
15
10
NOISE VOLTAGE (nV/√Hz)
5
0
60
10 1k 10k 100k
100
FREQUENCY (Hz)
TA = 25°C
= ±2.5V
V
S
= 0V
V
CM
6244 G27
6244f
11

LTC6244
UW
TYPICAL PERFOR A CE CHARACTERISTICS
0.1Hz to 10Hz Voltage Noise Noise Current vs Frequency
1000
NOISE CURRENT (fA/√Hz)
100
0.1
10
1
TA = 25°C
V
S
V
CM
100
= ±2.5V
= 0V
1k 10k 100k
FREQUENCY (Hz)
VS = 5V, 0V
VOLTAGE NOISE (500nV/DIV)
TIME (1s/DIV)
6244 G28
6244 G29
Series Output Resistance and
Overshoot vs Capacitive Load
60
V
= 100mV
OUT
= ±2.5V
V
S
= –2
A
50
V
30pF
40
30
OVERSHOOT (%)
20
10
0
10
1k
500Ω
–
+
CAPACITIVE LOAD (pF)
R
S
C
100 1000
RS = 10Ω
L
RS = 50Ω
6244 G30
Series Output Resistance and
Overshoot vs Capacitive Load
60
V
= 100mV
OUT
= ±2.5V
V
S
= –1
A
50
V
30pF
40
30
OVERSHOOT (%)
20
10
0
10
1k
1k
–
+
CAPACITIVE LOAD (pF)
R
S
C
100 1000
Settling Time vs Output Step
(Inverting)
900
VS = ±5V
= –1
A
V
800
= 25°C
T
A
700
600
500
400
300
SETTLING TIME (ns)
200
100
0
10mV
–3
–4
1k
V
IN
1mV
–2
–1
OUTPUT STEP (V)
–
+
0
L
1k
1mV
1
RS = 10Ω
RS = 50Ω
V
OUT
1k
10mV
2
6244 G34
6244 G31
3
Series Output Resistance and
Overshoot vs Capacitive Load
60
50
40
30
OVERSHOOT (%)
20
10
0
10
Maximum Undistorted Output
Signal vs Frequency
10
9
)
P-P
8
7
6
5
4
3
OUTPUT VOLTAGE SWING (V
2
4
1
10k
V
= 100mV
OUT
= ±2.5V
V
S
= 1
A
V
–
+
CAPACITIVE LOAD (pF)
VS = ±5V
= 25°C
T
A
HD2, HD3 < –40dBc
100k 1M 10M
FREQUENCY (Hz)
RS = 10Ω
RS = 50Ω
R
S
C
L
100 1000
6244 G32
AV = +2
AV = –1
6244 G35
Settling Time vs Output Step
(Noninverting)
900
VS = ±5V
= 1
A
V
800
= 25°C
T
A
700
600
500
400
300
SETTLING TIME (ns)
200
100
0
–4
NOTE: EXCEEDS INPUT
COMMON MODE RANGE
–
+
V
IN
1mV 1mV
–3
–2
0
–1
OUTPUT STEP (V)
Distortion vs Frequency
–30
VS = ±2.5V
= +1
A
V
–40
–50
–60
–70
DISTORTION (dBc)
–80
–90
–100
10k
= 2V
V
OUT
P-P
RL = 1k, 2ND
100k 1M 10M
FREQUENCY (Hz)
V
OUT
1k
10mV10mV
1
2
RL = 1k, 3RD
3
6244 G33
6244 G36
4
12
6244f

UW
TYPICAL PERFOR A CE CHARACTERISTICS
LTC6244
Distortion vs Frequency Distortion vs Frequency
–30
VS = ±2.5V
= +2
A
V
–40
–50
–60
–70
DISTORTION (dBc)
–80
–90
–100
10k
= 2V
V
OUT
P-P
RL = 1k, 2ND
RL = 1k, 3RD
100k 1M 10M
FREQUENCY (Hz)
6244 G37
Small-Signal Response Small-Signal Response
0V
Distortion vs Frequency
–30
VS = ±5V
= +1
A
V
–40
–50
–60
–70
DISTORTION (dBc)
–80
–90
–100
= 2V
V
OUT
P-P
RL = 1k, 2ND
10k
0V
100k 1M 10M
FREQUENCY (Hz)
RL = 1k, 3RD
6244 G38
–30
VS = ±5V
= +2
A
V
–40
–50
–60
–70
DISTORTION (dBc)
–80
–90
–100
10k
= 2V
V
OUT
P-P
RL = 1k, 2ND
100k 1M 10M
FREQUENCY (Hz)
Large-Signal Response
0V
RL = 1k, 3RD
6244 G39
VS = ±2.5V
= 1
A
V
= ∞
R
L
200ns/DIV
6244 G40
Large-Signal Response
0V
VS = ±2.5V
= –1
A
V
= 1k
R
L
200ns/DIV
6244 G43
= ±2.5V
V
S
= 1
A
V
= ∞
R
L
= 75pF
C
L
200ns/DIV
V
1V/DIV
V
OUT
2V/DIV
6244 G41
Output Overdrive Recovery
IN
0V
0V
VS = ±2.5V
= 3
A
V
= 3k
R
L
200ns/DIV
VS = ±5V
= 1
A
V
= ∞
R
L
6244 G44
2µs/DIV
6244 G42
6244f
13

LTC6244
–
U
WUU
APPLICATIO S I FOR ATIO
Amplifi er Characteristics
Figure 1 is a simplifi ed schematic of the LTC6244, which
has a pair of low noise input transistors M1 and M2. A
simple folded cascode Q1, Q2 and R1, R2 allow the input
stage to swing to the negative rail, while performing level
shift to the Differential Drive Generator. Low offset voltage
is accomplished by laser trimming the input stage.
Capacitor C1 reduces the unity cross frequency and improves the frequency stability without degrading the gain
bandwidth of the amplifi er. Capacitor C
amplifi er gain bandwidth. The differential drive generator
supplies signals to transistors M3 and M4 that swing the
output from rail-to-rail.
The photo of Figure 2 shows the output response to an
input overdrive with the amplifi er connected as a voltage
follower. If the negative going input signal is less than
–
a diode drop below V
, no phase inversion occurs. For
input signals greater than a diode drop below V
current to 3mA with a series resistor R
inversion.
The input common mode voltage range extends from
–
to V+ – 1.5V. In unity gain voltage follower applications,
V
exceeding this range by applying a signal that reaches 1V
from the positive supply rail can create a low level instability
at the output. Loading the amplifi er with several hundred
micro-amps will reduce or eliminate the instability.
sets the overall
M
–
, limit the
to avoid phase
S
ESD
The LTC6244 has reverse-biased ESD protection diodes on
all input and outputs as shown in Figure 1. These diodes
protect the amplifi er for ESD strikes to 4kV. If these pins
are forced beyond either supply, unlimited current will
fl ow through these diodes. If the current transient is less
than 1 second and limited to one hundred milliamps or
less, no damage to the device will occur.
The amplifi er input bias current is the leakage current of
these ESD diodes. This leakage is a function of the temperature and common mode voltage of the amplifi er, as
shown in the Typical Performance Chacteristics.
Noise
The LTC6244 exhibits low 1/f noise in the 0.1Hz to 10Hz
region. This 1.5µV
noise allows these op amps to be
P-P
used in a wide variety of high impedance low frequency
applications, where Zero-Drift amplifi ers might be inappropriate due to their input sampling characteristic.
In the frequency region above 1kHz the LTC6244 also
shows good noise voltage performance. In this frequency
region, noise can easily be dominated by the total source
+
V
2.5V
+
+
–
V
V
DESD1
+
V
IN
–
V
IN
DESD3
DESD2
DESD4
+
–
V
V
I
TAIL
M2M1
C1
BIAS
CM
DIFFERENTIAL
DRIVE
GENERATOR
–
V
Q1
Q2
M3
M4
V
V
V
+
–
DESD5
DESD6
–
V
2.5V
V
O
V
AND VIN OF FOLLOWER WITH LARGE INPUT OVERDRIVE
OUT
+2.5V
+
R
0Ω
1/2
S
LTC6244
V
OUT
–
R2
R1
Figure 1. Simplifi ed Schematic
6244 F01
–
V
V
IN
–2.5V
6244 F02
Figure 2. Unity Gain Follower Test Circuit
6244f
14

LTC6244
U
WUU
APPLICATIO S I FOR ATIO
resistance of the particular application. Specifi cally, these
amplifi ers exhibit the noise of a 4k resistor, meaning it is
desirable to keep the source and feedback resistance at or
below this value, i.e., R
source impedance, the noise voltage is not dominated by
the amplifi er.
Noise current can be estimated from the expression i
, where q = 1.6 • 10
√2qI
B
and R
√2qIBΔf shows that for source resistors below
S
50GΩ the amplifi er noise is dominated by the source
resistance. See the Typical Characteristics curve Noise
Current vs Frequency.
Proprietary design techniques are used to obtain simultaneous low 1/f noise and low input capacitance. Low input
capacitance is important when the amplifi er is used with
high source and feedback resistors. High frequency noise
from the amplifi er tail current source, I
couples through the input capacitance and appears across
these large source and feedback resistors.
Stability
The good noise performance of these op amps can be
attributed to large input devices in the differential pair.
Above several hundred kilohertz, the input capacitance
can cause amplifi er stability problems if left unchecked.
When the feedback around the op amp is resistive (R
pole will be created with R
capacitance (R
, CS), and the amplifi er input capacitance.
S
+ RG||RFB ≤ 4k. Above this total
S
–19
coulombs. Equating √4kTRΔf
in Figure 1,
TAIL
, the source resistance, source
F
n
), a
F
=
In low gain confi gurations and with R
and RS in even
F
the kilohm range (Figure 3), this pole can create excess
phase shift and possibly oscillation. A small capacitor C
in parallel with R
eliminates this problem.
F
F
Achieving Low Input Bias Current
The DD package is leadless and makes contact to the PCB
beneath the package. Solder fl ux used during the attachment of the part to the PCB can create leakage current
paths and can degrade the input bias current performance
of the part. All inputs are susceptible because the backside
–
paddle is connected to V
–
changes or if V
changes, a leakage path can be formed
internally. As the input voltage
and alter the observed input bias current. For lowest bias
current, use the LTC6244 in the MS8 package.
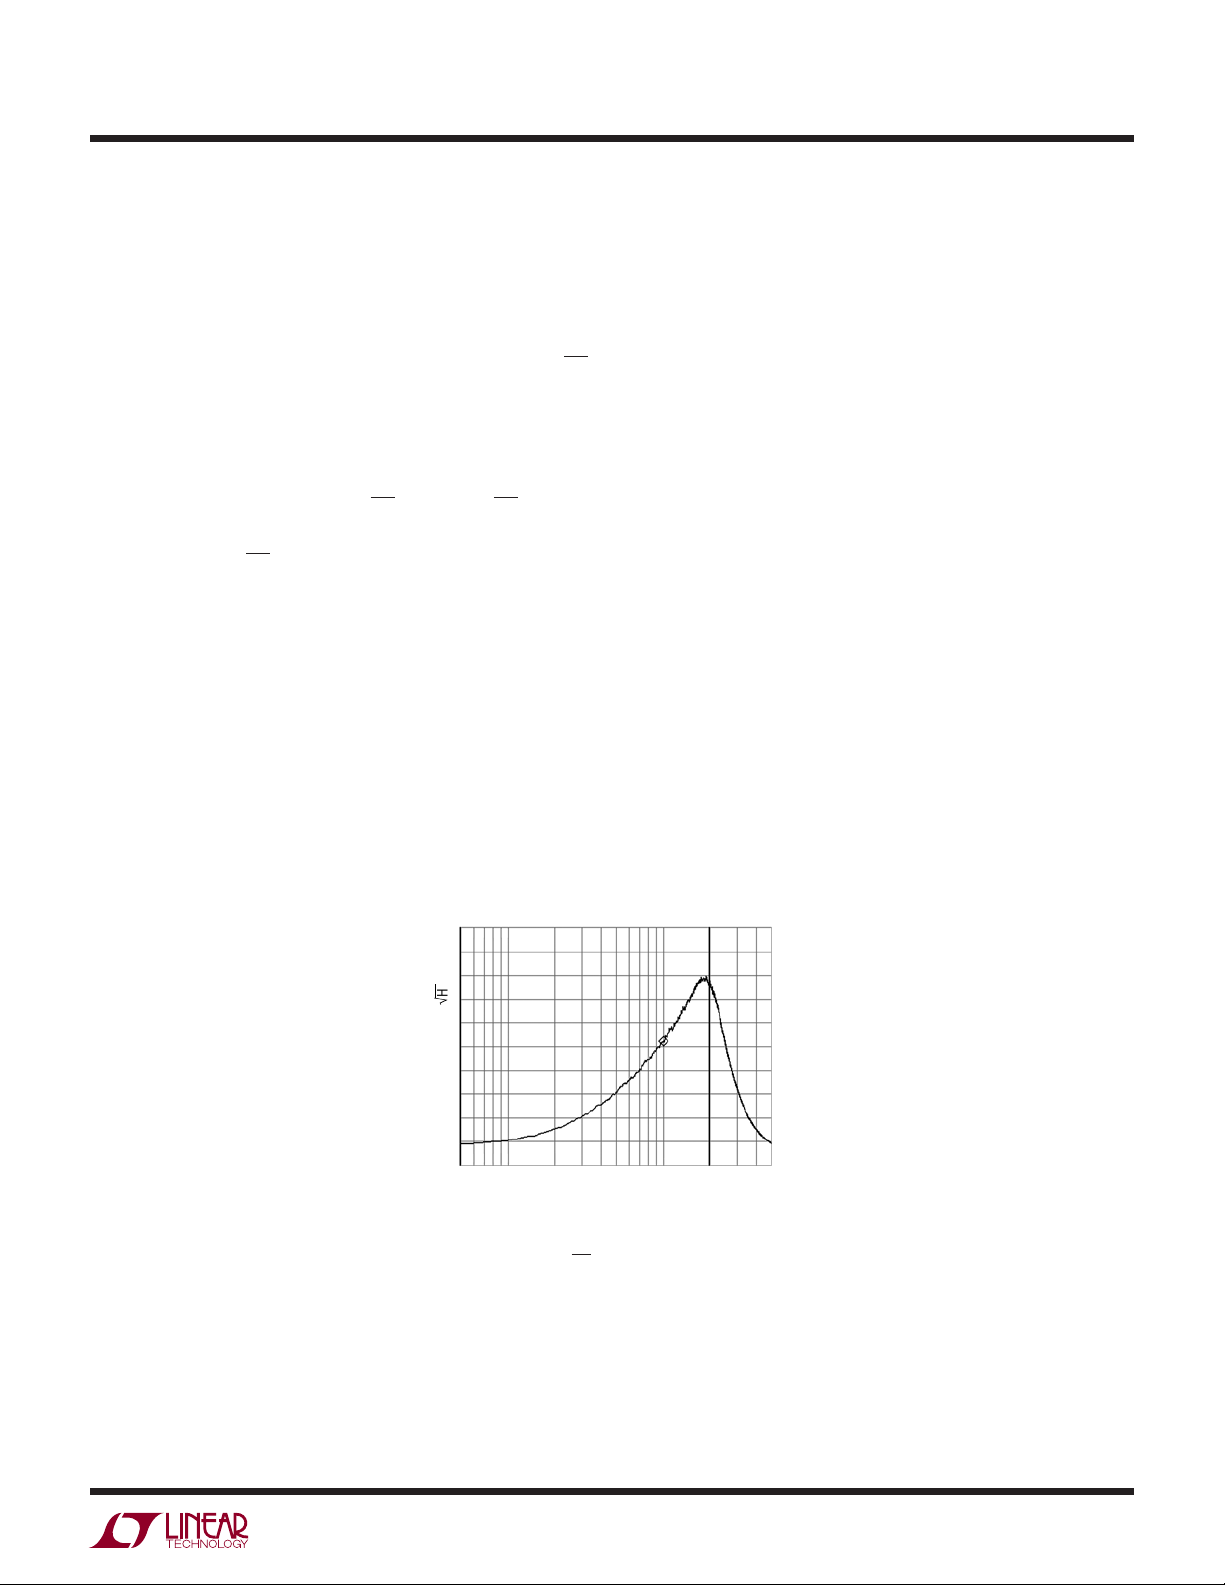
Photodiode Amplifi ers
Photodiodes can be broken into two categories: large area
photodiodes with their attendant high capacitance (30pF
to 3000pF) and smaller area photodiodes with relatively
low capacitance (10pF or less). For optimal signal-to-noise
performance, a transimpedance amplifi er consisting of an
inverting op amp and a feedback resistor is most commonly
used to convert the photodiode current into voltage. In low
noise amplifi er design, large area photodiode amplifi ers
require more attention to reducing op amp input voltage
noise, while small area photodiode amplifi ers require
more attention to reducing op amp input current noise
and parasitic capacitances.
C
F
R
F
–
C
C
R
S
S
Figure 3. Compensating Input Capacitance
IN
+
6244 F03
OUTPUT
6244f
15

LTC6244
U
WUU
APPLICATIO S I FOR ATIO
Large Area Photodiode Amplifi ers
A simple large area photodiode amplifi er is shown in
Figure 4a. The capacitance of the photodiode is 3650pF
(nominally 3000pF), and this has a signifi cant effect on
the noise performance of the circuit. For example, the
photodiode capacitance at 10kHz equates to an impedance
of 4.36kΩ, so the op amp circuit with 1MΩ feedback has a
noise gain of NG = 1 + 1M/4.36k = 230 at that frequency.
Therefore, the LTC6244 input voltage noise gets to the
output as NG • 7.8nV/√Hz = 1800nV/√Hz, and this can
clearly be seen in the circuit’s output noise spectrum in
Figure 4b. Note that we have not yet accounted for the
op amp current noise, or for the 130nV/√Hz of the gain
resistor, but these are obviously trivial compared to the op
C
F
3.9pF
R
F
1M
I
PD
HAMAMATSU
LARGE AREA
PHOTODIODE
S1227-1010BQ
= 3000pF
C
PD
Figure 4a. Large Area Photodiode Transimpedance Amplifi er
Hz/DIV)
Ö
OUTPUT NOISE (800nV/
1k 10k
Figure 4b. Output Noise Spectral Density of the Circuit of Figure
4a. At 10kHz, the 1800nV/√Hz Output Noise is Due Almost
Entirely to the 7.8nV Voltage Noise of the LTC6244 and the High
Noise Gain of the 1M Feedback Resistor Looking Into the High
Photodiode Capacitance
5V
–
1/2
LTC6244HV
+
–5V
FREQUENCY (Hz)
V
= 1M • I
OUT
BW = 52kHz
NOISE = 1800nV/√Hz AT 10kHz
V
OUT
6244 F04a
PD
100k
6244 F04b
amp voltage noise and the noise gain. For reference, the
DC output offset of this circuit is about 100µV, bandwidth
is 52kHz, and the total noise was measured at 1.7mV
RMS
on a 100kHz measurement bandwidth.
An improvement to this circuit is shown in Figure 5a,
where the large diode capacitance is bootstrapped by a
1nV/√Hz JFET. This depletion JFET has a V
–0.5V, so that R
forces it to operate at just over 1mA of
BIAS
of about
GS
drain current. Connected as shown, the photodiode has a
reverse bias of one V
, so its capacitance will be slightly
GS
lower than in the previous case (measured 2640pF), but
the most drastic effects are due to the bootstrapping.
Figure 5b shows the output noise of the new circuit.
Noise at 10kHz is now 220nV/√Hz, and the 130nV/√Hz
noise thermal noise fl oor of the 1M feedback resistor
is discernible at low frequencies. What has happened is
that the 7.8nV/√Hz of the op amp has been effectively
replaced by the 1nV/√Hz of the JFET. This is because the
1M feedback resistor is no longer “looking back” into the
large photodiode capacitance. It is instead looking back
into a JFET gate capacitance, an op amp input capacitance,
and some parasitics, approximately 10pF total. The large
photodiode capacitance is across the gate-source voltage of the low noise JFET. Doing a sample calculation at
10kHz as before, the photodiode capacitance looks like
6kΩ, so the 1nV/√Hz of the JFET creates a current noise
of 1nV/6k = 167fA/√Hz. This current noise necessarily
fl ows through the 1M feedback resistor, and so appears
as 167nV/√Hz at the output. Adding the 130nV/√Hz of the
resistor (RMS wise) gives a total calculated noise density
of 210nV/√Hz, agreeing well with the measured noise of
Figure 5b. Another drastic improvement is in bandwidth,
now over 350kHz, as the bootstrap enabled a reduction
of the compensating feedback capacitance. Note that the
bootstrap does not affect the DC accuracy of the amplifi er,
except by adding a few picoamps of gate current.
There is one drawback to this circuit. Most photodiode
circuits require the ability to set the amount of applied
reverse bias, whether it’s 0V, 5V, or 200V. This circuit has
a fi xed reverse bias of about 0.5V, dictated by the JFET.
16
6244f

LTC6244
U
WUU
APPLICATIO S I FOR ATIO
C
F
0.25pF
5V
–5V
PHILIPS
BF862
JFET
R
BIAS
4.99k
I
PD
–
HAMAMATSU
LARGE AREA
PHOTODIODE
S1227-1010BQ
= 3000pF
C
PD
LTC6244HV
+
Figure 5a. Large Area Diode Bootstrapping
Hz/DIV)
Ö
1/2
5V
–5V
R
F
1M
V
= 1M • I
OUT
BW = 350kHz
OUTPUT NOISE = 220nV/√Hz
V
OUT
6244 F04a
PD
AT10kHz
C
F
0.25pF
5V
4.99k
–5V
4.7µF
X7R
4.99k
V
BB
HAMAMATSU LARGE AREA
PHOTODIODE
S1227-1010BQ
C
PD
PHILIPS
BF862
JFET
I
PD
= 3000pF
–
LTC6244HV
+
1/2
5V
–5V
R
F
1M
V
= 1M • I
OUT
BW = 250kHz
OUTPUT NOISE = 291nV/√Hz
V
OUT
6244 F06a
PD
AT 10kHz
Figure 6a. The Addition of a Capacitor and Resistor Enable the
Benefi t of Bootstrapping While Applying Arbitrary Photodiode
Bias Voltage V
BB
OUTPUT NOISE (200nV/
1k 10k
FREQUENCY (Hz)
100k
6244 F05b
Figure 5b: Output Noise Spectral Density of Figure 5a. The
Simple JFET Bootstrap Improves Noise (and Bandwidth)
Drastically. Noise Density at 10kHz is Now 220nV/√Hz, About
a 8.2x Reduction. This is Mostly Due to the Bootstrap Effect
of Swapping the 1nV/√Hz of the JFET for the 7.8nV/√Hz of the
Op Amp
The solution is as shown in the circuit of Figure 6a, which
uses a capacitor-resistor pair to enable the AC benefi ts of
bootstrapping while allowing a different reverse DC voltage
on the photodiode. The JFET is still running at the same
current, but an arbitrary reverse bias may be applied to
the photodiode. The output noise spectrum of the circuit
with 0V of photodiode reverse bias is shown in Figure 6b.
Photodiode capacitance is again 3650pF, as in the original
circuit of Figure 4a. This noise plot with 0V bias shows
that bootstrapping alone was responsible for a factor of
6.2 noise reduction, from 1800nV/√Hz to 291nV/√Hz at
10kHz, independent of photodiode capacitance. However,
photodiode capacitance can now can be reduced arbitrarily
Hz/DIV)
Ö
OUTPUT NOISE (275nV/
1k 10k
FREQUENCY (Hz)
100k
6244 F06b
Figure 6b: Output Spectrum of Circuit of Figure 6a, with
Photodiode Bias at 0V. Photodiode Capacitance is Back Up,
as in the Original Circuit of Figure 4a. However, it can be
Reduced Arbitrarily by Providing Reverse Bias. This Plot
Shows that Bootstrapping Alone Reduced the 10kHz Noise
Density by a Factor of 6.2, from 1800nV/√Hz to 291nV/√Hz.
by providing reverse bias, and the photodiode can also be
reversed to support either cathode or anode connections
for positive or negative going outputs.
The circuit on the last page of this data sheet shows further reduction in noise by paralleling four JFETs to attain
152nV/√Hz at 10kHz, a noise of 12 times less than the
basic photodiode circuit of Figure 4a.
6244f
17

LTC6244
U
WUU
APPLICATIO S I FOR ATIO
Small Area Photodiode Amplifi ers
Small area photodiodes have very low capacitance, typically
under 10pF and some even below 1pF. Their low capacitance makes them more approximate current sources to
higher frequencies than large area photodiodes. One of
the challenges of small area photodiode amplifi er design
is to maintain low input capacitance so that voltage noise
does not become an issue and current noise dominates. A
simple small area photodiode amplifi er using the LTC6244
is shown in Figure 7. The input capacitance of the amplifi er consists of C
SMALL AREA
PHOTODIODE
VISHAY
TEMD1000
= 1.8pF
C
PD
Figure 7. LTC6244 in a Normal TIA Confi guration
and one CCM (because the +input is
DM
C
F
0.1pF
R
F
–5V
1M
I
PD
5V
–
1/2
LTC6244HV
+
6244 F07
–5V
= 1M • I
V
OUT
BW = 350kHz
NOISE = 120mV
MEASURED ON A
350kHz BW
V
OUT
PD
RMS
grounded), or about 6pF total. The small photodiode has
1.8pF, so the input capacitance of the amplifi er is dominating
the capacitance. The small feedback capacitor is an actual
component (AVX Accu-F series), but it is also in parallel
with the op amp lead, resistor and parasitic capacitances,
so the total real feedback capacitance is probably about
0.4pF. The reason this is important is that this sets the
compensation of the circuit and, with op amp gain bandwidth, the circuit bandwidth. The circuit as shown has a
bandwidth of 350kHz, with an output noise of 120µV
RMS
measured over that bandwidth.
The circuit of Figure 8a makes some slight improvements.
Operation is still transimpedance mode, with R
setting
F
the gain to 1MΩ. However, a noninverting input stage A1
with a gain of 3 has been inserted, followed by the usual
inverting stage performed by A2. Note what this achieves.
The amplifi er input capacitance is bootstrapped by the
feedback of R2:R1, eliminating the effect of A1’s input
(3.5pF), and leaving only one CCM (2.1pF). The op
C
DM
amp at Pins 5, 6 and 7 was chosen for the input amplifi er
to eliminate extra pin-to-pin capacitance on the (+) input.
The lead capacitance on the corner of an MSOP package is
only about 0.15pF. By using this noninverting confi guration, input capacitance is minimized.
0.07pF
(PARASITIC)
R
F
1M
R4
2
–
LTC6244HV
3
+
6.98k
A2 1/2
–5V
4
C2
150pF
V
OUT
BW = 1.6MHz
NOISE = 1.2mV
MEASURED ON A
2MHz BW
1
6244 F08a
= 1M • I
V
OUT
PD
RMS
SMALL AREA
PHOTODIODE
VISHAY
TEMD1000
= 1.8pF
C
PD
–5V
5
+
LTC6244HV
6
–
R1
499
9
A1 1/2
5V
8
56pF
R3
1k
7
R2
1k
C1
I
PD
Figure 8a: Using Both Op Amps for Higher Bandwidth. A1 Provides a Gain of 3 Within the Loop, Increasing the Gain Bandwidth
Product. This Bootstraps the C
Accross A1’s Inputs, Reducing Amplifi er Input Capacitance. Inversion is Provided by A2, so that
DM
the Photodiode Looks Into a Noninverting Input. Pin 5 was Selected Because it is in the Corner, Removing One Lead Capacitance
6244f
18
LTC6244
U
WUU
APPLICATIO S I FOR ATIO
Total capacitance at the amplifi er’s input is now one CCM
(2.1pF) plus the photodiode capacitance C
about 4pF accounting for parasitics. The shunt impedance
at 1MHz, for example, is X
= 1/(2πfC) = 39.8kΩ, and
C
therefore, the noise gain at 1MHz is NG = 1+Rf/X
The input voltage noise of this amplifi er is about 15nV/√Hz,
after accounting for the effects of R1 through R3, the
noise of the second stage and the fact that voltage noise
does rise with frequency. Multiplying the noise gain by
the input voltage noise gives an output noise density due
to voltage noise of 26 • 15nV/√Hz = 390nV/√Hz. But the
noise spectral density plot of Figure 8b shows an output
noise of 782nV/√Hz at 1MHz. The extra output noise is
due to input current noise, multiplied by the feedback
impedance. So while the circuit of Figure 8a does increase
bandwidth, it does not offer a noise advantage. Note,
however, that the 1.2mV
of noise is now measured in
RMS
a 2MHz bandwidth, instead of over a 350kHz bandwidth
of the previous example.
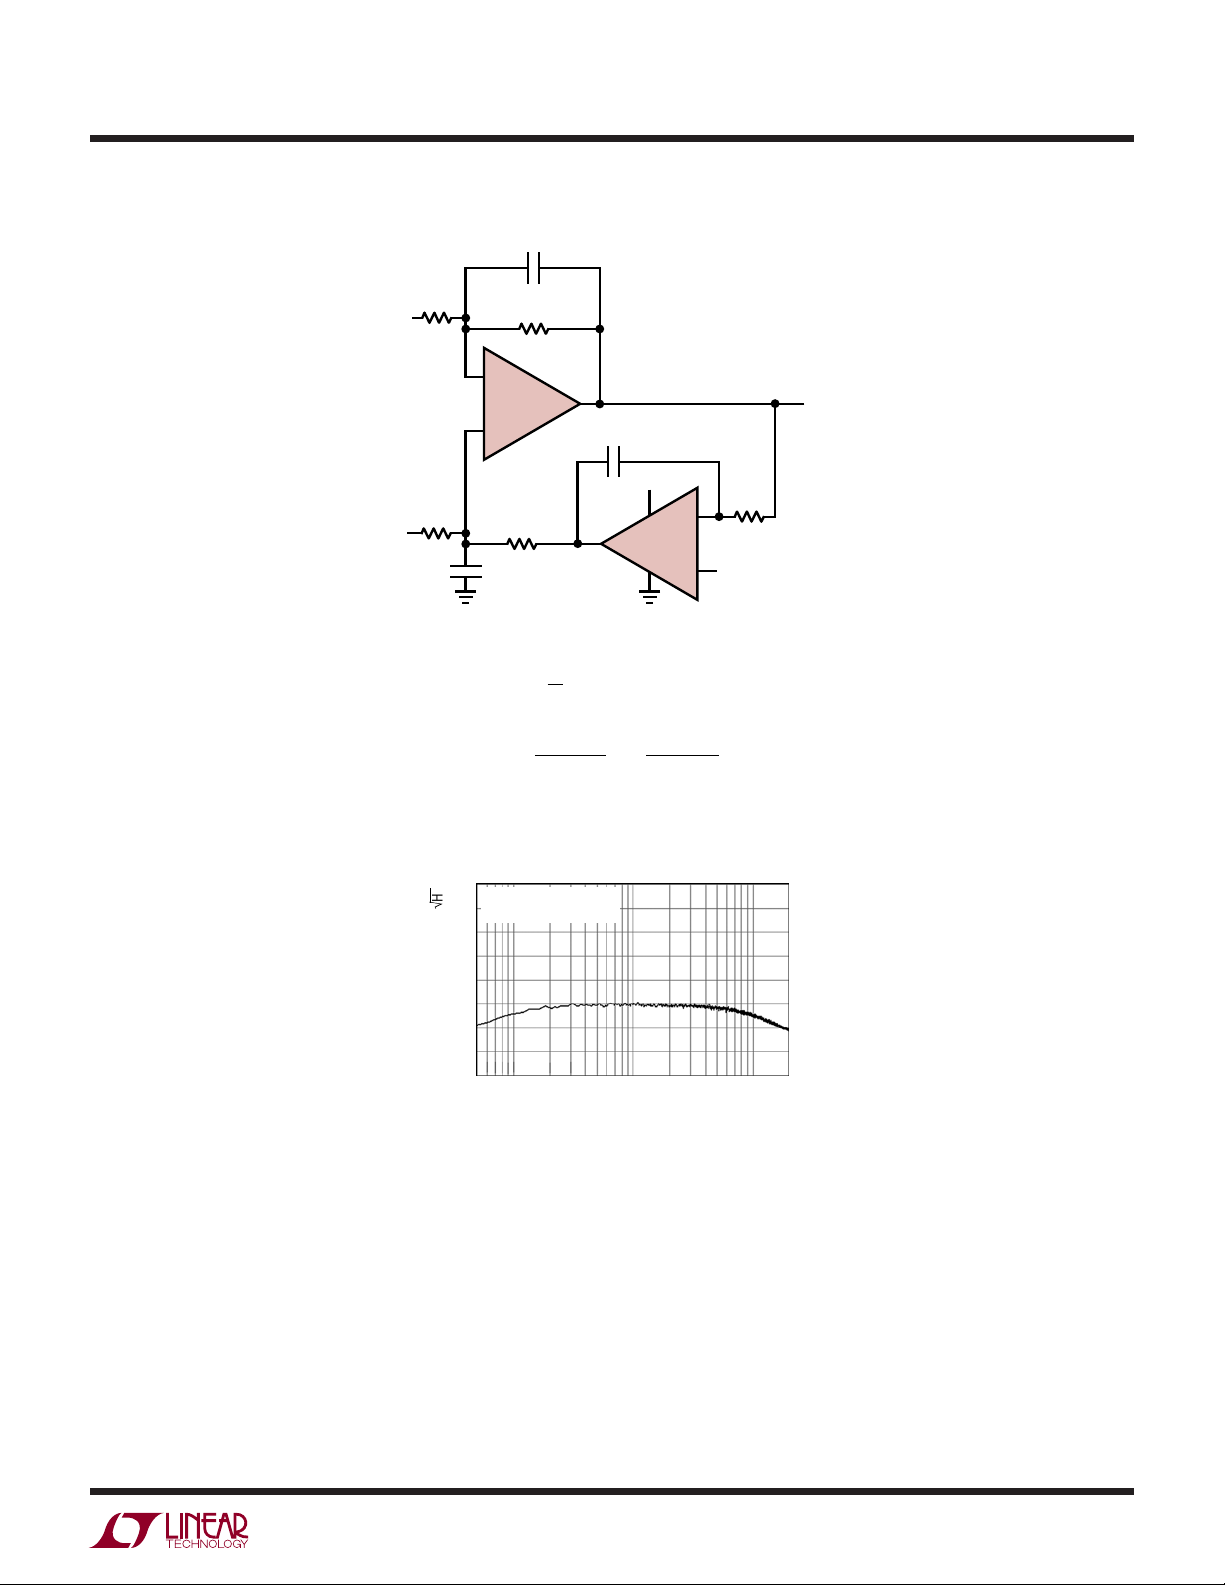
A Low Noise Fully Differential Buffer/Amplifi er
In differential signal conditioning circuits, there is often a
need to monitor a differential source without loading or
(1.8pF), or
PD
= 26.
C
adding appreciable noise to the circuit. In addition, adding gain to low level signals over appreciable bandwidth
is extremely useful. A typical application for a low noise,
high impedance, differential amplifi er is in the baseband
circuit of an RFID (radio frequency identifi cation) receiver.
The baseband signal of a UHF RFID receiver is typically a
low level differential signal at the output of a demodulator
with differential output impedance in the range of 100Ω to
400Ω. The bandwidth of this signal is 1MHz or less.
The circuit of Figure 9a uses an LTC6244 to make a low
noise fully differential amplifi er. The amplifi er’s gain, input
impedance and –3dB bandwidth can be specifi ed independently. Knowing the desired gain, input impedance and
–3dB bandwidth, R
, CF and CIN can be calculated from
G
the equations shown in Figure 9b. The common mode
gain of this amplifi er is equal to one (V
OUTCM
= V
INCM
)
and is independent of resistor matching. The component
values in the Figure 9a circuit implement a 970kHz, gain
= 5, differential amplifi er with 4k input impedance. The
output differential DC offset is typically less than 500µV.
The differential input referred noise voltage density is
shown in Figure 10. The total input referred noise in a
1MHz bandwidth is 16µV
RMS
.
Hz/DIV)
Ö
OUTPUT NOISE (150nV/
50k 1M
FREQUENCY (Hz)
Figure 8b: Output Noise Spectrum of the Circuit in Figure 8a.
Noise at 1MHz is 782nV/√Hz, Due Mostly to the Input Current
Noise Rising with Frequency
5M
6244 F08b
6244f
19

LTC6244
U
WUU
APPLICATIO S I FOR ATIO
+
1/2
LTC6244
–
R
IN
R
10k
C
82pF
C
82pF
R
10k
G
IN
IN
G
2k
2k
+
V
IN
R
IN
2k
–
V
IN
–
LTC6244
+
Figure 9a. Low Noise Fully Differential Buffer/Amplifi er
= 970kHz, Gain = 5, RIN = 4k)
(f
–3dB
Input Impedance = 2 • R
+
Gain
=
Maximum
C
=
F
43
C
=
IN
8 977
.• ••
VV
–
OUT OUT
+
V
I
NNIN
Gain =
–
V
5MHz
–
f
3dB
1
998 2
••
fGain
()
3
dB
Gain
+
2
Gain R f
C
F
33pF
2k2k
2k
C
F
33pF
+
V
1/2
–
V
IN
–
=
6244 F09a
R
G
R
IN
+
33
dB
IN
Hz)
f
Ö
+
V
OUT
INPUT REFERRED NOISE (nV/
= 970kHz
–3dB
32
GAIN = 5
28
= 4k
R
IN
24
20
16
12
8
4
10k 100k
FREQUENCY (Hz)
1M
6244 F10
Figure 10. Differential Input Referred Noise
A Low Noise AC Difference Amplifi er
In the signal conditioning of wideband sensors and transducers, a low noise amplifi er is often used to provide gain
–
V
OUT
for low level AC difference signals in the frequency range
of a few Hertz to hundreds of kilo-Hertz. In addition, the
amplifi er must reject common mode AC signals and its input
impedance should be higher than the differential source
impedance. Typical applications are piezoelectric sensors
used in sonar, sound and ultrasound systems and LVDT
(linear variable differential transformers) for displacement
measurements in process control and robotics.
The Figure 11a circuit is a low noise, single supply AC
difference amplifi er. The amplifi er’s low frequency –3dB
bandwidth is set with resistor R5 and capacitor C3, while
the upper –3dB bandwidth is set with R2 and C1. The
input common mode DC voltage can vary from ground to
+
and the output DC voltage is equal to the V
V
voltage.
REF
The amplifi er’s gain is the ratio of resistors R2 to R1 (R4
= R2 and R3 = R1). The component values in the circuit
of Figure 11a implement an 800Hz to 160kHz AC amplifi er with a gain equal to 10 and 12nV/√Hz input referred
voltage noise density shown in Figure 11b. The total input
referred wideband noise is 4.5µV
, in the bandwidth
RMS
of 500Hz to 200kHz.
20
••••π
1
2
RCC
GFIN
f
=
3
dB
4000
Figure 9b. Design Equations for Figure 9a Circuit
6244f
LTC6244
U
WUU
APPLICATIO S I FOR ATIO
R1
2k
V1
–
1/2 LTC6244
+
R3
2k
V2
C2
47pF
C1
47pF
R2
20k
C3
1000pF
+
V
R4
20k
VGAINVVV
=
OUT REF
2
R
GAIN
===
1
R
BANDWIDTH f f
f
=
HI
•• •
221
π
1/2 LTC6244
+
•–
21
()
,
–
,
f
LLO
,
221 2
=
253•• •π
314
RRRR
=
HI LO
1
RC
CC
–
+
6244 F11a
=
1
RC
V
OUT
R5
200k
V
REF
Figure 11a. Low Noise AC Difference Amplifi er
(Bandwidth 800Hz to 160kHz, Gain = 10)
Hz)
BW = 800Hz TO 160kHz
Ö
28
GAIN = 10
24
20
16
12
8
4
INPUT REFERRED NOISE (nV/
0
110
FREQUENCY (kHz)
1000
6244 F11b
Figure 11b. Input Referred Noise
6244f
21
LTC6244
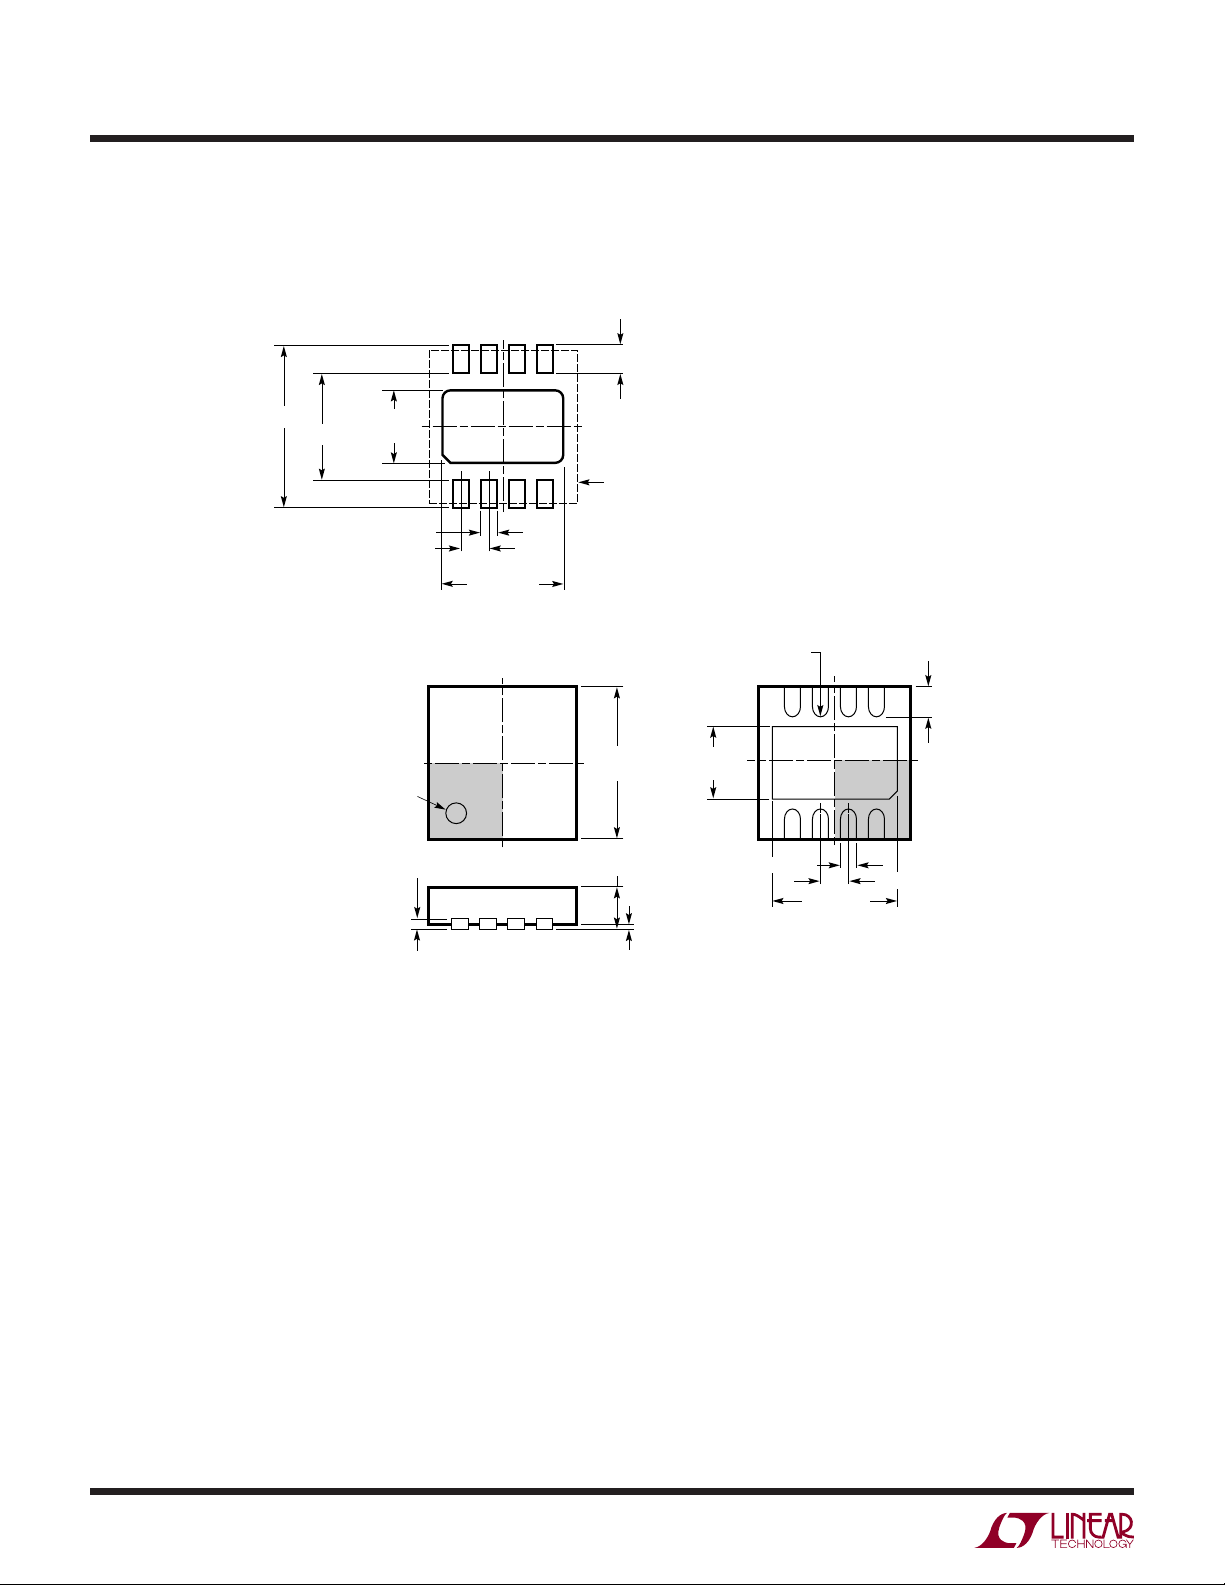
PACKAGE DESCRIPTIO
U
DD Package
8-Lead Plastic DFN (3mm × 3mm)
(Reference LTC DWG # 05-08-1698)
0.675 ±0.05
3.5 ±0.05
1.65 ±0.05
(2 SIDES)2.15 ±0.05
PACKAGE
OUTLINE
0.25 ± 0.05
RECOMMENDED SOLDER PAD PITCH AND DIMENSIONS
PIN 1
TOP MARK
(NOTE 6)
0.200 REF
NOTE:
1. DRAWING TO BE MADE A JEDEC PACKAGE OUTLINE M0-229 VARIATION OF (WEED-1)
2. DRAWING NOT TO SCALE
3. ALL DIMENSIONS ARE IN MILLIMETERS
4. DIMENSIONS OF EXPOSED PAD ON BOTTOM OF PACKAGE DO NOT INCLUDE
MOLD FLASH. MOLD FLASH, IF PRESENT, SHALL NOT EXCEED 0.15mm ON ANY SIDE
5. EXPOSED PAD SHALL BE SOLDER PLATED
6. SHADED AREA IS ONLY A REFERENCE FOR PIN 1 LOCATION
ON TOP AND BOTTOM OF PACKAGE
0.50
BSC
2.38 ±0.05
(2 SIDES)
3.00 ±0.10
(4 SIDES)
0.75 ±0.05
0.00 – 0.05
1.65 ± 0.10
(2 SIDES)
R = 0.115
TYP
0.25 ± 0.05
2.38 ±0.10
(2 SIDES)
BOTTOM VIEW—EXPOSED PAD
0.38 ± 0.10
85
14
0.50 BSC
(DD8) DFN 1203
22
6244f
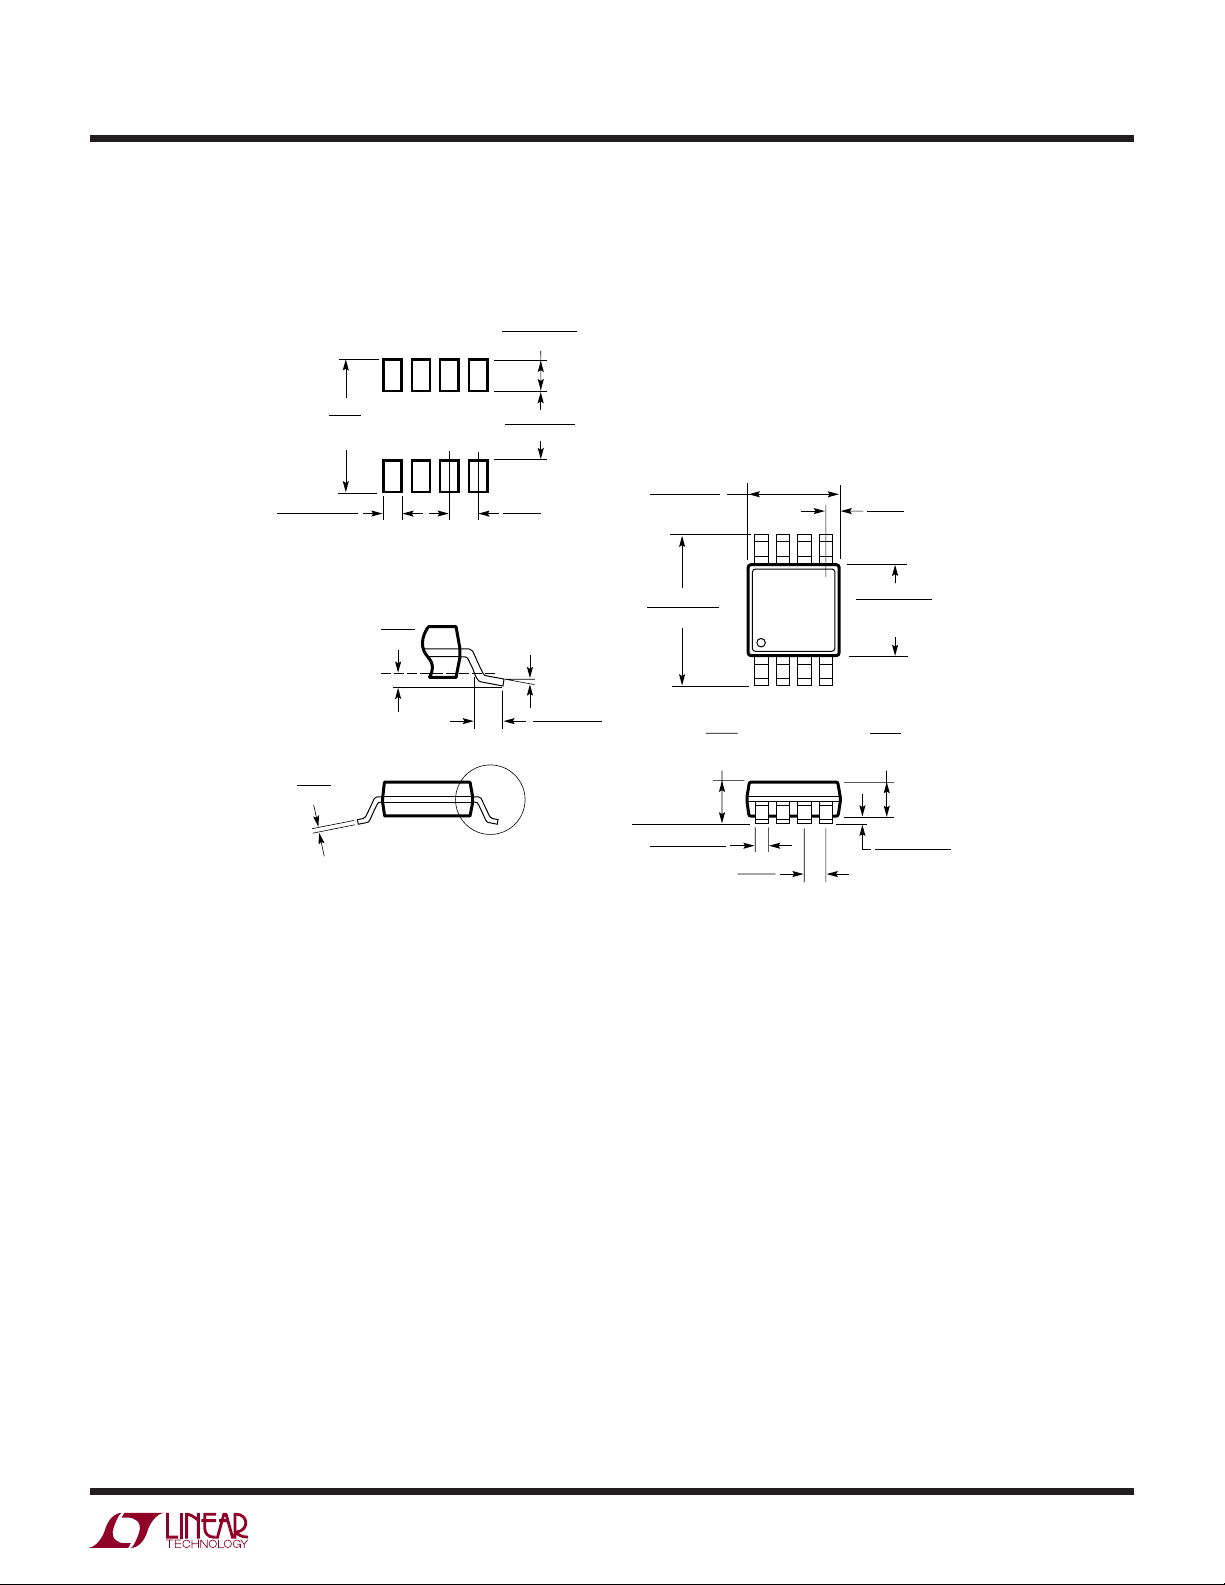
PACKAGE DESCRIPTIO
LTC6244
U
MS8 Package
8-Lead Plastic MSOP
(Reference LTC DWG # 05-08-1660)
0.889 ± 0.127
(.035 ± .005)
5.23
(.206)
MIN
0.42 ± 0.038
(.0165 ± .0015)
TYP
RECOMMENDED SOLDER PAD LAYOUT
0.254
(.010)
GAUGE PLANE
0.18
(.007)
NOTE:
1. DIMENSIONS IN MILLIMETER/(INCH)
2. DRAWING NOT TO SCALE
3. DIMENSION DOES NOT INCLUDE MOLD FLASH, PROTRUSIONS OR GATE BURRS.
MOLD FLASH, PROTRUSIONS OR GATE BURRS SHALL NOT EXCEED 0.152mm (.006") PER SIDE
4. DIMENSION DOES NOT INCLUDE INTERLEAD FLASH OR PROTRUSIONS.
INTERLEAD FLASH OR PROTRUSIONS SHALL NOT EXCEED 0.152mm (.006") PER SIDE
5. LEAD COPLANARITY (BOTTOM OF LEADS AFTER FORMING) SHALL BE 0.102mm (.004") MAX
DETAIL “A”
(.126 – .136)
(.0256)
0° – 6° TYP
DETAIL “A”
3.20 – 3.45
0.65
BSC
0.53 ± 0.152
(.021 ± .006)
SEATING
PLANE
3.00 ± 0.102
(.118 ± .004)
(NOTE 3)
4.90 ± 0.152
(.193 ± .006)
0.22 – 0.38
(.009 – .015)
TYP
1.10
(.043)
MAX
8
12
0.65
(.0256)
BSC
7
0.52
5
4
(.0205)
REF
3.00 ± 0.102
(.118 ± .004)
(NOTE 4)
0.86
(.034)
REF
0.127 ± 0.076
(.005 ± .003)
MSOP (MS8) 0204
6
3
Information furnished by Linear Technology Corporation is believed to be accurate and reliable.
However, no responsibility is assumed for its use. Linear Technology Corporation makes no representation that the interconnection of its circuits as described herein will not infringe on existing patent rights.
6244f
23
LTC6244
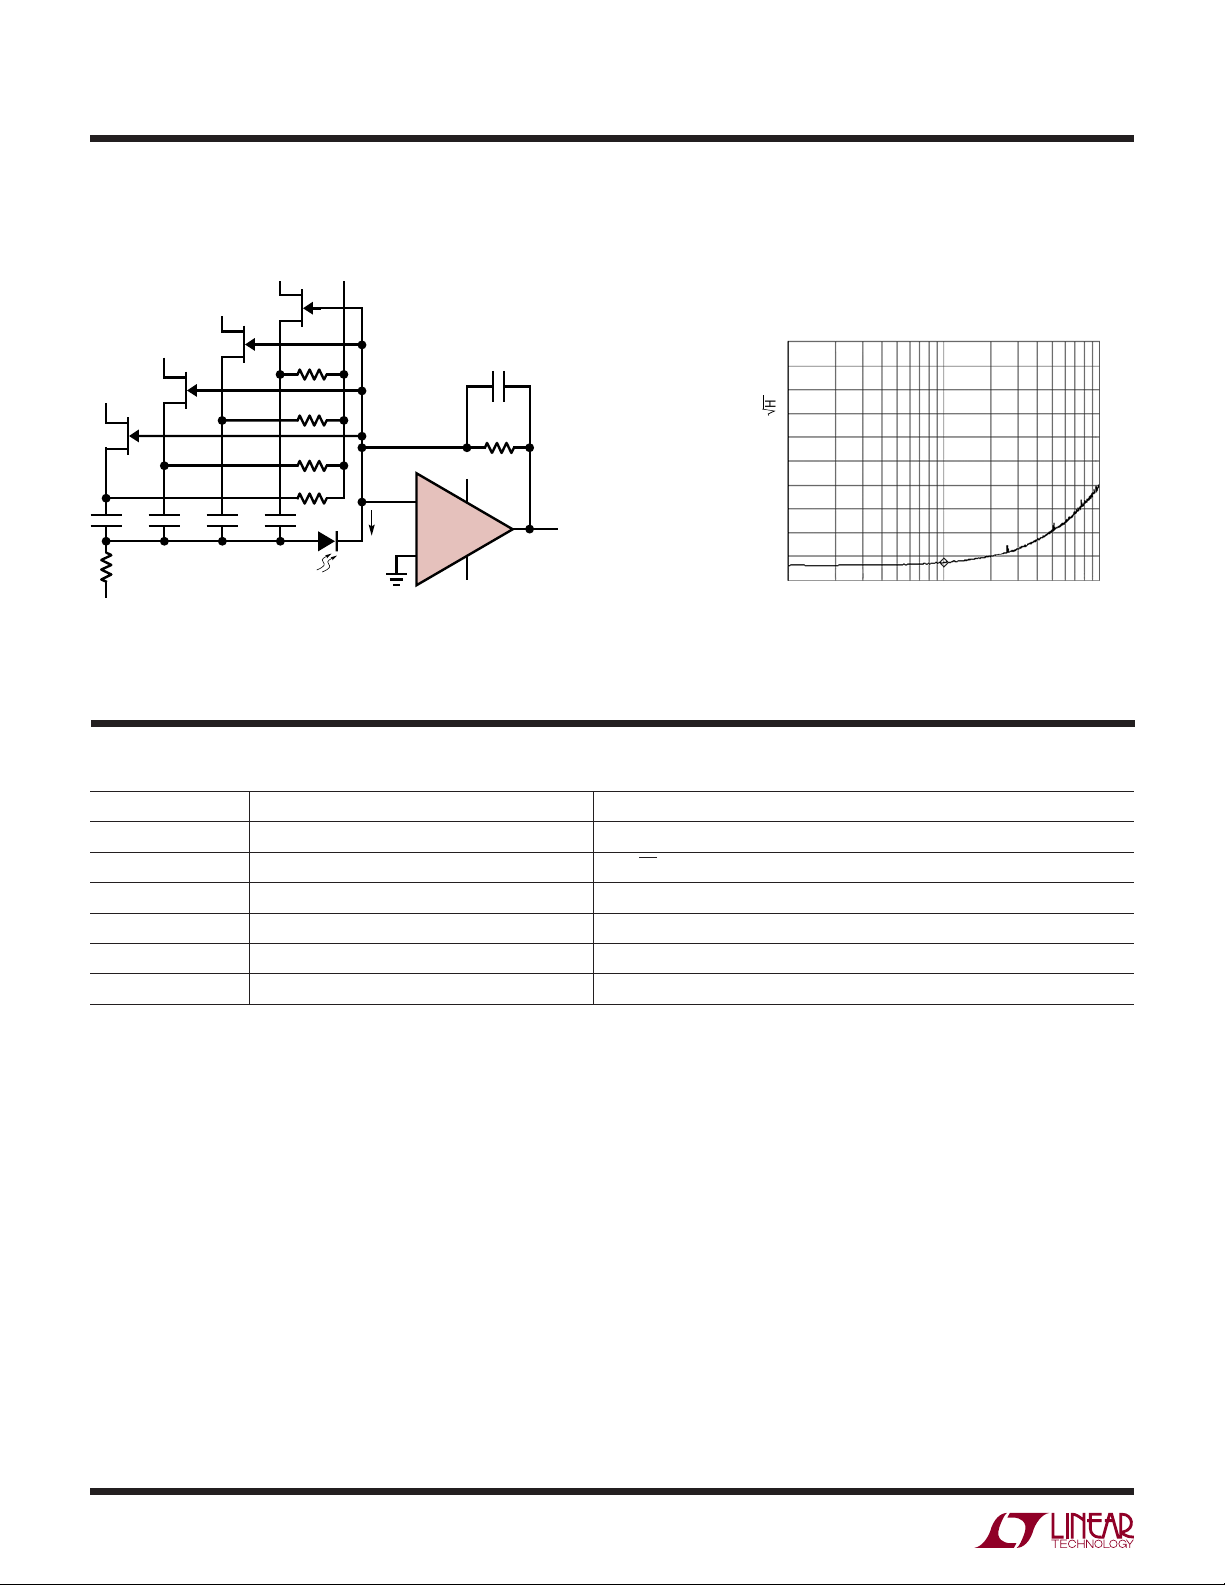
TYPICAL APPLICATION
Ultralow Noise Large Area Photodiode Amplifi er
5V –5V
5V
J4
J3
J1
5V
–5V
C1
R5
4.99k
5V
J2
C2 C3 C4
R4
R3
R2
R1
HAMAMATSU
LARGE AREA
PHOTODIODE
S1227-1010BQ
= 3000pF
C
PD
I
PD
C
F
0.25pF
R
F
1M
V
= 1M • I
OUT
5V
–
1/2
LTC6244HV
+
–5V
C1 TO C4: 4.7µF X7R
J1 TO J4: PHILIPS BF862 JFETS
R1 TO R4: 4.99k
BW = 400kHz
NOISE = 150µV
MEASURED ON 100kHz
BANDWIDTH
V
OUT
6244 TA02a
Photodiode Amplifi er Output
Noise Spectal Density
Hz/DIV)
Ö
PD
RMS
OUTPUT NOISE (200nV/
110
(kHz)
100
6244 TA02b
RELATED PARTS
PART NUMBER DESCRIPTION COMMENTS
LTC1151 ±15V Zero-Drift Op Amp Dual High Voltage Operation ±18V
LT1792 Low Noise Precision JFET Op Amp 6nV/√Hz Noise, ±15V Operation
LTC2050 Zero-Drift Op Amp 2.7 Volt Operation, SOT-23
LTC2051/LTC2052 Dual/Quad Zero-Drift Op Amp Dual/Quad Version of LTC2050 in MS8/GN16 Packages
LTC2054/LTC2055 Single/Dual Zero-Drift Op Amp Micropower Version of the LTC2050/LTC2051 in SOT-23 and DD Packages
LT6241/LT6242 Dual/Quad, 18MHz CMOS Op Amps Low Noise, Rail-to-Rail
24
Linear Technology Corporation
1630 McCarthy Blvd., Milpitas, CA 95035-7417
(408) 432-1900 ● FAX: (408) 434-0507 ● www.linear.com
6244f
LT 0706 • PRINTED IN USA
© LINEAR TECHNOLOGY CORPORATION 2006
 Loading...