

advertisement
LT5528 WCDMA ACPR and AltCPR Measurements – Design Note 375
Doug Stuetzle
Introduction
ACPR (adjacent channel power ratio) and AltCPR (alternate channel power ratio) are important measures of
spectral regrowth for digital communication systems that
use, for example, WCDMA (wideband code division multiple access) modulation. Both ACPR and AltCPR quantify
the ratio of regrowth in a nearby channel to the power in
the transmitted channel.
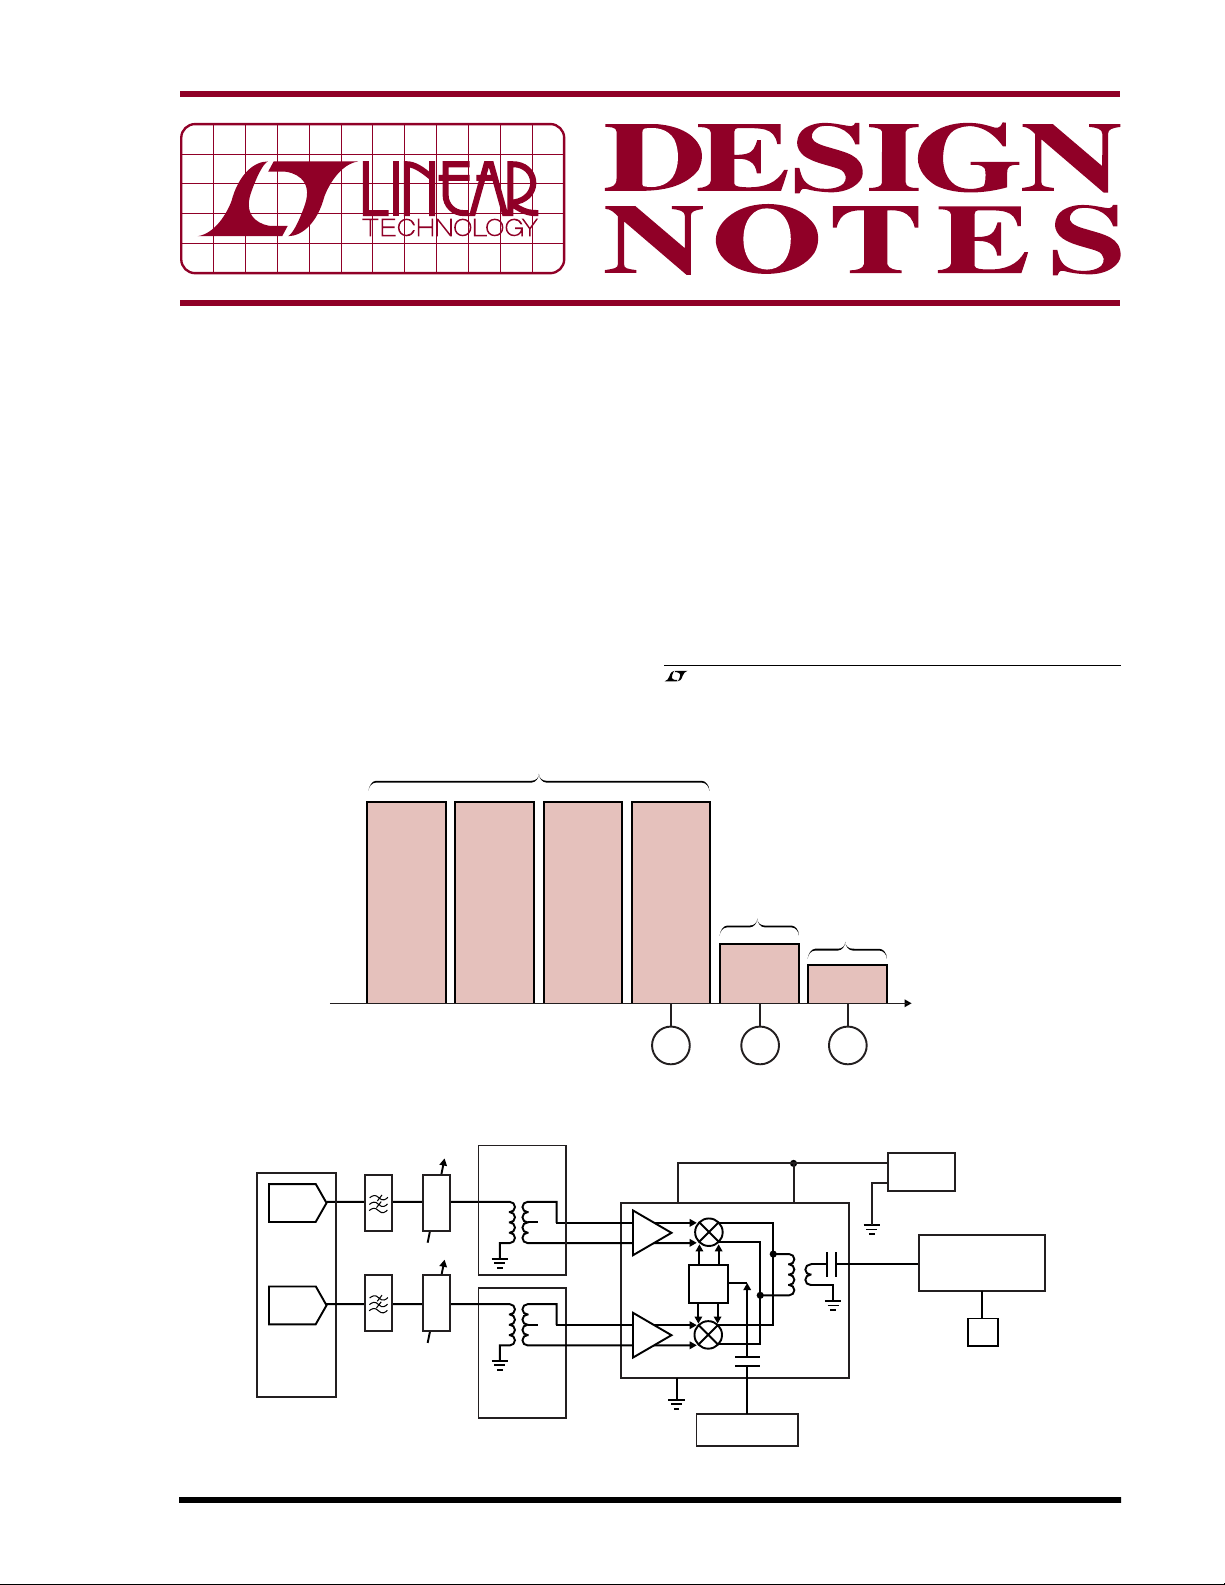
To measure ACPR and AltCPR, refer to the test setup
shown in Figure 2. The DUT (device under test) is the
1 TO 4 CARRIERS
3.84MHz WIDE
SPACED 5MHz APART
LT5528, which is a high linearity direct I/Q modulator. It
accepts complex modulation signals at its baseband
inputs and generates a modulated RF signal at the RF
output. An accurate measurement of the spectral regrowth of a highly linear device such as the LT5528 is
difficult because its dynamic range may rival that of the
measurement equipment. Because of this, it is important
to account for the noise of the measurement system; i.e.,
the spectrum analyzer. Refer to Figure 3. Some spectrum
, LTC and LT are registered trademarks of Linear Technology Corporation.
All other trademarks are the property of their respective owners.
3.08MHz TO
6.92MHz:
–45dBc/30kHz
8.08MHz TO
11.92MHz:
–50dBc/30kHz
FREQUENCY
10/05/375
I-DAC
Q-DAC
AGILENT
E4436B
W-CDMA
EXTENSION
MHz
0
MHz
5
MHz
10
dn375 F01
Figure 1. WCDMA ACPR Limits, Per 3GPP TS 25.104, Section 6.6.2.2.1
ATT
1dB
STEPS
ATT
1dB
BALUN BOARD
MINI-CIRCUITS
AD T2-1T
BALUN BOARD
MINI-CIRCUITS
AD T2-1T
BBIP
BBIM
BBQP
BBQM
V2I
I-CHANNEL
Q-CHANNEL
V2I
V2I
GND
V
EN
CC
0°
90°
LO
IN
HP8616A
SIGNAL GENERATOR
V
CC
LT5528
BALUN
LO = 1.8GHz
TO 2.2GHz, 0dBm
RF OUT
RF = 1.8GHz
TO 2.2GHz
dn375 F02
TTE LE1182
I
TTE LE1182
Q
STEPS
Figure 2. ACPR Measurement Setup
5V
POWER
SUPPLY
SPECTRUM ANALYZER
ROHDE AND SCHWARZ
FSEM30
HPIB
PC
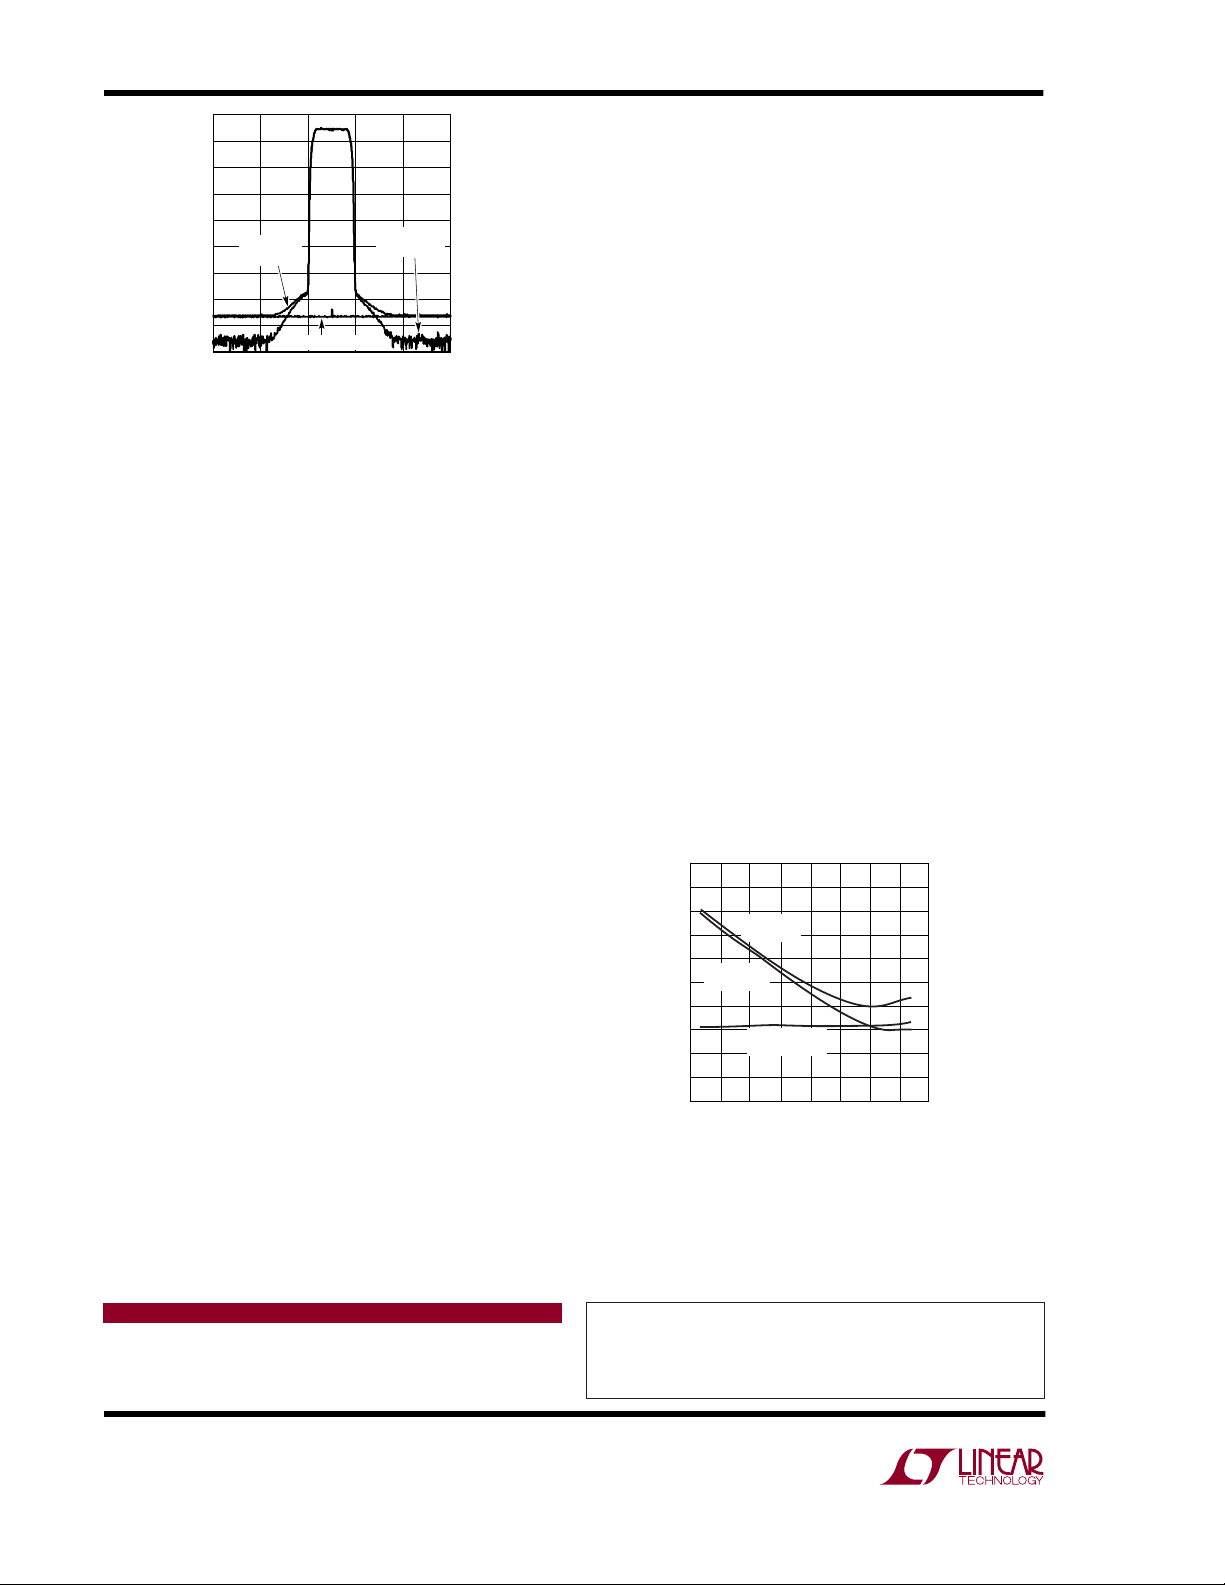
–30
–40
–50
–60
–70
SPECTRUM
–80
ANALYZER
–90
POWER IN 30kHz BW (dBm)
–100
–110
–120
2.1275
NOISE FLOOR
RF FREQUENCY (GHz)
NOISE
CORRECTED
2.14252.13752.1325 2.147.5
2.1525
dn375 F03
Figure 3. ACPR Spectrum for a Single Carrier WCDMA Signal
analyzers offer an ACPR measurement utility. This utility
will not, however, give accurate results for highly linear
devices, as it does not compensate for the system noise
floor.
The spectrum analyzer must have a wide dynamic range.
That means a high input 3rd order intercept point, and a
low noise floor. The analyzer shown in Figure 2 meets both
of these requirements.
Note that a free running RF generator provides the LO
signal. This type of generator is used because of its
superior noise performance. This is critical, as a noisy LO
signal may corrupt the ACPR measurement. Its output
operating frequency can drift slightly, so manual frequency correction is required.
Also, the baseband source can generate spectral regrowth
and noise which may swamp the performance of the DUT.
The lowpass filters shown at the baseband generator
outputs reduce these impairments to a tolerable level.
Filters suggested for this purpose are made by TTE
Engineering and offer >20dB rejection at 10.4MHz and
>80dB rejection at 13.08MHz.
To start, measure the noise floor of the spectrum analyzer
with a 50Ω input termination. The input attenuation of the
analyzer is set to minimize the noise figure of the measurement system. A 30kHz resolution bandwidth is used
because the spectrum analyzer shown has the lowest
noise figure (about 24dB) at that resolution bandwidth.
The spectrum analyzer shown includes an RMS display
detector mode, which is specifically designed to measure
noise-like signals. For spectum analyzers that do not
offer this mode, it is important to set the video bandwidth
to at least 3 times the resolution bandwidth; in this case
100kHz. If the ratio of video to resolution bandwidth is too
low, the power measurement will be inaccurate. Video
averaging helps smooth the result; 100 averages gives
good results. Once the settings are correct, use the
channel power utility of the analyzer to find the total noise
power within a 3.84MHz bandwidth.
Next measure the output spectrum of the DUT using the
same settings. For ACPR/AltCPR, center the measurement band 5MHz/10MHz above the center of the highest
carrier. To find the true spectral regrowth power, convert
the measured spectral power levels to mW and subtract
the spectrum analyzer noise floor from the measured
DUT power. Reconvert to dBm to get the true spectral
regrowth.
The ACPR/AltCPR is equal to the difference in dB between
the signal power per carrier and the spectral regrowth.
ACPR and AltCPR vary with output signal level. Figure 4
shows the ACPR and AltCPR versus RF output level for a
4-carrier WCDMA signal centered at 2.14GHz. For low RF
power levels, these are limited by the output noise floor of
the DUT. At high RF output power levels, they are determined by the linearity of the DUT. The maximum ACPR/
AltCPR are observed between these extremes, where the
spectral regrowth equals the noise floor of the DUT.
dn375 F04
–145
–147
–149
–151
–153
–155
–157
–159
–161
–163
–165
–24–26–28
NOISE (dBm/Hz)
–54
–56
–58
–60
–62
–64
–66
ACPR (dBc)
–68
–70
–72
–74
–40
ADJACENT
CHANNEL
ALTERNATE
CHANNEL
NOISE AT
30MHz OFFSET
–38 –36 –34 –32
RF OUTPUT PER CHANNEL (dBm)
–30
Figure 4. LT5528 4-Channel WCDMA Adjacent and
Alternate CPR Measurement vs Channel Power
Data Sheet Download
http://www.linear.com
Linear Technology Corporation
1630 McCarthy Blvd., Milpitas, CA 95035-7417
(408) 432-1900 ● FAX: (408) 434-0507 ● www.linear.com
For applications help,
call (408) 432-1900, Ext. 2482
dn375f LT/TP 1005 305K • PRINTED IN THE USA
© LINEAR TECHNOLOGY CORPORATION 2005
 Loading...