

P
PANEL
(W)
I
PANEL
(A)
V
PANEL
(V)
160
2.4
0
24
0
2 4 6 8 10 12 14
2.2
0.2
0.4
0.6
0.8
1
2
1.8
1.6
1.4
1.2
22
2
4
6
8
10
20
18
16
14
12
100W/m
2
1000W/m
2
V
IN_REG
(V)
2.65
V
SENSE
– V
BAT
(mV)
0
20
80
60
40
2.67
2.69
100
2.71
2.73 2.75
L DESIGN FEATURES
Designing a Solar Cell Battery Charger
by Jim Drew
Introduction
The market for portable solar powered
electronic devices continues to grow
as consumers look for ways to reduce
energy consumption and spend more
time outdoors. Because solar power
is a variable and unreliable, nearly
all solar-powered devices feature
rechargeable batteries. The goal is to
extract as much solar power as possible to charge the batteries quickly
and maintain the charge.
Solar cells are inherently inefficient
devices, but they do have a point of
maximum power output, so operating
at that point seems an obvious design
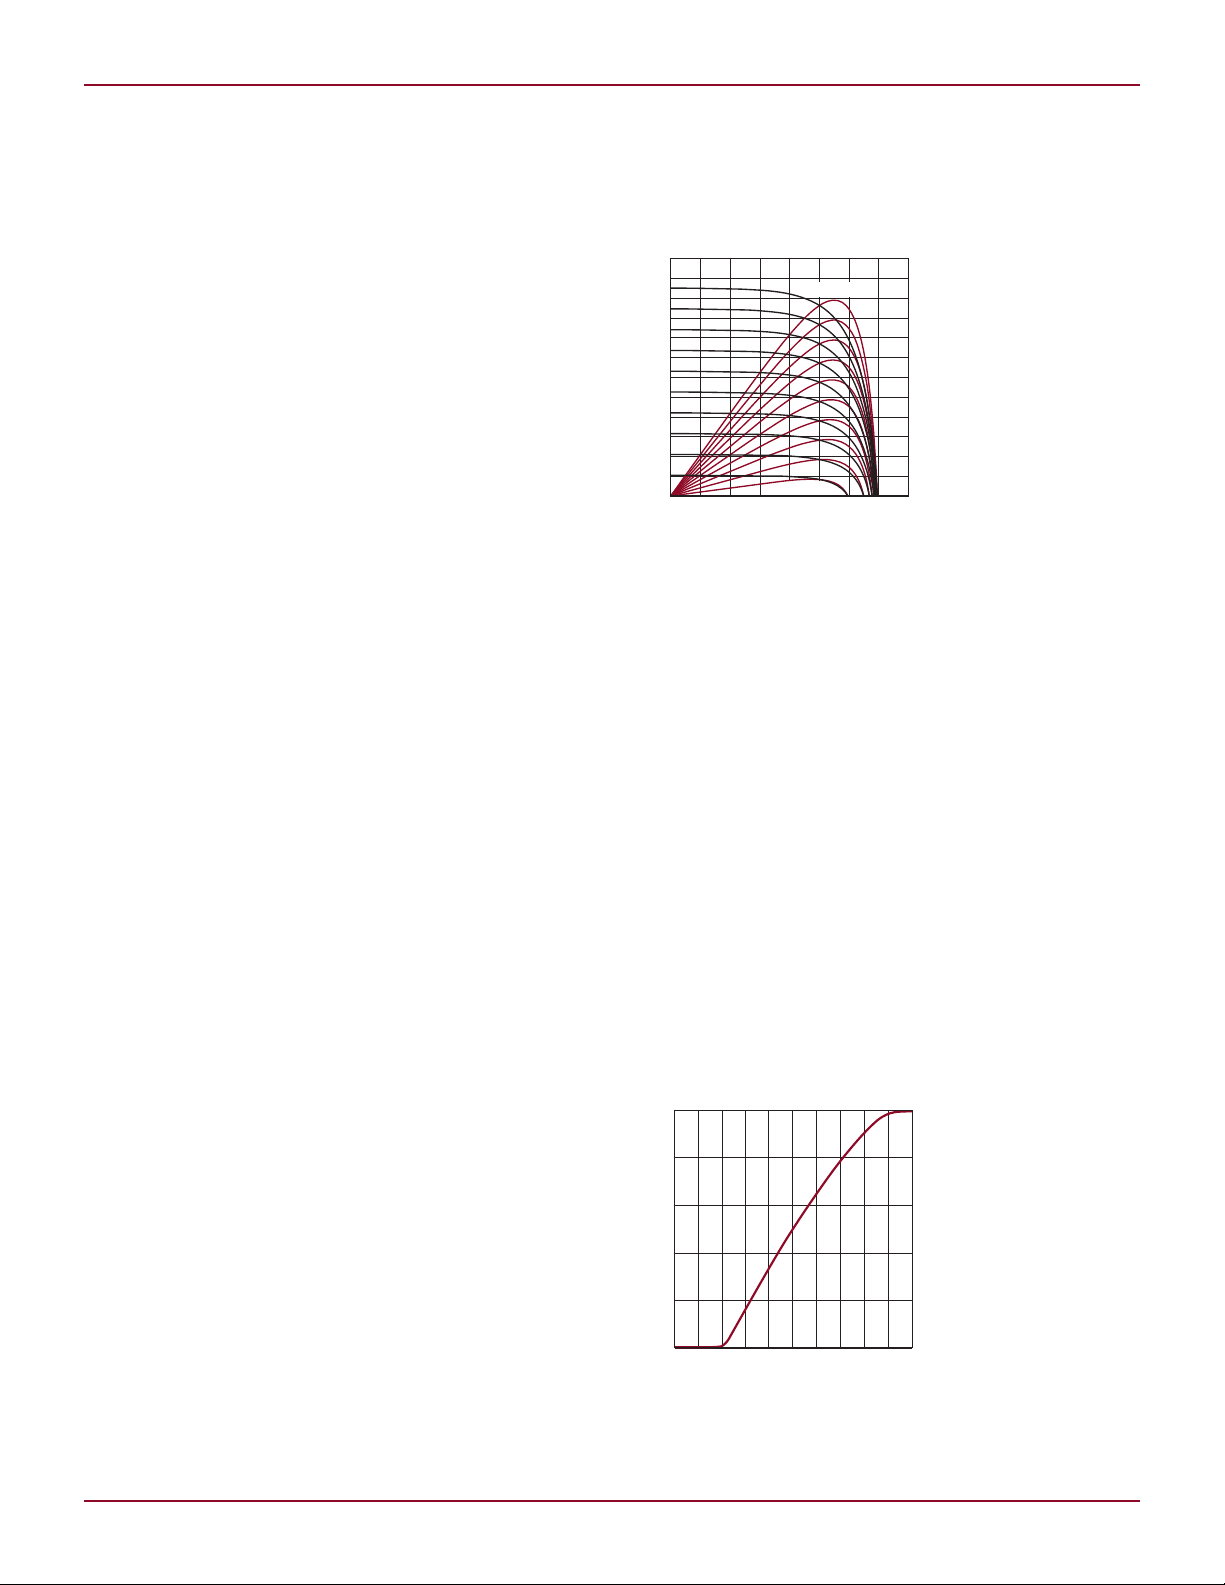
goal. The problem is that the IV characteristic of maximum output power
changes with illumination. A monocrystalline solar cell’s output current
is proportional to light intensity, while
its voltage at maximum power output
is relatively constant (see Figure 1).
Maximum power output for a given
light intensity occurs at the knee of
each curve, where the cell transitions
from a constant voltage device to a
constant current device. A charger
design that efficiently extracts power
from a solar panel must be able to steer
the panel’s output voltage to the point
of maximum power when illumination
levels cannot support the charger’s full
power requirements.
The LT3652 is a multi-chemistry
2A battery charger designed for solar
power applications. The LT3652 employs an input voltage regulation loop
that reduces the charge current if the
input voltage falls below a programmed
level set by a simple voltage divider
network. When powered by a solar
panel, the input voltage regulation
loop is used to maintain the panel at
near peak power output.
LT3652 Input Voltage
Regulation Loop
The input voltage regulation loop of the
LT3652 acts over a specific input voltage range. When VIN, as measured via a
resistor divider at the V
12
IN_REG
pin, falls
Figure 1. A solar cell produces current in proportion to the amount of sunlight falling on it, while
the cell’s open-circuit voltage remains relatively constant. Maximum power output occurs at
the knee of each curve, where the cell transitions from a constant voltage device to a constant
current device, as shown by the power curves.
below a certain set point, the charge
current is reduced. The charging cur rent is adjusted via a control voltage
across a current sensing resistor in
series with the inductor of the buck
regulator charging circuit. Decreased
illumination (and/or increased charge
current demands) can both cause the
input voltage (panel voltage) to fall,
pushing the panel away from its point
of maximum power output. With the
LT3652, when the input voltage falls
below a certain set point, as defined by
the resistor divider connected between
the V
and V
IN
pins, the current
IN_REG
control voltage is reduced, thus reducing the charging current. This action
causes the voltage from the solar panel
Figure 2. Charger current control voltage (V
measured via voltage divider at V
when V
current if necessary to run the panel at peak power output.
is between 2.67V and 2.74V. In this range, the charger will reduce the charging
IN_REG
pin. VIN (solar panel voltage) only affects charging current
IN_REG
to increase along its characteristic VI
curve until a new peak power operating point is found.
If the solar panel is illuminated
enough to provide more power than
is required by the LT3652 charging
circuit, the voltage from the solar panel
increases beyond the control range of
the voltage regulation loop, the charging current is set to its maximum value
and a new operation point is found
based entirely on the maximum charging current for the battery’s point in
the charge cycle.
If the electronic device is operating directly from solar power and the
input voltage is above the minimum
level of the input voltage regulation
– V
SENSE
) vs proportional input voltage, as
BAT
Linear Technology Magazine • December 2009
DESIGN FEATURES L
2 67
2 74
1 2
2
. •
. •
R R
R
V CONTROL RANGE
R
IN IN
IN
IN
+
(
)
< <
IIN IN
IN
R
R
1 2
2
+
(
)
V – V
SENSE BAT
=
+
1 43 2 67
2
1 2
. •
•
– .
V R
R R
V
IN IN
IN IN
I
CHARGE
=
+
1 43
2 67
2
1 2
.
•
•
– .
R
V R
R R
V
SENSE
IN IN
IN IN
I
V
V
IN
BAT
IN
= I
CHARGE
•
•η
P
V
R
V R
R R
IN
BAT
SENSE
IN IN
IN IN
=
+
1 43
2 6
2
1 2
. •
•
•
•
– .η77V
SW
V
IN
SOLAR PANEL INPUT
V
IN_REG
V
FB
BOOST
SENSE
NTC
BAT
TIMER
GND
1µF
50V
R
FB1
619k
2-CELL Li-ION (2 = 4.1V)
+
390µF
50V
CMSH1-40MA
OPTIONAL (SEE TEXT)
10µF
16V
10µH
IHLP-2525CZ-01
LT3652
R
IN1
280k
R
NTC
R
IN2
100k
SHDN
CHRG
FAULT
10µF
50V
R
SHDN1
787k
R
SHDN2
100k
R
SENSE
0.05Ω
R
FB2
412k
0.1Ω
100µF
10V
CMSH1-4
CMSH3-40MA
loop’s control range, the excess power
available is used to charge the battery
at a lower charging rate. The power
from the solar panel is adjusted to its
maximum operating power point for
the intensity level.
Figure 2 shows a typical V
IN_REG
control characteristic curve. As the
voltage on the V
beyond 2.67V, the voltage V
– V
, across the current sensing
BAT
pin increases
IN_REG
SENSE
resistor, increases until it reaches a
maximum of 100mV, when V
is above 2.74V. As V
further, V
SENSE
– V
increases
IN_REG
remains at
BAT
IN_REG
100mV. The expression for the input
voltage control range is:
Eq.1
If we linearize the portion of the
curve in Figure 2 for V
IN_REG
between
2.67V and 2.74V, the following expression describes the current sensing
voltage V
V
– V
SENSE
1.43 • (V
IN_REG
SENSE
=
BAT
– 2.67V)
– V
BAT
:
Eq.2
Eq.3
The charging current for the battery
would then be:
Eq.4
Since the charging circuit of the
LT3652 is a current controlled buck
regulator, the input current relates to
the charging current by the following
expression:
Eq. 5
where η is the efficiency of the
charger
The input power can now be determined by combining Equations 4 and
5 with the input voltage, resulting in
the following:
Eq. 6
Once R
maximum charging current and R
and R
are determined to select the
IN2
is selected for the
SENSE
IN1
input voltage current control range,
Equation 6 can be plotted against the
solar panels power curves to determine the charger’s operating point for
various battery voltages. An example
follows.
Design Example
Figure 3 shows a 2A, solar powered,
2-cell Li-Ion battery charger using
the LT3652.
First step is to determine the minimum requirements for the solar panel.
Important parameters include the
open circuit voltage, VOC, peak power
voltage, V
rent, I
P(MAX)
ISC, of the solar panel falls out of the
calculations based on the other three
parameters.
The open circuit voltage must be
3.3V plus the forward voltage drop
of D1 above the float voltage of the 2cell Li-ion battery plus an additional
15% for low intensity start-up and
operation.
VOC =
(V
BAT(FLOAT)
The peak power voltage must
be 0.75V plus the forward drop of
D1 above the float voltage plus an
additional 15% for low intensity operation.
, and peak power cur -
P(MAX)
. The short circuit current,
+ V
FORWARD(D1)
+ 3.3V) • 1.15
Linear Technology Magazine • December 2009
Figure 3. 2A Solar-powered battery charger
13

L DESIGN FEATURES
I
V
V
P MAX
BAT FLOAT
P MAX
( )
( )
( )
•
•
= I
CHARGE
η
R
V k
V
V k
V
FB
BAT FLOAT
1
250
3 3
8 2 250
3 3
621
=
=
=
( )
•
.
. •
.
..2k
R
R k
R k
k k
k k
FB
FB
FB
2
2
2
250
250
619 250
619 250
=
−
=
−
=
•
•
4419 2. k
R
V V V
V
R
IN
P MAX FORWARD D
IN
1
1
2
2 74
2 74
1
=
− −
=
( ) ( )
.
.
•
00 9 0 5 2 74
2 74
100
279 6
. . .
.
•
.
V V V
V
k
k
− −
=
V V
R R
R
V
V
REG MIN
IN IN
IN
F D( ) ( )
. •
.
=
+
+
=
2 67
10 65
1 2
2
1
V V
R R
R
V
V
REG MAX
IN IN
IN
F D( ) ( )
. •
.
=
+
+
=
2 74
10 9
1 2
2
1
R R
V V V
SHDN SHDN
REG MIN F D SHDN MAX
1 2
1
= •
−
(
)
−
( ) ( ) ( )
−−
(
)
−
V
V V
SHDN HYST
SHDN MAX SHDN HYST
( )
( ) ( )
R
V V V V
V
SHDN1
10 65 0 5 1 25 0 12
1 25 0 1
=
−
(
)
− −
(
)
−
. . . .
. . 22
100
798 2
V
k
k•.=
P
IN
(W)
VIN (V)
149
24
0
10 11 12 13
22
2
4
6
8
10
20
18
16
14
12
100W/m
2
LIGHT INTENSITY = 1000W/m
2
VIN CONTROL RANGE (V
REG
)
V
SHDN
PINFOR V
BAT(FLT)
8.2V AT 2A
PINFOR V
BAT(MIN)
5.7V AT 2A
PINFOR V
BAT(PRE)
5.7V AT 0.3A
V
REG(MAX)
=10.9V
V
REG(MIN)
=10.65V
A
B
D
E
C
V
(V
=
P(MAX)
BAT(FLOAT)
+ V
FORWARD(D1)
+ 0.75V) •
1.15
The peak input power current is the
product of the float voltage and the
maximum charging current divided by
the peak power input voltage and the
efficiency of the charging circuit.
Solving for these three equations,
we can define the minimum requirements of the solar panel:
VOC = 13.8V
V
I
P(MAX)
P(MAX)
= 10.9V
= 1.8A
The solar panel characteristics can
be seen in Figure 4.
The current sensing resistor,
R
maximum V
, is determined from the
SENSE
SENSE
– V
BAT
of 100mV
divided by the maximum charging
current of 2A
R
= 0.05Ω
SENSE
Figure 4. Action of the solar battery charger circuit in Figure 3. Power-intensity curves for
various illumination levels are shown for 100W/m2 to 1000W/m2 in 100W/m2 steps. The VIN
control range (V
the solar panel by steering VIN to the top of the panel’s power-intensity curve when VIN is in the
V
range.
REG
age divider network of R
connected between the V
V
Let R
IN_REG
= 100k
IN2
pins.
) is also shown. The VIN control loop extracts maximum possible power from
REG
and R
IN1
and the
IN
IN2
Let R
SHDN2
= 100k
The output feedback voltage divider network of R
determined next. The voltage divider
network must have a Thevenin’s equivalent resistance of 250k to compensate
for input bias current error. The VFB
pin reference voltage is 3.3V.
Let R
Let R
power tracking voltage using the volt-
14
= 619k
FB1
= 412k
FB2
The next step is to set the peak
FB1
and R
FB2
are
Let R
= 280k
IN1
Verify the minimum and maximum
peak power input tracking voltages.
The final step in selecting resistor values is to determine the V
voltage divider network consisting of
R
SHDN1
and R
SHDN2
. The V
SHDN
threshold is 1.2V ± 50mV with a hysteresis of 120mV. The voltage divider
network wants to be set such that,
when the voltage on the V
V
REG(MIN)
, V
is at its maximum
SHDN
pin is at
IN
possible value.
SHDN
rising
Let R
The V
SHDN1
= 787k
limits are now deter-
SHDN
mined as:
V
Rising Threshold
SHDN
V
SHDN(MIN)
V
SHDN(MAX)
V
SHDN
V
SHDN(MIN)
V
SHDN(MAX)
= 10.7V
= 11.6V
Falling Threshold
= 9.6V
= 10.5V
The LT3652 automatically enters
a battery precondition mode if the
sensed battery voltage is very low.
In this mode, the charge current is
reduced to 15% of the programmed
maximum, as set by the current
sensing resistor, R
SENSE
. Once the
battery voltage reaches 70% of the
fully charged float voltage (VFB = 2.3V),
the LT3652 automatically increases
maximum charge current to the full
programmed value. The battery voltage
threshold level between precondition
Linear Technology Magazine • December 2009

DESIGN FEATURES L
V V V
V
V
BAT PRE BAT MIN BAT FLOAT( ) ( ) ( )
•
.
.
< =
2 3
3 3
V V V
V
V
BAT PRE BAT MIN BAT FLOAT( ) ( ) ( )
•
.
.
< =
2 3
3 3
∆ •
• ∆
•
( )
V
V
R
R R
R R
IN NTC
REGINNTC NTC
IN NTC
=
2 1
mode and maximum charge current
is determined as follows:
V
BAT(MIN)
V
BAT(PRE)
V
CHRG(PRE)
V
CHRG(PRE)
= 5.7V
< 5.7V
= 0.15 • I
= 0.3A
CHRG
Using and efficiency of 0.85, plot PIN
over the range of VIN that is current
controlled. This is the regulated VIN,
or V
of the V
, power line. The intersection
REG
power line with the solar
REG
panel power curve is the operating
point. As the battery charges, the
slope of the V
power line increases,
REG
indicating the increase in input power
required to support the increasing
output power. The intersection of the
V
power line continues to follow
REG
up the solar panel’s power curves
until the charger exits constant current mode.
The resulting plots are shown in
Figure 4.
The Circuit in Action
Figure 4 shows the power output of the
solar panel plotted at light intensity
levels from 100W/m2 to 1000W/m2
in 100W/m2 steps. At maximum light
intensity (top curve in Figure 4) and
the battery voltage just above the preconditioning level (V
BAT(MIN)
solar panel is producing more power
than the charger needs. The solar
panel voltage rises above the V
control voltage and travels across the
constant power line until it intersects
the light-power-intensity curve for
that intensity level (point A in Figure
4). As the battery charges, the input
power increases and the solar panel
operating point moves up the lightpower-intensity curve until the battery
at 2A), the
REG
approaches full charge (point B). The
LT3652 transitions from constant current mode to constant voltage mode
and the charging current is reduced.
The solar panel operating point moves
back down the light-power-intensity
curve to the open circuit voltage (point
C) when the battery reaches its final
float voltage.
During the charging of the battery, if
the light intensity diminishes, the operation point moves across a constant
The input voltage regulation
loop of the LT3652 has
the ability to seek out the
maximum power operating
point of a solar panel’s
power characteristic, thus
utilizing the full capacity of
the solar panel.
power line for the battery voltage until
it reaches the new power-intensity
curve. If the light intensity level continues to diminish, the operating point
travels along this constant power line
until it reaches the V
At this point the charging current is
reduced until the operating point is at
the intersection of the light-power-intensity curve and the V
(point D for constant current charging
at V
BAT(FLOAT)
with 800W/m2 illumination). As the battery continues to
charge at this light intensity level, the
operating point moves along the new
light-power-intensity curve until the
battery approaches full charge.
As darkness approaches, the operating point moves down the V
power line until charging current
ceases (point E) and the solar panel
output voltage drops below the SHDN
power line.
REG
power line
REG
REG
falling threshold at which point the
LT3652 turns off.
The remaining elements of the
design, selection of output inductor,
catch rectifier and timer capacitor,
are outlined in the design procedure
in the LT3652 datasheet along with
PCB layout considerations.
The maximum power voltage, for
a monocrystalline solar cell, has a
temperature coefficient of –0.37%/K
while the maximum power level is
–0.47%/K. This may be compensated
for by letting R
be a combination
IN1
of a series resistor and a series NTC
thermistor. The ratio of the two elements that comprise R
of R
need to be adjusted to achieve
IN2
and the value
IN1
the correct negative temperature of
VIN while still maintaining the control
range of VIN.
Conclusion
The input voltage regulation loop of
the LT3652 has the ability to seek out
the maximum power operating point
of a solar panel’s power characteristic,
thus utilizing the full capacity of the
solar panel. The float voltage regulation loop and its adjustable charging
current enable the LT3652 to be used
with many battery chemistries, making
it a versatile battery charger. The added
features of a wide input voltage range,
an auto-recharge cycle to maintain a
fully charged battery, a battery preconditioning mode, NTC temperature
sensing, selectable C/10 or timed
charging termination, a FAULT and
a charging status pins fills out the
full feature set of the LT3652. The
LT3652 is available in a 3mm × 3mm
12-lead plastic DFN, package with an
exposed pad.
L
LTC3612, continued from page 11
inductor current measured through
the bottom MOSFET increases beyond
6A, the top power MOSFET is held off
and switching cycles are skipped until
the inductor current is reduced.
Linear Technology Magazine • December 2009
Conclusion
The LTC3612 is well suited for a wide
range of low voltage step-down converter applications, including DDR
memory termination applications
requiring ±1.5A of output current. Its
high switching frequency and internal
low R
power switches allow the
DS(ON)
LTC3612 to offer a compact, high efficiency design solution supplying up
to 3A output current.
L
15
 Loading...