

Page 1

LA100 Audio Analyser
Manual
Sixth edition, June 2007
© 2007 Lindos Electronics
Part number: MN100
This manual describes LA100 software version V6.7. Please refer to any accompanying
update sheets if your LA100 displays a version number later than this when it is turned on
or reset. Users familiar with earlier software should refer to appendix I.3 for a list of new
features.
We are continuously developing and enhancing the software within the LA100 and send
major new software EPROMs to all users. You should therefore ensure that you complete
and return the enclosed registration card directly to Lindos Electronics and advise of any
change of ownership or change of address so that you receive these updates.
All comments and suggestions regarding the LA100 will be gratefully received.
LINDOS ELECTRONICS Technical Support (usually 24 hours):
Saddlemakers Lane Telephone: +44 (1394) 380307
Melton
WOODBRIDGE Fax: +44 (1394) 385156
Suffolk IP12 1PP email: [email protected]
ENGLAND
Page 2

Contents
1.0 Introduction 9
1.1 Viewing Angle 9
1.2 Switching-On 9
1.3 The Keyboard 10
1.4 Reset 10
1.5 Memory Clear and Non-Volatile Memory 11
1.6 The Configuration Menu 12
1.7 Connectors 12
1.8 Technical Support 14
2.0 Manual Operation 15
2.1 Volume Control 15
2.2 Generating Tones 15
2.3 Measuring Tones 16
2.4 Channel Switching 18
2.5 Programmable Presets and Initial Settings 18
2.6 Relative Levels − Test Level (TL) 18
2.7 Measurement Options 19
2.8 Frequency Measurement 21
2.9 Phase Measurement 21
2.10 Noise Measurement 22
2.11 Rumble Measurement 23
2.12 Crosstalk Measurement 23
2.13 Distortion Measurement 24
2.14 Wow and Flutter Measurement 25
2.15 Speed Measurement 26
2.16 Difference Frequency Distortion Measurement 27
2.17 Quantising Distortion (QD) Measurement 29
2.18 Frequency Intermodulation (FIM) Measurement 29
2.19 Standards 30
2.20 400Hz High Pass Filter 30
2.21 Impedance & Impedance Correction (ZC) 30
2.22 dBu, dBV, Volts and Power Measurement 31
2.23 Printing the Displayed Values 33
2.24 Output Waveform 33
2.25 Miscellaneous Features 34
2.26 LA101 Weighting Curves 35
2.27 User Weighting Curves 35
2
Page 3

3.0 Sequence Testing 37
3.1 Running a Sequence 41
3.2 Page Results Mode 42
3.3 Frequency Response Results 43
3.4 Printing Sequence Results 43
3.5 Storing Results in Memory 45
3.6 Cyclic Identification Character 46
3.7 Test Level 46
3.8 Input Level 47
3.9 Ch
oosing a Sequence 47
3.10 Interpreting Sequence Results 50
3.11 Single Channel Operation 50
3.12 Single Register Operation 52
3.13 FSK Failure − Error Codes 53
3.14 Sweep Headroom 53
3.15 Peak Programme Meter (PPM) Testing 55
3.16 Normalisation of Frequency Response 56
3.17 Subtracting Reference Curves 57
3.18 Tests Which Always Subtract a Reference Curve 57
3.19 Oscillator Weightings 57
3.20 Automatic Results Storage 59
3.21 Printout Heading 60
3.22 Printout Date 60
3.23 Running Single Segments 61
3.24 Using Filters for Sequence Measurements 62
3.25 Remote Trigger 62
3.26 Breaking into a Repeating Sequence 63
3.27 CCITT O.33 Compatibility 63
4.0 User Defined Sequences 65
4.1 The Sequence Definition 66
4.2 The LA101 Sequence Editor 68
4.3 Source Identification 69
4.4 Copying a Sequence 71
4.5 Measurement Levels 71
4.6 Test Level Segments (T,V) 72
4.7 Frequency Sweep Segments (OPQRSUXorux) 73
4.8 Noise Segments (L,M,N,n) 73
4.9 Crosstalk Segments (A,B,C,J,c) 74
4.10 Distortion Segments (D,E,F,G,I) 74
3
Page 4

4.11 Wow & Flutter Segment (W) 75
4.12 Phase Segments (Y, Z, z) 75
4.13 User Level Segment (K) 75
4.14 Maximum Output Level (MOL) Segments (H, h) 76
4.15 Difference Frequency Distortion (d) 77
4.16 Tone Burst/Tones Segment (!) 78
4.17 Repeating Segments and Sequences (<) 81
4.18 Multiple Results Compartments 81
4.19 Selecting a Tolerance (±) 83
4.20 Output Impedance Segment (%) 83
4.21 Sequence Level Segment (/) 84
4.22 Channel Segment (:) 84
4.23 Subroutine Segment (>) 85
4.24 Pause Segment (?) 85
4.25 Sweep Headroom (^n) 85
4.26 Subtract a Reference Curve (\n) 86
4.27 Equivalent ! Segments 86
4.28 CCITT O.33 Sequences 87
4.29 Apply weighting (=n) 88
5.0 Tolerance Testing 89
5.1 Applying a Tolerance 92
5.2 Pre-Defined Tolerances 92
5.3 Tolerance Strings 93
5.4 The Tolerance Definition 93
5.5 Printout Format 95
5.5 Printout Format 95
5.6 The LA102 Tolerance Editor 96
5.7 Editing Tolerances on a Remote Computer 98
5.8 Example Tolerance 98
6.0 Using Test Tapes and Discs 101
6.1 Test Tape Mode 101
6.2 Frequency Sweep Mode 103
6.3 Frequency Response Results 104
6.4 Automatic W&F Measurement on Test Tapes 104
7.0 Applications Advice 107
7.1 Tape Machines 107
7.2 Loudspeakers 108
7.3 Microphones & Low Level Inputs 108
7.4 Lines, Links & Networks 109
4
Page 5

7.5 Mixing Consoles 110
7.6 Filters and Equalisers 110
7.7 Compact Disc Players 111
7.8 Amplifiers 111
7.9 Production Testing 111
7.10 Meter Testing 111
7.11 FM Transmitter Systems 112
8.0 Using Printers 113
8.1 Setting Up the Printer 113
8.2 Printing 114
8.3 Printout Format 115
8.4 Printers and the Configuration Menu 115
8.5 Choosing a Printer 117
8.6 9 Pin Dot Matrix Printers 117
8.7 Epson LQ and Other 24 Pin Printers 118
8.8 Inkjet Printers 118
8.9 Portable Printers 119
8.10 Printer Problems 119
9.0 Remote Control 121
9.1 Connecting the LA100 to a Computer 122
9.2 The RS232 Serial Data Format 123
9.3 Entering Remote Mode 123
9.4 Command Format 125
9. 5 Some Examples 126
9.6 Hints on Writing Programs 127
9.7 Errors 130
9.8 General Purpose Commands 131
9.9 LA101 Output Commands 133
9.10 LA101 Preset Commands 135
9.11 LA101 Frequency Sweeps & Tone Burst Commands 136
9.12 LA101 Weighting Curves 137
9.13 LA102 Measurement Commands 137
9.14 Running a Sequence 141
9.15 Defining a Sequence 143
9.16 Reading Sequence Results 144
9.17 LA102 Heading and Date 150
9.18 Tolerance Testing 150
9.19 Memory Operations 151
9.20 Using the Smart Sequence Modes 152
9.21 User Sweeps 153
5
Page 6

9.22 Using Sequences 155
10.0 Service Information 157
10.1 EPROM Replacement 157
10.2 Recalibration 158
10.3 Power Supply Voltage 159
10.4 System Overview 159
10.5 Fault Diagnosis 160
10.6 Selftest Failed 161
10.7 5V Power Supply Check 161
10.8 ±15V Power Supply Check 162
10.9 Battery Testing 162
10.10 No LA101 Output 164
10.11 Level Errors 164
10.12 Reed Relay Faults 165
10.13 Microprocessor Faults 166
10.14 Display Faults 167
10.15 Replacing Boards 167
10.16 Spares 167
10.17 LA101 Loudspeaker 168
Appendix A Accessories 169
A.1 Items Supplied with the LA100 169
A.2 Computer Support Software 169
A.3 Conversion Kits (Rack Mount/Separate) 169
Appendix B Audio Sockets 171
B.1 Rear XLR Connectors 171
B.2 Front Jack Sockets 172
B.3 BNC Sockets 172
Appendix C RS232 Connections 173
Appendix D Circuit Diagrams 175
Appendix E Error Messages 179
Appendix F Frequency Lists 182
F.1 IEC Third Octave Frequencies (and remote codes) 182
F.2 LA101 Frequencies and Remote Codes 182
6
Page 7

Appendix G LA102 Filter Graphs 185
Appendix H FSK Header Format 187
Appendix I LA100 Versions 188
I.1 LA100 History 188
I.2 Upgrading Early Units 188
I.3 Software Changes 188
I.4 Rack Mounted Unit (LA100R) 192
I.5 CCITT O.41 Filter Version (LA100C) 192
I.6 Power Supply Monitoring (LA100P) 193
I.7 Telecom Australia Version (LA100T) 193
Appendix J Specification 194
J.1 LA101 Audio Oscillator 194
J.2 LA102 Audio Measuring Set 195
J.3 Common to Both Units 197
Index 199
List of Tables
1.5 Configuration Options 13
2.6 Measurement Options 20
2.19 Impedance Correction Modes 31
3.1 Default sequences 38
3.2 Test Segments 40
3.14 Allocation of Sequence Banks 47
4.1 Control segments 67
5.3 Pre-defined Tolerances in the LA102 90
8.1 Printer configurations 117
9.3 Remote Command Summary 130
F.1 Third Octave Frequencies and Remote Codes 184
F.2 LA101 Frequencies and Remote Codes 186
7
Page 8

8
Page 9

1.0 Introduction
The first time user should read this chapter, which describes basic features common to
both units, but may then proceed to chapters 2 or 3 for a complete introduction to either
manual or sequence measurement. Sequence measurement is a very easy way of making
a predefined sequence of measurements, at the press of a few keys, without any
programming effort, and without any connection between units other than the signal path.
New users should refer to chapter 7 for applications advice on testing specific devices and
also appendix A which lists the items supplied with the LA100 and the optional
accessories which are available. Other sections of the manual give further information on
defining sequences, tolerance testing, using printers, remote computer control via the
serial (RS232) interface and on servicing the LA100 as there is no separate service
manual. In all cases the most important information can be found at the start of each
chapter; the sections towards the end of each chapter describe the technical details and
more specialist applications.
Although the LA101 Audio Oscillator and LA102 Audio Measuring Set are two
independent units, they are generally used together, and for convenience are then referred
to as the LA100 Audio Analyser. The LA100R is a rack mount version of the LA100
consisting of the LA101 and LA102 bolted together, side by side, to go into a 19" rack.
See appendix A for conversion kit details.
Conversion kits 19" rack mounting
1.1 Viewing AngleLCD contrast Lighting the display Backlit display
The full-graphic liquid crystal display in these units combines great flexibility of display
with very low power consumption. Units with serial numbers below 3430 use non-backlit
displays, and for good contrast it is essential that light strikes the display from above the
normal and is reflected off towards the eye below the normal. This requires a large angle
of tilt, or high mounting on a shelf or in a rack. Later units are fitted with high contrast
backlit displays, and the viewing angle is less critical. Earlier units can be upgraded to
the backlit display. A contrast adjustment is fitted inside the top cover (section 10.14)
which gives some optimisation for different viewing angles, but the units are supplied set
for best overall results.
1.2 Switching-OnSwitching on Mains voltage Power supply Mains power supply Power supply voltage
The units can be powered either from the mains or from their internal rechargeable
batteries. The
button controls the battery power and the units will always be on
when the mains is connected. There is no mains switch as power consumption is
negligible and continuous operation will do no harm. Units are normally supplied for
either 110-120V or 220-240V, 50/60Hz operation and marked accordingly on the back
9
Page 10
panel; but they can be altered internally by a competent technician (see section 10.3).
For battery operation, press
to turn the battery power on. To turn it off press
and hold it briefly. To conserve battery life the unit will switch off
automatically five minutes after the last key press unless it is put into battery lock by
pressing
(ie hold and press ). A ‘B’ in the corner of the display
indicates battery operation, and a heavy ‘B’ indicates the battery lock condition. A
flashing ‘
B’ indicates that the battery is nearing discharge, and the automatic switch-off
period then shortens to 30 seconds.
Low battery Recharge time battery life
The units will operate for around 4-5 hours on a fully charged battery. The battery is
trickle-charged whenever the mains is connected and will take 36 hours to fully recharge.
(Pressing
when the mains is connected will divert current from battery charging
to the backlight. The battery will not charge but the light will be brighter.
To achieve optimum power management in the unit, the backlight will operate for about
an hour from a fully charged battery. The unit will continue without backlight for about
3-4 hours.
When operating from a mains supply the backlight will be at reduced intensity for about
30 minutes after switch on if the battery is in a heavily discharged condition.
Backlight
1.3 The Keyboard
In the interest of simple error free operation, the units have only a small number of keys,
each clearly labelled underneath with its main function. The deceptively simple keyboard
hides the vast range of functions which are obtained by pressing combinations of keys, as
described in this manual and in the Quick Reference Card, but they need not concern the
beginner or occasional user.
The
key is like a computer’s shift key: while pressed it gives other keys a second
function (it does nothing by itself). In this manual a
in front of another key indicates a
second function requiring the
key to be held while the key is pressed. In particular,
to generate the numbers 6-10. Most keys repeat if held for a short while.
1.4 ResetNon-volatile memory
When turned on, or after a reset, the state of both units is determined by their
configuration settings stored in non-volatile memory. As supplied, or following removal
of the battery, configurations are set to the Lindos default settings, but these can be
changed using the configuration menu described below. In default configuration the
LA101 generates 0dBu (0.775V) at 1kHz and the LA102 goes into its flat level-
measurement mode. Tapping
briefly at any time causes a reset, momentarily
displaying the unit’s serial number and software version (Fig 1.1) and providing a fresh
10
1. Introduction
Page 11
start. Using this facility minimises mistakes caused by unwanted settings not being
cleared. Some settings are deliberately not cleared by a reset, e.g. measurement options,
frequency and level presets, configuration settings and sequence and tolerance definitions.
Tapping
briefly, and then holding it will keep the start-up message displayed.
Fig. 1.1 LA102 Start-up Screen Fig. 1.2 LA101 Reset Menu
1.5 Memory Clear and Non-Volatile MemoryMemory clear Reset menu Complete reset
Both units are equipped with non-volatile memory and the frequency and level presets,
measurement options, user configurations, sequence definitions, test sequence results and
tolerance specifications are all kept when the unit is turned off. Units are normally
supplied in the default condition, but the user should be aware of the fact that accidental
setting of non-volatile functions could cause confusion. In case of doubt, a complete reset
will restore Lindos default conditions. Press
(ie hold and press )
on either unit and a menu will appear (fig 1.2), with the following options:
Key LA101 Reset Menu LA102 Reset Menu
All but sequence definitions All but sequence results
Preset keys (frequency and level) Measurement options and ranges
Configuration options Configuration options
Sequence definitions & source ID Sequence results (memory 0)
− Tolerance definitions
Fig. 1.3 LA100 Reset menus
Press
and the unit will be restored to normal operation. Alternatively, a partial reset
can be obtained by pressing
to , as indicated.
Non-volatile memory relies on the internal Lithium-Ion battery having some charge, but
will normally persist for some time after the unit has ceased to function. A half-charged
battery will provide memory retention for around six months. A memory check is carried
out automatically when the unit is switched on, and in the unlikely event of memory
corruption the whole memory is cleared automatically and a ‘
MEMORY CLEARED’
message is displayed for 2 seconds.
Programmable presets Frequency presets Level presets NiCd battery
11
1. Introduction
Page 12
1.6 The Configuration MenuConfiguration letters Configuration options Setting configurations Initial settings
The configuration menu is obtained on either unit by holding and pressing
(Figs 1.4 & 1.5). It offers the possibility of changing many configuration parameters such
as printer baud rate, printer type, print format, and default impedance. The full list is
shown in table 1.6. Each configuration is given a letter (A-Z) and may be set to one of
several options, each represented by a number. For example, configuration P1 indicates
that the printer configuration (P) is set to Epson (1), while configuration P8 will indicate
that the LA102 is configured for a HP Deskjet printer. Similarly, configuration V will
determine the default loudspeaker volume in the range 0 (off) to 15 (maximum volume).
The configurations in the LA101 and LA102 are completely independent although similar
functions have been given the same letter wherever possible.
Fig. 1.4 LA101 Configuration Editor Fig. 1.5 LA102 Configuration Editor
When the configuration options are displayed (figs. 1.4 & 1.5) the left hand pair of keys
in the centre row can be used to cycle through the various configurations, and the right
hand pair will change the option number (these keys repeat if held). The various options
are displayed when selected. Keys
to , and to (representing 6 to 10) can
also be used to set the various options and
will restore the Lindos/Recommended
default option. Exit the menu by resetting or pressing
. The current LA102
configuration settings can be printed by pressing
when the configuration menu
is displayed (see sections 8.1 & 8.2).
Printing LA102 configuration settings
1.7 ConnectorsB-gauge jack sockets oscilloscope output trigger output Balanced inputs and outputs Impedance switching jack sockets
The LA101 output is balanced and floating, with 75 or 600 output impedance at the
front B-gauge jack sockets and 10
output impedance at the rear XLR sockets. The
LA102 has balanced inputs with 600
or 10k input impedance at both the front and rear
sockets (which, unlike the LA101, are connected in parallel). See section 2.21 for details
of impedance switching and appendix B for pin connections.
PO jack sockets Studio output audio sockets
The BNC sockets on the back of the LA102 allow monitoring of distortion residue and
other filtered signals on an oscilloscope and are also suitable for connecting high
12
1. Introduction
Page 13
13
1. Introduction
Table 1.6 Configuration Options Configuration letters Configuration options Setting configurations
LA101 Configurations:
B Sequence bank User, Lindos, Tape, Speaker, Filter, Meter, Utility, BBC,
BT, Telecom Australia, SAPO
F Frequency display Rounded, true
R Remote baud rate 75, 150, 300, 1200, 2400, 4800, 9600, 110
S Start up level MUTE, p/set 1, p/set 2, p/set 3, p/set 4, p/set 5, previous
value
T Start up frequency p/set 1, p/set 2, p/set 3, p/set 4, p/set 5, previous value
U Level units dBu/dBm, dBV, Volts and dBu/dBm, Volts and dBV
V Monitor volume Off, Remote error beep, 2,3,4,5,6,7,8,9,10,11,12,13,14,15
W Weighting on
All, usr1, usr2, usr3, usr4, usr5, RIAA, CCIR, CCITT, 50
µs
Z Output impedance 10
, 75 , 600
Default options (shown in bold) are: B0 F1 R3 S4 T4 U0 V8 W0 Z1
LA102 Configurations:
A Auto Print Seq Off, On, 2 Copies, 3 Copies, 4 Copies, 0 copies Multiple copies
B Printer baud rate 75, 150, 300, 1200, 2400, 4800, 9600, 110, 19200
C Compartments per memory 1, 2, 3, 4, 5
D Distortion display %, dB
E Graph width Normal (6cm), Wide (12cm), difference
F Graph fit 0dB, Peak, Centre 0dB
G Graph scale in dB/cm 1/4, 1/2, 1, 2, 4, 8
H Graph height in cm 0, 1, 2, 3, 4, 5, 6, 7, 8, 9, 10
I Lines per inch 6, 7, 8, 9
J Graph normalisation Absolute, 315Hz, 400Hz, 1kHz
M Top margin in 1/6" lines 0, 1, 2, 3, 4, 5, 6, 7, 8, 9, 10, 11, 12
N Page length in 1/6" lines 60-76 lines, default is 66 (ie 11")
P Printer type ASCII text only, Epson FX LX RX/IBM (9pin), P40 (40
col), P40 (80 col), HP Thinkjet, Epson NLQ, Apple
Imagewriter, Epson LQ (24 pin), HP Deskjet 100dpi, HP
Deskjet 150dpi, CSV
R Remote baud rate 75, 150, 300, 1200, 2400, 4800, 9600, 110
S Softstrip output No longer available (contact Lindos)
T Tolerance None, User 1, 2, 3, 4, 5, Selftest, EPS81A <40km, EPS84
<40km, EPS84 <320km,EPS98 <320km, IBA Tape/
general, IBA Tape/restricted, IBA Studio path, Lindos
cassette, Studer A812 stereo 15ips
Tolerance configuration
U Level units dBu/dBm, dBV, V, W
V Monitor volume 0 (off), 1, 2, 3, 4, 5, 6, 7, 8, 9, 10, 11, 12, 13, 14, 15, 16
W Watts into 8
display V, V/10
X Date operation Not printed, printed, advanced at switch on
Y Auto store SEQ results Off, in memory 1-5 next
Z Input impedance 600
, 10k
Default options (shown in bold) are:
A0 B7 C1 D2 E1 F1 G5 H4 I6 J3 M0 N66 P1 R3 T1 U0 V8 W1 X0 Y0 and Z2
Page 14

impedance headphones. See appendix B.3 for further details.
Finally, the 9 pin D-type sockets provide an RS232 compatible serial interface for
connecting printers (see chapter 8) and computers (see chapter 9). Wiring details are
given in appendix C.
RS232 serial port Serial interface
1.8 Technical SupportCalibration Recalibration Repair service User registration
Lindos takes great pride in the technical support offered to customers, which includes free
software updates and applications advice. Our technical support telephone line
(+44 1394 380307) is usually manned outside of normal office hours for urgent problems
and we aim to reply to technical queries sent by fax or email on the day they are received
(Fax +44 1394 385156, email: [email protected]). Support is also available through
our worldwide agent network although complex queries are best sent directly to Lindos.
To help us support you, please ensure that you return your completed registration card
directly to Lindos Electronics and ensure that you always supply your serial number and
software version number in any correspondence − both are shown on the LCD when the
units are switched on or reset (see fig. 1.1).
In the event of a unit developing a fault, Lindos can often diagnose the problem by
telephone or fax and forward any necessary parts the same day, but please refer to the
service information in chapter 10 first. If phoning, try to have the unit to hand, with the
covers removed and both channels directly connected. It is useful to have a multimeter
available.
Lindos also operates a fast turn-around repair and recalibration service, and a pcb
exchange scheme.
14
1. Introduction
Page 15
2.0 Manual Operation
Both units operate in manual mode when switched on, and can be toggled between this
and sequence mode by pressing
. The key is also used to exit from the
various menus and editors which can be called up. Alternatively, the
key can be
tapped briefly to reset various parameters and return to manual mode (see section 1.4).
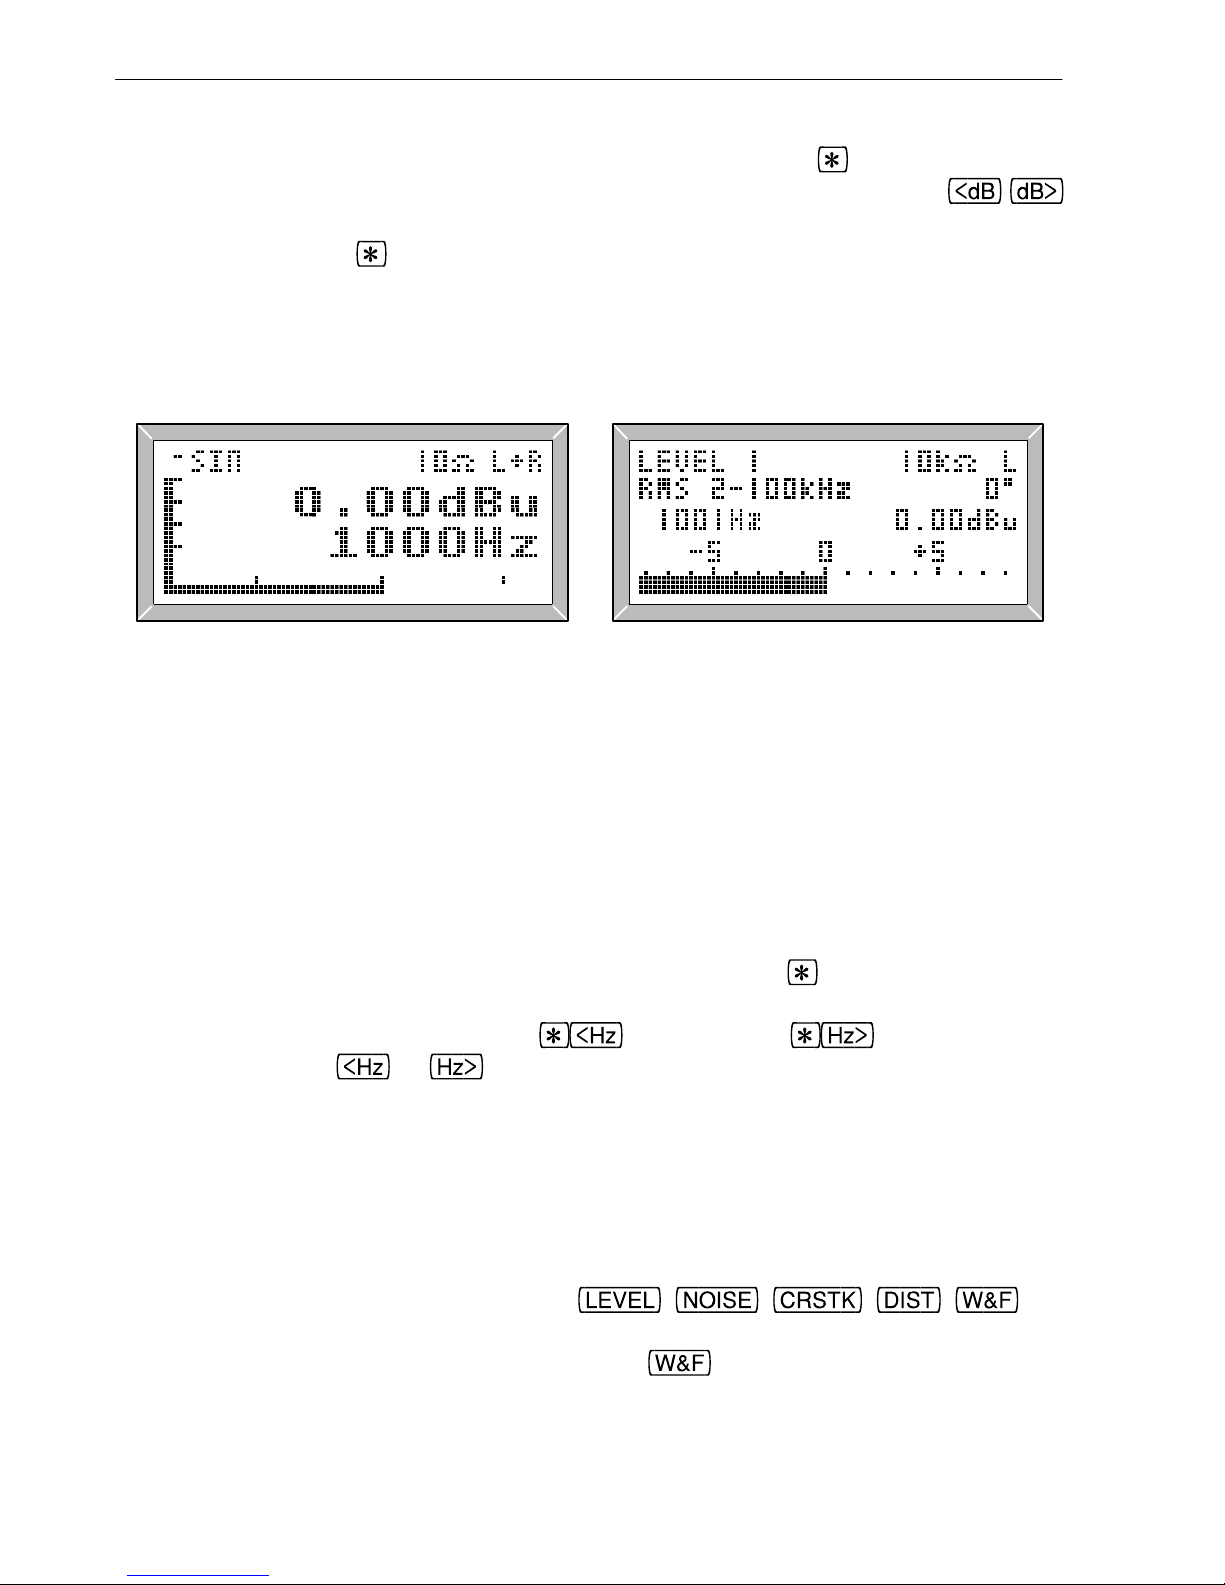
In manual mode the LA101 displays the frequency and level being generated, numerically
and on two bar graphs as shown in fig. 2.1, while the LA102 displays the measured
frequency, level and phase (depending on the selected measurement). The function keys
on the LA102 are particularly easy to use because they select a measurement to a
predefined standard which is displayed at the top of the screen (fig 2.2). Pressing
, for example, carries out a measurement to CCIR 468-4 (weighted), without
requiring the user to specify the measurement standard, weighting curve, rectifier etc., and
with the confidence that everything will be correctly set. The Lindos default settings
represent measurement methods most frequently used by most engineers, with various
options providing other standards. Options, in this context are built into every unit; they
are not optional extras!
Functions
The first-time user is advised to link the XLR sockets on the rear of the units and run
some of the measurements described below in order to gain familiarity with the LA100.
2.1 Volume Controlvolume monitor loudspeaker
The LA102 is fitted with an internal loudspeaker which allows the user to monitor the
signal after the filter and gain stages of the LA102. This enables distortion residue, noise
and even flutter components to be heard, but remember that the autoranging of the LA102
will make even very good systems sound noisy after 70dB of gain has been introduced!
The LA101 does not have a loudspeaker fitted as standard, but one can be fitted, as
described in section 10.17, and may be useful when testing lines, for example, where
there is no other way to monitor the signal being generated.
Press
to turn the loudspeaker on or off, or hold and press or to
change the volume (hold the keys to make them repeat). The initial volume used when
the unit is switched on is determined by configuration V (see section 1.6), and can be set
to 0 if you find the loudspeaker intrusive.
2.2 Generating Tones Generating tones Amplitude range Level range Frequency range Range Maximum output level
The LA101 generates 1kHz at 0dBu at switch-on, and this should be displayed on both
units (fig 2.1 & 2.2), if connected together. Two arrowed keys marked
permit
15
Page 16
the frequency to be stepped up or down between 5Hz and 31.5kHz in convenient onethird octave steps. For finer control (32 steps per octave) hold the
key while operating
these keys (see appendix F for a full list of frequencies). Two keys marked
allow similar adjustment of output level between -100dB and +26dBu in 1dB steps, or
0.01dB steps with the
key held. All of these keys repeat if held. The horizontal bar
graph indicates output frequency, with marks at 100Hz, 1kHz and 10kHz (the end points
of the bar graph represent 20Hz and 20kHz), while the vertical bar graph indicates output
level in dB, with marks at +20dB, 0dB, -20dB, -40dB and -60dB.
Fig. 2.1 LA101 Manual Mode Fig. 2.2 LA102 in Manual Mode
Do not be put off by the fact that some frequencies read differently on the two units (eg
10000Hz on the LA101 is shown as 10080Hz on the LA102). The LA101 can only
synthesize a limited number of frequencies, so it displays the true IEC third-octave
frequency but generates the nearest synthesised frequency. This is convenient and
perfectly satisfactory for most purposes, with the maximum difference between true and
displayed frequencies being around 1%.
The LA101 will always display the true frequency after the
key has been used to
change the frequency in a fine step, so to see the true frequency being generated for any
particular third-octave, simply press
followed by . Changing the
frequency using the
or keys will always set the next third octave frequency.
The LA101 can be made to always display the true frequency by setting configuration F2
(see section 1.6), but most users find the rounded values more convenient.
2.3 Measuring TonesMeasuring tones Level range Input level
The LA102 displays signal level, frequency and phase difference between channels
automatically at switch-on, and displays the level as a bar graph as well as a numerical
reading (fig. 2.2). The five function keys,
, , , , can
be used to select the measurement, as described in sections 2.10-2.18 (with various
miscellaneous measurements also available on the
key).
The measurement range extends from -120dB to +28dB, and all measurements are
16
2. Manual Operation
Page 17
autoranging; the bar graph scale changing in 10dB steps when the reading goes outside
±6dB of the centre. This leaves a ‘guard band’ of 2dB so that no reasonably steady signal
should cause the range to ‘hunt’ up and down. On wildly varying signals, though, manual
range setting may be found useful, and the
and keys on the LA102 change the
range, automatically disabling autoranging. To hold the current range, press one and then
the other. To re-enable autoranging just press the appropriate function key again or press
twice. Range setting Level range setting Manual range setting Range keys Input level
The bar graph shows the absolute level in dBu or dBV and is normally labelled in 5dB
steps, with each pixel representing a 0.2dB step. This is about as good as an analogue
meter, taking into account the very low levels of zero error and non-linearity, but for
greater precision
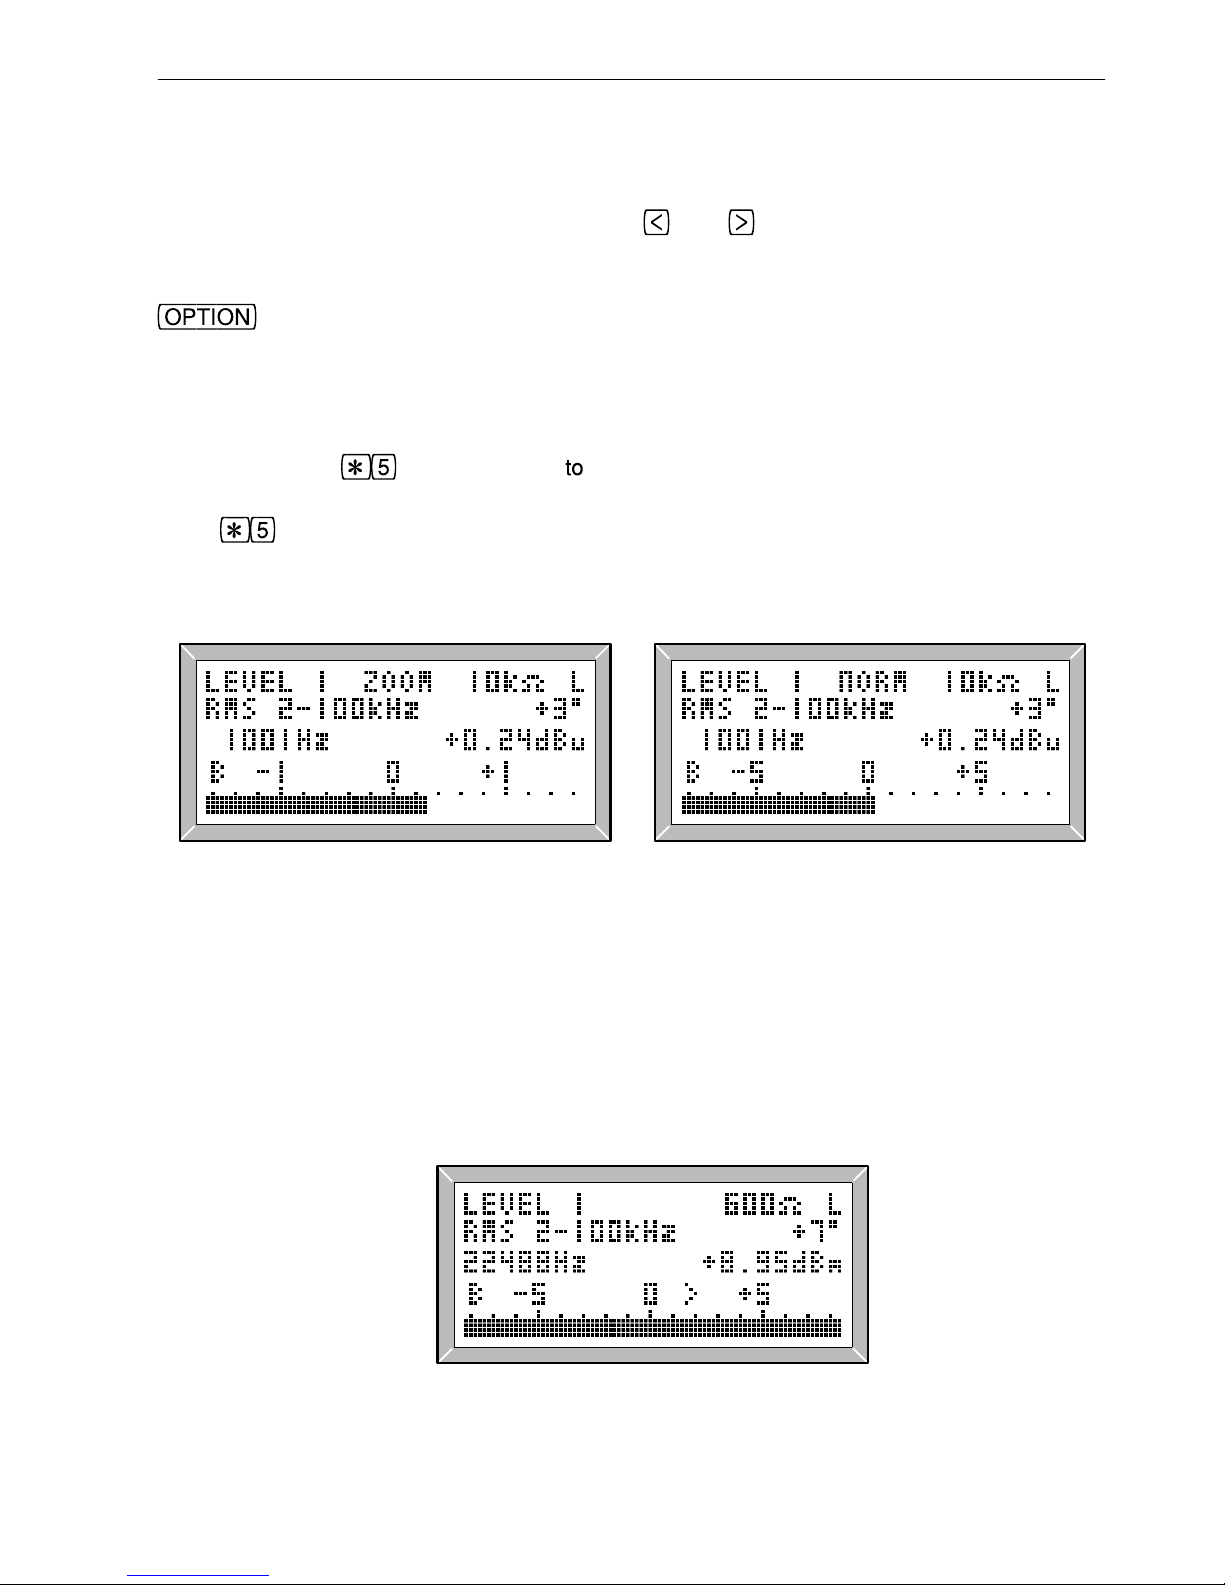
can be pressed expand the bar graph scale by a factor of 5. The
1dB steps will now be labelled, with each pixel representing 1/25th of a dB (0.04dB).
Press
again to return to the normal scale. ZOOM (fig. 2.3) is displayed for a second
when it is selected, and
NORM (fig. 2.4) when it is cancelled. For accurate readings on
steady signals the numerical readout is preferred, reading to 0.01dB.
Expanded bar graph Magnified bar
graph
Bar graph scale Level resolution Bar graph magnification Level range Bar graph units dB scale
Fig. 2.3 Zoom bar graph Fig. 2.4 Normal bar graph
The LA102 indicates if the input level is too high or too low for the range by flashing an
arrow (fig. 2.5). If the level is too high (flashing >) the displayed reading is incorrect
because the LA102 is overloaded, while a low level (flashing <) indicates that accuracy is
being lost (when the level is more than 30dB below the centre scale value). In either case
the range should be changed if possible (an LA102 will change range automatically
unless it has been locked).
Level too high Level too low
Fig. 2.5 Flashing overflow indicator
17
2. Manual Operation
Page 18
2.4 Channel SwitchingChannel switching
on the LA102 selects input channel (displaying ‘L’ or ‘R’ on the screen). on
the LA101 cycles through ‘L+R’, ‘L’ and ‘R’ channels, while
mutes both
channels and displays ‘
MTD’. Pressing again will restore the selected channel
state (‘
L+R’, ‘L’ or ‘R’) which can be changed even while the output is muted in
preparation for de-muting. When an output channel is turned off, it is switched by an
internal relay and terminated with the selected output impedance.
2.5 Programmable Presets and Initial SettingsProgrammable presets
The five numbered keys on the LA101 give instant access to preset levels and frequencies
as labelled on the panel. If the last thing changed was frequency then they operate as
frequency presets, otherwise they give preset levels. This can be confusing at first, but
with proper use it gives very quick access. We recommend always pressing one of the
frequency
or level up-down keys, to define the mode of operation,
before using the presets.
Level presets Start up frequency Start up level Initial settings
The presets can be programmed by simply selecting the desired frequency or level in the
normal way and then pressing
followed by the preset key (1 to 5) to be re-
programmed. The LA101 will prompt for the preset number, by displaying ‘
P?’ beside
the frequency or level display. Their settings are retained in non-volatile memory, and
many users will prefer to set values like 20Hz, 3150Hz, 15kHz or +8dB permanently.
Configuration T
When the LA101 is turned on (or reset) it will generate the frequency and level of one of
the presets. By default this is preset 4 which usually gives 1kHz and 0dB. Any change to
preset 4 will therefore change the start-up frequency and level as well. However, the
LA101 can be made to select the frequency and level assigned to any preset, by setting
configuration S (for level) and T (for frequency) to any preset number (1-6). For
example, users testing sensitive microphone inputs might like to set configuration S1 to
make the LA101 generate -60dB (the level usually assigned to preset 1). Furthermore,
configuration S0 can be used to make the oscillator start up with its output muted.
Configurations S6 and T6 will force the output level and frequency to the values set when
the unit was last turned off or reset. See section 1.6 for further details of configurations.
To avoid overloading sensitive inputs, it is possible to turn the LA101 on with its output
muted, by holding the
key while switching on. Mute on start-up Test level in manual mode
2.6 Relative Levels − Test Level (TL)Setting test level Test level setting TL in manual mode
Both units cater for relative level generation and measurement. Pressing on the
LA101 stores the current output level as a test level and displays TL. The output level is
now displayed relative to this test level. Pressing
again, or resetting (by tapping
18
2. Manual Operation
Page 19
), cancels the test level. Note that the level difference between the two channels
can be measured easily by setting the test level on one and then selecting the other.
The same key combination,
, on the LA102 stores the current reading and
subsequent readings are shown relative to this on the numerical readout. The bar-graph,
however, always reads absolute. A test level may be set for the functions level, noise and
crosstalk, and it then operates on all these measurements until cancelled by another
or a reset. It does not operate on distortion, which uses its own reference level, or on
W&F.
2.7 Measurement OptionsMeter characteristic Level measurement Measuring level Level options
To select the measurement option for the current function (level, noise etc), press
followed by the option number, to . More obscure measurements are
available as options 6 to 10 which are selected by pressing
to , and options 11
to 15 which are selected by pressing
followed by to . In all cases a menu appears
listing the 5 options which can be selected (fig. 2.7 & 2.8). Once options 11 to 15 are
selected for a particular function, they will be listed next time the
key is
pressed, and
should be used to return to options 1 to 5. Pressing from the
menu display cancels the option menu.
In the case of level measurement, for example, option 1 is wideband rms, option 2 is
22Hz-22kHz bandwidth rms, and option 3 gives the same bandwidth with a VU meter
characteristic. Level option 5 provides a PPM (peak programme meter) characteristic, but
shows a dB bar graph instead of a true PPM scale (PPM 4 is 0dBu, PPM 5 is +4dBu, PPM
6 is +8dBu etc). Options are described fully in the relevant section below, and a full list
of options is given in table 2.6. Once changed, options remain set for each measurement
so that the user may switch between his own preferred set of measurements. Options, like
presets, are held in non-volatile memory, so remember to set them as required (or use
reset option 2 to restore the default options − see section 1.5).
Experienced users will realise that options 11 to 15 are generally similar to options 1 to 5,
but with a different filter (this is true for level options 11 to 15, distortion options 11 to 15
and noise options 12 and 13), and may like to know that
provides a quick way of
toggling between options 1 to 5 and options 11 to 15 (where available).
19
2. Manual Operation
Page 20
20
LEVEL
1 RMS, 2-100kHz
2 RMS, 22-22kHz
3 VU 22-22kHz
4 Twin level and phase bar graphs
5 PPM 22-22kHz
6 VU, A weighted
7 RMS, A weighted
8 VU 2-100kHz
9 RMS 2-100kHz slow response
10 PPM 2-100kHz
11 RMS 400-100kHz
12 RMS 400-22kHz
13 VU 400-22kHz
14 Twin bar 400-100kHz
15 PPM 400-22kHz
NOISE
1 CCIR468-3 weighted quasi-peak
2 CCIR468-3 unweighted quasi-peak
3 RMS 22-22kHz
4 RUMBLE unweighted, slow
5 RUMBLE weighted, slow
6 CCIR weighted, ARM-1k
7 CCIR weighted, RMS
8 A weighted, RMS
9 CCIR weighted, ARM-2k
10 2-100kHz
, quasi-peak
11 Unused
12 CCIR unweighted, 400-22kHz
13 RMS, 400-22kHz
14 CCIR unweighted PPM
15 CCIR weighted PPM
to selects options 1-5
to selects 6-10
to selects 11-15
returns to options 1-5
CROSSTALK
1 100Hz narrow band, RMS
2 315Hz narrow band, RMS
3 1kHz narrow band, RMS
4 6.3kHz narrow band, RMS
5 10kHz narrow band, RMS
6 40Hz narrow band, RMS
7 150-300Hz narrow band, RMS
8 2k-20kHz narrow band, RMS
9 15kHz narrow band, RMS
DISTORTION
1 100Hz RMS THD, 200-22kHz
2 315Hz RMS 3rd harmonic, narrow band
3 1kHz RMS THD, 2k-22kHz
4 6.3kHz RMS THD, 12k-22kHz
5 10kHz RMS THD, 20k-22kHz
6 40Hz RMS 2-400Hz
7 1kHz RMS 3rd harmonic - experimental
8 1kHz notch only, 22-22kHz
9 6.3kHz notch only, 22-22kHz
10 10kHz notch only, 22-22kHz
11 100Hz CCIR weighted quasi-peak
12 Unused
13 1kHz CCIR weighted quasi-peak
14 6.3kHz CCIR weighted quasi-peak
15 10kHz CCIR weighted quasi-peak
WOW & FLUTTER etc
1 W&F IEC386 weighted quasi-peak
2 W&F IEC386 unweighted quasi-peak
3 Q-D 40Hz CCIR weighted quasi-peak
4 Q-D 40Hz RMS, 400Hz-22kHz
5 Difference frequency distortion, 70Hz RMS
6 W&F weighted RMS
7 W&F unweighted RMS
8 FIM (frequency intermod)
11 Speed (3150Hz reference)
12 Speed (3125Hz reference)
13 Speed (3kHz reference)
Table 2.6 Measurement Options Measurement option
2. Manual Operation
Page 21
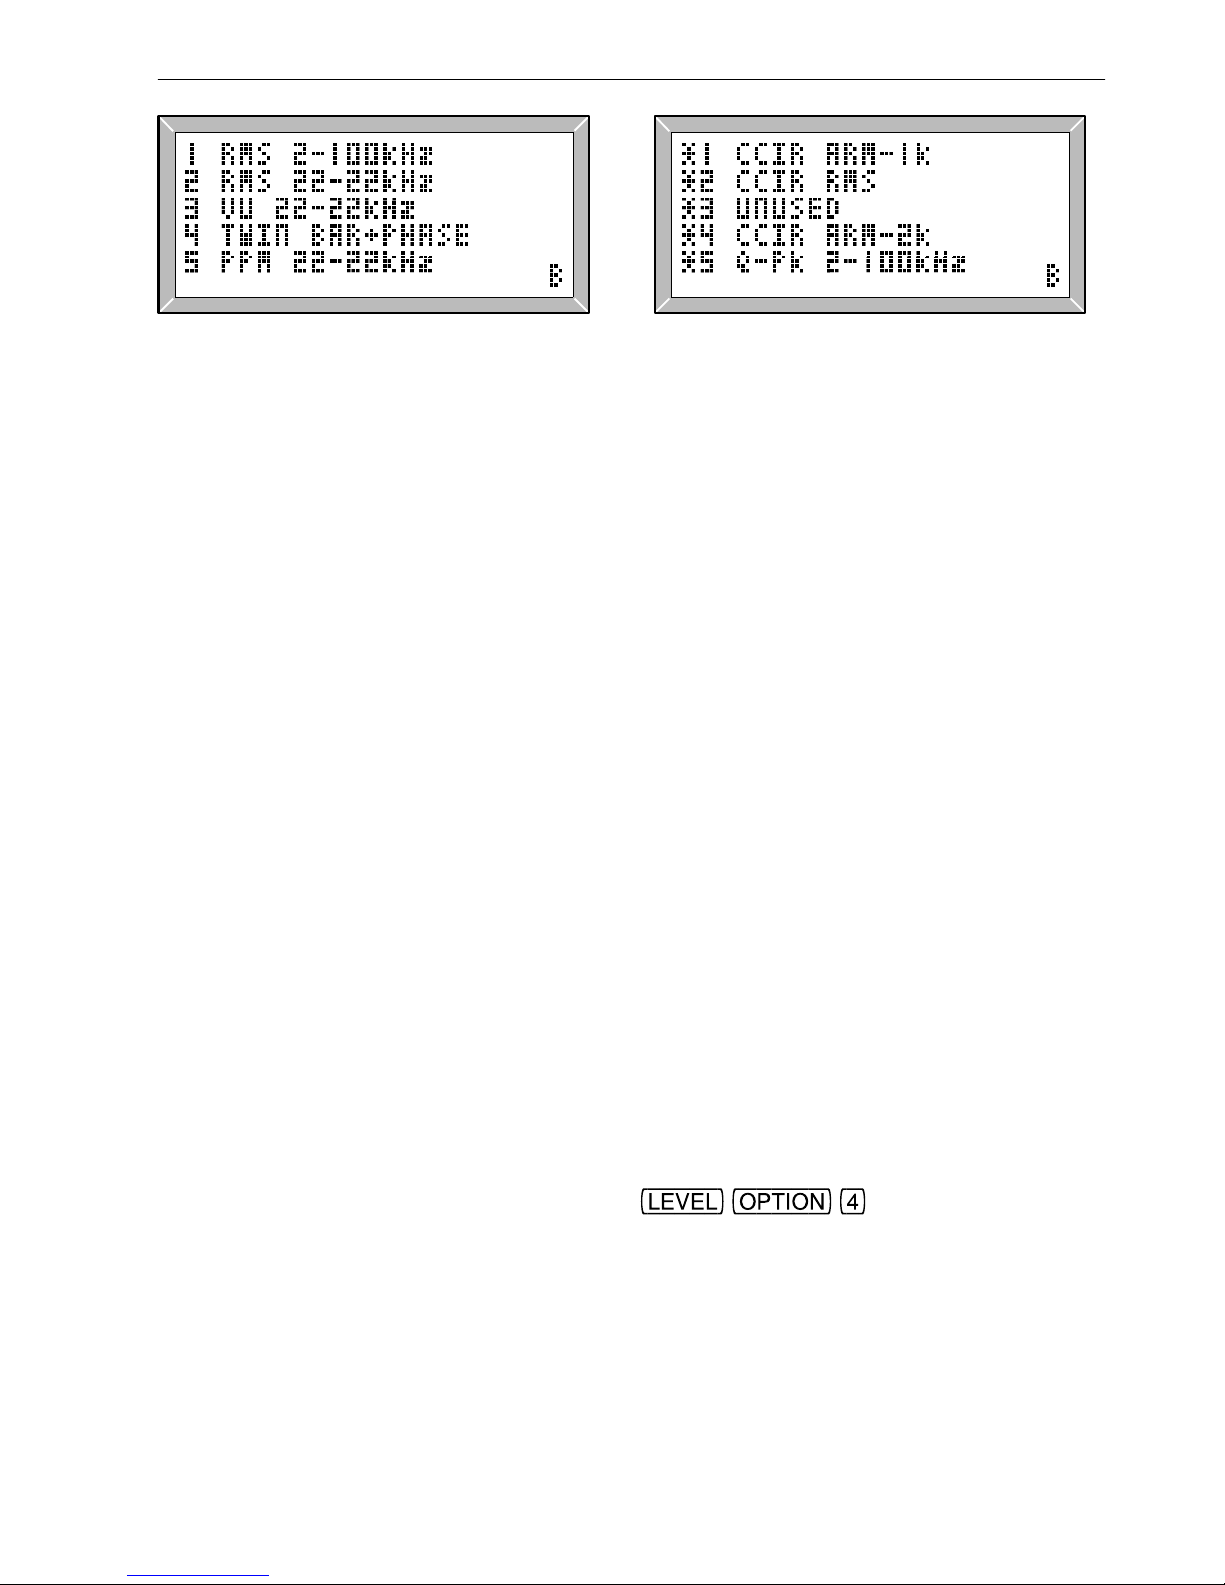
Fig. 2.7 Level options 1-5 Fig. 2.8 Noise Options 6-10
2.8 Frequency MeasurementFrequency measurement Aliasing on frequency measurement Frequency range
The LA102 displays the measured input frequency (of the selected channel) on all level
measurements (fig. 2.2). To measure frequency the LA102 times zero-crossings over a
variable number of cycles and calculates frequency − commonly referred to as ‘reciprocal
counting’. This gives rapid results even at low frequencies, together with high accuracy.
The algorithm used gives rapid updating after a large change in frequency, but averages
for greater accuracy on steady readings. The zero-crossing detector is preceded by the
filter and gain stages, so readings are valid down to quite low signal levels (-60dB) where
noise starts to cause errors. The frequency range is currently 20Hz to 50kHz, and aliasing
will occur above 50kHz (ie 60kHz will read as 40kHz).
2.9 Phase MeasurementPhase measurement between channels Azimuth check Head azimuth adjustment Tape machines
Phase (between channels) is also displayed on all level measurements. Again, it is
measured by timing zero-crossings and the use of software algorithms. Because the zerocrossing detectors for phase are at the front-end, phase readings are only useful for input
signals above -30dBu, and are most accurate around 0dBu. The phase display only
operates when a valid phase measurement has been made, it is blanked at low levels (or if
the frequency is not reasonably steady). The numerical indication reads ±180°, a negative
reading indicating that the R input lags the L input. Accuracy is greatest at low
frequencies, with some random variation occurring at frequencies around 10kHz and
above, but the reading will be found quite effective for setting tape azimuth. Input-output
phase can be measured by connecting the input to the equipment to the LA102’s L
channel and the output from it to the LA102’s R channel.
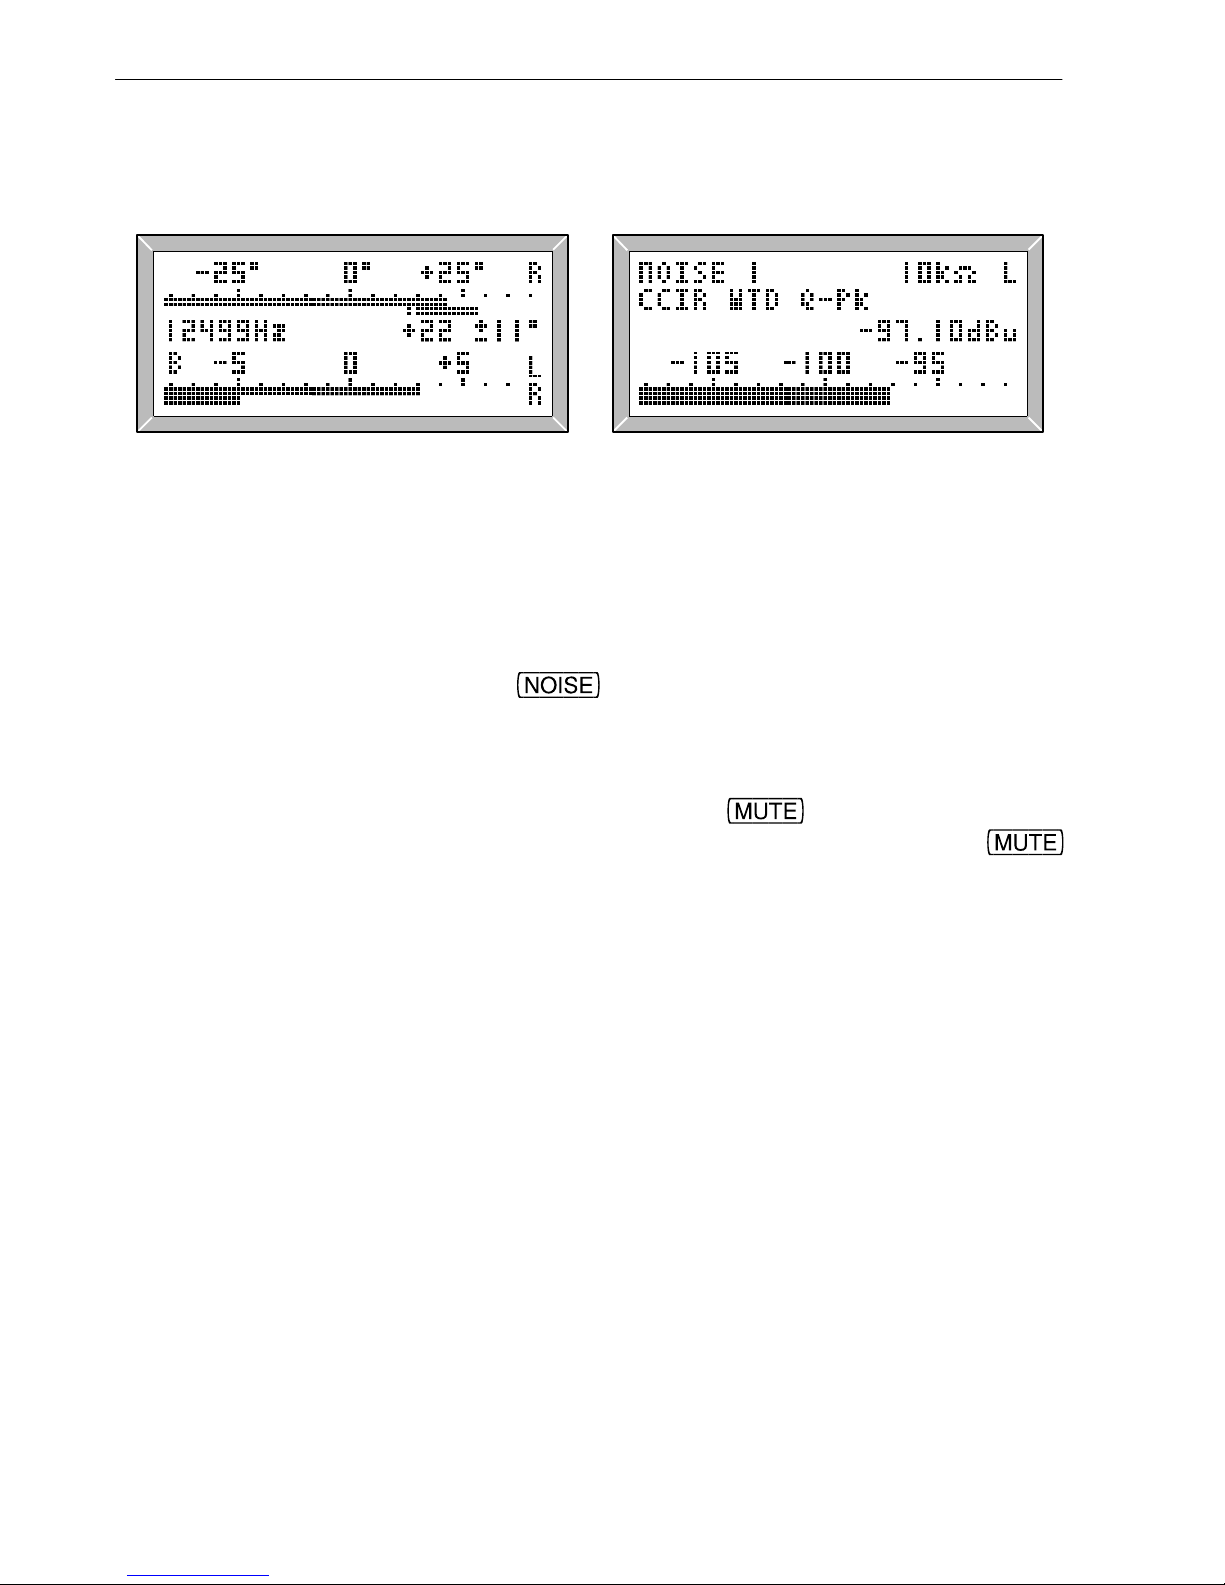
A graphical display of phase is provided on
(see fig. 2.9) and this
will be found ideal for tape head azimuth setting. The top bar graph shows mean phase
over a ±40° range. Immediately below that is a white mark indicating instantaneous
phase (to show phase jitter) surrounded by two bars showing peak phase deviation. The
bottom level bar graph is split into left and right channels (L above R as indicated) and
the LA102 measures and updates each channel alternately about 5 times a second, but
there is no numerical display of level. The digital readout shows frequency (measured on
the left channel), mean phase and peak phase deviation (from the mean). Autoranging
21
2. Manual Operation
Page 22
operates on the channel with the greatest level although manual range changing still
works normally.
Difference between the two channels
Fig. 2.9 Dual Level & Phase Bars Fig. 2.10 Noise Measurement
2.10 Noise MeasurementNoise measurement A weighted noise CCIR weighting filter CCIR468-3 Mute
Noise is normally measured using the widely accepted CCIR468-4 weighted
measurement (identical to CCIR468-1 to 3 but with different tolerances) which is
provided on noise option 1. Pressing
on the LA102 will measure noise using the
last noise option (see fig. 2.10, section 2.7 and table 2.6). The display shows the absolute
noise level in dBu (relative to 0.775V) unless a ‘test level’ has been set (section 2.6) in
which case the numerical reading is relative to test level (but the bar graph always shows
the absolute level). Try silencing the LA101 by pressing
and a reading of around
-97dB should be obtained, this being the residual input noise of the LA102. Press
again to restore the signal. The slowness of autoranging when changing to a higher range
results from the slow quasi-peak rectifier response. Option 2 gives unweighted
measurement to the CCIR468-4 standard and most other standards are incorporated (see
appendix G for graphs of CCIR and ‘A’ weighting curves).
Option 3 gives rms noise measurement (with 22Hz-22kHz bandwidth), equivalent to level
option 2 but, like all noise measurements, configured for low signal levels (an extra 20dB
of gain is selected, so the maximum level that can be measured is +8dBu on noise
compared with +28dBu on level). Options 6 and 7 provide CCIR weighted noise
measurement, using the average reading meter and the rms meter respectively. Option 8
gives ‘A’ weighted noise measurement, and option 9 gives CCIR ARM-2k (‘A’ weighted,
average reading meter, normalised to 2kHz). Option 10 provides a wide band,
2Hz-100kHz noise measurement using the quasi-peak rectifier. Options 12 and 13 are
similar to options 2 and 3 but use a 400Hz high pass filter, and options 14 and 15 provide
CCIR unweighted and weighted measurements using the PPM rectifier.
22
2. Manual Operation
Page 23
2.11 Rumble MeasurementMeasuring rumble Gramophone systems
Turntable rumble may be measured by selecting Noise Option 5 (weighted) or 4
(unweighted). Both rumble measurements have the same HF roll-off above 315Hz but
the weighted measurement also rolls off below 315Hz to give a measure of the subjective
intrusion of rumble (see appendix G). The unweighted measurement is flat down to very
low frequencies. To measure rumble, take a reading while playing the quiet grooves of a
special test disc, and then take a normal level measurement using a track cut to one of the
following reference levels: 315Hz 2.71cms
-1
rms one channel, 1kHz 5cms-1 rms one
channel, or 1kHz 10cms
-1
peak lateral. These are referred to in the various standards but
are in fact equivalent. The difference between the two readings is then the relative rumble
level. While it is also possible to set a test level and then read the relative rumble, visual
averaging may be needed, and this is easier using the bar graph. The LA102 uses VU
meter characteristics (with slow software averaging) for rumble measurement, as required
by IEC98, but later software may implement the very slow BS4852 characteristic which
gives exactly the same result but without the need to average visually. The unweighted
measurement differs slightly from all the standards which require a rather odd 10Hz
triangular roll-off. As the various standards then go on to require various additional rolloffs to be applied for the measurement (20Hz unspecified IEC, 31.5Hz 6dB/octave DIN,
none BS) the precise 10Hz specification seems to be pointless. The LA102 has been left
flat down to 2Hz as it is felt that in practice the LF limit for this measurement is set
entirely by the rumble filtering invariably included in the cartridge pre-amplifier.
2.12 Crosstalk MeasurementCrosstalk Automatic frequency selector
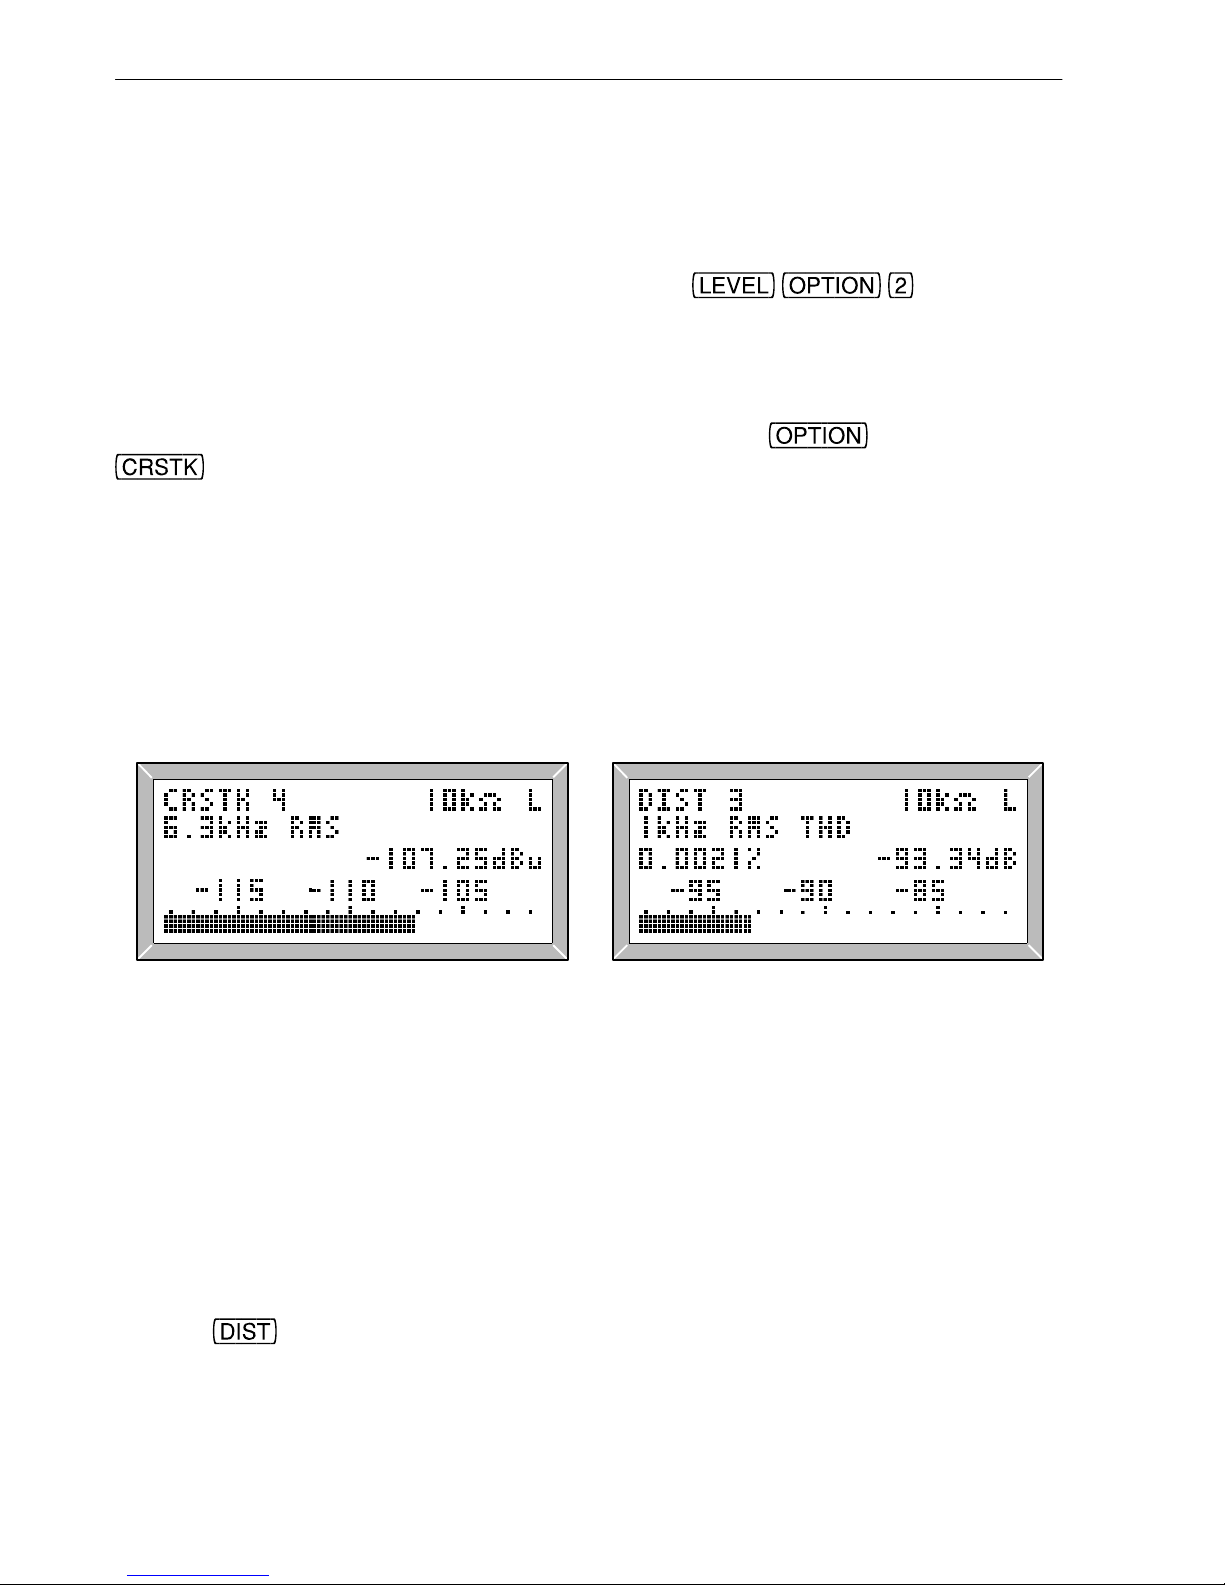
Pressing on the LA102 provides a narrow bandpass-filtered level measurement
which reduces the contribution from wideband noise by 10dB typically even when the
measured signal is close to or below the noise level (fig. 2.11). Measurement at six spot
frequencies is possible by selecting options 1 to 6, giving 100Hz, 315Hz, 1kHz, 6.3kHz,
10kHz and 40Hz respectively. Although other applications may arise where such filtered
measurement is useful, it is intended primarily for crosstalk measurement, either between
channels on a stereo signal or between unrelated channels in a mixer etc. Such
measurements are made by sending a tone on one channel and measuring on the other
channel, and on a stereo circuit this is simply achieved by appropriate use of the
keys on the two units. The reading obtained is absolute in dBu unless a ‘test level’ has
been set. It is NOT referred automatically to the level on the other channel as this may
not be the interfering channel in the case of mixer measurements. To refer the crosstalk
measurement to the level of the tone on the other channel, simply select level
measurement on the other channel and set a test level (eg press
.
Crosstalk options 7 and 8 permit some degree of noise reduction on crosstalk
measurement at a variety of frequencies. Option 7 introduces a 150Hz to 300Hz bandpass
23
2. Manual Operation
Page 24
filter (-3dB at 80Hz and 400Hz) which is particularly useful for 150Hz cuetone
breakthrough measurement on cartridge recorders. It reduces tape noise contribution by
typically 10dB. Option 8 covers 2kHz to 20kHz (-3dB frequencies are 1.8kHz to 21kHz)
and can be used for 8kHz cuetone measurement. Crosstalk option 9 (-3dB at 11kHz and
22kHz) is useful for 15kHz crosstalk. Crosstalk at other frequencies can be measured
using the 22Hz-22kHz level measurement facility (on
), but this will
also be measuring noise.
The crosstalk option is automatically selected if a suitable frequency (1kHz, 10kHz,
15kHz etc) is found on the other channel. In cases where there is no tone on the other
LA102 input the option may be set explicitly by pressing the
key after pressing
in the normal way (section 2.7). This manual selection may also be useful when
measuring crosstalk from noise or programme material. Note that a crosstalk reading
around 0dB usually indicates that the channels are transposed.
Note: The LA100 can measure crosstalk at levels of -100dB or lower and this is usually
good enough for all practical purposes. However, a few users have demanded even lower
residual crosstalk levels and Lindos has devised a way of reducing the LA102’s own
crosstalk with a simple board modification. Full details are given in Application Note 10
available from Lindos free on request.
Fig. 2.11 Crosstalk Measurement Fig. 2.12 Distortion Measurement
2.13 Distortion MeasurementDistortion measurement
The LA102 can measure harmonic distortion at 6 spot frequencies (as for crosstalk)
selected as options 1-6. Five of these are ‘total harmonic distortion’ measurements, (or
strictly THD+noise, band-limited 2nd harmonic to 22kHz) but the 315Hz measurement
reads third harmonic only. This involves a band pass filter centred on 945Hz which
greatly reduces the contribution of wideband noise, particularly from tape.
Pressing
results in a fully automatic measurement, the LA102 measures the input
frequency and selects one of the six notch filters, the fundamental being measured
immediately after the key is pressed and stored automatically as the reference level (fig.
2.12). The measurement is very fast, taking only about half a second to settle. The
24
2. Manual Operation
Page 25
relative level of distortion is displayed numerically, in dB and percent while the bar graph
shows the absolute level in dBu. Unlike most instruments the LA102 uses a multi-stage
bandstop-plus-highpass filter to reject the fundamental, and no nulling process is
involved. Very low distortion readings require a source of precise frequency, as provided
by the LA101 which is quartz synthesised, but the unusually wide notch permits readings
down to -60dB with a frequency tolerance of ±2%, giving complete immunity from the
effects of wow and flutter or speed drift when measuring off tape Auto-nulling, tracking
filters are often too slow to give accurate results.
The input frequency is constantly monitored and the filter is switched if it enters the valid
zone for a different one. Operation is only valid at six points: the filters do not track, they
just switch. Automatic operation only operates for tone levels above -29dB, but the
filters can be manually locked by selecting the option explicitly (section 2.7), and
unlocked by pressing
again (or by pressing twice). Re-normalisation of
the level occurs every time the filter changes and also if the other channel is selected with
the
key. If in doubt press to re-normalise.
Distortion option 6 (40Hz) has limited bandwidth to reduce noise and quantising effects
from the LA101, a response to the tenth harmonic (400Hz) is considered adequate here.
Distortion option 7 is experimental only. Option 8 is a 1kHz notch filter, like option 3,
but it passes frequencies below 1kHz. Similarly options 9 and 10 provide a 6.3kHz and a
10kHz notch filter and they too pass frequencies below the notch frequency.
There is growing popularity for distortion measurements using the CCIR468-4 weighting
filter and quasi-peak rectifier which, it is claimed, give better correlation with subjective
assessment and this is provided on distortion options 11-15. When CCIR weighted
distortion is being measured the automatic frequency selector will choose options 11-15
and
can be used to toggle quickly between options 1-5 and options 11-15.
IMPORTANT: Distortion measurement differs from the other measurements in storing
a reference level automatically and calculating a relative reading. As with all relative
readings only the numerical display is relative; the bar graph ALWAYS shows the
absolute level in dBu or dBV. This is partly for ease of implementation, but it can also be
useful. Remember to press
again (or press twice) for correct relative
readings if the signal level changes, as the level is only stored once.
2.14 Wow and Flutter MeasurementWow & flutter W&F Measurement
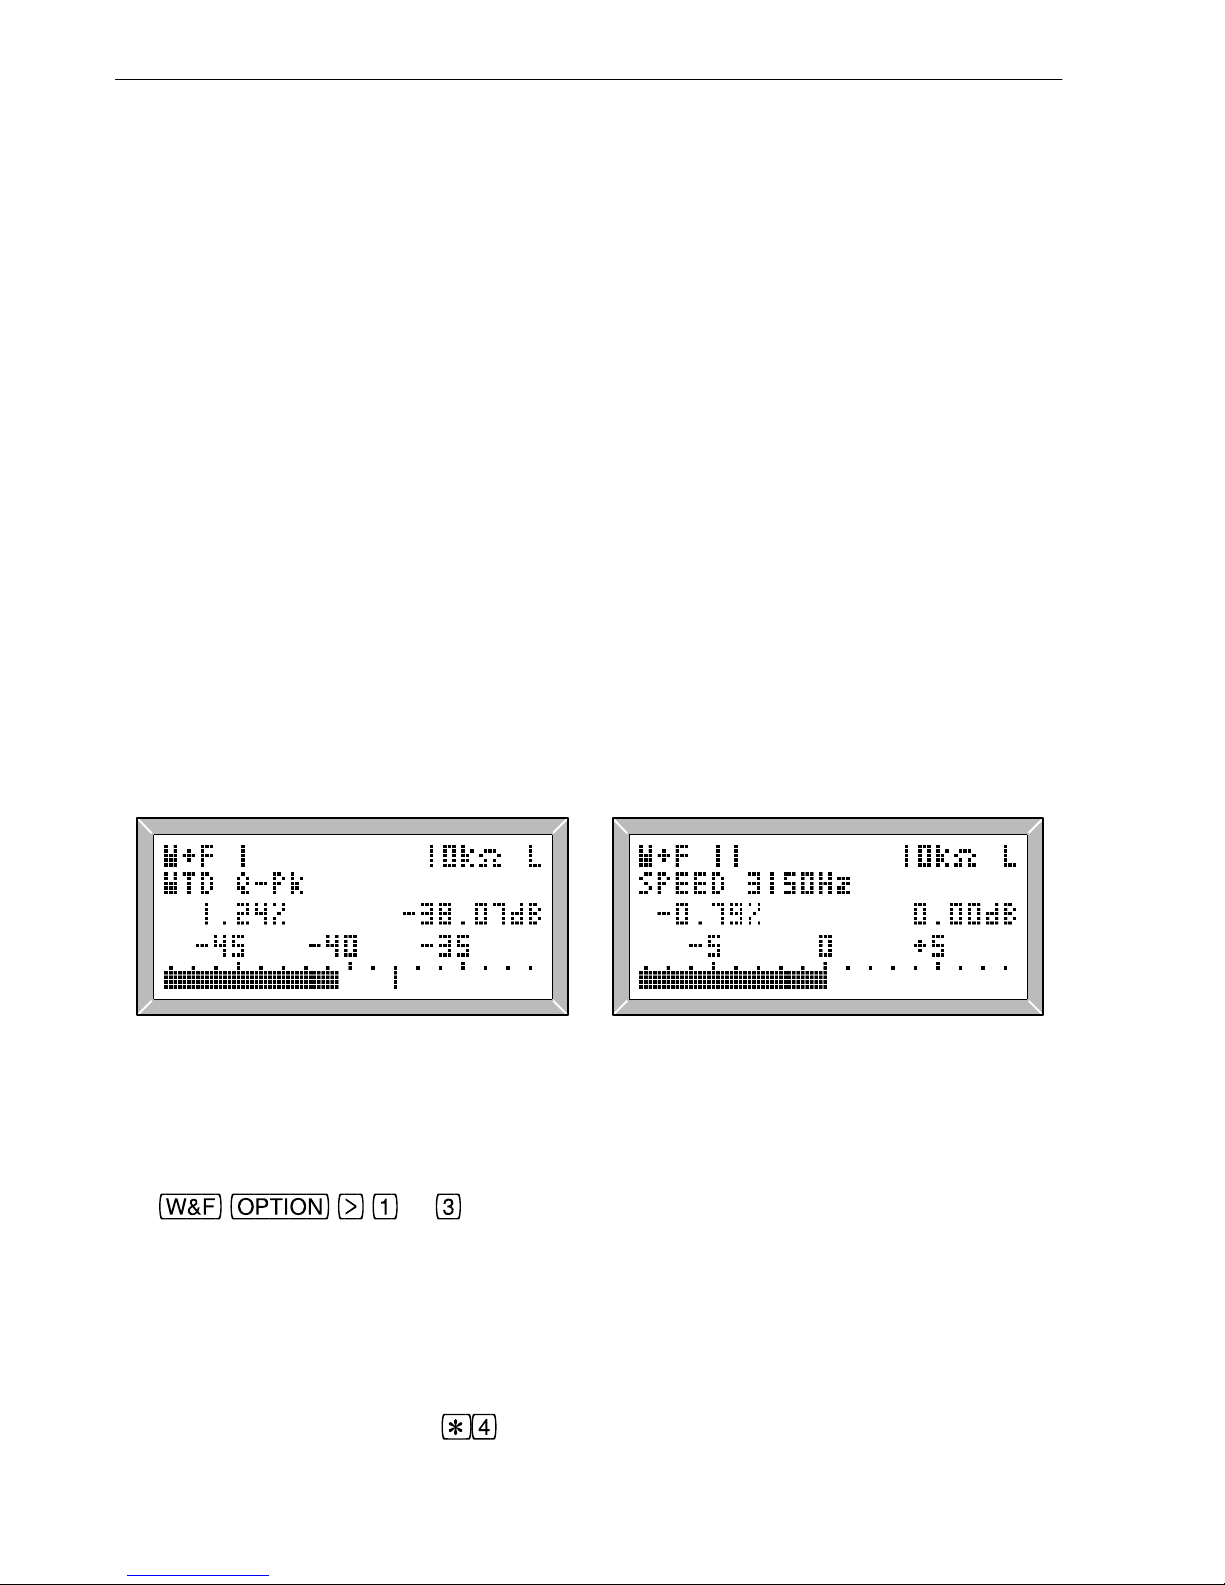
Wow and flutter is measured by replaying a tape that has been recorded with a 3kHz or
3.15kHz tone (at 0VU) and pressing
(fig. 2.13). Option 1 gives a weighted quasi-
peak measurement to the universally accepted IEC386 standard, and option 2 gives the
corresponding unweighted measurement. As with other measurements this one is
autoranging, and settling may take a few seconds. The result can be read on the bar graph
or digital readout (fig 2.13) in dB, a perfectly valid form of measurement which we
25
2. Manual Operation
Page 26
suggest is much more manageable than the usual ‘point nought five per cent’ (-66dB) and
should become established practice; as is tending to happen with distortion figures.
However, for the less daring, a digital percentage conversion is also displayed! A signal
level of -20 to +10dB is recommended for flutter measurement, but the unit does in fact
constantly monitor the signal level and frequency and display BAD TONE if either goes
out of limits. W&F can only be measured on the left channel which is automatically
selected. The measurement complies with IEC386, DIN45507 and BS4847-1972.
Although the ideal might be to use a perfect test tape for flutter measurement, it is usually
more practical to make record-replay measurements, a 3.15kHz (0dBu) tone being first
recorded on the same machine. The level of W&F on tape recorded on a modern
domestic or professional machine is often as good as the W&F present on most test tapes
A point to watch for is cancellation of slow rhythmical variations if they happen to
synchronise between record and replay. Stopping and starting the tape a few times should
show up such effects. Simultaneous record and replay should not be attempted as this
may also cause cancellation. Listening to unweighted flutter components can give an
interesting indication of ‘scrape flutter’.
Flutter measurement
W&F options 6 and 7 provide weighted and unweighted wow & flutter using an rms
rectifier, while the other W&F options are used for miscellaneous measurements
(described below).
Fig. 2.13 Wow & Flutter Fig. 2.14 Speed Measurement
2.15 Speed Measurement
Tape speed can be measured using a speed reference tape. Wow and flutter options 11 to
13 (
to ) provide speed measurement using 3150Hz, 3125Hz or
3kHz reference tones respectively (fig. 2.14). 3150Hz is the most common frequency, but
3125Hz must be used if the speed tape was recorded using the LA101 which cannot
generate 3150Hz (see section 2.2). The speed error is displayed as a percentage, accurate
to ±0.04%, and a
BAD TONE message is displayed if the frequency is out of range. The
level bar graph and numerical dB reading indicate the measured level (using an rms
rectifier). Unfortunately, it is not possible to measure speed at the same time as
measuring W&F, but note that
will quickly toggle between option 1 and option 11.
26
2. Manual Operation
Page 27
2.16 Difference Frequency Distortion Measurement
Several other miscellaneous measurements are provided on the key, and one of
these is 2nd order difference frequency distortion. This is a form of intermodulation
distortion (IMD) similar to the CCIF IMD measurement which has now been superseded
by the IEC268-3 standard. The term difference frequency distortion is used to distinguish
it from other forms of IMD which are now known as modulation distortion (previously
called SMPTE IMD), dynamic intermodulation distortion (DIM) and total difference
frequency distortion (based on the Thiele method).
Thiele IMD measurement
To measure difference frequency distortion, a test signal is used comprising two
frequencies, f
1
and f2, with a difference frequency of 70Hz. Each tone should have an
amplitude of -6dB relative to the nominal test level, so the rms value of the test signal will
be -3dB and the peak to peak amplitude of the test signal will be the same as that of a 0dB
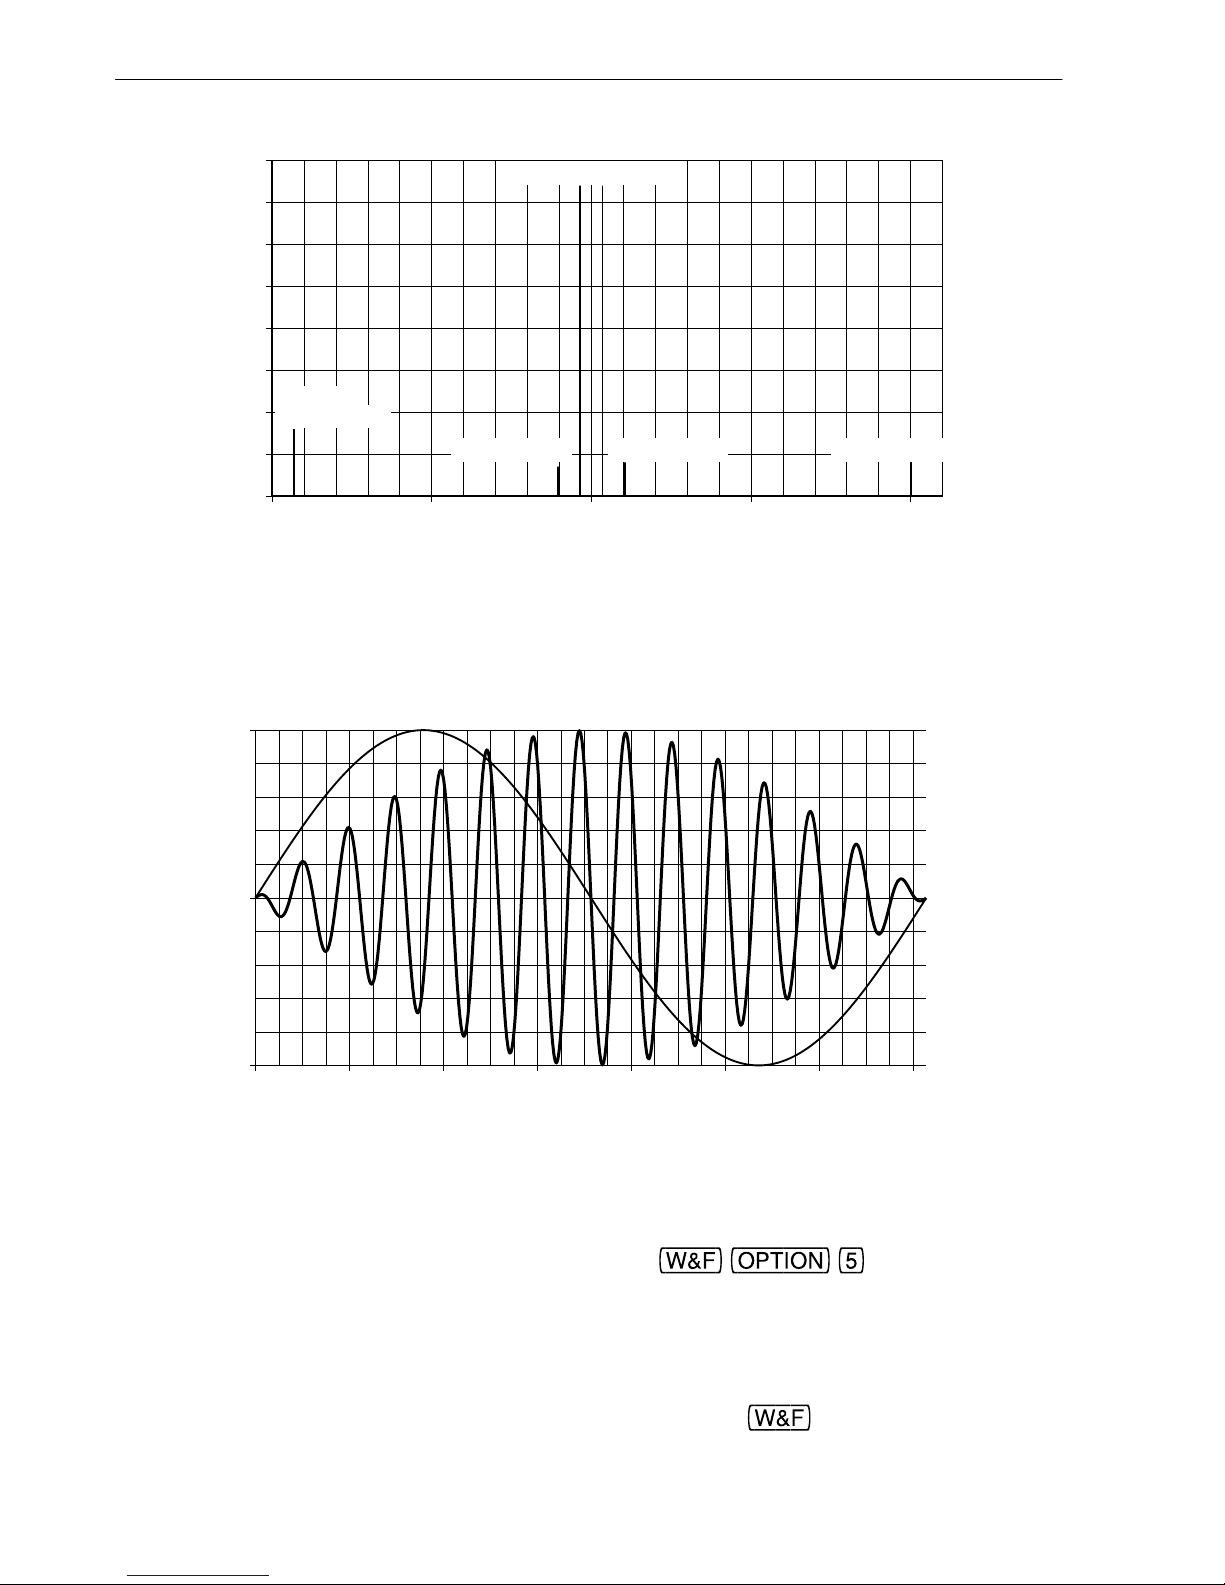
sine wave. The typical intermodulation distortion products for this test signal are shown
in fig. 2.15.
The level of the 2nd order difference frequency distortion at the system’s output is
measured using a 70Hz narrow bandwidth filter. In accordance with the IEC268-3
standard, the distortion is referred to a reference level which is twice the amplitude of
the f
2
tone. This is different from many older IMD measurements, including that
provided in earlier L102 software (prior to V5.6), which simply measured the distortion
level relative to rms level of the double tone. This new IEC268 method will therefore
give a figure 3dB lower than the old IMD measurement. In practice the LA102 cannot
measure the level of the f
2
tone by itself as it is so close to f1, so it actually measures the
rms level and assumes that the f
2
tone is 3dB below that (hence the reference level is 3dB
above it).
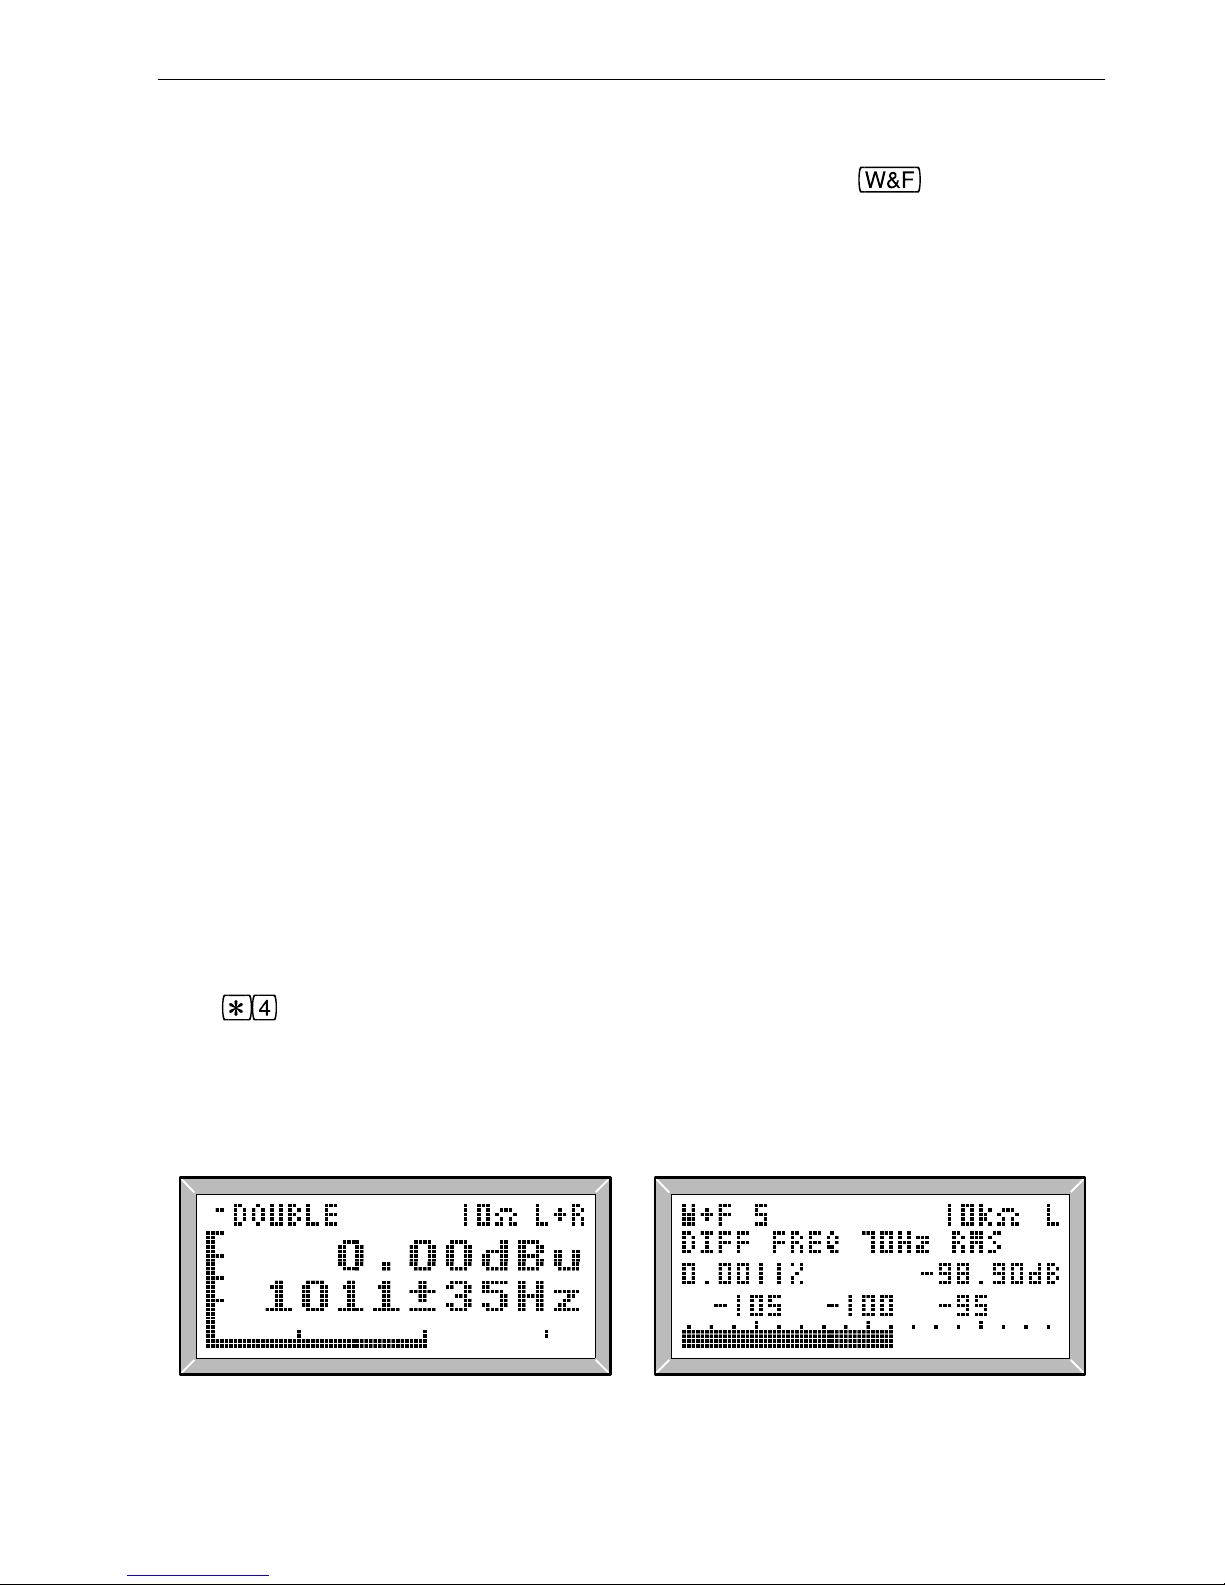
The LA101 can generate the necessary double tone, but only around 1kHz (see fig. 2.16).
Press
on the LA101 until the display shows DOUBLE (see fig. 2.17) and set 0dB.
The LA101 actually generates 976.56Hz and 1046.3Hz (69.754Hz separation) with each
tone having an rms level of -6dB relative to the displayed output level, and the resulting
waveform having an rms level of -3dB, as required by the standard. The peak to peak
level is therefore the same as that of a 0dB sine wave.
Fig. 2.17 Generating a Double Tone Fig. 2.18 Difference Freq. Distortion
27
2. Manual Operation
Page 28
To measure difference frequency distortion, press . The LA102 will
quickly measure the rms level of the double tone and assume that each component is 3dB
below this level. The 70Hz bandpass filter is then used to measure the level of the
difference frequency distortion product. This absolute level (in dBu or dBV) is shown on
the bar graph, while the normalised result (relative to the reference level, as explained
above) is shown numerically (see fig. 2.18). Note that the
key must be pressed in
28
2. Manual Operation
0 500 1000 1500 2000
-80
-70
-60
-50
-40
-30
-20
-10
0
Frequency/Hz
Level/dB
Test Signal (f1 and f2)
f2-f1 2nd
order product
f1+f2 product2f1-f2 product 2f2-f1 product
Fig. 2.15 Typical Intermodulation Products from a Double Tone with
1kHz Centre Frequency, and 70Hz Separation (Nominally)
0 2 4 6 8 10 12 14
-1
0
1
Double Tone Waveform Compared with 70Hz Sine Wave
Time/ms
Output V
Fig. 2.16 LA101 Double tone Waveform compared with 70Hz Sine Wave
Page 29

the presence of the double tone, and used to re-normalise the reading if the level changes
(as for THD measurement).
Another possible signal source is a test CD such as the the HiFi News test disc III. This
disc contains double tones with centre frequencies of 1kHz, 5kHz, 10kHz and 15kHz
(nominally), as well as a digitally generated Lindos test sequence. Residual readings of
below -90dB can generally be expected. The Philips test sample 3 disc (410 055-2,
SBC421) also contains suitable double tones, together with a double tone sweep.
Centre frequency
Difference frequency distortion tests are normally carried out using a test signal having a
peak to peak amplitude equivalent to that of a sine wave of the specified test level, and on
the test CDs mentioned the level of the double tones has been so adjusted. Any gain
adjustments to the system under test should therefore be made using a sine wave from the
disc, not the twin tone. Measurements will be valid above about 1kHz, below this the
measuring set will not adequately reject the double tone signal itself.
Note that only second order difference frequency distortion, resulting from an
asymmetrical transfer characteristic, is detected by this method. Many devices, such as
tape recorders, give rise predominantly to third order components. These are close to the
signal and more difficult to measure.
2.17 Quantising Distortion (QD) Measurement
The LA100 system measures quantising distortion on a 40Hz tone by notching out the
fundamental, and rejecting low harmonics with a 400Hz high-pass filter to leave only
high frequency components, which are then measured in one of two ways. W&F option 4
reads rms with 22kHz bandwidth, option 3 uses CCIR weighting and quasi-peak
detection. 40Hz was chosen to permit use with the Philips Test CD mentioned above,
which has 41Hz tones at 0, -24 and -30dB. Distortion components on the LA101 produce
a residual reading of -74dB, but this need not be a limitation as QD measurements are
most relevant at low signal level where they will usually be much worse than this. Like
THD measurement, the LA102 measures the level of the fundamental when this
measurement is selected. The numerical readout indicates the level of the distortion,
relative to the level of the fundamental, while the bar graph indicates the absolute level
being measured. Remember to press the
key (or the key) to re-measure
the level of the fundamental if it changes. Note that this measurement need not be limited
to digital systems and has been used to measure modulation noise on tape. It is also a
useful measure of low frequency rattles and turbulence on loudspeakers.
Loudspeaker testing
2.18 Frequency Intermodulation (FIM) Measurement
FIM or Frequency Intermodulation is a measurement of the degree of frequency
modulation of a 3kHz tone by a 300Hz tone, and is normally relevant to gramophone
systems where variations in the vertical tracking angle of cartridges results in a
29
2. Manual Operation
Page 30
component of motion along the groove equivalent to flutter. This can be measured using
W&F option 8 which selects a flutter measurement with special filtering to read only
flutter components around 300Hz (3.15kHz and 315Hz tones can also be used). The
measurement is normally made using a test disc to DIN45542 and complies with the
current ITC (IBA) requirement (DIN45411).
2.19 StandardsCCIR weighting filter
The measuring options meet appropriate world standards: Noise CCIR468-4 weighted
and unweighted (supersedes 468-1, 2 and 3); Rumble IEC98, DIN45539, BS4852 (except
slow response); ‘A’ weighting IEC179; VU response ANSI; PPM response IEC268-10
type 2, BS4297-1968, BBC ED1477 (except scale details); W&F IEC386, DIN45507,
CCIR409-3, BS4847; FIM DIN45411; 2nd order difference frequency distortion IEC2683 (note 70Hz used in place of 80Hz). See appendix G for frequency response graphs.
2.20 400Hz High Pass Filter
toggles a 400Hz high pass filter which is useful to ensure that measurements are
not being affected by mains hum. It will operate on level options 1 to 5 and noise options
2 and 3, but not on any other measurement.
HPF is displayed briefly to indicate the
selection, or
CAN'T if the filter cannot be switched in for the measurement (crosstalk for
example).
FLAT is displayed on return to a flat response.
Note for experienced users: The 400Hz high pass filter is actually provided as level
options 11 to 15 and noise options 12 and 13 (see table 2.2) and can also be selected by
pressing
(press to return to options 1 to 5). merely
provides a quick way of toggling between options 1 to 5 and 11 to 15 (see section 2.7).
2.21 Impedance & Impedance Correction (ZC)Impedance correction jack sockets
cycles round impedances on both units. The LA102 provides 10k or 600 inputs
as displayed, at both the front PO jack sockets, and the rear XLR sockets (which are
connected in parallel). The LA101 is more complex, as only the front jack sockets
change impedance (75
or 600 ), the rear XLR sockets are always 10 . The XLR
connectors are therefore optimised for studio equipment testing, in line with the standard
practise of feeding high impedance inputs from a low impedance output, while the jacks
are optimised for 600
line tests.
The letters ‘
ZC’ which appear when 75 or 600 outputs are selected signify ‘Z-
correction’, meaning that the open circuit level has been boosted to give the specified
level into a 600
load. Pressing will toggle between uncorrected and ZC mode as
shown at the top centre of the display (this setting is stored for each impedance even when
the unit is turned off). With the level uncorrected (ie no ZC displayed) the LA101
displays the open circuit output voltage in dB(0.775V), indicated by the symbol dBu. ZC
30
2. Manual Operation
Page 31
corrects the output to give the displayed power in dB(1mW), indicated by dBm, into a
600
load for any selected output impedance.
Note that 10
output impedance should always be selected on the LA101 when the rear
XLR sockets are being used, and that 75
or 600 should be selected when the front jack
sockets are being used.
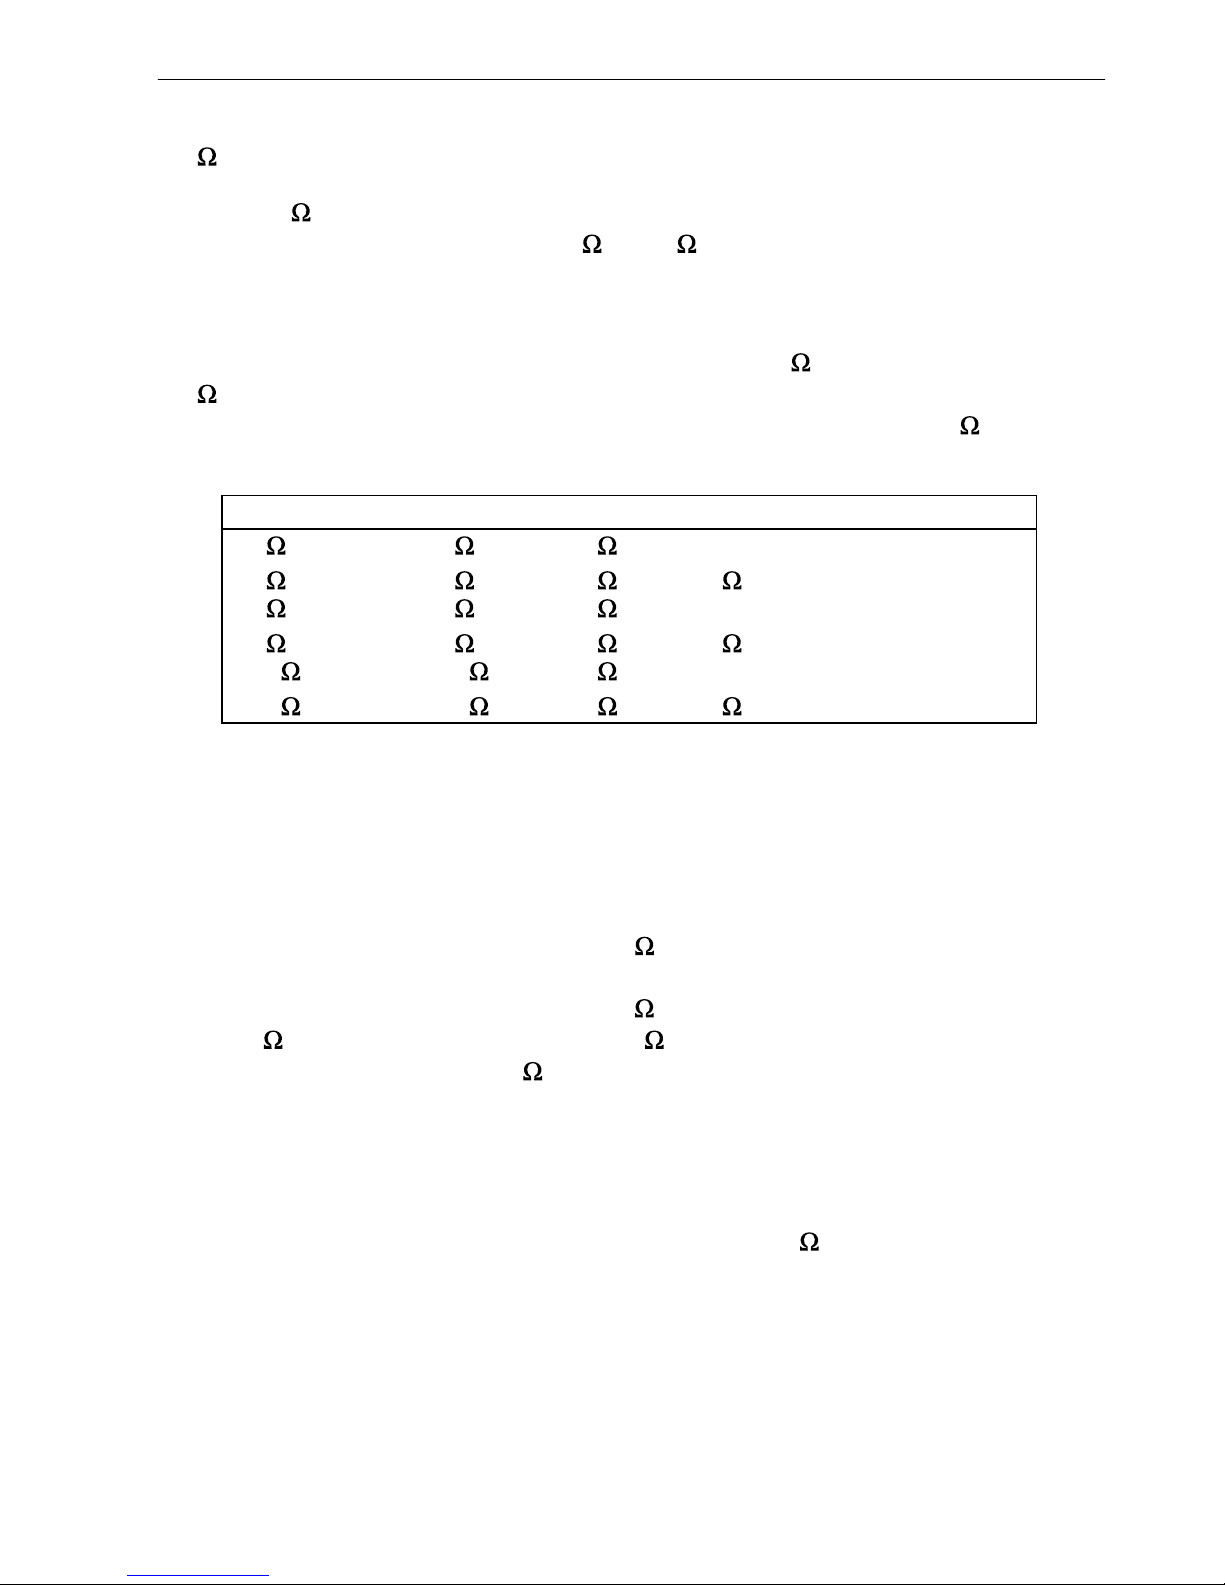
Table 2.19 summarises the different settings available, for various source and load
impedances. Note that it is quite acceptable to feed a 600
load from the LA101 with
600
output impedance and no ZC providing it is understood that the displayed output
level refers to the unloaded open circuit output level. Connecting the 600
output will
cause a 6.02dB drop which the LA101 will correct if the ZC mode is selected.
Display Front jacks Rear XLRs Load Z Output correction
10 75 10 high 0.00dB
10 ZC 75
*
10 600 +6.02dB
75 75 10 high 0.00dB
75 ZC 75 10
*
600 +1.02dB
600 600 10 high 0.00dB
600 ZC 600 10
*
600 +6.02dB
* Note that it is meaningless to use these conditions, because the LA101 is trying to correct for a different
source impedance to that being used.
Table 2.19 Impedance Correction Modes
It is important that this feature is used correctly. When ZC is selected the displayed
power level is only meaningful when a 600
load impedance is connected. Using the
wrong sockets for the selected impedance may be confusing; for example, the output from
the XLRs will increase by around 6dB if 600
ZC is selected, though the impedance will
still be 10
. Using the jack sockets in the 10 setting for equipment tests is permissible
though: the impedance will be 75
, but the lack of Z-correction ensures correct output
level provided a high impedance input is being fed.
2.22 dBu, dBV, Volts and Power MeasurementVolts
The LA101 normally displays the absolute level being generated in dB relative to 0.775V,
or dB(0.775V), indicated by the symbol dBu. When a 600
load is connected and ZC
turned on, the displayed units change to dBm to show that the level is the power into the
load. However, configuration U allows other units to be used (U0 being the default).
Setting U1 causes the LA101 to work in dBV units where 0dBV is 1V, or +2.21dBu.
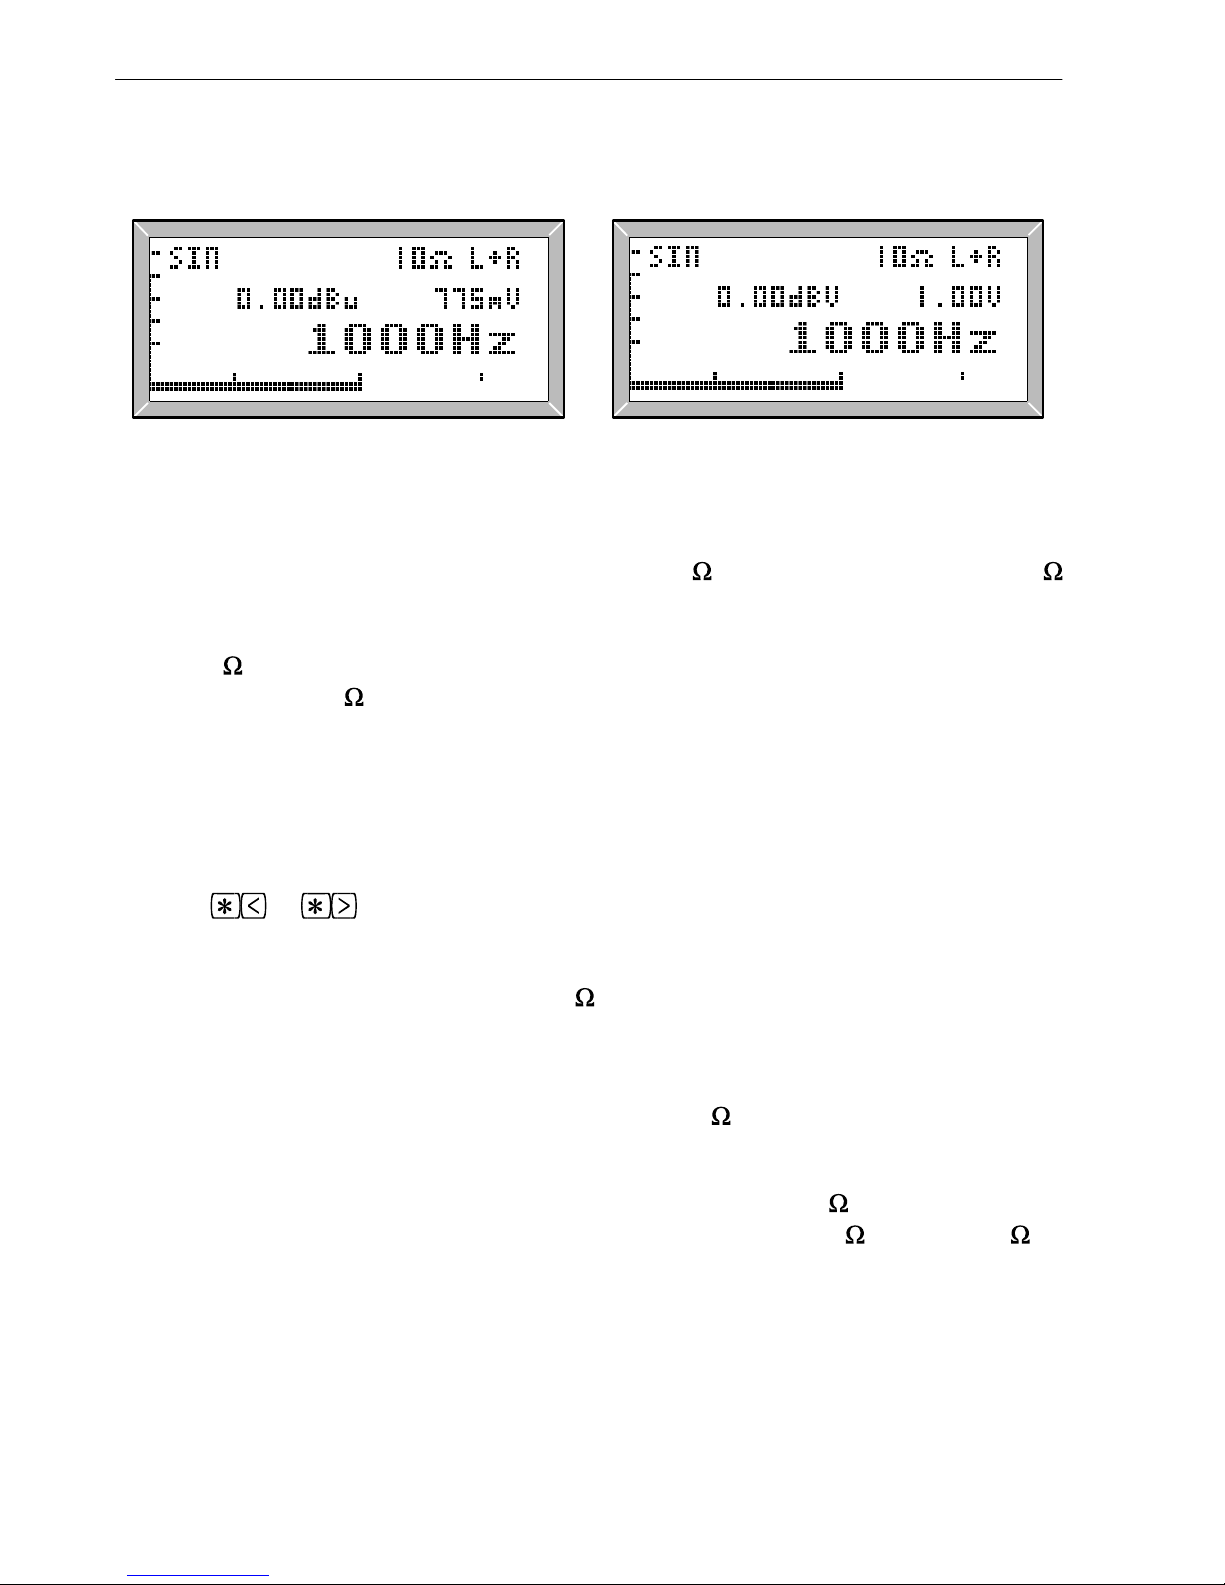
Setting U2 displays dBu and Volts (see fig 2.20), while setting U3 displays dBV and
Volts (note that the up/down keys still change the level in 1 or 0.01dB steps, they cannot
be made to change the level in voltage steps). The voltage displayed represents the
31
2. Manual Operation
Page 32
absolute output level in Volts (after taking the test level into consideration, but before the
weightings and impedance corrections are added).
Fig. 2.20 dBu and Volts Fig. 2.21 dBV and Volts
The LA102 normally displays the measured voltage in dB relative to 0.775V, or
dB(0.775V), indicated by the symbol dBu, with 10k
input impedance. When 600
input impedance is selected this changes to power, measured in dB(1mW), indicated by
the symbol dBm. (Note that this is equivalent to dBu, since a voltage of 0dBu (0.775V)
into a 600
load gives a power of 1mW, which is 0dBm; the ‘dBm’ units merely imply
the existence of a 600
load).
Level units
Relative measurements such as distortion, W&F and any measurement with a Test Level
set are always displayed in dB regardless of the units selected. The bar graph is always
labelled in absolute dBu except when dBV units are selected when it shows absolute
dBV.
bar graph units
Pressing or on the LA102 gives cyclic access to the other units (see fig. 2.21):
dBu or dBm (depending on input impedance, as described above)
dBV (relative to 1V, ie 0dBV = +2.21dBu)
Watts (power equivalent into 8
)
Volts (V, mV or µV)
Configuration U determines the units used after switch-on or reset: U0 selects dBu/dBm
(the default), U1 selects dBV, U2 selects Watts (into 8
), U3 selects Volts. Test level
segment results (T and V) are also displayed in the selected units.
When measuring power in Watts, the LA102 does not provide an 8
load which must be
provided externally. Configuration W provides a choice of ‘W into 8
’ or ‘W into 8 V/
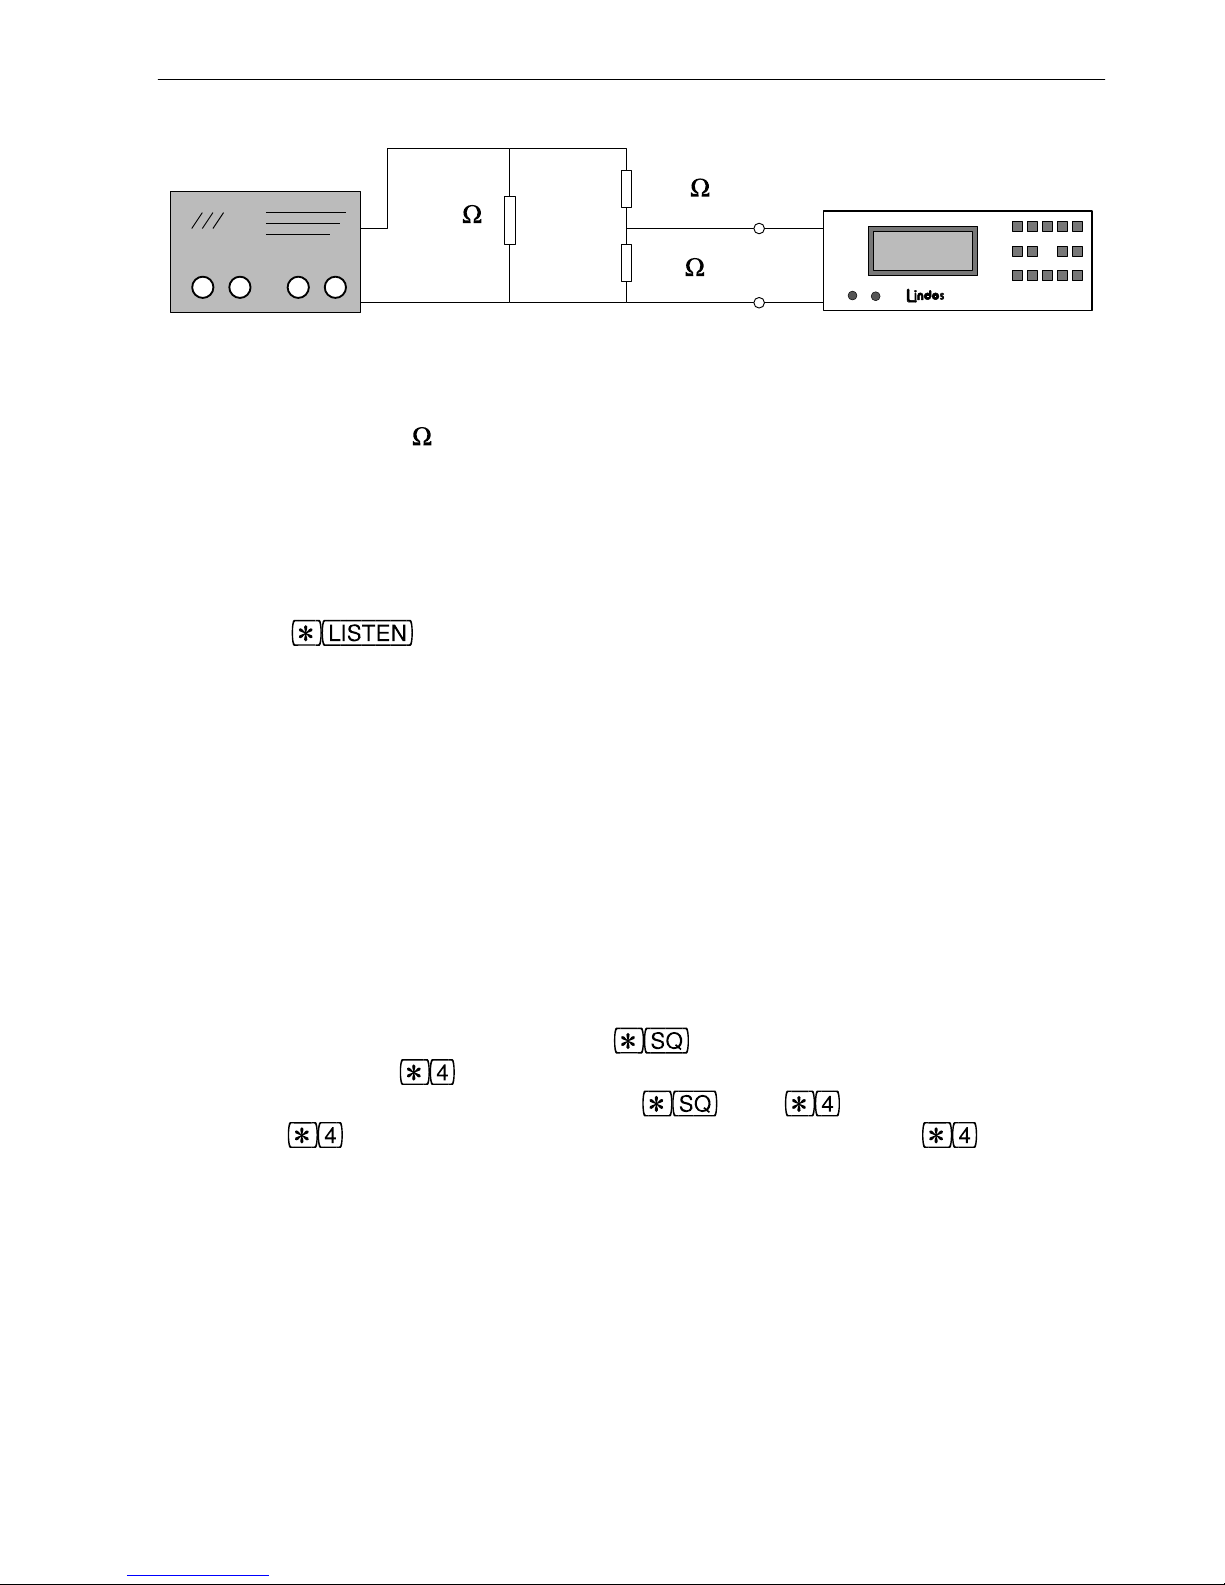
10’. The former measures from 8pW to 47W. The latter assumes an external divide-byten voltage attenuator as shown in fig. 2.22 for measurement up to 4700W.
32
2. Manual Operation
Page 33
load
8
100
900
Dummy
load
Power
Amplifier
Divide
by 10
100W
LA102 AUDIO MEASURING SET
LA102 Measuring Set
(configuration W2 set)
100W
Fig. 2.22 Using an 8 Dummy Load and Attenuator for Power Measurement
2.23 Printing the Displayed ValuesPrinting displayed values in manual mode Printing
The LA102 can print the measured frequency, level and phase which are displayed on the
LCD. Press
, and a single line will be printed, for example:
Level 1 2-100kHz RMS L 0.01dB 1001.6Hz 0d
This facility should be useful when testing equipment manually where results are
normally written down by hand. It is possible to print results for any measurement, so a
simple test sheet showing level, noise, crosstalk, distortion, W&F and speed can be
produced very easily. A printer must be connected and set up correctly (see chapter 8),
otherwise a
NO HANDSHAKE message will be displayed. For more sophisticated results
printouts sequence mode should be used (see chapter 3).
2.24 Output WaveformOutput waveform Mute
The LA101 generates a sine wave output by default (indicated by SIN), because this is
most useful for audio testing. Pressing
will toggle between sine and square
waves, while pressing
will cycle through DOUBLE, DC0, DC+, DC-, TRI, SAW+
and SAW- waveforms (fig. 2.23). Pressing
after will restore sine waves,
and another
will select the last waveform which was selected with (this allows
quick switching between sine and double tone waveforms, for example).
DC0 is for noise test purposes; the internal oscillator is stopped and the input to its digital
to analogue converter (DAC) is set to zero. This is different from MUTE because most of
the LA101 circuits are still connected to the output, and the noise level is therefore higher.
It is used automatically before tone bursts so that the signal can be turned on very quickly
at a zero-crossing, without any glitches caused by relay switching.
DC+ and DC- generate positive and negative DC voltages at the displayed level (ie the
same voltage as a positive or negative square wave half-cycle). Square waves are
33
2. Manual Operation
Page 34
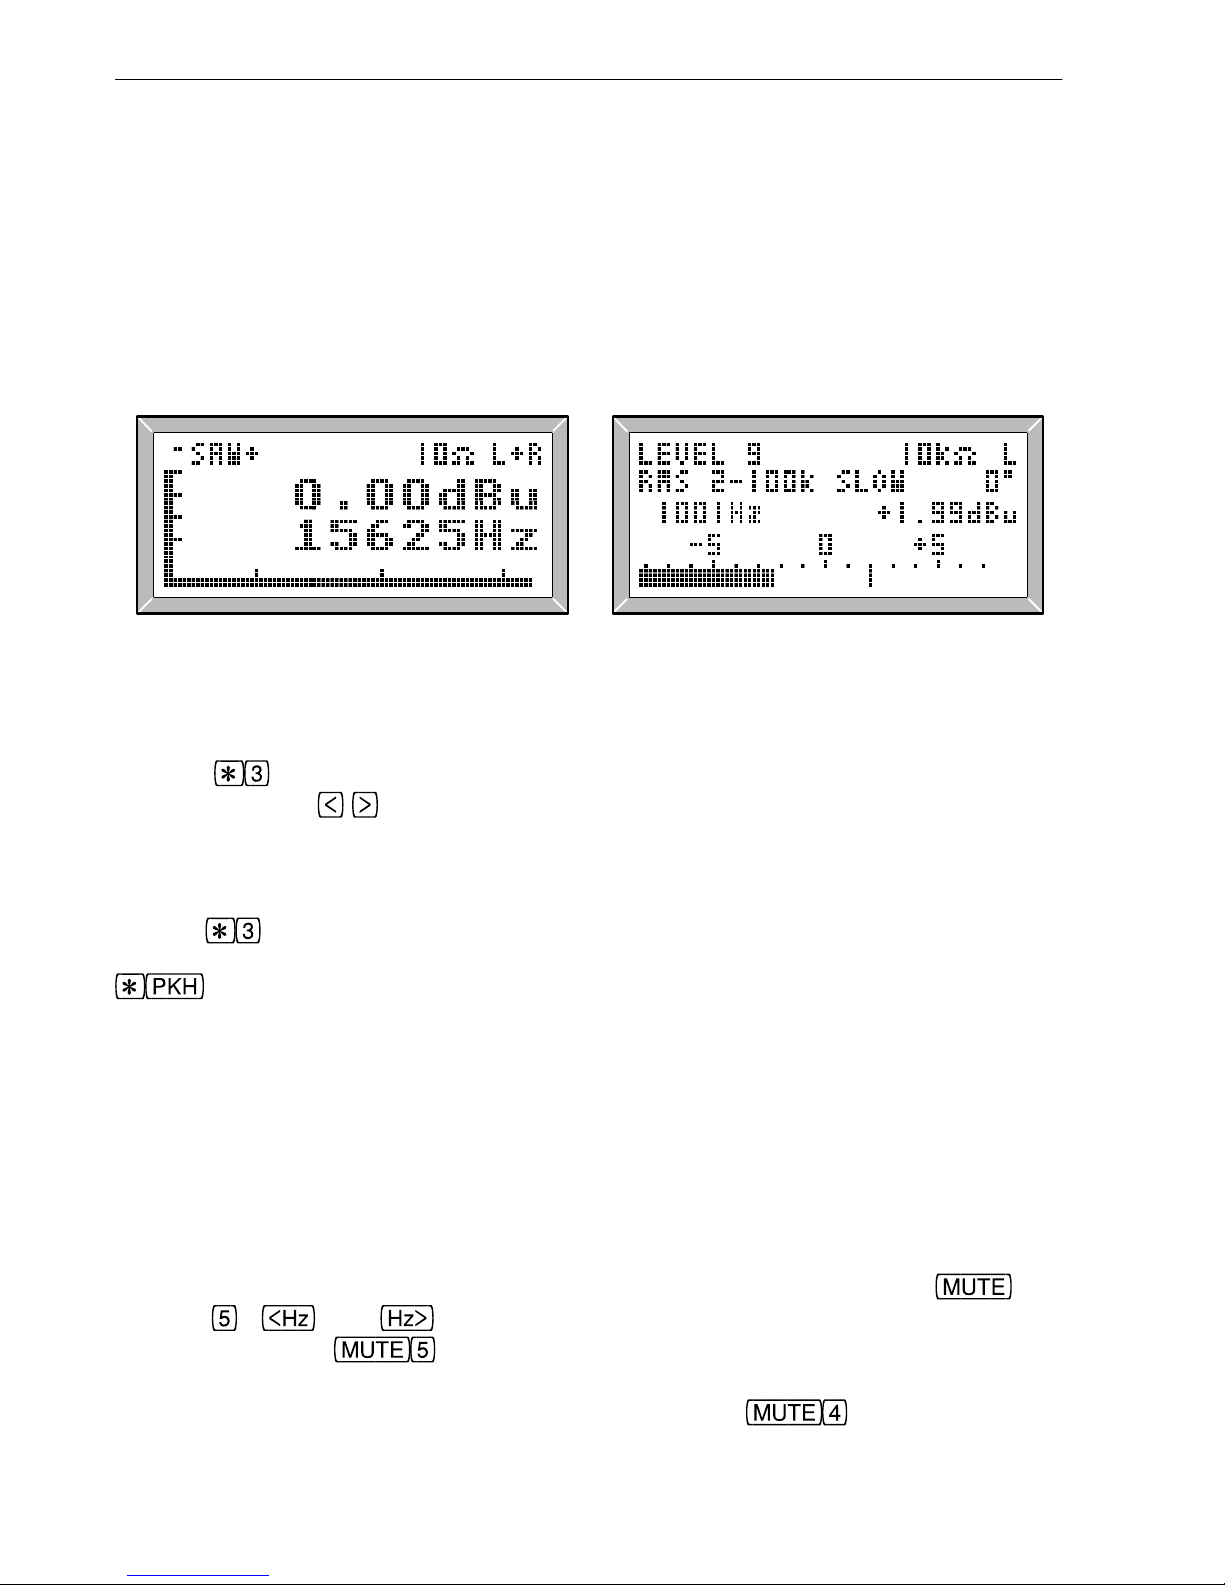
generated with the same rms level as sine waves (ie less peak to peak amplitude). The
peak to peak amplitude of sawtooth and triangular waveforms is the same as that for
sinusoids at the same level setting (so the rms level is 1.7dB lower). SAW+ and SAWprovide sawtooth waveforms with positive and negative going slopes.
DOUBLE provides a double tone with 1011Hz centre frequency and 70Hz separation for
difference frequency distortion measurement (see section 2.16). No other double tone
frequencies can be generated and the bar graph shows the frequency which will be
generated when another waveform is selected.
Fig. 2.23 Sawtooth Waveforms Fig. 2.24 Peak Hold
2.25 Miscellaneous FeaturesInhibit autoranging Continuity detection Range setting Level range setting
Pressing on the LA102 inhibits autoranging and sets a fixed range which can be
changed using the
range keys. Selecting a new function changes the range to the
range last used for the newly selected function, and this can be useful on test tapes, where
autoranging on verbal announcements can be troublesome. Default values (after memory
clear) are 0dB, -30, -30, -30, -60dB for Level through to W&F. Autoranging returns on
the next
or reset. Manual range setting
toggles a peak hold function on the LA102. The numerical display is held
briefly and a marker appears on the bar graph (fig. 2.24). This is always switched in
automatically on W&F.
Sometimes, on noisy or low frequency signals the rms bar graph can jump around making
it difficult to read. Level option 9 overcomes this problem by providing a slow average of
the rms rectifier which is much more stable (although slower at settling), even down to
10Hz. The averaging is performed in software using a first order digital filter.
The LA101 can generate 22.5kHz sine waves for pilot tone continuity detectors. The
frequency actually generated is 22.4905kHz and is selected by holding
and
pressing
. and keys can be used to go to adjacent frequencies (22321Hz
and 22727Hz), but
must be used to return to this special frequency. This
frequency can also be used in ! tone segment definitions (section 4.16) and from remote
mode (see section 9.11). Also provided is 19.003kHz on
for FM stereo pilot
34
2. Manual Operation
Page 35
tone testing.
2.26 LA101 Weighting CurvesCCIR468 inverse Oscillator weighting User weighting curves Pre-emphasis
on the LA101 cycles round weighting curves, currently RIAA-inverse, 50µs pre-
emphasis, CCIR468-inverse and CCITT O.41 psophometric inverse weighting for testing
disc pre-amps, FM transmitter systems and noise weighting filters. All levels are
generated digitally with high accuracy from look-up tables which are currently limited to
third-octave frequencies. The level can be adjusted using the
keys as usual,
and the weighting for the current frequency will be added to the displayed level to
calculate the actual output level. Excessive output excursions will cause the output level
to ‘slide’ to a value that can be managed. The level can be reduced when testing RIAA
phono inputs by setting a level of, say, -60dB; but it is sometimes better to use a potential
divider close to the input, as this also reduces stray pickup. A test with 50k
series
resistance is often also useful in showing up input impedance variations. Test levels are
still operative with weightings.
In addition to the existing weighting curves provided in the LA101, user weighting curves
can be entered. Pressing
in manual mode will normally cycle through the available
weighting curves (but see below):
W1-W5 User weighting curves
W6 RIAA inverse (disc recording characteristic)
W7 CCIR 468-3 inverse
W8 O.41 CCITT inverse
W9 50µs pre-emphasis
For quick access to a particular weighting curve configuration W can be set to one of the
above weighting numbers to make
toggle between that weighting and the flat
unweighted state. Setting configuration W0 (the default) will make
cycle through
all of the defined weightings. Only third octave frequencies can be used when a
weighting curve is in use and the weighting is applied equally to both left and right
channels.
2.27 User Weighting CurvesDe-emphasis Define weighting curve Inverse response Pre-emphasis
User weighting curves are useful for testing filters using the inverse filter response which
should result in a flat overall response. They are also useful for making test tapes where
the inverse of the record response is entered as a weighting curve to obtain a flat response
recorded on tape. User weighting curves, like pre-programmed weighting curves, can be
used to generate weighted frequency sweeps − see section 3.19.
To define one of the user weighting curves in the LA101 hold
and press and
then enter the weighting number (1 to 5), see figs. 2.25 and 2.26.
35
2. Manual Operation
Page 36
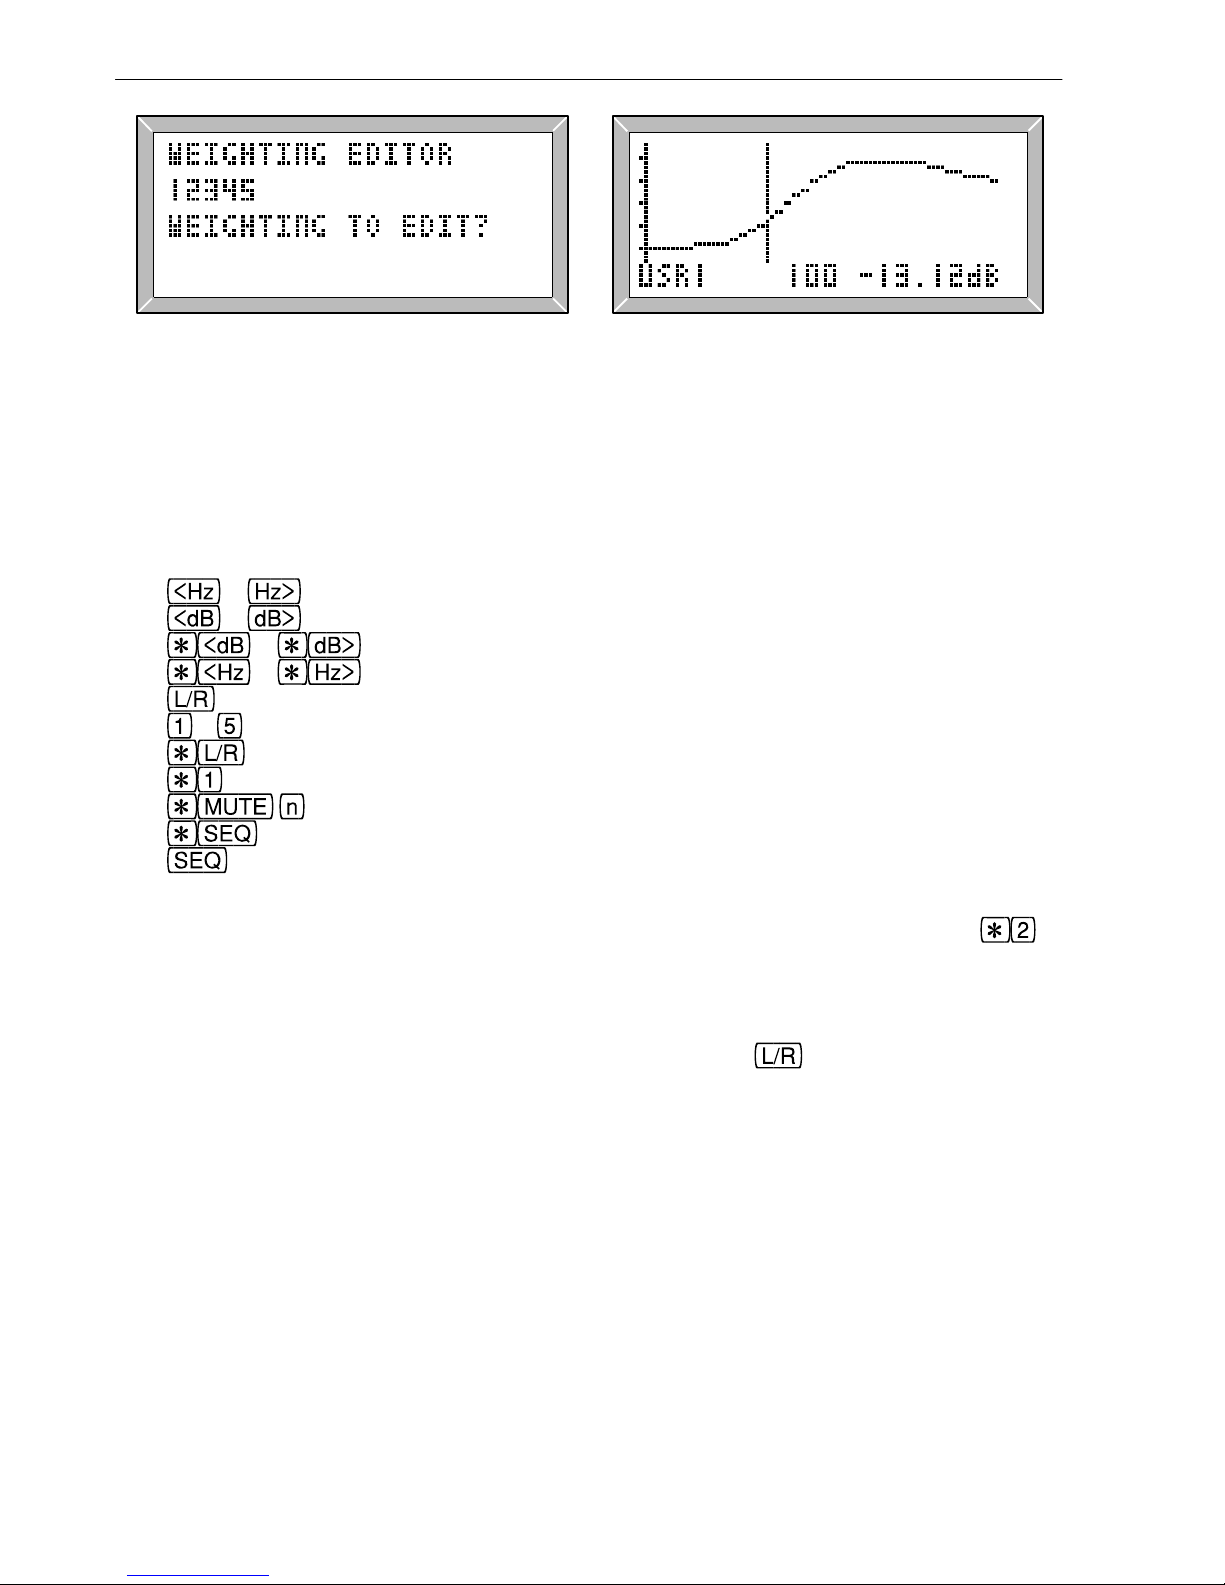
Fig. 2.25 Selecting a Weighting Curve Fig. 2.26 Weighting Curve Editor
The weighting curve will be plotted and if it has not been defined it will be a flat line. It
can be edited by moving the cursor and entering the level for each third octave frequency.
The editing keys are:
Editor keys Inverse response Inverting a weighting curve Normalise a weighting curve
& move the cursor in third octave steps
& change the weight at the cursor frequency by ±1dB
& change the weight at the cursor by ±0.01dB
& change the scale of the graph (zoom in/out)
copy the current weight to the next one for rapid entry
to preset keys set the weight to the preset level
invert the entire weighting curve
normalise the weighting curve to the cursor frequency
copy the weighting curve to user weighting curve n
select a new weighting curve to edit
exit from the editor.
To apply the user weighting set configuration W to its number (1 to 5) and press to
toggle it on/off (as described in section 2.26). When selected the actual output level will
be equal to the displayed level plus the weight for the current frequency being generated.
To clear a weighting simply set all of the weights to 0dB (this can be done very quickly
by setting the lowest frequency to 0dB and then holding the
key to copy this level to
the other weights).
Copy a weighting curve Copy a weight User weighting curves De-emphasis
36
2. Manual Operation
Page 37

3.0 Sequence Testing
Sequence testing, as its name implies, involves the sending of a sequence of test signals
for the complete and automatic evaluation of a system. Sequence testing on the LA100 is
completely self contained and requires no programming effort, yet it is powerful and
flexible, and designed to fully test any circuit or equipment which operates in the audio
band in about one minute. The test results can be displayed on the LA102’s LCD, printed
directly to a printer and downloaded to a PC.
Frequency shift keying Limit testing
A key feature is the use of test segments; standard ‘building blocks’ from which the
sequences are assembled. Each test segment (identified by a letter A-Z or a-z) consists of
a short sequence of tones or a frequency sweep, preceded by an FSK (Frequency Shift
Keyed) header code lasting around 200ms. The header acts as the synchronising trigger
for the LA102, as well as identifying the segment code: the LA102 then makes the
necessary measurements at the right time. Segments can be sent in almost any
combination over any audio path, or recorded and replayed, and any LA102 will still
make correct measurements without any programming. The use of short segments brings
many advantages over a single long test sequence. Speed errors on tape replay, which
could put a long sequence out of synchronism, are well tolerated as each segment is
retimed from its own FSK header. ‘Breaking-in’ on a continuous repeating sequence is
also possible, as the LA102 waits and responds to the next FSK header. Perhaps most
important, though, is the way in which segmented sequences combine flexibility with
standardisation. A relatively small number of segments can be put together to form an
almost unlimited number of test sequences, and yet every one will be recognised
automatically by any LA102 because the segments are standardised.
Up to 5 sets of results can be stored in the LA102’s non-volatile memory to be examined,
printed or transferred to a computer later. Tolerance limit tests can be applied to the
sequence results and up to 10 sets of user tolerances can be entered allowing limits to be
specified for every measurement providing pass/fail testing which is ideal for production
testing, or routine checking of equipment. A source identification message can be entered
into the LA101 (for all sequences, or for each sequence separately) and this is transmitted
to the LA102 as FSK. The heading and the date can be entered into the LA102, to be
printed at the top of the page. All sequences, results, tolerances and messages are
preserved in non-volatile memory when the unit is turned off so complex definitions need
only be entered once (they can also be entered from a remote computer via the serial port
- see chapter 9).
New users should read sections 3.1 to 3.4 which explain the basics of sequence testing.
They may then proceed to chapters 4, 5 or 8 for details on modifying the test sequences,
pass/fail tolerance testing or results printing respectively.
37
Page 38
38
3. Sequence Testing
User Sequences
0 For remote use only − this sequence can only be accessed by a remote computer
1-10 User sequences, initially set to be the same as sequences 11-20. These sequences can be edited by the
user or overwritten by copying other sequences over them (either individually, or as a whole bank).
Lindos Default Sequences
11 "GENERAL/TAPE TEST" TRCINZ General purpose test sequence
12 "LINES/LINKS TEST" TOCENZ Test for communications lines and links
13 "CASSETTE/CARTRIDGE" TPCINWZ Cassette and cartridge test with W&F
14 "SPEAKER/GENERAL" TUD Loudspeaker frequency response and distortion
15 "20-20kHz FAST SWEEP" TX<
16 "LINDOS SELF TEST" /0%10,0 LA100 Self Test − see section 10.6 of manual
"XLR SOCKETS ONLY/0dB"TUCDN±6
17 "FM TEST""ONE CHAN MTD FOR THD"VRA:19,0GNY FM transmitter test. Dist. measured on mono tone
18 "GERMAN SEQ" T+6U-14C+6D+6NZ-4 German line-up levels
19 "PPM TEST" A test for Peak Programme Meters
"100ms PPM6 +8dB"!5000,100,8,0,5000 Should read PPM 6
"10ms PPM5.5 +6dB"!5000,10,8,0,5000 Should read PPM 5½
"5ms PPM5 +4dB"!5000,5,8,0,5000 Should read PPM 5
"1.5ms PPM3.75 -1dB"!5000,1.5,8,0,5000 Should read PPM 3¾
"0.5ms PPM1.75 -9dB"!10000,0.5,8,0,5000 Should read PPM 1¾
"TONES PPM7-1"!1000,4000,12,,,8,,,4,,,0,,,-4,,,-8,,,-12 Levels PPM 7 to PPM 1
20 "5S SWEEP (REPEAT)" TU<
Tape Test Sequences
21 "FULL TAPE TEST" TRCINWZ As sequence 11, but with W&F
22 "MULTI-SWEEP" *3 TU0U-10U-20 Frequency response at 0dB, -10dB and -20dB
23 "CASSETTE/CARTRIDGE" TPCINWZ General cassette/cartridge test
24 "W+F ONLY" TW W&F test (including gain, speed and phase)
25 "20-20kHz FAST SWEEP" TX< Fast repeating sweep
26 "NOISE+DIST" TIN Simple noise and distortion test
Mono Loudspeaker Test Sequences
31 "SLOW SWEEP-10 DIST":3,1TS-10F0 Slow frequency sweep at -10dB, distortion at 0dB
32 "SLOW SWEEP 0 DIST":3,1TS0F0 Slow frequency sweep at 0dB, distortion at 0dB
33
34 "SWEEP+DIST":3,1TUD Sweep at 0dB, distortion at +8dB
35 "SWEEP+DIST ON R" Connect LA100 as in fig. 3.16 (Manual, page 51)
"SPEAKER ON R CHANNEL":3,2TUD L channel carries FSK, measurements made on R
Filter Test Sequences
41 "RIAA INVERSE" "WEIGHTED SWEEP -40dB" Inverse weighted frequency sweep at -40dB for
:3,1 =6 TU-40 RIAA disc equalisation filter. Result should be flat.
42 "CCIR468 INVERSE" "WEIGHTED SWEEP -40dB" Inverse weighted frequency sweep at -40dB for
:3,1 =7 TU-40 CCIR noise filter. Result should be flat.
To test the LA102, press:
and then run sequence 42
Meter Tests (Tone Bursts)
51 "FLUTTER METER 1%" This should produce a 1% W&F reading on a
!3125,600,0,3188,,,3188,0< flutter meter.
52 "CCIR468-4 WTD METER" CCIR486 noise meter test.
"6300Hz -40dB REF" !6300,5000,-52.2 6.3kHz, -40dB reference (set meter to read -40dB)
"100Hz -40±1dB" !100,4000,-20.2 Response test, meter should read -40dB±1dB
" 1kHz -40±0.2dB" !1000,4000,-40 Response test, meter should read -40dB±0.2dB
" 8kHz -40±0.4dB" !8000,4000,-51.4 Response test, meter should read -40dB±0.4dB
"10kHz -40±0.8dB" !10000,4000,-48.1 Response test, meter should read -40dB±0.8dB
"16kHz -40±1.6dB" !16000,4000,-28.3 Response test, meter should read -40dB±1.6dB
53 "A WTD METER" ‘A’ weighted meter test.
"1000Hz -40dB REF" !1000,4000,-40 1kHz, -40dB reference (set meter to read -40dB)
" 100Hz -40±0.5dB" !100,4000,-20.9 Response test, meter should read -40±0.5dB
"2500Hz -40±0.5dB" !2500,4000,-41.3 Response test, meter should read -40±0.5dB
" 10kHz -40±0.5dB"!10000,4000,-37.5 Response test, meter should read -40±0.5dB
Table 3.1 Sequence Definitions
Page 39

39
3. Sequence Testing
54 "CCIR TONE BURSTS" CCIR468-4 noise meter, ballistics test
"RANGE -40dB SET TL" 5kHz reference tone, should read -40dB
!5000,4000,-51.7,0,3000,-40 (adjust meter − if testing LA102 set Test Level)
"200ms ±1.2dB"!5000,200,-49.8,0,3000 200ms tone burst should read -40±1.2dB
"50ms ±1.3dB"!5000,50,-47.1,0,3000 50ms tone burst should read -40±1.3dB
"10ms ±1.2dB"!5000,10,-45.3,0,3000 10ms tone burst should read -40±1.2dB
"2ms ±1.5dB"!5000,2,-40.2,0,3000 2ms tone burst should read -40±1.5dB
55 "CCIR DUAL BURST" CCIR468-4 noise meter, ballistics test
"FIX-40 SET TL"!5000,6000,-51.7 5kHz reference tone, should read -40dB
"2/SEC -6.4±0.9dB"!5000,5,-51.7,0,495< 2 pulses per second, should read -40±0.9dB
56 "CCIR DUAL BURST" CCIR468-4 noise meter, ballistics test
"FIX-40 SET TL"!5000,6000,-51.7 5kHz reference tone, should read -40dB
"10/SEC -2.3±0.6dB"!5000,5,-51.7,0,95< 10 pulses per second, should read -42.3±0.6dB
59 "PPM TEST">19
Utility Sequences
61 "BETACAM CHANNEL ID" Audio channel identification for Betacam tapes:
"STEADY TONE ON R"!1000,3000,0,,0 Steady tone on R channel
"L MUTED FOR 0.25S":2!1000,250,0,,0:3<< Broken tone on L (muted for ¼s every 3¼s)
BBC Sequences
71-73 Not yet defined. 76 and 77 are included as temporary demonstrations!
74 "FM Radio Relay" FM Radio relay test, with 400Hz test level.
*2:3,1VRCJ:3,2VRCJ"DE-EMPHASIS ON,1=CONT"? Distortion is measured twice, and the LA101
"STEREO DISTORTION+8":19,1F:19,2F"PILOT will prompt before each distortion measurement,
OFF,1=CONT"?"MONO DISTORTION+8":3,1F:3,2F frst with ‘DE-EMPHASIS ON’ and then with
‘PILOT
75 "FM TEST""ONE CHAN MTD FOR THD"VRA:19,0GNY OFF’. Press
to continue.
British Telecom Sequences
81 "BT DIGITAL LINES" BT Digital lines/links test. Crosstalk at 0 & +10dB
*3 TOCC+10c0c+7ENZK+10,0,-30,-37,-47,-55 15kHz crosstalk at 0 & +7dB, response and level.
82 "BT EPS81 LINES/LINKS" Mono broadcast line, checked against EPS81
"MONO LINE<40km" :3,1 TOCENZ±7 tolerance in the LA102
83 "BT EPS84 LINES <40km" Stereo broadcast line, checked against EPS84
"STEREO LINE" TOCENZ±8 (for lines less than 40km)
84 "BT EPS84 LINES <320km" Stereo broadcast line, checked against EPS84
"STEREO LINE" TOCENZ±9 (for lines less than 320km)
85 "BT EPS98 LINES <320km" Stereo broadcast line, checked against EPS98
"STEREO LINE" TOCENZ±10
Telecom Australia Sequences
91 "REPEATING SWEEP""40 OHM 0dBm"%40,1TX<
92 "NOISE TEST""40 OHM 0dBm"%40,1TN
93 "THD +14dBm""40 OHM 0dBm"%40,1TF+20
94 "DIFF FREQ DIST""40 OHM 0dBm"%40,1Td
95 "LEVEL CRSTK + PHASE""40 OHM 0dBm"%40,1TC+12Z
96 "MONO LINES TEST""40 OHM 0dBm"%40,1:3,1TUF20Nd
97 "STEREO LINES TEST""40 OHM 0dBm"%40,1TUF20NdC+12Z
98 "MONO LINES O.33 EQVT""L CHANNEL ONLY":3,1T"COMPANDER TEST ON K"
U-12D+9!K800,1000,+6,,,-6,,,+6,,,+6,,,-6,,,+6N
99 "STEREO LINES (O.33)""COMPANDER TEST ON K"
*2 TU-12D+9B-12!K800,1000,+6,,,-6,,,+6,,,+6,,,-6,,,+6NZ
100 "LINDOS SELF TEST" As sequence 16
SAPO Sequences (South African Post Office)
101 "BTM/SEL SC"/-17%600,2"600OHM MATCHED"TrCEnz
102 "TV SOUND/BC"/0TOCENZ
103 "GTE SC"/-14%600,2"600OHM MATCHED"TrCEnz
104 "GTE SUB/BB"/-19%150,2"150OHM MATCHED"TOCENz
105 "20-20kHz FAST SWEEP"TX<
106 "LINDOS SELF TEST" As sequence 16
107 "TEST+PATCH SC"%600,2"600OHM MATCHED"TrCENz
108 "NSTD CHANNEL"/-10%600,2"600OHM MATCHED"TrCEnz
109 "PPM TEST" As sequence 19
110 "5S SWEEP (REPEAT)"TU< As sequence 15
in LA100 V6.7 Software
Page 40

40
3. Sequence Testing
Seg Measurement Default Level Time Values
A Crosstalk 40, 100, 315, 1k, 6.3k, 10kHz 0dB/50µs 6s 6
B Crosstalk 100, 1k, 6.3k, 10kHz 0dB 2s 4
C Crosstalk 40, 100, 315, 1k, 6.3k, 10kHz 0dB 6s 6
D Distortion 100, 1k, 6.3kHz +8dB 6s 3
E Distortion 100Hz +9dB, 1kHz -10dB, 1kHz +9dB -10/+9dB 6s 3
F Distortion 40, 100, 315, 1k, 6.3k, 10kHz +8dB 18s 6
G Distortion 40, 100, 315, 1k, 6.3k, 10kHz +8dB/50µs 18s 6
H 3% MOL at 1kHz 0 to 8dB 8.5s 1
I Distortion 100 +8dB, 1k +8dB, 100 -10dB 1k -10dB +8/-10 8s 4
J Crosstalk 40, 100, 315, 1k, 6.3k, 10kHz -10dB 6s 6
K User levels 1kHz (1, 2, 3, 4, 5, 6) 0 to -50dB 6s 6
L Noise RMS, A weighted and unweighted
noise segments 8s 2
M Noise CCIR468-3 peak wtd, peak unwtd and mean wtd 30s 3
N Noise CCIR468-3 peak wtd, peak unwtd and mean wtd 8s 3
O Sweep 20Hz-20kHz, British Telecom spec EPS84 frequencies: -10dB 5s 26
40, 50, 60, 100, 125, 200, 300, 500, 800, 1k, 2k, 3k, 4k, 5k,
6k, 7k, 8k, 8.5k, 9k, 10k, 11k, 12k, 13k, 14k, 15k, 20k
P Sweep 20Hz-20kHz -20dB 5s 20
Listed frequencies are: 30, 40, 50, 63, 100, 125, 250, 500,
1k, 2k, 4k, 6.3k, 8k, 10k, 12.5k, 14k, 15k, 16k, 18k, 20kHz
Q Sweep 20Hz-20kHz (list as for P) -12dB 5s 20
R Sweep 20Hz-20kHz (18dB headroom, list as for P) -10dB 5s 20
S Sweep 20Hz-20kHz (list as for P) -10dB 20s 20
T Test level, 1kHz 0dB 0dB 1s 1
U Sweep 20Hz-20kHz (max resolution, 8dB headroom, 0dB 5s 20
list as for segment P).
V Test level, 400Hz 0dB (for transmitters) 0dB 1s 1
W Wow & flutter, 3.125kHz wtd, unwtd, speed and phase 0dB 12s 4
X Fast sweep 20Hz-20kHz (list as for P) 0dB 1.5s 20
Y Phase 40, 100, 1k, 6.3k, 10k, 15kHz (Mean) 0dB/50µs 3s 6
Z Phase 40, 100, 1k, 6.3k, 10k, 15kHz (Mean) 0dB 3s 6
c Crosstalk 15kHz 0dB 3s 1
d Difference frequency distortion, 70Hz, 2nd order at 1kHz 0dB 2s 1
h 3% MOL at 315Hz (not available in V5.7T software) 0 to +8dB 8.5s 1
o Sweep 300Hz-18kHz 0dB 5s 19
Listed frequencies: 315, 400, 500, 630, 800, 1k, 1.25k,
1.6k, 2k, 2.5k, 3.15k, 4k, 5k, 6.3k, 8k, 10k, 12.5k, 16k, 18kHz.
n CCITT O.41 Psophometric noise (see appendix I.5) 8s 2
r Sweep 30Hz-4kHz 0dB 5s 22
Listed frequencies: 30, 40, 50, 63, 80, 100, 125, 160, 200, 250,
315, 400, 500, 630, 800, 1k, 1.25k, 1.6k, 2k, 2.5k, 3.15k, 4kHz.
u Sweep 10Hz-30kHz. Listed frequencies: 0dB 5s 24
10, 20, 30, 40, 50, 63, 100, 125, 250, 500, 1k, 2k, 4k, 6.3k, 8k,
10k, 12.5k, 14k, 15k, 16k, 18k, 20k, 25k, 30kHz.
x Sweep 300Hz-18kHz. Listed frequencies: 0dB 5s 15
315,400,500,630,800,1k,1.25k,1.6k,2k,2.5k,3.15k,4k,5k,6.3k,8kHz.
z Phase 40, 100, 315, 1k, 6.3k, 10k, 15kHz (Mean) 0dB 3.5s 7
Table 3.2 Test Segments available in LA100 V6.5 Software
Page 41
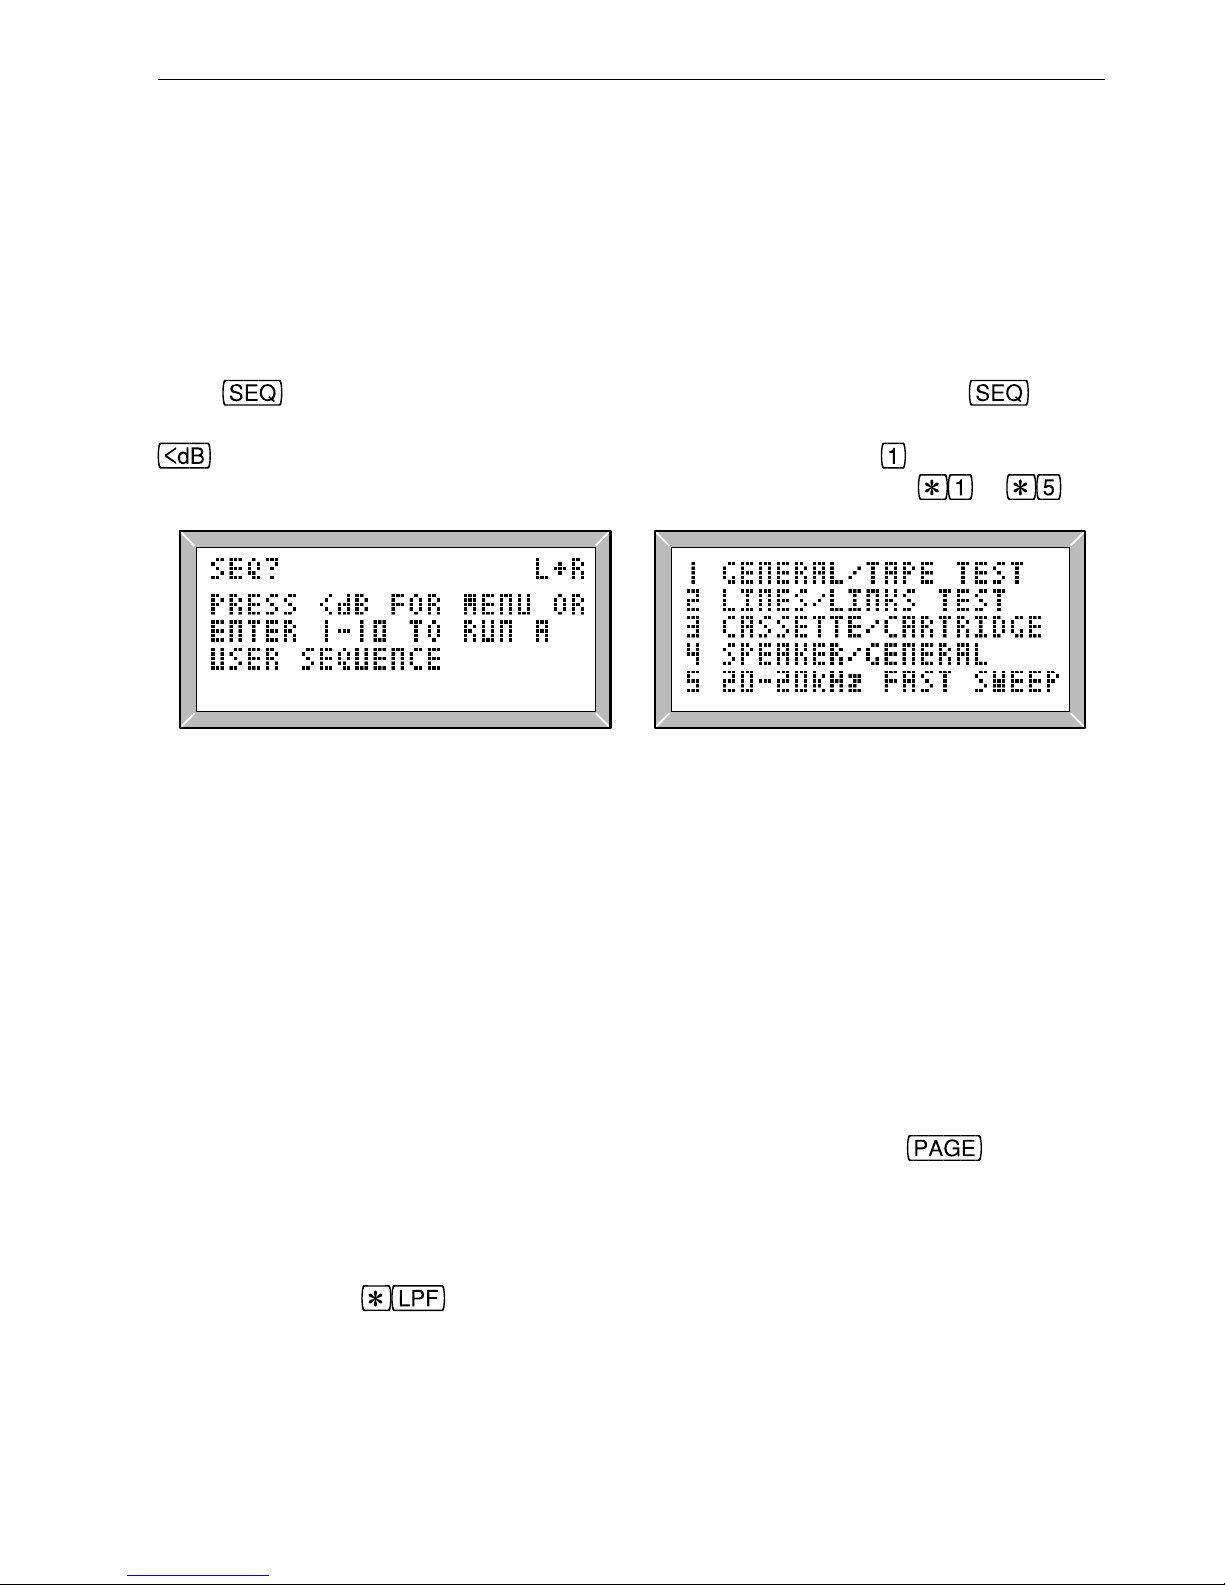
41
3.1 Running a SequenceRunning a sequence 22Hz-22kHz bandwidth
Over 100 ready-made test sequences are currently available on the LA101, as listed in
table 3.1, all constructed from the test segments listed in table 3.2 (and the control
segments listed in table 4.1). They differ in the tests that are carried out and the levels of
the test signals used; each being primarily intended for a particular purpose. The firsttime user should connect the two units directly at first, turn on the LA102 loudspeaker
and then try sequence operation.
Press
on both units to put them into sequence mode. After pressing on the
LA101 (fig. 3.3), a menu listing the available sequences can be displayed by pressing
(fig. 3.4). Now enter a sequence number on the LA101 (press to run the general/
tape sequence for example). Sequences 6 to 10 are selected by pressing
to .
Fig. 3.3 The Sequence Prompt Fig. 3.4 The Sequence Menu
The LA102 should respond immediately by displaying a + character followed by the
source message (usually the serial number of the oscillator) and a string of letters
denoting receipt of the various test segments for each channel. For sequence 1 this will
be ‘TRCINZ.’ for the left channel and ‘TRCIN.’ for the right channel (segment Z
measures phase between the two channels and therefore only needs to run once). The ‘.’
represents the sequence terminator which the LA101 sends to indicate the end of a
sequence.
When both channel tests are complete the LA102 will go into page mode and display a
graph of frequency response for the left channel (unless tolerances are in use, in which
case it will display the title page with tolerance information). If the unit does not go into
page mode automatically, perhaps because an error occurred, pressing
will ensure
that it does.
Note that sequence mode is independent of the frequency, level and measurement option
settings made in manual mode, as the sequence system specifies all of these parameters.
However, pressing
on the LA102 when it is in SEQ mode will toggle the 22Hz to
22kHz filter on frequency sweep and tone segments (‘
22-22kHz’ is displayed on the
screen) and this will eliminate interference from bias breakthrough on some tape
machines. It should not normally be used as it imposes its own response errors.
3. Sequence Testing
Page 42
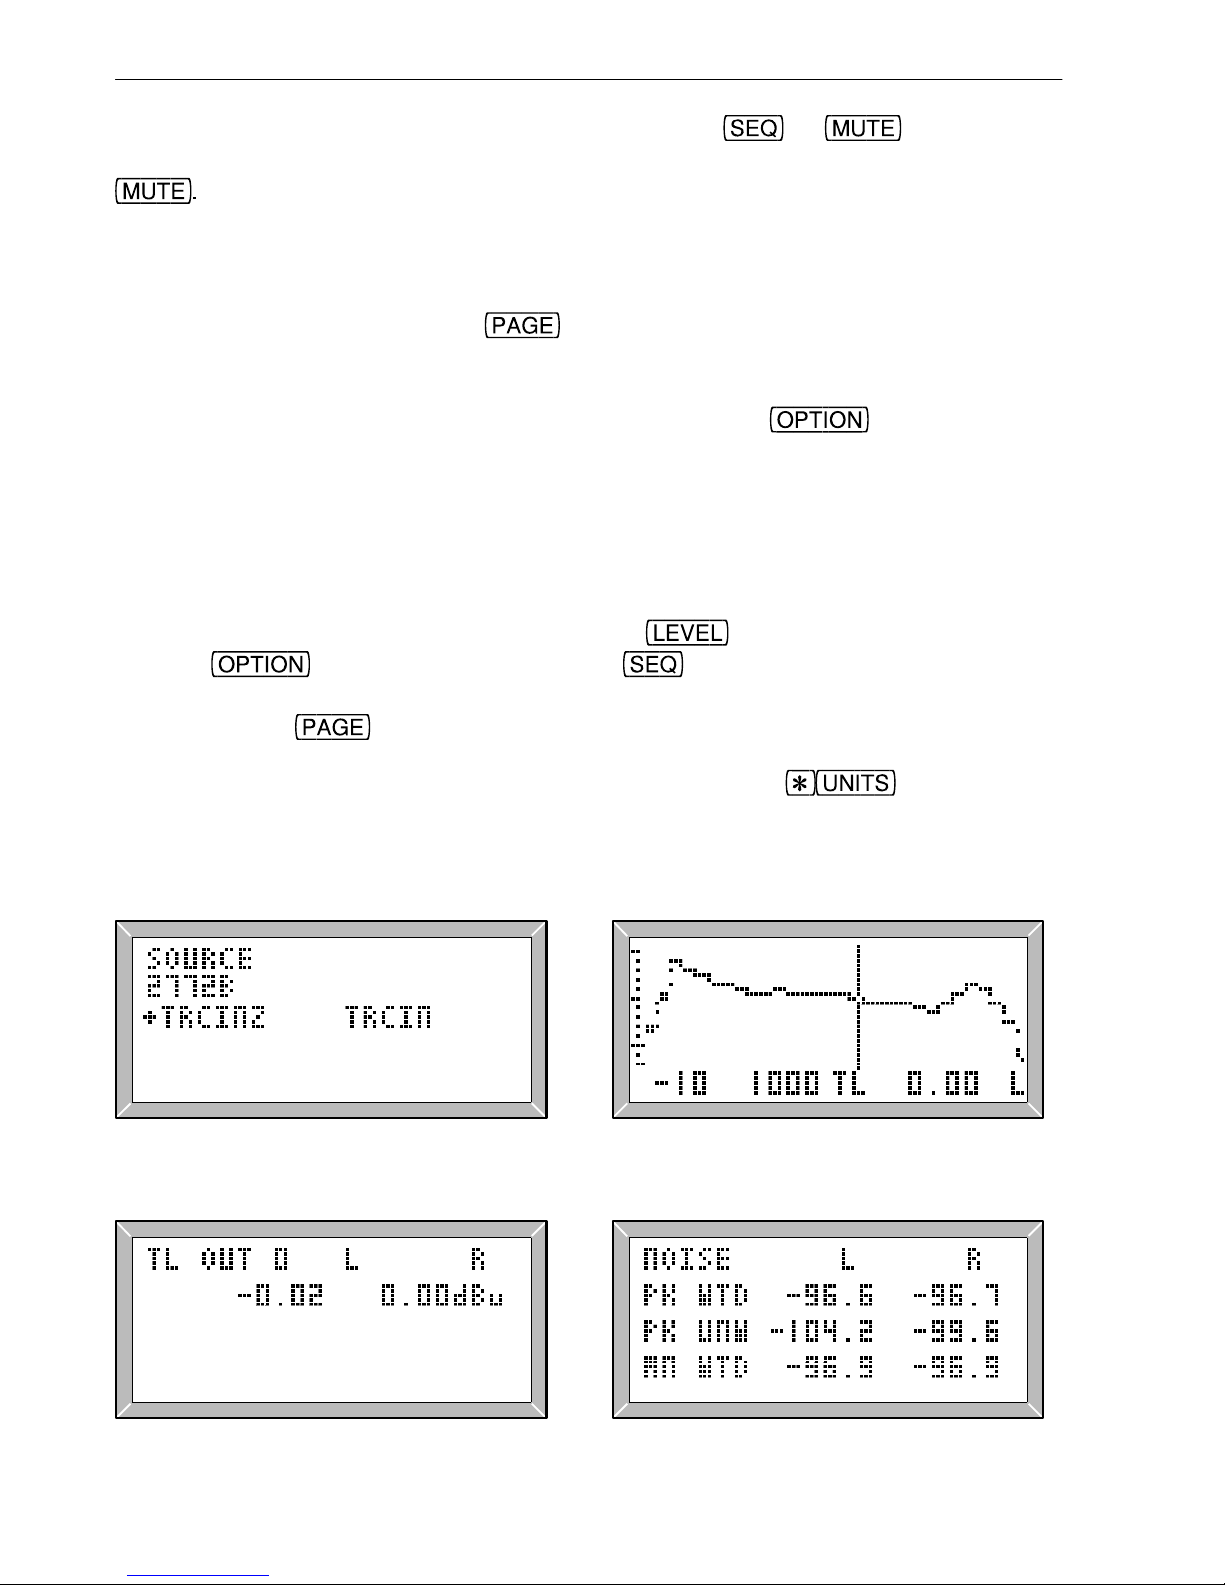
42
To abort a sequence when it is running press and hold or on the LA101
until
SEQ? appears (this may take a few seconds). To re-run the last sequence, press
3.2 Page Results ModeSequence results Displaying sequence results
Once in page mode, the results of a previously run test sequence can be viewed a
screenful at a time by pressing
to cycle forward through the results in the
following order: Source ID with segment list and pass/fail tolerance display, frequency
response graphs, test level, noise, crosstalk, MOL (Maximum Output Level), distortion,
W&F and speed, phase, user levels. See figs. 3.5-3.10. Press
to step backwards
through the pages. If no results were received for a particular page then it is not shown.
Pressing one of the keys in the top row will display the appropriate page for level, noise,
distortion etc., though in some cases only the key page is accessed in this way (crosstalk
on sequence 1 has two pages). There is also a page for the source ID (fig. 3.5 & section
4.3), segment list (for each channel) and tolerance information (when in use). Note that
the quickest way back to the graphs is to press
and then step back a page by
pressing
. To leave page mode press (twice to return to manual mode).
Sequence results remain stored in non-volatile memory and can be viewed again at any
time by pressing
. Distortion results Distortion results in % Configuration D Configuration U
Some results can be displayed using different units and the key will cycle
through dBu, dBV, V and W for test level or dB and % for distortion. The printout is also
affected by this setting and configurations U and D set the default units to be used (see
section 1.6).
Fig. 3.5 Source ID and Segment List Fig. 3.6 Frequency Response
Fig. 3.7 Measured Test Level Fig. 3.8 Noise Results
3. Sequence Testing
Page 43
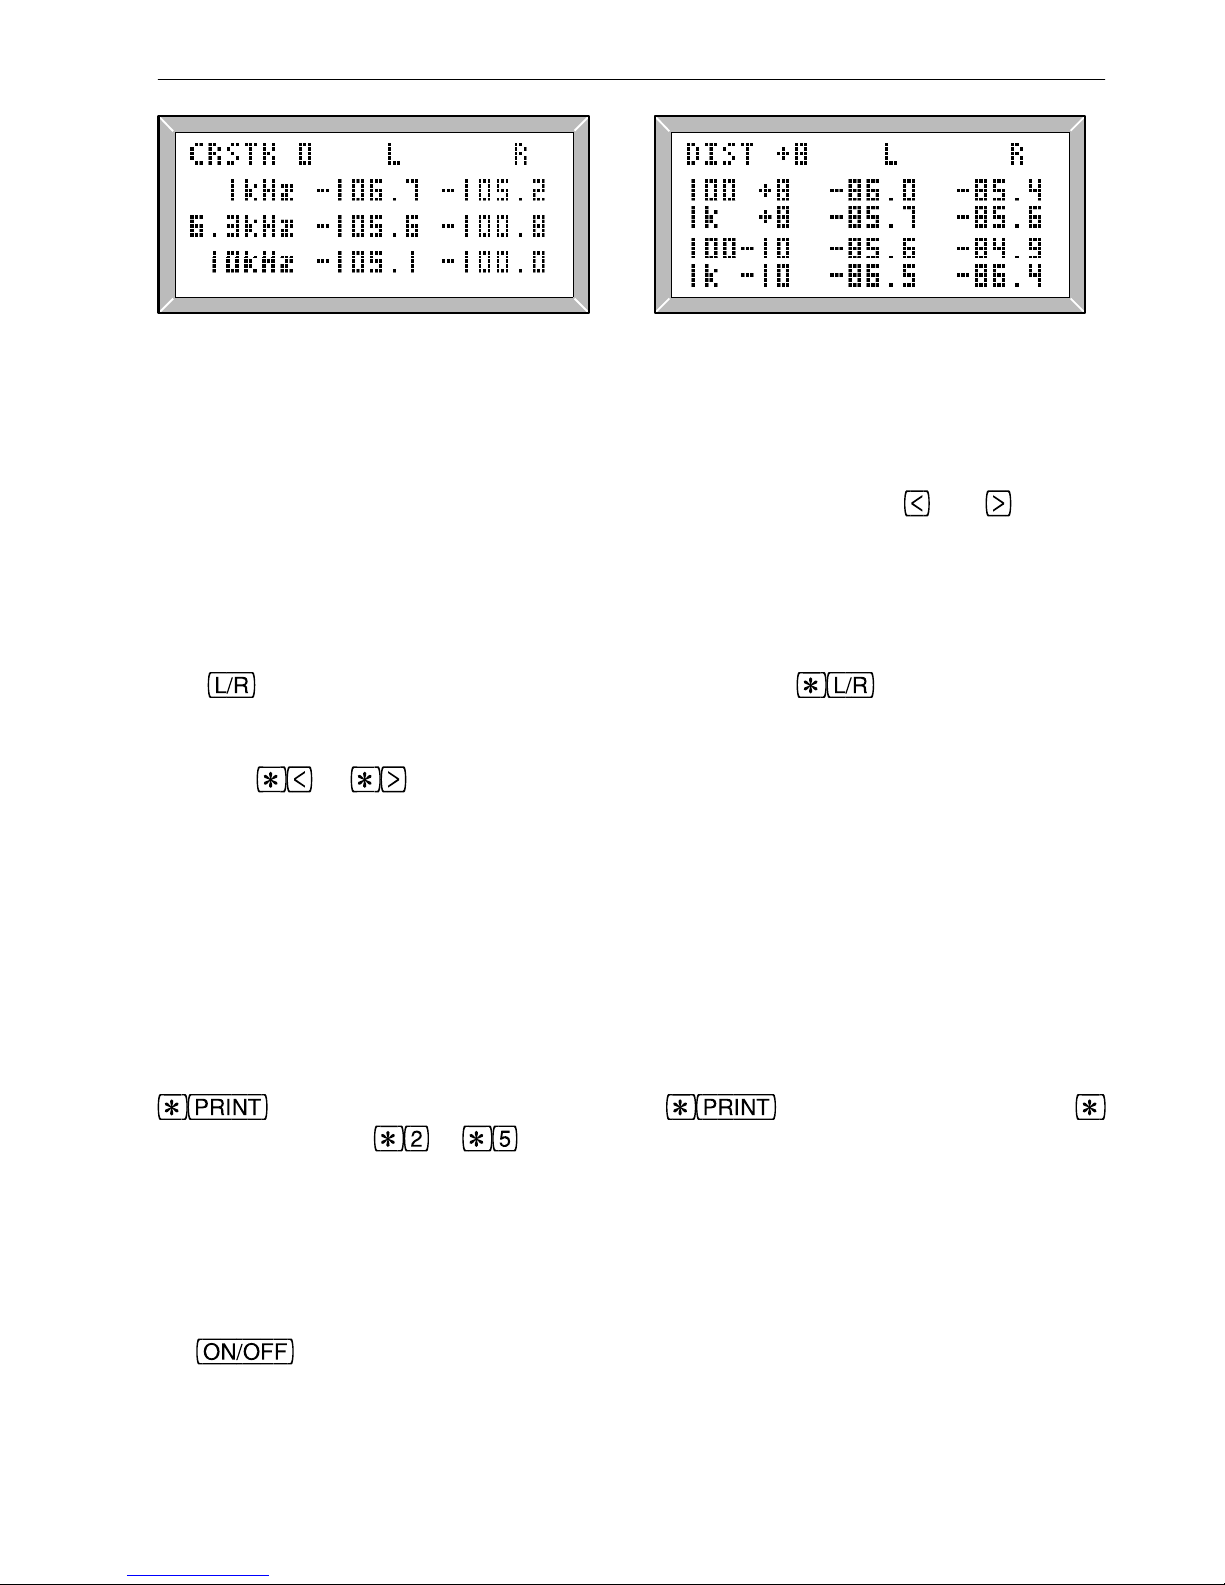
Fig. 3.9 Crosstalk Results Fig. 3.10 Distortion Results
3.3 Frequency Response ResultsGraph display Moving the cursor Relative level
The frequency response page shows a graph (fig. 3.6), usually covering 20Hz to 20kHz,
with a scale marked at 1dB (single pixel) and 5dB intervals (double pixels). The cursor
may be moved to any (third octave) frequency using the arrow keys
and , and the
frequency and level (at the cursor position) may be read from the numerical readout
which is based on stored information using 256 points per graph, and much more accurate
than can be seen directly from the graph. Similarly, the printed frequency response graph
is of much higher resolution (typically 512x512 pixels), as shown in fig. 3.11.
The
key toggles between left and right graphs, while displays a difference
graph (R-L). An ‘L’, ‘R’ or ‘D’ character is displayed to indicate Left, Right or
Difference graph. The level the sweep was transmitted at is shown to the left of the
display.
or can be pressed to expand or contract the dB scale of a displayed
graph, giving a range of 2, 4, 8, 16 or 32dB. This does not affect the printout, but a
similar control of the graph scale on the printout is available with configuration G. The
displayed levels are usually normalised to 1kHz, but this can be changed (see section
3.16). When the frequency response results are printed a table of frequency and levels is
printed beside the graph, using the frequencies shown for each sweep segment in table
3.2.
3.4 Printing Sequence ResultsPrinting sequence results Stop printing Multiple copies
To print the results of a sequence test ensure that a suitable printer is connected and press
. To print two or more copies press and, without releasing the
key, press a number to . A typical printout is shown in fig 3.11.
If the message
NO HANDSHAKE appears, or if the output is garbled then the printer
connections, the LA102 configuration options or the printer’s DIP switch settings may be
wrong. The LA102 will drive a wide range of printers directly, and the most likely fault
is incorrect setting of configuration P (printer type) or B (printer baud rate). Full details
of printer operation and the printout options are given in chapter 8. To abort printing, tap
the
key.
Automatic printing of sequence results is also possible, by setting LA102 configuration A
43
3. Sequence Testing
Page 44
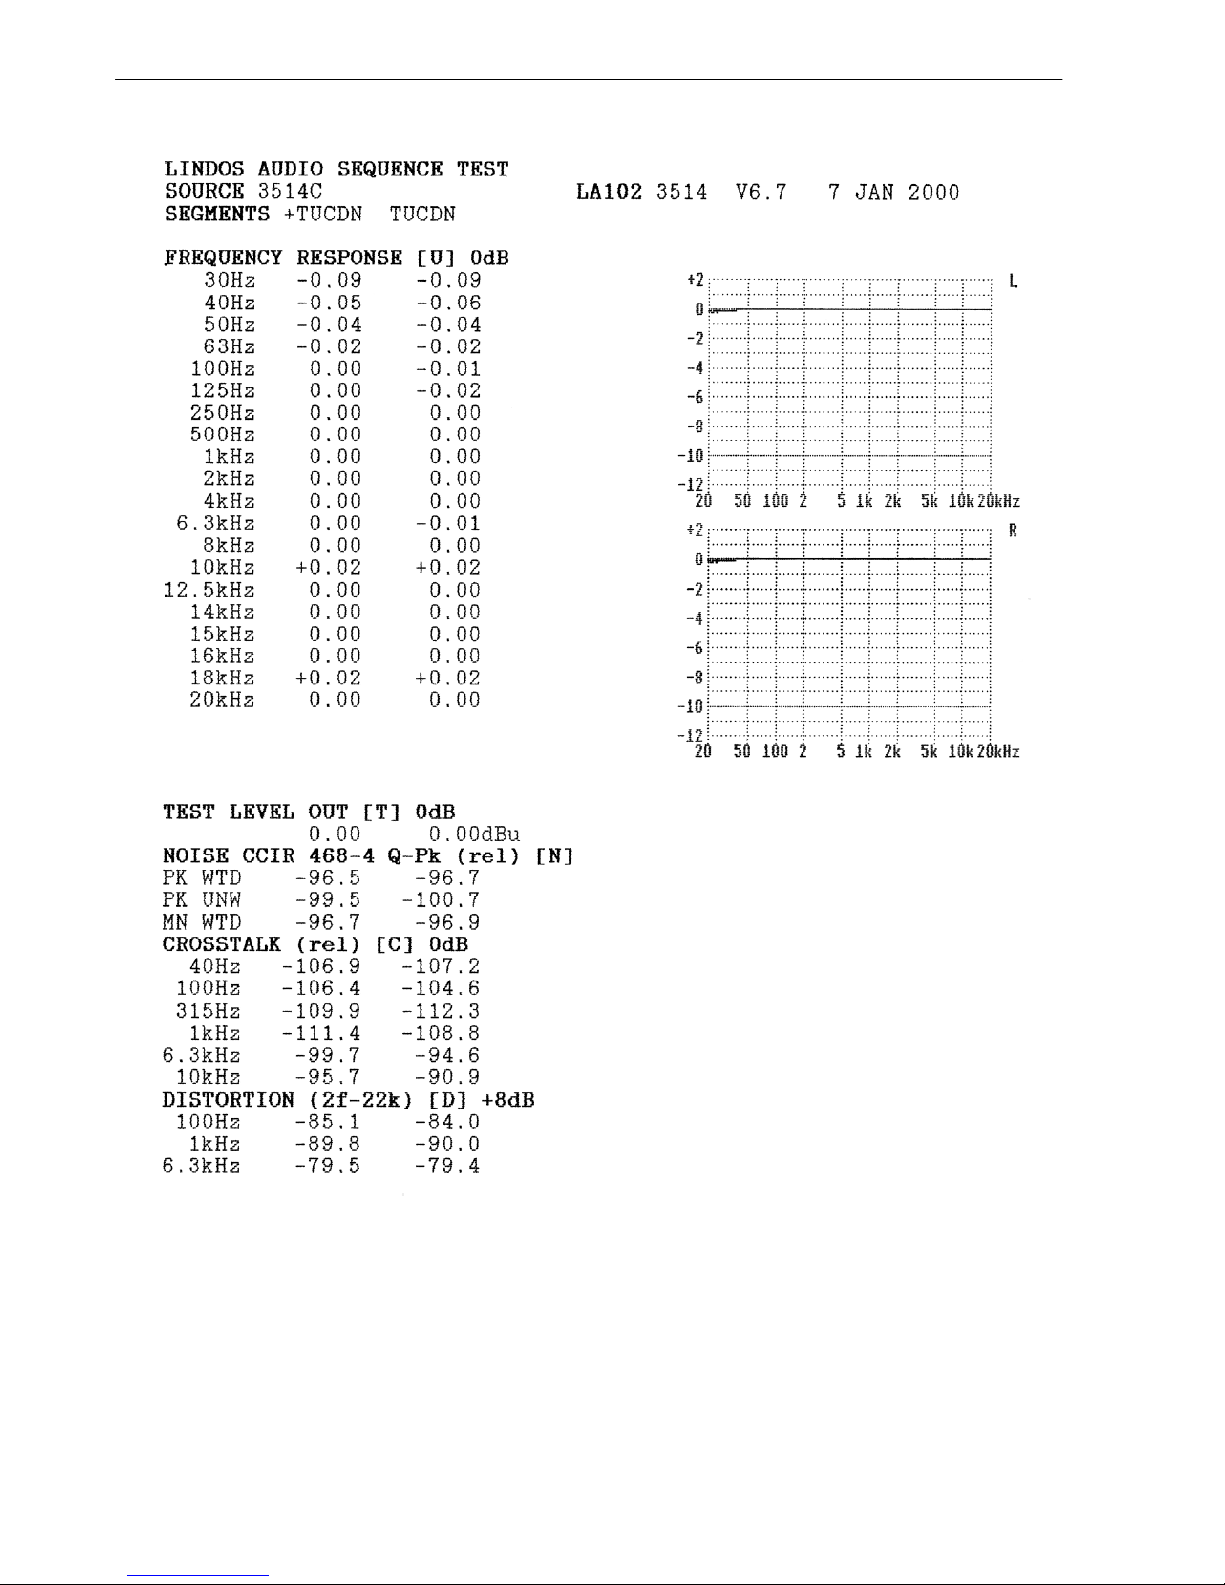
44
3. Sequence Testing
Fig. 3.11 A Typical Printout from the LA102
Page 45
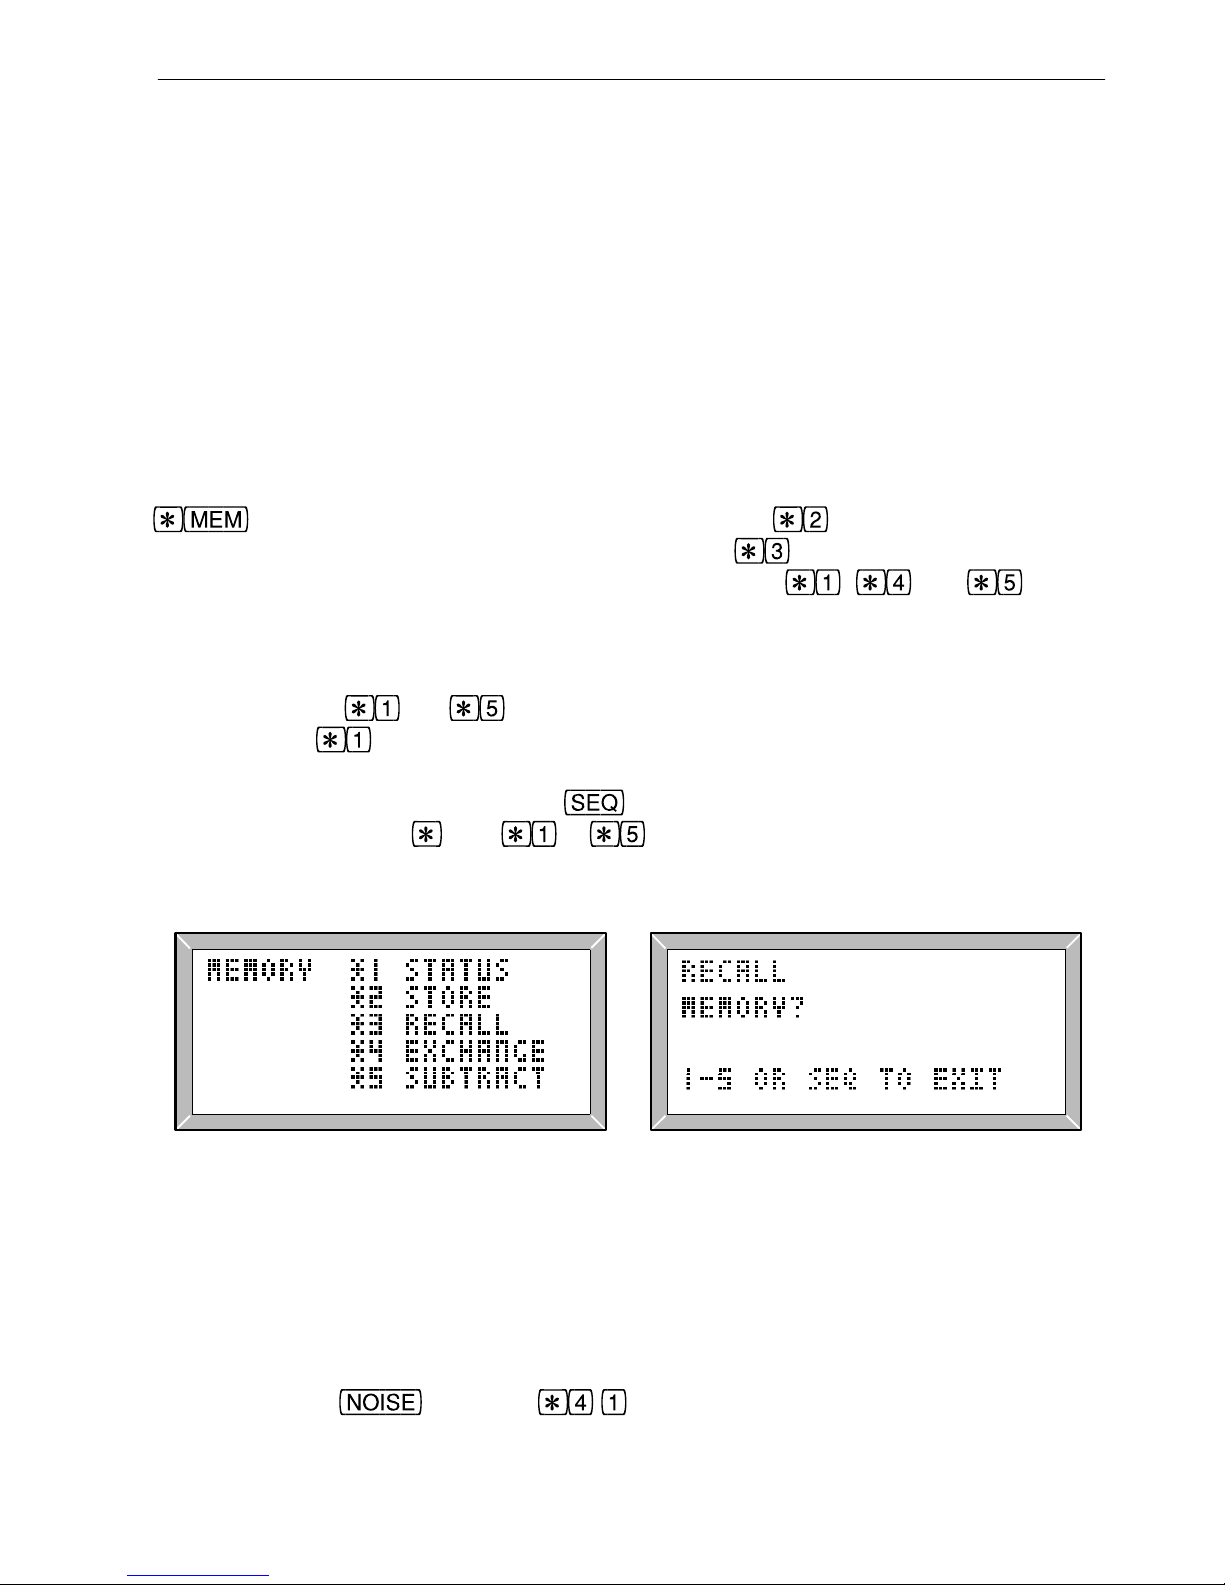
45
3. Sequence Testing
to 1, 2 or 3 (the number determines the number of copies). This makes the LA102 print
the results whenever it receives a sequence and is useful where the LA102 is being used at
a remote site to test a line or link, or even where a series of routine tests are being
performed and printouts of each are required. Similarly, automatic results storage is also
possible, see section 3.20. Setting configuration A to 5 causes the LA102 to enter
sequence mode after switching on or resetting. This setting, may be used in conjunction
with configuration Y to automatically store up to 5 sets of sequence results without any
operator intervention.
3.5 Storing Results in MemoryStoring results in memory Memory menu Results memories Clear results memory
Up to six sets of stereo sequence results can be held in non-volatile memory for later
comparison, printing or transfer to a computer. A menu (fig 3.12), obtained by pressing
from PAGE or SEQ mode, lists five operations: saves the results from the
‘working’ memory (0) to a specified memory (1 to 5).
recalls results (fig 3.13) from
a specified memory (1 to 5) to the working memory (0).
, and are for
status (show the source ID and segment list for a memory), exchange (gives, instant
comparison between memories) or subtract (each sample in a chosen memory is
subtracted from the sample in memory 0). Note that these operations can also be carried
out by pressing
to directly without entering the menu (with the small
restriction that
cannot be used from the graph page). When an operation has been
selected the memory number should be entered by pressing 1-5. At this stage, the
operation can be aborted by pressing
, or a different operation can be selected by
pressing the appropriate
key ( to ). Menu display Memory 0 Pass/fail testing
Fig. 3.12 Memory Operations Menu Fig. 3.13 Recalling Results
For convenience the same results page is displayed after a memory operation (providing
equivalent results are available), so results in different memories can be compared easily.
For example, to compare the noise results in the current memory, with those stored in
memory 1, press
and then to exchange the two results memories. The
noise figures which were in memory 1 will then be displayed and the same operation can
Page 46
be repeated to swap the memories back. Similarly, whenever the source ID page is
displayed the results are immediately compared with the pass/fail tolerance if one is in use
(see section 5.1). This allows memory recall and memory status operations to be used to
check quickly whether each set of results would pass the current tolerance.
Usually the unit can hold six complete sets of results in memories 0 to 5 (memory 0 being
the main or working memory). However, the number of results memories is reduced
when user tolerances are defined (section 5.6) or when the unit is configured for multiple
results compartments (section 4.18). In either case, the range of memory numbers
available is always shown (as in fig 3.13).
3.6 Cyclic Identification Character
A cyclic identification character (A-Z) is transmitted by the LA101 with the serial number
(as FSK) and printed out with the sequence results, as shown:
LINDOS AUDIO SEQUENCE TEST
SOURCE 6548A
...
LINDOS AUDIO SEQUENCE TEST
SOURCE 6548B
This letter advances through the alphabet each time a sequence is run (returning to A after
Z), and helps in sorting out a day’s tests. It may be set to any letter using the LA101
sequence editor (section 4.3), and it is reset to A when the sequence memory is cleared (or
if the SOURCE ID is deleted entirely).
3.7 Test LevelTest level for sequences Measuring gain Gain measurement Relative level Sensitive inputs Reference level
Sequence tests operate at a test level which is normally 0dBu but it can be changed to suit
the application. A typical example would be when testing a microphone input where a
test level of -60dBu might be selected. Similarly, a fixed-gain tape recorder might be
tested by setting a test level that produced exactly 0VU on its meters.
To set a test level other than 0dBu first select the desired level in manual mode on the
LA101 and then press
. The letters TL will now appear to indicate that a test level
has been set, and all sequences will be output relative to this level, unless the maximum
output level of the LA101 is exceeded, in which case an error message appears and the
sequence stops. To cancel the test level setting press
again in manual mode, or
more simply tap
to reset the LA101. Sequences usually begin with a test level
segment, and the result (under the heading ‘TL OUT’) indicates the measured test level,
(out of the system under test). If the LA101 test level was 0dBu, then TL OUT represents
the gain of the system.
If a sequence is always being used at a particular level then the sequence definition can be
modified to make it automatically set the test level when it is run (see section 4.21) and
46
3. Sequence Testing
Page 47

this avoids having to set the test level every time it is used.
3.8 Input LevelMinimum input level for sequences Sequence input level Sequence failure FSK failure
The LA102 looks for FSK signals at a nominal level of 0dBu, being intended for direct
connection to professional line levels, but a wide range of levels should give satisfactory
operation (-30 to +20dBu). Below this level the FSK may not be received, especially if
the system is noisy, but see section 3.13 for direct triggering using a separate channel.
Loudspeaker testing can be carried out using a measuring microphone with a suitable preamplifier, provided that this has the necessary gain. The actual measurements use
autoranging techniques, so they are independent of input level.
3.9 Ch
oosing a Sequence
Choosing a sequence Sequences − default Default sequences Tape machines
Although the LA101 has the capacity to store 250 sequence definitions, of which 110 are
currently defined as listed in table 3.1, many engineers find the Lindos Default sequences
are appropriate for nearly all their testing requirements.
The sequences are arranged in up to 25 sequence banks. Each bank contains 10 sequences
and the banks are listed in table 3.14. The default sequence bank is Bank 0.
Bank 0 is different from the others because the sequences therein are editable (see chapter
4). By default, Bank 0 contains the Lindos default sequences, and after option 4 is chosen
from the reset menu any user defined sequences in Bank 0 will be replaced by the Lindos
default sequences. Bank 1 also contains the Lindos default sequences, but this bank
cannot be edited. The other banks contain sequences written either by Lindos or third
parties.
Bank Sequences Allocation
B0 1-10 User sequences. These are held in RAM and can be edited
B1 11-20 Lindos default sequences
B2 21-30 Tape test sequences
B3 31-40 Speaker test sequences
B4 41-50 Filter test sequences
B5 51-60 Meter tone bursts
B6 61-70 Utilities
B7 71-80 BBC sequences
B8 81-90 BT lines/links sequences
B9 91-100 Telecom Australia sequences
B10 101-110 SAPO (South African Post Office) sequences
Table 3.14 Allocation of Sequence Banks in LA100 V6.5 Software
To select a particular sequence, first press
Subsequently each press of will
display the first 5 sequences of the next bank in succession. Pressing
will step back
a bank. Pressing
to will run the corresponding sequence. To view sequence 6 to 10
47
3. Sequence Testing
Page 48
of each bank press . While holding , press to to run sequence 6 to 10
respectively. For example, to run sequence 27: Press
to enter sequence mode; press
until sequence titles 21-25 are displayed; press to run sequence 27 (note that
represents the digit 6, represents 7 etc).
When a bank has been selected, it becomes the current bank and will be used next time a
sequence is run (ie after running sequence 27, pressing
will run sequence 21).
After the LA101 is turned on or reset (by tapping the
key), the current bank is
set from configuration B.
New users should first gain experience with the default Lindos sequences in Bank 0
before using sequences in other banks or editing sequences.
The 10 Lindos default sequences vary mainly in the levels at which each test is carried out
relative to test level, and the levels used are the result of careful analysis of various codes
of practice and specifications issued by the BBC, IBA, ITC, British Telecom, IEC, EBU
and CCITT. The use of +8dB for distortion tests is fairly standard, except for line testing
where +9dB is used. A level of -10dB has been chosen for the sweep in sequence 11, in
line with the BBC requirement for testing tape machines, and the IBA code of practice. A
sweep (segment Q) at -12dB is available in line with CCITT/EBU recommendation O.33
for line testing. Sequence 12 incorporates a frequency sweep at -10dB which gives a
printout to British Telecom specification EPS84 and also incorporates a ‘rest’ period
between the two high level distortion tests to minimise the risk of overloading FDM and
satellite systems. Sequence 13 uses a sweep at -20dB as is common in testing cassette
machines to avoid high frequency tape saturation.
Testing loudspeakers O.33 sequence
Sequence 14 is useful for testing loudspeakers and other devices where crosstalk and
noise are irrelevant. It is recommended that a working level of say 90dB SPL be adopted
for loudspeaker testing, while the distortion test will be found quite meaningful at +98dB
SPL.
Sequences 15 and 20 provide repeating frequency sweeps which can be used to see the
effect of making changes to a piece of equipment which affect its frequency response
(perhaps adjusting tape bias for example). The sweep repeats until stopped by pressing
on the LA101 (press and hold on the LA102 to stop it updating). Sequence
15 uses a fast 1½s sweep while sequence 20 provides a slower 5s sweep which will be
more suitable when testing steep filters. The LA102 plots the frequency response as it is
measured and the usual graph keys on the LA102 operate to move the cursor, zoom in or
switch channels etc (see section 3.3). These keys operate during sweep measurement, but
not during FSK input (which only lasts a small fraction of the repeat cycle anyway) and
the display shows ‘SEQ’ or ‘FSK’ to indicate the mode. Do not worry that scrolling and
cursor movement sometimes causes graph plotting to fall behind fast sweep input, as the
sweep input is independently timed and not affected by graph plotting or key presses.
48
3. Sequence Testing
Page 49
Each channel is measured and the graphs updated on alternate sweeps. When testing
mono circuits the channel should be selected on the LA101 with
before running the
sequence (after pressing the
key).
Sequence 16 is a Selftest sequence which can be used to test the LA100 using XLR leads
to connect the two units back to back. This sequence automatically selects the Selftest
tolerance in the LA102, so a PASSED or FAILED display will appear as soon as it has
finished. See section 10.6 if it fails.
400Hz test level
Sequence 17 is intended for testing FM transmitter systems where a 400Hz reference tone
is used and where the high frequency distortion and crosstalk tones are attenuated using a
50µs pre-emphasis curve (see below). Sequence 18 provides a sequence compatible with
German standards which specify distortion measured at +6dBu, sweep 20dB below 0dBu,
noise referred to +6dBu, crosstalk at +6dBu, W&F at 0dBu and phase at 10dB below
+6dBu. Sequence 19 provides a PPM (Peak Programme Meter) test using tone bursts and
reference levels. The user should compare the target levels shown in table 3.1 (and on the
LA101 display) with the peak meter readings. Note that this test sequence does not
generate any FSK as it is not normally used with an LA102 (although it can be used to
test the LA102 PPM available on level option 5).
PPM (peak programme meter)
Careful consideration has been given to the level at which crosstalk should be tested. Too
high a level can cause more, or less, crosstalk through overload, especially at high
frequencies if pre-emphasis is in use. Too low a level makes it more difficult to read
crosstalk in the presence of noise. While -10dB was considered it was felt too low to
allow discrimination from noise, even with the narrow band filtering in use in the LA102,
and so 0dB was adopted. Segment A gets round the problem partially by reducing the
level at high frequencies according to a 50µs pre-emphasis curve (-10.36dB at 10kHz)
with corresponding correction factors applied in the LA102. This will probably be most
useful in testing FM transmitter systems, where 50µs pre-emphasis and limiting are
applied. See section 4.1 for details of defining user sequences and section 4.5 for details
of altering segment levels.
Sequences need not be limited to the applications listed in their headings of course. Many
people will prefer to test cassette machines using sequence 11, and with type II or IV tape
the different high frequency saturation levels can be readily demonstrated by running
sweeps at different levels. See section 4.18 for details on running multiple sweeps.
The Lindos Default sequences were the only ones provided in early LA100 units. In
response to demand from users, the number of inbuilt sequences now exceeds 100, and
for ease of access they are arranged in sequence banks.
While the inbuilt sequences provide a variety of useful sequences, many users will want
to define their own sequences and this is readily achieved using the sequence editor built
49
3. Sequence Testing
Page 50

into the LA101. This is essential if some of the less common test segments are to be used
as they are not all provided in the default sequences. In particular, the slow, 20s,
frequency sweep (segment S), the MOL test (segment H) and the user level segment (K)
are extremely useful. Sequence editing is very simple and is explained fully in chapter 4.
3.10 Interpreting Sequence ResultsInterpreting sequence results Relative measurements
A slight caution is needed with regard to the 5 second sweep used in the default
sequences. This gives a quick accurate result for most purposes, but because it is quite
fast it is subject to the normal limitations found on any sweep system or spectrum
analyser with regard to very steep filters. Low pass anti-aliasing filters for digital
systems, for example, cannot be expected to show their true rate of roll-off if the rectifier
cannot follow the change quickly enough. Ringing and sidebands can also lead to small
errors, and low frequency overshoot can sometimes be observed as the result of a
complicated interaction between the output of a high pass filter and its own ringing; even
though this is not present in static tests. None of these effects need be feared on normal
tape machines etc. but if in doubt always confirm with a manual test or use the 20 second
sweep segment (segment S) instead.
In very extreme cases the LA102 may fail to take a valid speed or phase measurement and
will indicate this by showing -999° for an invalid phase measurement or -99.9% for an
invalid speed measurement. This is very unlikely even on very poor quality cassette
machines.
Tape speed
Some clarification of working levels may be appropriate. Distortion measurements are
truly relative, (ie harmonic separation) based on the measured level of signal received, but
the specified level of the distortion test is of course relative to test level. If TL OUT reads
+2dB and the distortion segment operates at +8dB then the measurement was actually
done with an output level of +10dB. Crosstalk and noise measurements are relative to the
measured test level on the measured channel.
Reference level
As with any test system, very low level measurements will also be limited by the
performance of the oscillator and measuring set (see specification in appendix J),
although generally this is unlikely to be a problem. If in doubt, run the sequence with the
LA101 connected directly to the LA102.
3.11 Single Channel OperationSingle channel operation Sequence channel Mono sequence
Sequences normally measure the left channel of a system and then the right channel by
repeating every segment. It is therefore much quicker, when testing a mono circuit, to run
the sequence only once, on the channel to be tested. This is readily achieved by pressing
the
key on the LA101 when in SEQ mode. The display will cycle through L, R and
L+R. When a sequence number is entered the sequence will run on the channels
indicated.
50
3. Sequence Testing
Page 51
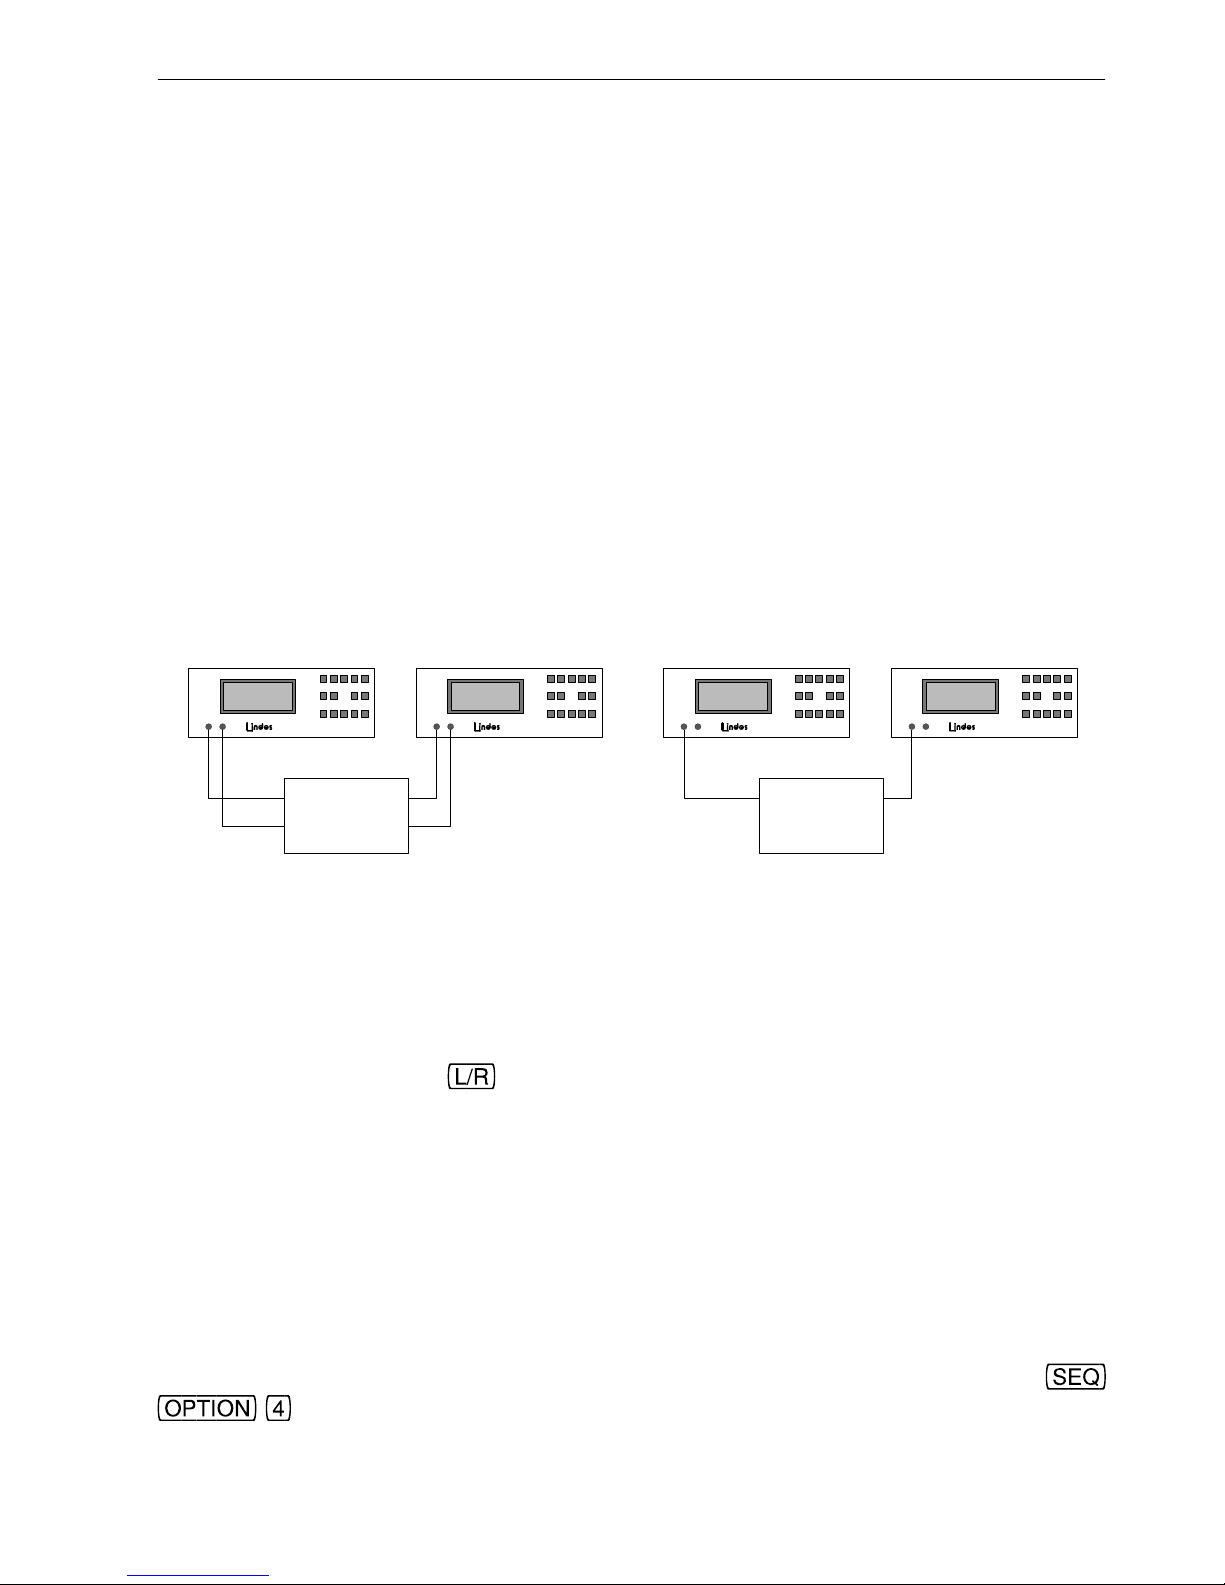
When running a sequence the FSK data and test tones are generated on both output
channels and the LA101 instructs the LA102 which channel to use via data embedded in
the FSK header. When testing stereo equipment, both channels are normally connected
through the device under test, as shown in fig. 3.15. When testing mono equipment the L
input on the LA102 should be used, as shown in fig. 3.16, and the LA101 should be set to
run the sequence for the L channel only. This is because the LA102 normally only
decodes FSK data on its left channel. It is quite permissible though, to connect both
channels through a stereo system and then run the sequence on the right channel only (by
selecting the R channel on the LA101). In this case the FSK will be decoded on the L
channel, but it will instruct the LA102 to measure on the R channel.
It is also possible to connect the LA101 L channel output directly to the LA102 L channel
input, and then connect the R channel through the system under test. This can be useful
where the system under test is unreliable at passing FSK; for example a loudspeaker or a
notch filter. See section 3.13 for further details.
DEVICE
UNDER
TEST
LA101
LA101 AUDIO OSCILLATOR
LA102
LA102 AUDIO MEASURING SET
DEVICE
UNDER
TEST
LA101
LA101 AUDIO OSCILLATOR
LA102
LA102 AUDIO MEASURING SET
Fig. 3.15 Testing a Stereo Device Fig. 3.16 Testing a Mono Device
A sequence that contains no FSK segments, such as the PPM test sequence, will only run
once and will not repeat for the second channel like most sequences do. Changing the
channel selection with the
key will have no effect on these sequences as this setting
only influences the channel that the LA102 will measure on − not the physical output
channels. Full control of output channels is possible from within a sequence using
channel control segments and full details are given in section 4.22.
Note that phase and W&F segments are only sent once in a two channel sequence
(because phase is measured between the two channels and W&F is assumed to be the
same for each channel).
FSK decoding on either channel Phase segments
Note for advanced users: Although the LA102 normally only decodes FSK on the L
channel, it is possible to make it decode FSK on either channel by pressing
immediately before running the sequence. This feature can be used when
51
3. Sequence Testing
Page 52
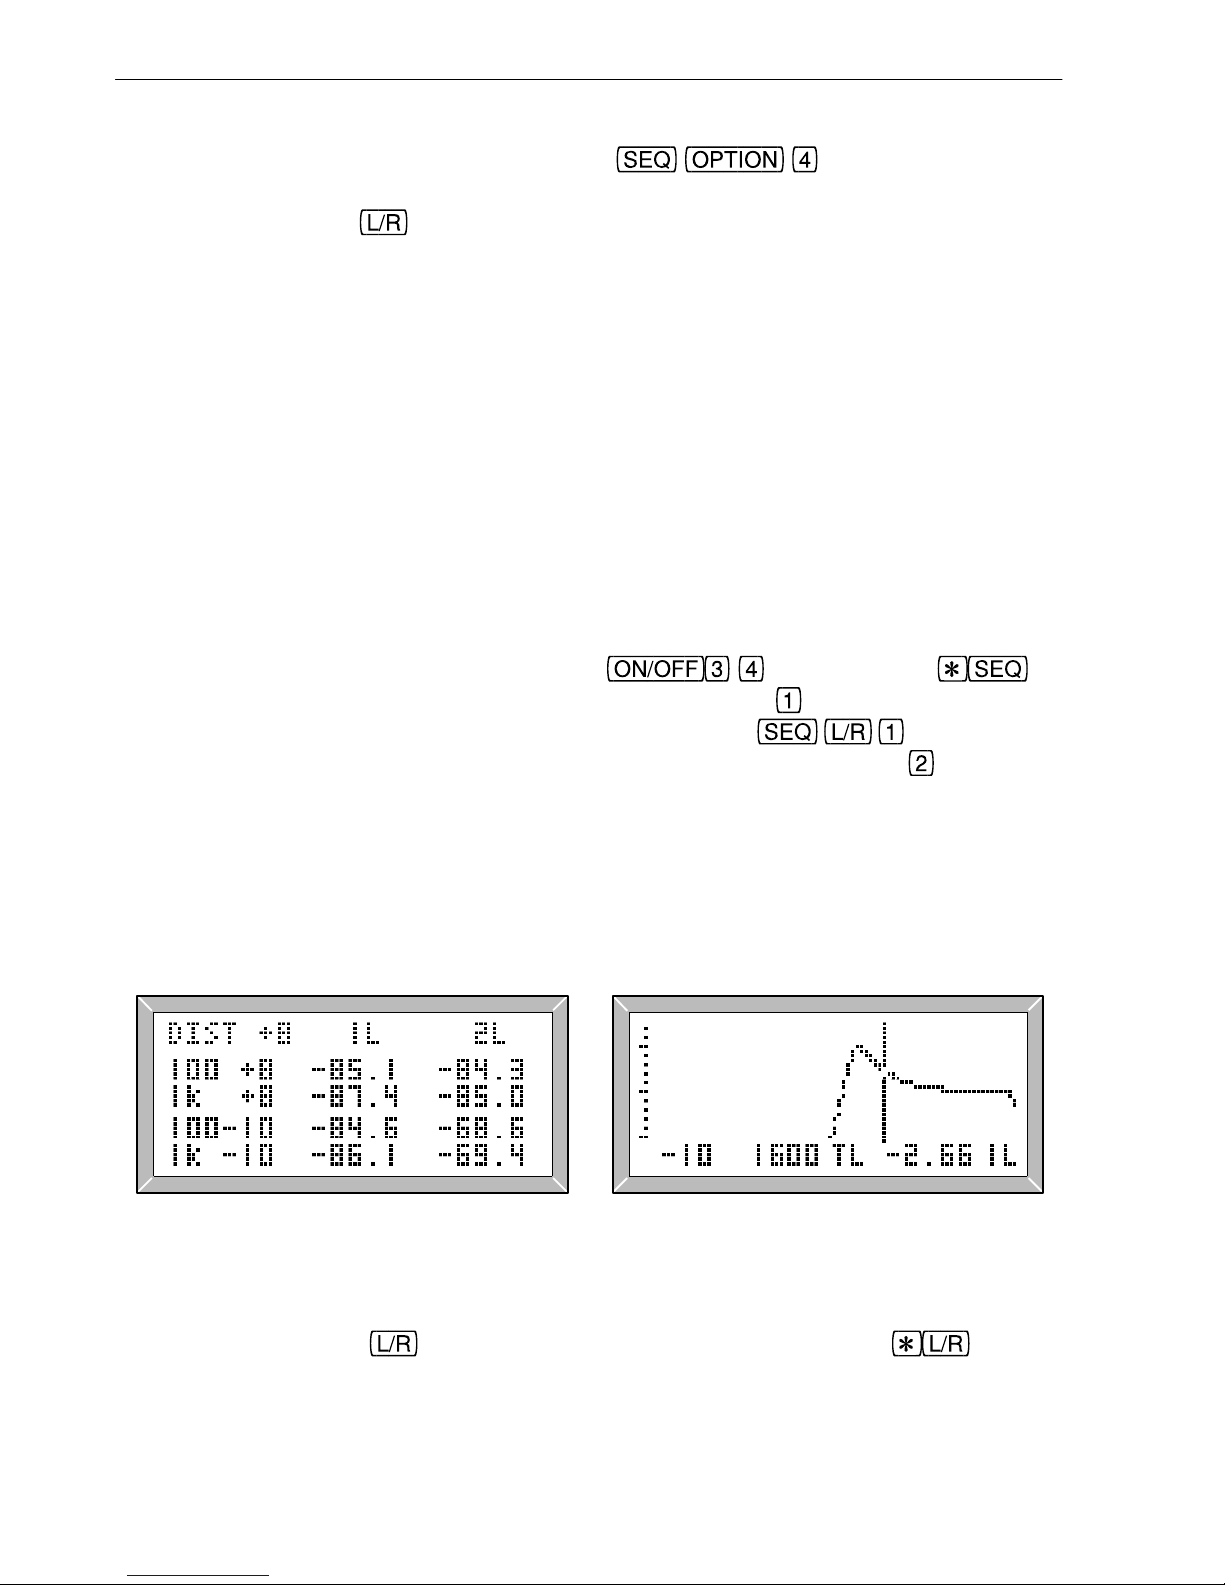
testing two independent mono communication channels. Set LA102 configuration Y1 to
automatically store sequence results and press
. A sequence can now
be sent to the LA102 L channel input by running a sequence with the L channel selected
on the LA101 (press
on the LA101 when in sequence mode to set the LA102
measurement channel). Another sequence can now be sent with the R channel selected
and this will leave the results for the first mono channel in memory 1 and the results for
the second mono channel in memory 2.
3.12 Single Register OperationSingle register operation Comparing two mono tests
Each results memory has two registers, numbered 1 and 2, which are are normally used to
hold the left and right channel results respectively. However, it is often convenient to
compare the results of two separate mono test runs on a single printout or display, and this
can be done using ‘single register’ operation to use the two results ‘registers’ separately.
Each register will then hold results for a single channel (and either register can hold L or
R channel results).
To run two mono sequences and store the results in the two registers for comparison, first
clear the LA102 results memory by pressing
and then press on
the LA102. The display will show
SEQ and REG?. Press on the LA102 to select
register 1 and run a single channel sequence test by pressing
on the LA101.
The results will be stored in register 1. Now repeat the operation but press
to make the
LA102 use register 2.
The results will be displayed and printed as for normal stereo results, but the column
headings will show the register numbers ‘1’ and ‘2’ in addition to the channel letter (L or
R). Note that it is quite permissible to have two sets of L channel results, one in each
register, as shown in fig. 3.17.
Fig. 3.17 Results for Two Registers Fig. 3.18 Register 1, L Channel
Frequency response graphs also indicate both the register number and the channel letter
(see fig. 3.15). Use the
key to switch between the two graphs and to show
the difference between the two responses (register 2 minus register 1) This can be useful
when comparing a frequency response in register 2 against a reference response in
52
3. Sequence Testing
Page 53
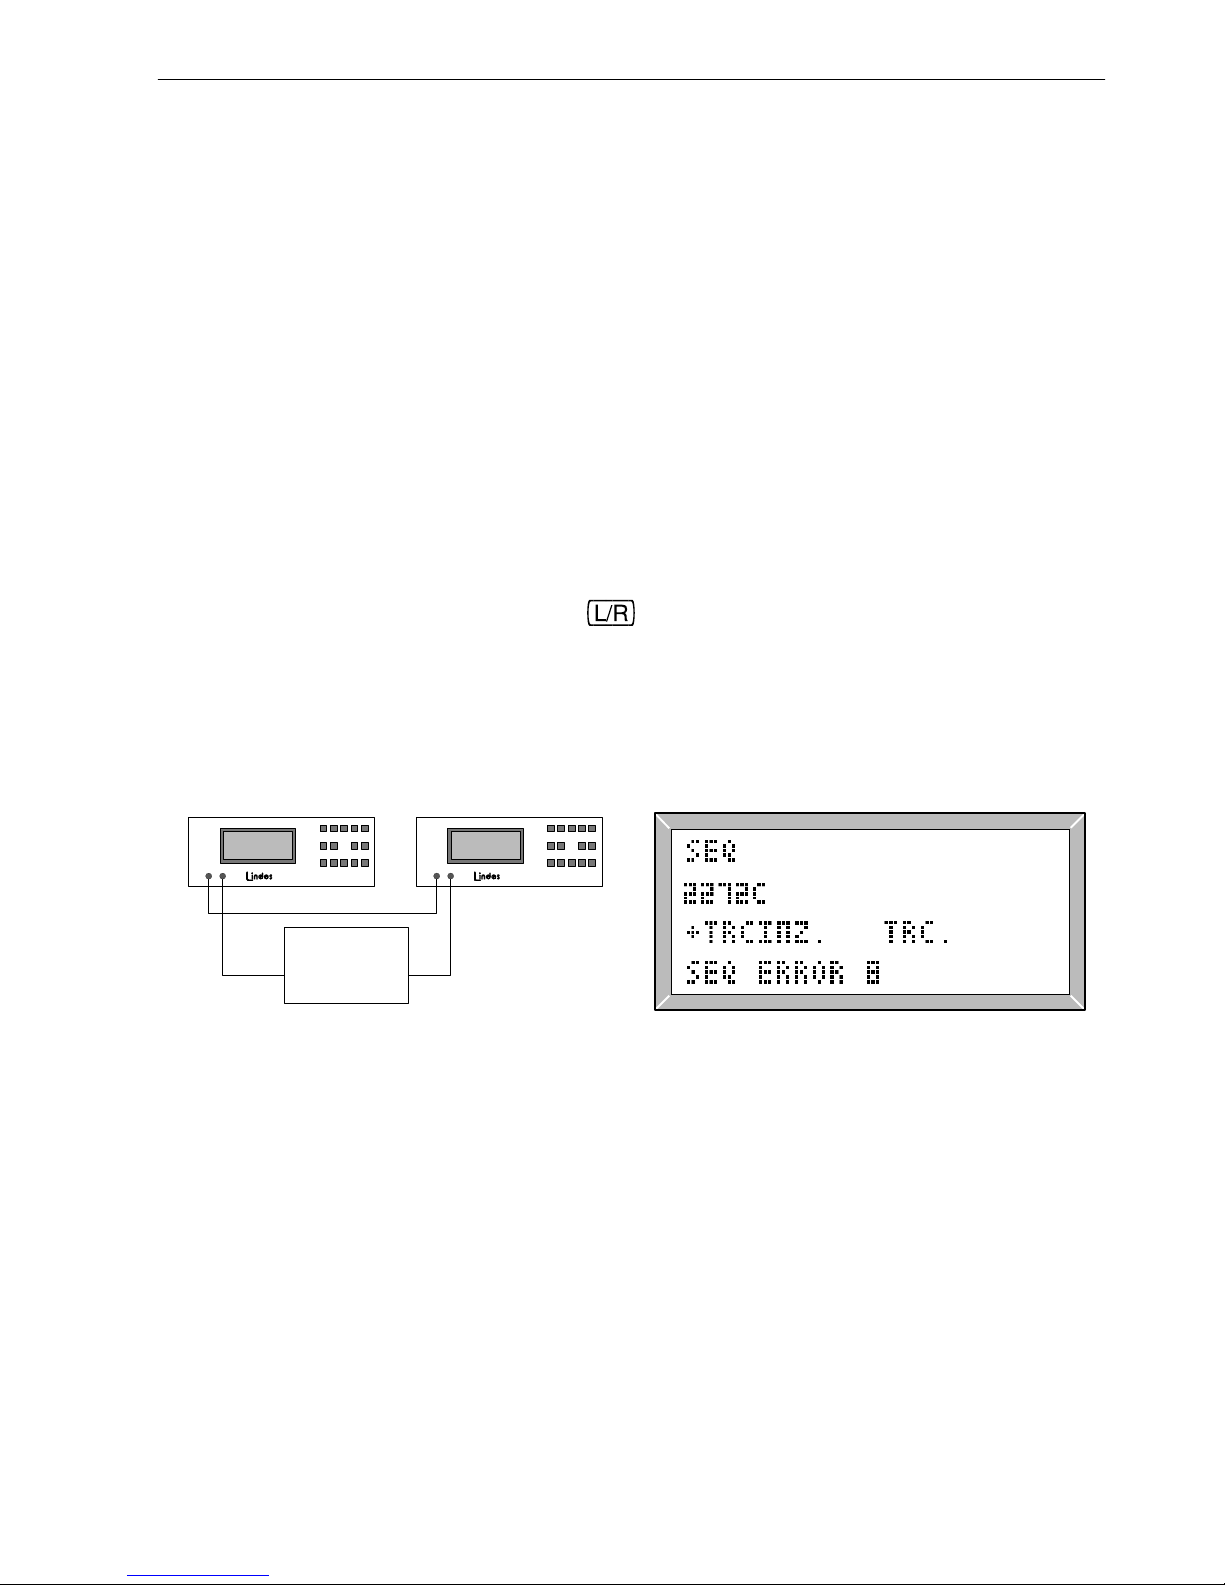
register 1 (perhaps from a reference tape, or from a device which is known to be good).
3.13 FSK Failure − Error CodesFSK failure Sequence error Sequence failure FSK speed tolerance
The FSK system used is very effective in coping with speed errors on tape replay, because
of the repeated resynchronising that it provides (the FSK itself will tolerate speed errors
up to ±4%). For optimum FSK operation a signal level of 0dBu into the LA102 is
preferred, but levels between -30dB and +20dB are normally satisfactory, permitting use
on most professional and domestic equipment. Loudspeaker measurements have proved
very successful, using a microphone and pre-amplifier and relying on FSK operation, but
careful microphone positioning is sometimes required as room reflections can cause
delayed interference with the FSK. Similarly systems that ‘ring’ badly, have extreme
group delay or do not pass the FSK frequencies (1650Hz and 1850Hz) may cause FSK
failure, which is indicated by an error message. In many such cases triggering can be
guaranteed by a direct connection between the units on the L channel, with the input to be
measured applied to the R channel, as shown in fig. 3.16. The R channel should now be
selected on the LA101 by pressing the
key when in sequence mode (note that the
FSK is still transmitted and decoded on the L channel even though the LA102 will now
take measurements on the R channel). ‘
SEQ ERRORS’ 1 to 8 usually indicate FSK
failure (as shown in fig. 3.20) and a full list of error messages, together with explanations,
is given in appendix E.
DEVICE
UNDER
TEST
LA101
LA101 AUDIO OSCILLATOR
LA102
LA102 AUDIO MEASURING SET
Fig. 3.19 A Separate FSK Path Fig. 3.20 FSK Failure Message
3.14 Sweep HeadroomSweep headroom Sweep failure Sequence failure Testing filters Sweep overload
Since the LA102 cannot be allowed to autorange during a sweep, and has no way of
knowing how high the signal will go in advance of the sweep, it is necessary to allow a
certain amount of headroom in the measuring set. Generally, the default sequences
provide sufficient headroom for most applications without losing too much resolution and
the user need take no action except where high accuracy is required, or where a signal
path has a large peak.
When testing systems with large peaks in the frequency response (such as one band of an
53
3. Sequence Testing
Page 54
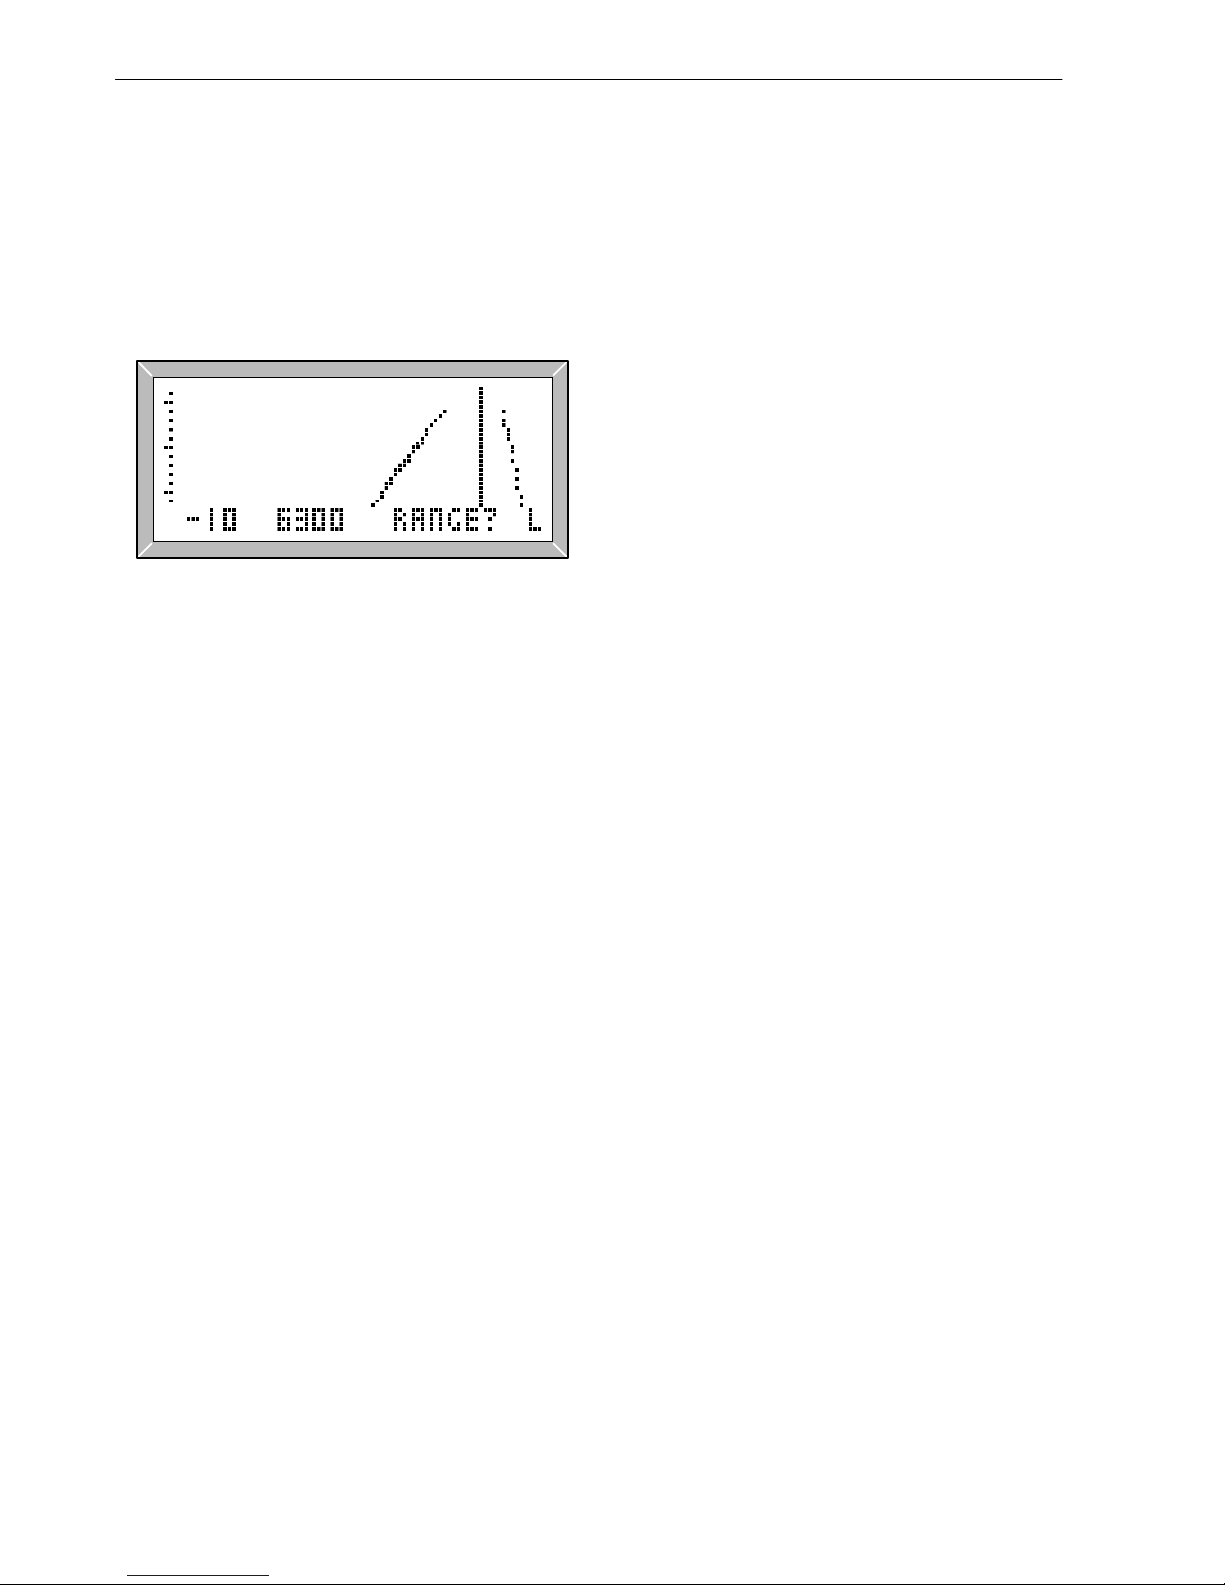
equaliser) more headroom may be required. An overload during frequency sweep
measurement is detected and the message
RANGE? is displayed in place of the level on
both the screen and the printout where an overload has occurred (see fig. 3.21). Since the
LA102 chooses its level based on the measured test level, a system which does not pass
the 1kHz test level tone may cause a similar problem. The following notes should give
sufficient information for most situations, but section 4.25 describes a technique for
setting sweep headroom for systems with very large peaks in frequency response.
Fig. 3.21 Overload During Sweep
When receiving segment U the LA102 assumes that a 0dB frequency sweep will be
received at a level similar to the measured test level and therefore uses the same range as
it used for measuring the test level (which itself was determined by autoranging on the
test level tone). If the sweep segment has a measurement level (see section 4.5) other
than 0dB then this is taken into account. Sweep segment U at 0dB therefore has 9dB of
nominal headroom, while all of the other sweep segments all provide an extra 10dB,
giving 19dB of headroom, but slightly less resolution.
When testing very flat systems segment U should be used to achieve the best resolution
and accuracy (when measuring a 0dB signal on the 0dB range the resolution is around
0.01dB, but when measuring a -20dB signal on this range it is around 0.05dB). If
necessary segment U can be used at a level other than 0dB by giving it a measurement
level (see section 4.5).
When testing a system with a large peak in the frequency response it is best to use a
segment other than segment U (if a 0dB sweep is required this can be achieved by giving
the sweep segment a measurement level of 0dB, see section 4.5). If an overload still
occurs, then the test level segment can be run at a higher level to make the LA102 use a
higher range for the frequency sweep (ie change
TR0 to T+10R0). Alternatively, a
repeating sweep (as found on sequences 15 and 20) can be used.
When testing a filter with a narrow pass band it is best to run the test level segment at the
filter centre frequency. This also means that the test level result will indicate the gain of
the filter at its centre frequency which is generally more useful than at the 1kHz default.
54
3. Sequence Testing
Page 55
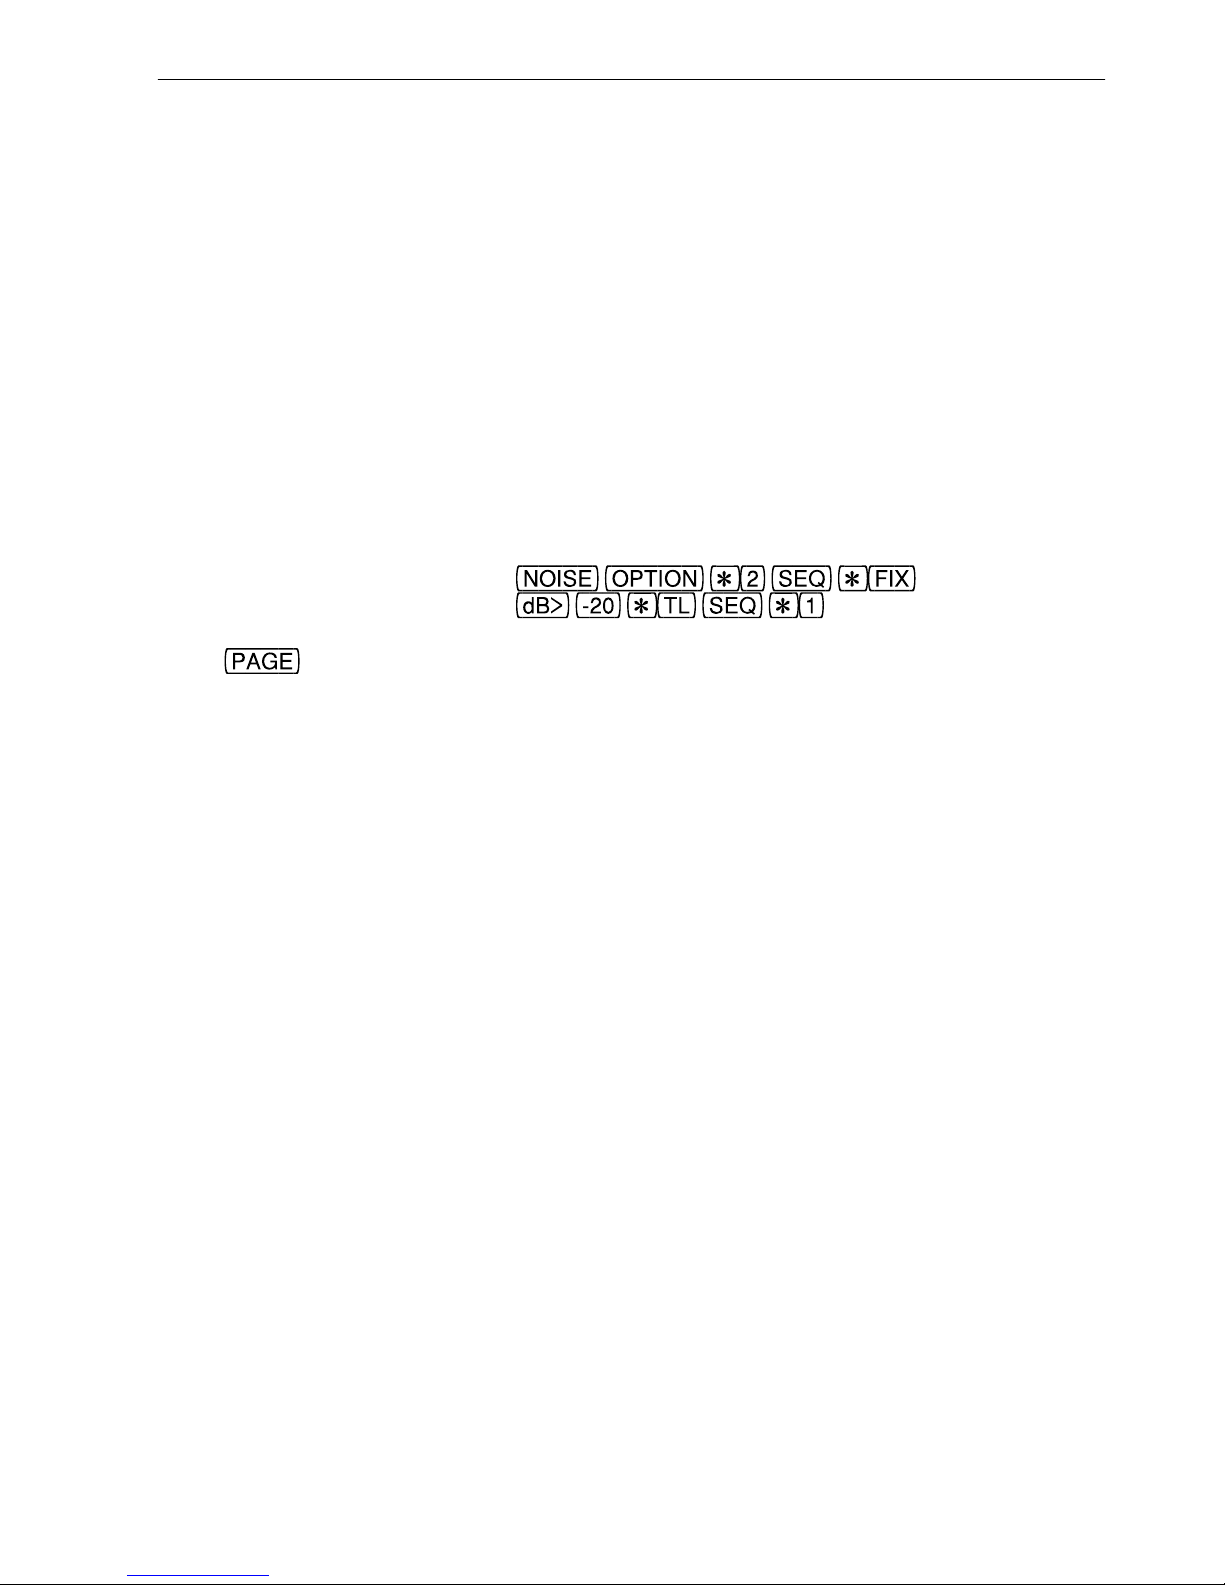
The LA102 will now measure the filter’s gain correctly and choose a range which will be
sufficient to handle the peak level. For example, when testing a 6.3kHz narrow band-pass
filter the sequence
!T6300,1000,0U should be used, and full details are given in section
4.16.
Repeating sweeps (as used in sequences 15 and 10) use the same rules for the first sweep,
but will autorange between successive sweeps to ensure that the optimum range is
selected, so it does not matter which segment is used − the results will always be accurate
after two or three sweeps. Note that this allows sweeps at low levels to be run and
accurately plotted.
An example for experienced users:
(the following assumes sequence 6 contains the Lindos default sequence)
Try sweeping the CCIR weighting filter in the LA102 (at -20dBu):
LA102:
LA101:
Press
and move the cursor to 6300Hz where the the CCIR filter peaks. The
LA102 will display
RANGE? to indicate that an overload occurred (fig. 3.21). To correct
this change sequence 6 in the LA101 to one of the following and repeat the test
(remembering to set the -20dBu test level before running the sequence):
T+10 U Run segment T 10dB higher
!T6300,1000,0 U Run segment T at frequency where peak occurs
TU< LA102 changes range between repeating sweeps
3.15 Peak Programme Meter (PPM) TestingTone bursts Meter testing Testing meters
The PPM test sequence generates a series of tone-bursts and reference levels for testing
the meter ballistics and level accuracy of a Peak Programme Meter, as required by the
relevant standards. With practice it is possible to verify correct PPM operation in a single
run, looking for the peak excursions on tone bursts. For development work the individual
tone bursts can be run over and over again using single segment operation (section 3.23).
Five tone bursts are used to test the meter ballistics and in each case the expected target
which the PPM should reach is shown on the LA101 display after the tone burst. A 5s
delay follows each tone burst to prevent retriggering before the meter has settled properly.
After the tone bursts seven levels are generated for 4s each ranging from PPM7 down to
PPM1 to enable the level accuracy to be checked.
Ballistics
55
3. Sequence Testing
Page 56
Segment Frequency Duration Level Target Reading
1. 5kHz 100ms +8dBu PPM6
2. 5kHz 10ms +8dBu PPM5½
3. 5kHz 5ms +8dBu PPM5
4. 5kHz 1.5ms +8dBu PPM3¾
5. 10kHz 0.5ms +8dBu PPM1¾
6. 1kHz 4s +12dBu PPM7
1kHz 4s +8dBu PPM6
1kHz 4s +4dBu PPM5
1kHz 4s 0dBu PPM4
1kHz 4s -4dBu PPM3
1kHz 4s -8dBu PPM2
1kHz 4s -12dBu PPM1
Note that the PPM test sequence 18 does not output any FSK and therefore only runs once
(even if both channels, L+R are selected). Other meters can also be tested by
programming the suitable tone bursts (see section 4.16).
3.16 Normalisation of Frequency ResponseGraph normalisation 400Hz normalisation
Frequency response graphs are usually normalised to 1kHz initially (ie the 1kHz level is
set as a test level) with each channel being normalised independently to its own 1kHz
level. However, other frequencies can be used for normalisation by setting configuration
J1 for 315Hz, J2 for 400Hz or J3 for 1kHz. Alternatively, absolute results (in dBu) can be
displayed by setting configuration J0.
TL on frequency response graph absolute level Test level on frequency response graph
This default normalisation can be overridden when the graph is displayed by pressing
to turn test level on and off. The letters ‘TL’ indicate that the displayed level is
relative to a test level (similar to the test level facility in manual mode), and initially the
test level will be set so as to normalise the frequency response results to a frequency
determined by configuration J (as described above). Pressing
when ‘TL’ is
displayed will turn the test level off causing the frequency response results to be shown as
absolute levels (in dBu). Pressing
again will set the test level to the displayed
cursor level, normalising the results to the frequency at the cursor; so positioning the
cursor at 100Hz and operating
twice will leave a graph normalised to 100Hz
(leaving the graph display resets the test level to its default). Printed graphs are not
affected by the test level setting as they always use the normalisation determined by
configuration J.
Normalisation operates independently on each channel, so it is quite possible to normalise
the left channel to 315Hz (using the
facility) while leaving the right channel
normalised to 1kHz. The difference graph is calculated from the normalised level on the
right channel minus the normalised level on the left channel, but it is also possible to set a
third, independent test level on the difference graph.
56
3. Sequence Testing
Page 57
3.17 Subtracting Reference Curves
The LA102 can subtract a reference response curve from the frequency response results.
This has many applications: loudspeaker and microphone measurements often need to be
corrected to allow for deficiencies in the system; similarly, record frequency response
measurements on a tape machine may be corrected to allow for errors in the replay
response.
The reference response should be measured either by using a normal Lindos test sequence
containing a frequency sweep, or by using the test tape or frequency sweep mode (see
chapter 6). The reference results should then be stored in one of the memories (by
pressing
and the memory number when the results are displayed). The results to be
corrected should be obtained in the same way and the reference results may then be
subtracted by pressing
when the frequency response is displayed and then entering
the memory number for the reference results. The frequency response results in memory
0 will be modified by subtracting the frequency response results in the reference memory,
but none of the other results will be affected.
The subtraction works by subtracting each sample in the reference memory from each
sample in memory 0. The left channel is subtracted from the left channel, and the right
channel is subtracted from the right channel.
The subtraction can only be used when configuration C1 is set, otherwise an error
message will be displayed (because if more than one frequency response curve was in
each memory it would not be clear which should be subtracted from which). The memory
to be subtracted must contain valid frequency response results covering the same
frequency range, otherwise it will produce meaningless results (eg do not subtract a 10Hz30kHz response from a 20Hz-20kHz response).
3.18 Tests Which Always Subtract a Reference Curve
Some measurements will always require the subtraction of a reference curve, and this can
be achieved by using the \n control segment which instructs the LA102 to subtract the
reference curve in memory n. The \n segment must appear after the frequency response
segment, otherwise the subtraction would occur before the frequency response had been
measured (the LA101 only sends this segment once, and if sending a two channel
sequence it will only send it when both frequency sweeps have been run). Some care
should be taken when using this segment to ensure that the correct reference curve is
stored in memory n before the sequence is received, and that LA102 configuration C1 is
set.
3.19 Oscillator WeightingsWeighting curves Filter testing Equaliser testing Testing filters
An oscillator weighting can be used when running sequences (see section 2.27). The
weighting is selected on the LA101 by pressing
in manual mode before running the
57
3. Sequence Testing
Page 58
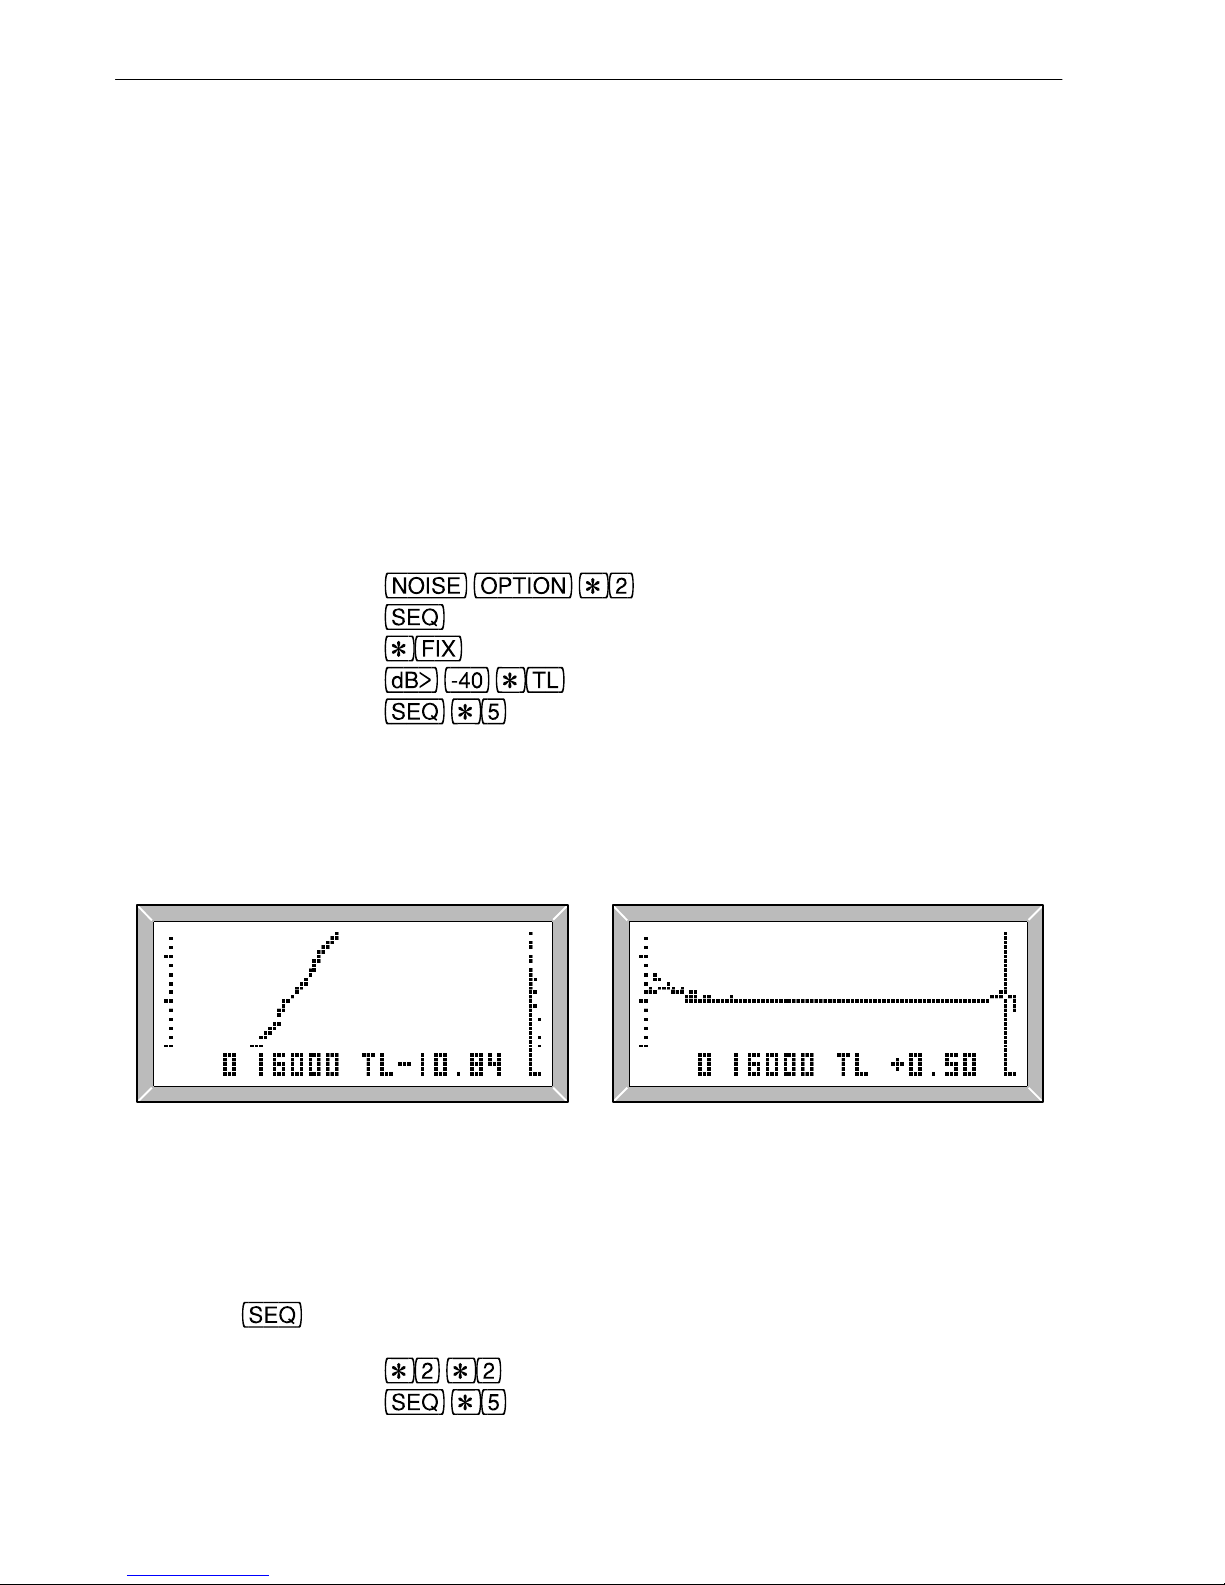
sequence, and the weighting name will appear at the top of the screen (in manual and
sequence modes). As the LA101 can only apply weightings to third octave frequencies,
some segments cannot be used. In particular, segments
O, S, X, Y, Z, !, c, d, o, r, u, x and
z are not allowed and will generate a CANNOT USE WEIGHTING error message if used.
Weighted frequency sweeps are possible using segments P, Q, R or U. A third octave
frequency sweep will be generated by these segments with fewer frequency steps than the
fine sweeps normally used. It is important to remember that the sweep only contains third
octave frequencies and the result will therefore be a stepped frequency response graph,
but this is quite satisfactory for most purposes. This feature allows filters to be tested by
using an inverse weighting curve to obtain a flat frequency response (providing the curve
is not too steep and covers a suitable level range).
As an example, we can test the CCIR weighting filter in the LA102. First of all, try
testing it with a normal, flat frequency sweep:
LA102:
Select CCIR RMS measurement
Enter sequence mode
Test the LA102 CCIR filter
LA101:
Set a test level of -40dB
Run sequence 10 (repeating sweep)
The result is shown in fig. 3.23, but accuracy has been lost due to the steep roll-off of the
filter, the slowness of the rectifier to respond to the rapidly changing level, and the large
dynamic range over which the measurements have been taken.
Fig. 3.23 Test with a Flat Sweep Fig. 3.24 Test with a Weighted Sweep
The solution is to use a weighted frequency sweep using the inverse of the CCIR
weighting filter, as provided by the LA101. Stop the LA101, and return to manual mode
by pressing
, leave the -40dB test level set and then enter the following:
LA101:
To select CCIR-inverse weighting
Run sequence 10 (repeating sweep)
58
3. Sequence Testing
Page 59
This time the result will be a flat frequency response, as shown in fig. 3.24. By using a
weighted frequency response with the inverse characteristic of the filter under test we
have measured the deviation from the ideal response and the cursor can now be moved to
any frequency to read the frequency response error. This gives more accurate results than
a flat sweep as it was measured over a small dynamic range with no steep slopes.
The CCIR 468-4 weighting curve specification shown in fig. G.2 (appendix G) demands
that the response at 16kHz should be -11.7dB within ±1.6dB. The display in fig. 3.23
would suggest that the 16kHz response is +0.86dB high, but we know that the accuracy is
dubious, and we haven’t checked the 6.3kHz level which should be used as a reference
level (since its tolerance is 0). Using the weighted sweep (fig. 3.24) allows us to read the
error directly from the graph. By moving the cursor to the 6.3kHz frequency and setting a
test level by pressing
twice we can examine the errors at other frequencies relative
to the assumed 0dB error at 6.3kHz, as required by the specification. As fig. 3.21 shows
the actual error was +0.50dB (less than the +0.86dB measured earlier) and well within the
allowed ±1.6dB tolerance. A manual test using steady tones gives exactly the same
+0.50dB value.
Most filters can be tested in this way. Enter the filter’s response into the LA101
weighting editor and press
to obtain the inverse response. Select the user
weighting in manual mode, by pressing
and run a sequence containing a suitable
sweep segment. Note that the LA102 does not need any special settings (the operations in
the above example were to force it to test its own internal filter for demonstration
purposes − see section 3.24).
Some care is needed with filters which have very deep notches. For example, if a filter
rejects 1kHz by 90dB, then this technique would require a level of +90dBu in order to
obtain a 0dBu output, and this is clearly impractical. In such cases the weighting should
be modified so that the system is not overloaded and the results around that frequency
should be ignored. Weightings can also be switched on from within a sequence definition
- see section 4.29.
3.20 Automatic Results StorageSequence results − automatic storage
The LA102 can be configured to automatically store sequence results in the next available
memory by setting configuration Y. This is provided for receiving several sequences at a
remote site without user intervention and is especially useful for receiving overnight test
transmissions. It can also be useful where several sets of sequence results need to be
recorded for later examination or simply for logging the last few tests for reference. The
LA102 can be configured to power up in sequence mode, and automatic results printing is
also possible (see section 3.4).
Setting configuration Y1 (
AUTO STORE SEQ RESULTS, IN MEMORY 1 NEXT) will
cause the sequence results to be stored in memory 1 immediately they are received.
59
3. Sequence Testing
Page 60
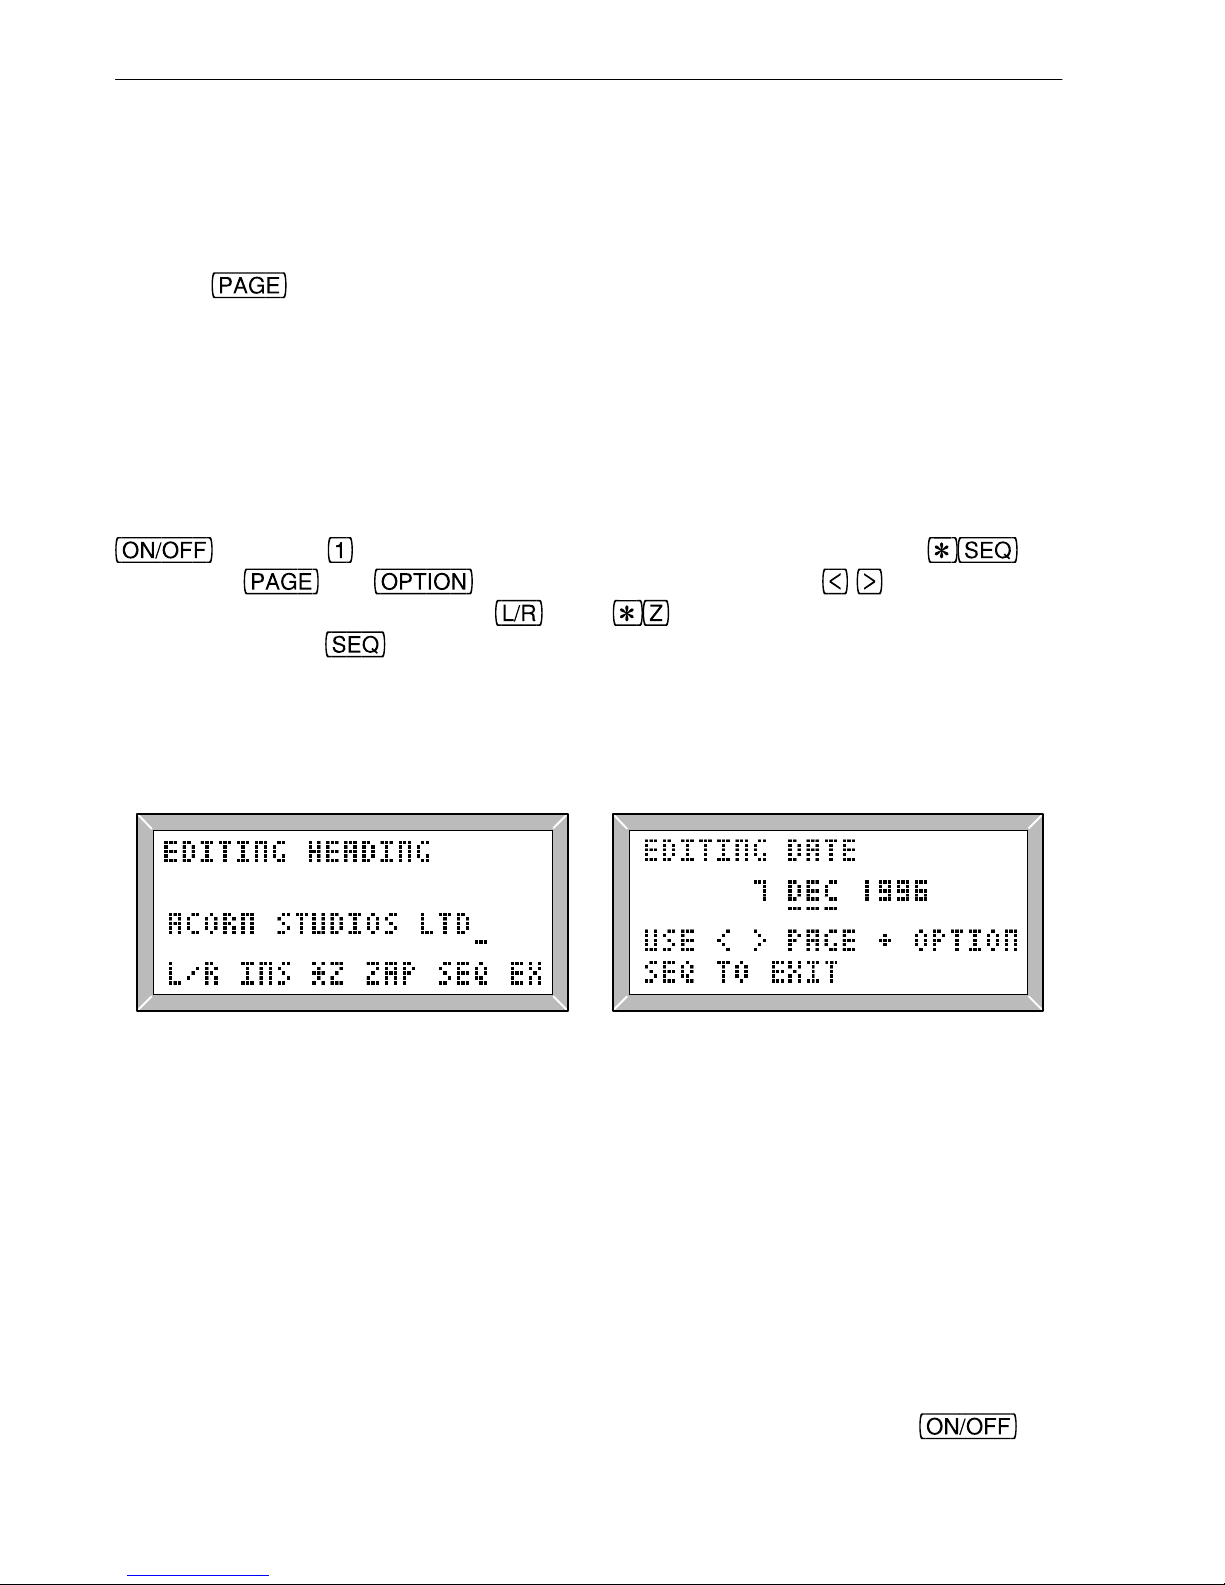
Configuration Y will then be advanced to 2, so the next set of results will be
automatically stored in memory 2, and the LA102 will remain in sequence mode, waiting
for the next sequence. When all of the available memories have been used configuration
Y will return to 1 and the first results will be overwritten by the next sequence. Memory
0 (the current memory) always contains the latest results which can be displayed by
pressing
in the normal way, and the results can easily be identified by the cycle
character appended to the LA101’s serial number. Note that the number of memories will
depend on the setting of configuration C (see section 4.18) and whether any user
tolerances are defined.
3.21 Printout HeadingPrintout heading Heading on printouts Sequence heading on printouts
A message (up to 40 characters), such as a company name or receiving station can be
entered into the LA102 to be printed at the top of every printout (as in fig. 3.11). Hold
and press to display the Tolerance Editor Menu and then press (fig
3.25). The
and keys now move the cursor, the keys change the
character at the cursor and the
and keys insert and delete characters
respectively. Press
to exit. All of the editing keys available in the tolerance editor,
operate in this mode, and full details are given in section 5.6 while a summary of the keys
can be found in the quick reference card. The LA101 source message is edited in a
similar manner (see section 4.3).
Fig. 3.25 Printout Heading Fig. 3.26 Setting the Date
3.22 Printout DatePrintout date Date on printouts Setting the date Date setting Computer support software Editing the date
It is sometimes convenient to include a date heading with results printouts and this is done
automatically if the results are printed using the Lindos Support software (see appendix
A.2). The LA102 can also print the date at the top of a test sheet (as shown in fig. 3.11),
but it does not have a real-time clock so it is necessary for the user to ensure that the date
is set correctly each day it is used.
The date is stored in non-volatile memory and can be changed manually every day or can
be made to advance by one day every time the unit is switched on. Hold
and
60
3. Sequence Testing
Page 61
press to enter the date editor shown in fig. 3.26. Use the and keys to change the
date by one day. The
and keys can be used to move the cursor under the
month or year so that
and will change them quickly. Press to exit.
Configuration X controls the date operation and the default X0 does not print the date.
Setting X1 will cause the date to be printed at the top of every test sheet and also
displayed on the start up screen (as a reminder). Configuration X2 is similar to X1 but
causes the date to be automatically advanced by one day every time the unit is turned on
and this will be useful when the unit is controlled by a mains power timer, or when it is
switched on once at the start of every day. When configuration X1 or X2 is set the date
will be printed at the top of every printout. When using the Lindos Lin4win Windows®
support software, the date is set to that of the host computer each time the LA100 is
addressed by the PC.
3.23 Running Single SegmentsRunning single segments
Lindos test sequences are built from individual test segments. For example, sequence 11
consists of the segments TRCIN and Z. Usually the entire test sequence is run, taking
about a minute, but occasionally it can be useful to run a single segment on its own. For
example, suppose a sequence test reveals that the noise results are very poor. The
connecting leads are suspected and replaced, and then need to be tested. It would be
possible to use the LA100 in manual mode to check the results, or it would be possible to
run the entire test sequence again to see if any improvement is observed. A much quicker
way though is simply to run the noise segment again, on its own, taking a few seconds.
To run a single segment press
on the LA101, enter the sequence number in the
usual way, and then enter the segment number (in each case the numbers 6 to 10 are
represented by
to as usual). Segment 1 is the first segment (usually segment
T), so pressing
will run the fifth segment in sequence 1 which is noise
segment N. The LA102 may generate a warning message (‘
SEQ ERROR 12’) to indicate
that the old results have been over-written by the new results, but this warning can be
safely ignored as the old results are no longer needed.
Sequence error 12
When finished the LA101 will prompt for another segment number (from the same
sequence). Pressing
will remove the segment number prompt and allow a
different sequence to be selected. Press
to run the last sequence or segment again.
After running a single segment the output is normally silenced (to the DC0 state), but
some segments cause their tone to be held after they have finished (segment T for
example), allowing the tone to be checked manually if necessary. The LA102 will remain
in sequence mode, waiting for further segments to be received, and the
button
should be pressed to see the results when all of the segments have been sent.
An alternative way to run a segment is to run a sequence in the normal way and then
interrupt it by holding the
key to make the LA101 prompt for a segment number.
61
3. Sequence Testing
Page 62
Single segments can be run on a single channel by pressing as described above
and then selecting the channel by pressing
.
Single segments only overwrite their own segment (or segments of the same type) in the
LA102 leaving the rest, but running a whole sequence always clears the results memory
completely, ready for the new results. Some segments, such as crosstalk and noise, give
measurements relative to the measured Test Level from a test level segment, and if such a
segment is run on its own it is important that the LA102 has a test level segment in its
results memory (ie from a T segment run previously).
Notes for advanced users:
1. If multiple results compartments are configured and single segments are run they will
be added to the results in the results memory. So setting configuration C3 and then
running 3 noise segments will leave all three sets of noise results in memory, and allow
them to be stepped through by pressing
in the normal way. Running a fourth
noise segment will overwrite the first and generate
SEQ ERROR 12 to indicate that some
results have been lost.
2. It is the + segment which causes the LA102 results memory to be cleared by a new
sequence, and this is automatically generated whenever a sequence is run. It can also be
defined within a sequence definition and then run as a single segment to achieve the same
effect.
3.24 Using Filters for Sequence Measurements
For advanced users: The LA102 measurement option selected in manual mode
normally has no effect on sequence measurements which are determined by the test
segments used. However it is possible to test the LA102’s internal filters and rectifiers by
forcing them to be used for all test level and frequency response measurements. To do
this, first select the measurement option (in manual mode) to be tested and then press
(the option name will be displayed). Some care is needed when using this
mode to ensure that the internal circuits are not overloaded because all but the level
measurement options actually have an extra 20dB of gain built in. Similarly, anything
other than the rms rectifier may give unexpected results since the other rectifiers have a
much slower response. For these reasons, this feature is really for very specialist use, as
well as for testing the internal filters and rectifiers of the LA102. See the examples on
testing the CCIR filter in section 3.14 and 3.19.
3.25 Remote TriggerRemote trigger Automatically running a sequence Triggering a sequence remotely Sequence triggering
It is possible to make the LA101 automatically run a sequence, triggered by a remote
push-button or timer circuit connected to the serial DIN socket on the LA101, and this is
useful where the LA101 is positioned away from an operator, perhaps at a remote or
62
3. Sequence Testing
Page 63

unmanned site. This can also be used for generating overnight test transmissions under
timer control.
The application of a voltage in the range +3 to +12V to pin 3 relative to pin 1 (see
appendix C.1) for at least 300ms initiates transmission of sequence 1. The sequence can
of course be programmed as required. If the voltage is still present when the sequence
has finished then it will run again. (Note that this does not interfere with serial
communication data which never lasts for more than 120ms even at 75 baud).
3.26 Breaking into a Repeating Sequence
When testing a line or link with the oscillator at an unmanned site, or even when testing a
tape machine, it is often convenient to leave the LA101 repeating a sequence which can
then be ‘broken into’ at any time. The LA102 will generate a
SEQUENCE ERROR 8
(missed segments), if it only receives the last part of a sequence, but this can be safely
ignored as the LA102 will stay in sequence mode until the whole sequence has been
received successfully when it will go into page results mode (this is true for single
channel and for stereo sequences).
To generate a repeating sequence the sequence definition must have ‘
<<’ added to the end
of it, and this is explained fully in section 4.17.
3.27 CCITT O.33 CompatibilityEBU O.33 sequence CCITT O.33 sequence
Although work has been done using the EBU/CCITT O.33 specification for sequence
testing, this sequence has been removed with the development of our more versatile
system of segmented sequences. Our FSK format is based on the CCITT O.33
specification but the actual data carried in the FSK header and the test tones used are
different.
The O.33 sequence is primarily suited to instruments that measure simultaneously on both
channels. While this can potentially result in a shorter sequence time for given settling
times it carries a heavy penalty in complexity and cost and is only worthwhile if the
sequence has already been optimised for speed. Four factors determine the settling time
needed for each measurement on a line: group delay, echoes, autoranging, and switching
transients in the instruments. Group delay affects low frequencies the most, delaying
their arrival when frequency response is being measured, echoes are likely to effect low
level measurements such as distortion and crosstalk, which also require time to autorange
for greatest flexibility, and switching transients can be minimised by not changing
channels more often than necessary. For these reasons distortion and crosstalk deserve a
larger time allocation than simple level measurements, but the O.33 sequence allocates a
whole second to every measurement. It would be possible to implement a stereo O.33
sequence on the LA100 by reading both channels in turn during each tone, but it makes
more sense to minimise switching transients by changing channels only once and
63
3. Sequence Testing
Page 64

optimise the timings.
The Lindos sequence system is now in widespread use by several major broadcast and
telecommunications companies world-wide, in addition to the hundreds of smaller
manufacturers and studios, and it has become the industry standard. It is suitable for line
testing, but unlike the O.33 specification, Lindos sequences can also be used to test tape
machines which may have large speed errors (up to ±4%). Our system is also more
flexible because it allows the user to build test sequences from test segments, thus
enabling a sequence to be designed which contains only the tests which are required and
relevant for the device being tested (wow & flutter and MOL test segments for example,
which can be used to test tape machines, but clearly would have no place in line testing).
For these reasons, and because of its greater flexibility, the Lindos system is felt to offer
better performance at lower cost, and the O.33 sequence will not be included as standard,
though compliance with the CCITT and EBU measurement standards will be maintained
as far as possible.
64
3. Sequence Testing
Page 65

4.0 User Defined Sequences
User defined sequences Programmable sequences Setting up sequences Sequence number Source ID
The ten test sequences in LA101 Bank 0 are editable via the front panel, or remotely with
Lindos Lin4win software. All other sequences may be viewed, but cannot be edited unless
they are first copied into one of the user sequences (sequences 0-10 are held in RAM,
while the other sequences are held in EPROM). When new, or after reset (4), Bank 0
contains the Lindos default sequences. Many users find that these make good starting
points when designing their own sequences.
The Lindos sequence system is very flexible and easy to use. Each test segment is
allocated a letter, and a sequence is built by simply specifying the segment letters,
together with an (optional) number which specifies the level that the segment will run at.
A typical sequence is therefore around 10 characters long and easily entered from the
front panel using the up-down keys to cycle through the character set. It is also possible
to enter messages to be displayed when the sequence is run, or transmitted to the
measuring set via FSK (useful for source identification when testing lines and links).
A wide range of segments are provided (table 3.2, page 40) to perform all of the
measurements available from manual mode including level, noise, crosstalk, distortion,
wow and flutter, speed and phase. Extra measurements not available in manual mode
include frequency response (over different ranges) and maximum output level (MOL).
Various control segments allow channel and impedance selection, pauses and repetition of
segments or sequences.
Meter ballistics
Most sequences will be built from these Lindos test segments which the LA102
automatically responds to. However, it is also possible to construct a sequence of tone
bursts (section 4.16) and this has many uses: a sequence can be used to test the level
accuracy and ballistics of a meter, similar to the PPM test available on sequence 19;
tones can be defined with record response corrections for making a test tape or disc; audio
channel identification for video tapes using intermittent tones can be generated. It has
even been used to demonstrate DCC compression on Tomorrow’s World (a popular
science and technology programme on BBC TV) and to generate morse code messages to
identify communication channels via a satellite link into a war zone.
The sequence definition is entered into the LA101, where it is held in non-volatile
memory; the LA102 will automatically respond to the segment letters and levels which
are transmitted in the FSK header at the start of each segment without any programming.
Test sequences can be created to perform tests at different levels and it is possible to
perform the same test at up to 5 different levels (frequency sweeps at different levels can
65
Page 66

be used to test for compression effects on tape, for example). Some users define
sequences to test different pieces of equipment, and make each sequence select a different
tolerance within the LA102. For example, sequence 1 might be set up to test a Studer
tape machine and select the Studer tape tolerance, while sequence 2 might test a Sonifex
cartridge machine and select a suitable user tolerance. The sequences may even perform
exactly the same tests, but just generate different source messages, or select different
tolerances to be applied.
Sequence definitions can be entered using the built-in LA101 sequence editor or by using
Lin4win Support Software running on a remote computer. The latter approach allows
sequence definitions to be saved to disk and edited more easily.
Computer support software Storage on disk
Most users will find that they only need a few short sequences to meet their requirements,
and these can easily be entered using the LA101 keyboard. Since sequences are held in
non-volatile memory, they should not need to be entered again, although in case of a
battery failure it is best to keep a written copy, or a copy on disc using our support
software.
4.1 The Sequence Definition
The sequence definition begins with an optional sequence title (up to 21 characters),
within quotes, and is followed by a string of test segments, each comprising a single
segment letter, optionally followed by a segment level.
For example, the default sequence 1 is:
"GENERAL/TAPE TEST" T R C I N Z
The title string is displayed on the LA101 when the sequence is run, and the test segments
will measure test level at 0dB (T), frequency response at -10dB (R), crosstalk at 0dB (C),
distortion at +8dB and -10dB (I), CCIR weighted and unweighted noise (N), and phase
(Z). The full list of segments is given in table 3.2. To add a MOL test (segment H) and a
W&F test (segment W), and to make the sweep (R) run at -4dB, this sequence could be
changed to:
"GENERAL/TAPE TEST" T R-4 C I N Z H W
Sequences should usually start with a test level segment (T or V) as some other segments
use this as a reference (noise, for example is referred to the measured test level, while the
level range used to measure frequency sweeps is calculated from the measured test level).
Segment W if present, should be at the end of the sequence as its de-selection may create
a transient signal. Otherwise the order of the test segments is not important.
Test segments are indicated by a letter, A-Z or a-z, and the case is important (Z is not the
same as z). Some care must be exercised, especially when entering these characters
66
4. User Defined Sequences
Page 67

directly into the LA100 without a computer as the small, low resolution characters can be
confusing to new users, but they are soon learnt, and the segment description provided by
the LA101 can always be used as a confirmation.
When designing a sequence you should choose the measurements that you want to
include from the list shown in fig. 3.2 (page 40), and refer to the sections below for
further details on each segment.
Normally sequences will only contain one segment for each type of measurement (eg one
frequency sweep, one distortion measurement etc). However, it is possible to include
more than one segment of each type providing the LA102 memory is configured (by
setting configuration C) before the sequence is received, otherwise, a
SEQUENCE
ERROR 12
will result. See section 4.18 for further details.
The sequence may be up to 250 characters long (most sequences contain typically 10
segments, but messages and long lists of tone specifications can make them much longer).
It is possible to include messages of up to 21 characters within double quotes (") which
are displayed on the LA101 when the sequence is run. The PPM test sequence displays
the target values before each tone burst using message segments. The messages are
displayed as encountered and if referring to a segment should be placed before the
segment letter so that the message is displayed while sending the segment. The message
will remain on the display until another message segment is encountered. To clear a
message, simply use an empty message segment, ie "".
In addition to the test segments the sequence can include control segments (which are
allocated symbols, such as < % > ! etc). The message segment described above is a
typical example, and other control segments are provided, as shown in table 4.1. They
67
4. User Defined Sequences
Control Segments
!f,d,l Tone bursts/tone sets. !frequency,duration,level,frequency,duration... (section 4.16)
+"txt" Send txt message to the LA102 measuring set, up to 21 characters (section 4.3)
"txt" Display txt message on the LA101 display, up to 21 characters (section 4.1)
< Repeat last segment, until interrupted by a key press (section 4.17)
Repeating segment
<< Repeat whole sequence, until interrupted by a key press (section 4.17) Repeating sequence
±n Select tolerance n (1-20) in the LA102 (section 4.19) Selecting a tolerance
%n,m Set output impedance n (10, 75 or 600) in ohms and ZC mode m (section 4.20)
/n Set oscillator test level to ndB. (section 4.21)
:n,m Select physical output channel n and logical channel m (section 4.22)
physical channel
>n Run sequence n as a sub-sequence and then continue (section 4.23)
? Pause until a key is pressed on the LA101 (section 4.24)
^n Set sweep headroom to ndB. (section 4.25)
\n LA102 to subtract reference curve in memory n from sweep results (section 4.26)
-"txt" Generate O.33 compatible FSK header (section 4.28)
=n Select weighting to be applied to sequence (section 4.29)
Table 4.1 Control Segments
Page 68
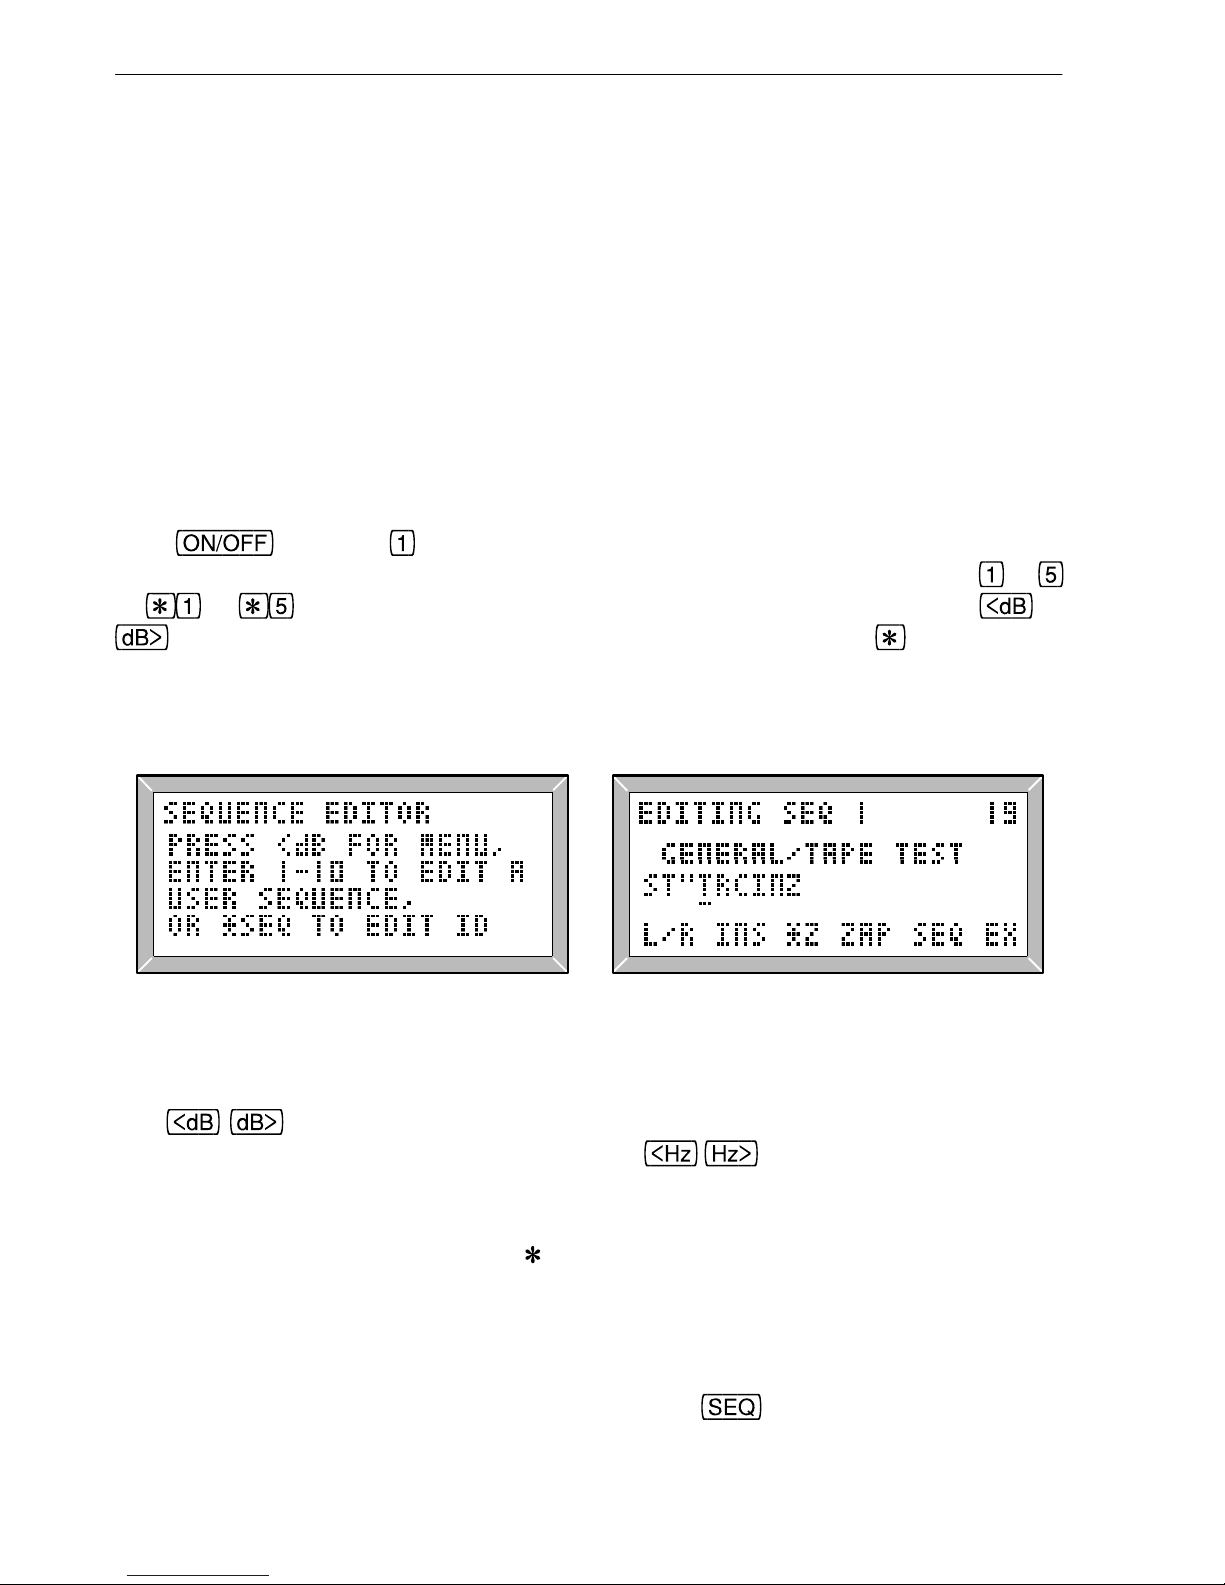
may be mixed freely with other segments and may occur several times within a sequence
although most will usually be positioned at the start of the sequence to set output
impedance, channel and sequence test level before the test segments. Control segments
only affect the sequence while it is running, and anything which they change will be
restored when the sequence has finished.
Note for computer users: Because of the limited character set of the LA100, it is best
to use only the characters shown in section 4.2 within comments. Capital letters are
preferred. Double quotes enclosing titles and comments should be plain (") as open and
close quotes are not recognized (“”). The ± character should be entered as a vertical bar
character (|), although the Lindos Support Software will show this correctly if possible.
4.2 The LA101 Sequence EditorDefining a sequence User defined sequences Setting up sequences
Hold and press to enter the LA101 sequence editor (fig. 4.2). The sequence
prompt will appear (see fig. 4.2) and the sequence can now be selected. Pressing
to
or to will select one of the sequences in the current bank. Pressing or
will produce a menu listing the first 5 sequences in the bank (hold to see the next
5), and pressing either of these keys again will change the bank. Whether the sequence
number is selected directly or via the menu, the LA101 LCD should be similar to fig 4.3
when a sequence is being edited.
Fig. 4.2 The Sequence Editor Prompt Fig. 4.3 Editing a Sequence
The
keys now move the cursor through the sequence definition which is a
single line of text up to 250 characters long. The
keys change the character at
the cursor and cycle through the character set:
<space> ABCDEFGHIJKLMNOPQRSTUVWXYZ
bcdhkmnoruxz @!?%<>=±
/+− . 0123456789 ,"
Note that the cursor is initially positioned after the sequence title (if there is one), but may
be moved back over the title to edit it as required. All keys repeat if held and the display
will scroll as necessary. When the cursor is under a segment letter the segment title is
displayed on the bottom line of the display. Pressing
(or resetting) will leave the
68
4. User Defined Sequences
Page 69
new sequence definition in non-volatile memory, ready to be run in the normal way.
Holding
while using the keys scrolls 21 characters (a screen width) through
the text providing quick access to any part of the sequence definition. Holding
with
the
keys limits the characters that are cycled through. For example
will cycle through the alphabet only (Z-A), so to select segment Y for example simply
press
twice, or to select a small ‘c’ character press and then twice.
Similarly
gives quick access to the symbol characters, so pressing four
times will give a ‘!’ character. Digits can also be entered directly by pressing
to or
to (for 6-9 and 0). With a little practice it is possible to become very quick at
using the sequence editor.
Copy a sequence
will return to the ‘SEQ TO EDIT?’ prompt, and will copy the
sequence being edited to another sequence number. This is useful if you want to modify a
sequence slightly but still keep the original, or simply to move sequences around for
convenience. The sequence editor displays the cursor position in the top right of the
screen to help find sequence errors and to show the user how long the sequence is so far.
A summary of all the editor keys can be found in the LA100 quick reference card.
For example: To add wow & flutter measurement on to sequence 1 (assuming it currently
contains the default sequence), press the following keys:
Sequence editor
To choose sequence 1
6 times To move the cursor after the last segment letter
4 times To enter a W segment
To finish and return to manual mode
All sequences can be restored to their default definitions using the reset menu.
Hold
and press to obtain the reset menu, then press (this also clears the
source ID, see sections 1.4 and 4.3).
4.3 Source IdentificationSource identification
The LA101 will automatically send a source message at the start of the sequence (via
FSK) to identify the source of the test signal. This might be used to identify an
originating site or company testing a communication link, or it might be used to identify a
brand of tape and a recording date when making a test tape. It is will be displayed by the
LA102 as it is received and will be stored with the sequence results (fig. 4.4).
69
4. User Defined Sequences
Page 70
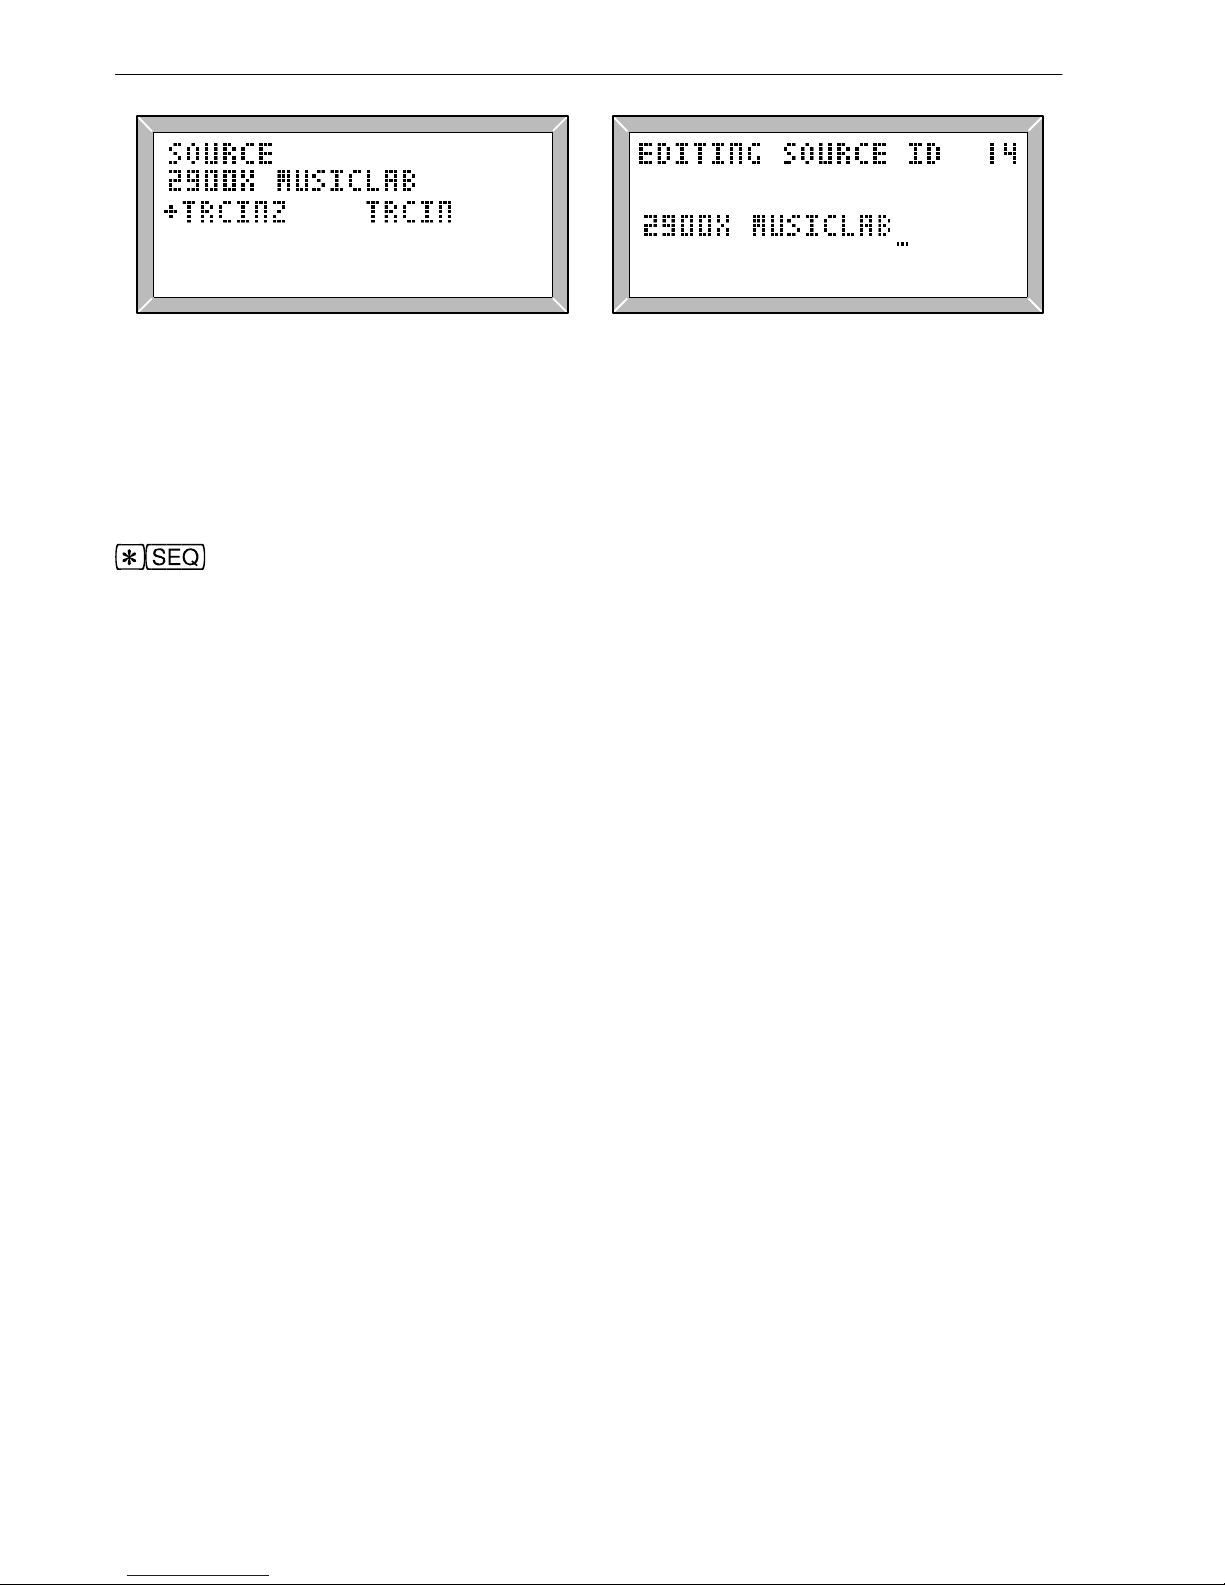
Fig. 4.4 LA102 Source ID Display Fig. 4.5 Editing the LA101 Source ID
The LA101 has a source ID which by default will be the serial number and a cyclic
identification character, A-Z (see section 3.6). This is normally sent automatically at the
start of every sequence which contains a test segment, and can be edited by pressing
from the sequence editor menu and using the normal sequence editor keys (fig.
4.5). The serial number and cyclic identification character are normally left at the start of
the source ID and the user’s text added after it, up to a maximum length of 21 characters
total.
It is also possible to make each sequence add its own message to the serial number and
cycle character by placing a source message segment (+) near the start of the sequence,
before any test segments. The message is placed in quotes after the + character, and
usually starts with a space to separate it from the cyclic identification character. Since it
is being appended to the 5 character serial number and cycle character, the maximum
length is normally 16 characters. For example:
"LINES TEST" +" RADIO SUFFOLK" T O C E N Z
The advantage of using the + segment in a sequence rather than editing the source ID is
that each sequence can have a different message on it. The LA101 will still send its serial
number and cyclic identification character, so the message received and displayed by the
LA102 will be:
SOURCE: 2834A RADIO SUFFOLK
Technical note for experienced users: It is normal to leave the serial number and cyclic
character in the source ID, but they may be changed if the extra space is needed to hold a
long message. If deleted from the source ID then the LA101 will assume that the serial
number and cyclic character are not wanted and so it will omit them from + segment
messages as well. This means that the + segment text can then be up to 21 characters in
length. However, if the source ID is deleted entirely then it will be reset to its default
value. Finally, it is possible to edit the cyclic identification character in the editor,
perhaps to restore it to ‘A’ before performing a series of tests.
70
4. User Defined Sequences
Page 71
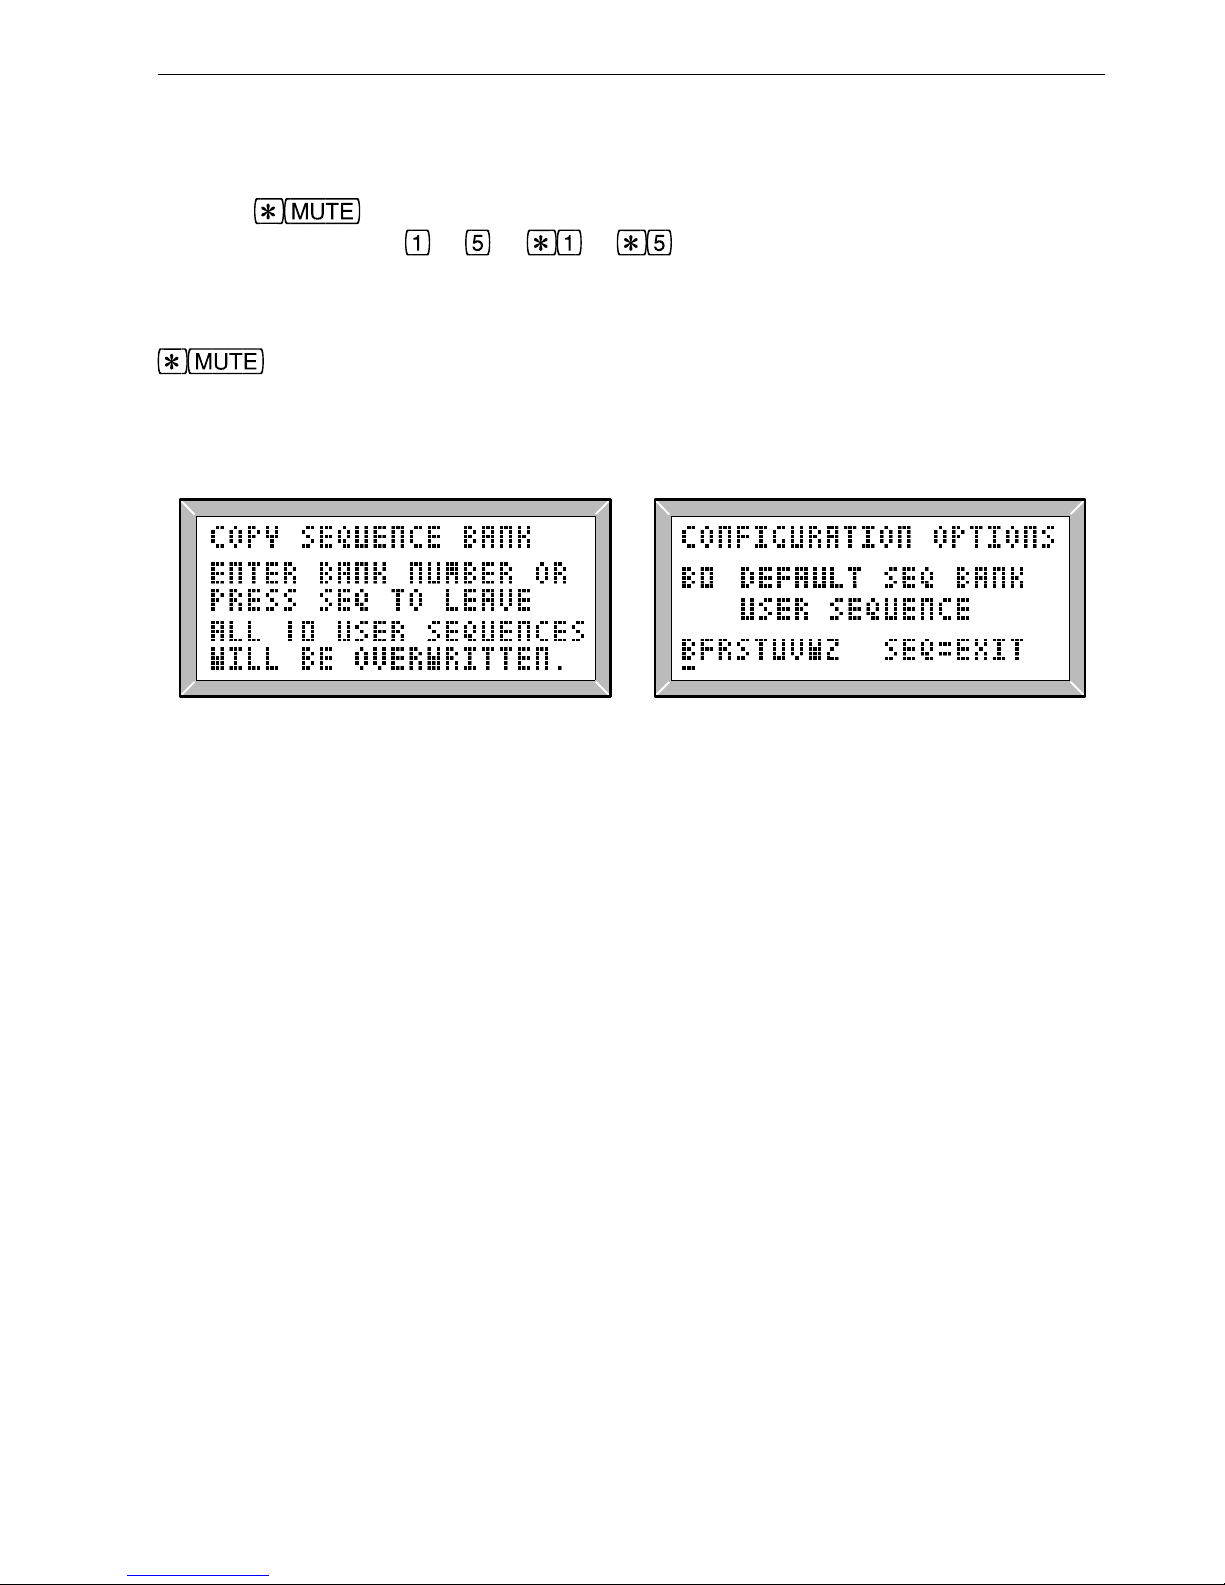
4.4 Copying a Sequence
When a sequence is being edited, or viewed, it may be copied to a user sequence by
pressing
. The LA101 will ask which user sequence (1-10) you want to copy
the sequence to. Press
to or to (for sequences 6-10). The sequence can
now be edited.
It is also possible to copy a whole bank of sequences into the user bank, by pressing
when the sequence editor prompt is displayed (fig. 4.6). The sequence editor
will prompt for a bank number, 1 to 10, where bank 1 contains sequences 11-20, bank 2
contains sequences 21-30 etc. Note that this operation will overwrite all 10 user
sequences.
Fig. 4.6 Copying a Sequence Bank Fig. 4.7 Selecting the Default Seq
Bank
4.5 Measurement LevelsAmplitude range
Although many of the segments have been designed to conform with various standards
(using BBC, CCITT, ITC, EBU and BT levels), it is often necessary to use different
levels, and the LA101 allows each segment to have its level specified independently.
This is done by entering an integer level in dB (in the range -63 to +31) after the segment
letter, called the Measurement level for the segment. The measurement level of each
segment is transmitted in the FSK header for each segment and displayed and printed by
the LA102 next to each segment’s title.
The measurement level is relative to any Test Level that is in use when the sequence is
run. Note that a Test Level allows the whole sequence to be run at a different level, while
this measurement level allows each segment to be given its own relative level. The Test
Level plus measurement level must be within the working range of the unit (-101dB to
+26dB), otherwise a ‘MAX LEVEL EXCEEDED’ error will occur. Some segments
already have an intrinsic measurement level, for example, segment Q runs at -12dB and
can be said to have an intrinsic measurement level of -12dB. The intrinsic measurement
level is always overridden by the measurement level specified, so a segment definition of
‘Q+6’ is exactly equivalent to ‘P+6’ and both run a sweep at +6dB (relative to Test Level
which defaults to 0dBu).
71
4. User Defined Sequences
Page 72

Sequence 18 makes use of this facility to define a sequence compatible with German
standards which specify distortion measured at +6dBu, sweep 20dB below +6dBu, noise
referred to +6dBu, crosstalk at +6dBu, W&F at 0dBu and phase at 10dB below +6dBu.
The definition is:
T+6 U-14 C+6 D+6 N W Z-4
It could have been be defined as:
T U-20 C D0 N W-6 Z-10
and run with a Test Level of +6dBu set but this would generate the FSK at +6dBu instead
of 0dBu since the FSK is always generated at the Test Level. Note that no level is given
for crosstalk as segment C runs at 0dB anyway (‘C0’ would have the same effect), but 0 is
given for segment D which would otherwise run at +8dB. No measurement level is
specified for noise which is always relative to the measured test level segment (segment T
in this case), and similarly, the crosstalk segments should normally be run at the same
level as the test level segment, since the measured crosstalk is always referred to the
measured TL OUT result.
The Test Level segments (T and V) are not normally given a measurement level, as they
are normally run at the Test Level so that the result (TL OUT) shows the true test level
which was in use for the sequence.
All segments except noise segments can be given a measurement level. Multi-level
distortion segments (E and I) can be given a measurement level but this is not
recommended as the displayed and printed levels will not be changed. For example, I+4
will measure distortion at +4dB and at -14dB and will display +4dB in the heading but
will still display +8 and -10dB which are the default levels. The FSK header is always
transmitted at 0dB (relative to Test Level).
4.6 Test Level Segments (T,V)Test level segment 400Hz test level4
Segment T generates a 1kHz reference tone at 0dB for 1s. Segment V is similar, but uses
a 400Hz tone, and is intended for use with FM transmitter systems. The level is measured
by the LA102 and displayed under the heading ‘
TL OUT’, and gives an indication of the
gain of the system.
These segments are called Test Level segments because they normally run at the Test
Level (which is set globally for the whole sequence, as described in sections 3.7 and
4.21). Although it is possible to give these segments a measurement level to make them
run at a level different from the test level, this would not normally be done as it makes
more sense to adjust the level for the whole sequence by setting the global test level.
A test level segment should usually be the first segment of a sequence as it is used to
72
4. User Defined Sequences
Page 73

determine the nominal level (used for frequency sweeps) and is also used to normalise
crosstalk and noise measurements. If run as a single segment the tone is held after the
segment has finished.
4.7 Frequency Sweep Segments (OPQRSUXorux)Segments O,P,Q,R,S
Various frequency sweep segments are available, providing a range of sweep speeds
(1½s, 5s or 20s), different frequency ranges (20Hz-20kHz, 10Hz-30kHz, 300Hz-18kHz
and 300Hz-8kHz), different amounts of headroom (see section 3.14) and different
printout frequencies. All of the frequency sweeps take 256 level measurements per
channel over their frequency range and the LA102 sampling rate is varied accordingly.
Segment U is a standard 5s frequency sweep segment covering the frequency range 20Hz
to 20kHz. Segment S is a slow sweep, 20 to 20kHz in 20 seconds, which is better able to
follow steep filters. Segment X is a fast 1.5s sweep but care is needed when interpreting
the results as it cannot follow fast changes in the level. However it is very useful for the
setting up of tape head alignment, especially if it is repeated (‘X<’). To achieve the fast
speed the resolution of this fast sweep is less than the slower sweeps (causing obvious
steps at low levels, especially if the graph scale is increased).
Segment U Segment X Segment o Segment r
The spot frequencies used in the printout and for tolerance testing are shown in fig. 3.2.
Segment O is a 5s sweep with special frequency listing on printout to comply with British
Telecom (BT) lines tests EPS81/EPS84.
Segment u Segment x
4.8 Noise Segments (L,M,N,n)Noise segments 22Hz-22kHz bandwidth A weighted noise CCIR weighted noise
Segments N and M measure peak (PK) noise as required by the CCIR standard as well as
peak unweighted noise and mean (MN) weighted noise. ‘Peak weighted noise’ is the
peak reading of the quasi-peak rectifier taken over the measurement period, which will
normally be slightly worse than the mean, but some circumstances, such as telephone
dialling pulses on lines, may result in a larger peak to mean difference. Segment N (8s) is
usually used, but segment M (30s) can be used where a longer sampling window is
required (again where the noise is intermittent). Segment L measures ‘A’ weighted noise,
and 22-22kHz noise using the rms rectifier. Segment n measures CCITT O.41 weighted
and unweighted psophometric noise but is only recognized by LA102 sets equipped with
a suitable filter board (see appendix I.5).
Slow noise measurement
All noise measurements are relative to the measured test level. For example, if ‘TL OUT’
is +2dBu, and the noise level is displayed as -95dB, then the absolute level of the noise is
-93dBu. It is therefore important that the noise segment is preceded by a test level
segment (T or V) otherwise a
SEQ ERROR 13 will be generated. Sequence error 13
73
4. User Defined Sequences
Page 74

4.9 Crosstalk Segments (A,B,C,J,c)
Crosstalk segments A, C and J measure crosstalk at six frequencies (40, 100, 315, 1kHz,
6.3kHz and 10kHz) taking 1s per frequency. The result is always calculated relative to
the ‘TL OUT’ level as for noise measurements. Segment C operates at 0dB, while
segment J operates at -10dB (as specified by the IBA for tape testing). Segment A is
similar to segment C but has 50µs de-emphasis applied to avoid overload when testing
FM transmitter systems.
Segment B is a fast crosstalk segment which takes 2s and produces crosstalk figures for
100Hz, 1kHz, 6.3kHz and 10kHz (½s each tone, default level is 0dB), but for very
accurate low level crosstalk measurement it is best to use segment C or J. Segment c
measures crosstalk at 15kHz and 0dB.
Since crosstalk is a relative measurement it is important that the crosstalk segment is
always preceded by a test level segment (T or V) otherwise a
SEQ ERROR 13 will be
generated.
Note for experienced users: The crosstalk result is the level of crosstalk relative to the
measured level of the interfering tone. Since the interfering tone may not be connected to
the other input channel the LA102 does not attempt to measure it. This means that
meaningful crosstalk measurements can still be made when only a single channel is
connected to the LA102 L input providing both output channels from the LA101 are
connected to the device under test.
The LA102 must therefore calculate the level which the interfering tone on another
channel would be measured at were it present. It assumes that this is equal to the
crosstalk measurement level plus the gain of the system and it calculates the latter from
the measured TL OUT result less the Test Level measurement level. For example, the
sequence T0C6 is run and the TL OUT is +10dB. The absolute crosstalk level is -40dBu,
so the relative crosstalk is -40 - (+6+10-0) = -56 since the LA102 assumes that the
interfering tone would have been measured at +16dB.
The test level and crosstalk segments can therefore be run with any measurement level,
although it is good practice to keep the test level segment at the test level.
4.10 Distortion Segments (D,E,F,G,I)Distortion segments
Segment D measures distortion at three frequencies (100Hz, 1kHz and 6.3kHz) in 6s at
+8dB (by default), and is generally used for quick distortion measurement. Similarly
segment E measures distortion at 100Hz +9dB, 1kHz +9dB and 1kHz -10dB in 6s.
Segment I measures 100Hz and 1kHz distortion at +8dB and -10dB.
Where more frequencies are required, segment F can be used as it measures distortion at
74
4. User Defined Sequences
Page 75

six frequencies (40Hz, 100Hz, 315Hz, 1kHz, 6.3kHz and 10kHz) but it takes 18s. As
usual, all measurements are THD (plus noise). Segment G is similar to segment F but it
has 50µs de-emphasis to avoid overloading FM transmitter systems.
Tape azimuth
4.11 Wow & Flutter Segment (W)Wow & flutter segment W&F measurement flutter measurement
Segment W measures the peak and mean weighted wow & flutter and speed error (on the
3125Hz tone) and makes use of essential settling time to take a mean phase reading at
3125Hz; useful as an azimuth check. Note that a speed of -99.9%, or a phase of -999°
indicates that the measurement failed because the signal was too noisy.
Speed measurement Tape speed
4.12 Phase Segments (Y, Z, z)Phase segments
Segment Z measures mean phase at 40Hz, 100Hz, 1kHz, 6.3kHz, 10kHz and 15kHz, and
because of slow averaging it is more accurate than manual measurement. A result of
‘-999°’ occurs if the phase for a particular tone could not be measured (typically because
the system is very noisy). Segment Y is similar but has 50µs de-emphasis to avoid
overload on FM transmitter systems. Segment z measures phase difference between
channels at 40, 100, 315, 1k, 6.3k, 10k and 15kHz (the same as segment Z with 315Hz
added).
Note: although phase can be measured at any frequency, the frequencies in this segment
should not be changed (using the ‘!’ segment) as the LA102 expects them and is
optimised for them to give very accurate phase measurement.
4.13 User Level Segment (K)User level segment Filter testing Equaliser testing
Segment K is a general 6 tone level test which accurately records the level of six 1s tones
(with autoranging and averaging). It can be used to test compression effects on
compandors, tape machines, limiters and noise reduction systems, and to accurately test
the frequency response of filters and equalisers over a large dynamic range (where the
frequency sweep segments may not be as accurate because they cannot change range in
mid-sweep).
The levels default to 0, -10, -20, -30, -40 and -50dB but any 6 levels can be specified by
the user (with a resolution of 0.01dB). For example:
K +10,0,-30,-37,-47,-55
If any levels are omitted they default to 10dB below the previous level (so K+20 would
generate levels at +20, +10, 0, -10, -20 and -30dB). As with all segments these levels are
relative to the LA101 test level - see sections 3.7, 3.10 and 4.21.
The first level is treated as the segment measurement level (see section 4.5) and is
transmitted in the FSK segment header. The LA102 displays this in the segment title for
reference, but the level at which the other tones are sent is not transmitted or displayed, so
the user must know which levels were used in order to interpret the results. However, it is
75
4. User Defined Sequences
Page 76

possible to make the target levels appear on the printout by programming them into a
tolerance definition, and this is explained in section 5.5. Typical results for the above
example might look like this:
USER LEVELS (+10dB)
1. +9.3 +9.5
2. -0.2 0.0
3. -30.1 -30.3
4. -36.8 -37.7
5. -47.6 -47.8
6. -53.6 -54.1
Because of memory constraints within the LA102 this segment shares results space with
the crosstalk segments. This means that LA102 configuration C must be set to at least 2
if segment K is being used in the same sequence as segments A, B, C or J, otherwise a
Sequence Error 12 will occur and only one of the segments will be stored (see section
4.18 for a more detailed explanation).
The frequency defaults to 1kHz, but any 6 frequencies can be specified by using the ! tone
segment (see section 4.16). This can be useful for accurately testing filters by using an
inverse weighting curve. For example, a CCITT O.41 weighting filter could be tested by
using six tones, corresponding to the filter’s inverse: 200Hz at +21dB, 500Hz at +3.6dB,
1kHz at -1dB, 2kHz at +3dB, 3kHz at +5.6dB and 4kHz at +15dB. The result will show
the deviation from the expected filter response and should be six levels all around 0dB. A
suitable segment would be:
!K 200,1000,+21, 500,,+3.6, 1000,,-1, 2000,,+3, 3000,,+5.6, 4000,,+15
When using the ! tone segment in this way there must be six tones and each tone must last
1s (hence the 1000ms duration in the above example). If only three tones are required
then dummy tones should be used to make the duration up to 6 seconds (otherwise the
LA101 will start the next segment before the LA102 expects it, and a
Sequence Error 8
will probably occur).
Like any other segment a tolerance can be specified for segment K and this can greatly
simplify filter and equaliser testing. This is also useful because it allows target levels to
be included on the printout.
Filter testing
4.14 Maximum Output Level (MOL) Segments (H, h)
A tape’s maximum output level (ie the level at which 3% total harmonic distortion
occurs) can be measured at 1kHz using segment H or 315Hz using segment h. These
segments sweep the level in small steps over an 8dB range and record the level at which
3% THD occurred. Note that the MOL result is the absolute level out of the system and
not the level into the system. For example if a tape machine has an overall gain of 4dB
and the measured MOL is +7dBu then the input level which gives 3% distortion is
76
4. User Defined Sequences
Page 77

+3dBu. Maximum output level
To calculate the MOL in nWb/m it is necessary to establish a relationship between the
machine output and a known tape flux level. For example, if a 320nWb/m test tape gives
an output of -2dBu, and the LA102 indicates an MOL of +7.5dBu, then the MOL of the
tape is:
320 x antilog
10
()
= 955nWb/m
7.5 - (-2)
20
If the 3% distortion point does not occur in the 8dB covered by this segment the LA102
will not be able to measure the MOL and will indicate the failure by giving a result of
+99.9dB if the distortion was below 3% at all levels in the range, or -99.9dB if the
distortion exceeded 3% at the lowest level used. Should this occur the segment should be
given a measurement level which will allow the 8dB range to include the 3% MOL point.
If no measurement level is specified segment H will cover the range from 0dB to +8dB,
while H4 will cover the range from +4dB to +12dB (as with all segments these levels are
relative to the LA101 test level − see sections 3.7, 3.10 and 4.21).
When measuring MOL the LA101 holds the first level of the level sweep for ½s to allow
the LA102 to accurately record the starting level. The sweep then progresses at a rate of
1dB/s over an 8dB range and the LA102 continuously measures the absolute level of
THD until it is -30.45dB (3%) below the expected level of the signal. The LA102 then
measures the actual absolute level of its input signal. Note that the expected level of the
signal is based upon the initial level and the known rate of increase, but this may be
different from the actual level if compression is occurring in the system. This means that
the distortion may actually be greater than -30.45dB when the LA102 decides that it is
-30.45dB below the expected signal level (ie if the actual signal level is less than
expected). The LA102 attempts to correct for this by calculating the MOL from a
weighted average of the expected level and the actual measured level.
In practice the result is usually accurate to within ±0.2dB of the manually measured MOL
with reasonable quality tape and little compression. With poor quality tape the error may
be as much as ±0.5dB. For best results the segment should be run at a level just below the
anticipated 3% MOL level to minimise any errors due to compression effects. For
example if the 3% MOL is known to be around +6.5dB best results will be obtained by
running segment
H6 whereas segment H will give less accurate results because of the
output level error due to the compression effects over a 6dB range.
4.15 Difference Frequency Distortion (d)2nd order difference frequency distortion
Segment d measures second order difference frequency distortion with a double tone
having a 1kHz centre frequency and 70Hz difference frequency (nominally), as explained
in section 2.16. The level of each tone is -6dB relative to Test Level, so the rms level of
77
4. User Defined Sequences
Page 78

the double tone is -3dB, and the reference frequency to which the distortion is referred is
0dB.
Intermodulation distortion
4.16 Tone Burst/Tones Segment (!)FSK decoders ASK decoders Testing FSK decoders
The tone burst segment (‘!’) is a very powerful facility for generating tones and tone
bursts. It can also be used to design new segments similar to standard segments but using
different frequencies or levels. Because this facility is so flexible it has been used for
many different applications, including: meter testing, generating FSK and ASK test
signals for testing decoders, generating morse code for identifying a transmitter source
and even playing tunes.
Multiple tone bursts Generating tones Intermittent tones Tone bursts
The ! character is followed by frequency duration and (optional) level parameters:
!f,d Generate f Hz for d ms (at 0dB), then silence.
!f,d,l Generate f Hz for d ms at l dB, then silence.
It is also possible to specify the frequency, level and duration of up to 32 tones with a
single ! segment:
!f
1,d1,l1,f2,d2
... Generate f1Hz for d1ms at l1dB, then f2Hz for d2ms at l2 etc
The frequency f will be rounded to the nearest that can be generated. 0 is allowed and
corresponds to the DC0 state (silence) which is useful before or after tone bursts. The
output is not muted in this condition, because relay switching may produce undesirable
transients.
The duration d in ms should be in the range 0ms to 1600000.0ms (ie 27 minutes) and may
be specified to 1 decimal place (ie 100µs resolution). Timing is very accurate (±50µs or
±0.01%) when the level for a tone is not specified. If the level is specified the timing
accuracy will be reduced slightly. A duration of 0 for the last tone in the list will cause
the last tone to be held after the segment has terminated instead of silencing. This is only
relevant in single segment mode (segment T behaves in this way) but can be useful for
programming sets of presets on the number keys (see example 3 below).
The level l in dB (relative to Test Level) should be in the range -101.99 to +26.00 and
may be specified to 2 decimal places. Transitions between tones where the absolute level
of one is above -38dBu and the other is below -38dBu may result in a small click (lasting
2-3ms) as a relay is switched for levels below -38dBu.
! tone segment Generating tones Tone bursts
The default value for any parameter is its previous value in the same segment if specified
(default value for first occurrence is 0 for f, d and l). Note that this can considerably
shorten definitions. There is no limit to the number of ‘!’ segments in a sequence, but
there is a limit of 32 tones per ‘!’ segment. More than this will generate a ‘
TOO MANY
TONES
’ error. In the unlikely event that you need to generate more than 32 tones, try
78
4. User Defined Sequences
Page 79

splitting into two separate ‘!’ segments, but remember that there is a small delay before
each segment is executed. To generate repeating patterns put a ‘<’ character after the last
parameter (section 4.17). To stop a ‘!’ segment when it is running, hold the
key
until the display indicates that the sequence has stopped (typically up to 7 seconds).
The LA101 sequence editor describes the parameter of the ! tone segment at the cursor, to
simplify entering and editing complicated tone definitions (eg
TONE 7 DURATION/ms).
If a very long series of tones is required it is possible that the sequence definition will
exceed the 250 characters allowed by the LA101. In this case the sequence should be
split into two or more sequences with the main sequence using the > segment to call subsequences as required (see section 4.23). This can also simplify any series of tones where
a particular set of tones is repeated several times within the series.
It is possible to output an FSK header before the tones by simply placing a letter after the
‘!’ character. Note that segments D, E, F, G, I, K, T, V, W, Y and Z can all be defined in
this way using the ‘!’ segment and this allows different levels or frequencies to be used,
but remember that the LA102 will assume it has a standard Lindos segment so you will
need to interpret the results intelligently. See section 4.27 for details of segment
frequencies, levels and timings and equivalent ‘!’ segment definitions.
Examples:
1. 1kHz at +12, +8, +4, 0, -4, -8 and -12dB for 2 seconds each, defined as a single
segment:
!1000,2000,12,,,8,,,4,,,0,,,-4,,,-8,,,-12
Note that the frequency and level are only specified for the first tone, and are left blank
for subsequent tones. They will always default to their previous values, and therefore
only need to be specified once in this example. The same results could be achieved using
the much longer definition:
!1000,2000,12,1000,2000,8,1000,2000,4,1000,2000,0,
1000,2000,-4,1000,2000,-8,1000,2000,-12
Alternatively, each tone can be defined in its own segment giving 7 segments in total.
This allows each segment to be run individually (see section 3.21):
!1000,2000,12 !1000,2000,8 !1000,2000,4 !1000,2000,0
!1000,2000,-4 !1000,2000,-8 !1000,2000,-12
2. To generate a 10ms 5kHz tone burst at +8dB followed by 5s silence:
!5000,10,8,0,5000
Note that the frequency of 0 in the second ‘tone’ will select the DC0 state on the LA101.
No level is specified for the second tone to avoid any transients caused by relay
79
4. User Defined Sequences
Page 80

switching. ! tone segment
3. A sequence containing 5 segments to be run manually to test a filter having a response
of -5.7dB at 1kHz, 0dB at 2kHz, +3.0dB at 3kHz, +6.0dB at 5kHz, and +2.3dB at 10kHz:
!1000,,+5.7 !2000,,0 !3000,,-3 !5000,,-6 !10000,,-2.3
Note that the duration defaults to 0 in each case so each segment will hold the tone after it
has been run. To use this sequence press
followed by the sequence number to
obtain the
SEG? prompt. Pressing 1-5 now will generate the appropriate frequency and
level to give a 0dB output from the filter. Because all the tone durations are zero it does
not make sense to run this as a whole sequence. If, however, the tones are defined with
duration 1s, and made to hold after the segment has finished, the sequence could be run as
a whole and would last 5s and still allow each segment to be run individually:
!1000,1000,+5.7,,0 !2000,1000,0,,0 !3000,1000,-3,,0 etc
If more tones are required segments 6-10 can be defined or other sequences can be used.
4. A repeating segment to generate ‘the Greenwich time signal’ every 10 seconds:
!1000,100,0,0,900,,1000,100,0,0,900,,1000,500,0,0,7500,,<
Two tone bursts of 0.1s followed by 0.9s of silence and then a long tone burst of 0.5s
followed by 7.5s of silence. The ‘<’ character causes the segment to repeat indefinitely
(see section 4.17). Hold
to stop it.
5. To generate 110 baud 7 bit FSK characters ‘L’ (binary 1001100) and ‘C’ (binary
0100011) by generating the tones for each bit. The actual bits (including start, stop and
parity) are 1100011001111011000011:
!1650,20,0,1850,27.3,,1650,18.2,,1850,,,1650,36.4,,
1850,9,,1650,18.2,,1850,36.4,,1650,18.2,
This could be used to test FSK decoders operating at other baud rates, but would not
normally be used to generate FSK within a Lindos sequence.
6. To simulate the W&F test segment with a -3.8% speed error. FSK ‘W’ followed by
3005Hz for 12.5s.
!W3005,12500,0
7. A segment containing the 20 frequencies printed in the table for sweep segment U with
compatible timing (ie a frequency sweep containing 20 frequencies instead of the usual
320):
! tone segment
!U30,523.4,,40,168.7,,50,161.7,,63,182.8,,100,267.2,,125,218,,
250,450,,500,450,,1000,450,,2000,450,,4000,411.3,,6300,260.2,,
8000,147.7,,10000,137.1,,12500,144.1,,14000,63.3,,15000,42.2,,
16000,45.7,,18000,98.3,,20000,328.3
80
4. User Defined Sequences
Page 81

This segment will produce a stepped graph but the levels will be correct at the listed
frequencies on the printout. Note that the levels could be specified for the tones providing
weighted sweeps. A simpler segment, using less frequencies is more manageable but
remember that the printed levels will only be correct at the specified frequencies (30, 100,
500, 1k, 6.3k, 10k, 15k, 20kHz):
!U30,1268.7,,100,1040.6,,500,112.5,,1000,1532.8,,6300,281.2,,
10000,281.2,,15000,322.8,,20000,160,,
4.17 Repeating Segments and Sequences (<)repeating segment
Segments can be made to repeat indefinitely by placing a < character after the segment
(and its parameters). Normally this feature is used with frequency sweeps where the
LA102 will continuously update the frequency response display as adjustments are made.
The default sequences 15 and 20 are set up to provide repeating frequency sweeps at
different speeds.
Whole sequences can be made to repeat by placing a << at the end of the sequence. This
would normally be used for testing a communication link where the oscillator can be left
at one end continuously generating the sequence. The measuring set can be connected at
the receiving end and will automatically receive the next complete sequence and display
the results. Alternatively, a test tape could be made containing several copies of the
sequence, allowing the user to ‘break-in’ anywhere on the tape (see section 3.26).
‘!’ segments can also be made to repeat by following the whole segment with a ‘<’
symbol. For example, to repeat a 100ms 1kHz tone burst every second:
!1000,100,0,0,900 <
Accurate timing is maintained during repeating ‘!’ segments. Unlike a normal ‘!’
segment DC0 output will not be selected after the last tone unless it is specifically
requested by using a frequency of 0 as in the above example. This allows two tones to
alternate smoothly. For example, to alternate between 3125Hz and 3188.7Hz at 2Hz:
!3125,500,3188.7 <
Any segment can be made to repeat by following the segment letter (O,P,Q,R,S,U or X)
with a ‘<’ symbol although only sweep segment results are displayed by current LA102
software. The fast sweep segment (X) is especially useful with repeating sweeps as it
gives a very quick update of the frequency response allowing equipment to be adjusted
easily.
4.18 Multiple Results Compartmentsresults compartments multiple results compartments
Normally the LA102 will only expect a single sweep segment, and a single distortion
segment, etc., in each sequence. This can be overcome by re-configuring the way the
LA102 uses its results memory.
memory number
81
4. User Defined Sequences
Page 82

The LA102 results memories are split into compartments where each compartment can
hold one segment from each segment group listed below. Configuration C (in the LA102)
must be set to determine the number of compartments per memory, and the number of
memories. If insufficient compartments are available when a sequence is being received
then some segments will be lost and the LA102 will generate a Sequence Error 12 (not
enough compartments), followed by a
Sequence Error 8 (missed segments).
The possible settings for configuration C are:
Number of results memories
C1 1 compartment per memory and 6 memories (0-5)
C2 2 compartments per memory and 3 memories (0-2)
C3 3 compartments per memory and 2 memories (0-1)
C4 4 compartments per memory and 1 memory (0)
C5 5 compartments per memory and 1 memory (0)
One compartment can hold one segment from each of the following groups:
GROUP SEGMENTS
Frequency response: O P Q R S U X o r u x
Test level: T V
CCIR noise: M N
A weighted & O.41 noise: L n
Crosstalk and user levels: A B C J K
Miscellaneous: H c d h
Distortion: D F G I
Distortion: E
W&F and phase: W z
Phase: Y Z
Configuration C1 is the normal default setting with 1 compartment and 6 memories, the
same as earlier software, and this is suitable for all of the default sequences. Allowing
more compartments in each memory reduces the number of memories and the user must
decide the best compromise. If results memories are not being used at all configuration
C5 can be set to allow up to 5 segments from each group. Remember that memory 0 is
the working memory used to receive sequences and that another memory will be lost if
user tolerances are defined with configurations C1 to C3. Memory operations will show
the range of available memory numbers or give a warning message if no memories are
available. Changing configuration C will clear all results memories as the LA102
must reorganize its memory usage.
Only one source message segment (+) and one test level segment (T or V) is allowed in
each sequence. To find the number of compartments needed for a particular sequence,
examine the groups listed above and count the number of segments in each group (if the
same segment letter is used twice within a sequence it must be counted twice). The
maximum number of segments in any one group determines the minimum number of
compartments required to store the results (and hence the minimum value for
82
4. User Defined Sequences
Page 83

configuration C). (When creating a sequence with the Lin4Win LA100 support software
the number of results compartments required to run the sequence is automatically
calculated.)
Results compartments
For example, these sequences will all require two compartments and will therefore need
LA102 configuration C2, C3, C4 or C5 to be set before receiving them:
T D E0 G+4 2 segments from the distortion group (D and G)
T U0 U-8 D+8 D0 2 distortion and 2 sweep segments
T R C K N 2 segments from the crosstalk/user levels group
Segments with the same segment letter will be printed and displayed in the order
received, while segments in the same group with different segment letters (for example F
and G) will appear in alphabetical order.
4.19 Selecting a Tolerance (±)Selecting a tolerance ± segment (select a tolerance)
By including a ‘±’ character followed by a tolerance number in a LA101 sequence
definition it is possible to select a tolerance to be applied before displaying sequence
results. When the LA102 receives the ‘±’ segment it temporarily selects the tolerance
specified and displays
PASSED or FAILED as soon as the sequence is complete. The
Lindos Self Test sequence (sequence 16) makes use of this feature to select tolerance 16
(the Selftest tolerance) in the LA102:
"LINDOS SELF TEST" T U C D N ±16
Note that the tolerance is only selected temporarily. The temporary tolerance selection
will be cleared when another sequence is received or when the LA102 configurations are
edited (since configuration T determines the tolerance to be applied). See chapter 5 for
full details of tolerance testing.
4.20 Output Impedance Segment (%)% segment (set impedance) Impedance − setting in sequence
Output impedance can be selected from within a sequence definition using %n,m where n
is the impedance in ohms (10, 75 or 600) and m is 0 for no level correction or 1 for 600
load impedance correction (ZC). This is equivalent to setting the impedance and
correction in manual mode before running the sequence so, when ZC is selected, the test
level the sequence runs at is also in dBm (ie segment T normally runs at 0dBu, but after
%75,1 it will run at 0dBm assuming a 600 load). If m is omitted the level correction
last used for that impedance is used. If n is omitted the current impedance is used. Use
the sequence editor to insert these characters in the normal way (section 4.2). Example:
"LINES TEST" "75OHM - 600OHM LOAD" %75,1 T O C E N Z
The LA102 input impedance is not affected by this segment. Z-correction
83
4. User Defined Sequences
Page 84

4.21 Sequence Level Segment (/)Sequence level segment / segment (set sequence level) FSK level
Test level can be set within a sequence using /n before any test segments, where n is the
level in dB (with 0.01dB resolution). This is equivalent to setting the test level in manual
mode using
before running the sequence and makes all output relative to the test
level, including the FSK. For example using the sequence:
/-17 %600,1 TrC+4ENz
the FSK will be output at -17dBm (-10.98dBu into 600 matched load), segment T will
be at -17dBm, segment C at -13dBm and distortion segment E will be at -8dBm and
-27dBm (+9 and -10dB relative to test level).
Temporary test level Test level − set in sequence Setting test level
When the sequence has finished the original test level will be restored as this segment
only sets a temporary test level for the duration of the sequence.
4.22 Channel Segment (:)Channel segment : segment (set channel) Sequence channel Channel switching Output channel
The channel may be selected using :n,m which selects physical channel n and logical
channel m. n should be 0 for MUTE, 1 for Left, 2 for Right or 3 for both channels (L+R)
or omitted for no change. m should be 1 for Left, 2 for Right, 3 for both channels or
omitted to make it default to the same setting as the physical channel.
Channel number Mute
The physical channel determines which output channel the signal will be on. Normally
the signal is on both channels (except during noise or crosstalk segments) but it is
possible to define a sequence with a tone on one channel only. For example, to generate a
1kHz test tone on the R channel only:
:2 !1000,0
To generate the special ITV channel identification signal for Betacam/stereo recordings
which consists of 1kHz steady tone on the right channel and 3s 1kHz pulses on the left
channel separated by 250ms of silence:
Channel ID for Betacam Betacam channel identification
!1000,3000,0,,0 :2 !1000,250,0,,0 :3 <<
The logical channel determines which channel the LA101 will instruct the LA102 to
make measurements on (via FSK) and also how many times the sequence will run. It is
normally set by pressing the
key on the LA101 before running a sequence but this
segment overrides any selection made with the
key. For example, a test sequence
for a mono circuit can select single channel operation within the sequence:
:1,1 T O E N
This sequence will only ever run on the left channel regardless of the L+R setting.
When measuring distortion on FM transmitter systems it is best to generate the test signal
on one channel only to obtain the maximum difference signal and hence test the system at
its limits. Generating the tone on both channels simultaneously (as Lindos sequences
normally operate) results in a zero amplitude difference signal giving less valid results.
84
4. User Defined Sequences
Page 85
The channel selection segment (:) can be used to allow for this special case. If 16 is
added to the physical channel number, before a distortion segment, then that distortion
segment will only put the tone on the channel which is being measured and will MUTE
the other channel. Sequence 17 (the FM transmitter test) makes use of this feature:
"FM TEST" "ONE CHAN MTD FOR THD" V R A :19,0 G N Y
4.23 Subroutine Segment (>)Subroutine segment > segment (call subroutine) Call another sequence
Sequences can call other sequences using the > segment (like a computer subroutine).
When
>n is encountered in a sequence, sequence n is run as though it were a single
segment and then the original sequence continues. The sub-sequence will only run on a
single channel each time it is called, but will be called for each channel the main sequence
runs on. For example:
SEQ 1:
T>2NWZ
SEQ 2: RCI
Running sequence 1 will run segments +TRCINWZ on the left channel and TRCIN on
the right. This facility is intended to allow complicated
! tone segments which require
more than 250 characters, and is especially useful where a particular sequence of tones
occurs at several places (tunes for example!). If the sequence consists entirely of
! tone
segments with no letter segments, the sequence will run once only, as usual.
Sub-sequences may call other sub-sequences, but an error will occur if a sequence calls
itself recursively.
4.24 Pause Segment (?)? segment (pause) Pause until a key is pressed
A pause segment is available to wait for user input. A question mark (?) will cause the
LA101 to stop and wait for a key to be pressed. Press
to continue running the
sequence, or
or to abort the sequence. The message "1=CONTINUE
SEQ=STOP
" will be displayed to indicate this unless the ? is preceded by a message
segment. For example:
"100, 1k AND 10kHz" !100,0 ? !1000,0 ? !10000,0 "PRESS 1 TO REPEAT"? <<
4.25 Sweep Headroom (^n)
When receiving a frequency sweep segment it is important that the LA102 uses a suitable
level range. For most normal frequency responses the LA102 will do this automatically.
However, problems can arise where a system has large peaks (eg steep filters, equalisers,
loudspeaker crossovers etc). If the range chosen is too low then clipping will occur,
causing part of the frequency response curve to be missed and producing RANGE?
messages. If the range chosen is too high, accuracy and resolution will be reduced. This
is explained in section 3.14, but a better solution is the ^n control segment.
85
4. User Defined Sequences
Page 86

The headroom segment, ^n, indicates to the LA102 that a 0dB sweep may peak at
anything up to ndB. This segment is normally placed immediately before the frequency
sweep segment, and must be positioned after the test level segment (T or V). For
example, if testing a filter which has 0dB gain at 1kHz and +12dB gain at 10kHz, the
following sequence could be used:
T ^+12 U
After receiving this segment the LA102 will ignore the measured test level when
choosing the range to use. If it receives a 0dB sweep it will always choose a range
suitable for measuring ndB, where n is the segment parameter. If the sweep has a
measurement level which is not 0dB then this will be taken into account when choosing
the level. For example consider the sequence:
T ^+12 U-20
This runs a test level segment at 0dB and a frequency sweep at -20dB as well as warning
the LA102 that the system may have a gain of up to 12dB. This means that the sweep at 20dB could peak at -8dB, so a range suitable for measuring -8dB will be chosen.
Segments with extra headroom built in (eg segment R) will still have this extra headroom.
4.26 Subtract a Reference Curve (\n)
Some measurements will always require the subtraction of a reference curve, and this can
be achieved by using the \n control segment which instructs the LA102 to subtract the
reference curve in memory n. The \n segment must appear after the frequency response
segment, otherwise the subtraction would occur before the frequency response had been
measured (the LA101 only sends this segment once, and if sending a two channel
sequence it will only send it when both frequency sweeps have been run). Some care
should be taken when using this segment to ensure that the correct reference curve is
stored in memory n before the sequence is received, and that LA102 configuration C1 is
set.
4.27 Equivalent ! Segments
Most test segments can be defined using the ! segment to generate the FSK, followed by
the necessary tones. The equivalent ! segment definitions are listed below, primarily
because this format provides a concise way of describing the tones used in each segment.
While it is possible to modify the frequencies in the ! segment, great care should be used,
because the LA102 will expect certain frequencies and levels to be used. Refer to the
relevant segment below for further details:
!A40,1000,0,100,,,315,,-.04,1000,,-.41,6300,,-6.92,10000,,-10.36
!B100,500,0,1000,,,6300,,,10000,,,
!C40,1000,0,100,,,315,,,1000,,,6300,,,10000,,
86
4. User Defined Sequences
Page 87

!D100,2000,8,1000,,,6300,,
!E100,+9,2000,1000,-10,,1000,+9,
!F10000,2000,+8,6300,,,1000,,,315,,,100,4000,,40,6000,
!G10000,2000,-2.36,6300,,1.08,1000,,7.59,315,,7.96,100,4000,8,40,6000,
!H1000,0,50,,0.05
!I1000,2000,+8,,,-10,100,,+8,,,-10
!J40,1000,-10,100,,,315,,,1000,,,6300,,,10000,,
!K 1000,1000,0,,,-10,,,-20,,,-30,,,-40,,,-50
!T1000,1000,0,,0
!V400,1000,0,,0
!W3125,12500,0,,,
!Y40,500,0,100,,,1000,,-.41,6300,,-6.92,10000,,-10.36,15000,,-13.66
!Z40,500,0,100,,,1000,,,6300,,,10000,,,15000,,
!c15000,3000,0
!z40,500,0,100,,,315,,,1000,,,6300,,,10000,,,15000,,
4.28 CCITT O.33 SequencesEBU O.33 sequence
Although the LA102 cannot make measurements from a CCITT O.33 sequence (see
section 3.27), the LA101 can generate an O.33 sequence. This is achieved using the ‘–’
segment which takes 7 characters in quotes:
–"BBC1A01"
The first four characters are the source identification, the next character is the special
signalling character while the final two characters are the program identification (00-99).
The LA101 will generate an FSK header complying with the CCITT O.33 specification:
110 baud, 1 start bit, 7 data bits, 1 even parity bit and 2 stop bits (as for Lindos FSK),
with the following characters:
Start of header (SOH) character, ASCII 1
4 character source identification
Start of text (STX) character, ASCII 2
2 character programme identification
ETX (end of text) character, ASCII 3
Any CCITT O.33 sequence can be defined, by following this segment with tone (!) and
channel selection (:) segments.
EBU O.33 sequence
Although this header format is different from the Lindos header format, the LA102 will
display the characters from an O.33 header as they are received, providing it is in
sequence mode. This may be useful for identifying the source of an O.33 sequence, but
the LA102 will not make any measurements.
87
4. User Defined Sequences
Page 88

4.29 Apply weighting (=n)
To automatically apply an LA101 weighting to a sequence definition, use the =n control
segment, where n is the weighting number. 1-5 are user weightings; 6 is RIAA inverse; 7
is CCIR 468-3 inverse; 8 is CCITT O.41 inverse and 9 is 50uS de-emphasis. Ensure the
weighting is defined before running the sequence. =n should come before any sweep
segment in a sequence. The LA101 can only apply weightings to third octave frequencies,
and consequently some segments cannot be used in a sequence which includes the =n
segment. In particular, segments
O, S, X, Y, Z, !, c, d, o, r, u, x and z are not allowed and
will generate an
ERROR AT CHAR xx error message, where xx is the position of the
offending segment in the sequence definition.
88
4. User Defined Sequences
Page 89
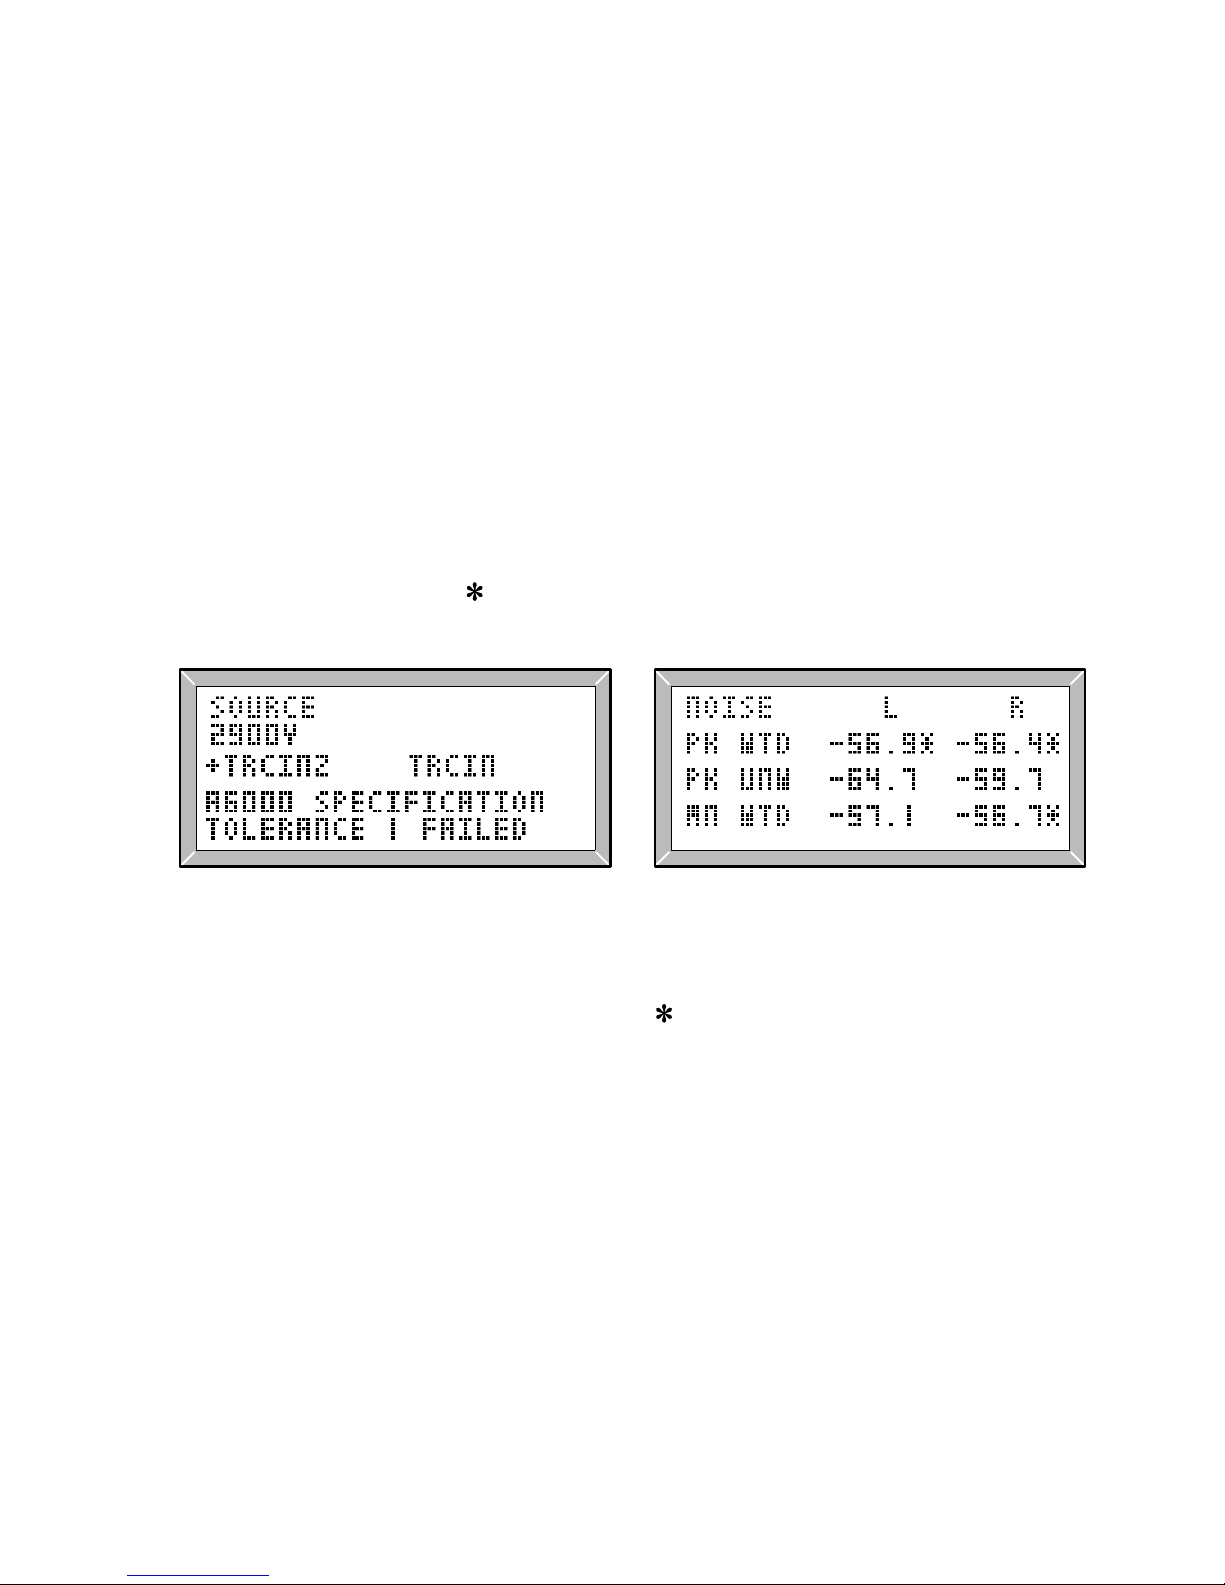
5.0 Tolerance Testing
Tolerance testing Pass/fail testing Limit testing Allowed range for results
For routine testing (production line testing, quality control checks etc) sequence operation
allows fast simple measurement but still requires the user to ensure that each
measurement is within its allowed range. By selecting one of the built-in tolerances listed
in table 5.3, or by entering a user tolerance into the LA102 it is possible to perform PASS/
FAIL tests, with every measurement being tested against its own tolerance specification.
‘TOLERANCE PASSED’ or ‘TOLERANCE FAILED’ will be displayed as soon as a
sequence finishes (fig 5.1) and it will also be included in the printout header. The
printout will also show the tolerance limits for each measurement in the form of a
tolerance string (see fig. 5.4) and the format of this is explained in section 5.3.
Measurements that are not within the specified range are marked on the display and on
the printout with an asterisk (
) as shown in figs. 5.2 and 5.4.
asterisk (*)
Fig. 5.1 Tolerance Failed Fig. 5.2 Indication of Failed Values
For frequency response results the asterisk (
) on the screen only indicates that the
frequency response on the displayed channel has failed. It does not indicate which value
has failed (because it is displayed regardless of the cursor position). To see which
frequencies have failed it is necessary to print the results.
The tolerance testing system also provides some control over the format of the printout,
and it can be used to add short comments or to suppress the printing of some results
values to obtain a more concise printout (section 5.5)
The LA102 allows up to ten user tolerances to be stored in non-volatile memory using the
built-in tolerance editor (section 5.6) or by using Lin4win, the Lindos Support Software
for Windows® on a remote computer (section 5.7).
Computer support software
89
Page 90

90
0 None
1-10 User Tolerances
11 IBA Tape/General
TV +-1
PQRSUX +6,+2-2.5<3,,,,+-1<1.5,,,,,,,,,+2-2.5<3,,,?
CJ -17,-25,-36,,,-32
B -25,-36,,-32
I -34,,-40
MN -41,-45,-41
YZ +-60,+-35,+-15,+-30,+-46,+-60
W .12,,+-15,+-.3
12 IBA Tape/Restricted Use
TV +-1.5
PQRSUX +6,+3.5-2.5<3,,,,,+-1.5<2,,,,,,,,+3.5-
2.5<3,,,?
CJ -17,-25,-36,,,-32
B -25,-36,,-32
I -28,,-30
MN -36,-40,-36
YZ +-180,+-90,,,,+-180
W .15,,+-90,+-.5
13 IBA Studio Path Standard
T +-0.5
PQRSUX +6,+-1<1,,,,+-0.5<0.5,,,,,,,,,+-1,,,+6
MN -60,-63,-60
I -46,,-52,
CJ -35,-43,-53,,,-49
B -43,-53,,-49
YZ +-20,+-16,+-10,+-14,+-17,+-20
14 Lindos Cassette
PQRSUX ?,+-3,,,+-2,,,,,,,,+-3,,,,,?
MN -40
CJ -20,,-30
B -20,-30
I -30,-28,-36,-40
W 0.12,,+-20,+-1
YZ +-60,+-35,+-15,+-30,+-45,?
5. Tolerance Testing
Table 5.3 Pre-Defined Tolerances in the LA102 V6.5 Software
15 Studer A812 15ips
PQRSUX +-2,+-1,,,,,,,,,,,,,,,,,,+-2
MN -50,-59,?
L -63,?
D ?,-40,?
F ?,,,-40,?
C ?,,,-65,?
B ?,-65,?
W 0.04,,?,+-0.2
16 Lindos LA100 Self Test
!3
U +0-.15,,+-.1,,+-.05,,,,,,,,,,+-.10
T +-.05
L -107,-105
MN -95,-98,-95
C -90,,,-80
D -80,-86,-76
Z +-2
17 British Telecom EPS81 <40km
TV +-1
O ?,+.75-1,,,+-.75,,,,,,,,,,,,,,+.75-3,,?
E -35,?,-40
MN -45,-35,-45
18 British Telecom EPS84 <40km
TV +-1
O +.5-1<1,,,,+-.5<.5,,,,,,,,,,,,,,,,+.5-1<1,,,,+.5-
2<3,?
BCJ -56
E -50,?,-50
MN -59,-44,-59
YZ +-18,+-15,+-9,+-15,+-16,+-18
19 British Telecom EPS84 <320km
TV +-1
O +.5-2<1,,,,+-.5<.5,,,,,,,,,,,,,,,,+.5-2<1,,,,+.5-
2<3,?
BCJ -56
E -50,?,-50
MN -52,-44,-52
YZ +-18,+-15,+-9,+-15,+-16,+-18
20 British Telecom EPS98 <320km
TV +-1.5
O ?,+.75-3.25,,,+.75-2.75,,,,,,,,,,,,,,+.75-
6.25,,?
E -35,?,-40
MN -44,-35,-44
Tolerance definitions Selftest tolerance Pre-defined tolerances Studer A812 Cassette
tolerance EPS81 EPS84 EPS98 British Telecom specification Built-in tolerances
Page 91
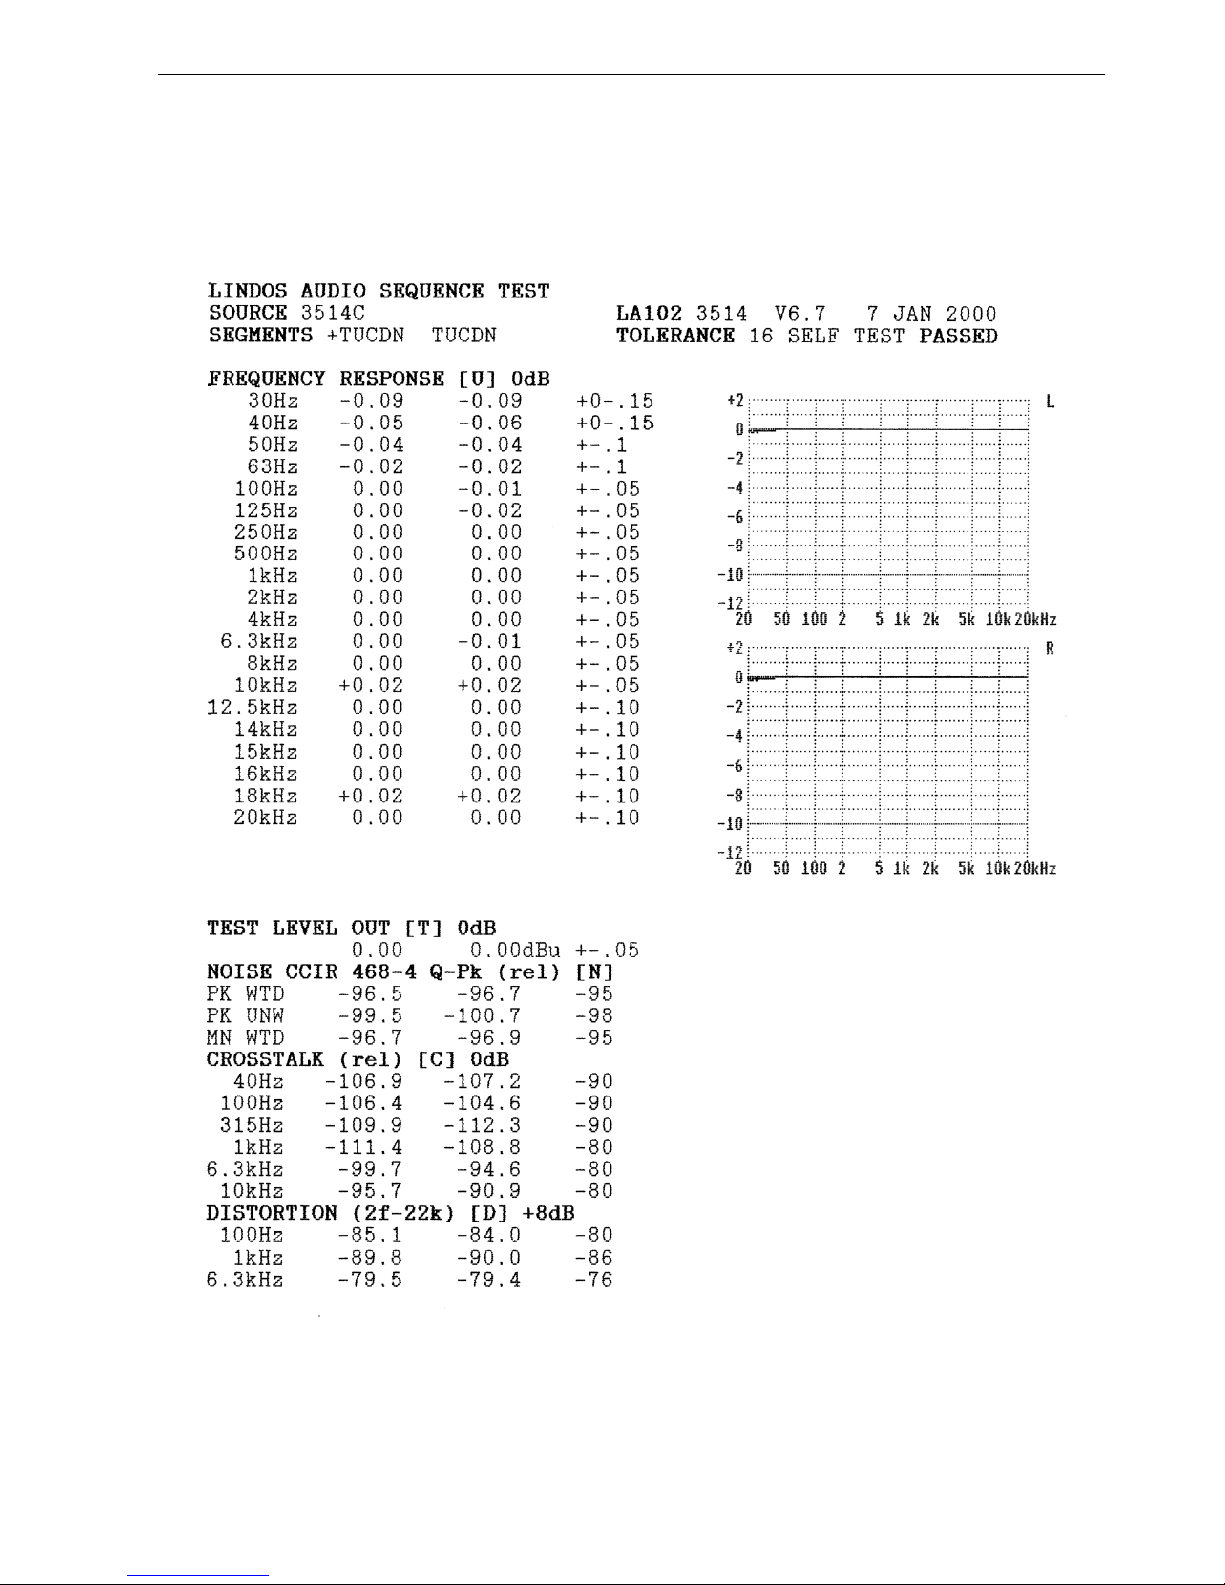
91
sequence printout HP Deskjet printout Printout from HP Deskjet Sequence results
5. Tolerance Testing
Fig. 5.4 A Typical Sequence Printout with Tolerance Testing (HP Deskjet)
Page 92
5.1 Applying a Toleranceselecting a tolerance Applying a tolerance Tolerance testing Tolerance printing
Configuration T selects the tolerance to be applied, tolerances 1 to 10 being user
tolerances, while tolerances 11 to 20 are fixed. Configuration T0 disables tolerance
testing. Once configuration T has been set all sequence results will be automatically
checked against the tolerance whenever they are displayed. If testing domestic cassette
machines for example, it may be useful to set configuration T14 so that all results are
automatically compared against the Lindos Domestic Cassette tolerance.
Tolerance configuration
Tolerance selection
It is also possible to make a sequence select a particular tolerance to be applied. In this
case the tolerance number is specified within the sequence definition, in a ± segment (see
section 4.19), and this temporarily overrides the configuration T setting, until another
sequence is received, or until the LA102 configurations are edited.
± segment (select a tolerance)
If the tolerance is pre-defined in the LA102 (tolerances 10-20) then nothing else need be
done to check results against it. However, with user tolerances (1-10) the tolerance must
be defined and entered into the LA102, using a tolerance editor.
Because the tolerance check is performed at the time of display or printout (rather than as
the sequence is received) it is possible to change the tolerance number (configuration T)
at any time to check the results in memory against any of the available tolerances.
Similarly, it is possible to recall a results memory (
) to check it against the current
tolerance. Even examining a memory status (
) will perform a tolerance check on the
specified memory (see section 3.5 for details of memory operations).
5.2 Pre-Defined TolerancesPre-defined tolerances Tolerance definitions
Tolerances 11-20 are pre-defined in the LA102 and cannot be changed. Tolerance 16 is
the Lindos Selftest tolerance which is normally automatically selected by sequence 16,
the Selftest sequence. The LA101 XLR outputs should be connected directly to the
LA102 XLR inputs using good, screened cable. The front jack sockets should not be used
because small errors in the output impedance can cause their own relatively large level
errors which are not included in the level accuracy specification of the LA101. Sequence
16 will set the LA101 test level and output impedance automatically, but 10k
input
impedance must be set on the LA102 before running the sequence.
Tolerances 17 to 20 are Engineering Performance Specifications (EPS) for programme
circuits used by British Telecom: EPS81 amplified 10kHz programme (sound) circuit for
mono transmission; EPS84 15kHz programme (sound) circuit suitable for mono
transmission; EPS98 10kHz mono multi-terminal programme circuit to connect a central
studio to a maximum of 12 outstations. Note that tolerance 18 applies to EPS84 circuits
less than 40km long while tolerance 19 applies to EPS84 circuits from 40 to 320km long.
92
5. Tolerance Testing
Page 93

Tolerances 11-13 are IBA Code of Practice specifications for General Tape, Restricted
Tape and Studio Paths respectively. Although the IBA is sadly no longer in existence the
IBA Code of Practice is still considered by many to be the definitive standard for
broadcast users and it is still in widespread use.
Tolerance 14 is a Lindos specification for a domestic cassette machines. Any good
cassette machine should pass.
Cassette machines
Tolerance 15 is the specification for stereo Studer A812 tape machines running at 15ips
with IEC equalisation and 320nWb/m nominal level but it can easily be copied to a user
tolerance and modified to suit other machines, speeds or equalisations etc. (See section
5.8).
5.3 Tolerance StringsTolerance testing Tolerance string Channel difference tolerance Limit testing Pass/fail testing
For every result value recorded by a test segment there can be a corresponding tolerance
string. Each tolerance string can specify an upper value or a range and a maximum
allowed difference between the two channels, in one of the following formats:
n Value must be less than or equal to n
±n Value must be 0±n
n m Value must lie between n and m (space or sign separate n & m)
n±m Value must be n±m
Any of these forms can be followed by a difference specifier:
<d Channels (or registers) must match within difference d
Note that the first form would normally be used for distortion, noise or crosstalk results
which must normally be below a certain limit (but there is usually no lower limit − they
cannot be too good). The second form (±n) would normally be used for frequency
response, speed error or phase results which should ideally be 0, although the third and
fourth forms are often used for frequency response results as the upper and lower limits
are often different (eg ‘+2-3’).
n, m and d may be positive or negative, although the + sign is optional. Most tolerance
limits tend to be whole numbers, although decimal places are allowed. In fact each value
may be specified to a resolution of 0.0001 in the range -9999.9999 to +9999.99 (the
decimal part can be omitted for whole numbers).
5.4 The Tolerance DefinitionTolerance testing Pass/fail testing Tolerance definitions
For each segment that requires a tolerance the segment letter is specified followed by a
list of tolerance strings, one for each value measured in that segment each separated by a
comma, as in table 5.3. A list of results values for each segment, together with the
number of values produced by each segment, is shown in table 3.2 (on page 40).
93
5. Tolerance Testing
Page 94

The segments may be specified in any order, and any segments that have the same
tolerance specification (eg R and S, or T and V) can be specified together by putting the
segment letters together. If any tolerance for a particular value in a segment is omitted
the tolerance for the previous value is assumed. For example, for distortion segment D,
the specification should start with a ‘D’ and be followed by a tolerance for 100Hz
distortion, 1kHz distortion and 6.3kHz distortion respectively. Space characters may be
inserted to make the tolerance more readable (a space before each segment letter is
strongly recommended). It is also possible to give the tolerance a title by putting a
message in quotes at the start of the definition. For example:
"DEMO" TV±.5<.1 D-60,-70,-65 YZ±20,,,±40
The tolerance title is ‘DEMO’ and this will appear on the printout and in the configuration
menu. The measured test level (segment T or V) must be within ±0.5dB of 0dBu and the
difference between channels less than 0.1dB. There is a -60dB upper limit for 100Hz
distortion, -70dB for 1kHz and -65dB for 10kHz. Phase (segment Y or Z) must be within
±20° of 0° at 40, 100 and 1kHz and within ±40° at 6.3k, 10k and 15kHz (the missing
tolerance strings default to the previous tolerance specification in the segment).
Before programming tolerance definitions into the LA102 it is a good idea to run a
sequence on the system for which the tolerance is being produced and print the results.
The proposed tolerance strings can then be written in beside each measurement and used
to produce the tolerance definition. Once the full definition has been programmed into
the LA102, the results can be printed again, with the tolerance applied, to ensure that the
tolerance definition is correct and that it agrees with the proposed version.
Distortion tolerances must be specified in dB regardless of the printout setting, but users
who prefer distortion results in % can put the equivalent percentage after the dB value,
using an "=" symbol as a separator (see section 5.5). Only the dB value is used, as text
following an "=" symbol is ignored up to the next comma, but it will appear on the
printout. For example:
D-50.5=0.3%, -60=0.1%, -80=0.01%
W&F and speed values must be in % and phase in degrees. All other values are specified
in dB. Frequency response tolerances always refer to the normalised levels of the
tabulated frequencies. Examine the built in tolerances for more examples.
A question mark (?) can be entered as a tolerance string to indicate that there is no
tolerance for that value and the tolerance column is left blank on the printout, eg
C-17,?,,-36,?,-32 will specify a tolerance for 40, 1k and 10kHz crosstalk, but will indicate
a "Don't Care" condition for 100, 315 or 6.3kHz.
Some care is needed when using a tolerance to check the frequency response results
94
5. Tolerance Testing
Page 95

because the spot frequency levels that the tolerance is applied to are affected by the
normalisation (ie the levels that are checked against the tolerance are always the same as
the levels that are printed). A tolerance which has been defined assuming 1kHz
normalisation might fail every value if given absolute levels instead of normalised levels.
To cater for such possibilities the normalisation can be specified within the tolerance
definition and this overrides the configuration J setting to ensure that the correct levels are
compared with the tolerance. The ! character is used to force the normalisation to
absolute (
!0), 315Hz (!1), 400Hz (!2) or 1kHz (!3), regardless of the configuration J
setting (and the V segment). This can be placed anywhere within the tolerance definition,
but it is conventionally placed after the tolerance title (as shown in table 5.3).
! character in tolerance
5.5 Printout FormatPrintout format Format of printout Comments on printouts Printout comments % distortion tolerances
In addition to the pass/fail features the tolerance strings can also be used to control the
format of test printouts, albeit in a limited way.
Since the tolerance strings are free format, it is possible to include extra information
(numbers and symbols only) which will appear on the results printout next to the relevant
values. One use is to make the LA102 print distortion tolerances in % as well as dB, as
explained in section 5.4. It is also useful to list the target or expected values for user level
results (see segment K, section 4.13). For example, suppose segment K is being used to
generate the levels -20,-25,-30,-35,-40 and -45dB, a tolerance could be defined to list
these values without actually testing them by preceding each target value with an = sign.
When the tolerance system encounters any invalid character (such as =) it will ignore the
rest of the tolerance string, but still print it. For this example, the tolerance would be:
K =-20,=-25,=-30,=-35,=-40,=-45
Sometimes a much simpler printout is required than that normally provided, perhaps only
listing one distortion value and one crosstalk value, and a reduced frequency response list.
This may be to enable more results to be printed on a single sheet, or perhaps because the
other values are not needed and an uncluttered printout is required. In some cases it may
be possible to choose a more appropriate segment and this will also reduce the test time
(segment F measures distortion at 6 frequencies whereas segment D only measures it at
3). Where there is no shorter segment it is possible to suppress particular results values
by putting a slash character (/) in the corresponding tolerance string.
For example, the following tolerance definition:
/ to suppress printout values Suppress printout values
N-40,/,/ C/,,,?,/,?
will apply a tolerance of -40dB to the CCIR peak weighted noise result, and suppress the
printing of unweighted and mean noise. It will also suppress the 40Hz, 100Hz, 315Hz
and 6.3kHz crosstalk results and only print the 1kHz and 10kHz values. Note that the
?
95
5. Tolerance Testing
Page 96
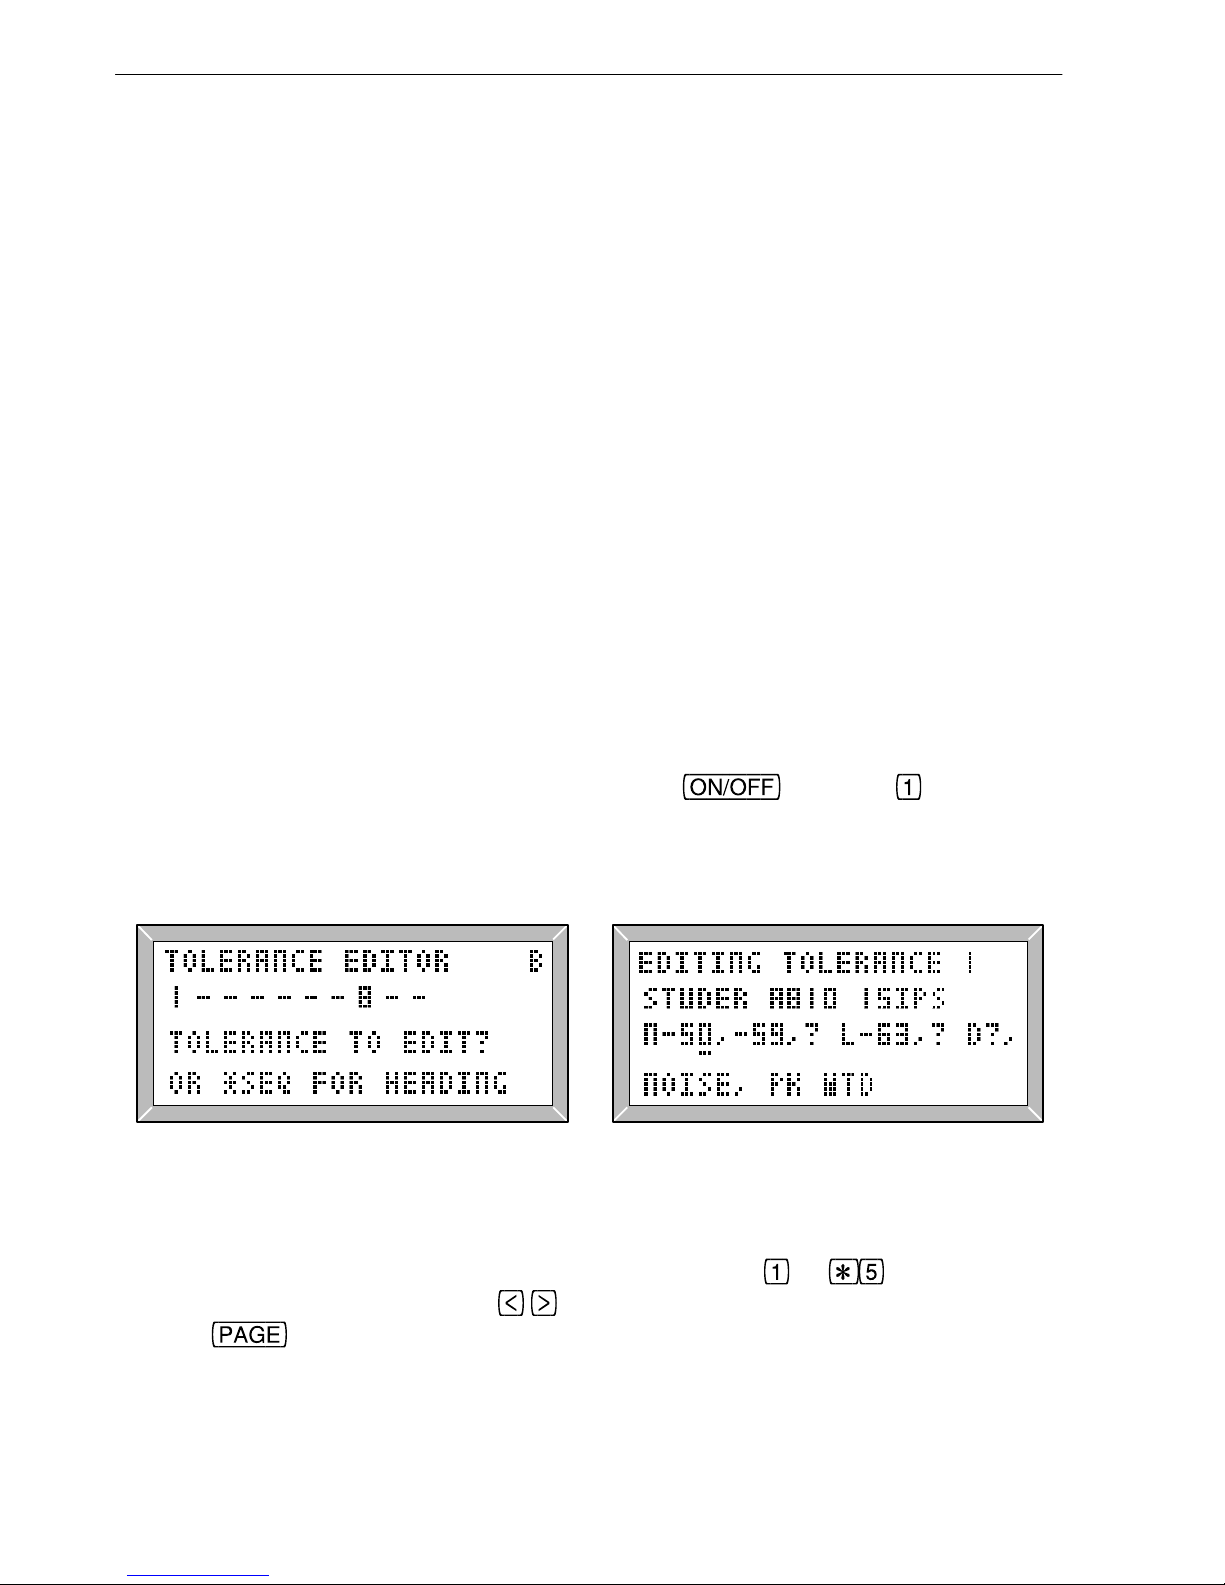
character is used to print a value without tolerance testing, and also that an empty field,
after a
/ field will also cause the corresponding results line to be suppressed (since empty
tolerance fields always default to the last field which had an entry). It is not possible to
apply a tolerance to suppressed results values (because the printout would be very
misleading if an invisible value failed). The simplified results printout would look like
this:
NOISE CCIR 468-3 Q-Pk (Rel) (N)
PK WTD -39.7* -41.6 -40
CROSSTALK (rel) (C) 0dB
1kHz -45.3 -46.9
10kHz -43.2 -42.7
If this facility is being used to suppress some results values without tolerance testing, the
“TOLERANCE n PASSED” message printed at the top of the test sheet is redundant. In
such cases, it can be suppressed by putting a slash character (/) at the start of the tolerance
(as the first character, in place of the quoted title). Only printer output is affected, the
results displayed on the LCD are always shown in full, and are never suppressed.
5.6 The LA102 Tolerance EditorTolerance testing Pass/fail testing Tolerance editor Tolerance number
User tolerances are entered from the keyboard using a built in editor (or from a remote
computer) and stored in non-volatile memory. Hold
and press to obtain the
LA102 tolerance editor. User tolerances that are defined are indicated by a number
(1-10), while undefined tolerances are represented by a dash (‘−’) as shown in fig 5.5.
Editor
keys
Fig. 5.5 The LA102 Tolerance Editor Fig. 5.6 Editing a Tolerance
Enter the number of the tolerance to be edited by pressing
to . To view a pre-
defined tolerance (11 to 20) use the
buttons to select the tolerance number and then
pressing
. Pre-defined tolerances can be copied to a user tolerance - see later in
this section.
The tolerance definition is a single line of text up to 250 characters in length (fig. 5.6).
96
5. Tolerance Testing
Page 97
The and keys move the cursor right and left by one character, while
and move it 21 characters (a screen width), with the display
scrolling sideways as necessary.
Editor keys
The and keys are used to change the character at the cursor, and they cycle through
the available characters:
<space> ABCDEFGHIJKLMNOPQRSTUVWXYZ
bcdhkmnoruxz @!?%<>=±
/+− . 0123456789 ,"
As in the sequence editor and give quick access to letters (‘Z’) and symbols
respectively (see section 4.2). It is also possible to enter a number directly by pressing
to or to (for 6 to 9 and 0). Pressing inserts a space while (ZAP!)
deletes a character, and all of the keys automatically repeat if held for a short while.
returns to the ‘TOLERANCE TO EDIT’ prompt (fig. 5.5).
The LA102 tolerance editor gives a description of the tolerance entry at the cursor
position, for example:
FREQUENCY RESPONSE, 6.3kHz, or NOISE, WTD.
It is often convenient to copy a pre-defined tolerance to create a slightly different version
without re-entering the entire tolerance - perhaps to modify the pre-defined Studer A812
tape tolerance to more accurately match a different machine, for example. This can be
achieved by pressing
] while the editor screen (Fig 5.5) is displayed, until the desired
pre-defined tolerance title is displayed, then press
to view the definition, to
enable copying, and finally the user tolerance number to which you wish to copy. Note
that all pre-defined tolerances must be copied to a user tolerance before they can be
changed.
Pressing
(or resetting by tapping ) will leave the chosen tolerance in non-
volatile memory ready to be selected by setting configuration option T to its tolerance
number.
Copy a tolerance Move tolerance Printing tolerance definitions Tolerance printing Studer A810
It is often useful to print tolerance definitions on a printer for future reference, and this is
readily achieved by pressing
from the tolerance editor menu to print all of the
defined tolerances. When printed the ‘±’ symbol will be expanded to ‘+-’ characters as it
is not a standard ASCII character and not available on all printers.
Each of the 10 user tolerances may be up to 255 characters in length. Because of the way
RAM is shared in the LA102, sequence results memories 4&5 are lost (reducing the total
number of memories from 6 to 4) when user tolerances are defined and any attempt to
perform a memory operation with memories 4 or 5 will then be ignored. To reclaim
sequence memories 4&5 all of the user tolerances must be cleared by using the reset
menu (
and then ) or by deleting each tolerance in turn (using .
97
5. Tolerance Testing
Page 98
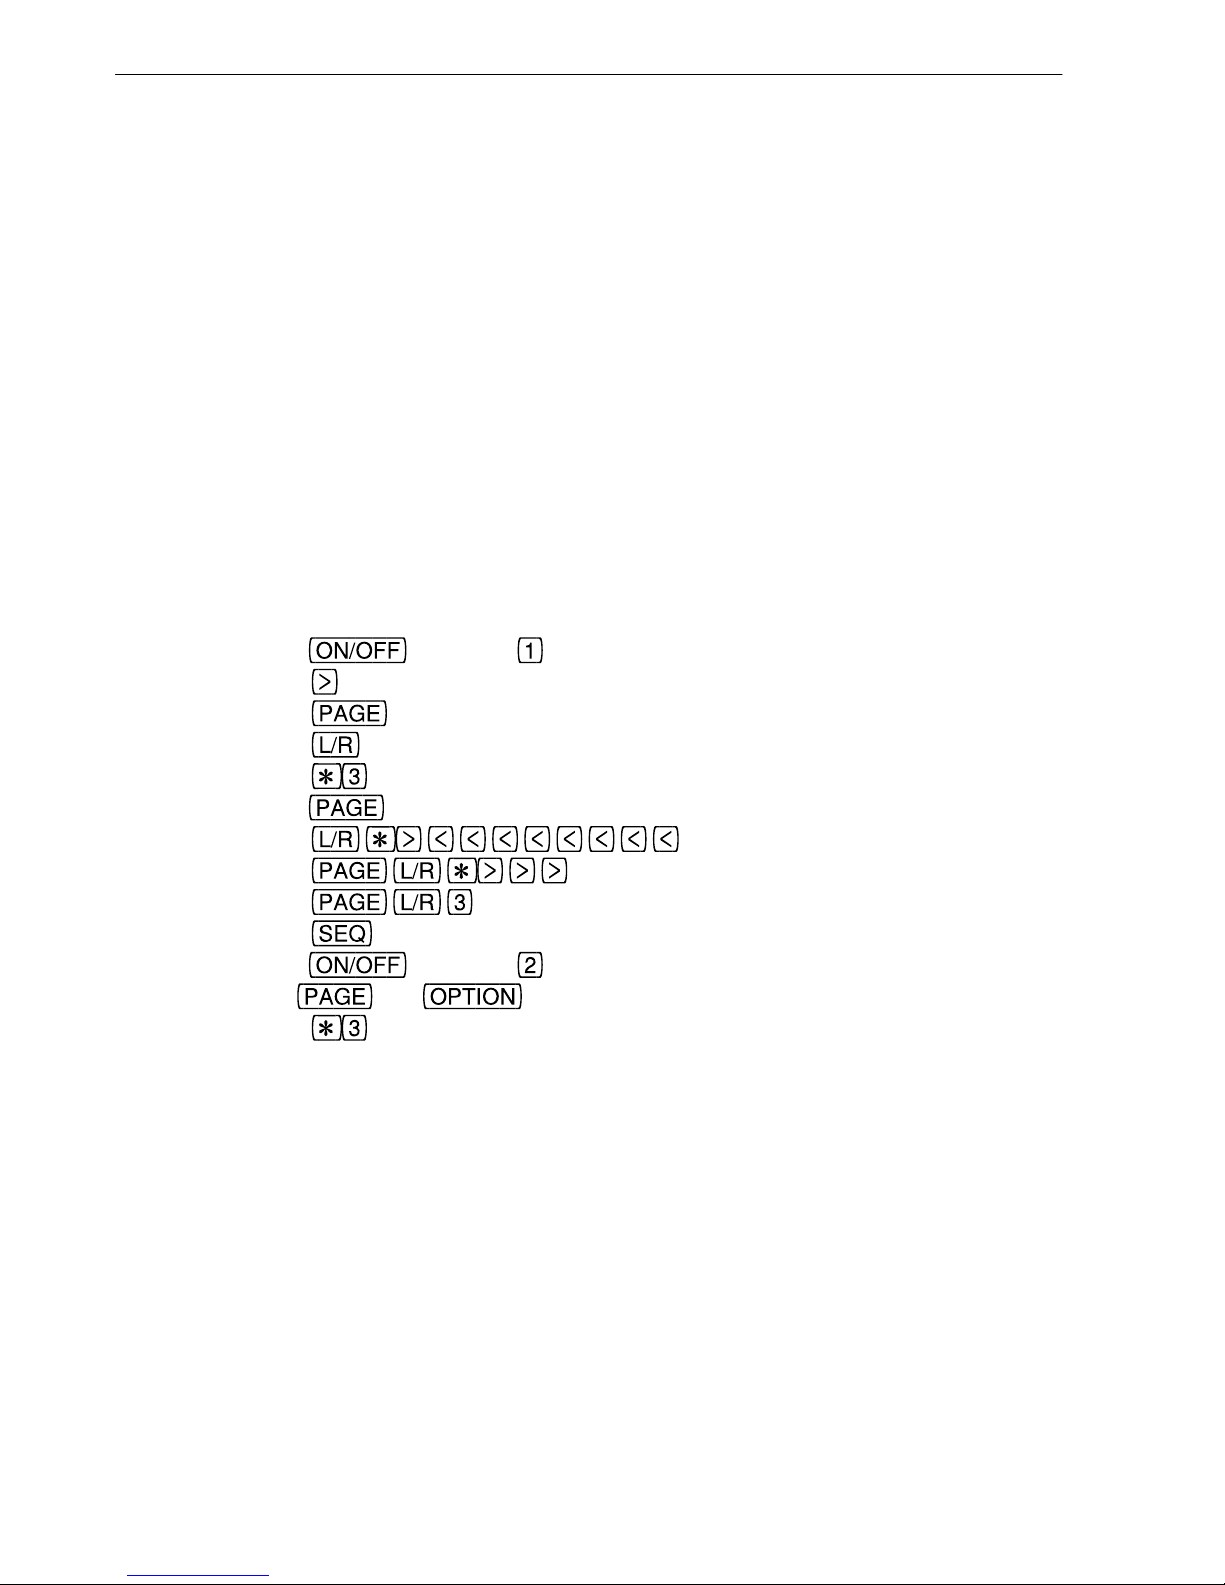
5.7 Editing Tolerances on a Remote ComputerTolerance testing Pass/fail testing
The Lindos Support Software (appendix A.2) provides a tolerance editor for editing
tolerances on a remote computer. Tolerances can be saved to disk for later use, and
transferred from the computer to the LA102.
If more than 10 tolerances are frequently used the Lindos Support Software should be
used to store the tolerances on disk and transfer them to the LA102 as necessary. The
Support Software also makes it easier to edit Tolerance definitions using a full-size
keyboard so the LA102 tolerance editor can be ignored. Unlike sequence definitions,
tolerances are often relatively large (typically 120 characters), so the support software is
generally preferred if available.
Computer support software
5.8 Example Tolerance
To copy tolerance ‘EPS81 <40km’ (tolerance 17) into user tolerance 8, and add the
specification that the channel difference at 1kHz must be less than 0.3dB (ie ‘TV±1<.3’)
Hold
and press to obtain the tolerance editor (fig 5.7)
Press
7 times to select tolerance 17 (fig 5.8)
Press
to enter viewing mode (fig 5.9)
Press
to enter copy mode (fig 5.10)
Press
to select user tolerance 8 (fig 5.11)
Hold
until cursor is at the space after ‘TV±1’
Press
to insert a ‘<’ character
Press
to insert a ‘.’
Press
to insert a ‘3’ (fig. 5.12)
Press
to exit from the editor
Hold
and press to obtain the configuration menu
Use
and to position the cursor under the T (fig 5.13)
Press
to ensure that tolerance 8 is applied to all sequence results
After entering a user tolerance it is wise to run a sequence, print the results and check the
tolerance column to ensure it is as intended and that no commas or numbers have been
omitted.
98
5. Tolerance Testing
Page 99
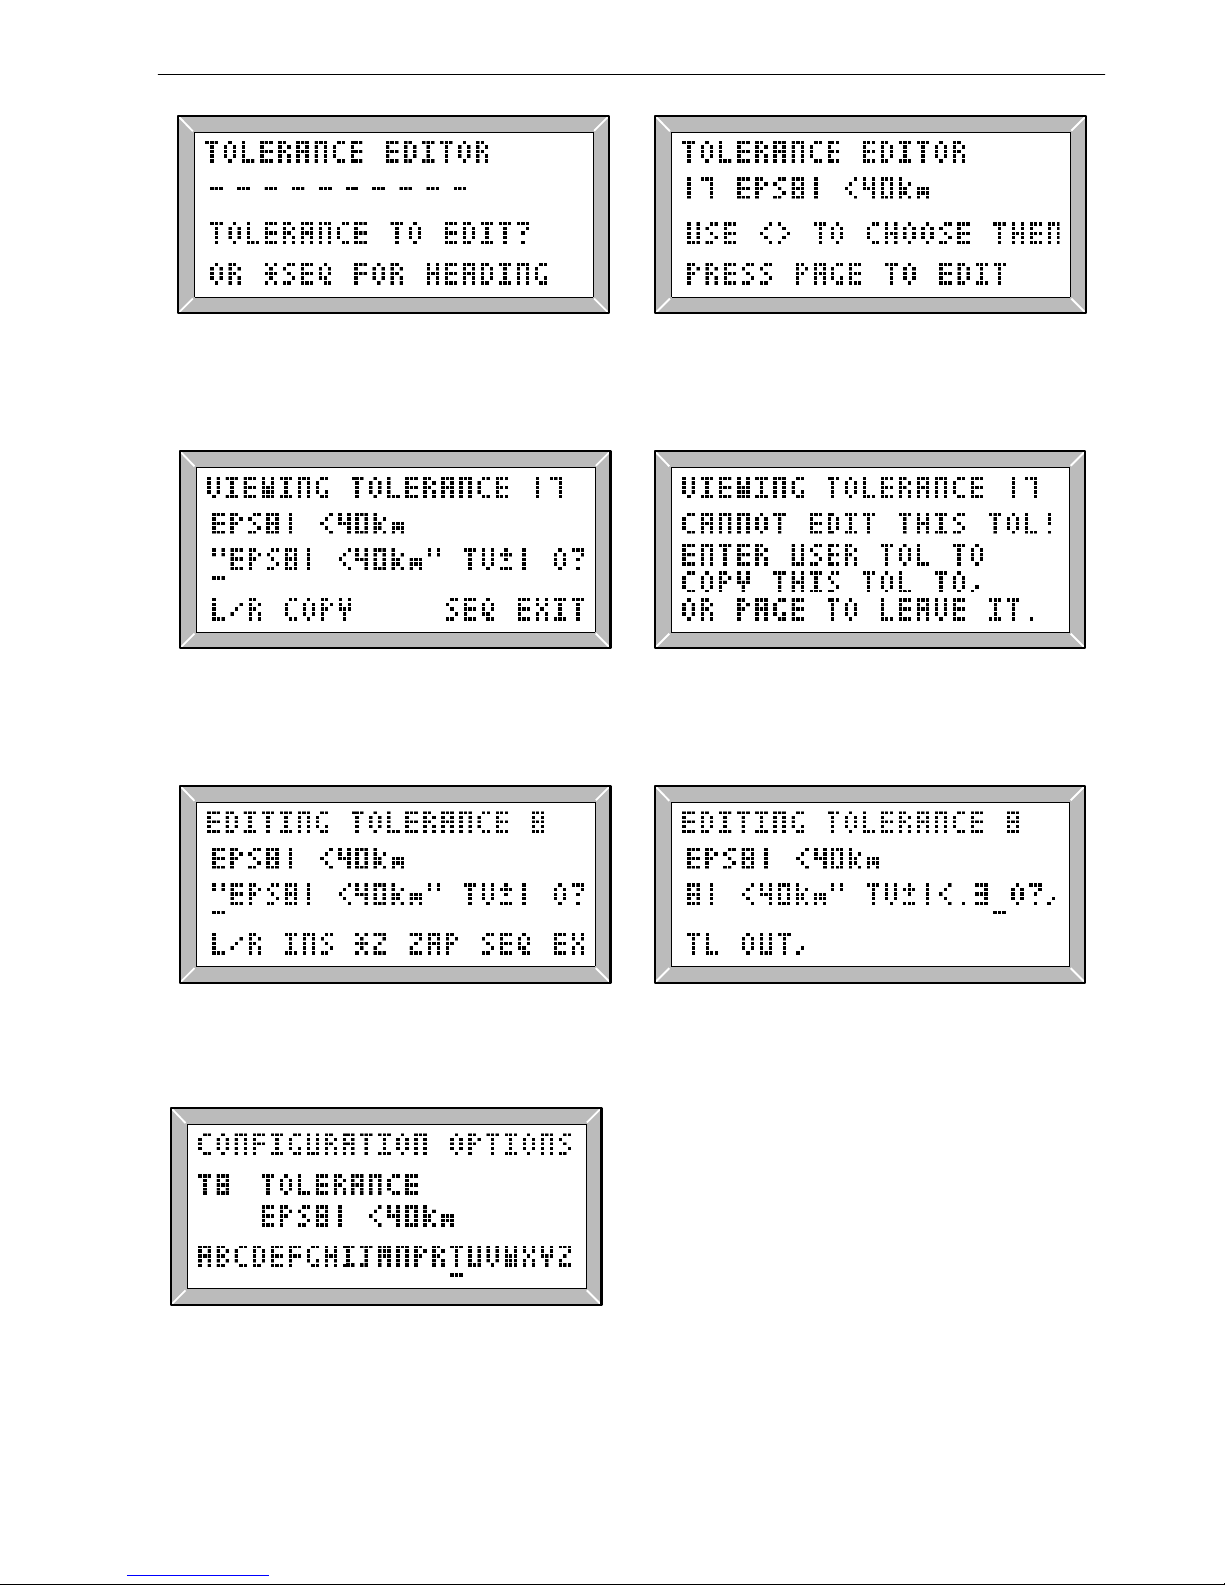
Fig. 5.7 Tolerance editor Fig. 5.8 Tolerance 17
Fig. 5.9 Viewing the Tolerance Fig. 5.10 Copying Mode
Fig. 5.11 The Opening Edit Screen Fig. 5.12 The Final Version
Fig. 5.13 Setting Configuration T
99
5. Tolerance Testing
Page 100

100
5. Tolerance Testing
 Loading...