

Page 1
lindab | we simplify construction
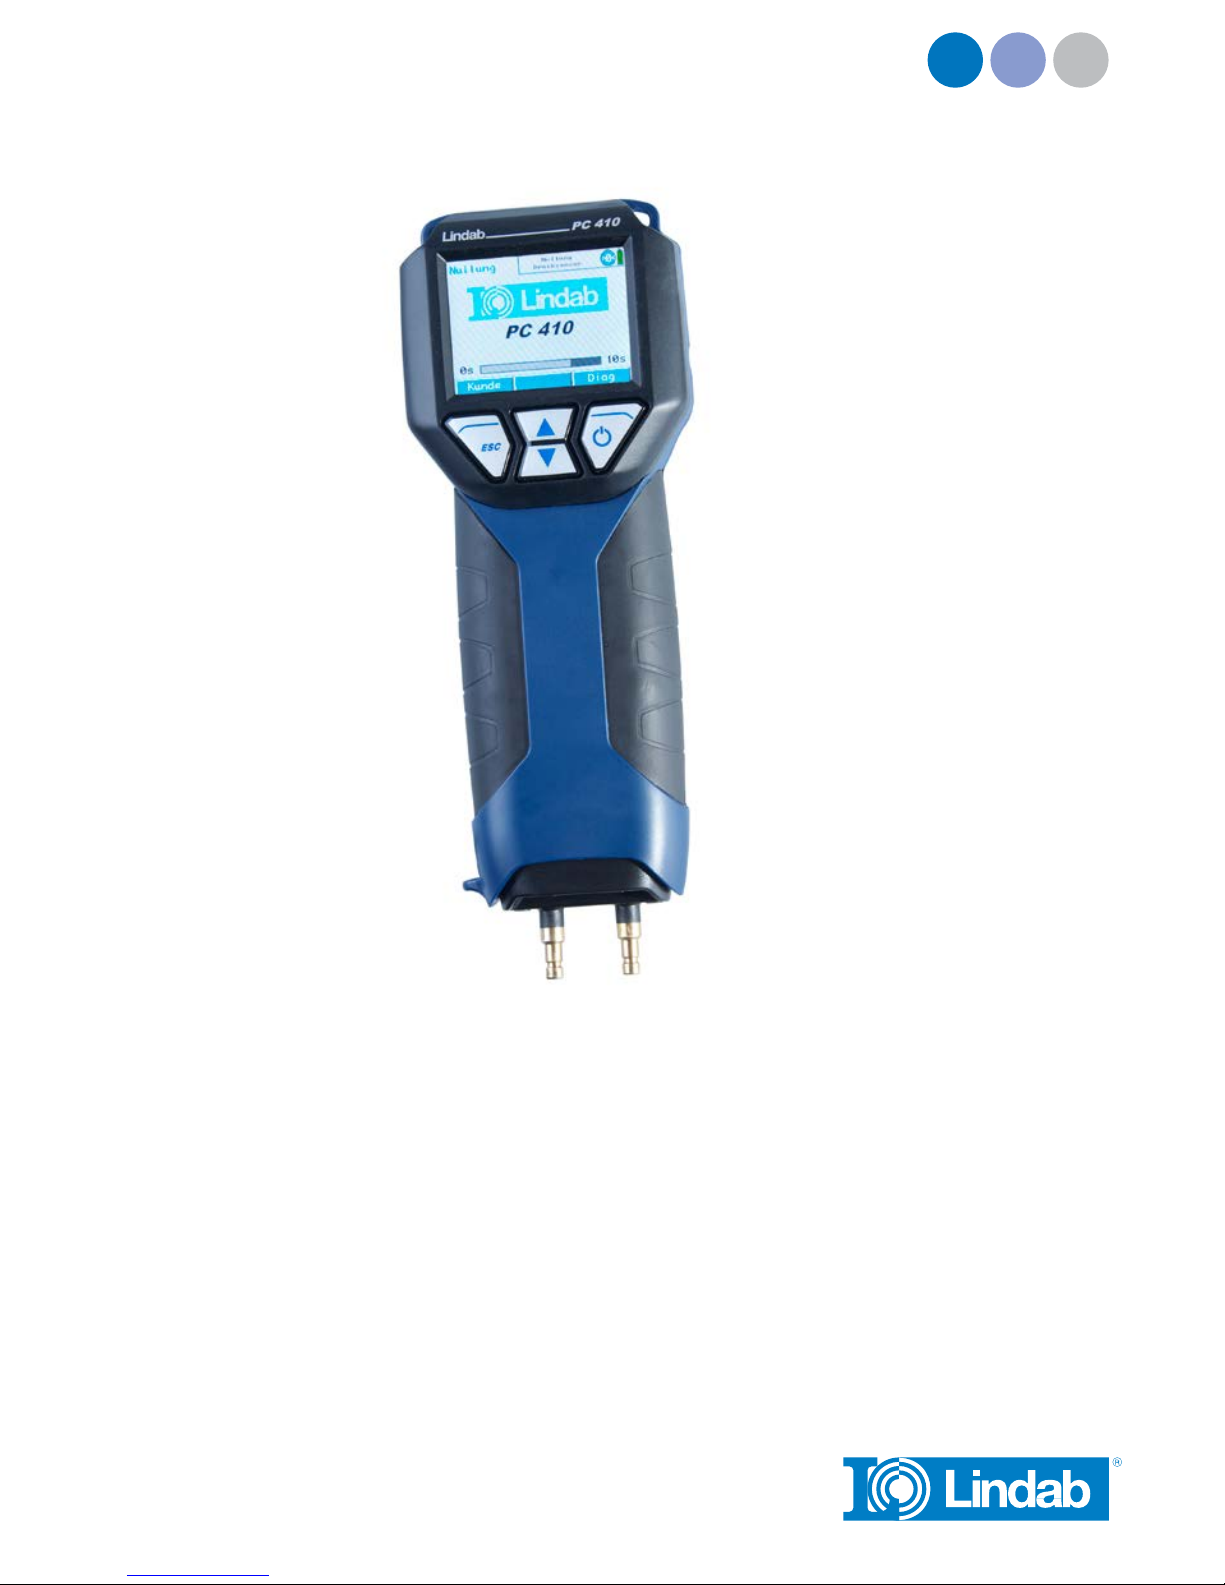
PC 410
Manual Flow and Pressure Meter
Page 2

2
Content
1 General Information 3
1.1 Operation Manual Information 3
1.2 Notes 3
1.3 Intended Use 3
1.4 Basic equipment 4
1.5 Transport 4
1.6 Information on disposal 4
1.7 Direction 4
2 Specifications 5
2.1 Measured values 5
2.2 Calculated Values 6
2.3 Logger 6
2.4 Technical Data 7
3 Component explanation 8
3.1 Basic unit 8
3.2 Probes and Components 10
3.3 Function 12
3.4 Operating Mode 13
3.5 Display and key setup 13
4 Getting started 15
4.1 Check battery status 15
5 Operation 17
5.1 Turning the Meter on and Self Check 17
5.2 Measuring 17
5.3 Using the Pressure computer 18
6 Measurement modes 20
6.1 Selecting the main menu 20
6.2 Option “Air flow (k value)” 21
6.2.1 Theoretical background 21
6.2.2 Connecting the meter to the vent 23
6.2.3 Performing the Test 24
6.3 Option “K-Value Matching” 26
6.4 Option “Airflow (Pitot)” 28
6.4.1 Measuring the airflow (Pitot) 28
6.4.2 Grid-point measurements 29
6.5 Option “Air speed” 32
6.5.1 Measuring the air speed 32
6.5.2 Theoretical background 32
6.6 Option “4 PA Test” 34
6.7 Option “Heating Check” (Energy
Utilization Check) 37
6.8 Option „Volume“ 42
6.9 Option “U-value” 45
6.10 Option “Graph / Record” 46
6.11 Option „Print“ 48
6.12 Option "Setup" 47
6.13 Option "Save measurements" 49
7 Option 'Data management' 50
7.1.1 Save Customer Records 50
7.1.2 Creating a New Customer Folder 51
7.2 Option "Data management" 51
7.3 Data Transfer with the Computer or
Notebook 52
7.4 Data Logging 52
8 Troubleshooting 52
9 Maintenance 53
9.1 Maintenance work 53
10 Warranty and Service 53
10.1 Warranty 53
11 Accessories 54
12 Declaration of conformity 55
Page 3
3
1. General information
1.1 Operation Manual Information This operation manual allows you to safely work with the PC
410. Please keep this manual for your information.
The PC 410 Flow and Pressure Meter should be employed by
professionals for its in-tended use only.
Liability is void for any damages caused by not following this
manual.
1.2 Notes
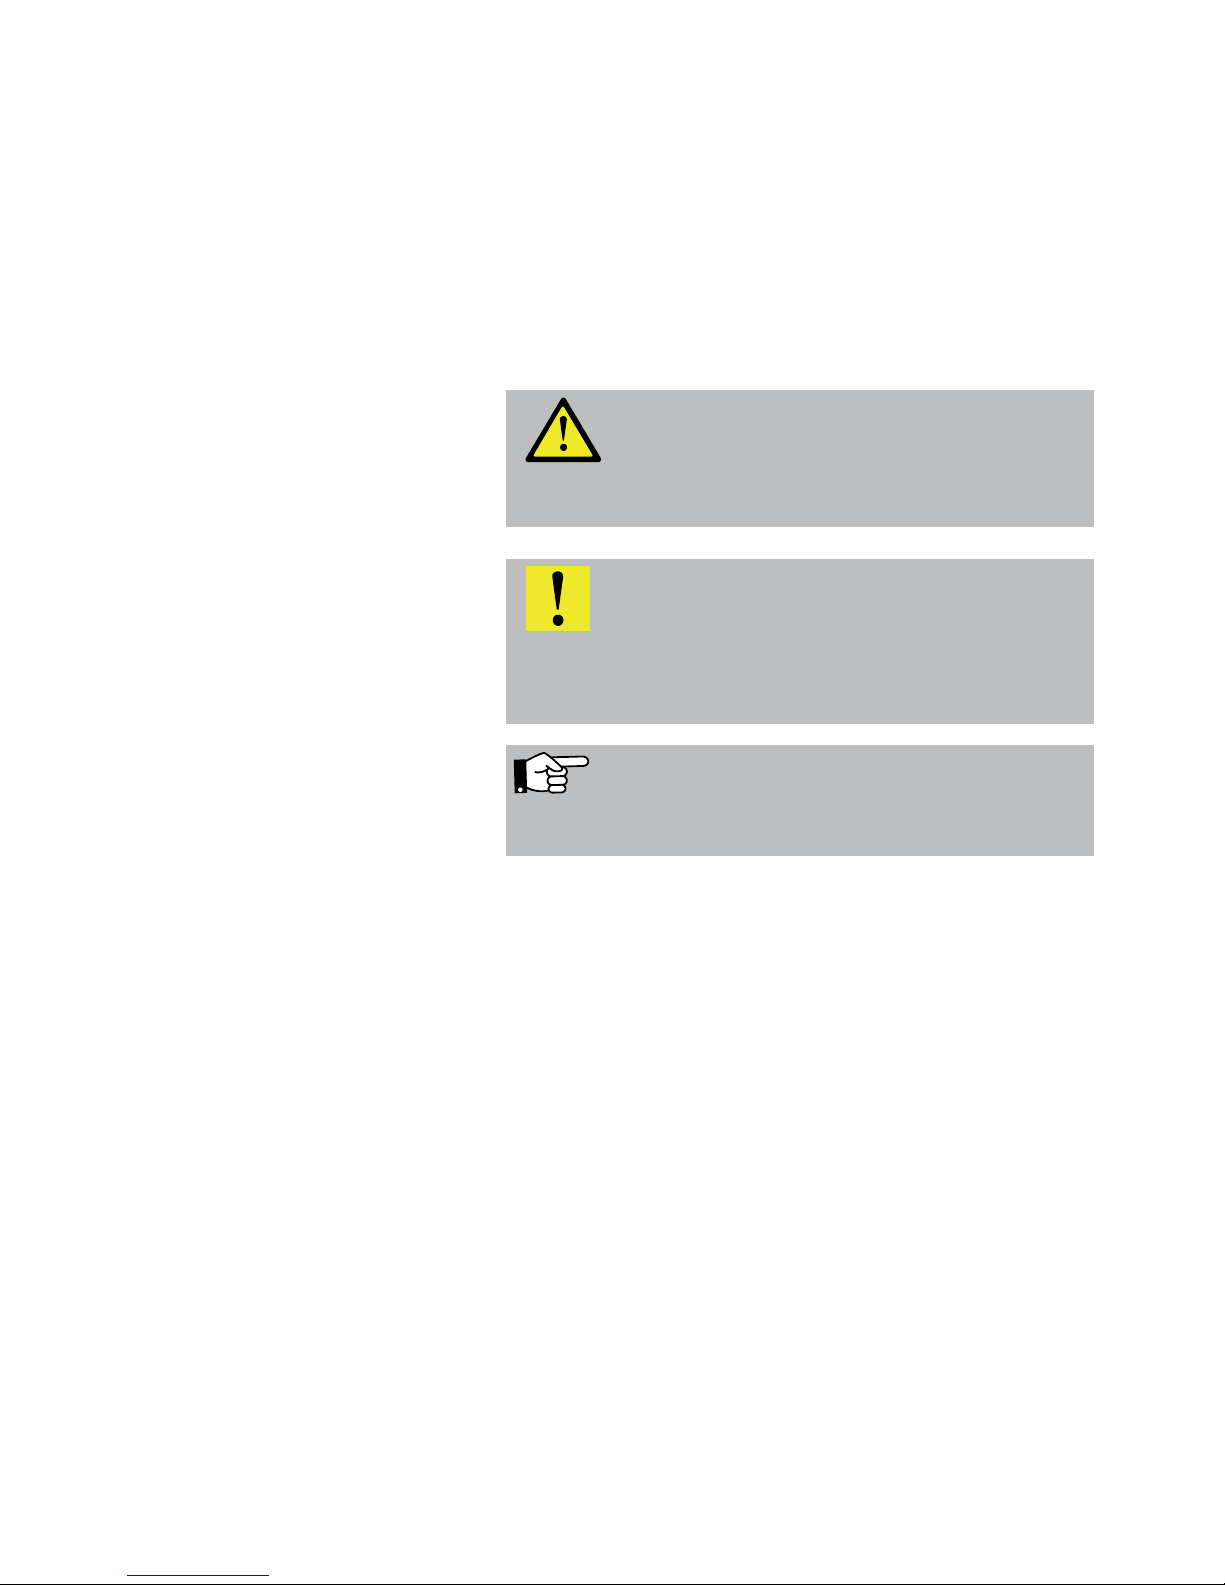
WARNING!
Not following this warning can cause injury or death.
ATTENTION!
Not following this note can cause permanent damage to
the device.
NOTE!
Useful information
1.3 Intended Use The meter can be used for the measurement of differential
pressure, airflow, flow speed and temperature as well as for
the registration of humidity and ambient pressure. It is especially designed for the following purposes:
• Acceptance measurements at ventilation systems accord-
ing to DIN EN 12599.
• 4 PA Pressure Test to confirm the combustion air availabil-
ity.
• Measurement of the ventilation loss and the surface loss.
• Flow pressure, installation pressure, standing pressure, jet
pressure.
• Flow measurement in air and flue gas ducts.
• Data logger.
Page 4
4
1.4 Basic equipment
Device Components
PC 410 Flow and Pressure Meter with bat-
teries
Hand strap
Silicone hose, 6 m
Rubber hose, 1,5 m
Plastic case
1.2 Transport
ATTENTION!
Improper transport can harm the instrument.
Always transport the instrument in the provided carrying case
in order to prevent damage. The pressure connectors have to
be protected by the protection cap.
The case is included in the sets and also can be bought
separately.
1.6 Information on disposal Electronic equipment does not belong into domestic waste,
but must be disposed in accordance with the applicable
statutory provisions.
You may hand in any defective batteries taken out of the unit
to our company as well as to recycling places of public disposal systems or to selling points of new batteries or storage
batteries.
1.7 Contact Please contact your local Lindab distributor
or send for technical questions an E-Mail:
Page 5
5
2. Specifications
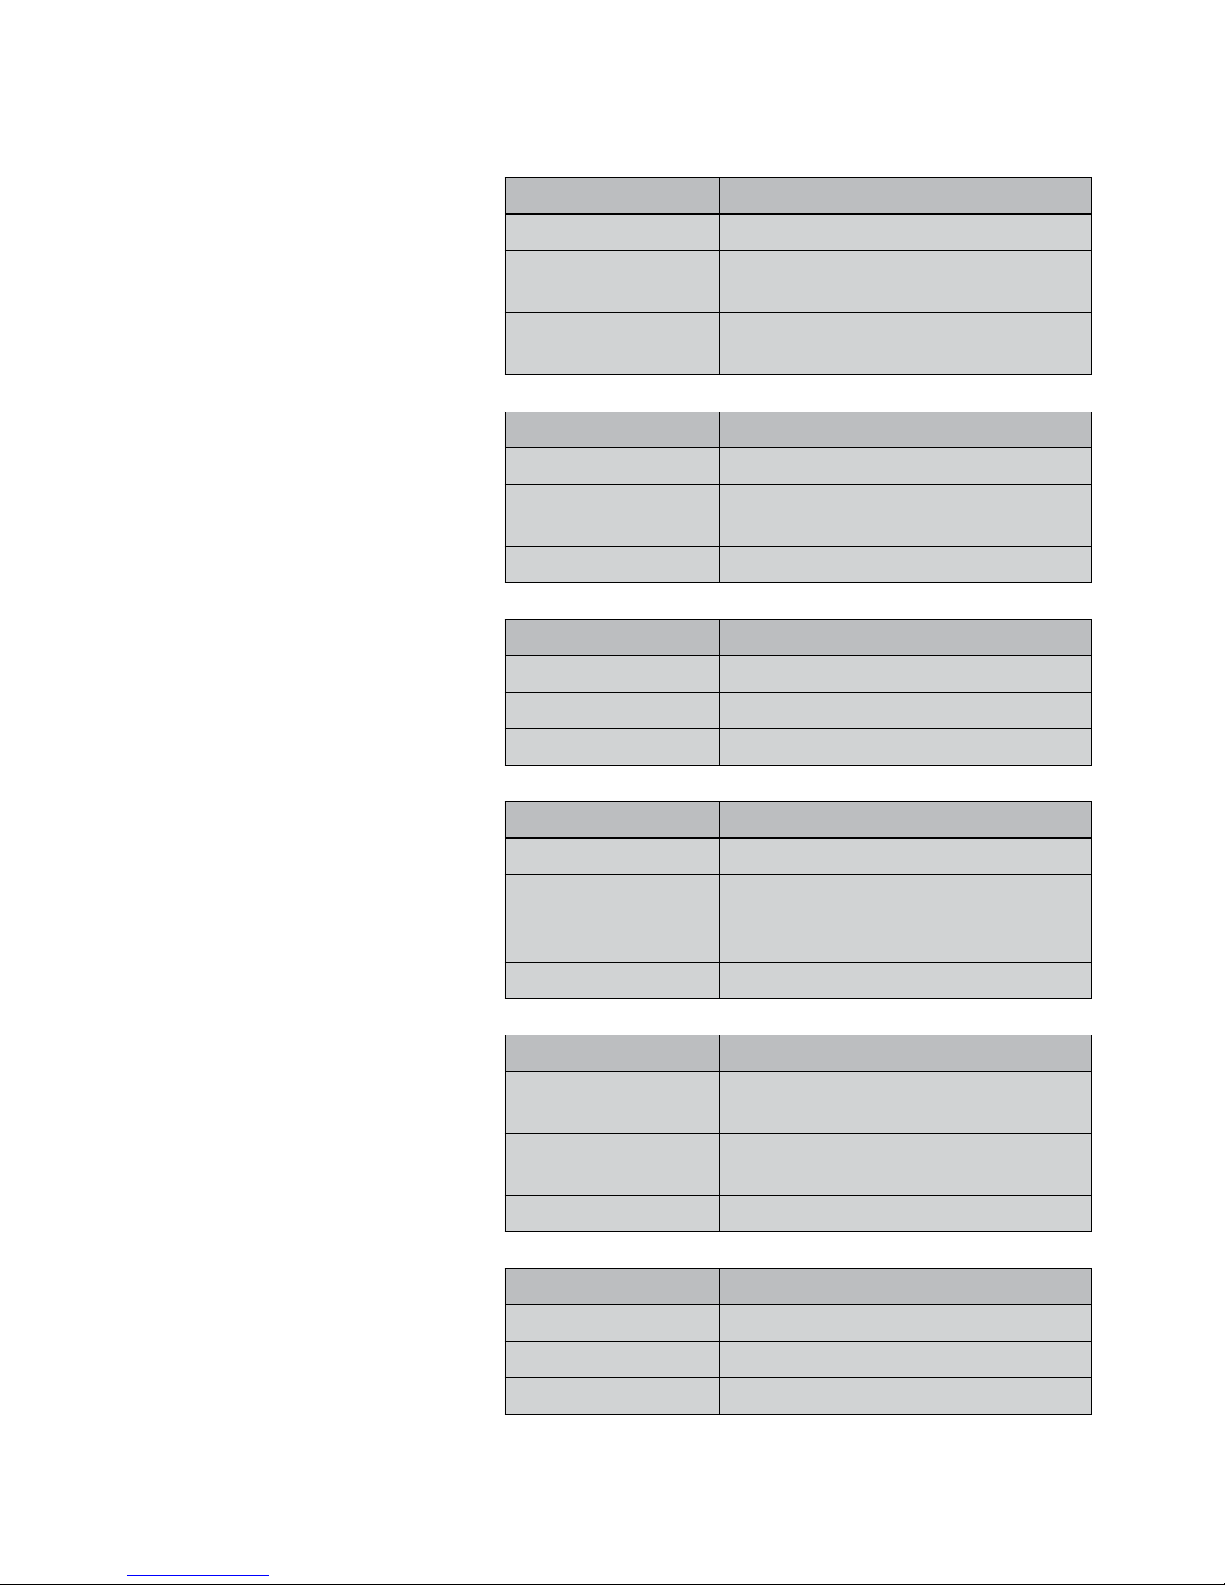
2.1 Measured values
Description Data
Range ±100 hPa
Accuracy < 3 % of the reading, if the value is
< ± 10 Pa, better than ± 0.3 Pa
Resolution 0.1 Pa at -1100 hPa to +1100 hPa,
otherwise 1 Pa
Measurement of very small
pressures
Description Data
Range ±100 hPa
Accuracy < 3 % of the reading, if the value is
< ± 10 Pa, better than ± 0.3 Pa
Resolution ± 0,01 Pa
Internal temperature
measurement
Description Data
Range -20 °C to 60°C
Accuracy < ± 1 °C
Resolution 0.1°C
External temperature
measurement
(optional, e.g. with
Measuring Pliers for
Temperature Measurement
or Special Wall Temperature
Probe)
Description Data
Range 2 canals, -20.0 °C to +800.0 °C
Accuracy < ± 2 °C at 0°C to 133°C, otherwise
1.5 % of the value, according to the
directive EN 50379-2
Resolution 0.1°C
Humidity measurement
(only AF version)
(integrated humidity sensor)
Description Data
Range 0 % to 100 % RH (relative
humidity), non condensing
Accuracy < ± 2 % RH, in range 0 to 90 % RH,
otherwise < 3 % RH
Resolution 0.1 % RH
Ambient Pressure measurement (only AF version with
humidity sensor)
Description Data
Range ±300 hPa, else 1100 Pa
Accuracy < ± 1.5 % hPa of reading
Resolution 0.1 hPa
Page 6
6
2.2 Calculated values
Variable Calculation
Pressure units hPa, Pa, mmH
2
O, PSI, inwc, bar,
mbar,
conversion according to the general
conversion rules.
Temperature units °C, °F,
conversion according to the general
conversion rules.
Air speed
Description Data
Range 0.3 m/s to 120 m/s
Resolution 0.01 m/s
Continuous density
correction
automatic, with temperature signal.
2.3 Logger
Description Data
Extent 9999 measurements, each with the
measured value of pressure and
humidity (optional) and three temperature values (if the external temperature sensors are connected) can
be stored in the internal memory.
The user can set the log rate from 1
second to 24 hours.
USB interface for
data transfer to a
PC
Permanent online data, already
during the registration.
User adjustable log
rate
Sampling interval of 1 second to 24
hour can be set.
NOTE!
Ensure that the meter is connected to the power supply or
that the batteries are charged.
Page 7

7
2.4 Technical Data
Description Data
Power
Consumption
4 AA rechargeable batteries or 4 AA
disposable batteries 1.5 volt
- working mode: ca. 60 mA,
- off-mode and log mode:
ca. 45 µA for clock and processor
Interface USB- (COM-Port),
data transfer to the PC.
It is possible to transfer the data
directly from the meter to the TD 600
thermal fast printer.
Storage
temperature
-20 °C to +60 °C
Operating
temperature
5 °C to +40 °C
Mass ca. 365 g, with batteries and
integrated magnet
Dimension 80 × 550 × 60 mm
Date and time Date and time are included in the
measurement report
Internal Memory 2 MB
Page 8
8
11
12
2
9
10
1
8
4
5
6
7
3
3. Component explanation
3.1 Basic unit
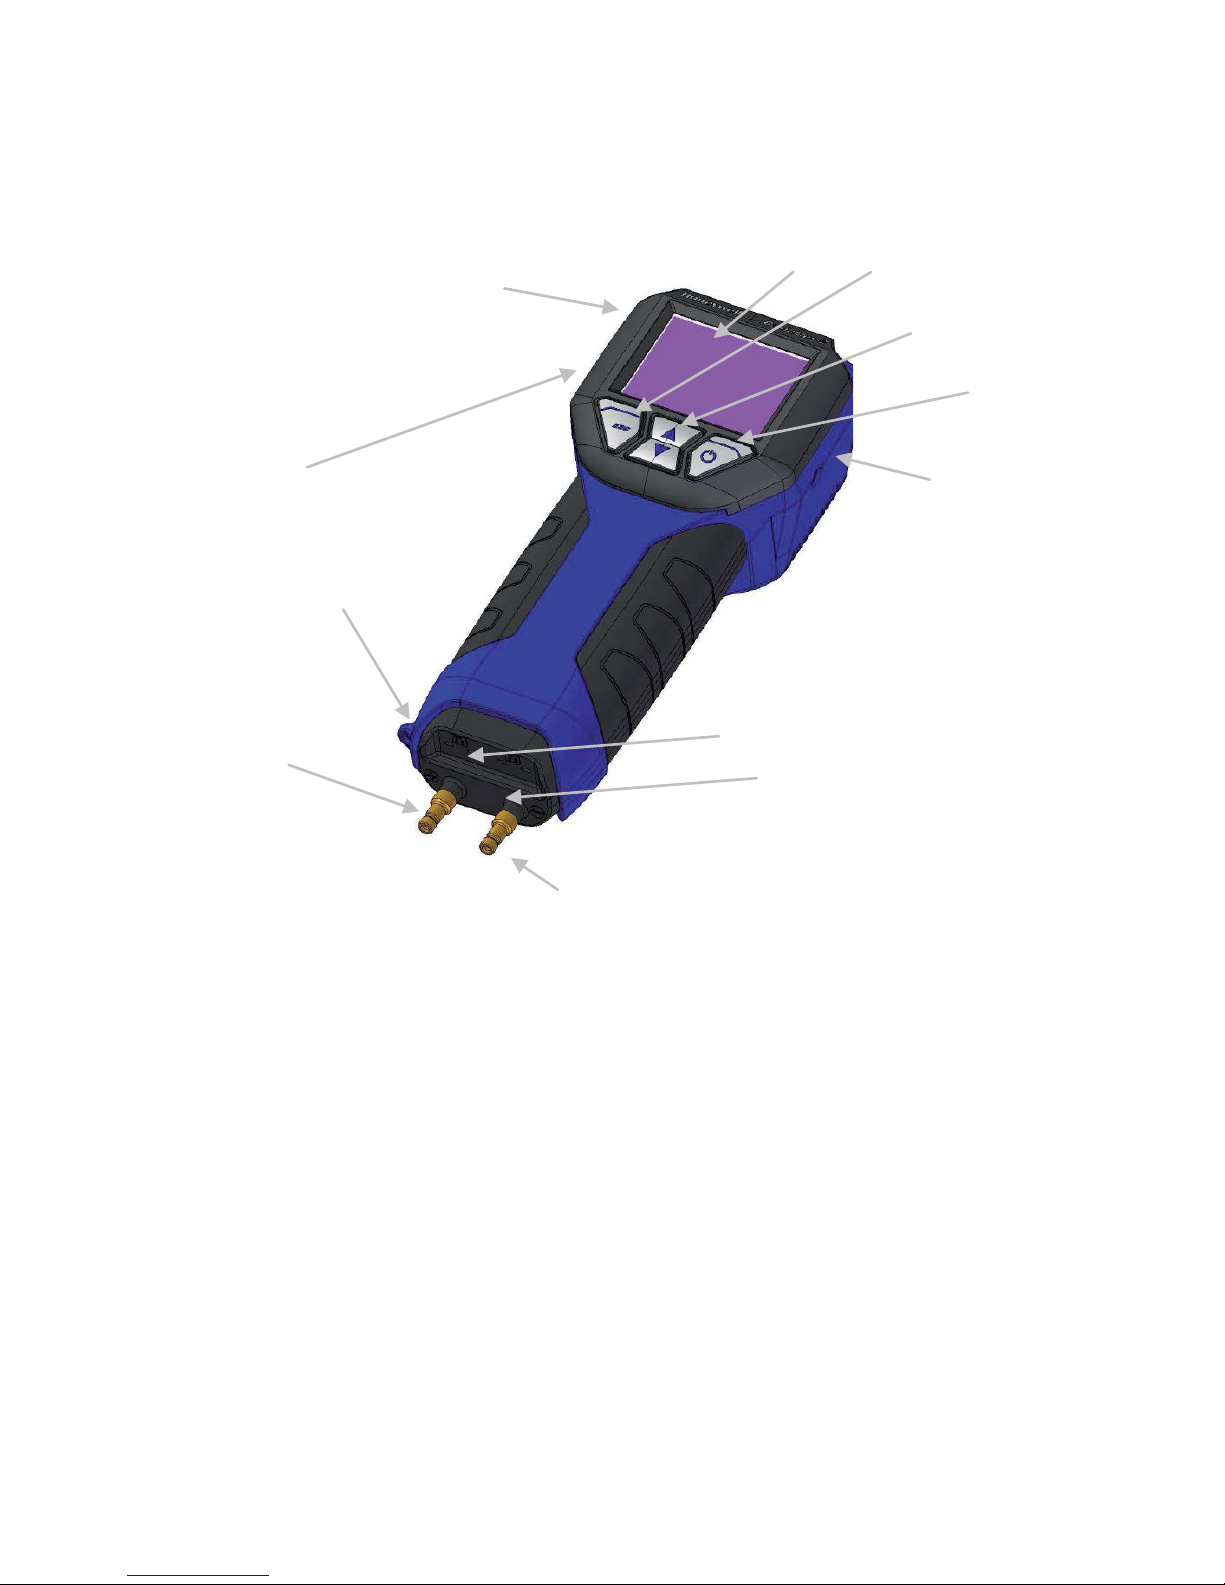
Fig. 1: Overview
Page 9
9
Number Part
1 Mini-USB-Port
2 Connection for protection cap
3 Power jack
4 Color display
5 ESC key context-sensitive
Escape
NOTE!
Keeping this key depressed will always call up the main menu.
6 Arrow keys The function changes according to the context.
Scroll up and down.
7 ENTER
and On-/Off key
a) Confirm the setting.
b) The function of the key changes according to the context.
c) Press and hold the key for 3 seconds to turn off the unit.
8 Infrared interface Thermal fast printer to print out the measurement report
9 Overpressure socket (+) Main connection
10 Underpressure socket (--) Reference socket for the measurement of the differential
pressure and static socket for the S-tube probe
11, 12
14
Standard jacks for temperature probes NiCr-Ni
14 Battery cover (in Fig. 1 on the rear side)
There are diffusion openings for the internal registration of the
humidity and temperature on the rear side of the Lindab
PC 410. The internal temperature measurement is necessary
for the temperature compensation of the pressure sensor.
Page 10
10
3.2 Probes and Components
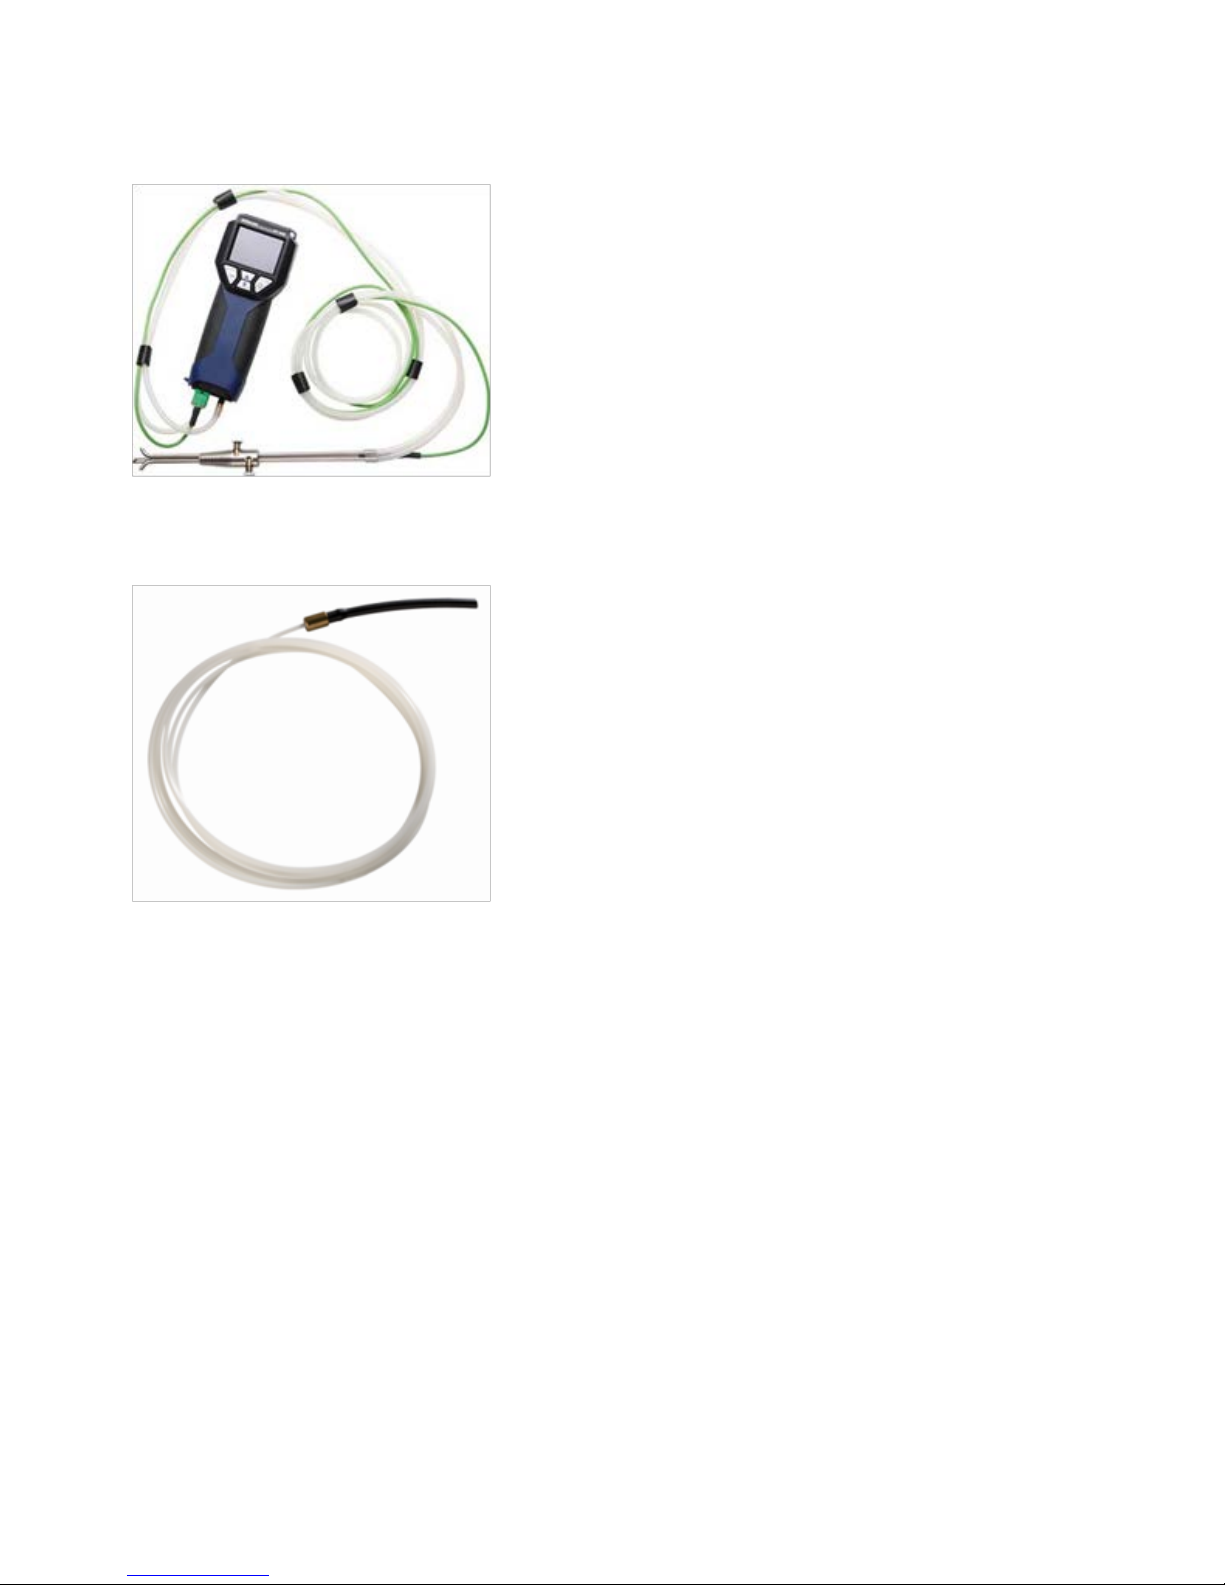
S-tube probe for measuring the flow speed (see chapter 6.5)
and the airflow (see chapter 6.2).
• Insert the plug of the S-tube probe into jack 11 (Fig. 1) of
the PC 410.
• Connect the overpressure hose (turned against the flow) of
the S-tube probe to the overpressure socket (+) (Fig. 1, part
9) and the underpressure hose to the underpressure socket
(-) (fig. 1, part 10).
Fig. 2: S-tube probe
Flexible capillary
For the 4 PA test two flexible capillaries are needed.
Fig. 3: Capillary tube
Page 11
11
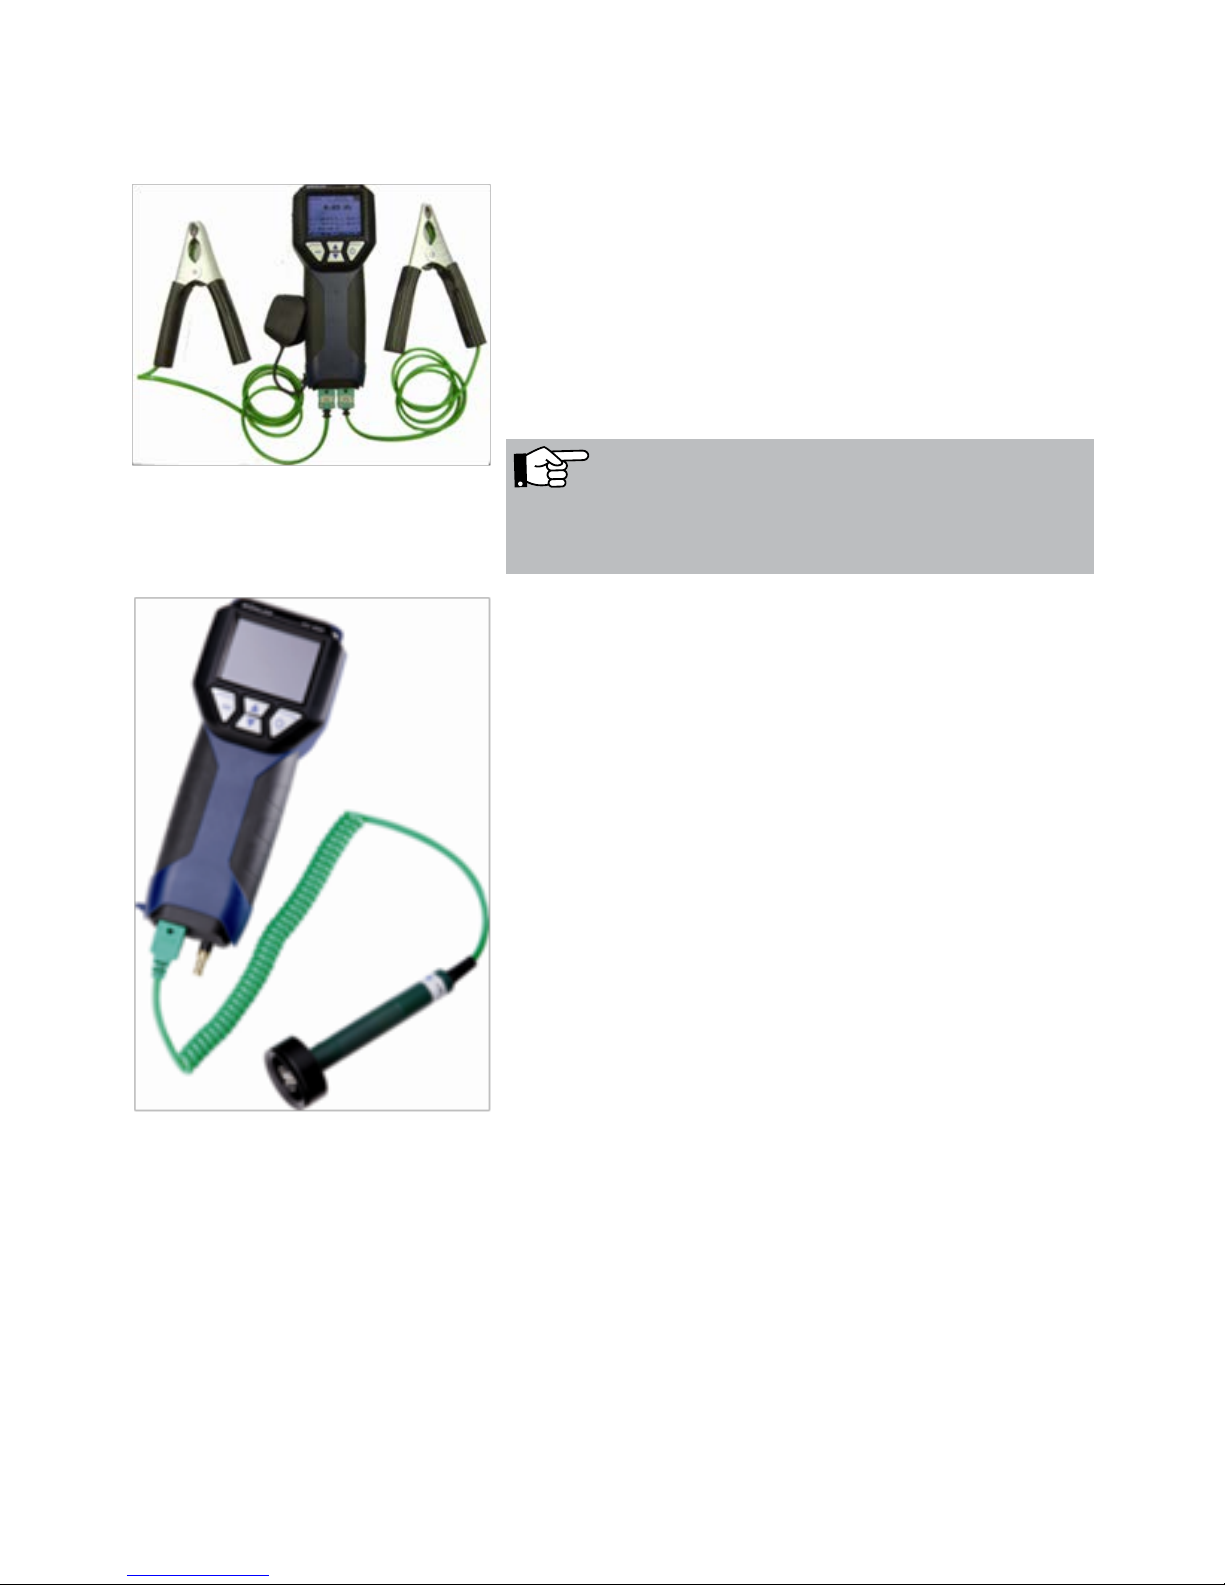
Two temperature measuring pliers can be connected at the
same time.
• Insert the plug of the temperature measuring pliers into the
jacks 11 and 12 (Fig. 1) of the PC 410.
The temperature value measured by the meter connected
to jack 11 will be indicated in the display as T1 and the one
measured by the meter connected to jack 12 will be shown
as T2.
Fig. 4: Connecting temperature measuring
pliers
Connection of the Special Wall Temperature Probe to
measure the heat transmission coefficient (See chapter 6.9)
Two Special Wall Temperature Probes can be connected at
the same time.
• Insert the plug of the temperature measuring pliers into the
jacks 11 and 12 (Fig. 1) of the PC 410.
Fig. 5: Connection of the Special Wall Temperature
Probe for measuring the heat transmission coefficient.
NOTE!
Any thermocouple type K may be connected to the jacks 11
and 12.
Page 12
12
3.3 Function
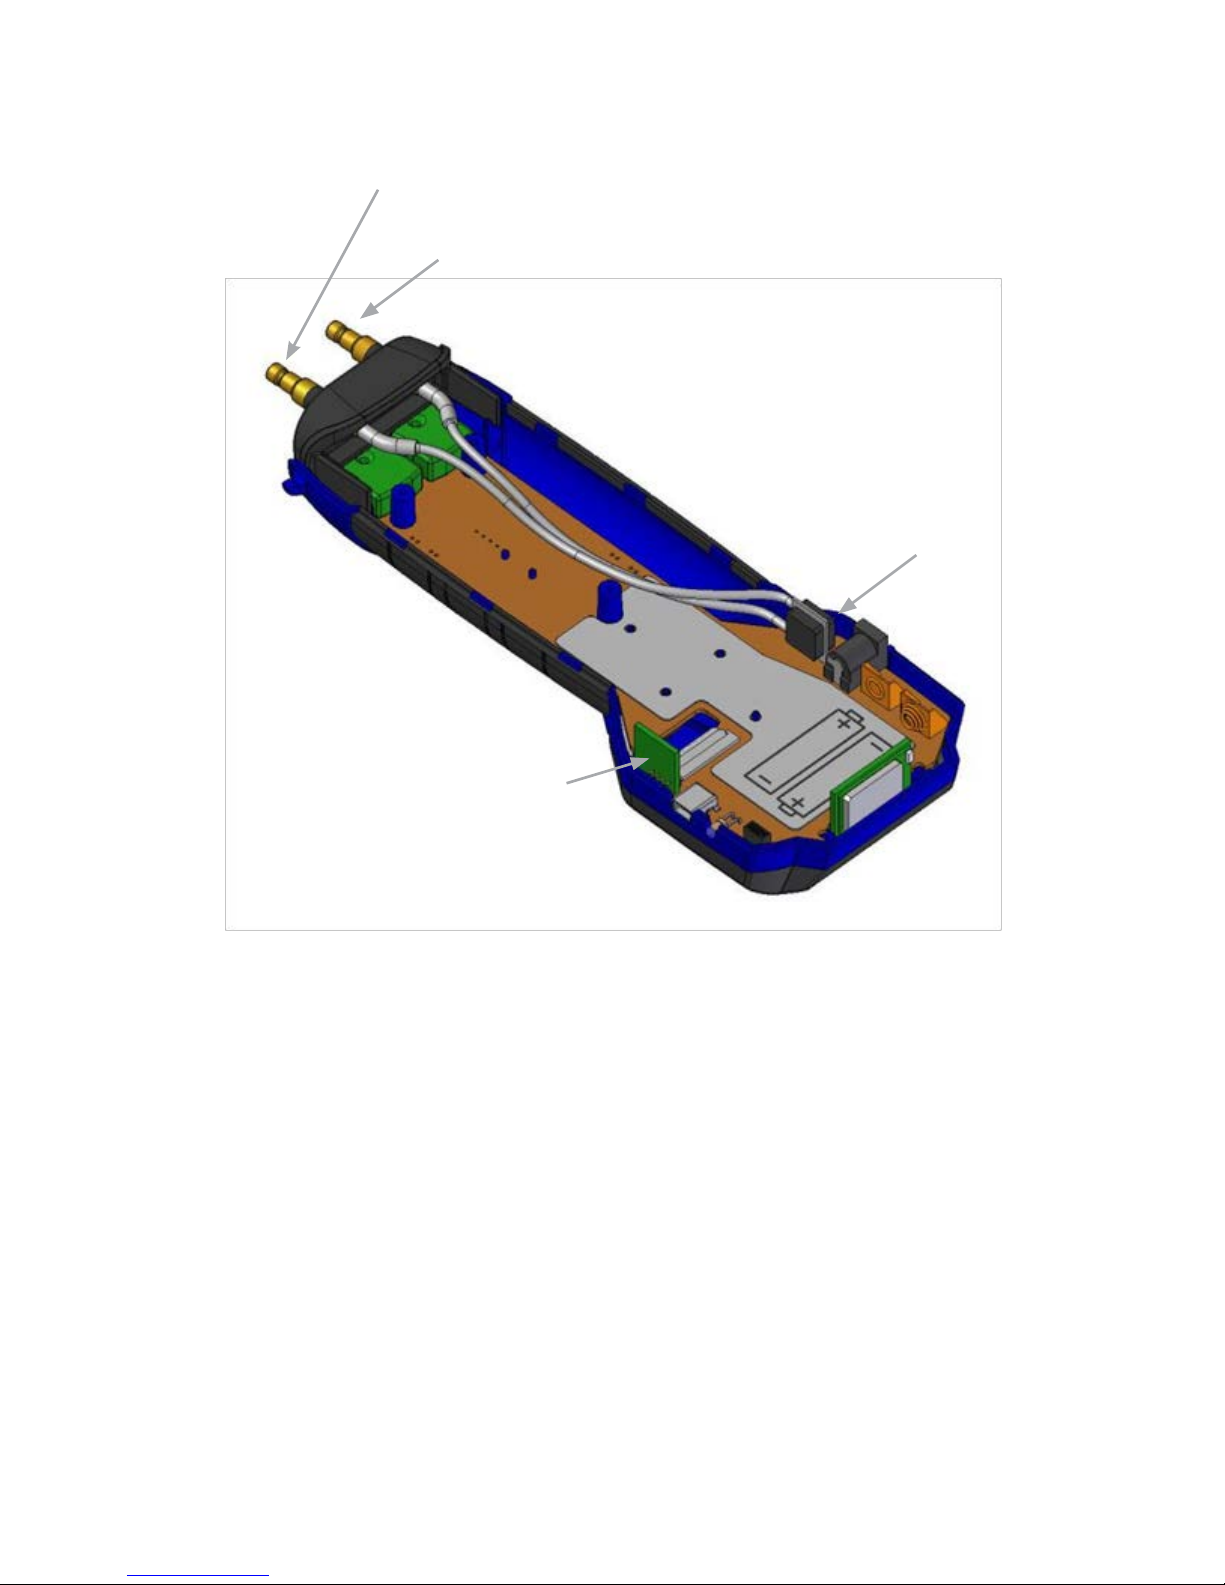
Fig. 6: Interior structure of the meter
Pressure sensor
Pressure socket (+)
Pressure socket (-)
Ambient
pressure and
humidity sensor
Page 13
13
3.4 Operating Mode
The Flow and Pressure Meter PC 410 is a high precision multimeter for the measurement of differential pressure, volume
flow and temperature as well as the registration of humidity
and ambient pressure. (These two functions are only available
in the version AF). Because of its extremely high precision,
the meter measures even very small pressures. Therefore, it is
ideal to determinate air speed, gas pressure, volume, tension
and also the flue gas temperature. A maximum measuring
range up to 100 hPa and a burst pressure of 0.75 bar provide
a sufficient degree of security even for high pressure ranges.
3.5 Display and key setup
1. The PC 410 has a color 2.4' display.
2. The OLED-technology allows reading the display from
almost any angle of view.
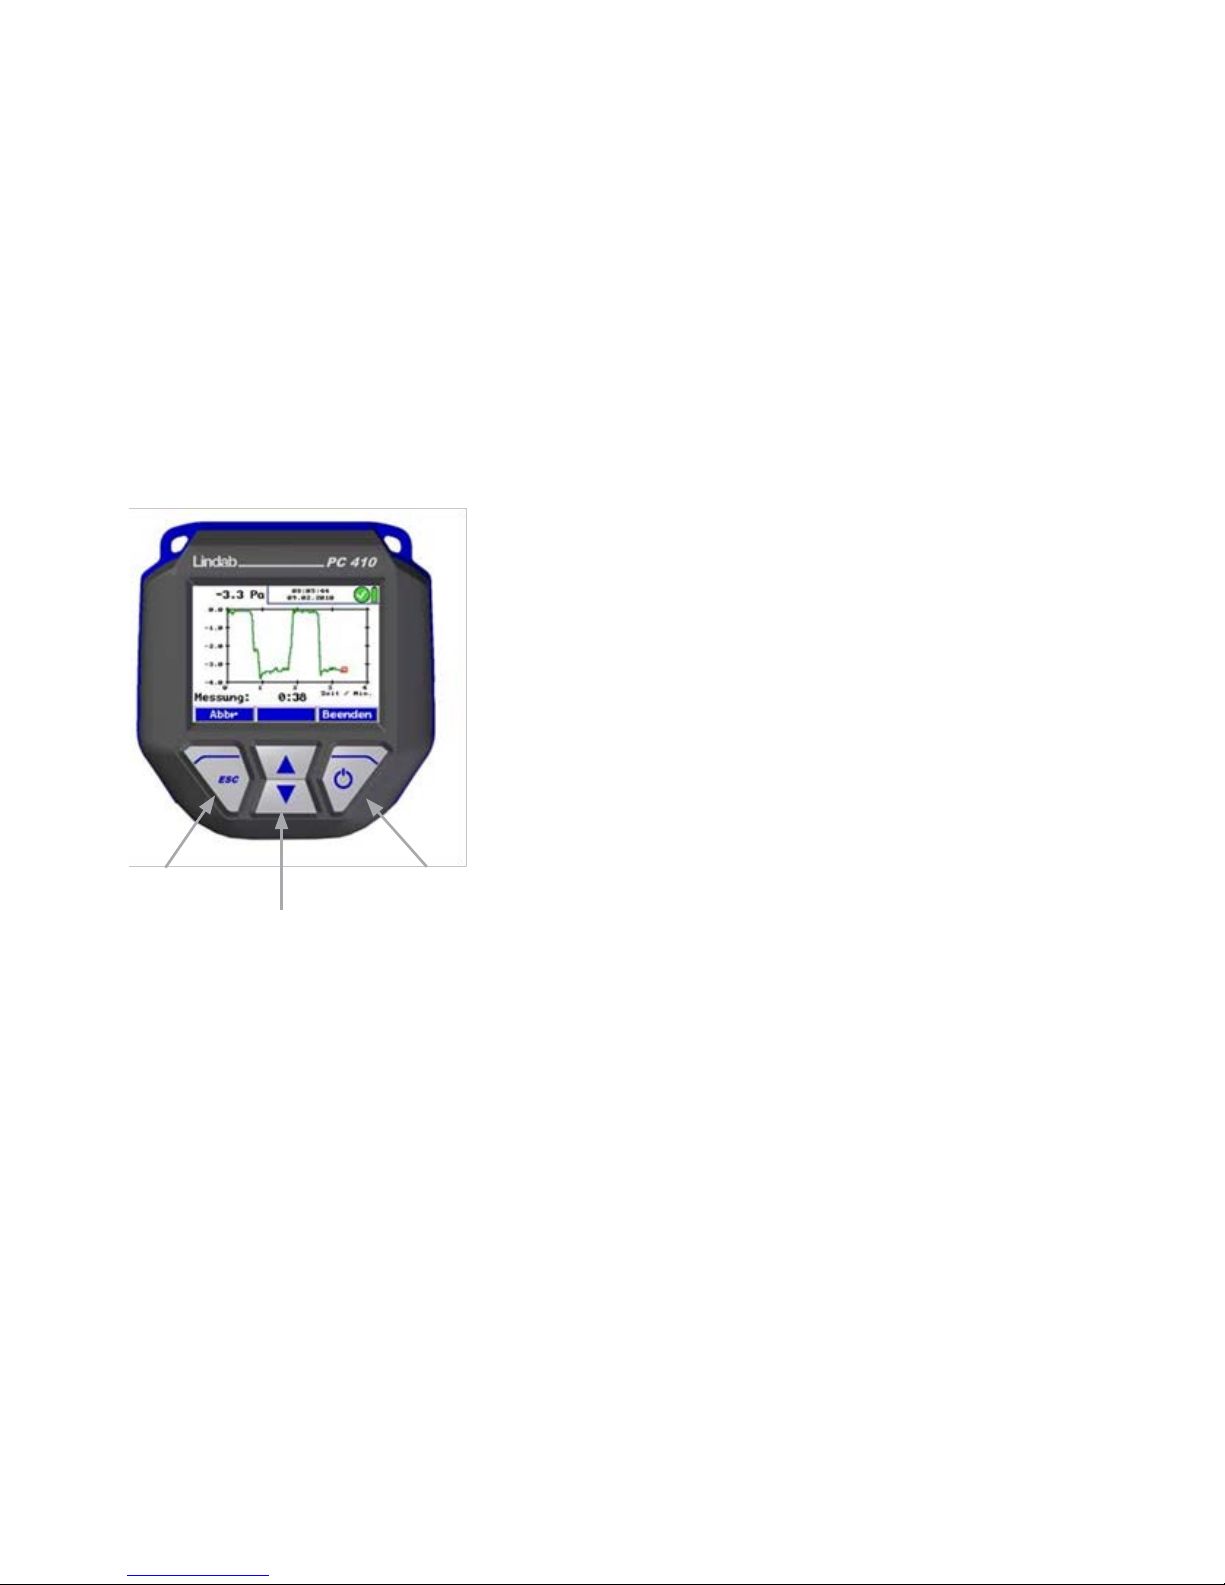
3. Four keys are available below the display to operate the
PC 410.
Fig. 7: Display and keys
Escape On/Off
Scroll/Zoom
Page 14
14
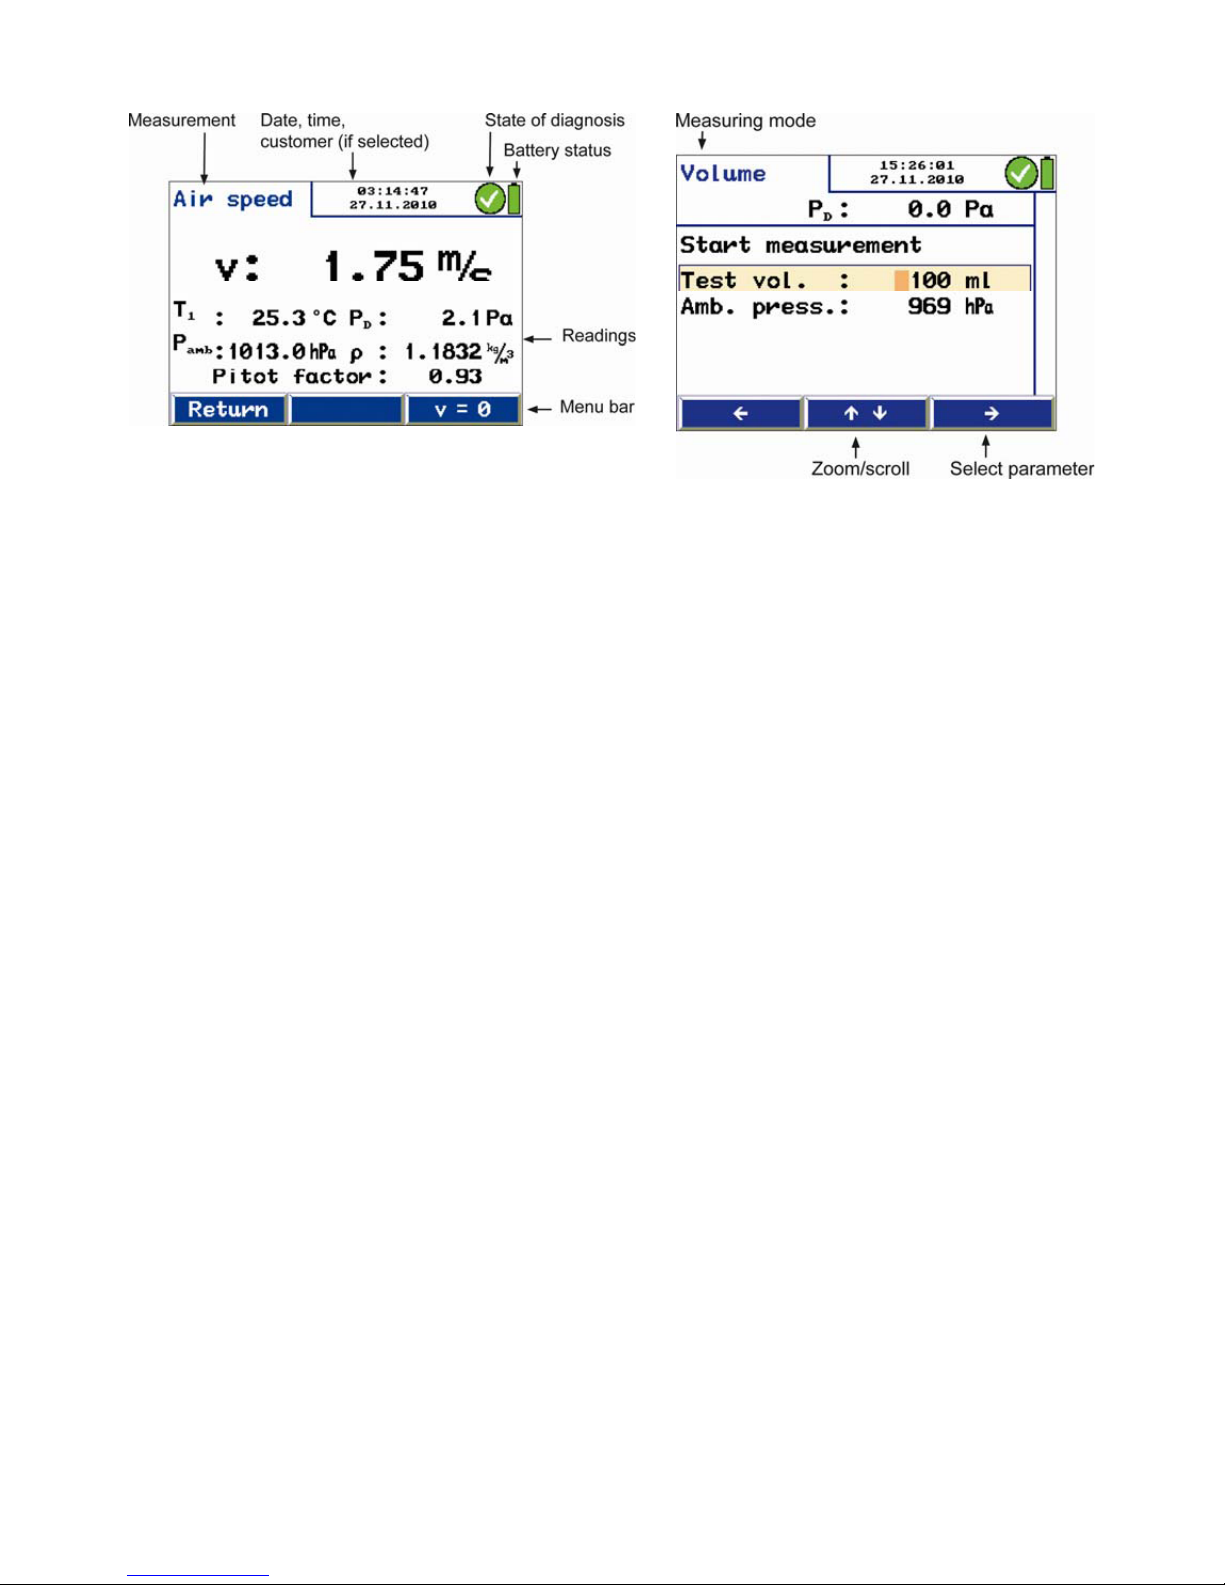
Fig. 8: Display details
The display is divided into a status, a menu and a readings
segment.
The currently selected task is shown in the left status segment.
– Date and time, customer (if selected), system diagnosis
status and battery level are shown in the status segment on
the right.
The readings segment displays the readings or the menu
items.
The menu segment is situated at the bottom of the display. It
consists of three soft keys.
Version AF (with internal ambient pressure and humidity
sensor): The values are indicated in the "pressure measurement" menu.
Page 15
15
4. Getting started
4.1 Check battery status
When the device is switched on, the battery indication is
displayed in the upper right hand corner of the screen. A fully
charged set of batteries is shown as a solid green battery
symbol. An empty red symbol indicates discharged or empty
batteries. If the batteries are almost empty the back light will
dim out. The warning "charge batteries" will appear. In this
case, finish the measuring process as soon as possible.
NOTE!
You can still go on measuring while battery charging is in
progress.
WARNING!
Incorrect use of batteries can cause injury!
Never dispose the battery to fire or high temperatures.
Danger of explosion!
Liquids can leak out of the batteries due to mistreatment.
Never touch the liquid. If you get in contact to the liquid
remove it with water. If the liquid got into your eyes, remove
it with water and see your doctor as soon as possible.
WARNING!
Risk of electrical shock!
Never touch the power supply with wet hands!
Protect the power supply against water and moisture!
Do not unplug the recharger by pulling the cable!
Do not use the power supply when the voltage requirements
of the recharger and the supply do not match!
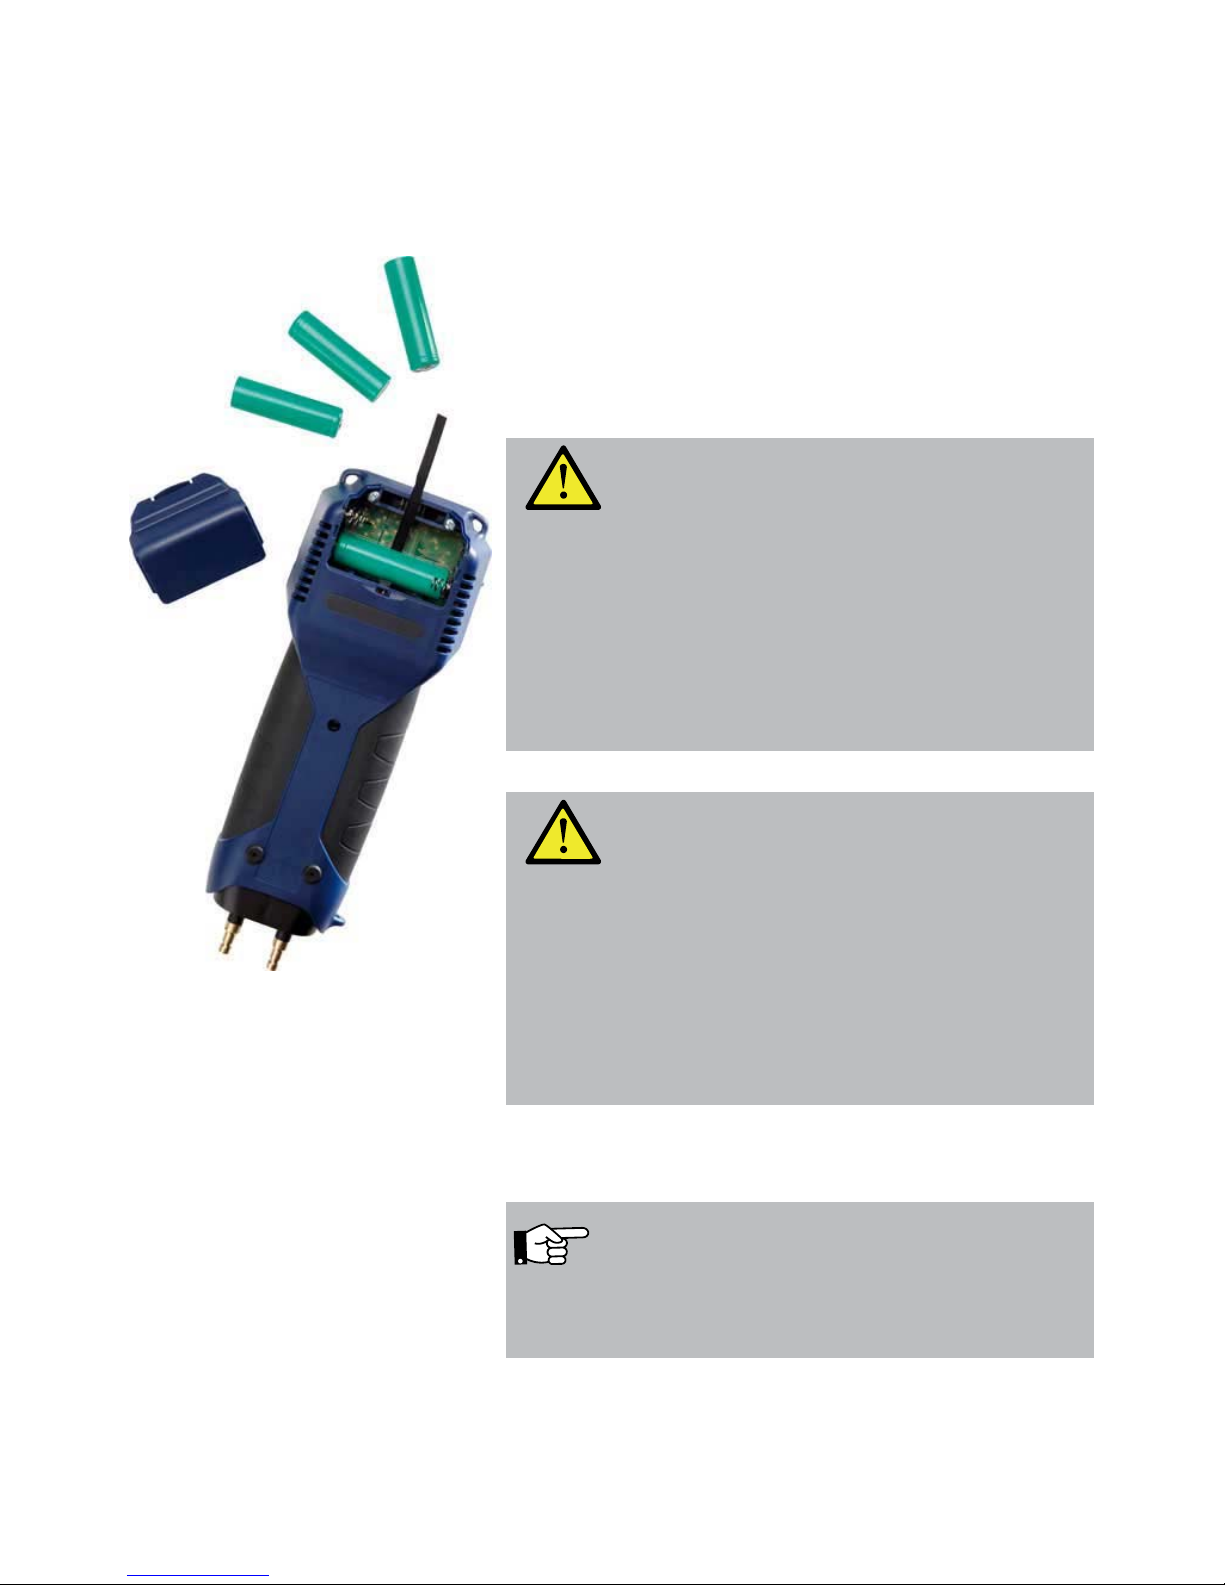
The batteries can be recharged even while they are located in
the analyzer.
Fig. 9: Position of the batteries in the PC
410
Page 16
16
How to charge the batteries:
• Before you plug the recharger into the outlet, connect it
with the charging connection of the PC 410 (Fig. 1, part 3).
Standard AA rechargers can be used for external charging
when the batteries are not located in the analyzer.
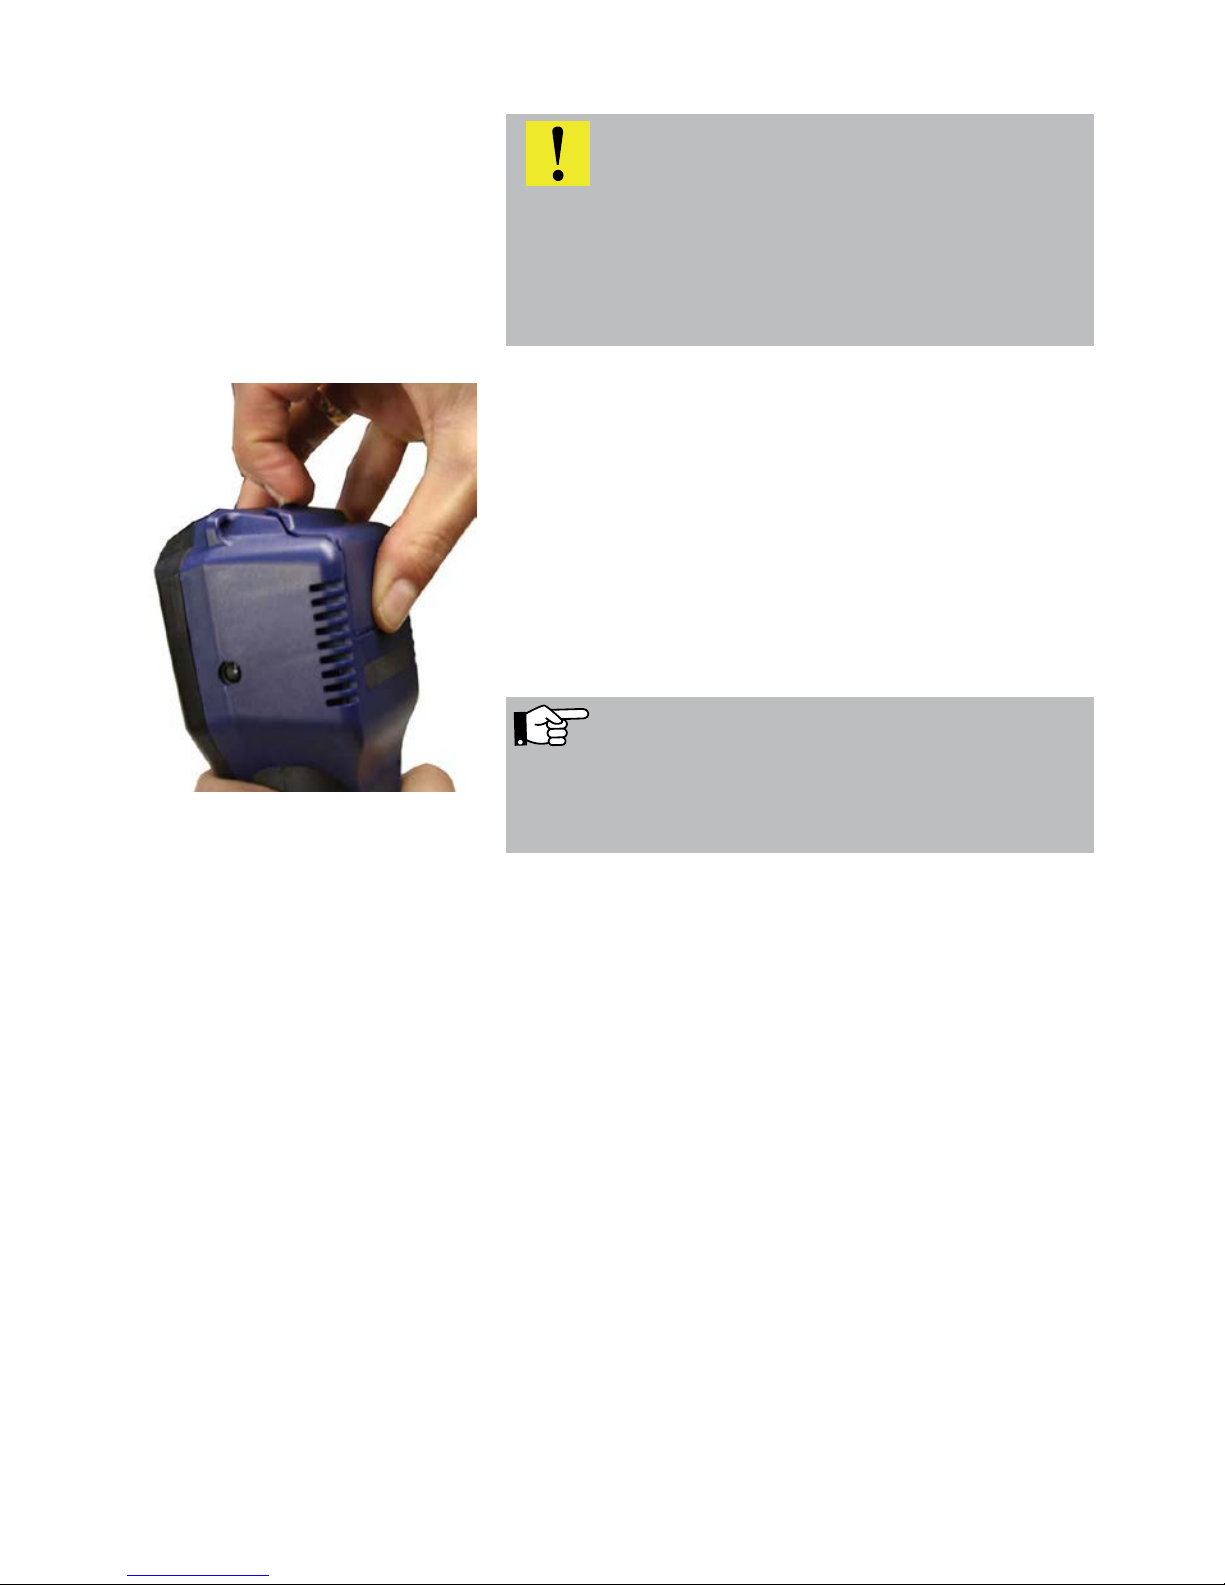
• To remove the batteries from the meter open the battery
compartment cover by pressing the clip and pushing the
battery compartment cover at the same time.
Recharging empty batteries can take up to 3 hours.
ATTENTION!
– Ensure rechargeable batteries are equipped in the meter
before charging. Never try to charge disposable batteries.
Use 4 AA rechargeable batteries only.
– Only use the charger delivered with the device.
NOTE!
To ensure maximum capacity use batteries of same age and
condition only. Always replace a full set of batteries when
necessary.
Fig. 10: Open the battery compartment.
Page 17
17
5.2 Measuring After that the meter will automatically switch to the Air flow
measuring mode.
1. Al readings (measured and computed values) will be
shown continuously in the readings segment.
The following functions can be selected from the menu
segment
• Submenu „PD=0“: The pressure sensor will be zeroed once
again.
• Change the k-value
• Stop-key to stop the measurement
5. Operation
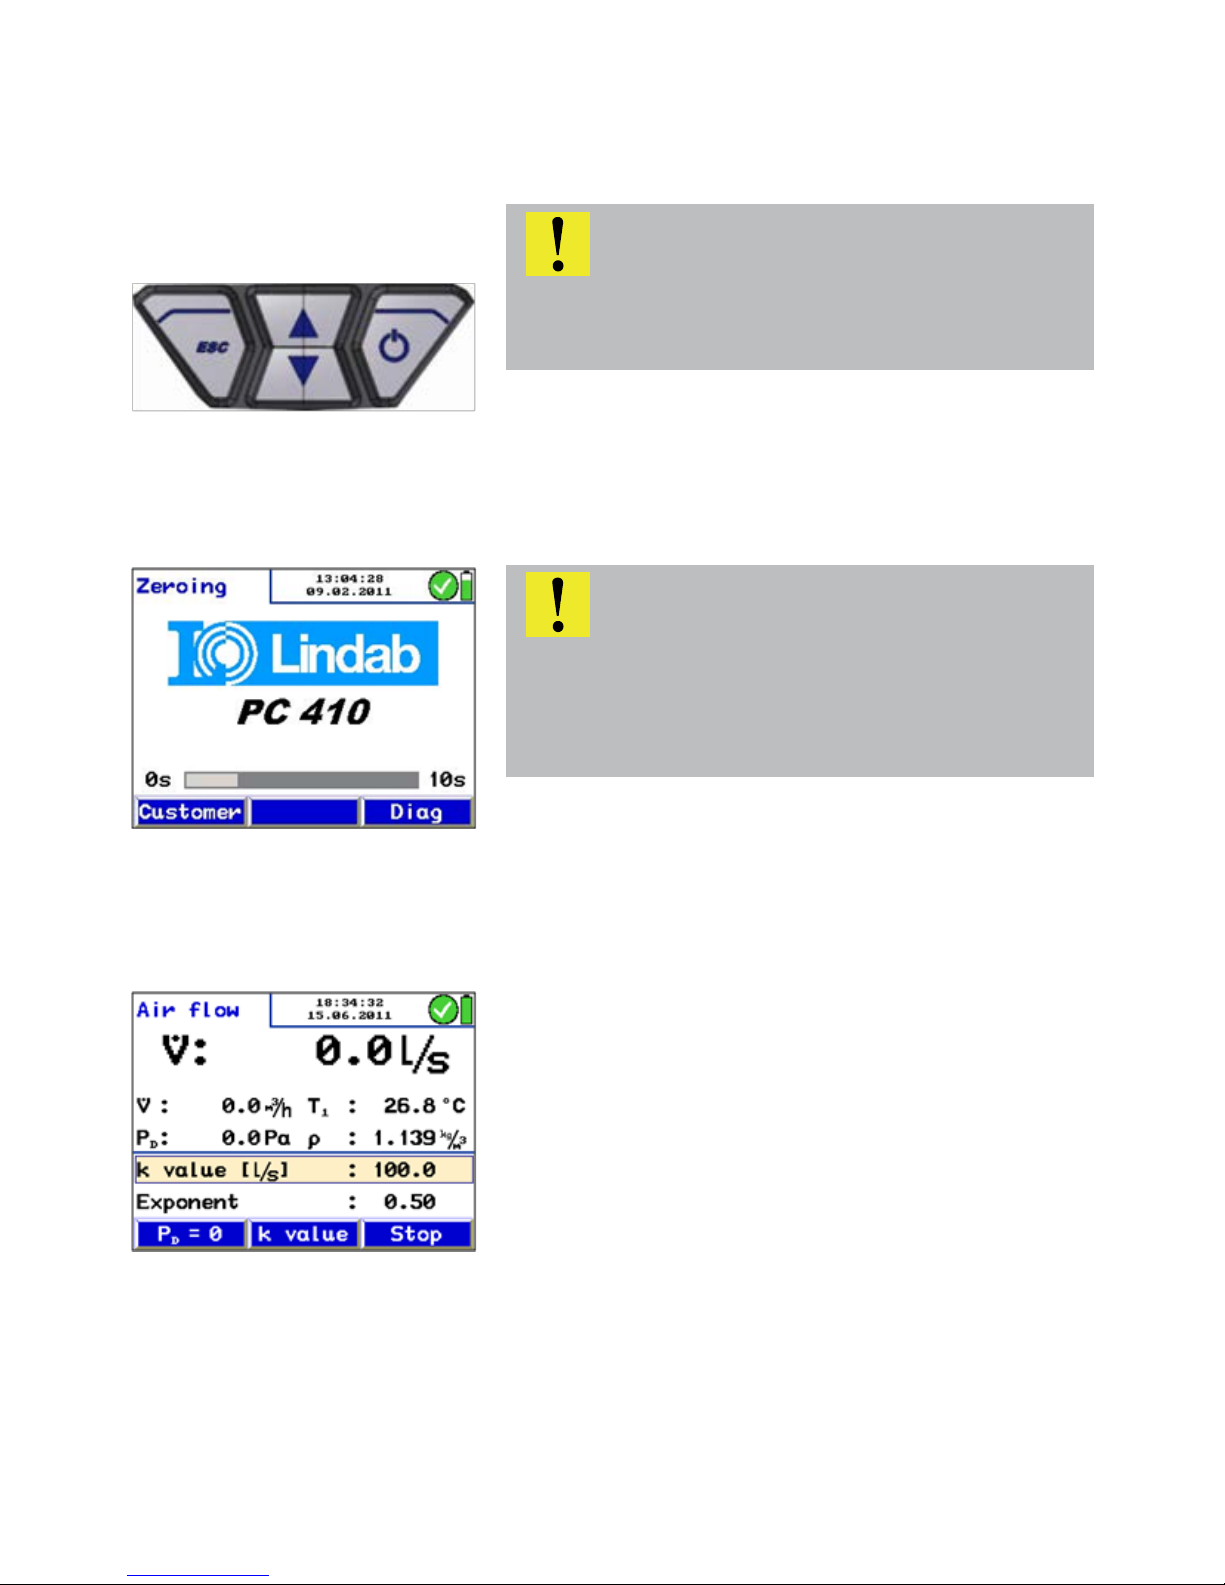
5.1 Turning the Meter on and Self
Check
• Turning on the Meter Press on/off-key (on the right)
The Meter will automatically start with a 10 second self test
and zeroing.
ATTENTION!
Before the Meter is used, a visual check must ensure each
and every time that all functions work properly.
ATTENTION!
Do not connect any hose while the Meter is performing the
self check and do not expose it to any differential pressure,
because the pressure sensor will automatically be zeroed
during the self test.
Fig. 11: Key pad with on/off-key
Fig. 12: Zeroing
Fig. 13: Measuring mode
Page 18
18
5.3 Using the Pressure computer
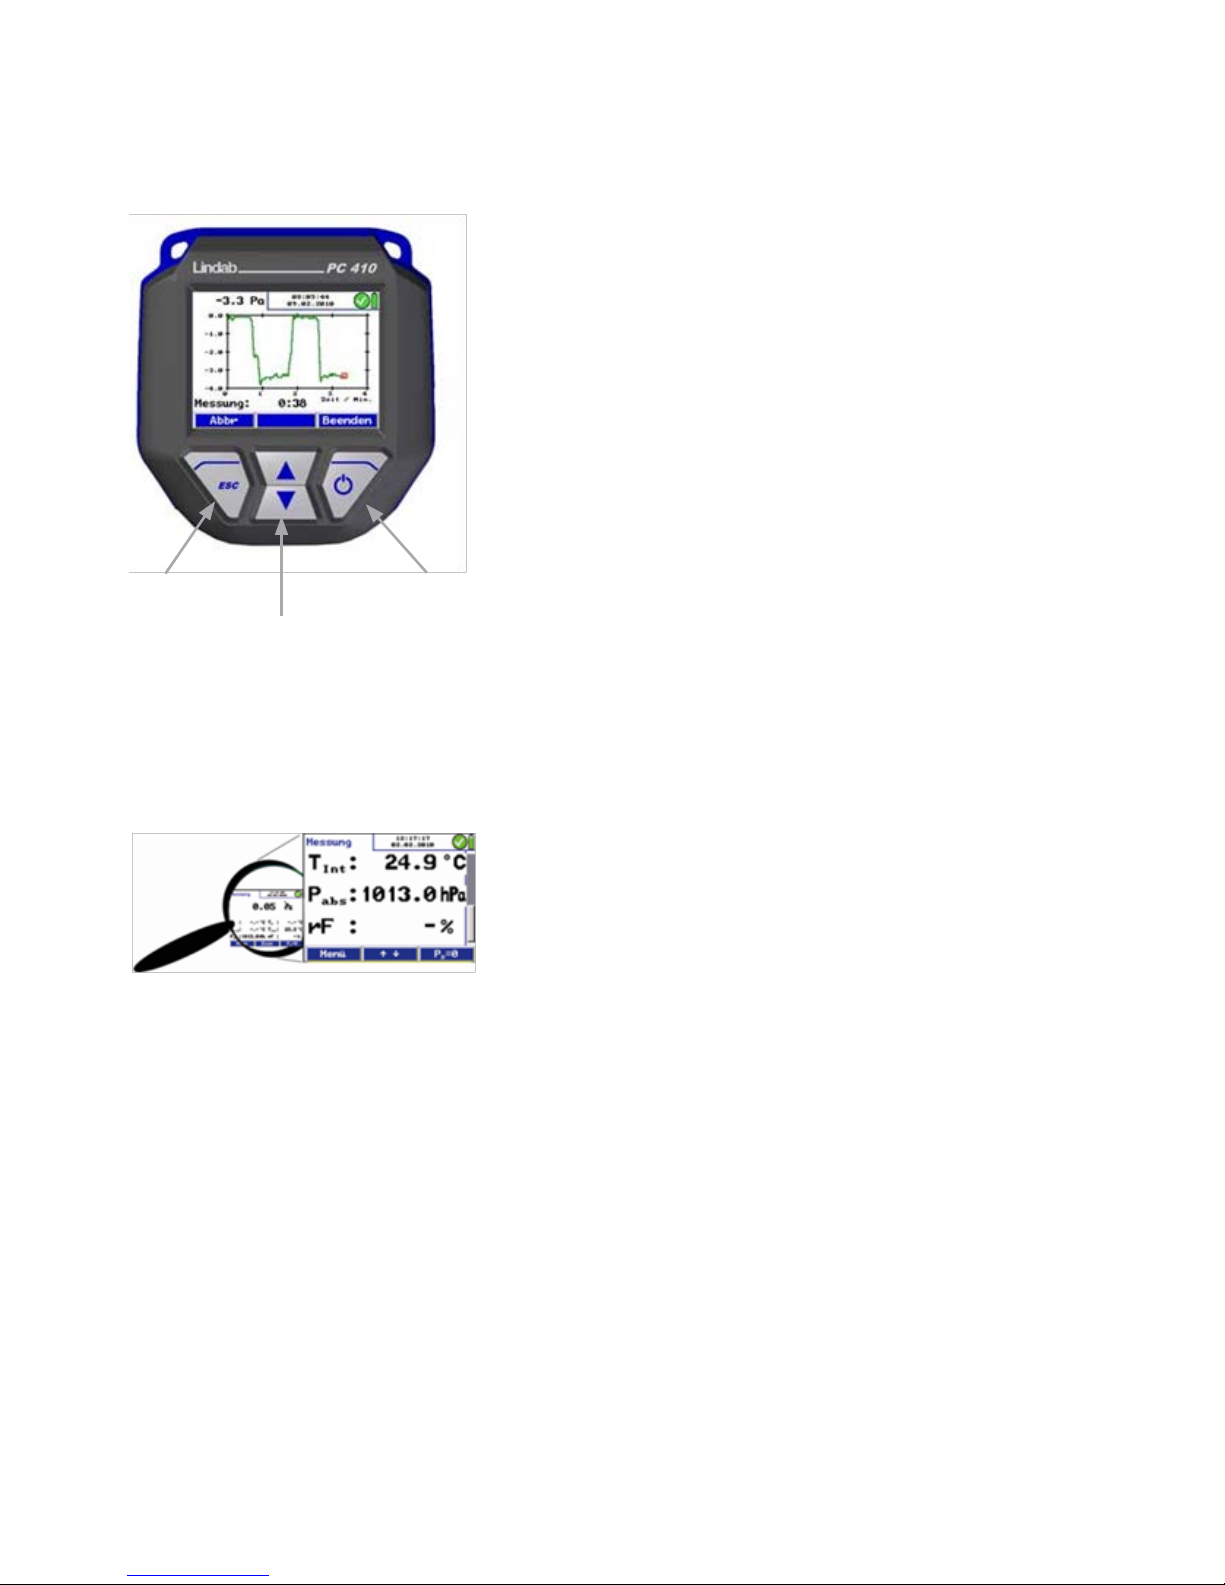
• Holding the left button depressed (ESCAPE) will always
stop the current menu and call up the main menu.
• In the pressure measuring mode, press the up or down key
to enter the zoom-mode. When the readings are zoomed in,
they can be read even from a distance. In the zoom mode
three values are shown in the display. Press the up or down
key shortly to scroll the readings.
• Hold the up or down key depressed to zoom in or out.
Fig. 15: Zoom feature
Fig. 14: Display and keys
Escape On/Off
Scroll/Zoom
Page 19
19
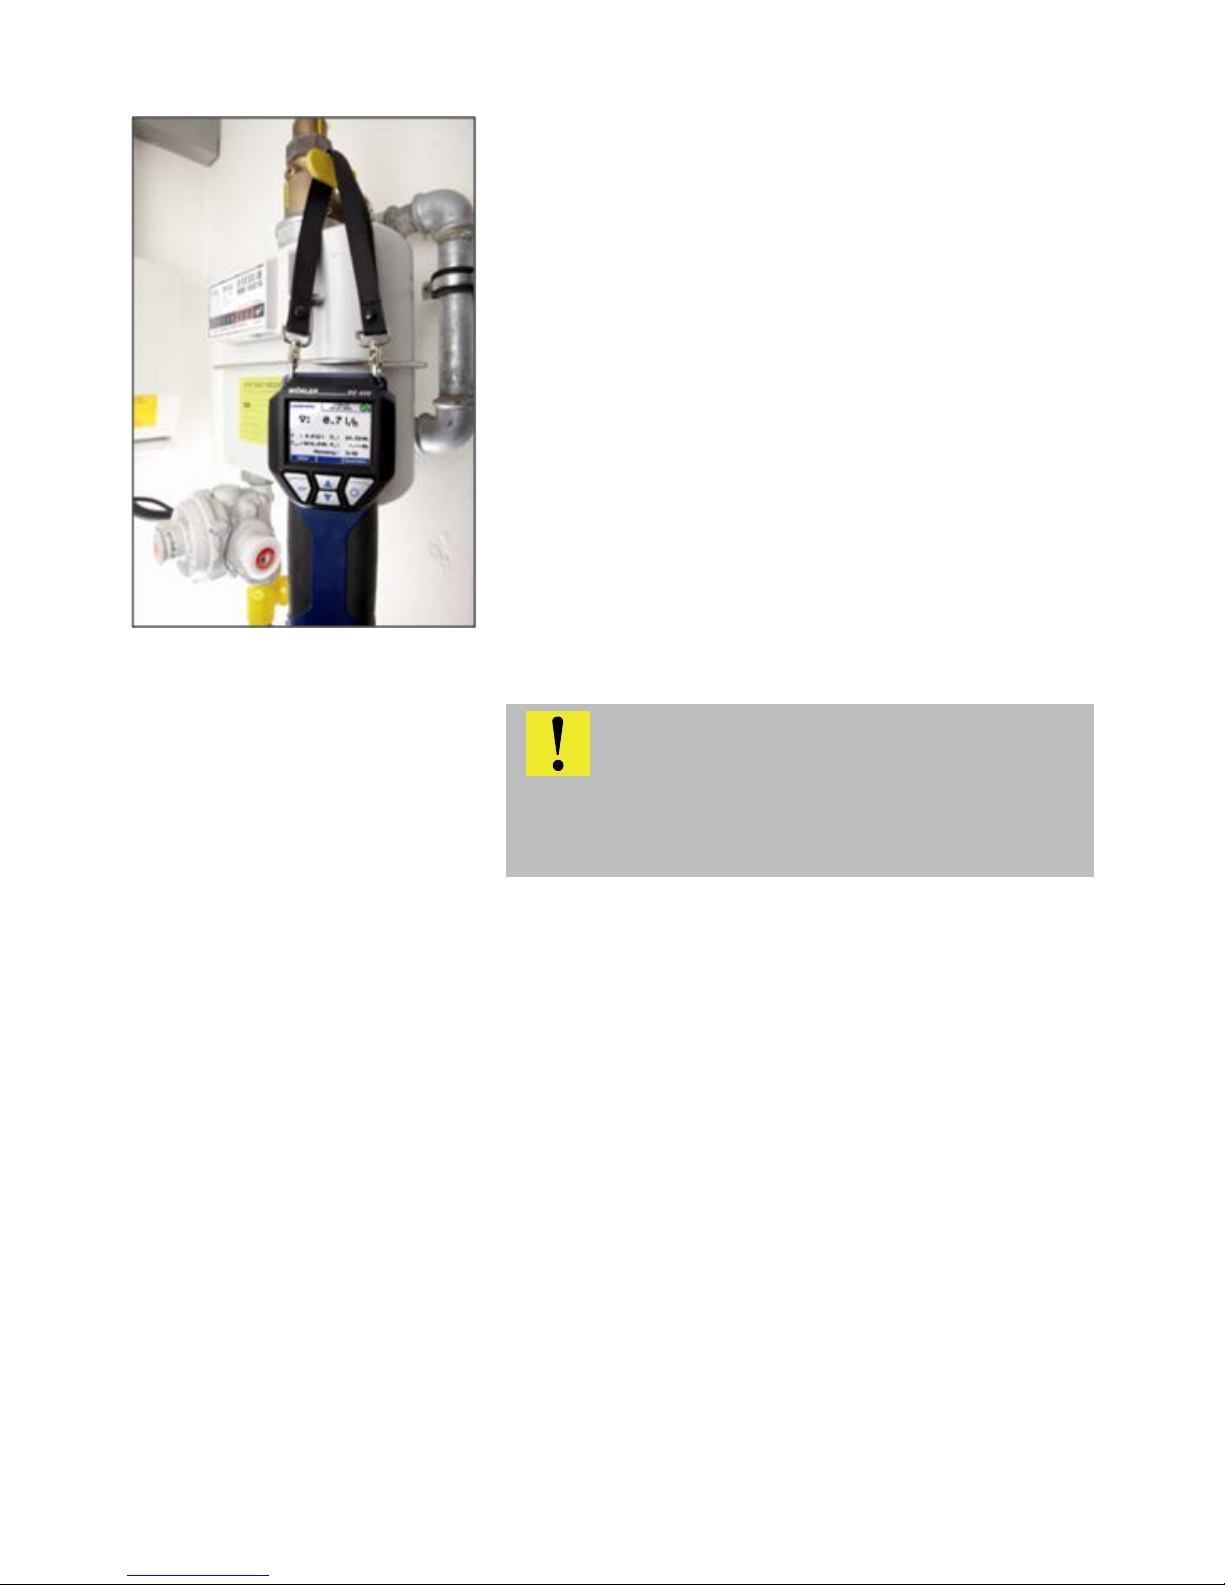
Fig. 16: PC 410 with supporting loop
• The PC 410 is equipped with integrated magnetic holders
on the rear side.
The magnetic holders will fix the analyzer on any magnetic
material surface.
• It is also possible to fix the PC 410 with the hand strap
during the measurement.
While measuring either
• hold the Pressure Computer in one hand
or
• place it with the magnetic holder to any appropriate surface
or
• fix it with the hand strap.
ATTENTION!
Do NOT place the Pressure Computer unsecured, it can fall
down and get damaged.
Page 20
20
6. Measurement modes in the main menu
6.1 Selecting the main menu
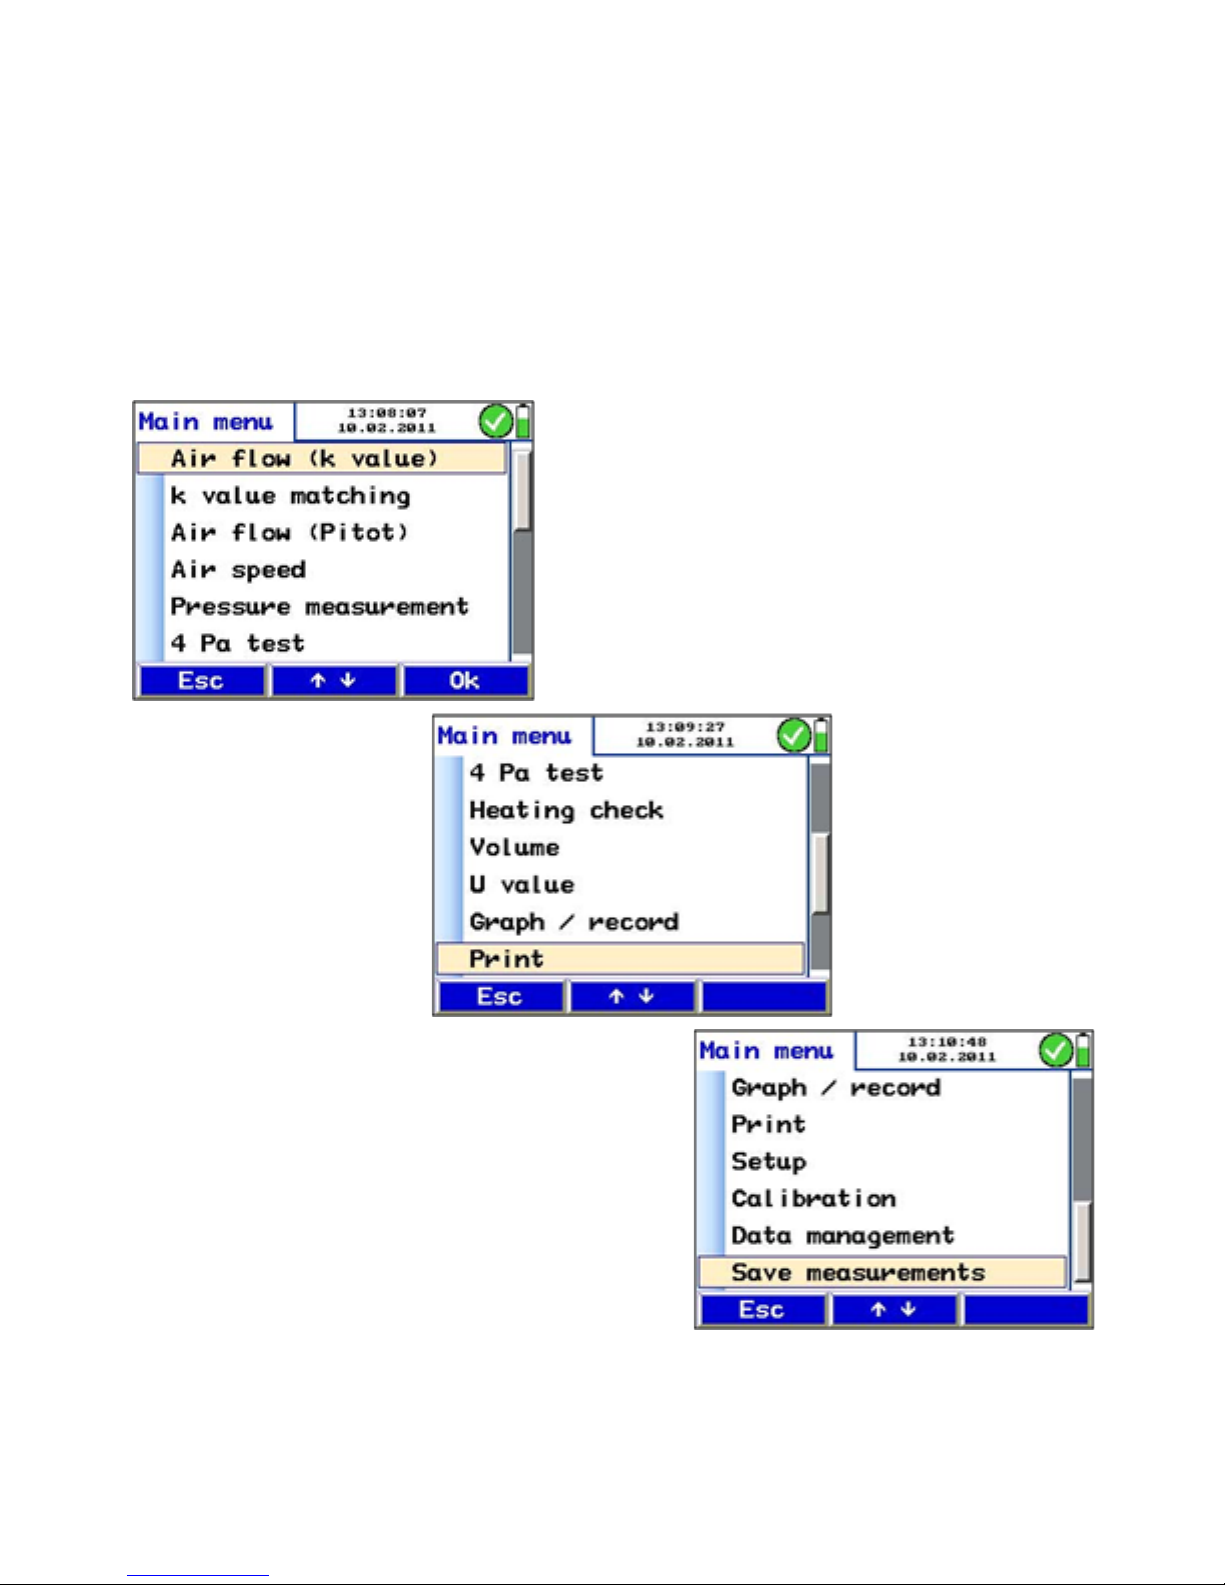
• Top the current measurement.
• Press "menu" to activate the main menu. In the main menu,
all submenus and applications can be activated. The following submenus can be selected:
Fig. 17: Main menu
Page 21
21
6.2 Option “Air flow (k value)” Select the submenu "Air flow (k-value)" to measure the air
flow at apertures or similar measuring openings of air pipes
or vents. This method is simple and precise and therefore
suitable for the adjustment of air pipe systems and vents.
6.2.1 Theoretical background In this menu, the air flow measurement is based on the k
value. The k value is a factor which describes the relation
between the decrease in pressure and the air flow.
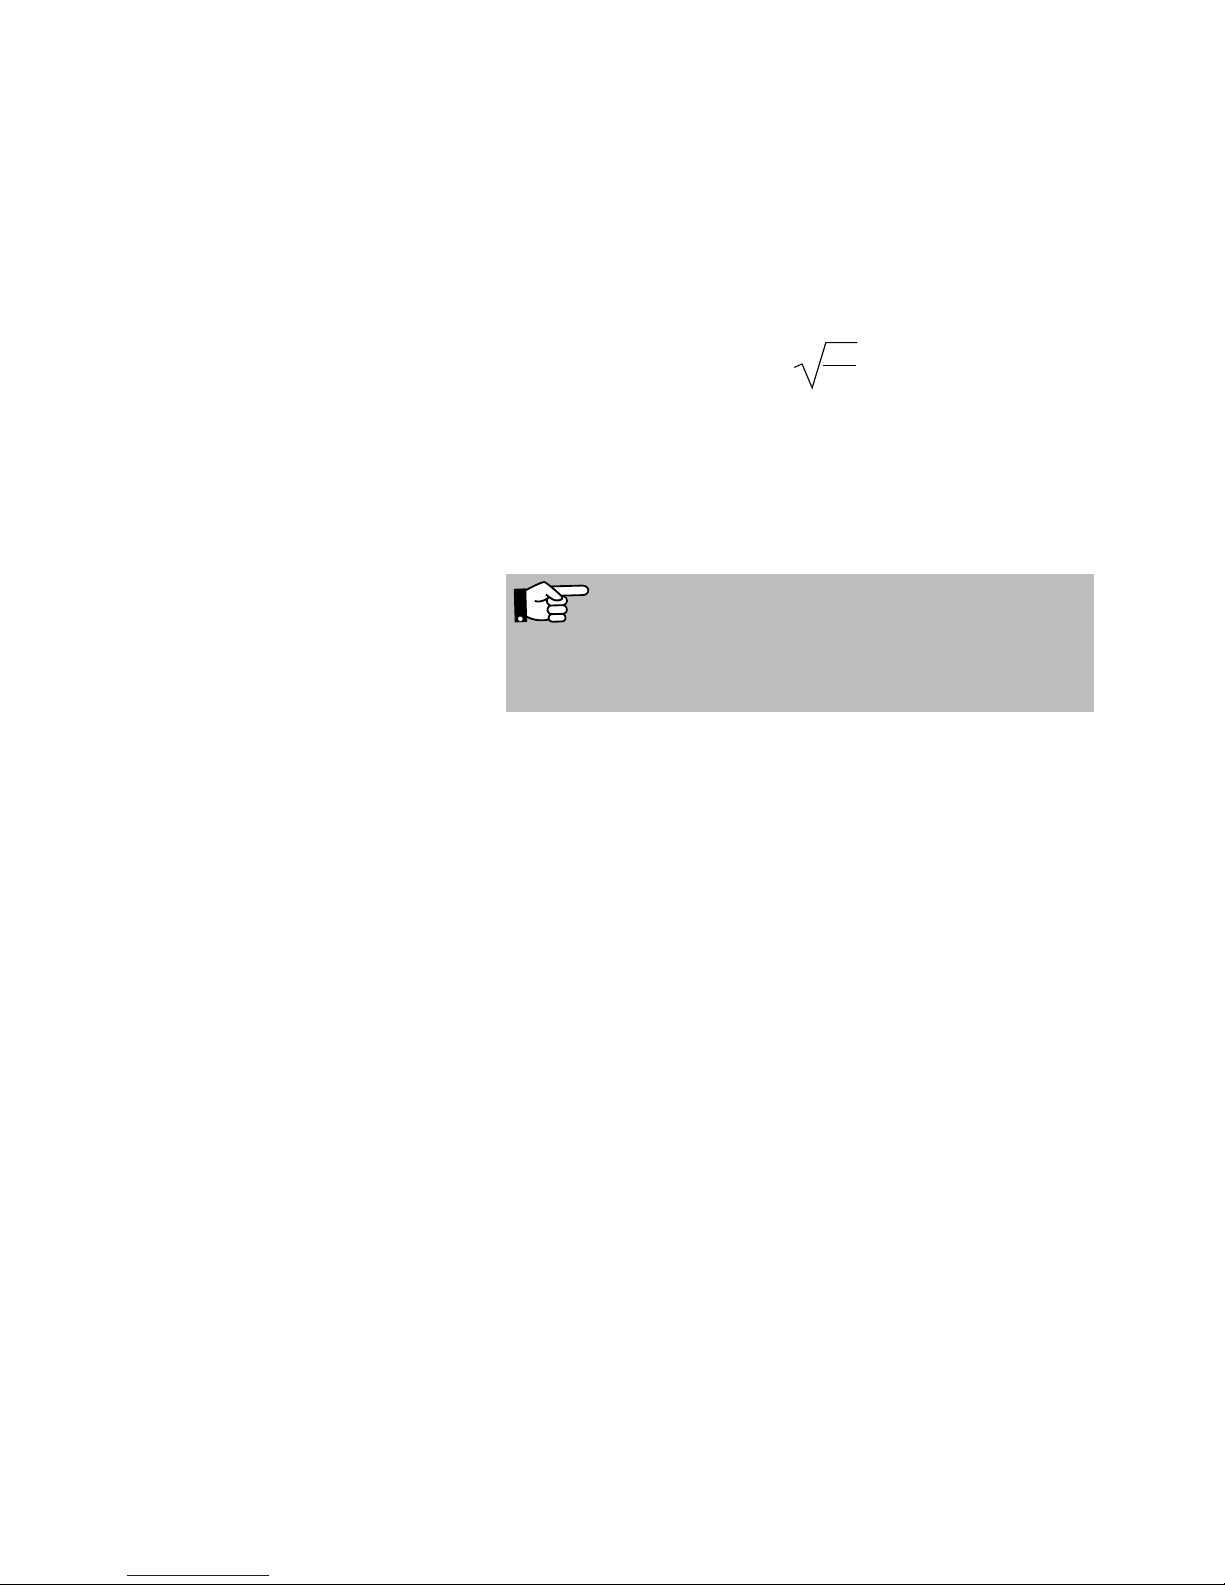
The air flow of measuring equipments mentioned in chapter
6.2 is proportional to the term
r
Dr
.
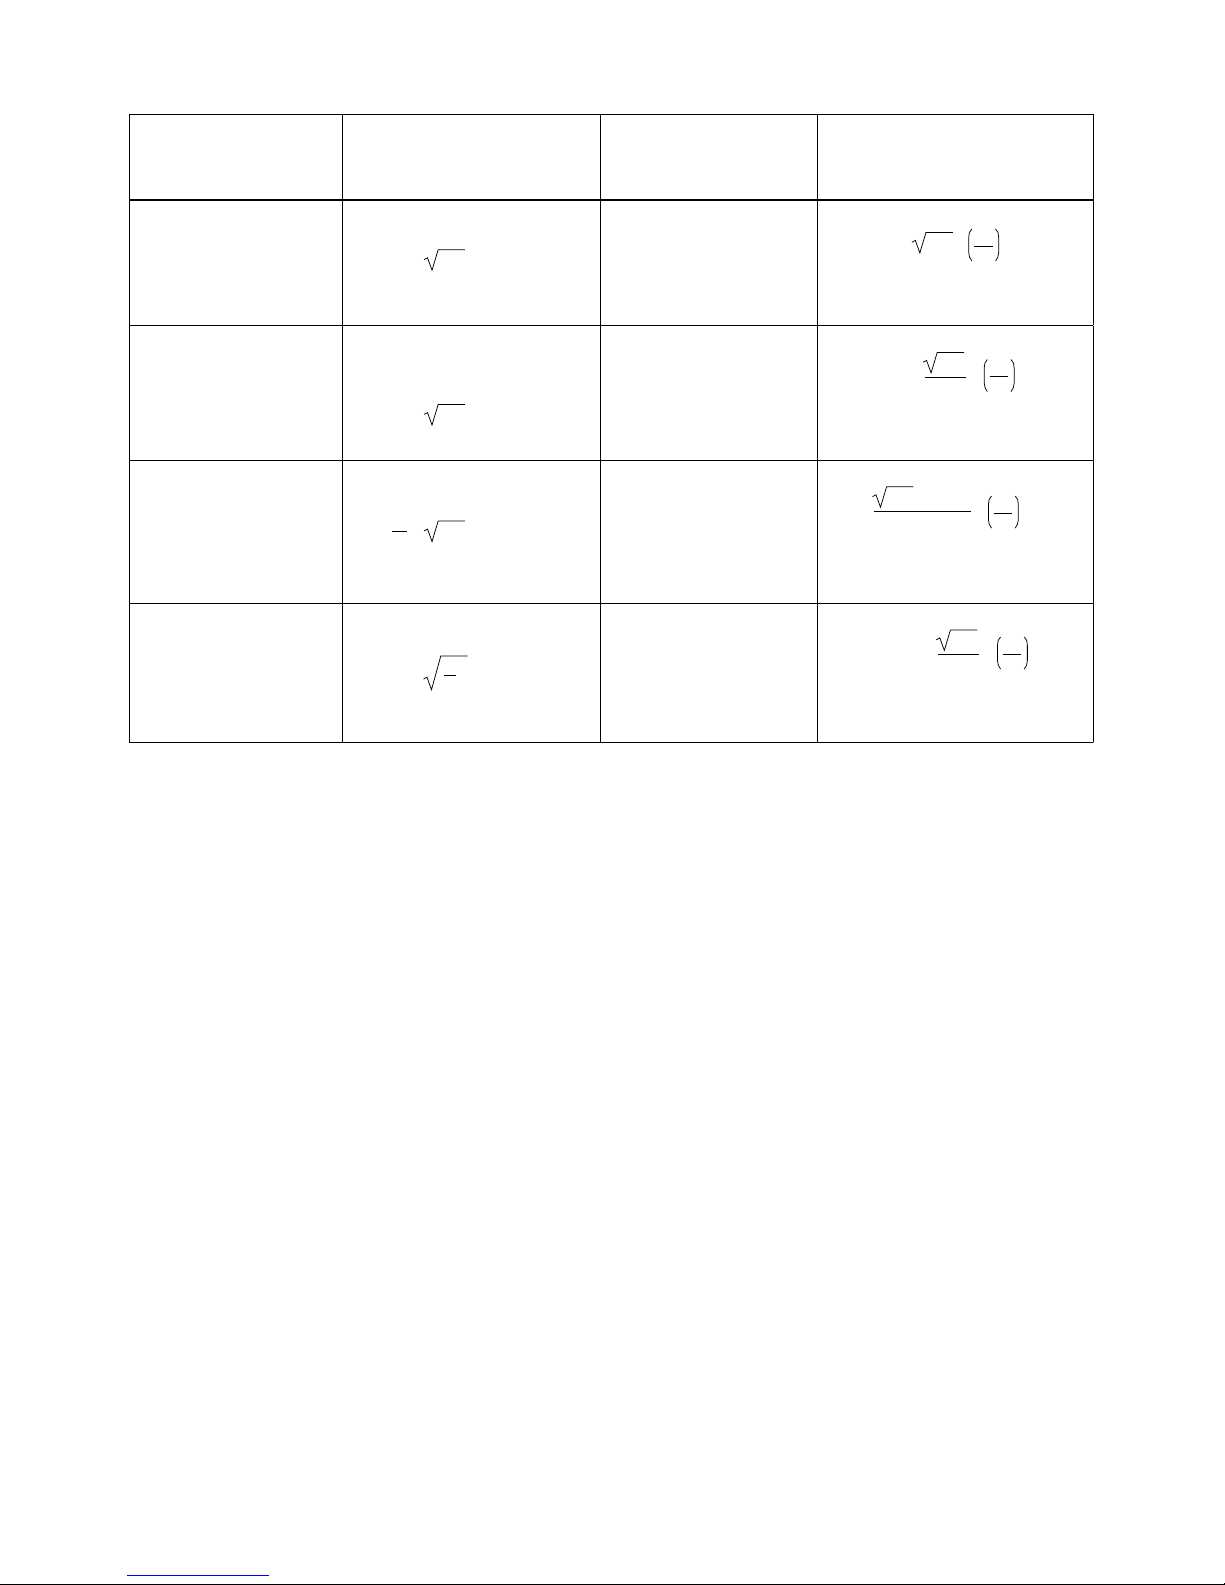
The different manufacturers indicate the proportionality factor
in a different way (see table 1). In the PC 410 the measurement type is indicated with the corresponding short description (see table 1). The user can choose the unit of the volume
flow in the setup-menu (l/s, m³/h, m³/s, cfm). The factory
setting is l/s and m3/h respectively.
NOTE!
If you select a certain measurement type in the setup-menu,
the displayed unit will not change automatically.
The PC 410 will always calculate with the unit l/s, even when
another unit is displayed. Table 1 shows the formula used for
the calculation.
For all calculations, the PC 410 will consider the standard
air density r, if no external temperature probe is connected.
When a temperature probe is connected, the air density will
be calculated automatically.
Page 22
22
Measurment type
Short description
Manufacturer specific
formula and unit
Components Formula to determine l/s
considering the density
l/s
∆pq = k · [l/s]
e.g. small fans and
air passages, iris
and calipers
1,2 · V = K
[l/s]
·
K
min
= 0,1 K
max
= 1000
ρ
∆p
E
m³/h
∆pq = k · [m³/h]
e.g. fans and air
passages
1,2
·
3,6
V = K
[m³/h]
·
K
min
= 1 K
max
= 5000
ρ
∆p
E
1/(m³/s)
∆pq = · [m³/s]
1
k
e.g. Scandinavian
fans
1,2 · 1000
·
V =
K
[1/(m³/s)]
ρ
∆p
E
K
min
= 0,01 K
max
= 100
(m³/s) × 1,3
q = K · [m³/h]
ρ
2
× ∆p
only used by few
German fan producers
1,2
·
3,6
V = K
[m³/h·1,3]
ρ
∆p
E
K
min
= 1 K
max
= 5000
Table 1
Explanation: V = air flow
k = k value (Take the k-value
from the data sheet and enter it
Into the meter).
Δp= measured pressure
r = air density, calculated on the
basis of temperature and the
pressure
Units V l/s
Dp in Pa
p in kg/m³
E 0,50 – 1,00
• In the Setup-Menu, select the formula that corresponds to the manufacturer according to table 1
(Setup>k-Value).
By default, the exponent will be 0.5 as indicated in the formula. Some fan manufacturers inform
explicitly in the data sheet that a special exponent has to be used for the airflow calculation.
• In this case, enter the exponent indicated in the data-sheet, in the setup-menu of the PC 410.
(see chapter 6.12, „exponent“).
Page 23
23
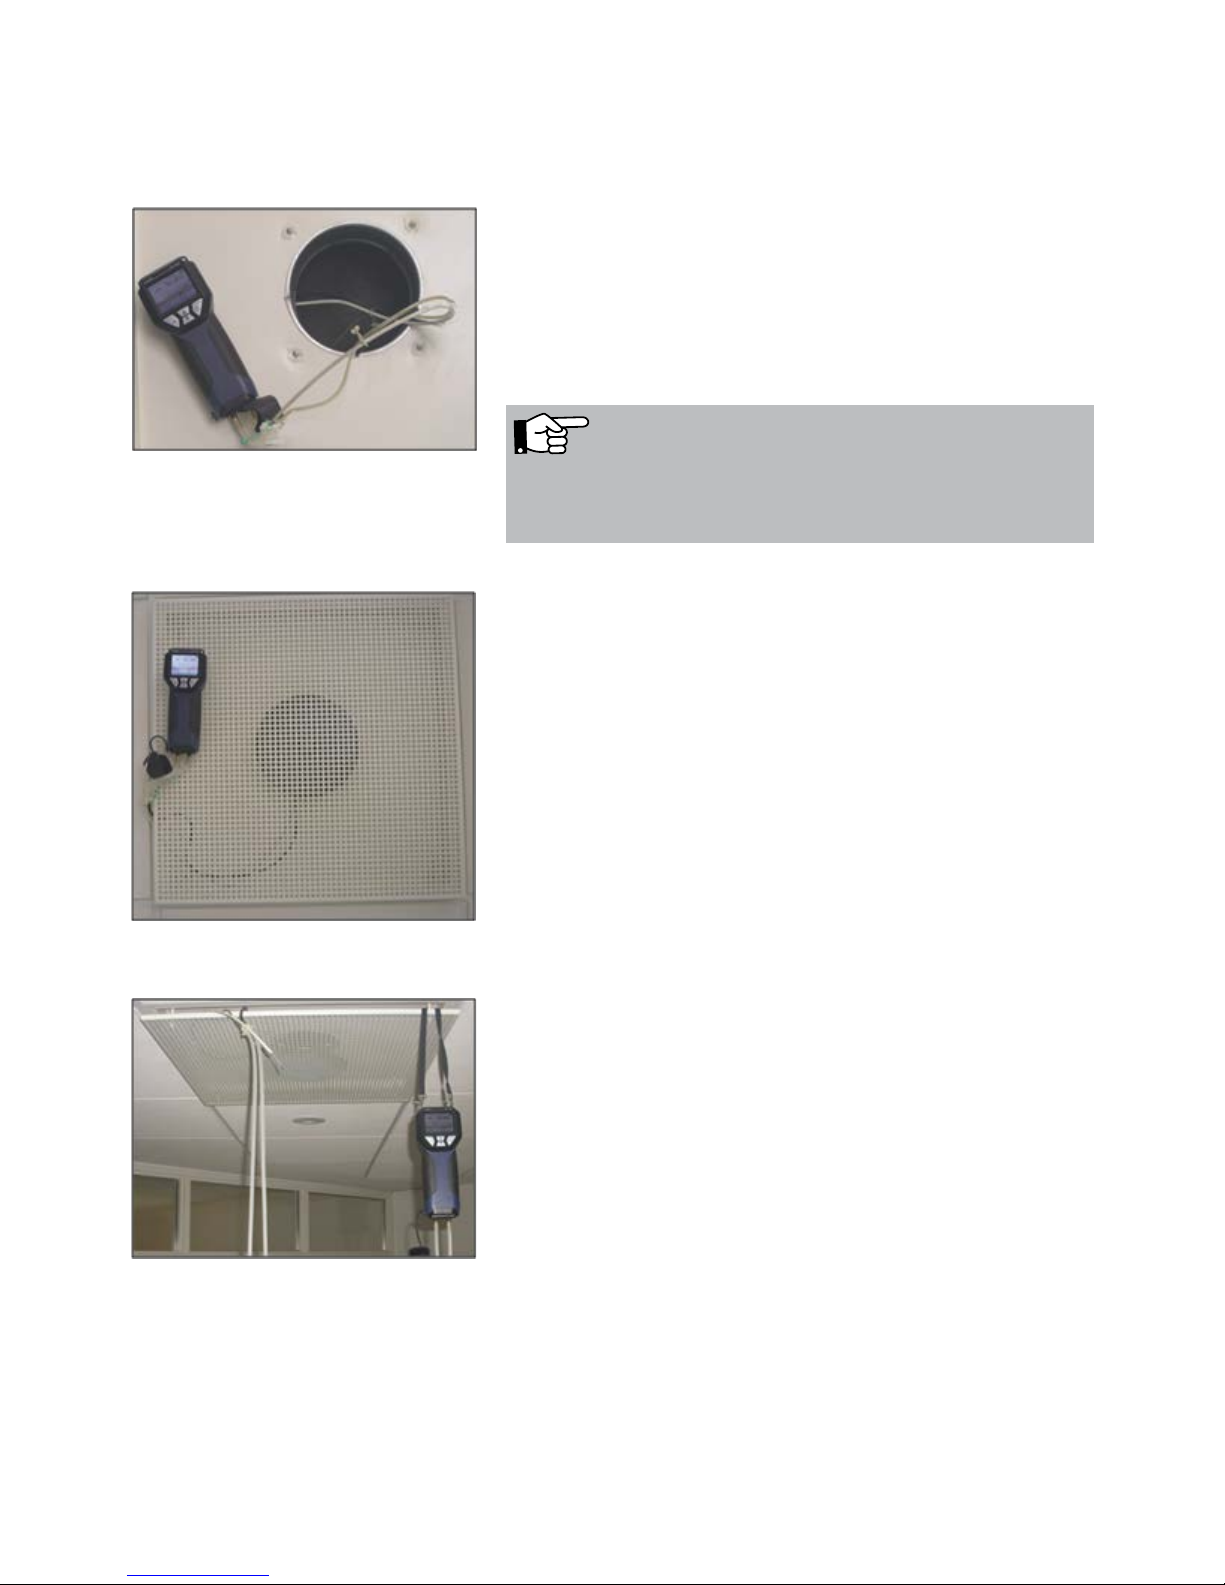
6.2.2 Connecting the meter to the vent
• Connect the Wöhler meter with two measuring hoses to the
vent.
The overpressure socket (+) of the meter has to be connected
to the aperture with the higher pressure and the underpressure socket (-) to the aperture with the lower pressure.
NOTE!
If the hoses are wrongly connected, the reading will be
negative. In this case inverse the hoses.
• During the measurement, the Wöhler meter can be fixed to
the protective grid with a magnet, so that the results can
easily be read from the display.
• When the aperture is under the ceiling, the meter can be
fixed with the hand strap.
Fig. 18: Example - Connection of the
measuring hoses
Fig. 19: Example - Fixing with a magnet
Fig. 20: Example - Fixing with the hand
strap
Page 24
24
6.2.3 Performing the Test
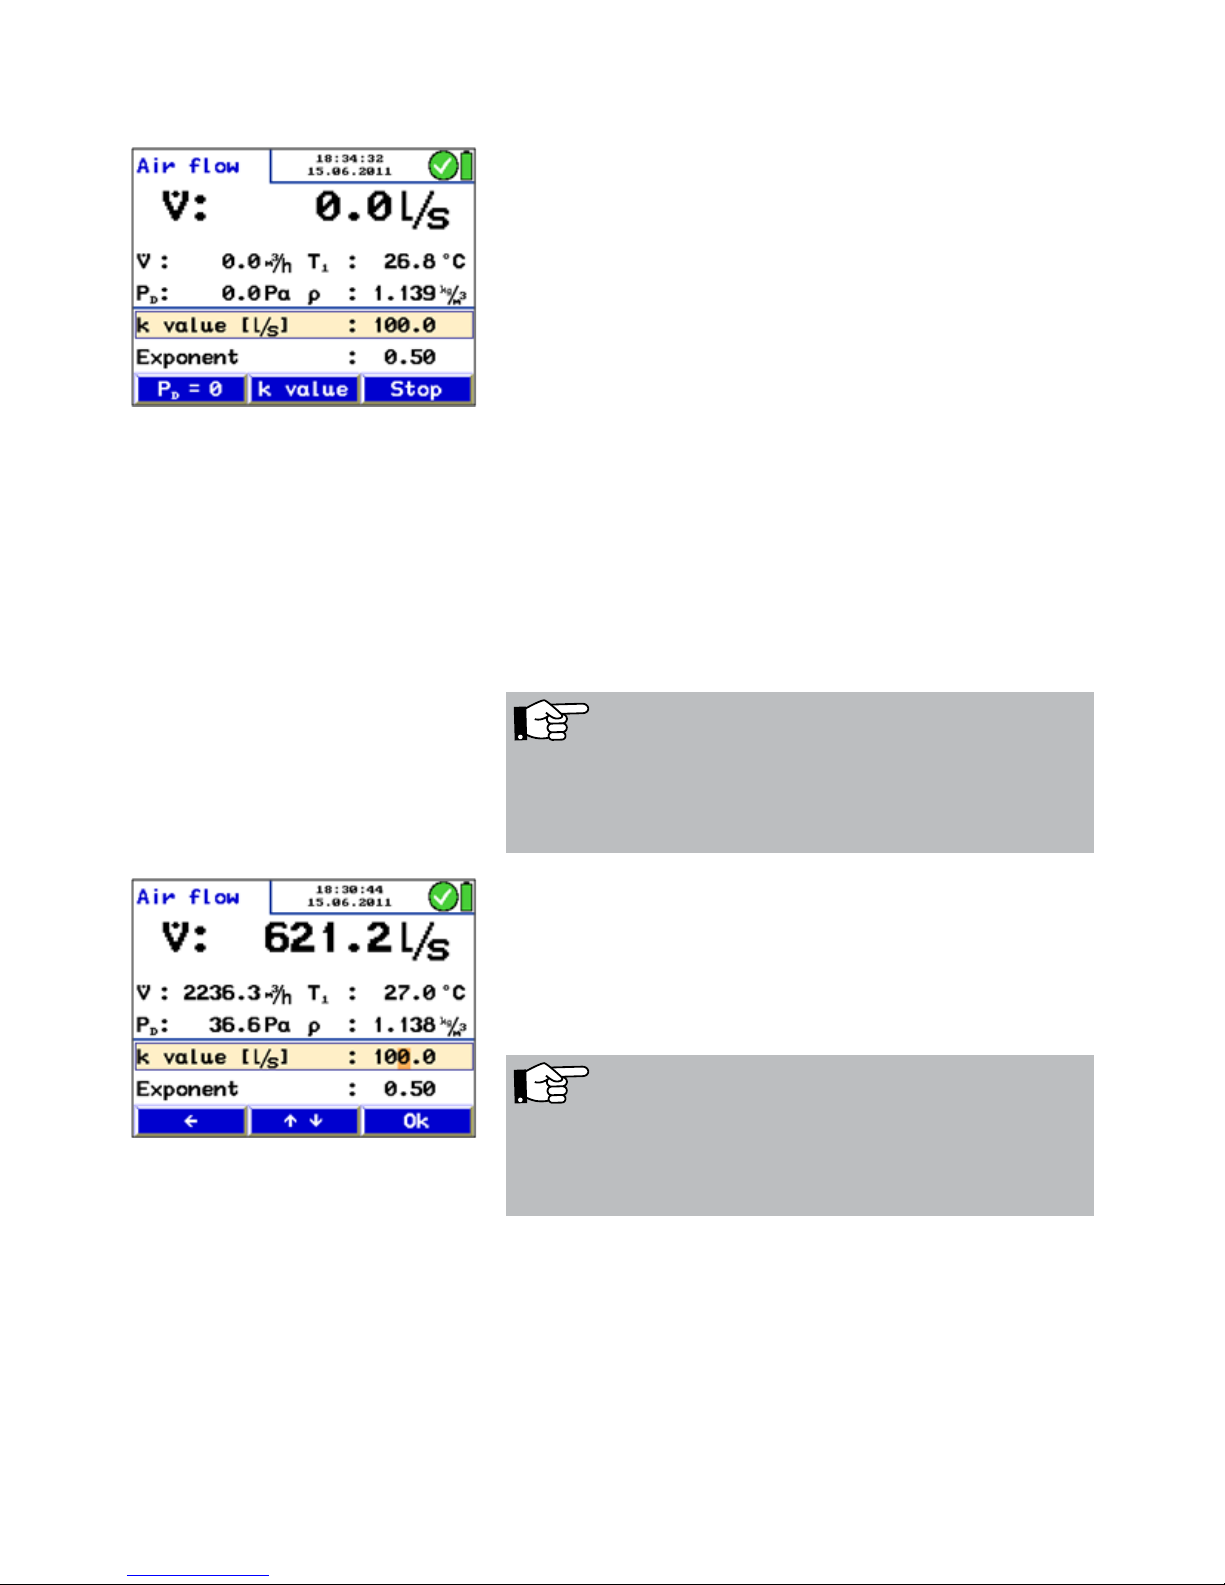
After the measuring mode has been activated, in the upper
part of the display the air flow will be indicated in the unit
selected in the setup-menu.
Below, the airflow will be indicated in the other unit.
If temperature sensors are connected, T1 is the reading of
the temperature measured by the sensor connected left and
T2 is the reading of the temperature measured by the sensor
connected right. If no temperature sensor is connected, the
meter will calculate with the standard density
value r = 1,200 kg/m³.
The following values will also be indicated:
Differential pressure P
D
Air density r
k value Below, the k value that has been entered by the user is indi-
cated.
Fig. 21: Menu "Air flow (k value)"
Enter the k-value as follows.
• Select K value, see Fig. 21: Menu "Air flow (k value)"
• Increase or reduce the value with the up and down keys.
• Press OK to confirm.
NOTE!
The k value is specified in the data sheet of the air vent. The
user must enter this k value into the Lindab PC 410 before
starting the measurement.
Fig. 22: Entering the K-value
NOTE!
Always enter the k value related to l/s (even if you have
changed the air flow unit from l/s to m3/h in the setupmenu).
Page 25
25
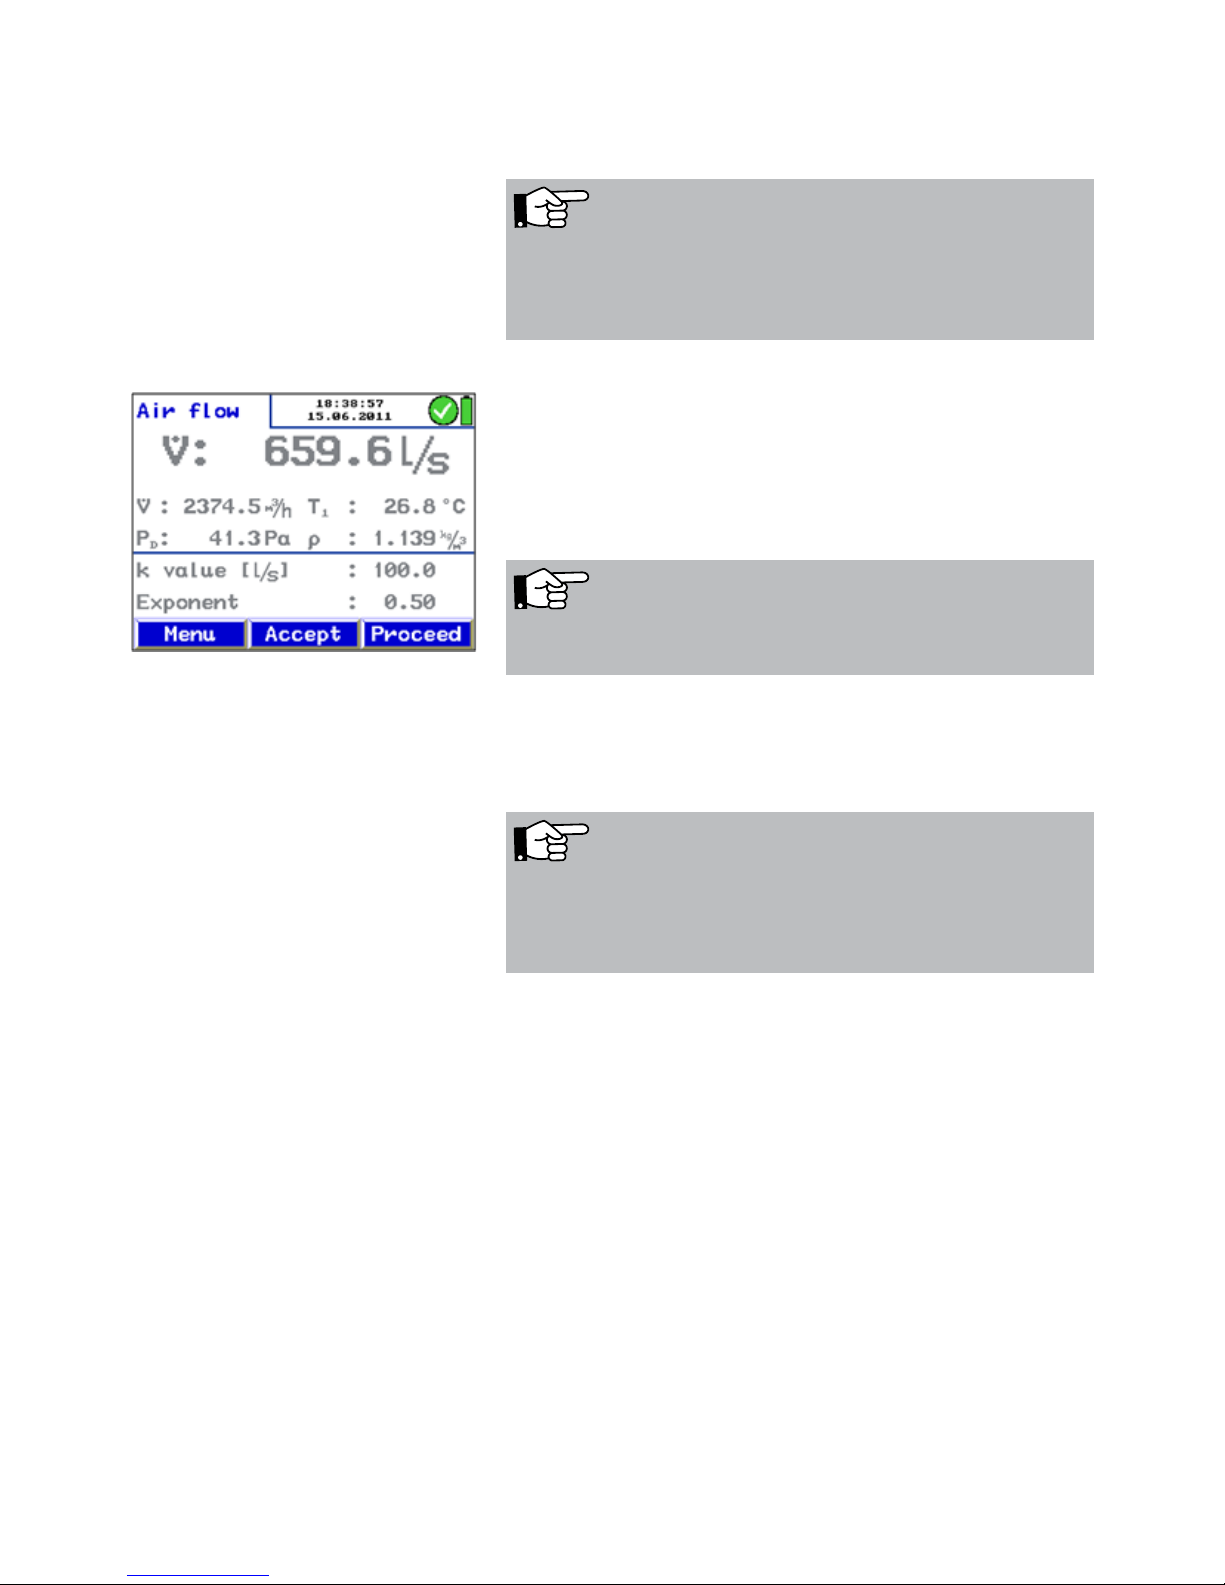
PD = 0 Press PD = 0 (menu bar, see Fig. 21: Menu "Air flow (k value)"
to zero the pressure sensor.
NOTE!
We recommend to zero the pressure sensor, if the pressure
indicated in the display is not PD = 0 after the measuring
hoses have been removed.
• When measuring, wait until the value has stabilized and
then press "Stop".
• Press "Accept" to capture and save the value. In the main
menu a tick mark beside the menu "air flow (k value)" will
indicate that the measurement has already been done.
• Press "Escape" to exit the menu without saving.
Press "Proceed" to return to the menu "air flow (k value)" for
further measurements.
NOTE!
Select "Print" to print out a report.
NOTE!
If the airflow reading is not stable or if the resolution is not
high enough, go to the Setup-menu and select Attenuation
> fine (see chapter 6.12)
Fig. 23: measuring value that has not been
accepted yet.
Page 26
26
6.3 Option “K-Value Matching”
This mode allows to adjust the k-value of iris apertures, air
passages and terminal boxes.
If the component is equipped with an adjustment scale for
the k-value, the airflow can be adjusted without a calculator
or a diagram.
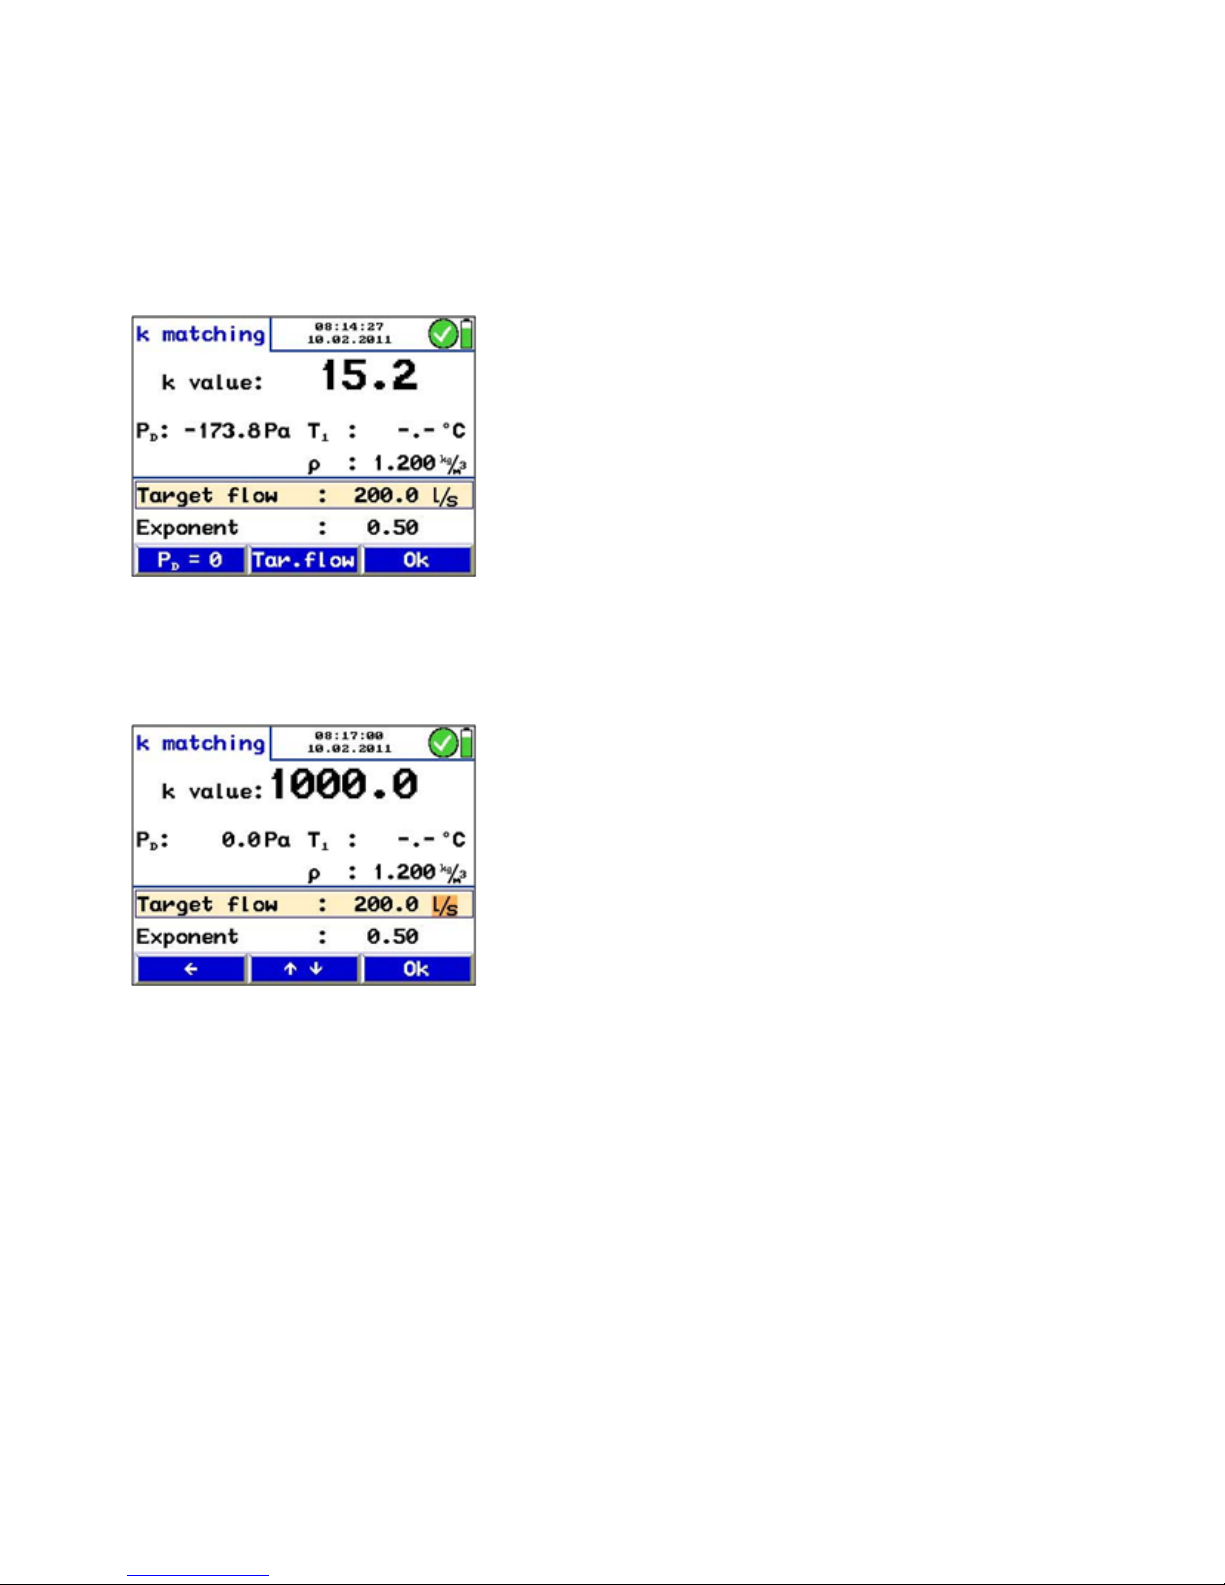
Go to the main menu and open the submenu "k-Value Matching".
The menu shown in the figure will appear. The k value is indicated in the upper part of the display.
Below the k value, the differential pressure PD and the air
density r will appear.
If temperature sensors are connected, T1 is the reading of
the temperature measured by the sensor connected left and
T2 is the reading of the temperature measured by the sensor
connected right.
Target Flow Below the target flow is indicated. The target flow has to be
entered by the user.
Enter the target flow as follows:
• Select the "Tar. flow"-key from the menu bar (see Fig. 24).
• Increase or reduce the value with the up and down keys.
• If necessary, select m³/h or l/s and change the unit.
• Press OK to confirm.
Fig. 24: Menu K-Value Matching
Fig. 25: Entering the Target Flow
Page 27
27
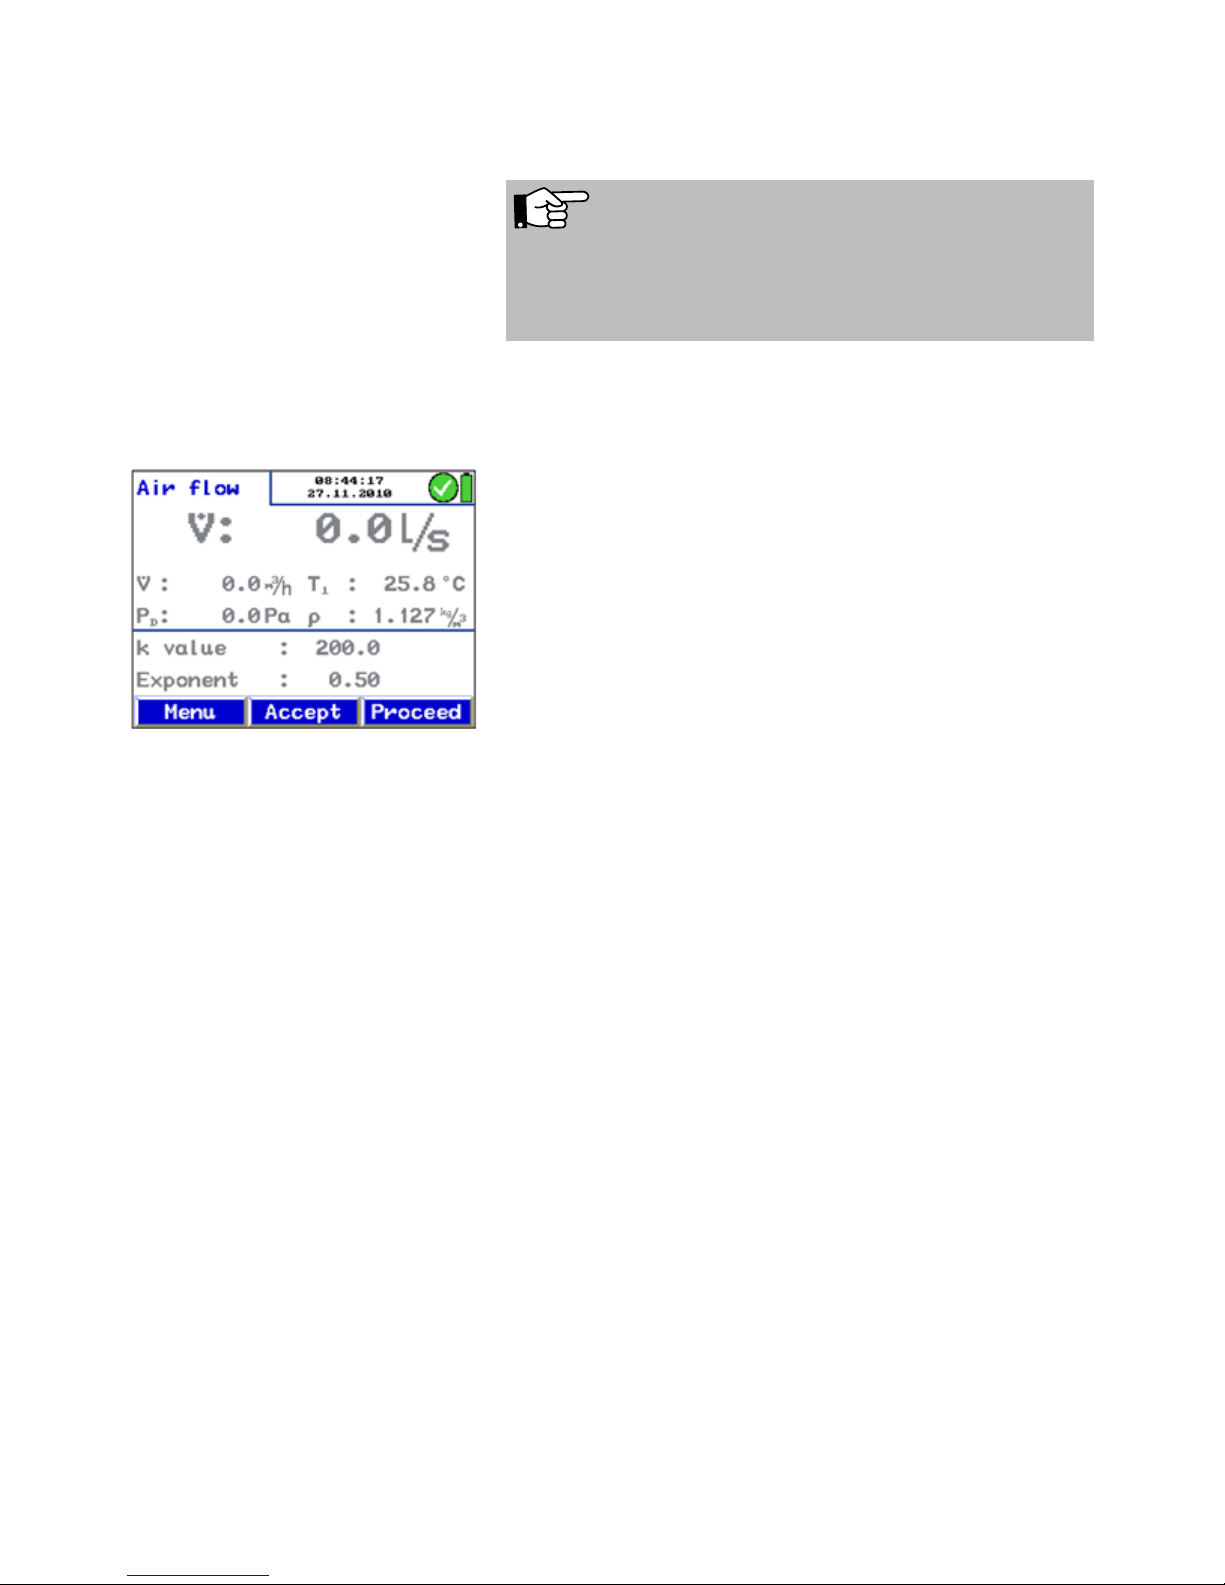
PD = 0 Press PD = 0 (menu bar, see Fig. 24 ) to zero the pressure
sensor.
NOTE!
We recommend to zero the pressure sensor, if the pressure
indicated in the display is not PD = 0 after the measuring
hoses have been removed.
• Modify the k-value of the component until the k value of
the component matches with the k-value indicated by the
meter.
• Press OK to confirm. The air flow mode (k-value) will
appear again.
• Now the user can perform another measure-ment to con-
firm the result and save the value afterwards.
• If necessary, select the "k-value matching" mode from the
main menu again.
Fig. 26: Air Flow Mode
Page 28
28
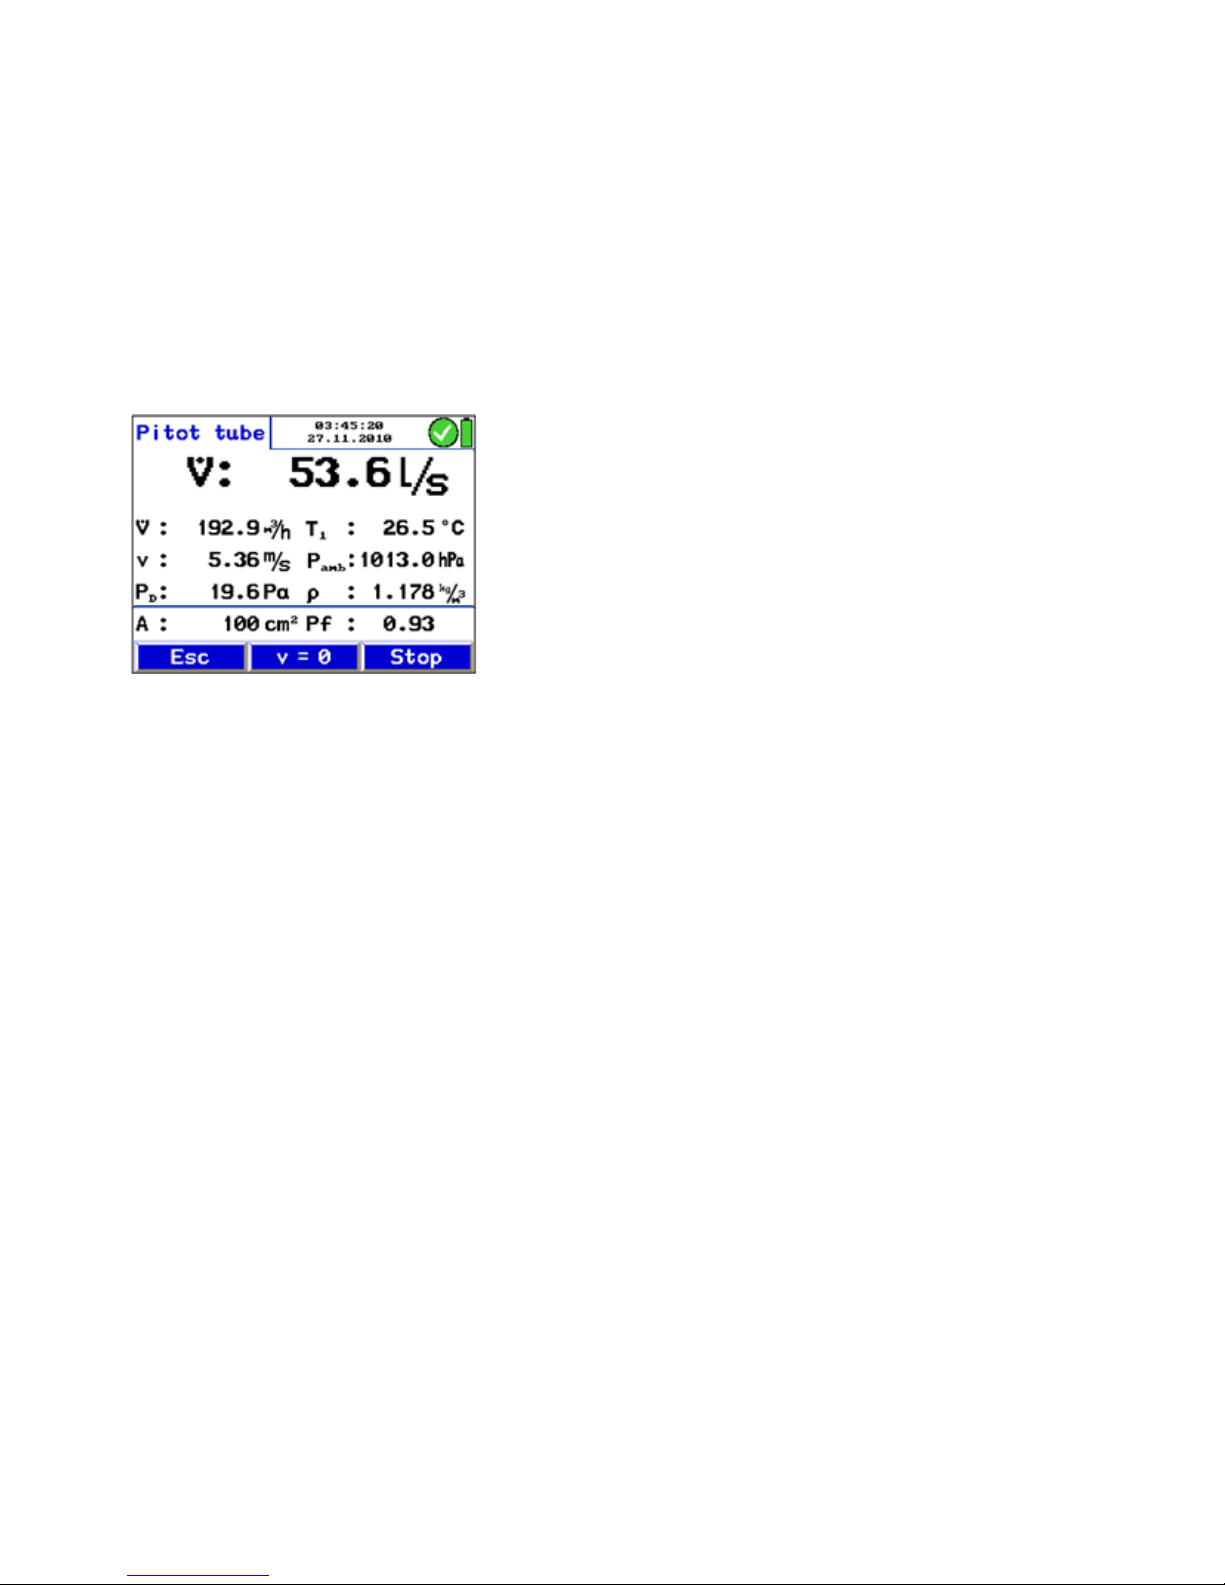
6.4 Option “Airflow (Pitot)” In this menu, the airflow (volume flow) is measured in l/s or in
m3/h. Select the unit in the setup menu. (see chapter 6.12)
1. With the Lindab PC 410, grid point measurements can be
done, so that the information provided by the measurement is significant (see chapter 6.4.2).
6.4.1 Measuring the airflow (Pitot) Connect the S-tube probe to the Lindab PC 410 and insert
it into the measurement opening. Proceed as described in
chapter 0
After the Menu "Airflow (Pitot)" has been selected, the current
airflow value V will be indicated.
The airflow is calculated from the surface area and the air
velocity.
V = A · v Formula 3
The Airflow v is indicated in the unit which has been selected
in the setup-menu.
Below the airflow is indicated in the other possible unit.
If temperature sensors are connected, T1 is the reading of
the temperature measured by the sensor connected left and
T2 is the reading of the temperature measured by the sensor
connected right. If no temperature sensor is connected, the
meter will calculate with the standard density
value r = 1,200 kg/m³.
The following values will also be indicated.
Air speed v.
Air pressure Pamb
Differential pressure P
D
Air density r
Pitot factor of the S-tube probe (Pf: can be adjusted in the
setup menu, 0.93 for the S-tube probe) cross section area A
of the duct (The user has to enter the cross section area A as
follows:)
Fig. 27: Menu Airflow (Pitot)
Page 29
29
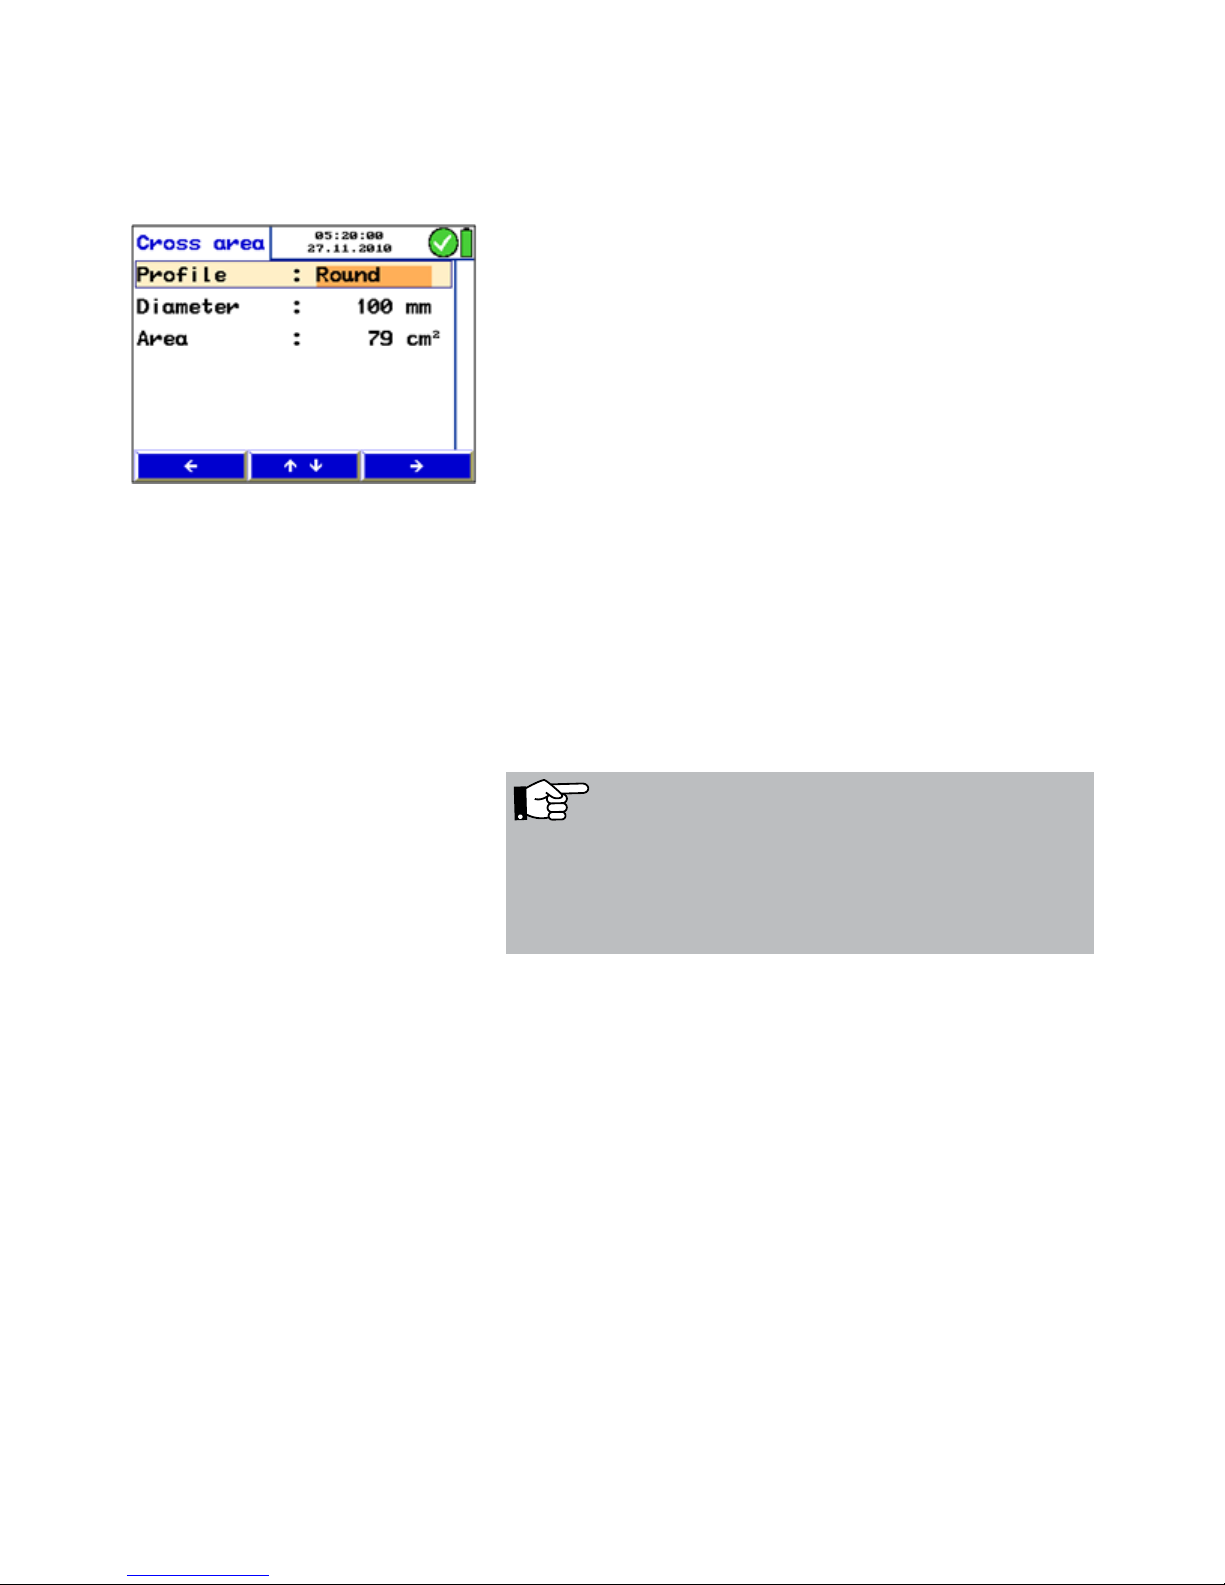
Entering the cross section area:
• Press "Stop" and then "Area" to bring up menu of the cross
section area.
• Go to the parameter "Profile" with the up and down keys.
• Use the right arrow to select between "round, rectangle,
arbitrary"
• Select by using the up and down keys.
• Change the other parameters in the same way.
The Lindab PC 410 will calculate the cross section area
automatically.
Press "Return" and then “Proceed” to start the measuring
with the correct area value.
6.4.2 Grid-point measurements The readings shown in the display are instantaneous values.
With the Lindab PC 410 grid-point measurements can be
done. This means that the air flow is measured at up to 12
different points of the tube and the meter will calculate the
average of the readings.
Fig. 28: Entering the cross section area
NOTE!
The average value determined by the grid-point measurement is much more informative than a value measured in
one point only, because possible fluctuations during the
measurement will be compensated.
Measurement 1
• Enter the area-value and insert the S-tube into the
measuring opening as described before.
Then start measuring.
• When the value has stabilized, press "Stop".
Page 30
30
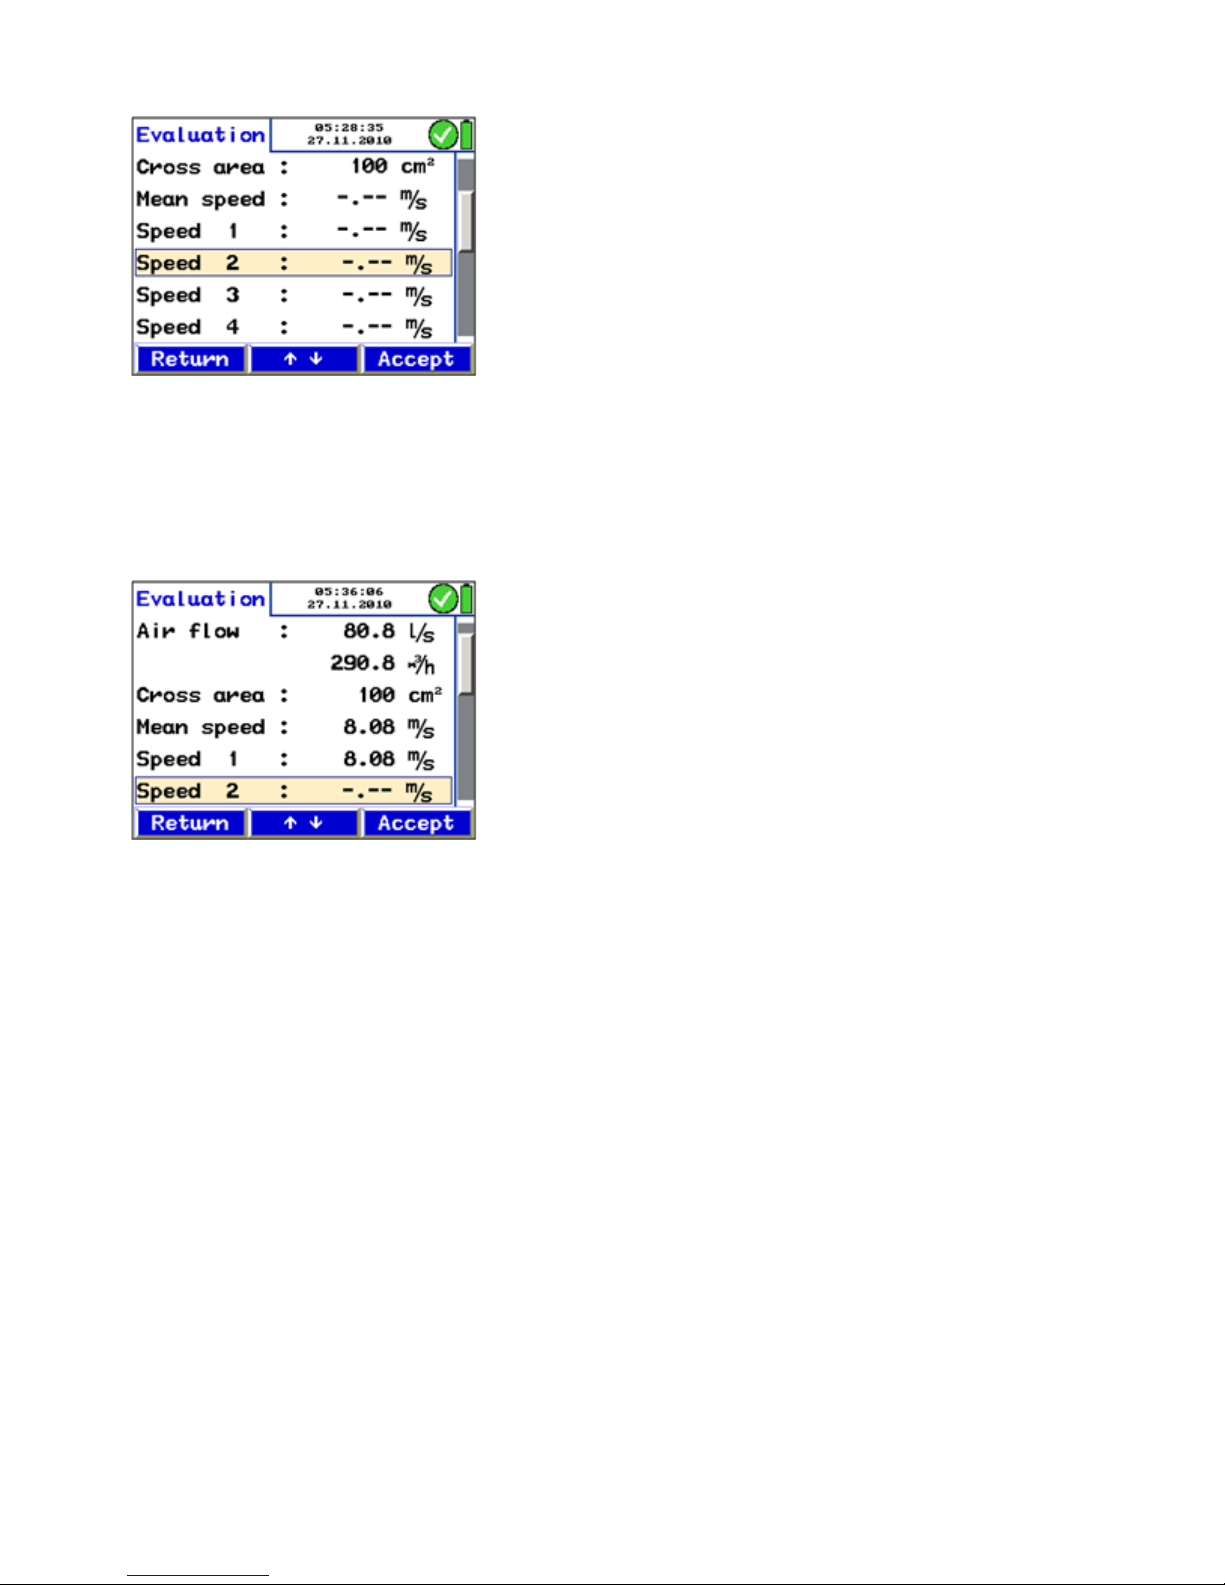
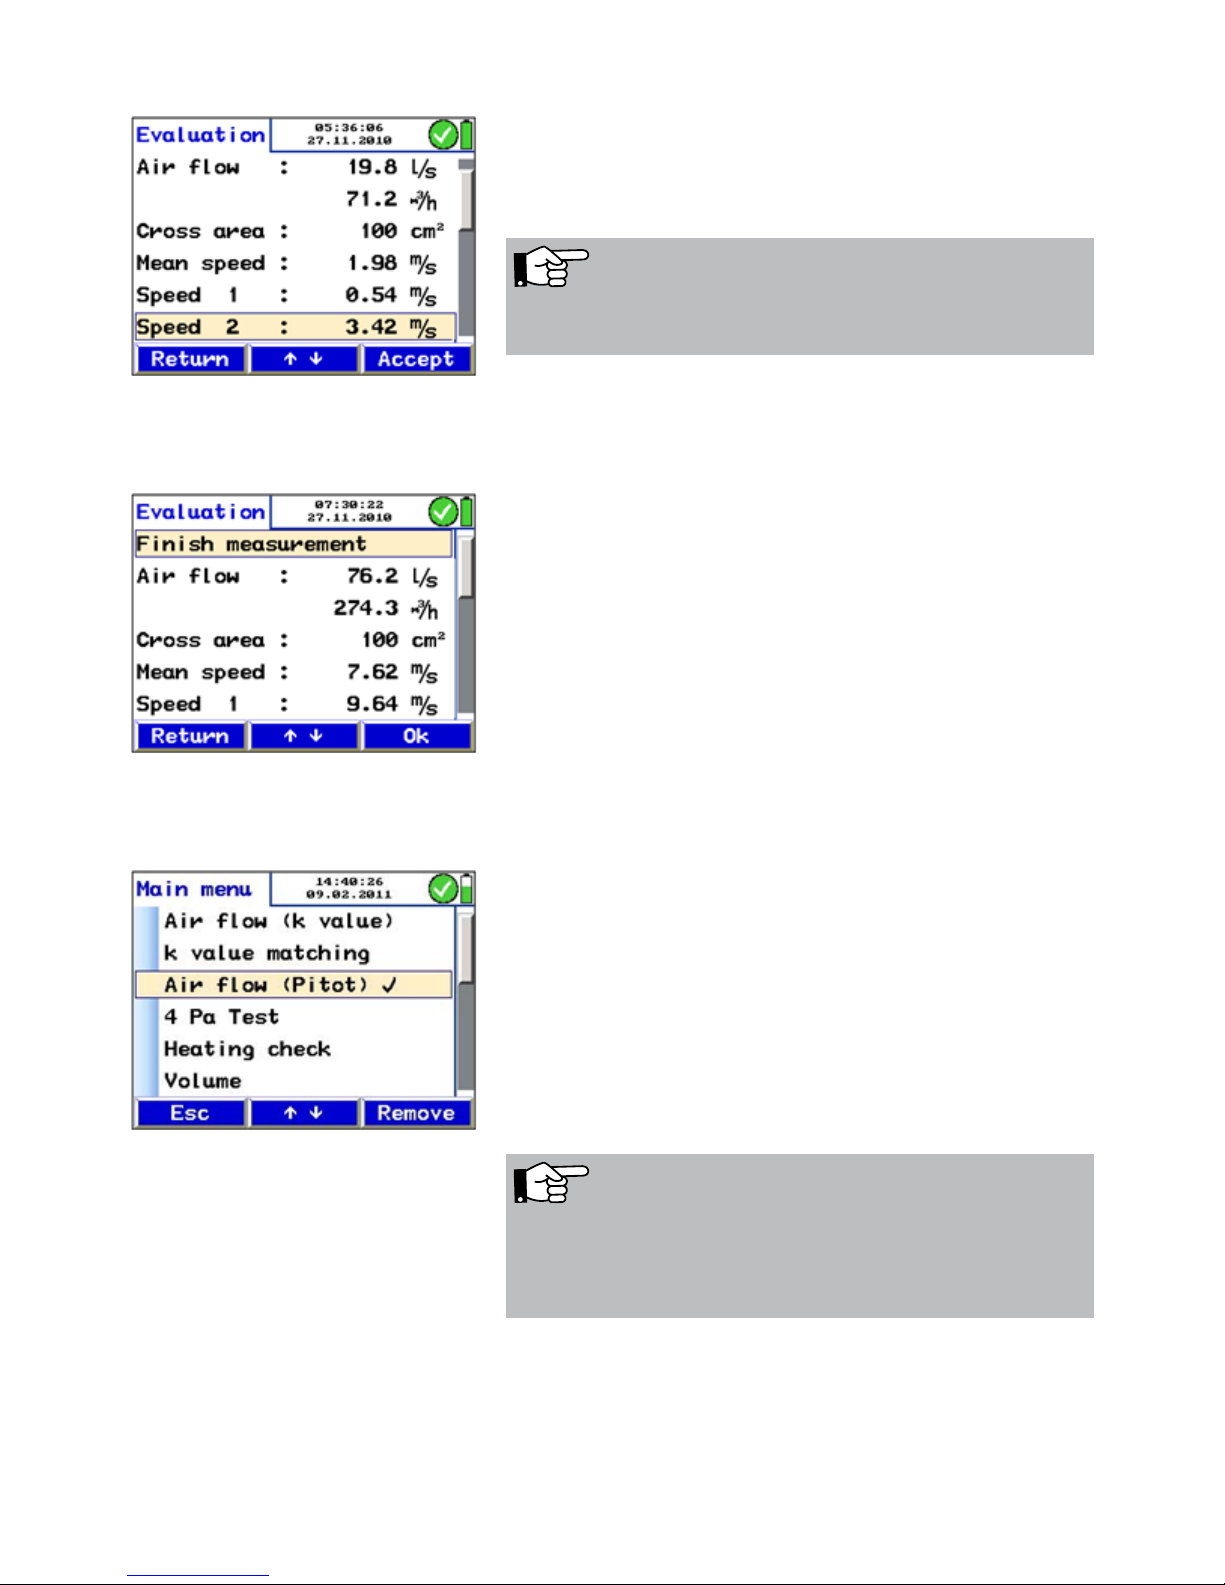
The readings of the first measurement are shown in the
display.
• Press the Evaluation-key to display all readings.
The result of the first measurement is not shown yet, because
it has not been captured yet.
• Press "Accept" to capture the value as the velocity 1.
The air flow is indicated in the upper part of the display as the
result of the measurement 1.
• Press "Return" to bring up the measurement menu.
• Press "Proceed" to start a new measurement.
Measurements 2 - 12 The current readings will be indicated in the display again.
• Press "Stop", when the values are stable.
• Press "Evaluation" to bring up a summary of all measure-
ments.
• Press "Accept" to capture the recent value.
• Perform the measurements 2-12 the same way.
Fig. 29: Standard report, when no reading
has been captured yet.
Fig. 30: Standard report after the readings
have been captured.
Page 31
31
In the display, the mean speed is shown above the readings.
The air flow is indicated in the upper part of the display as the
average of the results of all mea-surements performed until
now.
Fig. 31: Average value
NOTE!
Select "Print" to print out a report.
• In the Evaluation menu select "Finish mea-surement" (top
of the display) to finish the measurement.
Fig. 32: Finishing the measurement
NOTE!
If the airflow reading is not stable or if the resolu-tion is not
high enough, go to the Setup-menu and select Attenuation
> fine (see chapter 6.12)
In the main menu, a tick mark beside the menu "Air flow
(Pitot)" will indicate that the air flow measurement has already
been done.
Select "Print" to print out a report.
Page 32
32
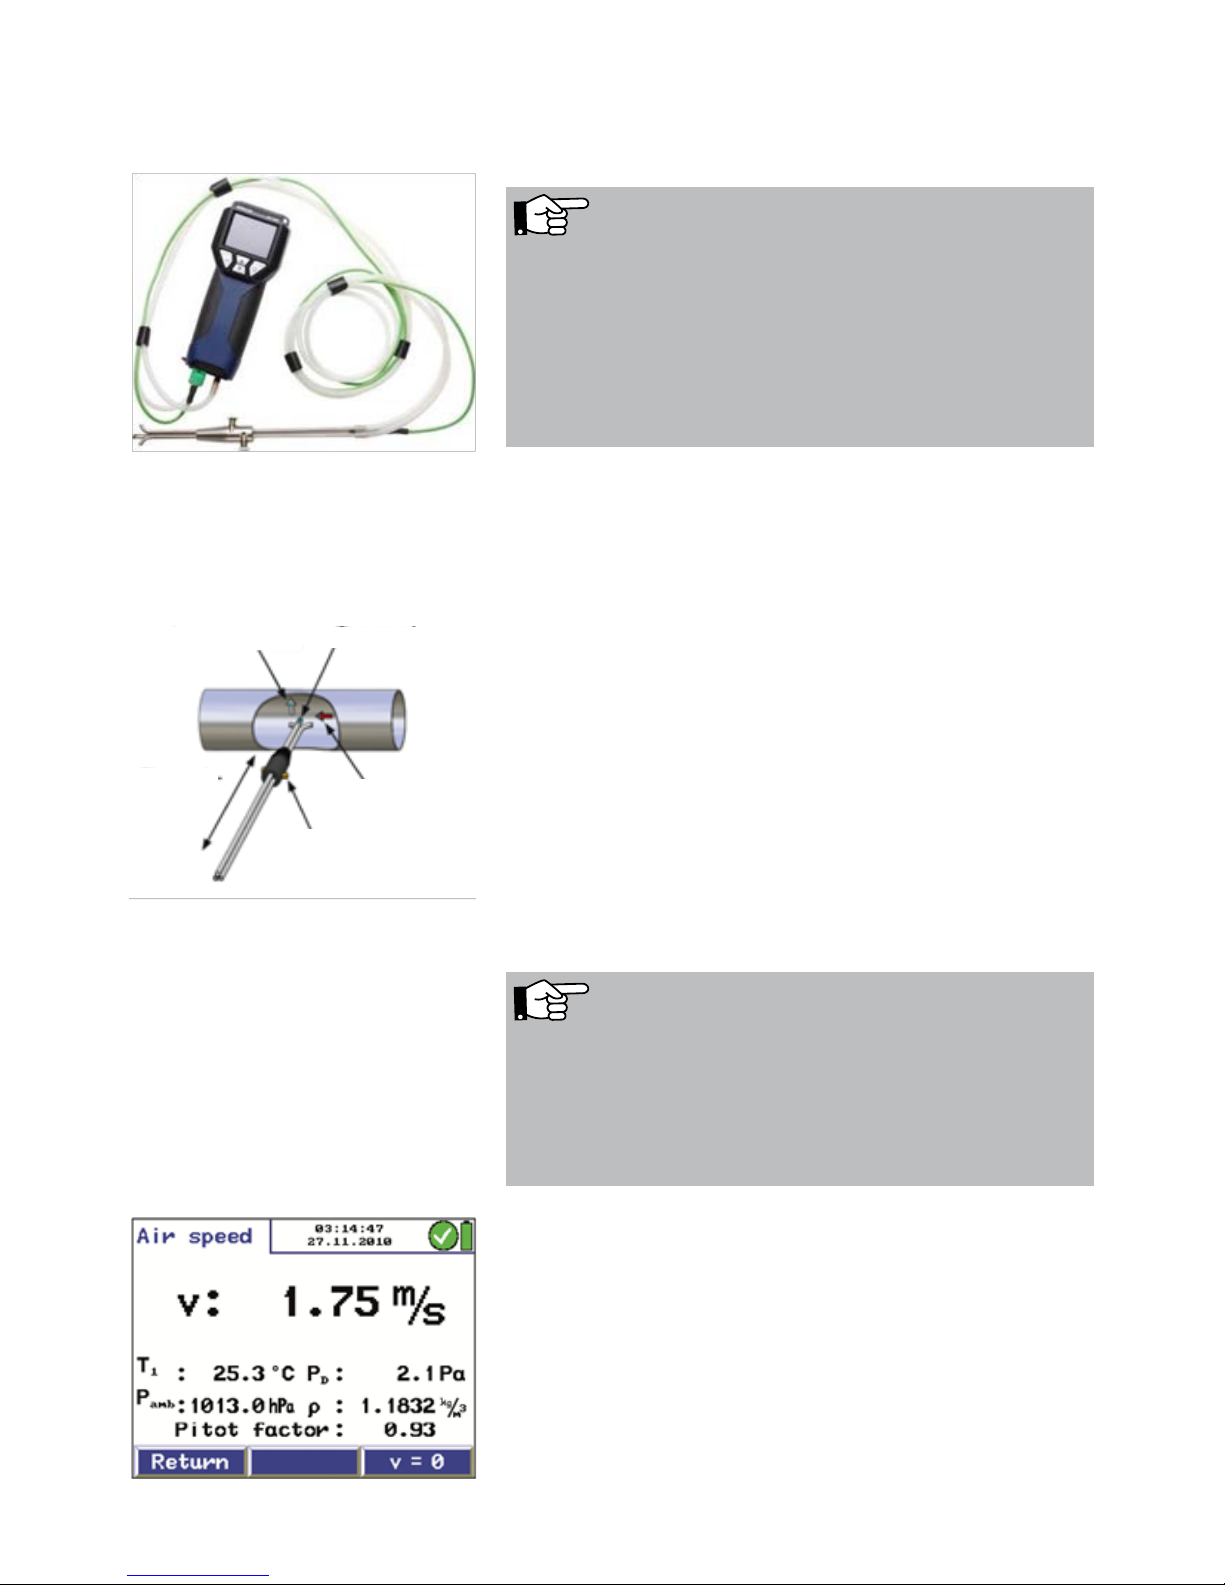
6.5 Option “Air speed” In the air speed mode, the air speed (v) of the gas is meas-
ured in m/s when the gas temperature is 800 °C or less.
Fig. 34: Connection of the S-tube probe
to the PC 410
NOTE!
An S-tube probe (see accessories) is needed for this measurement.
The wanted signal of the Wöhler S-tube probe is better
than that of a normal pitot tube, if the air speed is equal. In
the setup-menu the pitot factor 0,93 must be set once (see
chapter 6.12).
6.5.1 Measuring the air speed
1. Connect the pressure connector of the S-tube to the (+)
overpressure socket of the Lindab PC 410.
2. Connect the static pressure connector of the S-tube to
the (-) underpressure socket of the Lindab PC 410.
3. In calm air, switch on the Lindab PC 410 and wait until
the zeroing procedure of the sensor has finished.
4. When closed, the S-tube can be inserted through the
measurement opening into the gas flow.
5. Fix the S-tube with a cone, open it and direct the sensors
as shown in the figure.
6. If necessary, adapt the S-tube to the cross section of the
gas line with the help of the two knurled screws.
NOTE!
The S-tube must be adjusted before the measurement procedure starts, since it is required to check and/or adjust the
oppositely running orientation of the measuring tubes after
loosening the knurled screws and adjusting the immersion
depth.
Static pressure Temperature
Immersion
depth
Flow
Knurled screws
Fig. 35: Measuring the air speed with the
S-tube
7. In the main menu, select "Air speed" and confirm with
OK.
The air speed v is indicated in the upper part of the display.
The temperature, measured by the sensor or the S-tube, and
the ambient pressure Pamb, measured by the integrated
ambient pressure sensor, are indicated in the lower part of the
display.
Also the differential pressure P
D
and the density r are indi-
cated.
Fig. 36: Measurement of the air speed
Page 33

33
• Press the left key to bring up the menu again.
• Press the right key to zero the pressure sensor.
NOTE!
The pressure sensor must be zeroed, if the meter does not
indicate V=0 after the tubes have been removed.
6.5.2 Theoretical background
The PC 410 will calculate the air speed automatically according with the following formula:
v = S
p
2 ∆p
Formula 1
The air density r is determined as follows:
ρ =1,29 ·
kg
m³
273 °C .P
akt [hPa]
(ϑakt [°C]ϕ+273 °C) · 1013 hPa
Formula 2
Explanation: v: air velocity in m/s
r: air density, ca. 1.29 kg/m³ (depends on temperature and air pressure)
∆p: Differential pressure in Pa, measured with the S-tube
P
akt
: ambient air pressure, measured by the PC 410
S: Pitot factor 0,93 for S-tube probe
J
akt
: Measured Temperature
NOTE!
If the airflow reading is not stable or if the resolution is not
high enough, go to the Setup-menu and select Attenuation
> fine (see chapter 6.12)
Page 34
34
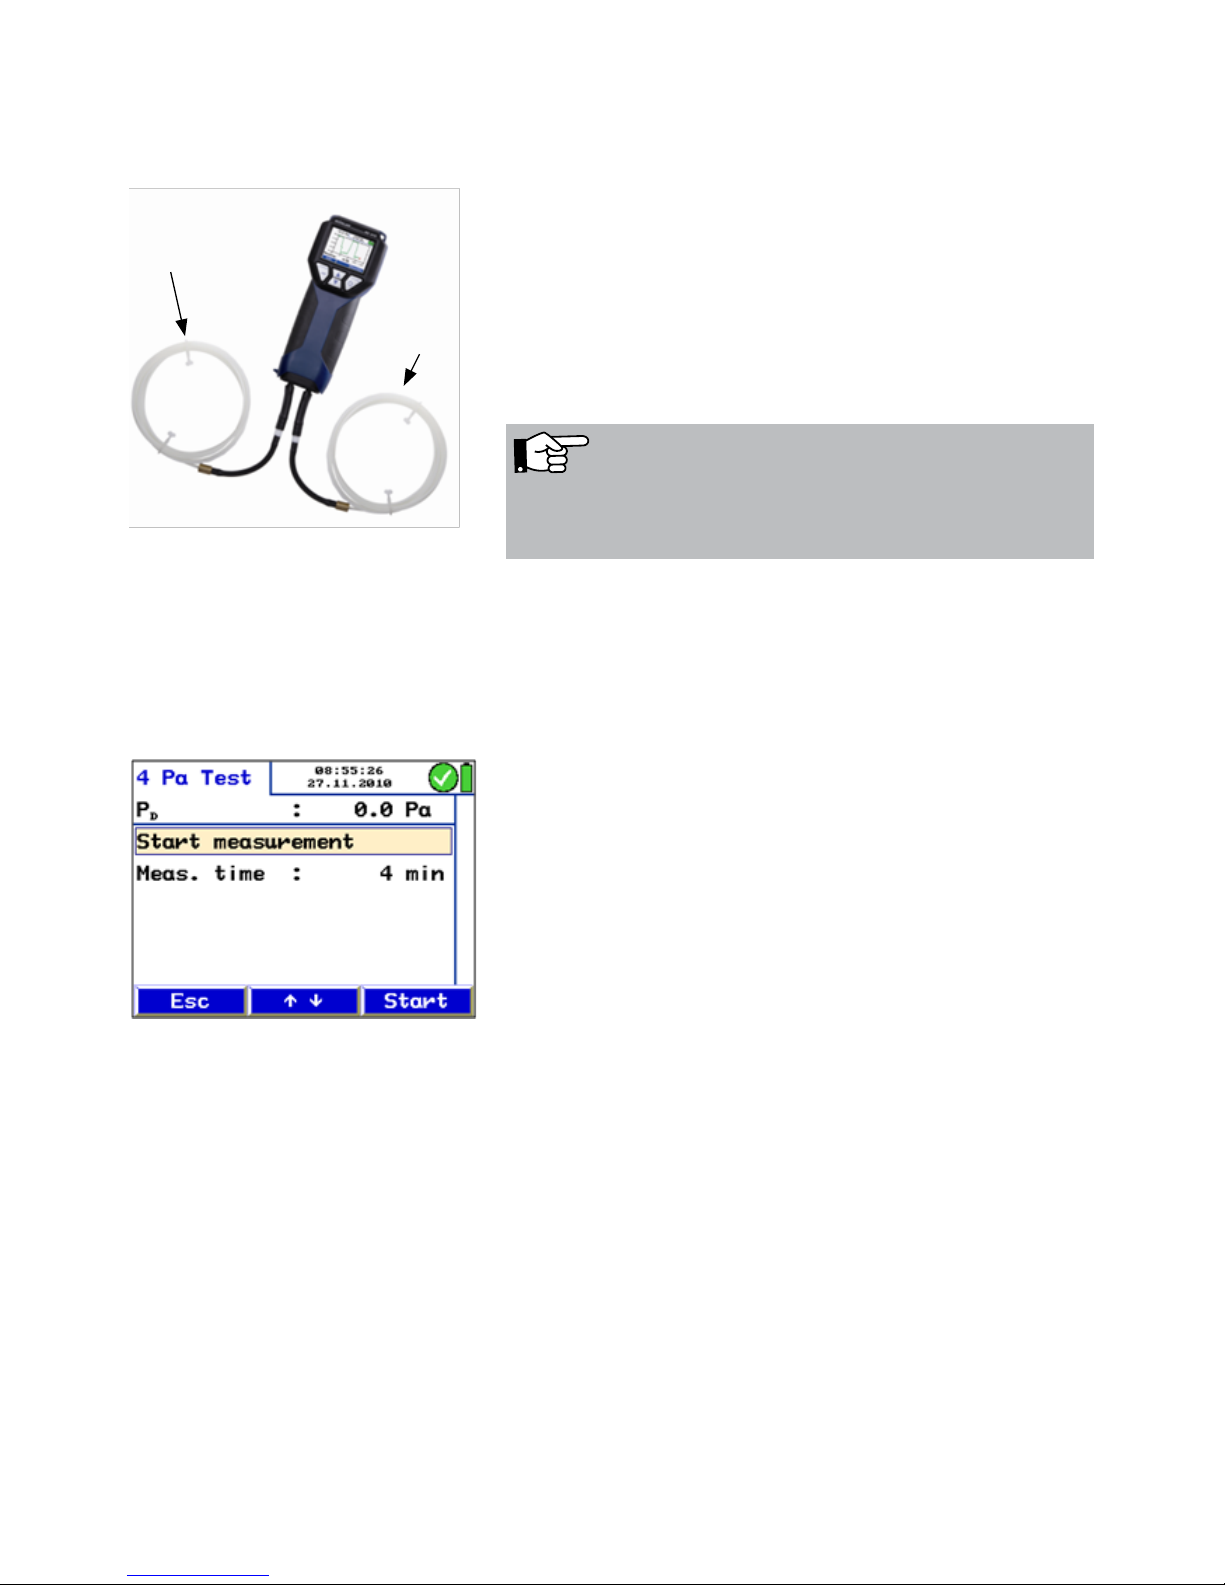
6.6 Option “4 PA Test” The 4 Pa Pressure Test is a simple control of the underpres-
sure limit 4 Pa for the confirmation of a sufficient combustion
air supply.
In a closed room or in connected rooms, simultaneous operation of non-roomsealed heating appliances and ventilation
and air conditioning systems can cause dangerous under
pressure.
With the 4 Pa Pressure Test the underpressure value can be
controlled. The readings are plotted in a graph during about 4
minutes, and can be saved and print out afterwards.
Fig. 37: PC 410 with capillary hoses
NOTE!
For the 4 Pa Test two capillary hoses must be connected to
the PC 410.
The 4-Pa Test measures the pressure difference between
the room where the fireplace is installed and another room
which is not connected (e.g. outside air, stairway etc.). Before
starting the measurement, two flexible capillary hoses must
be connected (see accessories). The pressure sensor of the
meter will measure the pressure difference.
Before starting the measurement:
1. Select 4 Pa Test in the main menu of the PC 410. The
current differential pressure reading will be displayed.
2. Connect the capillary hose leading to the reference point
(stairway or outside air) to the negative pressure socket
(Fig. 1, part 10).
3. Connect the second capillary hose to the positive pres-
sure socket (Fig. 1, part 9). The second hose stays in the
room where the fireplace is installed. With this hose the
march of pressure will be recorded.
Underpressure in the fireplace room in relation to the pressure
at the reference point will lead to a negative differential pressure.
Fig. 38: Initial display of the 4 Pa test
Capillary
hose inside
pressure
Capillary
hose
outside
pressure
Page 35
35
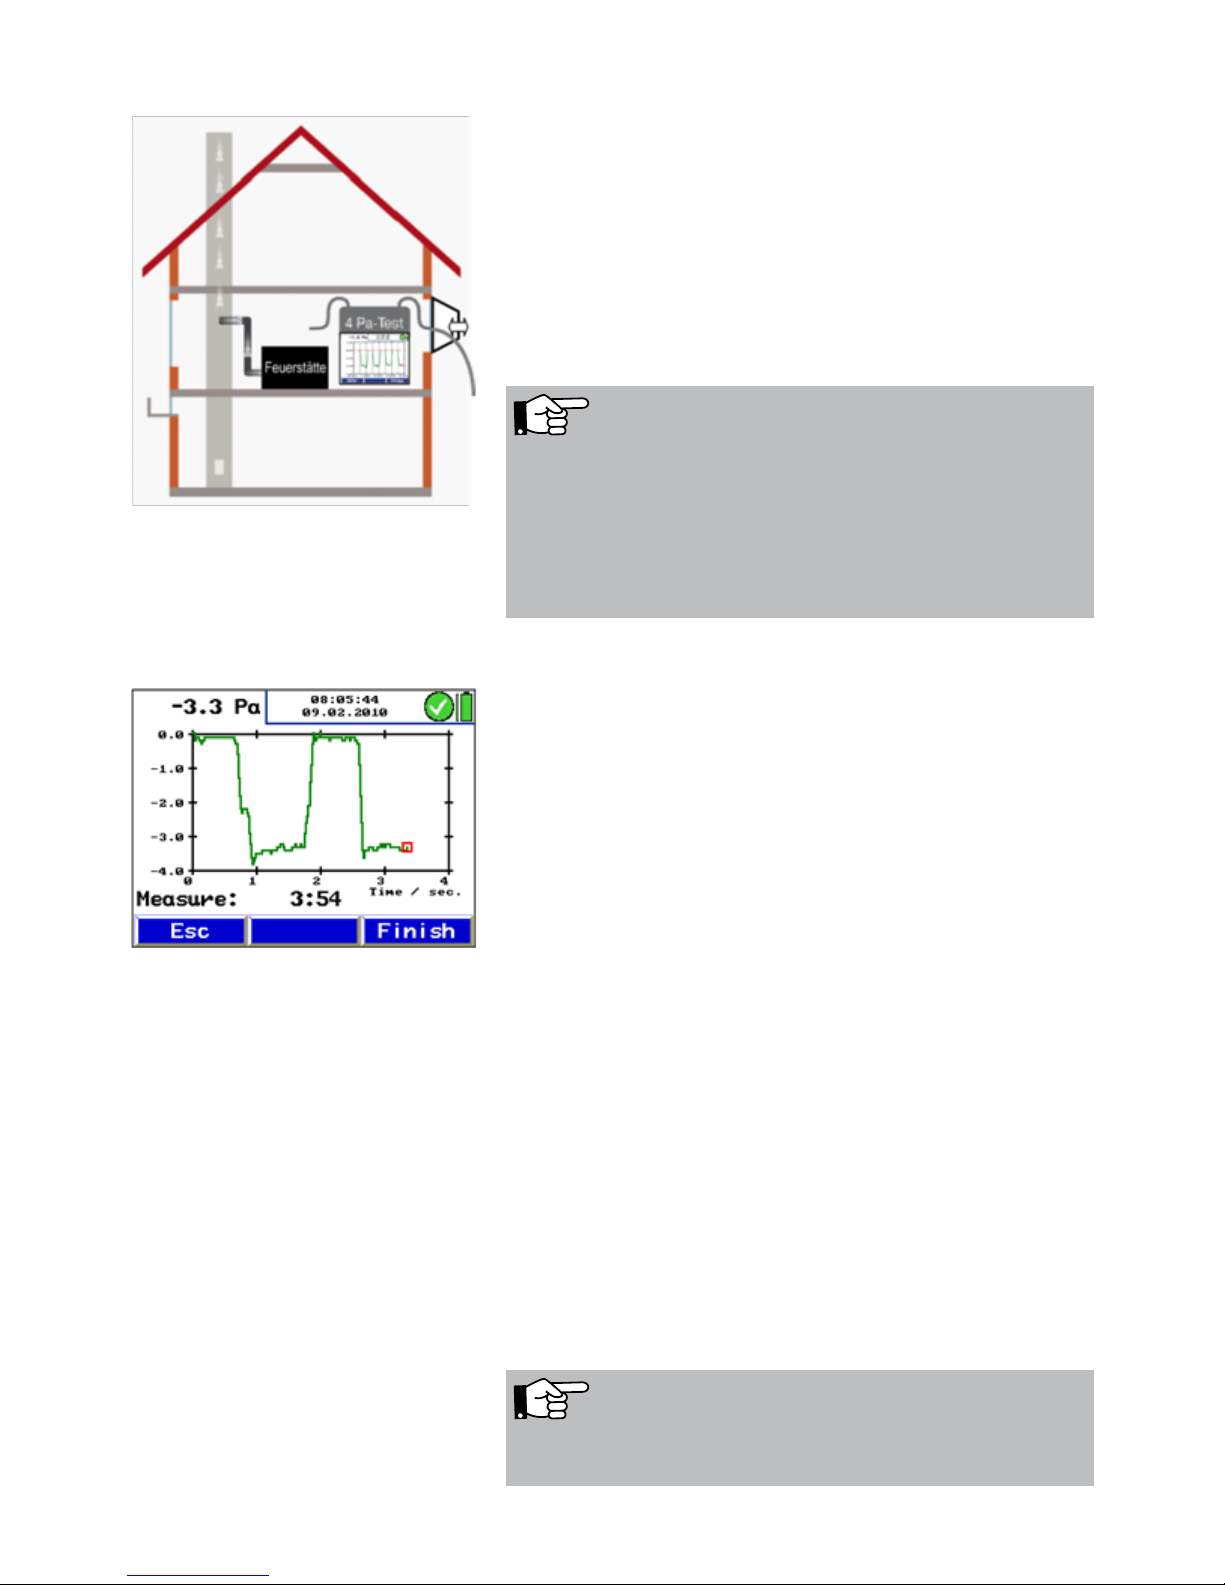
How to perform the 4 Pa Pressure Test:
4. Switch on appliance and all air conditioning (fan, dryer)
with maximum power.
5. Open an outside window or a door to the reference room
and test proper operation of the appliance, ensure that
there are no backdraft conditions.
6. Position the reference capillary hose: Lead the hose out-
side through a window seal or into the stairways through
the door rebate or the keyhole.
Fig. 39: 4-Pa Test
NOTE!
Especially on stormy days, the stairways may be a stable
reference room.
If the stairways are used as reference room, all windows,
doors, cellar doors and trap doors have to be closed.
The second capillary hose will stay uncut in the fireplace
room.
7. Press „PD =0“ to zero the pressure sensor.
8. Press "Start" to start the 4-PA Test.
The meter will now record the pressure profile for 4
minutes.
9. Open the window/door for about 30 seconds, so that the
zero line can be registered.
10. Close the window/door for about 30 seconds, control
underpressure.
11. Open the window/door for about 30 seconds, the zero
line should be reached again.
12. Close the window/door for about 30 seconds, control
underpressure.
13. Open the window/door for about 30 seconds, the zero
line should be reached again.
14. Close the window/door for about 30 seconds, control
underpressure.
For a better orientation, every 30 seconds there are auxiliary lines in the diagram. After a maximum of 4 minutes, the
measurement will stop automatically.
Fig. 40: Pressure profile during the
4 Pa Test
NOTE!
Press "Stop" to stop the 4 PA Test earlier.
Page 36
36
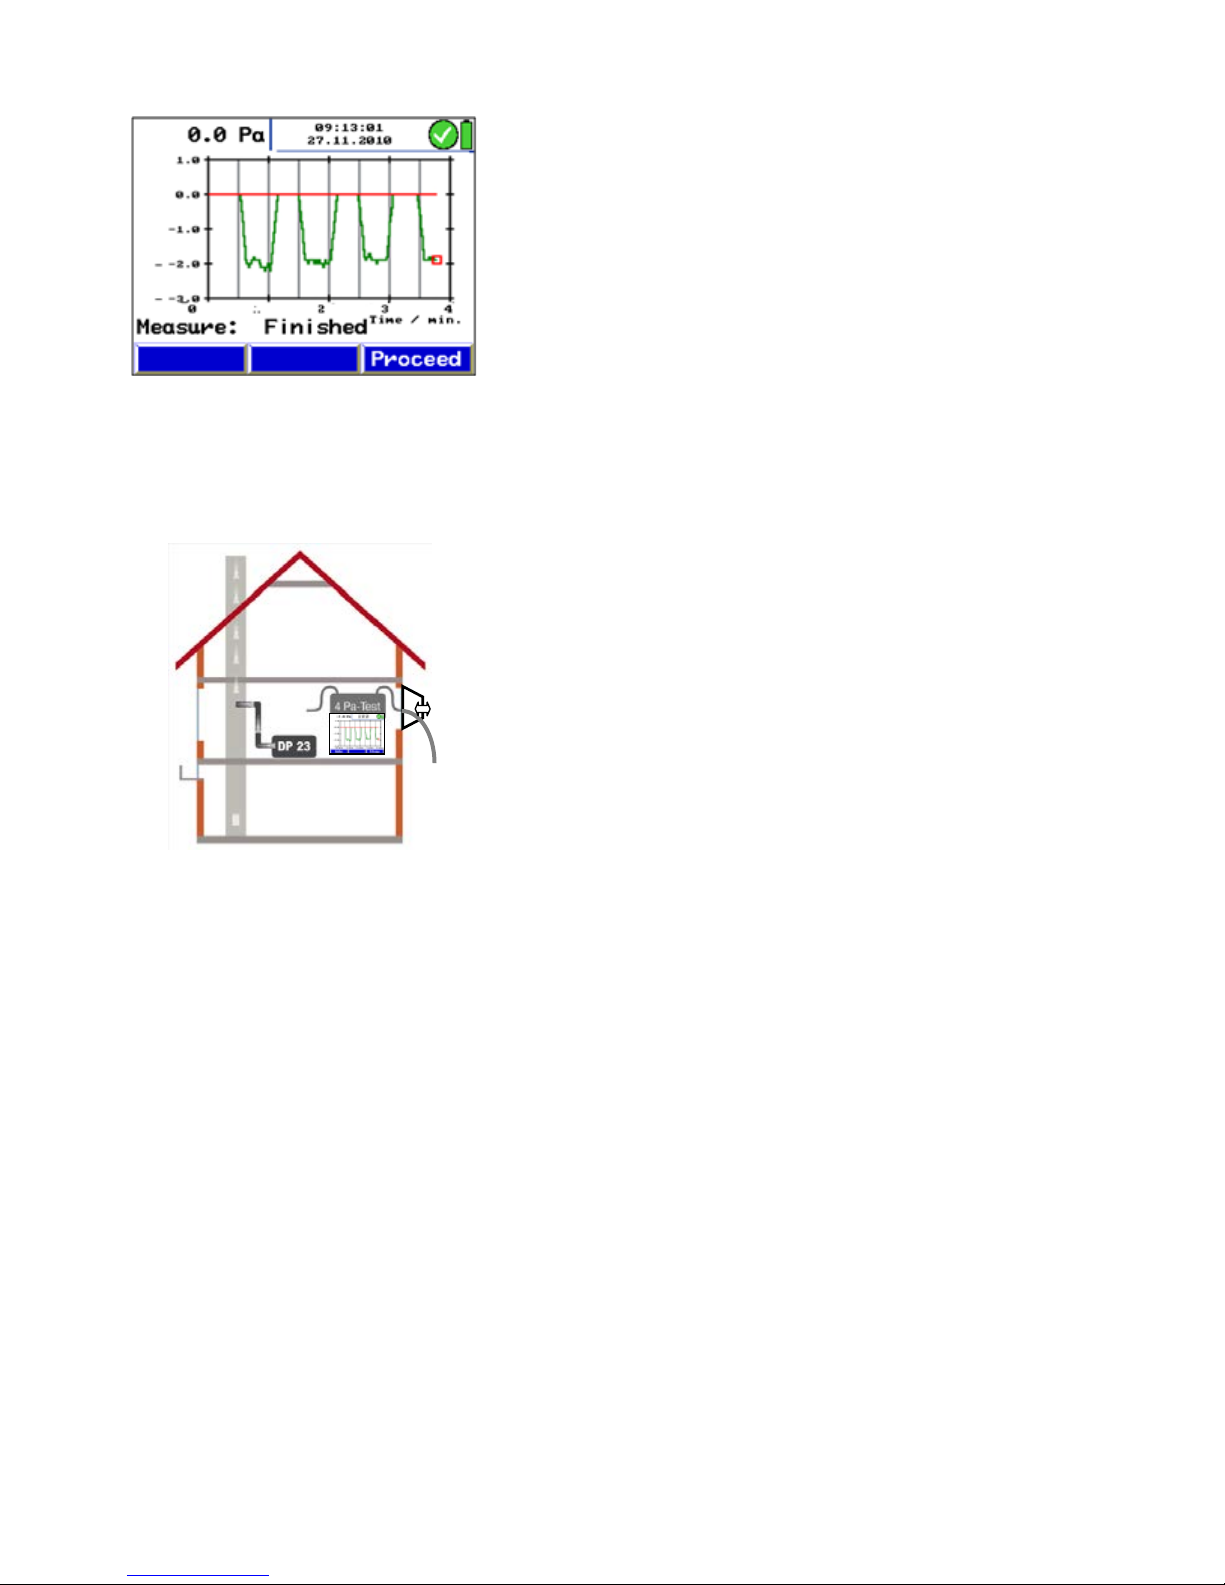
Normally a diagram as shown in Fig. 41. will appear. The
pressure peaks in the diagram are caused by the rapid movement of the window or the door and therefore they are not
relevant for the interpretation of the diagram.
In Fig. 41 the pressure drop is about 2,0 Pa.
The reliability of the system is considered suffi-cient, when
the pressure drop caused by opening and closing the window
is less or equal to 4 Pa (8 Pa in the case of wood burning
without surrounding air).
After the 4 Pa test is completed, "4 Pa Test" will be marked
by a tick mark in the main menu. Se-lect "Print" from the main
menu to print out the readings and select "Save measurements" (see chapter 0) to save them.
For the detailed procedure according to the Technical Rules
for Gas Installations (TRGI), working sheet G 625 (2009), it is
necessary to replace the fireplace by the Wöhler DP 23 (see
manual Wöhler DP 23).
Fig. 41: Diagram 4 Pa Test
Fig. 42: 4 Pa Test with Wöhler DP 23
Page 37
37
6.7 Option “Heating Check” (Energy Utilization Check)
The Energy Utilization Check provides a checklist to determine the potential efficiency improvements.
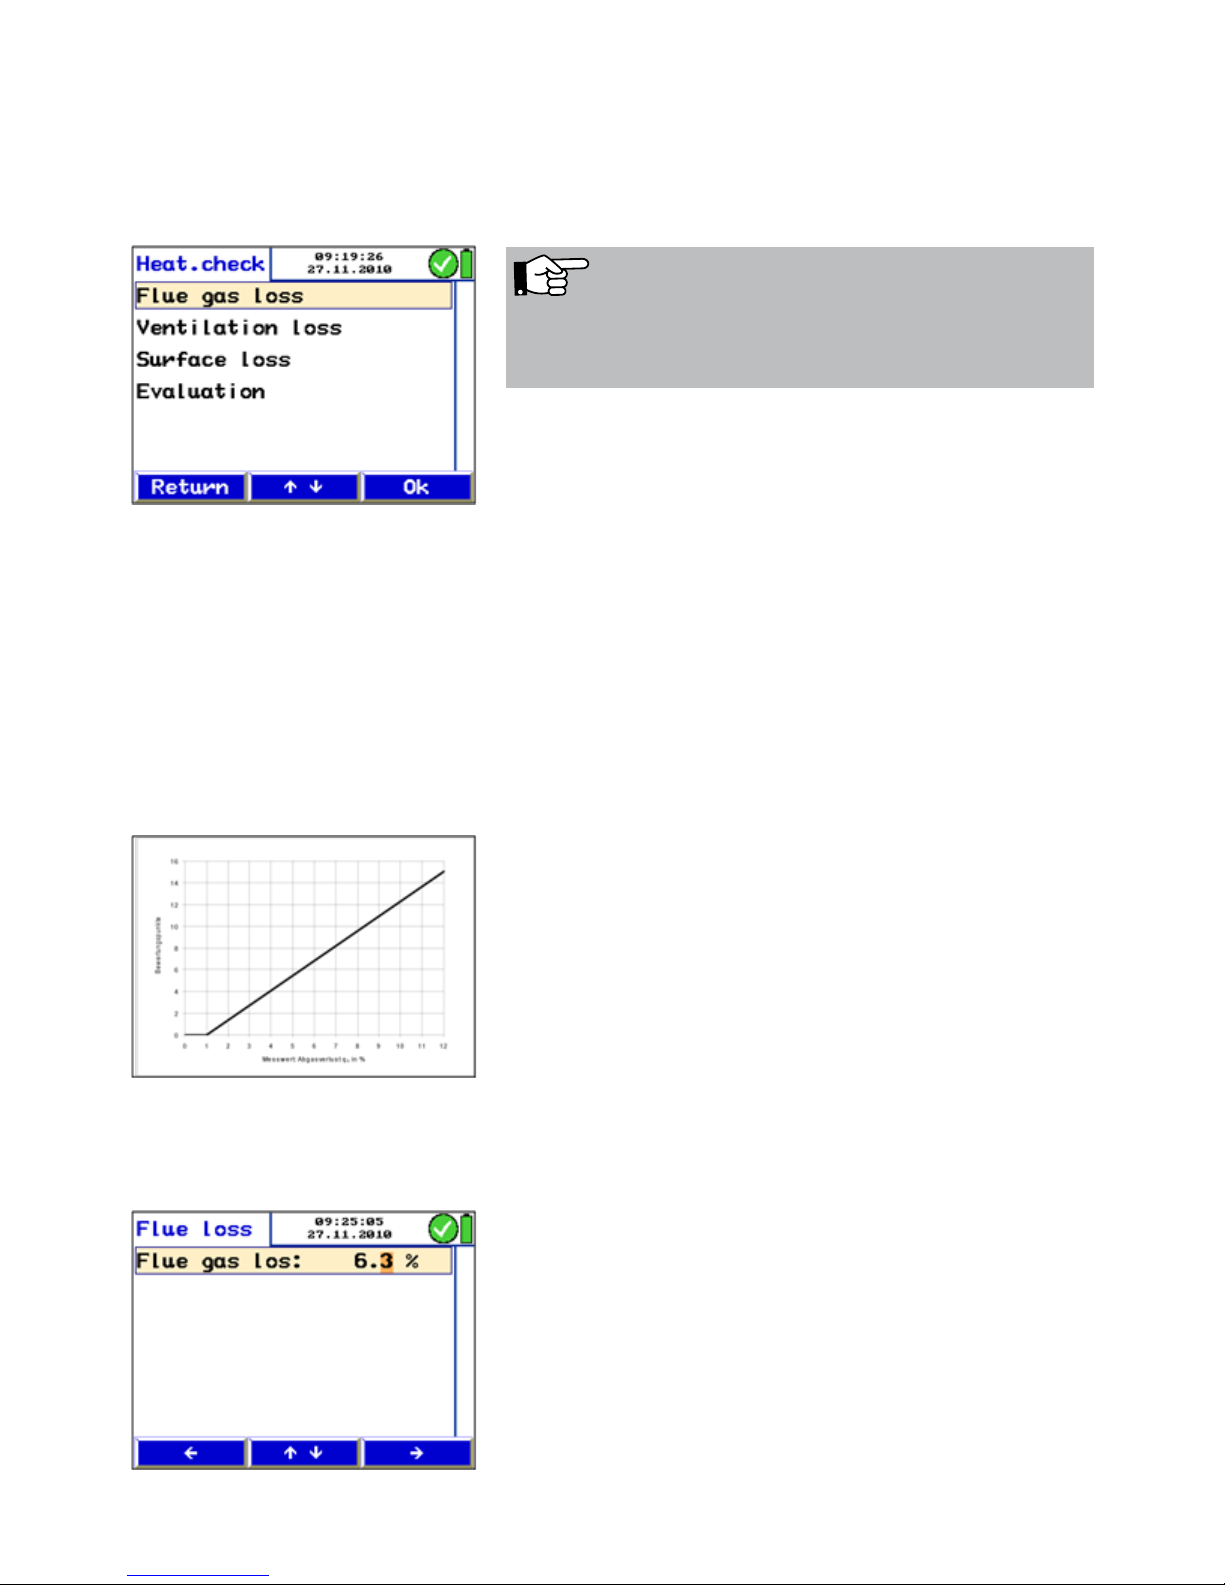
Select the supmenu "Heating Check" from the main menu. In
the Display the following options will appear:
• Flue gas loss
• Ventilation loss
• Surface loss
• Evaluation
How to activate a submenu:
• Select the option with the up or down key.
• Confirm with "OK".
Potential Improvement Points
Flue gas loss
In the submenu "Flue gas loss" the most recently measured
flue gas loss will be converted into potential improvement
points according to DIN EN 15378, national annex.
How to convert the flue gas loss into potential improvement
points:
• In the submenu "Heating check" select "flue gas loss".
Enter the measured flue gas loss.
The meter will convert the flue gas loss automatically according to the standard curve in Fig. 44.
After the conversion, "Flue gas loss" will be marked by a tick
mark in the "Heating check" screen.
NOTE!
It is necessary to connect the S-tube probe (see accessories).
Fig. 44: Standard characteristic curve
Fig. 45: Entering the flue gas loss
Fig. 43: Energy Utilization Check
Page 38
38
Measuring the Ventilation Loss The ventilation loss has to be measured 30 seconds after
burn-out. It is based on the measurement of the flow speed
and of the temperature of the residual core flow. The test
fulfills the requirements of DIN EN 15378, national annex,
concerning the evaluation of the ventilation loss of boilers.
How to perform the measurement:
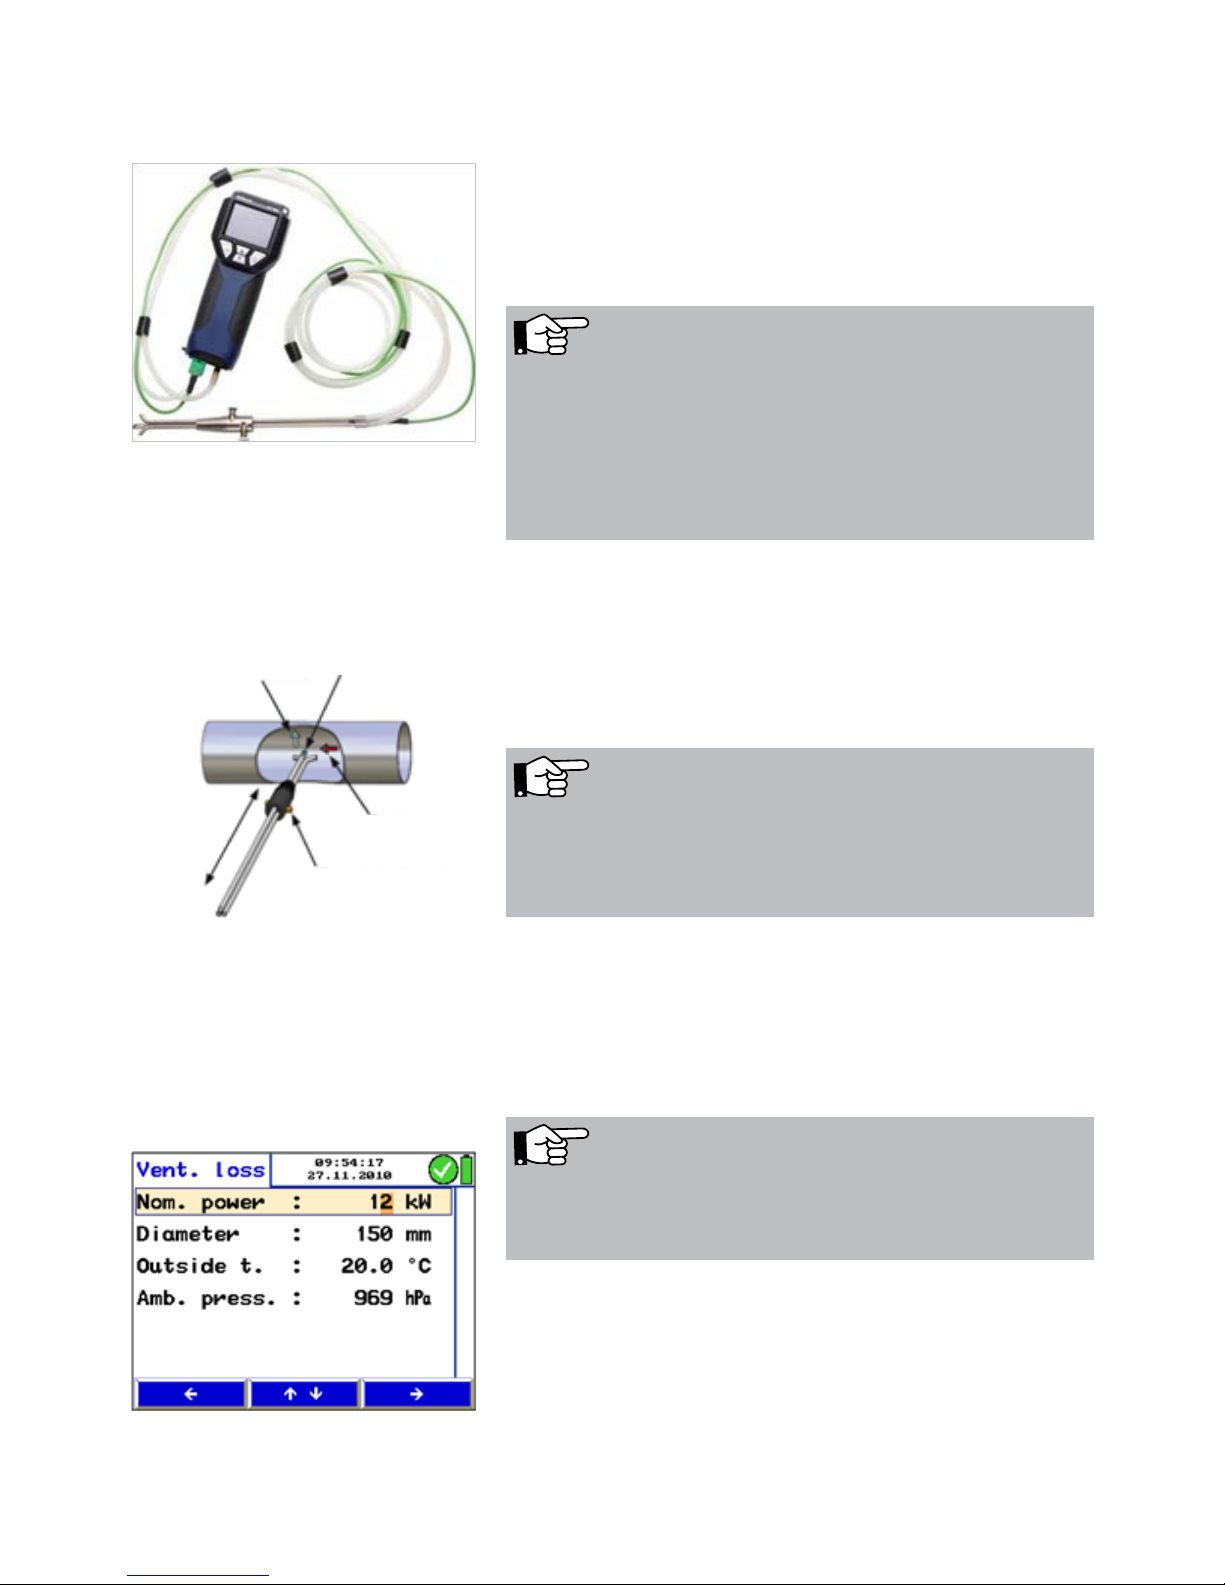
Fig. 46: S-tube probe
NOTE!
A room temperature probe can be connected. Connect the
Special Wall Temperature Probe (see accessories) to jack
12, fig. 1.
If you do not connect any room temperature probe, the temperature measured by the internal probe will be adopted.
• In the submenu "Heating check", select "ventilation loss".
Confirm with OK.
• Enter or control the parameters. (Nominal power, diameter
of the flue gas pipe, outside temperature and ambient pressure).
Press "Procced". A message will appear: "Zeroing pressure
sensor. Remove hoses."
• Confirm with "OK". The pressure sensor will be zeroed. It is
important that the S-tube probe is not connected yet.
NOTE!
If the Lindab PC 410 is equipped with an internal ambient
pressure probe, the meter will determine the ambient pressure automatically.
• Connect the S-tube probe to the Lindab PC 410.
• Insert the closed S-tube through the measurement opening
into the gas line, while the burner is working.
• Fix the S-tube with a cone, open it as shown in Fig. 47 and
direct the sensors as shown in the figure.
• If necessary, adjust the S-tube with the knurled screws, so
that it fits into the gas line.
NOTE!
Do not change the position of the meter after the pressure
sensor has been zeroed. The sensor is extremely sensitive.
Fig. 48: Entering the parameters for the
ventilation loss measurement
Fig. 47: Measuring the air speed with the
S-tube
Static pressure
Temperature
Immersion
depth
Knurled screws
Flow
Page 39
39
q
LS_Norm
=
·
Q
burner
Av · v(t) · ρ
AIR
· cpl · (ϑL(t) — ϑU)
273 + ϑ
outside ACTUAL
273 + ϑ
outside REF
The measurement will be done automatically.
• When the burner is turned off, press "Start" to start the
measurement.
After 30 seconds, the data recording will start automatically. The captured values are shown in the display.
• Press "OK" to capture the calculated ventilation loss.
NOTE!
The S-tube must be adjusted before the measurement procedure starts, since it is required to check and/or adjust the
oppositely running orientation of the measuring tubes after
loosening the knurled screws and adjusting the immersion
depth
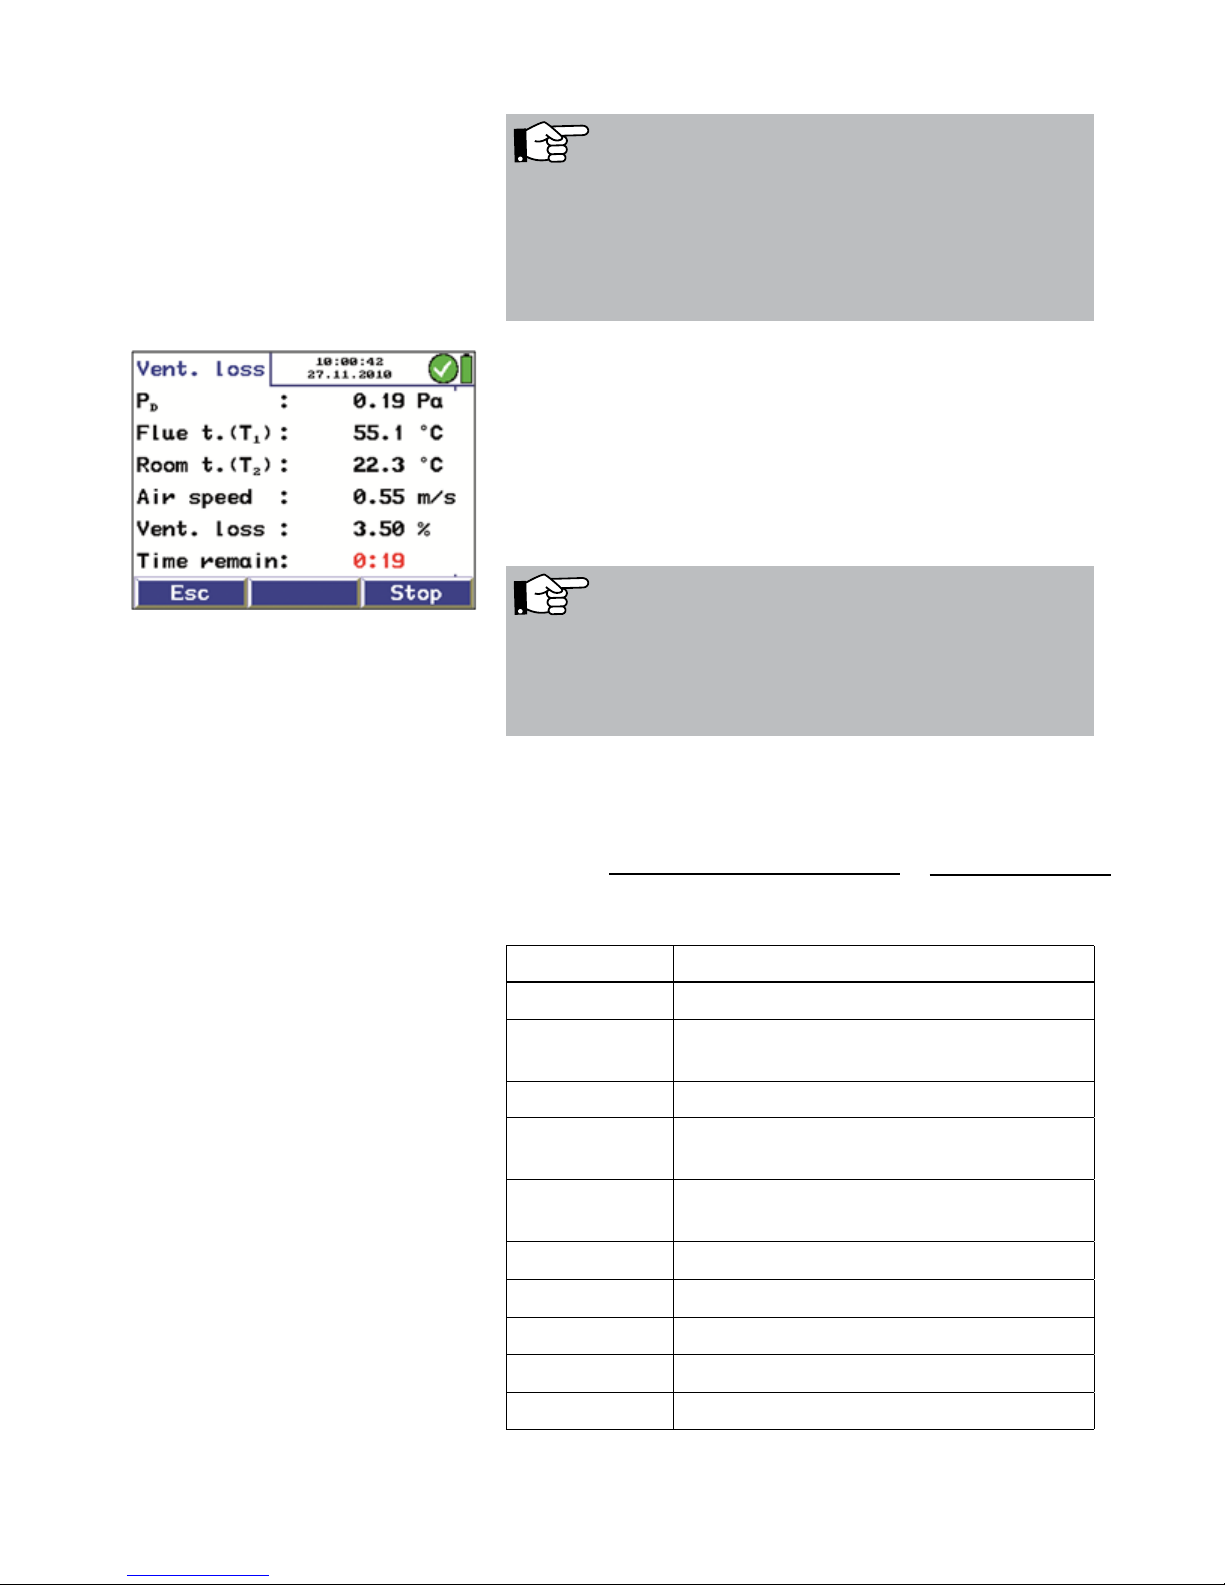
Fig. 49: Measuring the ventilation loss
NOTE!
The wanted signal of the S-tube probe is better than that of
a normal pitot tube, if the flow speed is equal. In the setupmenu the pitot factor 0.93 must be set once.
The measured values are converted according to the following formula:
Description Data
q
LS_Norm
Ventilation loss in %
A
v
Area cross section of the flue gas pipe
in m²
v(t) Air velocity in the flue gas pipe in m/s
r
AIR
air density, temperature compensated,
e.g. 20 °C 1,2 kg/m³
c
pl
specific heat capacity, norm:
0,279 Wh/kg °C
J
L
air temperature in the exhaust stack
J
U
air temperature in ° in the fireplace room
J
outside ACTUAL
Outside temperature, actual value in °C
J
outside REF
Outside reference tem-perature, 15 °C
Q
burner
Nominal power of the heat generator
The conversion rule for the determination of the flue gas loss
is integrated in the meter's program.
Page 40
40
After the measuring of the ventilation loss has been completed, "ventilation loss" will be marked by a tick mark in the
"Heating check" screen.
How to print out a report:
• Select the 'PRINT' option from the main menu.
How TO save the results:
• Select the 'Save' option from the main menu.
Measuring the surface loss The surface loss is the temperature that the burner emits via
the surface.
NOTE!
The Special Wall Temperature Probe is needed to measure
the surface loss (see accessories).
Before measuring the surface loss, it is necessary to enter
certain data. For that purpose all partial areas of the burner
must be considered that do not adjoin directly to other installations and/or walls and floors
Determining Denomination
A partial area = measured
value/manufacturer
information
Partial area in m²
T
S
partial area = measured
value
Temperature of the partial
area in °C
T
R
Room = measured value air temperature in ° in the
fireplace room
a = value determined
according to EN 304
Heat transfer coefficient in
W/m²K
Q
burner
= value indicated in
the instruction plate of the
burner
Nominal power of the heat
generator in kW
Page 41
41
How to measure the surface loss:
• Enter the nominal power of the burner.
• Press "Proceed"
• Enter the surface temperature TS of the single areas and
their dimensions (width x height).
• Measure the average surface temperatures with the Special
Wall Temperature Probe connected to the Lindab PC 410
and accept it by pressing the “Accept” key.
• Proceed the same way for each partial surface.
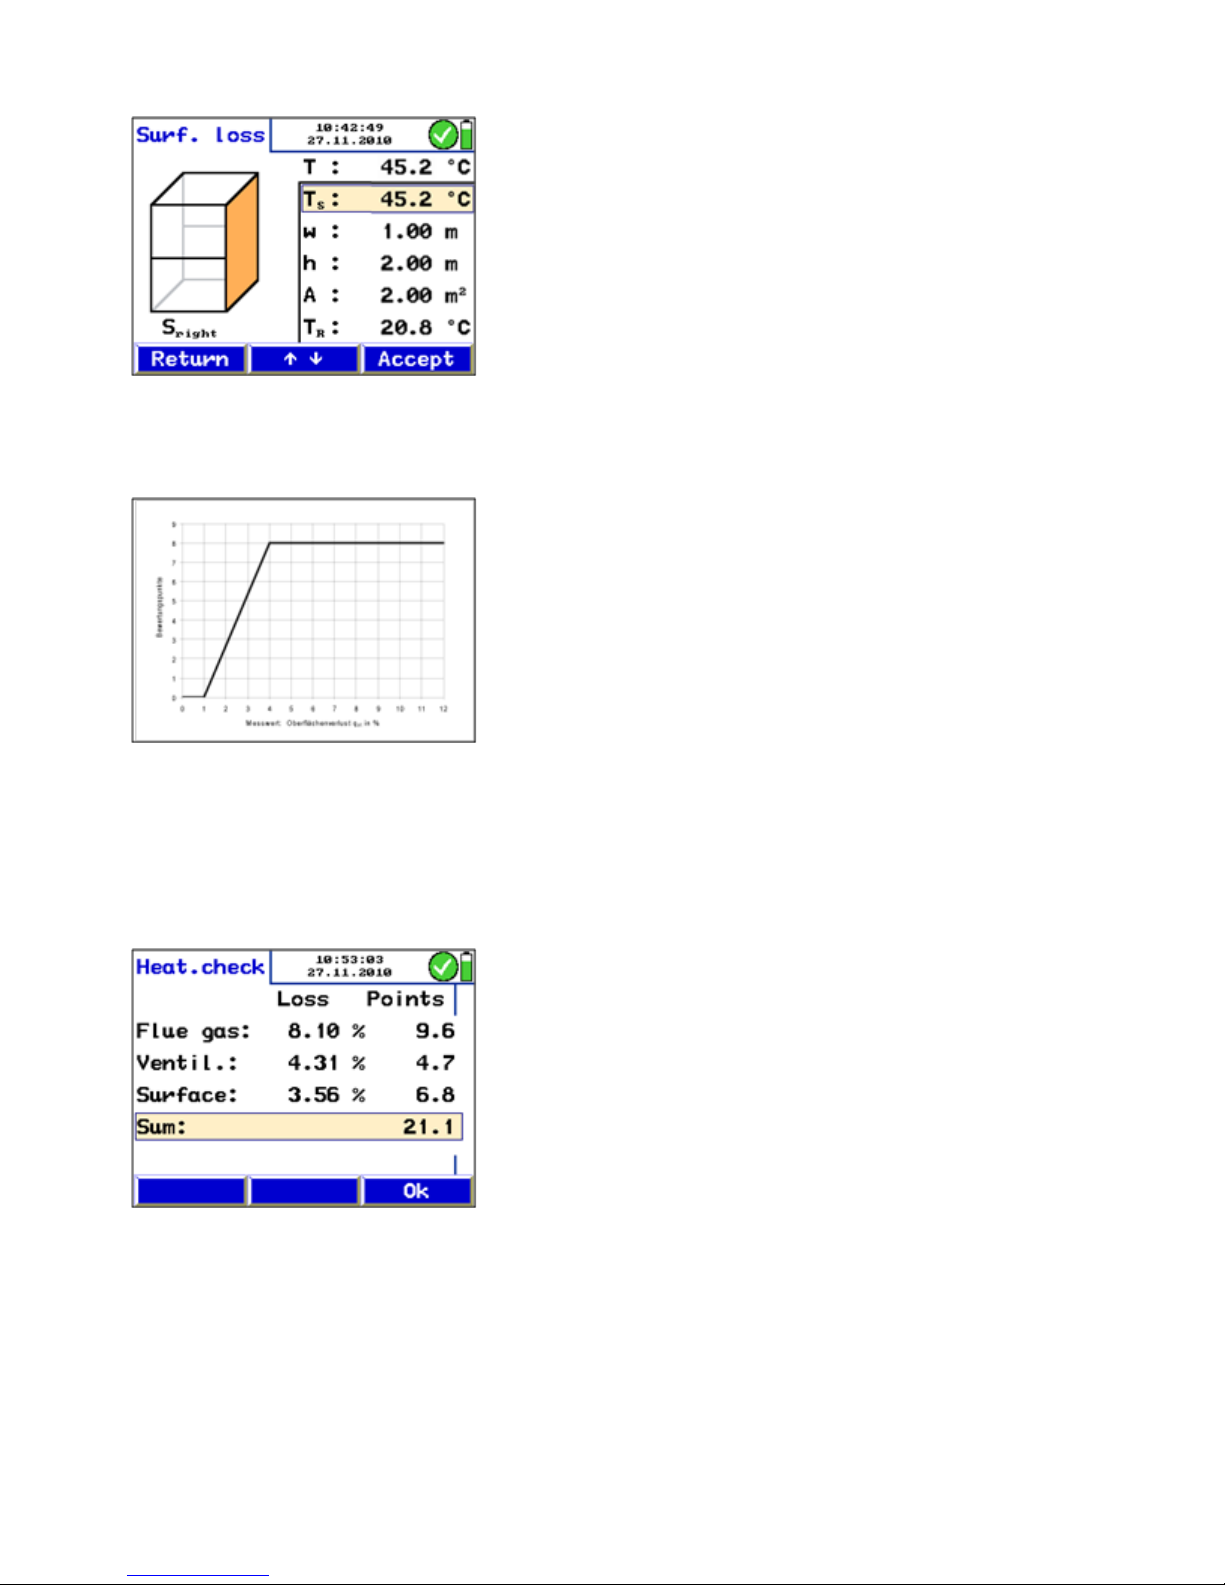
The meter will calculate the surface loss qr (r: radiation).
The surface loss will be referred to the heat emission and
then converted into improvement potential points according to the DIN EN 15378, national appendix. The conversion
into improvement potential points is done according to the
graphic in Fig. 51: Converting the surface loss in potential
improvement points.
After the measurement of the surface loss has been completed, "Surface loss" will be marked by a tick mark in the
"Heating check" screen.
Evaluation The menu item "Evaluation" presents all results and the corre-
sponding improvement potential points according to DIN EN
15378. These have to be registered in the Energy Utilization
Check certificate.
Fig. 51: Converting the surface loss in
potential improvement points
Fig. 52: Evaluation of the heating check
Fig. 50: Measuring the surface loss
Page 42
42
6.8 Option „Volume“ In this submenu, the content of a closed hermetic room is
determined (e.g. tank, bottle or pipe) with a volume up to
6000 l.
NOTE!
For the volume measurement, a a medical sy-ringe (up
to 100 ml), a Wöhler Soot Test Pump, a cross-union and
connection hoses are needed. We recommend the Wöhler
Leakeage Test Set.
Measuring principle of the determination of the volume
After a sample V
sample
has been drawn with the syringe (up
to 100 ml) or the soot test pump, the pressure in the tube
will change. Based on this pressure change, the total volume
V
tube
can be determined.
The Volume V
tube
is determined with the following equation in
accordance with the principle of the Boyle-Mariott's Law:
V
Tube
= V
Sample
·
∆p
P
act
-1
|Temp. = const.
V
tube
Tube volume to be determined, max.
6000 l
V
sample
Volume drawn as a sample
Dp
Maximum pressure difference that results
when the sample is drawn
p
act
ambient pressure, has to be entered in
the setup menu by the user
(Default: 1013 hPa)
The Lindab PC 410 measures the pressure difference ∆p.
For an exact measuring result, the pressure difference ∆p
should at least amount to 200 Pa so that an exact result can
be reached. Therefore, the sample V
sample
that the user draws
with the syringe or the soot test pump should amount to at
least 1/500 of the tube volume (see table).
Guidelines for the selection of the sample volume that has to
be drawn with the soot test pump.
Pump volume Max. tube volume
163 ml
(1 strike with the soot test pump)
80 l
489 ml
(3 strikes with the soot test pump)
240 l
Page 43
43
Performing the test
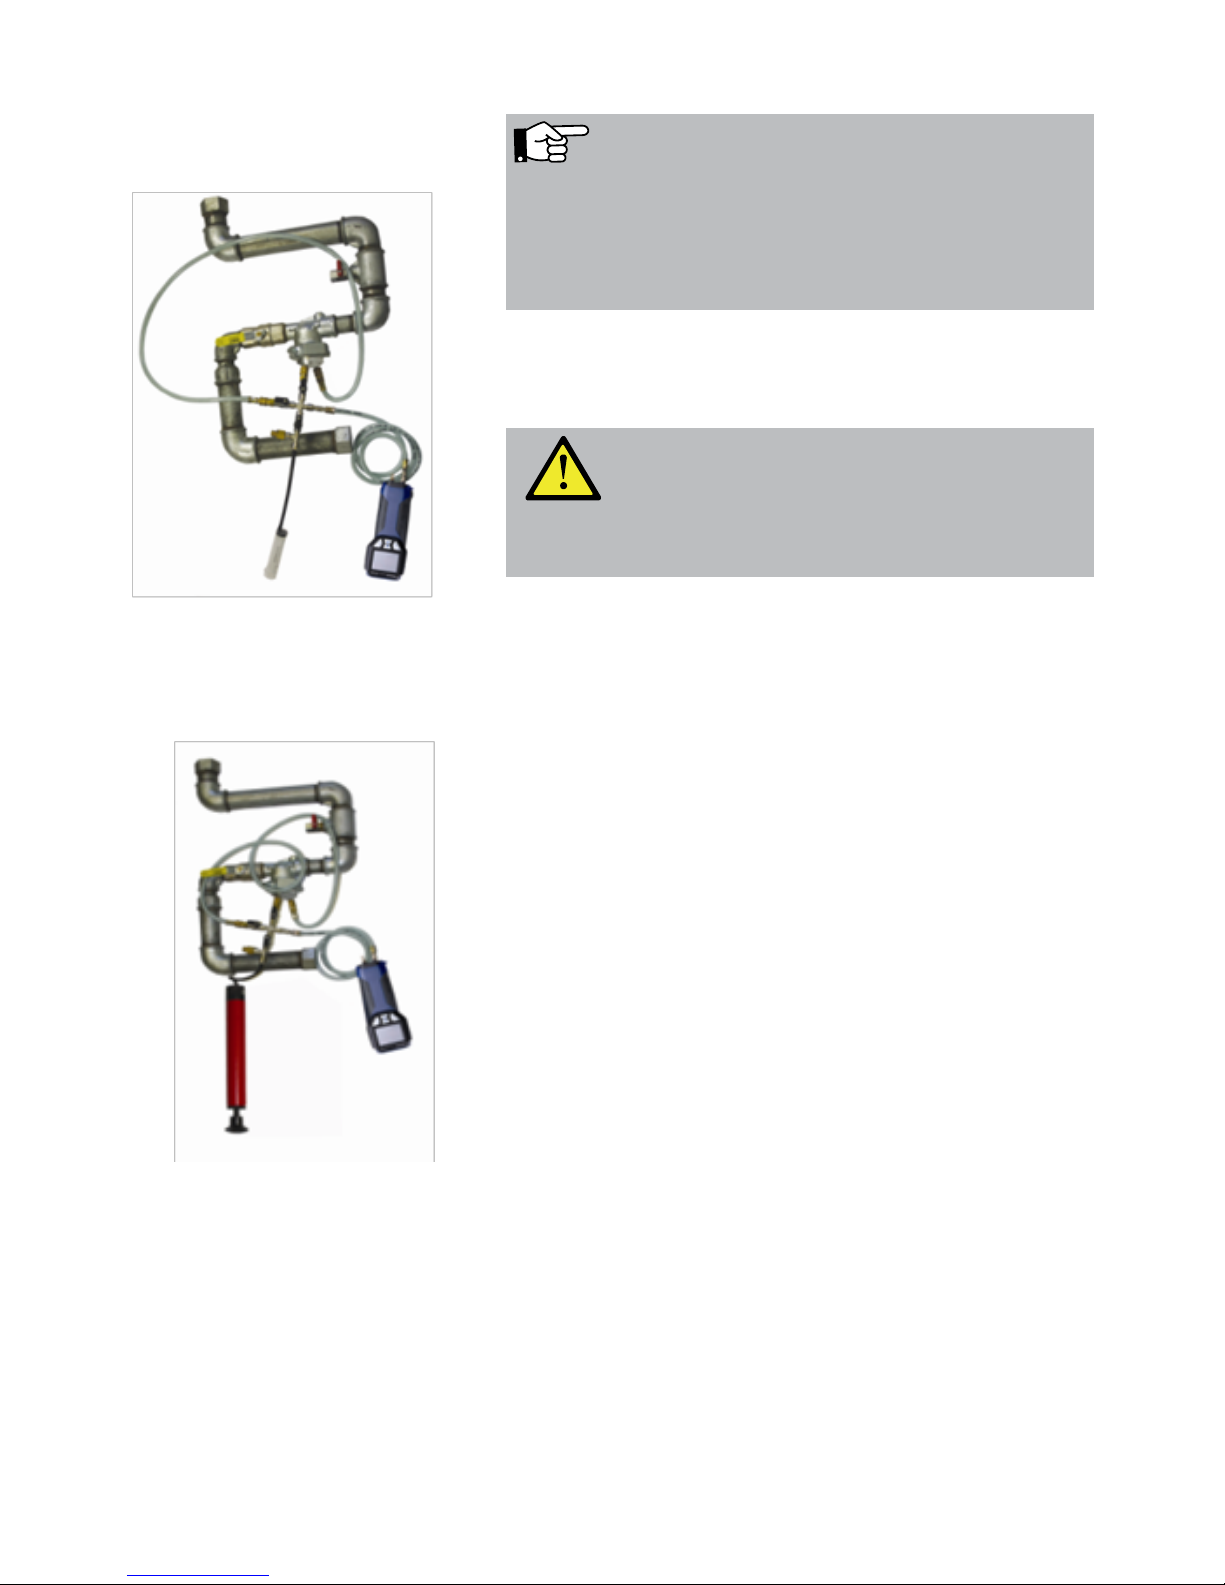
Fig. 53: Volume measurement with the
Lindab PC 410 and a syringe (up to 100
ml tube volume).
NOTE!
If the volume is smaller or equal 100 ml, a sy-ringe has to be
used. If the volume exceeds 100 ml, a Soot Test Pump will
be needed. The vo-lume of the Soot Test Pump is 163 ml
per strike.
• Close the gas line and seal it with a suitable test plug.
• Switch the Lindab PC 410 on before connect-ing the over-
pressure socket (+) via a hose to the test plug.
• Connect the soot test pump or the syringe with a second
hose and the cross piece.
• Go to the main menu, select "Volume" and confirm with
OK.
• Enter the test volume into the meter according to the
sample volume that has to be drawn with the soot test
pump or the syringe, e.g. 163 ml, that is one strike with the
soot test pump.
WARNING!
Please observe the valid accident prevention regulations!
Fig. 54: Volume measurement with the
Lindab PC 410 and a syringe (up to 100
ml tube volume).
Page 44
44
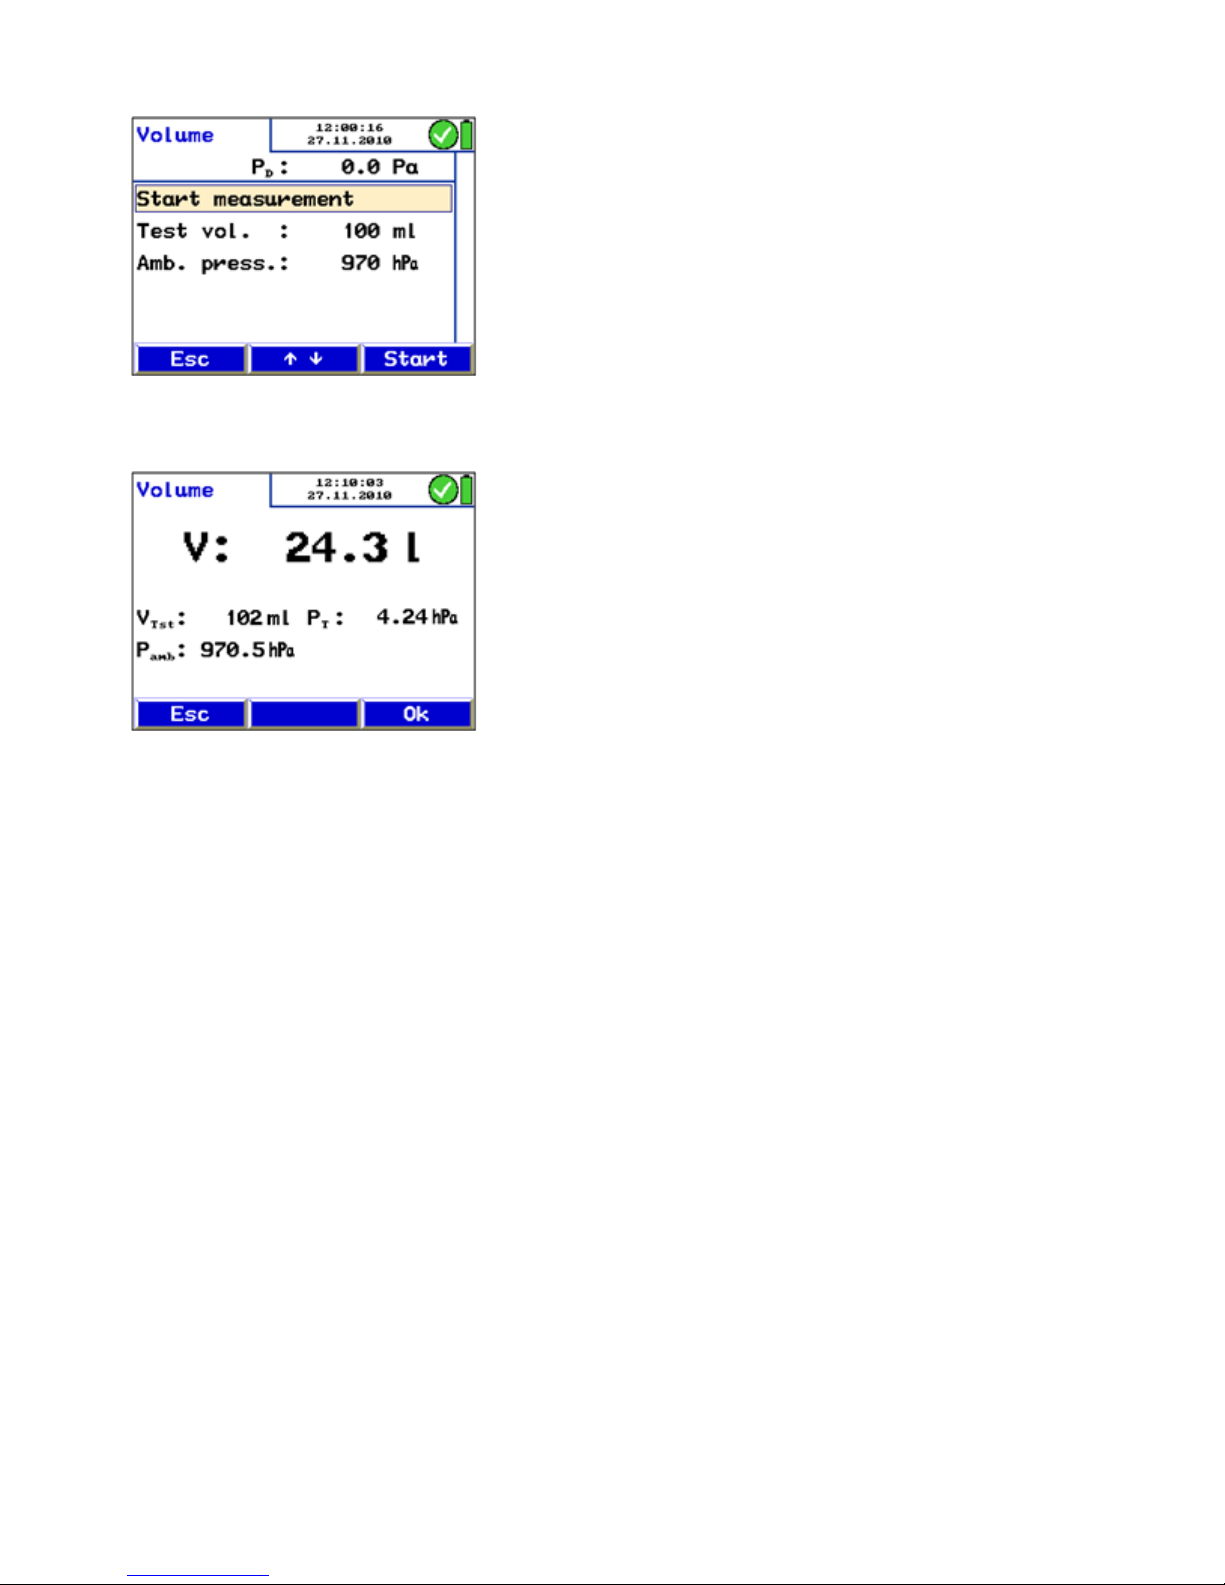
Fig. 55: Presettings (Volume test)
Fig. 56: Volume test result
• Press "Start".
In the display the request to add/remove the sample volume
will appear.
• Take the sample volume with the syringe or the soot test
pump.
• When the value V keeps stable, press "OK to save the
data.
In the main menu a tick mark beside "Volume" will indicate
that the volume test already has been done.
V
TST
= Volume
Test
PT = Pressure
Tube
P
amb
= Ambient Pressure
Page 45
45
6.9 Option “U-value” The heat transfer coefficient (U value) describes the heat flow
W/m²k that flows through a building element.
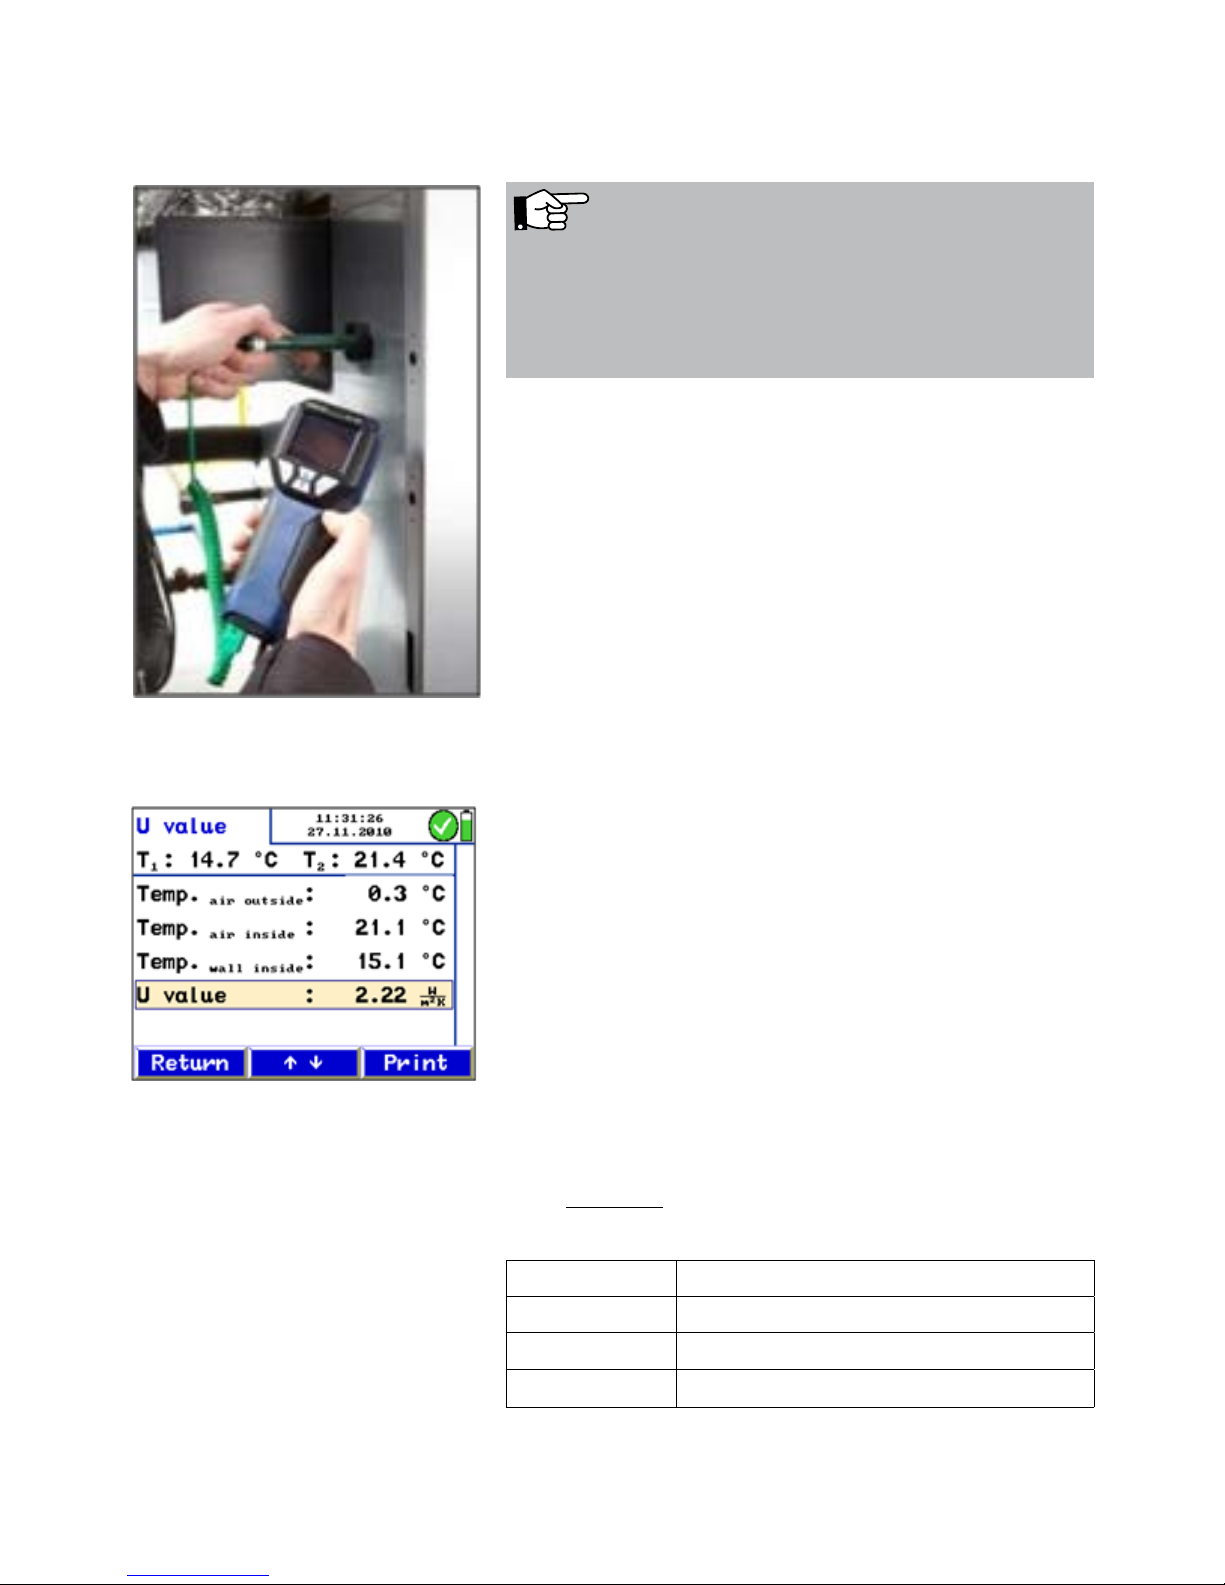
Fig. 57: Application example with Special
Wall Temperature Probe
Fig. 58: Display during the measurement
of the U value
NOTE!
A Special Wall Temperature Probe is needed to measure the
heat transfer coefficient (see accessories). All temperatures
(also the inside air temperature tai and the outside air temperature tao should be measured with the same sensor.
The temperature values measured by the Lindab PC 410 and
the Special Wall Temperature Probe are necessary for the
determination of the heat transfer coefficient. The u-value is
determined with the following equation according to the DIN
standard 4108.
αi · [tLi – tWi]
[t
Li
– tLa]
U
ist
=
U
current
U-value in W/(m²k), current value
t
AI
interior air temperature
t
WI
interior wall temperature
a
i
fix value, 7,69 W/(m²k)
All temperatures (also the interior air temperature tai and
the outside air temperature t
ao
should be measured with the
same sensor.
Page 46
46
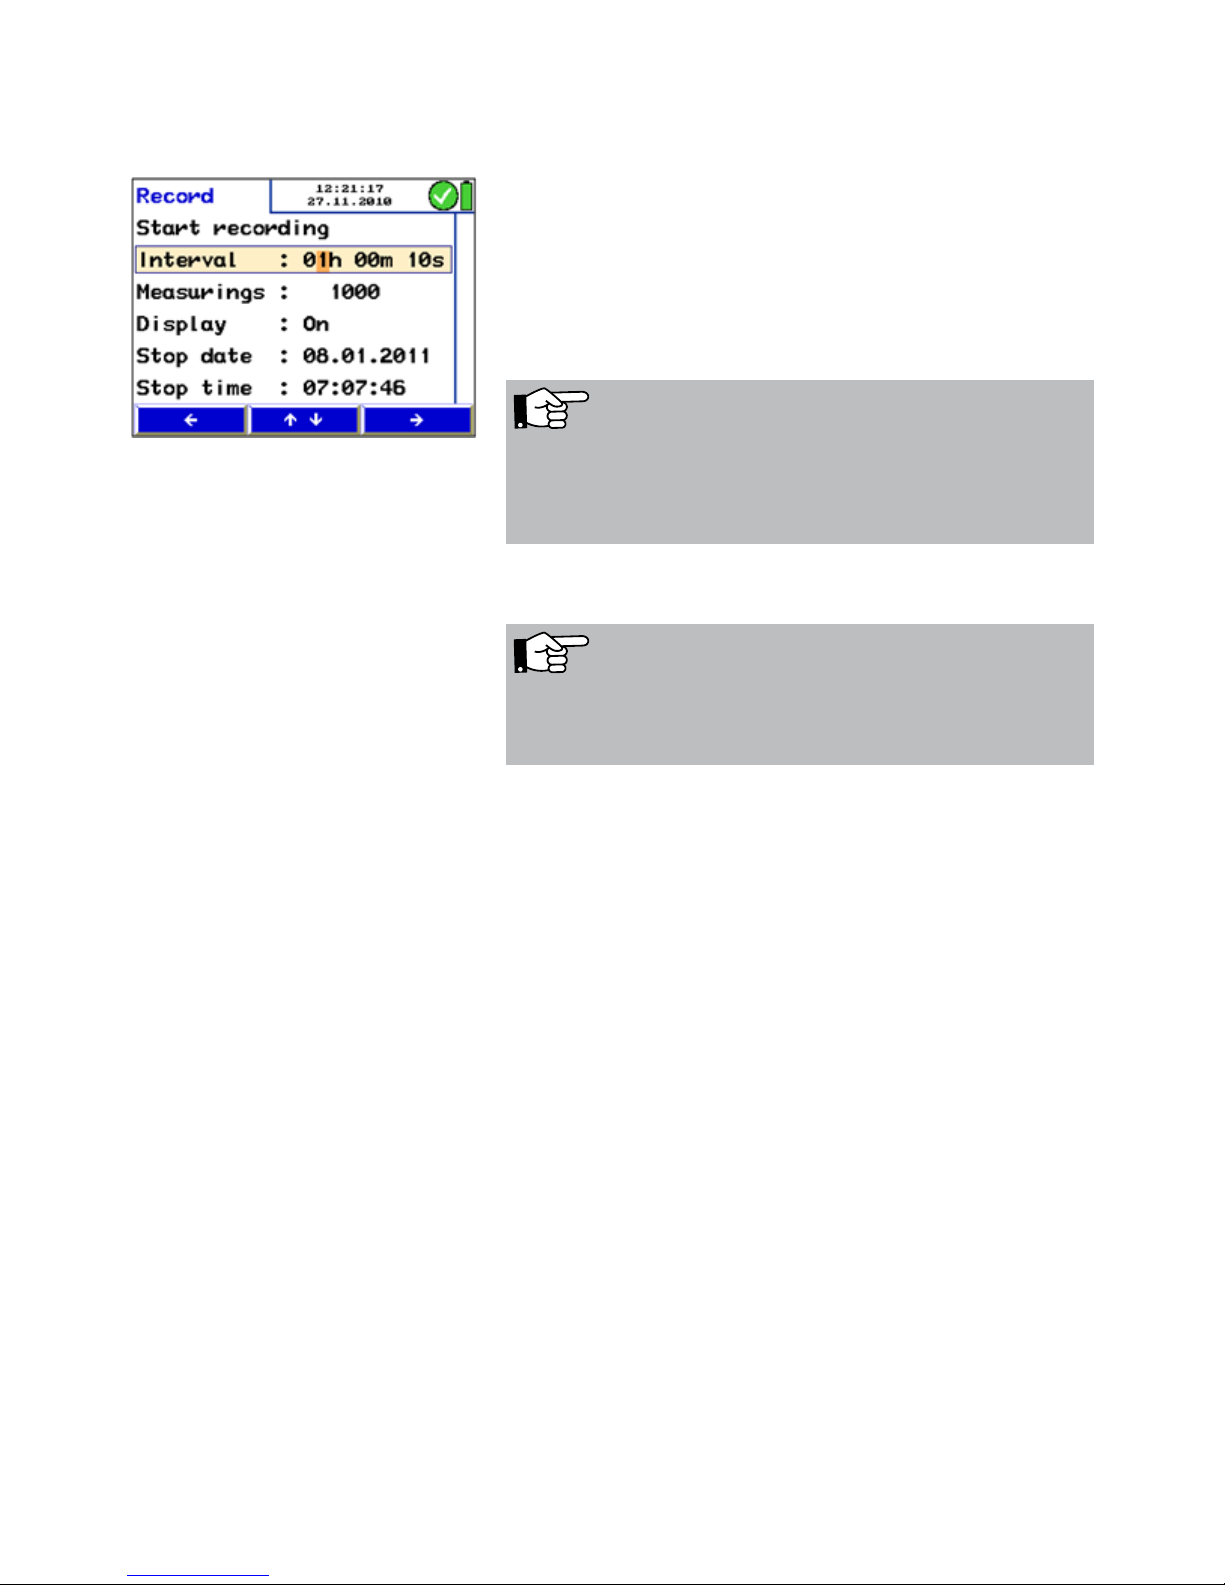
6.10 Option “Graph / Record” The "graph / record" mode is used to start a permanent data
recording. A graph of the records will appear on screen.
The user can modify the log interval, the number of measurements, the stop date and the stop time as follows:
• • Go to the next digit by pressing the left-/right-key
and increase or reduce the value by pressing the up- and
down-keys.
The display can be switched off during the data recording.
Fig. 59: Submenu Logging
NOTE!
The display only will switch off between the measuring
cycles, if a record interval of at least 20 seconds has been
set.
• Select "Start recording" and press "Start"
A graph which presents the measured values appears in the
display.
• Press "Stop" to save the logged data.
• Press "Print" to print a graph.
• Press "Proceed". The request " Accept measurements?"
will appear in the display.
• Press "No" to return to the main menu without saving the
measured values. In this case there will be no tick mark
beside the menu "Graph / logging".
• Press "Yes" to return to the main menu after saving
the measured values. Beside the menu "Graph / Logging" there will appear a tick mark that indicates that the
recorded data have been saved.
After the logging process has stopped select the 'save measurements' option in the main menu screen to save the logged
data as a customer record.
After the logging process has stopped select the 'save measurements' option in the main menu screen to save the logged
data as a customer record.
The data can be transfered to the PC with the Lindab Software PC 410 (see accessories).
NOTE!
Ensure that the meter is connected to the power supply or
that the batteries are charged.
Page 47
47
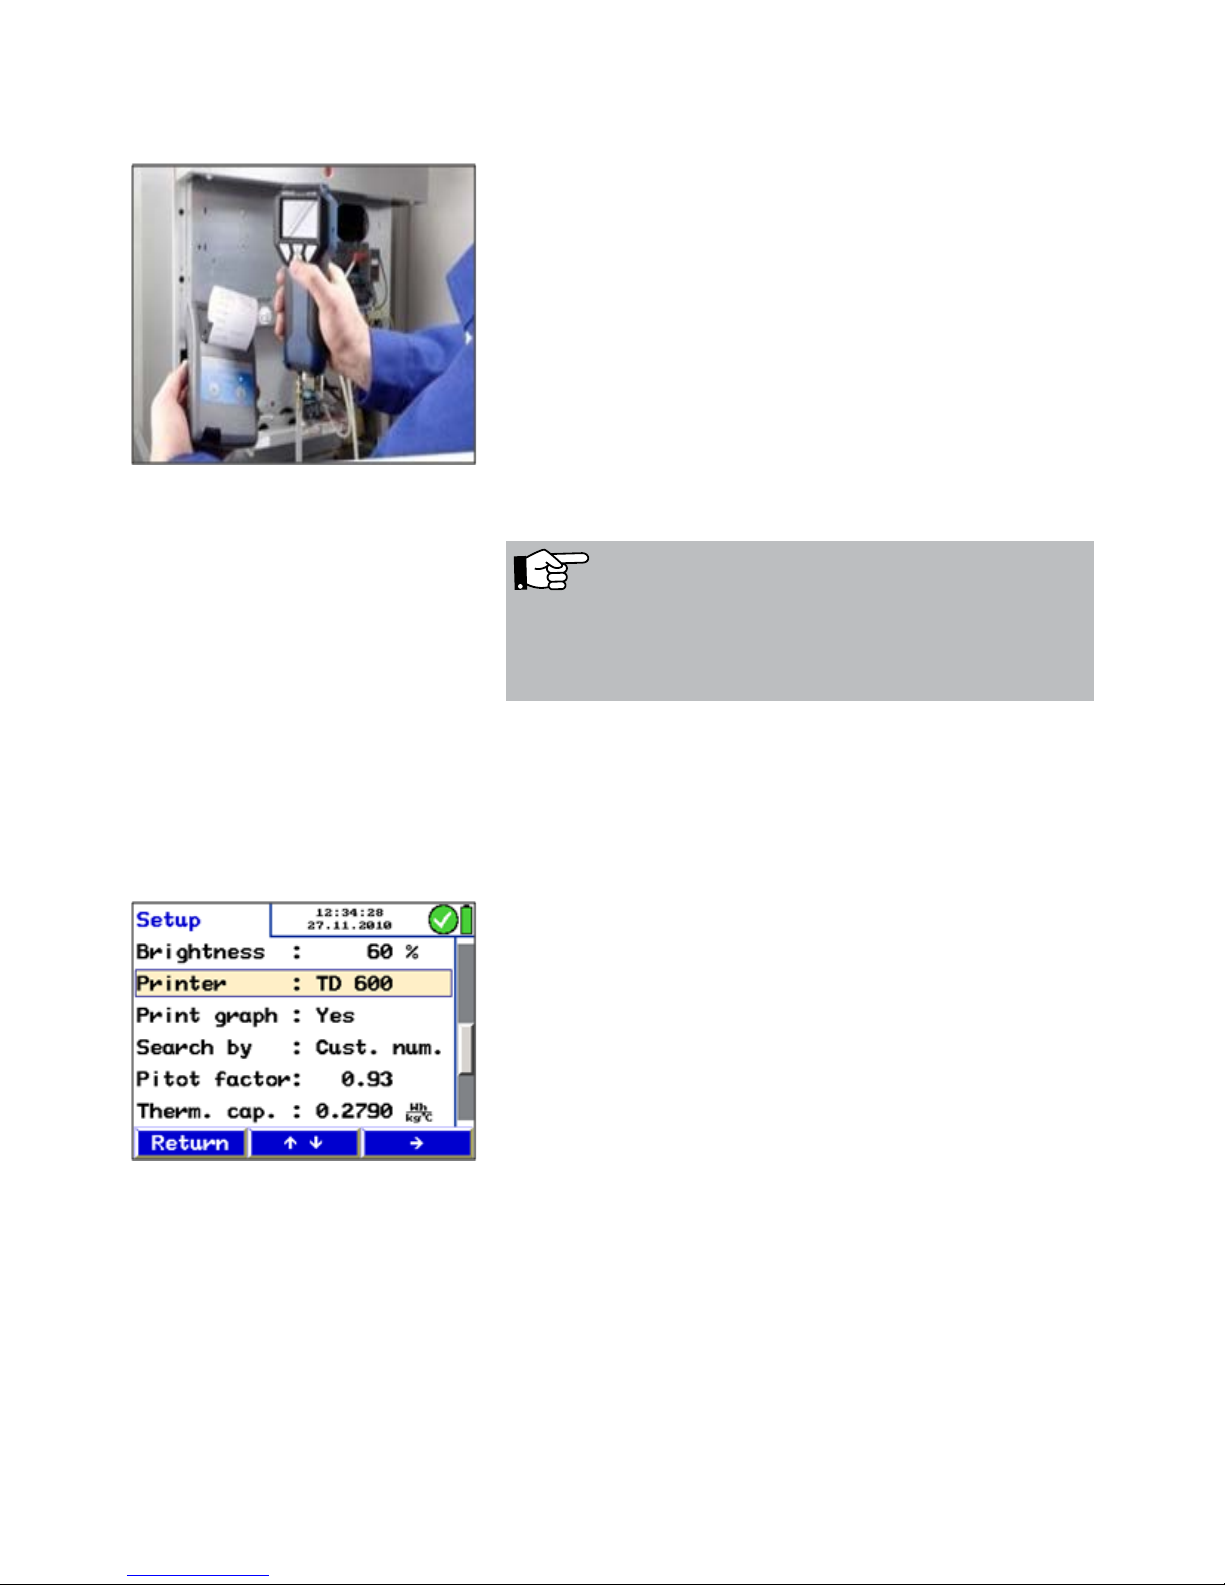
6.11 Option „Print“ In the main menu, select "PRINT" to start a data printout of all
measured values.
First, a print preview will appear on screen. In the Setupmenu,
the user can select between printing with the thermal fast
printer TD 600 or another printer.
The menu options in the preview screen are:
• Option "ESC" (left key): Click the left key to exit and return
to the main menu screen.
• Option „“ (center keys): Click either up or down key to
scroll up or down in the preview. Keep the key pressed to
scroll various lines.
• Option "Print" (right key): Click the right key to start the
print out.
Fig. 60: Transmission of data records from
the PC 410 to the thermal fast printer TD
600.
NOTE!
The menu item "Print" can only be selected, when measured values have been accepted and a submenu is marked
with a tick mark.
When printing is in progress, a status bar will display the current process state. Press "ESC" to stop the printout.
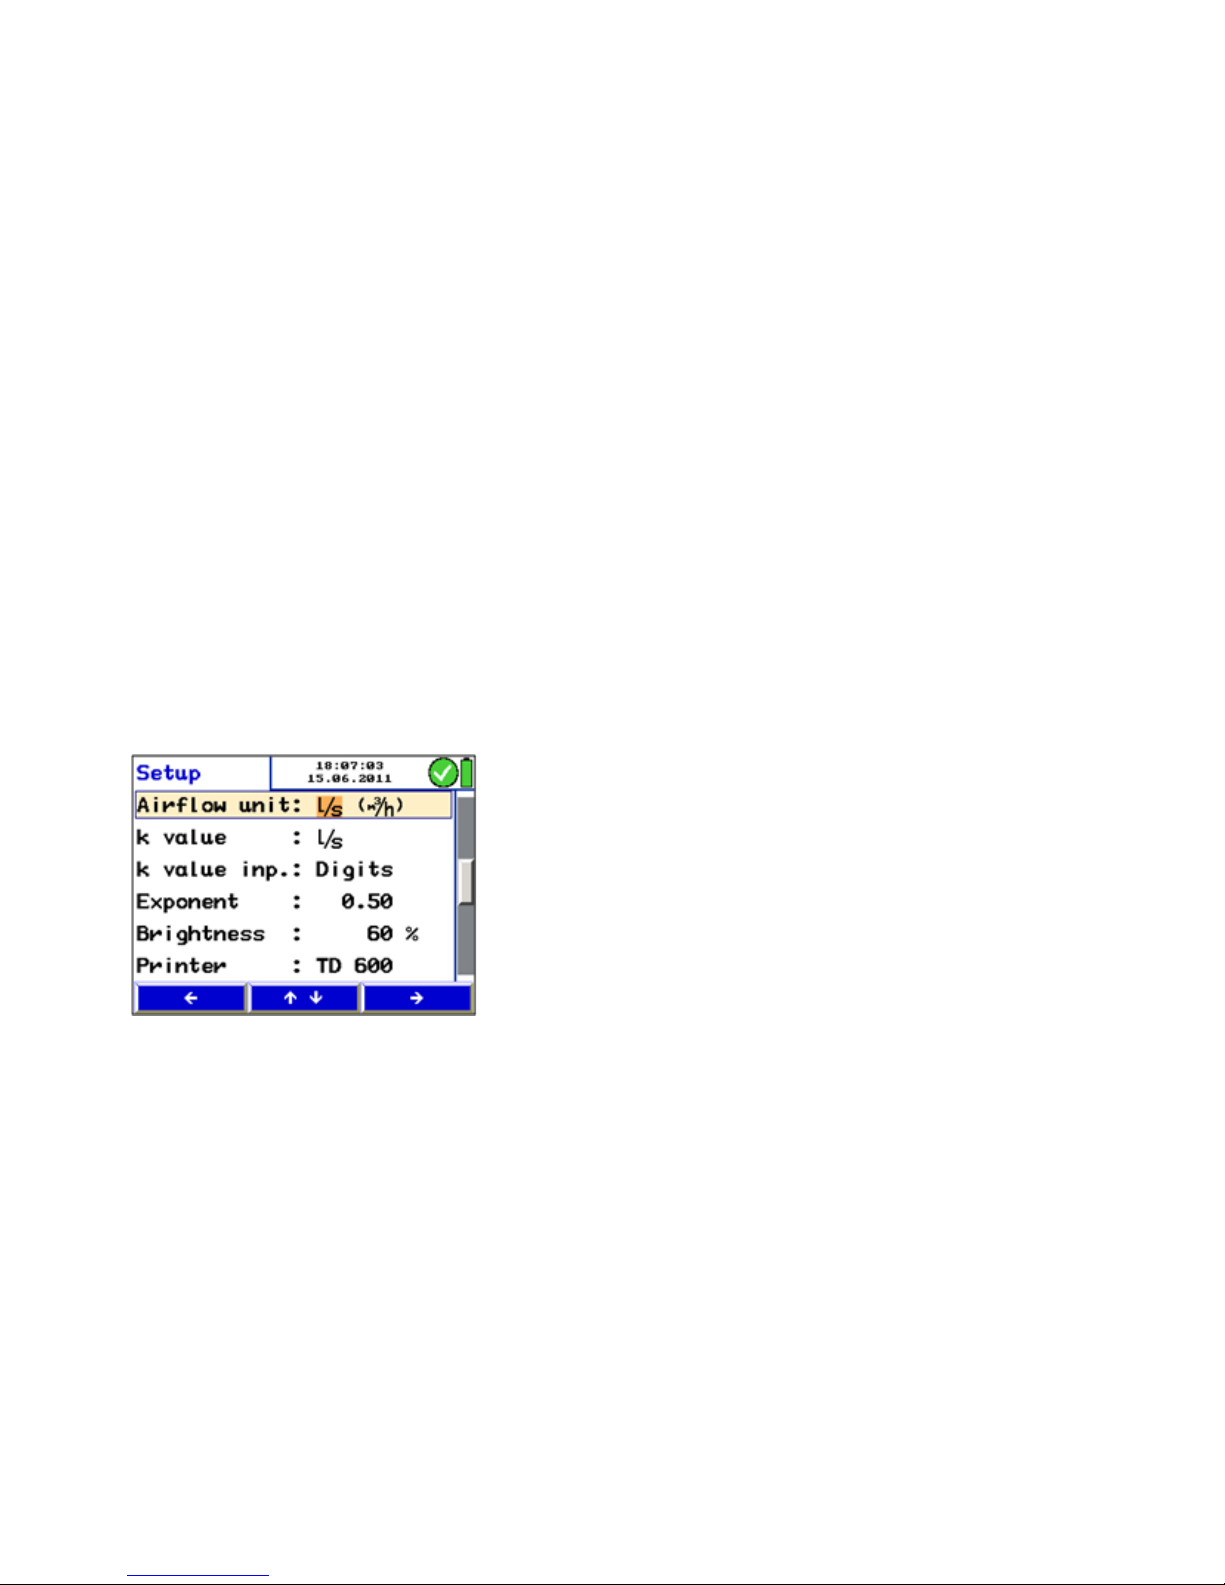
6.12 Option "Setup" Select the option "Setup" to enter the main setup menu.
• Use the arrow keys to select and change the parameters.
The parameter that can be changed appears in red.
• Press "Return" to return to the main menu without saving
the modification or press the right arrow key to confirm the
modification.
Fig. 61: Option "SETUP"
Option "Time" Change the current time of the internal clock (format 00:00)
Option "Date" Change the current date of the internal calendar (format
01.01.2011)
Option "Ambient Pressure" It is not necessary to enter an ambient pressure value,
because the meter is provided with an ambient pressure
probe (only version AF).
Page 48
48
Air density Standard air density in kg/m3. This value will be consid-
ered for all calculations, if no external temperature probe is
connected. When a temperature probe is connected, the air
density will be calculated automatically.
Pressure unit Select the pressure unit hPa, Pa, mm/H2O, PSI, inwc, bar or
mbar. The preselected unit is hPa.
Pressure measurement Select “fine pressure measurement” (1 reading per second,
the attenuation is adjustable) "normal pressure measurement"
(1 reading per second) and "fast pressure measurement" (4
readings per second).
When measuring the pressure and the flow the user can
select “fine”, so that the resolution will be 0,01 PA (range: ±
100 Pa).
Attenuation If the user increases the attenuation, the signal that repre-
sents the measured value will be more stable. At the same
time the readings display will become slower. The PC 410 will
only consider the attenuation, if “fine pressure measurement”
is selected in the setup-menu. (Setup>attenuation>fine pressure measurement.
Temperature unit Select the temperature unit °C or °F.
Air flow unit Select between l/s, m3/h, m3/s and cfm. The air flow value
will be indicated in the center of the display in the unit that is
selected first (here: l/s) and below, smaller, in the unit that is
selected afterwards (here: m3/h).
Fig. 62: Selecting the airflow unit
K-value Depending on the manufacturer of the measurement equip-
ment, the user can choose between different formula for the
determination of the volume flow (see chapter 6.2.1).
K Value Input Select between "Digits" (the user selects the digits that he
wants to change) and "Fast" (the user changes the k-value by
selecting it and simply pressing the up or down keys)
Exponent Here the exponent of the formula of chapter 6.2 (Air flow (k
value)) is entered. Per default the exponent is 0.50. The exponent can be risen from 0.50 to 1.00. It will only be necessary
to change the exponent, if another exponent is specified in
the data sheet of the air vent.
Brightness Adjust the brightness of the display from 20 % to 90 %.
Printer Here the user can select between printing with the thermal
fast printer TD 600 or another printer.
Page 49

49
Print graph Option "Yes": A graph will be printed with the diagram.
Option "No": No graph will be printed. The preselected option
is "Yes".
Search by Select between "customer name" and "customer number".
Depending on this selection, the name or the number of the
customer can be selected in the customer menu.
Pitot factor The pitot factor is important for the measurement of the flow
speed. It depends on the cross section of the utilized s-tube.
The pitot factor of the Wöhler S-tube probe is 0.93. Therefore
the preselected value is 0.93.
If a “normal” S-tube is connected, the pitot factor 1.0 has to
be entered.
Thermal capacity The default setting of the specific heat capacity is 0,2790
Wh/kg °C. The value is important for the measurement of the
ventilation loss (heating check)
Reference temperature The reference temperature can be adjusted from - 30 °C to +
70 °C.
Alpha Heat transmission coefficient for the u-value measurement
Language Depending on the version, the languages English, German or
other languages can be selected.
Printer logo Enter a custom corporate logo (6 lines) that will appear in
every printout.
Default Reset the PC 410 to its factory default setting (except the
calibration).
6.13 Option "Save measurements" To save all records which are marked by a tick mark in the
main menu, select the "Save measurement" option.
Page 50
50
7. Option 'Data management'
When working with the Lindab PC 410 it is possible to save and manage customized data which can
be assigned to different ducts. The user can create a folder for every customer and assign up to 128
ducts to each one.
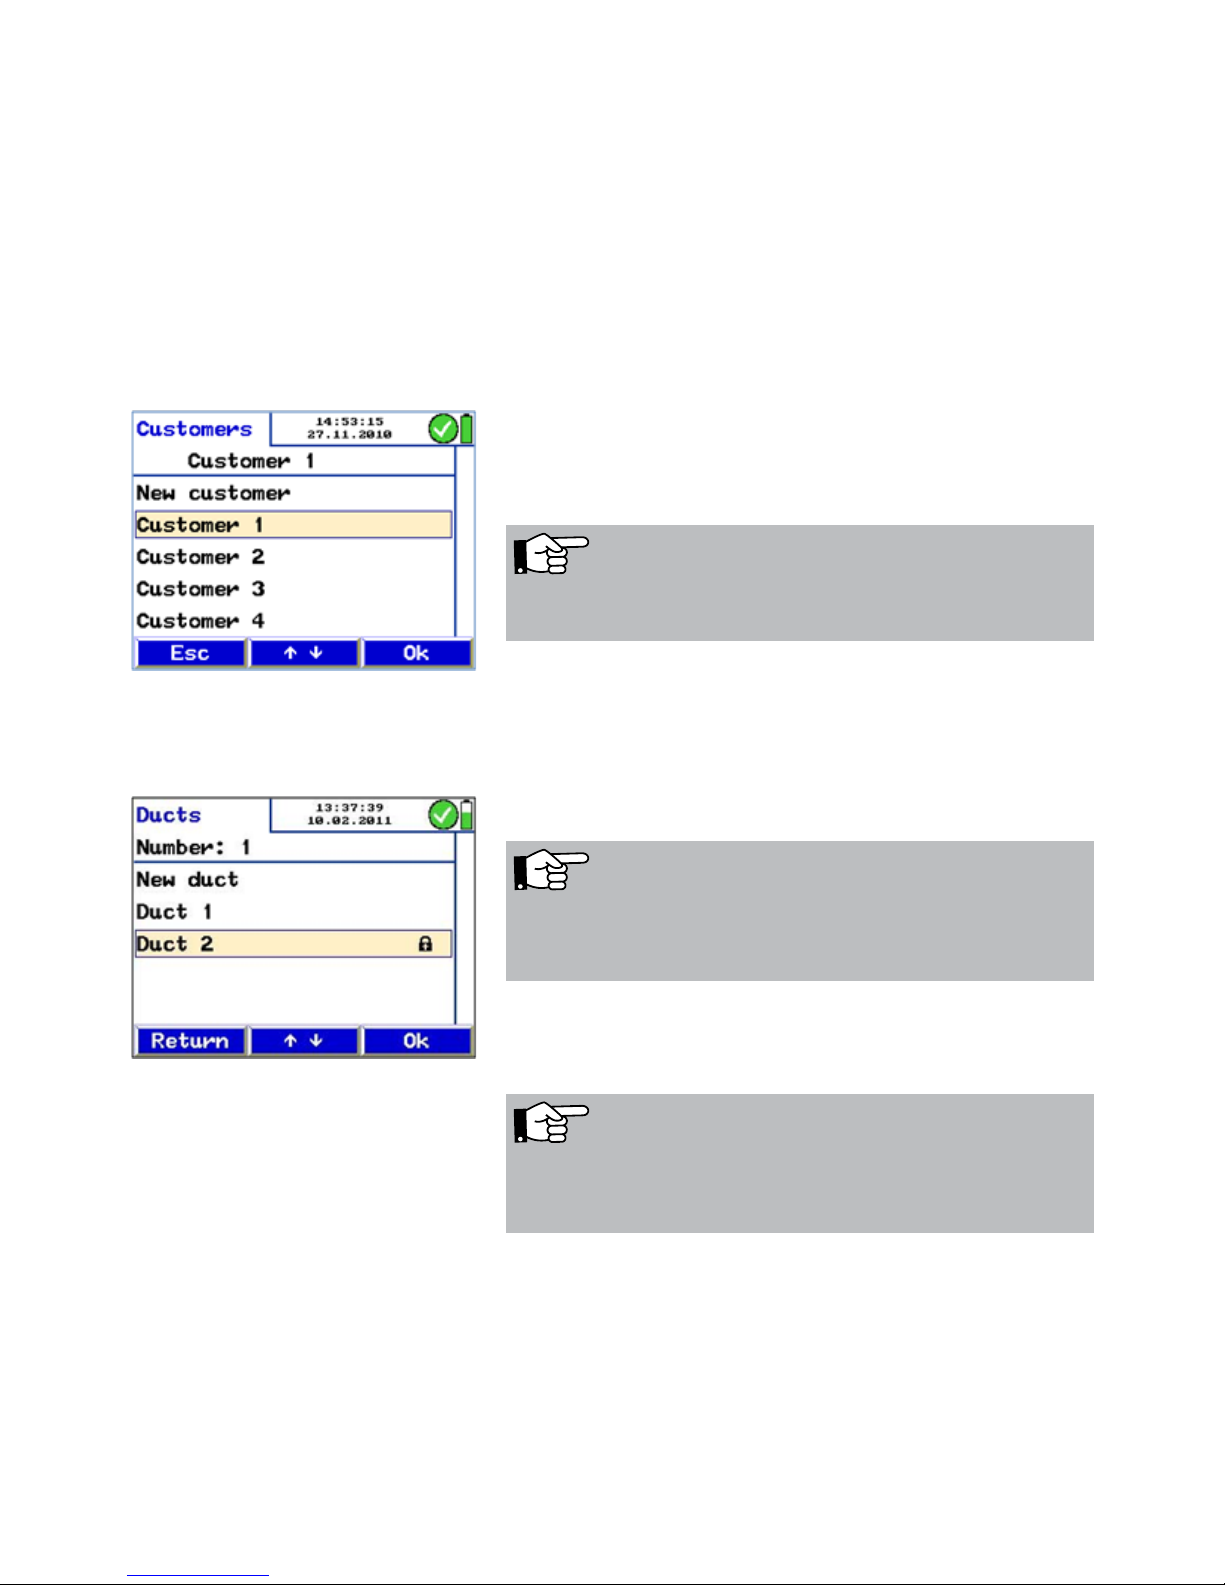
7.1.1 Save Customer Records When different measurements have been per-formed at one
installation, they can be assigned to a customer as follows:
• Select the 'Save measurements' option from the main
menu.
• Use the up- and down keys to navigate through the menu.
If there exists no folder of the costumer, whose data shall
be saved, it can be created in the "new customer" menu
(see chapter 7.1.2).
Fig. 63: Customer selection
Fig. 64: Duct selection
NOTE!
Keep the up or down key depressed to scroll faster.
• Confirm with "OK".
The duct list will appear. Select "New duct" to assign a new
duct to this client.
• Confirm with "OK".
NOTE!
The records marked with a tick mark in the main menu are
saved.
After the records have been successfully saved, a lock will
appear instead of the tick mark.
NOTE!
During the saving process, the data that has al-ready been
saved before under this duct, will be deleted.
Page 51
51
How to add measurement data to the data that has already
been saved under a duct:
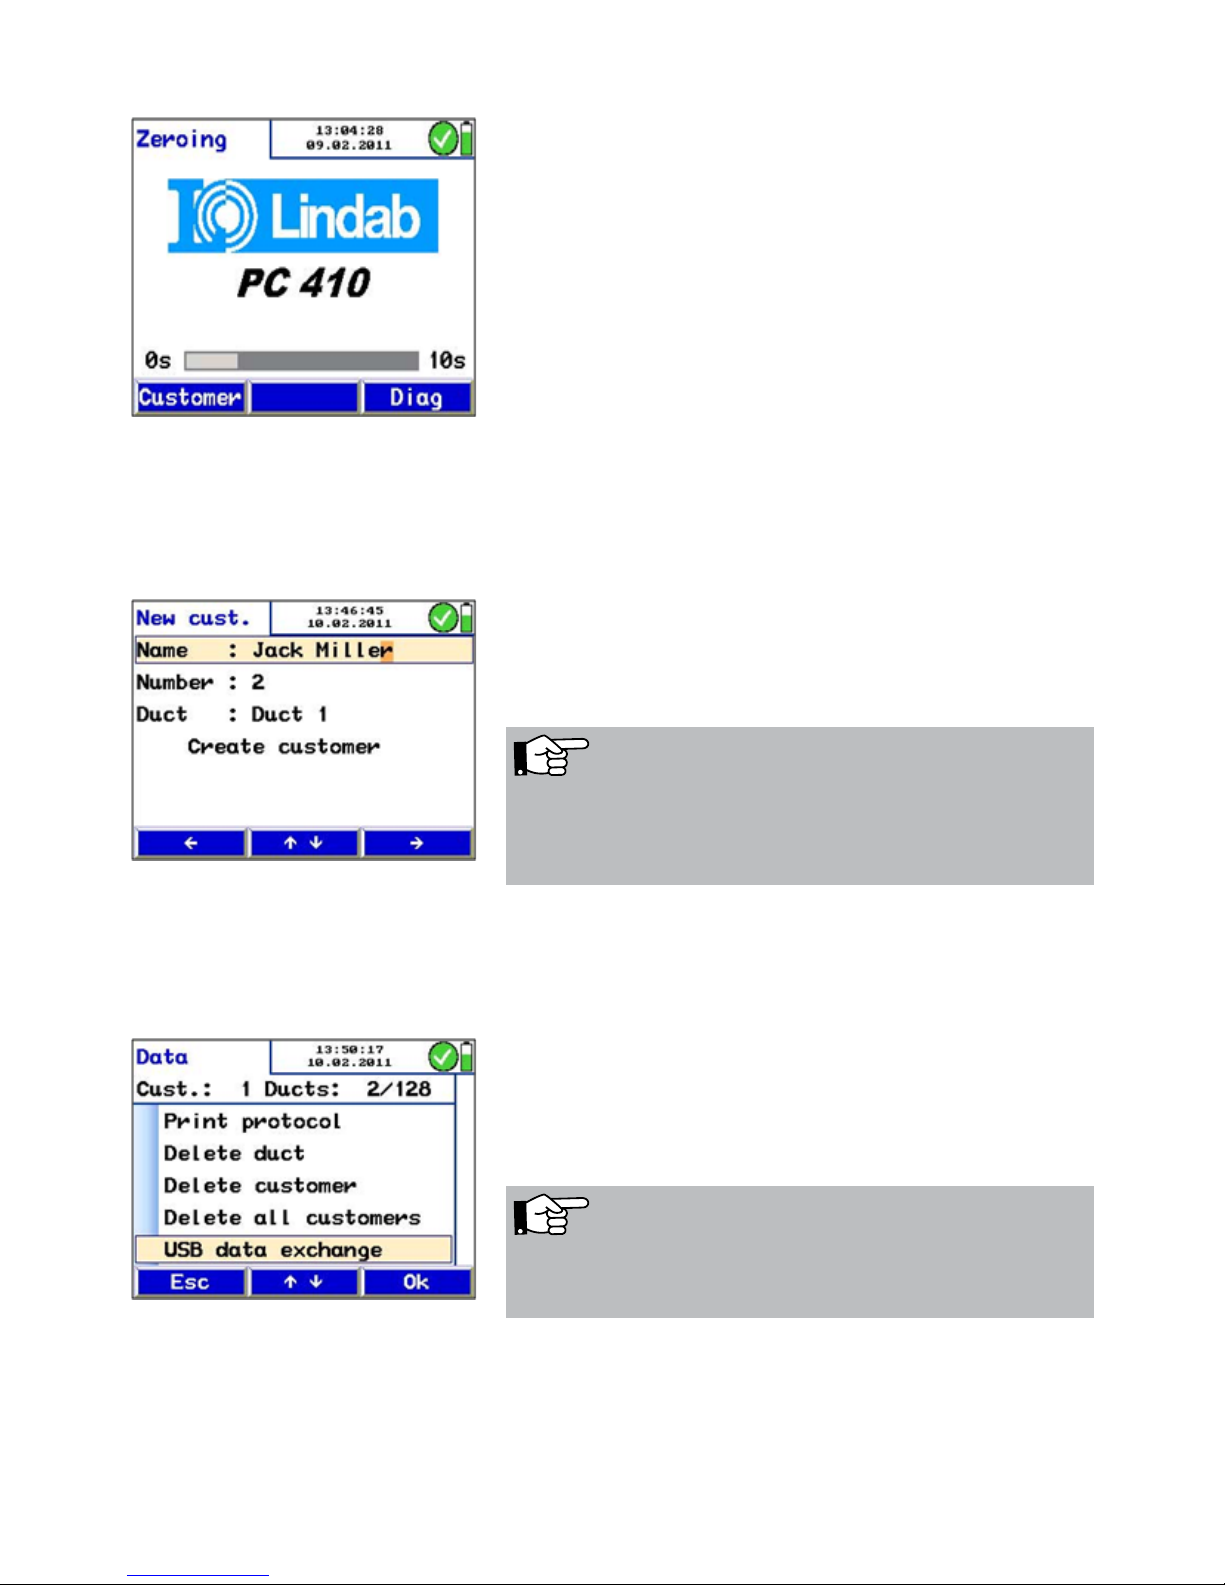
• Press "Customer" directly after switching on the meter,
during the zeroing-phase. Then select the duct, where you
want to add the new data.
In the main menu, the saved data will be marked by a lock
and the new measurements that have not been saved yet, will
be marked by a tick mark.
Save the data as described.
7.1.2 Creating a New Cus-tomer Folder
The user can create new customer folders or new ducts in the
customer menu (see Fehler! Ver-weisquelle konnte nicht
gefunden werden.) or when saving the data. Enter the name,
a customer number and the name of the duct.
Fig. 65: customer option
Fig. 66: Creating a new customer folder
NOTE!
The user can save all together 128 ducts in the meter and
assign them to different customers. The number of ducts
assigned to a customer is arbitrary.
7.2 Option "Data management" In the "Data management" display, the current number of
customer folders and ducts is indi-cated.
Select "Print protocol" to print a report of any saved measurement.
Select "Delete duct" to delete a single duct.
Fig. 67: USB data transfer
Select "Delete customer" to delete the complete customer
folder with all ducts.
Select "Delete all customers" to delete all customer folders.
Select "USB data exchange" to communicate with the computer, see chapter 7.3.
NOTE!
When there is only one duct saved in a customer folder, the
customer folder will be deleted when the duct is deleted.
Page 52
52
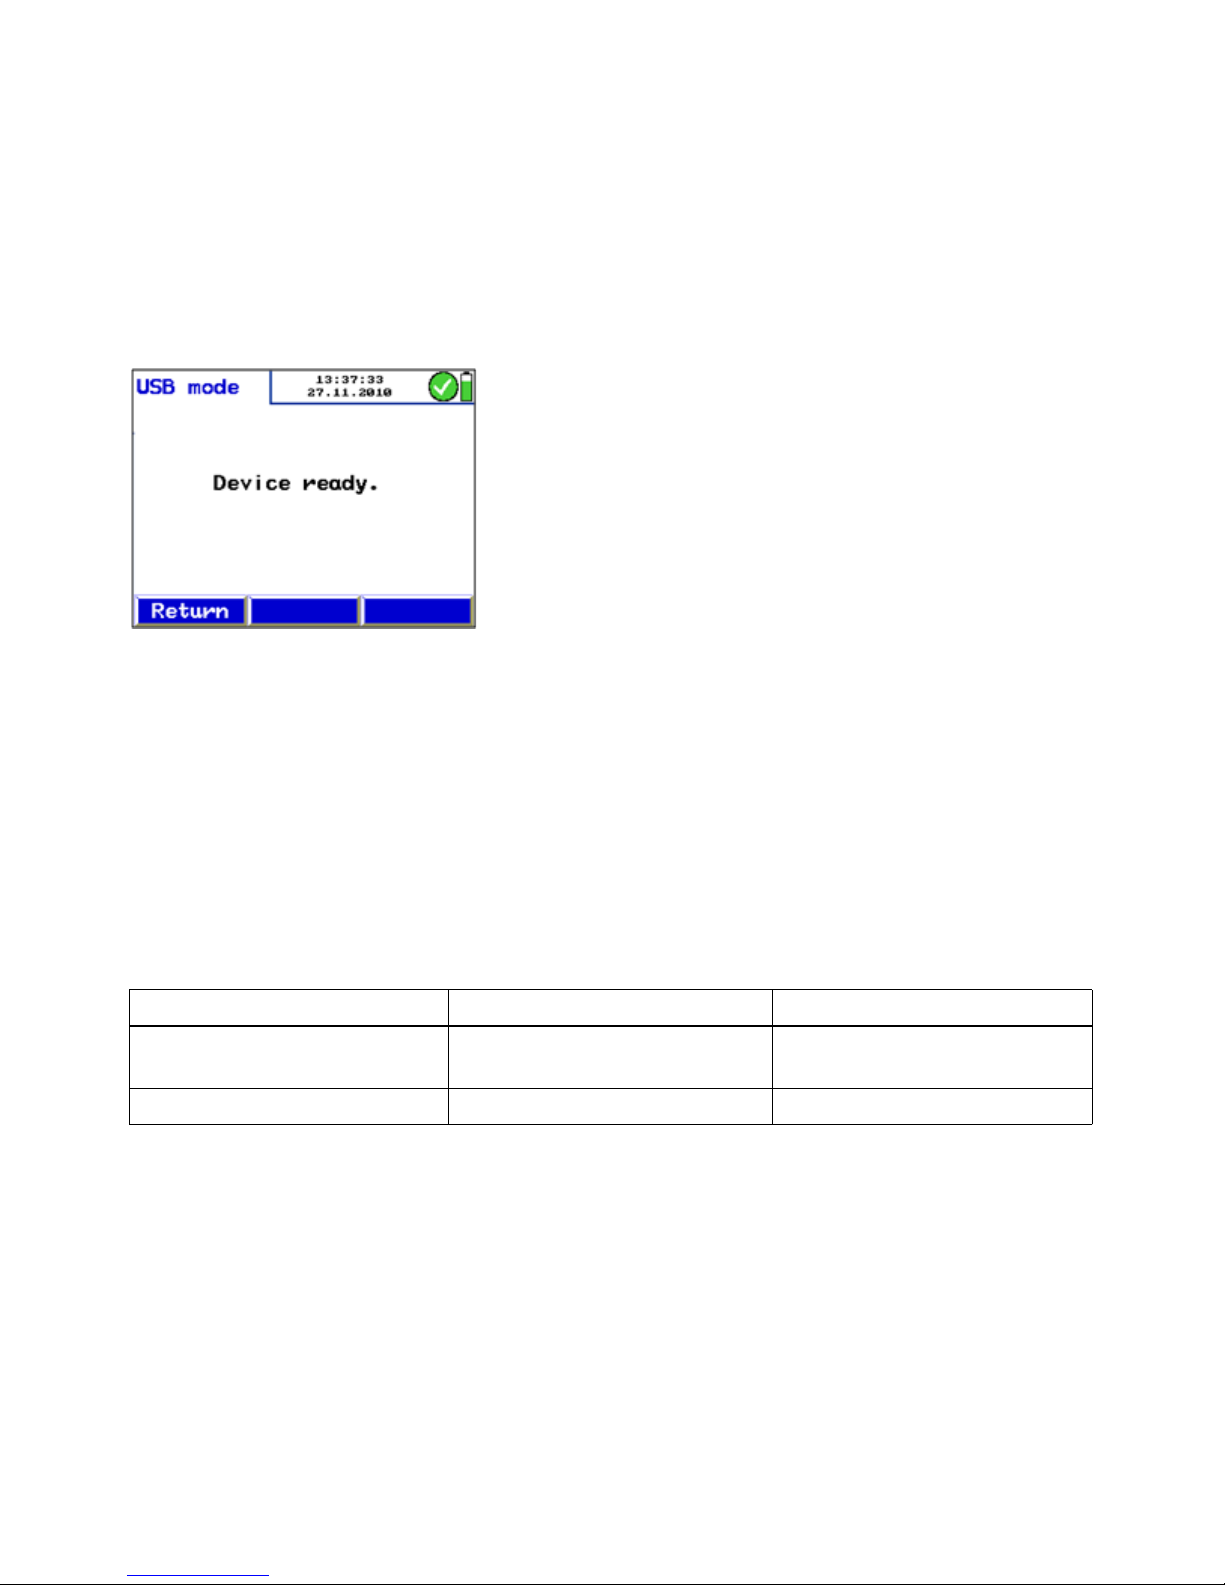
7.3 Data Transfer with the Computer or Notebook
The user can easily transfer data from the PC 410 to the
Computer or notebook via an USB cable. How to transfer
data to the Computer:
• Connect the Lindab PC 410 to the Computer via the USB
cable included in delivery.
• Select Main menu < Data management > USB data
exchange
The USB mode of the Lindab PC 410 is activated now.
• Open the Data Management Programm PC 410 on the
computer. Follow the instructions of the PC 410 Software.
Fig. 68: USB mode
7.4 Data Logging With the Lindab PC 410 Software data logging is possible.
8. Troubleshooting
Error message Possible reason Solution
Batteries low Disposable or rechargeable
batteries are empty.
Replace or recharge batteries.
ATTENTION! Overpressure High pressure Deflate pressure
Page 53

53
9. Maintenance
Proper operation of the Lindab PC 410 requires regular
maintenance.
9.1 Maintenance work
Interval Maintenance work
If required (user) Clean the device with a wet
cloth and a smooth cleanser.
Once a year (factory) Send the device to one of our
service points for checking and
calibration.
10. Warranty and Service
10.1 Warranty Each Lindab PC 410 probe will be tested in all functions and
will leave our factory only after extensive quality control testing. The final control will be recorded in detail in a test report
and delivered with any unit.
If used properly, the warranty period for the Lin-dab PC 410
will be twelve month from the date of sale. Not covered by
the warranty are batteries and defects of the pressure sensor
caused by overpressure.
This warranty does not cover the freight and packing costs
when the device is sent to the factory for repair.
Service by non authorized personnel or making modifications
to the analyzer voids any warranty.
Page 54

54
11. Accessories
Probes and sensors
Prandl tube, 1000 mm PCPRA
Capillary tubes 4 Pa Test PCKAP
S-tube probe PCSRS
Measuring pliers for temperature measurement PCZA500
Special Wall Temperature Probe PCHC
Wall Temperature Probe PCTF1
Penetration Temperature Probe PCTF4
Combustion and Temperature Probe PCTF5
Extras
Rechargeable batteries NiMH, 2 Ah PCAKKU
Charger PCLGA400
Thermal Fast Printer TD 600 TD 600
Thermal Paper, 10 rolls LTPP
Software
PC 410 Software with USB cable. PC410DAT
Page 55

55
12. Declaration of conformity
The manufacturer:
Wöhler Messgeräte Kehrgeräte GmbH
Schützenstr. 41, D-33181 Bad Wünnenberg
declares that the product
product name: Flow and Pressure Meter
model number: Lindab PC 410
complies with the following protective requirements:
• requirements for electromagnetic compatibility in accordance with EN 61326-1 1997+
A1: 1998+A2:2001
• requirements according to DIN EN 61010-1:2002
• the essential requirements for the protective system in accordance with EN 60529:1991
certified by TÜV SÜD
• Directive "Richtlinie für die Eignungsprüfung von Differenzdruckmessgeräten zur Messung von
Unterdrücken in Aufstellungsräumen von Feuerstätten“ (ZIV, Dez. 2007)"
• Requirements "Mindestanforderungen an geeignete Messgeräte zur Messung des Abgas-Ventila-
tions- und Strahlungsverlustes im Rahmen der energetischen Inspektion, Entwurf, ZIV, Stand 14.
Januar 2010"
This declaration is submitted for the manufactorer by:
Dr. Stephan Ester, managing director
Bad Wünnenberg, 22nd of october 2010
13. Lindab local
Contact your local Lindab distributor or find our representatives on www.lindab.com
Page 56

1072 EN 2011-11-04
 Loading...