

Page 1
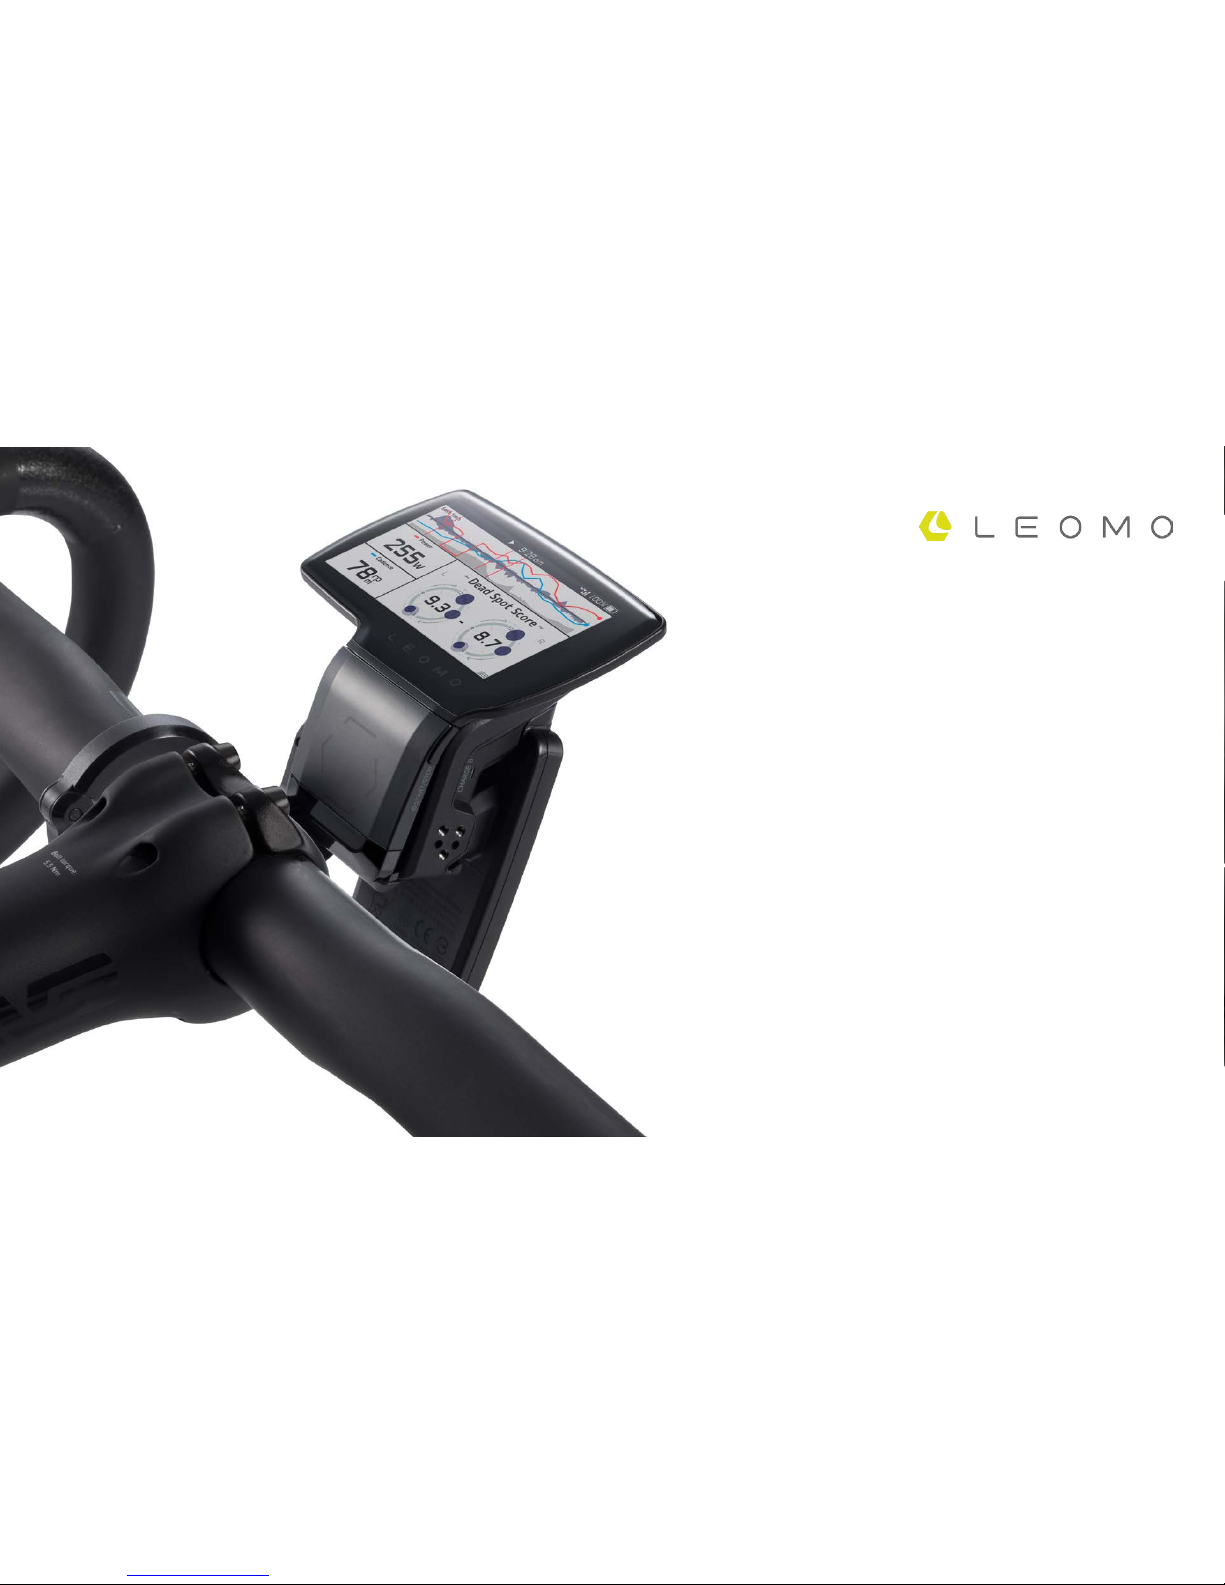
TYPE-R
Operations and Safety Manual
Manual Version 1.0 (released on 3/9/2017)
Page 2
2
CONTENTS
1. Contents – 2
2. Introduction – 3
3. Features – 4
4. What’s in the Box – 5
5. Getting Started – 6
6. Recording an Activity – 10
7. Wearing Your Motion Sensors – 11
8. Hardware Controls and Statuses – 12
9. Home and Menu Screens – 13
10. Status Bar – 14
11. Activity Screens – 15
12. Customizing the TYPE-R – 16
13. LEOMO Web App – 17
14. Motion and training – 21
15. Motion Performance indicators – 22
16. Technical Information – 28
Page 3
3
INTRODUCTION
Highly accurate, realtime quantified motion for
cycling
Whether you are a coach who wants to
add accuracy and effective tracking to your
observations, or a cyclist wanting objective
feedback of your motions in real-time, the lablevel accurate motion tracking capabilities of
the TYPE-R will deliver. Combining the latest in
technology, biomechanics, and cycling form
analysis, the TYPE-R brings training, coaching,
and injury prevention to a whole new level,
inside and outside the lab.
Page 4
4
FEATURES
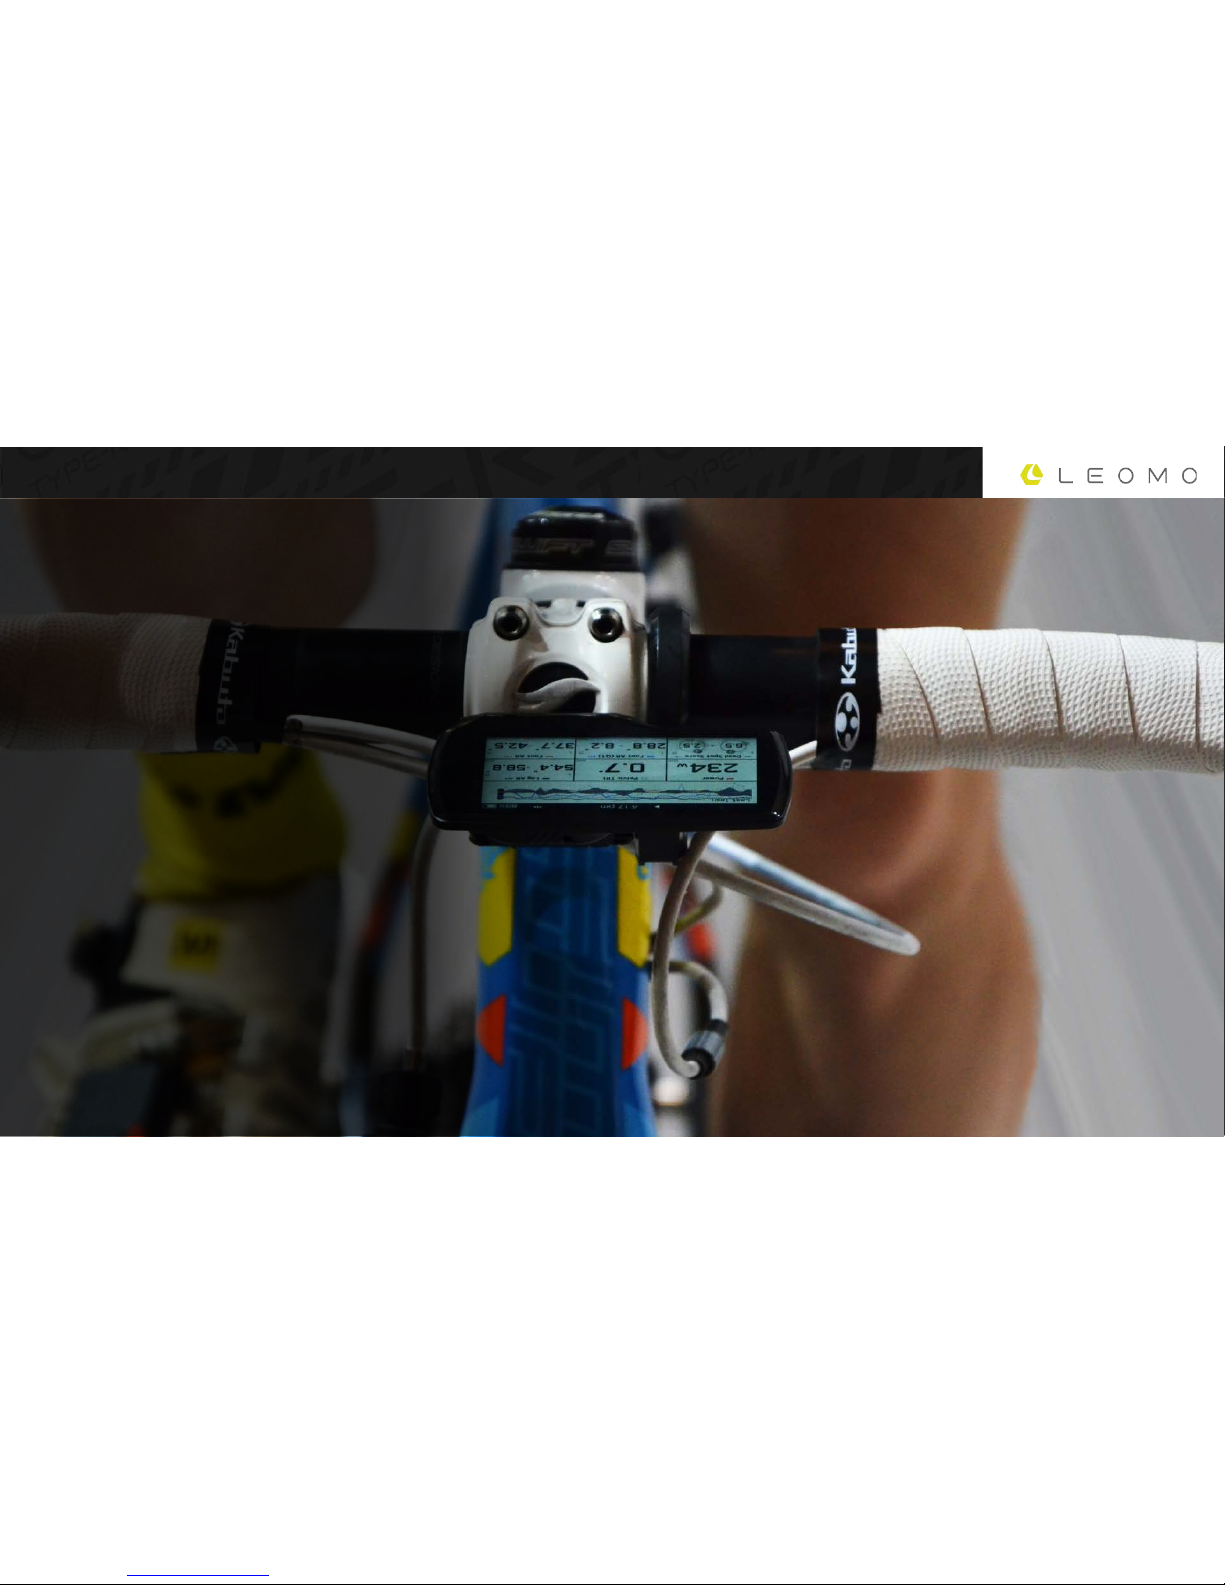
• Quantify your body’s 3D
movements in real-life training and
racing environments.
• Includes a High resolution color
display and FIVE wireless motion
sensors.
• powerful real-time graph for
trend evaluations of your motion,
power, cadence, speed, heart rate,
and GPS data.
• Analyze your activity data
anywhere using LEOMO’s browserbased analysis tool.
Page 5
5
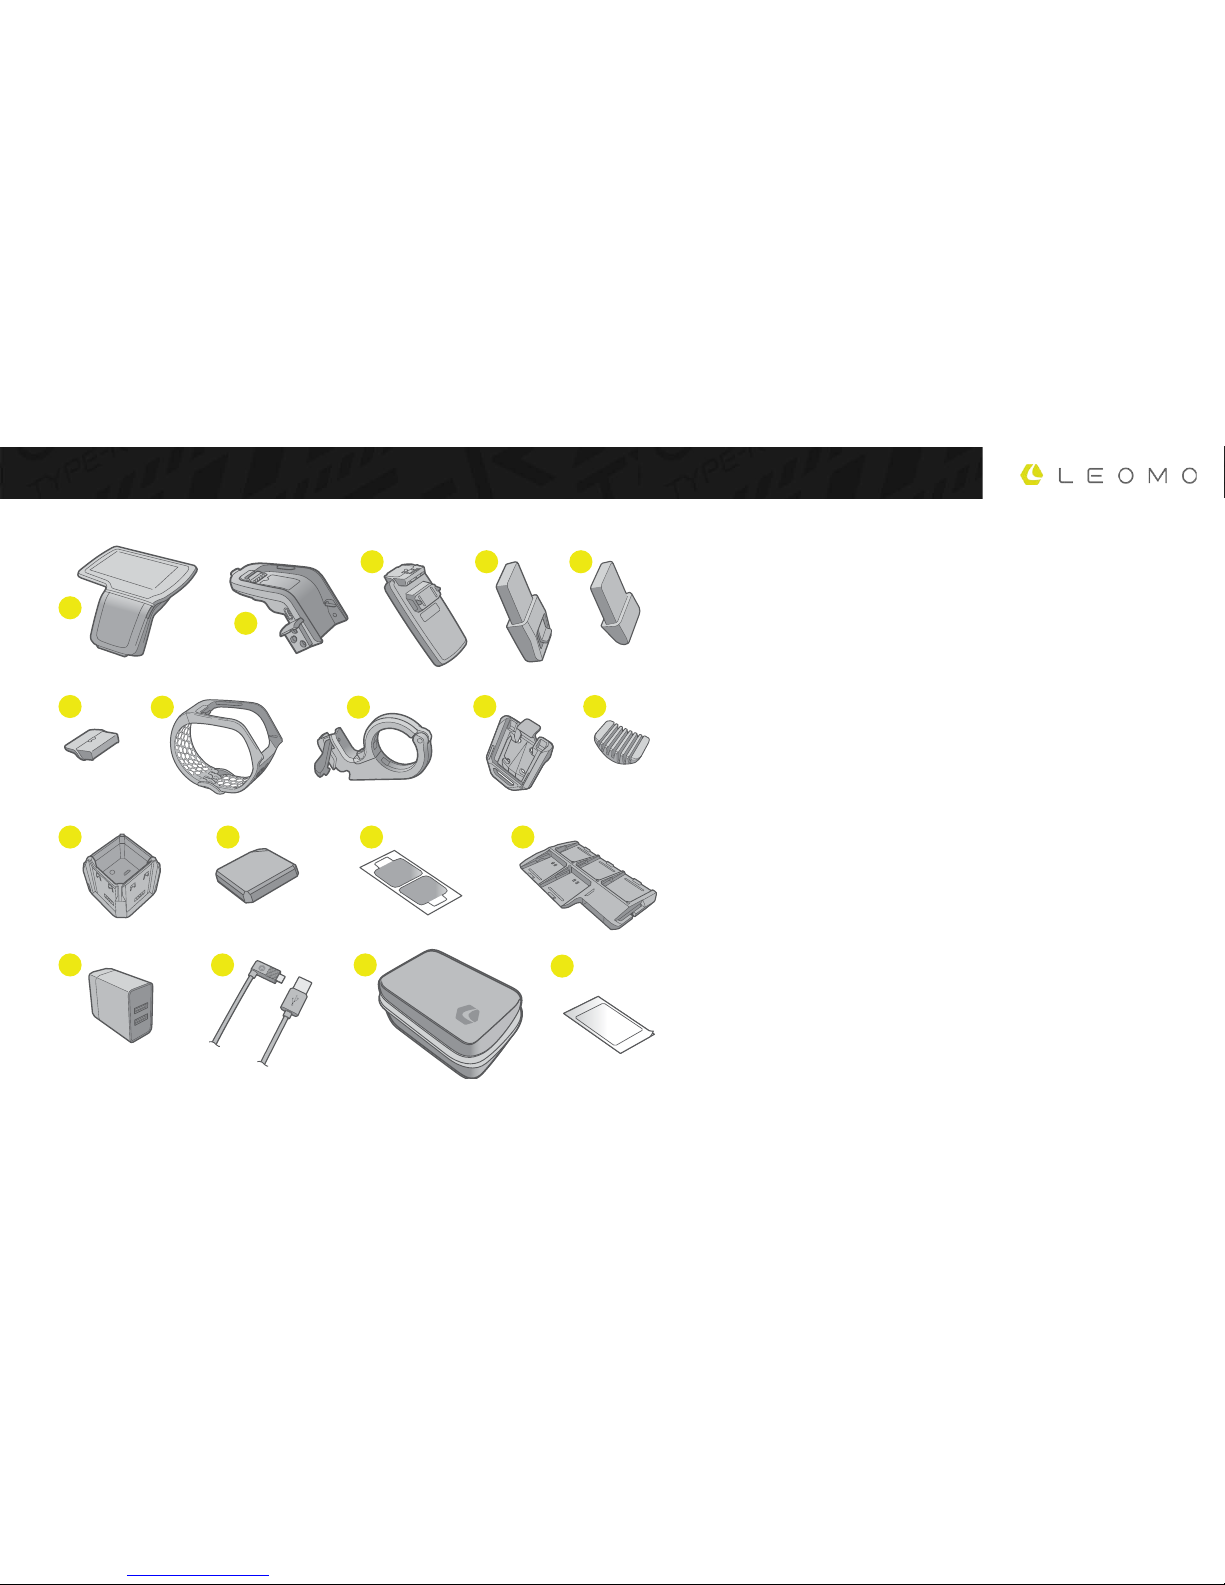
WHAT’S IN THE BOX
1. TYPE-R (Main
Unit, Display )
2. Dock
For fitting on bike
mount and USB charging
3. Dock Charger For
charging port A batteries
4. L Battery For
port A battery use
5. S Battery For
port A battery use
6. Dock Cap For
sealing port B when not
using dock charger
7. Wristband FOR
wearING TYPE-R on wrist
8. Bike Mount FOR
mountING TYPE-R on bike
9. Sensor Clip For
using sensors on shoes
10. Wristband Spacer
FOR adjustING wristband
×5
×2
×25
9
12 13 14
15 16 17
18
10
11
876
1
2
3 4 5
11. Sensor Charger For
charging motion sensors
12. Motion Sensors x5
For motion data collection
13. Sensor Adhesives
x50 For wearing
motion sensors
14. Sensor Carrier case
FOR keepING motion sensors
POWERED off while in transit
15. AC Adapter
16. USB Cables x2
17. Case
18. Anti-glare Film
Page 6
6
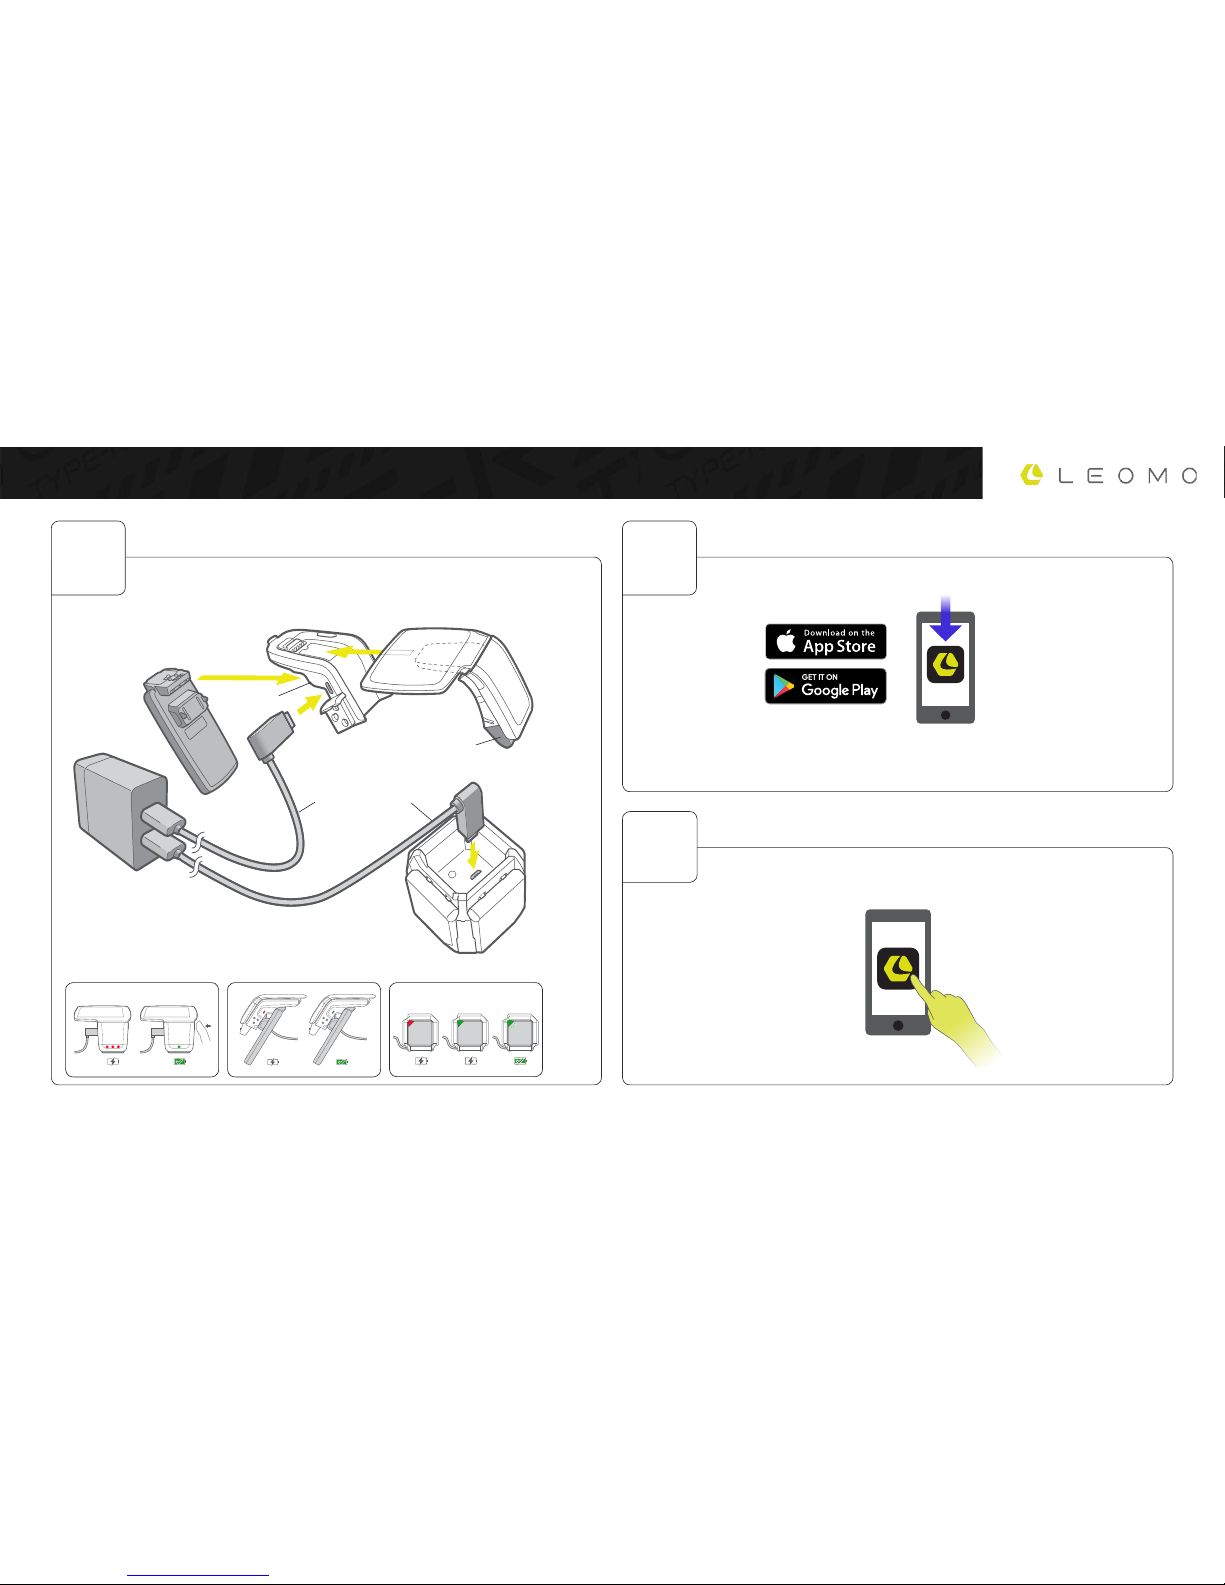
Download the LEOMO Link app for your smartphone. LEOMO Link is available on
the App Store* and Google Play**.
Open the LEOMO Link and create a LEOMO account, or log in if you already have
an account.
Download LEOMO Link
Log in to LEOMO Link
Charge devices
GETTING STARTED
1 2
3
Charge your TYPE-R, Dock Charger, and Motion Sensors.
Motion sensors x5 in
sensor charger
AdaptEr
USB Cable x2
Port A
Port A
Port B
Port B
Motion Sensors
ChargING Indicators
TYPE-R
Dock
Dock Charger
LEOMO Link
*Apple and the Apple logo are trademarks of Apple Inc., registered in the U.S. and other countries. App Store
is a service mark of Apple Inc., registered in the U.S. and other countries.
**Google Play and the Google Play logo are trademarks of Google Inc.
Page 7
7
NOTE
• Only one TYPE-R
and smartphone can
be linked to your
account at one time.
• The pairing process
can only be done
through the LEOMO
Link app, and linking
through your phone’s
settings can result in
errors.
Getting Started
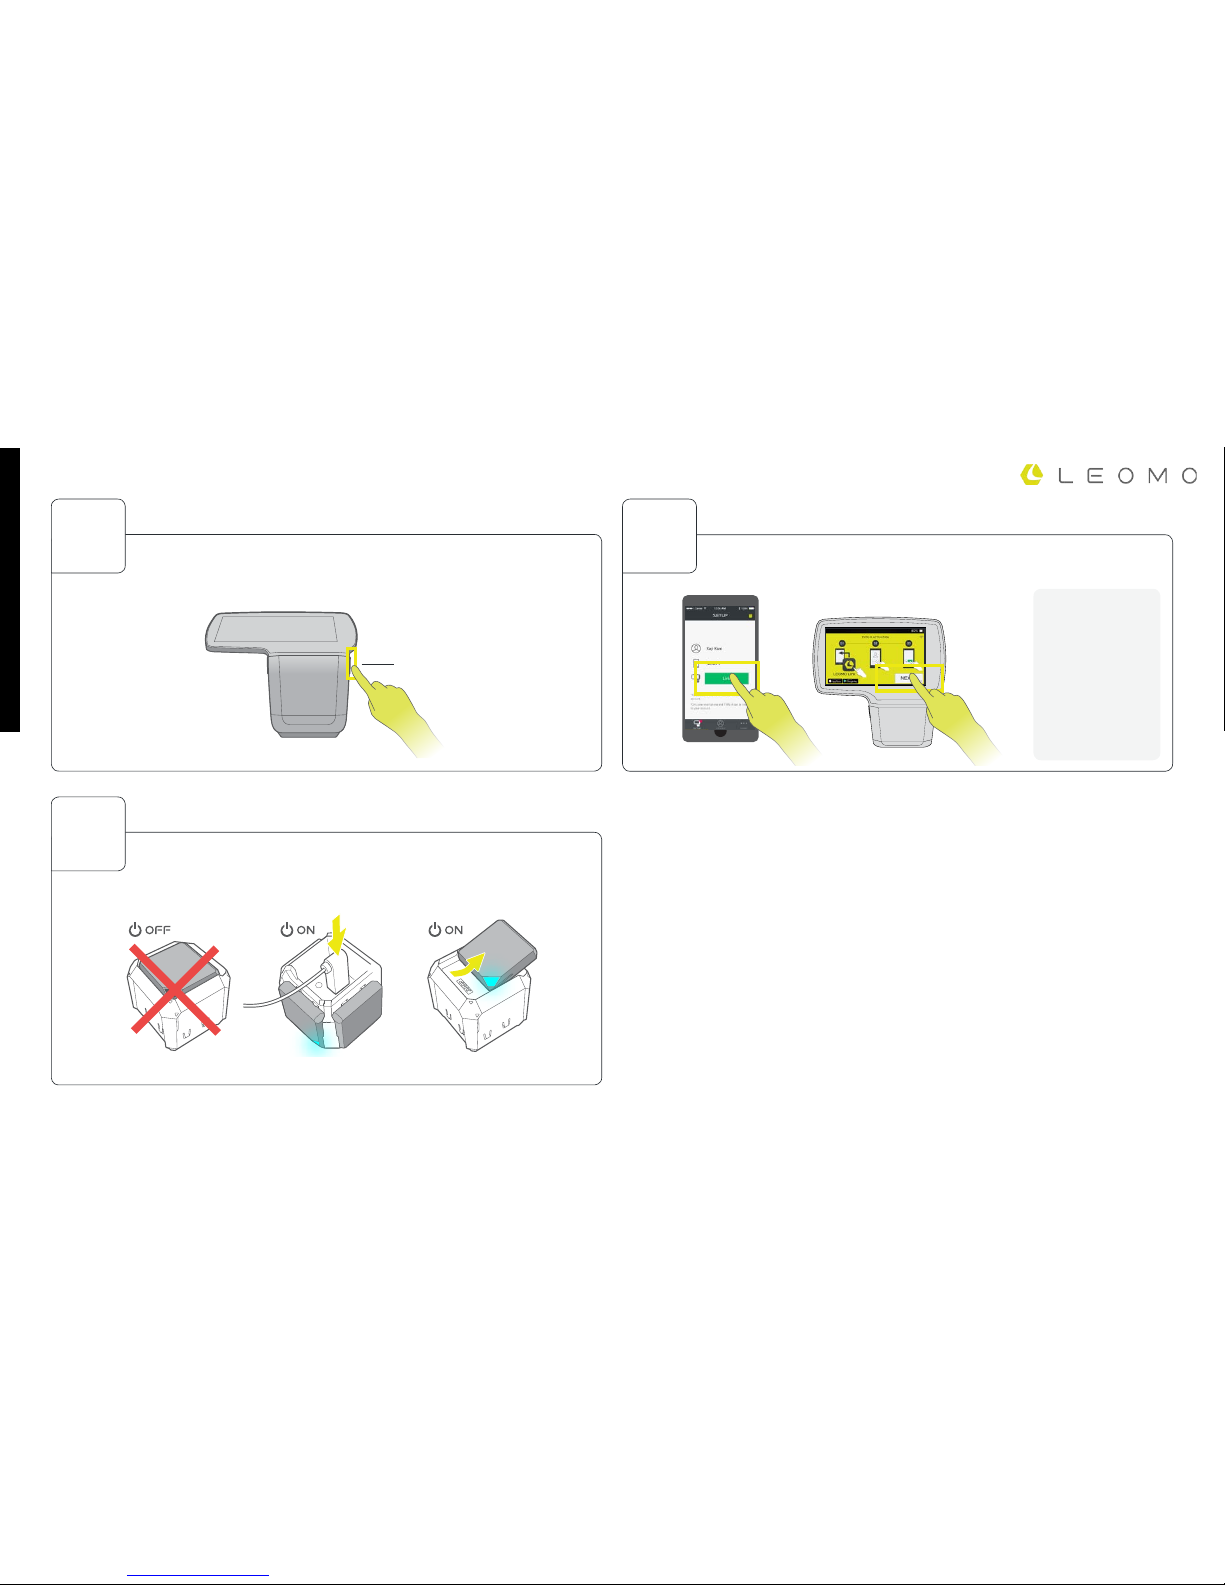
Link your TYPE-R from the Setup tab on LEOMO Link. This will (1) pair your
TYPE-R to your smartphone, (2) link your account to the TYPE-R, and (3)
set up the Wi-Fi connection to be used on your TYPE-R.
5
Link the TYPE-R to LEOMO Link
+
Turn on the TYPE-R
Turn on all 5 motion sensors
Turn on the TYPE-R by holding down the right hardware button on the side of the
TYPE-R until the TYPE-R powers on.
To turn on the motion sensors, place the motion sensors into a plugged in sensor
charger, or take the motion sensors out of the charger after they are charged
suciently. If the motion sensors are in a non-plugged in charger, they will be
turned o.
Power button
4
6
Page 8
8
9
Getting Started
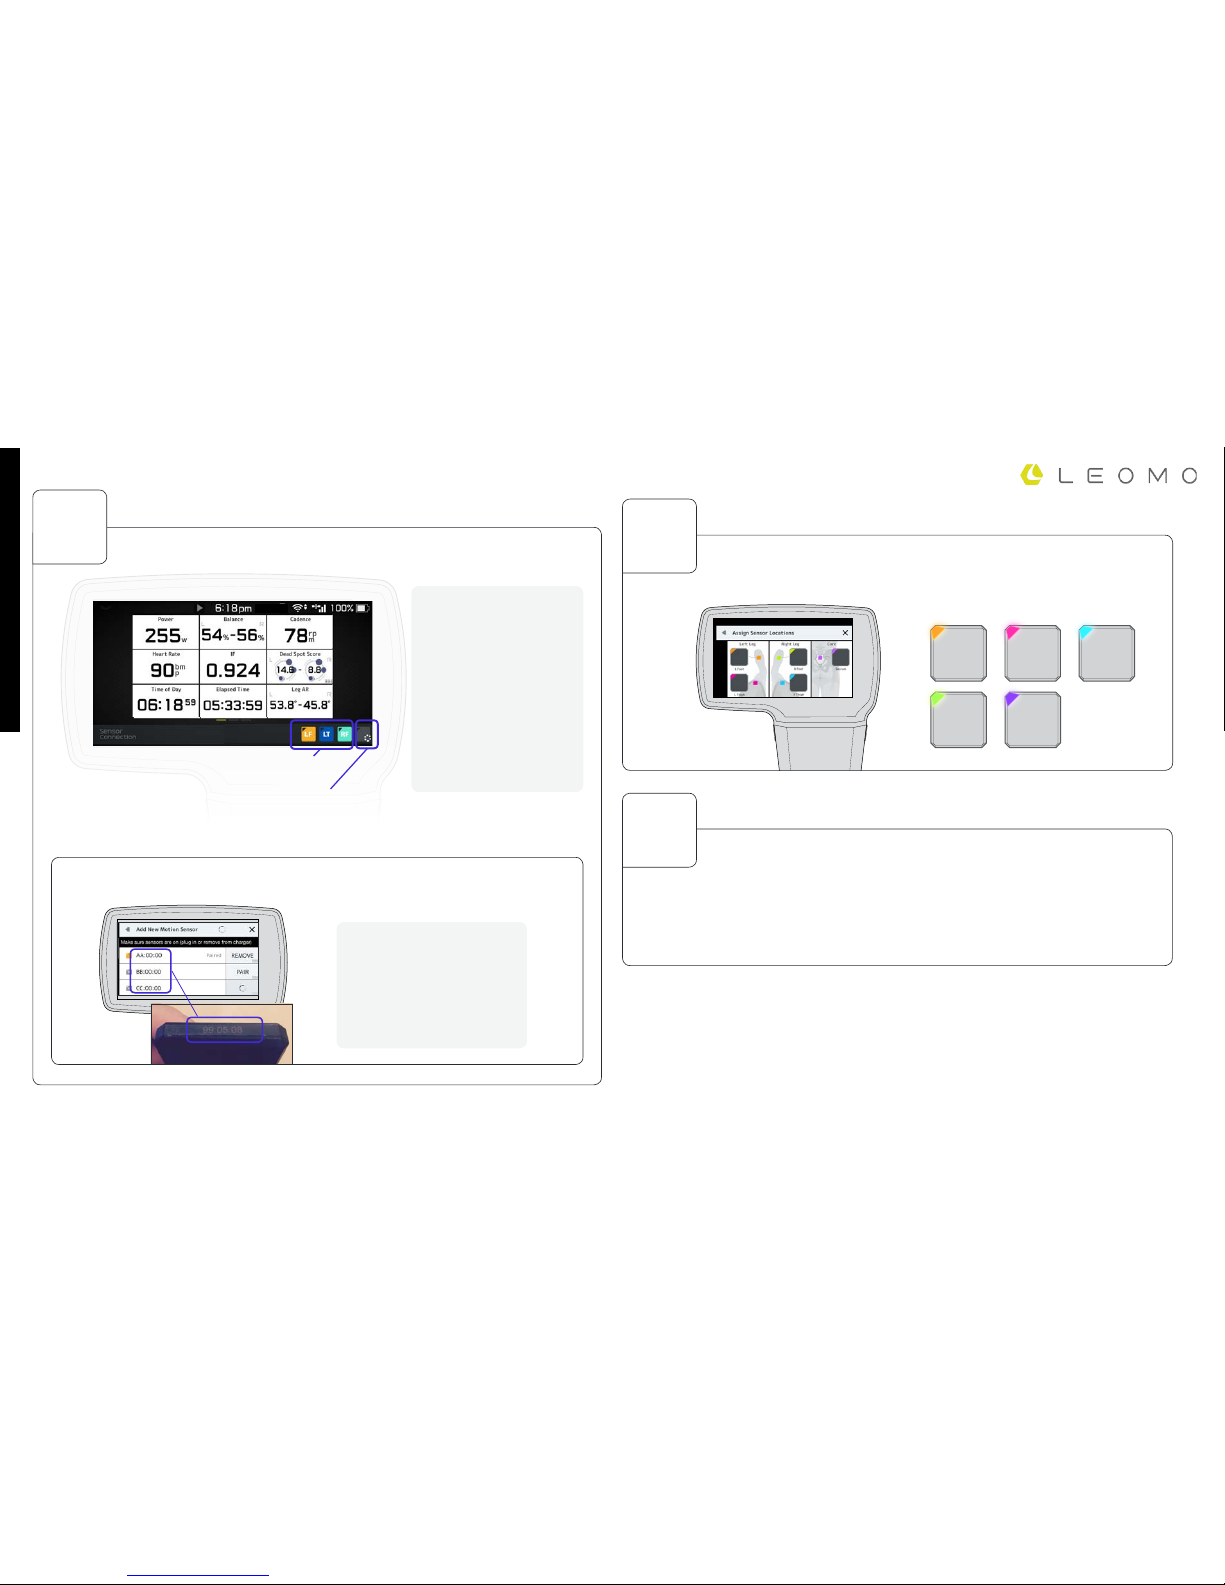
Motion sensors need to be assigned to a specic body location. When prompted,
set the locations of your motion sensors (you can also manually access the location
assignment page from Quick Menu > Menu > Motion Sensors > Assign Sensor
Locations).
Optional: Pair ANT+ sensors from Menu > ANT+ Sensors > Add
Sensor
8
Assign Motion Sensor Locations
Pair ANT+ Sensors (not included)
- Power Meters
- Heart Rate Sensors
- Speed Sensors
- Cadence Sensors
- Speed / Cadence Sensors
7
Make sure your motion sensors are connected to your TYPE-R by checking the sensor
connection status on the home screen.
paired motion sensorS that Are
cOnnected
paired motion sensors THAT ARE
Disconnected
Manual pairing
NOTE
• If you have more than 5 motion
sensors in your surroundings, pair
to the correct sensor by matching
the ID printed on the bottom of the
sensor.
NOTE
• If any sensors are not
connecting, manually connect
them from Quick Menu (swipe
down from the top of the
screen) > Menu > Motion
Sensors > (tap on paired
sensor) > Connect.
• If manually connecting
them doesn’t work, restart the
motion sensor by putting it in
and out of the sensor charger.
Connect Motion Sensors to TYPE-R
If you do not have 5 motions sensors paired to your TYPE-R, manually pair your sensors from
Quick Menu (swipe down from the top of the screen) > Menu > Motion Sensors
Page 9
9
Getting Started
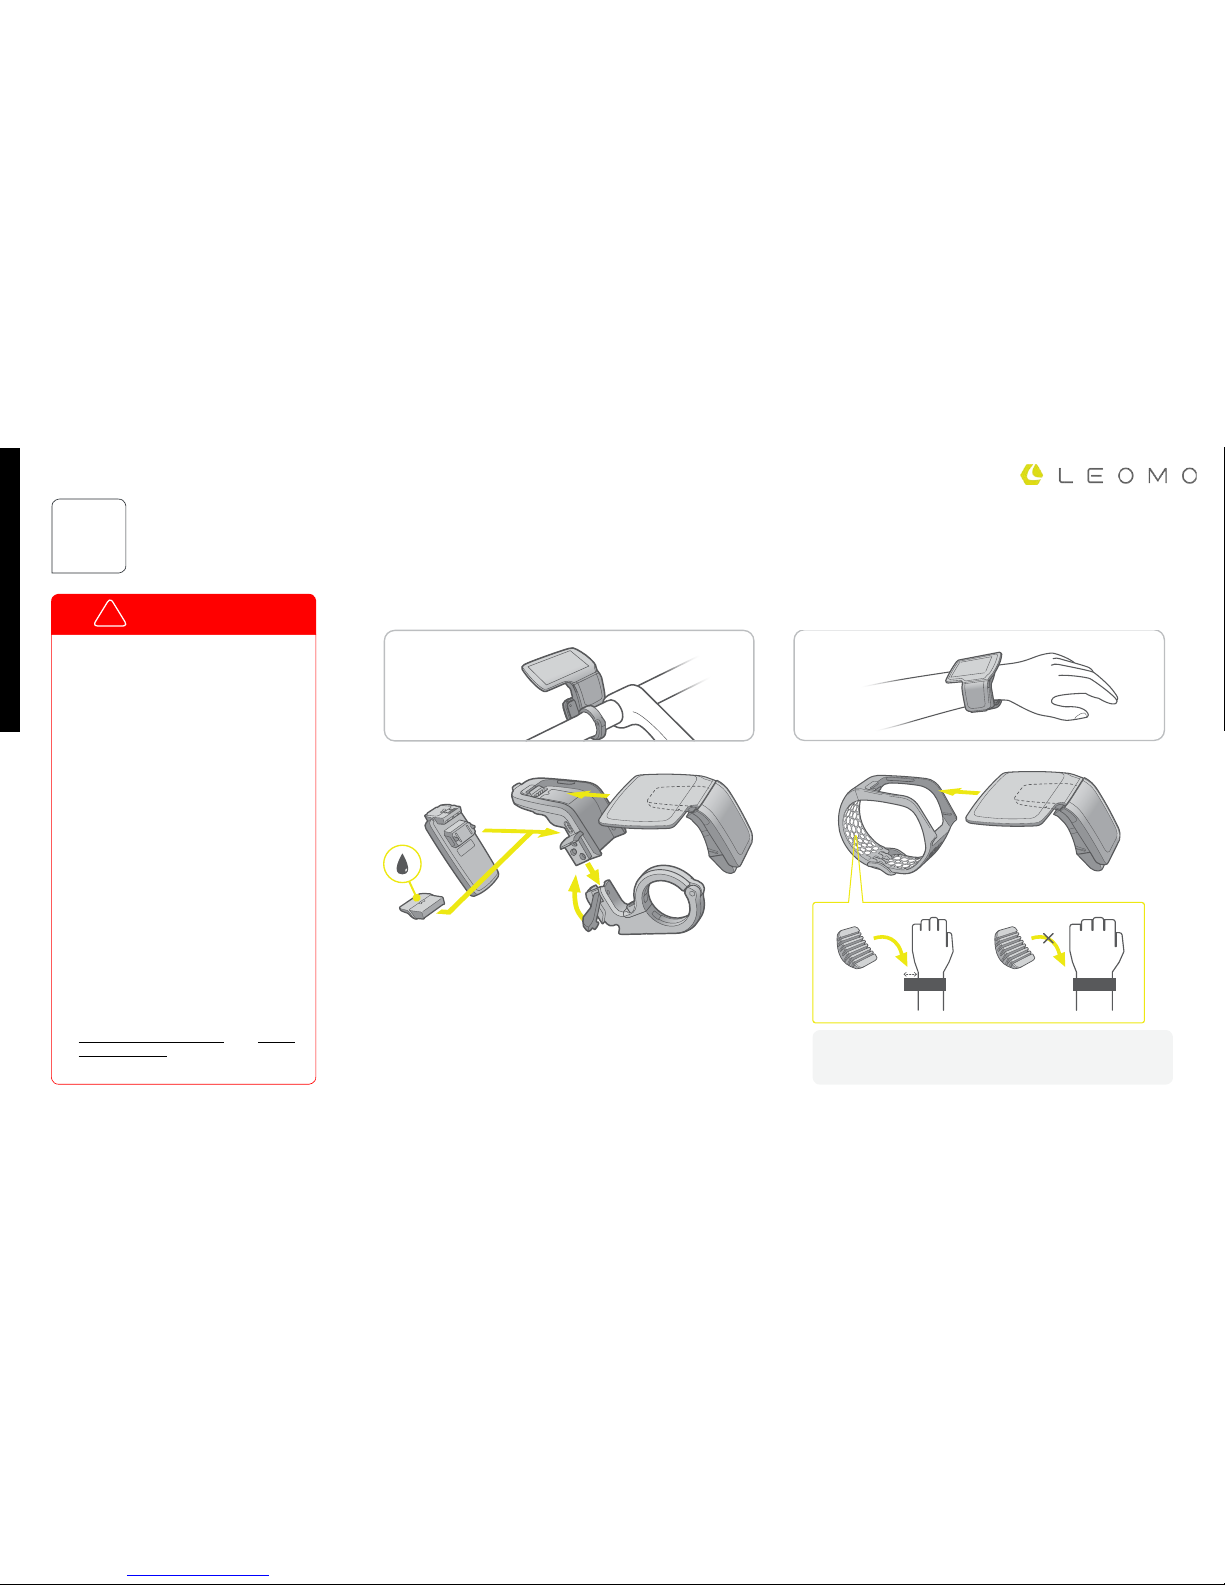
Attach the bike mount to your bike’s handebar. Place the L or S battery into port A of the TYPE-R, and lock the battery in place. Lock in the dock charger or cap into port B of the
dock. To place the TYPE-R and dock into the mount, lift up the handle bar, slide the dock in, then lock the handle bar by snapping it down into place.
Bike Handle Bar Band
In order to maintain the product’s
waterproof capabilities, please follow
all instructions written in this manual
and the LEOMO terms of use found
here. Any damage resulting from
user negligence will void the product
warranty.
• Do not insert wet batteries.
• Make sure batteries are
locked into place while
charging or in use.
• Make sure the TYPE-R main
unit is locked into the dock
while charging or in use.
• Battery and charging
components must be
completely dry while charging.
• When not using the dock
charger, cover the dock’s port
B with the port cap.
For more information, please go to
http://leomo.io/warranty and http://
leomo.io/terms
WARNING
10
Physical Configurations
!
NOTE
• The wrist band can also be used to mount the TYPE-R onto your bike,
sans dock and dock charger.
Page 10
10
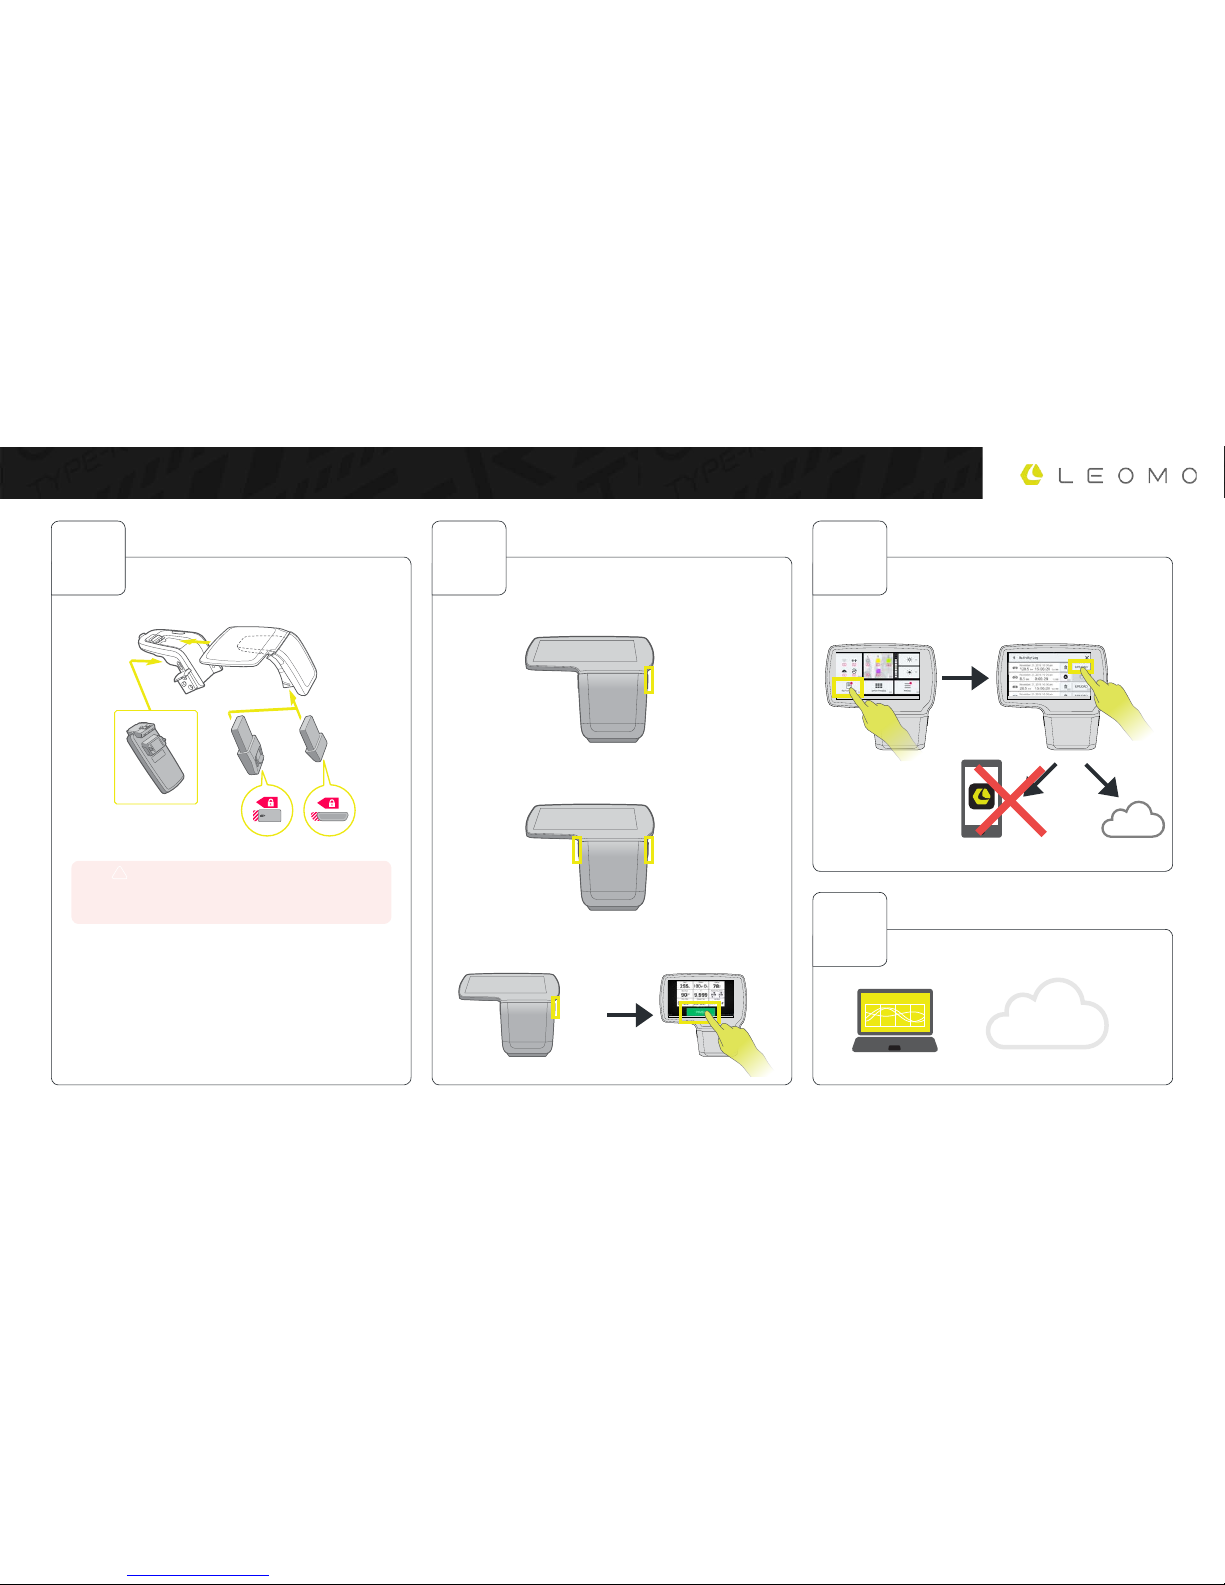
RECORDING AN ACTIVITY
Upload your activities via Wi-Fi directly from
the TYPE-R to the cloud from Quick Menu >
Activity Log. Note that the TYPE-R does not
upload activities via Bluetooth or USB.
Prepare the TYPE-R Record Activity Upload Activity
Analyze Data on Web App
1
1) Insert batteries
2) Connect to sensors
Connect to your motion sensors and ANT+ Sensors.
S Battery
40 min
Dock Charger
+6 hrs
*Use port cap if not
using dock charger
*Lock battery while in use
L Battery
90 min
Finishing an activity
during an activity
Starting an activity
3) Wear your motion sensors
Place motion sensors on assigned locations. Note that
sensors placed on non-assigned locations will have incorrect
data. (check next page for locations)
2 3
4
http://app.leomo.io
start
pause/unpause
pause
Mark Lap
NOTE
• Leaving the dock charger in the dock without being
connected to a power source will slowly drain the dock
charger.
!
Page 11
11
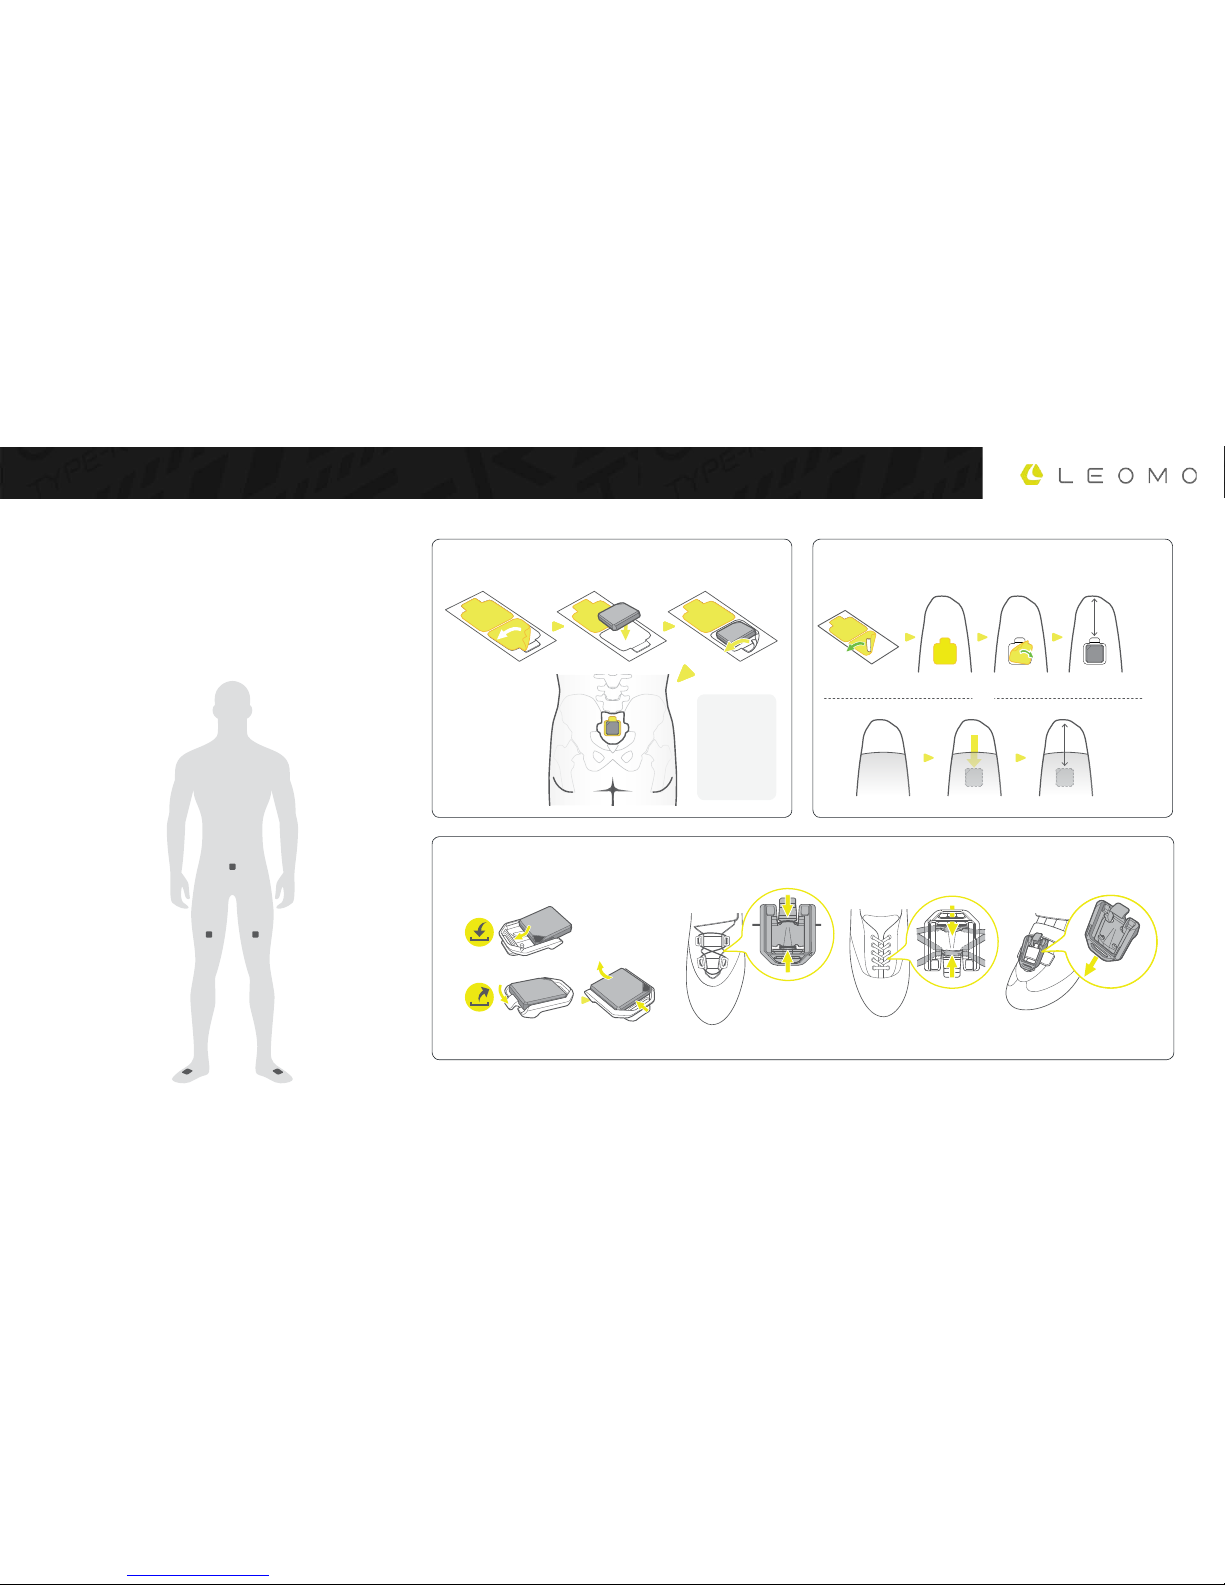
WEARING YOUR MOTION SENSORS
minimum
4” (10 cm)
minimum
4” (10 cm)
minimum
4” (10 cm)
minimum
4” (10 cm)
oror
Sacrum (S)
indoors only
Horizontal oset will not aect readings.
Sacrum
Thighs
Feet
Thigh (RT and LT)
Foot (RF and LF)
Match your motion sensor’s color to the assigned location on your
body. For example, if you have assigned the orange sensor as the
RT (right thigh) sensor, place the orange sensor on your right thigh.
Motion sensors may be placed in any direction and will
automatically adjust to real-world XYZ coordinates.
To check what color is assigned to what location, go to Quick
Settings > Motion Sensors > Assign Sensor Locations.
NOTE
• sacrum
can be
found right
above the
tailbone.
Page 12
12
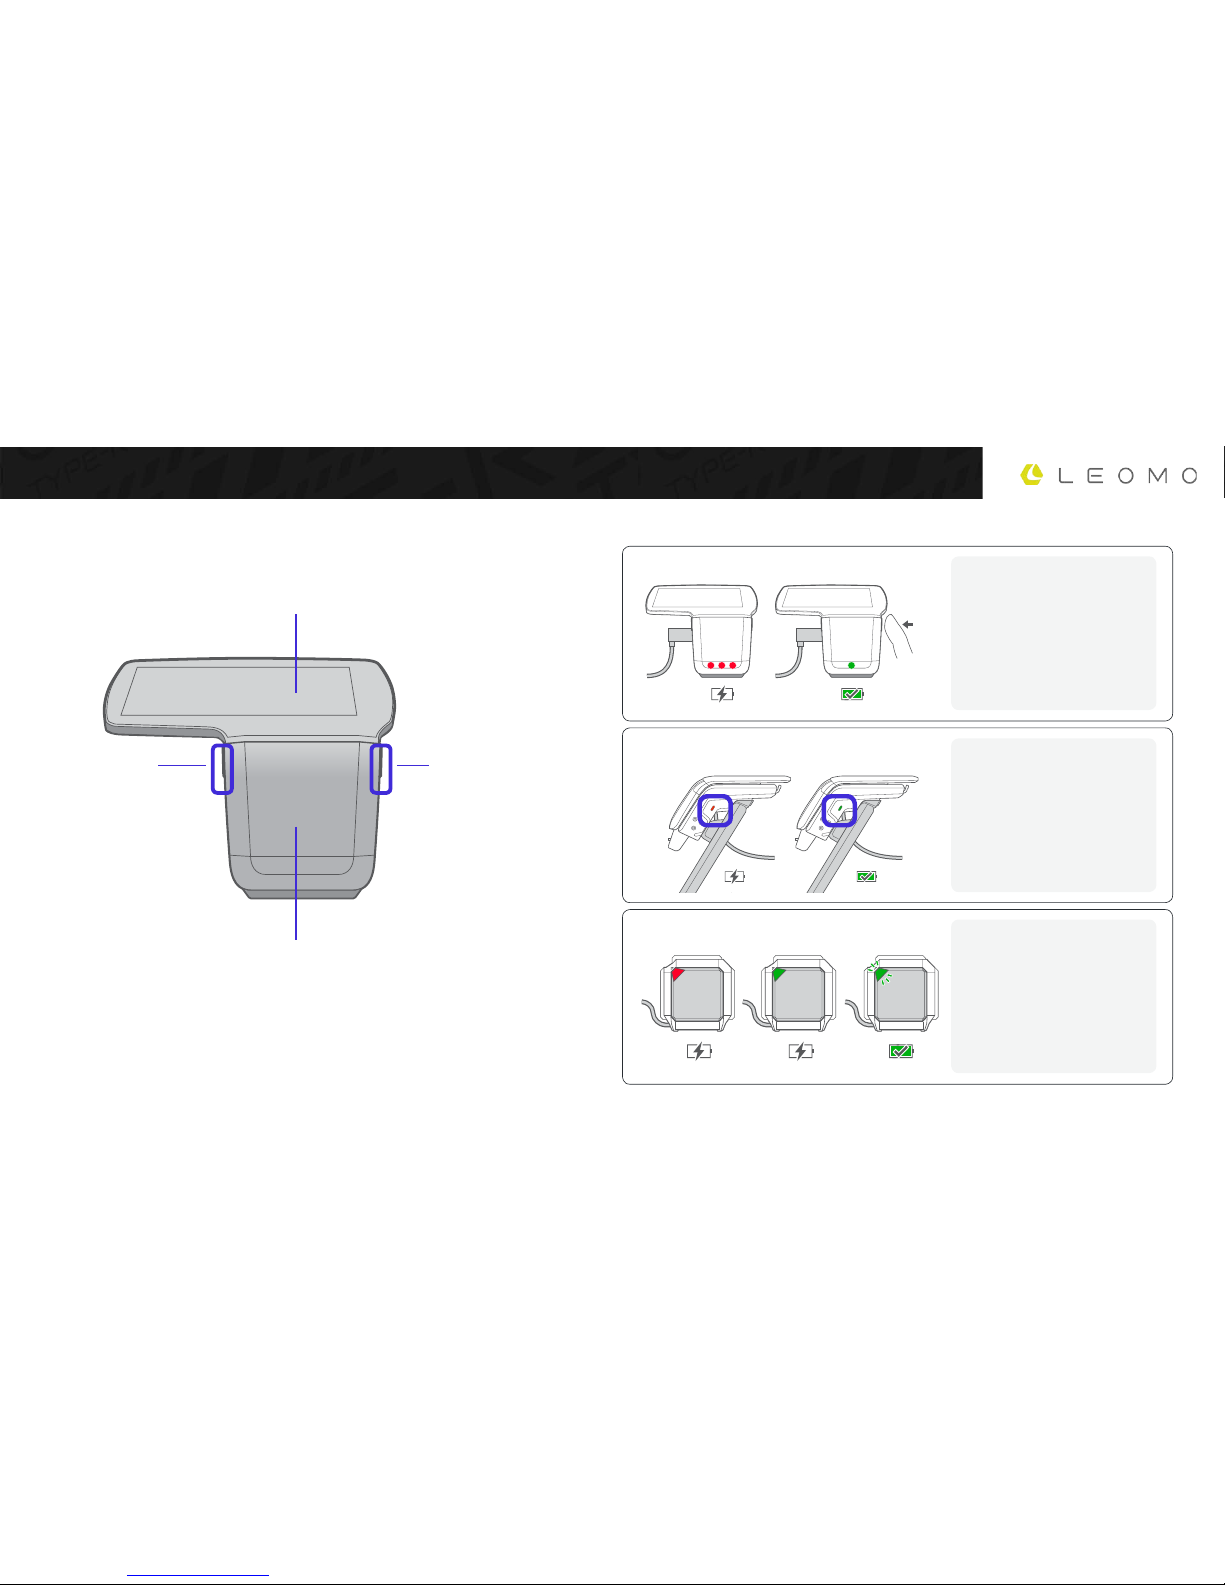
HARDWARE CONTROLS AND STATUSES
Touch Display
Battery StatusControls
Touch Pad
Swipe left / right to swipe through
data pages.
Power / Activity
Button
Press and hold for 2
seconds to turn on
TYPE-R / Bring up power
menu.
Tap to start/pause/
unpause activity.
Lap Button
Press and release
to mark lap (can
onlypress once in a
paused activity).
Port B Battery
Port A Battery
Motion Sensors
• Port A is located on the bottom of
the TYPE-R. The battery inserted in
port A is will act as the main battery
for the TYPE-R.
• Charging: A red LED gauge will
show on the bottom of the unit.
• Finished charging: The LED on
the bottom of the unit will turn o.
Pressing the right hardware key will
show a green LED.
• Port B is located on the back of the
dock. The S/L batteries and the dock
charger can be charged in port B.
When using the device, insert the dock
charger or dock cap.
• Charging: A red LED will show next
to the power button on the dock.
• Finished charging: A green LED will
show next to the power button on the
dock.
• Charging (0-20%): Non-blinking red
LED
• Charging (20% - 100%): Nonblinking green LED
• Finished Charging: Blinking green
LED
• Note: When the motion sensors
are connected to the TYPE-R, their
assigned location color will take
precedent over their charging color.
Page 13
13
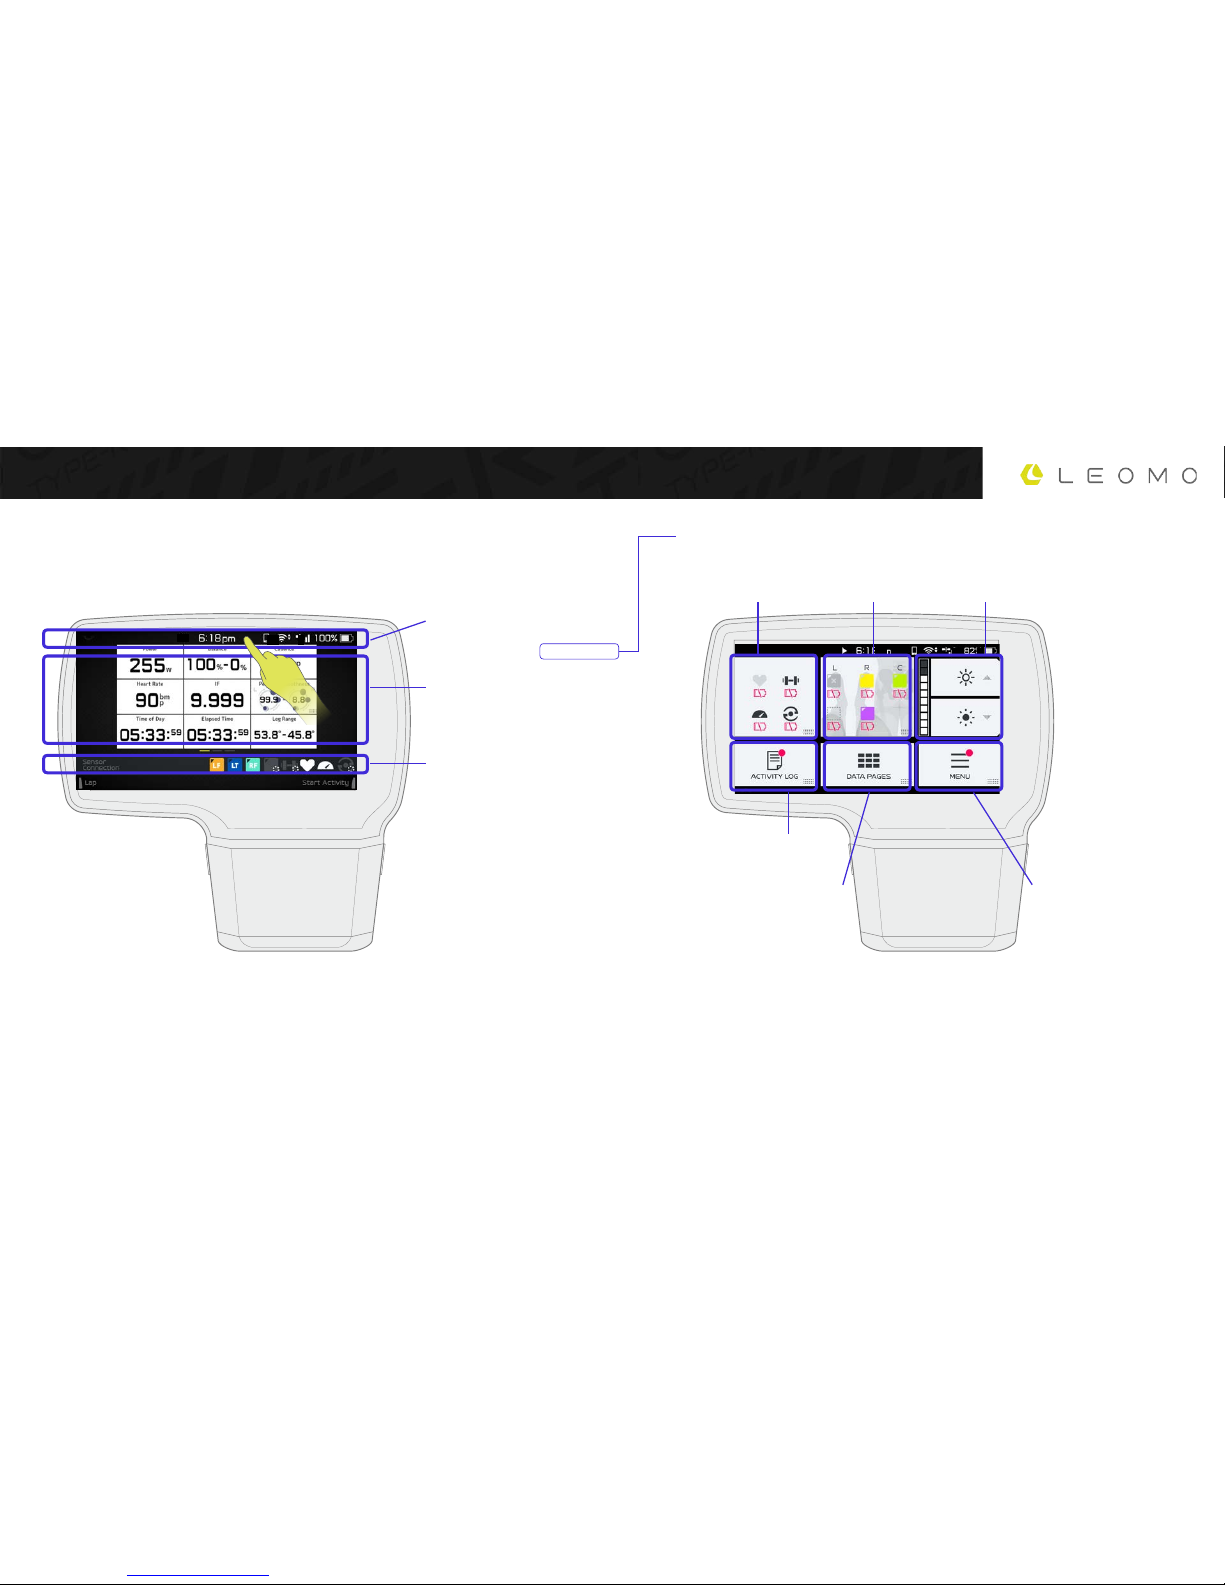
HOME AND MENU SCREENS
Paired sensors connection
status
Paired Motion and ANT+ Sensors
(Power Meters, Heart Rate
Sensors, Speed Sensors, and
Cadence Sensors) will show here.
Disconnected sensors will show as
a dark grey icon. Connected ANT+
sesnors will be white. Connected
motion sensors will show assigned
color and location:
- LF = Left foot
- RF = Right Foot
- LT = Left Thigh
- RT = Right Thigh
- S = Sacrum
- Empty = Connected but not
assigned (will not record data)
Statusbar
Tap or swipe down from the top of
the screen to access quick menu.
Data Page s
Data pages can be customized
though the LEOMO Link app. Swipe
left / right to change pages.
Activity Logs
ANT+ Sensors Motion Sensors Display Brightness
MenuClose Quick Menu
Home Screen Quick Menu Screen
Page 14
14
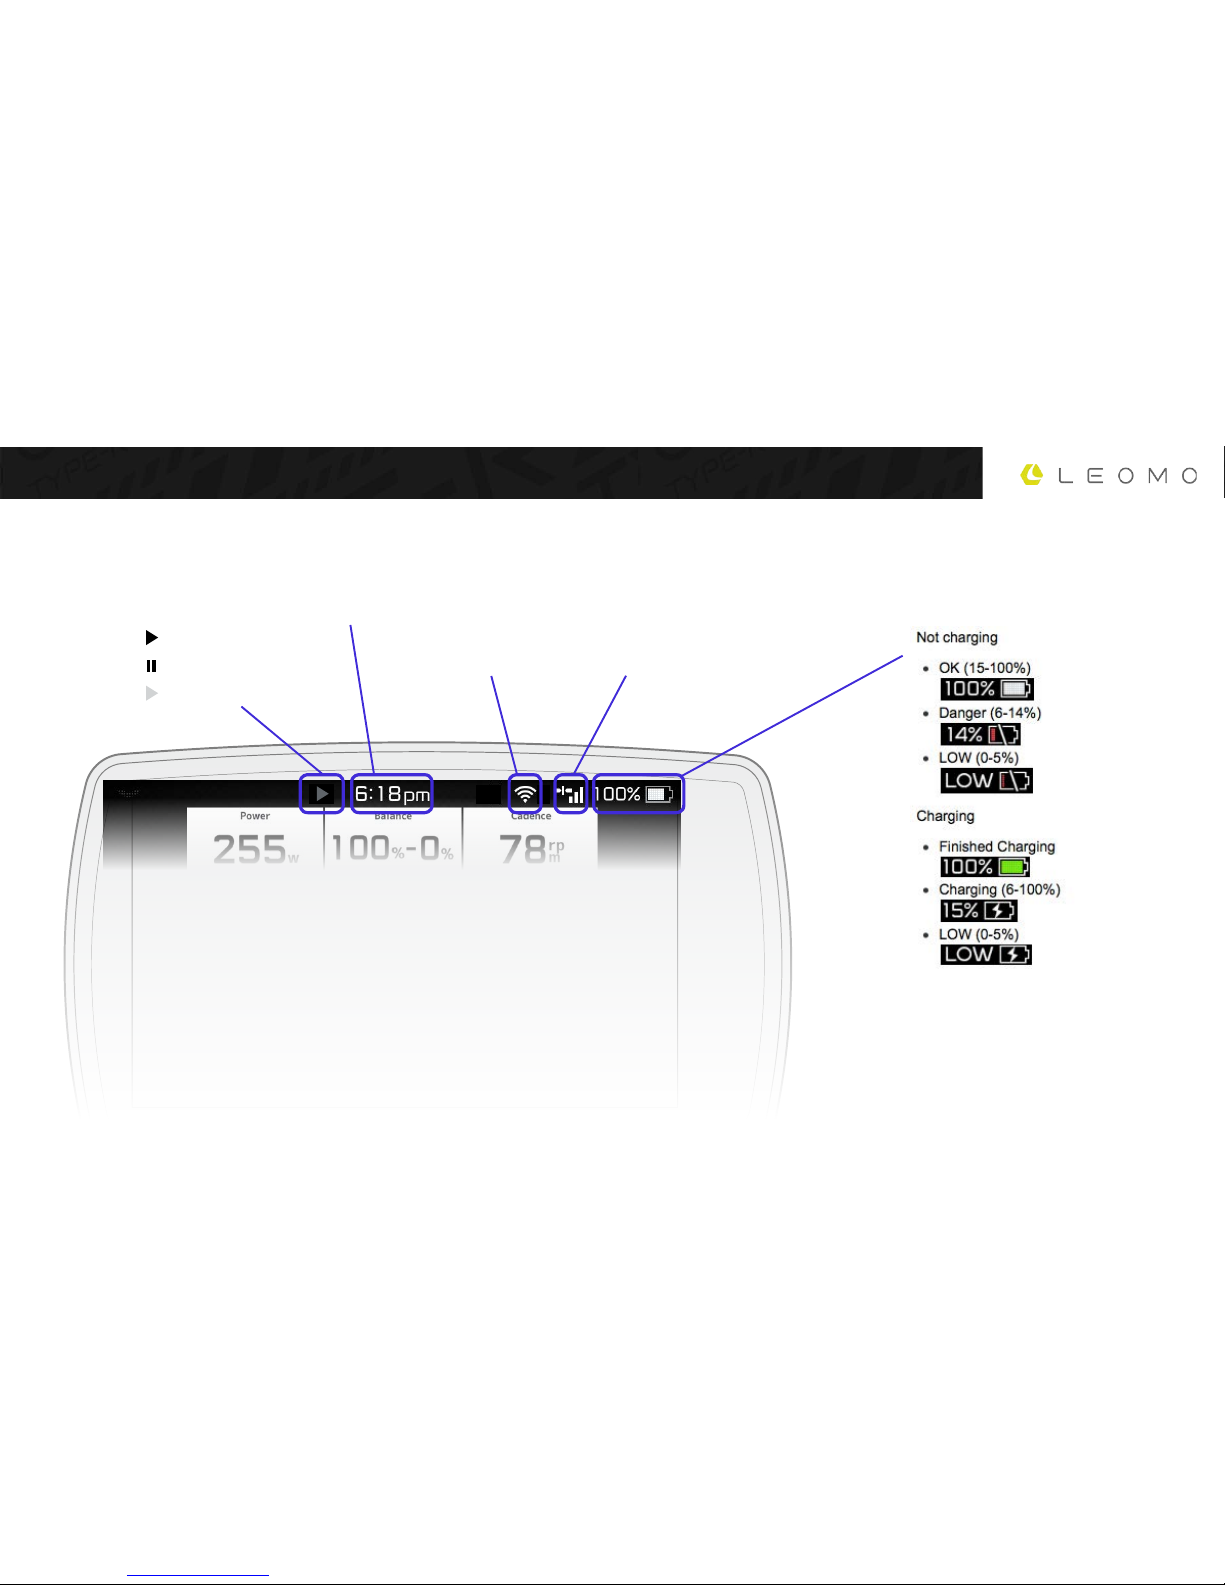
STATUS BAR
Time Port A Battery status
Activity Status
Activity recording
Activity paused
No activity recording
Wi-Fi Status
Wi-Fi connected (Weak: 1-2 bars)
Wi-Fi connected (Strong: 3-4 bars)
Wi-Fi not connected (no bars)
Wi-Fi searching (animated)
GPS Status
GPS connected (Weak: 1 bar)
GPS connected (Strong: 2-3 bars)
GPS not connected (no bars)
GPS searching (animated / blinking)
Page 15
15
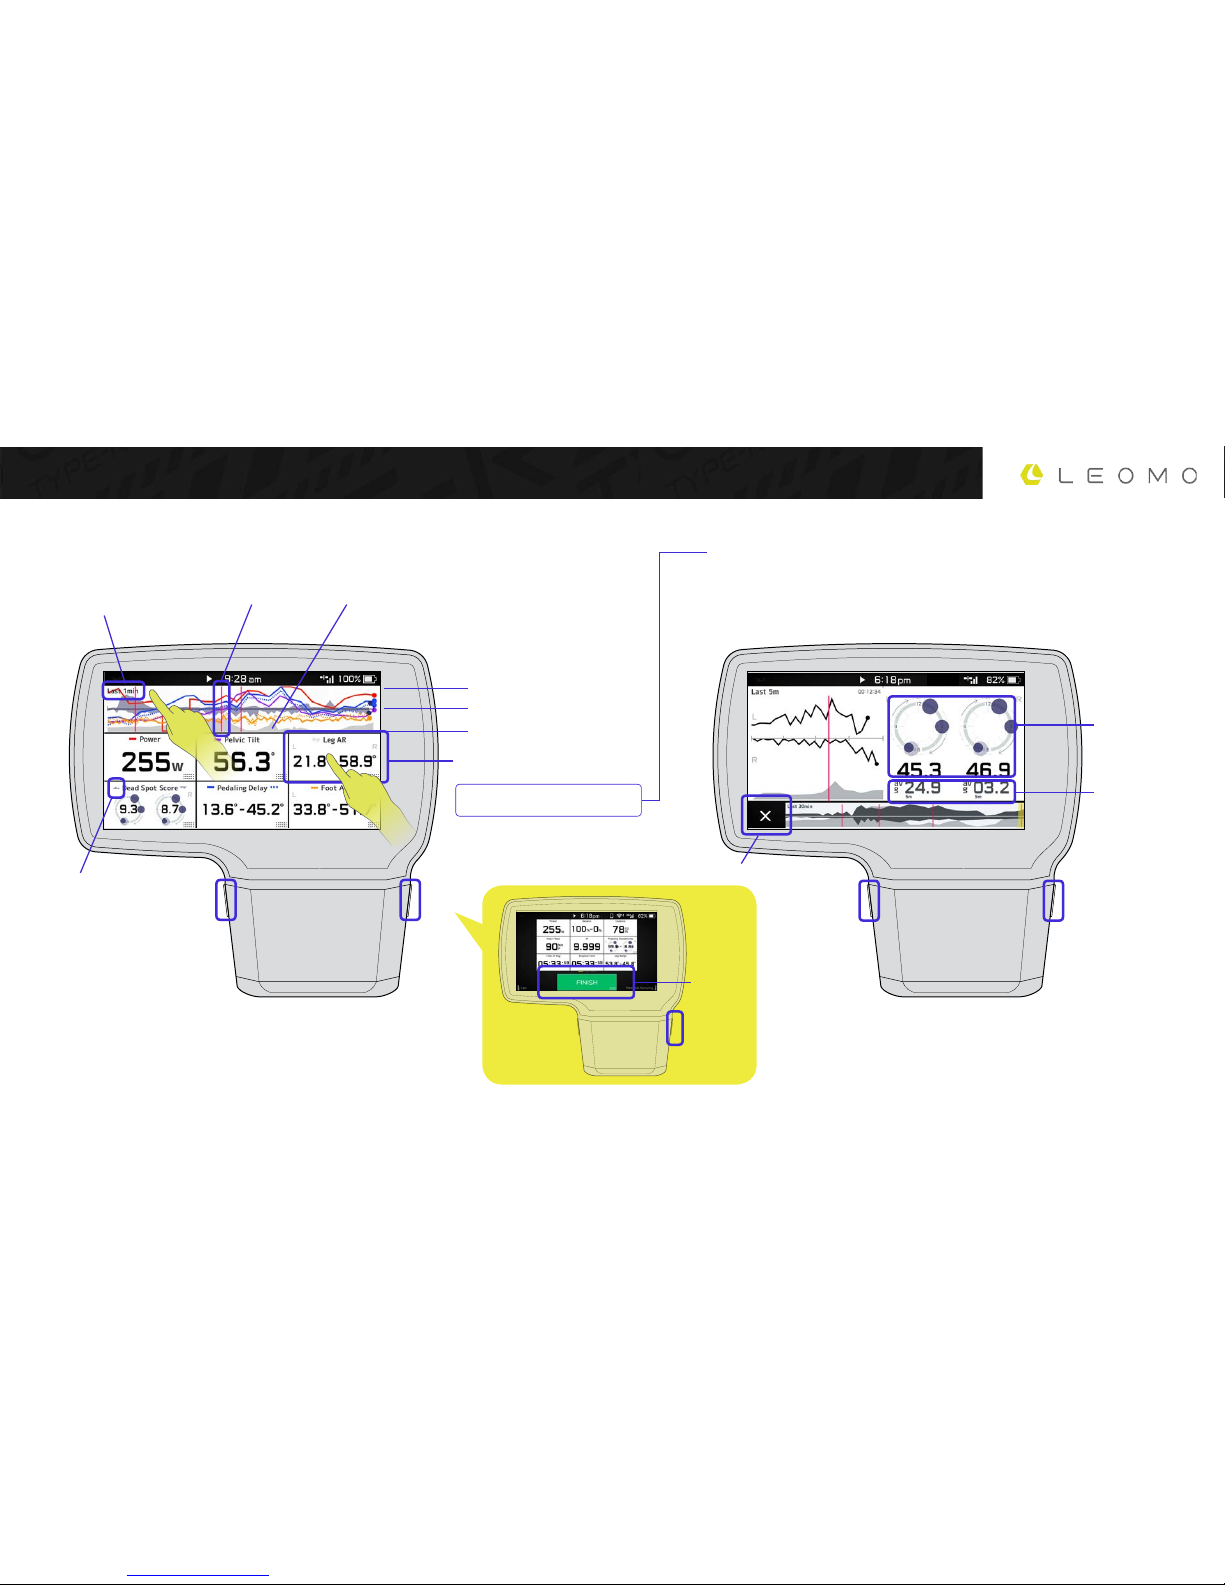
ACTIVITY SCREENS
Lap Line ElevationGraph range
Tap graph anywhere to change
range.
Data Box
Short press - turn graph on/o
Long press - open data detail
page
0 for “Balance“ values
0 / Min point (scaled)
Max point (scaled)
Average
last 5 min
Current
value
Graph icon
graph type
(standard or
balance), graph
color, graph on/
o status
Pause
Unpause
Close
Lap
Finish
Activity
Data Pages Data Detail Page (MPIs only)
PauseLap
Page 16
16
CUSTOMIZING THE TYPE-R
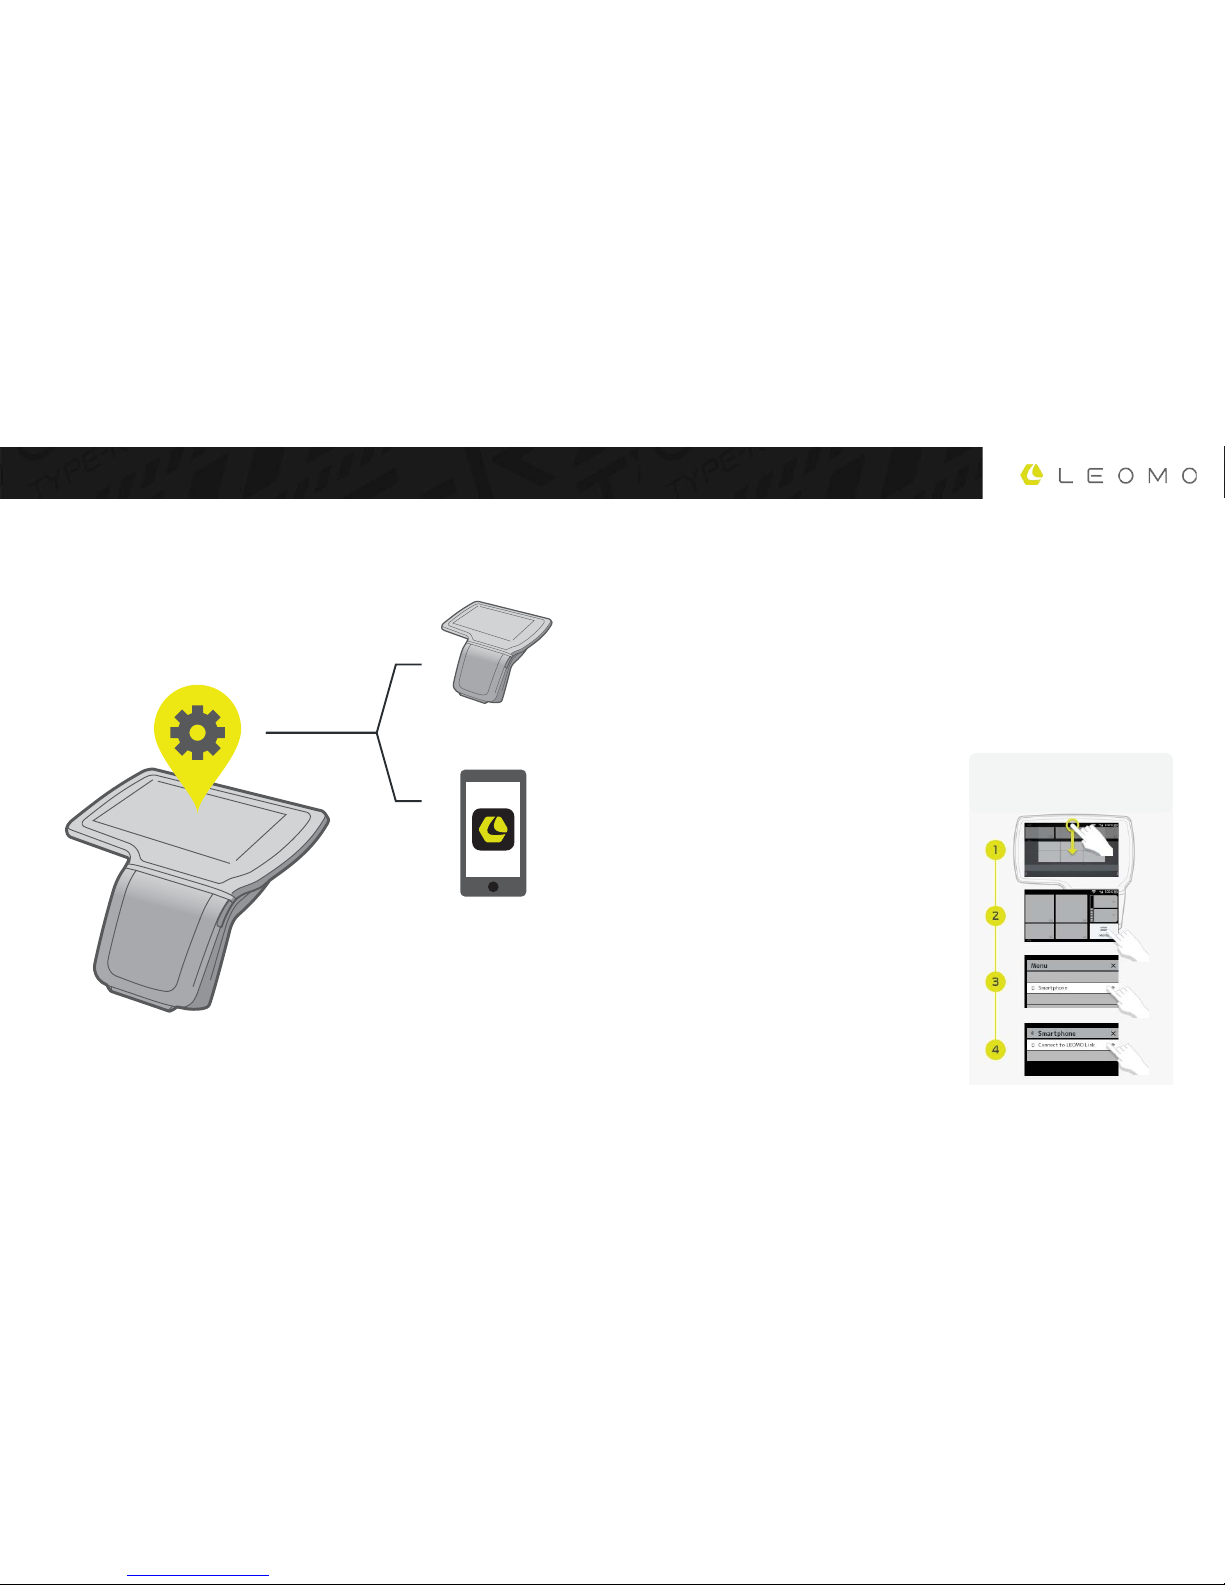
Edit Through LEOMO Link
• Adding, removing, and conguring Wi-Fi networks
on the TYPE-R
• Data page layouts
• FTP, Power Zones, etc
• Time, date, and unit formats
• Account Information
To customize your TYPE-R through LEOMO Link, open the LEOMO Link
app on your smartphone, then on the TYPE-R,
go to Menu > Smartphone > Connect to LEOMO Link. The TYPE-R
and LEOMO Link app should automatically connect.Note that your
smartphone and TYPE-R must be linked, not just paired, for them to
connect. Once connected, you can edit your TYPE-R’s settings through
LEOMO Link. For troubleshooting, please check the link on the end of
this manual.
Directly on the TYPE-R
• Adding, removing, and conguring up motion
sensors
• Adding, removing, and conguring up ANT+
sensors
• Choose Wi-Fi connection
• GPS on/o
Setup
Accessing the “connect to LEOMO
Link” screen
Page 17
17
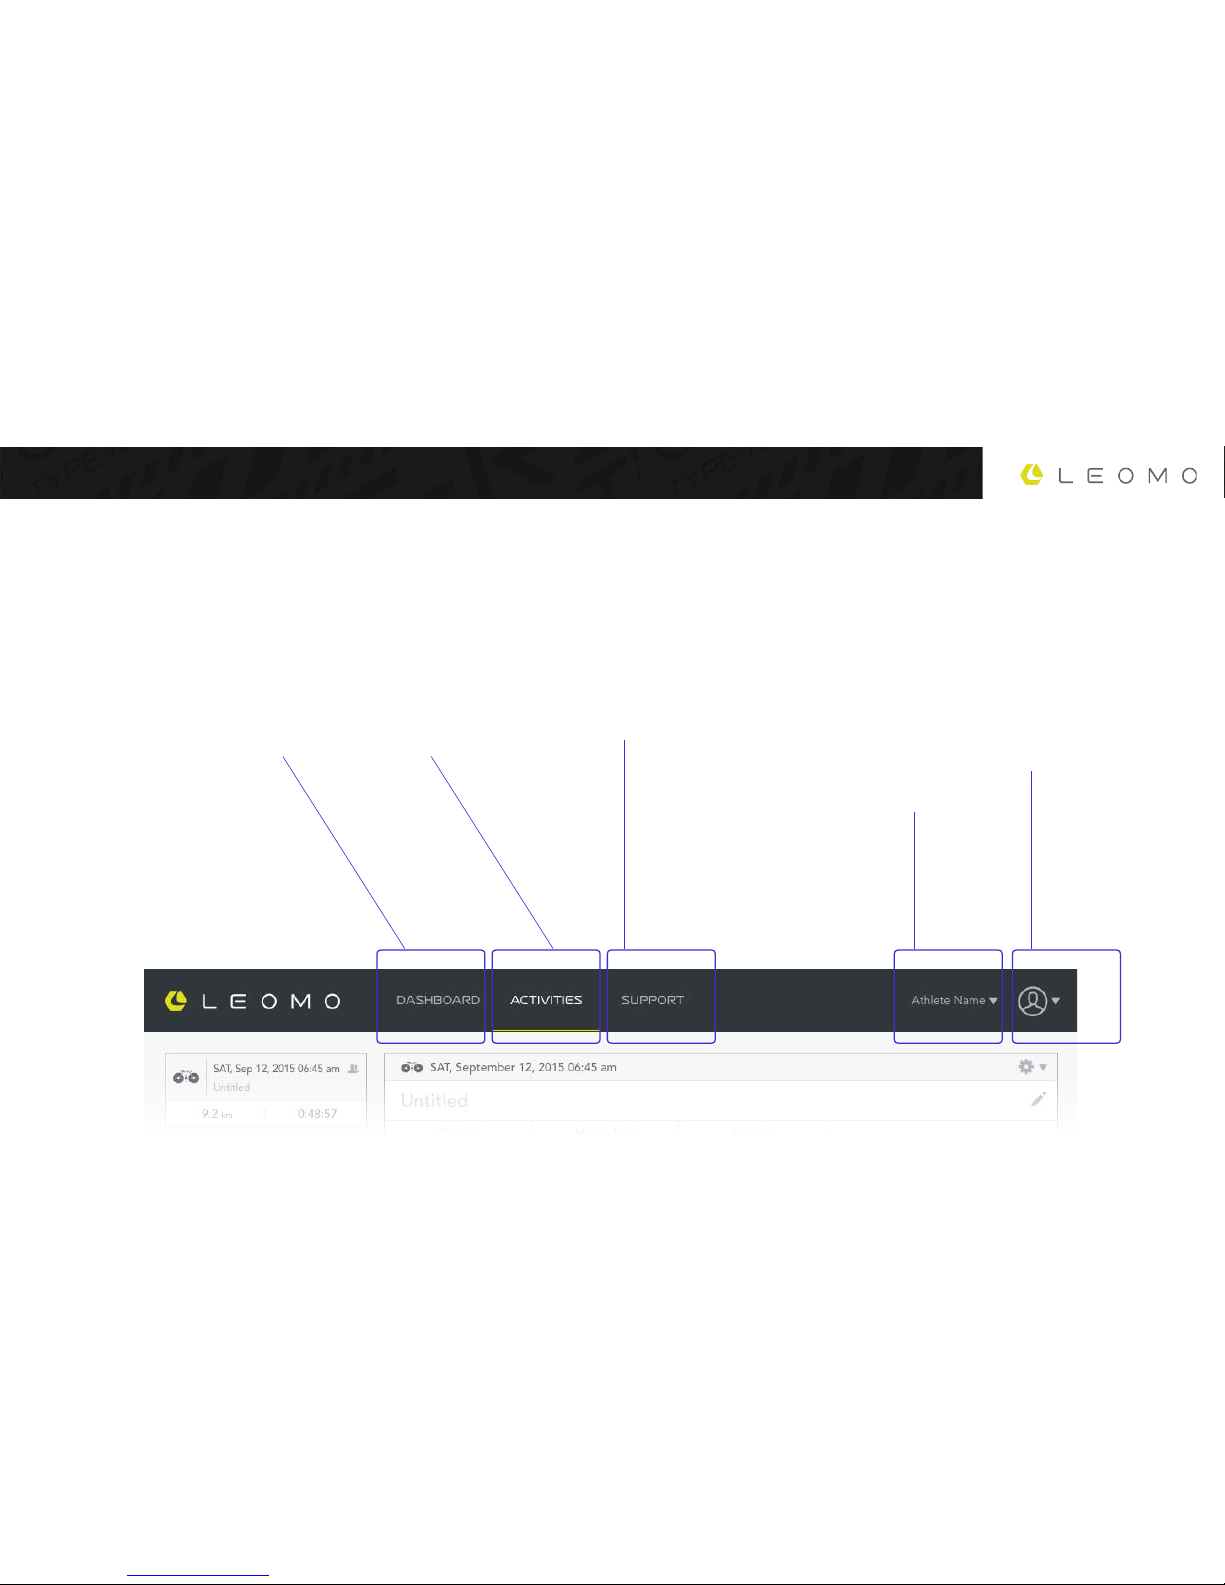
LEOMO WEB APP
Dashboard
Summary of athlete’s data.
HEADER
Activities List
List of athlete’s activities.
Support
Link to LEOMO’s help center.
Athlete
Displays the active athlete. If you
are a coach, athletes registered
under your name will be accessible
here. To register athletes, please
contact LEOMO.
Account
Your account information.
Page 18
18
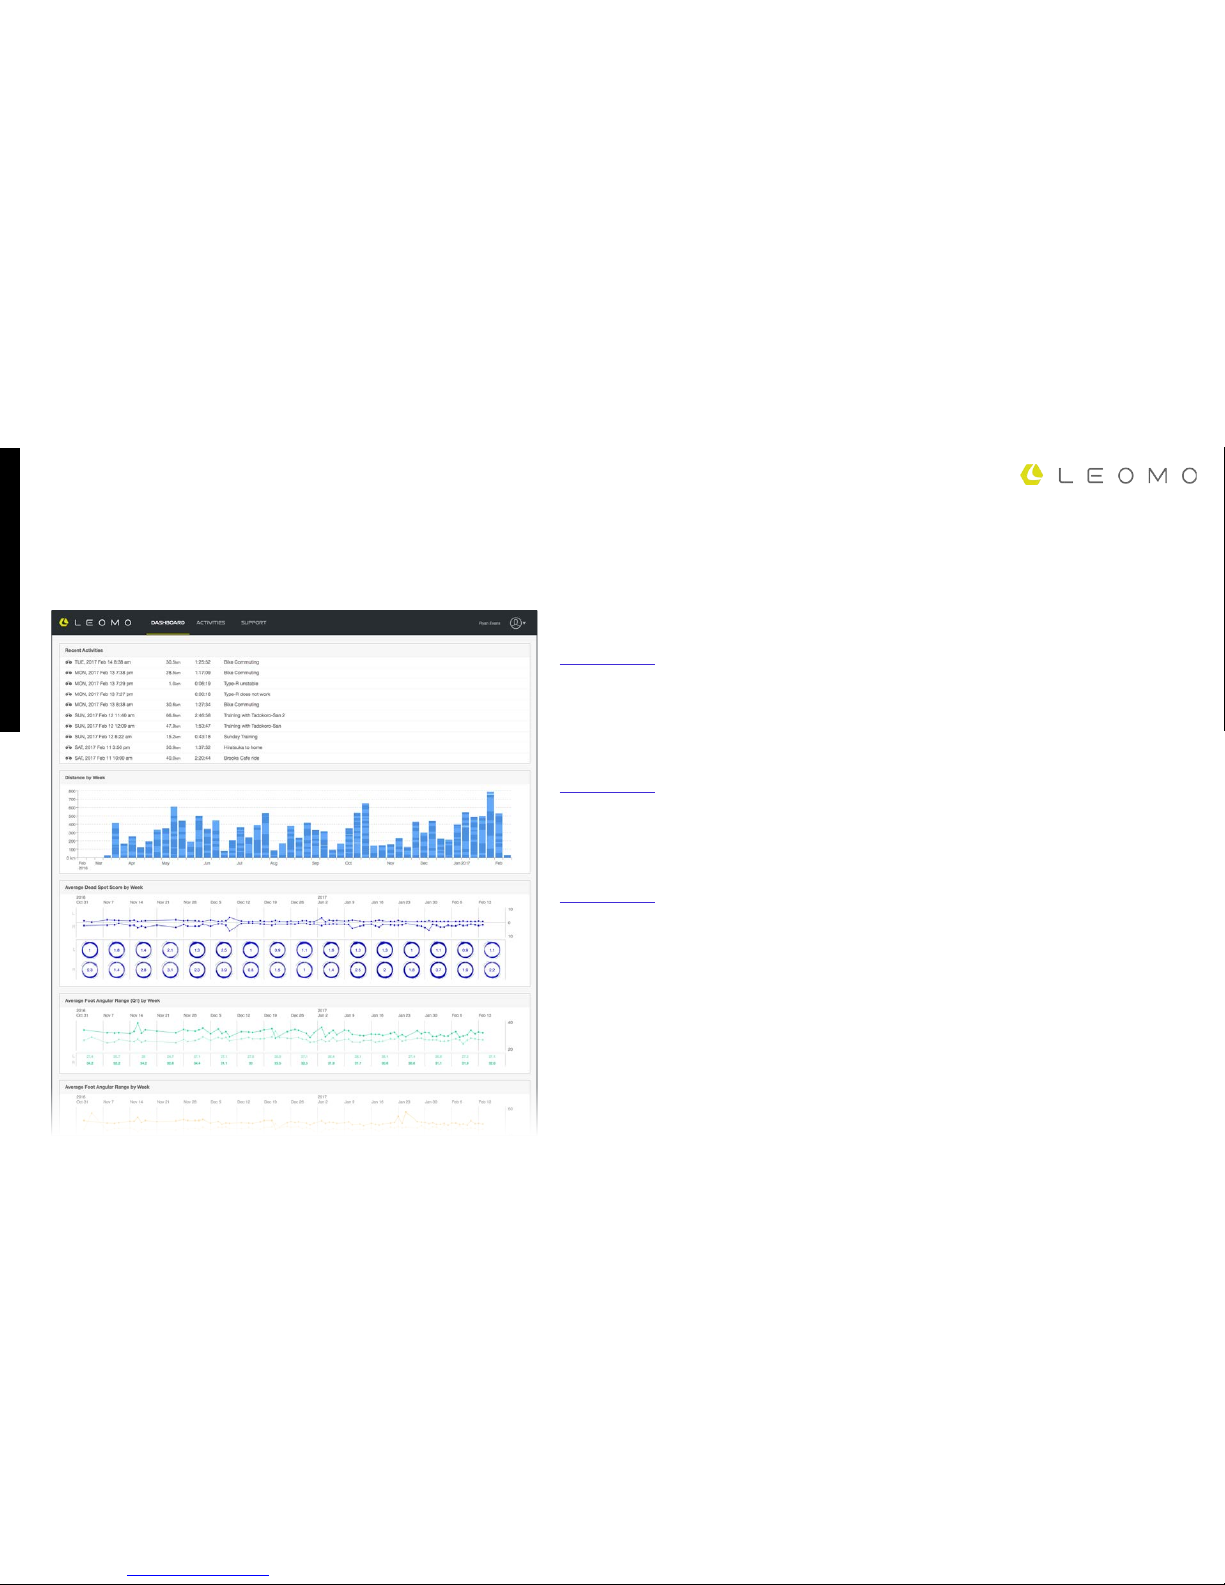
LEOMO Web App
Recent Activities
List of your (and if you’re a coach, your athlete’s) activities.
Distance Traveled
Distance traveled per week for one year.
MPIs Summaries
Summaries of all motion data types.
DASHBOARD
Page 19
19
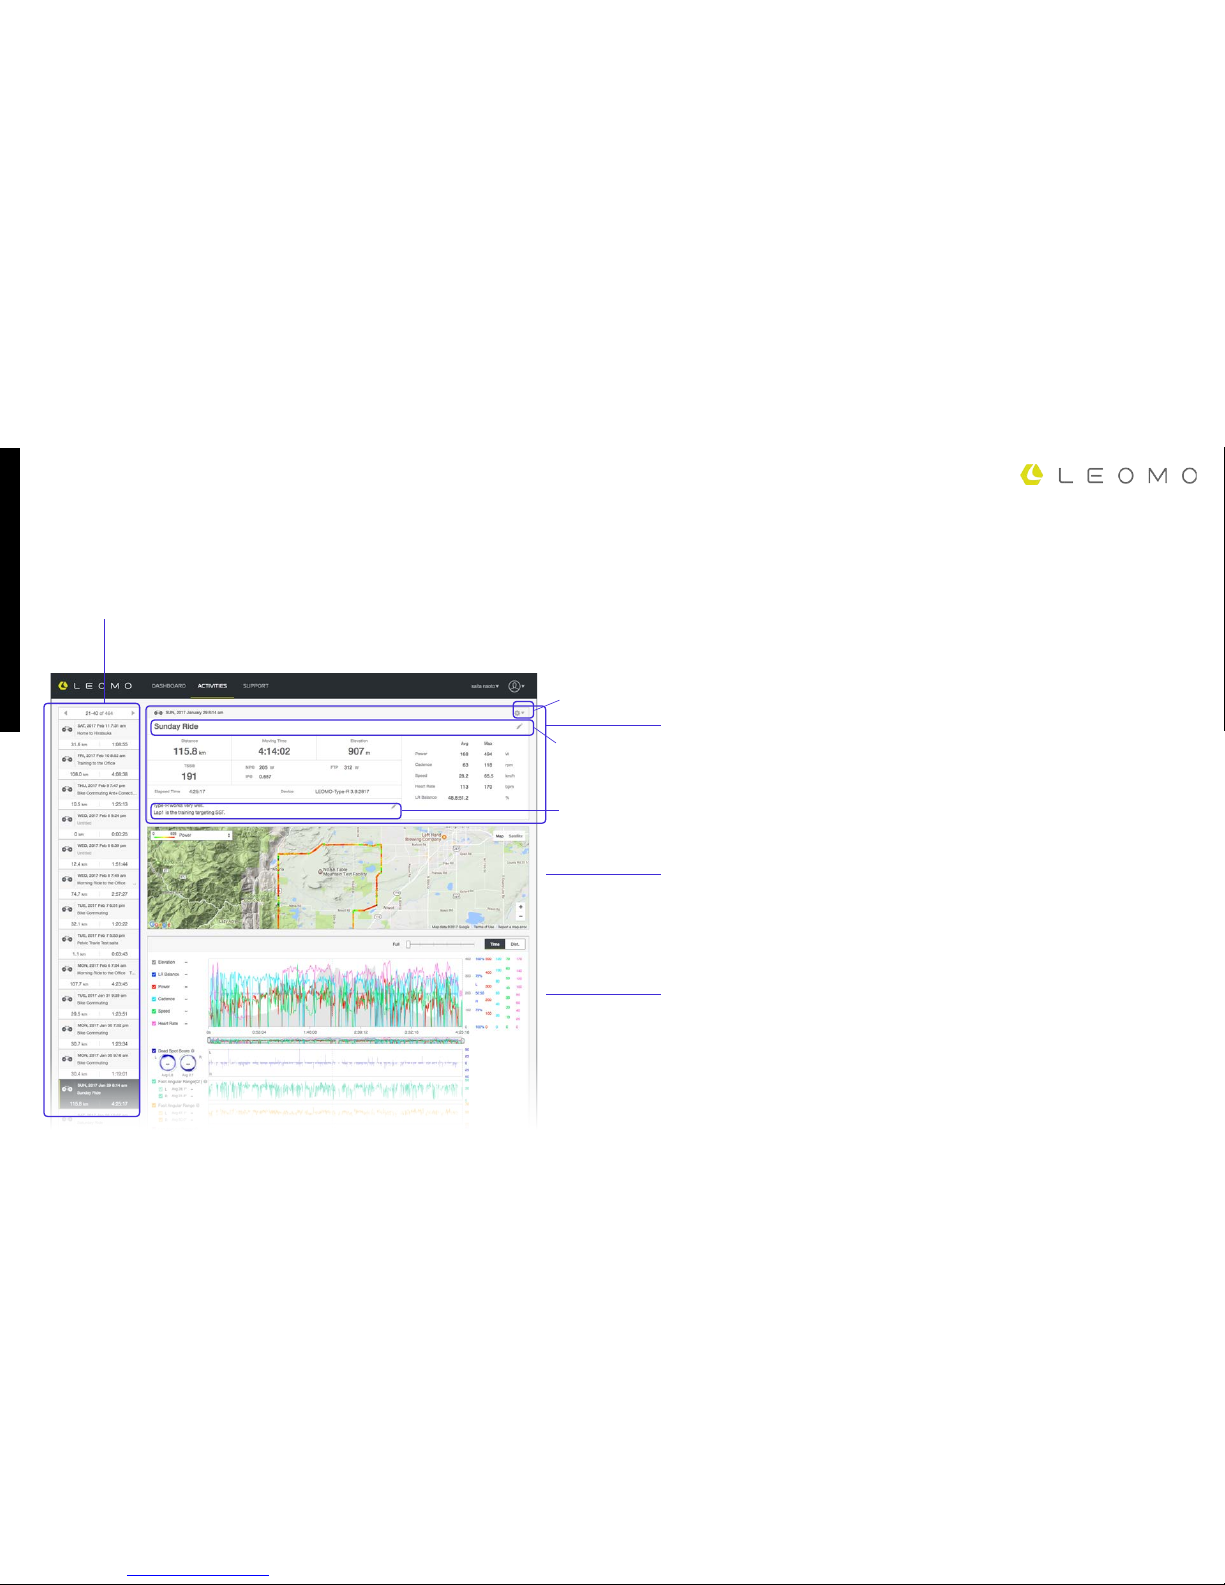
LEOMO Web App
Activity List
List of all activities.
Map
GPS data of your activity.
ANT+ Sensor and GPS Graph Data
Collected data from connected ANT+ sensors and GPS.
Activity Summary
Summary of this activity.
All owners can edit the “Title” and “notes” section by clicking on it. Make sure to save your notes
when done. You can also share / export / delete the actiivity data from Activity Settings.
ACTIVITIES
Activity settings
Activity title
Activity notes
Page 20
TITLE
20
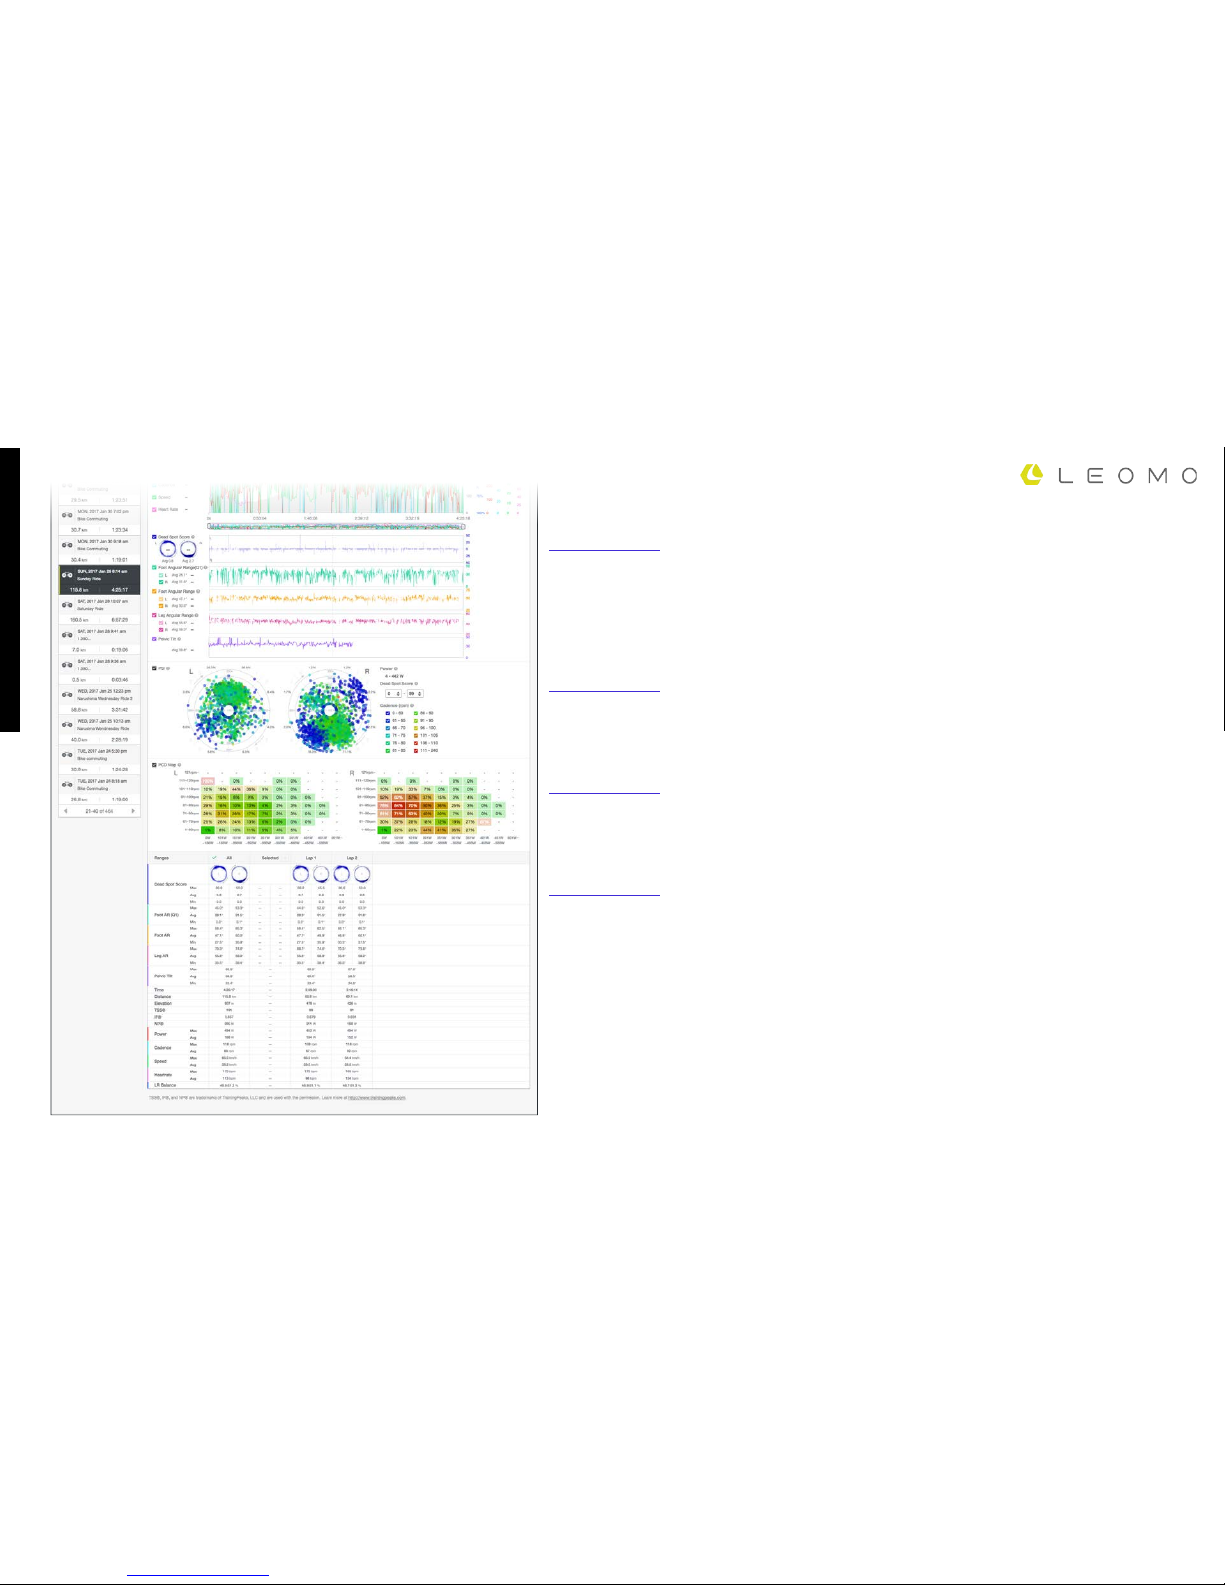
Motion Sensor Graph Data
L and R data collected from connected motion sensors.
Range Details
Details for laps / ranges in the activity.
- Tap on a range to zoom into selected range in the above graphs.
- Select a range in the graphs above and tap “+” on “selected range” to save range.
Pedal Stroke Intelligence (PSI)
Cross analysis of power, cadence, and dead spot score.
PCD Map
Maps power / cadence combinations that has the most dead spot scores. Higher opacity means
more strokes in that combination. Hover your mouse over each cell to show stroke count with
DDS / total stroke count.
Page 21
21
MOTION AND TRAINING
WHY MOTION?
Endurance. Power.
Technique.
When these three core skills come together, riders
have the key ingredients to reach their maximum
performance potential. Though endurance and
power are universally used as the basis for
cycling training, technique has been a challenging
element to measure. Skills such as pedaling,
positioning, breathing, muscle de-tension,
cornering, and sprinting are all qualitative cycling
elements.
Thankfully, coaches know good pedaling skills
and form when they witness it. With the TYPER’s Motion Performance Indicators, or MPIs,
coaches will now have actual values to validate
their observations. MPIs give an edge to their
assessments by making them more precise,
more communicable, and more trackable. MPIs
measure various motions related to cycling, and
using them, coaches and athletes can:
• Perform a deep analysis of movement versus power, cadence,
and fatigue.
• Establish baselines for various physical conditions and
situations.
• Discover clues to improving both tness and technique.
Since everyone’s bodies and riding environments
are different, each person has their own baseline
values, similar to FTP. LEOMO is working with
world-class coaches and research centers to
continue to improve and expand MPIs to help
coaches zero in on the analysis of technique.
Page 22
22
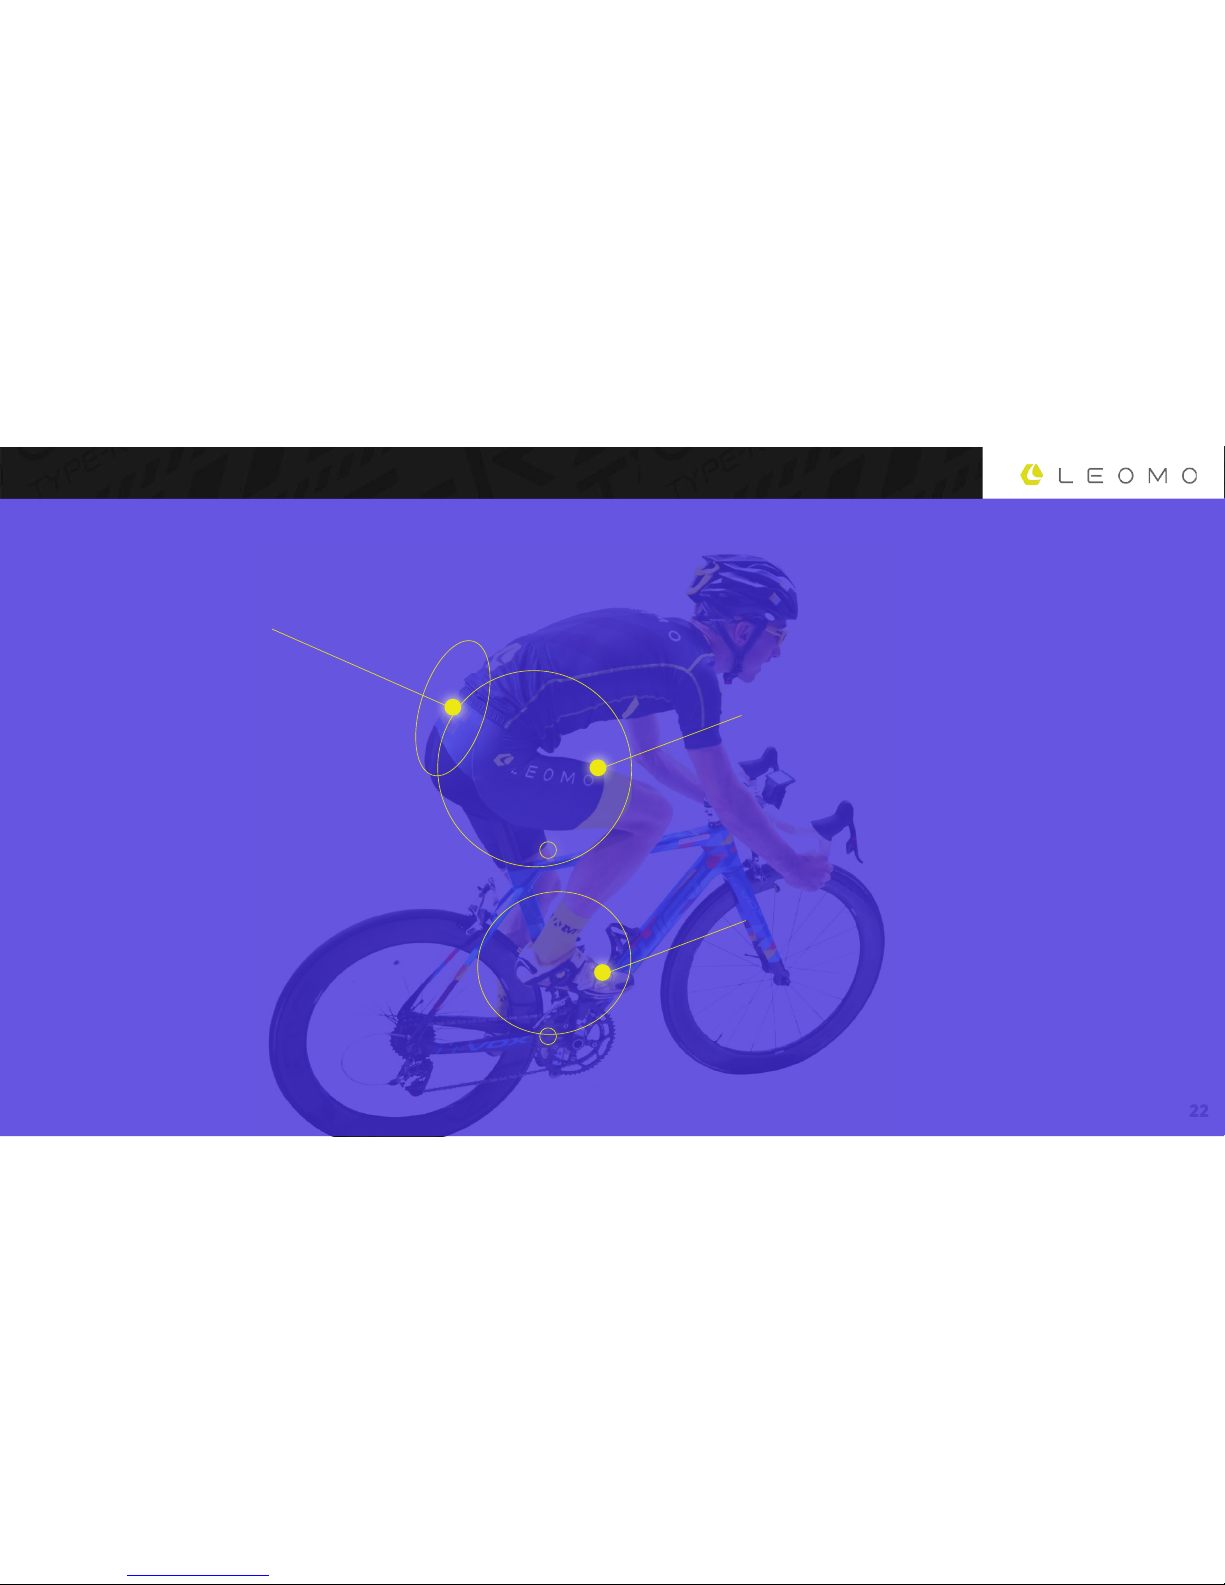
MOTION PERFORMANCE INDICATORS
LEG ANGULAR RANGE
DEAD SPOT SCORE
FOOT ANGULAR RANGE
FOOT ANGULAR RANGE (Q1)
coming soon
FOOT ANGULAR RANGE (Q2, Q3, Q4)
PELVIC TILT
coming soon
PELVIC TRAVEL (X,Y,Z)
PELVIC ROTATION (X,Y,Z)
The TYPE-R comes with five motion sensors and records five
types of Motion Performance Inidicators (MPIs).
Page 23
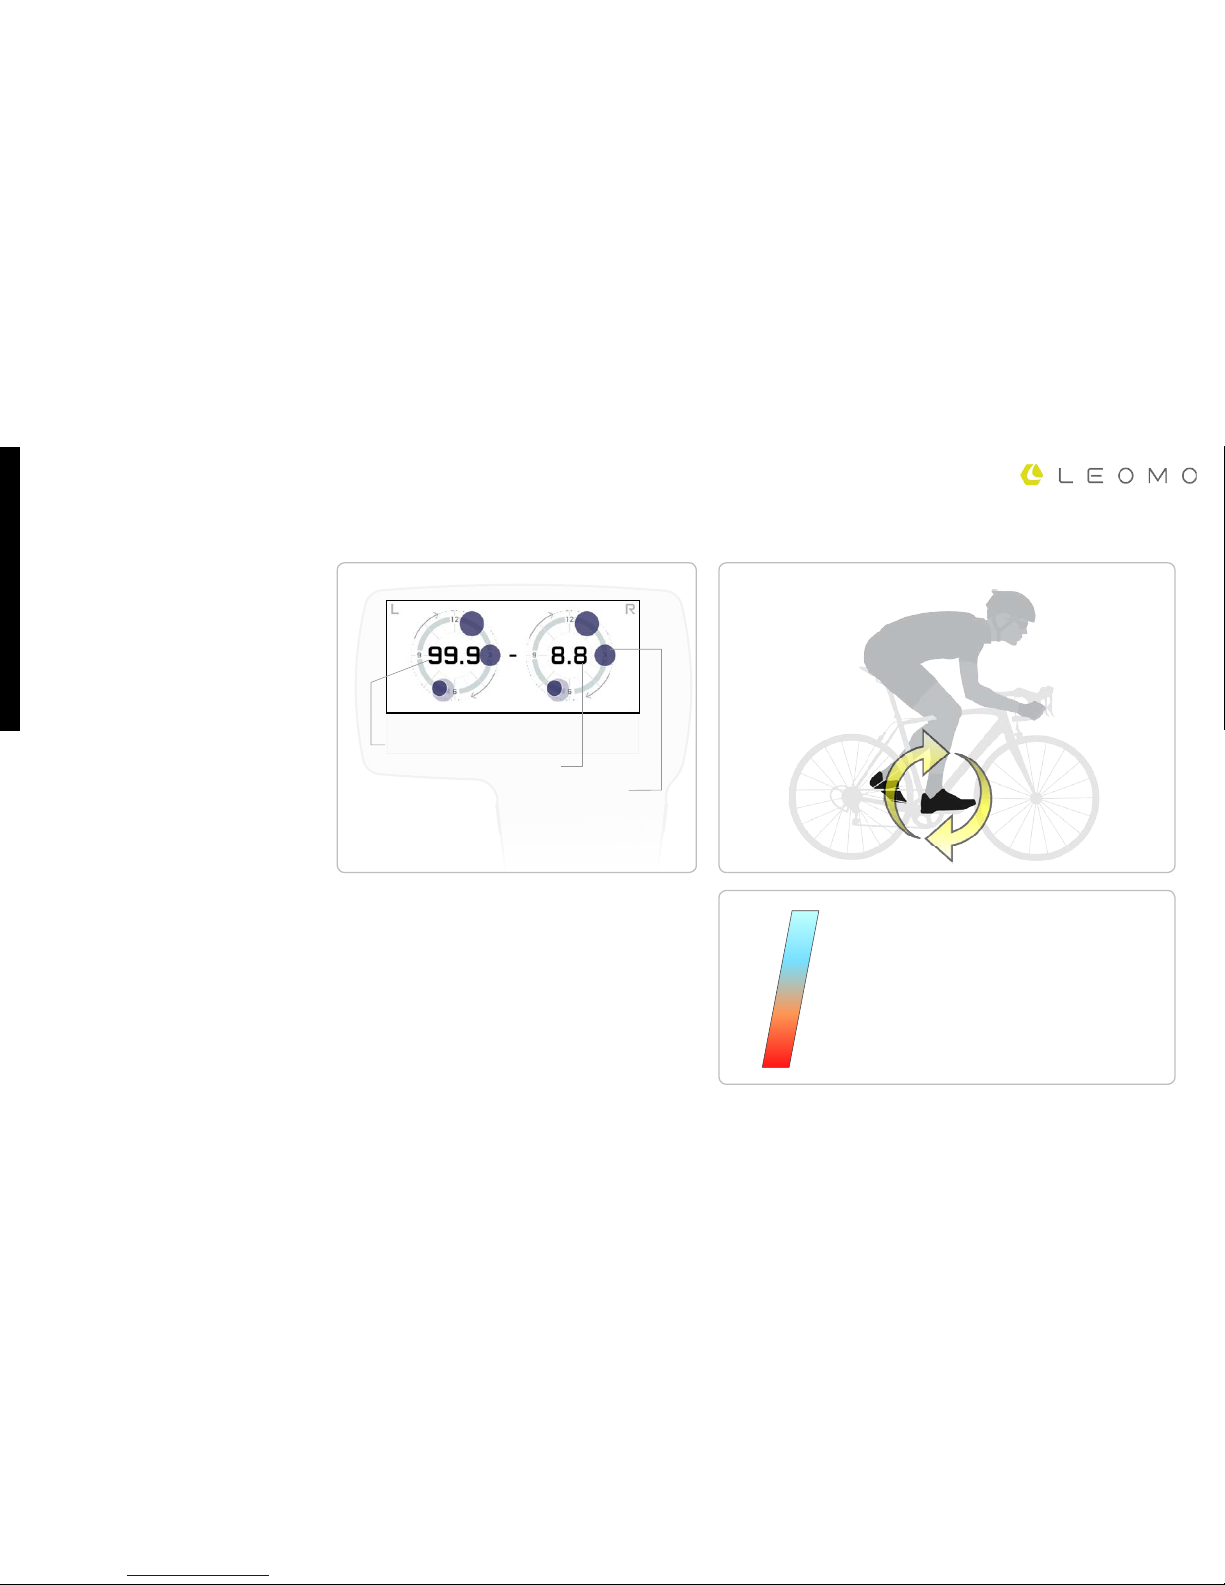
DEAD SPOT SCORE (DSS)
FRONT >
< BACK
rating
motionDisplay
Motion Performance Indicators
0.0
10.0
Optimum pedaling with little to no
dead spots
Unsmooth pedaling
Extremely unsmooth pedaling
23
>20.0
SCORE
The center value shows the total sum of
magnitudes (measured in degrees/sec) of the
dead spots that occurred in a single pedaling cycle.
Each dead spot is represented along the pedaling
stroke, with the size showing the magnitude of
deviation from a smooth angular velocity.
Left DSS (total for one cycle)
Right DSS (total for one cycle)
Dead spot Location and Magnitude (Dark Circle =
Last cycle, Light Circle = Previous cycles)
Summary
Dead Spot Scores (DSS) pinpoint the magnitude
and locations where pedaling velocities lack
smoothness along the left and right pedaling
cycle.
- Lack of smoothness is a secondary symptom of
sub-optimal pedaling motions.
- Looking at the right and left DSS values provides
insight to left/right movement imbalances.
DETAILS
A “dead spot” is where pedaling power is lost
when sub-optimally shifting from one movement
pattern to another during a pedaling stroke (such
as the shift between the power and recovery
phase).
Optimal pedaling motions are smooth and apply
less stress to the body than sub-optimal pedaling
motions. DSS is measured by the foot’s angular
velocity, where any deviation from a smooth
angular velocity sine curve is considered a dead
spot. Each dead spot is represented along the
pedaling cycle by a lled circle, and a circle’s size
indicates the magnitude of deviation.
Since dead spots are caused by many factors, a
trained coach must nd the primary cause of a
high DSS. One known cause of a high DSS is the
overuse of less powerful secondary muscles (such
as hamstrings) over larger primary muscles (such
as the glutes).
Page 24
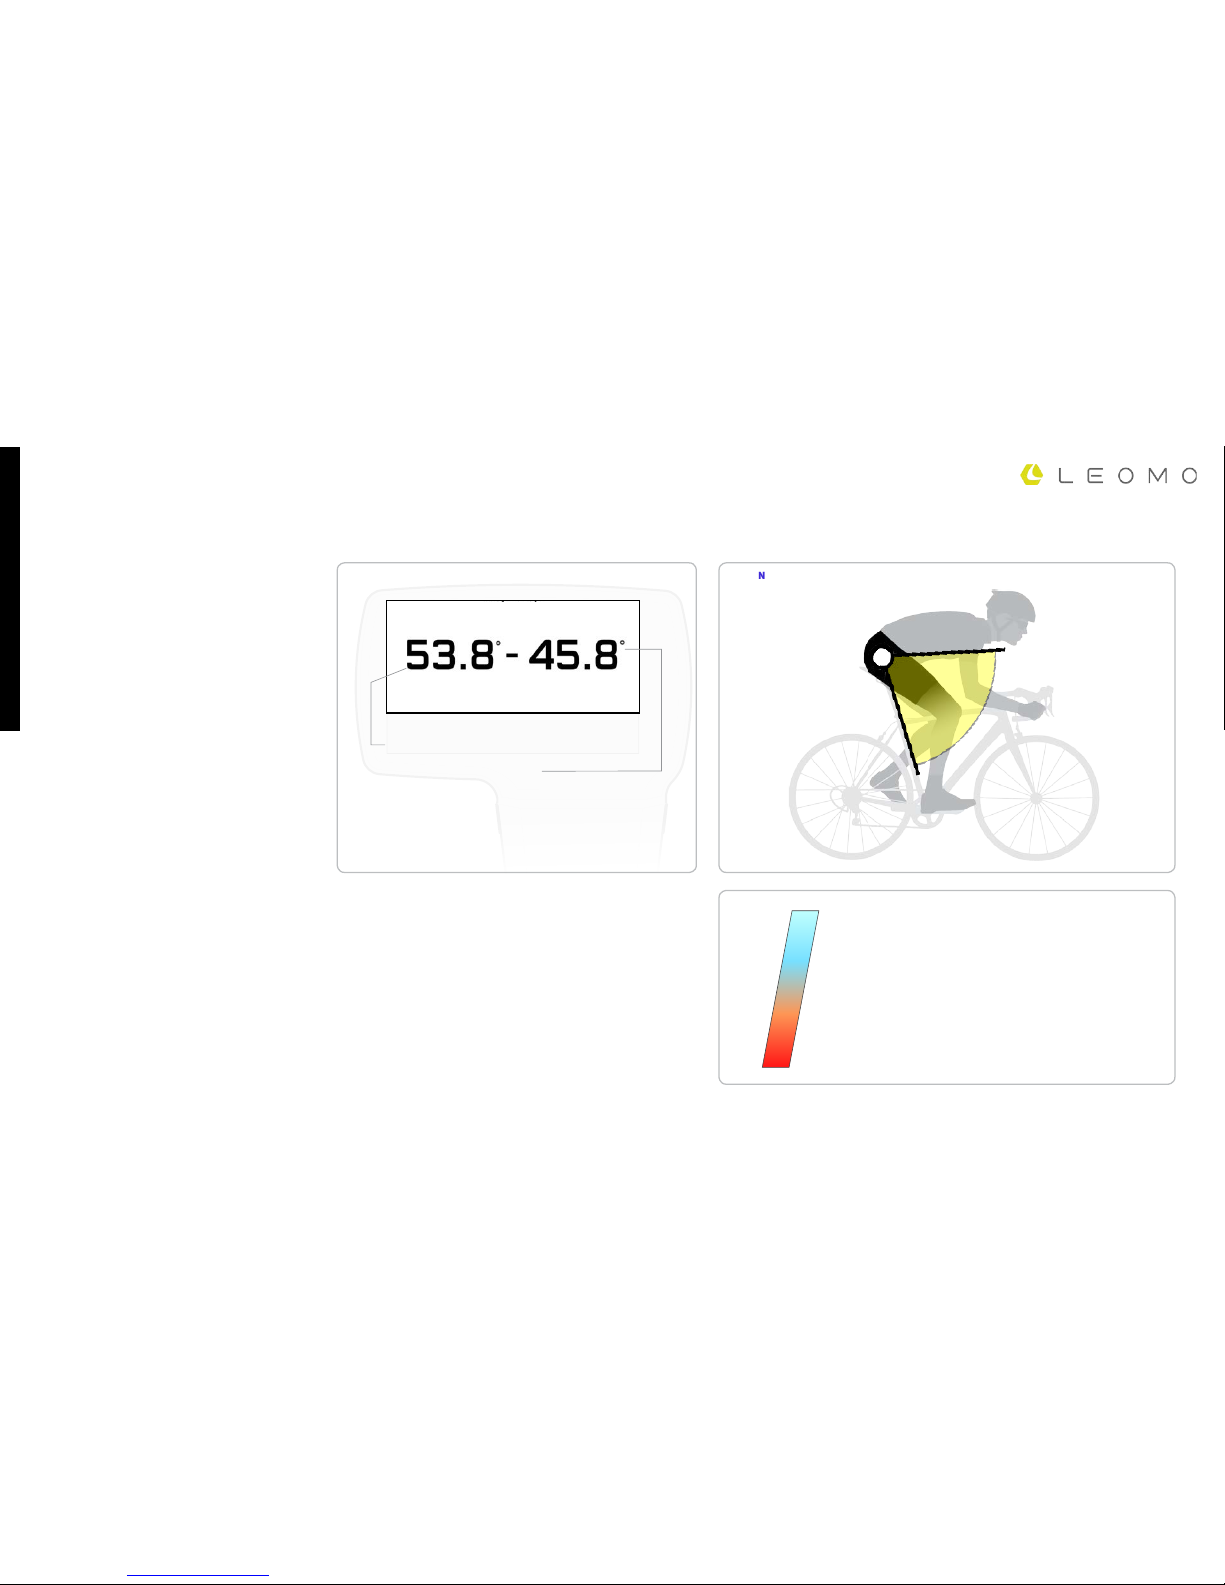
rating
motionDisplay
Motion Performance Indicators
24
50.0°
45.0°
Normal Range
Small range
Large range
>60.0°
Left Leg Angular Range
Right Leg Angular Range
Summary
Leg Angular Range measures how much the thighs
move up and down while pedaling.
- Looking at right and left Leg AR values provides
insight to left/right movement imbalances.
DETAILS
The Leg Angular Range is calculated by subtracting
the angle of the thigh at its lowest point from
its highest point. An athlete should attempt
to maximize their Leg Angular Range without
sacricing a stable pelvic tilt or an aggressive torso
angle. Leg Angular Range should not be increased
using incorrect form or bad bike t, such as by
hyper-extension of the knee, a low saddle height,
increasing the Foot Angular Range, by crank
lengthening, etc.
SCORE
The up-to-down angular range of the left and right
thighs (with the hip as the vertex) along a pedaling
stroke, in degrees.
LEG ANGULAR RANGE (LEG AR)
L
R
Page 25
rating
motionDisplay
Motion Performance Indicators
25
Static range
General Range
Very dynamic range
>65.0
50.0
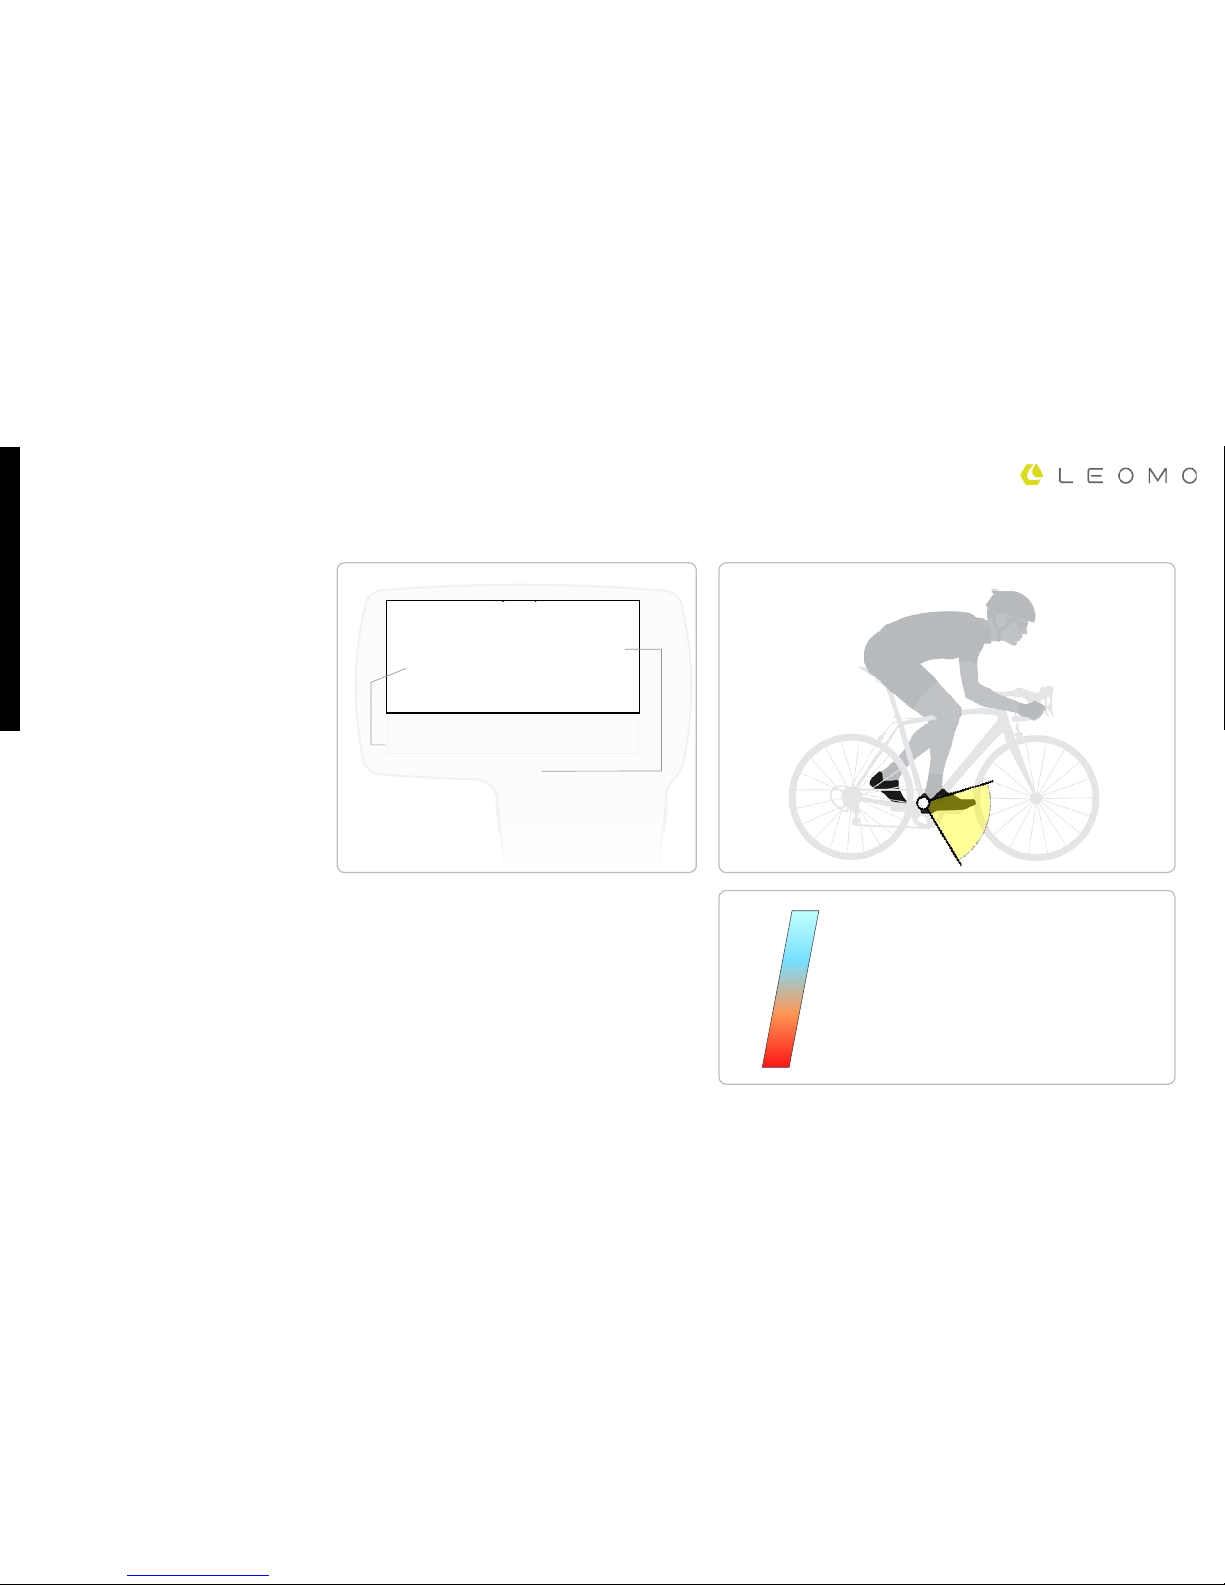
0.0
Left Foot Angular Range
Right Foot Angular Range
Summary
Foot Angular Range measures how much the heel
moves up and down while pedaling.
- Looking at the right and left Foot AR values
provides insight to left/right movement
imbalances.
DETAILS
The Foot Angular Range is calculated by
subtracting the angle of the foot at its lowest
point from its highest point. This score is mainly
used for characterizing an athlete’s pedaling. The
bigger the Foot Angular Range, the higher the
heels rise during the 9 - 12 o’clock phase, and the
more that ankling occurs between 0 - 6 o’clock.
SCORE
The up-to-down angular range of the foot (with
the pedal as the vertex) along a pedaling stroke,
in degrees. The lower the range, the easier it is for
the leg to transfer power to the pedal.
FOOT ANGULAR RANGE (FOOT AR)
L
R
46.7°- 43.9°
Page 26
rating
motionDisplay
Motion Performance Indicators
26
>30.0
0.0
Large movement in Q1
Small movement in Q1
Left Foot AR Q1
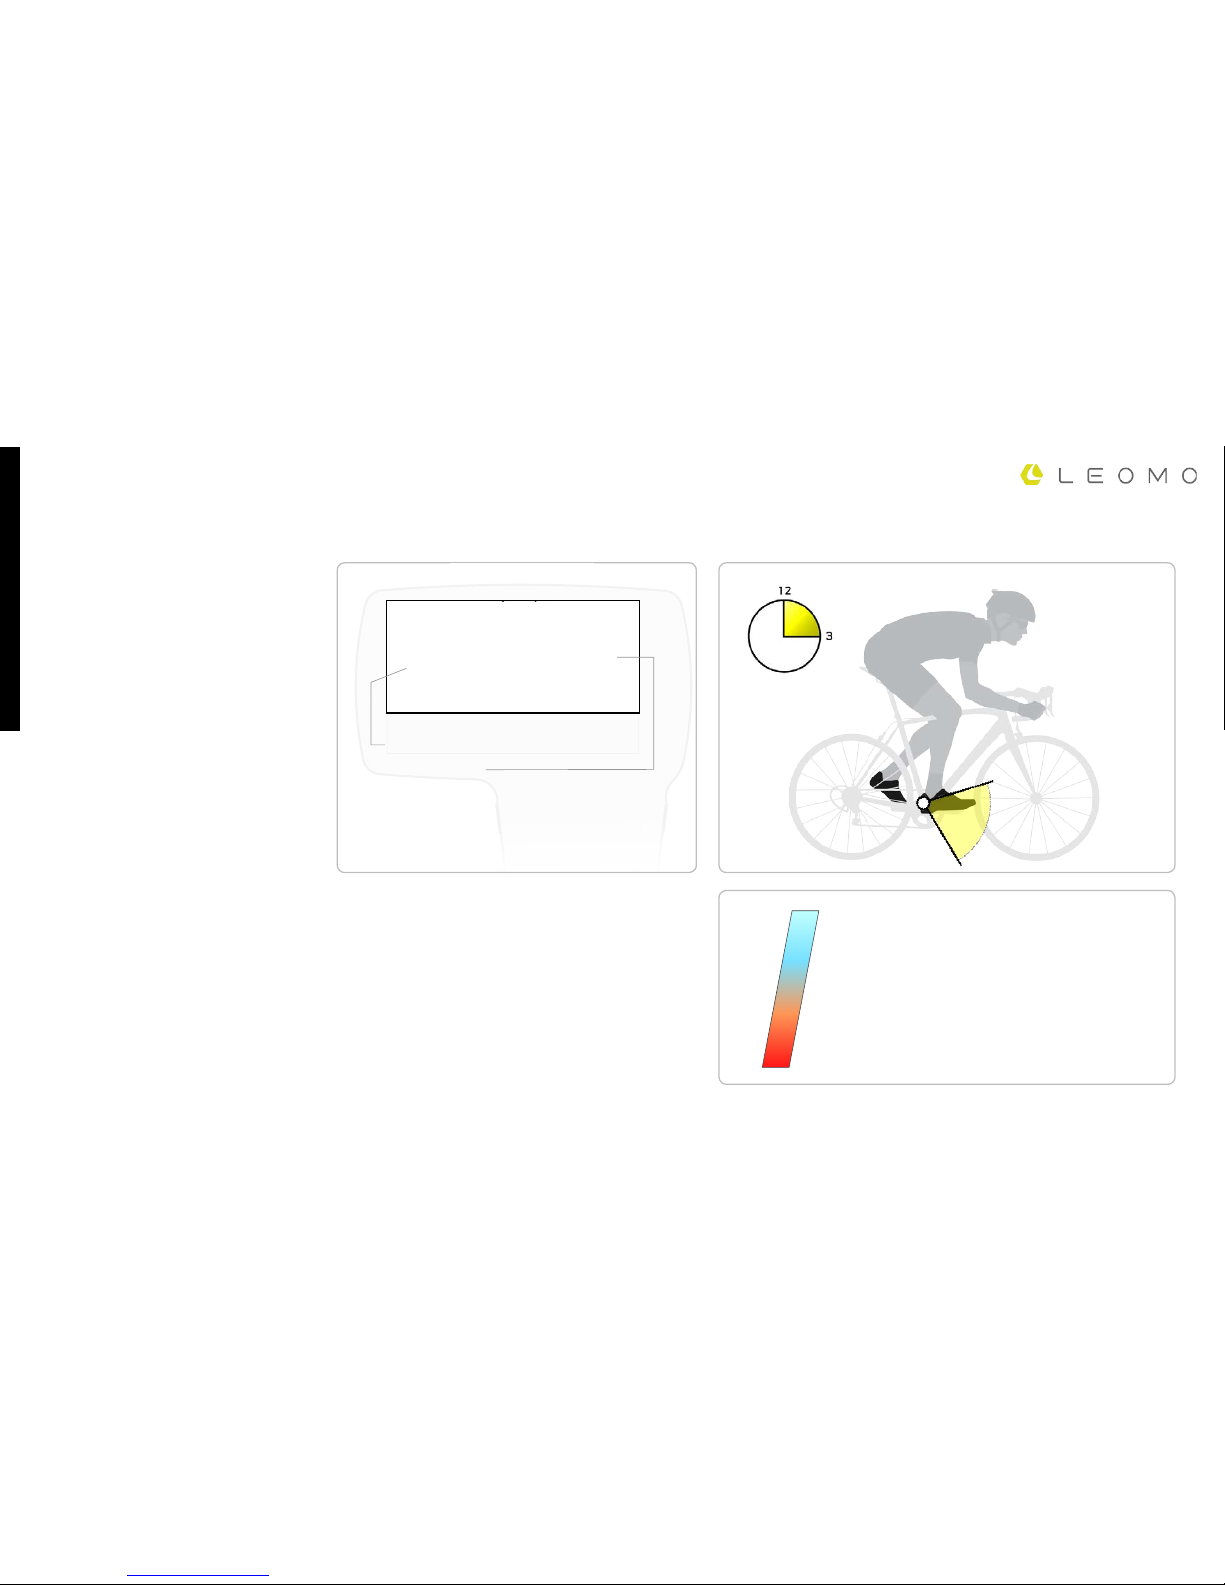
Right Foot AR Q1
Summary
Foot Angular Range (Q1) shows the foot angular
range of the rst quadrant of the pedaling cycle -
12 o’clock to 3 o’clock position.
- Looking at the right and left Foot AR (Q1)
values provides insight to left/right movement
imbalances.
DETAILS
A large FAR Q1 shows that the cyclist pushes
down hard after the 12 o’clock position, creating
a thrust around the 1 and 2 o’clock positions. By
pushing down earlier near the 12 o’clock position,
the cyclist minimizes the total angle the foot shifts
between the 12 - 3 o’clock position.
SCORE
Foot Angular Range (Q1) measures the range of
angular movement that occurs between the 12
and 3 o’clock position. The higher the range, the
longer the delay for the “push down” motion to
start for the power phase.
FOOT ANGULAR RANGE Q1 (FOOT AR Q1)
L
R
0.2°- 12.5°
Page 27
rating
motionDisplay
Motion Performance Indicators
27
Upright
Tilted
>55.0
<45°
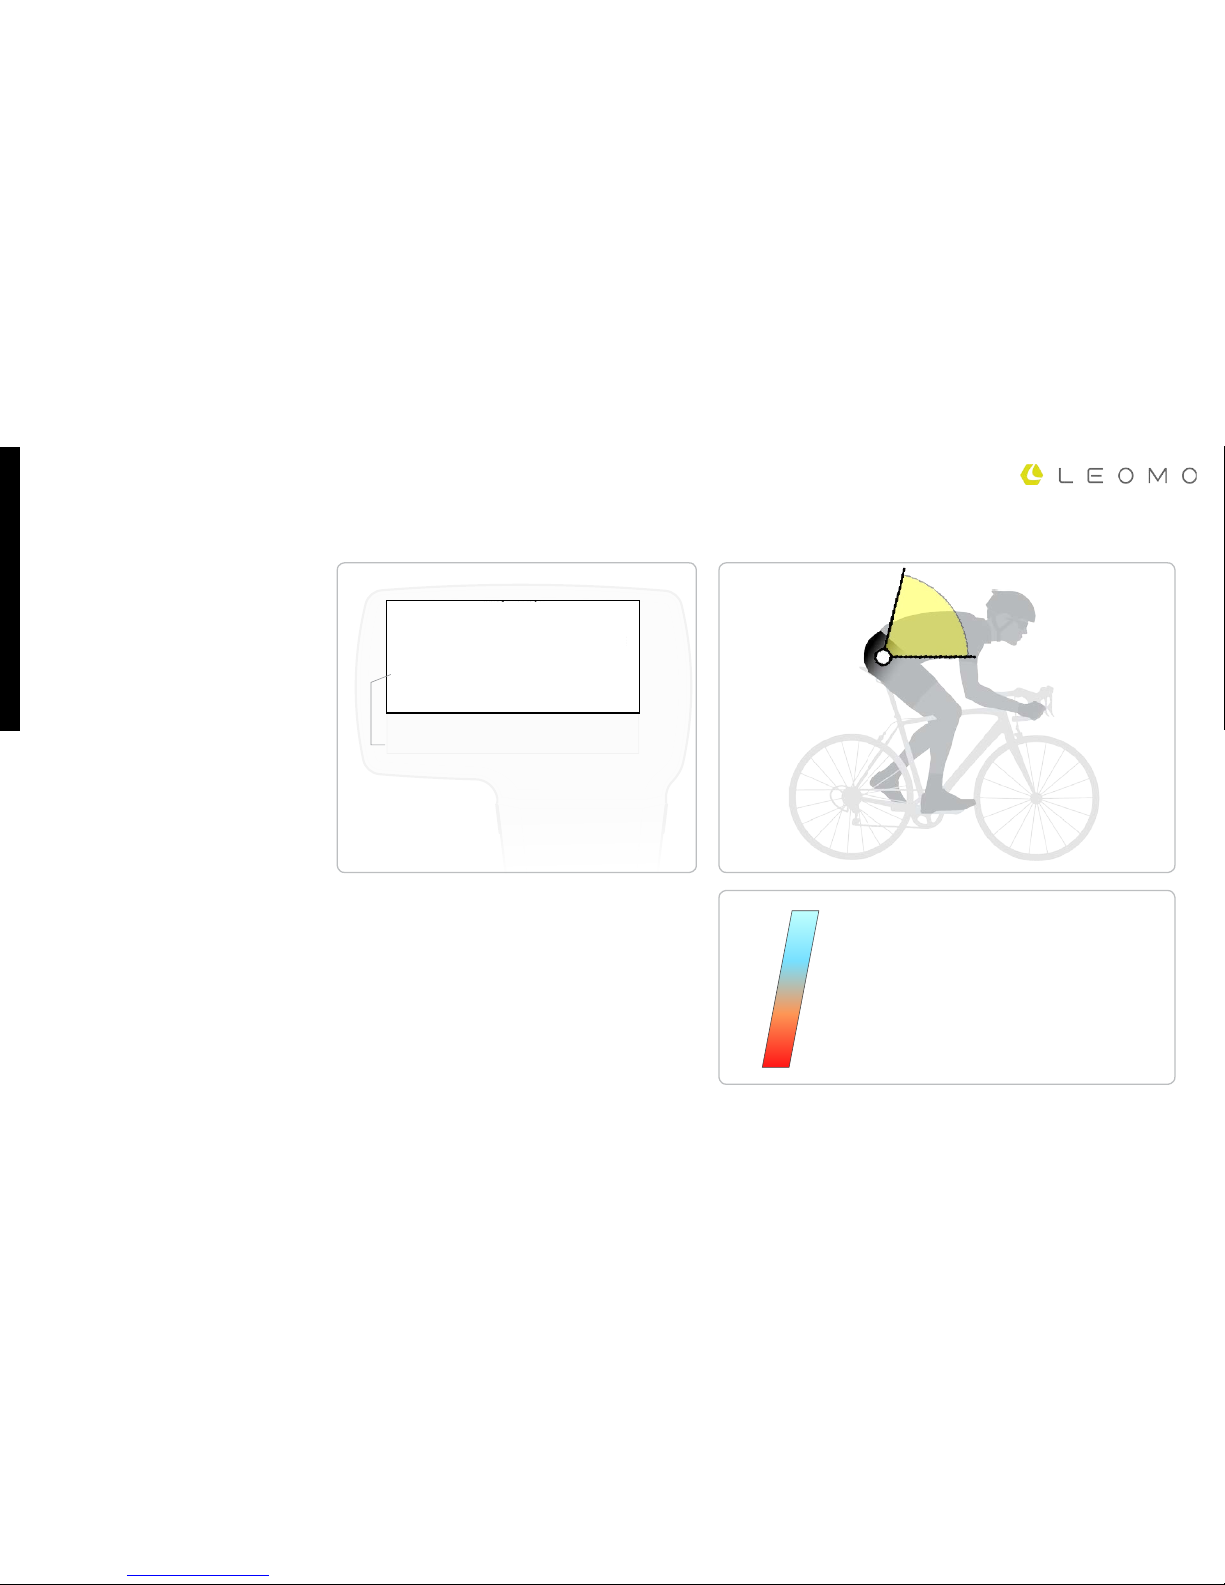
Pelvic Tilt
Summary
Pelvic Tilt measures how much the pelvis is tilted
upwards.
DETAILS
Each cyclist has a dierent neutral pelvic
alignment. Finding a natural pelvis position
engages the core muscles and reduces lumbar
spine strain. Coaches have observed that riders
with an upright Pelvic Tilt have a higher chance of
back injury.
If the pelvis is tilted too far back, lumbar strain can
occur, and if the pelvis is tilted too far forward,
maximum Leg Angular Range cannot be achieved.
Also, posterior rotation of the pelvis reduces
power generation capability.
SCORE
The front-to-back (z-axis) angle of the hip. Straight
up is 90 degrees, while 0 degrees is parallel to the
ground.
PELVIC TILT
52.4°
Page 28
28
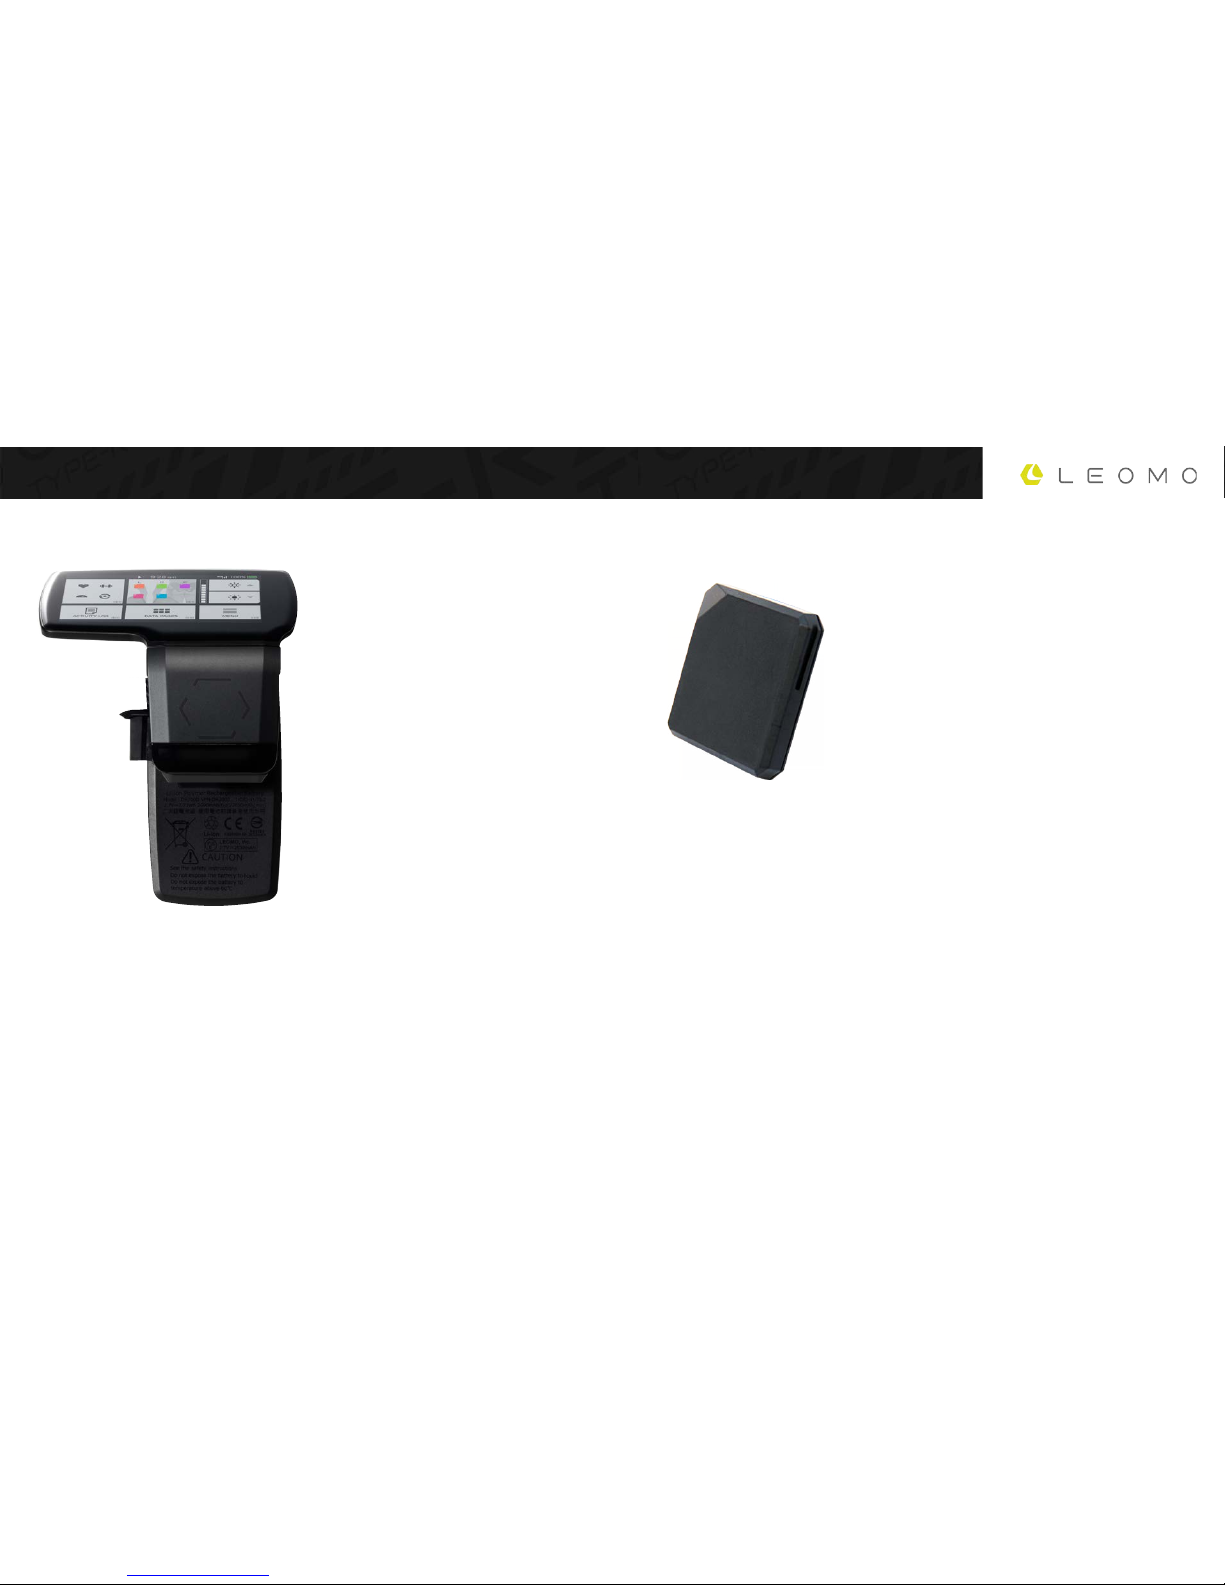
TECHNICAL INFORMATION
Size
• W 3.5” x H 3.3” x D 1.7”
Weight
• 84 g (w/ S Battery)
• 90 g (w/ L Battery)
• with Dock (w/ Dock Cap): + 32 g
• with Dock & Dock Charger: + 85 g
IPX Rating
• IPX 5
Wireless
• ANT+
• Bluetooth (For supplied LEOMO
Motion Sensors only), Bluetooth
Low Energy (For connection with
smartphone)
• Wi-Fi (802.11 b/g/n (2.4GHz), For data
connection)
Batteries
• Replaceable Li-ion Polymer
Rechargeable Battery
• L: 615mAh, S: 375mAh, Dock Charger
: 2030mAh
• Lasts up to 6.5 hrs
Memory
• 8GB Memory (6GB user available
space for about 30 hrs ride)
Size
• W 1.5” x H 1.5” x D 0.3”
Weight
• 12 g
IPX Rating
• IPX 7
Batteries
• Replaceable Li-ion Polymer
Rechargeable Battery
• Lasts up to 8 hrs
TYPE-R MOTION SENSOR
Page 29

 Loading...