

Page 1
International Electrical Symbols
Caution! Refer to this manual before using the meter
Meter is protected by Reinforced or Double Insulation
CONTENTS PAGE
1 INTRODUCTION..................................... 2
1.1 Instrument Features .............................. 3
2 SPECIFICATION..................................... 4
2.1 Electrical Data ....................................... 4
2.2 General Data ......................................... 8
3 OPERATING INSTRUCTIONS ............... 10
3.1 Rotary Switch / Keypad Selections........ 10
3.2 Voltage Measurement ........................... 11
3.3 Current Measurement............................ 13
3.4 Watts /VA /PF /kWHr measurement ...... 14
3.5 Watts 3Ø /VA /PF /kWHr measurement 15
3.6 Frequency / THD Measurement ............ 16
3.7 Set Up ................................................... 17
3.8 Data Logging – Quick Start ................... 17
3.9 Data Logging – Advanced ..................... 18
3.10 WinLog ................................................ 20
4 TECHNICAL DEFINITIONS .................... 21
4.1 Measured parameters ........................... 21
4.2 Watts/VA/VAR/PF sign conventions ...... 21
5 SAFETY .................................................. 22
6 BATTERY REPLACEMENT ................... 23
7 STATEMENTS & NOTICES.................... 24
Issue 7 07/00
Page 2

1. INTRODUCTION
The advanced design of the Analyst ensures reliable
and accurate measurements under a wide range of
operating conditions. Measurement features include:
• Non-intrusive AC/DC current
• True RMS, Crest Factor and THD for complex and
distorted waveforms
• Volts / Watts / VA / PF / kWHr
• 3 Phase measurements
• Screen SAVE mode
• MIN, MAX, AVE, REC Mode with time stamp
• Internal and PC Data logging (WinLog software
included)
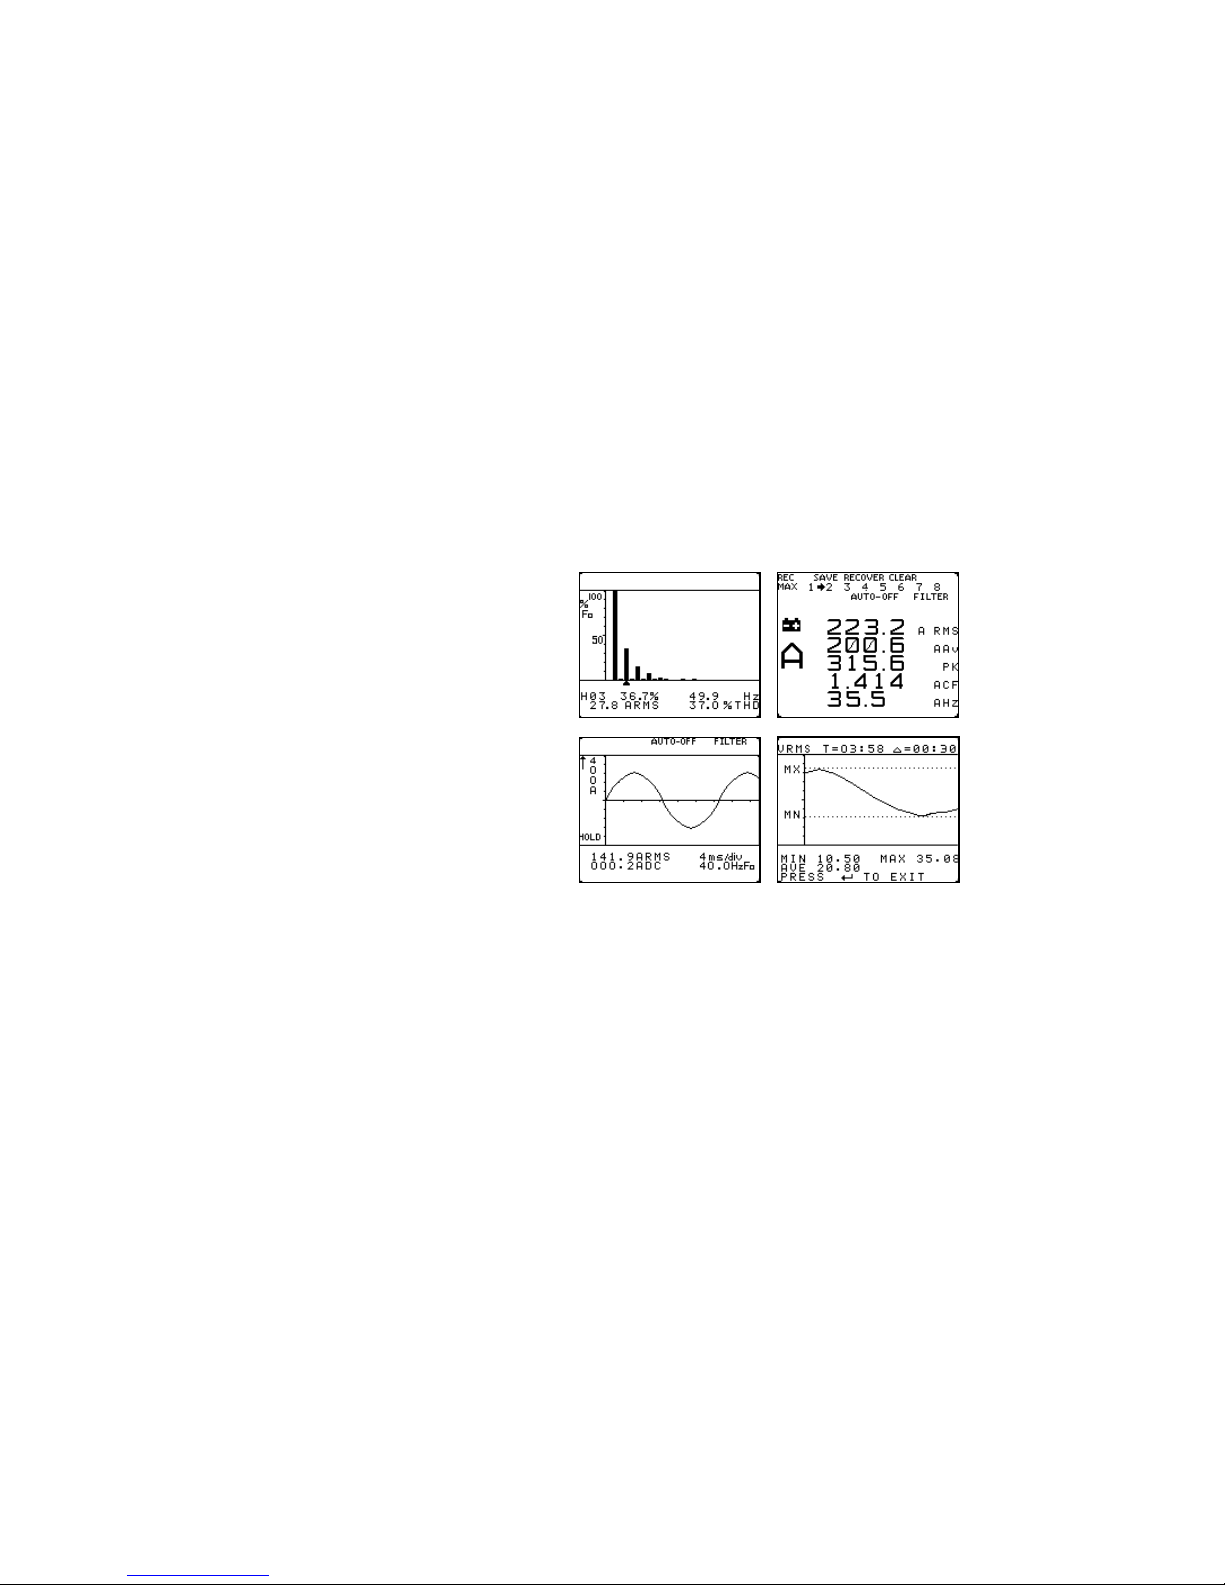
• Multi parameter and waveform display modes
• Live harmonics analysis and display
• Ripple measurement
• Extended memory for data logging
The Analyst conforms to the latest international
directives and standards concerning safety and
electromagnetic compatibility.
• European Low Voltage Directive 73/23/EEC and
93/68/EEC
• European EMC Directive 89/336/EEC and
93/68/EEC
Safety Standards
IEC 1010-1: 1992-09 Safety requirements for electrical
equipment for measurement, control and laboratory
use.
Part 2-032: 1994-12 Particular requirements for hand
held current clamps for electrical measurement and
test.
Part 2-031: 1993-02 Particular requirements for hand
held probe assemblies for electrical measurement and
test.
600V Cat IV (750V cat III) Pollution degree 2
EMC Standards
RF Susceptibility and Emissions
BS EN 61326 : 1998 Electrical equipment for
measurement, control and laboratory use – EMC
requirements.
RF Immunity. Annex C. Performance criteria A
RF Emissions. Limits for Class B equipment.
FCC Part 15 Class B
2
Page 3
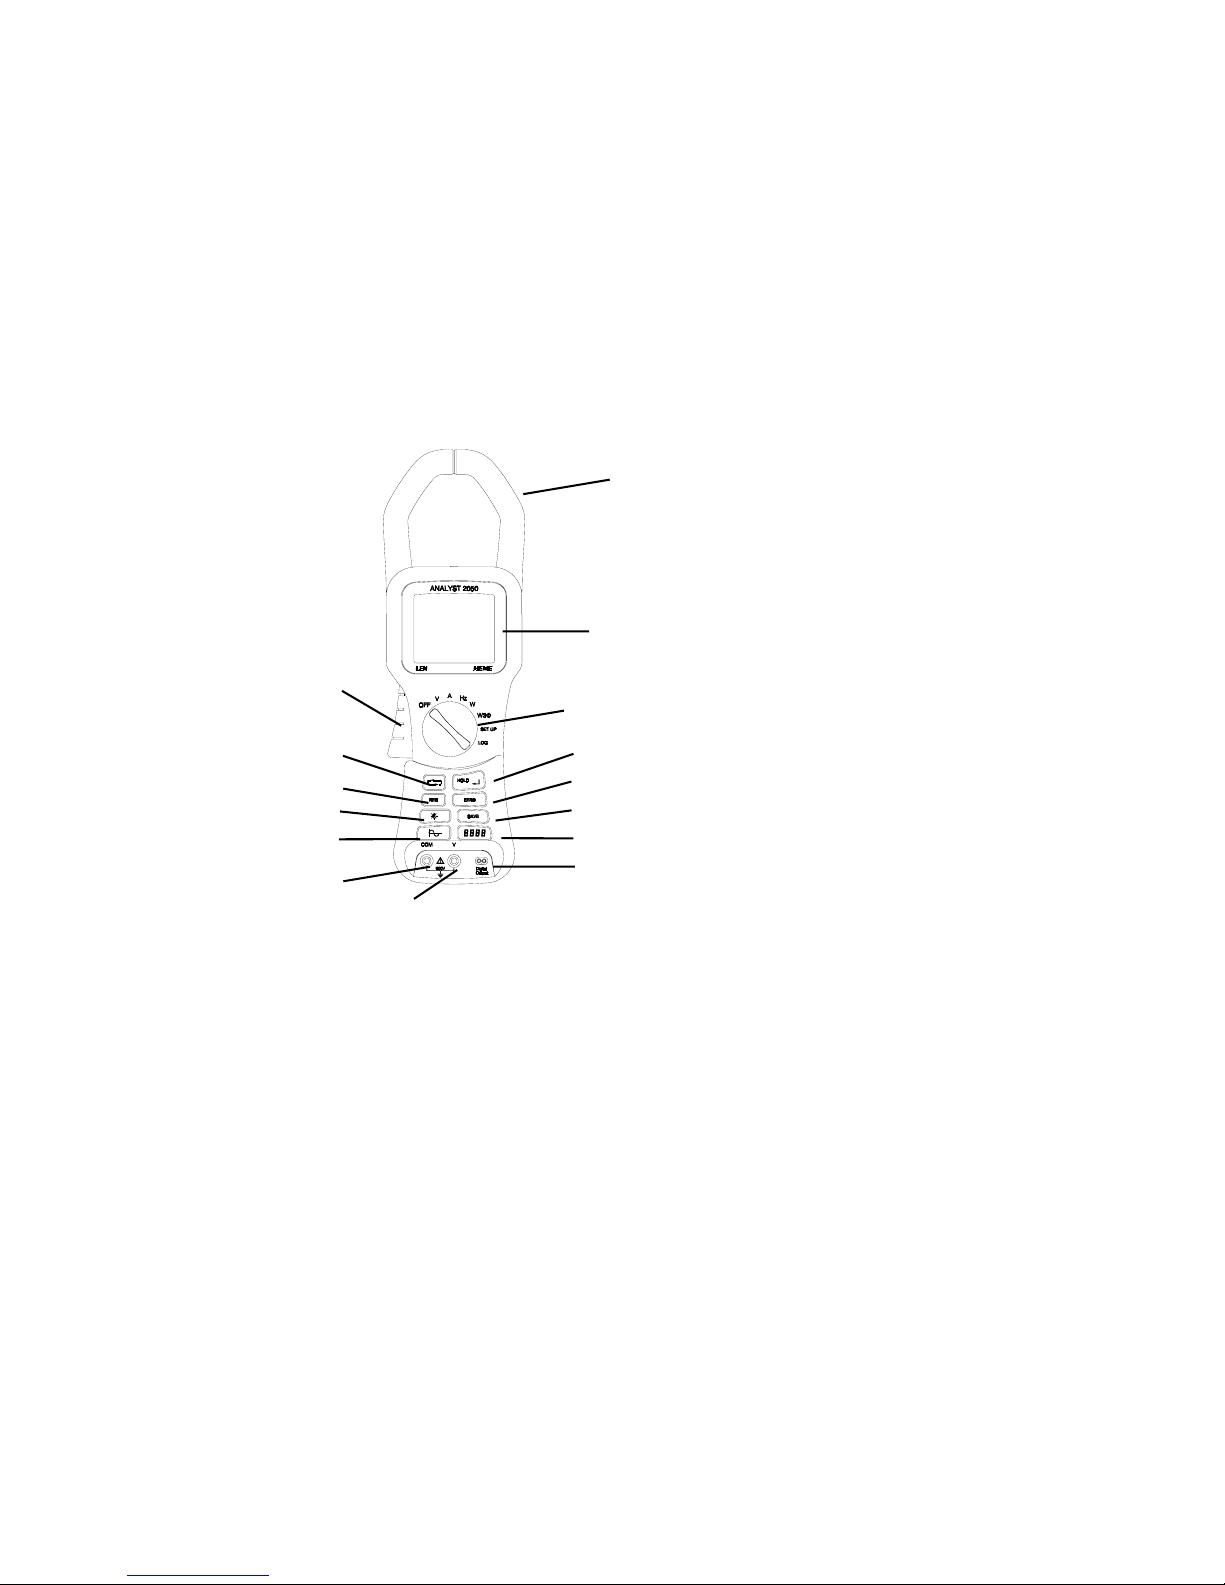
1.1 Instrument Features
The main operating features of the instrument are as
follows. See Fig. 1.
(1) Clamp-on jaws for current measurement
(2) Jaw opening lever
(3) Rotary switch for function selection
(4) Dot matrix LCD
(5) Screen cursor control
(6) REC mode. Time stamped MIN, MAX readings
(7) Backlight
(8) Oscilloscope / Harmonics mode
(9) HOLD and SELECT
(10) ZERO. Amps Zero
(11) SAVE. Screen save mode
(12) Numeric display mode
(13) and (14) Test lead input terminals
(15) Digital output
1
4
2
3
5
6
7
8
13
14
Instrument Features
Fig. 1
3
9
10
11
12
15
Page 4

2. SPECIFICATION
2.1 Electrical data
(All accuracies stated at 23°C ± 1°C)
2.1.1 Current measurement
(DC, DCRMS, ACRMS)
Measuring range................. 0 - 2000A DC or AC pk
Autorange facility................ 40A / 400A / 2000A
Resolution........................... 10mA in 40A range
100mA in 400A range
1A in 2000A range
Accuracy
RMS and DC
I > 10A ........................ ± 1.5% rdg ± 5 dgts
I < 10A ........................ ± 0.2A
AVE
I > 10A ........................ ± 3% rdg ± 5 dgts
I < 10A ........................ ± 0.5A
Pk
I > 10A ........................ ± 5% rdg ± 5 dgts
I < 10A ........................ ± 0.5A
AHr
I > 10AHr...................... ± 2% rdg ± 5 dgts
I < 10AHr...................... ± 0.5AHr
CF (Crest Factor)
1 ≤ CF < 3 .................... ± 3% rdg ± 5 dgts
3 ≤ CF < 5 .................... ± 5% rdg ± 5 dgts
Resolution .................... 0.01
RPL (Ripple)
2% ≤ RPL< 100%......... ± 3% rdg ± 5 dgts
100% ≤ RPL< 600%..... ± 5% rdg ± 5 dgts
Resolution .................... 0.1%
> 5A, IAC > 2A
I
DC
All measurements DC and 10Hz to 1kHz.
Maximum overload 10,000A or
RMS x frequency < 400,000. Amps RMS
is a true RMS measurement (AC + DC)
Harmonics
THD (Total Harmonic Distortion)
1% ≤ THD < 100% ....... ± 3% rdg ± 5 dgts
100% ≤ THD < 600% ... ± 5% rdg ± 5 dgts
Resolution .................... 0.1%
4
Page 5

DF (Distortion Factor)
1% ≤ DF < 100% ......... ± 3% rdg ± 5 dgts
Resolution .................... 0.1%
H02 ≤ I
H13 ≤ I
< H13........... ± 5% rdg ± 2 dgts
harm
≤ H25.......... ± 10% rdg ± 2 dgts
harm
All measurements up to 25th harmonic
Frequency range F
> 10A, I
I
acrms
45Hz to 65Hz
0
> 10% I
harm
acrms
2.1.2 Voltage measurement
(DC, DCRMS, ACRMS)
Measuring range................. 0 - 750V DC or AC
Autorange facility ................ 4V / 40V / 400V / 750V
Resolution........................... 1mV in 4V range
10mV in 40V range
100mV in 400V range
1V in 750V range
Accuracy
RMS and DC
V > 1V ......................... ± 1% rdg ± 5 dgts
V < 1V ......................... ± 0.02V
AV
V > 1V ......................... ± 3% rdg ± 5 dgts
V < 1V ......................... ± 0.03V
Pk
V > 1V ......................... ± 5% rdg ± 5 dgts
V < 1V ......................... ± 0.03V
CF (Crest Factor)
1 ≤ CF < 3..................... ± 3% rdg ± 5 dgts
3 ≤ CF < 5..................... ± 5% rdg ± 5 dgts
Resolution .................... 0.01
RPL (Ripple)
2% ≤ RPL< 100% ......... ± 3% rdg ± 5 dgts
100% ≤ RPL< 600% ..... ± 5% rdg ± 5 dgts
Resolution .................... 0.1%
> 0.5V, VAC > 0.2V
V
DC
All measurements DC and 10Hz to 1kHz.
Maximum overload 1,000 V RMS
Volts RMS is a true RMS measurement (AC + DC)
Harmonics
THD (Total Harmonic Distortion)
1% ≤ THD < 100%........ ± 3% rdg ± 5 dgts
100% ≤ THD < 600%.... ± 5% rdg ± 5 dgts
Resolution .................... 0.1%
5
Page 6

DF (Distortion Factor)
1% ≤ DF < 100%.......... ± 3% rdg ± 5 dgts
Resolution .................... 0.1%
H02 ≤ V
H13 ≤ V
All measurements up to 25
Frequency range F
> 1V, V
V
acrms
< H13......... ± 5% rdg ± 2 dgts
harm
≤ H25........ ± 10% rdg ± 2 dgts
harm
th
harmonic
45Hz to 65Hz
0
> 10% V
harm
acrms
2.1.3 Watts measurement (Single and 3 Phase)
(DC, DCRMS, ACRMS)
Measuring range................. 0 - 1200kW DC or
850kW AC
Autoranging facility ............. 4kW, 40kW, 400kW,
1200kW
Resolution........................... 1W in 4kW
10W in 40kW
100W in 400kW
1kW in 1200kW
Accuracy............................. 2.5% rdg ± 5 dgts
W1Ø < 2kW....... ± 0.08 kW
W3Ø < 4kW....... ± 0.25kW
2.1.4 VA measurement (Single and 3 Phase)
(DC, DCRMS, ACRMS)
Measuring range................. 0 -1200kVA DC or
850kVA AC
Autorange facility................ 4kVA, 40kVA, 400kVA,
1200kVA
Resolution........................... 1VA in 4kVA
10VA in 40kVA
100VA in 400kVA
1kVA in 1200Kva
Accuracy
VA > 2kVA......... 2.5% rdg ± 5 dgts
VA < 2kVA......... ± 0.08kVA
2.1.5 VAR Measurement (Single and 3 Phase)
Measuring range................. 0 - 850kVAR
Autorange facility................ 4kVAR, 40kVAR,
400kVAR, 850kVAR
Resolution........................... 1VAR in 4kVAR
10VAR in 40kVAR
100VAR in 400kVAR
1kVAR in 850kVAR
Accuracy VAR > 4kVAR.. ± 2.5% rdg ± 5 dgts
VAR < 4kVAR.. ± 0.25kVAR
Power Factor range ............ 0.3 < PF < 0.99
6
Page 7

2.1.6 Power Factor (Single and 3 Phase)
Measuring range 0.3 cap … 1.0 … 0.3 ind
(72.5° cap ... 0° ... 72.5° ind)
Resolution........................... 0.01
Accuracy ............................. ± 3°
2.1.7 Kilowatt Hour (kWHr)
Measuring range................. 40,000kWHr
Autorange facility ................ 4kWHr, 40kWHr,
400kWHr, 4,000kWHr,
40,000kWHr
Resolution........................... 1WHr in 4kWHr
10WHr in 40kWHr
100WHr in 400kWHr
1kWHr in 4,000kWHr
10kWHr in 40,000kWHr
Accuracy kWHr > 2kWHr.... ± 3% ± 5 dgts
kWHr < 2kWHr.... ± 0.08kWHr
All Watts /VA /VAR /PF measurements
Frequency range................. DC and 10Hz to 1kHz
Current range...................... 10A to 1400A RMS
Voltage range ..................... 1V to 600V RMS
Maximum input ................... 600V RMS / 2000A Pk
Maximum overload ............. 1000V RMS / 10,000A
2.1.8 Frequency measurement
(From Current or Voltage sources)
Measuring range................. 10Hz to 1kHz
Resolution........................... 0.1Hz
Accuracy 40 - 70Hz ............ ± 0.5% rdg
10 - 1000Hz ........ ± 1% rdg
Current Range .................... 10A to 1400A RMS
Voltage Range .................... 1V to 600V RMS
2.1.9 Scope Function
2.1.9.1 Current measurement
Ranges ............................... 10A/20A/40A/100A
200A/400A/1000A/2000A
Resolution........................... 1A in 40A
10A in 400A
50A in 2000A
Accuracy ............................. ± 3% rdg ± 1 pixel
Maximum overload ............. 10,000A
7
Page 8
2.1.9.2 Voltage measurement
Ranges ............................... 4V/10V/20V/40V/100V
200V/400V/1000V
Resolution........................... 100mV in 4V
1V in 40V
10V in 400V
31.25V in 1000V
Accuracy............................. ± 2% rdg ± 1 pixel
Maximum overload ............. 1000V RMS
Frequency range ................ DC and 10Hz to 600Hz
Time base........................... 2ms, 4ms, 10ms,
Refresh rate........................ 0.5 seconds
Maximum sampling rate ..... 9.6kHz
50ms/div
2.1.10 Digital output
RS-232 Interface to a PC
9600 baud 1 start bit 8 data bits 1 stop bit
Requires WinLog interface and software
2.2 General Data
2.2.1 Display
Backlit dot matrix LCD 160 x 128.
50ms/div
2.2.2 Power Supply
Battery type 1.5V Alkaline AA MN 1500 or IEC LR6 x 6
Battery life typically:
24 hours (backlight off)
12 hours (backlight on)
8
Page 9
2.2.3 Environmental
FOR INDOOR USE ONLY
Reference conditions. All accuracies stated at
23°C ± 1°C
Operating temperature 0°C to 50°C (32°F to 122°F)
Temperature coeff. of current ≤ ±0.15% of rdg per °C
Temperature coeff. of voltage ≤ ±0.15% of rdg per °C
Maximum relative humidity 80% for temperatures up to
31°C (87°F) decreasing linearly to 50% relative humidity
at 40°C (104°F)
Maximum operating altitude 2000m
2.2.4 Mechanical
Dimensions ...................... Length 300mm (12 inches)
Width 98mm (3.75 inches)
Depth 52mm (2 inches)
Weight inc. batteries ........ 820g / 1.8lbs.
Case material................... Bayblend T85
Jaw opening..................... 60mm
Jaw capacity .................... 58mm diameter
Accessories ..................... Voltage probes
Crocodile Clips
Carrying case
2 x Operator’s manual
WinLog Software
RS232 interface cable
Cleaning........................... The unit can be cleaned
with an Isopropanol
impregnated cloth.
Do not use abrasives or
other solvents.
2.2.5 Power-up
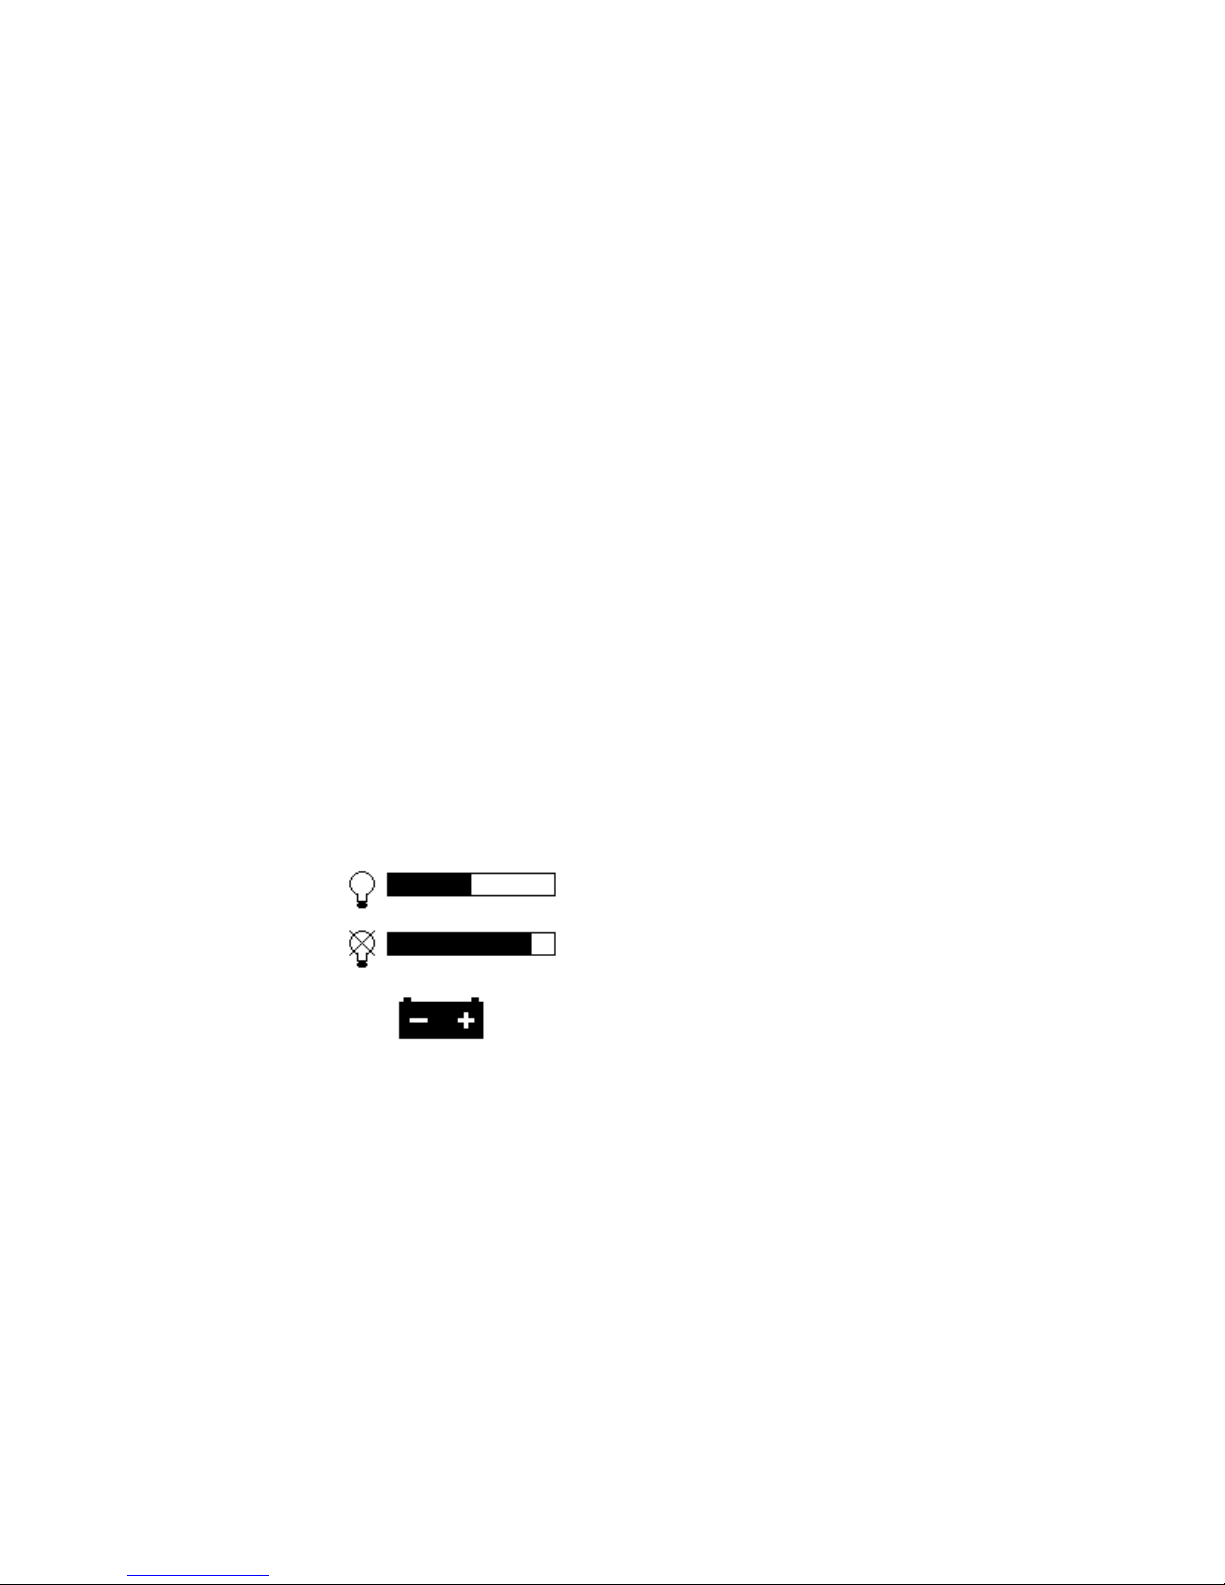
At power-up the following screen is displayed for 5
seconds indicating the battery status. The remaining
battery lifetime is displayed, with and without the
backlight. When the display changes to the digital
mode, the instrument is ready for use.
9
Page 10
3. OPERATING INSTRUCTIONS
International Symbols
3.1 Rotary Switch / Keypad selections
The instrument functions are selected by a rotary switch
and an 8 key keypad. The rotary switch positions are
as follows:
OFF Instrument off
V Voltage
A Current
Hz Frequency / THD
W Power
W3∅
Set up Options Menu
Log Logging Menu
When switching the instrument ON, wait for the auto
calibration, flashing CAL, to finish, before clamping the
jaw on a conductor or applying the test leads to the
circuit.
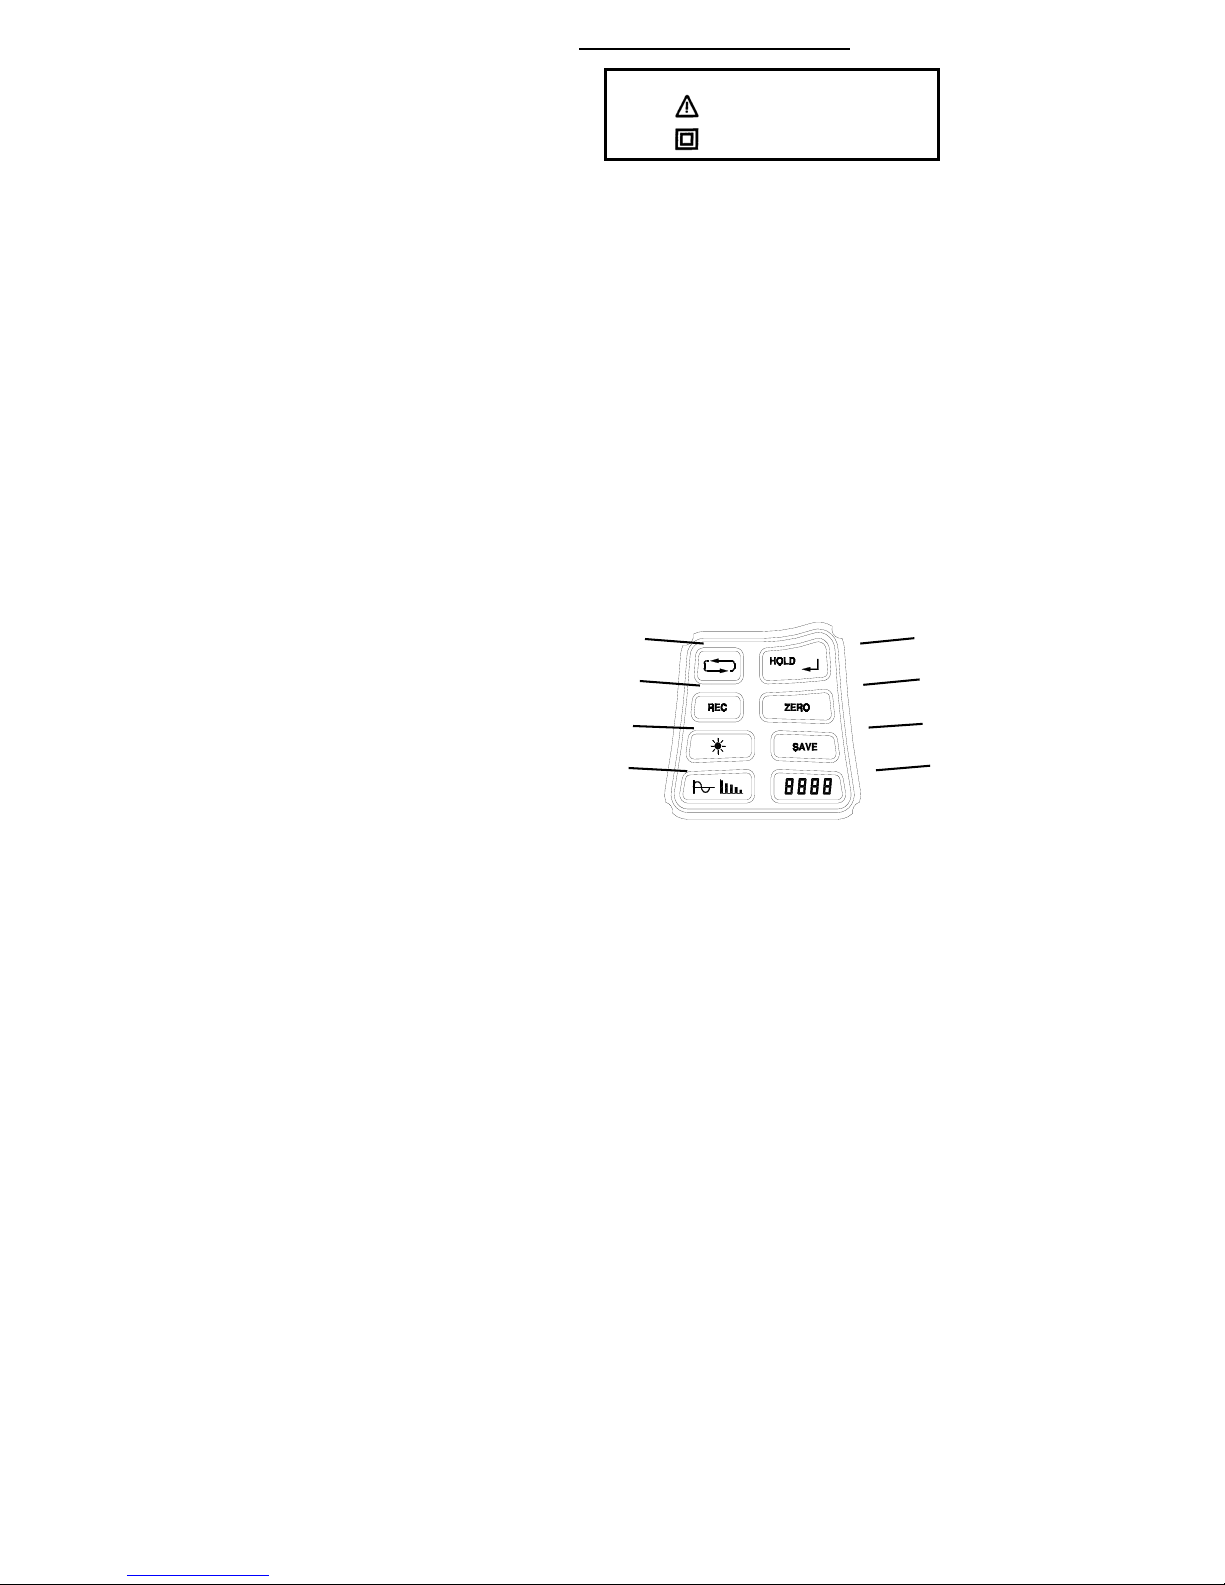
The push button keys are as follows:
Important Information
(See Manual)
Double Insulation
3 phase Power
1
3
2
4
5
7
1. Option cursor movement and screen changer
2. HOLD and Option select
3. REC mode (Min, Max, Ave)
4. ZERO Amps auto zero
5. Backlight ON / OFF
6. SAVE
7. Oscilloscope/Harmonics mode
8. Numeric Display mode
10
6
8
Page 11
REC
This function stores the minimum, maximum and
average values of all displayed parameters. The clock
shows the elapsed time in hours and minutes HH : MM
since starting the REC function when displaying
‘Average’ and ‘Now’ values and gives a time stamp for
when the ‘MIN’ and ‘MAX’ values occurred. The time
stamp refers to the main first parameter on the display.
If the real time has been set in the LOG/SET TIME
menu then the clock displays the real time.
SAVE Mode
This function allows the capture of up to 8 screens
which can be either waveforms or numerical data. Both
waveform and harmonics screens are captured
simultaneously in one memory location. Pressing the
SAVE mode key brings up the following text on the
screen:
SAVE RECOVER CLEAR
1 2 3 4 5 6 7 8
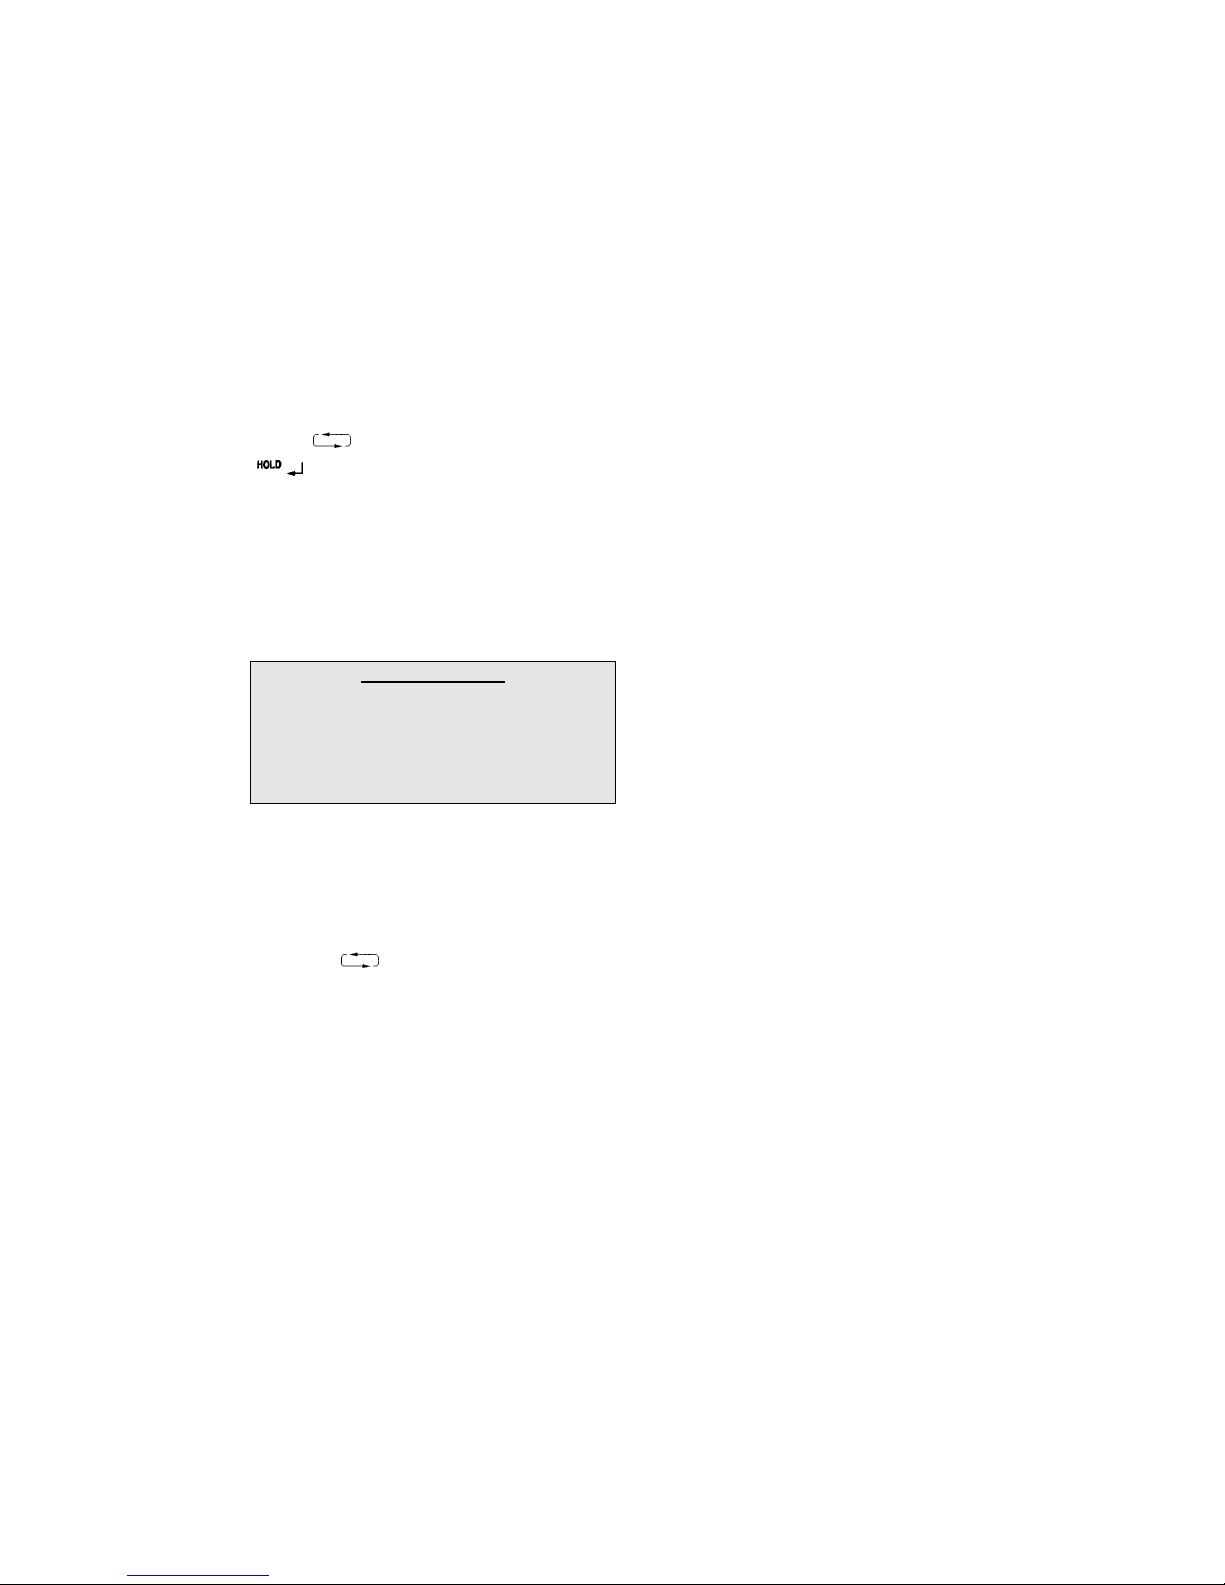
Use the
CLEAR. Repeat this process to select one of the SAVE
locations from 1 to 8.
The whole screen is saved in the selected location and
can be recovered at a later date - even after the
instrument has been powered off. A second press of the
SAVE key returns the instrument back to the normal
mode of operation.
3.2 Voltage measurement of RMS or DC Voltage
To avoid possible electric shock and damage
to the instrument, do not attempt to measure
any voltage that might exceed the maximum
range of the instrument - 600Vrms and 1kHz
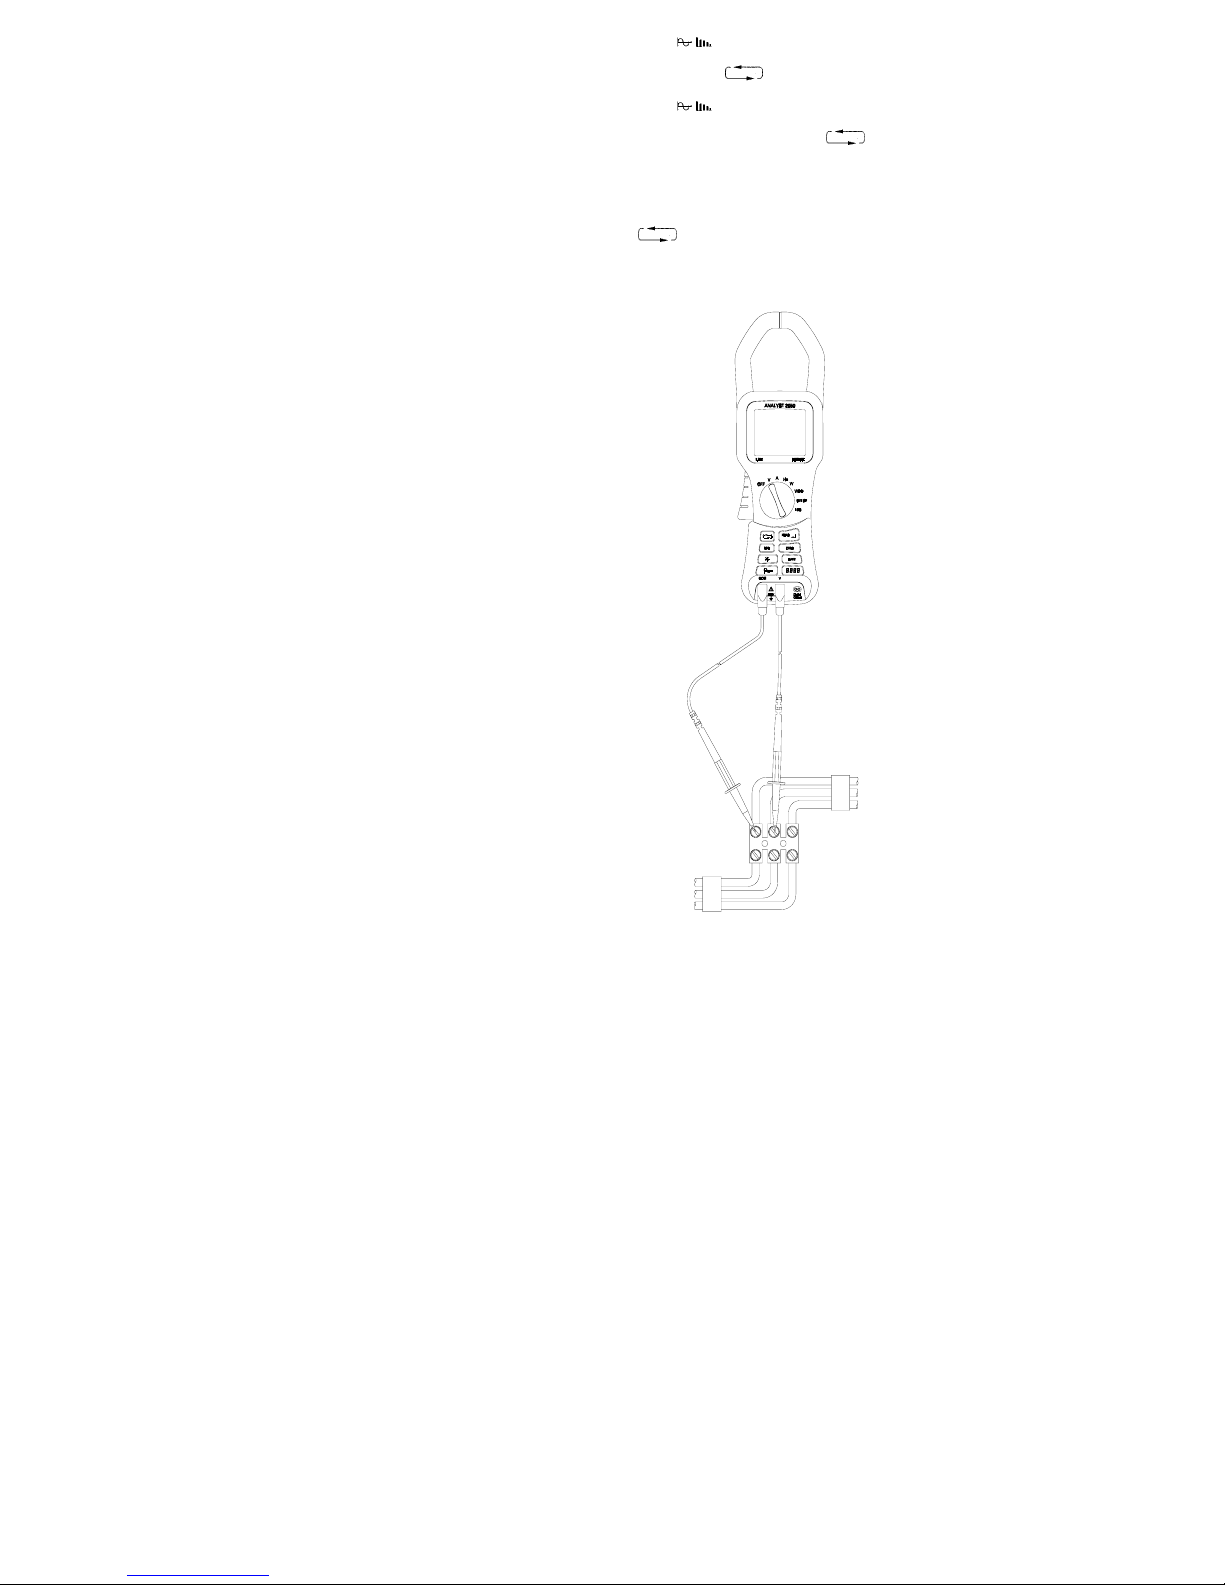
• Move the rotary switch to the V position.
• Insert the test leads into the sockets on the front of
the instrument. Connect the red lead to the V
terminal, and the black lead to the COM terminal.
• Apply the test leads to the circuit under test and
read the displayed voltage. See Fig. 2.
• Use the
displayed.
Screen 1 = V RMS (AC + DC) VDC
Screen 2 = V RMS,V Av,V Pk,V CF,V Rpl
• Use the HOLD key to freeze the display.
key to move the cursor and the
key to select either SAVE, RECOVER or
SAFETY WARNING
key to change the parameters
11
Page 12
• Use the
voltage and the
key to display the waveform of the
key to change the timebase.
• Use the
content of the voltage and the key to select
individual harmonics
• Use the 8888 key to return to the digital display.
• Use the REC key to enter the RECORD mode. Use
the
displays of the screen readings. Press the REC key
again to exit.
key to display the harmonic
key to show the MAX, MIN, AVE
Fig. 2
Voltage Measurement
12
Page 13
3.3 Current measurement
• Remove any Voltage test leads from the
instrument.
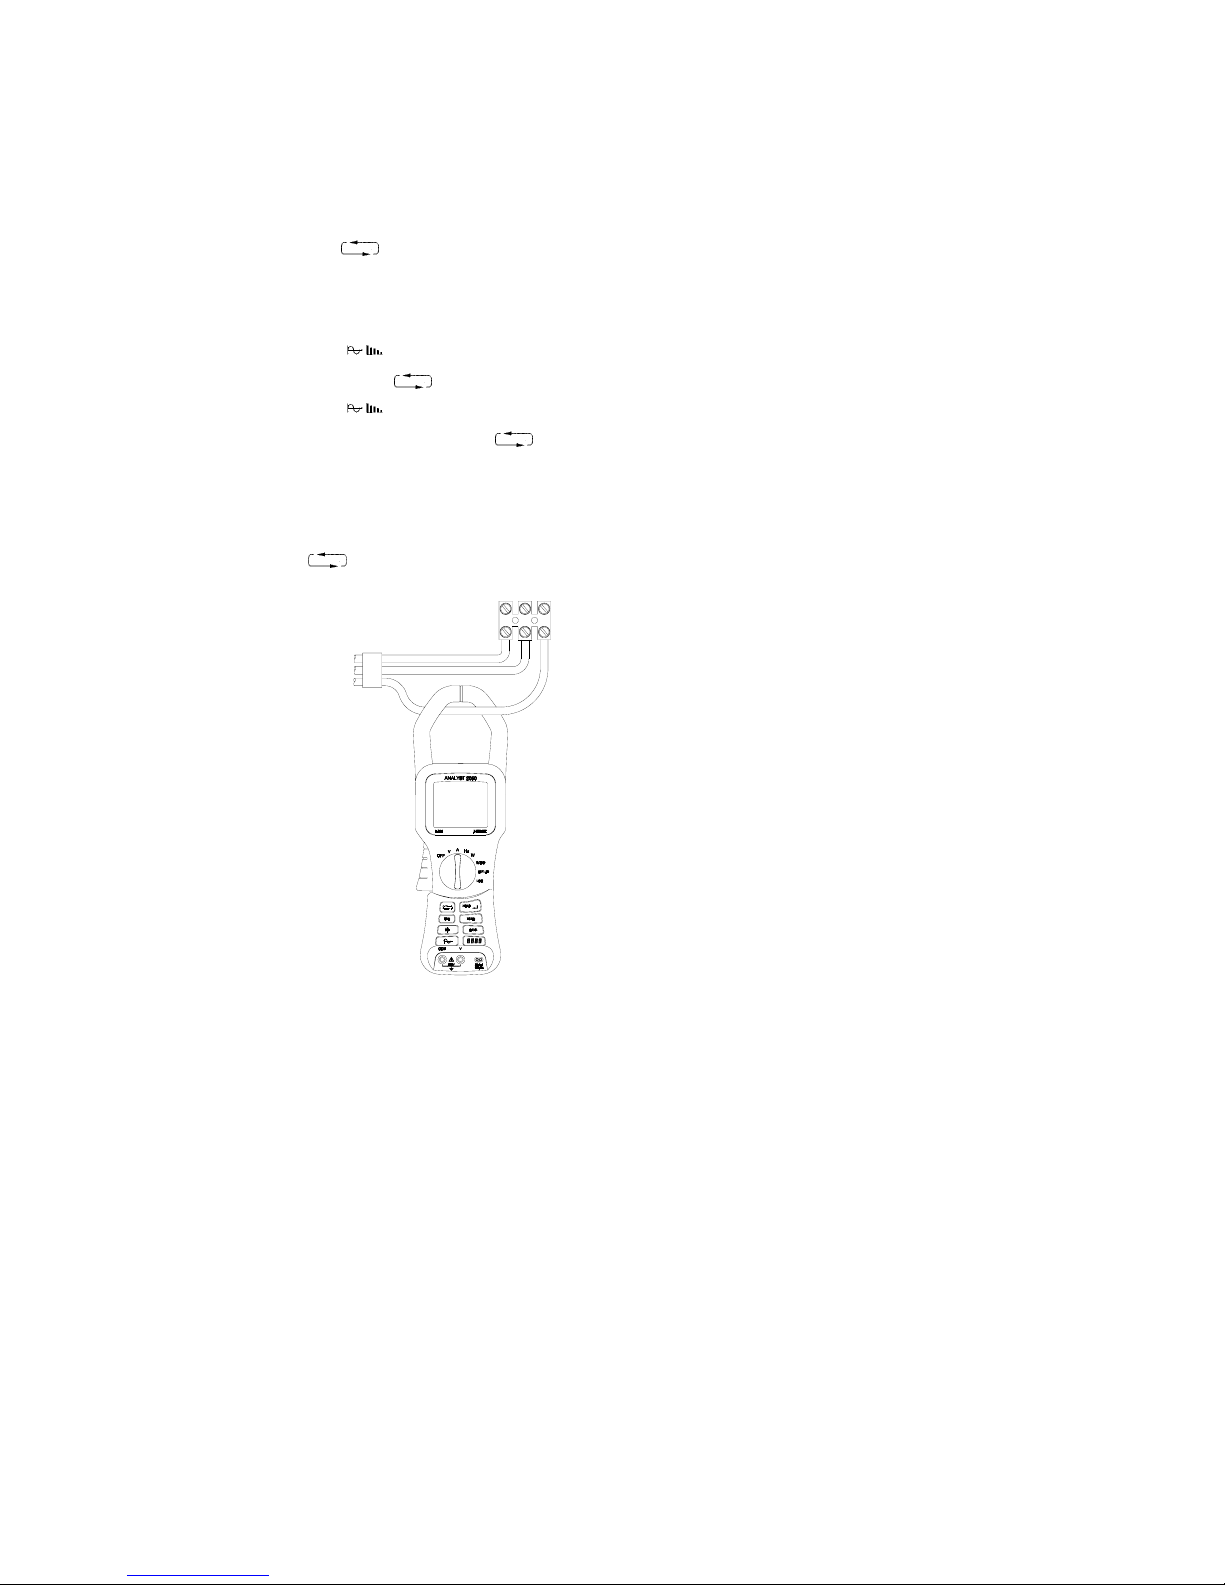
• Move the rotary switch to A position.
• Press the trigger to open the jaws and clamp
around the current carrying conductor as shown in
Fig. 3.
• Read the display. A “-“ polarity indicates a DC
current flowing in a direction opposite to the arrow
on the instrument case.
Use the key to change the parameters
•
displayed.
Screen 1 = A RMS (AC + DC) A DC
Screen 2 = A RMS,A Av,A Pk,A CF,A Rpl
• Use the HOLD key to freeze the display.
• Use the
current and the
• Use the
content of the current and the
individual harmonics
• Use the 8888 key to return to the digital display.
• Use the ZERO key to zero the display if necessary
or if relative readings are required.
• Use the REC key to enter the RECORD mode. Use
the
of the screen readings. Press the REC key to exit.
key to show the MAX, MIN, AVE values
key to display the waveform of the
key to change the timebase.
key to display the harmonic
key to select
Fig. 3
Current Measurement
13
Page 14
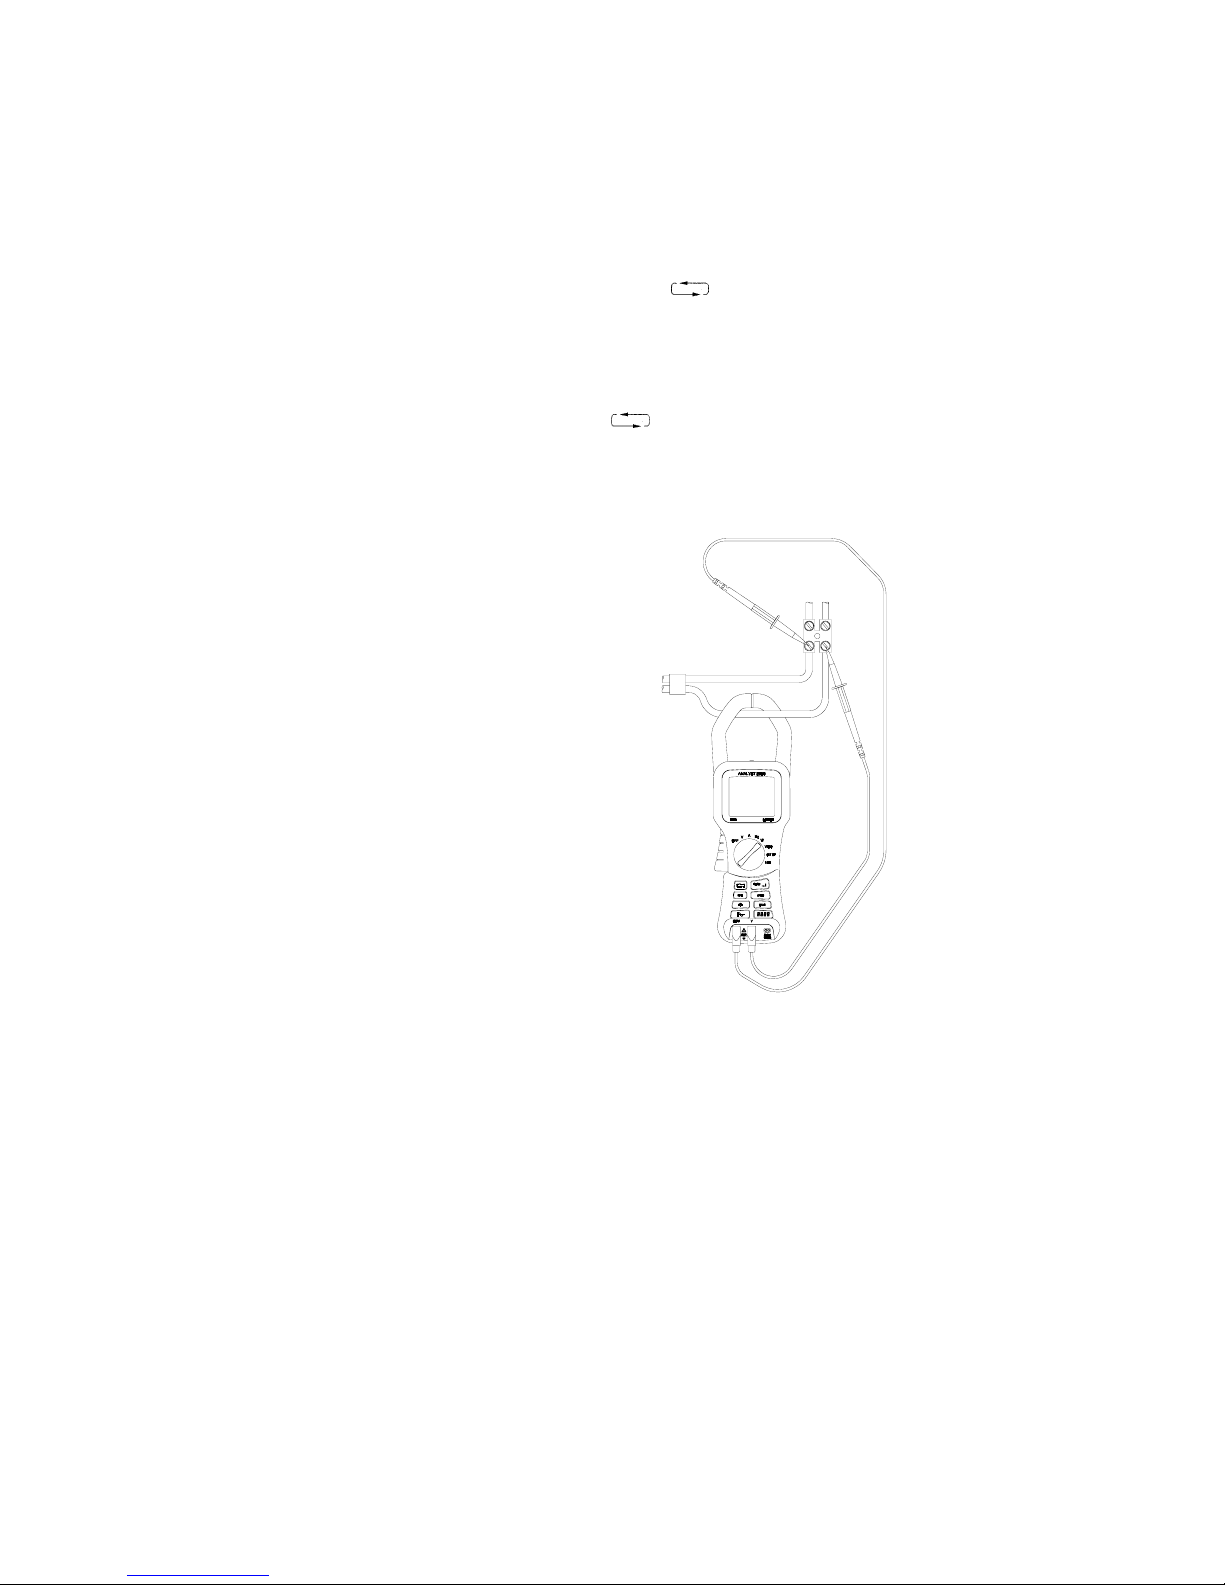
3.4 Measurement of Watts / VA / PF / kWHr
(Single Phase)
• Move the rotary switch to the W position.
•
Insert the test leads into the sockets on the front of
the instrument. Connect the red lead to the V
terminal, and the black lead to the COM terminal.
• Press the trigger to open the jaws, and clamp them
on the current carrying conductor, as shown in
Fig. 4.
• Read the display. See section 4.2 for details on
the sign conventions
• Use the
displayed.
Screen 1 = kW, kVA, kVAR, PF, kWHr
Screen 2 = kW, V RMS, A RMS, PF, AHr
• Use the HOLD key to freeze the display.
• Use the REC key to enter RECORD mode. Use the
the screen readings. Press the REC key again to
exit.
key to change the parameters
key to show the MAX, MIN, AVE displays of
Fig. 4
Single Phase Watts Measurement
14
Page 15

3.5 Measurement of Watts / VA / PF / kWHr in a
balanced system (3 Phase)
Fig. 5
Watts 3∅ Configuration
• Move the rotary switch to the W3∅ position.
• A screen prompt, Fig. 5, indicates the above
method of connection.
• Insert the test leads into the sockets on the front of
the instrument. Connect the red lead to the V
terminal and the black lead to the COM terminal.
• Apply the test leads to the circuit under test:
Red lead to Phase L2
Black lead to Phase L3
• Press the trigger to open the jaws and clamp them
around the current carrying Phase L1, as shown in
Fig. 5.
• Read the display. See section 4.2 for details on
the sign conventions
• Use the
displayed.
Screen1 = kW, kVA, kVAR, PF, kWHr
Screen2 = kW, V RMS, A RMS, PF, AHr
• Use the HOLD key to freeze the display.
• Use the REC key to enter RECORD mode. Use the
the screen readings. Press the REC key again to
exit this mode.
W3∅ gives the total power based on a balanced
system.
key to change the parameters
key to show the MAX, MIN, AVE displays of
15
Page 16

3.6 Frequency / THD Measurement
• Move the rotary switch to the Hz position.
• Insert the test leads into the sockets on the front of
the instrument. Connect the red lead to the V
terminal, and the black lead to the COM terminal.
• To measure the frequency of the voltage supply
apply the test leads to the circuit as shown in Fig. 2
and read the display.
• To measure the frequency of the current, press the
trigger to open the jaws, and clamp them on the
current carrying conductor, as shown in Fig. 3 and
read the display.
• Use the
key to change the parameters
displayed.
Screen 1 = Hz, ACRMS
Screen 2 = Hz(F
), ACRMS, THD, DF
o
See Section 4.1 for definitions of the measured
parameters.
• When configured to measure power (Fig. 4) with the
test leads connected and the jaws clamped around
a current carrying conductor, the instrument
displays the frequency of the current source
(providing ARMS > 10A). If ARMS < 10A, a volts
frequency measurement will be made (providing
VRMS > 1V), otherwise ---.- will be displayed.
• Press the HOLD / ZERO button to freeze the
display.
• Use the REC key to enter RECORD mode. Use the
key to show the MAX, MIN, AVE displays of
the screen readings. Press the REC key again to
exit this mode.
• Use the
key to display the waveform of the
current / voltage and the
timebase.
• Use the
key to display the harmonic
content of the current/voltage and the
select individual harmonics
16
key to change the
key to
Page 17

3.7 Set Up
The following screen is displayed:
C O N T R A S T
A U T O P O W E R DOWN
R A N G I N G
L O W P A S S F I L T E R
P F D I S P L A Y
S E L E C T C H A N G E
LOW PASS FILTER (ON) = -12dB / octave, F>100Hz
Default settings are shown in bold.
The keys are used to make selections from the menu.
3.8 Data Logging – Quick Start
3.8.1 Creating a data log
• Turn the rotary switch to LOG
• Select ENABLE LOG and change to ON
• Turn the rotary switch to either V, A, Hz, W, W3Ø
• Use
• Logging will commence approximately 5 seconds
later
The instrument will now log all displayed parameters to
internal memory for 1 hour. The default interval between
logged readings is 10 seconds.
Logging can be stopped at any time by turning the
rotary switch or pressing the
display.
3.8.2 Displaying logged data
• Turn the rotary switch to LOG
• Select Display Data
• Select the parameter to be displayed.
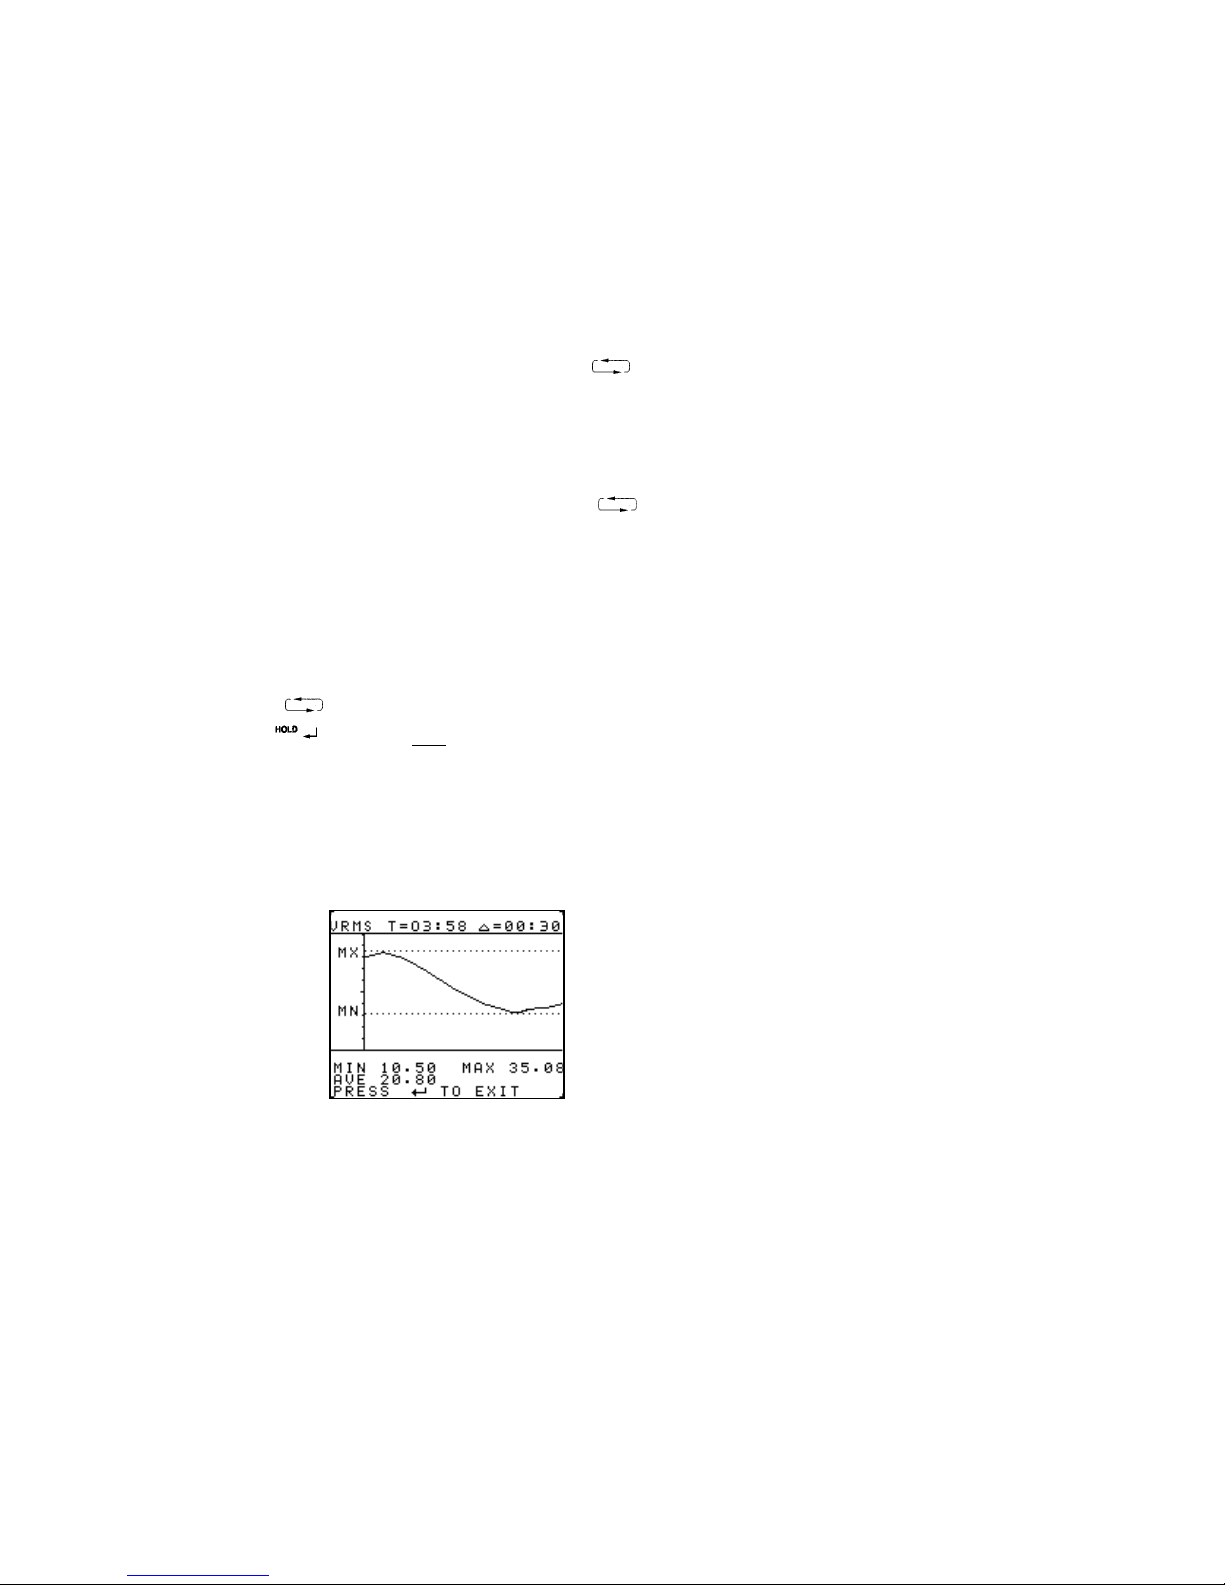
• A chart display shows variations in the measured
value with time together with MIN, MAX, AVE
values and the total logging period and logging
interval.
Download data to a PC, or log continuously to a PC,
using WinLog software and interface.
key to select the required screen
XXXXXXXX
O N or O F F
O N or O F F
O N or O F F
D E G or C O S ∅
key to change the
17
Page 18

3.9 Data Logging – Advanced
Selection of the rotary switch position ‘LOG’ brings up
the following menu:
OPTIONS
LOG INT <PC>
SET TIME
ENABLE LOG OFF <ON>
DISPLAY DATA
SEND TO PC
SELECT CHANGE
Two modes of data logging are available: either logging
to an internal non-volatile memory or logging to an
external PC, using the digital output lead.
INT Indicates internal logging
PC Indicates external (to a PC) logging
In PC mode, data is continually sent to the digital output
and is not logged within the instrument. The Analyst
logs all the parameters shown on the instrument
display.
3.9.1 SET TIME
This gives access to the SET LOGGING TIMES menu,
allowing the setting of current, start , stop times and the
logging interval.
For ease of operation if the current time is changed,
then the start is automatically reset to this time + 60
minutes, and the end time is set to the start time + 60
minutes. The minimum sample interval is 1 second,
and the maximum sample 1 hour. A 24 hour clock is
used.
Start / Stop and logging intervals can be selected as
required.
SET LOGGING TIMES
Increments the selection
Moves on to the next selection
CURRENT TIME HR:MIN
START TIME HR:MIN
END TIME HR:MIN
SAMPLE INTERVAL MIN:SEC
EXIT
The maximum number of points that can be logged is:
10000 rdgs, 5000 sets of 2 or 2000 sets of 5
18
Page 19
The maximum logging duration is determined by the
battery life (24hrs.) and the memory. Data being logged
is an average over the sample period.
Using this information the maximum logging period can
be calculated. For example, if logging the second Watts
screen which shows 5 parameters, with a logging
interval of 10 seconds, the maximum logging period
would be:
2000 x 10 seconds = 5 hrs 33 mins.
3.9.2 ENABLE LOG
This enables the logging session. The low battery
symbol flashes if there is insufficient battery life to
complete the logging session defined in the SET TIME
menu.
When internal logging is enabled the logging will
commence within 5 seconds of selecting the
measurement screen with the rotary switch and
key. All data displayed on the selected screen will be
logged. ‘MEMORY’ flashes if there is insufficient
memory to complete the logging session defined in the
SET TIME menu. Once logging has commenced an on
screen timer counts down the remaining logging period.
Logging will terminate if the screen display is changed
through moving the rotary switch or pressing the
key before the end of the logging session.
If PC logging is enabled, all measurements appearing
on the instruments display will be logged to the PC.
Logging will not terminate if the screen is changed.
3.9.3 DISPLAY DATA
This menu allows the user to recover data from the
internal memory. On entry to this menu a list of the
parameters which have been logged are displayed.
The
the
example:
ARMS, A Av, A Pk, A CF
3.9.4 EXIT returns to the previous menu.
On the chart display screen the single parameter is
shown vs time, and an EXIT is displayed on the screen
allowing the user to return to the logging parameter
select menu.
key increments through the list, and
key selects ONE parameter for display. For
19
Page 20
The following information is also displayed:
LOGGING DURATION T = HR:MIN
SAMPLE INTERVAL ∆ = MIN:SEC
MIN MAX AVE
3.9.5. SEND TO PC
This allows the user to download internal data to a PC
running the WinLog program. The digital output lead
must be connected from the digital output socket, on
the front of the instrument, to the PC serial port. Within
WinLog the port must be active and Download Log
selected from the instrument option within the WinLog
program.
On selection of SEND TO PC the text will flash until all
data has been downloaded to the PC.
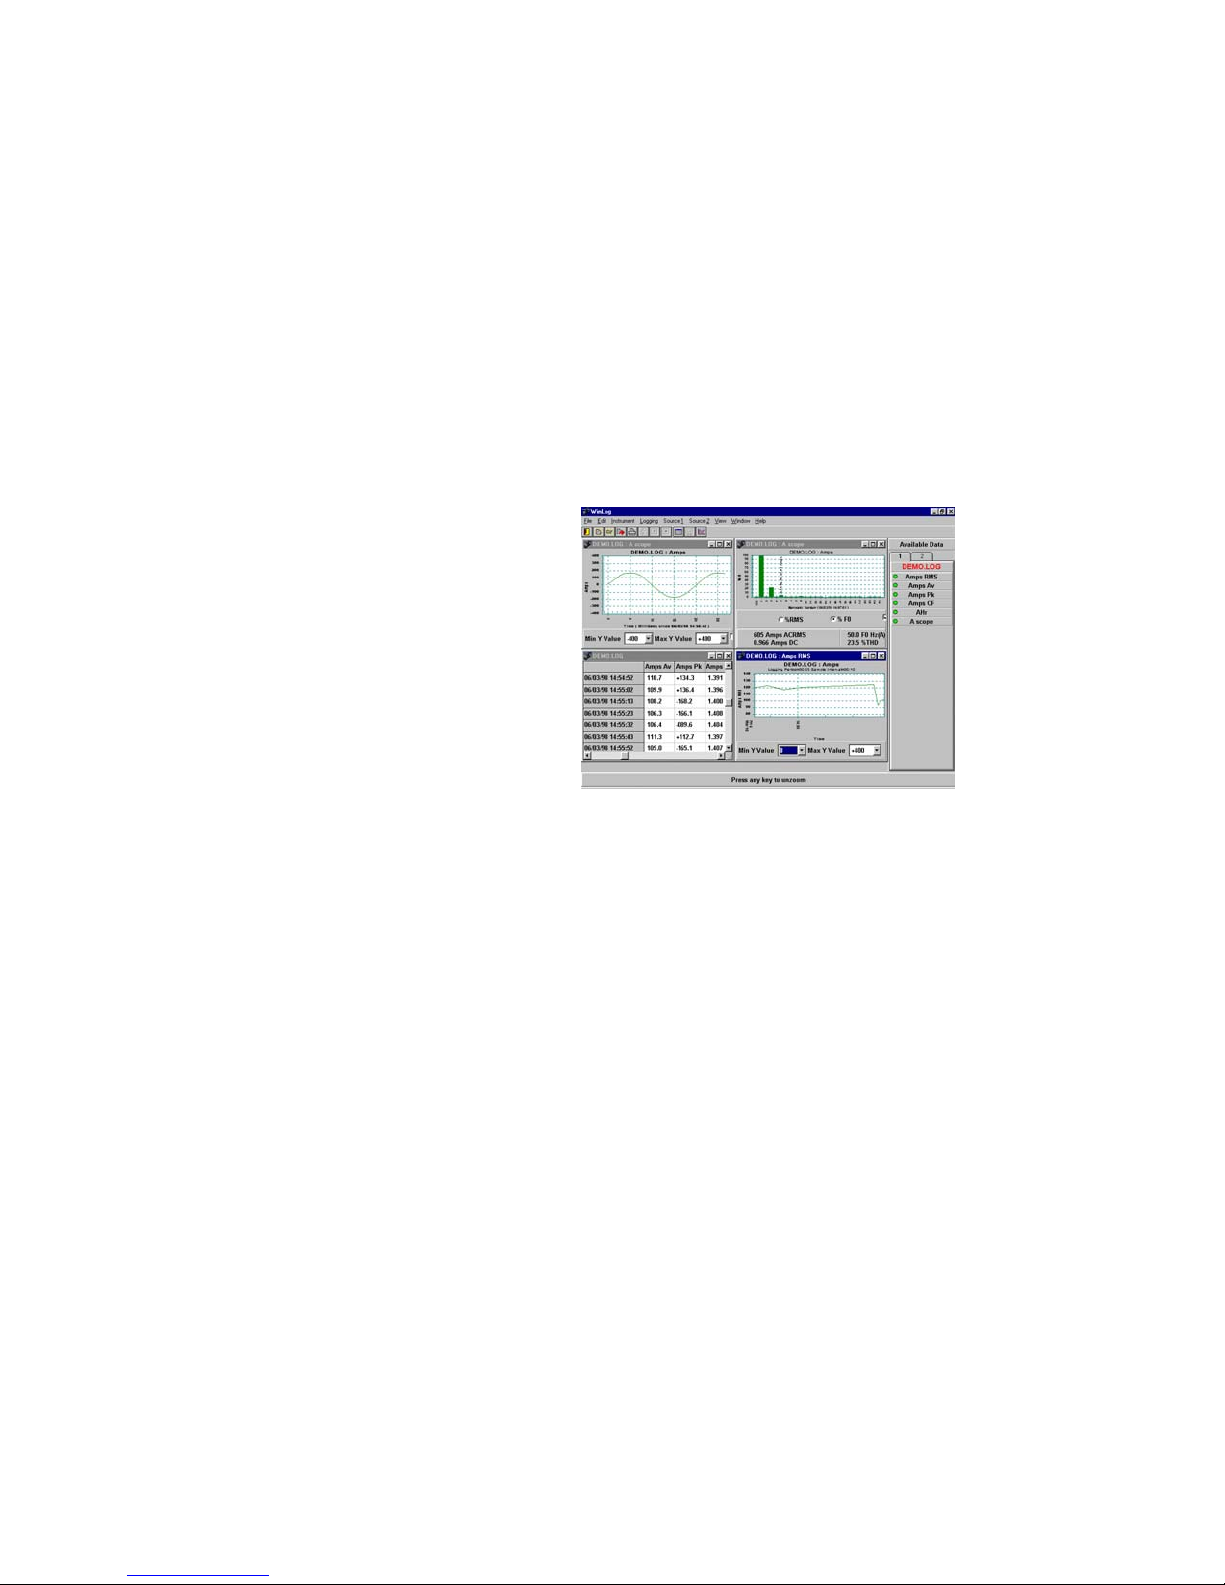
3.10 WINLOG
WinLog is the PC resident software for Analyst2060.
The software is used to continually log electrical power
measurements or download stored data to a Personal
Computer for further analysis
Fig. 7 WinLog Software
Key features include:
• Easy to use Windows format
• Data presentation in display mimic, table and
chart modes
• Waveform, harmonics and data download
• Harmonics analysis of waveforms
• Logging of up to 5 parameters, waveforms and
harmonics
• Simple exporting of data and trends into other
applications
20
Page 21

4. TECHNICAL DEFINITIONS
4.1 Measured Parameters
THD Total Harmonic Distortion, the level of
DF Distortion Factor, the level of harmonic
Fundamental frequency in Hz
F
0
CF Crest Factor, the ratio of the peak value
Rpl Ripple, the AC RMS value as a
Pk Maximum positive or negative value
4.2 Watts/ VA/ VAR/ PF Sign Conventions
For ease of use the following sign conventions have
been used.
Single phase/ Three phase measurements.
• Watts
flow.
No sign: indicates a power flowing in the conductor
on which the instrument is clamped, in the direction
of the arrow on the instrument case.
"_" sign: indicates a power flowing in the conductor
on which the instrument is clamped, in the direction
opposite to the arrow on the instrument case.
. The sign indicates the leading or lagging status
• PF
of the current, with reference to the voltage.
No sign: The current leads the voltage (capacitive
load).
"_" sign: The current lags the voltage (inductive
load).
• VAR
harmonic distortion as a percentage of
the waveform value at the fundamental
frequency.
distortion as a percentage of the total
RMS value of the waveform.
to the RMS value.
percentage of the DC component.
(>2ms) of a repetitive waveform. Not
suitable for single events.
. The sign indicates the direction of power
. No sign is displayed.
21
Page 22

5. SAFETY
Safety Summary
Definitions
WARNING statements inform the user that certain
conditions or practices could result in loss of life or
physical harm.
CAUTION statements identify conditions or practices
that could harm the Power Platform, its data, other
equipment, or property.
NOTE statements call attention to specific information.
The instrument has been designed to comply with
IEC1010-2-032 Installation Category (Overvoltage
Category) IV 600V Pollution degree 2 and
UL 3111-1. The Analyst conforms with the EEC Low
Voltage Directive 73/23/EEC and 93/68/EEC.
IEC 1010 is a safety standard which has the following
features:
• Installation categories I to IV relate the maximum
working voltage to overvoltage transients that can
be expected in the measuring environment. For the
Analyst instrument, 600V CAT IV, the maximum
expected transients must not exceed 8kV peak.
• In a pollution degree 2 environment the internal
design of the instrument can cope with transient
conductivities due to condensation.
Death, serious injury, or fire hazard could result from
improper connection of this instrument. Read and
understand this manual before connecting this
instrument. Follow all installation and operating
instructions while using this instrument.
Connection of this instrument must be performed in
compliance with the National Electrical Code
(ANSI/NFPA 70-2002) of USA and any additional safety
requirements applicable to your installation.
Installation, operation, and maintenance of this
instrument must be performed by qualified personnel
only. The National Electrical Code defines a qualified
person as “one who has the skills and knowledge
related to the construction and operation of the
electrical equipment and installations, and who has
received safety training on the hazards involved.”
Qualified personnel who work on or near exposed
energized electrical conductors must follow applicable
safety related work practices and procedures including
appropriate personal protective equipment in
compliance with the Standard for Electrical Safety
Requirements for Employee Workplaces (ANSI/NFPA
70E-2000) of USA and any additional workplace safety
requirements applicable to your installation.
Users of this equipment and or their employees are
reminded that Health and Safety Legislation
WARNING
22
Page 23

requires them to carry out valid risk assessments of
all electrical work, so as to identify potential
sources of electrical danger and risk of electrical
injury such as from inadvertent short circuits.
Where the assessments show that the risk is
significant, then the use of fused test leads
constructed in accordance with the HSE guidance
note GS38 ‘Electrical Test Equipment for use by
Electricians’ is advised.
If the instrument is used in a manner not specified by
the manufacturer, then the protection provided by the
equipment may be impaired.
Maximum Safe Voltage
Current :- 600V MAXIMUM AC RMS or DC between
uninsulated conductor and ground and maximum
frequency of 1kHz. This limitation applies to
uninsulated conductors only.
Voltage:- 600V MAXIMUM AC RMS or DC between
live conductor and ground. 600V MAXIMUM AC RMS
or DC between V and COM terminals and a maximum
frequency of 1kHz.
Safety precautions
The following safety precautions must be followed
whenever any type of voltage or current connection is
being made to the instrument.
• Wear proper Personal Protective Equipment,
including safety glasses and insulated gloves when
making connections to power circuits.
• Hands, shoes and floor must be dry when making
any connection to a power line.
• Before each use, inspect all cables for breaks or
cracks in the insulation. Replace immediately if
defective.
• Set the instrument power switch to Off.
• Before connecting to electric circuits to be
monitored, open their related circuit breakers or
disconnects. DO NOT install any connection of the
instrument to live power lines.
• Connections must be made to the instrument first,
then connect to the circuit to be monitored.
These safety precautions are repeated where
appropriate throughout this manual.
• The instrument is intended for indoor use only.
• Do not attempt to take any measurement of current
or voltage higher than the maximum range of the
instrument.
• The unit is not hermetically sealed and should NOT
be brought into contact with surface water.
USE ONLY SUITABLY RATED VOLTAGE TEST
LEADS TO IEC 1010-2-031. (600V CAT IV Pollution
Degree 2).
23
Page 24

6. BATTERY REPLACEMENT
A
Replacement with other than the specified batteries will
invalidate the warranty.
Fit only Battery Type 1.5V Alkaline MN1500, IEC LR6 or
equivalent x 6.
- + will appear on the LCD display to indicate that the
minimum operating battery voltage has been reached.
Before removing the battery cover, make sure
that all external voltages are disconnected
from the instrument. For certainty remove all
To change the batteries, see Fig. 8
• Switch off the instrument
• Undo the retaining screws (A and B) on the battery
cover and lift the cover clear of the unit.
• Replace the used batteries
• Ensure the battery cover is replaced and the locking
screws tightened, before further use.
SAFETY WARNING
leads and unclamp the instrument.
B
Fig. 8
Battery Replacement
24
Page 25

7. STATEMENTS & NOTICES
Statement of warranty:
All products of Dranetz-BMI are warranted to the
original purchaser against defective material and
workmanship for a period of one year from the date of
delivery. Dranetz-BMI will repair or replace, at its option,
all defective equipment that is returned, freight prepaid,
during the warranty period. There will be no charge for
repair provided there is no evidence that the equipment
has
been mishandled or abused. This warranty shall not
apply to any defects resulting from improper or
inadequate maintenance, buyer-supplied hardware/
software interfacing, unauthorized modification or
misuse of the equipment, operation outside of
environmental specifications, or improper site
preparation or maintenance.
Statement of reliability:
The information in this manual has been reviewed and
is believed to be entirely reliable, however, no
responsibility is assumed for any inaccuracies. All
material is for informational purposes only and is
subject to change without prior notice.
Notice regarding FCC compliance:
This device has been tested and found to comply with
the limits for a Class A digital device, pursuant to Part
15 of the FCC Rules. These limits are designed to
provide reasonable protection against harmful
interference when the equipment is operated in a
commercial environment. This equipment generates,
uses, and can radiate radio frequency energy and, if not
installed and used in accordance with the instruction
manual, may cause harmful interference to radio
communications. Operation of this equipment in a
residential area is likely to cause harmful interference in
which case the user will be required to correct the
interference at his/her own expense.
Notice regarding proprietary rights:
This publication contains information proprietary to
Dranetz-BMI. By accepting and using this manual, you
agree that the information contained herein will be used
solely for the purpose of operating equipment of
DranetzBMI.
Copyright:
This publication is protected under the Copyright laws of
the United States, Title 17 et seq. No part of this
publication may be reproduced, transmitted,
transcribed, stored in a retrieval system, or translated
into any language or computer language, in any form,
by any means, electronic, mechanical, magnetic,
25
Page 26

optical, chemical, manual, or otherwise, without the
prior written consent of Dranetz-BMI, 1000 New
Durham Road, Edison, New Jersey 08818.
Copyright © 2002 Dranetz-BMI
All Rights Reserved. Printed in the United States of
America.
Trademarks:
Power Platform, TASKCard, and Scope Mode are
registered trademarks of Dranetz-BMI.
26
Page 27
DECLARATION OF CONFORMITY
Equipment Name/Type Number: AN2060
Manufacturer: LEM HEME LIMITED
Address: 1 Penketh Place, West Pimbo,
Skelmersdale,
Lancashire, WN8 9QX.
United Kingdom.
European Standards: -
EMC EN61326 : 1998 Electrical equipment for
measurement, control and laboratory use –
EMC requirements.
Safety EN61010-1 : 1993 General Requirements.
Safety requirements for electrical equipment for
measurement, control and laboratory use:-
IEC1010-2-032 : 1994-12 Particular
requirements for hand held current clamps for
electrical measurement and test.
IEC1010-2-031 : 1993-12 Particular
requirements for hand held probe assemblies
for electrical measurement and test.
Description of Equipment : AC/DC Clamp On Power
Meter.
I certify that the apparatus identified above
conforms to the requirements of Council Directives:-
(1) Electromagnetic Compatibility Directive
89/336/EEC
(2) Low Voltage Directive 73/23/EEC
(3) CE Marking Directive 93/68/EEC
Signed:
Name : D.N.EBENEZER
R & D MANAGER
Date: 11/01/2000
27
 Loading...