

Page 1

W
W
AVVEE
A
S
S
L
L
R
R
EER
E
C
E
C
U
N
U
N
RIIEESS
R
R
NEE
N
O
O
R
R
D
D
Y
Y
®
®
S
S
6
0
6
0
O
O
0
0
0
0
A
A
G
EETTTTIINNGG
G
S
TTAARRTTEEDD
S
M
AANNUUAAL
M
J
UULLYY
J
L
22000055
Page 2
LeCroy Corporation
700 Chestnut Ridge Road
Chestnut Ridge, NY 10977-6499
Tel: (845) 578 6020
Fax: (845) 578 5985
Internet: www.lecroy.com
© 2004 by LeCroy Corp. All rights reserved.
LeCroy, ActiveDSO, ProBus, SMART Trigger, WavePro, JitterTrack, WaveMaster, and
Waverunner are registered trademarks of LeCroy Corporation. Information in this publication
supersedes all earlier versions. Specifications subject to change without notice.
Manufactured under an ISO 9000
Registered Quality Management
System
Visit
www.lecroy.com to view the
certificate.
WR6A-GS-E Rev B
913392-00
This electronic product is subject
to disposal and recycling
regulations that vary by country
and region. Many countries
prohibit the disposal of waste
electronic equipment in standard
waste receptacles.
For more information about
proper disposal and recycling of
your LeCroy product, please visit
www.lecroy.com/recycle.
Page 3

G ETTING S TARTED M ANUAL
INTRODUCTION...................................................................................................9
SAFETY REQUIREMENTS ................................................................................10
Safety Symbols and Terms........................................................................... 10
Operating Environment .................................................................................11
Cooling Requirements.................................................................................. 12
AC Power Source.......................................................................................... 12
Power and Ground Connections.................................................................. 12
On/Standby Switch........................................................................................ 13
Calibration ..................................................................................................... 13
Cleaning......................................................................................................... 13
Abnormal Conditions.................................................................................... 14
Virus Protection............................................................................................. 14
WHEN YOUR SCOPE IS DELIVERED...............................................................15
Check that You Have Everything ................................................................. 15
Warranty......................................................................................................... 15
Maintenance Agreements............................................................................. 15
Windows License Agreement....................................................................... 16
End-User License Agreement For Lecroy® X-Stream Software................ 16
INSTALLATION..................................................................................................23
Hardware Connections................................................................................. 23
Software......................................................................................................... 23
Adding a New Option.................................................................................... 23
WR6A-GS-E Rev B ISSUED: July 2005 1
Page 4

WAVER UNNER 6000A S ERIES
Restoring Software........................................................................................23
Restarting the Application....................................................................................................... 23
Restarting the Operating System............................................................................................ 24
External Monitor.............................................................................................24
SYSTEM RECOVERY........................................................................................25
Recovery Procedure......................................................................................25
Windows Activation................................................................................................................. 29
PROBES.............................................................................................................32
FRONT PANEL CONTROLS .............................................................................33
Front Panel Buttons and Knobs...................................................................33
Trigger Knobs: ........................................................................................................................34
Trigger Buttons: ......................................................................................................................34
Horizontal Knobs:.................................................................................................................... 34
Vertical Knobs:........................................................................................................................ 34
Channel Buttons: ....................................................................................................................34
Zoom Control Knobs: ............................................................................................................. 35
Special Features Knobs & Buttons: ....................................................................................... 35
General Control Buttons: ........................................................................................................36
ON-SCREEN TOOLBARS, ICONS, AND DIALOG BOXES..............................37
Menu Bar Buttons..........................................................................................37
Adjust Knob............................................................................................................................. 38
Dialog Boxes..................................................................................................38
Alternate Access Methods ............................................................................38
Mouse and Keyboard Operation............................................................................................. 38
Tool Bar Buttons ..................................................................................................................... 39
TRACE DESCRIPTORS.....................................................................................40
TURNING ON TRACES .....................................................................................41
VERTICAL SETTINGS AND CHANNEL CONTROLS.......................................43
2 ISSUED: July 2005 WR6A-GS-E Rev B
Page 5

G ETTING S TARTED M ANUAL
Adjusting Sensitivity..................................................................................... 43
Adjusting the Waveform's Position............................................................. 43
Coupling......................................................................................................... 43
TIMEBASE SETUP.............................................................................................44
Combining of Channels................................................................................ 44
To Combine Channels ............................................................................................................ 44
TRIGGERING .....................................................................................................45
Simple Triggers............................................................................................. 45
Edge Trigger on Simple Signals ............................................................................................. 45
Controlling Edge Triggering .................................................................................................... 45
To Set Up an Edge Trigger..................................................................................................... 46
SMART Triggers ............................................................................................ 48
DISPLAY FORMATS..........................................................................................49
Display Setup ................................................................................................ 49
Sequence Mode Display......................................................................................................... 49
Persistence Setup......................................................................................... 50
Saturation Level ...................................................................................................................... 50
3-Dimensional Persistence ..................................................................................................... 51
Show Last Trace ..................................................................................................................... 51
Zooming Waveforms..................................................................................... 51
To Zoom a Single Channel ..................................................................................................... 52
To Zoom by Touch-and-Drag ................................................................................................. 53
To Zoom Multiple Waveforms Quickly .................................................................................... 54
SAVE AND RECALL.......................................................................................... 55
Saving and Recalling Scope Settings ......................................................... 55
To Save Scope Settings .........................................................................................................55
To Recall Scope Settings ....................................................................................................... 55
To Recall Default Settings ......................................................................................................55
WR6A-GS-E Rev B ISSUED: July 2005 3
Page 6

WAVER UNNER 6000A S ERIES
Saving Screen Images...................................................................................56
Saving and Recalling Waveforms.................................................................56
To Save Waveforms ...............................................................................................................56
To Recall Waveforms.............................................................................................................. 58
WRITING FILES TO CD.....................................................................................59
PRINTING AND FILE MANAGEMENT ..............................................................63
Printing ...........................................................................................................63
To Set Up the Printer .............................................................................................................. 63
To Print.................................................................................................................................... 63
Adding Printers and Drivers.................................................................................................... 63
Changing the Default Printer................................................................................................... 64
Managing Files...............................................................................................64
Hard Disk Partitions ................................................................................................................ 64
UTILITIES...........................................................................................................65
Status..............................................................................................................65
To Access Status Dialog.........................................................................................................65
Remote communication ................................................................................65
To Set Up Remote Communication. ....................................................................................... 65
To Configure the Remote Control Assistant Event Log.......................................................... 66
Hardcopy ........................................................................................................66
Printing.................................................................................................................................... 66
Clipboard................................................................................................................................. 66
File ..........................................................................................................................................66
E-Mail...................................................................................................................................... 67
Aux Output .....................................................................................................67
To Set Up Auxiliary Output .....................................................................................................68
Date & Time....................................................................................................68
To Set Time and Date Manually .............................................................................................68
To Set Time and Date from the Internet ................................................................................. 69
To Set Time and Date from Windows..................................................................................... 69
4 ISSUED: July 2005 WR6A-GS-E Rev B
Page 7

G ETTING S TARTED M ANUAL
Options........................................................................................................... 70
Service ........................................................................................................... 70
Show Windows Desktop............................................................................... 71
Touch Screen Calibration............................................................................. 71
Preferences.................................................................................................... 71
Audible Feedback ................................................................................................................... 71
Auto-calibration ....................................................................................................................... 71
Offset Control.......................................................................................................................... 71
Performance Optimization ......................................................................................................72
Offset/Delay Control................................................................................................................ 72
E-mail...................................................................................................................................... 72
Acquisition Status......................................................................................... 73
INTRODUCTION TO WAVESHAPE ANALYSIS................................................74
Parameter Measurements............................................................................. 74
Measure Modes ...................................................................................................................... 74
Standard Vertical Parameters................................................................................................. 74
Standard Horizontal Parameters ............................................................................................ 74
Custom Measurements with My Measure .............................................................................. 75
Status Symbols ....................................................................................................................... 75
WAVEFORM MEASUREMENTS........................................................................76
Measuring with Cursors ............................................................................... 76
Cursor Measurement Icons .................................................................................................... 76
Cursors Setup ............................................................................................... 76
Quick Display ..........................................................................................................................76
Full Setup................................................................................................................................ 76
PARAMETER ANALYSIS ..................................................................................78
Trend measurements.................................................................................... 78
Track View...................................................................................................... 78
WR6A-GS-E Rev B ISSUED: July 2005 5
Page 8

WAVER UNNER 6000A S ERIES
JitterTrack View..............................................................................................78
HISTOGRAMS....................................................................................................79
Creating and Viewing a Histogram...............................................................79
To Set Up a Single Parameter Histogram ..............................................................................79
To View Thumbnail Histograms.............................................................................................. 80
Persistence Histogram............................................................................................................ 80
Persistence Trace Range .......................................................................................................81
Persistence Sigma ..................................................................................................................81
WAVEFORM MATH ...........................................................................................82
Math Setup......................................................................................................82
Resampling To Deskew.................................................................................82
To Resample........................................................................................................................... 83
Rescaling and Assigning Units.....................................................................83
To Set Up Rescaling ............................................................................................................... 83
Averaging Waveforms ...................................................................................83
Summed vs. Continuous Averaging ....................................................................................... 83
To Set Up Continuous Averaging ........................................................................................... 85
To Set Up Summed Averaging ............................................................................................... 85
Enhanced Resolution (ERES).......................................................................86
Waveform Copy..............................................................................................86
Waveform Sparser .........................................................................................87
To Set Up Waveform Sparser................................................................................................. 87
Interpolation...................................................................................................87
To Set Up Interpolation ........................................................................................................... 87
FFT Setup .......................................................................................................88
ANALYSIS..........................................................................................................89
Pass/Fail Testing............................................................................................89
Comparing Parameters...........................................................................................................89
Mask Tests.............................................................................................................................. 90
6 ISSUED: July 2005 WR6A-GS-E Rev B
Page 9

G ETTING S TARTED M ANUAL
Actions .................................................................................................................................... 90
Setting Up Pass/Fail Testing .................................................................................................. 91
Setting Up Mask Testing.........................................................................................................94
CUSTOMIZATION ..............................................................................................96
Solutions ................................................................................................................................. 96
CUSTOMDSO.....................................................................................................98
REMOTE CONTROL OPERATION....................................................................99
Standards....................................................................................................... 99
Program Messages ....................................................................................... 99
AUTOMATION..................................................................................................100
Standards..................................................................................................... 100
WR6A-GS-E Rev B ISSUED: July 2005 7
Page 10

WAVER UNNER 6000A S ERIES
BLANK PAGE
8 ISSUED: July 2005 WR6A-GS-E Rev B
Page 11

G ETTING S TARTED M ANUAL
Introduction
This brief guide includes important safety and installation information for your WaveRunner 6000A
Series oscilloscope along with brief operating procedures to get you started capturing, viewing,
and analyzing your waveforms.
The information contained in this guide also appears in greater detail in the on-line Help manual.
This searchable manual is resident in the scope and also supplied on CD-ROM, shipped with
your scope.
WR6A-GS-E Rev B ISSUED: July 2005 9
Page 12
WAVER UNNER 6000A S ERIES
Safety Requirements
This section contains information and warnings that must be observed to keep the instrument
operating in a correct and safe condition. You are required to follow generally accepted safety
procedures in addition to the safety precautions specified in this section.
SAFETY SYMBOLS AND TERMS
Where the following symbols or terms appear on the instrument’s front or rear panels, or in this
manual, they alert you to important safety considerations.
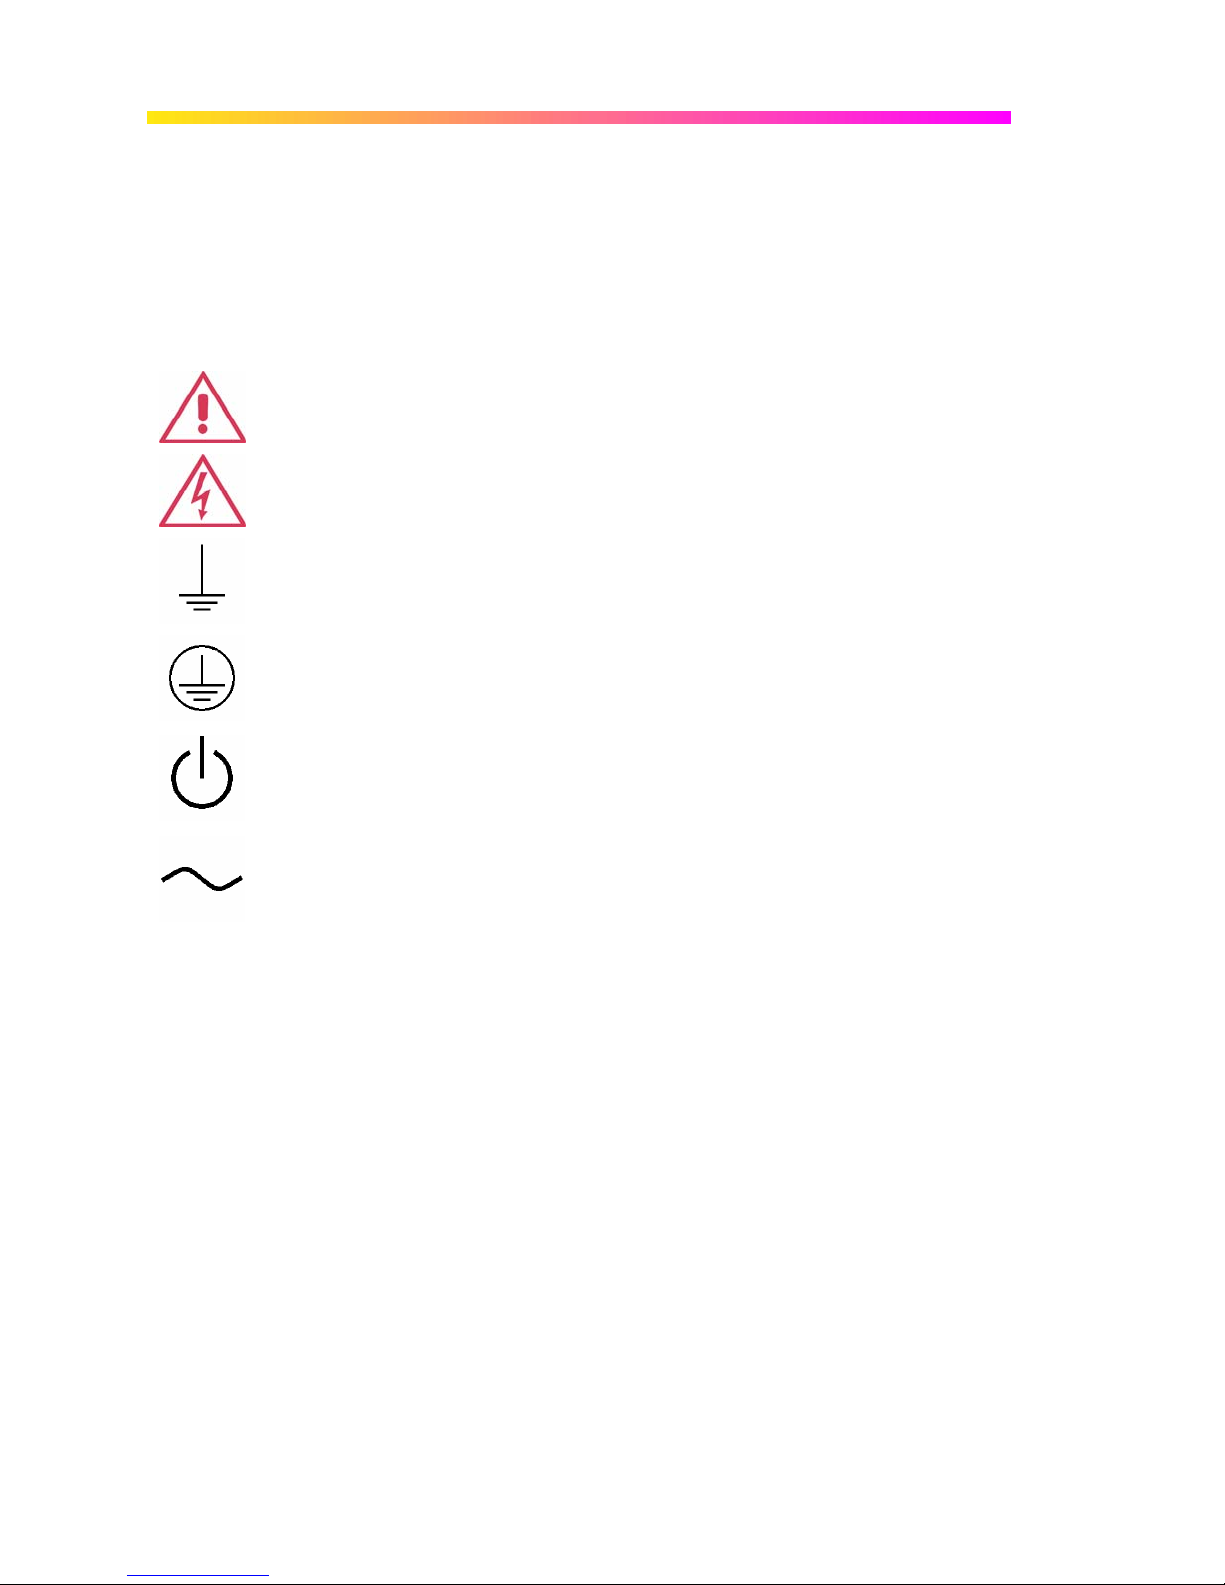
This symbol is used where caution is required. Refer to the accompanying
information or documents in order to protect against personal injury or damage to
the instrument.
This symbol warns of a potential risk of shock hazard.
This symbol is used to denote the measurement ground connection.
This symbol is used to denote a safety ground connection.
This symbol shows that the switch is a On/Standby switch. When it is pressed, the
DSO’s state toggles between Operating and Standby state. This switch is not a
disconnect device. To completely remove power to the DSO, the power cord must
be unplugged from the AC outlet after the DSO is placed in Standby state.
This symbol is used to denote "Alternating Current."
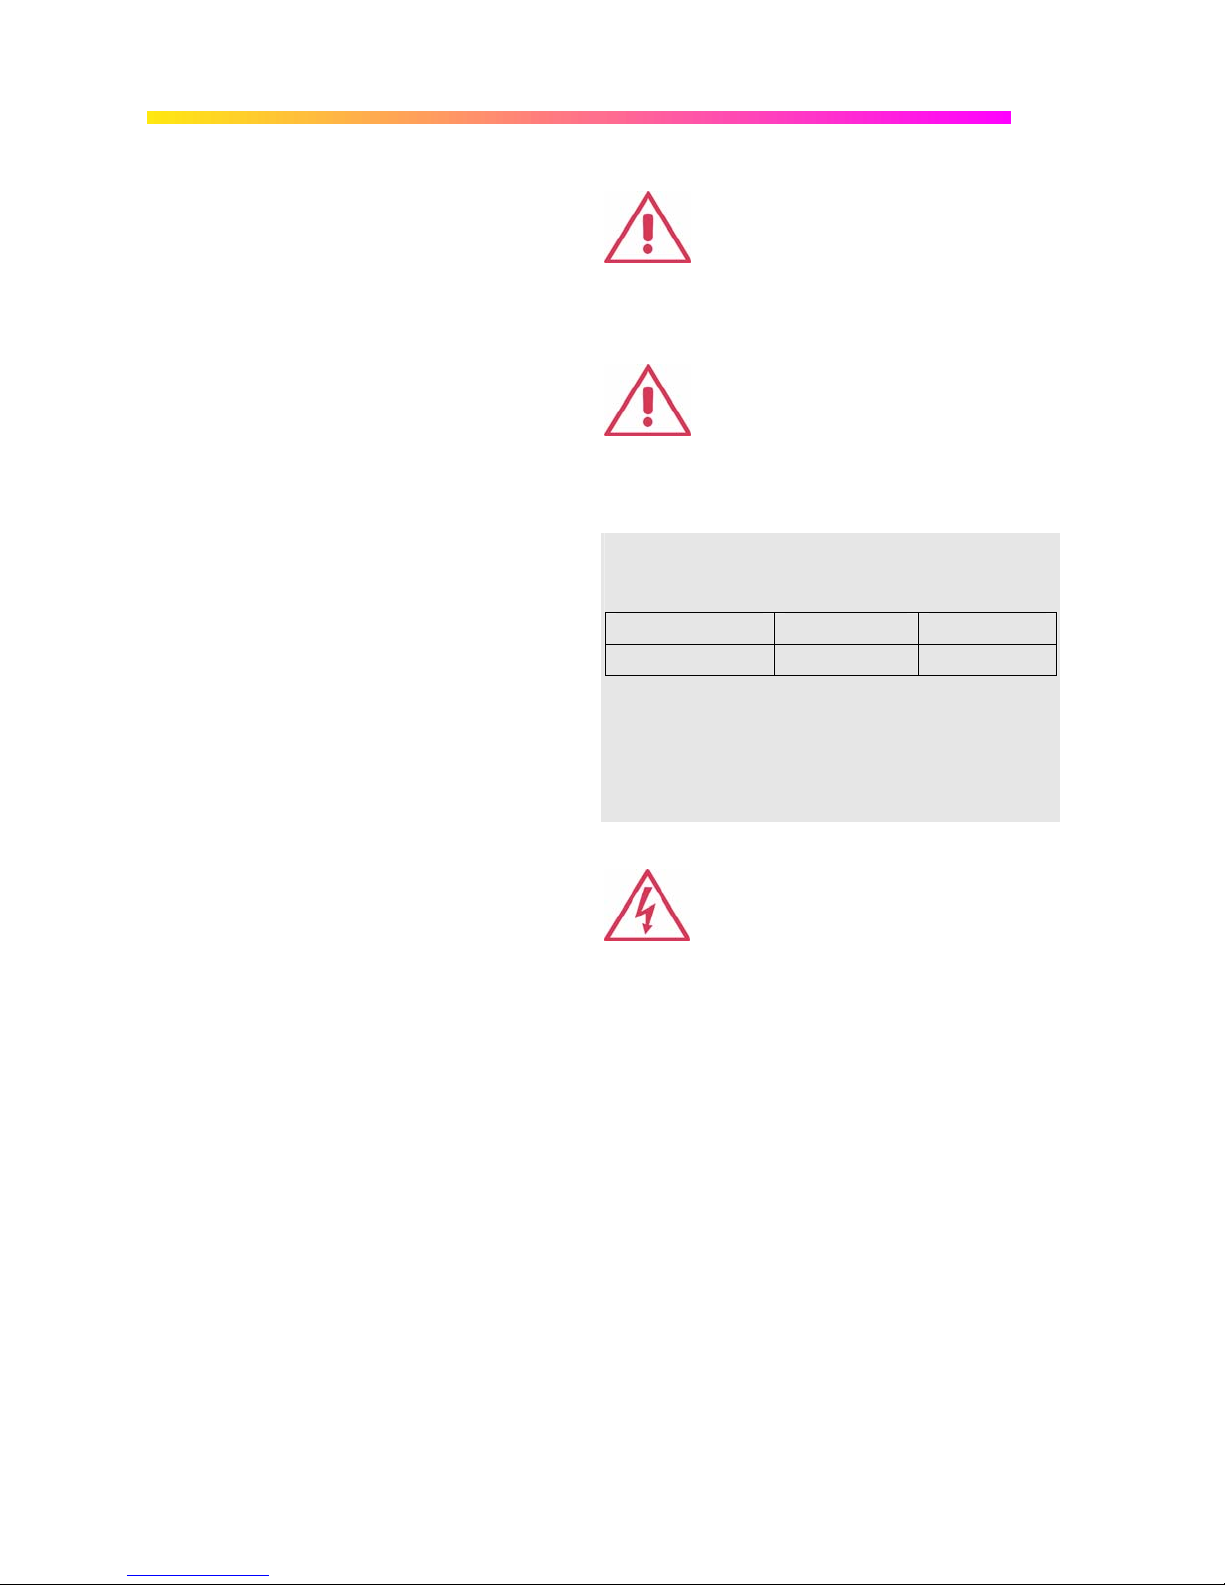
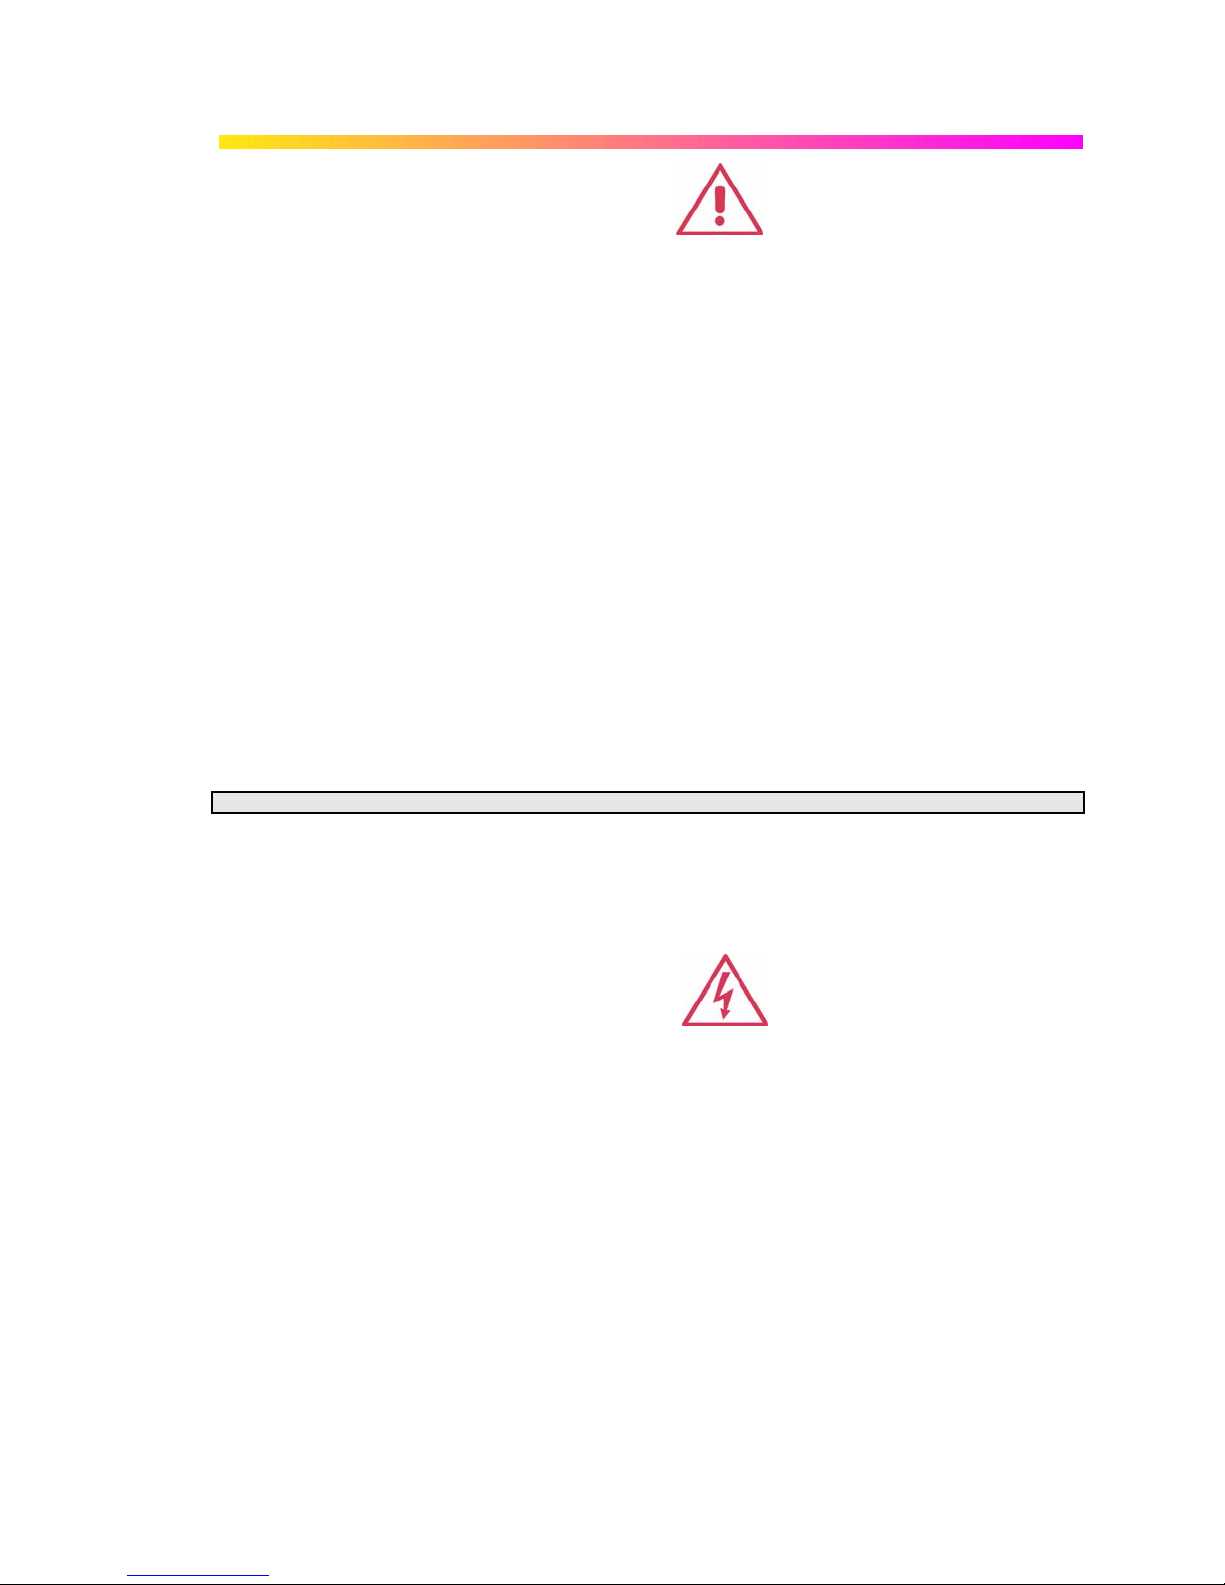
The CAUTION sign indicates a potential hazard. It calls attention to a procedure,
CAUTION
WARNING
10 ISSUED: July 2005 WR6A-GS-E Rev B
practice or condition which, if not followed, could possibly cause damage to
equipment. If a CAUTION is indicated, do not proceed until its conditions are fully
understood and met.
The WARNING sign indicates a potential hazard. It calls attention to a procedure,
practice or condition which, if not followed, could possibly cause bodily injury or
death. If a WARNING is indicated, do not proceed until its conditions are fully
understood and met.
Page 13

G ETTING S TARTED M ANUAL
Installation (Overvoltage) Category rating per EN 61010-1 safety standard and is
CA T I
Operating Environment
The instrument is intended for indoor use and
should be operated in a clean, dry environment
with an ambient temperature within the range of
5 °C to 40 °C.
Note: Direct sunlight, radiators, and other heat sources should
be taken into account when assessing the ambient
temperature.
The design of the instrument has been verified to
conform to EN 61010-1 safety standard per the
following limits:
Installation (Overvoltage) Categories II (Mains
Supply Connector) & I (Measuring Terminals)
Pollution Degree 2
Protection Class I
Note:
Installation (Overvoltage) Category II refers to local distribution
level, which is applicable to equipment connected to the mains
supply (AC power source).
Installation (Overvoltage) Category I refers to signal level, which
is applicable to equipment measuring terminals that are
connected to source circuits in which measures are taken to
limit transient voltages to an appropriately low level.
Pollution Degree 2 refers to an operating environment where
normally only dry non-conductive pollution occurs. Occasionally
a temporary conductivity caused by condensation must be
expected.
Protection Class 1 refers to a grounded equipment, in which
protection against electric shock is achieved by Basic Insulation
and by means of a connection to the protective ground
conductor in the building wiring.
applicable for the oscilloscope front panel measuring terminals. CAT I rated
terminals must only be connected to source circuits in which measures are taken to
limit transient voltages to an appropriately low level.
WARNING
The DSO must not be operated in explosive,
dusty, or wet/damp atmospheres.
CAUTION
Protect the DSO’s display touch screen from
excessive impacts with foreign objects.
CAUTION
Do not exceed the maximum specified front
panel terminal (CH1, CH2, CH3, CH4, EXT)
voltage levels. Refer to Specifications for
more details.
CAUTION
Do not connect or disconnect probes or test
leads while they are connected to a voltage
source.
WR6A-GS-E Rev B ISSUED: July 2005 11
Page 14
WAVER UNNER 6000A S ERIES
Cooling Requirements
The instrument relies on forced air cooling with
internal fans and ventilation openings. Care must
be taken to avoid restricting the airflow around the
apertures (fan holes) at the sides, front, and rear of
the DSO. To ensure adequate ventilation it is
required to leave a 10 cm (4 inch) minimum gap
Do not block the ventilation holes located on both
sides and rear of the DSO.
around the sides, front, and rear of the instrument.
Do not allow any foreign matter to enter the DSO
through the ventilation holes, etc.
AC Power Source
The instrument operates from a single-phase, 100240 V
(+/-5%), or single-phase 100-120 V
(+/-10%) AC power source at 50/60 Hz
rms
(+/-10%) AC
rms
power source at 400 Hz (+/-5%).
No manual voltage selection is required because
the instrument automatically adapts to line voltage.
Note:
The instrument automatically adapts itself to the AC line input
within the following ranges:
Voltage Range: 90 to 264 Vrms 90 to 132 Vrms
Frequency Range: 47 to 63 Hz 380 to 420 Hz
CAUTION
CAUTION
Depending on the accessories installed (internal
printer, front panel probes, PC port plug-ins, etc.),
the instrument can draw up to 400 W (400 VA). For
WaveRunner models 6030A and 6051A only:
350 W (350 VA).
Power and Ground Connections
The instrument is provided with a grounded cord
set containing a molded three-terminal polarized
plug and a standard IEC320 (Type C13) connector
for making line voltage and safety ground
connection. The AC inlet ground terminal is
connected directly to the frame of the instrument.
For adequate protection against electrical shock
hazard, the power cord plug must be inserted into
a mating AC outlet containing a safety ground
contact. Use only the power cord specified for this
instrument and certified for the country of use.
Electrical Shock Hazard!
Any interruption of the protective conductor inside
or outside of the DSO, or disconnection of the
safety ground terminal creates a hazardous
situation.
Intentional interruption is prohibited.
12 ISSUED: July 2005 WR6A-GS-E Rev B
WARNING
Page 15
G ETTING S TARTED M ANUAL
The DSO should be positioned to allow easy
access to the socket-outlet. To completely remove
power to the DSO, unplug the instrument’s power
cord from the AC outlet after the DSO is placed in
Standby state.
In Standby state the DSO is still connected to the
AC supply. The instrument can only be placed in a
complete Power Off state by physically
disconnecting the power cord from the AC supply.
It is recommended that the power cord be
unplugged from the AC outlet if the DSO is not
being used for an extended period of time.
See On/Standby Switch for more information.
The outer shells of the front panel terminals (CH1,
CH2, CH3, CH4, EXT) are connected to the
instrument’s chassis and therefore to the safety
ground.
On/Standby Switch
The front panel On/Standby switch controls the operational state of the DSO. This toggle switch is
activated by momentarily pressing and releasing it.
There are two basic DSO states: On or Standby. In the "On" state, the DSO, including its
computer subsystems (CPU, hard drive, etc,) is fully powered and operational. In the "Standby"
state, the DSO, including computer subsystems, is powered off with the exception of some
"housekeeping" circuitry (approximately 12 watts dissipation).
CAUTION
Always use the On/Standby switch to place the DSO in Standby state so that it executes a proper
shutdown process (including a Windows shutdown) to preserve settings before powering itself off.
This can be accomplished by pressing and holding in the On/Standby switch for approximately 5
seconds.
Note: To power off, place the DSO in Standby state, then disconnect the power cord.
Calibration
The recommended calibration interval is one year. Calibration should be performed by qualified
personnel only.
Cleaning
Clean only the exterior of the instrument, using a
damp, soft cloth. Do not use chemicals or abrasive
elements. Under no circumstances allow moisture
to penetrate the instrument. To avoid electrical
shock, unplug the power cord from the AC outlet
before cleaning.
WR6A-GS-E Rev B ISSUED: July 2005 13
Electrical Shock Hazard!
No operator serviceable parts inside. Do not
remove covers.
Refer servicing to qualified personnel.
WARNING
Page 16

WAVER UNNER 6000A S ERIES
Abnormal Conditions
Operate the instrument only as intended by the
manufacturer.
If you suspect the DSO’s protection has been
impaired, disconnect the power cord and secure
the instrument against any unintended operation.
The DSO’s protection is likely to be impaired if, for
example, the instrument shows visible damage or
has been subjected to severe transport stresses.
Proper use of the instrument depends on careful
reading of all instructions and labels.
VIRUS PROTECTION
Because your scope runs on a Windows-based PC platform, it must be protected from viruses, as
with any PC on a corporate network. It is crucial that the scope be kept up to date with Windows
Critical Updates, and that anti-virus software be installed and continually updated.
Visit www.lecroy.com/dsosecurity for more information regarding Windows Service Pack
compatibility with LeCroy operating software, and related matters.
Any use of the DSO in a manner not specified by
the manufacturer may impair the instrument’s
safety protection. The instrument and related
accessories should not be directly connected to
human subjects or used for patient monitoring.
WARNING
14 ISSUED: July 2005 WR6A-GS-E Rev B
Page 17

G ETTING S TARTED M ANUAL
When Your Scope is Delivered
CHECK THAT YOU HAVE EVERYTHING
First, verify that all items on the packing list or invoice copy have been shipped to you. Contact
your nearest LeCroy customer service center or national distributor if anything is missing or
damaged. If there is something missing or damaged, and you do not contact us immediately, we
cannot be responsible for replacement.
: THE WARRANTY BELOW REPLACES ALL OTHER WARRANTIES, EXPRESSED OR
NNOOTTEE:
IMPLIED, INCLUDING BUT NOT LIMITED TO ANY IMPLIED WARRANTY OF
MERCHANTABILITY, FITNESS, OR ADEQUACY FOR ANY PARTICULAR PURPOSE OR USE.
LECROY SHALL NOT BE LIABLE FOR ANY SPECIAL, INCIDENTAL, OR CONSEQUENTIAL
DAMAGES, WHETHER IN CONTRACT OR OTHERWISE. THE CUSTOMER IS RESPONSIBLE
FOR THE TRANSPORTATION AND INSURANCE CHARGES FOR THE RETURN OF
PRODUCTS TO THE SERVICE FACILITY. LECROY WILL RETURN ALL PRODUCTS UNDER
WARRANTY WITH TRANSPORT PREPAID.
WARRANTY
The oscilloscope is warranted for normal use and operation, within specifications, for a period of
three years from shipment. LeCroy will either repair or, at our option, replace any product
returned to one of our authorized service centers within this period. However, in order to do this
we must first examine the product and find that it is defective due to workmanship or materials
and not due to misuse, neglect, accident, or abnormal conditions or operation.
LeCroy shall not be responsible for any defect, damage, or failure caused by any of the following:
a) attempted repairs or installations by personnel other than LeCroy representatives or b)
improper connection to incompatible equipment, or c) for any damage or malfunction caused by
the use of non-LeCroy supplies. Furthermore, LeCroy shall not be obligated to service a product
that has been modified or integrated where the modification or integration increases the task
duration or difficulty of servicing the oscilloscope. Spare and replacement parts, and repairs, all
have a 90-day warranty.
The oscilloscope’s firmware has been thoroughly tested and is presumed to be functional.
Nevertheless, it is supplied without warranty of any kind covering detailed performance. Products
not made by LeCroy are covered solely by the warranty of the original equipment manufacturer.
MAINTENANCE AGREEMENTS
We offer a variety of services under the heading of Maintenance Agreements. These give
extended warranty and allow you to budget maintenance costs after the initial three-year warranty
has expired. Installation, training, enhancements, and on-site repairs — among other services —
are available through special supplemental support agreements. Inquire at your LeCroy customer
service center or national distributor.
WR6A-GS-E Rev B ISSUED: July 2005 15
Page 18

WAVER UNNER 6000A S ERIES
WINDOWS LICENSE AGREEMENT
LeCroy's agreement with Microsoft prohibits users from running software on LeCroy
X-Stream oscilloscopes that is not relevant to measuring, analyzing, or documenting waveforms.
End-User License Agreement For Le croy® X-Stream Software
IMPORTANT-READ CAREFULLY: THIS END-USER LICENSE AGREEMENT (“EULA”) IS A
LEGAL AGREEMENT BETWEEN THE INDIVIDUAL OR ENTITY LICENSING THE SOFTWARE
PRODUCT (“YOU” OR “YOUR”) A ND LECROY CORPORATION (“LECROY”) FOR THE
SOFTWARE PRODUCT(S) ACCOMPANYING THIS EULA, WHICH INCLUDE(S): COMPUTER
PROGRAMS; ANY “ONLINE” OR ELECTRONIC DOCUMENTATION AND PRINTED
MATERIALS PROVIDED BY LECROY HEREWITH ( “DOC UMENTATION”); ASSOCIATED
MEDIA; AND ANY UPDATES (AS DEFINED BELOW) (COLLECTIVELY, THE “SOFTWARE
PRODUCT”). BY USING AN INSTRUMENT TOGETHER WITH OR CONTAI NING THE
SOFTWARE PRODUCT, OR BY INSTALLING, COPYING, OR OTHERWISE USING THE
SOFTWARE PRODUCT, IN WHOLE OR IN PART, YOU AGREE TO BE BOUND BY THE
TERMS OF THIS EULA. IF YOU DO NOT AGREE TO THE TERMS OF THIS EULA, DO NOT
INSTALL, COPY, OR OTHERWISE USE THE SOFTWARE PRODUCT; YOU MAY RETURN
THE SOFTWARE PRODUCT TO YOUR PLACE OF PURCHASE FOR A FULL REFUND. IN
ADDITION, BY INSTALLING, COPYING, OR OTHERWISE USING ANY MODIFICATIONS,
ENHANCEMENTS, NEW VERSIONS, BUG FIXES, OR OTHER COMPONENTS OF THE
SOFTWARE PRODUCT THAT LECROY PROVIDES TO YOU SEPARATELY AS PART OF THE
SOFTWARE PRODU CT (“UPDA TES”), YOU AGREE TO BE BOUND BY ANY ADDITIONAL
LICENSE TERMS THAT ACCOMPANY SUCH UPDATES. IF YOU DO NOT AGREE TO SUCH
ADDITIONAL LICENSE TERMS, YOU MAY NOT INSTALL, COPY, OR OTHERWISE USE
SUCH UPDATES.
THE PARTIES CONFIRM THAT THIS AGREEMENT AND ALL RELATED DOCUMENTATION
ARE AND WILL BE DRAFTED IN ENGLISH. LES PARTIES AUX PRÉSENTÉS CONFIRMENT
LEUR VOLONTÉ QUE CETTE CONVENTION DE MÊME QUE TOUS LES DOCUMENTS Y
COMPRIS TOUT AVIS QUI S’Y RATTACHÉ, SOIENT REDIGÉS EN LANGUE ANGLAISE.
1. GRANT OF LICENSE.
1.1 License Grant.
fees, LeCroy grants to you a nonexclusive, nontransferable license (the “License”) to: (a) operate
the Software Product as provided or installed, in object code form, for your own internal business
purposes, (i) for use in or with an instrument provided or manufactured by LeCroy (an
“Instrument”), (ii) for testing your software product(s) (to be used solely by you) that are designed
to operate in conjunction with an Instrument (“Your Software”), and (iii) make one copy for
archival and back-up purposes; (b) make and use copies of the Documentation; provided that
such copies will be used only in connection with your licensed use of the Software Product, and
such copies may not be republished or distributed (either in hard copy or electronic form) to any
third party; and (c) copy, modify, enhance and prepare derivative works (“Derivatives”) of the
source code version of those portions of the Software Product set forth in and identified in the
Documentation as “Samples” (“Sample Code”) for the sole purposes of designing, developing,
16 ISSUED: July 2005 WR6A-GS-E Rev B
Subject to the terms and conditions of this EULA and payment of all applicable
Page 19

G ETTING S TARTED M ANUAL
and testing Your Software. If you are an entity, only one designated individual within your
organization, as designated by you, may exercise the License; provided that additional individuals
within your organization may assist with respect to reproducing and distributing Sample Code as
permitted under Section 1.1(c)(ii). LeCroy reserves all rights not expressly granted to you. No
license is granted hereunder for any use other than that specified herein, and no license is
granted for any use in combination or in connection with other products or services (other than
Instruments and Your Software) without the express prior written consent of LeCroy. The Software
Product is licensed as a single product. Its component parts may not be separated for use by
more than one user. This EULA does not grant you any rights in connection with any trademarks
or service marks of LeCroy. The Software Product is protected by copyright laws and international
copyright treaties, as well as other intellectual property laws and treaties. The Software Product is
licensed, not sold. The terms of this printed, paper EULA supersede the terms of any on-screen
license agreement found within the Software Product.
1.2 Upgrades.
the License will not take effect, and you will have no right to use or access the Software Product
unless you are properly licensed to use a product identified by LeCroy as being eligible for the
upgrade (“Underlying Product”). A Software Product labeled as an “upgrade” replaces and/or
supplements the Underlying Product. You may use the resulting upgraded product only in
accordance with the terms of this EULA. If the Software Product is an upgrade of a component of
a package of software programs that you licensed as a single product, the Software Product may
be used and transferred only as part of that single product package and may not be separated for
use on more than one computer.
1.3. Limitations.
use any Confidential Information to create any software or documentation that is similar to any of
the Software Product or Documentation; (b) encumber, transfer, rent, lease, time-share or use the
Software Product in any service bureau arrangement; (c) copy (except for archival purposes),
distribute, manufacture, adapt, create derivative works of, translate, localize, port or otherwise
modify the Software Product or the Documentation; (d) permit access to the Software Product by
any party developing, marketing or planning to develop or market any product having functionality
similar to or competitive with the Software Product; (e) publish benchmark results relating to the
Software Product, nor disclose Software Product features, errors or bugs to third parties; or (f)
permit any third party to engage in any of the acts proscribed in clauses (a) through (e). In
jurisdictions in which transfer is permitted, notwithstanding the foregoing prohibition, transfers will
only be effective if you transfer a copy of this EULA, as well as all copies of the Software Product,
whereupon your right to use the Software product will terminate. Except as described in this
Section 1.3, You are not permitted (i) to decompile, disassemble, reverse compile, reverse
assemble, reverse translate or otherwise reverse engineer the Software Product, (ii) to use any
similar means to discover the source code of the Software Product or to discover the trade
secrets in the Software Product, or (iii) to otherwise circumvent any technological measure that
controls access to the Software Product. You may reverse engineer or otherwise circumvent the
technological measures protecting the Software Product for the sole purpose of identifying and
analyzing those elements that are necessary to achieve Interoperability (the “Permitted
Objective”) only if: (A) doing so is necessary to achieve the Permitted Objective and it does not
If the Software Product is labeled as an “upgrade,” (or other similar designation)
Except as specifically permitted in this EULA, you will not directly or indirectly (a)
WR6A-GS-E Rev B ISSUED: July 2005 17
Page 20

WAVER UNNER 6000A S ERIES
constitute infringement under Title 17 of the United States Code; (B) such circumvention is
confined to those parts of the Software Product and to such acts as are necessary to achieve the
Permitted Objective; (C) the information to be gained thereby has not already been made readily
available to you or has not been provided by LeCroy within a reasonable time after a written
request by you to LeCroy to provide such information; (D) the information gained is not used for
any purpose other than the Permitted Objective and is not disclosed to any other person except
as may be necessary to achieve the Permitted Objective; and (E) the information obtained is not
used (1) to create a computer program substantially similar in its expression to the Software
Product including, but not limited to, expressions of the Software Product in other computer
languages, or (2) for any other act restricted by LeCroy’s intellectual property rights in the
Software Product. “Interoperability” will have the same meaning in this EULA as defined in the
Digital Millennium Copyright Act, 17 U.S.C. §1201(f), the ability of computer programs to
exchange information and of such programs mutually to use the information which has been
exchanged.
1.4 Prerelease Code.
(“Prerelease Code”). Prerelease Code is not at the level of performance and compatibility of the
final, generally available product offering. The Prerelease Code may not operate correctly and
may be substantially modified prior to first commercial shipment. LeCroy is not obligated to make
this or any later version of the Prerelease Code commercially available. The License with respect
to the Prerelease Code terminates upon availability of a commercial release of the Prerelease
Code from LeCroy.
2. SUPPORT SERVICES.
At LeCroy’s sole discretion, from time to time, LeCroy may provide Updates to the Software
Product. LeCroy shall have no obligation to revise or update the Software Product or to support
any version of the Software Product. At LeCroy’s sole discretion, upon your request, LeCroy may
provide you with support services related to the Software Product (“Support Services”) pursuant
to the LeCroy policies and programs described in the Documentation or otherwise then in effect,
and such Support Services will be subject to LeCroy’s then-current fees therefor, if any. Any
Update or other supplemental software code provided to you pursuant to the Support Services
will be considered part of the Software Product and will be subject to the terms and conditions of
this EULA. LeCroy may use any technical information you provide to LeCroy during LeCroy’s
provision of Support Services, for LeCroy’s business purposes, including for product support and
development. LeCroy will not utilize such technical information in a form that personally identifies
you.
3. PROPRIETARY RIGHTS.
3.1 Right and Title.
(including but not limited to any intellectual property or other proprietary rights, images, icons,
photographs, text, and “applets” embodied in or incorporated into the Software Product,
collectively, “Content”), and all Derivatives, and any copies thereof are owned by LeCroy and/or
its licensors or third-party suppliers, and is protected by applicable copyright or other intellectual
property laws and treaties. You will not take any action inconsistent with such title and ownership.
Portions of the Software Product may be identified as prerelease code
All right, title and interest in and to the Software Product and Documentation
18 ISSUED: July 2005 WR6A-GS-E Rev B
Page 21

G ETTING S TARTED M ANUAL
This EULA grants you no rights to use such Content outside of the proper exercise of the license
granted hereunder, and LeCroy will not be responsible or liable therefor.
3.2 Intellectual Property Protection.
copyright, trade secret, proprietary or other legal notices contained on or in copies of the Software
Product or Documentation.
3.3 Confidentiality.
disclose any Confidential Information (as defined below) of the other party without the written
consent of the disclosing party. A party receiving Confidential Information from the other shall use
the highest commercially reasonable degree of care to protect the Confidential Information,
including ensuring that its employees and consultants with access to such Confidential
Information have agreed in writing not to disclose the Confidential Information. You shall bear the
responsibility for any breaches of confidentiality by your employees and consultants. Within ten
(10) days after request of the disclosing party, and in the disclosing party's sole discretion, the
receiving party shall either return to the disclosing party originals and copies of any Confidential
Information and all information, records and materials developed therefrom by the receiving party,
or destroy the same, other than such Confidential Information as to which this EULA expressly
provides a continuing right to the receiving party to retain at the time of the request. Either party
may only disclose the general nature, but not the specific financial terms, of this EULA without the
prior consent of the other party; provided either party may provide a copy of this EULA to any
finance provider in conjunction with a financing transaction, if such provider agrees to keep this
EULA confidential. Nothing herein shall prevent a receiving party from disclosing all or part of the
Confidential Information as necessary pursuant to the lawful requirement of a governmental
agency or when disclosure is required by operation of law; provided that prior to any such
disclosure, the receiving party shall use reasonable efforts to (a) promptly notify the disclosing
party in writing of such requirement to disclose, and (b) cooperate fully with the disclosing party in
protecting against any such disclosure or obtaining a protective order. Money damages will not be
an adequate remedy if this Section 4.3 is breached and, therefore, either party shall, in addition to
any other legal or equitable remedies, be entitled to seek an injunction or similar equitable relief
against such breach or threatened breach without the necessity of posting any bond. As used
herein, “Confidential Information” means LeCroy pricing or information concerning new LeCroy
products, trade secrets (including without limitation all internal header information contained in or
created by the Software Product, all benchmark and performance test results and all
Documentation) and other proprietary information of LeCroy; and any business, marketing or
technical information disclosed by LeCroy, or its representatives, or you in relation to this EULA,
and either (i) disclosed in writing and marked as confidential at the time of disclosure or (ii)
disclosed in any other manner such that a reasonable person would understand the nature and
confidentiality of the information. Confidential Information does not include information (A) already
in the possession of the receiving party without an obligation of confidentiality to the disclosing
party, (B) hereafter rightfully furnished to the receiving party by a third party without a breach of
any separate nondisclosure obligation to the disclosing party, (C) publicly known without breach
of this EULA, (d) furnished by the disclosing party to a third party without restriction on
subsequent disclosure, or (e) independently developed by the receiving party without reference to
or reliance on the Confidential Information.
Except for the specific rights granted by this EULA, neither party shall use or
You may not alter or remove any printed or on-screen
WR6A-GS-E Rev B ISSUED: July 2005 19
Page 22

WAVER UNNER 6000A S ERIES
4. TERMINATION.
This EULA will remain in force until termination pursuant to the terms hereof. You may terminate
this EULA at any time. This EULA will also terminate if you breach any of the terms or conditions
of this EULA. You agree that if this EULA terminates for any reason, the License will immediately
terminate and you will destroy all copies of the Software Product (and all Derivatives), installed or
otherwise, the Documentation, and the Confidential Information (and all derivatives of any of the
foregoing) that are in your possession or under your control. The provisions of Sections 1.3, 4, 6,
7, 8, and 9 will survive any termination or expiration hereof.
5. U.S. GOVERNMENT RESTRICTED RIGHTS.
If any Software Product or Documentation is acquired by or on behalf of a unit or agency of the
United States Government (any such unit or agency, the “Government”), the Government agrees
that the Software Product or Documentation is “commercial computer software” or “commercial
computer software documentation” and that, absent a written agreement to the contrary, the
Government’s rights with respect to the Software Product or Documentation are, in the case of
civilian agency use, Restricted Rights, as defined in FAR §52.227.19, and if for Department of
Defense use, limited by the terms of this EULA, pursuant to DFARS §227.7202. The use of the
Software Product or Documentation by the Government constitutes acknowledgment of LeCroy’s
proprietary rights in the Software Product and Documentation. Manufacturer is LeCroy
Corporation, 700 Chestnut Ridge Road, Chestnut Ridge, NY 10977 USA.
6. EXPORT RESTRICTIONS.
You agree that you will not export or re-export the Software Product, any part thereof, or any
process or service that is the direct product of the Software Product (the foregoing collectively
referred to as the “Restricted Components”), to any country, person, entity or end user subject to
U.S. export restrictions. You specifically agree not to export or re-export any of the Restricted
Components (a) to any country to which the U.S. has embargoed or restricted the export of goods
or services, which currently include, but are not necessarily limited to Cuba, Iran, Iraq, Libya,
North Korea, Sudan and Syria, or to any national of any such country, wherever located, who
intends to transmit or transport the Restricted Components back to such country; (b) to any end
user who you know or have reason to know will utilize the Restricted Components in the design,
development or production of nuclear, chemical or biological weapons; or (c) to any end-user who
has been prohibited from participating in U.S. export transactions by any federal agency of the
U.S. government. You warrant and represent that neither the BXA nor any other U.S. federal
agency has suspended, revoked or denied your export privileges. It is your responsibility to
comply with the latest United States export regulations, and you will defend and indemnify LeCroy
from and against any damages, fines, penalties, assessments, liabilities, costs and expenses
(including reasonable attorneys' fees and court costs) arising out of any claim that the Software
Product, Documentation, or other information or materials provided by LeCroy hereunder were
exported or otherwise accessed, shipped or transported in violation of applicable laws and
regulations.
20 ISSUED: July 2005 WR6A-GS-E Rev B
Page 23

7. RISK ALLOCATION.
G ETTING S TARTED M ANUAL
7.1 No Warranty.
PRODUCT AND SUPPORT SERVICES IS/ARE BEING PROVIDED "AS IS" WITHOUT
WARRANTY OF ANY KIND. LECROY, FOR ITSELF AND ITS SUPPLIERS, HEREBY
DISCLAIMS ALL WARRANTIES, WHETHER EXPRESS OR IMPLIED, ORAL OR WRITTEN,
WITH RESPECT TO THE SOFTWARE PRODUCT OR ANY SUPPORT SERVICES INCLUDING,
WITHOUT LIMITATION, ALL IMPLIED WARRANTIES OF TITLE OR NON-INFRINGEMENT,
MERCHANTABILITY, FITNESS FOR A PARTICULAR PURPOSE, ACCURACY, INTEGRATION,
VALIDITY, EXCLUSIVITY, MERCHANTABILITY, NON-INTERFERENCE WITH ENJOYMENT,
FITNESS FOR ANY PARTICULAR PURPOSE, AND ALL WARRANTIES IMPLIED FROM ANY
COURSE OF DEALING OR USAGE OF TRADE. YOU ACKNOWLEDGE THAT NO
WARRANTIES HAVE BEEN MADE TO YOU BY OR ON BEHALF OF LECROY OR
OTHERWISE FORM THE BASIS FOR THE BARGAIN BETWEEN THE PARTIES.
7.2. Limitation of Liability.
WHATSOEVER, REGARDLESS OF THE FORM OF ANY CLAIM OR ACTION, SHALL NOT
EXCEED THE GREATER OF THE AMOUNT ACTUALLY PAID BY YOU FOR THE SOFTWARE
PRODUCT OR U.S.$5.00; PROVIDED THAT IF YOU HAVE ENTERED INTO A SUPPORT
SERVICES AGREEMENT WITH LECROY, LECROY’S ENTIRE LIABILITY REGARDING
SUPPORT SERVICES WILL BE GOVERNED BY THE TERMS OF THAT AGREEMENT.
LECROY SHALL NOT BE LIABLE FOR ANY LOSS OF PROFITS, LOSS OF USE, LOSS OF
DATA, INTERRUPTION OF BUSINESS, NOR FOR INDIRECT, SPECIAL, INCIDENTAL,
CONSEQUENTIAL OR EXEMPLARY DAMAGES OF ANY KIND, WHETHER UNDER THIS
EULA OR OTHERWISE ARISING IN ANY WAY IN CONNECTION WITH THE SOFTWARE
PRODUCT, THE DOCUMENTATION OR THIS EULA. SOME JURISDICTIONS DO NOT ALLOW
THE EXCLUSION OR LIMITATION OF INCIDENTAL OR CONSEQUENTIAL DAMAGES, SO
THE ABOVE EXCLUSION OR LIMITATION MAY NOT APPLY TO YOU. THESE LIMITATIONS
ARE INDEPENDENT FROM ALL OTHER PROVISIONS OF THIS EULA AND SHALL APPLY
NOTWITHSTANDING THE FAILURE OF ANY REMEDY PROVIDED HEREIN.
THE SOFTWARE PRODUCT IS NOT ERROR-FREE AND THE SOFTWARE
LECROY’S LIABILITY FOR DAMAGES FOR ANY CAUSE
7.3 Indemnification.
directors, affiliates, contractors, agents, and employees from, against and in respect of any and
all assessments, damages, deficiencies, judgments, losses, obligations and liabilities (including
costs of collection and reasonable attorneys’ fees, expert witness fees and expenses) imposed
upon or suffered or incurred by them arising from or related to your use of the Software Product.
8. GENERAL PROVISIONS.
8.1 Compliance with Laws.
governmental requirements with respect to the Software Product, and the performance by you of
your obligations hereunder, of any jurisdiction in or from which you directly or indirectly cause the
Software Product to be used or accessed.
8.2 No Agency.
agent or representative of the other party, or both parties as joint venturers or partners for any
purpose.
WR6A-GS-E Rev B ISSUED: July 2005 21
You will defend, indemnify and hold harmless LeCroy and its officers,
You will comply with all laws, legislation, rules, regulations, and
Nothing contained in this EULA will be deemed to constitute either party as the
Page 24

WAVER UNNER 6000A S ERIES
8.3 Entire Agreement; Waiver; Severability. This EULA constitutes the entire agreement between
the parties with regard to the subject matter hereof. No provision of, right, power or privilege
under this EULA will be deemed to have been waived by any act, delay, omission or
acquiescence by LeCroy, its agents, or employees, but only by an instrument in writing signed by
an authorized officer of LeCroy. No waiver by LeCroy of any breach or default of any provision of
this EULA by you will be effective as to any other breach or default, whether of the same or any
other provision and whether occurring prior to, concurrent with, or subsequent to the date of such
waiver. If any provision of this EULA is declared by a court of competent jurisdiction to be invalid,
illegal or unenforceable, such provision will be severed from this EULA and all the other
provisions will remain in full force and effect.
8.4 Governing Law; Jurisdiction; Venue.
accordance with the laws of the State of New York, USA, without regard to its choice of law
provisions. The United Nations Convention on Contracts for the International Sale of Goods will
not apply to this EULA. Exclusive jurisdiction and venue for any litigation arising under this EULA
is in the federal and state courts located in New York, New York, USA and both parties hereby
consent to such jurisdiction and venue for this purpose.
8.5 Assignment.
whole or in part by you, except to a successor to the whole of your business, without the prior
written consent of LeCroy. In the case of any permitted assignment or transfer of or under this
EULA, this EULA or the relevant provisions will be binding upon, and inure to the benefit of, the
successors, executors, heirs, representatives, administrators and assigns of the parties hereto.
8.6 Notices.
be in writing and delivered personally, sent by confirmed fax, by confirmed e-mail, by certified
mail, postage prepaid and return receipt requested, or by a nationally recognized express delivery
service. All notices will be in English and will be effective upon receipt.
8.7 Headings.
deemed to supersede or modify any provisions.
8.8 Acknowledgment.
it has had an opportunity to have its legal counsel review this EULA, (c) this EULA has the same
force and effect as a signed agreement, and (d) issuance of this EULA does not constitute
general publication of the Software Product or other Confidential Information.
This EULA and the rights and obligations hereunder, may not be assigned, in
All notices or other communications between LeCroy and you under this EULA will
The headings used in this EULA are intended for convenience only and will not be
Licensee acknowledges that (a) it has read and understands this EULA, (b)
This EULA will be governed by and construed in
22 ISSUED: July 2005 WR6A-GS-E Rev B
Page 25
Installation
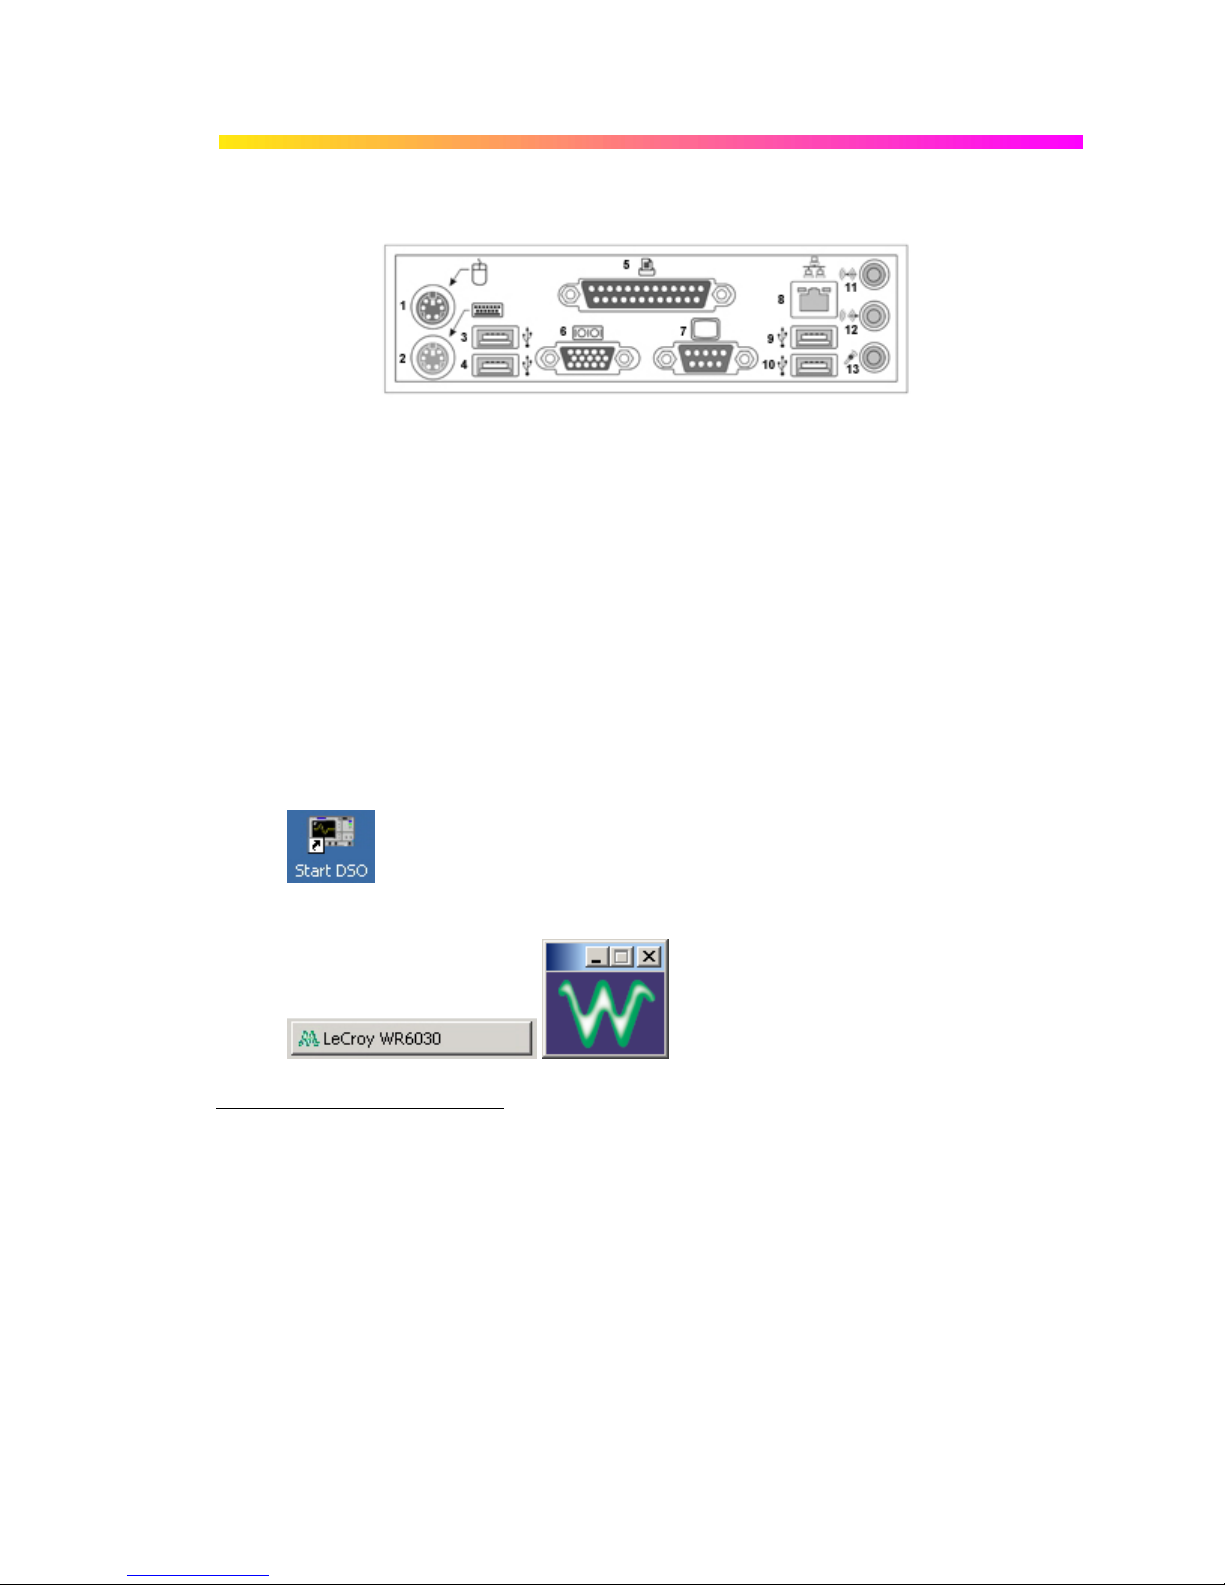
HARDWARE CONNECTIONS
G ETTING S TARTED M ANUAL
(1) Mouse
*
; (2) Keyboard*; (3) USB Port; (4) USB Port; (5) Centronics Port; (6) RS-232-C
Port; (7) External VGA Monitor; (8) Ethernet Port; (9) USB Port; (10) US B Port; (11) Line In;
(12) Speakers; (13) Microphone
SOFTWARE
You can find out the scope's software and hardware configuration as follows:
1. In the tool bar, touch Utilities.
2. In the dialog area, touch Status.
ADDING A NEW OPTION
To add a software option you will need a code to enable the option. Call LeCroy Customer
Support to place an order and receive the code.
RESTORING SOFTWARE
Restarting the Applica tion
Upon initial power-up, the scope will load the instrument application software automatically.
• If you exit the application and want to reload it, touch the shortcut icon on the desktop:
.
• If you minimize the application, touch the appropriate task bar or desktop button to
maximize it:
*
The mouse and keyboard supplied with your scope are USB devices that can be plugged into any available USB
connector.
WR6A-GS-E Rev B ISSUED: July 2005 23
.
Page 26
WAVER UNNER 6000A S ERIES
Restarting the Operating System
If you need to restart the Windows® operating system, you will have to reboot the scope by
pressing and holding in the power switch for 10 seconds, then turning the power back on.
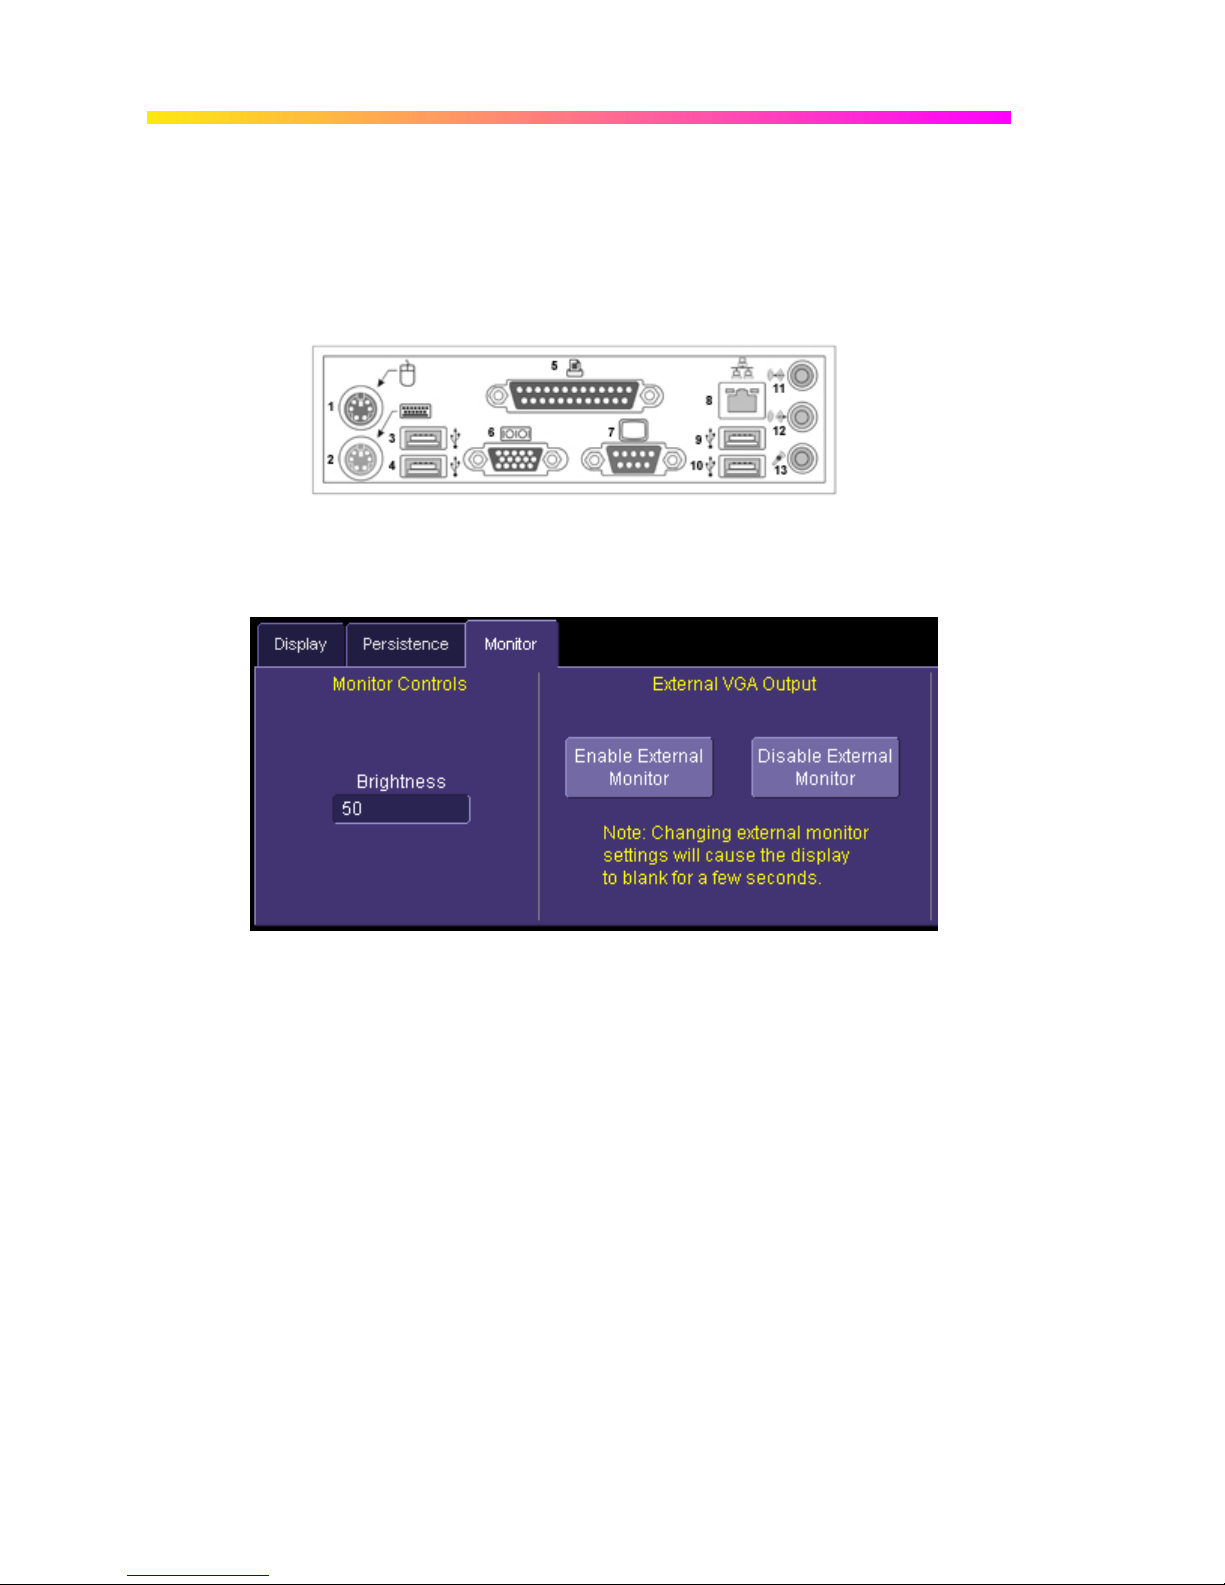
EXTERNAL MONITOR
You can easily add an external monitor to your scope as follows:
1. Connect the external monitor to the VGA port at the rear of the instrument (item 7 in the
diagram).
2. Plug in the monitor's power cord, and apply power to the monitor.
3. After boot-up, touch Display in the menu bar, then Display Setup... in the drop-down
menu.
4. Touch the Monitor tab of the "Display" dialog:
5. Touch Enable External Monitor.
6. Touch inside the Brightness field and adjust brightness as necessary.
24 ISSUED: July 2005 WR6A-GS-E Rev B
Page 27

G ETTING S TARTED M ANUAL
System Recovery
Your WaveRunner 6000A series oscilloscope was designed to operate very reliably for many
years. However, the application software that operates the instrument runs on a Windows
platform. The loading or incomplete removal of additional Windows applications may eventually
cause problems in the stability of the operating system. In severe cases, it may be necessary to
reload the base operating system and oscilloscope application. This can be done by using a
recovery routine to restore a clean copy of the image originally installed on the C: drive. Any user
data and calibration data located within the D: partition will not be affected by the recovery
process.
LeCroy has provided a recovery application, along with a backup image, in an extra partition on
the instrument’s hard drive. The recovery process is easy to perform, using the instructions
provided below.
After the recovery procedure is done, you must activate Windows, either by internet connection to
Microsoft’s Web site or by telephone. For this you will need to supply the Windows Product Key
number, which is affixed to the rear of the scope.
Note: The recovery process will produce a replica of the operating system and oscilloscope application software to the
revision levels that were current at the time the oscilloscope was manufactured. Any further revisions of the application
software, Windows operating system, and virus scan definition files will not be upgraded automatically. After completion of
the disk image recovery, it is highly recommended that you search the vendors’ Web sites to upgrade the individual
components to their current revision level. The current oscilloscope application software can be downloaded directly from
the LeCroy Web site at www.lecroy.com.
Since the calibration data for the oscilloscope is stored in the D: drive, the current calibration constants will not be
overwritten during the recovery process.
Recovery Procedure
1. Connect an network cable to the LAN port at the rear of the scope if you intend to
activate windows through the internet.
2. Connect a keyboard and a mouse to the scope.
3. Apply power to the scope.
4. As soon as the LeCroy logo appears on the screen, press and hold down the F4 key until
the recovery software logo appears momentarily:
WR6A-GS-E Rev B ISSUED: July 2005 25
Page 28

WAVER UNNER 6000A S ERIES
5. Then the cME console End User License Agreement is displayed. Read the agreement,
and click Accept:
6. The Phoenix cME Console main page is displayed. Click Click here to start recover:
26 ISSUED: July 2005 WR6A-GS-E Rev B
Page 29
G ETTING S TARTED M ANUAL
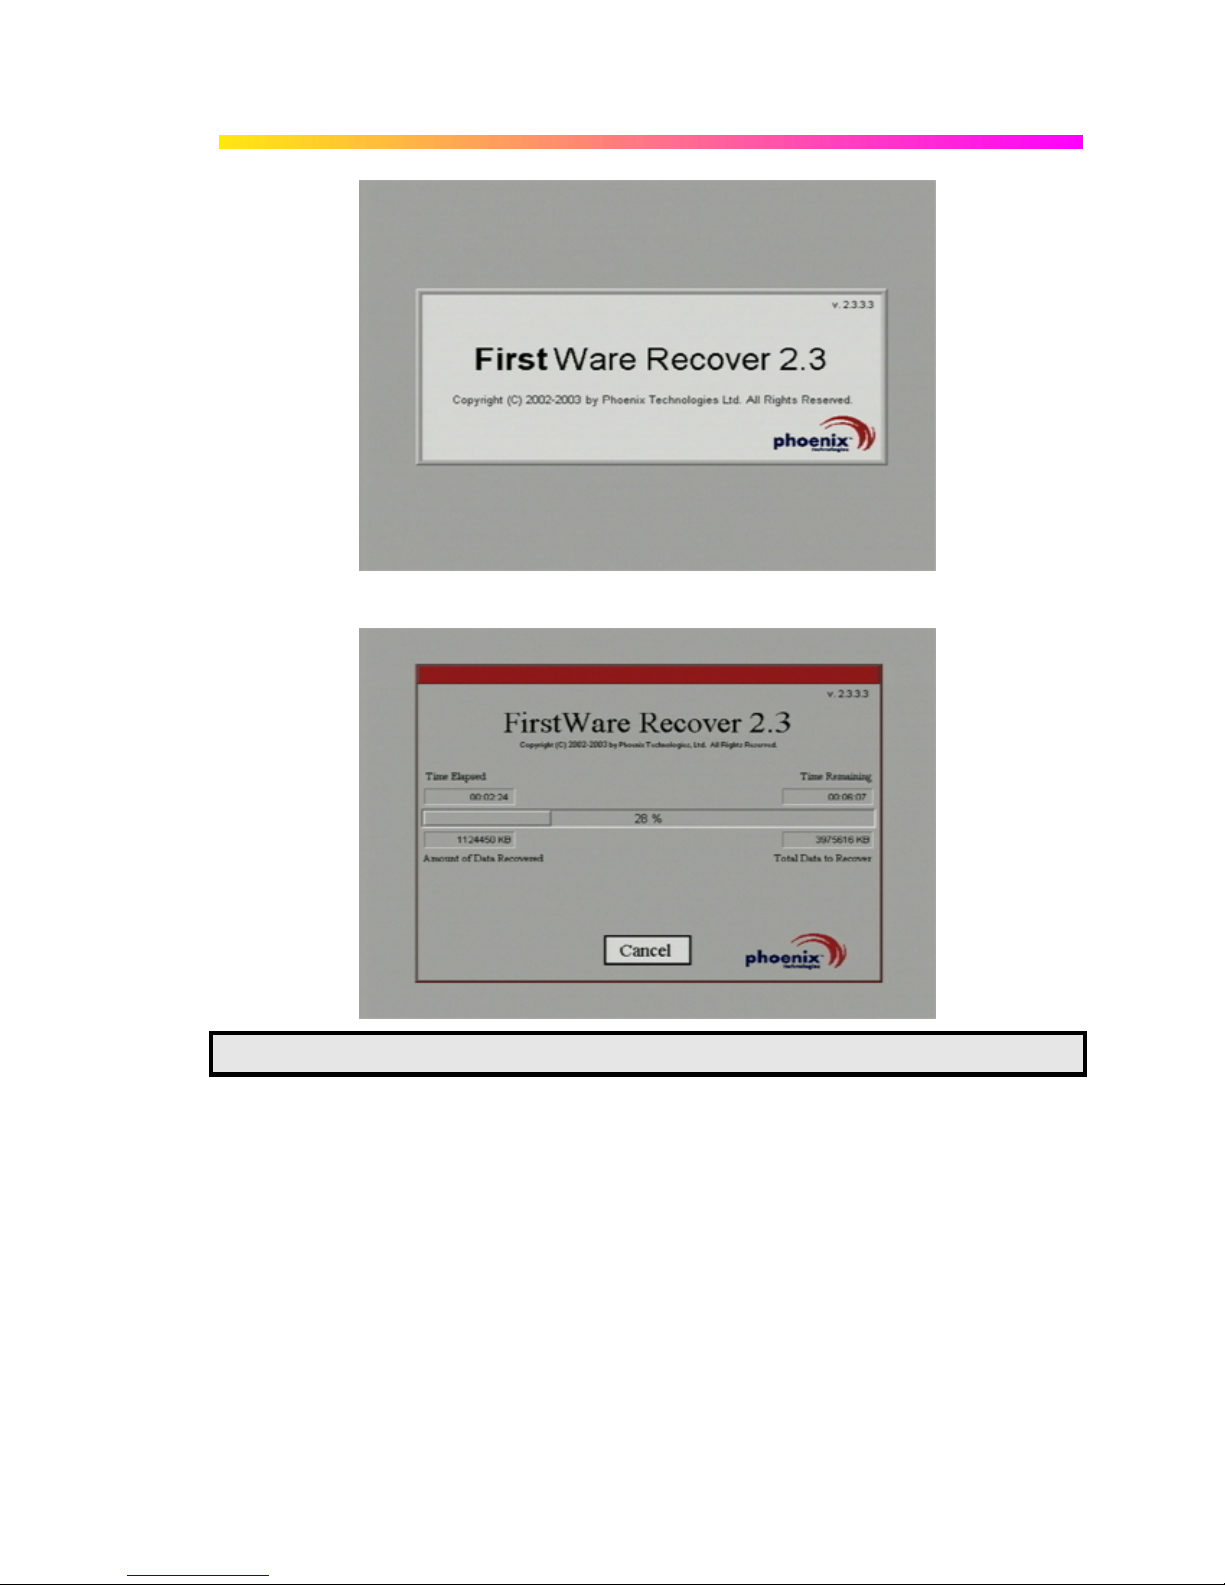
7. The FirstWare Recover splash screen is displayed momentarily:
8. The recovery starts, and the FirstWare Progress screen is displayed. No further
selections are required. The recovery takes about 10 minutes.
Note: The screen will blank on occasion for prolonged periods. This is normal and is not an indication of any
malfunctioning of the recovery process.
WR6A-GS-E Rev B ISSUED: July 2005 27
Page 30
WAVER UNNER 6000A S ERIES
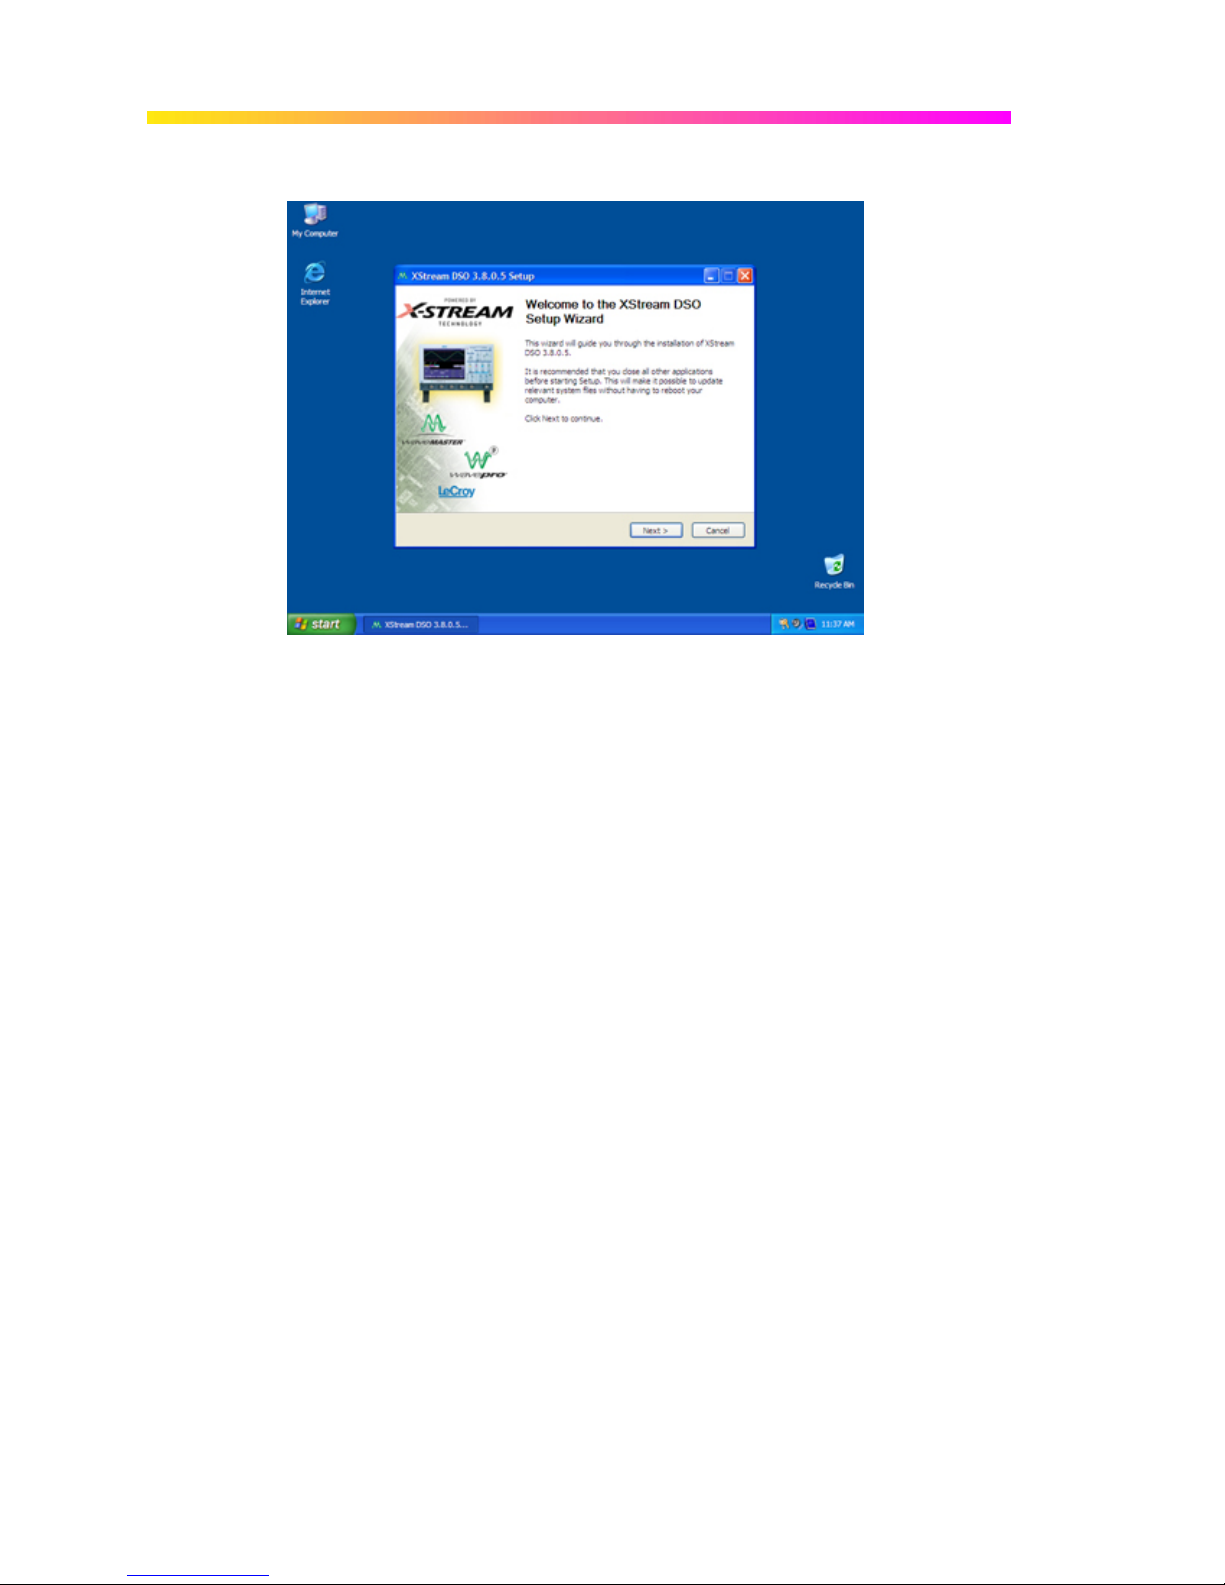
9. After the recovery is completed, the X-Stream software installer screen appears. Click
Next to continue:
10. When the X-Stream installation is completed, reboot the scope.
Now you must activate Windows by internet connection to Microsoft’s Web site or by telephone.
For this you will need to supply the Windows Product Key number, which is affixed to the rear of
the scope.
28 ISSUED: July 2005 WR6A-GS-E Rev B
Page 31

G ETTING S TARTED M ANUAL
Windows Activation
1. Click Start in the task bar, then select All Programs Æ Activate Windows.
Note: After Windows Activation is completed, this selection will no longer appear in the All Programs menu.
WR6A-GS-E Rev B ISSUED: July 2005 29
Page 32

WAVER UNNER 6000A S ERIES
2. Select an activation method: internet or phone. Then click Next.
3. If you elected to activate by internet, enter the Activation ID (Product Key) number when
prompted to do so, then click Next. Windows Activation will begin.
4. If you elected to activate by phone, select the country the scope is located in. Then dial
the number provided. You will be asked to repeat over the phone the installation ID listed
on the screen; then a 7-part number will be provided to you to enter in the empty boxes at
the bottom of the screen. Click Next when you are done.
30 ISSUED: July 2005 WR6A-GS-E Rev B
Page 33

G ETTING S TARTED M ANUAL
5. When activation is completed, an acknowledgement screen will appear. Click OK.
6. Check the revision levels of the X-Stream software, virus definitions, and Windows
updates. Visit the vendors’ Web sites and download all necessary updates.
WR6A-GS-E Rev B ISSUED: July 2005 31
Page 34

WAVER UNNER 6000A S ERIES
Probes
LeCroy offers a variety of passive and active probes for use with your WaveRunner 6000A Series
scope. Visit www.lecroy.com for specifications and ordering information.
Current Probes
Active Probes
Differential Probes
Passive Probes
High Voltage
Probes
Current Probes measure the current passing through a wire; current
probes do not use the "traditional" probing style of placing a tip onto a test
point. Rather, a wire is placed inside of the "jaw" of the probe, which then
allows the probe to measure the current (in Amps).
There are two different types of active probes: "single-ended" and
"differential."
Single-ended: A single-ended active probe is associated with measuring
voltages at high frequencies. Measurement with an active probe requires a
test point and a ground point. The ground (also called earth) acts as a zero
reference for the test point measurement.
Differential active probes are like two probes in one. Instead of measuring
a test point in relation to a ground point (like single-ended active probes),
differential probes measure the difference in voltage of a test point in
relation to another test point.
Passive probes measure voltages at lower frequencies (<400 MHz). They
have higher input capacitance (input C) and do not need power to operate
(unlike active probes). At higher frequencies, higher input capacitance
loads the test circuit, attenuating the signal. This is why active probes are
used in high frequency applications. Passive probes also measure voltage
in reference to ground.
These are active single ended probes that are designed to measure high
voltages (safely). They measure the voltage in reference to ground.
32 ISSUED: July 2005 WR6A-GS-E Rev B
Page 35

Front Panel Controls
FRONT PANEL BUTTONS AND KNOBS
G ETTING S TARTED M ANUAL
The control buttons of the WaveRunner 6000A Series DSO front panel are logically grouped into
analog and special functional areas. Analog functions are included in the Horizontal, Trigger,
and Vertical groups of control buttons and knobs.
Sometimes you may want to change a value without using the numeric keypad. In that case,
simply touch once inside the data entry field in the scope dialog area (the field will be highlighted
in yellow), then use the A
WR6A-GS-E Rev B ISSUED: July 2005 33
DJUST knob to dial in values into the selected field.
Page 36

WAVER UNNER 6000A S ERIES
By default, the ADJUST knob makes coarse adjustments (that is, digits to the left of the decimal
point). Push the button in to make fine adjusts (digits to the right of the decimal point). To enter
exact values, you can also display a keypad by touching twice inside the data entry field. Then
use the keypad to type in the value.
The following table provides an explanation of the front panel buttons and knobs:
Trigger
Knobs:
LEVEL
Trigger
Buttons:
STOP
AUTO
NORMAL
SINGLE
Horizontal
Knobs:
DELAY
TIME/DIVISION
Selects the trigger threshold level. The Level is indicated in the Trigger
descriptor label:
Prevents the scope from triggering on a signal.
Triggers the scope after a time-out, even if the trigger conditions are not met.
Triggers the scope each time a signal is present that meets the conditions set for
the type of trigger selected.
Arms the scope to trigger once (single-shot acquisition) when the input signal
meets the trigger conditions set for the type of trigger selected. If the scope is
already armed, it will force a trigger.
Horizontally positions the scope trace on the display so you can observe the
signal prior to the trigger time. Delay adjusts the pre- and post-trigger time.
Sets the time/division of the scope timebase (acquisition system). LeCroy's
SMART Memory automatically optimizes the memory and sample rate for
maximum resolution.
Vertical
Knobs:
OFFSET
VOLTS/DIV
Channel
Adjusts the vertical offset of a channel.
Adjusts the Volts/Division setting (vertical gain) of the channel selected.
Buttons:
1, 2, 3, 4
Turns a channel on or off. These buttons activate the dialog that lets you change
34 ISSUED: July 2005 WR6A-GS-E Rev B
Page 37

G ETTING S TARTED M ANUAL
the channel's setup conditions including coupling, gain, and offset. They are
used also to select multiple grids, to automatically set the gain (Find Scale), or to
automatically display a zoom of the signal. Press twice to toggle the trace on and
off.
Zoom Control
Knobs:
QUICKZOOM
(toggle switch)
POSITION
ZOOM
POSITION
ZOOM
Special
Features
Knobs &
Buttons:
Auto Setup
Automatically displays magnified views of up to four signal inputs on multiple
grids. With four input signals, the signals are displayed along with four zoom
traces, each on its own grid. This button turns off all other traces.
Adjusts the horizontal position of a zoom trace on the display. The zoom region
is highlighted in color on the source trace. Unlike Delay, the position is not
calibrated to the trigger position.
Adjusts the horizontal zoom (magnification factor) of the selected zoom trace.
Adjusts the vertical position of the selected zoom trace on the display. Unlike
Offset, the position is not calibrated to the 0 V reference.
Adjusts the vertical zoom (magnification factor) of the selected zoom trace on
the display.
Automatically sets the scope's horizontal timebase (acquisition system), vertical
gain and offset, as well as trigger conditions, to display a wide variety of signals.
CURSORS
WR6A-GS-E Rev B ISSUED: July 2005 35
These knobs control the placement of the cursors on your waveform. Cursors
are activated by selecting Cursors from the menu bar.
Page 38

WAVER UNNER 6000A S ERIES
ANALOG
PERSIST
General
Control
Buttons:
PRINT SCREEN
TOUCH SCREEN
(toggle switch)
CLEAR SWEEPS
Provides a three dimensional view of the signal: time, voltage, and a third
dimension related to the frequency of occurrence, as shown by a color-graded
(thermal) or intensity-graded display.
Prints the displayed screen to a file, a printer, the clipboard, or attaches it as an
e-mail. You can select the device and format it in the Utilities → Hardcopy dialog.
Activates or deactivates the touch screen.
Clears data from multiple sweeps (acquisitions) including: persistence trace
displays, averaged traces, parameter statistics, and Histicons. During waveform
readout, cancels readout.
36 ISSUED: July 2005 WR6A-GS-E Rev B
Page 39

G ETTING S TARTED M ANUAL
On-screen Toolbars, Icons, and Dialog Boxes
MENU BAR BUTTONS
The menu bar buttons at the top of the scope's display are designed for quick setup of common
functions. At the right end of the menu bar is a quick setup button that, when touched, opens the
setup dialog associated with the trace or parameter named beside it. The named trace or
parameter is the one whose setup dialog you last opened:
appears as an undo button
to perform an Undo operation, it must be the very next operation after you perform the Autosetup
operation.
Many of the menu bar buttons give you access to the same functions as do the front panel
buttons. Refer to this Table of Equivalent Functions.
Display Buttons Front Panel Push Buttons
after the Autosetup front panel button is pressed. If you want
. This button also
WR6A-GS-E Rev B ISSUED: July 2005 37
Page 40

WAVER UNNER 6000A S ERIES
Adjust Knob
The adjust knob can be used to dial in values into a selected control. The
selected control is signified by being highlighted in yellow.
Push this button in to toggle between coarse and fine adjustments, i.e., values
before and after the decimal point.
DIALOG BOXES
The dialog area occupies the bottom one-third of the screen. To expand the signal display area,
you can minimize each dialog box by touching the Close tab at the right of the dialog box.
AL TERNATE ACCESS METHODS
The instrument often gives you more than one way to access dialogs and menus.
Mouse and Keyboard Operation
In the procedures, we focus on touch-screen operation. But if you have a mouse connected to the
instrument, you can click on objects instead of touching them. Likewise, if you have a keyboard
38 ISSUED: July 2005 WR6A-GS-E Rev B
Page 41

G ETTING S TARTED M ANUAL
connected, you can use it to enter data instead of using the virtual keyboard provided by the
instrument.
Tool Bar Buttons
The procedures also focus on the use of the menu bar at the top of the screen to access dialogs
and menus. On several dialogs, however, common functions are accessible from a row of buttons
that save you a step or two in accessing their dialogs. For example, at the bottom of the Channel
Setup dialog, these buttons perform the following functions:
Calls up the Measure menu. You can then select a parameter from this menu
without leaving the Channel Setup dialog. The parameter automatically appears
below the grid.
Creates a zoom trace of the channel trace whose dialog is currently displayed.
Calls up the Math menu. You can then select a math function from this menu
without leaving the Channel Setup dialog. A math trace of the channel whose
dialog is currently open is automatically displayed.
Loads the channel trace into the next available memory location (M1 to M4).
Automatically performs a vertical scaling that fits the waveform into the grid.
Automatically moves the channel trace whose dialog is currently open onto the
next grid. If you have only one grid displayed, a new grid will be created
automatically, and the trace moved.
Another example is these buttons that appear at the bottom of the Measure Px
†
dialogs. Each
button opens a menu from which to choose a math trace (F1 to Fx) to display the functions
named in the buttons:
, , . By using these buttons you can
remain in the Measure dialog to set up other options.
†
The number of parameters and math traces available depends on the software options loaded on your scope.
WR6A-GS-E Rev B ISSUED: July 2005 39
Page 42

WAVER UNNER 6000A S ERIES
T race Descriptors
Vertical and horizontal trace descriptor labels are displayed below the grid. They provide a
summary of your channel, timebase, and trigger settings. To make adjustments to these settings,
touch the respective label to display the setup dialog for that function.
Channel trace labels show the vertical settings for the trace,
as well as cursor information if cursors are in use. In the title
bar of the label are also included indicators for (SinX)/X
interpolation, waveform inversion (INV), deskew (DSQ),
coupling (DC/GND), bandwidth limiting (BWL), and averaging
(AVG). These indicators have a long and short form:
Besides channel traces, math and parameter measurement
labels are also displayed. Labels are displayed only for
traces that are turned on.
The title bar of the TimeBase label shows the trigger delay
setting. Time per division and sampling information is given
below the title bar.
The title bar of the Trigger label shows the trigger mode:
Auto, Normal, or Stopped. Below the title bar is given the
coupling (DC), trigger type (Edge), source (C1), level (0 mV),
and slope (Positive).
Shown below the TimeBase and Trigger labels is setup
information for horizontal cursors, including the time between
cursors and the frequency.
40 ISSUED: July 2005 WR6A-GS-E Rev B
Page 43

G ETTING S TARTED M ANUAL
Turning On T races
1. To turn on a channel trace, on the front panel press a channel select button, such as
, to display the trace label for that input channel. While this turns on the trace, it
leaves the current dialog displayed.
If you want to also display the vertical setup dialog for the channel trace, touch the
Vertical menu bar button, then select the channel from the drop-down menu:
2. To turn on a math function trace, touch Math in the menu bar, then Math Setup... in the
drop-down menu. Touch the On checkbox for the trace you want to activate.
3. You can also turn on traces for math functions, parameters, and memory traces without
leaving the Vertical Adjust dialog by touching the icons at the bottom of the Vertical
Adjust dialog:
Whenever you turn on a channel or math trace via the menu bar at the top of the screen, the
dialog at the bottom of the screen automatically switches to the vertical setup or math setup
dialog for that selection. You can then configure your traces.
The channel or math trace number appears in the tab of the appropriate dialog, signifying that all
controls and data entry fields are dedicated to the selected trace:
WR6A-GS-E Rev B ISSUED: July 2005 41
, , , .
Page 44

WAVER UNNER 6000A S ERIES
42 ISSUED: July 2005 WR6A-GS-E Rev B
Page 45

G ETTING S TARTED M ANUAL
V ertical Settings and Channel Controls
ADJUSTING SENSITIVITY
1. Touch Vertical in the menu bar, then Channel 1 in the drop-down menu.
2. Touch inside the Trace On checkbox to display the trace.
3. Turn the volts per division knob for the selected channel. Or you can touch inside the
Volts/Div field and type in a value using the pop-up keypad. A third way is to use the
up/down arrows.
4. The voltage that you set is displayed in the Volts/Div field and in the trace descriptor
label:
ADJUSTING THE W AVEFORM'S POSITION
Turn the vertical offset adjust knob directly above the channel button whose waveform you want
to move vertically. Or you can touch inside the Offset field and type in a value on the pop-up
keypad. To set the vertical offset to zero, press the vertical offset adjust knob for the channel you
want to adjust:
COUPLING
Your choices of coupling are as follows:
• DC 50 ohm
• GROUND
• DC 1 Mohm
• AC 1 Mohm
To make a coupling selection, touch inside the Coupling field and choose a coupling mode from
the pop-up menu.
WR6A-GS-E Rev B ISSUED: July 2005 43
Page 46

WAVER UNNER 6000A S ERIES
Timebase Setup
Set up the timebase by using the front panel Horizontal controls, just as for analog scopes.
For additional timebase setups
1. Touch Timebase in the menu bar, then Horizontal Setup... in the drop-down menu. The
"Horizontal" dialog appears.
2. Touch inside the Time/Division data entry field and enter a value using the pop-up
numeric keypad, or use the up/down arrows to adjust the value.
3. Touch inside the Delay data entry field and type in a value, using the pop-up keypad.
Touch the Set To Zero button to set the delay to zero.
COMBINING OF CHANNELS
Channels can be combined to increase sample rate, memory, or both in order to capture and view
a signal in all its detail. When you combine channels, uncombined channels like EXT BNC remain
available for triggering, even though they are not displayed.
Note: While channels can be combined on any WaveRunner 6000A Series model to increase memory, sample rate can
only be increased on 1 GHz and 2 GHz bandwidth models.
In 2-channel operation, channels 2 and 3 are active. In Auto operation, you can use channel 1 or
2, and channel 3 or 4. On the paired channels the maximum sampling rate is doubled and the
record length is greatly increased:
Ch 1 & Ch 3 10 GS/s
Ch 1 & Ch 4 10 GS/s
Ch 2 & Ch 3 10 GS/s
Ch 2 & Ch 4 10 GS/s
As you can see, sampling can be maximized to 10 GS/s for any combination of two channels,
except a combination of channels 1 and 2, or channels 3 and 4, which yield 5 GS/s. The basic
rule is to choose either channel 1 or 2 for your first input, and either channel 3 or 4 for the second
input.
Refer to Acquisition Modes in the specifications for maximum sample rates.
To Combine Channels
1. In the menu bar, touch Timebase; the "Horizontal" setup dialog opens.
2. Under Active Channels, touch 4, 2 or Auto. The maximum sample rate is shown
alongside each button.
44 ISSUED: July 2005 WR6A-GS-E Rev B
Page 47

G ETTING S TARTED M ANUAL
T riggering
SIMPLE TRIGGERS
Edge Trigger on Simple Signals
The instrument uses many waveform capture techniques that trigger on features and conditions
that you define. These triggers fall into two major categories:
• Edge activated by basic waveform features or conditions such as a positive or negative
slope, and hold-off
• SMART Trigger® sophisticated triggers that enable you to use basic or complex conditions
for triggering.
Use Edge Triggers for simple signals, and the SMART Triggers for signals with rare features, like
glitches.
Controlling Edge Triggering
Horizontal: Turn the Delay knob in the HORIZONTAL control group to adjust the trigger's
horizontal position. Or, touch inside the Delay field in the timebase setup dialog and enter a
value, using the pop-up keypad.
The trigger location is shown by a marker below the grid
Post-trigger delay is indicated by a left-pointing arrow below-left of the grid
value is given in the title line of the TimeBase label
Vertical: Turn the L
vertical threshold.
Turn this knob to adjust the level of the trigger source or the highlighted trace. Level defines the
source voltage at which the trigger will generate an event: a change in the input signal that
satisfies the trigger conditions.
Alternatively, in the "Trigger" dialog, you can touch inside the Level field and type in a value,
using the pop-up numeric keypad. To quickly set a level of zero volts, touch the Zero Level button
directly below the Coupling field.
WR6A-GS-E Rev B ISSUED: July 2005 45
EVEL knob in the TRIGGER control group to adjust the trigger's
.
. The time
below-right of the grid.
Page 48

WAVER UNNER 6000A S ERIES
An arrow on the left side of the grid shows the threshold position. This arrow is only visible if the
trigger source is displayed.
To Set Up an Edge Trigger
1. In the menu bar, touch Trigger, then select Trigger Setup... from the drop-down menu.
2. Touch the Edge trigger button
3. Touch inside the Trigger On field and select an input from the pop-up menu:
.
4. Touch inside the Level data entry field
keypad, enter a value in millivolts or use the up/down buttons
increase or decrease the value in increments of 1 mV. Or, touch one of the preset value
buttons:
under the Trigger tab.
. In the pop-up numeric
to
46 ISSUED: July 2005 WR6A-GS-E Rev B
Page 49

.
G ETTING S TARTED M ANUAL
5. Select the holdoff by touching the Time or Events buttons
pop-up numeric keypad, enter a value and specify the unit of time
up/down buttons
of 200 ps. Or, touch one of the preset value buttons.
6. Choose Positive or Negative slope
.
to increase or decrease the time value in increments
, . Using the
, or use the
WR6A-GS-E Rev B ISSUED: July 2005 47
Page 50

WAVER UNNER 6000A S ERIES
SMART TRIGGERS
SMART Triggers are defined as follows:
One of LeCroy's SMART Triggers®, Width trigger allows you to define a positive- or
negative-going pulse width bounded by a voltage level, above or below which a trigger
will occur. Or you can specify a pulse width and voltage range, within or outside of
which a trigger will occur.
Another of the SMART Triggers, Glitch trigger is a simpler form of Width trigger. Use
Glitch trigger when you want to define a fixed pulse-width time or time range only. Glitch
trigger makes no provision for voltage levels or ranges.
While Glitch trigger performs over the width of a pulse, Interval trigger performs over the
width of an interval the signal duration (the period) separating two consecutive edges of
the same polarity: positive to positive or negative to negative. Use interval trigger to
capture intervals that fall short of, or exceed, a given time limit. In addition, you can
define a width range to capture any interval that is itself inside or outside the specified
range an Exclusion trigger by interval.
The Qualify trigger is an edge-qualified SMART Trigger that allows you to use one
signal's positive or negative transition to qualify a second signal, which is the trigger
source. For Qualify trigger, you specify the time or number of events after the transition
when you want the trigger to occur.
The State trigger is a level-qualified SMART Trigger which requires that the qualifying
signal remain above or below a specified voltage level for a trigger to occur. For Sate
trigger, you specify the time or number of events after the signal has gone above or
below the voltage level when you want the trigger to occur.
Used primarily in single-shot applications, and usually with a pre-trigger delay, Dropout
trigger can detect lost signals. The trigger is generated at the end of the timeout period
following the last trigger source transition. You can select a timeout period from 2 ns to
20 s.
Logic trigger enables triggering on a logical combination (pattern) of five inputs: CH1,
CH2, CH3, CH4, EXT. You have a choice of four Boolean operators (AND, NAND, OR,
NOR), and you can stipulate the high or low voltage logic level for each input
independently.
48 ISSUED: July 2005 WR6A-GS-E Rev B
Page 51

G ETTING S TARTED M ANUAL
Display Formats
DISPLAY SETUP
1. In the menu bar, touch Display; then touch Display Setup in the drop-down menu.
2. Touch one of the Grid combination buttons. Autogrid automatically adds or deletes grids
as you select more or fewer waveforms to display.
3. Touch inside the grid Intensity data entry field
0 to 100 using the pop-up keypad.
4. Touch the Grid on top checkbox if you want to superimpose the grid over the waveform.
Depending on the grid intensity, some of your waveform may be hidden from view when
the grid is placed on top. To undo, simply uncheck Grid on top.
5. Touch the Axis labels checkbox to permanently display the values of the top and bottom
grid lines (calculated from volts/div) and the extreme left and right grid lines (calculated
from the timebase).
6. Choose a line style for your trace: solid Line
Sequence Mode Display
To a set up Sequence Mode display, you must first have selected Sequence trigger mode in the
Timebase "Horizontal" dialog. You must also have entered a Num Segments value.
1. In the menu bar, touch Display; then touch Display Setup in the drop-down menu.
2. Touch inside the Display Mode field and select a display mode from the pop-up menu.
3. Touch inside the Num seg displayed field and enter a value, using the pop-up keypad.
The maximum number of segments that can be displayed is 80.
WR6A-GS-E Rev B ISSUED: July 2005 49
or Points .
and enter a value from
Page 52

WAVER UNNER 6000A S ERIES
4. Touch inside the Starting at field and enter a value.
Note: The maximum value that you can enter for Starting at depends on the Num Segme nts value you entered in the
"Timebase" dialog. It also depends on the Num seg displayed value you entered here in the "Display" dialog. For
example, if you had entered a value of 500 in Num Segments, and a value of 10 in Num seg displayed, the maximum
value you can enter as a starting segment is 491so that 10 segments can be seen.
PERSISTENCE SETUP
The analog Persistence feature displays your waveform and reveals its anomalies for a repetitive
signal. Use Persistence to accumulate on-screen points from many acquisitions to see your
signal change over time. The instrument persistence modes show the most frequent signal path
"three-dimensionally" in intensities of the same color, or graded in a spectrum of colors.
Saturation Level
The Persistence display is generated by repeated sampling of the amplitudes of events over time,
and the accumulation of the sampled data into "3-dimensional" display maps. These maps create
an analog-style display. User-definable persistence duration can be used to view how the maps
evolve proportionally over time. Statistical integrity is preserved because the duration (decay) is
proportional to the persistence population for each amplitude or time combination in the data. In
addition, the instrument gives you post-acquisition saturation control for a more detailed display.
When you select Analog mode
from the Persistence dialog, each channel is assigned a
single color. As a persistence data map develops, different intensities of that color are assigned to
the range between a minimum and a maximum population. The maximum population
automatically gets the highest intensity, the minimum population gets the lowest intensity, and
intermediate populations get intensities in between these extremes.
The information in the lower populations (for example, down at the noise level) could be of
greater interest to you than the rest. The Analog persistence view highlights the distribution of
data so that you can examine it in detail.
You can select a saturation level as a percentage of the maximum population. All populations
above the saturation population are then assigned the highest color intensity: that is, they are
saturated. At the same time, all populations below the saturation level are assigned the remaining
intensities. Data populations are dynamically updated as data from new acquisitions is
accumulated.
Color mode persistence, selected by touching Color
, works on the same principle as the
Analog persistence feature, but instead uses the entire color spectrum to map signal intensity:
violet for minimum population, red for maximum population. A saturation level of 100% spreads
the intensity variation across the entire distribution; at lower saturation levels the intensity will
50 ISSUED: July 2005 WR6A-GS-E Rev B
Page 53

G ETTING S TARTED M ANUAL
saturate (become the brightest color) at the percentage value specified. Lowering this percentage
causes the pixels to be saturated at a lower population, and makes visible those rarely hit pixels
not seen at higher percentages.
3-Dimensional Persistence
By selecting 3d
of shadings, textures, and hues. The advantage of the topographical view is that areas of highest
and lowest intensity are shown as peaks and valleys, in addition to color or brightness. The shape
of the peaks (pointed or flat) can reveal further information about the frequency of occurrences in
your waveform.
The instrument also gives you the ability to turn the X and Y axes of the waveform through 180°
of rotation from -90° to +90°.
Show Last Trace
For most applications, you may not want to show the last trace because it will be superimposed
on top of your persistence display. In those cases turn off Show Last Trace by touching the
checkbox. However, if you are doing mask testing and want to see where the last trace is falling,
turn Show Last Trace on.
ZOOMING WAVEFORMS
The Zoom button
Vertical Adjust" setup dialog if you want to create a math function zoom trace of your input
waveform. On the other hand, you can zoom a memory or math function non-zoom trace directly
without having to create a separate zoom trace. For such traces, a zoom control mini-dialog is
, you can create a topographical view of your waveform from a selection
appears as a standard button at the bottom of the channel "Cx
WR6A-GS-E Rev B ISSUED: July 2005 51
Page 54

WAVER UNNER 6000A S ERIES
provided at the right of each math trace "Fx" setup dialog:
The front panel "QuickZoom" button creates multiple zooms, one for each displayed input
channel.
At any time, you can also zoom a portion of a waveform by touching and dragging a rectangle
around any part of the input waveform. The zoom trace will size itself to fit the full width of the
grid. The degree of magnification, therefore, will depend on the size of the rectangle that you
create.
When you zoom a waveform, an approximation of the zoomed area will appear in a thumbnail
icon in the "Zoom" dialog:
dialog when Zoom is the math or memory function selected.
To Zoom a Single Channel
1. In the menu bar, touch Vertical; then touch a channel number in the drop-down menu.
Alternatively, you can just touch the channel trace label
displayed channel.
2. Touch
52 ISSUED: July 2005 WR6A-GS-E Rev B
at the bottom of the "Cx Vertical Adjust dialog." A zoom math trace
. The "Zoom" dialog appears alongside the math setup
for a
Page 55

G ETTING S TARTED M ANUAL
(one of F5 to Fx The number of math traces available depends on the software options
loaded on your scope.) will be created of the selected channel.
3. To vary the degree of zoom, touch the newly created Fx trace label. The setup dialog for
the math function opens, and the zoom control dialog appears at lower-right. It shows the
current horizontal and vertical zoom factors.
4. If you want to increase or decrease your horizontal or vertical zoom in small increments,
touch the Var. checkbox to enable variable zooming. Now with each touch of the zoom
control buttons
increment. To zoom in or out in large standard increments with each touch of the zoom
control buttons, leave the Var. checkbox unchecked. To set exact horizontal or vertical
zoom factors, touch inside the Horizontal Scale/div data entry field and enter a time-per-
div value, using the pop-up numeric keypad. Then touch inside the Vertical Scale/div
field and enter a voltage value.
5. To reset the zoom to x1 magnification, touch Reset Zoom in the dialog or press the front
panel zoom button
To Zoom by Touch-and-Drag
1. Touch and drag a rectangle around any part of an input channel waveform, math trace, or
memory trace. If you have more than one trace displayed, a pop-up "Rectangle Zoom
Wizard" will appear.
2. If more than one trace is displayed, touch the "Source" tab and select a trace to act on.
3. Touch the "Action" tab and select Create a New Zoom Trace. For channel traces, select
Update Acquisition Settings if you do not want to create a new zoom, but just want to
update acquisition settings. For math function traces, you will be offered the choice of
creating a new zoom trace or modifying the current trace.
4. Touch the Zoom tab and select a math function trace to display the zoom.
5. Turn the front panel Zoom Control position knobs to adjust the vertical and horizontal
position of the zoom:
.
, the degree of magnification will change by a small
WR6A-GS-E Rev B ISSUED: July 2005 53
Page 56

WAVER UNNER 6000A S ERIES
6. Turn the front panel Zoom knobs to control the boundaries of the zoom.
To Zoom Multiple Waveforms Quickly
Press the QuickZoom button
to create a zoom of each displayed input channel waveform. Each zoom will be displayed in its
own grid.
To Turn Off Zoom
1. Touch the math function trace label for the zoom you want to turn off.
2. Touch the Trace On checkbox to delete the check mark and disable the zoom trace.
on the front panel. Math function traces F1 to F4 will be used
54 ISSUED: July 2005 WR6A-GS-E Rev B
Page 57

G ETTING S TARTED M ANUAL
Save and Recall
SA VING AND RECALLING SCOPE SETTINGS
You can save or recall scope settings to or from hard disk, floppy disk, or LAN location.
To Save Scope Settings
1. In the menu bar, touch File; then touch Save Setup... in the drop-down menu. Or, press
the Save/Recall front panel button, then touch the "Save Setup" tab.
2. To Save To File, touch inside the Save Instrument Settings data entry field and use the
pop-up keyboard to enter the path to the destination folder. Or touch Browse to navigate
to the destination folder. Then touch
folder Internal Setups on the scope's hard drive, touch inside a SetupX data entry field
and use the pop-up keyboard to enter a file name. Touch
entry field. The file is deposited in D:\Internal Setups, and the current date is displayed
above the field.
To Recall Scope Settings
1. In the menu bar, touch File; then touch Recall Setup... in the drop-down menu.
2. To Recall From File, touch inside the Recall panels from file data entry field and use
the pop-up keyboard to enter the path to the source folder. Or touch Browse to navigate
to the source folder. Then touch
Setups on the scope's hard drive, touch
To Recall Default Settings
1. In the menu bar, touch File; then touch Recall Setup... in the drop-down menu.
below the data entry field. To save to
alongside the data
. To recall settings from folder D:\ Internal
alongside the file you want to recall.
2. Touch the button under Recall Default Setup
WR6A-GS-E Rev B ISSUED: July 2005 55
.
Page 58

WAVER UNNER 6000A S ERIES
SA VING SCREEN IMAGES
You can send images to a hard copy printer or to storage media. Both types of output are done
from the same dialog.
1. In the menu bar, touch Utilities, then Utilities Setup... in the drop-down menu.
2. Touch the Hardcopy tab.
3. Touch the File button.
4. Touch inside the File Format field and select a file type.
5. Under Colors, touch the Use Print Colors checkbox if you want your waveforms to print
in color with a white background. A white background saves printer toner.
6. Touch inside the Directory field and type in the path to the directory where you want the
image stored, using the pop-up keyboard. Or you can touch the browse button and
navigate there.
7. Touch inside the File Name field and type in a name for your image, using the pop-up
keyboard.
8. Under Include On Print, touch the Grid Area Only checkbox if you do not want to
include the dialog area in the image.
9. Touch the Print Now button.
SA VING AND RECALLING WAVEFORMS
To Save Waveforms
1. In the menu bar, touch File; then touch Save Waveform... in the drop-down menu.
2. In the "Save Waveform" dialog, touch the Save To
3. Touch inside the Source field and select a source from the pop-up menu. The source can
be any trace; for example, a channel (C1C4), math function (F1F4), or a waveform stored
in non-volatile RAM (M1M4).
4. Touch inside the Trace Title data entry field if you want to change the default name of
your waveforms. Use the pop-up keyboard to type in the new name.
Note: You can change the name but not the sequence number.
CAUTION
If you use a name that ends in a number instead of a letter, the instrument may truncate
the number. This is because, by design, the first waveform is automatically numbered 0,
the second 1, etc. For example, if you want to use waveform name "XYZ32" but it is not
preceded by waveforms XYZ0 through XYZ31, the waveform will be renumbered with the
next available number in the sequence. If you need to use a number in your waveform's
56 ISSUED: July 2005 WR6A-GS-E Rev B
or button.
Page 59

G ETTING S TARTED M ANUAL
name, it is recommended that you append an alpha character at the end of the number :
"XYZ32a" for example.
1. If you are saving to file, touch the Data Format field and select a format type from the
pop-up menu:
.
If you select ASCII or Excel, also touch the SubFormat field and select either Time Data
or Time & Ampl. Then touch the Delimiter field and select a delimiter character from the
pop-up menu: comma, space, semicolon, or tab.
2. Touch the Browse button for the Save file in directory field and browse to the location
where you want the file saved. The file name is assigned automatically and is shown
below the field.
3. Touch
Auto Save
You can also enable Auto Save from this dialog by touching one of the Auto Save buttons
overwritten).
If you select Fill, you can quickly use up all disk space on your hard disk.
WR6A-GS-E Rev B ISSUED: July 2005 57
CAUTION
.
: Wrap (old files overwritten) or Fill (no files
Page 60

WAVER UNNER 6000A S ERIES
To Recall Waveforms
1. In the menu bar, touch File; then touch Recall Waveform... in the drop-down menu.
2. In the "Recall Waveform" dialog, touch the Recall From
3. If you selected Memory, touch inside the Source field and select a memory location: M1
to M4.
4. If you selected File, touch inside the Destination field and select a memory location in
which to store the file.
a. Touch inside the Show only files field and select an area to limit the search to:
channels, math functions, or memory.
b. Touch inside the Recall files from directory data entry field and enter the path,
using the pop-up keyboard. Or touch the Browse button to navigate to the file.
c. Touch inside the Next file will be recalled from data entry field and enter the
path, using the pop-up keyboard. Or touch the Browse button to navigate to the
file.
5. Touch
.
or button.
58 ISSUED: July 2005 WR6A-GS-E Rev B
Page 61

G ETTING S TARTED M ANUAL
Writing Files to CD
A CD ROM recorder is available as an optional accessory that replaces the CD ROM reader in
the WaveRunner 6000 series oscilloscope. When installed, the CD ROM recorder provides a
convenient means of transferring large amounts of data from the oscilloscope, such as recorded
waveform files, measurement results from analysis applications running under Windows, etc.
To use the CD ROM recorder, a supply of blank CD-R media will be required. The CD ROM
recorder is a “write once” type, and cannot rewrite previously recorded erasable media (CD-RW).
To record data to a CD, minimize the X-Stream application by selecting File Æ Minimize. Follow
the instructions below to complete the recording.
1. Open My Computer:
WR6A-GS-E Rev B ISSUED: July 2005 59
Page 62

WAVER UNNER 6000A S ERIES
2. Click the CD RW Drive icon. The CD RW Drive window opens:
3. Drag and drop the files to be copied to CD onto the CD RW Drive window:
60 ISSUED: July 2005 WR6A-GS-E Rev B
Page 63

G ETTING S TARTED M ANUAL
4. Click Cancel in the pop-up window. You have already performed this step:
5. In the CD RW Drive window, click Write these files to CD. The CD Writing Wizard
opens:
WR6A-GS-E Rev B ISSUED: July 2005 61
Page 64

WAVER UNNER 6000A S ERIES
6. Enter a CD name, then click Next. Copying begins:
7. Click Finish when the Write completed window appears:
62 ISSUED: July 2005 WR6A-GS-E Rev B
Page 65

G ETTING S TARTED M ANUAL
Printing and File Management
The instrument gives you the ability to output files to a printer or plotter, to print to file, or to e-mail
your files. Any Windows 2000 supported printer is supported by your instrument.
PRINTING
To Set Up the Printer
1. In the menu bar, touch File, then Print Setup... in the drop-down menu. The Utilities
Hardcopy dialog opens.
2. In the dialog area, touch the Printer icon
3. Under Colors, touch the Use Print Colors checkbox if you want the traces printed on a
white background. A white background saves printer toner. (You can change the printer
colors in the Preference dialog;)
4. Touch inside the Select Printer field. From the touch pad pop-up choose the printer you
want to print to. Touch the Properties button to see your printer setup.
5. Touch the icon for the layout Orientation you want: portrait or landscape.
6. Touch the Grid Area Only checkbox if you do not need to print the dialog area and you
only want to show the waveforms and grids.
To Print
You can print in one of three ways:
• Press the printer button on the front panel:
• In the menu bar, touch File, then Print in the drop-down menu.
• Touch the Print Now button in the "Hardcopy" dialog
Adding Printers and Drivers
Note: If you want to add a printer driver, the driver must first be loaded on the scope.
1. In the menu bar, touch File, then Print Setup... in the drop-down menu. The Utilities
Hardcopy dialog opens.
2. In the dialog area, touch the Printer icon
3. Touch the Add Printer button. An MS Windows® window with which to add a printer will
open.
4. Touch the Properties button to change printer properties such as number of copies.
.
.
WR6A-GS-E Rev B ISSUED: July 2005 63
Page 66

WAVER UNNER 6000A S ERIES
Changing the Default Printer
1. If you want to change the default printer, minimize the instrument application by touching
File in the menu bar, then Minimize in the drop-down menu.
2. Touch the Start button in the task bar at the bottom of the screen.
3. Select Settings, then Printers.
4. Touch the printer you want to set as the default printer, then touch File, Set as Default
Printer.
MANAGING FILES
Use the instrument's utilities to create waveform files on optional floppy disk, internal hard drive,
or network drives.
Hard Disk Partitions
The instrument's hard disk is partitioned into drive C: and drive D:. Drive C: contains the Windows
operating system and the instrument application software. Drive D: is intended for data files.
64 ISSUED: July 2005 WR6A-GS-E Rev B
Page 67

G ETTING S TARTED M ANUAL
Utilities
STATUS
The status read-only dialog displays system information including serial number, firmware
version, and installed software and hardware options.
To Access Status Dialog
1. In the menu bar, touch Utilities.
2. Touch the Status tab.
REMOTE COMMUNICA TION
The Remote dialog is where you can select a network communication protocol, establish network
connections, and configure the Remote Control Assistant log. The choice of communication
protocols is limited to TCPIP and GPIB.
Note: GPIB is an option and requires a GPIB card to be installed in a card slot at the rear of the scope.
Note: The instrument uses Dynamic Host Configuration Protocol (DHCP) as its addressing protocol. Therefore, it is not
necessary to set up an IP address if your network supports DHCP. If it does not, you can assign a static address in the
standard Windows 2000 network setup menu.
The Remote Control Assistant monitors communication between your PC and scope when you
are operating the instrument remotely. You can log all events, or errors only. This log can be
invaluable when you are creating and debugging remote control applications.
To Set Up Remote Communication.
If you are connecting the scope to a network, first contact your Information Systems administrator.
If you are connecting the scope directly to your PC, connect a GPIB or Ethernet cable between
them.
1. In the menu bar touch Utilities, then Utilities Setup... in the drop-down menu.
2. Touch the Remote tab.
3. Make a Port selection:TCPIP (transmission control protocol/Internet protocol) or GPIB
(general purpose interface bus). If you do not have a GPIB card installed, the GPIB
selection will not be accessible.
4. If you are using GPIB, set a GPIB address by touching inside the GPIB Address data
entry field and enter an address.
5. Press the Net Connections button; the Windows Network and Dial-up Connections
window appears.
6. Touch Make New Connection and use the Windows Network Connection Wizard to
make a new connection; or, touch Local Area Connection to reconfigure the scope's
connection if it is already connected to the network.
WR6A-GS-E Rev B ISSUED: July 2005 65
Page 68

WAVER UNNER 6000A S ERIES
To Configure the Remote Control Assistant Event Log
1. In the menu bar touch Utilities, then Utilities Setup... in the drop-down menu.
2. Touch the Remote tab.
3. Touch inside the Log Mode data entry field.
4. Select Off, Errors Only, or Full Dialog from the pop-up menu.
5. To export the contents of the event log to an ASCII text file, touch the Show Remote
Control Log button: the "Event Logs" popup window appears. Touch inside the
DestFilename data entry field and enter a file name, using the pop-up keyboard. Then
touch the Export to T ext File button.
HARDCOPY
Printing
Refer to Printing under “File Management” (page 63).
Clipboard
This selection prints to the clipboard so you can paste a file into another application (like MS
Word, for example).
To Print from the Clipboard
1. In the menu bar touch Utilities, then Utilities Setup... in the drop-down menu.
2. Touch the Hardcopy tab.
3. Under Colors, touch the Use Print Colors checkbox if you want the traces printed on a
white background. A white background saves printer toner.
4. Touch the Grid Area Only checkbox if you do not need to print the dialog area and you
only want to show the waveforms and grids.
5. Touch the Print Now button.
File
Choose File if you want to output the screen image to storage media such as floppy drive or hard
drive. When outputting to floppy disk, be sure to use a preformatted disk.
66 ISSUED: July 2005 WR6A-GS-E Rev B
Page 69

G ETTING S TARTED M ANUAL
To Print to File
1. In the menu bar touch Utilities, then Utilities Setup... in the drop-down menu.
2. Touch the Hardcopy tab, then the File icon.
3. Touch inside the File Format data entry field and select a graphic file format from the
pop-up menu.
4. Under Colors, touch the Use Print Colors checkbox if you want the traces printed on a
white background. A white background saves printer toner.
5. Touch inside the Directory data entry field and type the path to the folder you want to
print to, using the pop-up keyboard. Or touch the Browse button and navigate to the
folder.
6. Touch inside the File Name data entry field and enter a name for the display image,
using the pop-up keyboard.
7. Touch the Grid Area Only checkbox if you do not need to print the dialog area and you
only want to show the waveforms and grids.
8. Touch the Print Now button.
E-Mail
The instrument also gives you the option to e-mail your screen images, using either the MAPI or
SMTP protocols. Before you output to e-mail from the Utilities dialog, you first have to set up the
e-mail server and recipient address in Preference Setup.
To Send E-mail
1. In the menu bar touch Utilities, then Utilities Setup... in the drop-down menu.
2. Touch the Hardcopy tab, then the E-mail button.
3. Touch inside the File Format data entry field and select a graphic file format from the
pop-up menu.
4. Under Colors, touch the Use Print Colors checkbox if you want the traces printed on a
white background. A white background saves printer toner.
5. Touch the Prompt for message to send with mail checkbox if you want to include
remarks with the image.
6. Touch the Grid Area Only checkbox if you do not need to print the dialog area and you
only want to show the waveforms and grids.
7. Touch the Print Now button.
AUX OUTPUT
In addition to a calibration signal, the following signals can be output through the AUX OUTPUT
connector:
WR6A-GS-E Rev B ISSUED: July 2005 67
Page 70

WAVER UNNER 6000A S ERIES
Square Wave
Trigger Out -- can be used to trigger another
scope
DC level -- a reference level
Trigger Enabled -- can be used as a gating
function to trigger another instrument when the
scope is ready
Pass/Fail -- allows you to set a pulse duration
from 1 ms to 500 ms; generates a pulse when
pass/fail testing is active and conditions are met.
Aux Output Off -- turns off the auxiliary output
signal
To Set Up Auxiliary Output
1. In the menu bar, touch Utilities, then Utilities Setup... in the drop-down menu.
2. Touch the Aux Output tab.
3. If you simply want a 1 kHz, 1 V square wave, touch the button so labeled.
4. If you want a specialized output, touch one of the buttons under Use Auxiliary Output
For.
5. Touch inside the Amplitude data entry field and enter a value, using the pop-up numeric
keypad. If you want a TTL level signal, touch the TTL Level checkbox. The Amplitude
field will accordingly become unavailable.
6. If you selected Square Wave, touch inside the Frequency data entry field and enter a
value, using the pop-up keypad. You can set a value from 5.0 Hz to 5 MHz.
7. If you selected Pass/Fail, touch inside the Pulse Duration field and enter a value from 1
ms to 500 ms, using the pop-up numeric keypad.
DA TE & TIME
The instrument gives you the choice of manually setting the time and date or getting it from the
Internet. If you elect to get the time and date from the Internet, you need to have the scope
connected to the Internet through the LAN connector on the rear panel. You can also set time
zones and daylight savings time.
To Set Time and Date Manually
1. In the menu bar touch Utilities, then Utilities Setup... in the drop-down menu.
68 ISSUED: July 2005 WR6A-GS-E Rev B
Page 71

G ETTING S TARTED M ANUAL
2. Touch the Date/Time tab.
3. Touch inside each of the Hour, Minute, Second, Day, Month, and Year data entry fields
and enter a value, using the pop-up numeric keypad.
4. Touch the Validate Changes button.
To Set Time and Date fr om the I ntern et
The Simple Network Time Protocol (SNTP) is used.
1. Ensure that the scope is connected to the Internet through the LAN connector at the rear
of the scope.
2. In the menu bar touch Utilities, then Utilities Setup... in the drop-down menu.
3. Touch the Date/Time tab.
4. Touch the Set from Internet button.
To Set Time and Date from Windows
1. In the menu bar touch Utilities, then Utilities Setup... in the drop-down menu.
2. Touch the Date/Time tab.
3. Touch the Windows Date/Time button
4. Use the Time & Date Properties window to configure the time, including time zone.
.
WR6A-GS-E Rev B ISSUED: July 2005 69
Page 72

WAVER UNNER 6000A S ERIES
OPTIONS
Use this dialog to add or remove software options. For information about software options,
contact your local LeCroy Sales and Service office, or visit our Web site at
http://www.lecroy.com/options.
Options that you purchase, such as JTA2, add performance to you instrument. This added
performance is seen in the new math functions or parameters that you can choose from when
doing Measure or Math setups.
SERVICE
This button provides access to service dialogs, which are for the sole use of LeCroy
service personnel. A security code is required to gain access.
70 ISSUED: July 2005 WR6A-GS-E Rev B
Page 73

SHOW WINDOWS DESKTOP
G ETTING S TARTED M ANUAL
Touching the Show Windows Desktop button
the instrument application to reveal the underlying desktop. To maximize the application, touch
the appropriate shortcut icon:
.
TOUCH SCREEN CALIBRATION
Touching the Touch-Screen Calibration button
the procedure, you will be prompted to touch the center of a small cross in 5 key locations on the
touch screen. Because sufficient accuracy cannot be achieved using your finger, use a stylus
instead for this procedure. The calibration has a ten-second timeout in case no cross is touched.
To avoid parallax errors, be sure to place your line of sight directly in front of each cross before
touching it.
PREFERENCES
Audible Feedback
You can elect to have audible confirmation each time you touch a screen or front panel control.
1. In the menu bar touch Utilities; then touch Preferences in the drop-down menu.
2. Touch the "Audible Feedback" Enable checkbox so that the scope emits a beep with
each touch of the screen or front panel control.
Auto-calibration
in the main "Utilities" dialog minimizes
starts the calibration procedure. During
You can choose to have your instrument automatically recalibrate itself whenever there is a
significant change in ambient temperature. If you do not enable this option, the scope will only
recalibrate at startup and whenever you make a change to certain operating conditions.
1. In the menu bar touch Utilities; then touch Preferences in the drop-down menu.
2. Touch the "Automatic Calibration" Enable checkbox.
Offset Control
As you change the gain, this control allows you to either keep the vertical offset level indicator
stationary (when Div is selected) or to have it move with the actual voltage level (when Volts is
WR6A-GS-E Rev B ISSUED: July 2005 71
Page 74

WAVER UNNER 6000A S ERIES
selected). The advantage of selecting Div is that the waveform will remain on the grid as you
increase the gain; whereas, if Volts is selected, the waveform could move off the grid.
Note: Regardless of whether you select Volts or Div, the "Offset" shown in the channel setup dialog always indicates
volts. However, when Div is selected for the Offset Control, the offset in volts is scaled proportional to the change in gain,
thereby keeping the division on the grid constant.
1. In the menu bar touch Utilities; then touch Preferences in the drop-down menu.
2. Touch the Offset/Delay tab.
3. Under Offset Setting constant in:, touch either the Div or Volts button.
Performance Optimization
You can set up the scope to optimize either calculating speed or display speed. If the display
update rate is of primary concern to you, optimize for Display. If acquisition and analysis are more
important, optimize for analysis. Optimizing for analysis can be useful when persistence or
averaging is used, giving higher priority to waveform acquisition at the expense of display update
rate.
The choices are presented as a spectrum with highest values at the extremes:
1. In the menu bar touch Utilities; then touch Preferences in the drop-down menu.
2. Touch one of the optimization icons.
Offset/Delay Control
As you change the timebase, this control allows you to either keep the horizontal offset indicator
stationary (when Div is selected) or to have it move with the trigger point (when Time is
selected). The advantage of selecting Div is that the trigger point will remain on the grid as you
increase the timebase; whereas, if Time is selected, the trigger point could move off the grid.
Note: Regardless of whether you select Time or Div, the "Delay" shown in the timebase setup dialog always indicates
time. However, when Div is selected for Delay In, the delay in time is scaled proportional to the change in timebase,
thereby keeping the division on the grid constant.
1. In the menu bar touch Utilities; then touch Preferences in the drop-down menu.
2. Touch the Offset/Delay tab.
3. Under Offset Setting constant in:, touch either the Volts or Div button.
4. Under Delay Setting constant in:, touch either the Time or Div button.
E-mail
Before you can send e-mail from the scope, it must first be configured.
y In the menu bar touch Utilities, then Preference Setup... in the drop-down menu.
y Touch the E-mail tab.
y Choose an e-mail server protocol: MAPI (Messaging Application Programming Interface)
is the Microsoft interface specification that allows different messaging and workgroup
72 ISSUED: July 2005 WR6A-GS-E Rev B
Page 75

G ETTING S TARTED M ANUAL
applications (including e-mail, voice mail, and fax) to work through a single client, such as
the Exchange client included with Windows 95 and Windows NT. MAPI uses the default
Windows e-mail application (usually Outlook Express). SMTP (Simple Mail Transfer
Protocol) is a TCP/IP protocol for sending messages from one computer to another
through a network. This protocol is used on the Internet to route e-mail. In many cases no
account is needed.
y If you chose MAPI, touch inside the Originator Address (From:) data entry field and use
the pop-up keyboard to type in the instrument's e-mail address. Then touch inside the
Default Recipient Address (To:) data entry field and use the pop-up keyboard to enter
the recipient's e-mail address.
y If you chose SMTP, touch inside the SMTP Server data entry field and use the pop-up
keyboard to enter the name of your server. Touch inside the Originator Address (From:)
data entry field and use the pop-up keyboard to type in the instrument's e-mail address.
Then touch inside the Default Recipient Address (To:) data entry field and use the pop-
up keyboard to enter the recipient's e-mail address.
y You can send a test e-mail text message by touching the Send Test Mail button. The test
message reads "Test mail from [name of scope's email address]."
ACQUISITION STATUS
For each general category of scope operation, you can view a summary of your setups. These
dialogs are not accessible through the Utilities menu, but are instead accessed from the menu
bar drop-down menus. The categories are as follows:
• Vertical -- select Channels Status . . . from drop-down menu
• Timebase -- select Acquisition Status . . . from drop-down menu
• Trigger -- select Acquisition Status . . . from drop-down menu
• Math -- select Math Status . . . from drop-down menu
In addition to these dialogs, summaries are also provided for XY setups, memory (M1-M4)
setups, and time stamps for sequence mode sampling.
WR6A-GS-E Rev B ISSUED: July 2005 73
Page 76

WAVER UNNER 6000A S ERIES
Introduction to WaveShape Analysis
This section is a brief reference to the basic tools available to perform WaveShape Analysis in the
time, frequency, and statistical domains.
PARAMETER MEASUREMENTS
WaveShape Analysis typically begins with the measurement of parameters. Parameter
measurement tools determine a wide range of waveform properties. Use them to automatically
calculate many attributes of your waveform, like rise time, rms voltage, and peak-to-peak voltage,
for example.
There are parameter modes for the amplitude and time domains, custom parameter groups, and
parameters for pass and fail testing. You can make common measurements on one or more
waveforms.
Measure Modes
The selections for Measure Mode allow you to quickly apply parameters for standard vertical and
standard horizontal setups, and custom setups.
Pass and fail parameters can be customized, too. You can accumulate and display statistics on
each parameter's average, lowest, highest, and standard deviation.
Standard Vertical Parameters
These are the default Standard Vertical Parameters:
Vertical Description
mean Mean
sdev Standard deviation
max Maximum
min. Minimum
ampl Amplitude
pkpk Peak-to-peak
Standard Horizontal Parameters
These are the default Standard Horizontal Parameters:
Horizontal
freq Frequency
74 ISSUED: July 2005 WR6A-GS-E Rev B
Page 77

G ETTING S TARTED M ANUAL
period Period
width Width
rise Risetime
fall Fall time
duty duty cycle
Custom Measurements with My Measure
You can choose to customize up to six parameters by touching My Measure and then selecting
the measurements desired.
Status Symbols
Below each parameter appears a symbol that indicates the status of the parameter, as follows:
A green check mark means that the scope is returning a valid value.
A crossed-out pulse means that the scope is unable to determine top and base; however,
the measurement could still be valid.
A downward pointing arrow indicates an underflow condition.
An upward pointing arrow indicates an overflow condition.
An upward-and-downward pointing arrow indicates an underflow and overflow condition.
WR6A-GS-E Rev B ISSUED: July 2005 75
Page 78

WAVER UNNER 6000A S ERIES
Waveform Measurement s
MEASURING WITH CURSORS
Cursors are important tools that aid you in measuring signal values. Cursors are markers — lines,
cross-hairs, or arrows — that you can move around the grid or the waveform itself. Use cursors to
make fast, accurate measurements and to eliminate guesswork. There are two basic types:
• Horiz(ontal) (generally Time or Frequency) cursors are markers that you move horizontally
along the waveform. Place them at a desired location along the time axis to read the signal’s
amplitude at the selected time.
• Vert(ical) (Voltage) cursors are lines that you move vertically on the grid to measure the
amplitude of a signal.
Cursor Measurement Icons
The Readout icons depict what is being measured for each measurement mode.
Each cursor locates a point on the waveform. The cursor values can be read in the
descriptor label for the trace. Use the Position data entry fields at the right side of
the dialog to place the cursors precisely.
This is the difference in Y values. The value can be read in the descriptor label for
the trace.
This gives the slope between cursors.
If there are non-time-domain waveforms displayed, there will also be a menu offering choices of
x-axis units: s or Hz, for example.
CURSORS SETUP
Quick Display
At any time, you can change the display of cursor types (or turn them off) without invoking the
"Cursors Setup" dialog as follows:
1. In the menu bar, touch Cursors, then Off, Abs Horizontal, Rel Horizontal, Abs
Vertical, or Rel Vertical.
2. The cursors displayed will assume the positions previously set up. If you want to change
their position or measurement mode, in the menu bar touch Cursors, then Cursors
Setup in the drop-down menu.
Full Setup
1. In the menu bar, touch Cursors, then Cursors Setup. The "Standard Cursors" dialog
76 ISSUED: July 2005 WR6A-GS-E Rev B
Page 79

G ETTING S TARTED M ANUAL
opens.
2. In the dialog area, touch the Cursors On check box to display them.
3. Touch one of the Horizontal or Vertical mode buttons: Relative or Absolute.
4. If you chose a Relative mode, also touch a readout parameter button: Y position, delta Y,
or slope.
5. If you chose a Relative mode, touch inside the Position 1 and Position 2 data entry
fields and type in a value for each cursor. You can also use the Cursors knobs on the
front panel to place the cursors. If you chose an Absolute mode, do the same for your
single cursor.
6. If you chose a Relative mode and you would like both cursors to move in unison as you
adjust the position, touch the Track check box to enable tracking.
WR6A-GS-E Rev B ISSUED: July 2005 77
Page 80

WAVER UNNER 6000A S ERIES
Parameter Analysis
TREND MEASUREMENTS
A trend of a measurement parameter is a line graph with a measurement point from each
subsequent signal acquisition plotted on the graph.
1. In the menu bar, touch Measure, then Measure Setup… in the drop-down menu.
2. Touch one of parameter tabs P1 through P6.
3. Touch inside the Source1 data entry field and select an input waveform from the pop-up
menu.
4. Touch inside the Measure data entry field and select a parameter from the pop-up menu.
5. Touch the Trend button at the bottom of the dialog.
TRACK VIEW
A Track View of a measurement parameter is a unique and specialized graph that is time
correlated to the signal being measured. The Track View applies to a single-shot acquisition and
plots the variation of a parameter (such as width) for each cycle in time-correlated sequence with
the waveform. Track View lets you locate a problematic signal feature including width, period,
amplitude, and more.
1. In the menu bar touch Measure, then Measure Setup… in the drop-down menu.
2. Touch one of parameter tabs P1 through P6.
3. Touch inside the Source1 data entry field and select an input waveform from the pop-up
menu.
4. Touch inside the Measure data entry field and select a parameter from the pop-up menu.
5. Touch the Track button at the bottom of the dialog.
JITTERTRACK VIEW
A JitterTrack View is similar to a Track View but is applicable to a specialized set of timing
parameter measurements used to analyze cycle-to-cycle timing variation, including clock jitter,
and to aid in tracking the variation to its source. JitterTrack is available with the optional XMAP or
JTA2 WaveShape Analysis packages.
78 ISSUED: July 2005 WR6A-GS-E Rev B
Page 81

G ETTING S TARTED M ANUAL
Histograms
CREATING AND VIEWING A HISTOGRAM
Note: The number of sweeps comprising a histogram is displayed in the bottom line of the trace descriptor label:
To Set Up a Single Parameter Histogram
From Measure Dialog
1. In the menu bar, touch Measure, then Measur e Setup.
2. Touch the My Measure button.
3. Touch one of tabs P1 through Px.
4. Touch inside the Source1 field and select an input waveform from the pop-up menu.
5. Touch inside the Measure field and select a parameter from the pop-up menu.
6. Touch the Histogram button at the bottom of the dialog.
7. Touch a math trace in which to place the resulting histogram, then close the pop-up
menu.
8. Touch the math trace label for the math trace you just created.
9. In the dialog to the right, touch the Histogram tab.
10. Under "Buffer," touch inside the #Values data entry field and enter a value.
11. Under "Scaling," touch inside the #Bins data entry field and enter a value from 20 to
2000.
12. Touch the Find Center and Width button to center the histogram. Or touch inside the
Center, then the Width, data entry fields and enter a value using the pop-up numeric
keypad.
From Math Dialog
1. In the menu bar, touch Math, then Math Setup.
2. Touch one of function tabs F1 through Fx. The number of math traces available depends
on the software options loaded on your scope.
3. Touch the Graph button
4. Touch inside the Source1 field and select a source from the pop-up menu.
5. Touch inside the Measurement field and select a parameter from the pop-up menu.
6. Touch inside the Graph with field and select Histogram from the pop-up menu.
WR6A-GS-E Rev B ISSUED: July 2005 79
.
Page 82

WAVER UNNER 6000A S ERIES
7. In the dialog to the right, touch the Histogram tab.
8. Under "Buffer," touch inside the #Values data entry field and enter a value.
9. Under "Scaling," touch inside the #Bins data entry field and enter a value from 20 to
2000.
10. Touch the Find Center and Width button to center the histogram. Or touch inside the
Center, then the Width, data entry fields and enter a value using the pop-up numeric
keypad.
11. Touch inside the Vertical Scale field and select Linear or Linear Constant Max from the
pop-up menu:
A linear histogram will continue to grow as values are accumulated. A linear-constantmaximum histogram will continually rescale itself to remain well within the grid.
To View Thumbnail Histograms
Histicons are miniature histograms of parameter measurements that appear below the grid.
These thumbnail histograms let you see at a glance the statistical distribution of each parameter.
1. In the menu bar, touch Measure, then one of the Measure Mode buttons: Std Vertical,
Std Horizontal, or My Measure.
2. Touch the Histicons checkbox to display thumbnail histograms below the selected
parameters.
Note: For measurements set up in My Measure, you can quickly display an enlarged histogram of a thumbnail histogram
by touching the Histicon you want to enlarge. The enlarged histogram will appear superimposed on the trace it describes.
This does not apply to "Std Vertical" or "Std Horizontal" measurements.
Persistence Histogram
You can create a histogram of a persistence display also by cutting a horizontal or vertical slice
through the waveform. You also decide the width of the slice and its horizontal or vertical
placement on the waveform.
This math operation is different than the "Histogram" math operation and is not affected by
Center and Width settings made there.
To Set Up Persistence Histograms
1. In the menu bar, touch Math, then Math Setup.
80 ISSUED: July 2005 WR6A-GS-E Rev B
Page 83

G ETTING S TARTED M ANUAL
2. Touch one of function tabs F1 through Fx The number of math traces available depends
on the software options loaded on your scope.
3. Touch inside the Source1 field and select a source from the pop-up menu.
4. Touch inside the Operator1 field and select Phistogram
from the Select Math
Operator menu.
5. Touch the "Phistogram" tab, then touch inside the Slice Direction field and select
Horizontal or Vertical slice from the pop-up menu.
6. Touch inside the Slice Center field and enter a value, using the pop-up keypad.
7. Touch inside the Slice Width field and enter a value, using the pop-up keypad.
Note: You can use the front panel Adjust knobs to move the Slice Center line and the Slice Width boundary lines.
Persistence Trace Range
This math operation has a field where you can enter the percent of the persistence trace
population to use in creating a new waveform.
Persistence Sigma
This math operation has a field where you can enter a scale, measured in standard deviations, by
which to create a new waveform.
WR6A-GS-E Rev B ISSUED: July 2005 81
Page 84

WAVER UNNER 6000A S ERIES
Waveform Math
MA TH SETUP
This setup mode allows you to quickly apply frequently used math functions.
1. In the menu bar, touch Math, then Math setup...
2. If there are math functions already assigned to F1 through Fx, touch the checkbox for the
function you want to enable. The number of math traces available depends on the
software options loaded on your scope.
3. To assign a new math function to a trace, touch the Fx button for that trace, for example
. The math function menu appears.
4. Touch a menu selection; your new function is automatically assigned, with the same
setups as were in place for the last function in that Fx position.
5. If you want to change other setup items, like the source waveform, touch the appropriate
Fx tab, for example
6. Touch the Single function button
on the trace, or touch the Dual function button
7. Touch the Graph button, then touch inside the Graph with field to select a graph mode.
The Graph modes are as follows:
Histogram of the values of a parameter
Track of the values of a parameter
Trend of the values of a parameter
RESAMPLING TO DESKEW
. The setup dialog for that Fx position appears.
if you want to perform just one math function
to perform math on math.
82 ISSUED: July 2005 WR6A-GS-E Rev B
Page 85

G ETTING S TARTED M ANUAL
Deskew whenever you need to compensate for different lengths of cables, probes, or anything
else that might cause timing mismatches between signals. Resample a signal on one channel
and adjust it in time relative to a signal on another channel.
To Resample
1. In the menu bar, touch Math, then Math Setup... in the drop-down menu.
2. Touch a math function trace tab F1 through Fx The number of math traces available
depends on the software options loaded on your scope.
3. Touch the single function button.
4. Touch inside the Source1 field and select a source: channel, math trace, memory
location.
5. Touch inside the Operator1 field and select Deskew from the Functions category.
6. In the dialog on the right, touch the Deskew tab.
7. Touch inside the Delay by data entry field and type in a time value, using the pop-up
keypad.
RESCALING AND ASSIGNING UNITS
This feature allows you to apply a multiplication factor (a) and additive constant (b) to your
waveform: aX + b. You can do it in the unit of your choice, depending on the type of application.`
To Set Up Rescaling
1. In the menu bar, touch Math, then Math Setup... in the drop-down menu.
2. Touch a math function trace tab F1 through Fx The number of math traces available
depends on the software options loaded on your scope.
3. Touch the single function button.
4. Touch inside the Source1 data entry field and select a source: channel, math trace,
memory location.
5. Touch inside the Operator1 data entry field and select Rescale from the Functions
category.
6. In the dialog on the right, touch the Rescale tab.
7. Touch inside the First multiply by checkbox and enter a value for a, the multiplication
factor.
8. Touch inside the then add: data entry field and enter a value for b, the additive constant.
9. Touch inside the Override units checkbox to disregard the source waveform's units,
using the pop-up keyboard.
A VERAGING WAVEFORMS
Summed vs. Continuous Averaging
For Summed averaging, you specify the number of acquisitions to be averaged. The averaged
data is updated at regular intervals and presented on the screen.
WR6A-GS-E Rev B ISSUED: July 2005 83
Page 86

WAVER UNNER 6000A S ERIES
On the other hand, Continuous averaging (the system default) helps to eliminate the effects of
noise by continuously acquiring new data and adding the new waveforms into the averaging
buffer. You determine the importance of new data vs. old data by assigning a weighting factor.
Continuous averaging allows you to make adjustments to a system under test and to see the
results immediately.
Note: Continuous Averaging is accessible from the channel "Vertical Adjust" dialog under "Pre-Processing," and from the
math function menu.
Summed Averaging
Summed Averaging is the repeated addition, with equal weight, of successive source waveform
records. If a stable trigger is available, the resulting average has a random noise component
lower than that of a single-shot record. Whenever the maximum number of sweeps is reached,
the averaging process stops.
An even larger number of records can be accumulated simply by changing the number in the
dialog. However, the other parameters must be left unchanged or a new averaging calculation will
be started. You can pause the averaging by changing the trigger mode from NORM/AUTO to
STOP. The instrument resumes averaging when you change the trigger mode back to
NORM/AUTO.
You can reset the accumulated average by pushing the CLEAR SWEEPS button or by changing
an acquisition parameter such as input gain, offset, coupling, trigger condition, timebase, or
bandwidth limit. The number of current averaged waveforms of the function, or its zoom, is shown
in the acquisition status dialog. When summed averaging is performed, the display is updated at
a reduced rate to increase the averaging speed (points and events per second).
Continuous Averaging
Continuous Averaging, the default setting, is the repeated addition, with unequal weight, of
successive source waveforms. It is particularly useful for reducing noise on signals that drift very
slowly in time or amplitude. The most recently acquired waveform has more weight than all the
previously acquired ones: the continuous average is dominated by the statistical fluctuations of
the most recently acquired waveform. The weight of ‘old’ waveforms in the continuous average
gradually tends to zero (following an exponential rule) at a rate that decreases as the weight
increases.
The formula for continuous averaging is
new average = (new data + weight * old average)/(weight + 1)
This is also the formula used to compute summed averaging. But by setting a "sweeps" value,
you establish a fixed weight that is assigned to the old average once the number of "sweeps" is
reached. For example, for a sweeps (weight) value of 4:
st
1
sweep (no old average yet): new average = (new data +0 * old average)/(0 + 1) =
new data only
84 ISSUED: July 2005 WR6A-GS-E Rev B
Page 87

G ETTING S TARTED M ANUAL
2nd sweep: new average = (new data + 1*old average)/(1 + 1) = 1/2 new data +1/2 old
average
rd
3
sweep: new average = (new data + 2 * old average)/(2 + 1) = 1/3 new data + 2/3 old
average
th
4
sweep: new average = (new data + 3 * old average)/(3 + 1) = 1/4 new data + 3/4 old
average
th
5
sweep: new average = (new data + 4 * old average)/(4 + 1) = 1/5 new data + 4/5 old
average
th
6
sweep: new average = (new data + 4 * old average)/(4 + 1) = 1/5 new data + 4/5 old
average
th
7
sweep: new average = (new data + 4 * old average)/(4 + 1) = 1/5 new data + 4/5 old
average
In this way, for sweeps > 4 the importance of the old average begins to decrease exponentially.
Note: The number of sweeps used to compute the average will be displayed in the bottom line of the trace descriptor
label:
To Set Up Continuous Averaging
1. In the menu bar, touch Math, then Math Setup... in the drop-down menu.
2. Select a function tab from F1 through Fx. The number of math traces available depends
on the software options loaded on your scope.
3. Touch inside the Source1 field and select a source waveform from the pop-up menu.
4. Touch inside the Operator1 field and select Average from the Select Math Operator
menu.
5. Touch the Average tab in the dialog to the right of the "Fx" dialog, touch the Continuous
button.
6. Touch inside the Sweeps data entry field and enter a value using the pop-up keypad.
The valid range is 1 to 1,000,000 sweeps.
To Set Up Summed Averaging
1. In the menu bar, touch Math, then Math Setup... in the drop-down menu.
2. Select a function tab from F1 through Fx. The number of math traces available depends
on the software options loaded on your scope.
3. Touch inside the Source1 field and select a source waveform from the pop-up menu.
4. Touch inside the Operator1 field and select Average from the Select Math Operator
menu.
WR6A-GS-E Rev B ISSUED: July 2005 85
Page 88

WAVER UNNER 6000A S ERIES
5. Touch the Average tab in the dialog to the right of the "Fx" dialog, then touch the
Summed button.
6. Touch inside the Sweeps data entry field and type in a value using the pop-up keypad.
The valid range is 1 to 1,000,000 sweeps.
ENHANCED RESOLUTION (ERES)
ERES (Enhanced Resolution) filtering increases vertical resolution, allowing you to distinguish
closely spaced voltage levels. The functioning of the instrument's ERES is similar to smoothing
the signal with a simple, moving-average filter. However, it is more efficient concerning bandwidth
and pass-band filtering. Use ERES on single-shot waveforms, or where the data record is slowly
repetitive (when you cannot use averaging). Use it to reduce noise when your signal is noticeably
noisy, but you do not need to perform noise measurements. Also use it when you perform highprecision voltage measurements: zooming with high vertical gain, for example.
1. In the menu bar, touch Math, then Math Setup... in the drop-down menu.
2. Touch a function tab F1 through Fx. The number of math traces available depends on the
software options loaded on your scope.
3. Touch inside the Operator1 data entry field.
4. Select ERES from the All Functions or Filter group of Math functions.
5. Touch the Trace On checkbox.
6. Touch the "ERES" tab in the right-hand dialog, then touch inside the bits field and make
an "Enhance by" selection from the pop-up menu:
.
WAVEFORM COPY
The Copy math function
state. While processing may continue on the original waveform, the copy enables faster
throughput in some cases by preserving the original data. That is, no calculations need to be
undone on the copy before additional math can be calculated.
This benefit of faster throughput, however, comes at the expense of memory usage.
86 ISSUED: July 2005 WR6A-GS-E Rev B
makes a copy of your present waveform in its unprocessed
Page 89

WAVEFORM SPARSER
G ETTING S TARTED M ANUAL
The Sparse math function
allows you to thin out an incoming waveform by skipping
points at regular intervals, and by starting acquisition at a particular "offset" (point). The Sparsing
factor specifies the number of sample points to reduce the input waveform by. A sparsing factor
of 4, for example, tells the scope to retain only one out of every 4 samples. A Sparsing offset of
3, on the other hand, tells the scope to begin on the third sample, then skip the number of
samples specified by the sparsing factor (4). In this way, the sample rate is effectively reduced.
For the sparsing factor (interval), you can set a value from 1 to 1,000,000 points. For the sparsing
offset you can set a value from 0 to 999,999.
Note: The maximum sparsing offset that can be entered for any sparsing factor equals Sparsing Factor - 1.
To Set Up Waveform Sparser
1. In the menu bar, touch Math, then Math setup... in the drop-down menu.
2. Touch the tab for the function (F1 to Fx The number of math traces available depends on
the software options loaded on your scope.) you want to assign the Sparse operation to.
3. Touch inside the Source1 field and select an input waveform.
4. Touch inside the Operator1 field and select Sparse from the Select Math Operator
menu.
5. Touch inside the Sparsing factor field and enter a value, using the pop-up keypad.
6. Touch inside the Sparsing offset field and enter a value, using the pop-up keypad.
INTERPOLATION
Linear interpolation, which inserts a straight line between sample point, is best used to
reconstruct straight-edged signals such as square waves. (Sinx)/x interpolation, on the other
hand, is suitable for reconstructing curved or irregular waveshapes, especially when the sampling
rate is 3 to 5 times the system bandwidth. The instrument also gives you a choice of Cubic
interpolation.
For each method, you can select a factor from 2 to 50 points by which to interpolate (upsample).
To Set Up Interpolation
1. In the menu bar, touch Math, then Math setup... in the drop-down menu.
2. Touch the tab for the function (F1 to Fx The number of math traces available depends on
the software options loaded on your scope.) you want to assign the Interpolate operation
to.
3. Touch inside the Source1 field and select an input waveform.
4. Touch inside the Operator1 field, then touch the Filter button in the Select Math
Operator menu.
5. Select Interpolate from the Filter submenu.
6. Touch the "Interpolate" tab in the mini setup dialog to the right of the main dialog.
WR6A-GS-E Rev B ISSUED: July 2005 87
Page 90

WAVER UNNER 6000A S ERIES
7. Touch inside the Algorithm field and select an interpolation type.
8. Touch inside the Upsample by Upsampling is the factor by which sampling is increased.
field and enter a value, using the pop-up numeric keypad, if you want to enter a specific
value. Otherwise, use the Up/Down buttons to increment the displayed value in a 1-2-5
sequence.
FFT SETUP
1. In the menu bar touch Math, then Math Setup... in the drop-down menu.
2. Touch a Math function trace button: F1 through Fx The number of math traces available
depends on the software options loaded on your scope.; a pop-up menu appears. Select
FFT
3. Touch the Single
from the menu.
or Dual (function of a function) button if the FFT is to
be of the result of another math operation.
4. Touch inside the Source1 field and select a channel, memory, or math trace on which to
perform the FFT.
5. Touch inside the Operator1 field: Select FFT from the pop-up menu if you selected
Single function. Select another math function if you selected Dual function. Then touch
inside the Operator2 field and select FFT from the pop-up menu.
6. In the right-hand dialog, touch the FFT tab.
7. Choose whether to Truncate
‡
or Zero-fill§ the trace display.
8. Touch the Suppress DC checkbox if you want to make the DC bin go to zero. Otherwise,
leave it unchecked.
9. Touch inside the Output type field, and make a selection from the pop-up menu.
10. Touch inside the Window field, select a window type.
11. Touch inside the Algorithm field and select either Least Prime
‡
When the FFT transform size does not match the record length, you can truncate the record and perform an FFT on the
shorter record. This will increase the resolution bandwidth.
§
Zero-fill is useful when the source data for the FFT comes from a math operation that shortens the record. This is
commonly encountered in filtering operations like enhanced resolution. The missing data points are replaced by data
values, whose amplitudes are interpolated to fit between the last data point and th first data point in the record. This
guarantees that there is not a first-order discontinuity in the filled data. Since the data at the end of the record is "filled"
data, it is advisable to select a weighting window other than rectangular to minimize the effect of the fill on the resulting
spectrum.
**
The default algorithm is a least primes algorithm that computes FFTs on transform sizes having lengths that can be
expressed as factors of 2
N*5K
. This is very compatible with the record lengths encountered in the oscilloscope, which are
**
from the pop-up menu.
88 ISSUED: July 2005 WR6A-GS-E Rev B
Page 91

G ETTING S TARTED M ANUAL
Analysis
PASS/FAIL TESTING
Comparing Parameters
Each Pass/Fail input (Qx) can compare a different parameter result to a user-defined limit (or
statistical range) under a different condition.
The conditions are represented by these comparison operators:
At the touch of a button, test results can also be compared to these standard statistical limits:
• current mean
• mean + 1 SD
• mean + 3 SD
In Dual Parameter Compare mode, your X-Stream scope gives you the option to compare to each
other parameter results measured on two different waveforms. You can set your test to be true if
Any waveform or All waveforms fit the criterion stipulated by the comparison condition. Your setup
is conveniently shown in the Summary box of the Qx dialog. For example:
often multiples of 1, 2, 4, 5, or 10. or Power of 2 The other choice is a power of two algorithm where the record lengths are
in the form of 2
record length that is not the same as the acquired signal. The power-of-two FFT uses the first 2
example, if you acquire 500 points in your trace, the power-of-two FFT would only use the first 256 points.
WR6A-GS-E Rev B ISSUED: July 2005 89
N
. The power of 2 algorithm generally runs faster than the least primes algorithm. The price that is paid is a
N
points of the record. For
Page 92

WAVER UNNER 6000A S ERIES
Mask Tests
You have the choice to do mask testing by using an existing mask, or by using a mask created
from your actual waveform, with vertical and horizontal tolerances that you define. Existing
masks can be loaded from a floppy disk or from a network.
You can set your mask test to be True for waveforms All In, All Out, Any In, or Any Out. For
example, if you select All In, the test will be False if even a single waveform falls outside the
mask.
Masks that you create from your waveform can be confined to just a portion of the trace by use of
a measure gate. (See Measure Gate for an explanation of how this feature works.)
Actions
By touching the Stop Test checkbox
"Actions" dialog, you can set up the test to end after a predetermined number of sweeps that you
decide.
You can also decide the actions to occur upon your waveforms' passing or failing, by selecting
one or all of the following:
• stop
• audible alarm
• print image of display
• emit pulse
• save waveform
90 ISSUED: July 2005 WR6A-GS-E Rev B
in the
Page 93

G ETTING S TARTED M ANUAL
The selection Pulse causes a pulse to be output through the Aux Out connector at
the front of the scope. This pulse can be used to trigger another scope. You can set the amplitude
and width of the pulse as described in Auxiliary Output Signals.
Depending on your scope model, you can configure up to 8 pass/fail conditions. The boolean
conditions to determine if your waveform passes are as follows:
All True All False
Any True Any False
All Q1 to Q4 Or All Q5 to Q8 Any Q1 to Q4 And Any Q5 to Q8
Setting Up Pass/Fail Testing
Initial Setup
1. Touch Analysis in the menu bar, then Pass/Fail Setup... in the drop-down menu.
2. Touch the Actions tab.
3. Touch the Enable Actions checkbox. This will cause the actions that you will select to
4. Touch the Summary View to enable a line of text
5. Touch inside the Pass If field, and select a boolean condition from the pop-up menu.
6. If you want to set up the test to end after a finite number of sweeps, touch the Stop Test
7. Under "If", touch either the Pass
8. Under "Then", touch the actions you want to occur: stop test, sound alarm, print result,
9. If you want to save your waveform automatically, touch the Save Setup. This will take
occur upon your waveform's passing or failing a test.
that shows concisely the status of your last waveform and keeps a running count of how
many sweeps have passed.
checkbox. Then touch inside the After data entry field and enter a value, using the pop-
up numeric keypad.
or Fail button to set the actions to
occur upon your waveform's passing or failing the test.
emit pulse, or save the waveform. If you want to have the results printed and your scope
is not equipped with a printer, be sure that the it is connected to a local or network printer.
See Printing.
you out of the current dialog and will open the "Save Waveform" dialog. See Saving and
Recalling Waveforms.
WR6A-GS-E Rev B ISSUED: July 2005 91
Page 94

WAVER UNNER 6000A S ERIES
10. Test your Pass/Fail conditions by touching the Force Actio ns Once button. Press the
Clear All button to quickly uncheck all checkboxes if you want to change your selections.
Comparing a Single Parameter
1. Touch Analysis in the menu bar, then Pass/Fail Setup... in the drop-down menu.
2. Touch a Qx tab; a setup dialog for that position will open.
3. Touch inside the Source1 field and select a source from the pop-up menu.
4. Touch inside the Condition field in the main dialog and select ParamCompare
5. Touch inside the Compare V alues field and select All or Any from the pop-up menu:
.
By selecting All, the test will be true only if every waveform falls within the limit that you
will set. By selecting Any, the test will be true if just one waveform falls within the limit.
6. Touch inside the Condition field in the "ParamCompare" mini-dialog and select a math
operator from the pop-up menu:
7. Touch inside the Limit field and enter a value, using the pop-up numeric keypad. This
value takes the dimensions of the parameter that you are testing. For example, if you are
testing a time parameter, the unit is seconds. If you chose either WithinDeltaPct
92 ISSUED: July 2005 WR6A-GS-E Rev B
.
Page 95

G ETTING S TARTED M ANUAL
or WithinDeltaAbs from the Condition menu, you also have the choice of
setting the limit by means of the statistical buttons at the bottom of the "ParamCompare"
dialog:
Comparing Dual Parameters
1. Touch Analysis in the menu bar, then Pass/Fail Setup... in the drop-down menu.
2. Touch a Qx tab; a setup dialog for that position will open.
3. Touch inside the Condition field in the main dialog and select DualParamCompare
.
4. Touch inside the Source1 and Source2 fields and select a source from the pop-up menu.
5. Touch inside the "ParamCompare" mini-dialog field and select a source from the pop-up
menu.
6. Touch inside the Compare V alues field and select All or Any from the pop-up menu:
.
By selecting All, the test will be true only if every waveform falls within the limit that you
will set. By selecting Any, the test will be true if just one waveform falls within the limit.
7. Touch inside the Condition field in the "ParamCompare" mini-dialog and select a math
operator from the pop-up menu:
WR6A-GS-E Rev B ISSUED: July 2005 93
Page 96

WAVER UNNER 6000A S ERIES
.
8. Touch inside the Limit field and enter a value, using the pop-up numeric keypad. This
value takes the dimension of the parameter that you are testing. For example, if you are
testing a time parameter, the unit is seconds.
9. If you chose either WithinDeltaPct
Condition menu, touch inside the Delta field and enter a value.
Setting Up Mask Testing
1. Touch Analysis in the menu bar, then Pass/Fail Setup... in the drop-down menu.
2. Touch a Qx tab; a setup dialog for that position will open.
3. Touch inside the Source1 field and select a source from the pop-up menu.
4. Touch inside the Condition field in the main dialog and select Mask Test
5. From the "Test" mini-dialog, make a selection in the Test is True when group of buttons:
.
This selection means, for example, that if you select All In the test will be False if even a
single waveform falls outside the mask.
6. From Show Markers, choose whether or not to have mask violations displayed.
7. If you are loading a pre-existing mask, touch the Load Mask tab, then the File button.
or WithinDeltaAbs from the
.
94 ISSUED: July 2005 WR6A-GS-E Rev B
Page 97

G ETTING S TARTED M ANUAL
You can then enter the file name or browse to its location.
8. If you want to make a mask from your waveform, touch the Make Mask tab.
9. Touch inside the Ver Delta and Hor Delta fields and enter boundary values, using the
pop-up numeric keypad.
10. Touch the Browse button to create a file name and location for the mask if you want to
save it.
11. Touch the Gate tab, then enter values in the Start and Stop fields to constrain the mask
to a portion of the waveform. Or, you can simply touch and drag the Gate posts, which
initially are placed at the extreme left and right ends of the grid.
WR6A-GS-E Rev B ISSUED: July 2005 95
Page 98

WAVER UNNER 6000A S ERIES
Customization
The instrument provides powerful capability to add your own parameters, functions, display
algorithms, or other routines to the scope user interface without having to leave the instrument
application environment. You can customize the instrument to your needs by using the power of
programs such as Excel™, Mathcad™, and MATLAB™, or by scripting in VBS. Whichever
method you use, the results appear on the instrument's display together with the signals that you
started with. This ability offers tremendous advantages in solving unique problems for a large
range of applications, with comparatively little effort from you.
Instrument customization provides these important capabilities:
• You can export data to programs, without leaving the instrument environment.
• You can get results back from those programs, and display them on the instrument, without
leaving the instrument application environment.
• Once the result is returned, you can perform additional scope operations, such as measuring
with cursors, applying parameters, or performing additional functions on the waveform, in
exactly the same way as for a normal waveform.
• You can program the scope yourself.
The instrument does not just provide connectivity with data downloads to other programs. It
provides true customizable interaction with these other programs, and allows you to truly
customize the scope to do the exact job you want it to do. The advantages to this are many:
• You can use the standard processing power of the instrument to do most of your calculations
• You only need to write the function, parameter, display algorithm, etc. that specifically applies
to your need and that the instrument doesn’t contain.
• You can view the final result on the instrument display, and use all of the instrument's tools to
understand the result.
• You can do additional processing on the result by applying either standard instrument
parameters, functions, etc. to the returned result, or even more powerfully, adding chained
customized functions. For example, you can do an Excel calculation on a result with a
MATLAB function applied to it.
Solutions
Engineers do not buy equipment; they buy solutions. But what solutions can be reached from a
set of instrument waveform data? In principle, anything that can be logically derived from those
data, given the limitations of signal-to-noise ratio and processing time. Here are some examples
of what can be done with a customized instrument:
• Changing the units of a grid to joules, newtons, amps, etc.
• Creating a new waveform by manipulating the data of one or two input waveforms
• Creating a new waveform without using any of the input data
• Creating a new parameter by manipulating the data of one or two input waveforms
• Changing a vertical scale or a horizontal scale from linear to non-linear
96 ISSUED: July 2005 WR6A-GS-E Rev B
Page 99

G ETTING S TARTED M ANUAL
You don’t have to use all the data from the input waveforms: you can select data from one or
more segments, which need not be aligned in the two-input waveforms.
Refer to the on-line Help manual for more information.
WR6A-GS-E Rev B ISSUED: July 2005 97
Page 100

WAVER UNNER 6000A S ERIES
CustomDSO
CustomDSO, in its Basic mode, allows you to create DSO setups that can be called by the touch
of a single button. The recalled setups can themselves include calls to other setups. A very simple
example would be a toggle between two setups. Rings of three or more setups are possible, as
are trees, or any other topology that you need. Basic mode also allows you to recall VBScripts
that can set up all or part of the scope and do many other things.
Another more powerful feature is the PlugIn, which allows you to add your own ActiveX controls
to a setup. These controls are powered by routines written in Visual Basic. With ActiveX controls
you can create your own user interfaces to suit your own preferences. A large number of
interactive devices are available: button, checkbox, radio button, list box, picture box, and
common dialogue box.
Refer to the on-line Help manual for more information.
98 ISSUED: July 2005 WR6A-GS-E Rev B
 Loading...