

Page 1
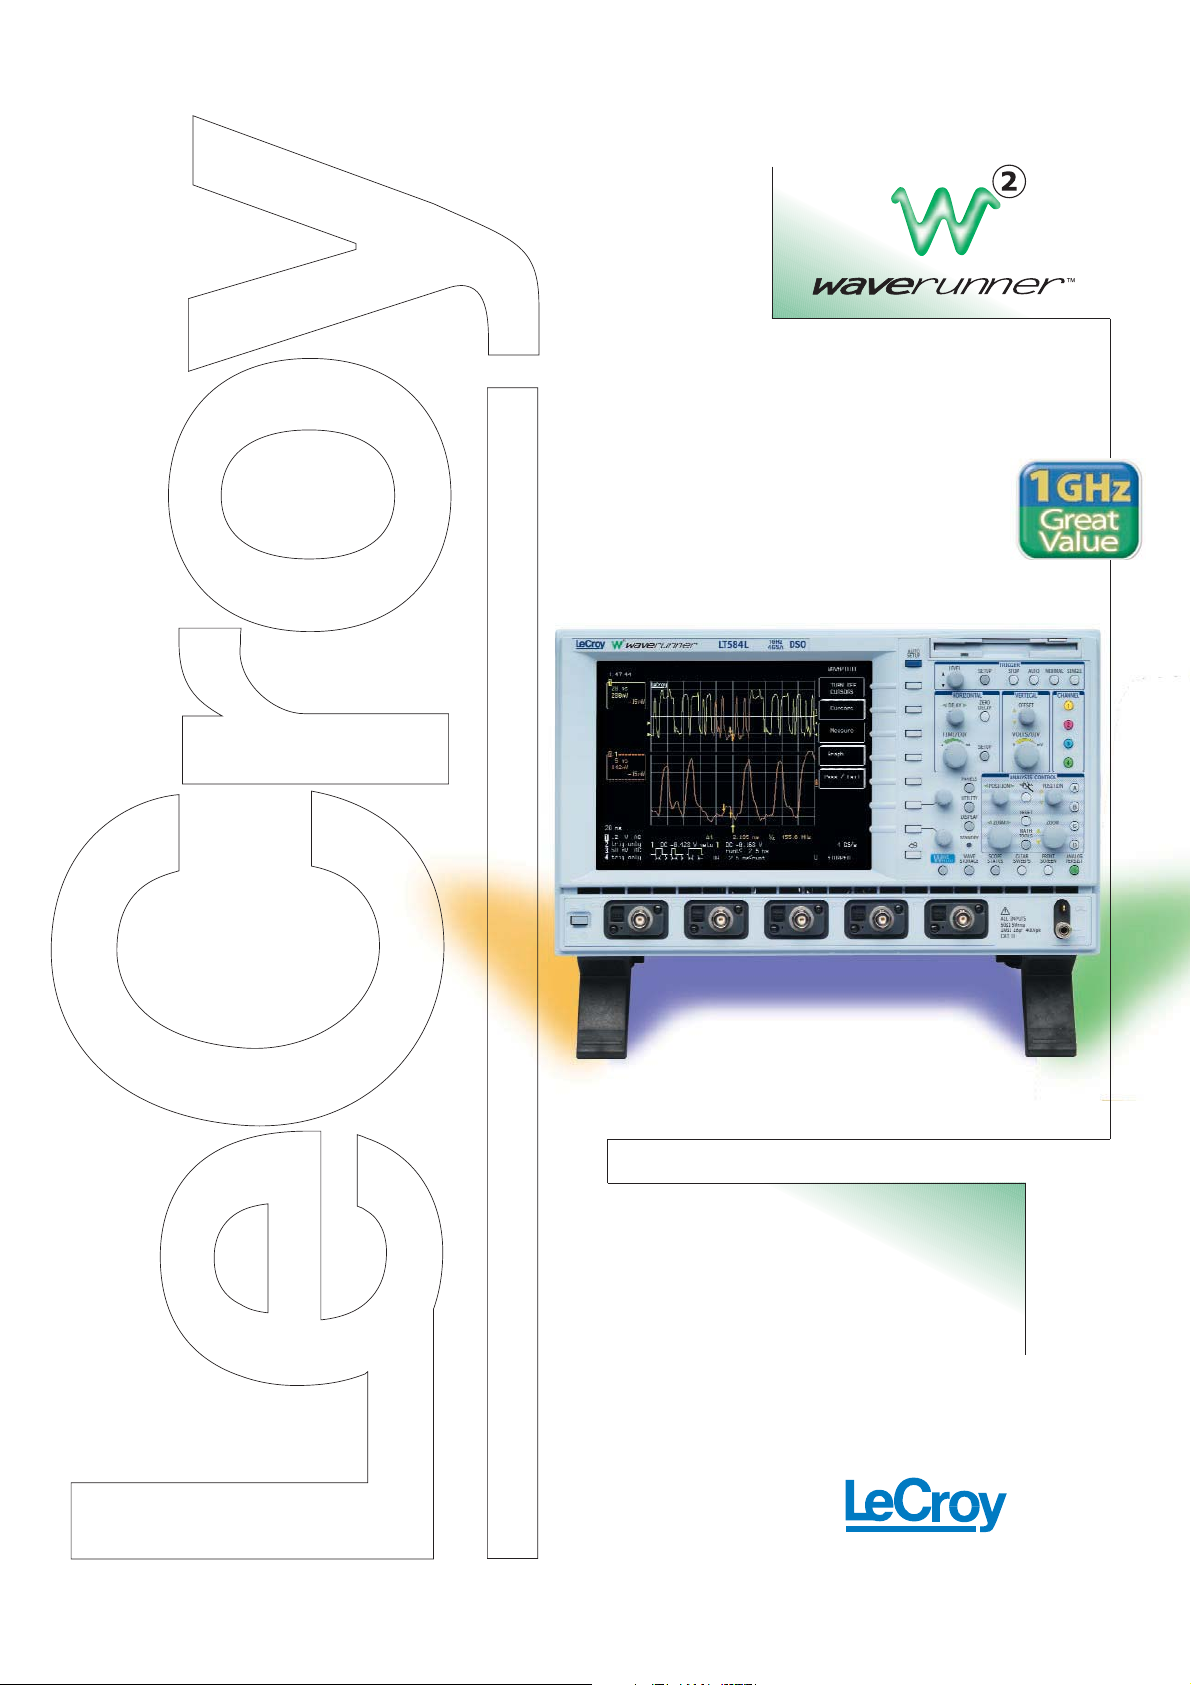
Powerful Capability.
User Friendly.
1 GHz - 350 MHz Bandwidth
4 GS/s - 1 GS/s Sample Rate
8 Mpts - 100 kpts Record Length
WAVERUNNER-2 OSCILLOSCOPES
Page 2
Waverunner-2 oscilloscopes provide all you need to quickly
capture, view and analyze your signals — accurately and reliably:
• 1 GHz– 350 MHz bandwidth
• 1 – 4 GS/s max, single-shot sample rate
• 50 GS/s for repetitive signals
• Up to 8 million data points to view signals
From troubleshooting to timing analysis to production testing, the
Waverunner-2 scopes are uniquely qualified to meet your requirements
— all at a great value!
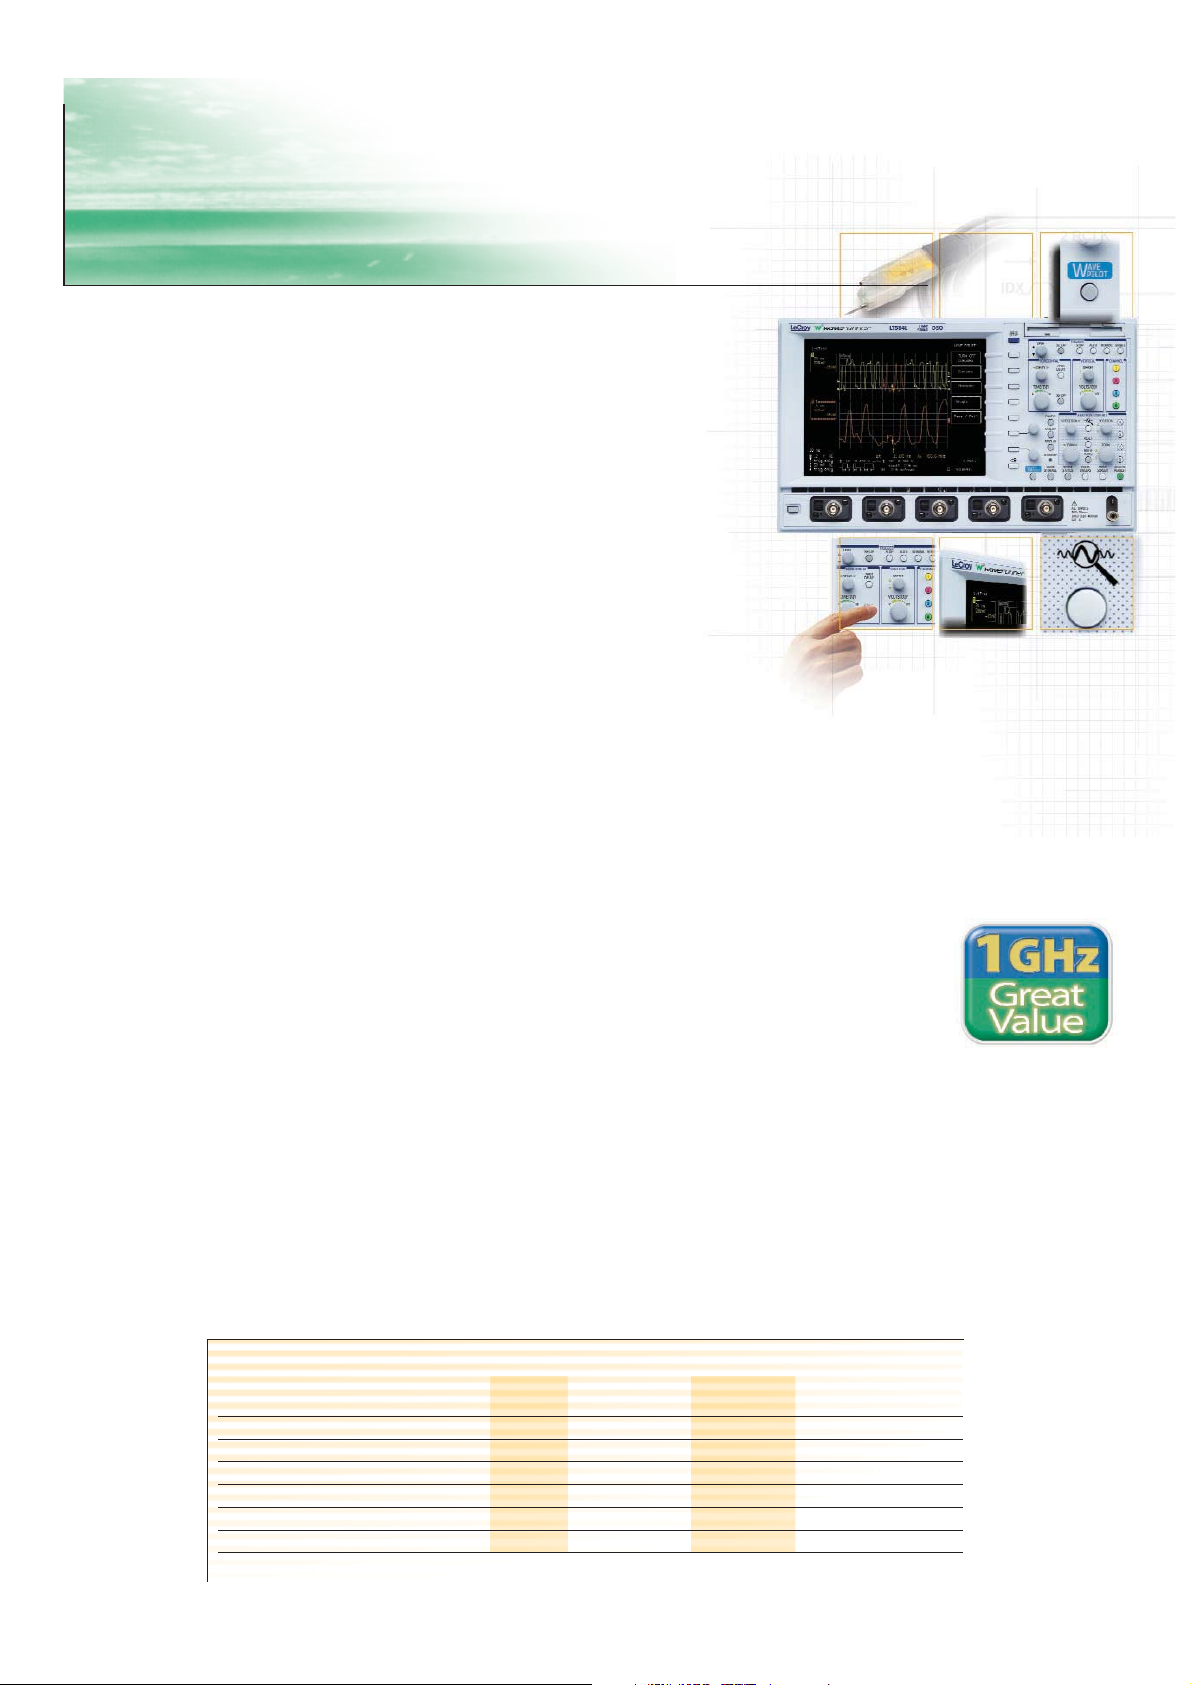
Simple, Fast Access to
Powerful Capabilities
Waverunner-2 scopes are the second generation
of the popular Waverunner series.They bring you
the power of LeCroy signal acquisition, viewing
and analysis capabilities with simple one-button
access. Using the new Wavepilot
™
feature, it’s
easier than ever to capture, view and analyze
long time duration, high-speed signals with high
resolution for accurate,precise results.
Easy to Use
Waverunner-2 scopes are designed to get you up
and running quickly.Their color-coded front panels and simple menu systems are easy to understand, so your focus is on the work and not the
tool. Common tasks are automatic. Navigation is
streamlined and intuitive.You’ll easily master their
powerful operations.
The Right Price
Waverunner-2 oscilloscopes raise the bar for
capability and value — you get more for your
money than with any other scope in this class.
And because Waverunner-2 scopes can be
upgraded, you can extend their life to meet
future needs.
Increase Your
Productivity
The new Wavepilot and QuickZoom buttons make
it simple to magnify,view,inspect or measure signal details, to perform automatic measurements
on signals, and to graph measurements in frequency spectra, histogram,or trend format. With
TrackView, you can track problems to the source.
Additional signal analysis capabilities let you datalog, chain math functions and more. LeCroy’s signal diagnostic and troubleshooting tools provide a
complete solution for characterization, debug and
signal analysis.
From Circuit to Scope
A variety of accessories are offered for effectively
connecting the Waverunner-2 to your circuit. The
LeCroy HFP small, lightweight probes assure you
high-bandwidth, low-capacitance connections to
your circuit. In addition, five interchangeable
probe tips are available for probing surface
mount devices, circuit vias, IC leads and other difficult spots — making the HFP probes the best
choice for probing high-frequency circuits.
Current probes, differential probes and amplifiers
are also available.
Catch the New Wave
Easy as 1-2-3
Waverunner-2 Color Digital Oscilloscopes
Model Bandwidth Channels Sample Maximum Acq.Memory Option M Option L
Rate/Ch Sample Rate per Ch/Max per Ch/max
LT584 1 GHz Four 2 GS/s 4 GS/s 250 k/500 kpt 1/2 Mpts 4/8 Mpts
LT374 500 MHz Four 2 GS/s 4 GS/s 250 k/500 kpt 1/2 Mpts 4/8 Mpts
LT372 500 MHz Two 2 GS/s 4 GS/s 250 k/500 kpt ——
LT354 500 MHz Four 1 GS/s 1 GS/s 250 k 1/1 Mpts 2/2 Mpts*
LT264 350 MHz Four 1 GS/s 1 GS/s 100 k 1/1 Mpts —
LT262 350 MHz Two 1 GS/s 1 GS/s 100 k — —
* Option ML
Page 3

Cursors
Press Wavepilot and select CURSORS,
then turn the knob for manual adjustment and measurement between
sections of your signal.
Measure
Select MEASURE to simultaneously display up to 26 parameters on the signal
of your choice and quickly switch from
trace to trace. The Measure dashboard
is context-sensitive,so when you
display a histogram, you will see
statistical parameters.
Graph
Select GRAPH to automatically display
an FFT,histogram (optional) or
TrackView (optional). Setting up
signal analysis is simple with the
Wavepilot menus.
Application Packages
Select access to choose optional
application-specific solution
packages including Telecommunications Mask Test, Jitter and Timing,
Power Measurements,and Data
Storage solutions.
GRAPH — Histogram
Histograms and Trends (optional) are popular
tools used to summarize measurement results.
LeCroy has made them easier than ever with
Wavepilot.Parameter selection is simple,and
graphs are automatically set up, scaled and displayed.
From beginner to expert,it is now
easier than ever to apply the power
of the unique analysis tools available
from LeCroy. The Wavepilot function
provides simple access to powerful,
easy-to-use signal analysis for real
insight into problems.
Histogram with Signal Measurements
MEASURE is simple to activate from the Wavepilot
toolbar.The DASHBOARD view displays up to 26
standard signal parameters. You can also select a set
of custom parameters.
2
Wavepilot with InsightWavepilot with Insight
Expand Your Vision
Select Trace A: When viewing a Histogram
trace,the Histogram parameters can be displayed instead of signal parameters.
One-touch insight into
any signal!
The Wavepilot function
provides fast access to
powerful signal analysis.
FFT Spectrum Analysis
When you need to understand the frequency
content of your signal, spectrum analysis is
easily accessed through the Wavepilot button.
Page 4
3
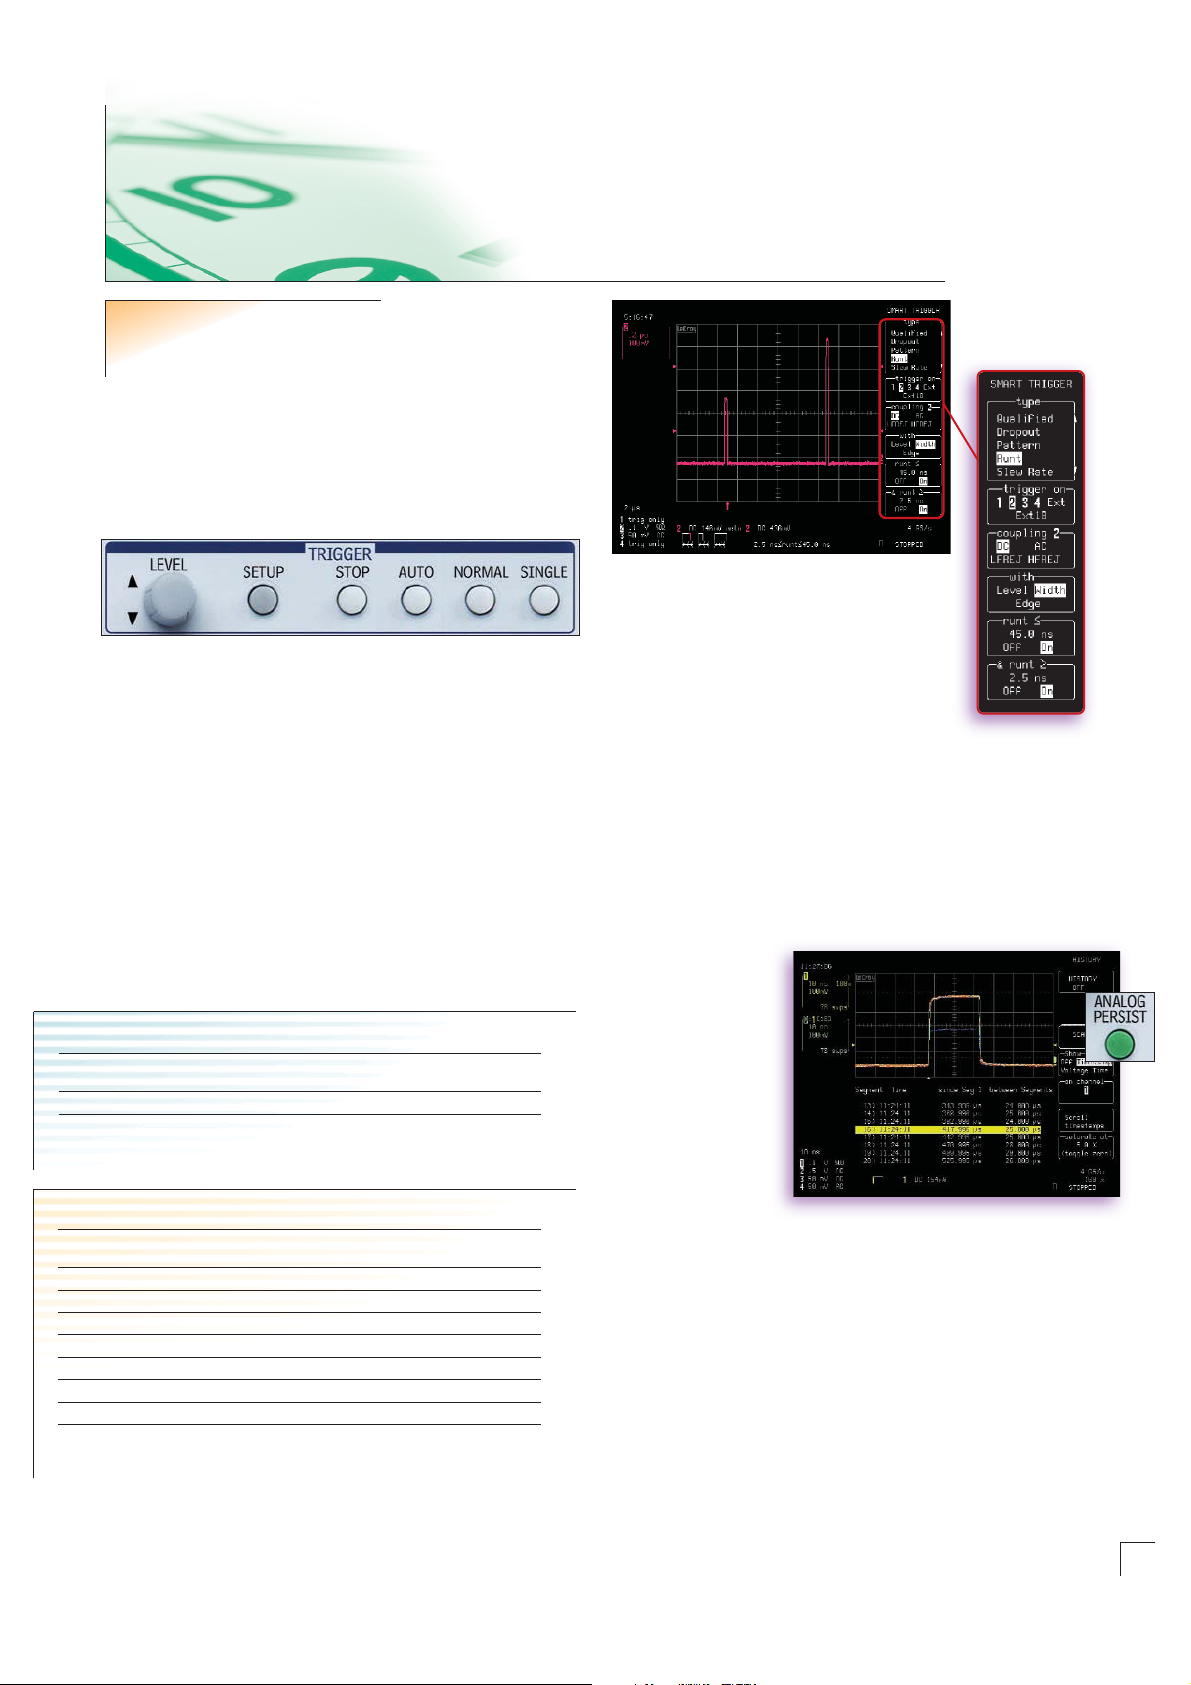
UNIQUE
SMART Triggers®
The Waverunner-2 scope’s trigger bar is simple
to operate. Run the scope in normal or auto
trigger modes, or capture one-time events
into scope memory as large as 8 Mpts with a
single-shot trigger. Triggering with
Waverunner-2 is direct, easy to read
and easy to understand.
SMART Trigger provides the flexibility needed
to quickly trigger on the specific signal
characteristic or pattern you are searching for.
All
Waverunner-2 oscilloscopes include SMART
Triggers. Trigger not only on what you expect
but also on unusual signals. Exclusion triggers
can exclude normal signals and capture only
the abnormal ones, speeding up the debug of
your circuits and systems. Trigger on signals
down to 2 ns in width. The optional Advanced
Trigger Package (ATP) extends
Waverunner-2’s
SMART Trigger capability by adding runt and
slew rate trigger for the capture of intermittent
events.
Use HISTORY Views to Find
Intermittents
Pressing the green Analog Persist button and
selecting History converts the scope into a fast
Analog Persistence fault-finder.The lifetime of
your signal is written into the History memory
and mapped on screen.You can measure each
signal, see its trigger time, and identify rare
events. Up to 4,000 events can be acquired for
playback.This is great
when you have intermittent problems and
want to know if they
occur at a rate related
to other circuit or system timing events.
Press “play” to replay
the signal history and
automatically scan
and search from
sweep to sweep.
Stop when you see
something of interest. The display shows the
Analog Persistence view of all acquired sweeps
as well as the individual sweep under inspection. Since the time of each trigger event is displayed with a resolution of 1 ns, you can easily
determine the rate of occurrence.
Waverunner-2 SMART Triggers
Name Triggers Conditions
Glitch From 2 ns - 20 s and when pulse is >, <, or in or out of a range
Interval Between edges and ranges of 10 ns - 20 s
Qualified By edge or state on a channel or if a pattern is present or absent
Qual First A single pulse qualifies a sequence of triggers.
Dropout If input drops out after a time from 25 ns - 20 s
Runt* Pulse levels, edge, widths from 2 ns - 20 s
Slew Rate* Slope, dV, dT from 1 ns - 20 ns
Pattern (logic) Logical combination of up to 5 inputs (3 on two-channel models).
Can also be used in combination with Qualified.
* Optional Advanced Trigger Package (ATP)
Waverunner-2 Basic Triggers
Name Description
Edge Select + or - slope and holdoff by time or events.
Window Triggers when signal crosses outside the window in either
direction.
Speed Up Debug and Analyze
HISTORY lets you see the intermittent Trigger on the problem,
and find how often it’s disrupting your design.
Runt triggering is great for capturing logic signals that exhibit
inadequate levels or spurious signals that interfere with circuit operation.With the exclusion/inclusion feature,the scope
will only trigger on runt signals that are outside/within a
specified range of pulse width.
Page 5
4
Hands-free probing with
FreeHand probe holder and
HFP probe.
NEW
Probing Solutions
Active Probes
Convenient,Hands-Free Probing
To access the ever-increasing variety of test
points, today’s probing solutions need to be
versatile, small and lightweight. The new HFP
series of probes meets these needs with high
bandwidth, miniature size and a variety of
tip styles, making probing easier than before.
In combination with these innovative probe
tips, the unique HFP
FreeHand probe holder will
hold the probe on test points to maintain signal fidelity.The end result of HFP “hands-free”
probing is the enhanced ability to analyze
waveforms instead of having to focus energy
on keeping the probe itself in place.
AutoColor ID
When the probe is connected to a
Waverunner-2 scope, our new patent-pending
AutoColor ID feature automatically senses and
illuminates the probe head in that channel’s
trace color.You no longer need to worry about
plastic rings or colored tape to identify which
channel on the scope is connected to a
particular test point.
HFP 1500
Leading Specifications
• 1.5 GHz Bandwidth
• 0.7 pF Input Capacitance
• 100 kΩ V DC Input Resistance
• ±8 V Dynamic Range
• 5 Interchangeable Tips available for Probing a Variety of Test Points
• Replaceable Probe Tip Socket
• Hands-Free Probing with Fr eeHand probe holder
• AutoColor ID Feature Matches the Probe Color to the Trace Color
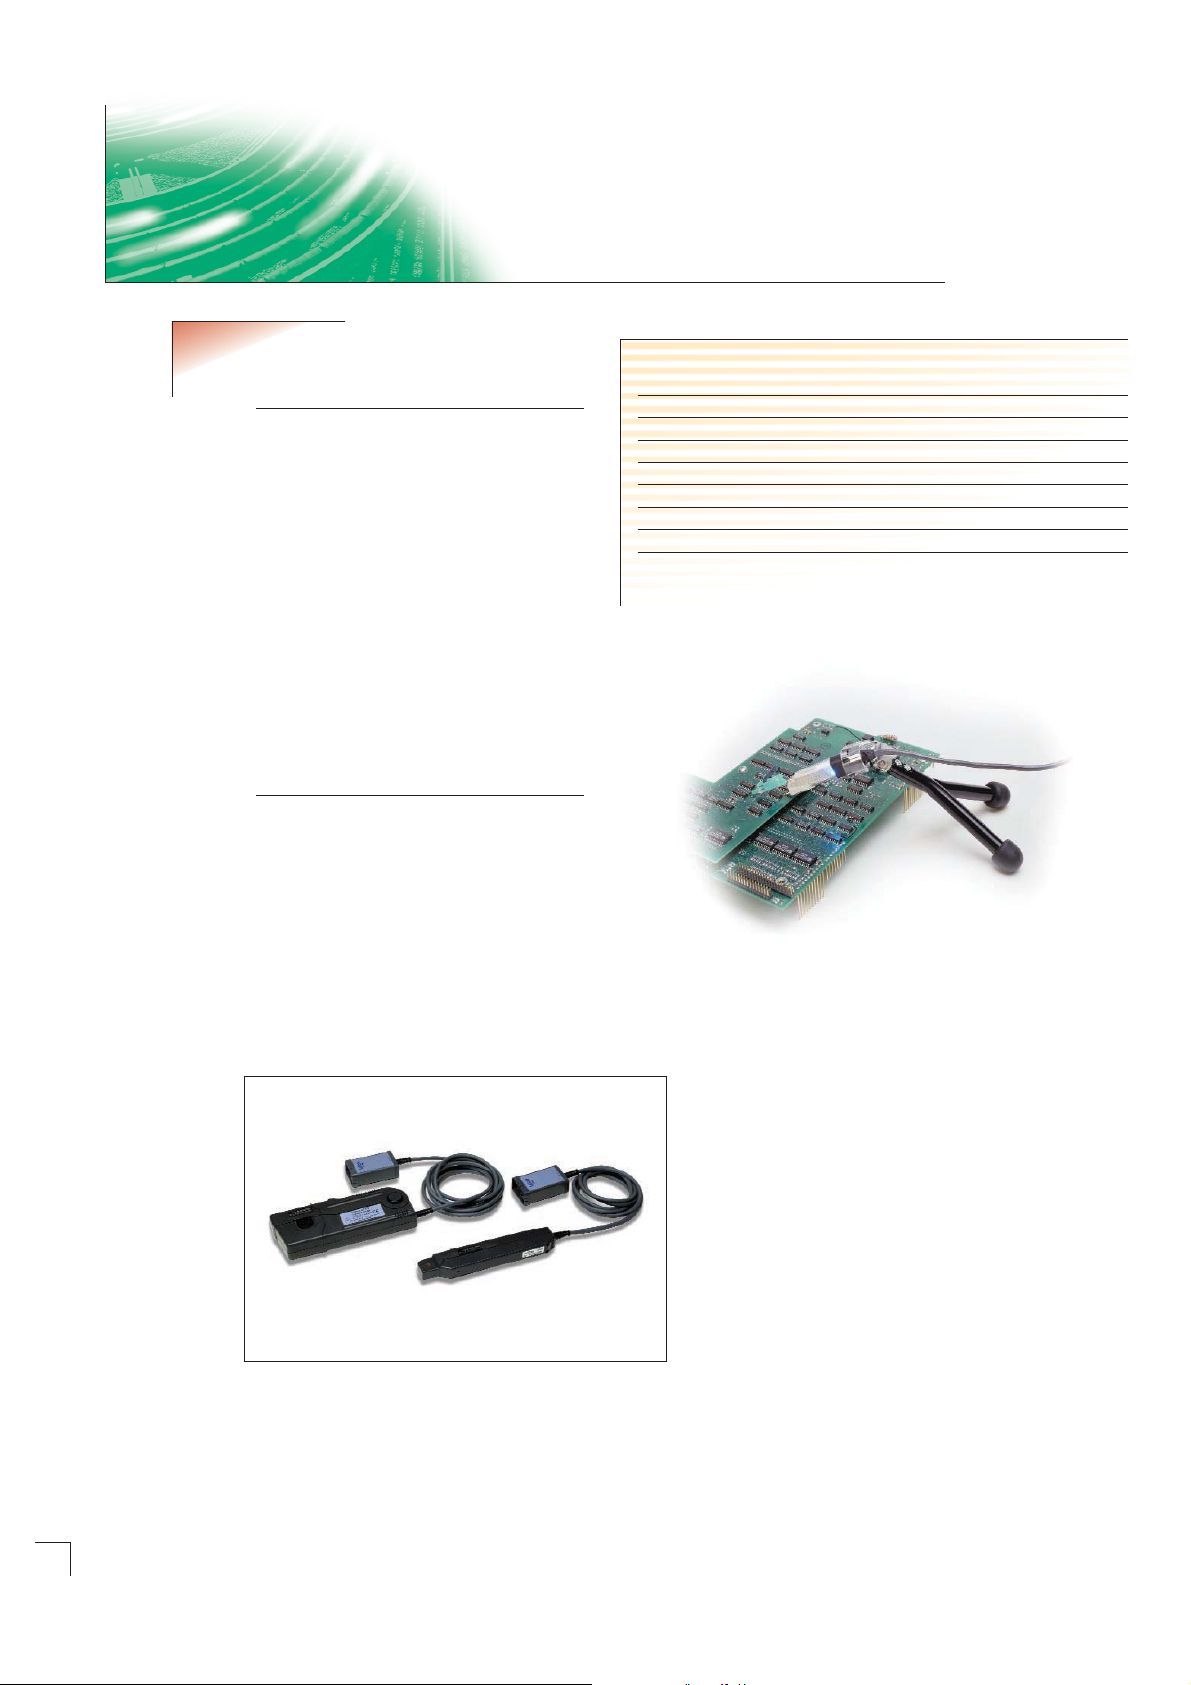
The new current probes,CP150 and CP015.
Current Probes
CP150 and CP015 are high-performance current
probes capable of measuring 150 amp and 15 amp
current signals. They incorporate Hall effect and
transformer technology to measure both DC and AC
currents. LeCroy also offers the best differential
amplifiers available on the market, the DA1800 series.
Other useful accessories for the Waverunner-2 series
are low-cost active differential probes, high voltage
probes, an internal graphics printer and a choice of
two scope carts.
Page 6

Signal Measurements and Analysis
Standard in all models
Press Wavepilot and select the Parameter
Dashboard and view up to 26 automatic meas-
urements that update with your waveform —
in real-time, on screen. Select Graph and view
an FFT of a signal—up to 50 kpoints. Process
signals with Math Tools including averaging to
1,000 sweeps to reduce noise or use enhanced
resolution for up to 11 bits of vertical resolution.
Chain up to 4 math functions and display the
final waveform or any of the intermediate steps.
Extended Math and Measurements
(EMM)
The EMM option provides basic graphical signal
analysis tools including Histograms (200 events)
and Trending of parameters (expanded to over
40). Additional
Math Tools include signal
integration and differentiation.
WaveAnalyzer with JTA (JTWA)
The WaveAnalyzer JTA option is the ultimate
tool for characterization and troubleshooting in
time, frequency,and statistical domains.
It includes:
• WaveAnalyzer Signal Analysis (WAVA)
• Jitter and Timing Analysis (JTA)
WaveAnalyzer Signal Analysis (WAVA)
Waveform averaging capability increases to one
million acquisitions.The FFT spectrum analysis
expands to process all acquired data up to
8 Mpts and provides additional spectral views.
Histograms (up to 2 billion events) and Trends
let you view and measure statistical variations
of signal parameters.
Jitter and Timing Analysis (JTA)
JTA has broad applications in measuring and
analyzing digital electronics or mechanically
related signals. Measure a wide variety of timing
parameters: cycle-to-cycle,period, frequency,
time interval and width. Use JitterTrack to plot
the parameter variation vs. time.
Digital Filter Package (DFP)
The DFP option implements a set of linearphase Finite Impulse Response (FIR) filters.
The package enhances your ability to examine
important signal components by filtering out
undesired spectral components such as noise.
The new Wavepilot button and the Analysis
Control Area provide quick access to a comprehensive, easy-to-use set of signal analysis tools
that help you solve problems fast. Optional
packages expand the Waverunner-2 scope to a
complete signal analyzer.
Filters include:
Up to 4 filters can be cascaded
Low Pass
High Pass
Band Pass
Band Stop
Raised Cosine
Raised Root Cosine
Gaussian
Custom
Input signal
Design your own filters with DFP
5
FFT of input signal
Amplitude
FFT of filtered signal
Band
Stop
Filter
Frequency
Page 7

JitterTrack clearly
shows timing variation as it tracks the
signal cycle by cycle.
World Class Power
Measurement
Solutions
With LeCroy
PowerMeasure Systems,
you can analyze power
devices' performance
while they are operating in
circuit.The PowerMeasure
System combines the
required current and differential voltage measuring capability with unequalled DSO triggering, long record capture, and waveform math to
make these difficult measurements as simple as
the push of a very few buttons.
Jitter & Timing Analysis (JTA)
This analysis package provides a comprehensive set of precise timing measurements for
clock, clock-to-data, and datastream analysis.
TrackView shows deviations directly synchronized to the signal — patterns you would
never see without this view. Press the
Wavepilot button for easy access, and zoom in
on both the “where”and the “why” of the
problem; you can see it and fix it! Quickly gain
insight into the source of timing and signal
integrity problems.
Telecom Mask Test
Packages
MT series Mask Testing
options for electrical
communications signals are available with
Waverunner-2 scopes. Mask Testing compares a
trace against a mask template to check if it falls
inside or outside the mask boundaries. Several
actions may be initiated if the trace fails the
test, including “stop”, “output a pulse”, and
“datalog”.
With the exclusive Finder Function, pulses,patterns or even random bit streams are easily isolated. MT packages take
control of the Waverunner
scope, displaying only relevant test menus.
PolyMask
PolyMask is a powerful,
general-purpose testing
application that lets you
view and test against
complex masks. PolyMask
locates and clearly depicts signal failures. In
pass/fail testing, failures are highlighted with
colored circles. Creating masks is greatly simplified with the MaskMaker utility, a simple
program that runs on any PC with Windows.
Masks can be used in either normal or X-Y
display mode (useful for applications such as
power measurement.)
Mask Testing and extinction
ratio measurements of a
156 Megabit/s coaxial (STM1-E)
Current,voltage, instantaneous
power and energy dissipation
measurements.
Here are four solution packages from LeCroy targeted
to your specific test applications.You’ll find that
these packages will bring precise measurements and
fast analysis to your workflow.
An Ethernet 100 Base-T
mask created with the
MaskMaker utility.
Powerful Applications
6
Page 8

Windows Software to Enhance
Your Productivity
ScopeExplorer and ActiveDSO are Windows (95,
98, 2000, or NT) PC-based connectivity tools
that make it easy to interface your
Waverunner-2 scope with a PC via Ethernet,
RS-232-C, or GPIB. It’s easy to integrate scope
data with Windows applications,as well as to
control the
Waverunner-2 scope from your PC.
ScopeExplorer
Annotate and print screen shots, drag and
drop files, save and load scope setup panels,
and run CustomDSO applications. Click on
the print icon to send the file to the printer of
your choice.
Access files on storage media, including
PC-Cards, hard drives,
and diskettes inserted
in a
Waverunner-2
scope.
ActiveDSO
™
ActiveDSO is a LeCroy
software utility for
ActiveX control of
LeCroy digital scopes.
Exchange
Waverunner-2 scope data with applications that support the ActiveX standard.
Many applications (such as Excel, PowerPoint,
Internet Explorer,Visual Basic,Visual C++ and
Labview) allow users to incorporate ActiveX
controls.
MaskMaker and DSO Filter
These easy-to-use Windows-based graphic
utilities let you create and edit test masks
and digital filters for use on
Waverunner-2
scopes. Use MaskMaker with the PolyMask
tolerance mask-testing option.You can even
create X-Y masks.
With the DSO-Filter PC utility and DFP (Digital
Filter Package), you can specify a set of filter
coefficients in an Excel spreadsheet and load
them directly into the oscilloscope.
All it takes is a PC with
Windows and a GPIB,
RS-232-C, or the
Ethernet option.
Windows Connectivity
ScopeExplorer provides access
to the scope’s storage media to
view,edit, save,load, and run
scope setup and CustomDSO
applications.
ScopeExplorer interactive front
panel with familiar Windows
PC operation.
Connect your scope to Windows-based
ScopeExplorer using the Ethernet (option),
GPIB or RS-232 interfaces. Click and drag
files, or operate from the virtual front panel.
Update your software via the web.
7
Page 9

Vertical System LT584/M/L LT374 / M / L LT372 LT354/M/ML LT264/M LT262
Input Channels 4 42442
Analog Bandwidth @ 50 Ω (-3 dB) 1 GHz 500 MHz 500 MHz 500 MHz 350 MHz 350 MHz
Hardware Bandwidth Limits 20 MHz or 200 MHz
Input Impedance 50 Ω ± 1%; 1 MΩ /12 pF typical (using PP006A probe)
Input Coupling 1 MΩ: AC, DC, GND; 50 Ω: DC, GND
Maximum Input 250 Vmax 50 Ω: 5 Vrms; 1 MΩ: 400 Vmax (peak AC ≤ 5 kHz + DC)
Vertical Resolution 8 bits; up to 11 bits with enhanced resolution (ERES)
Sensitivity (50 Ω or 1 MΩ) 2 mV – 5 V/div * 2 mV – 10 V/div fully variable
DC Gain Accuracy ± (1.5% + 0.5% of full scale)
Offset Accuracy (50 Ω or 1 MΩ) ± (1.5% + 0.5% of full scale + 1 mV)
Offset Range 1 V – 5 V/div: ±100 V 2 mV – 99 mV/div: ±1 V
100 mV – 99 V/div: ±10 V
1 V – 10 V/div: ±100 V
Isolation — Channel to Channel >250:1 at <= 500MHz ; >100:1 at 1 GHz
Timebase System
Timebases Main and up to four independent zoom traces simultaneously
Ranges 500 ps/div – 1000 s/div 1 ns/div – 1000 s/div
Clock Accuracy ≤10 ppm
Interpolator Resolution 5 ps
External Clock Frequency 500 MHz maximum, 50 Ω, or 1 MΩ impedance
Roll Mode – Operating Range time/div 500 ms – 1000 s/div or sample rate <100 kS/s max
External Timebase Clock 500 MHz maximum external sample clock input on front panel EXT BNC
Acquisition System
Single Shot Sample Rate
1 Channel Max. 4 GS/s 4 GS/s 4 GS/s — 1 GS/s 1 GS/s
2 Channels Max. 4 GS/s 4 GS/s 2 GS/s — 1 GS/s 1 GS/s
3 – 4 Channels Max. 2 GS/s 2 GS/s NA 1 GS/s 1 GS/s NA
Maximum Acquisition Points/Ch
1 Channel Max. 500k / 2M / 8M 500k / 2M / 8M 500k — 100k / 1 M 100k
2 Channels Max. 500k / 2M / 8M 500k / 2M / 8M 250k — 100k / 1 M 100k
3 – 4 Channels Max. 250k / 1M / 4M 250k / 1M / 4M NA 250k / 1M / 2M 100k / 1 M NA
Acquisition Modes
Random Interleaved Sampling (RIS) 50 GS/s for repetitive signals: 500 ps/div – 1 µs/div
Single Shot For transient and repetitive signals: 1 ns/div – 1000 s/div
Sequence
LT262/264 2 – 400 segments
LT354/372/374 2 – 1 000 segments
LT584 2 – 1 000 segments
Memory Option M, ML, or L 2 - 4 000 segments
Intersegment Time 50 µsec max.
Acquisition Processing
Averaging Summed averaging to 103sweeps; continuous averaging with weighting range from 1:1 to 1:1023 (standard).
Summed averaging up to 106sweeps (optional with WAVA)
Enhanced Resolution (ERES) From 8.5 to 11 bits vertical resolution
Envelope (Extrema) Envelope, floor, roof for up to 106sweep
* 50 Ω: 2 mV – 1V/div ; 1 MΩ: 2 mV - 5 V/div fully variable
Waverunner-2 Oscilloscopes
Specifications
8
Page 10

Triggering System
Modes Normal, Auto, Single,and Stop
Sources Any input channel, external, Ext/10 or line; slope, level, and coupling unique to each source (except line trigger)
Inactive channels usable as trigger inputs.
Slope Positive, Negative, Window
Coupling modes DC, AC, HFREJ, LFREJ
AC Cutoff Frequency 7.5 Hz Typical
HFREJ, LFREJ 50 kHz typical
Pre-trigger delay 0 – 100% of horizontal time scale
Post-trigger delay 0 – 10 000 divisions
Hold off by time or events Up to 20s or from 1 to 99 999 999 events
Internal trigger range ±5 div
Max trigger frequency 1 GHz ( LT584 ),500 MHz ( LT354, LT374, LT372 ), 350 MHz ( LT264, LT262 )
External trigger input range ±0.5 ( ±5 V with Ext/10 selected )
Maximum ext. input @ 50 Ω ±5 V DC or 5 Vrms
Maximum ext. input @ 1 MΩ 400 Vmax ( DC + peak AC < 5 kHz ) ( 250 Vmax on LT584 )
Automatic Setup
Auto Setup Automatically sets timebase, trigger, and sensitivity to display a wide range of repetitive signals
Vertical Find Automatically sets the vertical sensitivity and offset for the selected channels to display a waveform with maximum dynamic range
Probes
Model PP006A 10:1, 10 MΩ with auto-detect (one per channel)
Probe System: ProBus Automatically detects and supports a wide variety of differential amplifiers; active, high-voltage, current, and differential probes
Scale Factors Up to 12 automatically or manually selected
Color Waveform Display
Type VGA color 8.4" flat-panel TFT-LCD
Resolution VGA 640 x 480 pixels
Screen Saver Display blanks after 10 minutes (when screen saver is “on”)
Real Time Clock Date, hours, minutes, and seconds displayed with waveform
Number of Traces Display a maximum of eight traces.Simultaneously display channel, zoom, memory, and math traces.
Grid Styles Single, Dual, Quad, Octal, XY, Single + XY, Dual + XY; Full Screen gives enlarged view of each style.
Intensity Controls Separate intensity control for grids and waveforms
Waveform Styles Sample dots joined or dots only — regular or bold sample point highlighting
Trace Overlap Display Select opaque or transparent mode with automatic waveform overlap management.
Analog Persistence Display
Analog & Color-Graded Persistence Variable saturation levels; stores each trace’s persistence data in memory
Trace Selection Activate Analog Persistence on a selected trace, top 2 traces, or all traces
Persistence Aging Time Select from 500 ms to infinite
Trace Display Opaque or transparent overlap
Sweeps Displayed All accumulated or all accumulated with last trace highlighted
Zoom Expansion Traces
Display up to Four Zoom Traces
Vertical Zoom Up to 5X expansion, 50X with averaging
Horizontal Zoom Expand to 2 pts/div, magnify to 50 000X
Auto Scroll Automatically scan and display any zoom or math trace.
Rapid Signal Processing
Processor Power PC
Processing Memory Up to 128 Mbytes
Real Time Clock Dates, hours, minutes, seconds, and time stamp trigger time to 1 ns resolution
9
Page 11

Waverunner-2 Oscilloscopes
Specifications, Continued
10
Internal Waveform Memory
Waveform M1, M2,M3, M4 (Store full-length waveforms with 16 bits/data point)
Zoom and Math Four traces A, B, C, D with chained trace capability
Setup Storage
Front Panel and Instrument Status Four non-volatile memories and floppy drive are standard. Hard drive and memory card are optional.
Interface
Remote Control Full control of all front panel controls and internal functions via RS-232-C, GPIB, or Ethernet (optional)
RS-232-C Asynchronous transfer rate of up to 115.2 kbaud
GPIB Port Full control via IEEE – 4888.2; configurable as talker/listener for computer control and data transfer
Ethernet (optional) 10 Base-T Ethernet interface
Floppy Drive Internal, DOS-format, 3.5" high-density
PC Card Slot (optional) Supports memory and hard drive cards
External Monitor Port Standard 15-pin D-Type VGA-compatible
Centronics Port Parallel printer interface
Internal Graphics Printer (optional) Provides hard copy output in <10 seconds
Outputs
Calibrator Signal 500 Hz – 1 MHz square wave or DC level; Select from -1.0 to +1.0 into 1 MΩ, output on front panel test point and ground lug.
Control Signals Rear Panel, TTL level, BNC output; Choice of trigger ready, trigger out, pass/fail status. (output resistance 300 Ω ± 10%)
Environmental and Safety
Operating Conditions
Temperature 5 – 40 °C rated accuracy
0 – 45 °C operating
-20 – 60 °C non-operating
Humidity 80% max RH, non-condensing up to 35 °C; Derates to 50% max RH, non-condensing at 45 °C
Altitude 4 500 m ( 15 000 ft ) max. up to 25 ˚C; Derates to 2 000 m ( 6 600 ft ) at 45 °C
CE Approved
EMC EMC Directive 89/336/EEC; EN 61326-1 Emissions and Immunity
Safety Low Voltage Directive 73/23/EEC; EN 61010-1 Product Safety (Installation Category II, Pollution Degree 2, Protection Class 1)
UL and cUL approved UL Standard UL 3111-1
cUL Standard CSA C22.2 No. 1010-1
General
Auto Calibration Ensures specified DC and timing accuracy is maintained for 1 year minimum
Auto Calibration time < 500 ms
Power Requirements 90 – 132 VAC at 45 - 440 Hz
180 - 250 VAC at 45 - 66 Hz
Automatic AC voltage selection
Power Consumption: 150 – 250 VA depending on model
Battery Backup Front panel settings retained for two years minimum
Warranty and Calibration Three years; calibration recommended yearly
Physical Dimensions
Dimensions (HWD) 210 mm x 350 mm x 300 mm; 8.3" x 13.8" x 11.8" (height excludes feet)
Weight 18 lbs (8 kg)
Shipping Weight 27 lbs (12 kg)
Page 12

Math Tools (Standard)
Simultaneously perform up to four math (signal) processing functions; traces can be
chained together to perform math on math.
Measure Tools (Standard)
Automated Measurements: Display any five parameters together with their average,
high, low, and standard deviations.
Pass/Fail
Test any five parameters against selectable thresholds. Limit testing is performed
using masks created on the scope or PC. Set up a pass or fail condition to initiate
actions such as hard copy output, saving waveform to memory, GPIB SRQ, or pulse
out.
Options
Extended Math and Measurement: Adds math and advanced measurements for all
general purpose applications. Includes all standard math and measurement tools, plus
the following tools:
Extended Math Tools
Extended Measure Tools
WaveAnalyzer
Includes the Extended Math and Measure Tools as well as expanded capabilities for
performing FFTs, averaging, histograms, and histogram parameters.
WaveAnalyzer Tools (Standard)
Histogram up to 2 billion events. Analyze with 18 histogram parameters
Summed averaging to 1 million sweeps
WaveAnalyzer FFT capability expands the basic FFT to include:
FFT power averaging
FFT power density, real, and imaginary
FFT on all acquisition points
With WaveAnalyzer FFT you get maximum resolution at wide frequency spans.
Other Application Solutions
Jitter and Timing Analysis (JTA)
Digital Filter Package (DFP)
PowerMeasure Analysis (PMA1)
Communications Mask Testing (MT01/MT02)
Polymask Mask Testing (PMSK)
Advanced Optical Recording Measurements (AORM) for LT37X, 35X and 58X scopes
Disk Drive Measurements (DDM)
PRML Analysis (PRML)
Free Software Utilities
ScopeExplorer: Easy to use utility that provides a simple but powerful way to
control your scope remotely over RS-232-C, GPIB, or Ethernet.
ActiveDSO: ActiveX controls for flexible windows applications programming
with remote control.
MaskMaker: Create a tolerance test mask offline with this graphic tool.
DSO Filter: Specify a set of filter coefficients and load them into the scope.
cycle median
cycle std. deviation
∆ time @ level; % and volts
∆ time @ level from trigger
∆ time from clock to data + (setup time)
∆ time from clock to data - (hold time)
fall @ level; % and volts
first point
last point
number of points
median
rise @ level; % and volts
std. deviation
duration
absolute value
differentiate
exp (base e)
exp (base 10)
log (base e)
log (base(10)
integrate
square
square root
trend (datalog)
Histogram (200 events)
Cursor Measurements
Type Symbol From To
Relative time First point on Any other point
waveform on waveform
Relative voltage Select voltage level Any other voltage level
Absolute time Time and voltage Ground and trigger
relative
Absolute voltage Voltage Ground
➔
➔
amplitude fall 90-10% period
area fall 80-20% phase
base frequency rise 10-90%
cycle mean maximum rise 20-80%
cycle rms mean rms
cycles minimum sdev
delay +overshoot top
∆ delay –overshoot width
duty cycle peak-to-peak xamn
xamx
average (sum to 4 000 sweeps) product
average (continuous weighted) ratio
difference reciprocal (invert)
enhanced resolution (to 11 bits) resample (deskew)
envelope rescale (with units)
FFT of 50 kpoint waveforms roof
floor sin x/x
identity sum
negate
11
Page 13

Basic Triggers
Edge/Slope/Window/Line Triggers when signal meets slope and level condition
SMART Triggers
State or Edge Qualified Triggers on any input source only if a defined state or edge occurred on another input source. Delay between sources is selectable
by time or events.
Dropout Triggers if signal drops out for longer than selected time between 25 ns and 20 s.
Pattern Logic combination of 5 inputs ( 3 on two-channel models ); Each source can be high, low, or don’t care. Trigger entering or exiting
the pattern
TV-Video Triggers selectable fields ( 1, 2, 4, or 8 ) for NTSC, PAL SECAM, or nonstandard video ( up to 1500 lines )
SMART Triggers with Exclusion Technology
Signal or Pattern Width Triggers on glitches or on pulse widths selectable from <2.5 ns to 20 s or on intermittent faults.
Signal or Pattern Interval Triggers on intervals selectable between 10 ns and 20 s.
Slew Rate* Trigger on edge rates; select limits for dV, dt, and slope. Select edge limits between 2.5 ns and 20 s.
Runt* Positive or negative runts defined by two voltage limits and two time limits. Select between 2.5 ns and 20 ns.
Hard Copy
Print Screen is activated by a front-panel button or remote control. Store screen image files or print to external printers including
network printers and directories. Network printing and file access requires the LAN10BT Ethernet option.
Supported Printers
B/W LaserJet, DeskJet, Epson
An optional, internal high-resolution graphics printer is also available for screen dumps; stripchart output formats capable of up to
200 cm/div.
Color DeskJet 550C, Epson Stylus,Canon 200/600/800 series, HP7470 and HP7550
Hard copy Formats TIFF b/w,TIFF color, BMP color, BMP compressed, and HPGL
Waveform Output
Store Waveforms to floppy disk or optional PC-Card Hard Drives and memory cards.
Save any trace you choose and select Auto-Store to automatically store the waveform after each trigger.
Output Formats The ASCII waveform output is compatible with spreadsheets, MATLAB, Mathcad, etc. Binary output is also available for reduced file size.
Documentation
Included with Waverunner-2
Oscilloscopes:
Operators Manual — hard copy
Remote Programming Manual — hard copy
CD-ROM — PDF formatted manuals plus software utilities including ScopeExplorer, ActiveDSO, MaskMaker,
DSO-Filter, and DSONet Print Gateway
* optional Advanced Trigger Package
Waverunner-2 Oscilloscopes
Specifications, Continued
12
Page 14

Ordering Information
Waverunner-2 Digital Oscilloscopes Product Code
1 GHz, 2 GS/s, 250 kpts/ch, 4 Channel Color LT584
500 MHz, 2 GS/s, 250 kpts/ch, 4 Channel Color LT374
500 MHz, 2 GS/s, 250 kpts/ch, 2 Channel Color LT372
500 MHz, 1 GS/s, 250 kpts/ch, 4 Channel Color LT354
350 MHz, 1 GS/s, 100 kpts/ch, 4 Channel Color LT264
350 MHz, 1 GS/s, 100 kpts/ch, 2 Channel Color LT262
Included with Standard Configuration
10:1 10 MΩ Passive Probe (1 per channel) PP006A
Operator’s Manual, Quick Reference Guide, CD-ROM WR2-OMCD-E
with OM/RCM PDF manuals, and utility software
Operator’s Manual WR2-OM-E
Remote Control Manual WR2-RCM-E
Floppy Disk Drive
GPIB, RS-232-C, Centronics Parallel Port, VGA Video Output Port
Protective Front Cover
Performance Certificate
Three-Year Warranty
Memory Options LT264 LT354 LT374 LT584
M: 1 Mpts/ch ••••
ML: 2 Mpts/ch N/A • N/A N/A
L: 4 Mpts/ch N/A N/A ••
Hardware Options
Internal Graphics Printer GP02
10 Base-T Ethernet LAN option LAN10BT
PC Card Slot PCSLOT
PC Card Slot including 1 hard drive card and 1 memory card PCMEDIA
Software Options
Wave Analyzer Analysis Package WAVA
Jitter Analysis and Wave Analyzer JTWA
Extended Math and Measurement Package EMM
ITU G.703 Fully Automated Mask Tester* MT01
ANSI T1.102 Fully Automated Mask Tester* MT02
Jitter and Timing Analysis Package JTA
Digital Filter Package DFP
Surface Map Analysis Package SMAP
Disk Drive Measurements DDM
Supplementary Disk Drive Measurements PRML
Advanced Optical Recording Measurements** AORM
Power Measure Analysis Software PMA1
Advanced Trigger Package ATP
PolyMask Mask Testing Software PMSK
Selected Accessories
1.5 GHz Active Probe HFP 1500
1 GHz Active Probe HFP 1000
Differential Probe ADP300 series
Current Probe CP and AP series
Differential Amplifiers DA1800 series
50Ω to 75Ω Adapter PP090
Oscilloscope Carts OC1021, OC1024
Graphic Printer Paper/10 Rolls GPR10
Service and Extended Warranties
US NIST Standard Calibration CCNIST
US Military Standard Calibration CCMIL
Swiss OFMET Standard Calibration CCOFMET
Five-Year Warranty at time of scope purchase W5
Five-Year Warranty and NIST Calibration at time of scope purchase T5
13
* Test Masks available are dependent
upon oscilloscope bandwidth.
** option only for LT37X,LT35X and
LT58X series
Page 15

DC WRUNNER-2 Rev1
MTECH 15K 10/01
Sales and Service Throughout the World
Corporate Headquarters
700 Chestnut Ridge Road
Chestnut Ridge, NY 10977
USA
http://www.lecroy.com
LeCroy Sales Offices:
Copyright October 2001
LeCroy,SMART Trigger and ProBus are registered trademarks of LeCroy Corporation.All rights reser ved. Waverunner,JitterTrack, Analog Persistence and
Active DSO are trademarks of LeCroy Corporation. Other product or brand names are trademarks or requested trademarks of their respective holders.
Information in this publication supersedes all earlier versions. Specifications subject to change without notice.
Asia: Hong Kong
Phone (852) 2834 5630
Fax (852) 2834 9893
Austria: Markersdorf
Phone (43) 2749 30050
Fax (43) 2749 30051
Benelux: The Netherlands
Phone (31) 40 211 6998
Fax (31) 40 211 6999
France: Les Ulis
Phone (33) 1 69 18 83 20
Fax (33) 1 69 07 40 42
Germany: Heidelberg
Phone (49) 6221 827 00
Fax (49) 6221 834 655
Italy: Venice
Phone (39) 041 456 97 00
Fax (39) 041 456 95 42
Japan: Osaka
Phone (81) 6 6396 0961
Fax (81) 6 6396 0962
Japan: Tokyo
Phone (81) 3 3376 9400
Fax (81) 3 3376 9587
Japan: Tsukuba
Phone (81) 298 56 0961
Fax (81) 298 56 0962
Korea: Seoul
Phone (82) 2 3452 0400
Fax (82) 2 3452 0490
Spain: Madrid
Phone: (34) 91 640 11 34
Fax: (34) 91 640 06 40
Switzerland: Geneva
Phone (41) 22 719 2111
Fax (41) 22 719 2230
U.K.: Abingdon
Phone (44) 1 235 536 973
Fax (44) 1 235 528 796
U.S.A.: Chestnut Ridge
Phone (1) 845 578 6020
Fax (1) 845 578 5985
 Loading...