

Page 1

WAAVVEERRUU
W
OOPPEERRAATTOORR’’SS M
J
AANNUUAARRYY
J
N
NEERR--22
N
N
MAA
22000022
NUUAALL
N
Page 2

LeCroy Corporation
700 Chestnut Ridge Road
Chestnut Ridge, NY 10977-6499
Tel: (845) 578-6020, Fax: (845) 578-5985
Internet: General Information: http://www.lecroy.com
Software Utilities: http://www.lecroy.com/software
© 2002 by LeCroy Corporation. All rights reserved. Information in this publication supersedes all earlier
versions. Specifications subject to change.
LeCroy, ProBus and SMART Trigger are registered trademarks, and ActiveDSO, ScopeExplor er,
WaveAnalyzer and Waverunner are trademarks, of LeCroy Corporation. Centronics is a registered
trademark of Data Computer Corp. Epson is a registered trademark of Epson America Inc. Mathcad is a
registered trademark of MATHSOFT Inc. MATLAB is a registered trademark of The MathWorks, Inc.
Microsoft, MS and Microsoft Access are registered trademarks, and Windows and NT trademarks, of
Microsoft Corporation. PowerPC is a registered trademark of IBM Microelectronics. DeskJet, ThinkJet,
QuietJet, LaserJet, PaintJet, HP 7470 and HP 7550 are registered trademarks of Hewlett-Packard
Company.
Manufactured under an ISO 9000
Registered Quality Management System
Visit
www.lecroy.com to view the
certificate.
This electronic product is subject to
disposal and recycling regulations
that vary by country and region.
Many countries prohibit the
disposal of waste electronic
equipment in standard waste
receptacles.
For more information about proper
disposal and recycling of your
LeCroy product, please visit
www.lecroy.com/recycle.
WR2-OM-E Rev C
Page 3

T ABLE OF C ONTENTS
INTRODUCTION
Waver un ner-2Features… ................................................................................................................ 1
W A VE PILOT MENU ..............................................................................................................................................1
QUICK ZOOM.........................................................................................................................................................4
W A VE PILOT MENU GRAPH BUTTON .........................................................................................................5
WaveformHistory…........................................................................................................................8
DISPLAY SIGNAL CHANGES OVER TIME .................................................................................................8
About This Manual.........................................................................................................................12
FIRST T H INGS
WhenYourWaver un ner-2isDelivered….......................................................................................15
CHECK THAT YOU HAVE E VERYTHING................................................................................................15
BE SURE TO READ THIS WARRANTY.......................................................................................................15
TAKE ADVANTAGE OF MAINTENANCE AGREE ME NTS ................................................................16
OBTAIN ASSISTANCE .......................................................................................................................................16
RETURN A PRODUCT FOR SE RVICE OR REPAIR ................................................................................16
STAY UP-TO-DATE .............................................................................................................................................16
Install a tionforSaf eand Efficient Op e ratio n
SAFETY SYMBOLS ..............................................................................................................................................18
OPERATE IN A SAFE ENVIRONME NT .....................................................................................................19
AC POWER SOURCE...........................................................................................................................................20
POWE R AND GROUND CONNECTIONS.................................................................................................20
ON/ STANDBY SWITCH....................................................................................................................................20
POWE R OFF STATE ............................................................................................................................................20
CALIBRATION ......................................................................................................................................................21
CL EANING.............................................................................................................................................................21
ABNORMAL CONDITIONS.............................................................................................................................21
Upan dRunning............................................................................................................................ 22
GET TO KNOW YOUR W A VE RUNNER-2 – FRONT PANE L ..............................................................22
INSTALL AND POWER UP...............................................................................................................................22
GET TO KNOW YOUR W A VE RUNNER-2 – BACK PANEL .................................................................23
INITIAL IZE ............................................................................................................................................................25
CHECK YOUR WAVERUNNER-2 SYSTEM ................................................................................................25
ADD AN OPTION................................................................................................................................................26
UPDATE TO THE L ATEST FIRMWARE ......................................................................................................26
SAVE THE SCREEN (AND ENE RGY)..........................................................................................................26
DO YOU PREFE R YOUR CONTROLS WITH SOUND AND AUTO-REPE AT?.............................27
........................................................................................................1
..........................................................................................................15
.....................................................................18
WR2-OM-E RevC ISSUED: January2002 iii
Page 4

T ABLE OF C ONTENTS
PPAARRTTOONNEE::GGEETTTTIINNGGSSTTAARRTTEED
CHAPTER ONE:
ViewY ourWaveform......................................................................................................................31
USE TIME/ DIV TO ADJUST THE TIMEBASE .........................................................................................33
ADJUST SENSITIVITY AND POSITION.....................................................................................................34
ZOOM AND SCROLL AUTOMATICALLY ................................................................................................. 34
USE THE POSITION AND ZOOM CONTROLS ......................................................................................36
SET UP THE TIMEBASE ...................................................................................................................................37
SET THE COUPL ING .........................................................................................................................................38
SET UP FOR CAL AND BNC SIGNAL S.......................................................................................................39
CHAPTER TWO:
Edge Tri gge ro nSimple Signals.....................................................................................................43
CONTROL TRIGGERING ................................................................................................................................43
SET UP AN EDGE TRIGGER .........................................................................................................................44
USE WINDOW TRIGGER................................................................................................................................. 47
TRIGGER SOURCE .............................................................................................................................................48
OBTAIN A TRIGGER STATUS SUMMARY ................................................................................................49
CHAPTER THREE:
DisplayPer siste nce........................................................................................................................51
VIE W SIGNAL CHANGES OVER TIME .....................................................................................................51
SET UP YOUR DISPL AY....................................................................................................................................52
SET UP FOR PERSISTENCE ............................................................................................................................53
SET UP FOR PERSISTENCE AND HISTORY USING ANALOG PERSIST BUTTON .................54
SET UP FOR HISTORY...................................................................................................................................... 56
CHOOSE A GRID STYL E .................................................................................................................................58
Save and RecallYourPanelSet ups.................................................................................................60
SAVE PANEL SE TUPS ........................................................................................................................................60
RECALL PANEL SETUPS..................................................................................................................................61
CATCH A NEW WAVE
SIMPLY T RIGGER
..................................................................... 4 2
DISPLAY YOUR SIGNAL
............................................................... 3 0
D.............................29
...................................................... 5 0
CH APTER FO UR:
Cursors: To olsforMeasuring Signa lVal ues...................................................................................63
CURSORS AND PERSISTENCE...................................................................................................................... 63
CURSORS IN XY DISPLAY...............................................................................................................................64
W A VE PILOT........................................................................................................................................................... 65
Me a sure w ithCursors....................................................................................................................67
CONTROL THE TIME CURSORS ..................................................................................................................67
CONTROL THE AMPLITUDE CURSORS...................................................................................................68
Me a sure Auto matically withParam eters........................................................................................72
CHOOSE A STANDARD PARAMETER ....................................................................................................... 73
TURN OFF CURSORS AND PARAMETERS...............................................................................................74
CHOOSE A M EASURE T OOL
................................................ 6 2
iv ISSUED: January2002 WR2-OM-E Rev C
Page 5

Waver unn er -2
CH APTER FI V E:
Make MathEasy............................................................................................................................ 77
SET UP TO DO WA VE FORM MATHEMATICS .........................................................................................78
USE A MATH TOOL ............................................................................................................................................79
PE RFORM AN FFT OPERATION ..................................................................................................................80
DO SUMMED AVERAGING ............................................................................................................................83
Save and RecallWavefo rms ........................................................................................................... 8 5
OBTAIN A WA VEFORM OR MEMORY STATUS REPORT...................................................................87
CHAPTER SIX:
Make a Hard Copy......................................................................................................................... 89
PRINT, PLOT, OR COPY....................................................................................................................................90
Manage Fl oppyorCard Fil es.........................................................................................................91
CUSTOMIZE FILE NAMES ..............................................................................................................................92
ADD A NE W DIRE CTORY...............................................................................................................................93
COPY FILES ...........................................................................................................................................................94
PPAARRTTTTWWOO::LLOOOOKKIINNGGDDEEEEPPEER
CHAPTER SEVEN:
Choo se a Sampli ng Mode.............................................................................................................101
SINGLE-SHOT – W AVERUN NER-2’S BASIC CAPTURE TECHNIQUE .........................................101
RIS – FOR HIGHER SAMPL E RATES .........................................................................................................102
ROLL – DISPLAY IN REAL-TIME ................................................................................................................102
SEQUENCE – WORKING WITH SE GMENTS ........................................................................................103
PAIRING CHANNEL S ......................................................................................................................................104
Usea Sampling Mode...................................................................................................................105
SET UP FOR SINGLE -SHOT OR RIS ..........................................................................................................105
SET UP FOR SEQUENCE CAPTURE ..........................................................................................................106
OBTAIN A SE QUE NCE STATUS SUMMARY...........................................................................................107
OR SAMPL E EXTERNALLY...........................................................................................................................108
USE M ATH TOOLS
....................................................................76
DOCUMEN T YOURWORK
A QUESTION OF T IMEBASE
.........................................................88
R.............................. 9 9
............................................. 100
CHAPTER EIGHT:
Ho ld Off byTimeorEvents........................................................................................................ 111
HOLD OFF BY TIME........................................................................................................................................111
HOLD OFF BY E VE NTS .................................................................................................................................112
TriggerSMART ............................................................................................................................113
CATCH A GLITCH.............................................................................................................................................113
CAPTURE RARE PHENOMENA ..................................................................................................................117
TRIGGER ON INTERVALS ............................................................................................................................120
QUALIFY A SIGNAL .........................................................................................................................................124
TRIGGER ON L OST SIGNALS .....................................................................................................................127
TRIGGER ON TV SIGNAL S...........................................................................................................................130
WR2-OM-E RevC ISSUED: January2002 v
TRI GGER SMART
..................................................................110
Page 6

T ABLE OF C ONTENTS
PATTERN TRIGGER ........................................................................................................................................132
RUNT TRIGGER ................................................................................................................................................135
SL EW RATE TRIGGER ....................................................................................................................................136
CH APTER NINE :
Tra nsformYo urVisi on................................................................................................................. 139
“Paint ” YourDisp lay....................................................................................................................142
CHANGE YOUR PAL ETTE ............................................................................................................................143
Set Up XY Displa y........................................................................................................................146
CHAPTER TEN:
Comp ute Ex t rema Wavefor ms..................................................................................................... 151
Rescale and AssignUnits............................................................................................................. 153
En hanceResolution.....................................................................................................................154
Do Mor ewit hFFT ....................................................................................................................... 158
DO FFT AVERAGE ............................................................................................................................................158
DO ADDITIONAL PROCESSING ...............................................................................................................158
USE CURSORS WITH FFT ..............................................................................................................................158
SET FFT SPAN.....................................................................................................................................................161
UseanAdvance dMathFunction.................................................................................................163
Resamp le toDeskew....................................................................................................................164
Plo tTr en ds...................................................................................................................................165
READ TRENDS...................................................................................................................................................167
CH APTER ELEVEN:
UseCus t omPar a met ers............................................................................................................... 171
CUSTOMIZE A PARAME TE R .......................................................................................................................172
Test forPass and Fail................................................................................................................... 173
SET UP A PASS/ FAIL TEST ............................................................................................................................173
PASS/ FAIL TEST ON A MASK ......................................................................................................................174
MAKE A WAVEFORM MASK ........................................................................................................................175
CHANGE A TEST ACTION............................................................................................................................175
Choo se a Par ameter...................................................................................................................... 179
DISPLAYMORE
......................................................................138
USE ADVAN CED MAT H T OOL S
ANALYZE WITH PARAMETERS
............................................150
.....................................170
CH APTER TWEL V E:
Tra nsferData an dImages to PC..................................................................................................189
EXPLORE YOUR SCOPE ................................................................................................................................190
MONITOR YOUR REMOTE CONTROL OPERATIONS.....................................................................191
Save Waveforms inASCII............................................................................................................. 192
SAVE IN AN ASCII FORMAT.........................................................................................................................193
UseASCII Fo rmats...................................................................................................................... 195
SAVE TO SPREADSHEET...............................................................................................................................195
PL OT A WA VEFORM IN SPREADSHEET ................................................................................................198
USE MATHCAD..................................................................................................................................................199
USE WAVERUNNER-2WITH PC
....................................188
vi ISSUED: January2002 WR2-OM-E Rev C
Page 7

Waver unn er -2
USE MATLAB.......................................................................................................................................................201
PPAARRTTTTHHRREEEE::WWAAVVAAOOPPTTIIOON
CH APTER TH I RTEEN:
A Val uable Tool for Wavef or mAn aly s is........................................................................................205
SET UP FOR HISTOGRAMS...........................................................................................................................205
PARAMETER MATH .........................................................................................................................................211
CH APTER FO URT EEN:
Create and Viewa Histogr am.......................................................................................................217
SETTING BINNING AND SCAL E ...............................................................................................................223
CHOOSING HISTOGRAM PARAMETERS ...............................................................................................226
USING MEASURE ME NT CURSORS ...........................................................................................................227
ZOOMING SEGMENTED TRACES............................................................................................................229
CHAPTER FIFTEEN:
Theo ryof Opera tion....................................................................................................................231
DSO PROCESS.....................................................................................................................................................232
PARAMETER BUFFER .....................................................................................................................................232
CAPTURE OF PARAMETER EVENTS .......................................................................................................233
HISTOGRAM PARAMETE RS .........................................................................................................................233
ZOOM TRACES AND SEGMENTE D WA VEFORMS ............................................................................234
HISTOGRAM PEAKS........................................................................................................................................234
BINNING AND MEASUREMENT ACCURACY......................................................................................235
CHAPTER SIXTE EN:
avg ................................................................................................................................................23 7
fwhm.............................................................................................................................................238
fwxx..............................................................................................................................................239
ham pl............................................................................................................................................240
Hbase ...........................................................................................................................................2 41
high...............................................................................................................................................242
hmedian........................................................................................................................................24 3
hrms..............................................................................................................................................244
htop ........................................................................................................................... ....................24 5
low................................................................................................................................................246
m ax p.............................................................................................................................................247
m ode.............................................................................................................................................248
p c t l................................................................................................................................................249
p ks ................................................................................................................................................250
range.............................................................................................................................................252
sigma ............................................................................................................................................253
to t p................................................................................................................................................254
xap k..............................................................................................................................................25 5
PARAME T ERS AND OVE RVIEW
MAKING H ISTOGRAMS
HOW HISTOGRAMS WORK
HISTOGRAM PARAMETERS
N ................................2 03
...............................204
............................................. 2 17
........................................... 2 31
.........................................237
WR2-OM-E RevC ISSUED: January2002 vii
Page 8

T ABLE OF C ONTENTS
PPAARRTTFFOOUURR::EETTHHEERRNNEETTOOPPTTIIOON
CHAPTER SEVENTEEN:
Introduction.................................................................................................................................259
IMPLEMENTATION STANDARD ..............................................................................................................259
CONNECTIONS................................................................................................................................................ 259
ScopeExplorer.......................................................................................................................................................260
ActiveDSO.............................................................................................................................................................261
EXAMPLE SYNTAX .........................................................................................................................................262
CHAPTER EIGHTEEN:
Connecti ng th eWaverunner-2toits Host....................................................................................265
SCOPE REAR PANEL ......................................................................................................................................265
PC REQUIREMENTS .......................................................................................................................................266
ETHERNET CONNECTION ........................................................................................................................ 266
CONFI G URING THE WAVERUNNE R-2T O COMMUN I CAT E WITH A PC CON NE CTED
TO THE NETWORK ........................................................................................................................................ 267
CONFIGURING A PC THAT IS NOT CONNECTED TO THE NETWORK ...............................268
MAKING PHYSICAL CONNECTION .......................................................................................................270
VERIFYING CONNECTION ........................................................................................................................266
NETWORK CONNE CTION ..........................................................................................................................272
CHANGING IP ADDRE SS............................................................................................................................. 273
CHAPTER NINETEEN:
Introductionto Software To ols.....................................................................................................275
ActiveDSO.............................................................................................................................................................275
ScopeExplorer.......................................................................................................................................................275
Using ActiveDSO .........................................................................................................................275
CONTROL INSTANTIATION....................................................................................................................... 275
EXAMPLE : Pow e rPoint .....................................................................................................................................276
EXAMPLE : VBA................................................................................................................................................. 280
Using Sco peExplorer...................................................................................................................281
ScopeExplorer FEATURES............................................................................................................................... 282
OVERVIEW
.................................................................258
CONNECTING TO PC OR NE TWOR K
SOFTWARE TOOLS
.....................................................274
N
.....................264
APPENDI X:
Sp ecifi c atio ns.......................................................................................................................................283
MODELS ...............................................................................................................................................................283
TIMEBASE SYSTEM..........................................................................................................................................284
TRIGGERING SYSTEM ...................................................................................................................................285
SPE CIFICATION S
ACQUISITION SYSTEM ....................................................................................................................283
.............................................................................283
v iii ISSUED: January2002 WR2-OM-E Rev C
Page 9

Waver unn er -2
SMART TRIGGER TYPE S ...............................................................................................................................285
AUTOSETUP........................................................................................................................................................286
PROBES..................................................................................................................................................................286
COLOR WA VEFORM DISPLAY.....................................................................................................................286
ANAL OG PERSISTE NCE DISPLAY ............................................................................................................286
ZOOM EXPANSION TRACES .......................................................................................................................286
RAPID SIGNAL PROCESSING......................................................................................................................287
INTE RNAL W A VE FORM MEMORY............................................................................................................287
SETUP STORAGE ...............................................................................................................................................287
MATH TOOLS .....................................................................................................................................................287
MEASURE TOOLS .............................................................................................................................................288
STANDARD MEASURE TOOL S ...................................................................................................................288
EXTENDED MATH AND MEASUREMENTS OPTION......................................................................288
W A VE ANALYZER OPTION ..........................................................................................................................288
SPECIAL APPLICATION SOLUTIONS ......................................................................................................289
INTE RFACE..........................................................................................................................................................289
OUTPUTS ..............................................................................................................................................................289
GENERAL...............................................................................................................................................289
GL O SSARY OF TECH NI CAL T ER MS
IN DE X
.......................................................................................................................305
..................................................................293
WR2-OM-E RevC ISSUED: January2002 ix
Page 10

T ABLE OF C ONTENTS
BLANK PAGE
x ISSUED: January2002 WR2-OM-E Rev C
Page 11
I NTRO DUCTION
Waverunner-2 Features
ACCESS YOUR SCOPE’S ANALYTICAL POWERWITH THE PRE SSOF ABUTTON
Wavepilot Menu
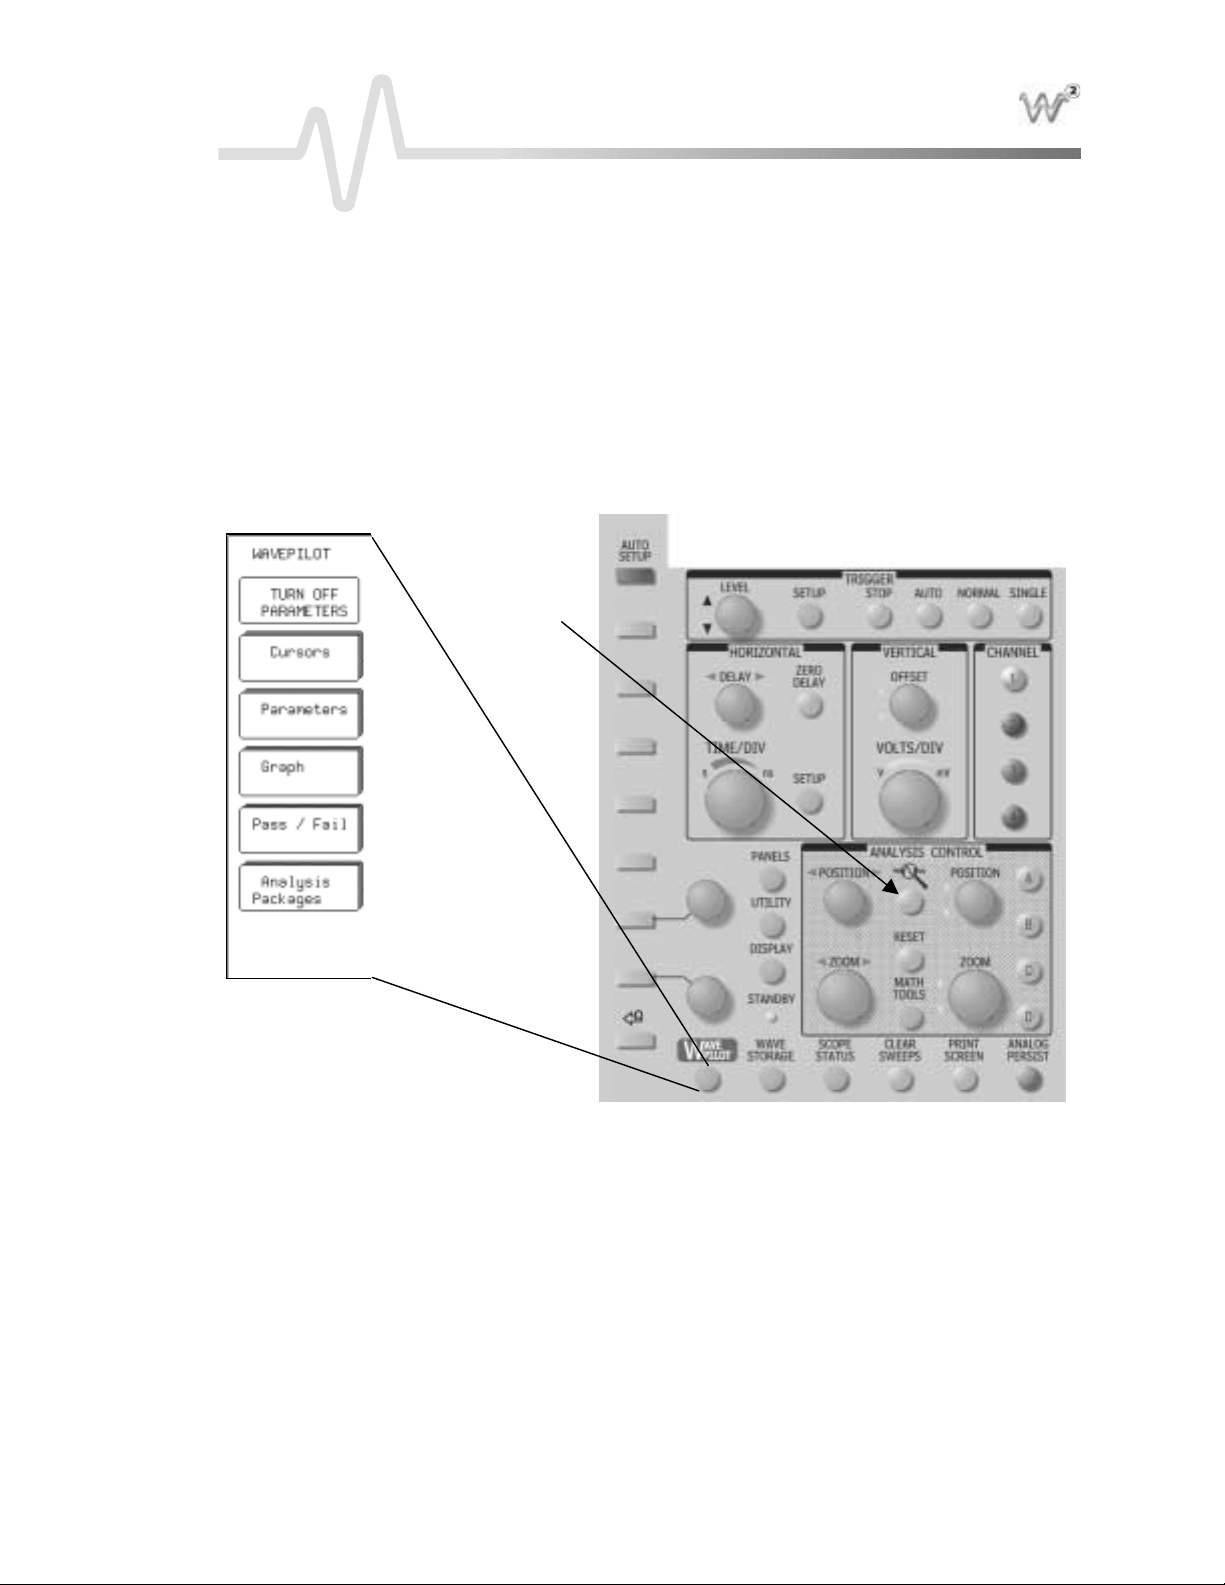
In the Wa verunner-2 series of scopes , L eCroyintroduces the Wa vep ilot menu, an operational aid that gives you
imme d ia te ac ce s s to thedigital stora g eoscilloscope’s (DSO) most freq u ently use d functions . The Wavep ilot
menu’s soft keys access measurement tools such as cursors and parameters. By means of the Graph button, it
also provides direct access to math analysis functions including histograms, fast Fourier transforms (FFT), and
the uniq u eJitterTrac k ™ timinganaly s is . Finally, yo ucan acce ss applica tion-spe c ific analysis options like
communications mask testing, disk drive, and powe r measureme nts by pressing the Analysis Packa ges button.
The figure below shows the location of the Wa vepilot and other new buttons.
QUICK ZOOM
L ocation of Wavepilot controls
WR2-OM-E RevC ISSUED: January2002 1
Page 12
Introduction
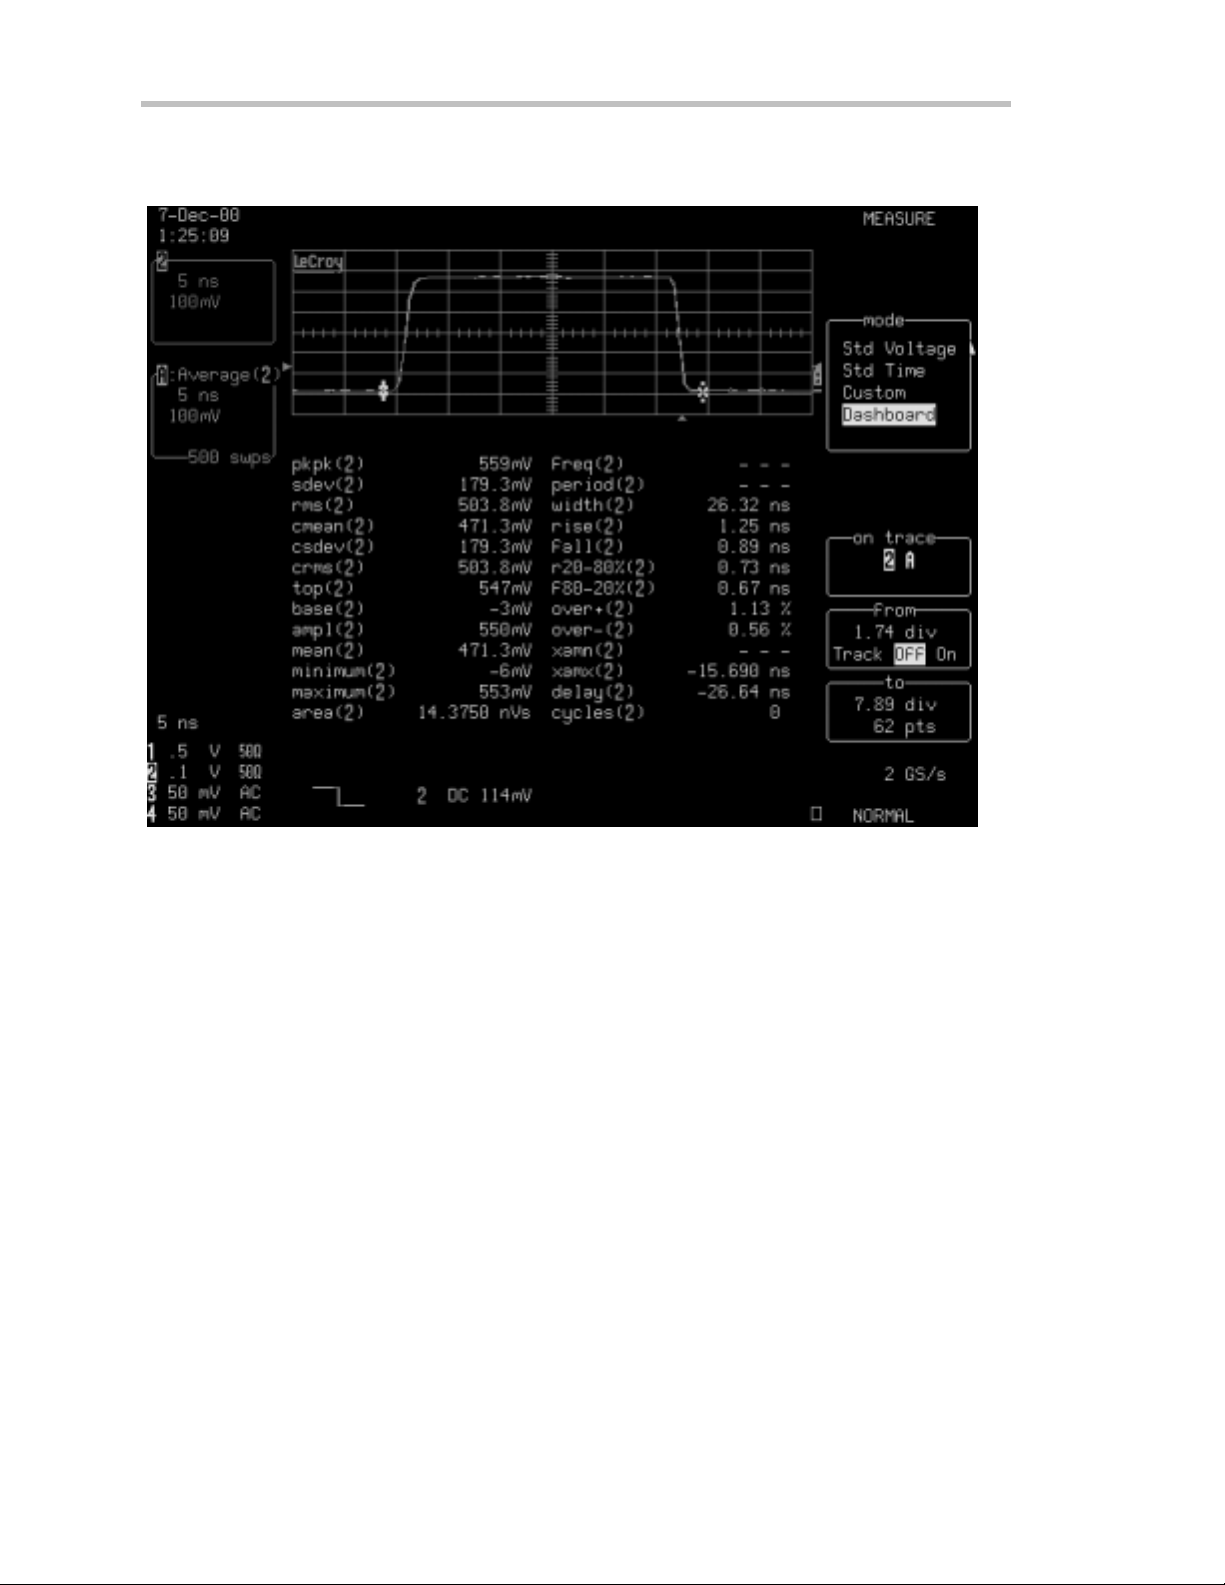
Thefigurebelowisanexampleof theWavepilot Parameters function. Show n is a viewof the measurement
Dashboard, which provides a summary of 26 key waveform parameters for the selected waveform.
A Wavepilot M easure menu showing the measurement parameter D ashboard
ISSUED: January2002 WR2-OM-E Rev C
2
Page 13
W
AVERUNNER
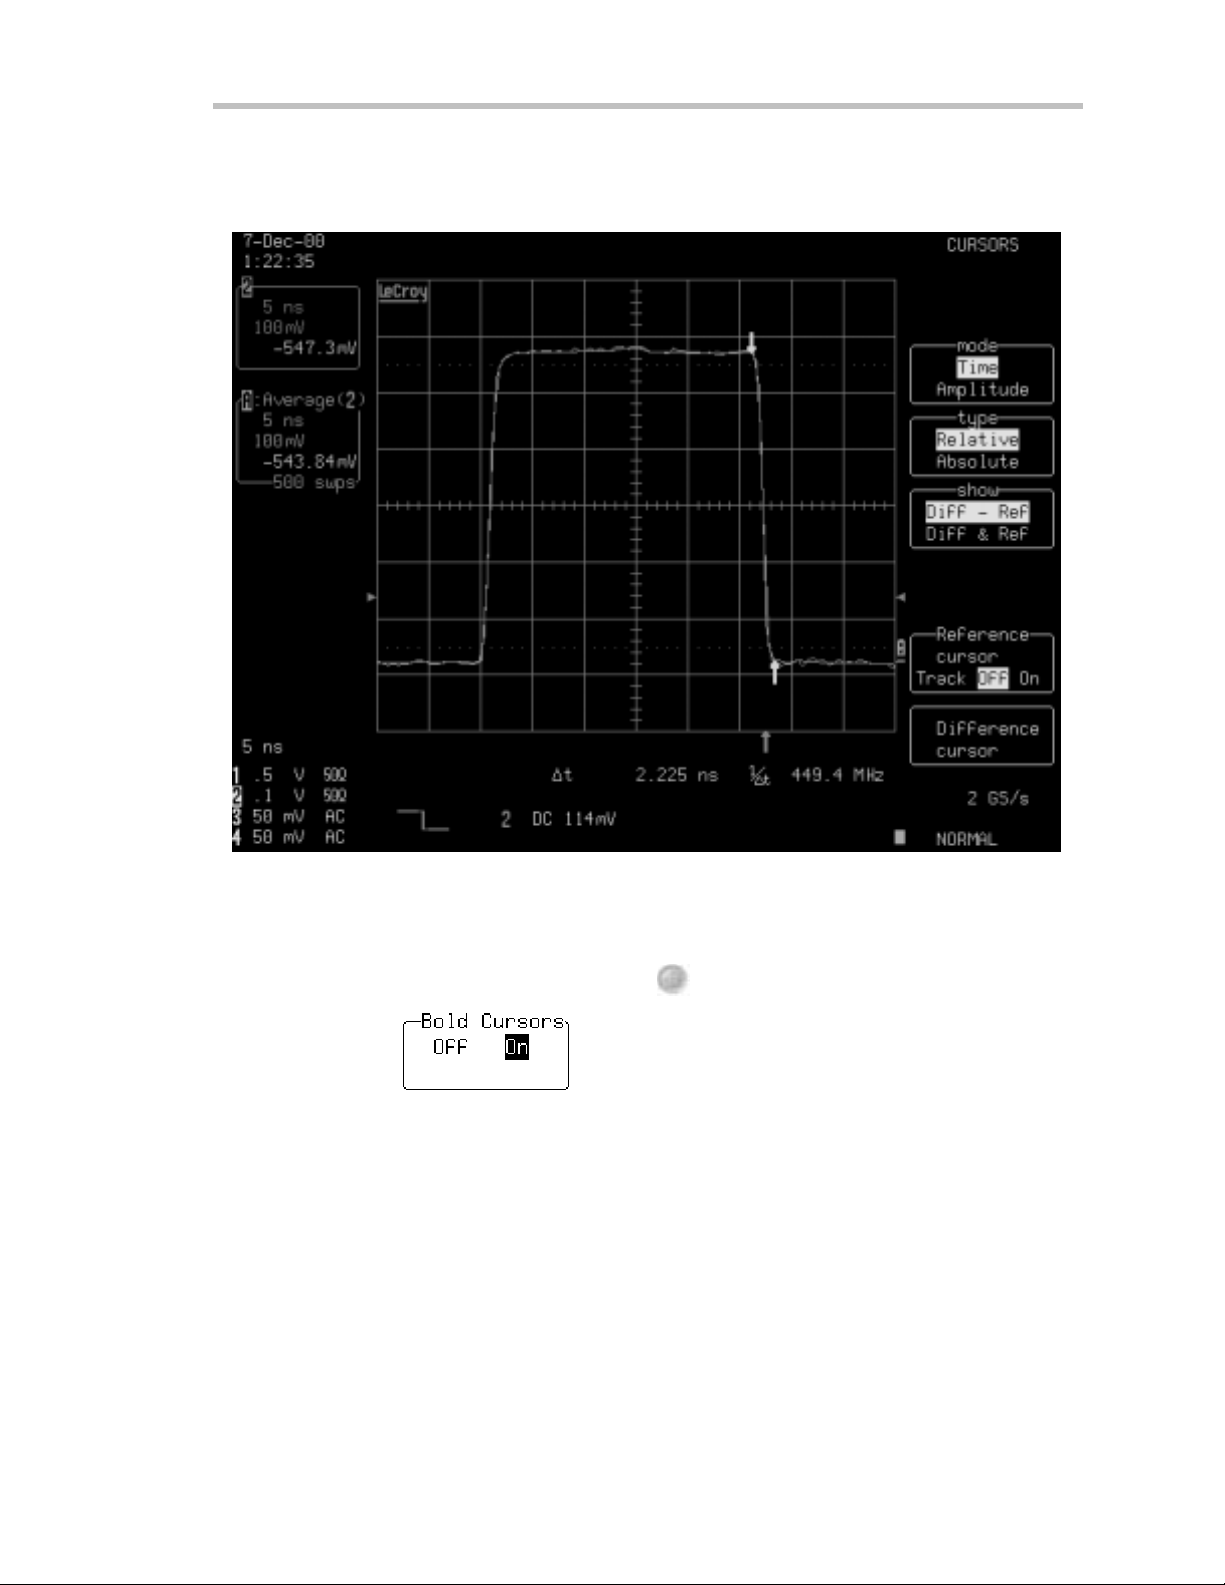
Pressing the Wave pilot menu’s Cursor button immediately displays the cursor control menu shown below. This
greatly enhances the accessibility of this frequently used function.
-2
Wav e pilo t Cu r so rs me nua c cesse dbypre ssingtheCu rso r s bu tton
UTILITY
You can make cursors appea r thin or thick by pressing
Cursors Measure. Turn
WR2-OM-E RevC ISSUED: January2002
on or off.
, then selecting Special Modes →
3
Page 14
Introduction
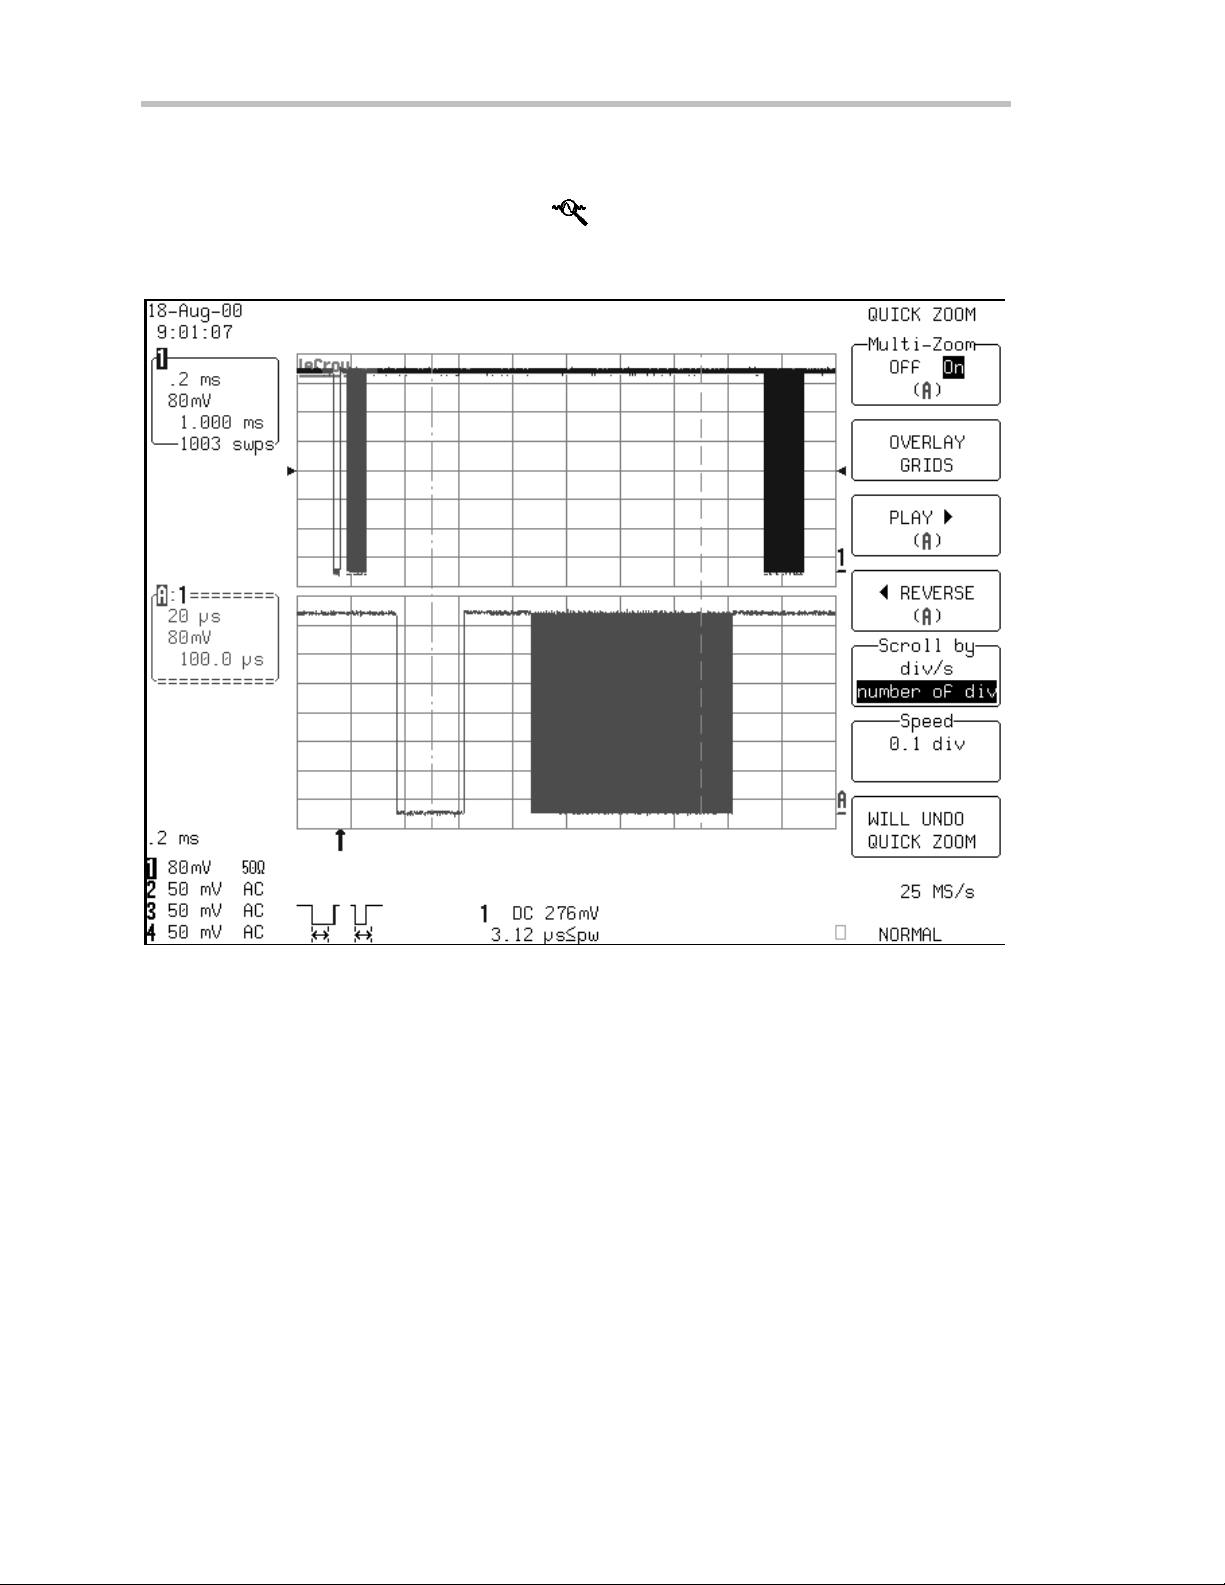
QuickZoom
QuickZoom, indicated by the magnifying glass icon
the currently use dacquis ition cha n n e ls. The figure be lo wprovid e s anexam p leof a typica l QuickZoom disp lay.
The QuickZoom menu includes controls for overlapping the traces and using Auto-scroll to scan through the
expanded display .
,isusedtoimmediatelyturnonthezoomdisplayof
A Quick Z oomdisplay for a single trace
4
ISSUED: January2002 WR2-OM-E Rev C
Page 15
W
AVERUNNER
Wavepilot Menu Graph Button
W aveform analy sis ca n bethou g h t of as a mu ltidimensiona l viewof a signal.Oscilloscopes hav ealway s be en
used to view signals in the time domain — a plot of signal amplitude versus time. More recently , frequency
domain analysis using the fast Fourier transform (FFT) has been added to digital oscilloscopes . The FFT
provid e s agra p h ica l disp lay of signa l amplitude as afunction of freq u e n cy. Usinghistogra ms ,LeCroyoffers
tw o ne wviews of statistical and timing analysis usingtheuniqu eTrackVie wfunction. TrackViewplots
variations in timing parameters, such as period, width, frequency, and duty cycle, as a function of time.
-2
These powerful analysis tools have been made even more accessible using the G
theG
RAPH button in Wave pilot evokes a special graph menu that offers an instant selection of Histograms,
FFT, Track View(with EMM option) , an d othe r options from ad d itiona llyinstalled progra ms.
RAPH function. Simply pressing
TheWave pilo t Gra ph fu n c tionoffers aninstan t ch o ic e o f histo g ram, Jitte rTrack, Trac kV iew, or F F T analysis of an acquired
signal, depending oninstalled option s
WR2-OM-E RevC ISSUED: January2002
5
Page 16
Introduction
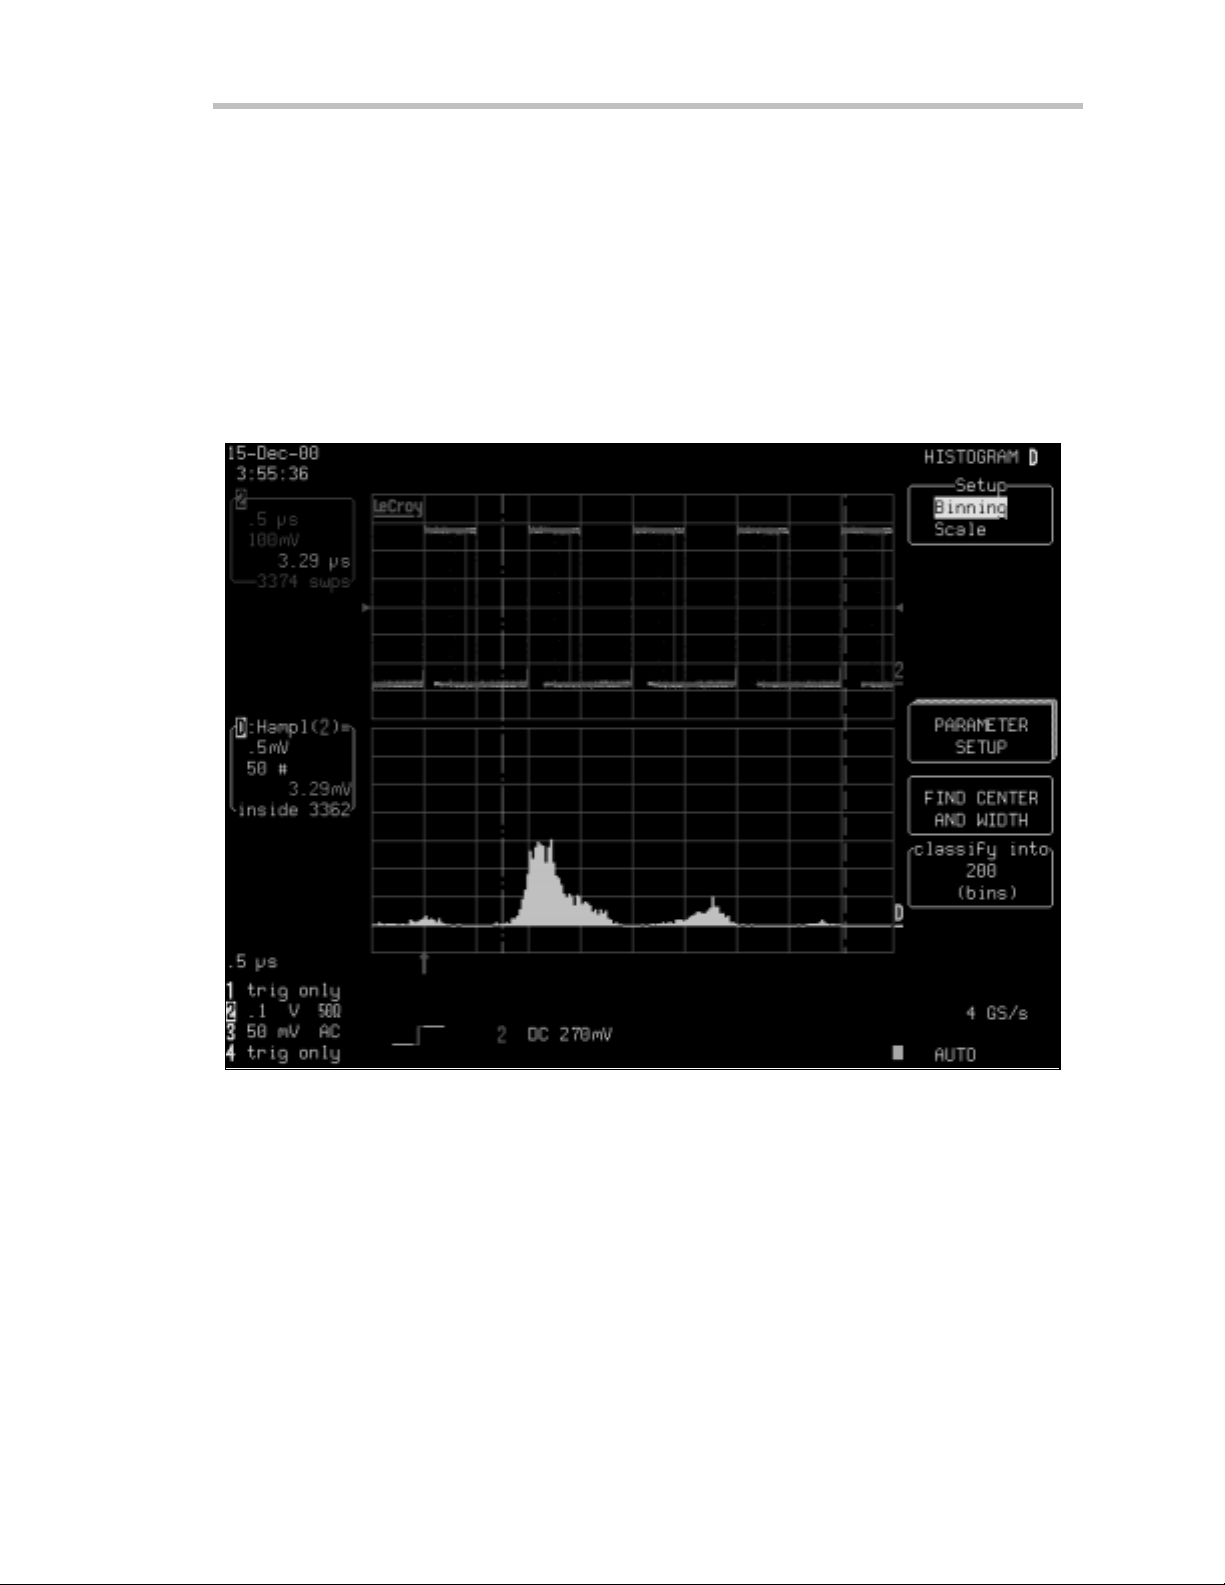
The figure on the preceding pag e shows the statistical analysis of a pulse-width-modulated signal displayed with
Analog Persistence . This is used to show the w ave form’s history . The histogram shows that there are nine
widths and that the frequency of occurrence of each pulse width varies proportional to the width. The next
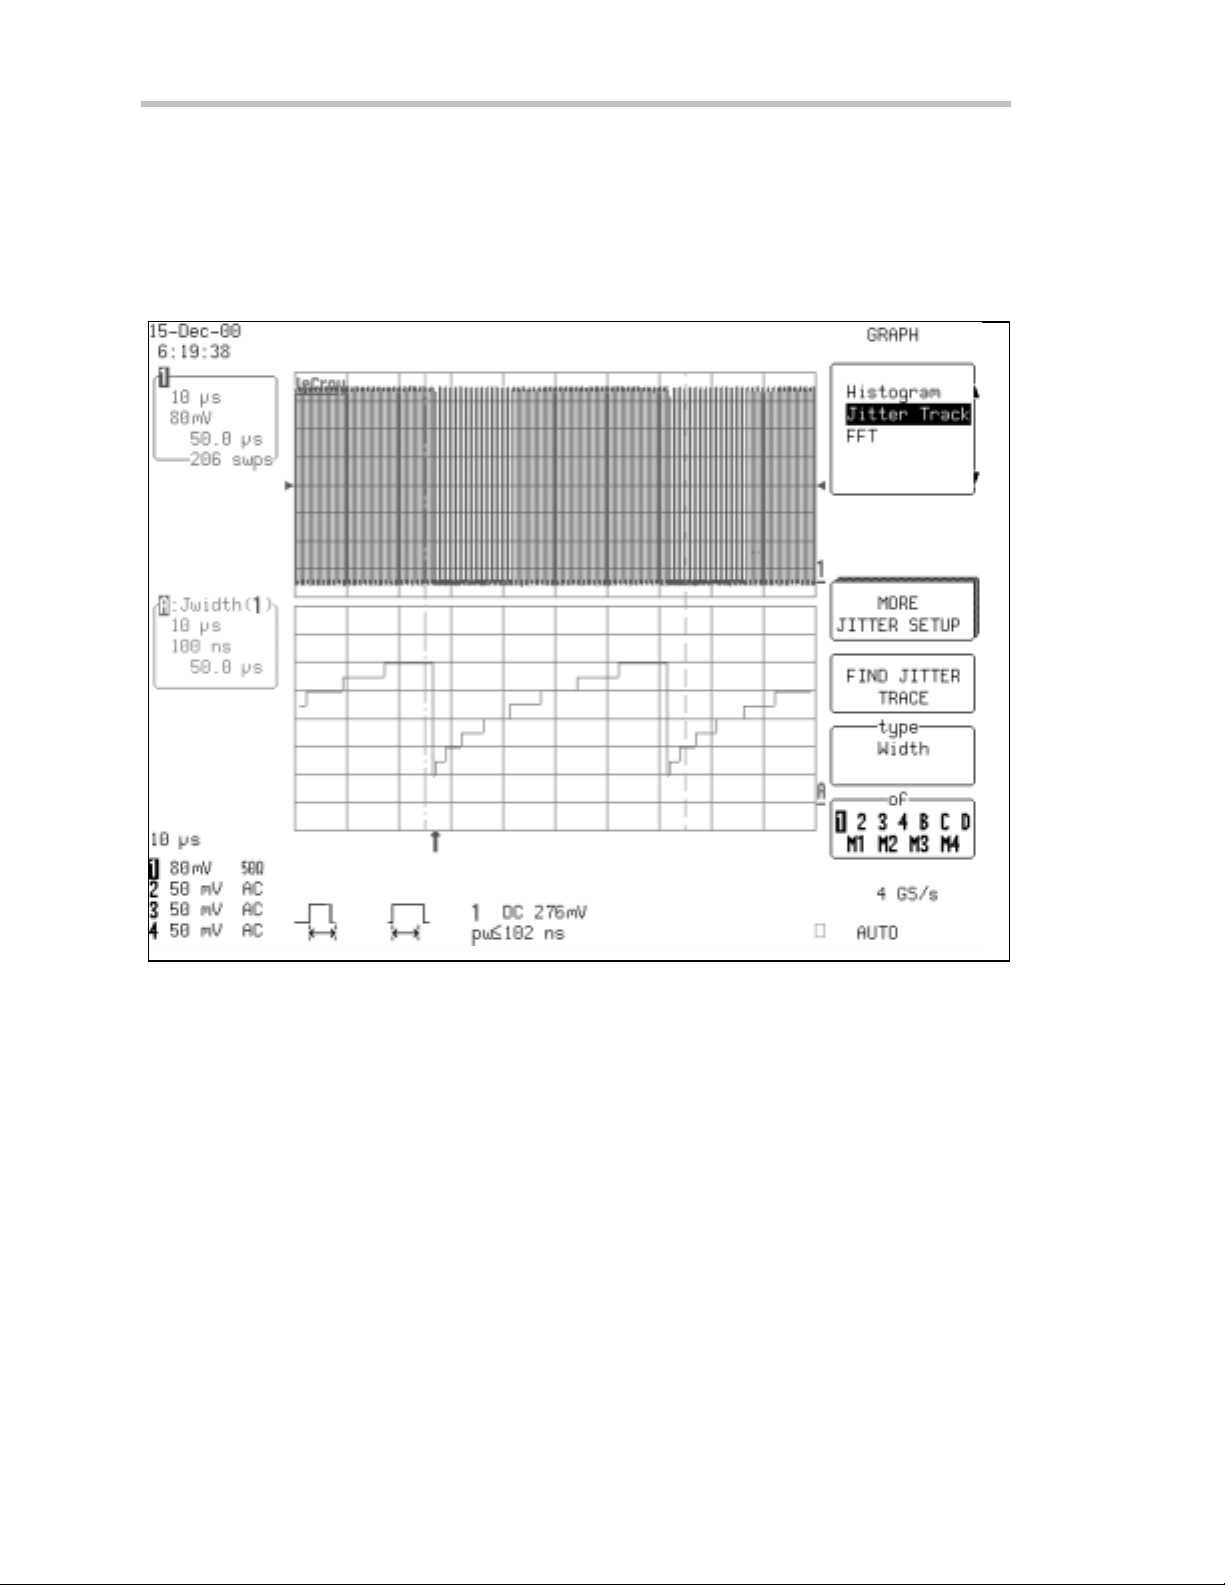
qu e s tion that one migh t ask is, "Wha t is theordering of thepulsewidths?" That question is ea silyanswere db y
selecting the JitterTrack view. The figure belowshow s an analysis of pulse width as a function of time. The
JitterTrack display shows that the pulse widths increase seque ntially, from narrowe st to widest, with the
duration of the signal at each width increasing proportionally to the width.
JitterTra c k exam ple
6
ISSUED: January2002 WR2-OM-E Rev C
Page 17
W
AVERUNNER
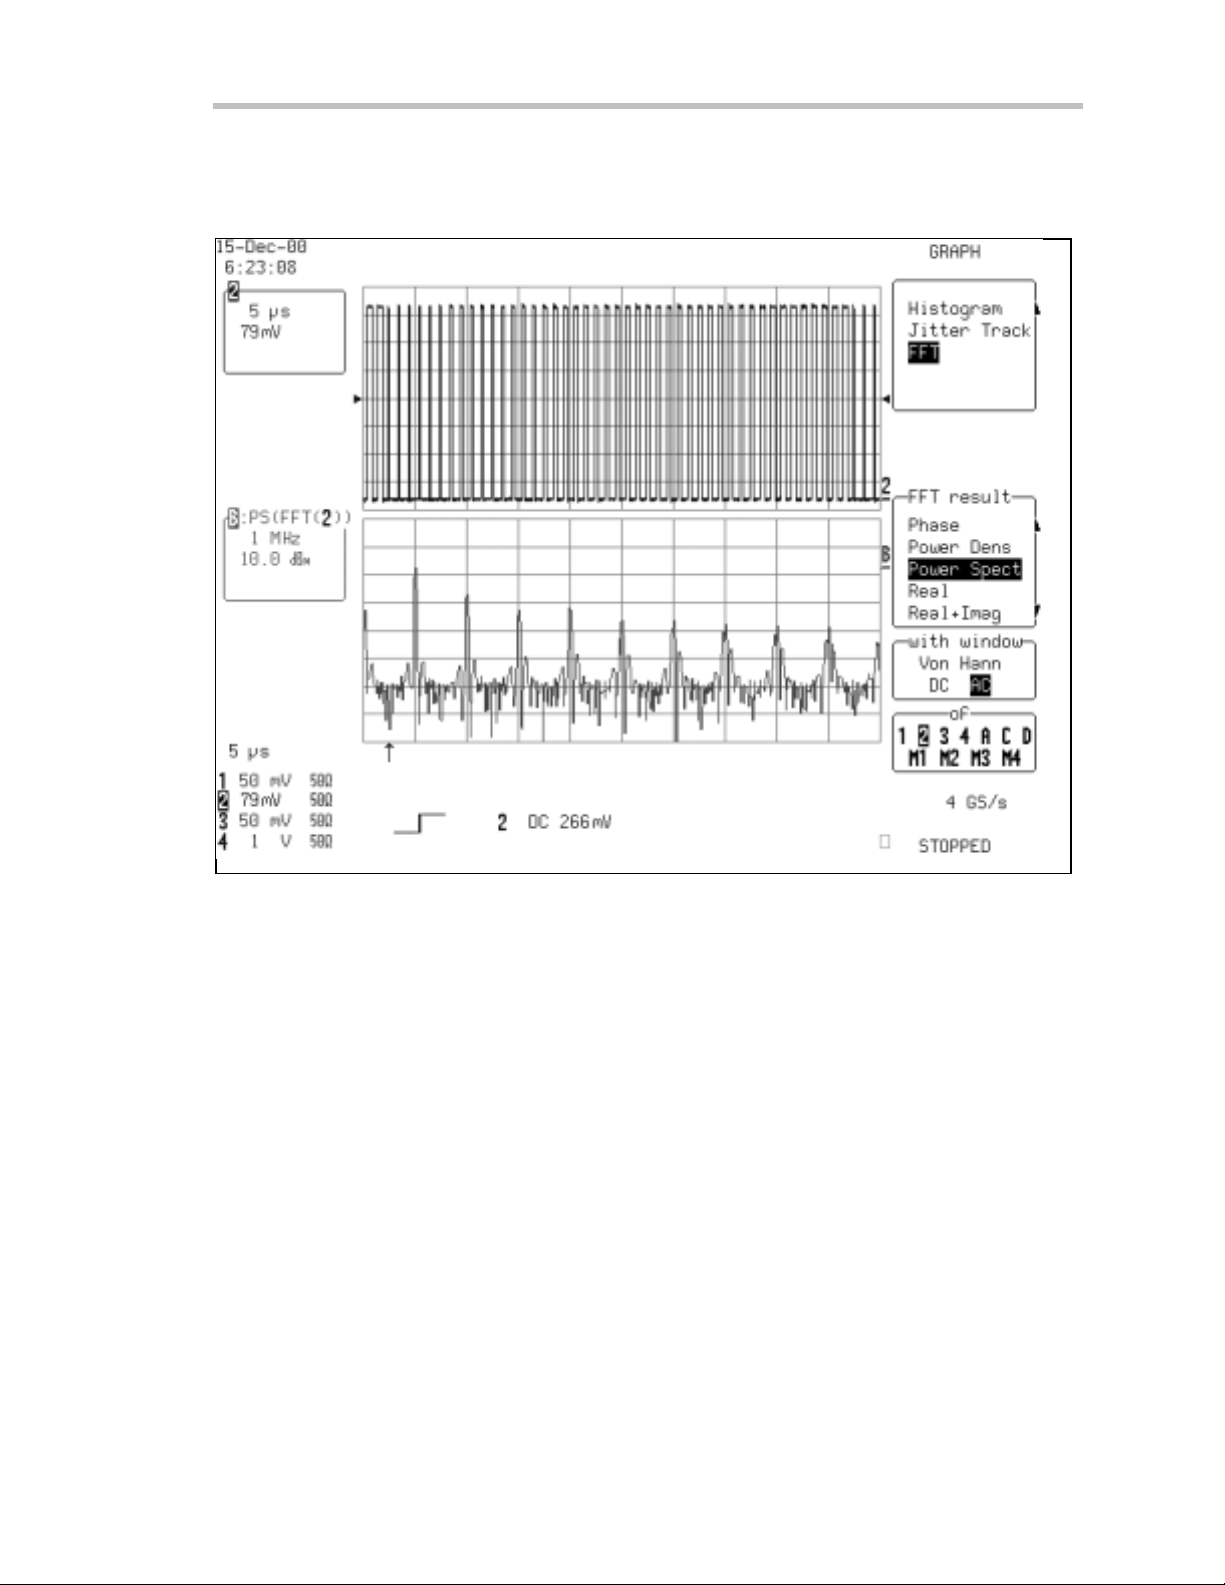
The final viewshow n belowis the FFT of the pulse-modulated wa veform. The FFT show s that the frequency
spectrum of the wa veform consists of the 1 MHz fundamental frequency along with a series of harmonics.
Modulation effects are obvious in the sidebands show n about each of the principal spectral lines.
-2
FFT of a p ulse- widthmodu l ateds i gnal take noveronec yc l eof th ewidthmodu l atio n
For additional controls or for manual setup , each of these analysis tools is available from the "Math Tools"
menu.
WR2-OM-E RevC ISSUED: January2002
7
Page 18
Introduction
WAVEFOR M HISTORY
Display Signal Changes Over T ime
Analog Persistence and History mode are tools used to acquire and display how a signa l changes over time.
These fea tures w ork in a highly integrated fashion to produce screen displays that show the range and
frequency of occurrence of variations in the signal.
TheLeCro yWa v e runn er-2 serie s of oscilloscop es placeboth the sefeatures at your fingertips. Both fe a ture s
ANALOG
PERSIST
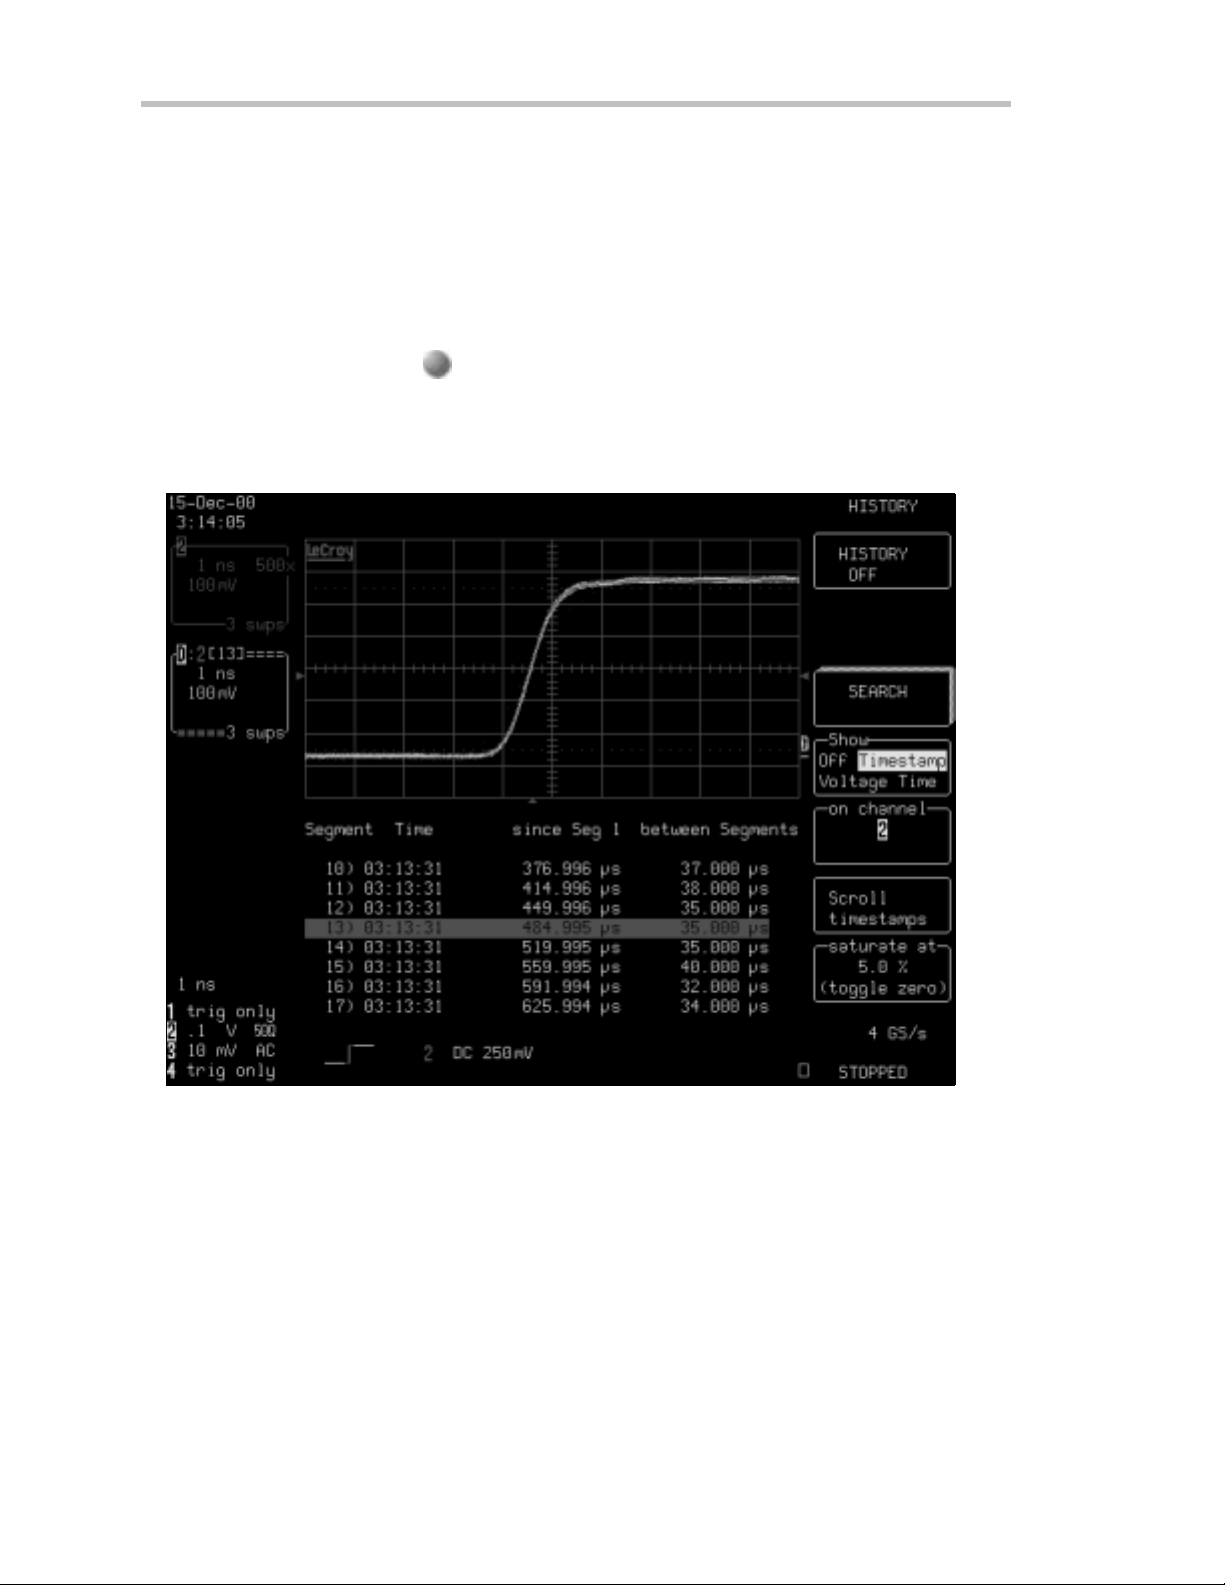
canbeevokedbysimplypressing
display that contains 15 overlaid acquisitions of the leading edge of a pulse wa veform. The intensity grading
indicates frequency of occurrence of each edge rate . Included are the time stamps for each acquisition.
The History data is display ed on trace D. Turn on trace D to viewthe data. When you turn off History mode,
turn traceD off manually.
. The figure belowshow s an intensity-graded Analog Persistence
TheAnalogPersist buttongives accesstotheHistoryfeature. Historyevokes sequencemodeandA nalogPersistencetoshowa
history of waveform chan ges.
ISSUED: January2002 WR2-OM-E Rev C
8
Page 19
W
AVERUNNER
-2
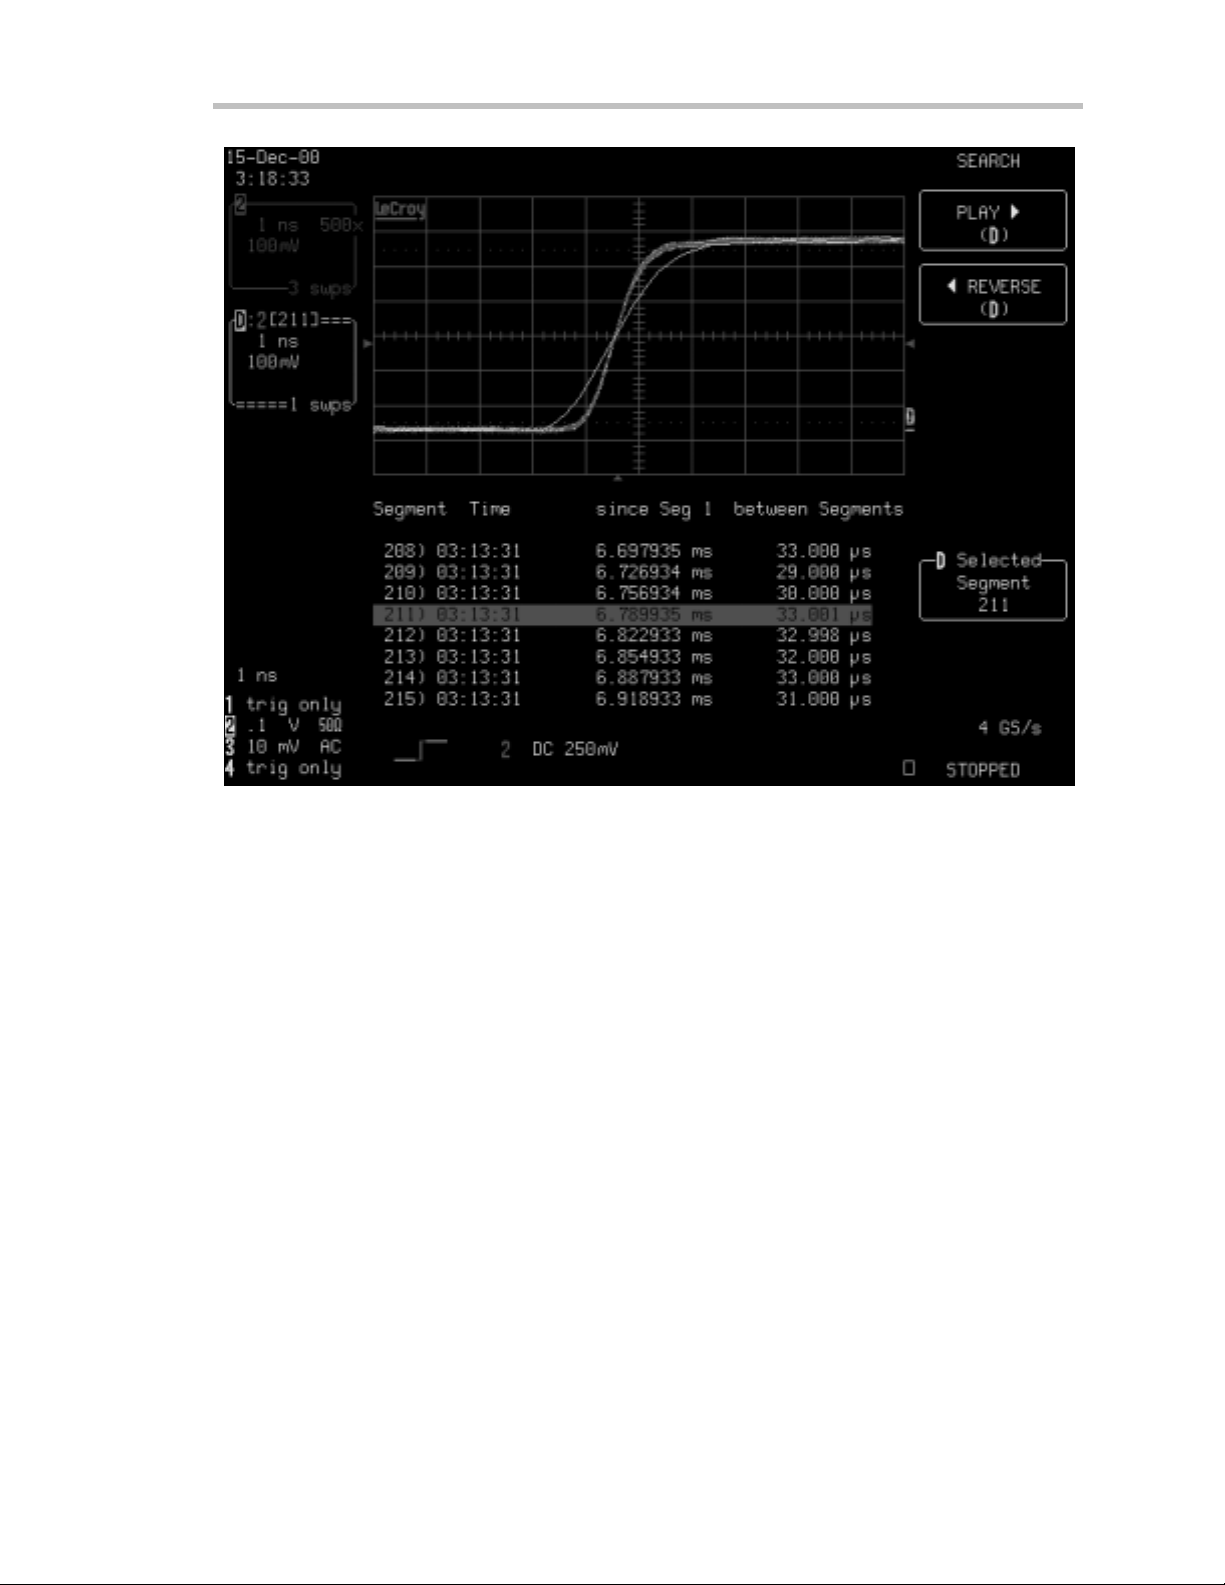
Turning off A nalog Persistence allows each segm ent to be viewed individually. Play and R everse menu selections control autoscrollin gth r ougha ll segme nts
Sequence mode (available in the Timebase S
oscillosco p einto a s man yas 8000 smaller seg ments. Each of these segments is ava ila b leafter the acqu is ition
for individual view ing, parameter measureme nts, or w ave form math. And each segment is individually time
stamped with an absolute real time stamp, time since first trigger, and time between segments.
In this example we can see a single edge that has a slow transition time. Each of the acquired segments can be
viewe d individually by using the oscilloscope ’s zoom feature. With Analog Persistence turned on, the scope
displays all the segments overlapped. If Analog Persistence is turned off, the zoom display shows each segment
individ u a lly. An auto-scrolling feature allo ws y outo au toma ticallyscan through all the segmen ts using Playand
Reverse. This allow s any segment located using the Analog Persistence display to be recovered for detailed
analysis.
WR2-OM-E RevC ISSUED: January2002
ETUP menus) brea ks the long acquisition memory of the
9
Page 20
Introduction
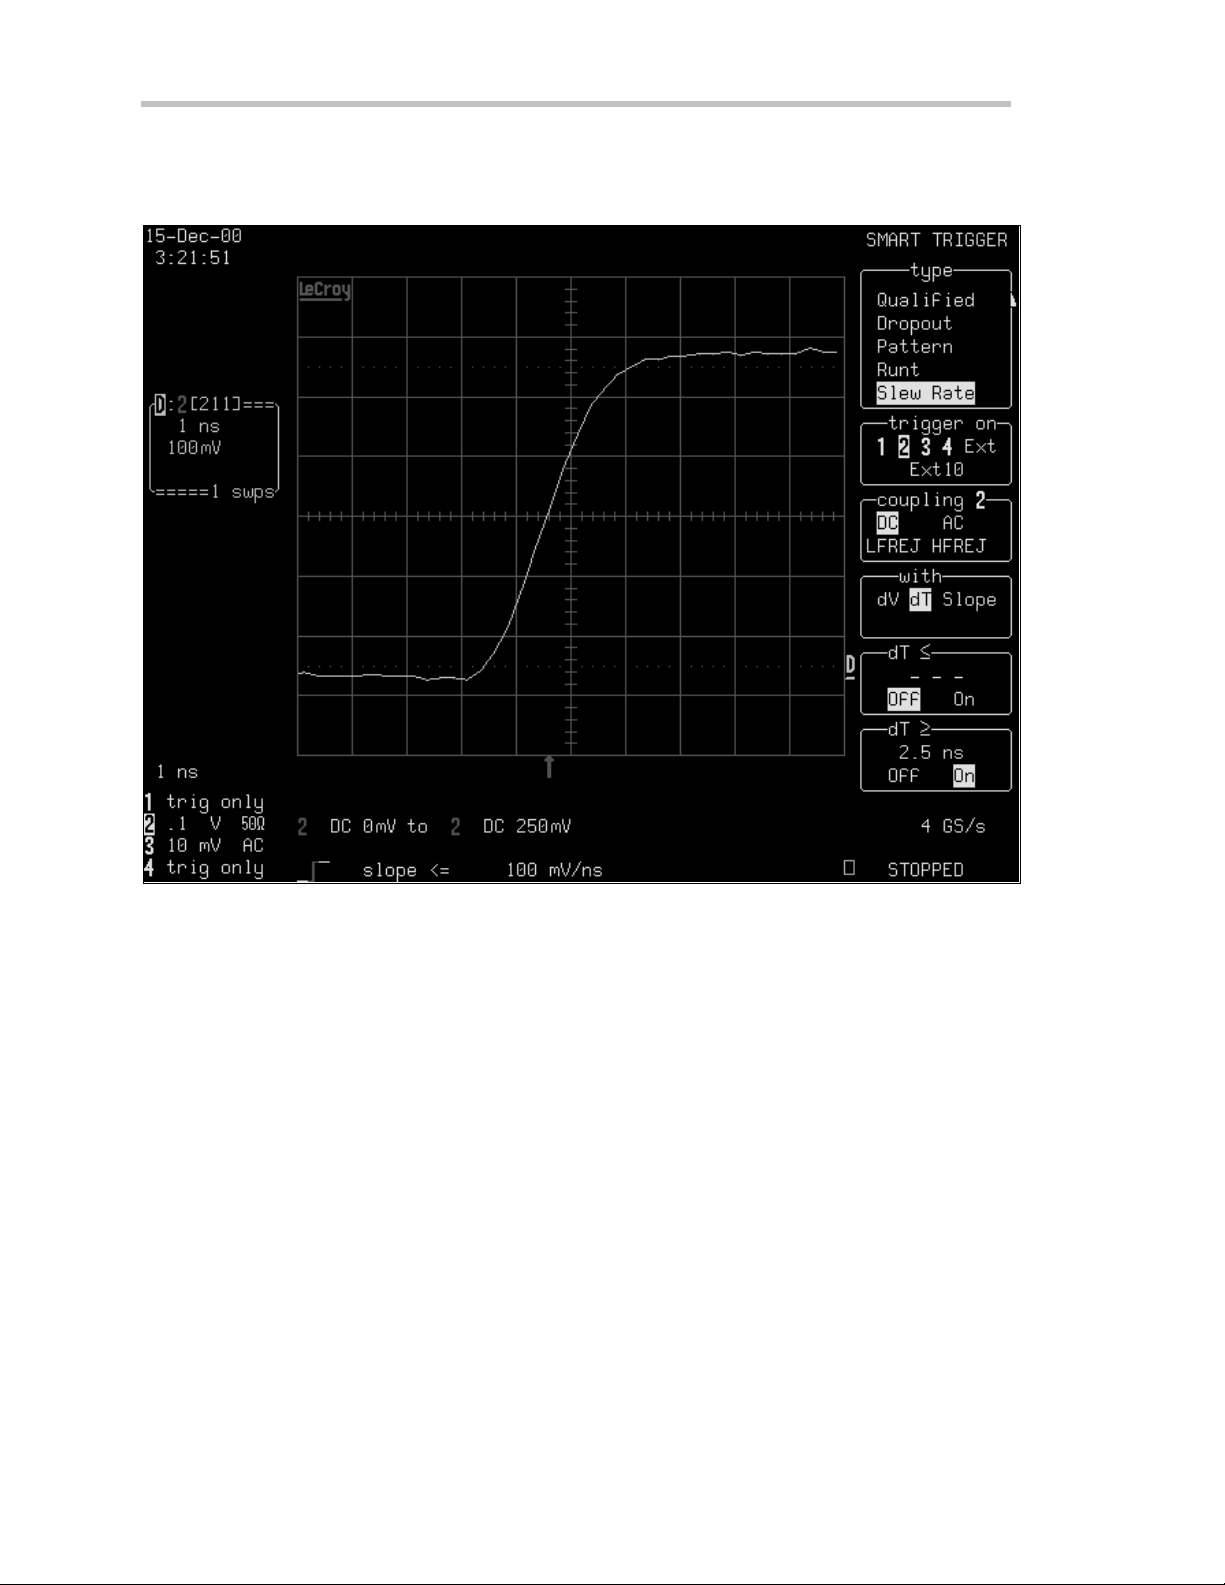
Once such an anomaly is observed it is easy to measure the risetime, using cursors or measurement parameters,
then se le ct a trigg e r to catch onlyeven ts with slowrise time s. This ty p eof ev e n t can be isola tedusing the Slew
Rate trigger (available with the advanced trigger packageoption), whose setup is shown in the following figure.
Se tu p fo r SlewRa tetrigge r to a cquirew a v e fo rms w ith tra nsitiontim e s g re a te r tha n1.4 n s
Once the special slew rate trigger has been enabled, running the acquisition again measures the precise time of
occu rrenceof ea chof the slowtransition ev e n ts. This is illustrated in thefollowingfigu re .
ISSUED: January2002 WR2-OM-E Rev C
10
Page 21

W
1
AVERUNNER
-2
R er unning a sequence acquisit ion aft er t urning on S M A R T T rigger shows t he t ime of occurrence of each sl ow edge event
The History button consolidates the existing Analog Persistence and sequence mode fea tures and makes both
easily accessible through a direct front pane l control.
WR2-OM-E RevC ISSUED: January2002
1
Page 22

Introduction
Ab out this Manual
Like the Wa verunner-2 scopeitself, this manual is designed to make your mea surements as easy as “1–2–3.”
Each section shows you step by step howto use the oscilloscope to solve simple or complex problems.
Use the manual with the Wa verunner-2 in front of you. Then you’ll see clea rly just what is being referred to;
and you can immediately put into action what is described.
The manual has two main parts:
Part One, “G et ti ng S tart ed,” is for newusers and basic operations. It explains the most important
Wa verunner-2 features , and show s you howto apply them. Use it when starting out and for getting quick
results.
Part Two, “ L oo king D eeper,” goes into more detail. It explains how to perform complex measurements
using more advanced Wa verunner-2 functions. It also looks more deeply into operations covered in Part One.
Use it for tackling demanding tasks, or as a reference for understanding better how your scope w orks.
Consult theglossary for clarification of oscilloscope an d rela tedterms.
As an additional guide, each chapter is prefaced by a summary of its contents.
Wa tch for panels and sections throughout the manual marked by these icons:
12
s offer additional hints on how to get the most out of Wa verunner-2 actions or features .
TTIIPPs
s bring to your attention important information you should know.
NNOOTTEEs
Thesections marked by the ma g n ifyingglass,a n d printedin italic te x t, “zoom” on particular
topics. They offer more information on the subject, whe re appropriate.
ISSUED: January2002 WR2-OM-E Rev C
Page 23

BLANK PAGE
W
AVERUNNER
-2
WR2-OM-E RevC ISSUED: January2002
13
Page 24

F IRST T HINGS...
Inth is preface, see ho w
Tomake sureyou h ave everyth ing
To operate withsafety
To get to kno wy o urWaver un n er -2 scope
Toinstalland powerup
To initialize
To checkth e systemstatus
To install n ewsoftw are and firmw are
To activate thescreensav e r
To use men us, men u butto n s and kno bs
To ch oo se button and kno b pr efer en ces
First
14
ISSUED: January2002 WR2-OM-E Rev C
Page 25

F IRST T HINGS
WhenYo urWav erun n er -2is Deliver ed
CHECK THATYOU HAVE EVERYTHING
First, verify that all items on the packing list or invoice copy have been shipped to you. (The items are also
listed below.) Second, check the SYSTEM STATUS display once your Wave runne r-2 oscilloscope is installed
(see page25). Contact your nearest L eCroy customer service center or national distributor if anything is
missing or damaged. If there is something missing or damaged, and you do not contact us immediately, we
cannot be responsible for replaceme nt.
The following is shipp ed w ith the standard Wa verunner-2 scope :
: Th e w arr antybelowreplaces all
10:110MΩ PP006 Passive Probe — one per channel
AC Powe r Cord and Plug
Performa n ceor Calibration Ce rtificate
Front Scope Cover
Operator’s M anual
RemoteControl Manual
Quick R eference Guide
De cla ra tio no f Confo rmity
NNOOTTEE:
other warranties, expressed or implied,
including but no t limited to an yim p lied
warranty of merchantability, fitness, or
adequacy foran yp articularp urp o se or
use. L eCroy shall not be liable for any
special, incidental, orconseque n tial
damages, wheth erin contr act or
oth er w ise. The custom eris respon sible
fo rthetransportati onand in su rance
ch arges fo rtheretur nof pro d uctsto
the service facility. LeCro yw ill return
all pro ducts underwar r an tyw ith
tr a nsp ort prepaid.
BE SURE T O RE AD T H IS WARRAN T Y
The Waverunner -2 oscilloscope is warranted fornormal use and operation, within specifications, for a
period of three years from shipment. L eCroy will either repair or, at our option, replace anyproduct
r e turn e dtoon eo f ourauthorizedservic ecenters withinthi s p e rio d . However, inor d e rto dothis we
must first examine the product and find that it is defective due to workmanship or materials and not
due to misuse, neglect, acciden t, orabn o rmal condition s oroper ation .
Spare and rep lacement parts, and rep airs, all have a 90-day war r an ty.
The oscill o sco p e’s firm war eh as beenthorough lytested an d is pr esu m edto be fun ctio n al .
Neverth el ess, it is suppl ied w ith o ut w arran tyo f an ykind cov erin g detailed perfo r m ance. Pro ducts no t
made by LeCr o yar e cov er ed solelyby the war r anty of the or igin al equipm en t man ufactur er.
WR2-OM-E RevC ISSUED: January2002 15
Page 26

F IRST T HINGS
TAKE ADVANTAGE OF MAINTENANCE AGREEMENTS
W e offer a variety of services under the heading of Maintenance Agreements. These give extende d wa rranty
and allow you to budget maintenance costs after the initial three-year warranty has expired. Installation,
training, enhancements, and on-site repairs — among other services — are available through special
supplemental support agreements. I nquire at your LeCroy customer service center or national distributor.
OBTAIN ASSISTANCE
Help w ith installation, calib ra tion, an d the useof yo u r W a v eru nn er-2 scop ein a ran g eof applications is also
available from your customer service center.
RE T U RN A PRODUCT FOR SERVICE OR REPAIR
If you do need to return a LeCroy product, identify it by its model and
serial numbers (see page 25). Describe the defect or failure, and provide
your name and contact number.
Forfactory returns, usea ReturnAuthorization N umber (RAN),
obtainable from customer service . Attach it so that it can be clearly seen on
the outside of the shipping package to ensure rapid forwarding within
LeCroy.
Return those products requiring only maintenance to your customer
service center.
Within the warranty period, transportation charges to the factory will be your responsibility, while products
under warranty will be returned to you with transport prepaid by L eCroy. Outside the warranty period, you will
ha veto provid eus with a purch a seorder numb e r before the work can bedone . Y ouwill be bille dfor parts and
labo r relatedto the repa ir w o rk, a s w ell as for shipp ing.
Youshouldprepayreturnshipments.LeCroycannotacceptCOD(CashOnDelivery)orCollectReturn
shipments. We recommend using air freight.
STAY UP-TO-DATE
To maintain your Wave runne r-2 scope ’s performance within specifications, have us calibrate it at least once a
year. LeCroy offers state-of-the-art technology by continually refining and improving the instrument’s
cap a b ilitiesa n d op e ra tion. W efreq u e n tly update both firmware an d software during se rvice, free of charge
during w arranty .
: If y ou nee dtoretur n
TTIIPP:
y ourscope, use the or iginal
shipping carton. If this is not
po ssibl e, the cartonused
sho uld be rigid. Th e scope
sh o uld be packedso that it is
surr o un de d by a min imum of
four inches (1 0 cm) of shock
absor ben t material.
Yo ucan also install newfirmw are you rse lf, w ithou t thenee d of a factoryrefit. Simp lyprovideu s with yo u r
Wa verunner-2 serial number and ID, and the version number of the software alrea dy installed (see page 25),
along with ordering information. We w ill provide youw ith a unique option key that has a code to be entered
through the instrument’s front panel to upgrade y our softw are. In addition, the very latest versions of L eCroy ’s
uniq u eoscilloscop esoftw are applications can bedow nlo a d e dfrom theInternet, freeof cha rge. Inclu d ed are
ScopeExplorer and ActiveDSO.
16 ISSUED: January2002 WR2-OM-E Rev C
Page 27
W
av erunn er-2
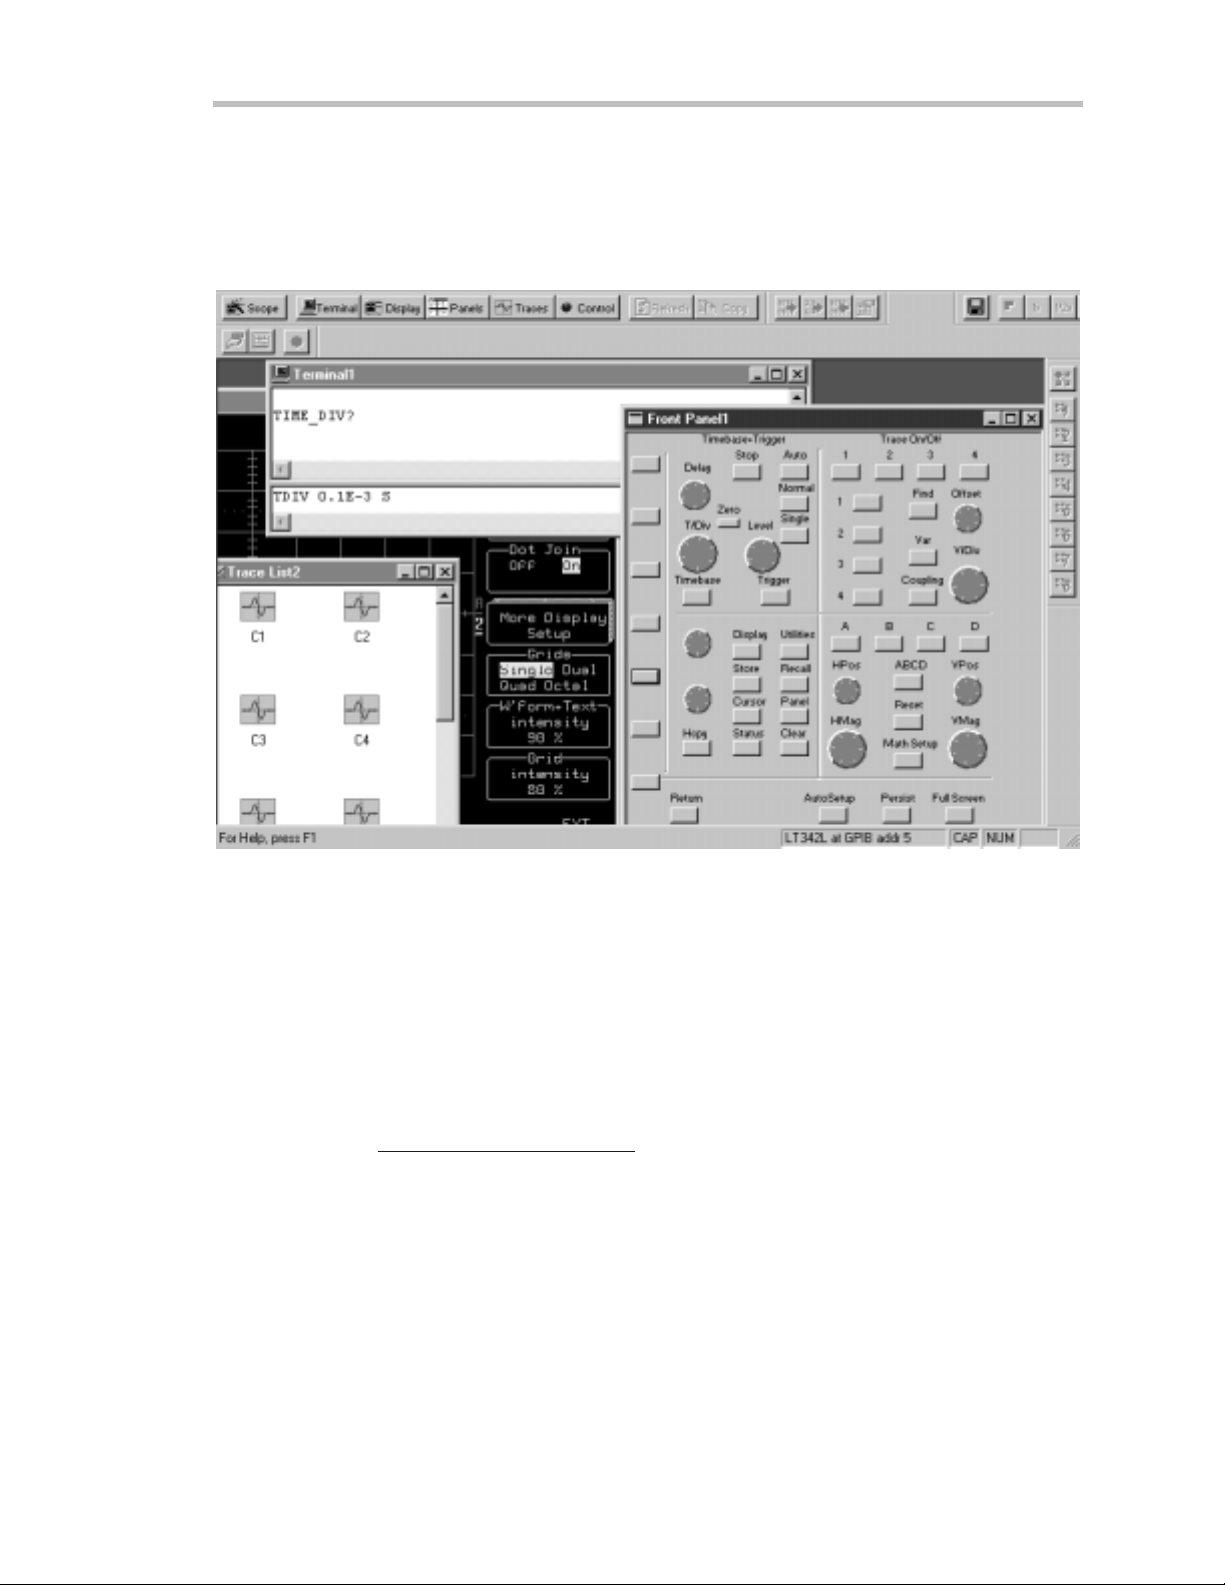
Scope Explor eris a highly practical PC-based connectivity tool that interfaces Wave runner-2 to a PC that is
running Microsoft Windows, via there ar pa n e l GPIB (IEEE 488) or RS-232 port. Specia llydesig n ed by
LeCroy for its oscilloscope s, ScopeExplorer allows you to perform data and image transfers and other remote
operations from scopeto PC with just a fewkeyboard strokes or mouse clicks. See Chapter 12, “U se
Waverunner-2 with P C,” for more about using ScopeExplorer with your Wave runne r-2 scope .
S copeE xplorer now has a virtual front panel to allowfull control of remote scopes.
ActiveDSO works on any PC running Window s 95, 98 or NT, and enables you to exchangedata with a
variety of Windows applications or programming languages that support the ActiveX standard, such as MS
Office, Internet Explorer, Visua l Basic, Visual C++ and Visual Java. ActiveDSO hides the intricacies of
programming for each of these interfaces and provides a simple and consistent interface to the controlling
application. You can also visually embed ActiveDSO in any OLE automation compatible client and use it
manually without programming. You could, for examp le, generate a rep ort by importing scope data straight
into Excel or Word, analyze your wa veforms by bringing them directly into MathCad, archive measurement
results “on the fly” in a Microsoft Access database,and automatetests usingVisual Basic,Java, C++, or
Excel(VBA).
Visit our Web site athttp://www.lecroy.com/software to download these and other free softw are applications.
WR2-OM-E RevC ISSUED: January2002 17
Page 28

F IRST T HINGS
Installation for Safe and E fficient Operation
Saf etySymbols
Where the following symbols or indications appear on the instrument’s front or rea r panels, or elsewhe re in this
manual, theyalert you to important safety considerations.
Sy mbol
WARN IN G
CAUT ION
Meaning
In cor r ect oper ationo rfailur e to heed w arn in gs may result in death orser io us
injury. If a WARN IN G is in d i cate do nth einstr ument, do n ot pr oceed until its
conditions are understood and met.
In cor r ect oper ationorfailur e to heed cautions m ay r esult in injuryor damage to
equipm en t. If a CAUTION is indicated, do not pr oceed un til its condition s are
under stoo d and m et.
Refer to accom p anying docum ents (forsafety rel ated in fo r m atio n).
See elsewhere in this manual wherever the symbol is present, as indicated in the T able of
Contents
Risk of E lectric Shock
Stand-by (Pow er ) State
E arth (Ground) Terminal
Pro te cti ve Conducto rTerm i nal
Altern atin g Curr ent Only
.
Chassis Termin al
E arth (Ground) Terminal on BNC Connectors
18 ISSUED: January2002 WR2-OM-E Rev C
Page 29
W
av erunn er-2
OPERATE IN A SAFE ENVIRONMENT
The Wa verunner-2 is intended for indoor use only.
Ensurethat its operating environ ment will be
maintainedwithin these parameters:
Tempe rature .............5 to 45 ºC
Humidity...................80% max. RH (non-
condensing) up to 35 ºC
Derates to 50% max. RH at
45 ºC
Altitude......................4500 m up to 25 ºC
Derates to 2000 m max. at
45 ºC
Note: TheWaveru nn e r-2 h a s bee nqual if i e dtothe
following E N 61 01 0-1 category:
Protec tionClass..........................................I
Inst alla t i on(Overvoltage) Category...........II
Pollut ionDegree.........................................2
CAUT ION
Donotblocktheairinletorexitports.
CAUT ION
Do not allo wany fo reignmatte rto enterthe
Waverunner-2 through air inlet ports, etc.
WR2-OM-E RevC ISSUED: January2002 19
Page 30

F IRST T HINGS
AC POWER SOURCE
The Wa verunner-2 operates from a single-phase
100–120 V (±10%) AC (~) power sou rce a t
50/60/400 (±10%) Hz, or 200–240 V (±10%) AC (~)
at 50/60 (±10%) Hz.
Maximum pow e r consumption: 250 VA (depe nding on
model)
No manual voltage selection is required because the
instru ment automaticallyadap ts to the line voltag e.
POWER AND GROUND CONNECTIONS
The Waverunner-2 is provided with a 3-wire electrical
cord containing a 3-terminal polarized plug for line
voltage and safety ground connection. The plug’s
groundterminalis connected directlyto the frameof
the Wa verunner-2. For adequa te protection against
electrical hazard, this plug must be inserted into a
mating outlet containing a safety ground contact.
Note: SetthepowerswitchtoSTANDBYbefore
connecting or disconnecting the pow e r cord.
ON /STANDBY SWITCH
The On/ Standby toggle switch controls the basic operational state of the DSO. A portion of the DSO will
remainpowered inthestandby state(5Watts dissipation).
Note: The W av e r un ner-2auto m aticallyadapts
itsel f to thelin evol tage prese nt wi thinthe
follow in g limits:
Voltage
Range: 1 00 – 120 VAC 200 – 240 VAC
Fr equen cy
Range: 50/ 60/400 Hz 50/ 60 H z
WARNIN G
Main tainth e groun dlin eto av o id electric sh o ck.
The power cord’s protective grounding conductor
must be connected to ground.
POWER OFF STATE
TheDSOcanonlybeplacedinacompletepower off statebyunpluggingtheDSO’spower cordfromthe
primary pow er source (AC outlet). It is recommende d that the DSO’s powe r cord be unplugged from the AC
outlet during any extended period of DSO inactivity.
20 ISSUED: January2002 WR2-OM-E Rev C
Page 31

W
av erunn er-2
CALIBRATION
The recommended calibration interval is one year. Calibration should be performed only by qualified personnel.
CLEANING
Clean only the exterior of the instrument, using a
damp , soft cloth. Do not use chemicals or abrasive
elements. Under no circumstances allow moisture to
pene trate the Wa verunner-2. To avoid electric shock,
disconnect the instrument from the pow e r supp ly
before cleaning.
ABNORMAL CONDITIONS
Operate the W ave runner-2 only as intended by the
manufacturer.
Do not operatetheWaverunner-2 withcovers
removed. If you suspect the Wa verunner-2 is damaged
or has failed, immediately set the pow er switch to
STANDBY and disconnect the pow er cord. Refer
servicing to qualified personnel.
WARN IN G
No op er atorserv iceable comp on en ts inside. Do
not remove covers.
WARN IN G
Any use of the instrument in a manner not
specified by the manufacturer may impair the
instrument’s safety protection. T he Waverunner-2
has no t been designed to make direct
measur em en ts onth e hum anbody . Nev er
connect the Waverunner-2 to a living person.
CAUT ION
Do not ex ceed the m ax imum spe cified inp ut
terminal (CH1,CH2, CH3, CH4, E XT) voltage
levels.
WR2-OM-E RevC ISSUED: January2002 21
Page 32

F IRST T HINGS
T
C
Z
C
A
P
M
Up and Running
GET TO KNOWYOUR WAVERUNNER-2– FRONT PANEL
MENU CONTROLS FLOPPY DISK DRIVE TIMEBASE CONTROLS
RIGGER
ONTROLS
OOM & MATH
ONTROLS
WAVE PILOT
MENU ACCESS
SCREEN SAVER
ODE LED
CAL
Waverunner- 2 mai n front panel cont rol s and features.
IN STALL AND POWE R UP
1. Before pow ering up, check that the local pow er source corresponds to Wave runner-2’s powe r range (see
pa g e20).
2. Use the cable provided to connect the scopeto the powe r outlet through its rear panel receptacle (see next
page).
3. Turn the scope on by pressing the On button at the bottom left-hand corner of the Wave runner-2 front
panel (see above) .
NALOG
ERSISTENCE
22 ISSUED: January2002 WR2-OM-E Rev C
Page 33
W
av erunn er-2
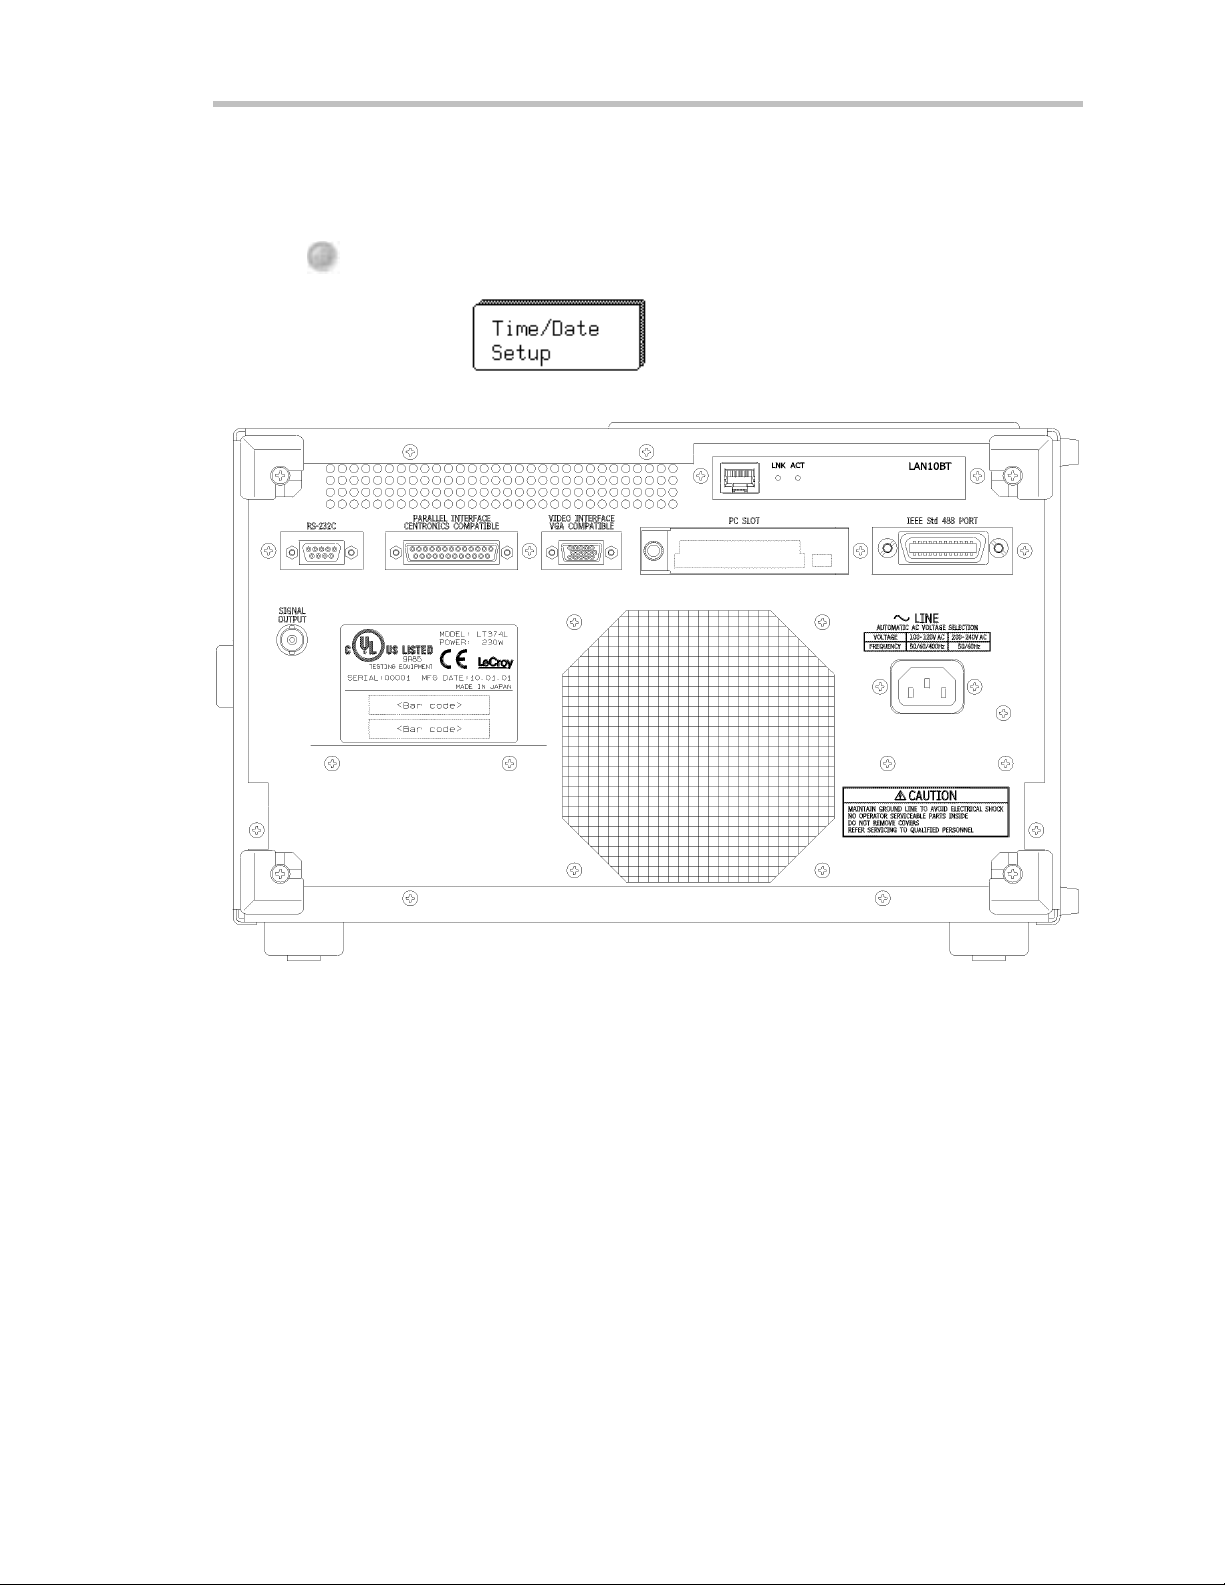
E
Before a disp la yapp ears, the instrum ent w ill au toma ticallyperform ha rdwareand software se lf-te sts, followed
by a full system calibration. The front panel STANDBY L ED will be lit during this sequence. The full testing
procedure will takeabout 10 seconds, after which a display ap pea rs.
UTILITY
4. Press
5. Press the menu soft key for
to displaythe UTIL ITIE S men us.
to set thetimeand date.
GET TO KNOWYOUR WAVERUNNER-2– BACKPANEL
XERNAL
MONITOR
BNC
SIGNAL
OUTPUT
Us e the RS-232- C and GPIB ports to connect your Waverunner-2 scope to a computer or termi nal,
the extern al monitor port t o display your waveforms on another monitor, and the Centronics
port
to connect compatible printers or ot her devices. U se the PC C ard sl ot for t he P C M emory Card and
portable H ard D isk opt ions, and the BN C output for extern al clock signals.
WR2-OM-E RevC ISSUED: January2002 23
Page 34

F IRST T HINGS
TON
AV I G AT ETHROUGHMENUS
Menus
Themenu butto n
Longer menus
Capitalized menus
The two menu knobs
Combin atio n s of kn o bs and buttons
or chang es the variable, while the kn ob adjusts its valu e.
Menus aregrouped
selectaparticularmenuoranitemonamenu.Travelupordowninthemenulist andchangethe
selection. Or change values and sett ings.
The dar ker, labeled button s
to select themenus for initialization. W hen you press any one of these, it offers access t o related
menus in i ts group.
such as ena ble you to perform actions or adjust settings.
beside each displayed m enu controls that menu .
that spanthebreadth of two buttons are controlled by both buttons.
— for exampl e — perform specific actions.
work together with the two menu buttons beside them.
control continuously adjustable variables. T hebuttonselects
and shown together according to their function. Press a buttonor turn a k nob to
PANELS
also play a role in menu selection:
—forexample—wasused
Menus withshadows
Press to r e tu r n
the previous menu display.
to a shado w e d m e nu. A lso use this button wh enever you w ish to go bac k to
Arrows on the s ide of a long menu
Press one or the other of these menus’ buttons t o move in the desired direction, and to view or select
any menu item not displayed. A rrows disappear when you reach the beginn ing or end of the menu
list.
lead to other menus: Press their buttons to display those others.
indicate that you can scroll up or down the menulist.
24 ISSUED: January2002 WR2-OM-E Rev C
Page 35

W
IN IT IAL IZE
Initialize your Wa verunner-2 scope to its basic default w ave form display settings:
PANELS
av erunn er-2
6. Press
to display the PANEL SE TUPS menu group.
7. If Recallis not selected, press the button once to select it:
8. Then press thebutton beside .
Initialize to Waverunner-2 default settings whene ver you wish to clear your settings and make a fresh start on a
newmeasureme nt.
CHECK YOUR WAVERUNN ER-2 SYSTEM
SCOPE
STATUS
Press
9.
to show the STATUS menus.
10. Press the top button to highlight and select Sys t em . The scree n will showyour Wave runner-2’s serial
nu mb er, theversion of softw a reinsta lle dand the date of its relea s e ,as we ll asafull list of your currently
installed softw are and hardw a re.
Contact L eCroy customer service immediately if any of the options you ordered have not been installed.
WR2-OM-E RevC ISSUED: January2002 25
Page 36

F IRST T HINGS
ADD AN OPTION
This menu will also be displayed when you select Sy stem:
Use it to install new options — without the need to return your Waverunner-2 for a refit.
1. Press that menu’s button to display
2. Then press that menu’s button to display the ADD OPTION menus. Use them whenever you wish to add
a Wa verunner-2 option by means of a special code. Contact your LeCroy sales or service center to obtain
the code.
UPDATE TOTHE LATEST FIRMWARE
Your Waverunner-2 comes with the latest firmware installed. But to take advantage of our continuou s
improvement, contact us to obtain a floppy disk or card containing the latest firmware. Then use these menus
to installit:
UTILITY
1. Press
2. Press the button for
3. Place the flopp y or card in the W ave runner-2 and press the buttons to select Floppyor Card and then
Update Flash. Thenewly installedfirmwa re will app e ar on the System Statu s scree n(seeabove).
Yo umay alsodow n load the firmware from the internet, usingScop eExplo rer .
SAVE T HE SCREEN (AND ENERGY)
Enable or disable your Wave runner-2’s screen saver:
1. Press
2. Press the button for “ More Display Setup” to access this menu:
to display the UTIL ITIE S men us.
, then for the one for .
DISPLAY
to showtheDISPLAY SETUP menus.
26 ISSUED: January2002 WR2-OM-E Rev C
Page 37

W
av erunn er-2
3. Press its button, then select Yes or No from
When enabled, the built-in screen saver is activated 10 minutes after the last use of a front panel control. This
is a complete display shutdow n of the internal screen — an “Energy-Saver.” The front panel LE D light will
indicate whe n the scope is in the screen-saving STANDBY state. Press any front panel button to restore the
screen.
DO YOU PRE FER YOUR CON T ROLS WIT H SOUND AN D AUTO-RE PEAT?
Haveyour buttons and knobs rep eat their actions and make an audible sound w hen used:
UTILITY
1. Press
2. Press the button for
3. Make your preferences by means of the USER PRE F’S menus displayed.
With Pushbutton auto-repea t On, all front pane l buttons, whe n pressed and held in, will move the selection
au toma ticallyand sequen tiallythrou g ha ll items in a men u .
With audible feedback for buttons and knobs On, an audible “click” will sound when any front panel button is
pressed or any knob is turned.
to displaythe UTIL ITIE S men us. These you w ill find useful for a variety of functions.
, then the button for .
WR2-OM-E RevC ISSUED: January2002 27
Page 38

F IRST T HINGS
BLANK PAGE
28 ISSUED: January2002 WR2-OM-E Rev C
Page 39

P
P
T
AARRT
O
O
E
NNE
G
T his part of the manual covers the main Waverunner-2 features and explains, step by step, how to use
them. You’ll get to know your scope and start working with it quickly and effectively. Capture and view
w av ef o rms. Zoo mand scr o ll . Learnthe ar t of displ ay . Use mathand measu rem ent tools. Do cum ent
your work.
G
E
E
T
T
TII
T
N
N
GSS
G
T
T
A
A
R
R
T
T
E
E
D
D
WR2-OM-E RevC ISSUED: January2002 29
Page 40

C HAPTER O NE:
In thi s ch a pter, see h ow
To select the input signal channel
To use menus and controls for basic operations
To find yo urwayar ound the display
To adjust the timeb ase, gainan dpo sitio nof th e signal
To zoom— man ual lyand autom atically
To set up thetim ebase
To set sign alcoup l in g
To calibr ate and use th e passiv e pr obe
To set up the CAL and BN C outputs
Catcha N ewWav e
30 ISSUED: January 2002 WR2-OM-E Rev C
Page 41

C HAPTER O NE
Catch a N ewWav e
View Yo ur Wav eform
Take thesesteps tocaptureand viewyour signal;set timeand voltsper division; zoom andauto-scroll:
1. Connect your signa l to the Wave runner-2 (Channel 1 input for this example) .
AUTO
SETUP
2. Press
input signa l. Press it aga in to confirm the action.
to automaticallyset the(Edge) trigger level, timebase, andverticalsettingsfor display of the
3. Press
to select CHANNEL 1 and disp lay the basic Wav e runner-2 me n u s .
4. Use these menus in the steps on the follow ing pages to adjust the signal’s trace
on the screen.
:Press
TurnsChannel 1 on or off.
Accesses the CHANNE L Coupling menus. See page 38.
Automaticallymakes a zoomed traceof thesignal. Usethevertical
POSITION kn ob to movethetrace so that it is clea rlyvisible. Use the
ve rtical ZOOM kno b to adjust its expansionvertica lly. See page 36.
Automaticallysets gain andoffset, and“find” thesignal.
Selec ts fix e dor variab legain. Select “varia ble” to control thechanne l’s
gain continuously. See page 34.
: With AUTO SETUP yo u canautomatically set
TTIIPP:
TTIIPP:
channel on or off.
up signals in the 5 mV to 40 V range with a
frequency of ≥≥≥≥50Hz and a duty cycle
as small as 0.1%.
tw i cetoturnthe
Selects the grid style and number. Next page: Single
grid. See also Chapter 3, “D i splay Your S ignal.”
WR2-OM-E RevC ISSUED: January2002 31
Page 42

P ART O NE: GETTING STARTED
TOF
IN DYOURWAY ARO UN D T H EWAVERUNNER
Real-time Clock field:
displays the current date and time.
Displayed Trace L abel
time/ div and volts/ div sett ings, and cursor readings where appropriat e.
Acqu isiti on Summary field:
attenuation, and coupling for each channel, with the selected
channel highlighted.
-2 D
ISPLAY
powered by a battery-backed real-time clock, it
indicates each channel or channel displ ayed, the
timebase, volts/ div, probe
32 ISSUED: January2002 WR2-OM-E Rev C
Page 43

C HAPTER O NE:
Catch a N ewWav e
Trigger L evel
the trigger voltage level relative to ground level.
Trigger Delay
Trigger Status field
(A U T O, N OR M A L , S IN G L E , S T OPPE D ). T he small square icon flashes
to indicate that an acquisition has been made.
Trigger Configuration field
trigger, and information on the trigger’s source, slope, level and coupling, and
other inform ation when appropriate.
Trace and Ground L evel
mar k er.
Other display areas inc lu de the
time and frequency relative to cursors, and a
specialmessages.Formoreaboutthedisplay,seeChapter3,“DisplayYourSignal.”
USE T IME / DIVT O ADJUST TH E TIME BASE
Ti me a nd Frequency field
arrows onboth sides of the grid that mark
is an arrow indicati ng the trigger time relat ive to t he trace.
shows sample rate and t rigger re-arming status
cont ains an icon indicating t he t ype of
show s the trac e number and ground level
, located belowthe grid and stating
M essag e field
placed above the grid and reserved for
:AUTO SETUP operates only
NNOOTTEE:
on channels that are turned on,
TIME / DIV
unless no channels are turned on.
T hen all channels will be affected.
sns
When more than one channel is
turned on, the first channel in
numerical order with a signal
5. Tu rn
to adjust the timebase as desired.
app lie d to it willbe automatically
set upforedgetriggering.
Thetimeper division is set in a 1–2–5 sequ e n c e. TheWav erun n er-2 au toma ticallyadapts itself to usethe
maximum sampling rate w hene ver the timebase is changed. The selected time/div setting is shown in the trace
labelat thetopleft portionof thescreen, andthesamplingrateinthetrigger status field at the bottom righthand corner.
WR2-OM-E RevC ISSUED: January2002 33
Page 44

P ART O NE: GETTING STARTED
ADJUST SENSITIVITY AND POSITION
VOLTS / DIV
VmV
6. Turn
The volts/div setting is shown in the Channel 1 trace
label.
The next two steps can be tak en (if not already) w hen you
wish to finetunethe vertical gainand get abetter vertical
resolution:
7. Fine tune the vertical gain by selecting “variable” from
theGainmenu(seepage31).
8. Now turn the VOLTS / DIV knob through several
completerotations, so that theentiresignalreaches
from top to bottom of thegrid.Filling thegrid in this
way, yo uca nu sethefull rangeof av a ila b ledigitizing
lev e ls.
OFFSET
9. Use
toreducethevertical gain sen sitivity.
to center the w ave form on the grid.
UTILITY
TTIIPP:
:Press
to select Special Modes.
T hen select the Channels menu to choose
In:tosettheoffset of a gain
(VO LTS/ DIV) change in volts or vertical
divisio n s (this is in vo lts, by default).
Automatic Reca l ib ratio n: to turnthis
featur eonoroff (default is “On ”). “Off”
maysp eed capture, but tim e calibrationis
no t certain durin g the capture per io d.
Global BWL : to control the global
bandwidth limit. When On, the chosen
bandw idth(see page 38 ) appl ies to all
channels. When Off, a bandwidth limit
canbeset in d i v i du al lyforeachchan nel.
ZOO M AND SCROLL AUTOM ATICALLY
Use ZOOM to see more detail on your signal. The display w ill showthe original signal and its zoomed copy.
10. Pre ss
11. Pre ss
12. Press the soft key for:
todisplaytheTRACEAmenus(todisplayTraceB,C,orD,pressitsbutton).
again or the top soft key to display the trace and its label. (Do the same to turn off a trace.)
:Togobacktothedefaultpower-up
TTIIPP:
settings, simultan eo uslypre ss the second
an d fifthm enu soft key s an d .
The menus shown on the next page will be displayed.
13. Use these menus to scroll back and forth through the full leng th of one or all of your zoom copies.
34 ISSUED: January2002 WR2-OM-E Rev C
Page 45

C HAPTER O NE:
MULTI-ZOOM unifies the con trol of all zoom traces , while AUTO-SCROLL
w alks the zoom trace or traces across the referenced trace.
Whe nOff, only the active zoom trace is controlled. When On,all
disp la yed zoo m traces (A, B, C, D) are simu ltan e o u slycontrolled
(a u toma tically) w ith Auto Scroll and (ma nually) w ith thehorizontal
ZOOM and POSITION knobs. See the next page for more on
Multi-Zoom .
To scroll the zoom trace from right to left of screen. When playing,
the menu is labeled “ STOP (PLAYIN G)”: Press to stop.
To scroll thezoom tracefrom left to right of screen . Whe nplayin g,
the menu is labeled “ STOP (RE VERSIN G)”: Press to stop.
To scroll by divisions per second or number of divisions. Use div/s to
scroll continuously for view ing. Use number of div forwaveform
processing ,especia llyPass/Fail testing. Whenp roce ssingis comp le te,
the displayw ill be updated by the number of divisions set.
To set scroll spee d, usingthe knob . Whenscrolling by
divisions, 10 div will step the zoom trace “grid-page” by
“grid-page” across the length of the referenced trace.
Catch a N ewWav e
To return to the TRACE A menus, while continuing to
scroll, by pressing the menu soft key.
To stop scrolling and return to the previous menu displayed.
: Conside rzoomas an ex tra timebase th at offer s
TTIIPP:
alternativ e sweepsp eed s. Yo u can disp layas many
as four zooms at once.
WR2-OM-E RevC ISSUED: January2002 35
Page 46

P ART O NE: GETTING STARTED
USE THE POSITION AND ZOOM CON TROLS
POSITION
: T he smaller Waverunner-2 knobs
TTIIPP:
arer ate sen siti v e: the fasteryour o tate
th e m, the greate rth e ch a nge that
r e su l ts p e rdegre eo f ro ta tion .
14. Turn
When using more than one grid (see Chapter 3), turn POSITION to movetraces from one grid to another.
ZOOM
15. Turn
POSITION
16. Turn
ZOOM
17. Turn
to placeTraceA verticallyonthegrid.
to adjust the expansion factor and increase the amount of zoom.
to move the zoomed region of t hetrace.
to vertically expand, or reduce, the zoom trace.
TOZ
OOM AN DMULTI-ZOOM
You can zoom several traces from a single waveform to obtain precise t iming
measuremen ts and im prove the time resolution on your displayed waveform . F or
in stance, on a w aveform com posed of tw o pu lses separated by a long delay, you could
make Trace A a zoom of the first pulse, and TraceB a zoom of the second.
Multi-Zoom
traces, or t wo or more regions of t he same trace, simult aneously. W hen you act ivat e mult i-zoom,
the horizontal zoomand position controls apply to all displayed traces — A , B, C , and D —
allowing you to view similar sect ions of different traces at t he same t ime. The vertical sensitivity
cont rols still act individual ly on t he t races.
When trace labels have dotted t op and bottom edges, like the one at right, this
in dicates that their traces are m u lt i-zoomed.
allows you to move the zoom ed region of the waveform along two or mo re different
36 ISSUED: January2002 WR2-OM-E Rev C
Page 47

SET UP THE TIMEBASE
SETUP
C HAPTER O NE:
Catch a N ewWav e
18. Pre ss
in the Horizontal group of control buttons to access the TIMEBASE menus .
19. Use these menus to set up the timebase in single-shot mode. See Chapter 7,
“A Quest ion of T imebase,” for more on the sampling modes.
Singl e-Shot sam p lin gdispl a y sdatacollecte dduringsucc e ssi vesing le -s ho t
acqu isitions from theinpu t channels — capture nonrecurring, or verylow
repetition-rateevents, simu ltan eouslyon all input channels.
To select Internalor external — ECL, 0V, TTL — clock modes.
Selec t internal unle ss usin gan external cloc ksignal. SeeChap te r 7, “A
Question of Timebase,” forexternal clock.TheLT374 and
LT264 series havea “Channe l Use” menu belo w“Sam pleClock” (see
“Pairing Channels” in Chap ter 8).
To switch sequence mode Onor Off.Usetheknobto
choose the number of seg ments. See Chapter 7, “A
Question of Timebase,” forsequence sampling.
To select the maximum number of samples to be
acquired, using the menu knob; and, to set the default
50k, using the menu soft key .
WR2-OM-E RevC ISSUED: January2002 37
Page 48

P ART O NE: GETTING STARTED
SET THE COUPLING
20. Pre ss
and then the soft key for to display the coupling menus.
21. Use these menus to set input signal coupling and grounding, the channel
bandw idth limit, and the probe attenuation.
Selects the signal coupling.
Moves your selection down the list. When at the bottom, as here, the
dow n arrow disappears and this soft key becomes inactive.
Press NORMAL to set offset, volts/ div , and input coupling to display
ECL signals. Press again; settings for TTL signals are given. Press a
third time; settings willreturn tothoseof thelast manual setup.
Press to turn the bandw idth limit Off or reduce the bandw idth to
200 MHz or 20 MHz. Reduces signal and system noise and prevents
high -frequencya lia sin g. Global BWL mean s that thelimit set w ill
ap p lyto all cha n n e ls. BWL mean s that a limit can be se t individu ally
for each channel. Seethe TIP on page 34 for how to set these, using
SPECIAL MODES.
Sets the probe attenuation factor for the input channel.
The soft keys scroll up or dow n, while the knobs scroll
theselector up anddown the list. LeCroy’sProBus
system automa tically sense s probe s and sets the ir
attenuation. This menu then changes to indicate the
typeof probeattachedand itsattenuation factor. See
the following pages for more on probes and ProBus.
:
NNOOTTEE:
AC position: signals are coupled capacitively , the input signal’s DC compon ent is blocked, and
signal fre quen cies belo w1 0Hz are lim ited.
DC position: signal frequency components are allowed to pass through, and an input impedance
of either1MΩΩΩΩ or 50 ΩΩΩΩ canbe selected. Th e max im umdissipation into50ΩΩΩΩ is 0.5 W. Whenever
this is attain ed, inp uts will autom aticallybe gr o un de d. “Gro unded” will be highligh ted in the
“Couplin g” menu and an ov er lo ad message willbe displaye d in the AcquisitionSumm ar yfield.
Reset by rem o v in g the sign al fromth e inp ut and reselecting “DC5 0ΩΩΩΩ.”
38 ISSUED: January2002 WR2-OM-E Rev C
Page 49

SET UP FOR CAL AND BNC SIGNALS
UTILITY
C HAPTER O NE:
Catch a N ewWav e
1. Press
.
2. Press the soft key to select
and display the CAL BNC OUT menus.
3. Use these menus to choose the type of signal put out at the front CAL and
rear BNC signal outputs. Set the frequency , amplitude, and pulse shape of
thecalibration signal.
Sets the typ e of signal from the rear BNC connector.
Resets the CAL output to its default state: a 1 kHz 1 V square wave.
TheWa v eru nn er-2 au toma ticallysets theca lib ration sign a l to its de fault
when switched on.
Selects the form of the calibration signal.
Sets thepulselevel forthe CAL output (range: −1.00 to
1.00 V),u sin gthek no b.
Sets the desired freque ncy of a CAL signal in the range
500 Hz to1 MHz, usingthe knob.
WR2-OM-E RevC ISSUED: January2002 39
Page 50

P ART O NE: GETTING STARTED
TOC
ALIBRATE THEPASSIV EPROBE
Your Waverunner-2 scope comes with a L eC roy passive probe for each channel.
First.
Second.
Third.
Things”).
Fourth.
T he C A L signal will be a 1 k H z square wave, 1 V p–p.
Fifth.
Sixth.
Seventh.
1MHz.
Eighth.
T urn on your Waverunner-2 scope.
Insert the probe lead in the Channel 1 input.
Connect the probe tip t o the C A L out put (see front panel ill ustrat ion in “ F irst
Attach the lead’s alligat or clip to the ground ring indicated by ,locatedbelowCAL.
UTILITY
Press
Turn the knob for and set the amplitude level.
Nowturntheknobfor to set the frequency in the range 500 H z to
S et channel coupling to D C 1 MΩusing “C oupling” (see previous page).
, then the soft key to select
N inth.
T enth.
I f overshoot or undershoot of t he displayed signal occurs, adjust the probe by inserting the smal l
screwdriver, supplied with the probe package, into the potent iometer on the probe headand turning it
clock wise or countercl ock wise t o achieve the opt imal square wave contour.
Press to turnonChannel 1.
AUTO
SETUP
Press
twice.
40 ISSUED: January2002 WR2-OM-E Rev C
Page 51

C HAPTER O NE:
Catch a N ewWav e
HOWPROBUSH
L eC roy’s ProBus probe system provides a complete measurem ent solution from probe
tip to oscilloscope display.
ProBus allow s you to con trol transparen t gain and offset direc tly from your front pan el —
particularly useful for voltage, differential, and current active probes. I t uploads gain and offset
corr ection factors from the ProBus E PR OM S , and automat ical ly compensates to achieve fully
calibrated mea surem en ts.
T his intelligent i nterconnection bet ween your Waverunner-2 scope and a wide range of accessories
offers important advantages over st andard BN C and probe ring connections. Pr oBus ensures corr ect
input coupling by auto-sensing the probe type, eliminating the guesswork an d errors that occur when
attenuation or ampl ification factors are set manually.
ELPSYOU
: Use the Wav er un n er -2’s rear pan el BNC sign al output topr o v ide a
TTIIPP:
pulse:
Fo rPass/Fail testing
At th eo ccu r rence of eachaccepte d tr i ggerevent (TriggerOut)
Whenth e scope is ready to accept a trigger event (Tr iggerRdy)
WR2-OM-E RevC ISSUED: January2002 41
Page 52

C HAPTER T WO:
In thi s ch a pter, see h ow
Tocontro ltr iggers
Toset upanEdge trigger
Tore-armtri ggering
To determ in e level, coup lin g an d slope
To use Windo wtr igger
To obtain a summ ar yo f y o urtrigger and systemstatus
SimplyTrigger
42
ISSUED: January2002 WR2-OM-E Rev C
Page 53

C HAPTER T WO
SimplyTrigger
Edge Tr iggeronSim p le Sign als
The Wa verunner-2 uses manywaveform capture technique s that trigger on features and conditions, which you
define . These trigge rs fall into two major categories:
Edge— activated by basic w ave form fea tures or conditions such as a positive or negative slope, and
holdoff
SMART Tr igger — sophisticated triggers that enable you to use basic and complex conditions for
triggering.SeeChapter 8, “Trigger Sm art.”
Use the E dge trigger typefor simple signals, and the SMART Trigger typefor signals with rarer features such
as glitches.
CONTROL TRIGGE RING
DELAY
Horizontal:Turn
Yo ucan adjust thetrigge r’s p os ition from 0% to 100% pre-trigg e r,from left to right on thegrid. DELAY can
also be used for setting the post-trigger, in time units, up to 10 000 divisions, in increments of 0.1 division.
The trigger location is shown by the arrowat the grid bottom, as
shown here at near right.
Post-trigge r delay is labe led in thetrigge r delay field, w h e rethe
arrowbecomes horizontal, as show n here at far right.
LEVEL
Vertical: Turn
Turn this knob to adjust the level of the trigger source or the highlighted trace. L evel defines the source voltage
at which the trigger will generate an event — a change in the input signal that satisfies the trigger conditions.
Arrow s on both sides of the grid show the threshold position. But these arrows are only
visible if the trigger source is displayed and the source signal DC coupled.
WR2-OM-E RevC ISSUED: January2002 43
to adjust the trigger’s horizontal position.
to adjust the trigger’svertical threshold.
Page 54
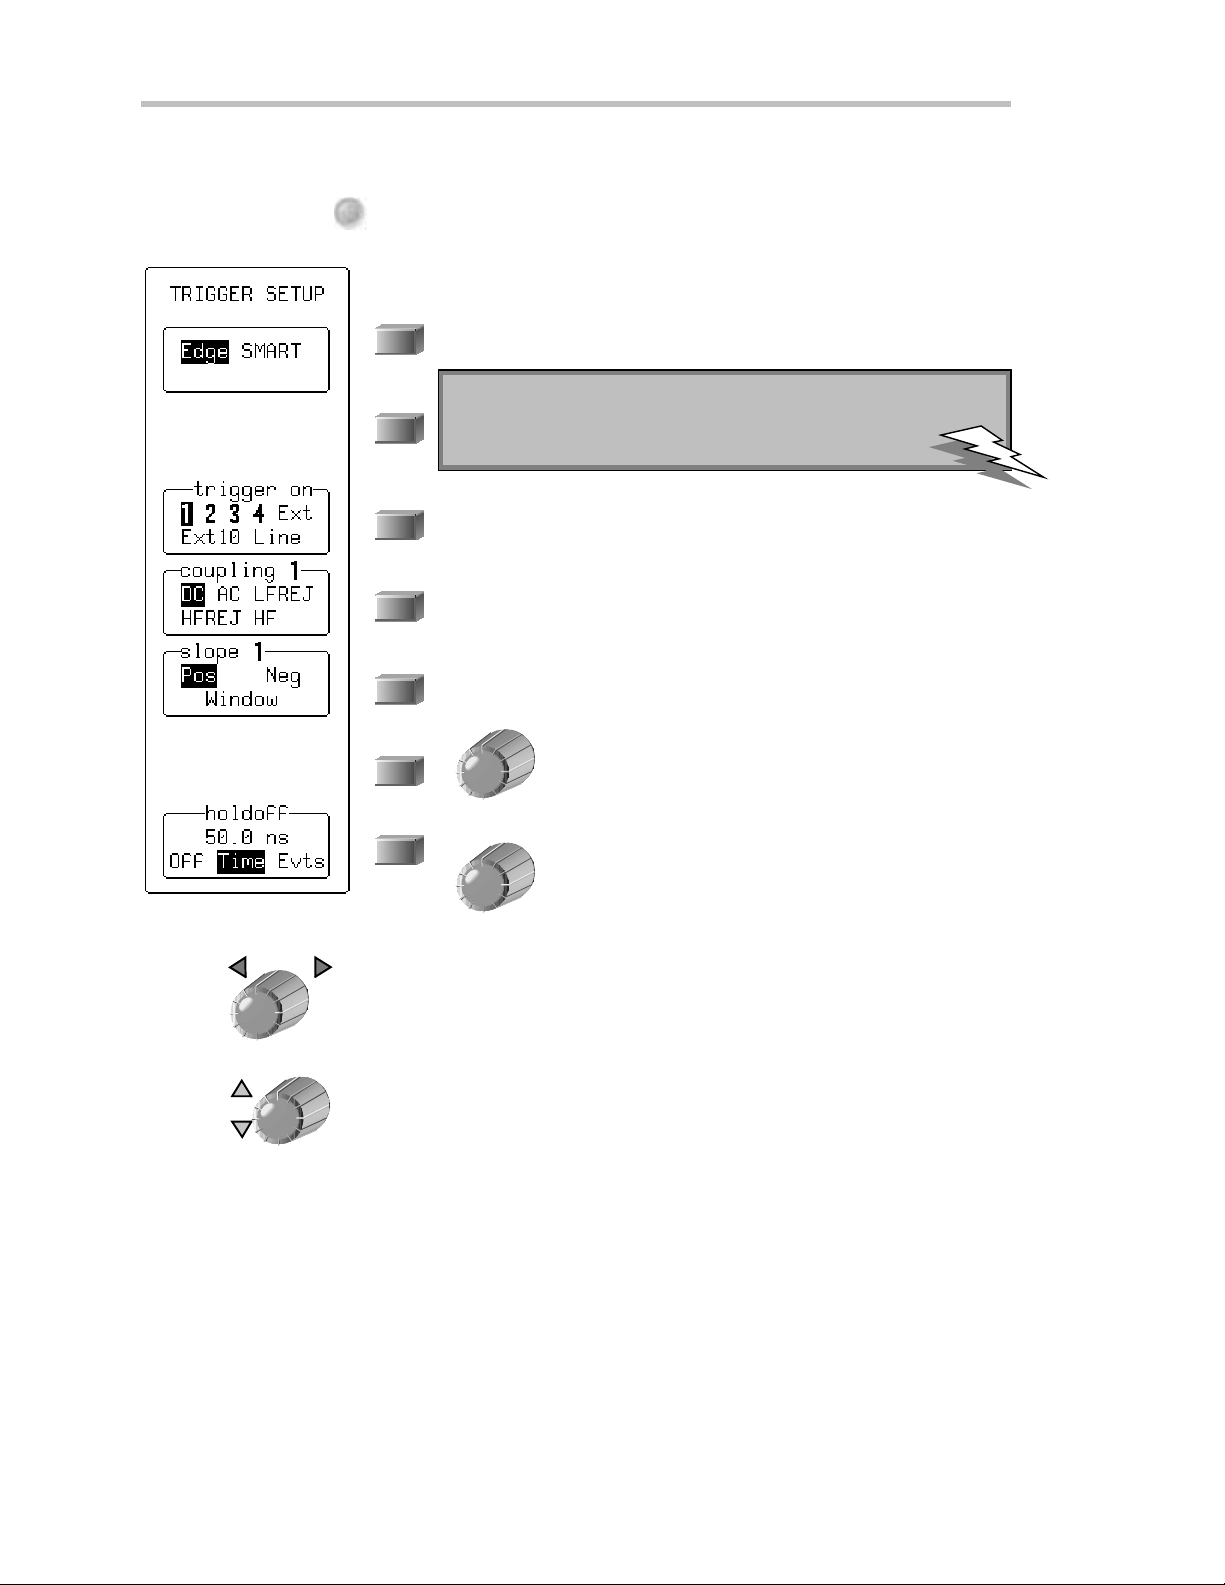
P ART O NE: GETTING STARTED
SE T UP AN EDGE TRIGGER
SETUP
1. Press TRIGGER
to access these menus:
Use them to select the trigger source, the source’s coupling, the slope (positive
or negative) and the amount of trigger holdoff by time or events.
1. Select “Edge” or “SMART”: “Edge” is selected by default.
: Once set, trigger level and coupling pass unchanged from
TTIIPP:
tr i ggertyp etotriggerty pe foreachtriggersource.
2. Select the trigger source. This could be a signal on a channel, the
line voltage that powe rs the Wa verunner-2, or the EXT BNC
connector.
3. Select the coupling for the trigge r sou rce .
4. Place the trigger point on the positive or negative slope of the
selected source, or choose to define a window.
Whe n Windowis selected from the above menu, a
menu appea rs heretha t allows youto define the
window ’ s size. See page 47.
Enableholdoff to dela ytriggeringfor a defined time , or
numberof events,afteraparticulartriggerevent.Use
this soft key to select Time or Events,andtheknobto
set theva lue. Offdeactivates the holdoff. SeeChapter 8,
“Trigger S mart.”
DELAY
5. Tu rn
LEVEL
6. Tu rn
to adjust the trigger’s horizontal position, and the amount of pre-trigger, as desired.
to adjust the trigger voltage level.
44 ISSUED: January2002 WR2-OM-E Rev C
Page 55

TOD
ETERMINETRIGGE RLEVEL,COUPL ING AN DSLOPE
C HAPTER T WO:
SimplyTrigger
Level
a change in the input signal that satisfies the trigger conditions. The selected t rigger
level is associat ed with t he chosen trigger source.
Trigger level is spec ified in volts and normally rema ins un c han ged w hen you chan ge the vertic al gain
or offset. The amplit ude and range of t he trigger level are l imit ed as fol l ows:
C oupling
trigger level, you can select the coupling indepen dently for each source. Chan ge the trigger source an d
you can change the couplin g. You can choose from these couplin g types:
bursts or where the use of A C coupling would shift the effective trigger level.
levels are rejected and frequenc ies below 50 H z
attenuated.
capacitivehigh-pass filter network, D C is rejected
an d signal frequenc ies below 50 k Hz are attenua ted.
For stable triggering on med ium to high frequen c y
signals.
circuit, and alow-pass filter network attenuates
frequencies above 50 k H z; used for triggering on l ow
frequencies.
definesthesourcevoltageatwhichthetriggercircuitwillgenerateanevent:
±5 screen divisions wit h a channel as the t rigger source
±0.5 V withEXT as the trigger source
±5 V with E X T/ 10 as t he t rigger source
N one with L I N E as the trigger source (zero crossing is used).
refers t o t he t ype of signal coupling at the input of the t rigger circuit. A s wit h t he
DC: A ll the signa l's frequen c y com ponen ts are coupled to the t rigger circuit for high frequen cy
A C : T he s ignal is capacitivel y coupl ed, D C
LF REJ:Thesignaliscoupledthrougha
HF RE J: Signals are DC coupled to the trigger
e
p
o
l
S
e
v
Trigger level
i
t
i
s
o
P
H F: U se only when needed for triggering on
high-frequency repetitive signals. H F is
automatically overridden and set t o A C when
incompatible with trigger characteristics such as those
of S M A R T T rigger.
Slope
transition used for generating a particular trigger
event. You can choose a positive or neg ative slope.
L ike coupling, t he sel ected slope is associated with
the chosent rigger source.
WR2-OM-E RevC ISSUED: January2002 45
determines the directionof the trigger voltage
F igure 1. E dge trigger work s on the selected
edge at the chosen level. T he slope — positive
here — is highlighted on the trigger ic on .
Trigger
Page 56

P ART O NE: GETTING STARTED
TORE-A
RM ATRIGGE R
Three trigger re-arming modes — AU TO, N ORMA L , and SIN GL E — are
available for all types of triggers. In addition, S T OP canc els the capture in all
three modes.
AUTO
Press
to activate A U T O mode: the trace will automatically be displayed if no trigger occurs
soon after. But if a sign al does occu r, the Waverunn er-2 behaves as if in N OR M A L mo de.
NORMAL
Press
to enter NORM AL mode and continuously update the display while thereis a valid
trigger. I f there is no valid trigger, the last signal is retained and the warning “ S L OW
TRIG GE R” is displayed in t he t rigger st atus field.
SINGLE
Press
to enter S IN GL E m od e: the Waverunne r-2 will wait for a single trigger t o occ u r, then
display the signal and stop capturing. I f no trigger occurs, you can press t his button again t o
manuall y t rigger t he scope.
STOP
Press
to halt the capture made in AUTO, N ORM A L or S I N GL E re-arming modes. Press
STOP to prevent capture of a new signal, or w hile a sing le-shot capture is un de r wa y to keep the
last captured signal.
TOR
ECOGNIZETRIGGE RICON S
T rigger icons al low immediat e on-screen recognit ion of t he current t rigger condit ions. T here is an
icon for each trigger. The more heavily marked transitions on the icon indicate t he sl ope on which the
trigger will be generated. The icons are annotatedwith information on the trigger settings.
This icon, for example, represents an Edge trigger set up to trigger on the positive slope, at a level of
0.008 V , wit h a holdoff time of 50 ns.
46 ISSUED: January2002 WR2-OM-E Rev C
Page 57

C HAPTER T WO:
USE WINDOWTRIGGER
Define a region whose boundaries extend above and below the selected trigger level. A trigger event will occur
whe n the signal lea ves this window region in either direction and passes into the upp er or low e r region (Fig. 2).
The next trigger will occur when the signal again passes into the window region.
SimplyTrigger
1. Select
2. Then turn the knob for
As you turn the knob, a solid bar that shrinks or lengthens at the left-hand side of the grid visually indicates the
window ’ s height.
TriggerLevel
.
to define the size of the windowregion (0.80 to 9.99 V).
UpperR egion
WIN DOW REGION
Lower Region
Time
Triggers
F igure 2. W in dow T rigger: t riggers when the sign al leaves the win dow region. T he arrows indicate
wher e t ri ggers occur when the signal l eaves t he wi ndow r egion.
WR2-OM-E RevC ISSUED: January2002 47
Page 58

P ART O NE: GETTING STARTED
T RIGGER SOU RCE
Thetriggersourcemaybeoneofthefollowing:
The acquisition channel signal (CH 1, CH 2, CH 3 or CH 4) conditioned for the overall voltage gain,
coupling, an dbandwidth.
The line voltage tha t powers the oscillosco p e (LINE ) . This can be use d to provide a stab le display of
signals synchronous with the pow er line. Coupling and level are not relevant for this selection.
The signal applied to the EXT BNC connector (E XT). This can be used to trigge r the oscilloscope within
arangeof
Level
Level defines the source voltage at which the trigger circuit will generate an event (a change in the input signal
that satisfies the trigger conditions). The selected trigger level is associated with the chosen trigger source. Note
that the trigger level is specified in volts and normally remains unchanged when the vertical gain or offset is
modified.
TheAmplitud eand Ran g eof the trigger lev e l arelimite d as follows:
±5 screen divisions with a channel as the trigger source
±5VwithEXT/10
none with LINE as the trigger source (zero crossing is used)
±0.5 V on E XT and ±5 V with EXT/10 as thetrigger source.
Note:
Note:
Note:Note:
On ce specified, Tr igger Level andCoupling are theonly
pa rameters that pa ssunch a nged fr omtriggerm ode to tr i ggermo d e
foreachtr igger source.
48 ISSUED: January2002 WR2-OM-E Rev C
Page 59

C HAPTER T WO:
SimplyTrigger
OBTAIN A TRIGGER STAT USSUMMARY
Display a summary of the status of your trigger, as well as timebase , vertical sensitivity , probe attenuation, and
offset and coupling for each channel.
SCOPE
STATUS
PRINT
SCREEN
1. Press
to show the STATUS menus.
2. Select Acquisition.
TTIIPP:
:Press
to documen t yo urstatus summary
an d mak ea hard copy.
PANELS
Press
wheny ou h ave a setting you w ant to
reuse(seethenextchapterformoreonthis).
Press the S COPE S TA T U S button for acc ess to full-screen sum maries of your Waveru n n er-2’s
systemst atus and other functional status.
See Chapter 8, “Tr iggerSm art,” formoreabo ut E dge triggerand all about the SMART Trigger types.
WR2-OM-E RevC ISSUED: January2002 49
Page 60

C HAPTER T HREE:
In thi s ch a pter, see ho w
To viewsignalch an ges ov ertime
To set up thedisp lay
Disp l ayYourSignal
Toset upforAn alog Per sistence
Tochoose a gridsty le
To save an d recal l panel setups
50
ISSUED: January2002 WR2-OM-E Rev C
Page 61

C HAPTER T HREE
Displ ayPer sisten ce
Disp layYourSign al
You can use Waverunner-2 colors and tools to display you r
signal on the screen.
View one, two, fou r, or eigh t grids and upto eigh t trac e s
(depe nding on model) at the same time. Adjust display and
grid intensity. Cho osefrom several grid sty le s. Or fill the
entire screen with your waveforms using Full Screen.
: To clear your settings and make a
TTIIPP:
“fresh” start on a new waveform:
1. Connect the signal to be measured to a
Waverunner-2 channel.
2. Simultaneo usly pr ess th e second and
fifth menu soft keys an d to re ver t
Yo ucan person a lizeyou r W averunn er-2 disp la y, while
managing color and scree n intensity automatically. The
displayed signal and all related information share identifying
colors chosen by you. Show signals and traces opaquely or
transparently,so that overlappingobjects — traces over
traces, trace sover grids — arealways visible.
Other invaluable tools and technique s, such as the
Analog Persistence feature, help you displa y your wa veform
and reveal its idiosyncrasies.
to th ede f au l t settings.
3. Turnoff an yunw an ted traces by
pressin g A, B, C, orD.
4. PressSELECT1,2,3,or4forthe
signal’s channel and choose
“Coupling.” E nsure that the coupling
matches the circuit’s impedance. I f not,
setitcorrectlyusingthemenusoftkey.
5. PressAUTOSE TUP twice.
Thenfollo wth e steps below.
VIEW SIGNAL CHANGES OVER TIME
Use Persistence to accumulate on-screen points from many acquisitions and seeyour signa l change over time.
The Wa verunner-2 persistence modes show the most frequent signal path “three-dimensionally” in intensities
of the same color, or graded in a spectrum of colors.
To display y our waveform with persistence:
ANALOG
PERSIST
1. Press
Analog Persistence or Color Graded persistence.
DISPLAY
2. Press
WR2-OM-E RevC ISSUED: January2002 51
to display your signal with
to displaythe “Displa y Setup” menus.
Page 62

P ART O NE: GETTING STARTED
SET UP YOUR DISPLAY
3. Use these menus to set up your display . When not using persistence, some menus
are different, as indicated below.
Selects standard or XY displa y: Standardis se le ctedby defau lt.
See Chapter 9, “ D ispl ay M or e,” for XY display .
Turns persistence on or off. Or press
Infiniteis the default “pe rsist for” setting unde r Persistence Setup.
Sets up the persistence display (see next page). When Persistence is Off,
this menu becomes Dot Join: when there are more than 400 sample
points on the screen, the points are connected by line seg ments.
Accesses more display setup menus. See Chapter 9, “ D ispl ay M o re.”
Selects the grid style and number. Seepage 58.
ANALOG
PERSIST
to toggleit onor off.
Used with persistence to select the displayed trace for the
menu action below. When persistence is not being used, this
menu is calledW’form+ Text and its knob adjusts
waveform and text brightness.
Used with persistence to select the percentage of
saturation:100% sprea d s the sp e c trum across the entire
depth of the persistence data map; at lower values, the
spectrum will saturate— brightest color or shade — at the
percentage value specified. L owering this percentage causes
: At 0% intensity in Standar d display
TTIIPP:
with o ut persistence, th e wav efo r man d text
disappear.
PANELS
Press
to r e cal la pa nelsetu pand to
r e turnthemto no rm albrightn e ss.
the pixels to be saturated at a lower data intensity , and
makes visiblerare lyhit pix e ls not see n a t highe r
percentages.
Whe n persistence is not beingu sed, this menu is calle d
Grid intensity; its knob adjusts the intensity of the grid.
Grids canbe brightene d , or blen d e dwith displa yed traces
by reducing their intensity. Also press this menu soft key to
return brightness from 0% to the default level.
52 ISSUED: January2002 WR2-OM-E Rev C
Page 63

SET UP FOR PERSISTENCE
C
C HAPTER T HREE:
Disp layYourSign al
4. Press the menu soft key for
5. Use them to set up your persistence display .
to access these menus.
Disp lays the last trace cap tured.
Selects the persistence duration, in seconds. If this w ere to be set at
1 s, for example , each captured trace w ould be displayed for one
second and then deleted. The number of swe eps include d in the
disp la y(upto onemillion )is indica tedat thebottom of eac h trace
label. Thedefault selection is Infinite.
Selects persistence for all, or the top two labeled traces displayed. T his
becomes useful when four traces or functions are show n and
pe rsisten cewill not be app lied to all of them.
Selects Analog and renders the persistence data maps to the screen in
intensities of thetracecolor; or sele cts ColorGraded,wherethe
maps are rendered in a red-to-violet spe ctrum.
Selects the displayed trace for the menu action below.
Selectsthepercentageof saturation. Seemenu
explanation on the previous page.
6. Press Return to go back to the main display setup menus.
LEAR
SWEEPS
TTIIPP:
:Press
to r e sta r t th ep e rsiste nce accum u l ati ono f
po in ts — forex am p le, wh eny o u change the signal sour ce and
w an t to clear the prev io us trace.
WR2-OM-E RevC ISSUED: January2002 53
Page 64

P ART O NE: GETTING STARTED
SET UP FOR PERSISTENCE AND HISTORY USING ANALOG PERSIST BU TTON
ANALOG
PERSIST
7. Press
.
8. Use them to set up your persistence display .
Enables Persistence. The display ed time interval is the“Persist for”
settingfrom PersistenceSetup.
Displays the PE RSISTE NCE SE TUP menus described on the
preceding page. The number of swe ep s included in the displa y (up to
onemillion) is indicatedat the bottom of eac htrace la bel. The default
selection is Infinite.
Displays History menus (see next page).
54 ISSUED: January2002 WR2-OM-E Rev C
Page 65

C HAPTER T HREE:
W
HENUSIN G T H EANALOGPE RSI ST B UT T O N T OENTERHISTORY
Disp layYourSign al
The default num ber of segmen ts and the record length are determ ined by the
“ S equence” and “ R ecord up t o” set tings i n t he T imebase menu. You can change
thes e settings at any t ime, alt hough doing so will cl ear s weeps and begi n a new
collect ion of data. I n H istor y mode, each sweep will be composed of a number of
segments,eachwithadefinedrecordlength.
To initiate H istory data collection, properly trigger the scope; the signal will be
collect ed. Persis tence will be aut omat icall y tur ned on befor e dat a collect ion, wit h the
“Persist for” setting defaulted to w hatever was previously set.
To collect more than one sweep, trigger in
NORMAL
mode or pr es s
SINGLE
for the
required number of sweeps. Si ngl e shot t riggering is best because there is no way to
view a segmen t in a sweep earlier than the current sweep unless that sweep was
saved to memory.
WR2-OM-E RevC ISSUED: January2002 55
Page 66

P ART O NE: GETTING STARTED
SET UP FOR HISTORY
9. From the PERSIST menu, select
10. Use these menus to set up your History display .
.
Turns History off and returns to preceding menu.
Searches through a set of segments one by one or plays throug h them
in forw ard or reverse order, with a pause for each display.
Selects the typ e of segment data to be display ed belowthe grid.
Timestamp display s acquisition time for each segment, time since the
first segment in that sweep, and time between segments. Voltage
displays five voltage parameters plus statistics. Timedisplays similar
information for time parameters.
Selects the trace for display , defined by the selections below.
Selects the number of events w hen Timeor Voltage is
sele cted for “Show” abov e . When Timestamp is
selected, you can scroll throug h the segments one at a
time by pressing the soft key, or play through them in
forwa rd or reverse order by turning the knob .
Used with persistence to select the percentage of
saturation:100% sprea d s the sp e c trum across the entire
depth of the persistence data map; at lower values, the
spectrum will saturate(brightest color or shade)at the
percentage value specified. L owering this percentage
causes the pixels to be saturated at a lower data intensity ,
and makes visible rarely hit pixels not seen at higher
percentages.
56 ISSUED: January2002 WR2-OM-E Rev C
Page 67

C HAPTER T HREE:
11. To view a particular segment, from the HISTORY menu select .Thesegment
selected is displayed on channel D.
12. Usethese menus to locatethesegment for display.
Automaticallydis p lays ea c hse gmen t sequ e n tiallyforward, be g inn ing
with the selected segment. Press a second time to stop forward play .
Automaticallydis p lays ea c hse gmen t sequ e n tiallyback wa rd, be g in nin g
with the selected segment. Press a second time to stop backward play .
Disp layYourSign al
Press the button to advance forwa rd one segment at a
time,orturntheknobforwardorbackwardtorapidly
loca te a segmen t.
WR2-OM-E RevC ISSUED: January2002 57
Page 68

P ART O NE: GETTING STARTED
CHOOSE A GRID STYLE
At left arethe Standard grid styles for one, two, and four
grids. Dep ending on the Wave runner-2 model, six or eight
traces on six or eight grids can be shown at once (see
facing page) , with their trace labels and any combination
of math, zoom, and memories. Standard grids present
source w aveforms versus time (for FFT, versus frequ e ncy ) .
XY display, on the other hand, compares one source
w ave form with another. It has its own special grids (see
Chapter 9, “ Display More” ). TheParame ter-style grid
is displa yed a u toma ticallywh e n p a ram e te rs are use d(see
next chapter).
TOL
IN K ANDSE PARAT EOBJECTS
WI T HCOLOR
Advanced color manag ement
objects — grids, waveforms, curs ors, or text — are
alw a ys visible, even w hen overlapping. S ign als and
their related data are color associated. E ach trace
has its own dedicated color. Persisten ce displays are
automatically color matched t o the parent trace.
Relatedtracesandtext,iconsandparent-daughter
zoom regions are also l ink edby color.
Thechoiceof backgroundcolor
darker colors so that displayed objects will be clearly
defined and recognizable. T he colors of obj ect s that
aretoocloseinhuetothechosenbackgroundcolor
are autom atically changed so that the objects always
stand out .
Each trace has its owncol o r.
zoomed sect ions of a t race can be given their own
colors, so that a single trace may have a number of
colors at once: its principal color plus those of a
number of expanded regions.
Tr ace-related tex t
information t hat describe measurement paramet ers,
cursors, triggers, waveforms, and channels. A
standard text color covering all on-screen text ex ists
in the preset color schemes, or canbe chosen for
custom palettes. S ee Chapter 9, “ Display M ore.”
in c ludes piec es of on-screen
ensures that
is limited t o the
But ex panded or
58 ISSUED: January2002 WR2-OM-E Rev C
Page 69

C HAPTER T HREE:
Disp layYourSign al
Waveformsource descriptions, trace l abels and the information they contain will al ways take the
color of their respecti ve traces, as in this four-channel model’s Oct al-grid, eight-trace displ ay.
Most menus aredisp layed in thetext coloronly.
rel ated informat ion in t he t race col or, as does the trigger icon. Channel C oupling menu t itles are
trace colored, and M ath S et-U p m en u sources have their own color.
Select
Opaque
layers. S elect
aut omatically change col or, whil e grid intensity r emains constant . S ee Chapter 9, “ Dis play M ore. ”
to place overlapping waveform s one on t op of the other in normal, non-transparent
Transparent
for overlap mixing : those areas of the waveform s that overlap will
Objects are auto matical l yov e rlaidinsequence.
described in t he top t race label, the next in the second-from-top trace label, and so on in descending
order t ow ard the backgroun d. Choose the order in which traces appear usin g the SE L E CT soft keys.
When different types of t races are displayed , placed by defau lt in ascen d ing order from the grid at
the bottom are: envelope traces, persistence traces, normal traces, and cursors (foremost onthe
screen). This sequence can also be customized.
WR2-OM-E RevC ISSUED: January2002 59
T he active t rigger edge or condition shows source
With traces of the same type, the foremost is
Page 70

P ART O NE: GETTING STARTED
Sav e an d Recal l Y ou rPan elSe tup s
Your Waverunner-2 scope allow s you to store your preferred display settings and recall them later. Or choose to
recall adefault setup already installed in thescope. Storing an d reca llin gpane l se tup s is very pra ctical w h e nyou
have set up elaborate zoom and math display s on multiple traces and would like to use them on another signal.
The scope can store four panel setup s in volatile memory , and many more to floppy disk or the optional PC
Card slot (memory card or hard disk card), in numbered files marked with their date and time of storage. You
can recall them quickly and easily for later use.
SAVE PANEL SETUPS
PANELS
1. Press
to display the PANE L SETUPS menus.
Use these menus to save your preferred panel setups — to SE TUP1 in this
example.
2. Select Save.
3. Sa ves to SETUP1.
Saves to SETUP2.
Saves to SETUP3.
Saves to SETUP4.
SavestoPCCardslot.
Save s to floppy disk.
60 ISSUED: January2002 WR2-OM-E Rev C
Page 71

RE CALL PANE L SE T U PS
C HAPTER T HREE:
Disp layYourSign al
1. Press the soft key to select
2. Press the soft key to select
Or, to recall a default setup already stored in your scope, press the soft key to select
Or, when youstore setups to floppy disk or PC Card, press the soft key to select
The last alternative accesses the RECAL L SETUPS menu, which enables you to recall setups from a
floppy disk in the floppy disk drive, or an optional portable storage device (PC memory card or hard disk
card)in thePC Cardslot.
To stor e and recall the wav efo rm s them selves, see Chapter 5, “U se M ath Tools.”
.
and recall the setup you stored for examp le in SE TUP 3.
WR2-OM-E RevC ISSUED: January2002 61
Page 72

C HAPTER F OUR:
In thi s ch a pter, see ho w
To control time cursors
To contr ol amplitudecurso rs
To use cursor s in standar d display
To select a standar dp arame ter
Choose a Measur e T ool
62
ISSUED: January2002 WR2-OM-E Rev C
Page 73

C HAPTER F OUR
ChooseaMeasureTool
Cur so rs : To ol s forMeas ur in g Sign al Valu es
In Standard display mode, Am p litude (or Voltage) cursors, which appea r as broke n lines or bars
running across the scree n, are moved up and down the grid pixel by pixel.
Time cursors (arrows or cross-hair marke rs that movealong the w ave form) can be placed at a
desired time to read the amplitude of a signal at that time, and moved to every single point acquired.
When a Time cursor is placed on a data point, a cross-bar appears at the tail of the arrow, or at top and bottom
of the cross-hair marke r.
InAb solutemode , a single cursor is controlled. Readings for amplitude (using Amplitude cursors) or time and
amplitude (u sin gTime cursors)can be displaye dat the cursor location. Me a s u redvoltage am p litud e s are
relativeto ground; measured timesarerelativetothetrigger point.
In Relative mode, two Amplitude or tw o Time cursors are controlled at the same
time, provid ingreadin g s on the diffe ren cebetw een the tw oin amp litud e, or time
andamplitude, respe c tive ly.
Amplitudes are shown in the trace label for each trace. When Time cursors are used, the time is shown below
the grid. In Relative mode, the frequency corresponding to the time interval betwee n the cursors is also
displayed there.
When there are few data points displayed, Time cursor positions are linearly interpolated between the data
poin ts. Time cursors moveu pand down alongthese straight line seg m e nts .
CURSORS AND PERSISTENCE
When using Persistence, Amplitude cursors are the sameas in Standard Display (see above). Time cursors are
vertical bars that move horizontally across the screen.
WR2-OM-E RevC ISSUED: January2002 63
Page 74

P ART O NE: GETTING STARTED
CUR SORS IN XYDISPL AY
In XY Displa y, Absolute Amplitudecu rsors are ho rizontal an dvertica l ba rs that yo ucan moveup and do wn
and from side to side across the screen. Relative Amplitude cursors are pairs of bars that move in the same w ay.
Absolute and Relative Time cursors behave as they do in Standard Display
Combinations of the Amplitude values are shown on the left-hand side of the grid in the following top-tobottom order.
1. “∆Yvalue/∆X value”.....................Ratio
2. “20 ∗ log 10 (ratio)” ..........................Ratio in dB units
3. “∆Yvalue∗∆X value ”.....................Produ ct
4. “φ =arctan(∆Y/ ∆X)
rang e[–180° to + 180°]”...........................Angle (polar)
5. “r = sqrt (∆X ∗∆X+∆Y ∗∆Y)”..Radiu s ( dis tanceto origin ) .
Thedefinition of ∆Xand∆Y depends on the cursor used. The table below show s how ∆Xand∆Y are defined
for each type of measurement.
Cursors
T
Abs
∆∆∆∆X
∆∆∆∆Y
V
V
A
XRef
YRef
Abs
–0 V
–0 V
A
Rel
XDif–VXRef
YDif–VYRef
Org = (0,0)
V
–0 V
XRef
V
–0 V
YRef
Org = V
V
XRef–VXOffset
YRef–VYOffset
XOffset
YOffset
T
Rel
V
XDif–VXRef
V
YDif–VYRef
WHERE:
A
A
T
Abs AbsoluteTimecursors
T
Rel
Org
AbsoluteAmplitudecursors
Abs
Rel R elat ive A mplitude cursors
Relative Time cursors
Origin
V
V
V
V
V oltag eo f theRef ere n c ec u rsoronth eX trac e
XRef
V oltag eo f theRef ere n c ec u rsoronth eY trac e
YRef
V oltage of the Difference cursor on the X trace
XDif
V oltage of the Difference cursor on the Y t race
YDif
64 ISSUED: January2002 WR2-OM-E Rev C
Page 75

WAVEPILOT
C HAPTER F OUR:
Choose a Measure Tool
1. Press
; the follo wingmenu is disp la yed.
2. Use these men us to set up for parame ters.
Turns off cursors (or parameters) and returns the display to grids only.
To reactivate cursors, press the soft keyfor Cursors, next in line. To
reactivate parameters, press thesoft key for Measure.
Accesses cursor setup menus.
Acce sse s pa rame ter setup menu s .
AccessHistograms,JitterTrack,FFT,andTrackViewfeatures.
Acce sse s setup me nu s for pass/fail testing.
Accesses softwa reoptions like Powe r Me a su re. These
software package s modify normal scope control and men u
layout. This soft key is labeled only if analysis package s are
load ed.
WR2-OM-E RevC ISSUED: January2002 65
Page 76

P ART O NE: GETTING STARTED
3. Press ; the follo wingmenu is disp la yed.
4. Use these men us to set up yo ur cursors.
Selects Ampl itude (voltage), or Timeor frequency cursors.
Relativedisplays two cursors, Reference and Difference, and indicates
either the voltageor timeandvoltagebetween thetwo. Absolutedisplays
a single cursor that indicates either voltage compared to ground, or this
andtimecomparedtotriggerpoint.
Selects the Difference minus Reference cursor, or the Difference plus
Reference cursor. This appears only if XY Disp layis activated.
Controls the Reference cursor available with Relative
cursors. With Track on, reference and difference cursors are
controlled by this knob and move together; a constant time
or voltage interval is maintained betw een them. T his
tracking interval is represented by a bar (horizontal for
time; verticalf or voltage)that appearsabove or t o theleft
of the grid.
Controls the position of the Relativecursor. It is availab le
only when Relative is selected from the ‘type” menu above.
66 ISSUED: January2002 WR2-OM-E Rev C
Page 77
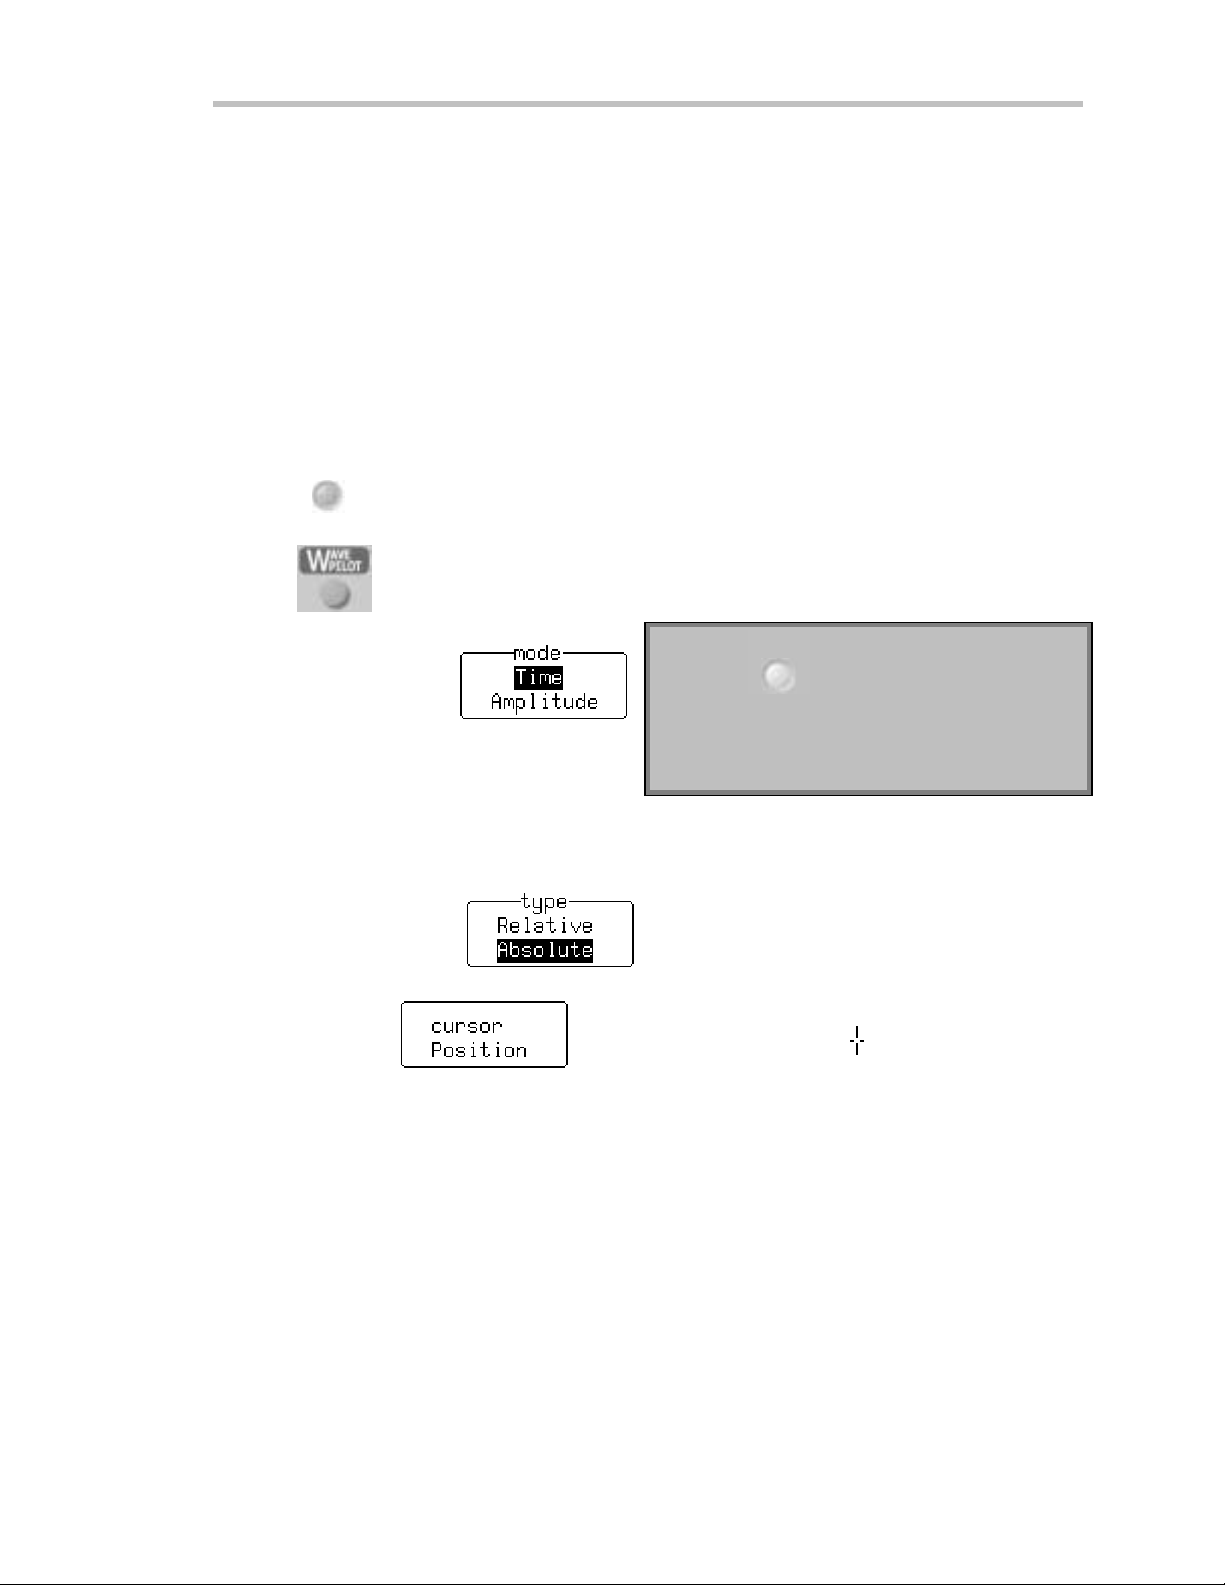
C HAPTER F OUR:
Choose a Measure Tool
Measur e w ithCurso r s
Cursors are imp o rtant tools tha t aid yo uin measu ringsignal valu es. Cursors are marke rs — lines, cross-ha irs, or
arrow s — that you can move around the grid or the w ave form itself. Use cursors to mak e fast, accurate
measurements and to eliminate guesswork. There are tw o basic types:
Time (Freq uency)cursors are markers that you move horizontally along the w ave form. Place them at a
de siredlocation alongthetimeaxis to rea d the sign a l’s amp litudeat the sele ctedtime .
Ampl itude (Voltage) cursorsarelines that youmoveverticallyon the gridto measure the amplitudeof a
signa l.
CONTROL THE TIM E CURSORS
DISPLAY
1. Press
2. Press
3. Press the soft key to select
and make sure that Standard is sele c ted in the top men u .
thenselect Cursors.
SINGLE
:Press
TTIIPP:
as a smooth way to stop your
W av e r unn er-2 scope andall o wmeasurem ent of
th edis played wavefo rm .
4. Press the soft key to select
5. Tu rn the knobfor tomovetheAbsoluteTimecursor .
Watch this cross-hair marker move up and down along your displayed w aveform. As it moves , the cursor’s time value
in relation to the trigger point is shown beneath the grid, and its voltage value in the trace label.
WR2-OM-E RevC ISSUED: January2002 67
Page 78
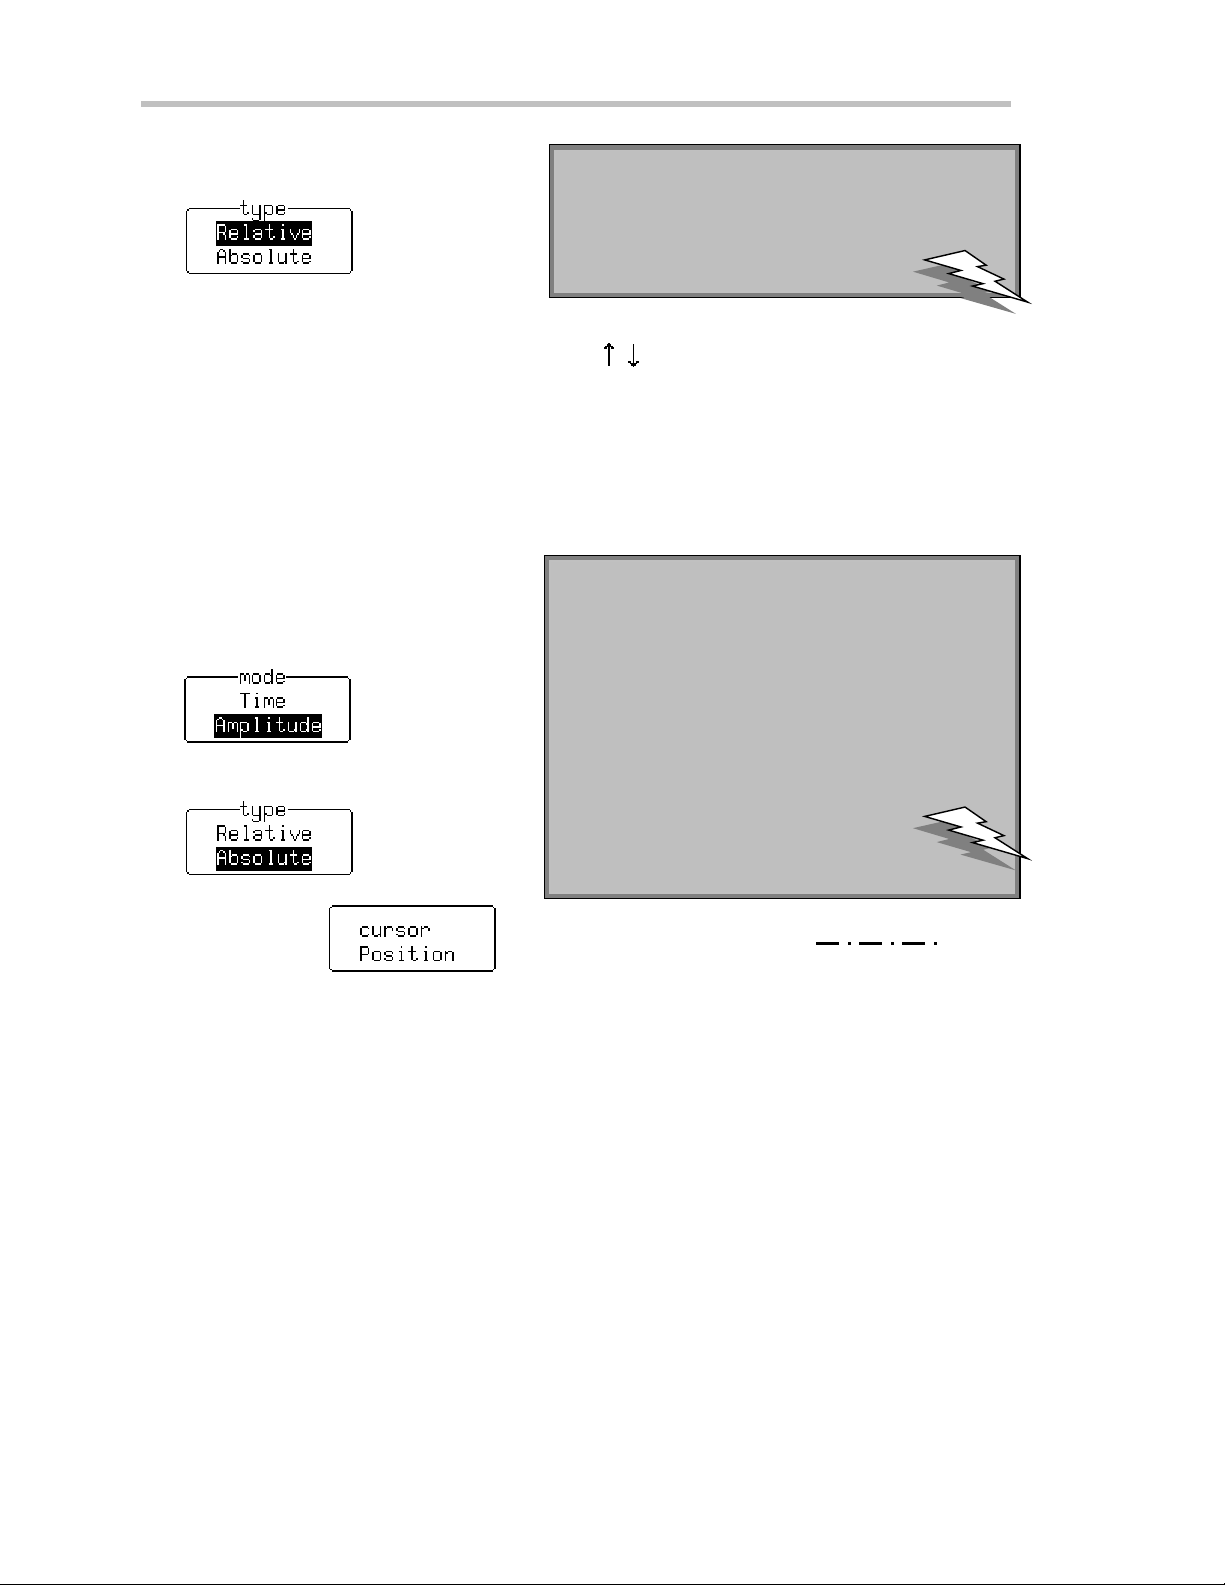
P ART O NE: GETTING STARTED
6. Press the soft key to select
7. Turn the knobsto movethetwoRelativetimecursors along the w ave form.
Beneath the grid the Wa verunner-2 shows the relative time and voltage difference betwee n the two cursors.
When you use Relative time cursors, the Reference cursor (upw a rd-pointing arrow ) can be changed, and could
be different from the trigger poin t. You mig h t placeit, for ex a m p le, at the fallinge d g eof the cap turedsig n a l’ s
oscilla tions . Yo ucan movetheDifferenc ecursor (do wnward-p o inting arrow) to me a su rethe time difference
anyw he re on the w av eform. Selection ↓–↑ displaysthesubtractionof thereferencefromthedifference
amplitudes .
CONTROL THE AM PLITUDE CURSORS
1. Press the soft key to select
2. Press the soft key to select
: Select “↓&↑” from the “show” menu to display in
TTIIPP:
the trace label the absolute amplitude, with respect to
groun d level , of the twoRelativetimecurso rs.
: TurnTrack “On” in th e Refer en ce Curso r
TTIIPP:
menu. The differ en ce betweenth e Refer en ce and
Differ en ce cur sor s will rem ainth e same whenyou
tur nthism e nu’s kno b, an dthe tw ocursorbars w il l
mo v e in tandem . Turnth e Differen ce cursormen u
knob: only this cursor’s position will change. T he
linkbetw eenthetw o cursor s is indicated by a
ver tical bar at the side of the gr id. Press the same
menusoft keyto turnTrack “Off”.
3. Tu rn the knobfor tomovetheAbsoluteAmplitudecursor
Place it at the top of your displayed wa veform. The difference in amplitude between the cursor and the ground
level (indicated by the ground leve l marke r at right of grid) is shown in the trace label.
68 ISSUED: January2002 WR2-OM-E Rev C
Page 79

C HAPTER F OUR:
4. Press the soft key to select and show tw o bar cursors: Reference and Difference.
Choose a Measure Tool
5. Tu rn the knobfor
Turn trackin gon
6. Tu rn the knobfor
When you use Relative Amplitude cursors, you can make the Reference cursor different from ground level. You
might place it, for example, at the base level of a square wave . You could then position the Difference cursor at
the top of the w ave form. The difference betw e en the two w ou ld then give you the signal’s amplitude, indicated
in the tracelabe l, as illu strated on the ne x t page.
to move the Reference cursor.
to move both cursors together.
to move the Difference cursor only.
WR2-OM-E RevC ISSUED: January2002 69
Page 80

P ART O NE: GETTING STARTED
R elative A mplitude cursors mark out t he signal’s amplitude. Here it is 510 mV , as indicated in the
trace label at top-left of screen.
70 ISSUED: January2002 WR2-OM-E Rev C
Page 81

C HAPTER F OUR:
T
OUSECURSORS INSTAN DARDDISPL AY
Choose a Measure Tool
You can move
the screen — up and down the grid pixel by pixel. A mplitudes are shown in the
trace label for each trace.
Place
Time
at a desired time to read t he ampl itude of a signal at that time, and move t hem t o every singl e
point acquired.
W hen you place a t ime cursor on a data point, cr oss-bars appear on the ar row and cr oss-hair
mar k er s
Thetimeisshownbelowthegrid.InRelativemodethefrequencycorrespondingtothetimeinterval
bet ween the cursors is also displayed there. W hen there are few data points displayed, time-cu rsor
positions are l inearly interpolated bet ween the data points. T ime cursors move up and down along
these straight-line segments.
Absolute
In
ampl it ude ( usi ng amplit ude cursors) or t ime and amplit ude (us ing t ime cur sors). M easur ed vol t age
amplitudes are relative to ground; measured times are relative to the trigger point.
In
Relative
differen c e between t he two in am plitud e, or time and amplitud e.
W
HEN INPERSISTENCEMODE
Inpersistencemode,amplitudecursorsarethesameasinStandarddisplay,whiletimecursorsare
verti cal bars running down the s creen and moving across it .
Amplitude
(Frequen cy) cursors — arrow s or cross-hair markers that move along the waveform —
.
mo de, you control a sin gle cursor. You can display the cu rsor location’s readings for
mode, you control a pair of ampl itude or time cursors, and get readings onthe
(V oltage) cursors — broken lines or bars run n ing across
: To set time-curso ram p litude units involts ordecibels...
TTIIPP:
UTILITY
Press
to access an dsel e ct Speci alModes. Thenselect
theCurso r s Measur em enu to access and use the Read time
cursoramplitudes in men u to select the desir ed unit.
WR2-OM-E RevC ISSUED: January2002 71
Page 82

P ART O NE: GETTING STARTED
Measur e Autom aticallyw ithPar ame ter s
Parameters aremeasurement toolsthat determineawiderange of signal properties. Usethemtoautomatically
calculate time and voltage values . There are parameter modes for the amplitude and time domains, custom
parameter groups, and parameters for pass and fail testing . You can make common measurements on one
signal in either the standard voltage (amplitude) or standard time modes. On more than one signal, select
parameters from a Custom category and use them to determine up to five quantities at once. Pass and fail
parameterscan becustomized,too. Youcan accumulate anddisplaystatistics oneach parameter’s sweeps,
average, low est, highest and standard deviation. See Chapter 11, “A nalyze with Par amet er s,” for how to
customize parameters, and for a description of each.
A special display is automatically used with parameters, whose data are listed ben eath the grid (see
next page for display setup). S hown here: a F ull-S creen, Quad-grid parameter display. Top of facing
page:theStandard,Single-grid,parameterdisplay.
72 ISSUED: January2002 WR2-OM-E Rev C
Page 83

C HAPTER F OUR:
CHOOSE A STANDARD PARAME TE R
Choose a Measure Tool
1. Press
Standa rdVol t agewill be selected by defau lt in the mode menu, shown
be lo w, and a list of five para meters will appea r ben e ath the grid. This list
w ill changewhe n Stand a rdTimeis sele cted . Wh i leMeasure is sele c te d,
statistics accumulation (see below ) goes on, even if not shown.
2. Use these men us to set up for parame ters.
Selects the mode. StandardVolt ageme a su res for a single signal: pe a k -
to-pea k(the amp litudebetw e en the maxim u mand minimu m sa mp le
values), mean of all sample values, standa rd deviation, root mean square
of all sample values, and signal amplitude. Standa rdTimemeasures for
a single signal: period, width at 50% of amplitude, rise time at 10–90% of
amplitude, fall time at 90–10% of amplitude, and the delay from the first
trigger to the first 50% amplitude point.
Automaticallycalculatesthedisplayedparameters’ average, lowest, highest
and standard deviation, and number of swe eps used.
, then select Measure.
Selects the trace on which the parameters are to be measured. This menu
indicates those traces displaye d.
Sets thestarting point inscreen divisions for parameter
measurements, using the knob. Turn Track On,usingthe
soft key. Control of the starting and end points is linke d
and theycan be moved together using the knob.
Sets the end point in screen divisions for parameter
measurements,usingtheknob.Alsoindicates the total
number of data points used for the measurements.
WR2-OM-E RevC ISSUED: January2002 73
Page 84

P ART O NE: GETTING STARTED
DISPLAY
3. Press
See the preceding chapter.
TURN OFF CURSORS AND PARAMETERS
1. Press
2. Press the soft ke yto
: To clear param eter“statistics” pre ss
TTIIPP:
to set upthe display(to se lect pa ram e te r grid sty le s, for example )using DISPL AY SETUP.
to return to theWavepilot menus, orpress .
.
CLEAR
SWEEPS
74 ISSUED: January2002 WR2-OM-E Rev C
Page 85

TOR
ECOGNIZEPARAM E TE RSYMB OL S
C HAPTER F OUR:
Choose a Measure Tool
The algorithms that allow the Waverunner-2 to determin e pulse-waveform param eters
detect the particular situations where the mathematical formulas can be applied.
S om etimes you should interpret the results with cau tion. In these cases the scope alerts you by
displayingasymbolunderthegridbetweenthenameof theparameteranditsvalue.Thesesymbols
act as in formation or warnin gs:
The param eter has been determ ined for several periods (up to 100), and the average of
those values has been taken.
The param eter has been determined over an integral nu m ber of periods.
T he parameter has been calc ulat ed on a histogram.
Insufficient data to determine theparameter.
Amplitude histogramis flat withinstatistical fluctuations; minimumand maximum are
used to assigntop and base.
Only an upper limit could be est im ated (the actual value of t he parameter may be
sm aller than the displayed value).
T he signal is partially in overflow .
T he signal is partially in underflow.
The signal is partiall y i n overflow and in underflow.
WR2-OM-E RevC ISSUED: January2002 75
Page 86

C HAPTER F IVE:
In thi s ch a pter, see ho w
Toset upformath
To do multiplication
ToperformanFFT
To do summ ed aver agin g
Tost ore and recall wa ve fo rms
To obtaina wav efo rmor mem or ystatus repo rt
Use M ath T ools
76
ISSUED: January2002 WR2-OM-E Rev C
Page 87

C HAPTER F IVE
Use Math To o ls
MakeMathEasy
With Wave runne r-2 math tools you can perform mathematical functions on a wa veform displayed on any
channel, or recalled from any of the four reference memories M1, M2, M3, or M4. To do computations in
sequence, you can also set up any trace of A, B, C, or D for math.
For example: you could set up Trace A as the difference betwe en Channels 1 and 2, Trace B as the average of
A, and Trace C as the integral of B. You could then display the integral of the averaged differencebetw ee n
Channe ls 1 and 2. Any trace and function can be chained to another trace and function. For example, you could
make Trace A an average of Channel 1, Trace B an FFT of A, and Trace C a zoom of B.
Wa verunner-2 math tools are available in these standard and optional packages:
Arith m etic Sum (add), Difference(subtract), Product (multiply) , Ratio (divide)
Ave raging Sum med (linear) of up to 4000 swee p s or ContinuousAverage
STANDARD
MAT H
Included with all
Waverunner- 2
oscilloscopes
E XT E N DE D
MAT H AN D
MEASUREMENT
OPTION (E MM)
Alltools in
Standard Math
plus:
WAV E ANALYZER
OPTION
(WAVA)
Alltools in
Ex tended Math
plus:
Extrema envelope, floor, roof
FFT Fast Fourier Transform to 50000 points; Power Spectrum, Phase,
Magnitude; All FFT Windows
Functions Identity, Negation,(Sin x)/x
Resample (deskew)
Rescale
E nhanced Resolution (E RES)
Functions Absolute Value, Derivative, Exp (base e), Exp (base 10), Identity ,
Integral,Log(basee),Log(base10),Reciprocal,Square,Square
Root
Trending
Histograms for 200 events
Ave raging
FFT+ Fast Fou rie r Tra ns form to one million poin ts; FFT Ave rag e ;
Histograms Histog ram s , Histog ram Pa ram e ters (u pto 2 billion eve n ts)
Summe d , or linear, Averag eof up to one millionwa veforms;
Continuous Average
Power Averaging, Pow er Density , Real, Real + Imaginary
WR2-OM-E RevC ISSUED: January2002 77
Page 88

P ART O NE: GETTING STARTED
SETUPTODOWAVEFORMMATHEMATICS
After connecting your signal to a Wave runne r-2 channel (Channel 1 in this example), do the following:
1. Press
2. Press the soft ke yto
3. Press to make Trace A a zoom of Channel 1.
4. Press the soft key for
5. Press the soft key to select and display the SETUP OF A menus, show n next page.
TOSETU
First.
to select CHANNE L 1 and displaytheWa verunne r-2’s ba sicmenus.
PFORMATHANOTHERWAY
MATH
TOOLS
Press
to display the Z OOM + M A T H menus.
Second.
Select or one of the other trac es.
NNOOTTEE:
pro ce ss ing title foreach
:Awaveform
displayed tr ace will be sho wn
inits tr ace label. If th e title is
missing, the math function
Third.
Press theso ft key to select
cannot be done and the
contents of th etrace wi l l
remain un ch an ged.
Fourth.
Follow the first three steps in the procedu re above.
78 ISSUED: January2002 WR2-OM-E Rev C
Page 89

C HAPTER F IVE:
USE A MATH TOOL
Use these menus to choose and set up any math tool. As an example, select the arithmetic tool Product to
multip lyChan nel 1 byChann el 2.
Enables math.
6. Press to select Ar ith m etic.
7. Press to select Pro duct.
UseMathTools
8. Press the soft key or turn the knob to select Channel 1
as the source trace . When using Arithmetic, this sets
one of the two operand sources. Using other math
types, this menu may be in a different position and may
set the signal offset, number of swee ps, or compensate
for anyDC offset in thesignal.
9. Press the soft key or turn the knob to select the trace
bywhichthe source traceCha n n e l 1 will bemultiplied .
Now go on to set up your trace as an FFT (Fast Fourier Transform) function (next page).
WR2-OM-E RevC ISSUED: January2002 79
Page 90
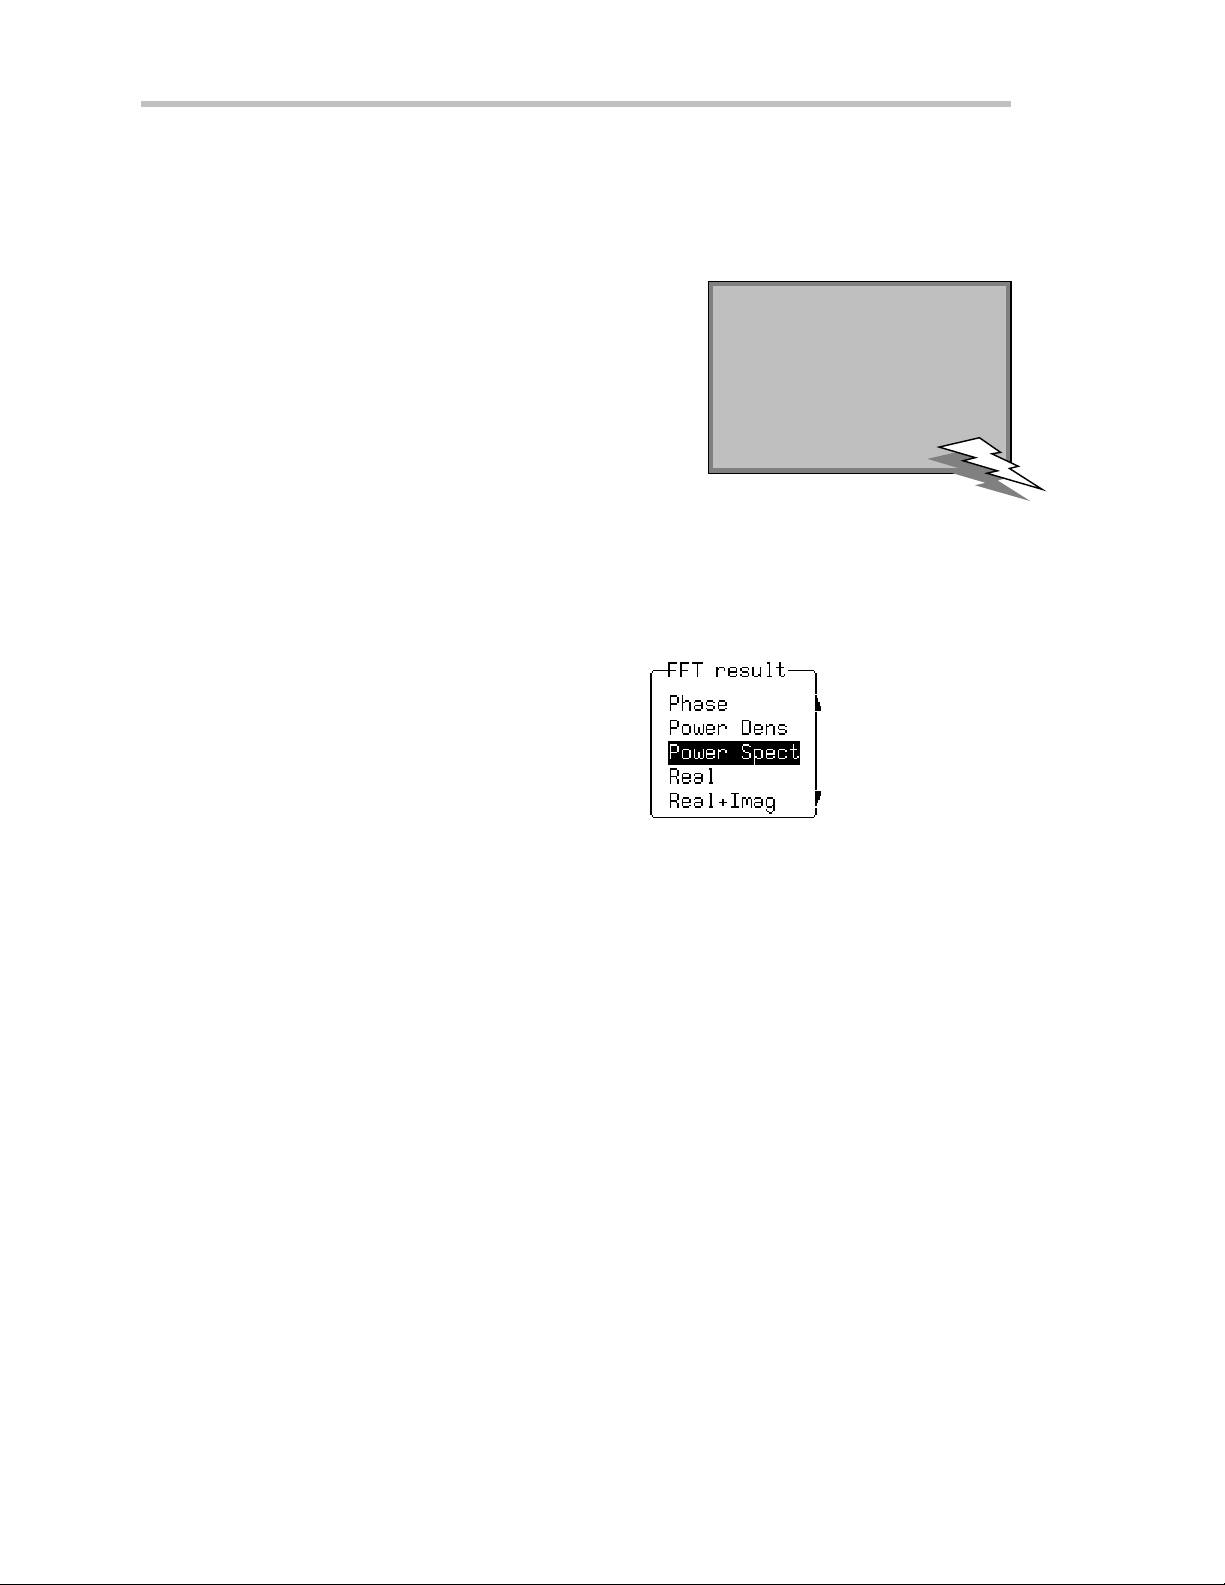
P ART O NE: GETTING STARTED
PERF ORM AN FF T OPE RAT ION
Continuing from the preceding steps, set up Channel 1 for FFT. Fast Fourier Transform will conve rt your time
domain wave form into a frequ ency domain spectrum similar to that of an RF spectrum analyzer display. But
unlike the analyzer, which has controls for span and resolution bandwidth, with the Wa verunner-2 you
determine the FFT span using the scope’s sampling rate (see Chapter 10, “U se A dvanced M at h Tool s” ).
10. Press the soft key to select FFT fromtheMathTypemenu.
: Dur ing FFT computation ,
TTIIPP:
the FFT sign is show nbelow
Spectra will be shown with a linear frequency axis running from zero to
the Nyquist frequency. The frequency scale factors (Hz/ div) are in a
1–2–5 sequence. The processing equation is display ed at the bottom of
thescreen, together with thethreekeyparameters that characterize an
FFT spectrum:
Transform size N (number of input points)
Nyquist frequency (= ½ sample rate)
Frequency increment, ∆f, betw e en two successive points of the spectrum.
These parameters are related as: N yquist frequency = ∆f ∗ N/ 2, where∆f = 1/ T, and T is the duration of
the input wa veform record (10 ∗ time/ div). The number of output points is equal to N /2.
11. Press the soft key to select Pow er Spectrum from the menu
Pow erSpectrum is the signal pow er, or magnitude, represe nted on a logarithmic vertical scale: 0 dBm
corresponds to the voltage (0.316 V peak ), which is equivalent to 1 mW into 50 Ω. Pow er Spectrum is
suitab lefor characte rizingsp ectratha t contain isolatedpea k s (d Bm).
th egr id . The comp u tationcan
take a while on long timedom ainrecor ds, but yo u can
stopit at anytime by pr essing
any front panel button.
Other FFT functions available in this menu depend on the Wave runne r-2 math options installed in your
scope(seepage77).
80 ISSUED: January2002 WR2-OM-E Rev C
Page 91

C HAPTER F IVE:
Phaseis measured with respect to a cosine whose maximum occurs at the left-hand edge of the screen, at
which point it has 0°. Similarly, a positive -goingsine w ave starting at the left-ha ndedgeof the screenhas a –
90° phase. Phase is displayed in degrees.
Pow erDens ity :Sign a l po we r normalizedto the band width of the e q u iv a lent filter associatedwith theFFT
calculation. Suitable for characterizing broadband noise. Pow e r Density is display ed on a logarithmic vertical
axis calibrated in dBm. It is available only w ith the W ave Analyzer option for the Wave runner-2.
Magn itude: The p e ak signa l am p litudeis rep re sented on a line ar scale, in thesame un its as theinput signa l.
Real, Real + Imaginar y, Imaginar y : Complex result of the FFT processing in the same units as the input
signal. These are only available with the W ave Analyzer option.
UseMathTools
12. Nowturn the kno b to sele ct Von Hann
AC forces the DC component of the input signal to zero before FFT processing, and improves the amplitude
resolu tion. Thisis esp eciallyuseful wh en you r inpu t has a largeDC comp on e n t.
FFT window s define the bandw idth and shape of the FFT filter. (See Chapter 10, “U se A dvanced M ath
Tools,” for thewindo ws’ filter param e ters .)
VonHann (Hanning) w indows reduce leakage and improve amplitude accuracy. But they also reduce
frequency resolution.
Rectangularwindows should be used when the signal is transient (completely contained in the time-domain
window ) or you know it to have a fundame ntal frequency component that is an integer multiple of the
fundame ntal frequency of the w indow. Other signa l types w ill show varying amounts of spe ctral leakage and
scallop loss when you use a Rectangular window. To correct this, use another window type.
Hamming reduces lea k a geand improves amp litude accu racy, but also red u ce s freq u e ncyreso lution.
Flat Top provide s e x c e llent amplitudeaccurac ywith mode ra te leakag ereduction , bu t also redu ces freq u e n cy
resolution.
Black m an–Harrisw indow s reducelea kageto a minimum, but redu ce frequency resolution.
13. InthefinalFFT step,pressthesoftkeytoselect thesourcetrace.
The “before” and “after” of your FFT computation is shown on the next page .
andpressthesoft keyto select AC.
WR2-OM-E RevC ISSUED: January2002 81
Page 92

P ART O NE: GETTING STARTED
FFT PowerSpectrum:Thetopgridshowsthewaveforminthetimedomain,whilethebottomone
show s it in the frequency domain, after F F T Power Spectrum has been applied. W ith the cursor
m easure tool (positioned here on the left-most peak of the F F T trace) you can read either the tim e or
frequen c y of your waveform. Trac e A ’s label indicates 50 M Hz per division in the frequen c y domain.
T he memory status field beneath the grids gives other FFT information.
To move the cursor from one waveform to the other, press
knob until the cu rsor reaches the end of the wa veform. T he cu rsor will jump to
the other waveform, and the indication below the grid will display “T ime” if the cursor is on the top
waveformor “Freq” if ont he F FT waveform.
then keep turning the
82 ISSUED: January2002 WR2-OM-E Rev C
Page 93

C HAPTER F IVE:
DO SUMMED AVERAGING
Now makea Summed Average of your wave form — again, going on from the previous steps. Averag ing is
normallyused to elimina te noise.
14. Press the soft key to select Ave rage fromtheMathTypemenu.
UseMathTools
15. Press the soft key to select the typ e of averaging you w ant
you specify the number of acquisitions to be averaged. Co n tin uo us averaginghelps to elimina te the
effects of noise by continuously acquiring newdata and adding the new w a veforms into the averaging
buffer. The averaged data is updated at regular intervals and prese nted on screen. You determine the
importance of newdata vs. old data by assigning a w eighting factor. continuous averaging (the default
selection) allows you to make adjustments to a system under test and to see the results right aw ay.
The Waverunner-2 starts the calculation immediately.
16. Turntheupperknobtosetthenumberof sweeps
to 4000)
This is counted in the trace label, as show n here, at right:
If the Continuous Averageis selected, the “for” menu becomes “with…weighting”.
Useit todefinetheweight.
(See Chapter 10, “ Us e A dv anced M at h To ols ,” for the difference between
summed and continuous averaging.)
.ForSummed averaging,
(up
17. Finally , press the soft key or turn the knob to select the source trace:
The type of result you can expect is illustrated on the next page.
WR2-OM-E RevC ISSUED: January2002 83
Page 94

P ART O NE: GETTING STARTED
S ummed A verage: N oise evident in t he signal shown in the top t race has beeneliminated from the
averaged wa veform on the lower grid. The calculation was stopped after 206 sweeps. T he number of
points used in the calculation is shown in the information field at the bott omof t he screen. The same
number of points means that all points were used in the calculation.
84 ISSUED: January2002 WR2-OM-E Rev C
Page 95

Sav e an d Recall W avefo rms
C HAPTER F IVE:
UseMathTools
Save your waveforms to internal reference memory — M1, M2, M3 or
M4 — or to floppy disk or the optional PC Card slot (Memory card or
HDD). Recall them later for further analysis. You could zoom them or
perform more math.
1. Press
WAVE
STORAGE
and then the soft key for
2. Use these menus to store your display ed w ave form.
Stores the w a veform, which you first select from the menu below, to the
memory or floppy disk (also selected below) .
NNOOTTEE:
: For each unit of record
length per channel, or per zoom
an d mathtrace, a point canbe
stored in the w avefo r mr efer en ce
memories M1, M 2, M 3, or M 4.
Selects the channel or trace whose wa veform you w ish to
store .
Selects the internal reference memory , floppy, or optional
storage device the wa veform is to be saved to.
See Chap ter 12, “Use Waver unner-2 wit h PC,” for
how to save w aveforms in ASCII format.
3. Presstogobacktothe“W’FORM”menusinordertorecallthe
wavef orm you have st ored.
WR2-OM-E RevC ISSUED: January2002 85
Page 96

P ART O NE: GETTING STARTED
4. Pressthe soft key for
5. These menus will be displayed. Use them to recall your waveform.
Recalls the wa veform from memory or portable storage device.
Recalls the selected waveform to the selected trace (see menus below).
Selec ts thememo ry in w hic hthe wav eform youwish to
display is stored.
Selects the trace on which the recalled w ave form is to be
displayed.
: Tr an sferwav efor mdata to PC and use the data for calculations with spr eadsheet orm ath
TTIIPP:
softwar e. To do this, sav e y o urwavefo rms to flo p p yorano p tio n alstorage device inth e ASCII form at.
The Waverunner-2 can save to floppy in ASCII traces of up to 50000 points. You should remember
that waveforms stored in ASCII cannot be called back into the oscilloscope. See Chapter 12, “ Use
Waverunner-2 with PC.”
86 ISSUED: January2002 WR2-OM-E Rev C
Page 97

C HAPTER F IVE:
UseMathTools
OBTAIN A WAVEFORM OR M EMORY STATU S REPORT
Display a summary of the status of your channels, zoom and math functions, wave form memories , and
displayed traces. Viewthe settings on your vertical and horizontal controls. Check on how much memory you r
Wa verunner-2 scope is using for storage of records. Clear and freeup memory .
SCOPE
STATUS
1. Press
to show the STATUS menus.
2. Press the soft key to select Waveform, then the soft key for the w ave form status summary of choice.
3. Press the soft key to select Memory Usedto obtain a similar rep ort on what you have stored and how
much memory is available. Memories occupied by wave forms will be boxed, and empty ones indicated as
such. You can also clea r occupied memories by pressing the corresponding menu soft keys.
WR2-OM-E RevC ISSUED: January2002 87
Page 98

C HAPTER S IX:
In thi s ch a pter, see ho w
To print your display using the Waverunner-2 internal printer
To print orplot yo u rdisp l a ywithanextern alpr i nterorplotter
To create TIFF and BMP image files
To store and retrieve floppy- disk, PC M emory- card and hard- disk-card files
To give custo mn ames to yourfiles and create directories
To add ordelete file directories
To cop yfiles fromon e por table stor age device to anoth er
Docum en t Yo urWork
88
ISSUED: January2002 WR2-OM-E Rev C
Page 99

C HAPTER S IX
Docume nt YourWo rk
MakeaH ardCopy
Mak e a hard copy of your displayed traces and screen data using the scope’ s optional internal printer. Or print
to an exte rnal printer or plotter usin gthe rea r GPIB, RS-232-C, or Ce n tronics port. CreateTIFF andBMP
image files with the scope and save them to floppy disk, or optional PC memory or hard disk card.
UTILITY
1. Press
2. Then press the soft key for
to display the UTIL ITIE S men us.
Use them to mak e a hard copy of your screen.
to access these menus.
3. Press to select
theoptional
internal printer,
or another
device to print
or save to (see
next page).
4. Press to turn the auto-print function on or off: On
will print a hard copy after every acquisition.
5. Pressorturntoexpandthewaveformandshowmoredetail.
: Connect an exter nal p rinterorplo tte r
TTIIPP:
using one of the ports on the rear of your
Waverunner-2 scope. Print or plot to an
exter nal device selecte dfro mthe“outp ut to ”
menu. A wide range of printers and plotters
canbeuse d.
6. Press or turn to select the page format.
WR2-OM-E RevC ISSUED: January2002 89
Page 100

P ART O NE: GETTING STARTED
3
7
7. Press
PRINT
SCREEN
to print a copy of the screen display .
TTIIPP:
:Press
PRINT
SCREEN
w h ilep r intin g to cancel.
PRINT, PLOT, OR COPY
1. Press the soft key to select a port, the PC Card slot, or f loppy-disk drive:
2. Pressthesoft key to select a printer, plotter,or graphic protocol (TIFF, BMP,or
HPGL ):
Other menus will appe ar according to your selection. The “plot size” and “pe n number” menus appe ar when a
plotter is selected. The “background” menu becomes available whe n a color or compressed TIFF or BMP
graphic protocol is used. This gives you the choice betw ee n a black or white background for a screen image.
The Waveru nn er-2 assign s file name s a u toma ticallywhen copy in gto flop p yor optiona l storagedevice (s e e
pa g e91).
3. Press the soft key for
PRINT
SCREEN
4. Press
to print, plot,or save acopyof thescreendisplayto a printer, plotter, or graphic protocol.
AUTO
SETUP
ZERO DELAY SETUPSTOPAUTONORMALSINGLE
DELAY LEVEL
TIME / DIV
PANELS
UTILITIES
DISPLA Y
STANDBY
RETURN
WAVE
TOOLS
STORAGE
TRIGGER
OFFSET
CHANNEL
2
SELECT
VOLTS / DIV
VmVnss
SETUP
TIMEBASE
ZOOM + MATH
ZOOM
SCOPEMEASURE
CLEAR
STATUS
SWEEPS
ALL INP UTS
Ω
50 5Vrms
Ω
1M 16pF 400Vpk
CAT II
3
POSITIONPOSITION
RESET
ZOOM
5
MATH
TOOLS
ANALOG
PRINT
PERSIST
SCREEN
8
CAL
to start a new page each time you perform Step 4.
2
20
R S -232-C print er cabl ing: C onnect your scope to a variety of external print ers using t he rear
R S-232-C port. You could also conn ec t to PC via GPI B, and use the com puter to con trol a printer
connected via RS-232-C . See C hapter 12, “U se Waverunner-2 wit h PC,” for computer cabling.
90 ISSUED: January2002 WR2-OM-E Rev C
 Loading...