

Page 1

I
OPERATOR'S
MODEL 9450A
DUAL-CHANNEL
DIGITAL OSCILLOSCOPE
MANUAL
I
Serial Number
May 1992
Page 2
LeCroy
Corporate Headquarters
700
Chestnut Ridge Road
Chestnut Ridge,
Tel:
(914) 425-2000,
European Headquarters
2,
rue Pre-de-la-Fontaine
P.O. Box
121 7
Tel.:
341
Meyrin 1 /Geneva, Switzerland
(022) 71 9 21 11 , Telex:
NY
10977-6499
TWX:
710-577-2832
41 9 058
Copyrightm May
publication supersedes all earlier versions. Specifications subject to change.
1992,
LeCroy. Ail rights reserved. information in this
Page 3
TABLE
OF
CONTENTS
Page 4
Page 5
8
Extended Pulse Parameters
Extended Parameters Display
Extended Parameters Setup
Extended Parameters List
9
The
Rear Panel
Mains Voltage Selection (67)
Fuse Protection
Power Switch (66)
Accessory Power Connectors (73)
GPIB and RS-232-C Port Selection
RS-232-C Connector (68)
Accessory Control (69)
BNC Connector (62)
External
Sampling CK Output (63)
Trigger Out (64)
Trigger Veto (65)
Reset (71)
CK
Input (62)
10 Getting Started
Waveform Acquisition
Saving and Recalling Front-Panel Setups
Storing and Recalling Waveforms
Waveform Expansion
Waveform Processing
Table of Contents
(70)
11 Getting More from your Oscilloscope
Rapid Response of the Front-Panel Controls
Accurate Amplitude Measurements
Accurate Time Measurements
Auto-Calibration
12 Waveform Processing Option (WPO1)
Processing Capabilities
Summed Average
Continuous Average
Arithmetic
Extrema
Functions
Enhanced Resolution
Page 6
Page 7
1
GENERAL INFORMATION
INITIAL INSPECTION
WARRANTY
It is recommended that the shipment be thoroughly inspected
mediately upon delivery to the purchaser. All material in the
container should be checked against the enclosed Packing List.
LeCroy cannot accept responsibility for shortages in comparison
with the Packing List unless notified promptly. If the shipment is
damaged in any way, please contact the Customer Service Department or local field
LeCroy warrants its oscilloscope products to operate within specifications under normal use for a period of two years from the date of
shipment.
90
thought to be functional, but is
any kind covering detailed performance. Products not
tured by LeCroy are covered solely by the warranty of the original
equipment manufacturer.
In exercising this warranty, LeCroy will repair or, at its option,
replace any product returned to the Customer Service Department
or an authorized service facility within the warranty period, provlded that the warrantor's examination discloses that the product
1s defectlve due to workmanship or materials and that the defect
has not been caused by
ditlons or operation.
The purchaser is responsible for transportation and insurance
charges for the return of products to the servicing facility. LeCroy
wlll return all in-warranty products with transportation prepaid.
This warranty 1s in lieu of all other warranties, expressed or implied,
merchantability, fitness, or adequacy for any particular purpose or
use. LeCroy shall not be liable for any speclal, Incidental, or consequential damages, whether in contract or otherwise.
Spares, replacement parts and repairs are warranted for
days. The instrument's firmware is thoroughly tested and
including
offlce immediately.
supplled "as is" with no warranty of
mlsuse, neglect, accident or abnormal con-
but not limited to any implied warranty of
im-
manufac-
PRODUCT ASSISTANCE
MAINTENANCE
AGREEMENTS
Answers to
of LeCroy equipment are available from the Customer Service
Department,
York
Pre-de-la-Fontaine,
(4 1)22/7 19 2 1 11,
LeCroy offers a selection of customer support services. Maintenance agreements provide extended warranty and allow the
customer to budget maintenance costs after the initial two year
warranty has expired. Other services such as installation, training,
enhancements and on-site repair are available through specific
Supplemental Support Agreements.
questions
700
10977-6499,
concerning installation, calibration, and use
Chestnut Ridge Road, Chestnut Ridge, New
U.S.A., tel.
1217
or your local field engineering office.
(914)578-6061,
Meyrin
1,
and
2,
rue du
Geneva, Switzerland, tel.
I
Page 8
Page 9
INTRODUCTION
ARCHITECTURE
Hi-Z,
50
Amplifiers
Attenuators
Cl
t
PRODUCT DESCRIPTION
The
LeCroy 9450A is a high-performance digital oscilloscope
suited to a wide variety of research, design and test applications. It
is used to capture, analyze, display and archive electrical
waveforms in fields such as electronic engineering, physics and
defense research, automated testing and measurement, telecommunications, laser research, computer design, electromagnetic
pulse and interference measurement, lidar technology and ultrasonics research.
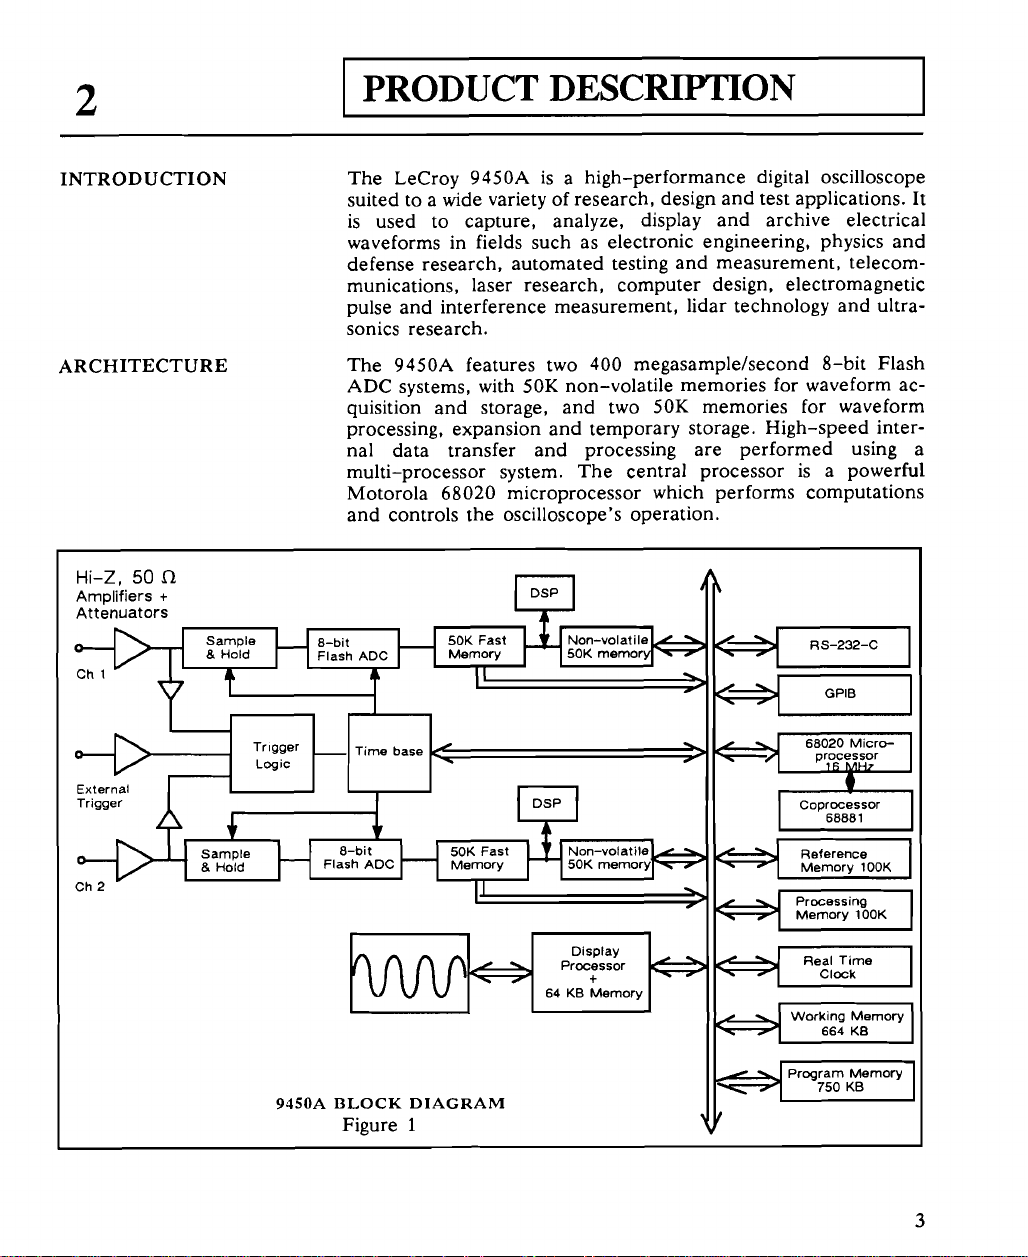
9450A features two 400 megasamplelsecond 8-bit Flash
The
ADC systems, with 50K non-volatile memories for waveform acquisition and storage, and two 50K memories for waveform
processing, expansion and temporary storage. High-speed internal data transfer and processing are performed using a
multi-processor system. The central processor is a powerful
Motorola 68020 microprocessor which performs computations
and controls the oscilloscope's operation.
Non-volat ile
RS-232-C
9450A
-
BLOCK
Figure
Time base
DIAGRAM
1
Display
Processor
t
64 KB Memory
v
GPlB
-
68020 Micro-
processor
16
MHY
4
68881
Reference
Memory
lOOK
Processing
lOOK
Memory
Real Time
Clock
Working Memory
KB
664
Program Memory
750 KB
Page 10

TRIGGER
Page 11
Product Descri~tion
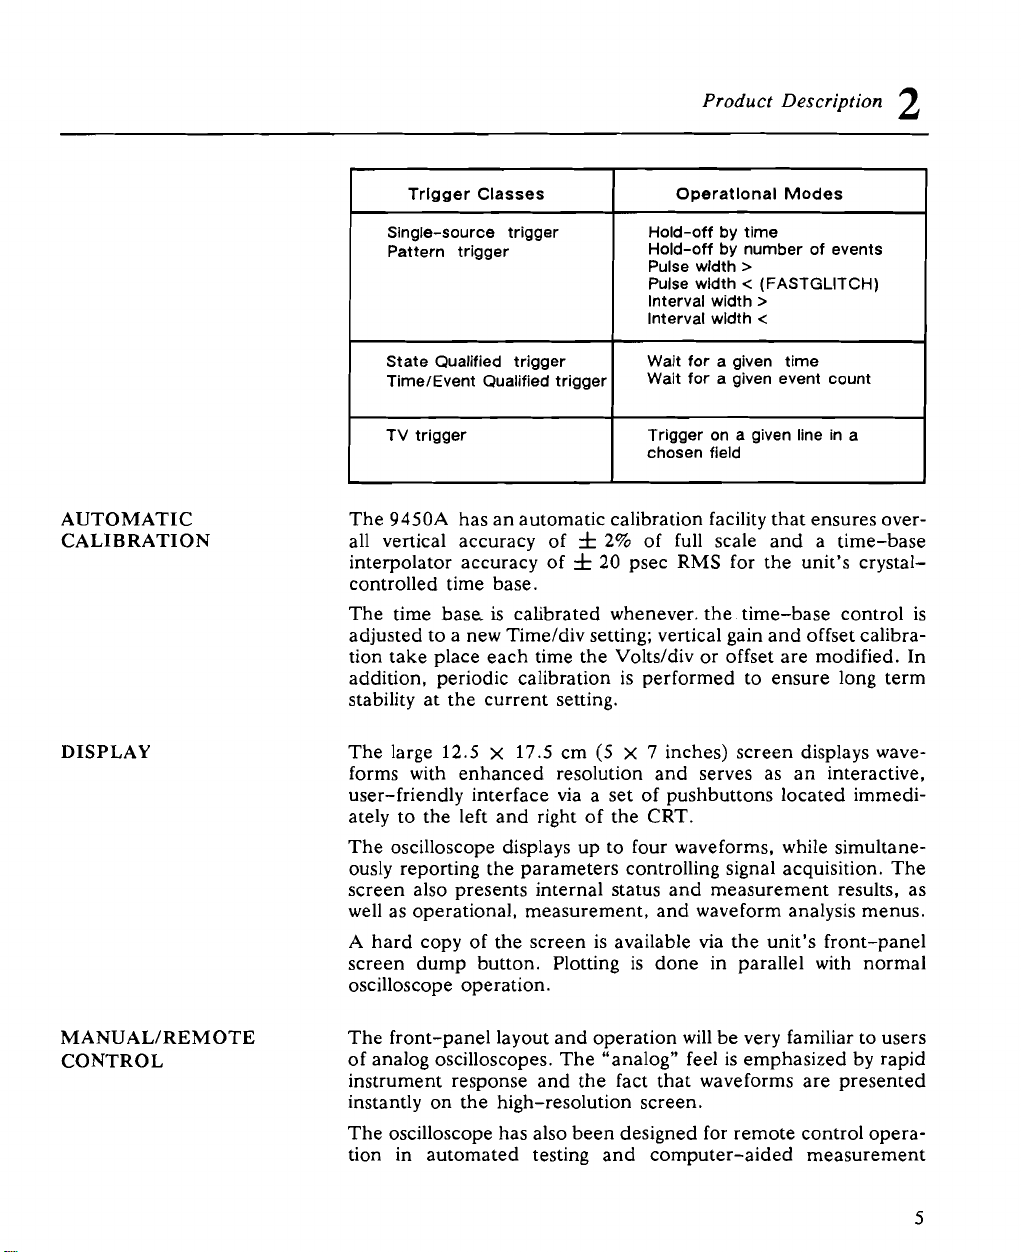
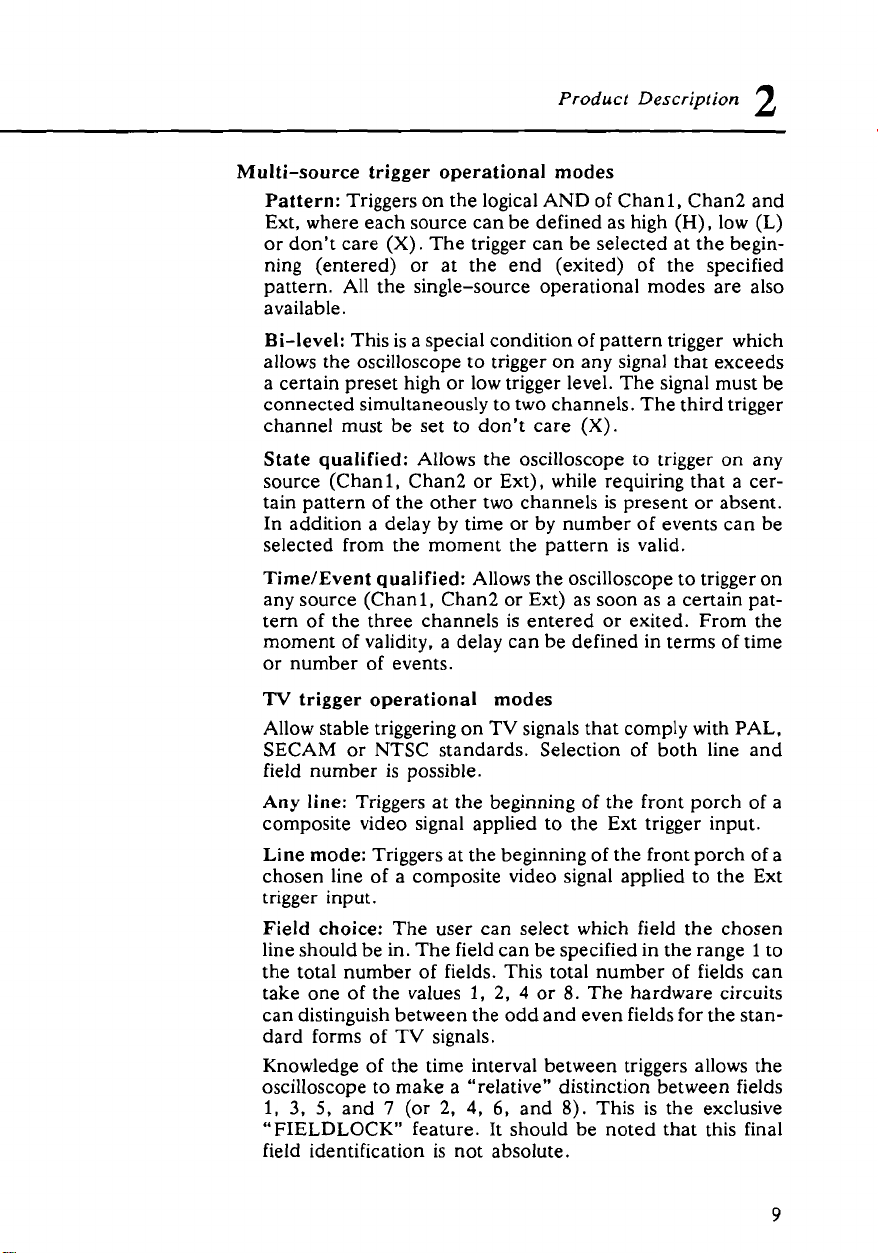
Trigger Classes Operatlonal Modes
Single-source trigger Hold-off by time
Pattern trigger Hold-off by number of events
Pulse width
Pulse wldth < (FASTGLITCH)
Interval width
Interval width
>
>
<
7
State Qualified trigger Wait for a given time
TimelEvent Qualified trigger
TV trigger
additinn nerindir ralihratinn ic n~rfnrmed tn enciire lnno term
Wait for a given event count
Trigger on a given line in a
chosen field
atelv to the left and right of the CRT.
screen also presents internal status and measurement results, as
screen dump button. Plotting is done in parallel with normal
MANUALIREMOTE The
instantly on me nign
front-M an el
lavout and o~eration will be verv familiar to users
Page 12
Page 13
Product Description
2
Reference memories, C and
which can store one acquired and/or processed waveform, or up to
200 waveform segments.
Function memories E and F: Two
for waveform
Peak and Glitch Detection
Horizontal Section
Tlme Base Range: 1 nsecldiv to 5000 secldiv.
Acquisition
Modes
Minimum and maximum peaks, as fast as 0.002% of the record
length (minimum 2.5 nsec), are captured and
probability.
100%
Using LeCroy's FASTGLITCH trigger technique (see the trigger
section below), glitches faster than 2.5 nsec can be detected on all
time-base settings.
Clock accuracy:
Interpolator resolution: 5 psec.
Interpolator accuracy: 20 ps RMS
Sampling clock output: BNC connector on rear panel.
External clock in: BNC connector on rear panel.
Random Interleaved Sampling (RIS) for repetitive signals from
1 nsecldiv to
Single shot for transient signals and
10 nsecldiv to 200 msecldiv.
processing.
I
5
psecldiv.
f
D:
0.002%
Two 50K, 16-bit word memories
16-bit word memories
50K,
displayed
repetitive
with
signals from
Roll for slowly-changing signals from 500 msecldiv to
5000 sec/div.
Sequence mode divides the acquisition memory into 2, 5, 10, 20,
50,
100 or 200 segments.
Horizontal expansion: Dual zoom mode allows
or different sections of the same signal to be expanded up to 1000
times.
Pre-trigger recording: Adjustable in 0.2% increments to 100%
of full scale (grid width).
Post-trigger delay: Adjustable in 0.02 division increments up to
10,000 divisions.
External trigger input: 1 Ma, < 20 pF, 250 V max. (DC + peak
AC 10 kHz).
External trigger range:
f
2
V
in Ext, f 20 V in ExtIlO.
d~fferent signals
Page 14
Page 15
Page 16
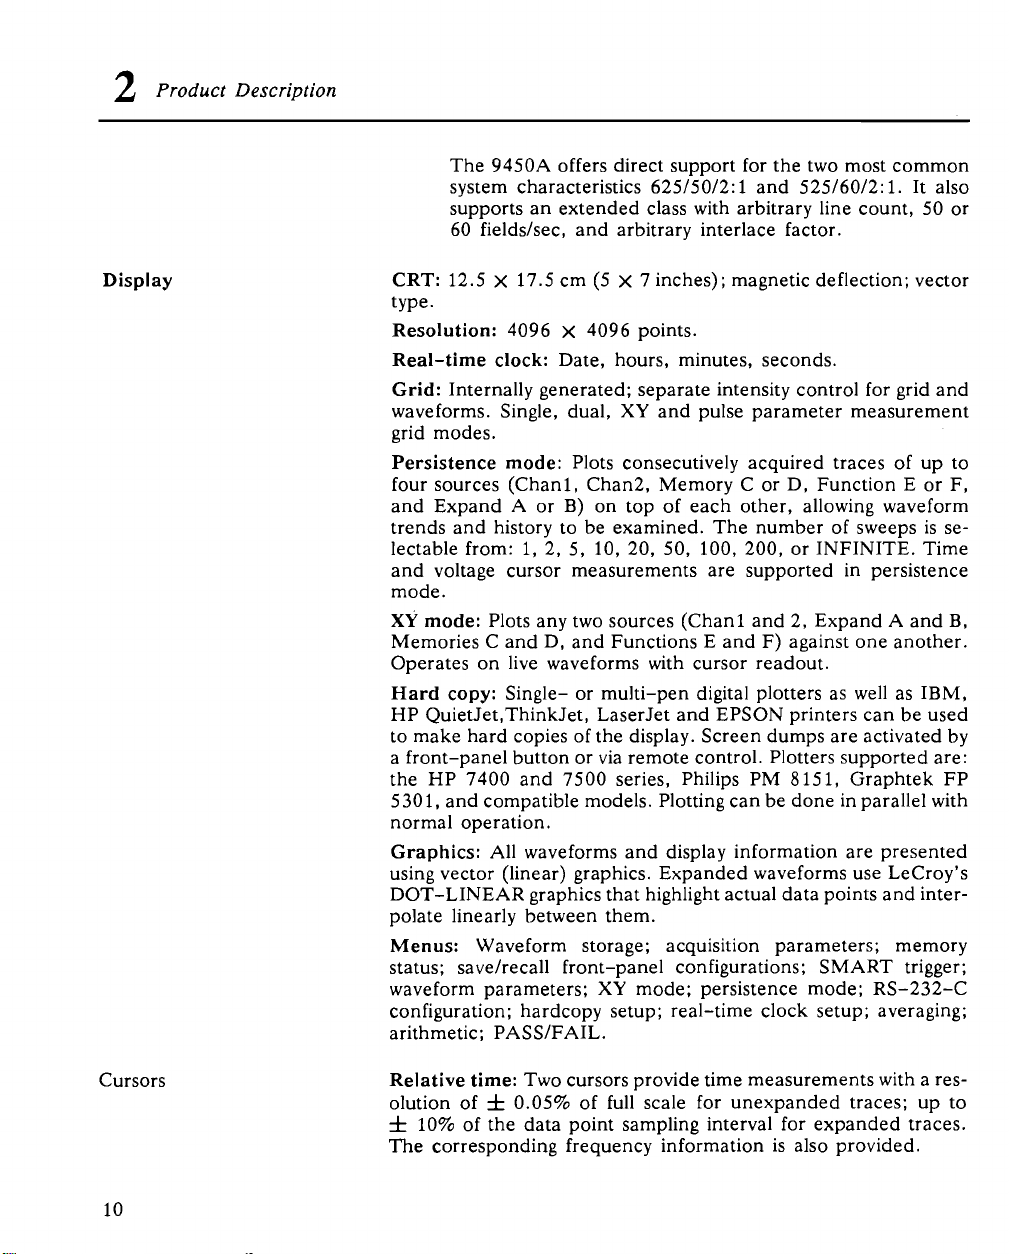
Display
Cursors
Page 17
Page 18
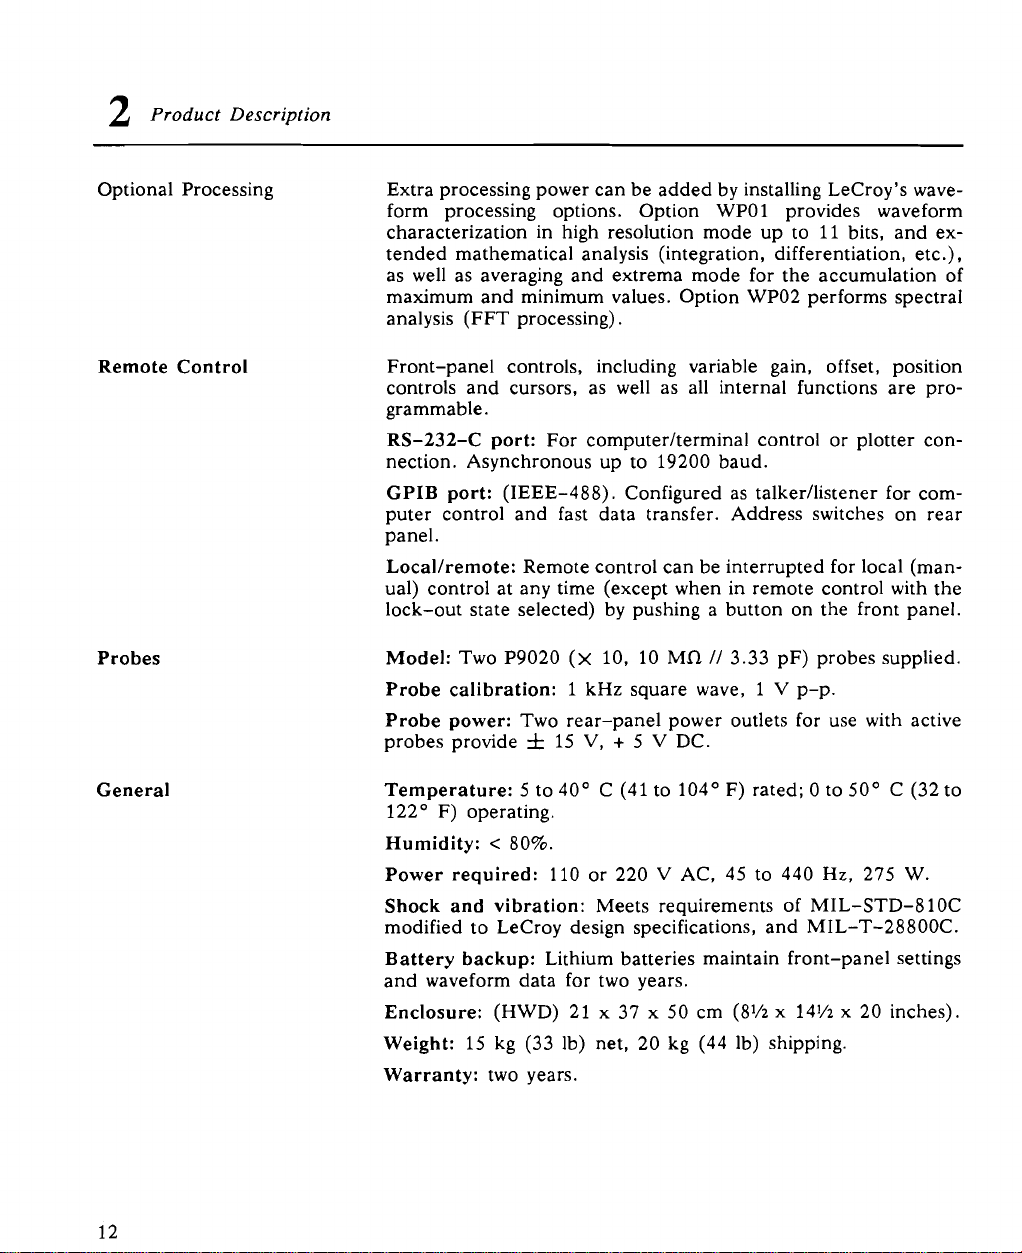
Remote Control
Probes
General
Page 19
INSTALLATION
CAUTION
If a
LeCroy oscilloscope set for
into a
220
V
power source, severe damage can occur. Before powering up the unit, ensure that the
correct mains voltage has been set.
11 5 V
is plugged
Page 20

Page 21

DISPLAY LAYOUT
I
Real-time clock field VI Abridged trigger fleld
II Menu field VII Abrldged front-panel status field
Ill Icon field Vlll Displayed trace field
IV Trigger delay field IX Message field
V Time and frequency field X Trigger level field
Page 22
ICON
TRIGGER DELAY
FIELD (IV)
FIELD (111)
Page 23
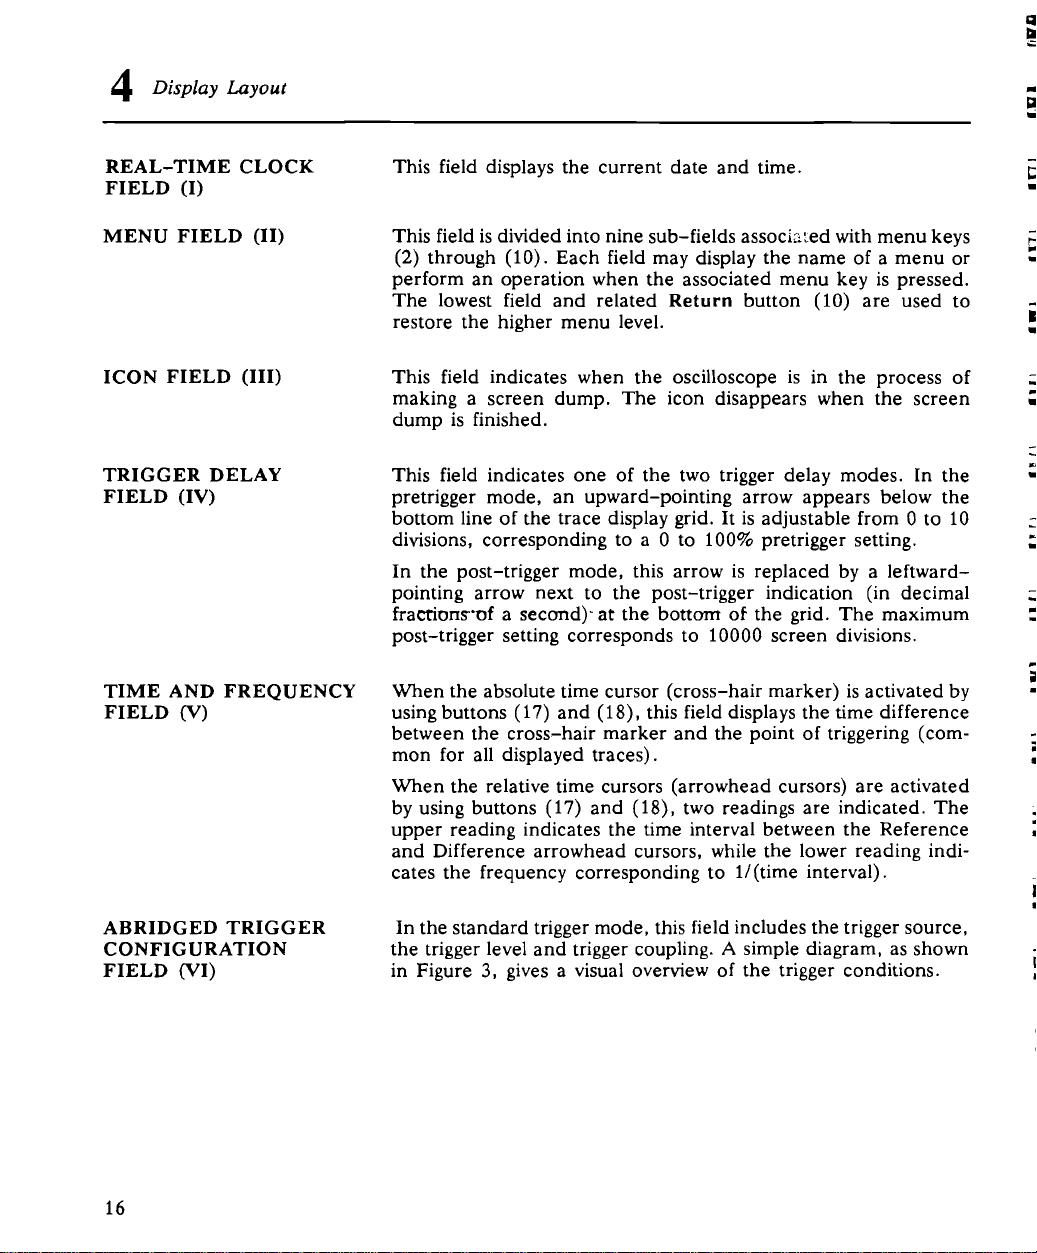
CH2
n
0.2
mV
DC
Trigger source: Channel
Trigger level:
Trigger coupling: DC
SPECIAL LeCROY TRIGGER GRAPHICS INDICATE the
SLOPE
and
LEVEL
of
Figure
0.2
mV
the TRIGGER
3
2
Page 24
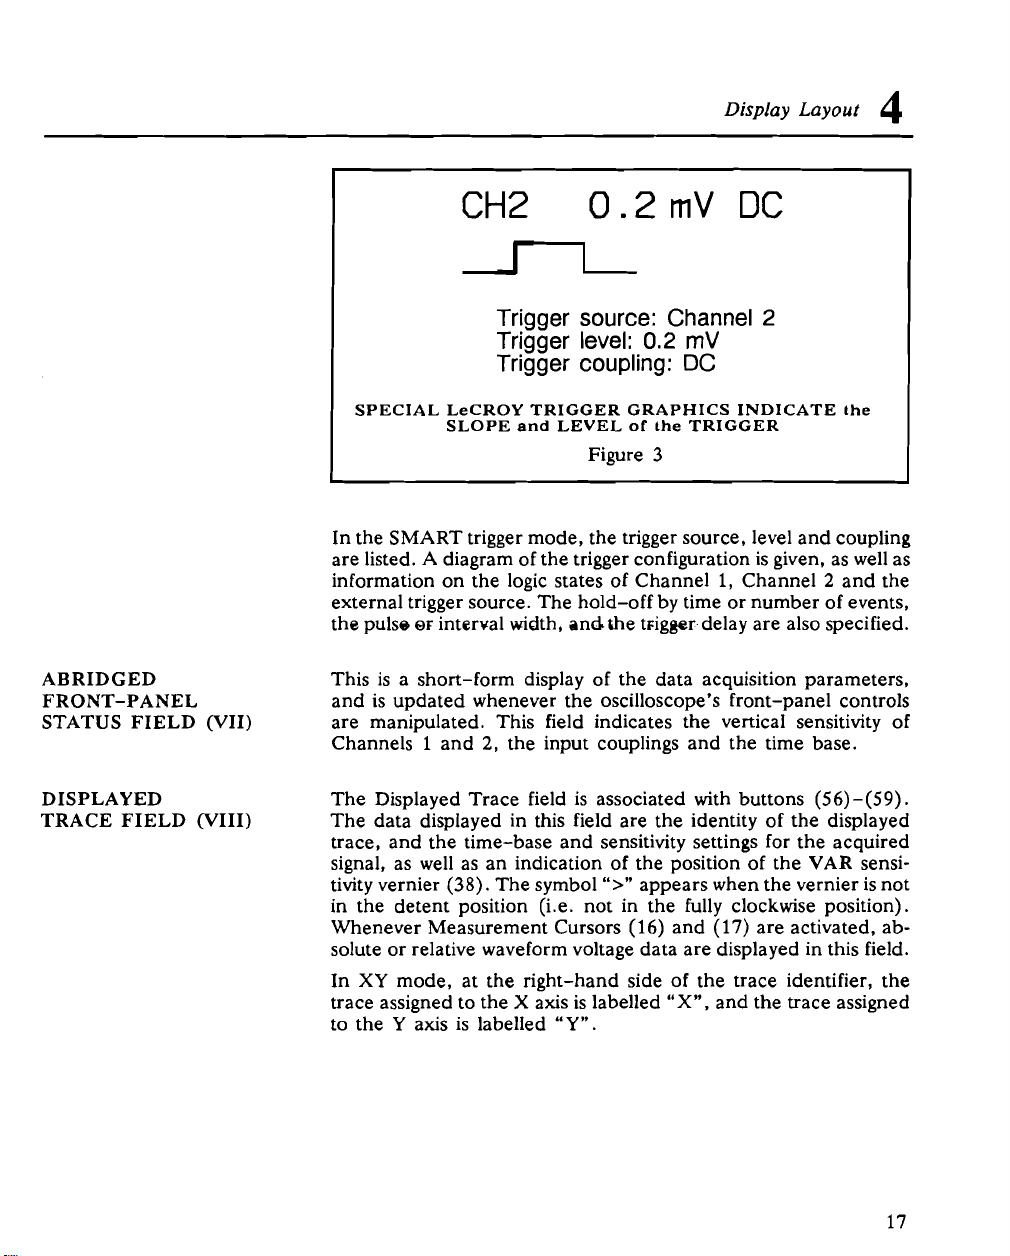
NJ
or
9U1W
TRIGER
EXAMPLE
of
MESSAGE FIELD DISPLAY
Figure
4
Page 25
MANUAL
OPERATION
Page 26
n
CHI
UQ
10mV
T/div
1V#
-
10
ps
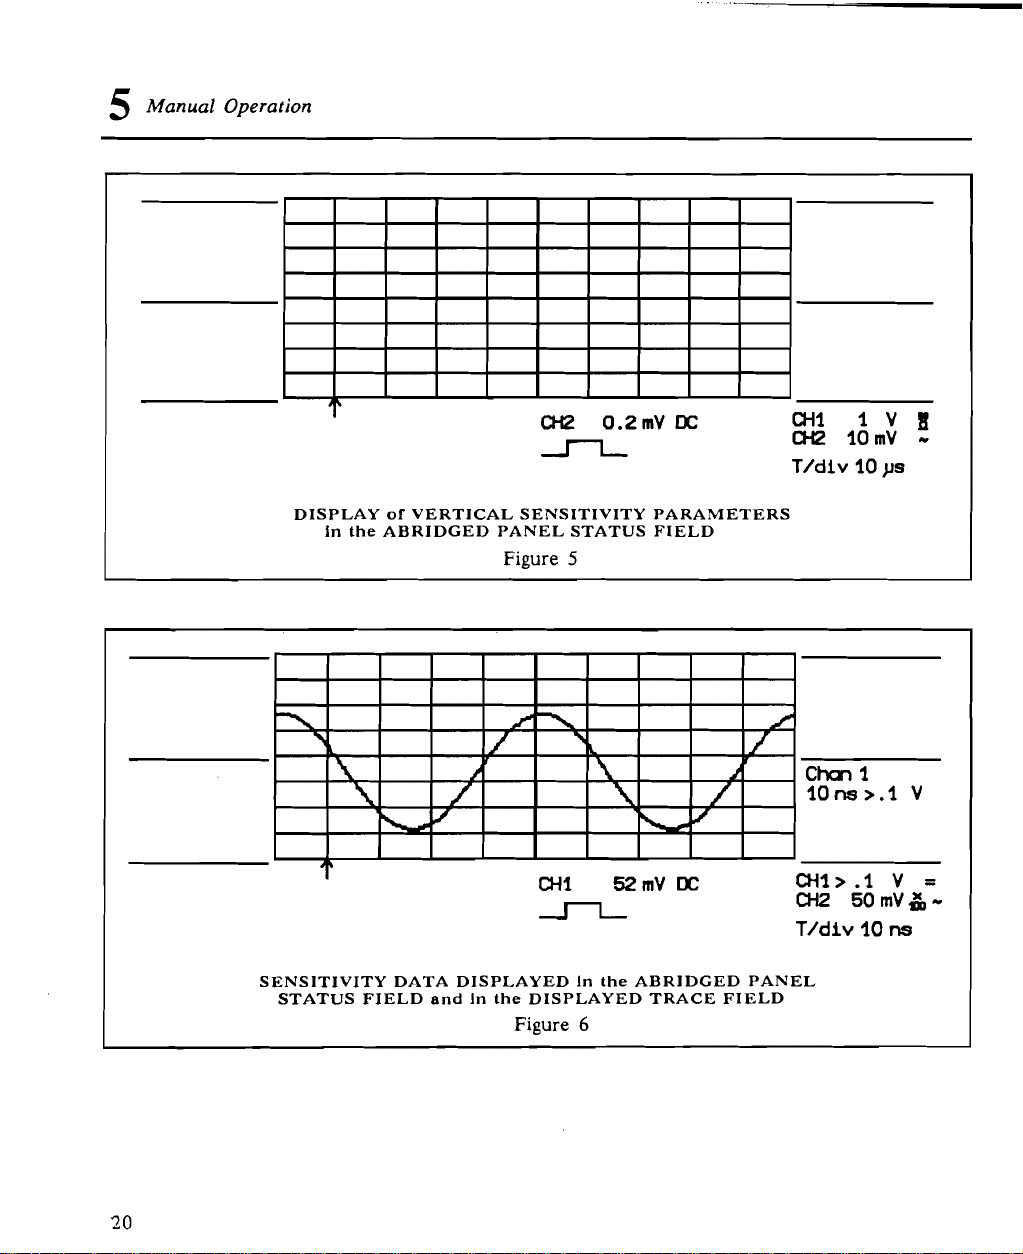
DISPLAY
In
of
the ABRIDGED PANEL STATUS FIELD
\
VERTICAL SENSITIVITY PARAMETERS
Figure
I
I
CHI
n
SENSITIVITY DATA DISPLAYED
STATUS FIELD
and In
the DISPLAYED TRACE FIELD
Figure
5
I
I
52mVDC CH1>.1
In
the ABRIDGED PANEL
6
Chm
10ns>.l
CHZ
50
T/div
1
mV&
10
v
v
ns
=
-
Page 27
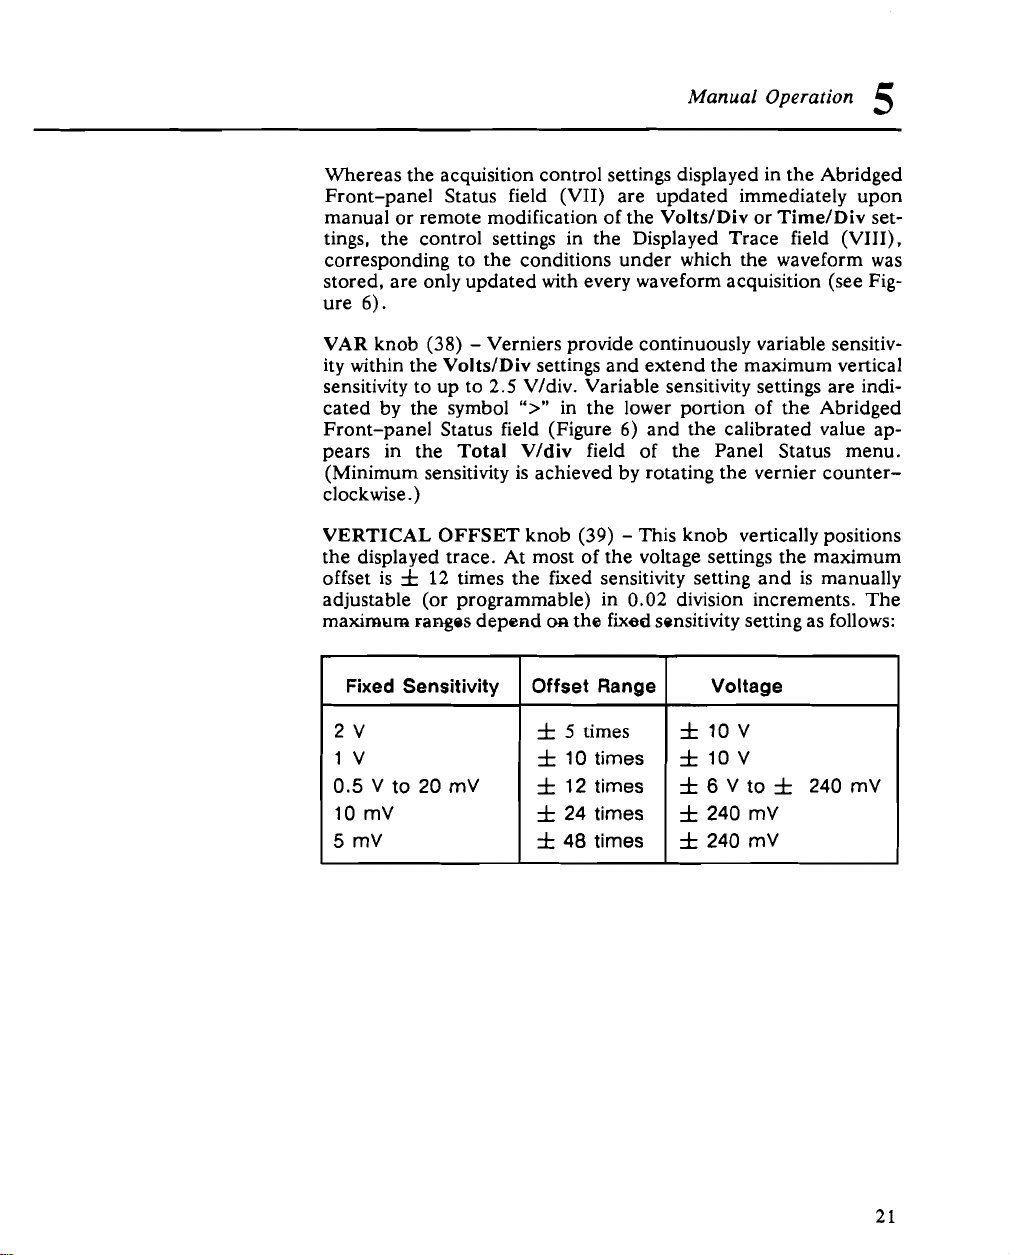
Fixed Sensitivity Offset Range Voltage
2 V
1 V
0.5 V to 20 mV
10 mV
5
mV
f
5
f
lotimes
f
12 times
f
24 times
f
48 times
times
f
10 V
f
10V
f
6
V to f 240 mV
f
240 mV
f
240 mV
Page 28
Main
Henu
.
A
Sampling
v
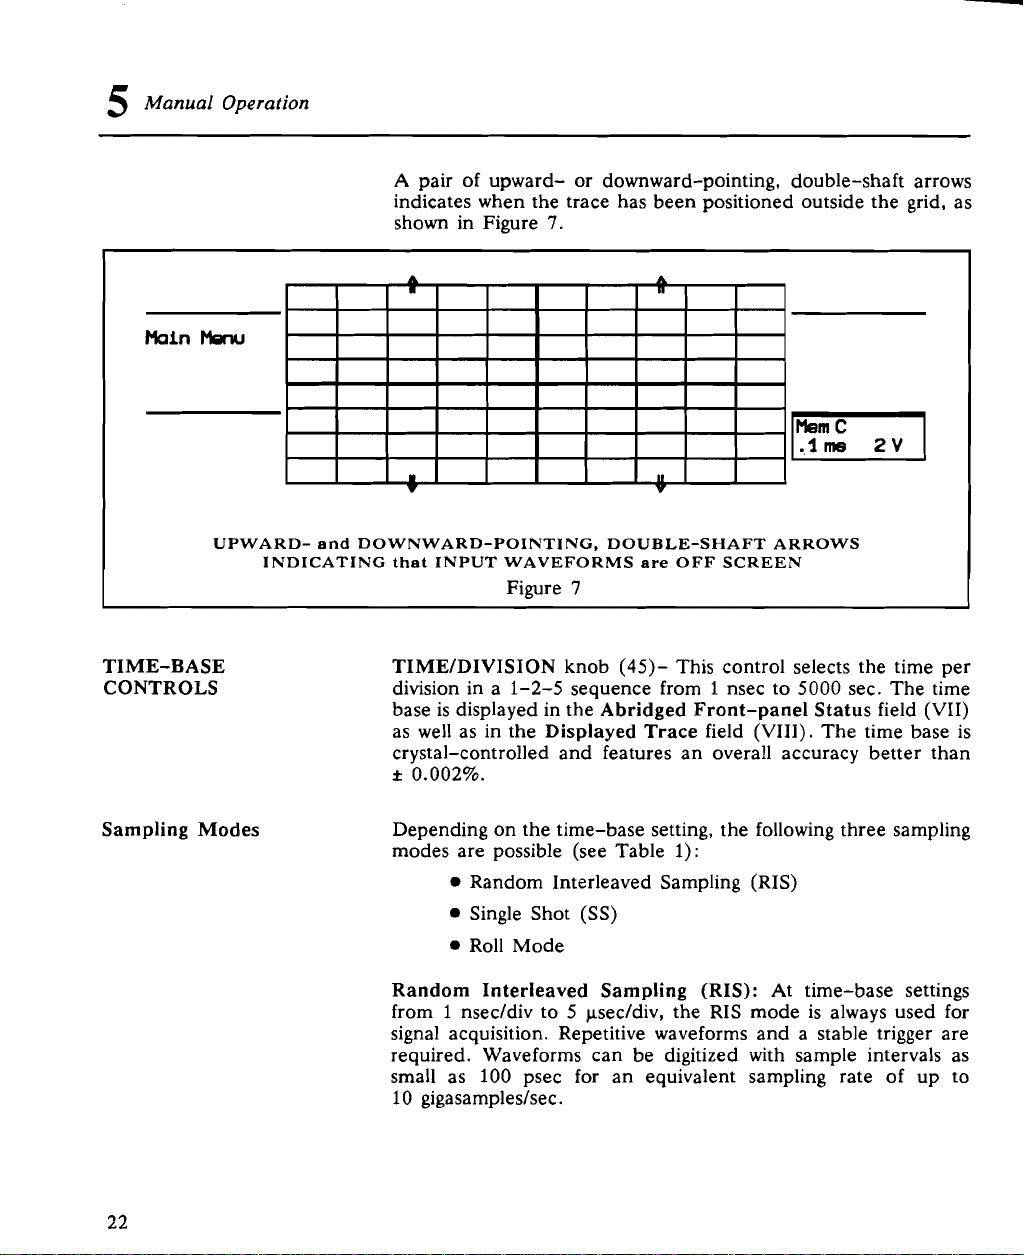
UPWARD- and DOWNWARD-POINTING, DOUBLE-SHAFT ARROWS
INDICATING that INPUT WAVEFORMS
Figure
7
v
are
OFF SCREEN
Modes
Page 29

Page 30
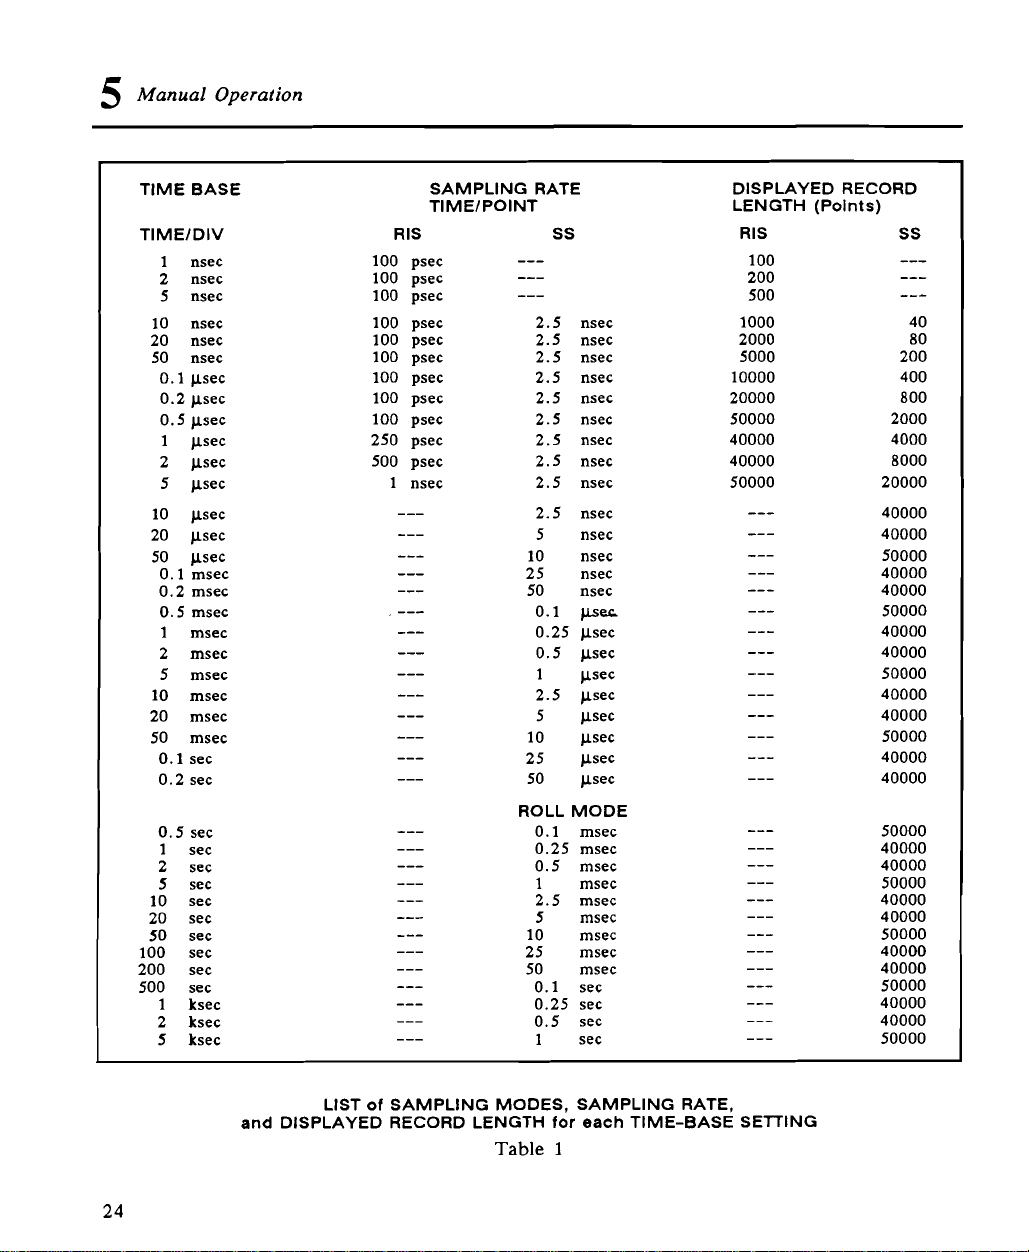
TIME BASE SAMPLING RATE DISPLAYED RECORD
TlMElDlV RIS SS RIS SS
1
nsec
2
nsec
5
nsec
10
nsec
20
nsec
50
nsec
0.1
psec
0.2
psec
psec
0.5
1
psec
psec
2
psec
5
psec
10
psec
20
psec
50
0.1
msec
0.2
msec
0.5
msec
1
msec
2
msec
msec
5
msec
10
msec
20
msec
50
sec
0.1
sec
0.2
0.5
sec
1
sec
2
sec
5
sec
10
sec
sec
20
50
sec
100
sec
sec
200
sec
500
1
ksec
ksec
2
ksec
5
TlMElPOlNT LENGTH (Polnts)
100
100
100
100
100
100
100
100
100
250
500
1
psec
psec
psec
psec
psec
psec
psec
psec
psec
psec
psec
nsec
---
---
---
---
---
---
---
---
---
---
---
---
---
---
---
---
---
---
---
---
---
---
---
---
---
---
---
---
---
---
2.5
nsec
2.5
nsec
2.5
nsec
2.5
nsec
2.5
nsec
2.5
nsec
2.5
nsec
2.5
nsec
2.5
nsec
2.5
nsec
5
nsec
10
nsec
25
nsec
50
nsec
0.1
per
0.25
psec
0.5
psec
1
psec
2.5
psec
5
psec
10
psec
25
psec
50
psec
ROLL MODE
0.1
msec
0.25
msec
0.5
msec
1
msec
2.5
msec
5
msec
10
msec
25
msec
50
msec
0.1
sec
0.25
sec
0.5
sec
1
sec
100
200
500
1000 40
2000 80
5000 200
10000 400
20000 800
50000 2000
40000 4000
40000 8000
50000 20000
---
---
---
---
---
---
---
---
---
---
---
---
---
---
---
---
---
---
---
---
---
---
---
---
---
---
---
---
---
---
40000
40000
50000
40000
40000
50000
40000
40000
50000
40000
40000
50000
40000
40000
50000
40000
40000
50000
40000
40000
50000
40000
40000
50000
40000
40000
50000
Page 31

Manual Operation
PROBES Two Model P9020 passive probes are supplied with the oscillo-
scope. These probes have 10 Ma input impedance and 16 pF
capacitance. The system bandwidth with these probes is DC to
1
250 MHz (typical) in
250 MHz in AC coupling. Active FET probes (Tektronix models
P6201, P6202a and P6230) may be powered via probe power con-
nectors on the rear panel.
PROBE CALIBRATION outputs (21). (22)- To calibrate the
P9020 probe, connect it to one of the input channels BNC connectors (23). (25) or (30). Connect the probe's grounding alligator
clip to the front panel ground lug (22) of the oscilloscope and
nect the tip to lug (21).
Adjust the oscilloscope's front-panel controls as described in
tion 8. If over- or undershoot of the displayed signal occurs, it is
possible to adjust the probe by inserting the small screwdriver.
supplied with the probe package, into the trimmer on the probe's
barrel and turning it clockwise or counter-clockwise to achieve the
optimal square-wave contour.
Ma DC coupling, and > 10 Hz to
5
con-
Sec-
setting
BANDWIDTH LIMIT
TRIGGER CONTROLS Two basic trigger modes are available. The standard trigger facili-
(STANDARD)
By
width can be reduced from 300 MHz to 80 MHz (-3 dB).
Bandwidth limiting may be useful in reducing signal and system
noise or preventing high-frequency aliasing. For example, bandwidth limiting reduces any high-frequency signals that may cause
aliasing in single-shot applicat~ons using time-base settings faster
than 20 ~sec/division.
ties are described below. For a full description of the SMART
trigger facilities refer to Section 6.
The standard trigger has a single source and is completely
trolled from the front panel. SMART trigger functions are selected
by pressing the SMART Trigger button (35) which switches "ON"
the adjacent LED. Pressing the SMART Trigger button again,
switches off the LED and returns the oscilloscope to standard trigger control. SMART trigger functions are inspected and modified
using a display menu.
the Bandwidth-Limit button (20) to ON, the band-
con-
Page 32

Trigger Sources
Trigger Coupling
Page 33

Manual
Operation
5
slope is possible for fixed gain settings of 5 and 10 mV/div. For
all other fixed gain settings, only a negative trigger slope is possible.
AC: Signals are capacitively coupled; DC levels are rejected
and frequencies below 50 Hz are attenuated.
LF
REJ: Signals are coupled via a capacitive high-pass filter
network. DC is rejected and signal frequencies below 50 kHz
LF
are attenuated. The
triggering on medium to high frequency signals is desired.
HF
REJ: Signals are DC coupled to the trigger circuit and a
low-pass filter network attenuates frequencies above 50 kHz.
The
HF
REJ trigger mode is used to trigger on low frequencies.
DC:
All of the signal's frequency components are coupled to
the trigger circuit. This coupling mode is used in the case of
high frequency bursts, or where the use of AC coupling would
shift the effective trigger level.
REJ trigger mode is used when stable
Trigger Adjustment TRIGGER
(Delay, Level and Slope) pre- or post-trigger delay desired when recording signals. Turning
this knob slowly allows fine adjustment of the trigger point; turning
it quickly results in rapid trigger point movement. Note that the
value of the trigger delay applies to all the trigger sources.
Pretrigger adjustment up to 100% full scale, in steps of 0.2% is
available. The value is displayed in % in the Panel Status display
(press button (2) in the Main menu) and indicated on the grid by
the position of an upward pointing arrow t in the Trigger Delay
field (IV).
Post-trigger adjustment is possible up to 10,000 divisions in 0.02
division increments. A post-trigger delay is indicated by a leftward-pointing arrow,
Delay field (IV). The exact delay in seconds is specified beside
this arrow.
ZERO button (41)- The Zero function resets the trigger delay
from previously set positions to the farthest left grid line
Pretrigger position).
TRIGGER LEVEL knob (42)- adjusts the required voltage level
of a signal which is being used to generate a trigger. The level can
be adjusted independently for each trigger source. Note that the
trigger level is specified in volts and is normally unchanged when
the vertical gain or offset is modified.
BELAY
knob (40)- is used-to adjust the amount of
t,
in the left-hand corner of the Trigger
(i.e. 0.0%
2
7
Page 34

Trigger
Mode
Page 35

Page 36

No.
of
Segments PtslSegment PtslSegment
20
msecldiv Maximum
2 20000 20000
5 8000 10000
10 4000 5000
20 2000 2000
50 800 1000
100 400 500
200 200 200
Page 37

Manual
When the 9450A is in Single or Seqnce mode and has finished
acquiring data, all the parameters may be modified by manipulating the appropriate front-panel controls, but such modification
indicated by parameter changes in the Abridged Front Panel
Status field (VII) - will only be taken into account when the next
trace is being acquired.
Whenever the oscilloscope is in the Norm or Auto trigger modes,
data are continuously acquired and a display is rapidly generated.
Adjustment of the front-panel controls will cause prompt changes
in the acquisition parameters and immediate waveform acquisition
with the new settings.
Operation
5
-
Trigger Status
Trigger Symbols To allow immediate recognition of the current trigger conditions,
TRIGGER STATUS, TRIG'D and READY
left of the Zero button (41))- The Trig'd LED indicates that an
acquisition has been completed (normally after a valid trigger).
The Ready LED indicates that the trigger circuit has been armed
and that the oscilloscope is currently digitizing input signals. When
it receives a valid trigger signal, it will continue digitization until the
other trigger conditions, such as trigger delay, have been satisfied
and will then display the acquired waveform.
In RIS, at slow trigger rates, the trigger LED lights up each time an
intermediate acquisition occurs. This feature helps to monitor the
behavior of the waveform even before the waveform is reconstructed.
the oscilloscope displays a special set of trigger graphics, which
appear in the Front Panel Status field (VII). Some examples of
the standard trigger symbols are given in Figure
of symbols for the SMART trigger may be found in Section
LEDs (located to the
8.
An extended set
6.
3
I
Page 38

Ch
1
1.8
mV
n
Ch
2
11
mV
n
HF
LF
REJ Trigger Source: Channel
Trigger Source: Channel
Level:
Coupling: HF
Slope: Posltlve
Level: 11
Coupling: LF REJ
Slope: Positlve
.8
rnV
rnV
1
2
1
ExtllO
u
Line
Trigger
n
EXAMPLES
-1.4
V
HF
REJ Trigger Source: ExtllO
Trlgger Source: Llne
OF
THE STANDARD TRIGGER GRAPHICS
Figure
8
Level:
Coupling: HF REJ
Slope: Negative
-1.4
V
Page 39

Manual
the Store button (1). Press the button corresponding to the re-
quired source and then choose either Mem C or D as required.
FUNCTION E, F buttons (58)- Turn the display of a computed
or stored waveform ON or OFF. The type of computation may be
defined by pressing the Redefine button (51)
1,
2
CHANNELS
applied to the input connectors (23), (25) and (30) ON or OFF.
Data are always recorded simultaneously into the acquisition memories, irrespective of whether the trace displays are ON or OFF.
buttons (59) - Turn the display of signals
Operation
5
DISPLAY CONTROL
AND EXPANSION
Before waveform acquisition the traces are controlled by the
tical and
(45). respectively).
Displayed traces may be modified within certain limits following
waveform acquisition.
Expand A,
are controlled by the Display Control kaobs and buttons (49)
through (54). Only one trace can be controlled at a time. The
identity of the controlled trace is indicated by a rectangular frame
around the waveform descriptor in the Displayed Trace field
(VIII)
Whenever more than one of the six traces listed above is currently
displayed, the frame may be moved to the next trace by pressing
the Select button (55).
HORIZONTAL POSITION knob (49)- Horizontally positions
an expanded waveform and the intensified region along the source
trace. This control is activated only after the Expand A and/or
buttons (56) have been pressed to display the expanded trace.
The Horizontal Position knob allows the user to scroll continuously through a displayed waveform.
When the waveform source is a sequence waveform, two addition-
al options appear in the root menu. They can be used to change
between segments of a sequence acquisition while keeping a constant expansion factor and position. If the buttons are pressed
continuously, the display will rapidly move from one segment to
the next. This capability can also be used with the dual-zoom
feature.
TimeIDivision controls ((37). (38), (39), and (44),
B
(56), Memory C, D (57), and Function E, F (58).
.
Ver-
B
VERTICAL POSITION knob (50)- Vertically repositions the
selected trace.
3 3
Page 40

Page 41

Hain
Dwl
h
zoom
off
Mi-1.WV
n
DUAL ZOOM EXPANSION
Figure
9
#:
CHI
c14
T/div
.2
V
.6V!
1
pe
Page 42

Page 43

Manual Operation
Select button (55) and press Redefine (5 1). A full-page setup
menu for the function appears on the screen. To return to the
waveform display, press either the Return button (10) or the Redefine (5 1) button.
The currently selected processing function and its parameters may
be modified with the soft keys (2) to (5). First select the field to be
modified. The rectangular frame around parameter values indicates the currently selected field. Pressing the Previous Field
button (2) will cause the frame to move towards the top of the list,
whereas pressing the Next Field button (3) will cause the frame to
move downwards. The Reference knob (48) can also be used to
move the frame from one field to another. Note that the options
available in each field are listed in the frame in the lower right
corner of the screen.
Following field selection, the current value of the field may be
modified by pressing either the Previous Value or Next value
(5)
button (4) or
identity of the lower fields may depend on the function chosen,
the parameters should be modified from top to bottom.
The following standard waveform processing functions are available:
-
Average: summed
-
Arithmetic: Identity, Negation, Addition, and Subtraction
or turning the Difference knob (46). Since the
Available Functions Summed Average: Summed averaging consists of the repeated
addition, with equal weight, of recurrences of the source waveform. Whenever the maximum number of sweeps is reached, the
averaging process stops. The averaging process may be interrupted
by switching the trigger mode from Norm to Single (31) or by
turning the function trace OFF (button (58)). Averaging will continue when these actions are reversed.
The currently accumulated average may be reset by changing an
acquisition parameter, such as input gain, offset or coupling, trigger condition or time base. The number of accumulated sweeps is
displayed in the Displayed Trace field
function or of its expansion.
After the maximum number of sweeps is reached, a larger number
of sweeps may be accumulated by increasing the maximum num-
ber of sweeps in the setup menu. In this case, care must be taken
to leave the other parameters unchanged, otherwise the accumulation will be restarted.
Summed averaging may be performed over Channel
(VIII) of the corresponding
1
or 2.
Page 44

Page 45

Page 46

5
Manual Operation
CH2
n
-6.6mV
DC
CHI 10
ai2
20
T/div
10
nV
mV
tm
=
-
DISPLAYED TRACE SHOWING REFERENCE and DIFFERENCE, VOLTAGE CURSORS, and ALPHANUMERIC READOUT of TRACE AMPLITUDE. The VERTICAL
BAR on the LEFT EDGE of the GRID INDICATES that TRACKING Is being used.
Figure
Note: Measurement resolution wlth the Voltage cursors is
0.2%
10
of lull scale
(8
divisions).
Page 47

At
-26.0m
Uk38H-i~
n
T/div
.I
me
DISPLAYED TRACE SHOWING TIME CURSORS, thelr VOLTAGE DIFFERENCES
their TIME DIFFERENCES
Note: Measurement resolution with Time cursors Is
0.0002%
to
tor expanded waveforms.
and
the CORRESPONDING FREQUENCY.
Figure
0.5%
11
of full scale (10 divisions) tor unexpanded waveforms and up
Page 48

Page 49

-
Time 19.6733
DISPLAYED TRACES SHOWING MARKER CURSOR, INTERVAL BETWEEN TRIG-
GER POINT
and
CURSOR,
pe
and
ALPHANUMERIC READOUT
CH1-0.06V
n
Figure
12
DC
Mi
.6
V
T/div
of
TRACE AMPLITUDE
6
pa
Page 50

padm
Source
aharrrli
maxinun 1.70V
mininun -1.68V
l~~n
edov
me
CHI
0.71V
t
42.5m. 4.2175pel 1708pte
*
*
81mV rise
1.1WV
1.112V
#:
PULSE PARAMETERS DISPLAY
periodu
width
Pall
delcry
n
Figure
13
u
u
u
Zs
710.8m
88.0m
223.4-
228.2-
306.1-
-1
.Spe .SV
.6V
M2
1OmV
T/div .6
=
pe
Page 51

Case
1
base base
90%-
Case
2
--
)
r.ise
tlme4
top
)
fall
*
time
-
base base
Pulse Parameters
PULSE
Once the Parameters button is pressed, a pair of cross-hair cursors appear on the currently selected waveform. Measurements
may be performed on any region of interest by simply positioning
the cursors, using the Reference and Difference controls (48)
(46).
and
of the area on which measurements will be made.
Pressing the Tracking button (47) causes the Difference cursor to
track the Reference cursor at a fixed interval as determined by the
Difference control.
indicates that tracking is on. Its length shows the tracking interval.
Precise information relating to the cursor positions (in time), and
the number of data points within the region of interest, is provided
The cursors define the left- and right- hand boundaries
TERMS
A
horizontal bar on the top line of the grid
AND DEFINITION
Figure 14
Page 52

Page 53

Manual Operation
Mean determines the average value of all the data points
selected as described above.
r=
1
Standard Deviation (Sdev) is the standard deviation of the
measured points from the mean. It is calculated from the
following formula:
Time
Measurements
-
RMS is derived from the square root of the average of the
squares of the magnitudes, for all the data as described
above.
Note: For the time measurements it is necessary to distinguish
between magnitude crossings occurring on leading edges and those
occurring on trailing edges. In the equations below the following
notation has been used:
MI = number of leading edges found
MJ = number of trailing edges found
tt:
=
time when leading edge i crosses the
tl: = time when trailing edge i crosses the
All times are linearly interpolated between two measured points.
Period is calculated from the average length of the full periods of the waveform within the selected interval. A full
period is the time measured between the first and third
crossing points, the third and fifth, the fifth and seventh,
etc.
1
Mt-1
1
Mt - 1
1
i=l
(
(
v,
ttz
-
-
mean
do
)
)'
x%
x%
level
level
50%
Page 54

Page 55

Parameter has been determlned for several
Jl
(L
- - -
<
periods (up to
values has been taken.
Parameter has been determlned over an
integral number of periods.
Insufficient data to determlne a parameter.
1.0. . amplitude hlstogram Is flat withln statlstlcal
fluctuations. Minimum and maximum are used to
assign base and top.
Only an upper llmlt could be estlmated (actual
value of parameter may be smaller than displayed
value).
INFORMATION
100)
and the average of those
WARNINGS
f
8
$
Signal Is partlally In overflow.
Signal Is partlally In underflow.
Signal Is partially in overflow and partially
In underflow.
PULSE PARAMETER WARNINGS
Figure
15
Page 56

MENU FIELD (11)
CONTROLS
Page 57

0
0
Pml
STATUS
-
0
0
00
0
0
-
Roar11
Ato<iliary
x-Ynodo
Porsi~
node
MAIN MENU
PAPa
and
RELATED MENU KEYS
Figure
16
Page 58

U#UISITI[3N
-1
CN,
Fid
V/div
Total V/div
IFF&
2di2'
TIE
BhSE
Tinddiv
RI5
m,
Fa
SEONn
Ebpmtm
PAMETEm
am
W
no
oVpimllv
nods:
6
-11
60
mV
W
.O
nV
0
nV
hc11W
~LoobiM
Tindpk
10
Chamhl2
10
nV
10.0
nV
0.0
nV
ACIW
Wdiv
Weeg
MX)
60
TRIeeER
Pm-tPiggsr
Trippar
Tb
arrartly
Clow
an
fm
PANEL
Standard
Dslay
+
edoo
of
prwelsctsd
'Pottern'
STATUS
Figure
CY-wI
MENU
17
10.0
Sncrt
x
Trim
N~o
SI
FX3LE
Lave1 22
Couplins
nV
Page 59

Page 60

r€rlmY
STATUS
fa
Reviwo
-
Npxt
m
@
Triw
~ertsopl./div
CoUplirQ
HorSoal./div
HorSoal./pnt
Trig
ReoadType
Tine
Delay
CHAN
11-Sep-1-
1:
MEMORY STATUS MENU
6.00nv
DCWQ
lop
2.5-
0.2
X
Rs
SIHjLE
Figure
13:4Z:40.2
Offeet
BU-Linit
Wdiv
18
-7.6
CFF
4MX)
mV
Page 61

Manual
Operation
5
-
Rwiw
-
rbnt
Faokrrn
Trlgosr Tirns
vmtsoawdiv 2.1omv
@
Carplino
Hawmldiv
HaS~talmlplt
Trio
Dolay
RaOordTypm
EXPAND
Q-3Pp-isBB
OCWQ
0.10~
2.5
nm
1B.BBO
p
SImE
A:
MEMORY
Figure
16:69:42.7
WPrt
mumt
Mdiv
STATUS
19
0.OO.v
QF
40
MENU
Page 62

5
Manual Operation
-
Mi-
TRAQ
N.xt
R#un
Tri~pr Tirs 11-1sBB iB:66:18.Q
VrtS~dddiv 1.OOV
@
-?ling
HaSoale/div
HaSoale/e
Tri~
blc~
MTyp
MEMORY
DCWO
2.0~~8
2.6m
6.2
1
SINQE
C:
MEMORY STATUS MENU
Figure
PPO
Wfwt
BW-Lmt
Wdiv
20
-0.78
ON
800
V
Page 63

-
Rwiam
bxt
Trigow Time 11-Slp-lsBB 17:OO:W.O
Vmrt
@
SwWdiv 7.68
WlirP DClW
HorSoale/div 2.0~
HorSoale/pnt 0.10Jm wdlv
Trig Delay 6.2
X
mV
PPO
Wfd
BWUt
11
(H
a0
.O
mv
Return
rasoordTypm
FUNCTION E: MEMORY STATUS MENU
SINOLE
Figure
21
Page 64

5
Manual Operation
K~RY
Rwiow
Nmxt
S=vn-
Tim
R.tun
@
MEMORY STATUS MENU after an ACQUISITION in SEQUENCE MODE
STATUS
Tri-
Vert
-4Jling
Ha
HaWdplt
Trig
ReoadType
Pror
Swlddiv 1WmV
Soalddiv 0.
0.1~
for
~~ul-iggo
DCWO
Wp
10
ne
28.OdR-a
SINGLE
Figure
18:92:28.8
WW~
BWlilit
Pntddiv
YSweepo
22
for
29.883
-12
mV
OFF
w
10
e
Page 65

Revlow
-@
Next
hlute/
Relative
Return
suxmccETIFEsof of10
Fimt
L&
Trig
Th:
Tri~ Tim: 4-0ot-is90 14:W:26.0
1 I 4-t-1- 14:66:63.6
2
I
4-t-is90 14:67:W.8
3 I 4-t-1990 14:W: 10.3
4 I 4&t-1990 14:57:11.0
6
I
4-t-is90 14:67:16.7
8
I
4-t-1990 14:67:20.8
7
1
4-t-1990 14:57:20.7
8
I
4-t-1990 14:67:20.8
Q
I
4-t-1990 14:67:24
10
I
4-t-1990 14:67:2B.O
TRIGGER TIMING
Figure
4-0ot-1890 14:88:63.5
.%
23
segmta
Page 66

Saw
Panel
-*1
-*l2
-*l9
-*l4
-*l6
-*l8
-*l7
I
SAVE
SAE
SAE
SAVE
T
Eluui
SAVE FRONT-PANEL SETUP MENU
Figure
24
Page 67

fEcALL
PAM,
Panel 1
RECALL
Po7el2
Pone1
RECALL
Panel
Panel
RECALL
Panel
Panel
RECALL
Default
RETUW
h.aa
h.aa
3
4
6
8
7
hun
hun
frwn
h.aa
Prors
4-t-1990 16:W:W
440t-1990 16:
4-t-1990 16:Og: 18
at-1990 16:W:B
26-Sep-IS90
26-Sop-1890 16:
26-5ep-19SI 16:28:68
A
predefined
RECALL FRONT-PANEL
rqmxbiblo
09:
16:
46:
66:
Figure
00
69
16
etato
SETUP
25
Page 68

UC(UISITIP(
VERTICN
Fixed V/&v
Total
OWd
TIE
V/&v
BAS€
Tiwdiv
RIS
(IFF
Fa
SEONn
+sqmnh
PARAPETERS
m
w
no
Tins/Pt
nods:
6
TWpk
Chanall
50
nV
53
.O
0
nV
AClM
Chams1
W
nV W.OnV
10
no
10-
nV
0
nV
KIM0
wdiv
wwg
2
6
W
TRIBBER
-1-
Tripper
Thu
cursntly
Cla
im
I
FRONT-PANEL SETUP MENU
an
+
'Singla
Delay
edpo
preeelsctsd
of
Sovrao'
Figure
10.0
CHFSrH
Snart
of
the
26
riocb
x
Level
Carplins
Trim
DEFAULT SETUP
l'lXWAL
0
nV
Page 69

INSTRUENT
IDENTIFICATION
Hordcop~
RS292
Time
Return
Serial
SoPt
Soft
Hard
GPIB
[3SD
RS232 cutput
Numbr:
Version:
Options:
Options:
8
RS232
ranote
9450A
WW2Q6
LECROY
94MM
Standard
Standard
COPFIGURATION
oartrol
only
AUXILIARY
Figure
SETUPS
27
04.3
GPIB
MENU
ak
addrew
4
Page 70

HARD
COPY
Previous
FIELD
Next
Prwioue
VALE
Next
Canoe1
Return
@
@
Device type:
Hardoopy
Plotter
port:
speed:
W
74MA
RS232
Normal
Wer of installed
Pcrge fwd:
PLOT
>
Pcper format:
Size
of
Position
Plot
area
OFF
SIZE
Non
stcndard
the
grid
square
of
lower left corner:
625
x
448
The
HARDCOPY
Figure
plotter or compatible
(wet uee 8 bite with printerel
pens:
d
28
4
Iml
MENU
:
xtmnl +10
ytml +10
VALUES
99
-9
Page 71

Manual Operation
5
Use the Reference knob
(48)
or buttons
(2)
and
(3)
to scroll
through the parameters. Note that the options available for each
parameter are indicated on the lower right-hand edge
screen. Use the Difference knob
(46)
or buttons
(4)
and
choose the required option.
Hardcopy parameters can be selected by the user as shown in the
following table:
PLOTTERS PRINTERS
Devlce Type: HP 7550A (or compatlble) EPSON FX80 (or cornpatlble)
Hardcopy Port: RS-232-C RS-232-C
Graphlcs Density:
Plotter Speed: Normal
Number of
Installed Pens:
7470A (or compatible)
HP
Graphtec FP 5301 HP
Phllips PM8151 HP LaserJet
GPIB (IEEE-488) GPlB
---------
Low speed
1
to 8
QuietJet (or compatible)
HP
ThinkJet
Two to one
Single
Double
Hi-speed double
Quadruple
CRT screen
One to one
HI-res CRT
---------
---------
of
(5)
the
to
Page Feed: Off Off
Plot Size:
Non- Non-standard:
standard:
On On
IS0 AS-US 8.5"~ 5.5" Plot Area: 157x112 mrr? Prlnt Size:
IS0 A4-US 8.5"~ 5.5"
IS0 AS-US 17"x 11
Non-standard
Slze of the grid square: 1 to 99.9 mm In 0.1 rnm steps
Lower left corner posltlon
x [mm]
y
:
-999 to 999 rnm In 1 mm steps
[mm]: -999 to 999 mrn In 1 mm steps
"
235x168 rnd
313x224 mmz
Table
3
ISO AS-US 8.5"~ 5.5"
Size of rld square [mrn
1 to 99.8 mm in steps o 0.1 mm
I
:
Page 72

RS-232-C
Setup
RS232
-
Ranots
Control
Port
mias
FIaD
Nact
mias
VKLE
Next
Caroel
Retun
Bardmt0:paiJ
fg
Charootere
Parity
@
Hrnberoe8tcpbite:
:
naris
length
(bite)
RS-232-C SETUP MENU
1
Figure
:
8
29
800
16200
Page 73

Previous
FIELD
Next
Reviare
VALE
Next
LOAD
TIE
Return
@
Q
TIE
-
Dato:
SENP
8
Nov
1890
Bl2:w
TIME SETUP MENU
Figure
30
Page 74

Page 75

Poral
STATUS
~PY
Savo
PAr€L
Reoall
Auxiliary
stupe
X-Y
off
Return
Time
3.0818~~
XY
MODE
Figure
n
DISPLAY
31
CH2
1OnV
T/dLv
4
6me
Page 76

Cursors
Page 77

Manual
Operation
The definition of
AX
and
AY
is dependent on the type of cursors
used. The following table shows how
each type of measurement.
Where
VAbs
VRel
TAbs
=
Absolute Voltage cursors
=
Relative Voltage Cursors
=
Absolute Time cursors
TR~~ = Relative Time cursors
=
Org
VxRef
VyRef
Vx~if
Vy~~f
Origin
=
Voltage of the reference cursor on the X trace
=
Voltage of the reference cursor on the Y trace
=
Voltage of the difference cursor on the X trace
=
Voltage of the difference cursor on the Y trace
AX
and
AY
are defined for
Selecting the In order to make the polar readout of the absolute time cursor
Reference Point
more useful, there is the possibility of choosing between two reference points. The reference is either located at point
X
=
0
Volt and
Menu button
Y
=
0
Volt, or at the center of the square grid.
(9),
active only in absolute time cursor mode, toggles
(0. 0).
i.e. at
the position of the reference origin between the center of the grid
and
(0,O).
The values of the origin are displayed on the left-hand side of the
square grid. By changing the offsets of the source traces the user
can center a figure on the screen and then measure angles and
distances with respect to the center of the figure.
Page 78

5
Manual Operation
PERSISTENCE DISPLAY
kin
Pku
Clear
display
t
i
sweep
100
1.42728
Psrei-
off
The Persistence Display mode (Figure
(9)
button
button
main menu.
ms
100
Sweepe
in the main menu, and is turned off by either pressing
(9)
again or by switching to the
~attem~~xentered
J-u-ul
No
Wait
32)
is turned on by pressing
XY
display mode in the
man1
1
ps
20
mV
CHI
20mV
CH2
20mV
T/div
1
pe
=
=
PERSISTENCE DISPLAY MODE
Figure
The Persistence Display mode allows the user to examine the evolution of a signal in time.
sweeps are overlaid on the screen and the resultant display shows
the variation in the signal during the sweeps. The display is updated continuously, with data older than the chosen number of
sweeps being eliminated from the display. When persistence is set
to INFINITE, all data is retained on the display until it is cleared
by the user.
32
A
user-selectable number of successive
Page 79

Manual Operation
Selecting Traces
Traces are selected using the
The display can be cleared at any time by pressing Clear Display
(button
a displayed trace is turned off, subsequent sweeps cease to contrib-
ute and the display will gradually disappear.
The desired number of sweeps is selected by pressing Sweeps but-
ton
If the persistence display is turned off and on again, the original
trace will be retained, provided that no further triggers are received
Any changes made to the acquisition conditions will cause the persistence display to be cleared and a new display will be built up.
On slow timebases (Roll Mode) there is no display update until the
acquisition is complete. In some cases this can take a considerable
time and it may appear as if nothing is happening.
Persistence display cannot be used in Auto Roll mode. Since there
is never a completed acquisition, a display update is impossible.
In sequence mode, each segment is overlaid and the entire seg-
mented waveform contributes as a single sweep.
When Summed Averaging, FFT Power Average, or Extrema are
performed, the intermediate accumulated sweeps which are displayed at regular intervals in normal display mode, each contribute
as single sweeps in persistence mode.
(3)),
allowing a new persistence display to build up. When
(8).
The options are
(e.g. if the oscilloscope is triggered in Single trigger mode).
TraceOnIOff buttons
1,
2,
5,
10, 20, 50, 100, 200,
(56)
through
INFINITE.
Cursor Measurements Full cursor facilities are available in persistence display mode with
both absolute and relative measurements supported. The time and
voltage cursors are completely independent of the normal display
cursors. The measurement readings appear in the Displayed Trace
Field (VIII) on the right hand side of the screen.
Voltage cursors are similar to those in normal display mode. Time
cursors consist of vertical bars which are placed on the desired part
of the displayed waveform.
Waveform parameter measurements are not available in persistence display mode.
Page 80

5
Manual Operation
STORE MENU
TO
kc
kD
co
>
Cawel
12
(1)
The Store button
acquisition memories into reference Memories
enables the user to store any trace in the
FRarl
WA
WB
Plemc
bD
Fm
Fm
mi
b2
Mi
0.30
V
DC
Mi
n
T/di
STORE TRACE MENUS
Figure
33
v
E
F
.6
C
.5
pa
and/or
V
D.
Note: Users should be aware that Memories C and D are volatile
and will be erased when the oscilloscope is switched off. For non-
volatile storage, use the CD
the oscilloscope.
>
12
button
(8)
before switching off
Page 81

Prwiam
FIM
Next
mia#
VALUE
Next
Externrrl
@
#
Nota:
@
CONTINUOUS
TIE
BASE
CONTROL
Tim
Bow:
iGEXq
d
p0i~~:
Unmgirg
metame
SE(MNCE
WK
the
tiddivisiari
normal
MOE
time
b088
kncb
behovior.
Mify
#
sesmente
START
cant
iruouc~
Mi
Wf2md.
Return
#SeQnents
4
Tine/@
2.6m
Note:~krttontothelefttostort.
Pudl
VERTICAL
hgaYl%
SWNCE
OFF
HIE
nmE
OfFWt
t
in
6
etuye
volk
button
Cdivieionsl
toholt.
.
w=%l
2mo
inaotive
SPECIAL MODES MENU
Figure
34
involve the use of verv hieh-urecision clocks or clocks that urovide
Continuous Seauence This is a s~ecial form of seauence acauisition. It continuouslv
waverorms (wnere
I
Page 82

Vertical Offset Mode
Page 83

SMART Trlgger
THE
b
#
-
SlMART
Push Button
TRIGGER
6->
Standard Trigger
I
Slngle-source State Quallfled TV Mode
Pattern
THE
SMART TRIGGER
Figure
TimelEvent Qualified
35
Page 84

Width-based Trigger
Page 85

--
The SMART Trigger
FASTGLITCH trigger mode, like the other modes, can be se-
lected at any time-base setting. The user can define widths with
2.5 nsec resolution starting at a minimum value of 2.5 nsec. For
recurrent glitches, the oscilloscope's random interleaved sampling
mode allows glitch visualization with an equivalent sampling rate of
up to 10
Missing bits in long data streams are easily triggered on using the
interval width triggering facility. For ranging applications, interval
trigger may be used to ignore unwanted signal reflections.
Multi-source Triggers There are four types of multi-source triggers in the 9450A. These
are the Pattern, State Qualified, TimeIEvent Qualified, and
triggers. Details of how to set up these triggers are given later in this
section.
Pattern Trigger
A pattern trigger is defined as a logical AND combination of the
states of Channel 1, Channel 2 and External. The states are defined as being either low (L) or high
respect to the individually defined trigger thresholds. Further-
more, the user decides whether the oscilloscope should trigger at
the beginning of the defined pattern or at the end,
pattern is "entered" or "exited".
The FASTGLITCH and time-separation trigger capabilities de-
scribed above can be combined with pattern trigger, enabling the
user to compare the "duration" of the
tween patterns, with a reference time. This also applies to the
hold-off by time or number of events.
The pattern trigger will be appreciated every time complex logic
has to be tested. Examples are: computer or microprocessor debugging; High Energy Physics where a physical event is identified
by several events occurring simultaneously; and debugging of data
transmission busses in telecommunications.
When set to pattern trigger, the oscilloscope always checks the
logic AND of the defined input logic states. However, with the help
of de Morgan's laws, the pattern becomes much more general. To
demonstrate this, consider an example which is of particular importance, that is a bi-level or window trigger.
Bi-level trigger means that the user is expecting a single-shot
nal where the amplitude will go outside a known range in either
direction.
gigasampleslsec, that is one sample point every 100 psec.
(H)
or don't care
i.e. when the
pattern, or the interval be-
(X)
6
TV
with
sig-
79
Page 86

Page 87

IL
IL
Trigger
Trigger
LHX
entering width
LHX
exiting
f
PATTERN TRIGGER TIMING DIAGRAM
Figure
checked
36
*t
width
checked
T
Page 88

CH2
EXT
Pattern XLL
CHI
(Source)
J
1
Present presl Abs
I
I
Absent
Triggers
(Pattern present)
Triggers
(Pattern absent)
-
20
nsec (3 ev)
<
Wait
-
<
20
sec
-
STATE-QUALIFIED TRIGGER TIMING DIAGRAM
(lo9
T
ev)
Figure
-
20
nsec (3 ev)
<
Wait
3
20
sec
37
(lo9
f
ev)
Page 89

CH2
EXT
Pattern
CHI
(Source)
XLL
1
I
I
Triggers
(Entering Pattern)
Triggers
(Exiting Pattern)
TIMEIEVENT QUALIFIED TRIGGER TIMING DIAGRAM
-
10
nsec
(0
5
Wait
5:
20
sec
ev)
(1
OQ
ev)
-
Figure
10
I
nsec
Wait
20
38
sec
(0
t
ev)
(1
O9
t
ev)
Page 90

TV Signal
Field
transltlon
Line
synchronlzlng
pulses
Trlgger
--
IIL
-.
-
-
1
~IIYYmTYIII~
t
TV
TRIGGER TIMING DIAGRAM
Figure
39
Page 91

ADJUST SMART TRIGGER
-
v;
ON
0-
ZERO
THE SMART TRIGGER CONTROLS
EVENTS
WIDTH
WIDTH
Figure
'
<
>
4
P
\
40
36
35
33
3
2
Page 92

M
TRf860R
Rrviour
FIELD
kxt
Revioue
VKUE
-
Canosl
Retvn
@J
@
TrigOk Type
Triggr
Chamall
-2
mtunal
Pattamstate;
Sunary
While
Uaib
LwPl
Corrpliw
~i~(3rloy
Sovmr:
CHAN1
44l.OnomdTr~an+~&
THE SMART TRIGGER MENU
:
:
:
:
e
.
CHAW
CHAN1
22mV
M:
Figure
Fitate
DCC
L
H
-
jiizq
.
EXT
CHWz
OnV
Ac Ac
a0.ooOp
41
OJaliPied
=
L
H
DCT
0.WV
X
absent
MT
Page 93

Pattern
LHX
-
H'off 100.0ns
Pattern Trigger
Trigger on Chanl
followed by a hold-off by 100 nsec
.
Chan 2 . Ext
exited
= L H X exited
CHI 84
J
-ur
Ul-.
Wait
State Qualified Trigger
While the states Chanl
wait for 60,010,860 events and trigger on a
CH2 0
a.
-ur
-L.JLr-
-
Wait
TimeIEvents Qualified Trigger
After Chanl
Wait for 25 events and trigger on a
.
Chan2 . Ext = H H X exited
N
mV
DC
-ur
XHX
60010860
.
Chan 2 . Ext = X H X
.OO V AC
HHX
25
evts
+
edge of Chan2
EXT
J-
Line
8
Trigger on EXT TV signal, line 8, any field
SMART TRIGGER GRAPHICS
Figure
42
evts
are absent
+
edge of Chanl
Page 94

Front Panel
i
Menu
Front Panel
-
Single-source Trigger
Source, Coupling,
Slope, Level, Mode
Hroff
by
Tlrne
25nsec20sec 0-10
M'ofi
by
#
Events
@
SINGLE-SOURCE TRIGGER
Figure
I
I
Pulse Interval
I
I
Width< W~dth> Widtk Width>
2. 5nsec
-
2Osec
*
Fastglitch
43
2.5nsec
-
20sec
1
Onsec 25nsec
-
20sec
I
-
20sec
Hold-off
By
Time
Page 95

SMART
1
Triggw Type
WidUl
Sunary
Loval
Cwpliw
TRIBBR
Typr
tmilinO
by
22
mV
:
blngle
:
Put
Width
-
edge
M.0m
Souroe(
OF
CHANi
*~E&F
bw
HOLD-OFF
Figure
20.0
BY TIME
44
Z
Tine/Evmta
Page 96

SMART
TRIGQR
Previous
FIELD
Next
Previam
VALE
Next
camel
Return
@
@
Trigger
WidthType
Type
:
Single
:
pGiiaKq
-
Surmcrry
on
+
~~1ldoPP
Levol
Couplirg
Pre-trig~er
HOLD-OFF
trcii-iiw
by
1.0mV
Dc
Delay
BY NUMBER
Figure
45
Source
10.0
OF
EVENTS
X
Pulse
Uidth
Page 97

T
rt-)
Trigger
4-
Threshold
Trigger position:
Pulse width < T
T
lTru--L
Trigger position:
(FASTGLITCH trigger)
f
f
>
Pulse width
T
PULSE WIDTH TRIGGERS
Figure
46
Page 98

SMART
TRI-
Previous
FIELD
Next
Reviare
VALE
Next
Canoe1
Return
@
@
Trigger Type
WidVlTyp
:
Single
:
pziamq
Sovroo
-
Sunnary
Lwel
Coupling
Pre-trigger Delay
PULSE WIDTH < A SPECIFIED VALUE
1
.O
mV
Figure
47
16
.O
X
Pulse Width
Page 99

Page 100

T
-
-
Trigger position:
Interval width < T
t
Interval Width
a Specified Value
<
4
T
*
Trigger position:
INTERVAL WIDTH TRIGGERS
Interval width > T
*
Figure
48
t
 Loading...